BERKSHIRE HILLS BANCORP INC
10-Ks and 10-Qs
|
|
|
|
|
|
|
|
|
|
|
|
|
|
|
|
|
|
|
|
|
|
|
|
|
|
|
|
|
|
|
|
|
|
|
|
|
|
|
|
|
|
|
|
|
|
|
|
|
|
UNITED STATES
SECURITIES AND EXCHANGE COMMISSION
WASHINGTON, D.C. 20549
FORM 10-Q
|
ý
|
QUARTERLY REPORT PURSUANT TO SECTION 13 OR 15(d) OF THE SECURITIES EXCHANGE ACT OF 1934
|
For the quarterly period ended:
September 30, 2016
|
o
|
TRANSITION REPORT PURSUANT TO SECTION 13 OR 15(d) OF THE SECURITIES EXCHANGE ACT OF 1934
|
For the transition period from to
Commission File Number:
001-15781

BERKSHIRE HILLS BANCORP, INC.
(Exact name of registrant as specified in its charter)
|
Delaware
|
|
04-3510455
|
|
(State or other jurisdiction of incorporation or organization)
|
|
(I.R.S. Employer Identification No.)
|
|
|
|
|
|
24 North Street, Pittsfield, Massachusetts
|
|
01201
|
|
(Address of principal executive offices)
|
|
(Zip Code)
|
Registrant’s telephone number, including area code:
(413) 236-3149
Indicate by check mark whether the registrant (1) has filed all reports required to be filed by Section 13 or 15(d) of the Securities Exchange Act of 1934 during the preceding 12 months (or for such shorter period that the registrant was required to file such reports), and (2) has been subject to such filing requirements for the past 90 days. Yes
ý
No
o
Indicate by check mark whether the registrant has submitted electronically and posted on its corporate Web site, if any, every Interactive Data File required to be submitted and posted pursuant to Rule 405 of Regulation S-T (§232.405 of this chapter) during the preceding 12 months (or for such shorter period that the registrant was required to submit and post such files). Yes
ý
No
o
Indicate by check mark whether the registrant is a large accelerated filer, an accelerated filer, a non-accelerated filer, or a smaller reporting company. See the definition of “large accelerated filer,” “accelerated filer” and “smaller reporting company” in Rule 12b-2 of the Exchange Act. (Check one)
Large Accelerated Filer
ý
Accelerated Filer
o
Non-Accelerated Filer
o
Smaller Reporting Company
o
Indicate by check mark whether the registrant is a shell company (as defined in Rule 12b-2 of the Exchange Act) Yes
o
No
ý
The Registrant had 31,173,020 shares of common stock, par value $0.01 per share, outstanding as of November 4, 2016.
BERKSHIRE HILLS BANCORP, INC.
FORM 10-Q
INDEX
|
|
|
Page
|
||
|
|
|
|
||
|
|
||||
|
|
|
|
||
|
|
||||
|
|
|
|
||
|
|
||||
|
|
|
|
||
|
|
||||
|
|
|
|
||
|
|
||||
|
|
|
|
||
|
|
||||
|
|
|
|
||
|
|
||||
|
|
|
|
||
|
|
Notes to Consolidated Financial Statements
|
|
||
|
|
|
|||
|
|
|
|||
|
|
|
|||
|
|
|
|||
|
|
|
|||
|
|
|
|||
|
|
|
|||
|
|
|
|||
|
|
|
|||
|
|
|
|||
|
|
|
|||
|
|
|
|||
|
|
|
|||
|
|
|
|
||
|
|
|
|
||
|
|
||||
|
|
|
|
||
|
|
||||
|
|
|
|
||
|
|
||||
|
|
|
|
||
|
|
|
|
||
2
3
BERKSHIRE HILLS BANCORP, INC.
|
|
September 30,
2016 |
|
December 31,
2015 |
|||||
|
(In thousands, except share data)
|
|
|||||||
|
Assets
|
|
|
|
|
||||
|
Cash and due from banks
|
$
|
61,107
|
|
$
|
72,918
|
|
||
|
Short-term investments
|
8,178
|
|
30,644
|
|
||||
|
Total cash and cash equivalents
|
69,285
|
|
103,562
|
|
||||
|
Trading security, at fair value
|
14,149
|
|
14,189
|
|
||||
|
Securities available for sale, at fair value
|
946,853
|
|
1,154,457
|
|
||||
|
Securities held to maturity (fair values of $139,358 and $136,904)
|
131,467
|
|
131,652
|
|
||||
|
Federal Home Loan Bank stock and other restricted securities
|
61,277
|
|
71,018
|
|
||||
|
Total securities
|
1,153,746
|
|
1,371,316
|
|
||||
|
Loans held for sale
|
20,471
|
|
13,191
|
|
||||
|
Commercial real estate
|
2,327,044
|
|
2,059,767
|
|
||||
|
Commercial and industrial loans
|
994,874
|
|
1,048,263
|
|
||||
|
Residential mortgages
|
1,818,111
|
|
1,815,035
|
|
||||
|
Consumer loans
|
906,975
|
|
802,171
|
|
||||
|
Total loans
|
6,047,004
|
|
5,725,236
|
|
||||
|
Less: Allowance for loan losses
|
(43,105
|
)
|
(39,308
|
)
|
||||
|
Net loans
|
6,003,899
|
|
5,685,928
|
|
||||
|
Premises and equipment, net
|
85,794
|
|
88,072
|
|
||||
|
Other real estate owned
|
80
|
|
1,725
|
|
||||
|
Goodwill
|
339,975
|
|
323,943
|
|
||||
|
Other intangible assets
|
8,308
|
|
10,664
|
|
||||
|
Cash surrender value of bank-owned life insurance policies
|
127,880
|
|
125,233
|
|
||||
|
Deferred tax assets, net
|
34,616
|
|
42,526
|
|
||||
|
Other assets
|
87,107
|
|
64,926
|
|
||||
|
Total assets
|
$
|
7,931,161
|
|
$
|
7,831,086
|
|
||
|
Liabilities
|
|
|
|
|
||||
|
Demand deposits
|
$
|
1,113,733
|
|
$
|
1,081,860
|
|
||
|
NOW deposits
|
476,189
|
|
510,807
|
|
||||
|
Money market deposits
|
1,469,075
|
|
1,408,107
|
|
||||
|
Savings deposits
|
607,868
|
|
601,761
|
|
||||
|
Time deposits
|
2,082,889
|
|
1,986,600
|
|
||||
|
Total deposits
|
5,749,754
|
|
5,589,135
|
|
||||
|
Short-term debt
|
939,800
|
|
1,071,200
|
|
||||
|
Long-term Federal Home Loan Bank advances
|
109,114
|
|
103,135
|
|
||||
|
Subordinated borrowings
|
89,116
|
|
88,983
|
|
||||
|
Total borrowings
|
1,138,030
|
|
1,263,318
|
|
||||
|
Other liabilities
|
110,784
|
|
91,444
|
|
||||
|
Total liabilities
|
$
|
6,998,568
|
|
$
|
6,943,897
|
|
||
|
(continued)
|
||||||||
|
Shareholders’ equity
|
|
|
|
|
||||
|
Common stock ($.01 par value; 50,000,000 shares authorized and 32,321,962 shares issued and 31,121,676 shares outstanding in 2016; 32,321,962 shares issued and 30,973,986 shares outstanding in 2015)
|
322
|
|
322
|
|
||||
|
Additional paid-in capital
|
747,844
|
|
742,619
|
|
||||
|
Unearned compensation
|
(6,991
|
)
|
(6,997
|
)
|
||||
|
Retained earnings
|
213,453
|
|
183,885
|
|
||||
|
Accumulated other comprehensive income
|
8,411
|
|
(3,305
|
)
|
||||
|
Treasury stock, at cost (1,200,286 shares in 2016 and 1,179,045 shares in 2015)
|
(30,446
|
)
|
(29,335
|
)
|
||||
|
Total shareholders’ equity
|
932,593
|
|
887,189
|
|
||||
|
Total liabilities and Shareholders’ equity
|
$
|
7,931,161
|
|
$
|
7,831,086
|
|
||
The accompanying notes are an integral part of these consolidated financial statements.
4
BERKSHIRE HILLS BANCORP, INC.
|
Three Months Ended
September 30, |
Nine Months Ended
September 30, |
|||||||||||||||
|
(In thousands, except per share data)
|
2016
|
2015
|
2016
|
2015
|
||||||||||||
|
Interest and dividend income
|
|
|
|
|
|
|
|
|
||||||||
|
Loans
|
$
|
61,571
|
|
$
|
56,343
|
|
$
|
179,716
|
|
$
|
152,292
|
|
||||
|
Securities and other
|
8,940
|
|
9,109
|
|
28,289
|
|
26,314
|
|
||||||||
|
Total interest and dividend income
|
70,511
|
|
65,452
|
|
208,005
|
|
178,606
|
|
||||||||
|
Interest expense
|
|
|
|
|
|
|
|
|
||||||||
|
Deposits
|
7,790
|
|
6,046
|
|
22,327
|
|
16,287
|
|
||||||||
|
Borrowings
|
4,750
|
|
2,435
|
|
12,569
|
|
7,218
|
|
||||||||
|
Total interest expense
|
12,540
|
|
8,481
|
|
34,896
|
|
23,505
|
|
||||||||
|
Net interest income
|
57,971
|
|
56,971
|
|
173,109
|
|
155,101
|
|
||||||||
|
Non-interest income
|
|
|
|
|
|
|
|
|
||||||||
|
Loan related income
|
5,102
|
|
1,537
|
|
11,046
|
|
5,603
|
|
||||||||
|
Mortgage banking income
|
1,862
|
|
693
|
|
4,018
|
|
3,492
|
|
||||||||
|
Deposit related fees
|
6,278
|
|
6,549
|
|
18,678
|
|
18,668
|
|
||||||||
|
Insurance commissions and fees
|
2,601
|
|
2,544
|
|
8,154
|
|
7,997
|
|
||||||||
|
Wealth management fees
|
2,269
|
|
2,376
|
|
7,006
|
|
7,376
|
|
||||||||
|
Total fee income
|
18,112
|
|
13,699
|
|
48,902
|
|
43,136
|
|
||||||||
|
Other, net
|
188
|
|
(1,050
|
)
|
(440
|
)
|
(3,563
|
)
|
||||||||
|
Gain on sale of securities, net
|
78
|
|
49
|
|
101
|
|
2,467
|
|
||||||||
|
Gain on branch sales, net
|
563
|
|
—
|
|
563
|
|
—
|
|
||||||||
|
Total non-interest income
|
18,941
|
|
12,698
|
|
49,126
|
|
42,040
|
|
||||||||
|
Total net revenue
|
76,912
|
|
69,669
|
|
222,235
|
|
197,141
|
|
||||||||
|
Provision for loan losses
|
4,734
|
|
4,240
|
|
13,262
|
|
12,295
|
|
||||||||
|
Non-interest expense
|
|
|
|
|
|
|
|
|
||||||||
|
Compensation and benefits
|
26,119
|
|
25,237
|
|
76,497
|
|
71,551
|
|
||||||||
|
Occupancy and equipment
|
6,650
|
|
6,827
|
|
19,900
|
|
21,178
|
|
||||||||
|
Technology and communications
|
4,902
|
|
4,645
|
|
14,573
|
|
12,328
|
|
||||||||
|
Marketing and promotion
|
671
|
|
781
|
|
2,081
|
|
2,294
|
|
||||||||
|
Professional services
|
1,744
|
|
1,053
|
|
4,533
|
|
3,700
|
|
||||||||
|
FDIC premiums and assessments
|
1,208
|
|
1,157
|
|
3,644
|
|
3,429
|
|
||||||||
|
Other real estate owned and foreclosures
|
46
|
|
298
|
|
702
|
|
800
|
|
||||||||
|
Amortization of intangible assets
|
749
|
|
887
|
|
2,355
|
|
2,722
|
|
||||||||
|
Acquisition, restructuring and conversion related expenses
|
2,170
|
|
3,361
|
|
3,828
|
|
16,493
|
|
||||||||
|
Other
|
4,585
|
|
5,132
|
|
14,099
|
|
14,056
|
|
||||||||
|
Total non-interest expense
|
48,844
|
|
49,378
|
|
142,212
|
|
148,551
|
|
||||||||
|
Income before income taxes
|
23,334
|
|
16,051
|
|
66,761
|
|
36,295
|
|
||||||||
|
Income tax expense
|
6,953
|
|
1,350
|
|
18,422
|
|
2,791
|
|
||||||||
|
Net income
|
$
|
16,381
|
|
$
|
14,701
|
|
$
|
48,339
|
|
$
|
33,504
|
|
||||
|
Earnings per share:
|
|
|
|
|
|
|
|
|
||||||||
|
Basic
|
$
|
0.53
|
|
$
|
0.49
|
|
$
|
1.58
|
|
$
|
1.21
|
|
||||
|
Diluted
|
$
|
0.53
|
|
$
|
0.49
|
|
$
|
1.57
|
|
$
|
1.20
|
|
||||
|
Weighted average common shares outstanding:
|
|
|
|
|
|
|
|
|
||||||||
|
Basic
|
30,621
|
|
29,893
|
|
30,584
|
|
27,685
|
|
||||||||
|
Diluted
|
30,811
|
|
30,069
|
|
30,757
|
|
27,847
|
|
||||||||
The accompanying notes are an integral part of these consolidated financial statements.
5
BERKSHIRE HILLS BANCORP, INC.
CONSOLIDATED STATEMENTS OF COMPREHENSIVE INCOME
|
Three Months Ended
September 30, |
Nine Months Ended
September 30, |
|||||||||||||||
|
(In thousands)
|
2016
|
2015
|
2016
|
2015
|
||||||||||||
|
Net income
|
$
|
16,381
|
|
$
|
14,701
|
|
$
|
48,339
|
|
$
|
33,504
|
|
||||
|
Other comprehensive income, before tax:
|
|
|
|
|
|
|
|
|
||||||||
|
Changes in unrealized gain on securities available-for-sale
|
(5,654
|
)
|
8,207
|
|
21,639
|
|
1,474
|
|
||||||||
|
Changes in unrealized loss on derivative hedges
|
2,730
|
|
(4,369
|
)
|
(2,660
|
)
|
(7,486
|
)
|
||||||||
|
Changes in unrealized loss on pension
|
—
|
|
65
|
|
—
|
|
(1,402
|
)
|
||||||||
|
Income taxes related to other comprehensive income:
|
|
|
|
|
|
|
||||||||||
|
Changes in unrealized gain on securities available-for-sale
|
2,218
|
|
(3,186
|
)
|
(8,330
|
)
|
(692
|
)
|
||||||||
|
Changes in unrealized loss on derivative hedges
|
(1,096
|
)
|
1,761
|
|
1,067
|
|
3,017
|
|
||||||||
|
Changes in unrealized loss on pension
|
—
|
|
(26
|
)
|
—
|
|
565
|
|
||||||||
|
Total other comprehensive (loss) income
|
(1,802
|
)
|
2,452
|
|
11,716
|
|
(4,524
|
)
|
||||||||
|
Total comprehensive income
|
$
|
14,579
|
|
$
|
17,153
|
|
$
|
60,055
|
|
$
|
28,980
|
|
||||
The accompanying notes are an integral part of these consolidated financial statements.
6
BERKSHIRE HILLS BANCORP, INC.
CONSOLIDATED STATEMENTS OF CHANGES IN SHAREHOLDERS’ EQUITY
|
Additional
|
Accumulated
other |
||||||||||||||||||||||||||||||
|
|
Common stock
|
paid-in
|
Unearned
|
Retained
|
comprehensive
|
Treasury
|
|
||||||||||||||||||||||||
|
(In thousands)
|
Shares
|
Amount
|
capital
|
compensation
|
earnings
|
income
|
stock
|
Total
|
|||||||||||||||||||||||
|
Balance at December 31, 2014
|
25,183
|
|
$
|
265
|
|
$
|
585,289
|
|
$
|
(6,147
|
)
|
$
|
156,446
|
|
$
|
6,579
|
|
$
|
(33,145
|
)
|
$
|
709,287
|
|
||||||||
|
Comprehensive income:
|
|
|
|
|
|
|
|
|
|
|
|
|
|
|
|
|
|||||||||||||||
|
Net income
|
—
|
|
—
|
|
—
|
|
—
|
|
33,504
|
|
—
|
|
—
|
|
33,504
|
|
|||||||||||||||
|
Other comprehensive loss
|
—
|
|
—
|
|
—
|
|
—
|
|
—
|
|
(4,524
|
)
|
—
|
|
(4,524
|
)
|
|||||||||||||||
|
Total comprehensive income
|
|
|
|
|
|
|
|
|
|
|
|
|
|
|
28,980
|
|
|||||||||||||||
|
Acquisition of Hampden Bancorp, Inc
|
4,186
|
|
42
|
|
114,562
|
|
—
|
|
—
|
|
—
|
|
—
|
|
114,604
|
|
|||||||||||||||
|
Acquisition of Firestone Financial
|
1,442
|
|
15
|
|
42,092
|
|
—
|
|
—
|
|
—
|
|
—
|
|
42,107
|
|
|||||||||||||||
|
Cash dividends declared ($0.57 per share)
|
—
|
|
—
|
|
—
|
|
—
|
|
(16,016
|
)
|
—
|
|
—
|
|
(16,016
|
)
|
|||||||||||||||
|
Treasury stock purchased
|
—
|
|
—
|
|
—
|
|
—
|
|
—
|
|
—
|
|
—
|
|
—
|
|
|||||||||||||||
|
Forfeited shares
|
(19
|
)
|
—
|
|
42
|
|
479
|
|
—
|
|
—
|
|
(521
|
)
|
—
|
|
|||||||||||||||
|
Exercise of stock options
|
11
|
|
—
|
|
—
|
|
—
|
|
(165
|
)
|
—
|
|
281
|
|
116
|
|
|||||||||||||||
|
Restricted stock grants
|
182
|
|
—
|
|
316
|
|
(4,804
|
)
|
—
|
|
—
|
|
4,488
|
|
—
|
|
|||||||||||||||
|
Stock-based compensation
|
—
|
|
—
|
|
—
|
|
3,378
|
|
—
|
|
—
|
|
—
|
|
3,378
|
|
|||||||||||||||
|
Net tax benefit related to stock-based compensation
|
—
|
|
—
|
|
26
|
|
—
|
|
—
|
|
—
|
|
—
|
|
26
|
|
|||||||||||||||
|
Other, net
|
(36
|
)
|
—
|
|
7
|
|
—
|
|
—
|
|
—
|
|
(921
|
)
|
(914
|
)
|
|||||||||||||||
|
Balance at September 30, 2015
|
30,949
|
|
$
|
322
|
|
$
|
742,334
|
|
$
|
(7,094
|
)
|
$
|
173,769
|
|
$
|
2,055
|
|
$
|
(29,818
|
)
|
$
|
881,568
|
|
||||||||
|
Balance at December 31, 2015
|
30,974
|
|
$
|
322
|
|
$
|
742,619
|
|
$
|
(6,997
|
)
|
$
|
183,885
|
|
$
|
(3,305
|
)
|
$
|
(29,335
|
)
|
$
|
887,189
|
|
||||||||
|
Comprehensive income:
|
|
|
|
|
|
|
|
|
|
|
|
|
|
|
|
|
|||||||||||||||
|
Net income
|
—
|
|
—
|
|
—
|
|
—
|
|
48,339
|
|
—
|
|
—
|
|
48,339
|
|
|||||||||||||||
|
Other comprehensive income
|
—
|
|
—
|
|
—
|
|
—
|
|
—
|
|
11,716
|
|
—
|
|
11,716
|
|
|||||||||||||||
|
Total comprehensive income
|
|
|
|
|
|
|
|
|
|
|
|
|
|
|
60,055
|
|
|||||||||||||||
|
Acquisition of 44 Business Capital
|
45
|
|
—
|
|
—
|
|
—
|
|
—
|
|
—
|
|
1,217
|
|
1,217
|
|
|||||||||||||||
|
Cash dividends declared ($0.60 per share)
|
—
|
|
—
|
|
—
|
|
—
|
|
(18,675
|
)
|
—
|
|
—
|
|
(18,675
|
)
|
|||||||||||||||
|
Treasury stock adjustment
(1)
|
—
|
|
—
|
|
4,632
|
|
—
|
|
—
|
|
—
|
|
(4,632
|
)
|
—
|
|
|||||||||||||||
|
Forfeited shares
|
(63
|
)
|
—
|
|
106
|
|
1,592
|
|
—
|
|
—
|
|
(1,698
|
)
|
—
|
|
|||||||||||||||
|
Exercise of stock options
|
9
|
|
—
|
|
—
|
|
—
|
|
(96
|
)
|
—
|
|
238
|
|
142
|
|
|||||||||||||||
|
Restricted stock grants
|
185
|
|
—
|
|
504
|
|
(5,052
|
)
|
—
|
|
—
|
|
4,548
|
|
—
|
|
|||||||||||||||
|
Stock-based compensation
|
—
|
|
—
|
|
—
|
|
3,466
|
|
—
|
|
—
|
|
—
|
|
3,466
|
|
|||||||||||||||
|
Net tax benefit related to stock-based compensation
|
—
|
|
—
|
|
(1
|
)
|
—
|
|
—
|
|
—
|
|
—
|
|
(1
|
)
|
|||||||||||||||
|
Other, net
|
(28
|
)
|
—
|
|
(16
|
)
|
—
|
|
—
|
|
—
|
|
(784
|
)
|
(800
|
)
|
|||||||||||||||
|
Balance at September 30, 2016
|
31,122
|
|
$
|
322
|
|
$
|
747,844
|
|
$
|
(6,991
|
)
|
$
|
213,453
|
|
$
|
8,411
|
|
$
|
(30,446
|
)
|
$
|
932,593
|
|
||||||||
(1) Treasury stock adjustment represents the extinguishment of
168,931
shares of Berkshire Hills Bancorp stock held by the Company's subsidiary.
The accompanying notes are an integral part of these consolidated financial statements.
7
BERKSHIRE HILLS BANCORP, INC.
|
|
Nine Months Ended
September 30, |
|||||||
|
(In thousands)
|
2016
|
2015
|
||||||
|
Cash flows from operating activities:
|
|
|
|
|
||||
|
Net income
|
$
|
48,339
|
|
$
|
33,504
|
|
||
|
Adjustments to reconcile net income to net cash provided by operating activities:
|
|
|
|
|
||||
|
Provision for loan losses
|
13,262
|
|
12,295
|
|
||||
|
Net amortization of securities
|
3,476
|
|
2,282
|
|
||||
|
Change in unamortized net loan costs and premiums
|
(3,825
|
)
|
(716
|
)
|
||||
|
Premises and equipment depreciation and amortization expense
|
6,226
|
|
6,443
|
|
||||
|
Stock-based compensation expense
|
3,466
|
|
3,377
|
|
||||
|
Accretion of purchase accounting entries, net
|
(7,266
|
)
|
(6,383
|
)
|
||||
|
Amortization of other intangibles
|
2,355
|
|
2,722
|
|
||||
|
Write down of other real estate owned
|
395
|
|
480
|
|
||||
|
Excess tax loss from stock-based payment arrangements
|
(105
|
)
|
(26
|
)
|
||||
|
Income from cash surrender value of bank-owned life insurance policies
|
(2,905
|
)
|
(2,401
|
)
|
||||
|
Gain on sales of securities, net
|
(101
|
)
|
(2,467
|
)
|
||||
|
Net (increase) in loans held for sale
|
(7,280
|
)
|
(5,060
|
)
|
||||
|
Loss on disposition of assets
|
32
|
|
2,208
|
|
||||
|
Loss on sale of real estate
|
62
|
|
240
|
|
||||
|
Amortization of interest in tax-advantaged projects
|
4,454
|
|
8,577
|
|
||||
|
Net change in other
|
(1,089
|
)
|
(4,236
|
)
|
||||
|
Net cash provided by operating activities
|
59,496
|
|
50,839
|
|
||||
|
Cash flows from investing activities:
|
|
|
|
|
||||
|
Net decrease in trading security
|
446
|
|
424
|
|
||||
|
Proceeds from sales of securities available for sale
|
283,755
|
|
24,389
|
|
||||
|
Proceeds from maturities, calls and prepayments of securities available for sale
|
128,566
|
|
143,489
|
|
||||
|
Purchases of securities available for sale
|
(186,392
|
)
|
(236,601
|
)
|
||||
|
Proceeds from maturities, calls and prepayments of securities held to maturity
|
5,946
|
|
6,889
|
|
||||
|
Purchases of securities held to maturity
|
(5,969
|
)
|
(62,074
|
)
|
||||
|
Net change in loans
|
(284,440
|
)
|
(327,813
|
)
|
||||
|
Purchases of bank owned life insurance
|
—
|
|
554
|
|
||||
|
Proceeds from surrender of bank-owned life insurance
|
258
|
|
—
|
|
||||
|
Proceeds from sale of Federal Home Loan Bank stock
|
18,544
|
|
306
|
|
||||
|
Purchase of Federal Home Loan Bank stock
|
(8,803
|
)
|
(10,706
|
)
|
||||
|
Net investment in limited partnership tax credits
|
(5,189
|
)
|
(2,500
|
)
|
||||
|
Proceeds from the sale of premises and equipment
|
226
|
|
1,932
|
|
||||
|
Purchase of premises and equipment, net
|
(4,314
|
)
|
(3,961
|
)
|
||||
|
Acquisitions, net of cash (paid) acquired
|
(55,542
|
)
|
74,324
|
|
||||
|
Proceeds from sale of other real estate
|
1,483
|
|
1,705
|
|
||||
|
Net cash used in investing activities
|
$
|
(111,425
|
)
|
$
|
(389,643
|
)
|
||
|
(continued)
|
||||||||
8
|
|
Nine Months Ended
September 30, |
|||||||
|
(In thousands)
|
2016
|
2015
|
||||||
|
Cash flows from financing activities:
|
|
|
|
|
||||
|
Net increase in deposits
|
161,114
|
|
393,762
|
|
||||
|
Proceeds from Federal Home Loan Bank advances and other borrowings
|
7,264,120
|
|
6,441,300
|
|
||||
|
Repayments of Federal Home Loan Bank advances and other borrowings
|
(7,389,048
|
)
|
(6,458,567
|
)
|
||||
|
Exercise of stock options
|
141
|
|
116
|
|
||||
|
Excess tax loss from stock-based payment arrangements
|
—
|
|
26
|
|
||||
|
Common stock cash dividends paid
|
(18,675
|
)
|
(16,016
|
)
|
||||
|
Net cash provided by financing activities
|
17,652
|
|
360,621
|
|
||||
|
Net change in cash and cash equivalents
|
(34,277
|
)
|
21,817
|
|
||||
|
Cash and cash equivalents at beginning of year
|
103,562
|
|
71,754
|
|
||||
|
Cash and cash equivalents at end of year
|
$
|
69,285
|
|
$
|
93,571
|
|
||
|
Supplemental cash flow information:
|
|
|
|
|
||||
|
Interest paid on deposits
|
$
|
21,954
|
|
$
|
15,833
|
|
||
|
Interest paid on borrowed funds
|
12,166
|
|
7,069
|
|
||||
|
Income taxes paid, net
|
10,995
|
|
1,125
|
|
||||
|
Acquisition of non-cash assets and liabilities:
|
|
|
|
|
||||
|
Assets acquired
|
56,976
|
|
948,796
|
|
||||
|
Liabilities assumed
|
(109
|
)
|
(762,261
|
)
|
||||
|
Other non-cash changes:
|
|
|
|
|
||||
|
Other net comprehensive income (loss)
|
11,716
|
|
(4,524
|
)
|
||||
|
Real estate owned acquired in settlement of loans
|
295
|
|
2,747
|
|
||||
9
The consolidated financial statements (the “financial statements”) of Berkshire Hills Bancorp, Inc. and its subsidiaries (the “Company” or “Berkshire”) have been prepared in conformity with accounting principles generally accepted in the United States of America (“GAAP”). The Company is a Delaware corporation and the holding company for Berkshire Bank (the “Bank”), a Massachusetts-chartered trust company headquartered in Pittsfield, Massachusetts, and Berkshire Insurance Group, Inc. (“Berkshire Insurance Group” or “BIG”). These financial statements include the accounts of the Company, its wholly-owned subsidiaries and the Bank’s consolidated subsidiaries. In consolidation, all significant intercompany accounts and transactions are eliminated. The results of operations of companies or assets acquired are included only from the dates of acquisition. All material wholly-owned and majority-owned subsidiaries are consolidated unless GAAP requires otherwise.
In addition, these interim financial statements have been prepared in accordance with the instructions to Form 10-Q and Article 10 of Regulation S-X, and accordingly, certain information and footnote disclosures normally included in financial statements prepared according to U.S. GAAP have been omitted.
The results for any interim period are not necessarily indicative of results for the full year. These consolidated financial statements should be read in conjunction with the audited financial statements and note disclosures for Berkshire Hills Bancorp, Inc. (the “Company”) previously filed with the Securities and Exchange Commission in the Company’s Annual Report on Form 10-K for the year ended December 31, 2015. In management's opinion, all adjustments necessary for a fair statement are reflected in the interim periods presented.
Recently Adopted Accounting Principles
Effective January 1, 2016, the following new accounting guidance was adopted by the Company:
|
•
|
ASU No. 2015-02, Consolidation (Topic 810) - Amendments to the Consolidation Analysis;
|
|
•
|
ASU No. 2015-03, Interest-Imputation of Interest (Subtopic 835-30) - Simplifying the Presentation of Debt Issuance Costs;
|
|
•
|
ASU No. 2015-05, Intangibles-Goodwill and Other-Internal-Use Software (Subtopic 350-40): Customer’s Accounting for Fees Paid in a Cloud Computing Arrangement; and
|
|
•
|
ASU No. 2015-16, Business Combinations (Topic 805) - Simplifying the Accounting for Measurement - Period Adjustments.
|
The adoption of these accounting standards did not have a material impact on the Company's financial statements.
In March 2016, the FASB issued ASU No. 2016-09, “Improvement to Employee Share-Based Payment Accounting”. This ASU contains targeted amendments to the accounting for shared based payment transactions, including income tax consequences for awards, classification of awards as either equity or liabilities, and classification of activity on the statement of cash flows. Specifically, some of the requirements under the amendments include: (1) excess tax benefits and/or tax deficiencies, determined as the difference between compensation cost recognized for financial reporting purposes and the deduction for tax, be recognized in the income statement as income tax expense or benefit in the period in which they occur, removing historical equity treatment; (2) excess tax benefits are no longer separately classified as a financing activity but rather should be classified with other income tax cash flows as an operating activity on the statement of cash flows; (3) cash paid by an employer when withholding shares for tax withholding purposes should be classified as a financing activity. Additionally, regarding forfeitures, this guidance permits a company to make an entity-wide accounting policy election to either estimate the number of awards that are expected to vest (current GAAP) or account for forfeitures when they occur. ASU No. 2016-09 is effective for annual periods beginning after December 15, 2016. The Company adopted ASU No. 2016-09 in April 2016 and the adoption of this accounting standard did not have a material impact on the Company's consolidated financial statements. The Company chose a modified retrospective approach and a policy election to account for forfeitures when they occur. This change resulted in a cumulative adjustment immaterial to all periods presented.
10
Future Application of Accounting Pronouncements
In May 2014, the FASB issued ASU No. 2014-09 related to the recognition of revenue from contracts with customers. The new revenue pronouncement creates a single source of revenue guidance for all companies in all industries and is more principles based than current revenue guidance. The pronouncement provides a five-step model for a company to recognize revenue when it transfers control of goods or services to customers at an amount that reflects the consideration to which it expects to be entitled in exchange for those goods or services. The five steps are (1) identify the contract with the customer, (2) identify the separate performance obligations in the contract, (3) determine the transaction price, (4) allocate the transaction price to the separate performance obligations and (5) recognize revenue when each performance obligation is satisfied. The standard is effective for public entities for interim and annual reporting periods beginning after December 15, 2016; early adoption is not permitted. However, in August 2015, Accounting Standards Update No. 2015-14, “Deferral of the Effective Date” (“ASU 2015-14”) was issued and delayed the effective date of ASU 2014-09 to annual and interim periods in fiscal years beginning after December 15, 2017. Early adoption is permitted, but not before the original effective date (i.e., interim and annual reporting periods beginning after December 15, 2016). For financial reporting purposes, the standard allows for either full retrospective adoption, meaning the standard is applied to all of the periods presented, or modified retrospective adoption, meaning the standard is applied only to the most current period presented in the financial statements with the cumulative effect of initially applying the standard recognized at the date of initial application.
In March, April and May 2016, the FASB issued ASU No. 2016-08, “Principal versus Agent Considerations,” ASU No. 2016-10, “Identifying Performance Obligations and Licensing,” and ASU 2016-12, “Narrow-Scope Improvements and Practical Expedients,” respectfully. The updates are not intended to change the core principles of the standard; however, they attempt to clarify important aspects of the guidance and improve its operability. The amendments have the same effective date and transition requirements as the new revenue standard. The Company is currently evaluating the provisions of ASU No. 2014-09, and will be closely monitoring developments and additional guidance to determine the potential impact the new standard will have on the Company's consolidated financial statements.
In January 2016, the FASB issued ASU No. 2016-01, “Recognition and Measurement of Financial Assets and Financial Liabilities.” This ASU requires an entity to: i) measure equity investments at fair value through net income, with certain exceptions; (ii) present in other comprehensive income the changes in instrument-specific credit risk for financial liabilities measured using the fair value option; (iii) present financial assets and financial liabilities by measurement category and form of financial asset; (iv) calculate the fair value of financial instruments for disclosure purposes based on an exit price and; (v) assess a valuation allowance on deferred tax assets related to unrealized losses of AFS debt securities in combination with other deferred tax assets. The guidance provides an election to subsequently measure certain nonmarketable equity investments at cost less any impairment and adjusted for certain observable price changes. The guidance also requires a qualitative impairment assessment of such equity investments and amends certain fair value disclosure requirements. The guidance is effective for annual periods beginning after December 15, 2017. Early adoption is only permitted for the provision related to instrument specific credit risk. The Company is currently evaluating the impact of the new standard on the Company's consolidated financial statements.
In February 2016, the FASB issued ASU No. 2016-02, “Leases”. The new pronouncement improves the transparency and comparability of financial reporting around leasing transactions and more closely aligns accounting for leases with the recently issued International Financial Reporting Standard. The pronouncement affects all entities that are participants to leasing agreements. From a lessee accounting perspective, the ASU requires a lessee to recognize assets and liabilities on the balance sheet for operating leases and changes many key definitions, including the definition of a lease. The ASU includes a short-term lease exception for leases with a term of twelve months or less, in which a lessee can make an accounting policy election not to recognize lease assets and lease liabilities. Lessees will continue to differentiate between finance leases (previously referred to as capital leases) and operating leases, using classification criteria that are substantially similar to the previous guidance. For lessees, the recognition, measurement, and presentation of expenses and cash flows arising from a lease have not significantly changed from previous GAAP. From a lessor accounting perspective, the guidance is largely unchanged, except for targeted improvements to align with new terminology under lessee accounting and with the
11
updated revenue recognition guidance in Topic 606. For sale-leaseback transactions, for a sale to occur the transfer must meet the sale criteria under the new revenue standard, ASC 606. Entities will not be required to reassess transactions previously accounted under then existing guidance.
Additionally, the ASU includes additional quantitative and qualitative disclosures required by lessees and lessors to help users better understand the amount, timing, and uncertainty of cash flows arising from leases. ASU No. 2016-02 is effective for fiscal years beginning after December 31, 2018, and interim periods within those fiscal years. Lessees and lessors are required to recognize and measure leases at the beginning of the earliest period presented using a modified retrospective approach. The modified retrospective approach includes a number of optional practical expedients that entities may elect to apply as well as transition guidance specific to nonstandard leasing transactions. The Company is currently evaluating the provisions of ASU No. 2016-02 to determine the potential impact the new standard will have on the Company's consolidated financial statements.
In March 2016
,
the FASB issued ASU No. 2016-05, “Effect of Derivative Contract Novations on Existing Hedge Accounting Relationships.” This ASU clarifies that changes in the counterparty to a derivative instrument designated as a hedg
e
does not
alone require it to be de-designated and therefore discontinue the application of hedge accounting. Companies are still required to evaluate whether it is probable that a counterparty will perform under the contract as part of the ongoing effectiveness assessment for hedge accounting. The new guidance is effective for annual periods beginning after December 15, 2016 and entities may adopt on a prospective or modified retrospective basis. The adoption of this pronouncement is not expected to have a material impact on the Company's consolidated financial statements.
In March 2016, the FASB issued ASU No. 2016-06, “Contingent Put and Call Options in Debt Instruments” clarifying the assessment of whether contingent call or put options that can accelerate the payment of principal on debt instruments are clearly and closely related to the economic characteristics and risks of their debt hosts, a criteria in assessing whether to bifurcate an embedded derivative. The new pronouncement clarifies the exercise contingency and the event triggering the contingency does not need to be evaluated in the clearly and closely analysis relative to interest rates or credit risks. Rather, the call or put would be evaluated as a derivative regardless of the exercise contingency. Further, if an entity is no longer required to bifurcate a
put or call option per the new guidance, the entity has a one-time option to irrevocably elect to measure that debt instrument in its entirety at fair value with changes in fair value recognized in earnings. ASU No. 2016-06 is effective for annual periods beginning after December 15, 2016 and early adoption is permitted. The ASU should be applied using the modified retrospective basis to existing instruments as of the beginning of the annual period of adoption.
The adoption of this pronouncement is not expected to have a material impact on the Company's consolidated financial statements.
In March 2016, the FASB issued ASU No. 2016-07 “Simplifying the Transition to the Equity Method of Accounting” which eliminates the requirement to retroactively adjust an investment that becomes subject to the equity method of accounting as a result of an increase ownership interest or degree of influence. Alternatively, an investor entity adds the cost of acquiring the additional interest in the investee to the current basis of the investor’s previously held interest and adopts the equity method of accounting prospectively as of the qualifying date; no retroactive adjustment is required. Additionally, ASU No. 2016-07 specifies that when an available-for-sale equity security becomes qualified for the equity method of accounting, a company should recognize the unrealized holding gain or loss in accumulated other comprehensive income through earnings at the date the investment becomes qualified for use of the equity method. This guidance is effective for all entities for annual periods beginning after December 15, 2016, with early adoption permitted on a prospective basis. The adoption of this pronouncement is not expected to have a material impact on the Company's consolidated financial statements.
In June 2016, the FASB issued ASU No. 2016-13, “Measurement of Credit Losses on Financial Instruments.” This ASU improves financial reporting by requiring timelier recording of credit losses on loans and other financial instruments. The ASU requires companies to measure all expected credit losses for financial assets held at the reporting date based on historical experience, current conditions, and reasonable and supportable forecasts. Forward-looking information will now be used in credit loss estimates. The ASU requires enhanced disclosures to provide better understanding surrounding significant estimates and judgments used in estimating credit losses, as well as the credit quality and underwriting standards of a company’s portfolio. These disclosures include qualitative
12
and quantitative requirements that provide additional information about the amounts recorded in the financial statements. Additionally, the ASU amends the accounting for credit losses on available-for-sale debt securities and purchased financial assets with credit deterioration. Most debt instruments will require a cumulative-effect adjustment to retained earnings on the statement of financial position as of the beginning of the first reporting period in which the guidance is adopted (modified retrospective approach). However, there is instrument-specific transition guidance. ASU No. 2016-13 is effective for interim and annual periods beginning after December 15, 2019. Early application will be permitted for interim and annual periods beginning after December 15, 2018. The Company is evaluating the provisions of ASU No. 2016-13, and will closely monitor developments and additional guidance to determine the potential impact on the Company's consolidated financial statements.
In August 2016, the FASB issued ASU No. 2016-15, “Classification of Certain Cash Receipts and Cash Payments.” Current GAAP is unclear or does not include specific guidance on how to classify certain transactions in the statement of cash flows. The new guidance addresses eight specific cash flow issues with the objective of reducing the existing diversity in practice. ASU No. 2016-15 is effective for interim and annual periods beginning after December 15, 2017. Early application will be permitted provided that all of the amendments are adopted in the same period. Entities will be required to apply the guidance retrospectively. If it is impracticable to apply the guidance retrospectively for an issue, the amendment related to that issue would be applied prospectively. As this guidance only affects the classification within the statement of cash flows, ASU No. 2016-15 is not expected to have a material impact on the Company’s consolidated financial statements.
13
NOTE 2.
ACQUISITION
44 Business Capital
On April 29, 2016, the Bank acquired and assumed the business model, certain assets, and certain liabilities of 44 Business Capital, along with certain loans and other assets of Parke Bank’s (“Parke”) SBA 7(a) loan program operations. 44 Business Capital was a joint venture of Parke (
51%
) and a management group (
49%
), 44 Amigos LLC, located in Blue Bell, Pennsylvania. 44 Business Capital was engaged in originating, servicing, and selling SBA loans using Parke’s SBA PLP preferred lender license.
The transaction includes acquiring assets, key people, systems, and processes necessary for a market participant to run operations as a business. In accordance with ASC 805-10-55, the transaction was recorded as a business combination, resulting in acquisition accounting in which all assets acquired and liabilities are assumed at fair value.
The loans acquired by the Bank were the unguaranteed portions of SBA loans of which
$35.6 million
were recorded as commercial real estate and
$1.2 million
were recorded as commercial & industrial. Servicing rights on a notional loan balance of
$148 million
were also acquired. The Company expects the acquisition to expand its SBA lending program on a super-regional and national basis with the intent of selling many of these loans on the secondary market. It expands and diversifies the Company's fee revenue sources. Additionally, the acquisition of 44 Business Capital expands the Company’s product lines, creates cross-selling opportunities, and adds niche lending to its portfolio. 44 Business Capital will operate as a direct small business lending department reporting up through the Company’s established specialty lending division.
The following table provides a summary of the assets acquired and liabilities assumed and the associated fair value adjustments as recorded by the Company at acquisition:
Explanation of Certain Fair Value Adjustments
|
(in thousands)
|
As Acquired
|
Fair Value Adjustments
|
As Recorded at Acquisition
|
|||||||||||
|
Consideration paid:
|
||||||||||||||
|
Company common stock issued to certain 44 Business Capital shareholders (44,840 shares)
|
$
|
1,217
|
|
|||||||||||
|
Cash paid to 44 Business Capital shareholders and Parke
|
55,649
|
|
||||||||||||
|
Total consideration paid
|
$
|
56,866
|
|
|||||||||||
|
Recognized amounts of identifiable assets acquired and liabilities assumed, at fair value:
|
||||||||||||||
|
Cash and short-term investments
|
$
|
107
|
|
$
|
—
|
|
$
|
107
|
|
|||||
|
Loans
|
42,627
|
|
(5,777
|
)
|
(a)
|
36,850
|
|
|||||||
|
Premises and equipment
|
69
|
|
(36
|
)
|
(b)
|
$
|
33
|
|
||||||
|
Other assets
|
3,076
|
|
639
|
|
(c)
|
3,715
|
|
|||||||
|
Other liabilities
|
(108
|
)
|
—
|
|
$
|
(108
|
)
|
|||||||
|
Total identifiable net assets
|
$
|
45,771
|
|
$
|
(5,174
|
)
|
$
|
40,597
|
|
|||||
|
Goodwill
|
$
|
16,269
|
|
|||||||||||
|
(a)
|
The adjustment represents the write down of the book value of loans to their estimated fair value based on current interest rates and expected cash flows, which includes an estimate of expected loan loss inherent in the portfolio. Loans that met the criteria and are being accounted for in accordance with ASC 310-30 had a book value of
$6.3 million
and have a fair value
$2.6 million
. Non-impaired loans accounted for under ASC 310-10 had a book value of
$36.4 million
and have a fair value of
$34.3 million
. ASC 310-30 loans have a
$708 thousand
fair value adjustment discount that is accretable in earnings over an average estimated
six
-year life using the effective yield as determined on the date of acquisition. The effective yield is periodically adjusted for changes in expected cash flows. ASC 310-10 loans have a
$2.1 million
fair value adjustment discount that is amortized into income over the remaining term of the loans using the effective interest method.
|
|
(b)
|
The fair value of the equipment was assumed to approximate the net carrying value based on overall condition and age. The adjustment represents the immediate expensing of equipment not meeting the thresholds for
|
14
capitalization in accordance with Company policy. The recorded amount will be depreciated over the remaining estimated economic lives of the assets.
|
(c)
|
The adjustment represents the fair value write up of book value of the loan servicing right asset to its estimated fair value based on current interest rates and expected cash flows, which includes an estimate of cost of service and conditional prepayment rates applied to the underlying unpaid loan pool balance over the remaining life of the loans. The balance includes accrued interest of
$221 thousand
.
|
The fair values for loans acquired were estimated using cash flow projections based on the remaining maturity and repricing terms. Cash flows were adjusted by estimating future credit losses and the rate of prepayments. Projected monthly cash flows were then discounted to present value using a risk-adjusted market rate for similar loans. There was no carryover of the seller’s allowance for credit losses associated with the loans that were acquired in the acquisition as the loans were initially recorded at fair value.
Information about the acquired loan portfolio subject to ASC 310-30 as of April 29, 2016 is, as follows (in thousands):
|
ASC 310-30 Loans
|
|||
|
Gross contractual receivable amounts at acquisition
|
$
|
6,265
|
|
|
Contractual cash flows not expected to be collected (nonaccretable discount)
|
(3,000
|
)
|
|
|
Expected cash flows at acquisition
|
3,265
|
|
|
|
Interest component of expected cash flows (accretable discount)
|
(708
|
)
|
|
|
Fair value of acquired loans
|
$
|
2,557
|
|
Capitalized goodwill, which is not amortized for book purposes, was assigned to the Company.
Direct acquisition and integration costs of the 44 Business Capital acquisition were expensed as incurred, and totaled
$164 thousand
during the nine months ending September 30, 2016 and
$124 thousand
for the same period of 2015. These costs totaled
$66 thousand
for the three months ended September 30, 2016 and
$124 thousand
for the same period of 2015.
Pro Forma Information (unaudited)
The following table presents selected unaudited pro forma financial information reflecting the acquisition of 44 Business Capital assuming the acquisition was completed as of January 1, 2015. The unaudited pro forma financial information includes adjustments for scheduled amortization and accretion of fair value adjustments recorded at the acquisitions. These adjustments would have been different if they had been recorded on January 1, 2015, and they do not include the impact of prepayments. The unaudited pro forma financial information is presented for illustrative purposes only and is not necessarily indicative of the combined financial results of the Company and 44 Business Capital had the transaction actually been completed at the beginning of the periods presented, nor does it indicate future results for any other interim or full-year period. Pro forma basic and diluted earnings per common share were calculated using Berkshire’s actual weighted-average shares outstanding for the periods presented plus the
45 thousand
shares issued as a result of the 44 Business Capital acquisition. The unaudited pro forma information is based on the actual financial statements of Berkshire and 44 Business Capital for the periods shown until the date of acquisition, at which time 44 Business Capital operations became included in Berkshire’s financial statements. For the period from the date of acquisition through September 30, 2016, 44 Business Capital's net revenue was
$2.8 million
and net income was
$593 thousand
which includes
$164 thousand
of acquisition expenses.
The unaudited pro forma information, for the nine months ended September 30, 2016 and 2015, set forth below reflects adjustments related to amortization and accretion of purchase accounting fair value adjustments and an estimated tax rate of
40 percent
. Direct acquisition expenses incurred by the Company during 2016, as noted above, are reversed for the purposes of this unaudited pro forma information. Furthermore, the unaudited pro forma information does not reflect management’s estimate of any revenue-enhancing or anticipated cost-savings that could occur as a result of the acquisition.
15
Information in the following table is shown in thousands, except earnings per share:
|
Pro Forma (unaudited)
|
||||||||
|
Nine Months Ended September 30,
|
||||||||
|
2016
|
2015
|
|||||||
|
Net interest income
|
$
|
173,421
|
|
$
|
156,812
|
|
||
|
Non-interest income
|
51,279
|
|
46,196
|
|
||||
|
Net income
|
49,170
|
|
35,567
|
|
||||
|
Pro forma earnings per share:
|
||||||||
|
Basic
|
$
|
1.61
|
|
$
|
1.28
|
|
||
|
Diluted
|
$
|
1.60
|
|
$
|
1.28
|
|
||
The Company holds a tax advantaged economic development bond accounted for at fair value. The security had an amortized cost of
$11.5 million
and
$12.0 million
, and a fair value of
$14.1 million
and
$14.2 million
, at
September 30, 2016
and
December 31, 2015
, respectively. As discussed further in Note 12 - Derivative Financial Instruments and Hedging Activities, the Company has entered into a swap contract to swap-out the fixed rate of the security in exchange for a variable rate. The Company does not purchase securities with the intent of selling them in the near term, and there are
no
other securities in the trading portfolio at
September 30, 2016
.
16
The following is a summary of securities available for sale and held to maturity:
|
(In thousands)
|
Amortized Cost
|
Gross
Unrealized
Gains
|
Gross
Unrealized
Losses
|
Fair Value
|
||||||||||||
|
September 30, 2016
|
|
|
|
|
|
|
|
|
||||||||
|
Securities available for sale
|
|
|
|
|
|
|
|
|
||||||||
|
Debt securities:
|
|
|
|
|
|
|
|
|
||||||||
|
Municipal bonds and obligations
|
$
|
114,866
|
|
$
|
6,357
|
|
$
|
(97
|
)
|
$
|
121,126
|
|
||||
|
Agency collateralized mortgage obligations
|
530,548
|
|
11,567
|
|
(118
|
)
|
541,997
|
|
||||||||
|
Agency mortgage-backed securities
|
103,261
|
|
1,463
|
|
(54
|
)
|
104,670
|
|
||||||||
|
Agency commercial mortgage-backed securities
|
61,673
|
|
627
|
|
—
|
|
62,300
|
|
||||||||
|
Corporate bonds
|
46,869
|
|
359
|
|
(706
|
)
|
46,522
|
|
||||||||
|
Trust preferred securities
|
11,584
|
|
275
|
|
(58
|
)
|
11,801
|
|
||||||||
|
Other bonds and obligations
|
3,158
|
|
42
|
|
—
|
|
3,200
|
|
||||||||
|
Total debt securities
|
871,959
|
|
20,690
|
|
(1,033
|
)
|
891,616
|
|
||||||||
|
Marketable equity securities
|
47,825
|
|
9,148
|
|
(1,736
|
)
|
55,237
|
|
||||||||
|
Total securities available for sale
|
919,784
|
|
29,838
|
|
(2,769
|
)
|
946,853
|
|
||||||||
|
Securities held to maturity
|
|
|
|
|
|
|
|
|
||||||||
|
Municipal bonds and obligations
|
95,457
|
|
5,708
|
|
—
|
|
101,165
|
|
||||||||
|
Agency collateralized mortgage obligations
|
66
|
|
7
|
|
—
|
|
73
|
|
||||||||
|
Tax advantaged economic development bonds
|
35,619
|
|
2,176
|
|
—
|
|
37,795
|
|
||||||||
|
Other bonds and obligations
|
325
|
|
—
|
|
—
|
|
325
|
|
||||||||
|
Total securities held to maturity
|
131,467
|
|
7,891
|
|
—
|
|
139,358
|
|
||||||||
|
Total
|
$
|
1,051,251
|
|
$
|
37,729
|
|
$
|
(2,769
|
)
|
$
|
1,086,211
|
|
||||
|
December 31, 2015
|
|
|
|
|
|
|
|
|
||||||||
|
Securities available for sale
|
|
|
|
|
|
|
|
|
||||||||
|
Debt securities:
|
|
|
|
|
|
|
|
|
||||||||
|
Municipal bonds and obligations
|
$
|
99,922
|
|
$
|
4,763
|
|
$
|
(124
|
)
|
$
|
104,561
|
|
||||
|
Agency collateralized mortgage obligations
|
833,633
|
|
4,957
|
|
(5,554
|
)
|
833,036
|
|
||||||||
|
Agency mortgage-backed securities
|
127,274
|
|
542
|
|
(987
|
)
|
126,829
|
|
||||||||
|
Agency commercial mortgage-backed securities
|
—
|
|
—
|
|
—
|
|
—
|
|
||||||||
|
Corporate bonds
|
42,849
|
|
—
|
|
(1,826
|
)
|
41,023
|
|
||||||||
|
Trust preferred securities
|
11,719
|
|
182
|
|
(1
|
)
|
11,900
|
|
||||||||
|
Other bonds and obligations
|
3,175
|
|
—
|
|
(34
|
)
|
3,141
|
|
||||||||
|
Total debt securities
|
1,118,572
|
|
10,444
|
|
(8,526
|
)
|
1,120,490
|
|
||||||||
|
Marketable equity securities
|
30,522
|
|
5,331
|
|
(1,886
|
)
|
33,967
|
|
||||||||
|
Total securities available for sale
|
1,149,094
|
|
15,775
|
|
(10,412
|
)
|
1,154,457
|
|
||||||||
|
Securities held to maturity
|
|
|
|
|
|
|
|
|
||||||||
|
Municipal bonds and obligations
|
94,642
|
|
3,359
|
|
(34
|
)
|
97,967
|
|
||||||||
|
Agency collateralized mortgage obligations
|
68
|
|
3
|
|
—
|
|
71
|
|
||||||||
|
Tax advantaged economic development bonds
|
36,613
|
|
1,924
|
|
—
|
|
38,537
|
|
||||||||
|
Other bonds and obligations
|
329
|
|
—
|
|
—
|
|
329
|
|
||||||||
|
Total securities held to maturity
|
131,652
|
|
5,286
|
|
(34
|
)
|
136,904
|
|
||||||||
|
Total
|
$
|
1,280,746
|
|
$
|
21,061
|
|
$
|
(10,446
|
)
|
$
|
1,291,361
|
|
||||
17
The amortized cost and estimated fair value of available for sale (“AFS”) and held to maturity (“HTM”) securities, segregated by contractual maturity at
September 30, 2016
are presented below. Expected maturities may differ from contractual maturities because issuers may have the right to call or prepay obligations. Mortgage-backed securities are shown in total, as their maturities are highly variable. Equity securities have no maturity and are also shown in total.
|
|
Available for sale
|
Held to maturity
|
||||||||||||||
|
|
Amortized
|
Fair
|
Amortized
|
Fair
|
||||||||||||
|
(In thousands)
|
Cost
|
Value
|
Cost
|
Value
|
||||||||||||
|
Within 1 year
|
$
|
—
|
|
$
|
—
|
|
$
|
2,580
|
|
$
|
2,589
|
|
||||
|
Over 1 year to 5 years
|
4,894
|
|
4,984
|
|
16,906
|
|
17,920
|
|
||||||||
|
Over 5 years to 10 years
|
32,920
|
|
33,643
|
|
13,853
|
|
14,444
|
|
||||||||
|
Over 10 years
|
138,663
|
|
144,022
|
|
98,062
|
|
104,332
|
|
||||||||
|
Total bonds and obligations
|
176,477
|
|
182,649
|
|
131,401
|
|
139,285
|
|
||||||||
|
Marketable equity securities
|
47,825
|
|
55,237
|
|
—
|
|
—
|
|
||||||||
|
Mortgage-backed securities
|
695,482
|
|
708,967
|
|
66
|
|
73
|
|
||||||||
|
Total
|
$
|
919,784
|
|
$
|
946,853
|
|
$
|
131,467
|
|
$
|
139,358
|
|
||||
18
Securities with unrealized losses, segregated by the duration of their continuous unrealized loss positions, are summarized as follows:
|
|
Less Than Twelve Months
|
Over Twelve Months
|
Total
|
|||||||||||||||||||||
|
|
Gross
|
|
Gross
|
|
Gross
|
|
||||||||||||||||||
|
|
Unrealized
|
Fair
|
Unrealized
|
Fair
|
Unrealized
|
Fair
|
||||||||||||||||||
|
(In thousands)
|
Losses
|
Value
|
Losses
|
Value
|
Losses
|
Value
|
||||||||||||||||||
|
September 30, 2016
|
|
|
|
|
|
|
|
|
|
|
|
|
||||||||||||
|
Securities available for sale
|
|
|
|
|
|
|
|
|
|
|
|
|
||||||||||||
|
Debt securities:
|
|
|
|
|
|
|
|
|
|
|
|
|
||||||||||||
|
Municipal bonds and obligations
|
$
|
97
|
|
$
|
12,160
|
|
$
|
—
|
|
$
|
—
|
|
$
|
97
|
|
$
|
12,160
|
|
||||||
|
Agency collateralized mortgage obligations
|
118
|
|
43,710
|
|
—
|
|
—
|
|
118
|
|
43,710
|
|
||||||||||||
|
Agency mortgage-backed securities
|
30
|
|
12,901
|
|
24
|
|
1,349
|
|
54
|
|
14,250
|
|
||||||||||||
|
Corporate bonds
|
—
|
|
—
|
|
706
|
|
19,998
|
|
706
|
|
19,998
|
|
||||||||||||
|
Trust preferred securities
|
—
|
|
—
|
|
58
|
|
1,200
|
|
58
|
|
1,200
|
|
||||||||||||
|
Total debt securities
|
245
|
|
68,771
|
|
788
|
|
22,547
|
|
1,033
|
|
91,318
|
|
||||||||||||
|
Marketable equity securities
|
494
|
|
9,899
|
|
1,242
|
|
6,939
|
|
1,736
|
|
16,838
|
|
||||||||||||
|
Total securities available for sale
|
739
|
|
78,670
|
|
2,030
|
|
29,486
|
|
2,769
|
|
108,156
|
|
||||||||||||
|
Total
|
$
|
739
|
|
$
|
78,670
|
|
$
|
2,030
|
|
$
|
29,486
|
|
$
|
2,769
|
|
$
|
108,156
|
|
||||||
|
December 31, 2015
|
|
|
|
|
|
|
|
|
|
|
|
|
||||||||||||
|
Securities available for sale
|
|
|
|
|
|
|
|
|
|
|
|
|
||||||||||||
|
Debt securities:
|
|
|
|
|
|
|
|
|
|
|
|
|
||||||||||||
|
Municipal bonds and obligations
|
$
|
9
|
|
$
|
1,587
|
|
$
|
115
|
|
$
|
3,400
|
|
$
|
124
|
|
$
|
4,987
|
|
||||||
|
Agency collateralized mortgage obligations
|
2,958
|
|
304,907
|
|
2,596
|
|
136,988
|
|
5,554
|
|
441,895
|
|
||||||||||||
|
Agency mortgage-backed securities
|
306
|
|
34,543
|
|
681
|
|
35,522
|
|
987
|
|
70,065
|
|
||||||||||||
|
Corporate bonds
|
30
|
|
6,934
|
|
1,796
|
|
21,587
|
|
1,826
|
|
28,521
|
|
||||||||||||
|
Trust preferred securities
|
1
|
|
1,269
|
|
—
|
|
—
|
|
1
|
|
1,269
|
|
||||||||||||
|
Other bonds and obligations
|
—
|
|
108
|
|
34
|
|
3,032
|
|
34
|
|
3,140
|
|
||||||||||||
|
Total debt securities
|
3,304
|
|
349,348
|
|
5,222
|
|
200,529
|
|
8,526
|
|
549,877
|
|
||||||||||||
|
Marketable equity securities
|
534
|
|
2,908
|
|
1,352
|
|
5,729
|
|
1,886
|
|
8,637
|
|
||||||||||||
|
Total securities available for sale
|
3,838
|
|
352,256
|
|
6,574
|
|
206,258
|
|
10,412
|
|
558,514
|
|
||||||||||||
|
Securities held to maturity
|
|
|
|
|
|
|
|
|
|
|
|
|
||||||||||||
|
Tax advantaged economic development bonds
|
—
|
|
—
|
|
34
|
|
2,143
|
|
34
|
|
2,143
|
|
||||||||||||
|
Total securities held to maturity
|
—
|
|
—
|
|
34
|
|
2,143
|
|
34
|
|
2,143
|
|
||||||||||||
|
Total
|
$
|
3,838
|
|
$
|
352,256
|
|
$
|
6,608
|
|
$
|
208,401
|
|
$
|
10,446
|
|
$
|
560,657
|
|
||||||
19
The Company expects to recover its amortized cost basis on all debt securities in its AFS and HTM portfolios. Furthermore, the Company does not intend to sell nor does it anticipate that it will be required to sell any of its securities in an unrealized loss position as of
September 30, 2016
, prior to this recovery. The Company’s ability and intent to hold these securities until recovery is supported by the Company’s strong capital and liquidity positions as well as its historically low portfolio turnover.
The following summarizes, by investment security type, the basis for the conclusion that the debt securities in an unrealized loss position within the Company’s AFS and HTM portfolios were not other-than-temporarily impaired at
September 30, 2016
:
AFS municipal bonds and obligations
At September 30, 2016,
7
of the total
127
securities in the Company’s portfolio of AFS municipal bonds and obligations were in unrealized loss positions. Aggregate unrealized losses represented
0.8%
of the amortized cost of securities in unrealized loss positions. The Company continually monitors the municipal bond sector of the market carefully and periodically evaluates the appropriate level of exposure to the market. At this time, the Company feels the bonds in this portfolio carry minimal risk of default and the Company is appropriately compensated for that risk. There were no material underlying credit downgrades during the quarter. All securities are performing.
AFS collateralized mortgage obligations
At
September 30, 2016
,
6
out of the total
112
securities in the Company’s portfolios of AFS collateralized mortgage obligations were in unrealized loss positions. Aggregate unrealized losses represented
0.3%
of the amortized cost of securities in unrealized loss positions. The Federal National Mortgage Association (“FNMA”), Federal Home Loan Mortgage Corporation (“FHLMC”), and Government National Mortgage Association (“GNMA”) guarantee the contractual cash flows of all of the Company’s collateralized mortgage obligations. The securities are investment grade rated and there were no material underlying credit downgrades during the quarter. All securities are performing.
AFS mortgage-backed securities
At
September 30, 2016
,
13
out of the total
87
securities in the Company’s portfolios of AFS residential mortgage-backed securities were in unrealized loss positions. Aggregate unrealized losses represented
0.4%
of the amortized cost of securities in unrealized loss positions. The FNMA, FHLMC, and GNMA guarantee the contractual cash flows of all of the Company’s residential mortgage-backed securities. The securities are investment grade rated and there were no material underlying credit downgrades during the quarter. All securities are performing.
AFS corporate bonds
At
September 30, 2016
,
2
out of
9
securities in the Company’s portfolio of AFS corporate bonds were in an unrealized loss position. The aggregate unrealized loss represents
3.4%
of the amortized cost of bonds in unrealized loss positions. The Company reviews the financial strength of all of these bonds and has concluded that the amortized cost remains supported by the expected future cash flows of these securities.
At
September 30, 2016
,
$637.9 thousand
of the total unrealized losses was attributable to a
$17.5 million
investment. The Company evaluated this security, with a Level 2 fair value of
$16.9 million
, for potential other-than-temporary impairment (“OTTI”) at September 30, 2016 and determined that OTTI was not evident based on both the Company’s ability and intent to hold the security until the recovery of its remaining amortized cost.
AFS trust preferred securities
At
September 30, 2016
1
out of the
3
securities in the Company’s portfolio of AFS trust preferred securities were in an unrealized loss position. Aggregate unrealized losses represented
4.6%
of the amortized cost of these securities in an unrealized loss position. The Company’s evaluation of the present value of expected cash flows on these securities supports its conclusions about the recoverability of these securities’ amortized cost basis. These securities are investment grade rated. The Company reviews the financial strength of all of the single issue trust issuers and
20
has concluded that the amortized cost remains supported by the market value of these securities and they are performing.
Marketable Equity Securities
In evaluating its marketable equity securities portfolio for OTTI, the Company considers its ability to more likely than not hold an equity security to recovery. The Company additionally considers other various factors including the length of time and the extent to which the fair value has been less than cost and the financial condition and near term prospects of the issuer. Any OTTI is recognized immediately through earnings.
At
September 30, 2016
,
10
out of the total
28
securities in the Company’s portfolio of marketable equity securities were in an unrealized loss position. The unrealized loss represented
9.4%
of the amortized cost of the securities. The Company has the ability and intent to hold the securities until recovery of their cost basis and does not consider the securities other-than-temporarily impaired at
September 30, 2016
. As new information becomes available in future periods, changes to the Company’s assumptions may be warranted and could lead to a different conclusion regarding the OTTI of these securities.
21
The Company’s loan portfolio is segregated into the following segments: commercial real estate, commercial and industrial, residential mortgage, and consumer. Commercial real estate loans include construction, single and multi-family, and other commercial real estate classes. Commercial and industrial loans include asset based lending loans, lease financing, and other commercial business loan classes. Residential mortgage loans include classes for 1-4 family owner occupied and construction loans. Consumer loans include home equity, direct and indirect auto, and other. These portfolio segments each have unique risk characteristics that are considered when determining the appropriate level for the allowance for loan losses. A substantial portion of the loan portfolio is secured by real estate in western Massachusetts, southern Vermont, northeastern New York, and in the Bank’s other New England lending areas. The ability of many of the Bank’s borrowers to honor their contracts is dependent, among other things, on the specific economy and real estate markets of these areas.
Total loans include business activity loans and acquired loans. Acquired loans are those loans acquired from Parke Bank, Firestone Financial Corp., Hampden Bancorp, Inc., the New York branch acquisition, Beacon Federal Bancorp, Inc., The Connecticut Bank and Trust Company, Legacy Bancorp, Inc., and Rome Bancorp, Inc. The following is a summary of total loans:
|
|
September 30, 2016
|
December 31, 2015
|
|||||||||||||||||
|
(In thousands)
|
Business
Activities Loans |
Acquired
Loans |
Total
|
Business
Activities Loans |
Acquired
Loans |
Total
|
|||||||||||||
|
Commercial real estate:
|
|
|
|
|
|
|
|
|
|
|
|
|
|||||||
|
Construction
|
$
|
221,749
|
|
$
|
19,850
|
|
$
|
241,599
|
|
$
|
210,196
|
|
$
|
43,474
|
|
$
|
253,670
|
|
|
|
Single and multi-family
|
271,844
|
|
40,696
|
|
312,540
|
|
214,823
|
|
36,783
|
|
251,606
|
|
|||||||
|
Other commercial real estate
|
1,438,726
|
|
334,179
|
|
1,772,905
|
|
1,209,008
|
|
345,483
|
|
1,554,491
|
|
|||||||
|
Total commercial real estate
|
1,932,319
|
|
394,725
|
|
2,327,044
|
|
1,634,027
|
|
425,740
|
|
2,059,767
|
|
|||||||
|
Commercial and industrial loans:
|
|
|
|
|
|
|
|
|
|
|
|
|
|||||||
|
Asset based lending
|
327,100
|
|
—
|
|
327,100
|
|
331,253
|
|
—
|
|
331,253
|
|
|||||||
|
Other commercial and industrial loans
|
520,769
|
|
147,005
|
|
667,774
|
|
495,979
|
|
221,031
|
|
717,010
|
|
|||||||
|
Total commercial and industrial loans
|
847,869
|
|
147,005
|
|
994,874
|
|
827,232
|
|
221,031
|
|
1,048,263
|
|
|||||||
|
Total commercial loans
|
2,780,188
|
|
541,730
|
|
3,321,918
|
|
2,461,259
|
|
646,771
|
|
3,108,030
|
|
|||||||
|
Residential mortgages:
|
|
|
|
|
|
|
|
|
|
|
|
|
|||||||
|
1-4 family
|
1,513,122
|
|
287,574
|
|
1,800,696
|
|
1,454,233
|
|
332,747
|
|
1,786,980
|
|
|||||||
|
Construction
|
16,600
|
|
815
|
|
17,415
|
|
26,704
|
|
1,351
|
|
28,055
|
|
|||||||
|
Total residential mortgages
|
1,529,722
|
|
288,389
|
|
1,818,111
|
|
1,480,937
|
|
334,098
|
|
1,815,035
|
|
|||||||
|
Consumer loans:
|
|
|
|
|
|
|
|
|
|
|
|
|
|||||||
|
Home equity
|
323,642
|
|
46,258
|
|
369,900
|
|
307,159
|
|
53,446
|
|
360,605
|
|
|||||||
|
Auto and other
|
435,618
|
|
101,457
|
|
537,075
|
|
311,328
|
|
130,238
|
|
441,566
|
|
|||||||
|
Total consumer loans
|
759,260
|
|
147,715
|
|
906,975
|
|
618,487
|
|
183,684
|
|
802,171
|
|
|||||||
|
Total loans
|
$
|
5,069,170
|
|
$
|
977,834
|
|
$
|
6,047,004
|
|
$
|
4,560,683
|
|
$
|
1,164,553
|
|
$
|
5,725,236
|
|
|
22
The carrying amount of the acquired loans at
September 30, 2016
totaled
$978 million
. A subset of these loans was determined to have evidence of credit deterioration at acquisition date, which is accounted for in accordance with ASC 310-30. These purchased credit-impaired loans presently maintain a carrying value of
$15.1 million
(and a note balance of
$29.9
million). These loans are evaluated for impairment through the periodic reforecasting of expected cash flows. Loans considered not impaired at acquisition date had a carrying amount of
$962.7 million
.
At December 31, 2015, acquired loans maintained a carrying value of
$1.2 billion
and purchased credit-impaired loans totaled
$21.4 million
(note balance of
$40.2
million). Loans considered not impaired at acquisition date had a carrying amount of
$1.1 billion
.
The following table summarizes activity in the accretable yield for the acquired loan portfolio that falls under the purview of ASC 310-30,
Accounting for Certain Loans or Debt Securities Acquired in a Transfer:
|
|
Three Months Ended September 30,
|
|||||||
|
(In thousands)
|
2016
|
2015
|
||||||
|
Balance at beginning of period
|
$
|
6,213
|
|
$
|
6,540
|
|
||
|
Acquisitions
|
—
|
|
684
|
|
||||
|
Reclassification from nonaccretable difference for loans with improved cash flows
|
688
|
|
1,214
|
|
||||
|
Accretion
|
(2,298
|
)
|
(967
|
)
|
||||
|
Balance at end of period
|
$
|
4,603
|
|
$
|
7,471
|
|
||
|
Nine Months Ended September 30,
|
||||||||
|
(In thousands)
|
2016
|
2015
|
||||||
|
Balance at beginning of period
|
$
|
6,925
|
|
$
|
2,541
|
|
||
|
Acquisitions
|
708
|
|
4,862
|
|
||||
|
Reclassification from nonaccretable difference for loans with improved cash flows
|
2,106
|
|
2,950
|
|
||||
|
Reclassification to TDR
|
(185
|
)
|
—
|
|
||||
|
Accretion
|
(4,951
|
)
|
(2,882
|
)
|
||||
|
Balance at end of period
|
$
|
4,603
|
|
$
|
7,471
|
|
||
23
The following is a summary of past due loans at
September 30, 2016
and December 31, 2015:
Business Activities Loans
|
(in thousands)
|
30-59 Days
Past Due |
60-89 Days
Past Due |
90
Days or Greater Past Due |
Total Past
Due |
Current
|
Total Loans
|
Past Due >
90 days and Accruing |
|||||||||||||||||||||
|
September 30, 2016
|
|
|
|
|
|
|
|
|
|
|
|
|
|
|
||||||||||||||
|
Commercial real estate:
|
|
|
|
|
|
|
|
|
|
|
|
|
|
|
||||||||||||||
|
Construction
|
$
|
—
|
|
$
|
—
|
|
$
|
—
|
|
$
|
—
|
|
$
|
221,749
|
|
$
|
221,749
|
|
$
|
—
|
|
|||||||
|
Single and multi-family
|
573
|
|
—
|
|
351
|
|
924
|
|
270,920
|
|
271,844
|
|
—
|
|
||||||||||||||
|
Other commercial real estate
|
568
|
|
473
|
|
7,240
|
|
8,281
|
|
1,430,445
|
|
1,438,726
|
|
2,292
|
|
||||||||||||||
|
Total
|
1,141
|
|
473
|
|
7,591
|
|
9,205
|
|
1,923,114
|
|
1,932,319
|
|
2,292
|
|
||||||||||||||
|
Commercial and industrial loans:
|
|
|
|
|
|
|
|
|
|
|
|
|
|
|
||||||||||||||
|
Asset based lending
|
—
|
|
—
|
|
—
|
|
—
|
|
327,100
|
|
327,100
|
|
—
|
|
||||||||||||||
|
Other commercial and industrial loans
|
1,304
|
|
181
|
|
5,270
|
|
6,755
|
|
514,014
|
|
520,769
|
|
503
|
|
||||||||||||||
|
Total
|
1,304
|
|
181
|
|
5,270
|
|
6,755
|
|
841,114
|
|
847,869
|
|
503
|
|
||||||||||||||
|
Residential mortgages:
|
|
|
|
|
|
|
|
|
|
|
|
|
|
|
||||||||||||||
|
1-4 family
|
1,446
|
|
1,602
|
|
3,411
|
|
6,459
|
|
1,506,663
|
|
1,513,122
|
|
944
|
|
||||||||||||||
|
Construction
|
—
|
|
—
|
|
45
|
|
45
|
|
16,555
|
|
16,600
|
|
—
|
|
||||||||||||||
|
Total
|
1,446
|
|
1,602
|
|
3,456
|
|
6,504
|
|
1,523,218
|
|
1,529,722
|
|
944
|
|
||||||||||||||
|
Consumer loans:
|
|
|
|
|
|
|
|
|
|
|
|
|
|
|
||||||||||||||
|
Home equity
|
154
|
|
5
|
|
1,732
|
|
1,891
|
|
321,751
|
|
323,642
|
|
150
|
|
||||||||||||||
|
Auto and other
|
1,774
|
|
405
|
|
530
|
|
2,709
|
|
432,909
|
|
435,618
|
|
—
|
|
||||||||||||||
|
Total
|
1,928
|
|
410
|
|
2,262
|
|
4,600
|
|
754,660
|
|
759,260
|
|
150
|
|
||||||||||||||
|
Total
|
$
|
5,819
|
|
$
|
2,666
|
|
$
|
18,579
|
|
$
|
27,064
|
|
$
|
5,042,106
|
|
$
|
5,069,170
|
|
$
|
3,889
|
|
|||||||
Business Activities Loans
|
(in thousands)
|
30-59 Days
Past Due |
60-89 Days
Past Due |
90
Days or Greater Past Due |
Total Past
Due |
Current
|
Total Loans
|
Past Due >
90 days and Accruing |
|||||||||||||||||||||
|
December 31, 2015
|
|
|
|
|
|
|
|
|
|
|
|
|
|
|
||||||||||||||
|
Commercial real estate:
|
|
|
|
|
|
|
|
|
|
|
|
|
|
|
||||||||||||||
|
Construction
|
$
|
—
|
|
$
|
—
|
|
$
|
58
|
|
$
|
58
|
|
$
|
210,138
|
|
$
|
210,196
|
|
$
|
—
|
|
|||||||
|
Single and multi-family
|
65
|
|
160
|
|
70
|
|
295
|
|
214,528
|
|
214,823
|
|
—
|
|
||||||||||||||
|
Other commercial real estate
|
1,523
|
|
831
|
|
3,286
|
|
5,640
|
|
1,203,368
|
|
1,209,008
|
|
—
|
|
||||||||||||||
|
Total
|
1,588
|
|
991
|
|
3,414
|
|
5,993
|
|
1,628,034
|
|
1,634,027
|
|
—
|
|
||||||||||||||
|
Commercial and industrial loans:
|
|
|
|
|
|
|
|
|
|
|
|
|
|
|
||||||||||||||
|
Asset based lending
|
—
|
|
—
|
|
—
|
|
—
|
|
331,253
|
|
331,253
|
|
—
|
|
||||||||||||||
|
Other commercial and industrial loans
|
1,202
|
|
1,105
|
|
7,770
|
|
10,077
|
|
485,902
|
|
495,979
|
|
146
|
|
||||||||||||||
|
Total
|
1,202
|
|
1,105
|
|
7,770
|
|
10,077
|
|
817,155
|
|
827,232
|
|
146
|
|
||||||||||||||
|
Residential mortgages:
|
|
|
|
|
|
|
|
|
|
|
|
|
|
|
||||||||||||||
|
1-4 family
|
3,537
|
|
857
|
|
4,304
|
|
8,698
|
|
1,445,535
|
|
1,454,233
|
|
2,006
|
|
||||||||||||||
|
Construction
|
—
|
|
—
|
|
—
|
|
—
|
|
26,704
|
|
26,704
|
|
—
|
|
||||||||||||||
|
Total
|
3,537
|
|
857
|
|
4,304
|
|
8,698
|
|
1,472,239
|
|
1,480,937
|
|
2,006
|
|
||||||||||||||
|
Consumer loans:
|
|
|
|
|
|
|
|
|
|
|
|
|
|
|
||||||||||||||
|
Home equity
|
563
|
|
20
|
|
1,658
|
|
2,241
|
|
304,918
|
|
307,159
|
|
61
|
|
||||||||||||||
|
Auto and other
|
1,230
|
|
132
|
|
610
|
|
1,972
|
|
309,356
|
|
311,328
|
|
59
|
|
||||||||||||||
|
Total
|
1,793
|
|
152
|
|
2,268
|
|
4,213
|
|
614,274
|
|
618,487
|
|
120
|
|
||||||||||||||
|
Total
|
$
|
8,120
|
|
$
|
3,105
|
|
$
|
17,756
|
|
$
|
28,981
|
|
$
|
4,531,702
|
|
$
|
4,560,683
|
|
$
|
2,272
|
|
|||||||
24
Acquired Loans
|
(in thousands)
|
30-59 Days
Past Due |
60-89 Days
Past Due |
90
Days or Greater Past Due |
Total Past
Due |
Acquired
Credit Impaired |
Total Loans
|
Past Due >
90 days and Accruing |
|||||||||||||||||||||
|
September 30, 2016
|
|
|
|
|
|
|
|
|
|
|
|
|
|
|
||||||||||||||
|
Commercial real estate:
|
|
|
|
|
|
|
|
|
|
|
|
|
|
|
||||||||||||||
|
Construction
|
$
|
—
|
|
$
|
—
|
|
$
|
—
|
|
$
|
—
|
|
$
|
1,082
|
|
$
|
19,850
|
|
$
|
—
|
|
|||||||
|
Single and multi-family
|
1,086
|
|
—
|
|
—
|
|
1,086
|
|
1,169
|
|
40,696
|
|
—
|
|
||||||||||||||
|
Other commercial real estate
|
431
|
|
—
|
|
996
|
|
1,427
|
|
9,580
|
|
334,179
|
|
—
|
|
||||||||||||||
|
Total
|
1,517
|
|
—
|
|
996
|
|
2,513
|
|
11,831
|
|
394,725
|
|
—
|
|
||||||||||||||
|
Commercial and industrial loans:
|
|
|
|
|
|
|
|
|
|
|
|
|
|
|
||||||||||||||
|
Asset based lending
|
—
|
|
—
|
|
—
|
|
—
|
|
—
|
|
—
|
|
—
|
|
||||||||||||||
|
Other commercial and industrial loans
|
1,190
|
|
177
|
|
1,947
|
|
3,314
|
|
1,852
|
|
147,005
|
|
—
|
|
||||||||||||||
|
Total
|
1,190
|
|
177
|
|
1,947
|
|
3,314
|
|
1,852
|
|
147,005
|
|
—
|
|
||||||||||||||
|
Residential mortgages:
|
|
|
|
|
|
|
|
|
|
|
|
|
|
|
||||||||||||||
|
1-4 family
|
764
|
|
441
|
|
1,951
|
|
3,156
|
|
1,337
|
|
287,574
|
|
89
|
|
||||||||||||||
|
Construction
|
—
|
|
—
|
|
—
|
|
—
|
|
—
|
|
815
|
|
—
|
|
||||||||||||||
|
Total
|
764
|
|
441
|
|
1,951
|
|
3,156
|
|
1,337
|
|
288,389
|
|
89
|
|
||||||||||||||
|
Consumer loans:
|
|
|
|
|
|
|
|
|
|
|
|
|
|
|
||||||||||||||
|
Home equity
|
—
|
|
489
|
|
784
|
|
1,273
|
|
7
|
|
46,258
|
|
257
|
|
||||||||||||||
|
Auto and other
|
340
|
|
842
|
|
818
|
|
2,000
|
|
96
|
|
101,457
|
|
176
|
|
||||||||||||||
|
Total
|
340
|
|
1,331
|
|
1,602
|
|
3,273
|
|
103
|
|
147,715
|
|
433
|
|
||||||||||||||
|
Total
|
$
|
3,811
|
|
$
|
1,949
|
|
$
|
6,496
|
|
$
|
12,256
|
|
$
|
15,123
|
|
$
|
977,834
|
|
$
|
522
|
|
|||||||
Acquired Loans
|
(in thousands)
|
30-59 Days
Past Due |
60-89 Days
Past Due |
90
Days or Greater Past Due |
Total Past
Due |
Acquired
Credit Impaired |
Total Loans
|
Past Due >
90 days and Accruing |
|||||||||||||||||||||
|
December 31, 2015
|
|
|
|
|
|
|
|
|
|
|
|
|
|
|
||||||||||||||
|
Commercial real estate:
|
|
|
|
|
|
|
—
|
|
|
|
|
|
|
|
||||||||||||||
|
Construction
|
$
|
—
|
|
$
|
—
|
|
$
|
—
|
|
$
|
—
|
|
$
|
1,298
|
|
$
|
43,474
|
|
$
|
—
|
|
|||||||
|
Single and multi-family
|
—
|
|
176
|
|
227
|
|
403
|
|
1,380
|
|
36,783
|
|
127
|
|
||||||||||||||
|
Other commercial real estate
|
547
|
|
43
|
|
1,368
|
|
1,958
|
|
13,087
|
|
345,483
|
|
—
|
|
||||||||||||||
|
Total
|
547
|
|
219
|
|
1,595
|
|
2,361
|
|
15,765
|
|
425,740
|
|
127
|
|
||||||||||||||
|
Commercial and industrial loans:
|
|
|
|
|
|
|
|
|
|
|
|
|
|
|
||||||||||||||
|
Asset based lending
|
—
|
|
—
|
|
—
|
|
—
|
|
—
|
|
—
|
|
—
|
|
||||||||||||||
|
Other commercial and industrial loans
|
1,214
|
|
505
|
|
1,420
|
|
3,139
|
|
2,775
|
|
221,031
|
|
785
|
|
||||||||||||||
|
Total
|
1,214
|
|
505
|
|
1,420
|
|
3,139
|
|
2,775
|
|
221,031
|
|
785
|
|
||||||||||||||
|
Residential mortgages:
|
|
|
|
|
|
|
|
|
|
|
|
|
|
|
||||||||||||||
|
1-4 family
|
2,580
|
|
311
|
|
1,880
|
|
4,771
|
|
2,572
|
|
332,747
|
|
212
|
|
||||||||||||||
|
Construction
|
—
|
|
—
|
|
—
|
|
—
|
|
—
|
|
1,351
|
|
—
|
|
||||||||||||||
|
Total
|
2,580
|
|
311
|
|
1,880
|
|
4,771
|
|
2,572
|
|
334,098
|
|
212
|
|
||||||||||||||
|
Consumer loans:
|
|
|
|
|
|
|
|
|
|
|
|
|
|
|
||||||||||||||
|
Home equity
|
82
|
|
277
|
|
837
|
|
1,196
|
|
118
|
|
53,446
|
|
111
|
|
||||||||||||||
|
Auto and other
|
1,491
|
|
145
|
|
1,081
|
|
2,717
|
|
132
|
|
130,238
|
|
187
|
|
||||||||||||||
|
Total
|
1,573
|
|
422
|
|
1,918
|
|
3,913
|
|
250
|
|
183,684
|
|
298
|
|
||||||||||||||
|
Total
|
$
|
5,914
|
|
$
|
1,457
|
|
$
|
6,813
|
|
$
|
14,184
|
|
$
|
21,362
|
|
$
|
1,164,553
|
|
$
|
1,422
|
|
|||||||
25
The following is summary information pertaining to non-accrual loans at
September 30, 2016
and December 31, 2015
|
|
September 30, 2016
|
December 31, 2015
|
||||||||||||||||||||||
|
(In thousands)
|
Business
Activities Loans |
Acquired
Loans (1) |
Total
|
Business
Activities Loans |
Acquired
Loans (2) |
Total
|
||||||||||||||||||
|
Commercial real estate:
|
|
|
|
|
|
|
|
|
|
|
|
|
||||||||||||
|
Construction
|
$
|
—
|
|
$
|
—
|
|
$
|
—
|
|
$
|
59
|
|
$
|
—
|
|
$
|
59
|
|
||||||
|
Single and multi-family
|
351
|
|
—
|
|
351
|
|
70
|
|
100
|
|
170
|
|
||||||||||||
|
Other commercial real estate
|
4,948
|
|
996
|
|
5,944
|
|
3,285
|
|
1,368
|
|
4,653
|
|
||||||||||||
|
Total
|
5,299
|
|
996
|
|
6,295
|
|
3,414
|
|
1,468
|
|
4,882
|
|
||||||||||||
|
Commercial and industrial loans:
|
|
|
|
|
|
|
|
|
|
|
|
|
||||||||||||
|
Other commercial and industrial loans
|
4,767
|
|
1,695
|
|
6,462
|
|
7,624
|
|
597
|
|
8,221
|
|
||||||||||||
|
Total
|
4,767
|
|
1,695
|
|
6,462
|
|
7,624
|
|
597
|
|
8,221
|
|
||||||||||||
|
Residential mortgages:
|
|
|
|
|
|
|
|
|
|
|
|
|
||||||||||||
|
1-4 family
|
2,467
|
|
1,862
|
|
4,329
|
|
2,298
|
|
1,668
|
|
3,966
|
|
||||||||||||
|
Construction
|
45
|
|
—
|
|
45
|
|
—
|
|
—
|
|
—
|
|
||||||||||||
|
Total
|
2,512
|
|
1,862
|
|
4,374
|
|
2,298
|
|
1,668
|
|
3,966
|
|
||||||||||||
|
Consumer loans:
|
|
|
|
|
|
|
|
|
|
|
|
|
||||||||||||
|
Home equity
|
1,582
|
|
526
|
|
2,108
|
|
1,597
|
|
727
|
|
2,324
|
|
||||||||||||
|
Auto and other
|
530
|
|
643
|
|
1,173
|
|
551
|
|
893
|
|
1,444
|
|
||||||||||||
|
Total
|
2,112
|
|
1,169
|
|
3,281
|
|
2,148
|
|
1,620
|
|
3,768
|
|
||||||||||||
|
Total non-accrual loans
|
$
|
14,690
|
|
$
|
5,722
|
|
$
|
20,412
|
|
$
|
15,484
|
|
$
|
5,353
|
|
$
|
20,837
|
|
||||||
_______________________________________
(1) At quarter end
September 30, 2016
, acquired credit impaired loans accounted for
$252 thousand
of non-accrual loans that are not presented in the above table.
(2) At December 31, 2015, acquired credit impaired loans accounted for
$39 thousand
of non-accrual loans that are not presented in the above table.
26
Loans evaluated for impairment as of
September 30, 2016
and December 31, 2015 were as follows:
Business Activities Loans
|
(In thousands)
|
Commercial
real estate |
Commercial and
industrial loans |
Residential
mortgages |
Consumer
|
Total
|
|||||||||||||||
|
September 30, 2016
|
|
|
|
|
|
|
|
|
|
|
||||||||||
|
Loans receivable:
|
|
|
|
|
|
|
|
|
|
|
||||||||||
|
Balance at end of period
|
|
|
|
|
|
|
|
|
|
|
||||||||||
|
Individually evaluated for impairment
|
$
|
14,058
|
|
$
|
3,955
|
|
$
|
3,045
|
|
$
|
1,483
|
|
$
|
22,541
|
|
|||||
|
Collectively evaluated
|
1,918,261
|
|
843,914
|
|
1,526,677
|
|
757,777
|
|
5,046,629
|
|
||||||||||
|
Total
|
$
|
1,932,319
|
|
$
|
847,869
|
|
$
|
1,529,722
|
|
$
|
759,260
|
|
$
|
5,069,170
|
|
|||||
Business Activities Loans
|
(In thousands)
|
Commercial
real estate |
Commercial and
industrial loans |
Residential
mortgages |
Consumer
|
Total
|
|||||||||||||||
|
December 31, 2015
|
|
|
|
|
|
|
|
|
|
|
||||||||||
|
Loans receivable:
|
|
|
|
|
|
|
|
|
|
|
||||||||||
|
Balance at end of year
|
|
|
|
|
|
|
|
|
|
|
||||||||||
|
Individually evaluated for impairment
|
$
|
11,560
|
|
$
|
7,191
|
|
$
|
2,812
|
|
$
|
1,810
|
|
$
|
23,373
|
|
|||||
|
Collectively evaluated for impairment
|
1,622,467
|
|
820,041
|
|
1,478,125
|
|
616,677
|
|
4,537,310
|
|
||||||||||
|
Total
|
$
|
1,634,027
|
|
$
|
827,232
|
|
$
|
1,480,937
|
|
$
|
618,487
|
|
$
|
4,560,683
|
|
|||||
Acquired Loans
|
(In thousands)
|
Commercial
real estate |
Commercial and
industrial loans |
Residential
mortgages |
Consumer
|
Total
|
|||||||||||||||
|
September 30, 2016
|
|
|
|
|
|
|
|
|
|
|
||||||||||
|
Loans receivable:
|
|
|
|
|
|
|
|
|
|
|
||||||||||
|
Balance at end of Period
|
|
|
|
|
|
|
|
|
|
|
||||||||||
|
Individually evaluated for impairment
|
$
|
4,190
|
|
$
|
1,144
|
|
$
|
315
|
|
$
|
415
|
|
$
|
6,064
|
|
|||||
|
Purchased credit-impaired loans
|
11,831
|
|
1,852
|
|
1,337
|
|
103
|
|
15,123
|
|
||||||||||
|
Collectively evaluated
|
378,704
|
|
144,009
|
|
286,737
|
|
147,197
|
|
956,647
|
|
||||||||||
|
Total
|
$
|
394,725
|
|
$
|
147,005
|
|
$
|
288,389
|
|
$
|
147,715
|
|
$
|
977,834
|
|
|||||
Acquired Loans
|
(In thousands)
|
Commercial
real estate |
Commercial and
industrial loans |
Residential
mortgages |
Consumer
|
Total
|
|||||||||||||||
|
December 31, 2015
|
|
|
|
|
|
|
|
|
|
|
||||||||||
|
Loans receivable:
|
|
|
|
|
|
|
|
|
|
|
||||||||||
|
Balance at end of year
|
|
|
|
|
|
|
|
|
|
|
||||||||||
|
Individually evaluated for impairment
|
$
|
3,749
|
|
$
|
—
|
|
$
|
570
|
|
$
|
487
|
|
$
|
4,806
|
|
|||||
|
Purchased credit-impaired loans
|
15,765
|
|
2,775
|
|
2,572
|
|
250
|
|
21,362
|
|
||||||||||
|
Collectively evaluated for impairment
|
406,226
|
|
218,256
|
|
330,956
|
|
182,947
|
|
1,138,385
|
|
||||||||||
|
Total
|
$
|
425,740
|
|
$
|
221,031
|
|
$
|
334,098
|
|
$
|
183,684
|
|
$
|
1,164,553
|
|
|||||
27
The following is a summary of impaired loans at
September 30, 2016
and December 31, 2015:
Business Activities Loans
|
|
September 30, 2016
|
|||||||||||
|
(In thousands)
|
Recorded Investment
|
Unpaid Principal
Balance |
Related Allowance
|
|||||||||
|
With no related allowance:
|
|
|
|
|
|
|
||||||
|
Commercial real estate - construction
|
$
|
—
|
|
$
|
—
|
|
$
|
—
|
|
|||
|
Commercial real estate - single and multifamily
|
—
|
|
—
|
|
—
|
|
||||||
|
Other commercial real estate loans
|
3,593
|
|
3,593
|
|
—
|
|
||||||
|
Other commercial and industrial loans
|
218
|
|
218
|
|
—
|
|
||||||
|
Residential mortgages - 1-4 family
|
2,367
|
|
2,367
|
|
—
|
|
||||||
|
Consumer - home equity
|
380
|
|
380
|
|
—
|
|
||||||
|
Consumer - other
|
3
|
|
3
|
|
—
|
|
||||||
|
With an allowance recorded:
|
|
|
|
|
|
|
||||||
|
Commercial real estate - construction
|
$
|
—
|
|
$
|
—
|
|
$
|
—
|
|
|||
|
Commercial real estate - single and multifamily
|
—
|
|
—
|
|
—
|
|
||||||
|
Other commercial real estate loans
|
10,275
|
|
10,465
|
|
190
|
|
||||||
|
Other commercial and industrial loans
|
3,543
|
|
3,737
|
|
194
|
|
||||||
|
Residential mortgages - 1-4 family
|
589
|
|
678
|
|
89
|
|
||||||
|
Consumer - home equity
|
841
|
|
999
|
|
158
|
|
||||||
|
Consumer - other
|
94
|
|
101
|
|
7
|
|
||||||
|
Total
|
|
|
|
|
|
|
||||||
|
Commercial real estate
|
$
|
13,868
|
|
$
|
14,058
|
|
$
|
190
|
|
|||
|
Commercial and industrial loans
|
3,761
|
|
3,955
|
|
194
|
|
||||||
|
Residential mortgages
|
2,956
|
|
3,045
|
|
89
|
|
||||||
|
Consumer
|
1,318
|
|
1,483
|
|
165
|
|
||||||
|
Total impaired loans
|
$
|
21,903
|
|
$
|
22,541
|
|
$
|
638
|
|
|||
28
Business Activities Loans
|
|
December 31, 2015
|
|||||||||||
|
(In thousands)
|
Recorded Investment
|
Unpaid Principal
Balance |
Related Allowance
|
|||||||||
|
With no related allowance:
|
|
|
|
|
|
|
||||||
|
Commercial real estate - construction
|
$
|
2,000
|
|
$
|
2,000
|
|
$
|
—
|
|
|||
|
Commercial real estate - single and multifamily
|
—
|
|
—
|
|
—
|
|
||||||
|
Other commercial real estate loans
|
4,613
|
|
4,613
|
|
—
|
|
||||||
|
Other commercial and industrial loans
|
5,828
|
|
5,828
|
|
—
|
|
||||||
|
Residential mortgages - 1-4 family
|
1,181
|
|
1,181
|
|
—
|
|
||||||
|
Consumer - home equity
|
702
|
|
702
|
|
—
|
|
||||||
|
Consumer - other
|
1
|
|
1
|
|
—
|
|
||||||
|
With an allowance recorded:
|
|
|
|
|
|
|
||||||
|
Commercial real estate - construction
|
$
|
—
|
|
$
|
—
|
|
$
|
—
|
|
|||
|
Commercial real estate - single and multifamily
|
—
|
|
—
|
|
—
|
|
||||||
|
Other commercial real estate loans
|
4,798
|
|
4,947
|
|
149
|
|
||||||
|
Other commercial and industrial loans
|
1,341
|
|
1,362
|
|
21
|
|
||||||
|
Residential mortgages - 1-4 family
|
1,479
|
|
1,632
|
|
153
|
|
||||||
|
Consumer - home equity
|
903
|
|
999
|
|
96
|
|
||||||
|
Consumer - other
|
101
|
|
108
|
|
7
|
|
||||||
|
Total
|
|
|
|
|
|
|
||||||
|
Commercial real estate
|
$
|
11,411
|
|
$
|
11,560
|
|
$
|
149
|
|
|||
|
Commercial and industrial loans
|
7,169
|
|
7,190
|
|
21
|
|
||||||
|
Residential mortgages
|
2,660
|
|
2,813
|
|
153
|
|
||||||
|
Consumer
|
1,707
|
|
1,810
|
|
103
|
|
||||||
|
Total impaired loans
|
$
|
22,947
|
|
$
|
23,373
|
|
$
|
426
|
|
|||
29
Acquired Loans
|
|
September 30, 2016
|
|||||||||||
|
(In thousands)
|
Recorded Investment
|
Unpaid Principal
Balance |
Related Allowance
|
|||||||||
|
With no related allowance:
|
|
|
|
|
|
|
||||||
|
Commercial real estate - construction
|
$
|
—
|
|
$
|
—
|
|
$
|
—
|
|
|||
|
Commercial real estate - single and multifamily
|
—
|
|
—
|
|
—
|
|
||||||
|
Other commercial real estate loans
|
632
|
|
632
|
|
—
|
|
||||||
|
Other commercial and industrial loans
|
—
|
|
—
|
|
—
|
|
||||||
|
Residential mortgages - 1-4 family
|
211
|
|
211
|
|
—
|
|
||||||
|
Consumer - home equity
|
—
|
|
—
|
|
—
|
|
||||||
|
Consumer - other
|
—
|
|
—
|
|
—
|
|
||||||
|
With an allowance recorded:
|
|
|
|
|
|
|
||||||
|
Commercial real estate - construction
|
$
|
—
|
|
$
|
—
|
|
$
|
—
|
|
|||
|
Commercial real estate - single and multifamily
|
891
|
|
930
|
|
39
|
|
||||||
|
Other commercial real estate loans
|
1,963
|
|
2,628
|
|
665
|
|
||||||
|
Other commercial and industrial loans
|
1,023
|
|
1,144
|
|
121
|
|
||||||
|
Residential mortgages - 1-4 family
|
92
|
|
104
|
|
12
|
|
||||||
|
Consumer - home equity
|
280
|
|
415
|
|
135
|
|
||||||
|
Consumer - other
|
—
|
|
—
|
|
—
|
|
||||||
|
Total
|
|
|
|
|
|
|
||||||
|
Commercial real estate
|
$
|
3,486
|
|
$
|
4,190
|
|
$
|
704
|
|
|||
|
Commercial and industrial loans
|
1,023
|
|
1,144
|
|
121
|
|
||||||
|
Residential mortgages
|
303
|
|
315
|
|
12
|
|
||||||
|
Consumer
|
280
|
|
415
|
|
135
|
|
||||||
|
Total impaired loans
|
$
|
5,092
|
|
$
|
6,064
|
|
$
|
972
|
|
|||
Acquired Loans
|
|
December 31, 2015
|
|||||||||||
|
(In thousands)
|
Recorded Investment
|
Unpaid Principal
Balance |
Related Allowance
|
|||||||||
|
With no related allowance:
|
|
|
|
|
|
|
||||||
|
Other commercial real estate loans
|
$
|
1,722
|
|
$
|
1,722
|
|
$
|
—
|
|
|||
|
Residential mortgages - 1-4 family
|
274
|
|
274
|
|
—
|
|
||||||
|
Consumer - home equity
|
117
|
|
117
|
|
—
|
|
||||||
|
Consumer - other
|
177
|
|
177
|
|
—
|
|
||||||
|
With an allowance recorded:
|
|
|
|
|
|
|
||||||
|
Commercial real estate - single and multifamily
|
$
|
638
|
|
$
|
655
|
|
$
|
17
|
|
|||
|
Other commercial real estate loans
|
1,964
|
|
2,032
|
|
68
|
|
||||||
|
Residential mortgages - 1-4 family
|
266
|
|
296
|
|
30
|
|
||||||
|
Consumer - home equity
|
167
|
|
192
|
|
25
|
|
||||||
|
Total
|
|
|
|
|
|
|
||||||
|
Other commercial real estate loans
|
$
|
4,324
|
|
$
|
4,409
|
|
$
|
85
|
|
|||
|
Other commercial and industrial loans
|
—
|
|
—
|
|
—
|
|
||||||
|
Residential mortgages
|
540
|
|
570
|
|
30
|
|
||||||
|
Consumer
|
461
|
|
486
|
|
25
|
|
||||||
|
Total impaired loans
|
$
|
5,325
|
|
$
|
5,465
|
|
$
|
140
|
|
|||
30
The following is a summary of the average recorded investment and interest income recognized on impaired loans as of
September 30, 2016
and 2015:
Business Activities Loans
|
|
Nine Months Ended September 30, 2016
|
Nine Months Ended September 30, 2015
|
||||||||||||||
|
(in thousands)
|
Average Recorded
Investment |
Cash Basis Interest
Income Recognized |
Average Recorded
Investment |
Cash Basis Interest
Income Recognized |
||||||||||||
|
With no related allowance:
|
|
|
|
|
|
|
|
|
||||||||
|
Commercial real estate - construction
|
$
|
—
|
|
$
|
—
|
|
$
|
2,326
|
|
$
|
1
|
|
||||
|
Commercial real estate - single and multifamily
|
48
|
|
1
|
|
80
|
|
—
|
|
||||||||
|
Other commercial real estate loans
|
2,624
|
|
111
|
|
9,787
|
|
157
|
|
||||||||
|
Other commercial and industrial loans
|
805
|
|
26
|
|
234
|
|
7
|
|
||||||||
|
Residential mortgages - 1-4 family
|
2,309
|
|
51
|
|
1,264
|
|
32
|
|
||||||||
|
Consumer - home equity
|
693
|
|
5
|
|
155
|
|
6
|
|
||||||||
|
Consumer - other
|
1
|
|
—
|
|
—
|
|
—
|
|
||||||||
|
With an allowance recorded:
|
|
|
|
|
|
|
|
|
||||||||
|
Commercial real estate - construction
|
$
|
—
|
|
$
|
—
|
|
$
|
—
|
|
$
|
—
|
|
||||
|
Commercial real estate - single and multifamily
|
—
|
|
—
|
|
—
|
|
—
|
|
||||||||
|
Other commercial real estate loans
|
10,266
|
|
351
|
|
7,725
|
|
199
|
|
||||||||
|
Other commercial and industrial loans
|
4,609
|
|
154
|
|
3,610
|
|
103
|
|
||||||||
|
Residential mortgages - 1-4 family
|
684
|
|
21
|
|
1,795
|
|
60
|
|
||||||||
|
Consumer - home equity
|
999
|
|
26
|
|
248
|
|
—
|
|
||||||||
|
Consumer - other
|
104
|
|
3
|
|
113
|
|
3
|
|
||||||||
|
Total
|
|
|
|
|
|
|
|
|
||||||||
|
Commercial real estate
|
$
|
12,938
|
|
$
|
463
|
|
$
|
19,918
|
|
$
|
357
|
|
||||
|
Commercial and industrial loans
|
5,414
|
|
180
|
|
3,844
|
|
110
|
|
||||||||
|
Residential mortgages
|
2,993
|
|
72
|
|
3,059
|
|
92
|
|
||||||||
|
Consumer loans
|
1,797
|
|
34
|
|
516
|
|
9
|
|
||||||||
|
Total impaired loans
|
$
|
23,142
|
|
$
|
749
|
|
$
|
27,337
|
|
$
|
568
|
|
||||
31
Acquired Loans
|
|
Nine Months Ended September 30, 2016
|
Nine Months Ended September 30, 2015
|
||||||||||||||
|
(in thousands)
|
Average Recorded
Investment |
Cash Basis Interest
Income Recognized |
Average Recorded
Investment |
Cash Basis Interest
Income Recognized |
||||||||||||
|
With no related allowance:
|
|
|
|
|
|
|
|
|
||||||||
|
Commercial real estate - construction
|
$
|
—
|
|
$
|
—
|
|
$
|
593
|
|
$
|
60
|
|
||||
|
Commercial real estate - single and multifamily
|
—
|
|
—
|
|
169
|
|
—
|
|
||||||||
|
Other commercial real estate loans
|
546
|
|
20
|
|
1,824
|
|
5
|
|
||||||||
|
Other commercial and industrial loans
|
191
|
|
1
|
|
42
|
|
3
|
|
||||||||
|
Residential mortgages - 1-4 family
|
321
|
|
9
|
|
423
|
|
—
|
|
||||||||
|
Consumer - home equity
|
—
|
|
—
|
|
39
|
|
—
|
|
||||||||
|
Consumer - other
|
140
|
|
1
|
|
—
|
|
—
|
|
||||||||
|
With an allowance recorded:
|
|
|
|
|
|
|
|
|
||||||||
|
Commercial real estate - construction
|
$
|
—
|
|
$
|
—
|
|
$
|
—
|
|
$
|
—
|
|
||||
|
Commercial real estate - single and multifamily
|
942
|
|
37
|
|
2,878
|
|
82
|
|
||||||||
|
Other commercial real estate loans
|
2,606
|
|
127
|
|
1,266
|
|
77
|
|
||||||||
|
Other commercial and industrial loans
|
404
|
|
10
|
|
—
|
|
—
|
|
||||||||
|
Residential mortgages - 1-4 family
|
117
|
|
4
|
|
409
|
|
13
|
|
||||||||
|
Consumer - home equity
|
356
|
|
13
|
|
309
|
|
11
|
|
||||||||
|
Consumer - other
|
—
|
|
—
|
|
19
|
|
4
|
|
||||||||
|
Total
|
|
|
|
|
|
|
|
|
||||||||
|
Other commercial real estate loans
|
$
|
4,094
|
|
$
|
184
|
|
$
|
6,730
|
|
$
|
224
|
|
||||
|
Commercial and industrial loans
|
595
|
|
11
|
|
42
|
|
3
|
|
||||||||
|
Residential mortgages
|
438
|
|
13
|
|
832
|
|
13
|
|
||||||||
|
Consumer loans
|
496
|
|
14
|
|
367
|
|
15
|
|
||||||||
|
Total impaired loans
|
$
|
5,623
|
|
$
|
222
|
|
$
|
7,971
|
|
$
|
255
|
|
||||
32
Troubled Debt Restructuring Loans
The Company’s loan portfolio also includes certain loans that have been modified in a Troubled Debt Restructuring (TDR), where economic concessions have been granted to borrowers who have experienced or are expected to experience financial difficulties. These concessions typically result from the Company’s loss mitigation activities and could include reductions in the interest rate, payment extensions, forgiveness of principal, forbearance, or other actions. Certain TDRs are classified as nonperforming at the time of restructure and may only be returned to performing status after considering the borrower’s sustained repayment performance for a reasonable period, generally
six months
. TDRs are evaluated individually for impairment and may result in a specific allowance amount allocated to an individual loan.
The following tables include the recorded investment and number of modifications identified during the
three and nine
months ended
September 30, 2016
and for the
three and nine
months ended
September 30, 2015
, respectively. The table includes the recorded investment in the loans prior to a modification and also the recorded investment in the loans after the loans were restructured. The modifications for the
three and nine
months ended
September 30, 2016
were attributable to interest rate concessions, maturity date extensions, modified payment terms, reamortization, and accelerated maturity. The modifications for the
three and nine
months ending
September 30, 2015
were attributable to interest rate concessions, maturity date extensions, modified payment terms, reamortization, and accelerated maturity.
|
Three Months Ended September 30, 2016
|
|||||||||||
|
(Dollars in thousands)
|
Number of
Modifications |
Pre-Modification
Outstanding Recorded Investment |
Post-Modification
Outstanding Recorded Investment |
||||||||
|
Troubled Debt Restructurings
|
|
|
|
|
|
|
|||||
|
Commercial and industrial - Other
|
2
|
|
$
|
404
|
|
$
|
404
|
|
|||
|
Residential - 1-4 Family
|
2
|
|
5
|
|
5
|
|
|||||
|
Total
|
4
|
|
$
|
409
|
|
$
|
409
|
|
|||
|
Nine Months Ended September 30, 2016
|
|||||||||||
|
(Dollars in thousands)
|
Number of
Modifications |
Pre-Modification
Outstanding Recorded Investment |
Post-Modification
Outstanding Recorded Investment |
||||||||
|
Troubled Debt Restructurings
|
|
|
|
|
|
|
|||||
|
Commercial - Other
|
2
|
|
$
|
1,049
|
|
$
|
1,049
|
|
|||
|
Commercial and industrial - Other
|
4
|
|
555
|
|
555
|
|
|||||
|
Residential - 1-4 Family
|
2
|
|
5
|
|
5
|
|
|||||
|
Consumer - Home Equity
|
1
|
|
117
|
|
117
|
|
|||||
|
Total
|
9
|
|
$
|
1,726
|
|
$
|
1,726
|
|
|||
|
Three Months Ended September 30, 2015
|
|||||||||||
|
(Dollars in thousands)
|
Number of
Modifications |
Pre-Modification
Outstanding Recorded Investment |
Post-Modification
Outstanding Recorded Investment |
||||||||
|
Troubled Debt Restructurings
|
|
|
|
|
|
|
|||||
|
Commercial - Single and multifamily
|
2
|
|
307
|
|
307
|
|
|||||
|
Total
|
2
|
|
$
|
307
|
|
$
|
307
|
|
|||
|
Nine Months Ended September 30, 2015
|
|||||||||||
|
(Dollars in thousands)
|
Number of
Modifications |
Pre-Modification
Outstanding Recorded Investment |
Post-Modification
Outstanding Recorded Investment |
||||||||
|
Troubled Debt Restructurings
|
|
|
|
|
|
|
|||||
|
Commercial - Construction
|
1
|
|
$
|
2,000
|
|
$
|
2,000
|
|
|||
|
Commercial - Single and multifamily
|
2
|
|
307
|
|
307
|
|
|||||
|
Commercial - Other
|
2
|
|
1,694
|
|
1,694
|
|
|||||
|
Commercial and industrial - Other
|
5
|
|
8,192
|
|
8,192
|
|
|||||
|
Total
|
10
|
|
12,193
|
|
12,193
|
|
|||||
33
The following tables disclose the recorded investments and numbers of modifications for TDRs for the prior year where a concession has been made, that then defaulted in the respective reporting period. For the
three and nine
months ended
September 30, 2016
, there were no loans that were restructured that had subsequently defaulted during the period.
|
Modifications that Subsequently Defaulted
|
||||||
|
Three Months Ended September 30, 2015
|
||||||
|
|
Number of Contracts
|
Recorded Investment
|
||||
|
Troubled Debt Restructurings
|
|
|
|
|
||
|
Commercial and industrial- Other
|
2
|
|
$
|
5,742
|
|
|
|
Modifications that Subsequently Defaulted
|
||||||
|
Nine Months Ended September 30, 2015
|
||||||
|
|
Number of Contracts
|
Recorded Investment
|
||||
|
Troubled Debt Restructurings
|
|
|
|
|
||
|
Commercial - Other
|
1
|
|
$
|
649
|
|
|
|
Commercial and industrial - Other
|
2
|
|
$
|
5,742
|
|
|
The following table presents the Company’s TDR activity for the
three and nine
months ended
September 30, 2016
and 2015:
|
Three Months Ended September 30,
|
||||||||
|
(In thousands)
|
2016
|
2015
|
||||||
|
Balance at beginning of the period
|
$
|
22,122
|
|
$
|
25,716
|
|
||
|
Principal payments
|
(932
|
)
|
(1,538
|
)
|
||||
|
TDR status change (1)
|
—
|
|
—
|
|
||||
|
Other reductions/increases (2)
|
—
|
|
(69
|
)
|
||||
|
Newly identified TDRs
|
409
|
|
307
|
|
||||
|
Balance at end of the period
|
$
|
21,599
|
|
$
|
24,416
|
|
||
|
Nine Months Ended September 30,
|
||||||||
|
(In thousands)
|
2016
|
2015
|
||||||
|
Balance at beginning of the period
|
$
|
22,048
|
|
$
|
16,714
|
|
||
|
Principal payments
|
(2,041
|
)
|
(2,629
|
)
|
||||
|
TDR status change (1)
|
2,236
|
|
—
|
|
||||
|
Other reductions/increases (2)
|
(2,370
|
)
|
(1,862
|
)
|
||||
|
Newly identified TDRs
|
1,726
|
|
12,193
|
|
||||
|
Balance at end of the period
|
$
|
21,599
|
|
$
|
24,416
|
|
||
(1) TDR status change classification represents TDR loans with a specified interest rate equal to or greater than the rate that the Company was willing to accept at the time of the restructuring for a new loan with comparable risk and the loan was on current payment status and not impaired based on the terms specified by the restructuring agreement.
(2) Other reductions classification consists of transfer to other real estate owned and charge-offs and advances to loans.
The evaluation of certain loans individually for specific impairment includes loans that were previously classified as TDRs or continue to be classified as TDRs.
As of
September 30, 2016
, the Company maintained foreclosed residential real estate property with a fair value of
$80 thousand
. Additionally, residential mortgage loans collateralized by real estate property that are in the process of foreclosure as of
September 30, 2016
and December 31, 2015 totaled
$6.3 million
and
$7.5 million
, respectively. As of December 31, 2015, foreclosed residential real estate property totaled
$675 thousand
.
34
Activity in the allowance for loan losses for the three and
nine
months ended
September 30, 2016
and 2015 was as follows:
|
At or for the three months ended September 30, 2016
|
||||||||||||||||||||||||
|
Business Activities Loans
(In thousands)
|
Commercial
real estate
|
Commercial and
industrial loans
|
Residential
mortgages
|
Consumer
|
Unallocated
|
Total
|
||||||||||||||||||
|
Balance at beginning of period
|
$
|
16,895
|
|
$
|
8,296
|
|
$
|
7,526
|
|
$
|
4,769
|
|
$
|
(362
|
)
|
$
|
37,124
|
|
||||||
|
Charged-off loans
|
—
|
|
1,599
|
|
253
|
|
434
|
|
—
|
|
2,286
|
|
||||||||||||
|
Recoveries on charged-off loans
|
114
|
|
37
|
|
96
|
|
61
|
|
—
|
|
308
|
|
||||||||||||
|
Provision/(releases) for loan losses
|
507
|
|
1,776
|
|
37
|
|
904
|
|
251
|
|
3,475
|
|
||||||||||||
|
Balance at end of period
|
$
|
17,516
|
|
$
|
8,510
|
|
$
|
7,406
|
|
$
|
5,300
|
|
$
|
(111
|
)
|
$
|
38,621
|
|
||||||
|
Individually evaluated for impairment
|
190
|
|
194
|
|
89
|
|
165
|
|
—
|
|
638
|
|
||||||||||||
|
Collectively evaluated
|
17,326
|
|
8,316
|
|
7,317
|
|
5,135
|
|
(111
|
)
|
37,983
|
|
||||||||||||
|
Total
|
$
|
17,516
|
|
$
|
8,510
|
|
$
|
7,406
|
|
$
|
5,300
|
|
$
|
(111
|
)
|
$
|
38,621
|
|
||||||
|
At or for the nine months ended September 30, 2016
|
||||||||||||||||||||||||
|
Business Activities Loans
(In thousands) |
Commercial
real estate |
Commercial and
industrial loans |
Residential
mortgages |
Consumer
|
Unallocated
|
Total
|
||||||||||||||||||
|
Balance at beginning of period
|
$
|
14,508
|
|
$
|
7,317
|
|
$
|
7,566
|
|
$
|
4,956
|
|
$
|
227
|
|
$
|
34,574
|
|
||||||
|
Charged-off loans
|
1,578
|
|
4,145
|
|
1,340
|
|
1,175
|
|
—
|
|
8,238
|
|
||||||||||||
|
Recoveries on charged-off loans
|
242
|
|
114
|
|
101
|
|
183
|
|
—
|
|
640
|
|
||||||||||||
|
Provision/(releases) for loan losses
|
4,344
|
|
5,224
|
|
1,079
|
|
1,336
|
|
(338
|
)
|
11,645
|
|
||||||||||||
|
Balance at end of period
|
$
|
17,516
|
|
$
|
8,510
|
|
$
|
7,406
|
|
$
|
5,300
|
|
$
|
(111
|
)
|
$
|
38,621
|
|
||||||
|
Individually evaluated for impairment
|
190
|
|
194
|
|
89
|
|
165
|
|
—
|
|
638
|
|
||||||||||||
|
Collectively evaluated
|
17,326
|
|
8,316
|
|
7,317
|
|
5,135
|
|
(111
|
)
|
37,983
|
|
||||||||||||
|
Total
|
$
|
17,516
|
|
$
|
8,510
|
|
$
|
7,406
|
|
$
|
5,300
|
|
$
|
(111
|
)
|
$
|
38,621
|
|
||||||
|
At or for the three months ended September 30, 2015
|
||||||||||||||||||||||||
|
Business Activities Loans
(In thousands)
|
Commercial
real estate
|
Commercial and
industrial loans
|
Residential
mortgages
|
Consumer
|
Unallocated
|
Total
|
||||||||||||||||||
|
Balance at beginning of period
|
$
|
12,967
|
|
$
|
9,166
|
|
$
|
6,471
|
|
$
|
4,914
|
|
$
|
(292
|
)
|
$
|
33,226
|
|
||||||
|
Charged-off loans
|
1,329
|
|
916
|
|
316
|
|
353
|
|
—
|
|
2,914
|
|
||||||||||||
|
Recoveries on charged-off loans
|
—
|
|
6
|
|
28
|
|
86
|
|
—
|
|
120
|
|
||||||||||||
|
Provision/(releases) for loan losses
|
2,623
|
|
(223
|
)
|
1,187
|
|
281
|
|
263
|
|
4,131
|
|
||||||||||||
|
Balance at end of period
|
$
|
14,261
|
|
$
|
8,033
|
|
$
|
7,370
|
|
$
|
4,928
|
|
$
|
(29
|
)
|
$
|
34,563
|
|
||||||
|
Individually evaluated for impairment
|
410
|
|
1,032
|
|
248
|
|
38
|
|
—
|
|
1,728
|
|
||||||||||||
|
Collectively evaluated
|
13,851
|
|
7,001
|
|
7,122
|
|
4,890
|
|
(29
|
)
|
32,835
|
|
||||||||||||
|
Total
|
$
|
14,261
|
|
$
|
8,033
|
|
$
|
7,370
|
|
$
|
4,928
|
|
$
|
(29
|
)
|
$
|
34,563
|
|
||||||
35
|
At or for the nine months ended September 30, 2015
|
||||||||||||||||||||||||
|
Business Activities Loans
(In thousands) |
Commercial
real estate |
Commercial and
industrial loans |
Residential
mortgages |
Consumer
|
Unallocated
|
Total
|
||||||||||||||||||
|
Balance at beginning of period
|
$
|
14,690
|
|
$
|
5,206
|
|
$
|
6,836
|
|
$
|
5,928
|
|
$
|
135
|
|
$
|
32,795
|
|
||||||
|
Charged-off loans
|
5,751
|
|
1,288
|
|
762
|
|
815
|
|
—
|
|
8,616
|
|
||||||||||||
|
Recoveries on charged-off loans
|
146
|
|
160
|
|
141
|
|
213
|
|
—
|
|
660
|
|
||||||||||||
|
Provision/(releases) for loan losses
|
5,176
|
|
3,955
|
|
1,155
|
|
(398
|
)
|
(164
|
)
|
9,724
|
|
||||||||||||
|
Balance at end of period
|
$
|
14,261
|
|
$
|
8,033
|
|
$
|
7,370
|
|
$
|
4,928
|
|
$
|
(29
|
)
|
$
|
34,563
|
|
||||||
|
Individually evaluated for impairment
|
410
|
|
1,032
|
|
248
|
|
38
|
|
—
|
|
1,728
|
|
||||||||||||
|
Collectively evaluated
|
13,851
|
|
7,001
|
|
7,122
|
|
4,890
|
|
(29
|
)
|
32,835
|
|
||||||||||||
|
Total
|
$
|
14,261
|
|
$
|
8,033
|
|
$
|
7,370
|
|
$
|
4,928
|
|
$
|
(29
|
)
|
$
|
34,563
|
|
||||||
|
At or for the three months ended September 30, 2016
|
||||||||||||||||||||||||
|
Acquired Loans
(In thousands)
|
Commercial
real estate
|
Commercial and
industrial loans
|
Residential
mortgages
|
Consumer
|
Unallocated
|
Total
|
||||||||||||||||||
|
Balance at beginning of period
|
$
|
2,140
|
|
$
|
776
|
|
$
|
881
|
|
$
|
476
|
|
$
|
—
|
|
$
|
4,273
|
|
||||||
|
Charged-off loans
|
662
|
|
84
|
|
332
|
|
77
|
|
—
|
|
1,155
|
|
||||||||||||
|
Recoveries on charged-off loans
|
—
|
|
37
|
|
37
|
|
33
|
|
—
|
|
107
|
|
||||||||||||
|
Provision for loan losses
|
907
|
|
210
|
|
111
|
|
31
|
|
—
|
|
1,259
|
|
||||||||||||
|
Balance at end of period
|
$
|
2,385
|
|
$
|
939
|
|
$
|
697
|
|
$
|
463
|
|
$
|
—
|
|
$
|
4,484
|
|
||||||
|
Individually evaluated for impairment
|
704
|
|
121
|
|
12
|
|
135
|
|
—
|
|
972
|
|
||||||||||||
|
Purchased credit-impaired loans
|
—
|
|
—
|
|
—
|
|
—
|
|
—
|
|
—
|
|
||||||||||||
|
Collectively evaluated
|
1,681
|
|
818
|
|
685
|
|
328
|
|
—
|
|
3,512
|
|
||||||||||||
|
Total
|
$
|
2,385
|
|
$
|
939
|
|
$
|
697
|
|
$
|
463
|
|
$
|
—
|
|
$
|
4,484
|
|
||||||
|
At or for the nine months ended September 30, 2016
|
||||||||||||||||||||||||
|
Acquired Loans
(In thousands) |
Commercial
real estate |
Commercial and
industrial loans |
Residential
mortgages |
Consumer
|
Unallocated
|
Total
|
||||||||||||||||||
|
Balance at beginning of period
|
$
|
1,903
|
|
$
|
1,330
|
|
$
|
976
|
|
$
|
525
|
|
$
|
—
|
|
$
|
4,734
|
|
||||||
|
Charged-off loans
|
788
|
|
359
|
|
696
|
|
457
|
|
—
|
|
2,300
|
|
||||||||||||
|
Recoveries on charged-off loans
|
—
|
|
213
|
|
141
|
|
79
|
|
—
|
|
433
|
|
||||||||||||
|
Provision for loan losses
|
1,270
|
|
(245
|
)
|
276
|
|
316
|
|
—
|
|
1,617
|
|
||||||||||||
|
Balance at end of period
|
$
|
2,385
|
|
$
|
939
|
|
$
|
697
|
|
$
|
463
|
|
$
|
—
|
|
$
|
4,484
|
|
||||||
|
Individually evaluated for impairment
|
704
|
|
121
|
|
12
|
|
135
|
|
—
|
|
972
|
|
||||||||||||
|
Purchased credit-impaired loans
|
—
|
|
—
|
|
—
|
|
—
|
|
—
|
|
—
|
|
||||||||||||
|
Collectively evaluated
|
1,681
|
|
818
|
|
685
|
|
328
|
|
—
|
|
3,512
|
|
||||||||||||
|
Total
|
$
|
2,385
|
|
$
|
939
|
|
$
|
697
|
|
$
|
463
|
|
$
|
—
|
|
$
|
4,484
|
|
||||||
36
|
At or for the three months ended September 30, 2015
|
||||||||||||||||||||||||
|
Acquired Loans
(In thousands)
|
Commercial
real estate
|
Commercial and
industrial loans
|
Residential
mortgages
|
Consumer
|
Unallocated
|
Total
|
||||||||||||||||||
|
Balance at beginning of period
|
$
|
1,786
|
|
$
|
973
|
|
$
|
808
|
|
$
|
404
|
|
$
|
—
|
|
$
|
3,971
|
|
||||||
|
Charged-off loans
|
38
|
|
318
|
|
66
|
|
206
|
|
—
|
|
628
|
|
||||||||||||
|
Recoveries on charged-off loans
|
23
|
|
130
|
|
1
|
|
11
|
|
—
|
|
165
|
|
||||||||||||
|
Provision for loan losses
|
(252
|
)
|
(133
|
)
|
182
|
|
312
|
|
—
|
|
109
|
|
||||||||||||
|
Balance at end of period
|
$
|
1,519
|
|
$
|
652
|
|
$
|
925
|
|
$
|
521
|
|
$
|
—
|
|
$
|
3,617
|
|
||||||
|
Individually evaluated for impairment
|
199
|
|
—
|
|
48
|
|
71
|
|
—
|
|
318
|
|
||||||||||||
|
Purchased credit-impaired loans
|
—
|
|
—
|
|
—
|
|
—
|
|
—
|
|
—
|
|
||||||||||||
|
Collectively evaluated
|
1,320
|
|
652
|
|
877
|
|
450
|
|
—
|
|
3,299
|
|
||||||||||||
|
Total
|
$
|
1,519
|
|
$
|
652
|
|
$
|
925
|
|
$
|
521
|
|
$
|
—
|
|
$
|
3,617
|
|
||||||
|
At or for the nine months ended September 30, 2015
|
||||||||||||||||||||||||
|
Acquired Loans
(In thousands) |
Commercial
real estate |
Commercial and
industrial loans |
Residential
mortgages |
Consumer
|
Unallocated
|
Total
|
||||||||||||||||||
|
Balance at beginning of period
|
$
|
790
|
|
$
|
1,093
|
|
$
|
615
|
|
$
|
369
|
|
$
|
—
|
|
$
|
2,867
|
|
||||||
|
Charged-off loans
|
625
|
|
654
|
|
441
|
|
814
|
|
—
|
|
2,534
|
|
||||||||||||
|
Recoveries on charged-off loans
|
418
|
|
186
|
|
42
|
|
67
|
|
—
|
|
713
|
|
||||||||||||
|
Provision for loan losses
|
936
|
|
27
|
|
709
|
|
899
|
|
—
|
|
2,571
|
|
||||||||||||
|
Balance at end of period
|
$
|
1,519
|
|
$
|
652
|
|
$
|
925
|
|
$
|
521
|
|
$
|
—
|
|
$
|
3,617
|
|
||||||
|
Individually evaluated for impairment
|
199
|
|
—
|
|
48
|
|
71
|
|
—
|
|
318
|
|
||||||||||||
|
Purchased credit-impaired loans
|
—
|
|
—
|
|
—
|
|
—
|
|
—
|
|
—
|
|
||||||||||||
|
Collectively evaluated
|
1,320
|
|
652
|
|
877
|
|
450
|
|
—
|
|
3,299
|
|
||||||||||||
|
Total
|
$
|
1,519
|
|
$
|
652
|
|
$
|
925
|
|
$
|
521
|
|
$
|
—
|
|
$
|
3,617
|
|
||||||
Credit Quality Information
Business Activities Loans Credit Quality Analysis
The Company monitors the credit quality of its portfolio by using internal risk ratings that are based on regulatory guidance. Loans that are given a Pass rating are not considered a problem credit. Loans that are classified as Special Mention loans are considered to have potential credit problems and are evaluated closely by management. Substandard and non-accruing loans are loans for which a definitive weakness has been identified and which may make full collection of contractual cash flows questionable. Doubtful loans are those with identified weaknesses that make full collection of contractual cash flows, on the basis of currently existing facts, conditions, and values, highly questionable and improbable.
For commercial credits, the Company assigns an internal risk rating at origination and reviews the rating annually, semiannually or quarterly depending on the risk rating. The rating is also reassessed at any point in time when management becomes aware of information that may affect the borrower’s ability to fulfill their obligations.
The Company risk rates its residential mortgages, including 1-4 family and residential construction loans, based on a
three
rating system: Pass, Special Mention and Substandard. Loans that are current within
59
days are rated Pass. Residential mortgages that are
60
-
89
days delinquent are rated Special Mention. Loans delinquent for
90
days or greater are rated Substandard and generally placed on non-accrual status. Home equity loans are risk rated based on the same rating system as the Company’s residential mortgages.
Ratings for other consumer loans, including auto loans, are based on a
two
rating system. Loans that are current within
119
days are rated Performing while loans delinquent for
120
days or more are rated Non-performing. Other consumer loans are placed on non-accrual at such time as they become Non-performing.
37
Acquired Loans Credit Quality Analysis
Upon acquiring a loan portfolio, the Company's internal loan review function assigns risk ratings to the acquired loans, utilizing the same methodology as it does with business activities loans. This may differ from the risk rating policy of the predecessor bank. Loans which are rated Substandard or worse according to the rating process outlined below are deemed to be credit impaired loans accounted for under ASC 310-30, regardless of whether they are classified as performing or non-performing.
The Bank utilizes an
eleven
grade internal loan rating system for each of its acquired commercial real estate, construction and commercial loans as outlined in the Credit Quality Information section of this Note. The ratings system is similar to loans originated through business activities.
The Company subjects loans that do not meet the ASC 310-30 criteria to ASC 450-20 (
Loss Contingencies
) by collectively evaluating these loans for an allowance for loan loss. The Company applies a methodology similar to the methodology prescribed for business activities loans, which includes the application of environmental factors to each category of loans. The methodology to collectively evaluate the acquired loans outside the scope of ASC 310-30 includes the application of a number of environmental factors that reflect management’s best estimate of the level of incremental credit losses that might be recognized given current conditions. This is reviewed as part of the allowance for loan loss adequacy analysis. As the loan portfolio matures and environmental factors change, the loan portfolio will be reassessed each quarter to determine an appropriate reserve allowance.
Additionally, the Company considers the need for an additional reserve for acquired loans accounted for outside of the scope of ASC 310-30 under ASC 310-20. At acquisition date, the Bank determined a fair value mark with credit and interest rate components. Under the Company’s model, the impairment evaluation process involves comparing the carrying value of acquired loans, including the entire unamortized premium or discount, to the recorded reserve allowance. If necessary, the Company books an additional reserve to account for shortfalls identified through this calculation. Fair value marks are not bifurcated when evaluating for impairment.
A decrease in the expected cash flows in subsequent periods requires the establishment of an allowance for loan losses at that time for ASC 310-30 loans. At
September 30, 2016
the allowance for loan losses related to acquired loans under ASC 310-30 and ASC 310-20 was
$4.5 million
using the above mentioned criteria.
38
The following tables present the Company’s loans by risk rating at
September 30, 2016
and December 31, 2015:
Business Activities Loans
Commercial Real Estate
Credit Risk Profile by Creditworthiness Category
|
|
Construction
|
Single and multi-family
|
Other
|
Total commercial real estate
|
||||||||||||||||||||||||||||
|
(In thousands)
|
September 30, 2016
|
December 31, 2015
|
September 30, 2016
|
December 31, 2015
|
September 30, 2016
|
December 31, 2015
|
September 30, 2016
|
December 31, 2015
|
||||||||||||||||||||||||
|
Grade:
|
|
|
|
|
|
|
|
|
|
|
|
|
|
|
|
|
||||||||||||||||
|
Pass
|
$
|
221,749
|
|
$
|
208,138
|
|
$
|
269,342
|
|
$
|
212,900
|
|
$
|
1,378,353
|
|
$
|
1,155,770
|
|
$
|
1,869,444
|
|
$
|
1,576,808
|
|
||||||||
|
Special mention
|
—
|
|
—
|
|
348
|
|
—
|
|
21,533
|
|
3,449
|
|
21,881
|
|
3,449
|
|
||||||||||||||||
|
Substandard
|
—
|
|
2,058
|
|
2,154
|
|
1,923
|
|
38,803
|
|
49,716
|
|
40,957
|
|
53,697
|
|
||||||||||||||||
|
Doubtful
|
—
|
|
—
|
|
—
|
|
—
|
|
37
|
|
73
|
|
37
|
|
73
|
|
||||||||||||||||
|
Total
|
$
|
221,749
|
|
$
|
210,196
|
|
$
|
271,844
|
|
$
|
214,823
|
|
$
|
1,438,726
|
|
$
|
1,209,008
|
|
$
|
1,932,319
|
|
$
|
1,634,027
|
|
||||||||
Commercial and Industrial Loans
Credit Risk Profile by Creditworthiness Category
|
|
Asset based lending
|
Other
|
Total comm. and industrial loans
|
|||||||||||||||||||||
|
(In thousands)
|
September 30, 2016
|
December 31, 2015
|
September 30, 2016
|
December 31, 2015
|
September 30, 2016
|
December 31, 2015
|
||||||||||||||||||
|
Grade:
|
|
|
|
|
|
|
|
|
|
|
|
|
||||||||||||
|
Pass
|
$
|
327,100
|
|
$
|
331,253
|
|
$
|
499,953
|
|
$
|
455,710
|
|
$
|
827,053
|
|
$
|
786,963
|
|
||||||
|
Special mention
|
—
|
|
—
|
|
484
|
|
24,578
|
|
484
|
|
24,578
|
|
||||||||||||
|
Substandard
|
—
|
|
—
|
|
20,332
|
|
15,691
|
|
20,332
|
|
15,691
|
|
||||||||||||
|
Total
|
$
|
327,100
|
|
$
|
331,253
|
|
$
|
520,769
|
|
$
|
495,979
|
|
$
|
847,869
|
|
$
|
827,232
|
|
||||||
Residential Mortgages
Credit Risk Profile by Internally Assigned Grade
|
|
1-4 family
|
Construction
|
Total residential mortgages
|
|||||||||||||||||||||
|
(In thousands)
|
September 30, 2016
|
December 31, 2015
|
September 30, 2016
|
December 31, 2015
|
September 30, 2016
|
December 31, 2015
|
||||||||||||||||||
|
Grade:
|
|
|
|
|
|
|
|
|
|
|
|
|
||||||||||||
|
Pass
|
$
|
1,508,109
|
|
$
|
1,449,073
|
|
$
|
16,555
|
|
$
|
26,704
|
|
$
|
1,524,664
|
|
$
|
1,475,777
|
|
||||||
|
Special mention
|
1,602
|
|
857
|
|
—
|
|
—
|
|
1,602
|
|
857
|
|
||||||||||||
|
Substandard
|
3,411
|
|
4,303
|
|
45
|
|
—
|
|
3,456
|
|
4,303
|
|
||||||||||||
|
Total
|
$
|
1,513,122
|
|
$
|
1,454,233
|
|
$
|
16,600
|
|
$
|
26,704
|
|
$
|
1,529,722
|
|
$
|
1,480,937
|
|
||||||
Consumer Loans
Credit Risk Profile Based on Payment Activity
|
|
Home equity
|
Auto and other
|
Total consumer loans
|
|||||||||||||||||||||
|
(In thousands)
|
September 30, 2016
|
December 31, 2015
|
September 30, 2016
|
December 31, 2015
|
September 30, 2016
|
December 31, 2015
|
||||||||||||||||||
|
Performing
|
$
|
322,060
|
|
$
|
305,562
|
|
$
|
435,088
|
|
$
|
310,777
|
|
$
|
757,148
|
|
$
|
616,339
|
|
||||||
|
Nonperforming
|
1,582
|
|
1,597
|
|
530
|
|
551
|
|
2,112
|
|
2,148
|
|
||||||||||||
|
Total
|
$
|
323,642
|
|
$
|
307,159
|
|
$
|
435,618
|
|
$
|
311,328
|
|
$
|
759,260
|
|
$
|
618,487
|
|
||||||
39
Acquired Loans
Commercial Real Estate
Credit Risk Profile by Creditworthiness Category
|
|
Construction
|
Single and multi-family
|
Other
|
Total commercial real estate
|
||||||||||||||||||||||||||||
|
(In thousands)
|
September 30, 2016
|
December 31, 2015
|
September 30, 2016
|
December 31, 2015
|
September 30, 2016
|
December 31, 2015
|
September 30, 2016
|
December 31, 2015
|
||||||||||||||||||||||||
|
Grade:
|
|
|
|
|
|
|
|
|
|
|
|
|
|
|
|
|
||||||||||||||||
|
Pass
|
$
|
18,768
|
|
$
|
42,176
|
|
$
|
35,812
|
|
$
|
32,796
|
|
$
|
317,894
|
|
$
|
324,614
|
|
$
|
372,474
|
|
$
|
399,586
|
|
||||||||
|
Special mention
|
—
|
|
—
|
|
—
|
|
655
|
|
1,630
|
|
352
|
|
1,630
|
|
1,007
|
|
||||||||||||||||
|
Substandard
|
1,082
|
|
1,298
|
|
4,884
|
|
3,332
|
|
14,655
|
|
20,517
|
|
20,621
|
|
25,147
|
|
||||||||||||||||
|
Total
|
$
|
19,850
|
|
$
|
43,474
|
|
$
|
40,696
|
|
$
|
36,783
|
|
$
|
334,179
|
|
$
|
345,483
|
|
$
|
394,725
|
|
$
|
425,740
|
|
||||||||
Commercial and Industrial Loans
Credit Risk Profile by Creditworthiness Category
|
|
Asset based lending
|
Other
|
Total comm. and industrial loans
|
|||||||||||||||||||||
|
(In thousands)
|
September 30, 2016
|
December 31, 2015
|
September 30, 2016
|
December 31, 2015
|
September 30, 2016
|
December 31, 2015
|
||||||||||||||||||
|
Grade:
|
|
|
|
|
|
|
|
|
|
|
|
|
||||||||||||
|
Pass
|
$
|
—
|
|
$
|
—
|
|
$
|
141,843
|
|
$
|
212,825
|
|
$
|
141,843
|
|
$
|
212,825
|
|
||||||
|
Special mention
|
—
|
|
—
|
|
180
|
|
487
|
|
180
|
|
487
|
|
||||||||||||
|
Substandard
|
—
|
|
—
|
|
4,813
|
|
7,719
|
|
4,813
|
|
7,719
|
|
||||||||||||
|
Doubtful
|
—
|
|
—
|
|
169
|
|
—
|
|
169
|
|
—
|
|
||||||||||||
|
Total
|
$
|
—
|
|
$
|
—
|
|
$
|
147,005
|
|
$
|
221,031
|
|
$
|
147,005
|
|
$
|
221,031
|
|
||||||
Residential Mortgages
Credit Risk Profile by Internally Assigned Grade
|
|
1-4 family
|
Construction
|
Total residential mortgages
|
|||||||||||||||||||||
|
(In thousands)
|
September 30, 2016
|
December 31, 2015
|
September 30, 2016
|
December 31, 2015
|
September 30, 2016
|
December 31, 2015
|
||||||||||||||||||
|
Grade:
|
|
|
|
|
|
|
|
|
|
|
|
|
||||||||||||
|
Pass
|
$
|
285,167
|
|
$
|
329,375
|
|
$
|
815
|
|
$
|
1,351
|
|
$
|
285,982
|
|
$
|
330,726
|
|
||||||
|
Special mention
|
441
|
|
311
|
|
—
|
|
—
|
|
441
|
|
311
|
|
||||||||||||
|
Substandard
|
1,966
|
|
3,061
|
|
—
|
|
—
|
|
1,966
|
|
3,061
|
|
||||||||||||
|
Total
|
$
|
287,574
|
|
$
|
332,747
|
|
$
|
815
|
|
$
|
1,351
|
|
$
|
288,389
|
|
$
|
334,098
|
|
||||||
Consumer Loans
Credit Risk Profile Based on Payment Activity
|
|
Home equity
|
Auto and other
|
Total consumer loans
|
|||||||||||||||||||||
|
(In thousands)
|
September 30, 2016
|
December 31, 2015
|
September 30, 2016
|
December 31, 2015
|
September 30, 2016
|
December 31, 2015
|
||||||||||||||||||
|
Performing
|
$
|
45,732
|
|
$
|
52,719
|
|
$
|
100,814
|
|
$
|
129,345
|
|
$
|
146,546
|
|
$
|
182,064
|
|
||||||
|
Nonperforming
|
526
|
|
727
|
|
643
|
|
893
|
|
1,169
|
|
1,620
|
|
||||||||||||
|
Total
|
$
|
46,258
|
|
$
|
53,446
|
|
$
|
101,457
|
|
$
|
130,238
|
|
$
|
147,715
|
|
$
|
183,684
|
|
||||||
40
The following table summarizes information about total loans rated Special Mention or lower as of
September 30, 2016
and December 31, 2015. The table below includes consumer loans that are special mention and substandard accruing that are classified in the above table as performing based on payment activity.
|
|
September 30, 2016
|
December 31, 2015
|
||||||||||||||||||||||
|
(In thousands)
|
Business
Activities Loans |
Acquired Loans
|
Total
|
Business
Activities Loans |
Acquired Loans
|
Total
|
||||||||||||||||||
|
Non-Accrual
|
$
|
14,690
|
|
$
|
5,974
|
|
$
|
20,664
|
|
$
|
15,484
|
|
$
|
5,391
|
|
$
|
20,875
|
|
||||||
|
Substandard Accruing
|
52,352
|
|
23,223
|
|
75,575
|
|
60,549
|
|
32,560
|
|
93,109
|
|
||||||||||||
|
Total Classified
|
67,042
|
|
29,197
|
|
96,239
|
|
76,033
|
|
37,951
|
|
113,984
|
|
||||||||||||
|
Special Mention
|
24,378
|
|
3,583
|
|
27,961
|
|
29,036
|
|
2,259
|
|
31,295
|
|
||||||||||||
|
Total Criticized
|
$
|
91,420
|
|
$
|
32,780
|
|
$
|
124,200
|
|
$
|
105,069
|
|
$
|
40,210
|
|
$
|
145,279
|
|
||||||
41
A summary of time deposits is as follows:
|
(In thousands)
|
September 30,
2016 |
December 31,
2015 |
||||||
|
Time less than $100,000
|
$
|
535,655
|
|
$
|
545,819
|
|
||
|
Time $100,000 or more
|
1,547,234
|
|
1,440,781
|
|
||||
|
Total time deposits
|
$
|
2,082,889
|
|
$
|
1,986,600
|
|
||
Included in time deposits are brokered deposits of
$810.0 million
and
$784.1 million
at
September 30, 2016
and
December 31, 2015
, respectively. Included in the deposit balances contained on the balance sheet are reciprocal deposits of
$102.4 million
and
$101.5 million
at
September 30, 2016
and
December 31, 2015
, respectively.
Borrowed funds at
September 30, 2016
and
December 31, 2015
are summarized, as follows:
|
|
September 30, 2016
|
December 31, 2015
|
||||||||||||
|
|
|
Weighted
|
|
Weighted
|
||||||||||
|
|
|
Average
|
|
Average
|
||||||||||
|
(dollars in thousands)
|
Principal
|
Rate
|
Principal
|
Rate
|
||||||||||
|
Short-term borrowings:
|
|
|
|
|
|
|
|
|
||||||
|
Advances from the FHLBB
|
$
|
924,800
|
|
0.55
|
%
|
$
|
1,071,200
|
|
0.43
|
%
|
||||
|
Other Borrowings
|
15,000
|
|
2.17
|
|
—
|
|
—
|
|
||||||
|
Total short-term borrowings:
|
939,800
|
|
0.58
|
|
1,071,200
|
|
0.43
|
|
||||||
|
Long-term borrowings:
|
|
|
|
|
|
|
|
|
||||||
|
Advances from the FHLBB
|
109,114
|
|
1.61
|
|
103,135
|
|
1.89
|
|
||||||
|
Subordinated borrowings
|
73,652
|
|
7.00
|
|
73,519
|
|
7.00
|
|
||||||
|
Junior subordinated borrowings
|
15,464
|
|
2.67
|
|
15,464
|
|
2.23
|
|
||||||
|
Total long-term borrowings:
|
198,230
|
|
3.69
|
|
192,118
|
|
3.88
|
|
||||||
|
Total
|
$
|
1,138,030
|
|
1.12
|
%
|
$
|
1,263,318
|
|
0.96
|
%
|
||||
Short term debt includes Federal Home Loan Bank of Boston (“FHLBB”) advances with an original maturity of less than one year and a short-term line-of-credit drawdown through a correspondent bank. The Bank also maintains a
$3.0 million
secured line of credit with the FHLBB that bears a daily adjustable rate calculated by the FHLBB. There was
no
outstanding balance on the FHLBB line of credit for the periods ended
September 30, 2016
and
December 31, 2015
.
The Bank is approved to borrow on a short-term basis from the Federal Reserve Bank of Boston as a non-member bank. The Bank has pledged certain loans and securities to the Federal Reserve Bank to support this arrangement.
No
borrowings with the Federal Reserve Bank took place for the periods ended
September 30, 2016
and
December 31, 2015
.
Long-term FHLBB advances consist of advances with an original maturity of more than one year. The advances outstanding at
September 30, 2016
include callable advances totaling
$11.0 million
, and amortizing advances totaling
$1.2 million
. The advances outstanding at
December 31, 2015
include callable advances totaling
$11.0 million
, and amortizing advances totaling
$1.2 million
. All FHLBB borrowings, including the line of credit, are secured by a blanket security agreement on certain qualified collateral, principally all residential first mortgage loans and certain securities.
42
A summary of maturities of FHLBB advances as of
September 30, 2016
is as follows:
|
|
September 30, 2016
|
||||||
|
|
|
Weighted
|
|||||
|
|
|
Average
|
|||||
|
(in thousands, except rates)
|
Principal
|
Rate
|
|||||
|
Fixed rate advances maturing:
|
|
|
|
|
|||
|
2016
|
$
|
835,308
|
|
0.54
|
%
|
||
|
2017
|
183,154
|
|
1.08
|
|
|||
|
2018
|
1,018
|
|
2.62
|
|
|||
|
2019
|
—
|
|
—
|
|
|||
|
2020 and beyond
|
14,434
|
|
2.41
|
|
|||
|
Total FHLBB advances
|
$
|
1,033,914
|
|
0.66
|
%
|
||
The Company does not have variable-rate FHLBB advances for the periods ended
September 30, 2016
and
December 31, 2015
.
In September 2012, the Company issued
fifteen
year subordinated notes in the amount of
$75.0 million
at a discount of
1.15%
. The interest rate is fixed at
6.875%
for the first ten years. After
ten years
, the notes become callable and convert to an interest rate of three-month LIBOR rate plus
5.113%
. The subordinated note includes reduction to the note principal balance of
$737 thousand
and
$829 thousand
for unamortized debt issuance costs as of
September 30, 2016
and December 31 2015, respectively.
The Company holds
100%
of the common stock of Berkshire Hills Capital Trust I (“Trust I”) which is included in other assets with a cost of
$0.5 million
. The sole asset of Trust I is
$15.5 million
of the Company’s junior subordinated debentures due in 2035. These debentures bear interest at a variable rate equal to LIBOR plus
1.85%
and had a rate of
2.67%
and
2.23%
at
September 30, 2016
and
December 31, 2015
, respectively. The Company has the right to defer payments of interest for up to
five years
on the debentures at any time, or from time to time, with certain limitations, including a restriction on the payment of dividends to shareholders while such interest payments on the debentures have been deferred. The Company has not exercised this right to defer payments. The Company has the right to redeem the debentures at par value. Trust I is considered a variable interest entity for which the Company is not the primary beneficiary. Accordingly, Trust I is not consolidated into the Company’s financial statements.
43
The actual and required capital ratios were as follows:
|
September 30,
2016 |
Regulatory
Minimum to be Well Capitalized |
December 31,
2015 |
Regulatory
Minimum to be Well Capitalized |
|||||||||
|
Company (consolidated)
|
|
|
|
|
|
|
|
|
||||
|
Total capital to risk weighted assets
|
11.5
|
%
|
10.0
|
%
|
11.9
|
%
|
10.0
|
%
|
||||
|
Common equity tier 1 capital to risk weighted assets
|
9.5
|
|
6.5
|
|
9.8
|
|
6.5
|
|
||||
|
Tier 1 capital to risk weighted assets
|
9.6
|
|
8.0
|
|
9.9
|
|
8.0
|
|
||||
|
Tier 1 capital to average assets
|
7.7
|
|
5.0
|
|
7.7
|
|
5.0
|
|
||||
|
Bank
|
|
|
|
|
|
|
||||||
|
Total capital to risk weighted assets
|
10.9
|
%
|
10.0
|
%
|
11.2
|
%
|
10.0
|
%
|
||||
|
Common equity tier 1 capital to risk weighted assets
|
9.6
|
|
6.5
|
|
9.9
|
|
6.5
|
|
||||
|
Tier 1 capital to risk weighted assets
|
9.6
|
|
8.0
|
|
9.9
|
|
8.0
|
|
||||
|
Tier 1 capital to average assets
|
7.6
|
|
5.0
|
|
7.7
|
|
5.0
|
|
||||
At each date shown, the Company and the Bank met the conditions to be classified as “well capitalized” under the relevant regulatory framework. To be categorized as well capitalized, an institution must maintain minimum total risk-based, Tier 1 risk-based, and Tier 1 leverage ratios as set forth in the table above.
Effective January 1, 2015, the Company and the Bank became subject to the Basel III rule that requires the Company and the Bank to assess their Common equity tier 1 capital to risk weighted assets and the Company and the Bank each exceed the minimum to be well capitalized. In addition, the final capital rules added a requirement to maintain a minimum conservation buffer, composed of Common equity tier 1 capital, of
2.5%
of risk-weighted assets, to be phased in over
three
years and applied to the Common equity tier 1 risk-based capital ratio, the Tier 1 risk-based capital ratio and the Total risk-based capital ratio. Accordingly, banking organizations, on a fully phased in basis no later than January 1, 2019, must maintain a minimum Common equity tier 1 risk-based capital ratio of
7.0%
, a minimum Tier 1 risk-based capital ratio of
8.5%
and a minimum Total risk-based capital ratio of
10.5%
.
The required minimum conservation buffer began to be phased in incrementally, starting at
0.625%
on January 1, 2016 and will increase to
1.25%
on January 1, 2017,
1.875%
on January 1, 2018 and
2.5%
on January 1, 2019. The final capital rules impose restrictions on capital distributions and certain discretionary cash bonus payments if the minimum capital conservation buffer is not met.
At
September 30, 2016
, the capital levels of both the Company and the Bank exceeded all regulatory capital requirements and their regulatory capital ratios were above the minimum levels required to be considered well capitalized for regulatory purposes. The capital levels of both the Company and the Bank at
September 30, 2016
also exceeded the minimum capital requirements including the currently applicable capital conservation buffer of
0.625%
.
44
Accumulated other comprehensive income (loss)
Components of accumulated other comprehensive income is as follows:
|
(In thousands)
|
September 30,
2016 |
December 31,
2015 |
||||||
|
Other accumulated comprehensive income, before tax:
|
|
|
|
|
||||
|
Net unrealized holding gain on AFS securities
|
$
|
27,955
|
|
$
|
6,316
|
|
||
|
Net unrealized loss on effective cash flow hedging derivatives
|
(11,191
|
)
|
(8,532
|
)
|
||||
|
Net unrealized holding loss on pension plans
|
(3,469
|
)
|
(3,469
|
)
|
||||
|
Income taxes related to items of accumulated other comprehensive income:
|
|
|
|
|
||||
|
Net unrealized holding gain on AFS securities
|
(10,766
|
)
|
(2,437
|
)
|
||||
|
Net unrealized loss on effective cash flow hedging derivatives
|
4,490
|
|
3,425
|
|
||||
|
Net unrealized holding loss on pension plans
|
1,392
|
|
1,392
|
|
||||
|
Accumulated other comprehensive income (loss)
|
$
|
8,411
|
|
$
|
(3,305
|
)
|
||
The following table presents the components of other comprehensive income for the
three and nine
months ended
September 30, 2016
and
2015
:
|
(In thousands)
|
Before Tax
|
Tax Effect
|
Net of Tax
|
|||||||||
|
Three Months Ended September 30, 2016
|
|
|
|
|
|
|
||||||
|
Net unrealized holding (loss) on AFS securities:
|
x
|
|
|
|
||||||||
|
Net unrealized (loss) arising during the period
|
$
|
(5,576
|
)
|
$
|
2,190
|
|
$
|
(3,386
|
)
|
|||
|
Less: reclassification adjustment for gains realized in net income
|
78
|
|
(28
|
)
|
50
|
|
||||||
|
Net unrealized holding (loss) on AFS securities
|
(5,654
|
)
|
2,218
|
|
(3,436
|
)
|
||||||
|
Net unrealized gain on cash flow hedging derivatives:
|
|
|
|
|
|
|
||||||
|
Net unrealized gain arising during the period
|
1,363
|
|
(547
|
)
|
816
|
|
||||||
|
Less: reclassification adjustment for (losses) realized in net income
|
(1,367
|
)
|
549
|
|
(818
|
)
|
||||||
|
Net unrealized gain on cash flow hedging derivatives
|
2,730
|
|
(1,096
|
)
|
1,634
|
|
||||||
|
Net unrealized holding (loss) on pension plans:
|
|
|
|
|
|
|
||||||
|
Net unrealized (loss) arising during the period
|
—
|
|
—
|
|
—
|
|
||||||
|
Less: reclassification adjustment for gains (losses) realized in net income
|
—
|
|
—
|
|
—
|
|
||||||
|
Net unrealized holding (loss) on pension plans
|
—
|
|
—
|
|
—
|
|
||||||
|
Other comprehensive (loss)
|
$
|
(2,924
|
)
|
$
|
1,122
|
|
$
|
(1,802
|
)
|
|||
|
Three Months Ended September 30, 2015
|
|
|
|
|
|
|
||||||
|
Net unrealized holding gains on AFS securities:
|
|
|
|
|
||||||||
|
Net unrealized gains arising during the period
|
$
|
8,256
|
|
$
|
(3,204
|
)
|
$
|
5,052
|
|
|||
|
Less: reclassification adjustment for gains realized in net income
|
49
|
|
(18
|
)
|
31
|
|
||||||
|
Net unrealized holding gains on AFS securities
|
8,207
|
|
(3,186
|
)
|
5,021
|
|
||||||
|
Net unrealized (loss) on cash flow hedging derivatives:
|
|
|
|
|
||||||||
|
Net unrealized (loss) arising during the period
|
(4,369
|
)
|
1,761
|
|
(2,608
|
)
|
||||||
|
Less: reclassification adjustment for gains (losses) realized in net income
|
—
|
|
—
|
|
—
|
|
||||||
|
Net unrealized (loss) on cash flow hedging derivatives
|
(4,369
|
)
|
1,761
|
|
(2,608
|
)
|
||||||
|
Net unrealized holding gain on pension plans:
|
|
|
|
|
|
|
||||||
|
Net unrealized gain arising during the period
|
—
|
|
—
|
|
—
|
|
||||||
|
Less: reclassification adjustment for (losses) realized in net income
|
(65
|
)
|
26
|
|
(39
|
)
|
||||||
|
Net unrealized holding gain on pension plans
|
65
|
|
(26
|
)
|
39
|
|
||||||
|
Other comprehensive income
|
$
|
3,903
|
|
$
|
(1,451
|
)
|
$
|
2,452
|
|
|||
45
|
(In thousands)
|
Before Tax
|
Tax Effect
|
Net of Tax
|
|||||||||
|
Nine Months Ended September 30, 2016
|
|
|
|
|
|
|
||||||
|
Net unrealized holding gains on AFS securities:
|
|
|
|
|
|
|
||||||
|
Net unrealized gains arising during the period
|
$
|
21,740
|
|
$
|
(8,366
|
)
|
$
|
13,374
|
|
|||
|
Less: reclassification adjustment for gains realized in net income
|
101
|
|
(36
|
)
|
65
|
|
||||||
|
Net unrealized holding gains on AFS securities
|
21,639
|
|
(8,330
|
)
|
13,309
|
|
||||||
|
Net unrealized (loss) on cash flow hedging derivatives:
|
|
|
|
|
|
|
||||||
|
Net unrealized (loss) arising during the period
|
(5,322
|
)
|
2,136
|
|
(3,186
|
)
|
||||||
|
Less: reclassification adjustment for (losses) realized in net income
|
(2,662
|
)
|
1,069
|
|
(1,593
|
)
|
||||||
|
Net unrealized (loss) on cash flow hedging derivatives
|
(2,660
|
)
|
1,067
|
|
(1,593
|
)
|
||||||
|
Net unrealized holding (loss) on pension plans:
|
|
|
|
|
|
|
||||||
|
Net unrealized (loss) arising during the period
|
—
|
|
—
|
|
—
|
|
||||||
|
Less: reclassification adjustment for gains (losses) realized in net income
|
—
|
|
—
|
|
—
|
|
||||||
|
Net unrealized holding (loss) on pension plans
|
—
|
|
—
|
|
—
|
|
||||||
|
Other comprehensive income
|
$
|
18,979
|
|
$
|
(7,263
|
)
|
$
|
11,716
|
|
|||
|
Nine Months Ended September 30, 2015
|
|
|
|
|
|
|
||||||
|
Net unrealized holding gains on AFS securities:
|
|
|
|
|
|
|
||||||
|
Net unrealized gains arising during the period
|
$
|
3,940
|
|
$
|
(1,580
|
)
|
$
|
2,360
|
|
|||
|
Less: reclassification adjustment for gains realized in net income
|
2,466
|
|
(888
|
)
|
1,578
|
|
||||||
|
Net unrealized holding gains on AFS securities
|
1,474
|
|
(692
|
)
|
782
|
|
||||||
|
Net unrealized (loss) on cash flow hedging derivatives:
|
|
|
|
|
|
|
||||||
|
Net unrealized (loss) arising during the period
|
(7,486
|
)
|
3,017
|
|
(4,469
|
)
|
||||||
|
Less: reclassification adjustment for gains (losses) realized in net income
|
—
|
|
—
|
|
—
|
|
||||||
|
Net unrealized (loss) on cash flow hedging derivatives
|
(7,486
|
)
|
3,017
|
|
(4,469
|
)
|
||||||
|
Net unrealized holding (loss) on pension plans:
|
|
|
|
|
|
|
||||||
|
Net unrealized (loss) arising during the period
|
(1,596
|
)
|
643
|
|
(953
|
)
|
||||||
|
Less: reclassification adjustment for gains (losses) realized in net income
|
(194
|
)
|
78
|
|
(116
|
)
|
||||||
|
Net unrealized holding (loss) on pension plans
|
(1,402
|
)
|
565
|
|
(837
|
)
|
||||||
|
Other comprehensive (loss)
|
$
|
(7,414
|
)
|
$
|
2,890
|
|
$
|
(4,524
|
)
|
|||
46
The following table presents the changes in each component of accumulated other comprehensive income (loss), for the
three and nine
months ended
September 30, 2016
and
2015
:
|
(in thousands)
|
Net unrealized
holding gain
on AFS Securities
|
Net loss on
effective cash
flow hedging derivatives
|
Net unrealized
holding loss
on pension plans
|
Total
|
||||||||||||
|
Three Months Ended September 30, 2016
|
|
|
|
|
|
|
|
|
||||||||
|
Balance at Beginning of Period
|
$
|
20,625
|
|
$
|
(8,335
|
)
|
$
|
(2,077
|
)
|
$
|
10,213
|
|
||||
|
Other Comprehensive (Loss) Gain Before reclassifications
|
(3,386
|
)
|
816
|
|
—
|
|
(2,570
|
)
|
||||||||
|
Less: Amounts Reclassified from Accumulated other comprehensive income
|
50
|
|
(818
|
)
|
—
|
|
(768
|
)
|
||||||||
|
Total Other Comprehensive (Loss) Income
|
(3,436
|
)
|
1,634
|
|
—
|
|
(1,802
|
)
|
||||||||
|
Balance at End of Period
|
$
|
17,189
|
|
$
|
(6,701
|
)
|
$
|
(2,077
|
)
|
$
|
8,411
|
|
||||
|
Three Months Ended September 30, 2015
|
|
|
|
|
|
|
|
|
||||||||
|
Balance at Beginning of Period
|
$
|
5,677
|
|
$
|
(3,830
|
)
|
$
|
(2,244
|
)
|
$
|
(397
|
)
|
||||
|
Other Comprehensive Gain (Loss) Before reclassifications
|
5,052
|
|
(2,608
|
)
|
—
|
|
2,444
|
|
||||||||
|
Less: Amounts Reclassified from Accumulated other comprehensive income
|
31
|
|
—
|
|
(39
|
)
|
(8
|
)
|
||||||||
|
Total Other Comprehensive Income (Loss)
|
5,021
|
|
(2,608
|
)
|
39
|
|
2,452
|
|
||||||||
|
Balance at End of Period
|
$
|
10,698
|
|
$
|
(6,438
|
)
|
$
|
(2,205
|
)
|
$
|
2,055
|
|
||||
|
Nine Months Ended September 30, 2016
|
|
|
|
|
|
|
|
|
||||||||
|
Balance at Beginning of Period
|
$
|
3,880
|
|
$
|
(5,108
|
)
|
$
|
(2,077
|
)
|
$
|
(3,305
|
)
|
||||
|
Other Comprehensive Gain (Loss) Before reclassifications
|
13,374
|
|
(3,186
|
)
|
—
|
|
10,188
|
|
||||||||
|
Less: Amounts Reclassified from Accumulated other comprehensive income
|
65
|
|
(1,593
|
)
|
—
|
|
(1,528
|
)
|
||||||||
|
Total Other Comprehensive Income (Loss)
|
13,309
|
|
(1,593
|
)
|
—
|
|
11,716
|
|
||||||||
|
Balance at End of Period
|
$
|
17,189
|
|
$
|
(6,701
|
)
|
$
|
(2,077
|
)
|
$
|
8,411
|
|
||||
|
Nine Months Ended September 30, 2015
|
|
|
|
|
|
|
|
|
||||||||
|
Balance at Beginning of Period
|
$
|
9,916
|
|
$
|
(1,969
|
)
|
$
|
(1,368
|
)
|
$
|
6,579
|
|
||||
|
Other Comprehensive Gain (Loss) Before reclassifications
|
2,360
|
|
(4,469
|
)
|
(953
|
)
|
(3,062
|
)
|
||||||||
|
Less: Amounts Reclassified from Accumulated other comprehensive income
|
1,578
|
|
—
|
|
(116
|
)
|
1,462
|
|
||||||||
|
Total Other Comprehensive Income (Loss)
|
782
|
|
(4,469
|
)
|
(837
|
)
|
(4,524
|
)
|
||||||||
|
Balance at End of Period
|
$
|
10,698
|
|
$
|
(6,438
|
)
|
$
|
(2,205
|
)
|
$
|
2,055
|
|
||||
47
The following table presents the amounts reclassified out of each component of accumulated other comprehensive income (loss) for the
three and nine
months ended
September 30, 2016
and
2015
:
|
|
|
|
Affected Line Item in the
|
|||||||
|
|
Three Months Ended September 30,
|
Statement where Net Income
|
||||||||
|
(in thousands)
|
2016
|
2015
|
is Presented
|
|||||||
|
Realized gains on AFS securities:
|
|
|
|
|
|
|||||
|
|
$
|
78
|
|
$
|
49
|
|
Non-interest income
|
|||
|
|
(28
|
)
|
(18
|
)
|
Tax expense
|
|||||
|
|
50
|
|
31
|
|
Net of tax
|
|||||
|
|
||||||||||
|
Realized (losses) on cash flow hedging derivatives:
|
|
|
|
|
|
|||||
|
|
(1,367
|
)
|
—
|
|
Non-interest income
|
|||||
|
|
549
|
|
—
|
|
Tax expense
|
|||||
|
|
(818
|
)
|
—
|
|
Net of tax
|
|||||
|
Realized (losses) on pension plans:
|
|
|
|
|
|
|||||
|
|
—
|
|
(65
|
)
|
Non-interest income
|
|||||
|
|
—
|
|
26
|
|
Tax expense
|
|||||
|
|
—
|
|
(39
|
)
|
Net of tax
|
|||||
|
Total reclassifications for the period
|
$
|
(768
|
)
|
$
|
(8
|
)
|
Net of tax
|
|||
|
|
|
|
Affected Line Item in the
|
|||||||
|
|
Nine Months Ended September 30,
|
Statement where Net Income
|
||||||||
|
(in thousands)
|
2016
|
2015
|
is Presented
|
|||||||
|
Realized gains on AFS securities:
|
|
|
|
|
|
|||||
|
|
$
|
101
|
|
$
|
2,466
|
|
Non-interest income
|
|||
|
|
(36
|
)
|
(888
|
)
|
Tax expense
|
|||||
|
|
65
|
|
1,578
|
|
Net of tax
|
|||||
|
Realized (losses) on cash flow hedging derivatives:
|
|
|
|
|||||||
|
|
(2,662
|
)
|
—
|
|
Non-interest income
|
|||||
|
|
1,069
|
|
—
|
|
Tax expense
|
|||||
|
|
(1,593
|
)
|
—
|
|
Net of tax
|
|||||
|
Realized (losses) on pension plans:
|
|
|
|
|
|
|||||
|
|
—
|
|
(194
|
)
|
Non-interest income
|
|||||
|
|
—
|
|
78
|
|
Tax expense
|
|||||
|
|
—
|
|
(116
|
)
|
Net of tax
|
|||||
|
Total reclassifications for the period
|
$
|
(1,528
|
)
|
$
|
1,462
|
|
Net of tax
|
|||
48
Earnings per share have been computed based on the following (average diluted shares outstanding are calculated using the treasury stock method):
|
|
Three Months Ended September 30,
|
Nine Months Ended September 30,
|
|||||||||||||
|
(In thousands, except per share data)
|
2016
|
2015
|
2016
|
2015
|
|||||||||||
|
Net income
|
$
|
16,381
|
|
$
|
14,701
|
|
$
|
48,339
|
|
$
|
33,504
|
|
|||
|
Average number of common shares issued
|
32,273
|
|
31,565
|
|
32,216
|
|
29,374
|
|
|||||||
|
Less: average number of treasury shares
|
1,137
|
|
1,201
|
|
1,117
|
|
1,229
|
|
|||||||
|
Less: average number of unvested stock award shares
|
515
|
|
471
|
|
515
|
|
460
|
|
|||||||
|
Average number of basic common shares outstanding
|
30,621
|
|
29,893
|
|
30,584
|
|
27,685
|
|
|||||||
|
Plus: dilutive effect of unvested stock award shares
|
131
|
|
114
|
|
115
|
|
98
|
|
|||||||
|
Plus: dilutive effect of stock options outstanding
|
59
|
|
62
|
|
58
|
|
64
|
|
|||||||
|
Average number of diluted common shares outstanding
|
30,811
|
|
30,069
|
|
30,757
|
|
27,847
|
|
|||||||
|
Earnings per share:
|
|
|
|
|
|
|
|
|
|||||||
|
Basic
|
$
|
0.53
|
|
$
|
0.49
|
|
$
|
1.58
|
|
$
|
1.21
|
|
|||
|
Diluted
|
$
|
0.53
|
|
$
|
0.49
|
|
$
|
1.57
|
|
$
|
1.20
|
|
|||
For the
nine
months ended
September 30, 2016
,
401 thousand
shares of restricted stock and
201 thousand
options were anti-dilutive and therefore excluded from the earnings per share calculations. For the
nine
months ended
September 30, 2015
,
361 thousand
shares of restricted stock and
212 thousand
options were anti-dilutive and therefore excluded from the earnings per share calculations.
A combined summary of activity in the Company’s stock award and stock option plans for the
nine
months ended
September 30, 2016
is presented in the following table:
|
|
Non-Vested Stock Awards Outstanding
|
Stock Options Outstanding
|
|||||||||||||
|
(Shares in thousands)
|
Number of Shares
|
Weighted-Average Grant Date Fair Value
|
Number of Shares
|
Weighted-Average Exercise Price
|
|||||||||||
|
December 31, 2015
|
488
|
|
$
|
25.09
|
|
265
|
|
$
|
21.11
|
|
|||||
|
Granted
|
185
|
|
27.37
|
|
—
|
|
—
|
|
|||||||
|
Stock options exercised
|
—
|
|
—
|
|
(10
|
)
|
14.98
|
|
|||||||
|
Stock awards vested
|
(116
|
)
|
25.15
|
|
—
|
|
—
|
|
|||||||
|
Forfeited
|
(63
|
)
|
25.39
|
|
—
|
|
—
|
|
|||||||
|
Expired
|
—
|
|
—
|
|
(3
|
)
|
34.45
|
|
|||||||
|
September 30, 2016
|
494
|
|
$
|
26.23
|
|
252
|
|
$
|
21.08
|
|
|||||
|
Exercisable options at
|
September 30, 2016
|
251
|
|
$
|
21.15
|
|
|||||||||
During the
nine
months ended
September 30, 2016
and
2015
, proceeds from stock option exercises totaled
$141 thousand
and
$116 thousand
, respectively. During the
nine
months ended
September 30, 2016
, there were
116 thousand
shares issued in connection with vested stock awards. During the
nine
months ended
September 30, 2015
, there were
126 thousand
shares issued in connection with vested stock awards. All of these shares were issued from available treasury stock. Stock-based compensation expense totaled
$3.5 million
and
$3.4 million
during the
nine
months ended
September 30, 2016
and
2015
, respectively. Stock-based compensation expense is recognized over the requisite service period for all awards.
49
As of
September 30, 2016
, the Company held derivatives with a total notional amount of
$1.9 billion
. That amount included
$300.0 million
in interest rate swap derivatives that were designated as cash flow hedges for accounting purposes. The Company also had economic hedges and non-hedging derivatives totaling
$1.5 billion
and
$83.8 million
, respectively, which are not designated as hedges for accounting purposes and are therefore recorded at fair value. Economic hedges included interest rate swaps totaling
$1.3 billion
, risk participation agreements with dealer banks of
$77.9 million
, and
$95.0 million
in forward commitment contracts.
As part of the Company’s risk management strategy, the Company enters into interest rate swap agreements to mitigate the interest rate risk inherent in certain of the Company’s assets and liabilities. Interest rate swap agreements involve the risk of dealing with both Bank customers and institutional derivative counterparties and their ability to meet contractual terms. The agreements are entered into with counterparties that meet established credit standards and contain master netting and collateral provisions protecting the at-risk party. The derivatives program is overseen by the Risk Management/Capital Committee of the Company’s Board of Directors. Based on adherence to the Company’s credit standards and the presence of the netting and collateral provisions, the Company believes that the credit risk inherent in these contracts was not significant at
September 30, 2016
.
The Company pledged collateral to derivative counterparties in the form of cash totaling
$650 thousand
and securities with an amortized cost of
$59.2 million
and a fair value of
$61.3 million
as of
September 30, 2016
. The Company does not typically require its commercial customers to post cash or securities as collateral on its program of back-to-back economic hedges. However certain language is written into the International Swaps Dealers Association, Inc. (“ISDA”) and loan documents where, in default situations, the Bank is allowed to access collateral supporting the loan relationship to recover any losses suffered on the derivative asset or liability. The Company may need to post additional collateral in the future in proportion to potential increases in unrealized loss positions.
Information about derivative assets and liabilities at
September 30, 2016
, follows:
|
|
|
Weighted
|
Weighted Average Rate
|
Estimated
|
|||||||||||
|
|
Notional
|
Average
|
|
Contract
|
Fair Value
|
||||||||||
|
|
Amount
|
Maturity
|
Received
|
pay rate
|
Asset (Liability)
|
||||||||||
|
|
(In thousands)
|
(In years)
|
|
|
(In thousands)
|
||||||||||
|
Cash flow hedges:
|
|
|
|
|
|
|
|
|
|
||||||
|
Interest rate swaps on FHLBB borrowings
|
$
|
300,000
|
|
2.5
|
0.52
|
%
|
2.29
|
%
|
$
|
(11,191
|
)
|
||||
|
Total cash flow hedges
|
300,000
|
|
|
|
|
|
|
(11,191
|
)
|
||||||
|
Economic hedges:
|
|
|
|
|
|
|
|
|
|
||||||
|
Interest rate swap on tax advantaged economic development bond
|
11,540
|
|
13.2
|
0.89
|
%
|
5.09
|
%
|
(2,869
|
)
|
||||||
|
Interest rate swaps on loans with commercial loan customers
|
642,399
|
|
6.4
|
2.27
|
%
|
4.23
|
%
|
(36,055
|
)
|
||||||
|
Reverse interest rate swaps on loans with commercial loan customers
|
642,399
|
|
6.4
|
4.23
|
%
|
2.27
|
%
|
35,546
|
|
||||||
|
Risk Participation Agreements with Dealer Banks
|
77,887
|
|
12.2
|
|
|
|
|
47
|
|
||||||
|
Forward sale commitments
|
95,042
|
|
0.2
|
|
|
|
|
(582
|
)
|
||||||
|
Total economic hedges
|
1,469,267
|
|
|
|
|
|
|
(3,913
|
)
|
||||||
|
Non-hedging derivatives:
|
|
|
|
|
|
|
|
|
|
||||||
|
Interest rate lock commitments
|
83,765
|
|
0.2
|
|
|
|
|
1,574
|
|
||||||
|
Total non-hedging derivatives
|
83,765
|
|
|
|
|
|
|
1,574
|
|
||||||
|
Total
|
$
|
1,853,032
|
|
|
|
|
|
|
$
|
(13,530
|
)
|
||||
50
Information about derivative assets and liabilities at
December 31, 2015
, follows:
|
|
|
Weighted
|
Weighted Average Rate
|
Estimated
|
|||||||||||
|
|
Notional
|
Average
|
|
Contract
|
Fair Value
|
||||||||||
|
|
Amount
|
Maturity
|
Received
|
pay rate
|
Asset (Liability)
|
||||||||||
|
|
(In thousands)
|
(In years)
|
|
|
(In thousands)
|
||||||||||
|
Cash flow hedges:
|
|
|
|
|
|
|
|
|
|
||||||
|
Forward-starting interest rate swaps on FHLBB borrowings
|
$
|
300,000
|
|
3.3
|
0.14
|
%
|
2.29
|
%
|
$
|
(8,532
|
)
|
||||
|
Total cash flow hedges
|
300,000
|
|
|
|
|
|
|
(8,532
|
)
|
||||||
|
Economic hedges:
|
|
|
|
|
|
|
|
|
|
||||||
|
Interest rate swap on tax advantaged economic development bond
|
11,984
|
|
13.9
|
0.61
|
%
|
5.09
|
%
|
(2,450
|
)
|
||||||
|
Interest rate swaps on loans with commercial loan customers
|
457,392
|
|
6.7
|
2.18
|
%
|
4.49
|
%
|
(17,143
|
)
|
||||||
|
Reverse interest rate swaps on loans with commercial loan customers
|
457,392
|
|
6.7
|
4.49
|
%
|
2.18
|
%
|
17,129
|
|
||||||
|
Risk participation agreements with dealer banks
|
59,016
|
|
15.0
|
|
|
|
|
(56
|
)
|
||||||
|
Forward sale commitments
|
44,840
|
|
0.2
|
|
|
|
|
53
|
|
||||||
|
Total economic hedges
|
1,030,624
|
|
|
|
|
|
|
(2,467
|
)
|
||||||
|
Non-hedging derivatives:
|
|
|
|
|
|
|
|
|
|
||||||
|
Interest rate lock commitments
|
36,043
|
|
0.2
|
|
|
|
|
323
|
|
||||||
|
Total non-hedging derivatives
|
36,043
|
|
|
|
|
|
|
323
|
|
||||||
|
Total
|
$
|
1,366,667
|
|
|
|
|
|
|
$
|
(10,676
|
)
|
||||
51
Cash flow hedges
The effective portion of unrealized changes in the fair value of derivatives accounted for as cash flow hedges is reported in other comprehensive income and subsequently reclassified to earnings in the same period or periods during which the hedged transaction is forecasted to affect earnings. Each quarter, the Company assesses the effectiveness of each hedging relationship by comparing the changes in cash flows of the derivative hedging instrument with the changes in cash flows of the designated hedged item or transaction. The ineffective portion of changes in the fair value of the derivatives is recognized directly in earnings.
The Company has entered into
six
interest rate swap contracts with an aggregate notional value of
$300 million
as of
September 30, 2016
. All have durations of
three
years. This hedge strategy converts the
one
month rolling FHLBB borrowings based on the FHLBB’s
one
month fixed interest rate to fixed interest rates, thereby protecting the Company from floating interest rate variability.
Amounts included in the Consolidated Statements of Income and in the other comprehensive income section of the Consolidated Statements of Comprehensive Income (related to interest rate derivatives designated as hedges of cash flows), were as follows:
|
|
Three Months Ended September 30,
|
Nine Months Ended September 30,
|
|||||||||||||
|
(In thousands)
|
2016
|
2015
|
2016
|
2015
|
|||||||||||
|
Interest rate swaps on FHLBB borrowings:
|
|
|
|
|
|
|
|
|
|||||||
|
Unrealized gain (loss) recognized in accumulated other comprehensive loss
|
$
|
1,363
|
|
$
|
(4,369
|
)
|
$
|
(5,322
|
)
|
$
|
(7,486
|
)
|
|||
|
Less: Reclassification of unrealized (loss) from accumulated other comprehensive income to interest expense
|
(1,367
|
)
|
—
|
|
(2,662
|
)
|
—
|
|
|||||||
|
Net tax effect on items recognized in accumulated other comprehensive income
|
(1,096
|
)
|
1,761
|
|
1,067
|
|
3,017
|
|
|||||||
|
Other comprehensive gain (loss) recorded in accumulated other comprehensive income, net of reclassification adjustments and tax effects
|
$
|
1,634
|
|
$
|
(2,608
|
)
|
$
|
(1,593
|
)
|
$
|
(4,469
|
)
|
|||
|
Net interest expense recognized in interest expense on hedged FHLBB borrowings
|
$
|
1,367
|
|
$
|
—
|
|
$
|
2,662
|
|
$
|
—
|
|
|||
Hedge ineffectiveness on interest rate swaps designated as cash flow hedges was immaterial to the Company’s financial statements during the
three and nine
months ended
September 30, 2016
and
2015
.
Amounts reported in accumulated other comprehensive income related to derivatives will be reclassified to interest expense as interest payments are made on the Company’s variable-rate liabilities. During the next twelve months, the Company anticipates reclassification of approximately
$4.9 million
.
52
Economic hedges
As of
September 30, 2016
, the Company has an interest rate swap with a
$11.5 million
notional amount to swap out the fixed rate of interest on an economic development bond bearing a fixed rate of
5.09%
, currently within the Company’s trading portfolio under the fair value option, in exchange for a LIBOR-based floating rate. The intent of the economic hedge is to improve the Company’s asset sensitivity to changing interest rates in anticipation of favorable average floating rates of interest over the
21
-year life of the bond. The fair value changes of the economic development bond are mostly offset by fair value changes of the related interest rate swap.
The Company also offers certain derivative products directly to qualified commercial borrowers. The Company economically hedges derivative transactions executed with commercial borrowers by entering into mirror-image, offsetting derivatives with third-party financial institutions. The transaction allows the Company’s customer to convert a variable-rate loan to a fixed rate loan. Because the Company acts as an intermediary for its customer, changes in the fair value of the underlying derivative contracts mostly offset each other in earnings. Credit valuation adjustments arising from the difference in credit worthiness of the commercial loan and financial institution counterparties totaled
$(62) thousand
as of
September 30, 2016
. The interest income and expense on these mirror image swaps exactly offset each other.
The Company has risk participation agreements with dealer banks. Risk participation agreements occur when the Company participates on a loan and a swap where another bank is the lead. The Company gets paid a fee to take on the risk associated with having to make the lead bank whole on Berkshire’s portion of the pro-rated swap should the borrower default. Changes in fair value are recorded in current period earnings.
The Company utilizes forward sale commitments to hedge interest rate risk and the associated effects on the fair value of interest rate lock commitments and loans originated for sale. The forward sale commitments are accounted for as derivatives with changes in fair value recorded in current period earnings.
The Company uses the following types of forward sale commitments contracts:
|
•
|
Best efforts loan sales,
|
|
•
|
Mandatory delivery loan sales, and
|
|
•
|
To Be Announced (“TBA”) mortgage-backed securities sales.
|
A best efforts contract refers to a loan sale agreement where the Company commits to deliver an individual mortgage loan of a specified principal amount and quality to an investor if the loan to the underlying borrower closes. The Company may enter into a best efforts contract once the price is known, which is shortly after the potential borrower’s interest rate is locked.
A mandatory delivery contract is a loan sale agreement where the Company commits to deliver a certain principal amount of mortgage loans to an investor at a specified price on or before a specified date. Generally, the Company may enter into mandatory delivery contracts shortly after the loan closes with a customer.
The Company may sell TBA mortgage-backed securities to hedge the changes in fair value of interest rate lock commitments and held for sale loans, which do not have corresponding best efforts or mandatory delivery contracts. These security sales transactions are closed once mandatory contracts are written. On the closing date the price of the security is locked-in, and the sale is paired-off with a purchase of the same security. Settlement of the security purchase/sale transaction is done with cash on a net-basis.
53
Non-hedging derivatives
The Company enters into interest rate lock commitments (“IRLCs”) for residential mortgage loans, which commit the Company to lend funds to a potential borrower at a specific interest rate and within a specified period of time. IRLCs that relate to the origination of mortgage loans that will be held for sale are considered derivative financial instruments under applicable accounting guidance. Outstanding IRLCs expose the Company to the risk that the price of the mortgage loans underlying the commitments may decline due to increases in mortgage interest rates from inception of the rate lock to the funding of the loan. The IRLCs are free-standing derivatives which are carried at fair value with changes recorded in noninterest income in the Company’s consolidated statements of income. Changes in the fair value of IRLCs subsequent to inception are based on changes in the fair value of the underlying loan resulting from the fulfillment of the commitment and changes in the probability that the loan will fund within the terms of the commitment, which is affected primarily by changes in interest rates and the passage of time.
Amounts included in the Consolidated Statements of Income related to economic hedges and non-hedging derivatives were as
follows:
|
|
Three Months Ended September 30,
|
Nine Months Ended September 30,
|
|||||||||||||
|
(In thousands)
|
2016
|
2015
|
2016
|
2015
|
|||||||||||
|
Economic hedges
|
|
|
|
|
|
|
|
|
|||||||
|
Interest rate swap on industrial revenue bond:
|
|
|
|
|
|
|
|
|
|||||||
|
Unrealized gain (loss) recognized in other non-interest income
|
$
|
29
|
|
$
|
(493
|
)
|
$
|
(802
|
)
|
$
|
(433
|
)
|
|||
|
Interest rate swaps on loans with commercial loan customers:
|
|
|
|
|
|
|
|
|
|||||||
|
Unrealized gain (loss) recognized in other non-interest income
|
2,411
|
|
(7,698
|
)
|
(18,911
|
)
|
(6,923
|
)
|
|||||||
|
Reverse interest rate swaps on loans with commercial loan customers:
|
|
|
|
|
|
|
|
|
|||||||
|
Unrealized gain (loss) recognized in other non-interest income
|
(2,411
|
)
|
7,698
|
|
18,911
|
|
6,923
|
|
|||||||
|
(Unfavorable) Favorable change in credit valuation adjustment recognized in other non-interest income
|
(62
|
)
|
52
|
|
(495
|
)
|
109
|
|
|||||||
|
Risk Participation Agreements:
|
|
|
|
|
|
|
|
|
|||||||
|
Unrealized (loss) gain recognized in other non-interest income
|
(14
|
)
|
(65
|
)
|
102
|
|
(42
|
)
|
|||||||
|
Forward Commitments:
|
|
|
|
|
|
|
|
|
|||||||
|
Unrealized (loss) gain recognized in other non-interest income
|
(582
|
)
|
(387
|
)
|
(1,898
|
)
|
(300
|
)
|
|||||||
|
Realized gain (loss) in other non-interest income
|
109
|
|
(493
|
)
|
(224
|
)
|
(80
|
)
|
|||||||
|
Non-hedging derivatives
|
|
|
|
|
|
|
|
|
|||||||
|
Interest rate lock commitments
|
|
|
|
|
|
|
|
|
|||||||
|
Unrealized gain recognized in other non-interest income
|
$
|
1,574
|
|
$
|
754
|
|
$
|
3,635
|
|
$
|
2,113
|
|
|||
|
Realized gain in other non-interest income
|
760
|
|
819
|
|
2,505
|
|
1,760
|
|
|||||||
54
Assets and Liabilities Subject to Enforceable Master Netting Arrangements
Interest Rate Swap Agreements (“Swap Agreements”)
The Company enters into swap agreements to facilitate the risk management strategies for commercial banking customers. The Company mitigates this risk by entering into equal and offsetting swap agreements with highly rated third party financial institutions. The swap agreements are free-standing derivatives and are recorded at fair value in the Company’s consolidated statements of condition. The Company is party to master netting arrangements with its financial institution counterparties; however, the Company does not offset assets and liabilities under these arrangements for financial statement presentation purposes. The master netting arrangements provide for a single net settlement of all swap agreements, as well as collateral, in the event of default on, or termination of, any one contract. Collateral generally in the form of marketable securities is received or posted by the counterparty with net liability positions, respectively, in accordance with contract thresholds.
The Company had net asset positions with its commercial banking counterparties totaling
$35.5 million
and
$17.1 million
as of
September 30, 2016
and
December 31, 2015
, respectively. The Company had net liability positions with its financial institution counterparties totaling
$49.5 million
and
$28.2 million
as of
September 30, 2016
and
December 31, 2015
, respectively. At
September 30, 2016
, the Company did not have a net liability position with its commercial banking counterparties. The collateral posted by the Company that covered liability positions was
$49.6 million
and
$28.2 million
as of
September 30, 2016
and
December 31, 2015
, respectively.
The following table presents the assets and liabilities subject to an enforceable master netting arrangement as of
September 30, 2016
and
December 31, 2015
:
Offsetting of Financial Assets and Derivative Assets
|
Gross
Amounts of
|
Gross Amounts
Offset in the
|
Net Amounts
of Assets
Presented in the
|
Gross Amounts Not Offset in
the Statements of Condition
|
|||||||||||||||||||||
|
|
Recognized
|
Statements of
|
Statements of
|
Financial
|
Cash
|
|
||||||||||||||||||
|
(in thousands)
|
Assets
|
Condition
|
Condition
|
Instruments
|
Collateral Received
|
Net Amount
|
||||||||||||||||||
|
September 30, 2016
|
|
|
|
|
|
|
|
|
|
|
|
|
||||||||||||
|
Interest Rate Swap Agreements:
|
|
|
|
|
|
|
|
|
|
|
|
|
||||||||||||
|
Institutional counterparties
|
$
|
118
|
|
$
|
—
|
|
$
|
118
|
|
$
|
—
|
|
$
|
—
|
|
$
|
118
|
|
||||||
|
Commercial counterparties
|
35,546
|
|
—
|
|
35,546
|
|
—
|
|
—
|
|
35,546
|
|
||||||||||||
|
Total
|
$
|
35,664
|
|
$
|
—
|
|
$
|
35,664
|
|
$
|
—
|
|
$
|
—
|
|
$
|
35,664
|
|
||||||
Offsetting of Financial Liabilities and Derivative Liabilities
|
Gross
Amounts of
|
Gross Amounts
Offset in the
|
Net Amounts
of Liabilities
Presented in the
|
Gross Amounts Not Offset in
the Statements of Condition
|
|||||||||||||||||||||
|
|
Recognized
|
Statements of
|
Statements of
|
Financial
|
Cash
|
|
||||||||||||||||||
|
(in thousands)
|
Liabilities
|
Condition
|
Condition
|
Instruments
|
Collateral Pledged
|
Net Amount
|
||||||||||||||||||
|
September 30, 2016
|
|
|
|
|
|
|
|
|
|
|
|
|
||||||||||||
|
Interest Rate Swap Agreements:
|
|
|
|
|
|
|
|
|
|
|
|
|
||||||||||||
|
Institutional counterparties
|
$
|
(49,570
|
)
|
$
|
42
|
|
$
|
(49,528
|
)
|
$
|
48,878
|
|
$
|
650
|
|
$
|
—
|
|
||||||
|
Commercial counterparties
|
—
|
|
—
|
|
—
|
|
—
|
|
—
|
|
—
|
|
||||||||||||
|
Total
|
$
|
(49,570
|
)
|
$
|
42
|
|
$
|
(49,528
|
)
|
$
|
48,878
|
|
$
|
650
|
|
$
|
—
|
|
||||||
55
Offsetting of Financial Assets and Derivative Assets
|
Gross
Amounts of
|
Gross Amounts
Offset in the
|
Net Amounts
of Assets
Presented in the
|
Gross Amounts Not Offset in
the Statements of Condition
|
|||||||||||||||||||||
|
|
Recognized
|
Statements of
|
Statements of
|
Financial
|
Cash
|
|
||||||||||||||||||
|
(in thousands)
|
Assets
|
Condition
|
Condition
|
Instruments
|
Collateral Received
|
Net Amount
|
||||||||||||||||||
|
December 31, 2015
|
|
|
|
|
|
|
|
|
|
|
|
|
||||||||||||
|
Interest Rate Swap Agreements:
|
|
|
|
|
|
|
|
|
|
|
|
|
||||||||||||
|
Institutional counterparties
|
$
|
40
|
|
$
|
—
|
|
$
|
40
|
|
$
|
—
|
|
$
|
—
|
|
$
|
40
|
|
||||||
|
Commercial counterparties
|
17,129
|
|
—
|
|
17,129
|
|
—
|
|
—
|
|
17,129
|
|
||||||||||||
|
Total
|
$
|
17,169
|
|
$
|
—
|
|
$
|
17,169
|
|
$
|
—
|
|
$
|
—
|
|
$
|
17,169
|
|
||||||
Offsetting of Financial Liabilities and Derivative Liabilities
|
Gross
Amounts of
|
Gross Amounts
Offset in the
|
Net Amounts
of Liabilities
Presented in the
|
Gross Amounts Not Offset in
the Statements of Condition
|
|||||||||||||||||||||
|
|
Recognized
|
Statements of
|
Statements of
|
Financial
|
Cash
|
|
||||||||||||||||||
|
(in thousands)
|
Liabilities
|
Condition
|
Condition
|
Instruments
|
Collateral Pledged
|
Net Amount
|
||||||||||||||||||
|
December 31, 2015
|
|
|
|
|
|
|
|
|
|
|
|
|
||||||||||||
|
Interest Rate Swap Agreements:
|
|
|
|
|
|
|
|
|
|
|
|
|
||||||||||||
|
Institutional counterparties
|
$
|
(28,220
|
)
|
$
|
—
|
|
$
|
(28,220
|
)
|
$
|
18,500
|
|
$
|
9,720
|
|
$
|
—
|
|
||||||
|
Commercial counterparties
|
—
|
|
—
|
|
—
|
|
—
|
|
—
|
|
—
|
|
||||||||||||
|
Total
|
$
|
(28,220
|
)
|
$
|
—
|
|
$
|
(28,220
|
)
|
$
|
18,500
|
|
$
|
9,720
|
|
$
|
—
|
|
||||||
56
A description of the valuation methodologies used for assets and liabilities measured at fair value, as well as the general classification of such instruments pursuant to the valuation hierarchy, is set forth below. These valuation methodologies were applied to all of the Company’s financial assets and financial liabilities that are carried at fair value.
Recurring Fair Value Measurements
The following table summarizes financial assets and financial liabilities measured at fair value on a recurring basis as of
September 30, 2016
and
December 31, 2015
, segregated by the level of the valuation inputs within the fair value hierarchy utilized to measure fair value.
|
|
September 30, 2016
|
||||||||||||||
|
|
Level 1
|
Level 2
|
Level 3
|
Total
|
|||||||||||
|
(In thousands)
|
Inputs
|
Inputs
|
Inputs
|
Fair Value
|
|||||||||||
|
Trading security
|
$
|
—
|
|
$
|
—
|
|
$
|
14,149
|
|
$
|
14,149
|
|
|||
|
Available-for-sale securities:
|
|
|
|
|
|
|
|
|
|||||||
|
Municipal bonds and obligations
|
—
|
|
121,126
|
|
—
|
|
121,126
|
|
|||||||
|
Agency collateralized mortgage obligations
|
—
|
|
541,997
|
|
—
|
|
541,997
|
|
|||||||
|
Agency residential mortgage-backed securities
|
—
|
|
104,670
|
|
—
|
|
104,670
|
|
|||||||
|
Agency commercial mortgage-backed securities
|
—
|
|
62,300
|
|
—
|
|
62,300
|
|
|||||||
|
Corporate bonds
|
—
|
|
46,522
|
|
—
|
|
46,522
|
|
|||||||
|
Trust preferred securities
|
—
|
|
11,801
|
|
—
|
|
11,801
|
|
|||||||
|
Other bonds and obligations
|
—
|
|
3,200
|
|
—
|
|
3,200
|
|
|||||||
|
Marketable equity securities
|
53,602
|
|
1,635
|
|
—
|
|
55,237
|
|
|||||||
|
Loans held for sale
|
—
|
|
20,471
|
|
—
|
|
20,471
|
|
|||||||
|
Derivative assets
|
|
|
35,546
|
|
1,574
|
|
37,120
|
|
|||||||
|
Derivative liabilities
|
331
|
|
50,068
|
|
251
|
|
50,650
|
|
|||||||
|
|
December 31, 2015
|
||||||||||||||
|
|
Level 1
|
Level 2
|
Level 3
|
Total
|
|||||||||||
|
(In thousands)
|
Inputs
|
Inputs
|
Inputs
|
Fair Value
|
|||||||||||
|
Trading security
|
$
|
—
|
|
$
|
—
|
|
$
|
14,189
|
|
$
|
14,189
|
|
|||
|
Available-for-sale securities:
|
|
|
|
|
|
|
|
|
|||||||
|
Municipal bonds and obligations
|
—
|
|
104,561
|
|
—
|
|
104,561
|
|
|||||||
|
Agency collateralized mortgage obligations
|
—
|
|
833,036
|
|
—
|
|
833,036
|
|
|||||||
|
Agency residential mortgage-backed securities
|
—
|
|
126,829
|
|
—
|
|
126,829
|
|
|||||||
|
Agency commercial mortgage-backed securities
|
—
|
|
—
|
|
—
|
|
—
|
|
|||||||
|
Corporate bonds
|
—
|
|
41,023
|
|
—
|
|
41,023
|
|
|||||||
|
Trust preferred securities
|
—
|
|
11,900
|
|
—
|
|
11,900
|
|
|||||||
|
Other bonds and obligations
|
—
|
|
3,141
|
|
—
|
|
3,141
|
|
|||||||
|
Marketable equity securities
|
32,925
|
|
334
|
|
708
|
|
33,967
|
|
|||||||
|
Loans Held for Sale
|
—
|
|
13,191
|
|
—
|
|
13,191
|
|
|||||||
|
Derivative assets
|
45
|
|
17,130
|
|
332
|
|
17,507
|
|
|||||||
|
Derivative liabilities
|
—
|
|
28,181
|
|
—
|
|
28,181
|
|
|||||||
57
There were no transfers between levels during the three months ended
September 30, 2016
or
2015
.
During the
nine months ended
September 30, 2016
, the Company had
one
transfer of
$708 thousand
in marketable equity securities from Level 3 to Level 2 based on a change in valuation technique driven by the availability of market data. There were
no
transfers between levels during the
nine months ended
September 30, 2015
.
Trading Security at Fair Value.
The Company holds
one
security designated as a trading security. It is a tax advantaged economic development bond issued to the Company by a local nonprofit which provides wellness and health programs. The determination of the fair value for this security is determined based on a discounted cash flow methodology. Certain inputs to the fair value calculation are unobservable and there is little to no market activity in the security; therefore, the security meets the definition of a Level 3 security. The discount rate used in the valuation of the security is sensitive to movements in the 3-month LIBOR rate.
Securities Available for Sale
.
AFS securities classified as Level 1 consist of publicly-traded equity securities for which the fair values can be obtained through quoted market prices in active exchange markets. AFS securities classified as Level 2 include most of the Company’s debt securities. The pricing on Level 2 was primarily sourced from third party pricing services, overseen by management, and is based on models that consider standard input factors such as dealer quotes, market spreads, cash flows, the U.S. Treasury yield curve, live trading levels, trade execution data, market consensus prepayment speeds, credit information and the bond’s terms and condition, among other things.
Loans held for sale.
The Company elected the fair value option for all loans held for sale (HFS) originated for sale on or after May 1, 2012. Loans HFS are classified as Level 2 as the fair value is based on input factors such as quoted prices for similar loans in active markets.
|
|
|
|
Aggregate Fair Value
|
|||||||||
|
September 30, 2016
|
Aggregate
|
Aggregate
|
Less Aggregate
|
|||||||||
|
(In thousands)
|
Fair Value
|
Unpaid Principal
|
Unpaid Principal
|
|||||||||
|
Loans Held for Sale
|
$
|
20,471
|
|
$
|
19,796
|
|
$
|
675
|
|
|||
|
|
|
|
Aggregate Fair Value
|
|||||||||
|
December 31, 2015
|
Aggregate
|
Aggregate
|
Less Aggregate
|
|||||||||
|
(In thousands)
|
Fair Value
|
Unpaid Principal
|
Unpaid Principal
|
|||||||||
|
Loans Held for Sale
|
$
|
13,191
|
|
$
|
12,914
|
|
$
|
277
|
|
|||
The changes in fair value of loans held for sale for the
three and nine
months ended
September 30, 2016
, were losses of
$216 thousand
and gains of
$398 thousand
, respectively. The changes in fair value of loans held for sale for the
three and nine
months ended
September 30, 2015
, were losses of
$44 thousand
and
$115 thousand
, respectively. The changes in fair value are included in mortgage banking income in the Consolidated Statements of Income.
58
Derivative Assets and Liabilities
Interest Rate Swap.
The valuation of the Company’s interest rate swaps is obtained from a third-party pricing service and is determined using a discounted cash flow analysis on the expected cash flows of each derivative. The pricing analysis is based on observable inputs for the contractual terms of the derivatives, including the period to maturity and interest rate curves.
The Company incorporates credit valuation adjustments to appropriately reflect both its own nonperformance risk and the respective counterparty’s nonperformance risk in the fair value measurements. In adjusting the fair value of its derivative contracts for the effect of nonperformance risk, the Company has considered the impact of netting and any applicable credit enhancements, such as collateral postings.
Although the Company has determined that the majority of the inputs used to value its interest rate derivatives fall within Level 2 of the fair value hierarchy, the credit valuation adjustments associated with its derivatives utilize Level 3 inputs, such as estimates of current credit spreads to evaluate the likelihood of default by itself and its counterparties. However, as of
September 30, 2016
, the Company has assessed the significance of the impact of the credit valuation adjustments on the overall valuation of its derivative positions and has determined that the credit valuation adjustments are not significant to the overall valuation of its derivatives. As a result, the Company has determined that its derivative valuations in their entirety are classified in Level 2 of the fair value hierarchy.
Interest Rate Lock Commitments.
The Company enters into IRLCs for residential mortgage loans, which commit the Company to lend funds to a potential borrower at a specific interest rate and within a specified period of time. The estimated fair value of commitments to originate residential mortgage loans for sale is based on quoted prices for similar loans in active markets. However, this value is adjusted by a factor which considers the likelihood that the loan in a lock position will ultimately close, and by the non-refundable costs of originating the loan. The closing ratio is derived from the Bank’s internal data and is adjusted using significant management judgment. The costs to originate are primarily based on the Company’s internal commission rates that are not observable. As such, IRLCs are classified as Level 3 measurements.
Forward Sale Commitments
. The Company utilizes forward sale commitments as economic hedges against potential changes in the values of the IRLCs and loans originated for sale. To Be Announced (“TBA”) mortgage-backed securities forward commitment sales are used as the hedging instrument, are classified as Level 1, and consist of publicly-traded debt securities for which identical fair values can be obtained through quoted market prices in active exchange markets. The fair values of the Company’s best efforts and mandatory delivery loan sale commitments are determined similarly to the IRLCs using quoted prices in the market place that are observable. However, costs to originate and closing ratios included in the calculation are internally generated and are based on management’s judgment and prior experience, which are considered factors that are not observable. As such, best efforts and mandatory forward commitments are classified as Level 3 measurements.
59
The table below presents the changes in Level 3 assets and liabilities that were measured at fair value on a recurring basis for the
three and nine
months ended
September 30, 2016
and
2015
.
|
|
Assets (Liabilities)
|
||||||||||||||
|
|
|
Securities
|
Interest Rate
|
|
|||||||||||
|
|
Trading
|
Available
|
Lock
|
Forward
|
|||||||||||
|
(In thousands)
|
Security
|
for Sale
|
Commitments
|
Commitments
|
|||||||||||
|
Three Months Ended September 30, 2016
|
|
|
|
|
|
|
|
|
|||||||
|
June 30, 2016
|
$
|
14,479
|
|
$
|
—
|
|
$
|
1,259
|
|
$
|
(189
|
)
|
|||
|
Unrealized (loss) gain, net recognized in other non-interest income
|
(180
|
)
|
—
|
|
3,563
|
|
(62
|
)
|
|||||||
|
Paydown of trading security
|
(150
|
)
|
—
|
|
—
|
|
—
|
|
|||||||
|
Transfers to held for sale loans
|
—
|
|
—
|
|
(3,248
|
)
|
—
|
|
|||||||
|
September 30, 2016
|
$
|
14,149
|
|
$
|
—
|
|
$
|
1,574
|
|
$
|
(251
|
)
|
|||
|
Nine Months Ended September 30, 2016
|
|
|
|
|
|
|
|
|
|||||||
|
December 31, 2015
|
$
|
14,189
|
|
$
|
708
|
|
$
|
323
|
|
$
|
9
|
|
|||
|
Unrealized gain, net recognized in other non-interest income
|
405
|
|
—
|
|
6,480
|
|
(260
|
)
|
|||||||
|
Transfers to Level 2
|
—
|
|
(708
|
)
|
—
|
|
—
|
|
|||||||
|
Paydown of trading security
|
(445
|
)
|
—
|
|
—
|
|
—
|
|
|||||||
|
Transfers to held for sale loans
|
—
|
|
—
|
|
(5,229
|
)
|
—
|
|
|||||||
|
September 30, 2016
|
$
|
14,149
|
|
$
|
—
|
|
$
|
1,574
|
|
$
|
(251
|
)
|
|||
|
Unrealized gains (losses) relating to instruments still held at September 30, 2016
|
$
|
2,610
|
|
$
|
—
|
|
$
|
1,574
|
|
$
|
(251
|
)
|
|||
60
|
|
Assets (Liabilities)
|
||||||||||||||
|
|
|
Securities
|
Interest Rate
|
|
|||||||||||
|
|
Trading
|
Available
|
Lock
|
Forward
|
|||||||||||
|
(In thousands)
|
Security
|
for Sale
|
Commitments
|
Commitments
|
|||||||||||
|
Three Months Ended September 30, 2015
|
|
|
|
|
|
|
|
|
|||||||
|
June 30, 2015
|
$
|
14,378
|
|
$
|
773
|
|
$
|
382
|
|
$
|
50
|
|
|||
|
Sale of Marketable Equity Security
|
—
|
|
—
|
|
—
|
|
—
|
|
|||||||
|
Unrealized gain (loss), net recognized in other non-interest income
|
351
|
|
—
|
|
1,366
|
|
(72
|
)
|
|||||||
|
Unrealized loss included in accumulated other comprehensive loss
|
—
|
|
(9
|
)
|
—
|
|
—
|
|
|||||||
|
Paydown of trading account security
|
(142
|
)
|
—
|
|
—
|
|
—
|
|
|||||||
|
Transfers to held for sale loans
|
—
|
|
—
|
|
(994
|
)
|
—
|
|
|||||||
|
September 30, 2015
|
$
|
14,587
|
|
$
|
764
|
|
$
|
754
|
|
$
|
(22
|
)
|
|||
|
Nine Months Ended September 30, 2015
|
|
|
|
|
|
|
|
|
|||||||
|
December 31, 2014
|
$
|
14,909
|
|
$
|
2,326
|
|
$
|
625
|
|
$
|
(93
|
)
|
|||
|
Sale of Marketable Equity Security
|
—
|
|
(1,327
|
)
|
—
|
|
—
|
|
|||||||
|
Unrealized gain, net recognized in other non-interest income
|
103
|
|
—
|
|
4,037
|
|
71
|
|
|||||||
|
Unrealized loss included in accumulated other comprehensive loss
|
—
|
|
(235
|
)
|
—
|
|
—
|
|
|||||||
|
Paydown of trading account security
|
(425
|
)
|
—
|
|
—
|
|
—
|
|
|||||||
|
Transfers to held for sale loans
|
—
|
|
—
|
|
(3,908
|
)
|
—
|
|
|||||||
|
September 30, 2015
|
$
|
14,587
|
|
$
|
764
|
|
$
|
754
|
|
$
|
(22
|
)
|
|||
|
Unrealized gains (losses) relating to instruments still held at September 30, 2015
|
$
|
2,457
|
|
$
|
(6
|
)
|
$
|
754
|
|
$
|
(22
|
)
|
|||
61
Quantitative information about the significant unobservable inputs within Level 3 recurring assets and liabilities is as follows:
|
|
Fair Value
|
|
|
Significant
Unobservable Input
|
||||||||
|
(In thousands)
|
September 30, 2016
|
Valuation Techniques
|
Unobservable Inputs
|
Value
|
||||||||
|
Assets (Liabilities)
|
|
|
|
|
|
|
||||||
|
Trading Security
|
$
|
14,149
|
|
Discounted Cash Flow
|
Discount Rate
|
1.80
|
%
|
|||||
|
Forward Commitments
|
(251
|
)
|
Historical Trend
|
Closing Ratio
|
93.97
|
%
|
||||||
|
|
|
|
Pricing Model
|
Origination Costs, per loan
|
$
|
2,500
|
|
|||||
|
Interest Rate Lock Commitment
|
1,574
|
|
Historical Trend
|
Closing Ratio
|
93.97
|
%
|
||||||
|
|
|
|
Pricing Model
|
Origination Costs, per loan
|
$
|
2,500
|
|
|||||
|
Total
|
$
|
15,472
|
|
|
|
|
|
|||||
|
|
Fair Value
|
|
|
Significant
Unobservable Input
|
||||||||
|
(In thousands)
|
December 31, 2015
|
Valuation Techniques
|
Unobservable Inputs
|
Value
|
||||||||
|
Assets (Liabilities)
|
|
|
|
|
|
|
||||||
|
Trading Security
|
$
|
14,189
|
|
Discounted Cash Flow
|
Discount Rate
|
2.49
|
%
|
|||||
|
AFS Securities
|
708
|
|
Pricing Model
|
Median Peer Price/Tangible Book Value Percentage Multiple
|
88.52
|
%
|
||||||
|
Forward Commitments
|
9
|
|
Historical Trend
|
Closing Ratio
|
92.57
|
%
|
||||||
|
|
|
|
Pricing Model
|
Origination Costs, per loan
|
$
|
2,500
|
|
|||||
|
Interest Rate Lock Commitment
|
323
|
|
Historical Trend
|
Closing Ratio
|
92.57
|
%
|
||||||
|
|
|
|
Pricing Model
|
Origination Costs, per loan
|
$
|
2,500
|
|
|||||
|
Total
|
$
|
15,229
|
|
|
|
|
|
|||||
62
Non-Recurring Fair Value Measurements
The Company is required, on a non-recurring basis, to adjust the carrying value or provide valuation allowances for certain assets using fair value measurements in accordance with GAAP. The following is a summary of applicable non-recurring fair value measurements. There are no liabilities measured at fair value on a non-recurring basis.
|
|
September 30, 2016
|
December 31, 2015
|
Three months ended September 30, 2016
|
Nine months ended September 30, 2016
|
Fair Value Measurement Date as of September 30, 2016
|
|||||||||||||
|
|
Level 3
|
Level 3
|
Total
|
Total
|
Level 3
|
|||||||||||||
|
(In thousands)
|
Inputs
|
Inputs
|
Gains (Losses)
|
Gains (Losses)
|
Inputs
|
|||||||||||||
|
Assets
|
|
|
|
|
|
|
||||||||||||
|
Impaired loans
|
$
|
19,591
|
|
$
|
11,657
|
|
$
|
(2,955
|
)
|
$
|
7,934
|
|
September 2016
|
|||||
|
Capitalized servicing rights
|
10,495
|
|
5,187
|
|
—
|
|
—
|
|
September 2016
|
|||||||||
|
Other real estate owned
|
80
|
|
1,725
|
|
(35
|
)
|
(456
|
)
|
Feb. 2016 - Mar. 2016
|
|||||||||
|
Total
|
$
|
30,166
|
|
$
|
18,569
|
|
$
|
(2,990
|
)
|
$
|
7,478
|
|
||||||
Quantitative information about the significant unobservable inputs within Level 3 non-recurring assets is as follows:
|
|
Fair Value
|
|
|
|
||||||
|
(in thousands)
|
September 30, 2016
|
Valuation Techniques
|
Unobservable Inputs
|
Range (Weighted Average) (a)
|
||||||
|
Assets
|
|
|
|
|
|
|||||
|
Impaired loans
|
$
|
19,591
|
|
Fair value of collateral - appraised value
|
Discounted cash flow - loss severity
|
0.19% to 89.11% (10.01%)
|
||||
|
|
|
|
|
Appraised value
|
$29.2 to $2,197.4 ($1160.1)
|
|||||
|
Capitalized servicing rights
|
10,495
|
|
Discounted cash flow
|
Constant prepayment rate (CPR)
|
7.35% to 15.23% (11.04%)
|
|||||
|
|
|
|
|
Discount rate
|
10.00% to 14.00% (11.71%)
|
|||||
|
Other real estate owned
|
80
|
|
Fair value of collateral
|
Appraised value
|
$46.0 to $129.0 ($118.6)
|
|||||
|
Total
|
$
|
30,166
|
|
|
|
|
||||
|
(a)
|
Where dollar amounts are disclosed, the amounts represent the lowest and highest fair value of the respective assets in the population except for adjustments for market/property conditions, which represents the range of adjustments to individuals properties.
|
|
|
Fair Value
|
|
|
|
||||||
|
(in thousands)
|
December 31, 2015
|
Valuation Techniques
|
Unobservable Inputs
|
Range (Weighted Average) (a)
|
||||||
|
Assets
|
|
|
|
|
|
|||||
|
Impaired loans
|
$
|
11,657
|
|
Fair value of collateral - appraised value
|
Discounted cash flow - loss severity
|
0.05% to 29.50% (7.55%)
|
||||
|
|
|
|
|
Appraised value
|
$46.3 to $1,962.0 ($999.7)
|
|||||
|
Capitalized servicing rights
|
5,187
|
|
Discounted cash flow
|
Constant prepayment rate (CPR)
|
7.17% to 12.06% (10.02%)
|
|||||
|
|
|
|
|
Discount rate
|
10.00% to 15.00 (10.88%)
|
|||||
|
Other real estate owned
|
1,725
|
|
Fair value of collateral
|
Appraised value
|
$39.0 to $1,200.0 ($919.9)
|
|||||
|
Total
|
$
|
18,569
|
|
|
|
|
||||
|
(a)
|
Where dollar amounts are disclosed, the amounts represent the lowest and highest fair value of the respective assets in the population except for adjustments for market/property conditions, which represents the range of adjustments to individuals properties.
|
63
There were no Level 1 or Level 2 nonrecurring fair value measurements for the periods ended
September 30, 2016
and
December 31, 2015
.
Impaired Loans.
Loans are generally not recorded at fair value on a recurring basis. Periodically, the Company records non-recurring adjustments to the carrying value of loans based on fair value measurements for partial charge-offs of the uncollectible portions of those loans. Non-recurring adjustments can also include certain impairment amounts for collateral-dependent loans calculated when establishing the allowance for credit losses. Such amounts are generally based on the fair value of the underlying collateral supporting the loan and, as a result, the carrying value of the loan less the calculated valuation amount does not necessarily represent the fair value of the loan. Real estate collateral is typically valued using appraisals or other indications of value based on recent comparable sales of similar properties or assumptions generally observable in the marketplace. However, the choice of observable data is subject to significant judgment, and there are often adjustments based on judgment in order to make observable data comparable and to consider the impact of time, the condition of properties, interest rates, and other market factors on current values. Additionally, commercial real estate appraisals frequently involve discounting of projected cash flows, which relies inherently on unobservable data. Therefore, nonrecurring fair value measurement adjustments that relate to real estate collateral have generally been classified as Level 3. Estimates of fair value for other collateral that supports commercial loans are generally based on assumptions not observable in the marketplace and therefore such valuations have been classified as Level 3.
Capitalized loan servicing rights
.
A loan servicing right asset represents the amount by which the present value of the estimated future net cash flows to be received from servicing loans exceed adequate compensation for performing the servicing. The fair value of servicing rights is estimated using a present value cash flow model. The most important assumptions used in the valuation model are the anticipated rate of the loan prepayments and discount rates. Adjustments are only recorded when the discounted cash flows derived from the valuation model are less than the carrying value of the asset. Although some assumptions in determining fair value are based on standards used by market participants, some are based on unobservable inputs and therefore are classified in Level 3 of the valuation hierarchy.
Other real estate owned (“OREO”).
OREO results from the foreclosure process on residential or commercial loans issued by the Bank. Upon assuming the real estate, the Company records the property at the fair value of the asset less the estimated sales costs. Thereafter, OREO properties are recorded at the lower of cost or fair value less the estimated sales costs. OREO fair values are primarily determined based on Level 3 data including sales comparables and appraisals.
64
Summary of Estimated Fair Values of Financial Instruments
The estimated fair values, and related carrying amounts, of the Company’s financial instruments follow. Certain financial instruments and all non-financial instruments are excluded from disclosure requirements. Accordingly, the aggregate fair value amounts presented herein may not necessarily represent the underlying fair value of the Company.
|
|
September 30, 2016
|
|||||||||||||||||||
|
|
Carrying
|
Fair
|
|
|
|
|||||||||||||||
|
(In thousands)
|
Amount
|
Value
|
Level 1
|
Level 2
|
Level 3
|
|||||||||||||||
|
Financial Assets
|
|
|
|
|
|
|
|
|
|
|
||||||||||
|
Cash and cash equivalents
|
$
|
69,285
|
|
$
|
69,285
|
|
$
|
69,285
|
|
$
|
—
|
|
$
|
—
|
|
|||||
|
Trading security
|
14,149
|
|
14,149
|
|
—
|
|
—
|
|
14,149
|
|
||||||||||
|
Securities available for sale
|
946,853
|
|
946,853
|
|
53,602
|
|
893,251
|
|
—
|
|
||||||||||
|
Securities held to maturity
|
131,467
|
|
139,358
|
|
—
|
|
—
|
|
139,358
|
|
||||||||||
|
FHLB bank stock and restricted securities
|
61,277
|
|
61,277
|
|
—
|
|
61,277
|
|
—
|
|
||||||||||
|
Net loans
|
6,003,899
|
|
6,081,799
|
|
—
|
|
—
|
|
6,081,799
|
|
||||||||||
|
Loans held for sale
|
20,471
|
|
20,471
|
|
—
|
|
20,471
|
|
—
|
|
||||||||||
|
Accrued interest receivable
|
17,263
|
|
17,263
|
|
—
|
|
17,263
|
|
—
|
|
||||||||||
|
Cash surrender value of bank-owned life insurance policies
|
127,880
|
|
127,880
|
|
—
|
|
127,880
|
|
—
|
|
||||||||||
|
Derivative assets
|
37,120
|
|
37,120
|
|
—
|
|
35,546
|
|
1,574
|
|
||||||||||
|
Assets held for sale
|
—
|
|
—
|
|
—
|
|
—
|
|
—
|
|
||||||||||
|
Financial Liabilities
|
|
|
|
|
|
|
|
|
|
|
||||||||||
|
Total deposits
|
$
|
5,749,754
|
|
$
|
5,751,777
|
|
$
|
—
|
|
$
|
5,751,777
|
|
$
|
—
|
|
|||||
|
Short-term debt
|
939,800
|
|
939,823
|
|
—
|
|
939,823
|
|
—
|
|
||||||||||
|
Long-term Federal Home Loan Bank advances
|
109,114
|
|
109,625
|
|
—
|
|
109,625
|
|
—
|
|
||||||||||
|
Subordinated borrowings
|
89,116
|
|
97,437
|
|
—
|
|
97,437
|
|
—
|
|
||||||||||
|
Derivative liabilities
|
50,650
|
|
50,650
|
|
331
|
|
50,068
|
|
251
|
|
||||||||||
65
|
|
December 31, 2015
|
|||||||||||||||||||
|
|
Carrying
|
Fair
|
|
|
|
|||||||||||||||
|
(In thousands)
|
Amount
|
Value
|
Level 1
|
Level 2
|
Level 3
|
|||||||||||||||
|
Financial Assets
|
|
|
|
|
|
|
|
|
|
|
||||||||||
|
Cash and cash equivalents
|
$
|
103,562
|
|
$
|
103,562
|
|
$
|
103,562
|
|
$
|
—
|
|
$
|
—
|
|
|||||
|
Trading security
|
14,189
|
|
14,189
|
|
—
|
|
—
|
|
14,189
|
|
||||||||||
|
Securities available for sale
|
1,154,457
|
|
1,154,457
|
|
32,925
|
|
1,120,824
|
|
708
|
|
||||||||||
|
Securities held to maturity
|
131,652
|
|
136,904
|
|
—
|
|
—
|
|
136,904
|
|
||||||||||
|
FHLB bank stock and restricted securities
|
71,018
|
|
71,018
|
|
—
|
|
71,018
|
|
—
|
|
||||||||||
|
Net loans
|
5,685,928
|
|
5,727,570
|
|
—
|
|
—
|
|
5,727,570
|
|
||||||||||
|
Loans held for sale
|
13,191
|
|
13,191
|
|
—
|
|
13,191
|
|
—
|
|
||||||||||
|
Accrued interest receivable
|
20,940
|
|
20,940
|
|
—
|
|
20,940
|
|
—
|
|
||||||||||
|
Cash surrender value of bank-owned life insurance policies
|
125,233
|
|
125,233
|
|
—
|
|
125,233
|
|
—
|
|
||||||||||
|
Derivative assets
|
17,507
|
|
17,507
|
|
45
|
|
17,130
|
|
332
|
|
||||||||||
|
Assets held for sale
|
278
|
|
278
|
|
—
|
|
278
|
|
—
|
|
||||||||||
|
Financial Liabilities
|
|
|
|
|
|
|
|
|
|
|
||||||||||
|
Total deposits
|
$
|
5,589,135
|
|
$
|
5,582,835
|
|
$
|
—
|
|
$
|
5,582,835
|
|
$
|
—
|
|
|||||
|
Short-term debt
|
1,071,200
|
|
1,071,044
|
|
—
|
|
1,071,044
|
|
—
|
|
||||||||||
|
Long-term Federal Home Loan Bank advances
|
103,135
|
|
103,397
|
|
—
|
|
103,397
|
|
—
|
|
||||||||||
|
Subordinated borrowings
|
89,812
|
|
93,291
|
|
—
|
|
93,291
|
|
—
|
|
||||||||||
|
Derivative liabilities
|
28,181
|
|
28,181
|
|
—
|
|
28,181
|
|
—
|
|
||||||||||
Other than as discussed above, the following methods and assumptions were used by management to estimate the fair value of significant classes of financial instruments for which it is practicable to estimate that value.
Cash and cash equivalents.
Carrying value is assumed to represent fair value for cash and cash equivalents that have original maturities of ninety days or less.
FHLB bank stock and restricted securities.
Carrying value approximates fair value based on the redemption provisions of the issuers.
Cash surrender value of life insurance policies.
Carrying value approximates fair value.
Loans, net.
The carrying value of the loans in the loan portfolio is based on the cash flows of the loans discounted over their respective loan origination rates. The origination rates are adjusted for substandard and special mention loans to factor the impact of declines in the loan’s credit standing. The fair value of the loans is estimated by discounting future cash flows using the current interest rates at which similar loans with similar terms would be made to borrowers of similar credit quality.
Accrued interest receivable.
Carrying value approximates fair value.
Deposits.
The fair value of demand, non-interest bearing checking, savings and money market deposits is determined as the amount payable on demand at the reporting date. The fair value of time deposits is estimated by discounting the estimated future cash flows using market rates offered for deposits of similar remaining maturities.
Borrowed funds.
The fair value of borrowed funds is estimated by discounting the future cash flows using market rates for similar borrowings. Such funds include all categories of debt and debentures in the table above.
66
Subordinated borrowings.
The Company utilizes a pricing service along with internal models to estimate the valuation of its junior subordinated debentures. The junior subordinated debentures re-price every
ninety
days.
Off-balance-sheet financial instruments.
Off-balance-sheet financial instruments include standby letters of credit and other financial guarantees and commitments considered immaterial to the Company’s financial statements.
Presented below is net interest income after provision for loan losses for the
three and nine
months ended
September 30, 2016
and 2015, respectively.
|
Three Months Ended September 30,
|
Nine Months Ended September 30,
|
|||||||||||||||
|
(In thousands)
|
2016
|
2015
|
2016
|
2015
|
||||||||||||
|
Net interest income
|
$
|
57,971
|
|
$
|
56,971
|
|
$
|
173,109
|
|
$
|
155,101
|
|
||||
|
Provision for loan losses
|
4,734
|
|
4,240
|
|
13,262
|
|
12,295
|
|
||||||||
|
Net interest income after provision for loan losses
|
$
|
53,237
|
|
$
|
52,731
|
|
$
|
159,847
|
|
$
|
142,806
|
|
||||
On June 24, 2016, the Company entered into an agreement and plan of merger with First Choice Bank ("First Choice"), the parent company of First Choice Loan Services ("FCLS"), pursuant to which First Choice will merge with and into Berkshire Bank in a transaction to be accounted for as a business combination. It is expected that FCLS will become an operating subsidiary of the Bank. Headquartered in Lawrenceville, New Jersey, First Choice had
$1.1 billion
in assets as of September 30, 2016 (unaudited) and operates
eight
banking offices providing a range of banking services in Central New Jersey and greater Philadelphia metropolitan area.
If the Merger is completed, each outstanding share of First Choice Bank common stock will be converted into the right to receive
0.5773
shares of the Company's common stock. In addition, each outstanding share of First Choice preferred stock will be converted into the right to receive such number of the Company's common stock equal to the number of shares of First Choice common stock issuable upon the conversion of the First Choice preferred stock multiplied by
0.5773
.
The transaction is subject to closing conditions, including the receipt of regulatory approvals and approval by the shareholders of First Choice. The merger is currently expected to be completed in the fourth quarter of 2016. If the merger is not consummated under specified circumstances, First Choice has agreed to pay the Company a termination fee of
$4.1 million
.
The Company incurred
$1.1 million
and
$1.5 million
of merger and acquisition expenses related to the First Choice merger for the three and nine months ended September 30, 2016. There were
no
merger and acquisition expenses related to the First Choice merger in 2015. Excluding the merger and acquisition expenses incurred in 2016, this merger agreement had no material effect on the Company’s financial statements for the periods presented.
67
GENERAL
Management’s discussion and analysis of financial condition and results of operations is intended to assist in understanding the financial condition and results of operations of the Company. The following discussion and analysis should be read in conjunction with the Company’s consolidated financial statements and the notes thereto appearing in Part I, Item 1 of this document and with the Company’s consolidated financial statements and the notes thereto and Management’s Discussion and Analysis of Financial Condition and Results of Operations included in the 2015 Annual Report on Form 10-K. In the following discussion, income statement comparisons are against the same period of the previous year and balance sheet comparisons are against the previous fiscal year-end, unless otherwise noted. Operating results discussed herein are not necessarily indicative of the results for the year 2016 or any future period. In management’s discussion and analysis of financial condition and results of operations, certain reclassifications have been made to make prior periods comparable. Tax-equivalent adjustments during the current period are the result of increasing income from tax-advantaged securities by an amount equal to the taxes that would be paid if the income were fully taxable based on a 40.1% marginal income tax rate. In the discussion, references to earnings per share refer to diluted earnings per share unless otherwise specified.
Berkshire Hills Bancorp, Inc. (“Berkshire” or “the Company”) is a Delaware corporation headquartered in Pittsfield, Massachusetts and the holding company for Berkshire Bank (“the Bank”) and Berkshire Insurance Group. Established in 1846, the Bank operates as a commercial bank under a Massachusetts trust company charter. Berkshire Bank operates under the brand America’s Most Exciting Bank®.
Berkshire is a regional financial services company that seeks to distinguish itself over the long term based on the following attributes:
|
•
|
Strong growth from organic, de novo, product, and acquisition strategies
|
|
•
|
Solid capital, core funding, and risk management culture
|
|
•
|
Experienced executive team focused on earnings and stockholder value
|
|
•
|
Distinctive brand and culture as America’s Most Exciting Bank®
|
|
•
|
Diversified integrated financial service revenues
|
|
•
|
Positioned to be regional consolidator in attractive markets.
|
Shown below is a profile of the Company:
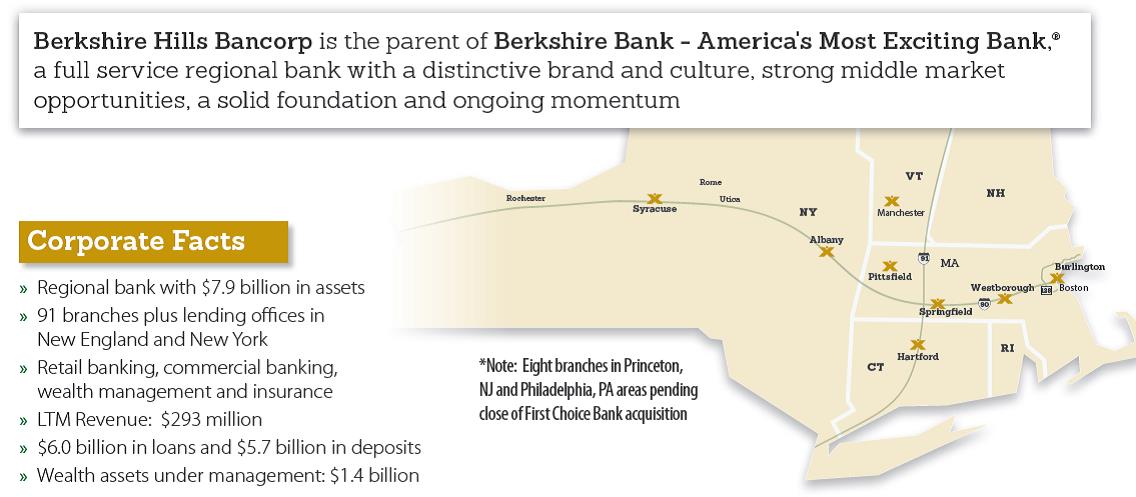
On April 17, 2015, Berkshire completed the acquisition of Springfield, MA based Hampden Bancorp, Inc. (“Hampden"). On August 7, 2015, Berkshire Bank completed the acquisition of Firestone Financial Corp.
68
(“Firestone”), a commercial specialty finance company providing secured installment loan equipment financing for small and medium-sized businesses. On April 29, 2016, Berkshire acquired certain assets related to the SBA lending operations of 44 Business Capital LLC.
FORWARD-LOOKING STATEMENTS
Certain statements contained in this document that are not historical facts may constitute forward-looking statements within the meaning of Section 27A of the Securities Act of 1933, as amended (referred to as the Securities Act), and Section 21E of the Securities Exchange Act of 1934, as amended (referred to as the Securities Exchange Act), and are intended to be covered by the safe harbor provisions of the Private Securities Litigation Reform Act of 1995. You can identify these statements from the use of the words “may,” “will,” “should,” “could,” “would,” “plan,” “potential,” “estimate,” “project,” “believe,” “intend,” “anticipate,” “expect,” “target” and similar expressions. These forward-looking statements are subject to significant risks, assumptions and uncertainties, including among other things, changes in general economic and business conditions, increased competitive pressures, changes in the interest rate environment, legislative and regulatory change, changes in the financial markets, and other risks and uncertainties disclosed from time to time in documents that Berkshire Hills Bancorp files with the Securities and Exchange Commission, including the Annual Report on Form 10-K for the fiscal year ended December 31, 2015 and the Risk Factors in Item 1A of this report. Because of these and other uncertainties, Berkshire’s actual results, performance or achievements, or industry results, may be materially different from the results indicated by these forward-looking statements. In addition, Berkshire’s past results of operations do not necessarily indicate Berkshire’s combined future results.
Additional factors that could cause results to differ materially from those described in the forward-looking statements can be found in the Registration Statement on Form S-4 that includes a Proxy Statement/Prospectus filed by Berkshire Hills Bancorp with the SEC on October 24, 2016 related to the acquisition of First Choice Bank. This document contains forward-looking statements about the merger of Berkshire Hills Bancorp and First Choice. Certain factors that could cause actual results to differ materially from expected results include difficulties in achieving cost savings from the merger or in achieving such cost savings within the expected time frame, difficulties in integrating Berkshire Hills Bancorp and First Choice, increased competitive pressures, changes in the interest rate environment, changes in general economic conditions, legislative and regulatory changes that adversely affect the business in which Berkshire Hills Bancorp and First Choice are engaged, changes in the securities markets and other risks and uncertainties disclosed from time to time in documents that Berkshire Hills Bancorp files with the Securities and Exchange Commission.
You should not place undue reliance on any of the forward-looking statements, which speak only as of the dates on which they were made. Berkshire is not undertaking an obligation to update forward-looking statements, even though its situation may change in the future, except as required under federal securities law. Berkshire qualifies all of its forward-looking statements by these cautionary statements.
69
SELECTED FINANCIAL DATA
The following summary data is based in part on the consolidated financial statements and accompanying notes and other information appearing elsewhere in this or prior Forms 10-Q.
|
At or for the
|
At or for the
|
||||||||||||||
|
Three Months Ended September 30,
|
Nine Months Ended September 30,
|
||||||||||||||
|
|
2016
|
2015
|
2016
|
2015
|
|||||||||||
|
PER COMMON SHARE DATA
(1)
|
|
|
|
|
|
|
|
|
|||||||
|
Net earnings, diluted
|
$
|
0.53
|
|
$
|
0.49
|
|
$
|
1.57
|
|
$
|
1.20
|
|
|||
|
Adjusted earnings, diluted
(2)
|
0.57
|
|
0.54
|
|
1.64
|
|
1.55
|
|
|||||||
|
Total book value
|
29.97
|
|
28.48
|
|
29.97
|
|
28.48
|
|
|||||||
|
Tangible book value
(2)
|
18.78
|
|
17.61
|
|
18.78
|
|
17.61
|
|
|||||||
|
Dividends
|
0.20
|
|
0.19
|
|
0.60
|
|
0.57
|
|
|||||||
|
Common stock price:
|
|
|
|
|
|
|
|||||||||
|
High
|
28.37
|
|
29.81
|
|
28.93
|
|
29.81
|
|
|||||||
|
Low
|
25.90
|
|
26.68
|
|
24.71
|
|
24.27
|
|
|||||||
|
Close
|
27.71
|
|
27.54
|
|
27.71
|
|
27.54
|
|
|||||||
|
PERFORMANCE RATIOS
(1)(3)
|
|||||||||||||||
|
Return on assets
|
0.82
|
%
|
0.78
|
%
|
0.82
|
%
|
0.63
|
%
|
|||||||
|
Adjusted return on assets
(2)
|
0.88
|
|
0.86
|
|
0.86
|
|
0.81
|
|
|||||||
|
Return on equity
|
7.29
|
|
6.90
|
|
7.21
|
|
5.71
|
|
|||||||
|
Adjusted return on equity
(2)
|
7.75
|
|
7.58
|
|
7.53
|
|
7.34
|
|
|||||||
|
Adjusted return on tangible equity
(2)
|
12.99
|
|
12.78
|
|
12.55
|
|
12.43
|
|
|||||||
|
Net interest margin, fully taxable equivalent (FTE)
(4)
|
3.25
|
|
3.37
|
|
3.30
|
|
3.29
|
|
|||||||
|
Net interest margin, excluding purchased loan accretion and FTE
(2)
|
3.13
|
|
3.22
|
|
3.18
|
|
3.18
|
|
|||||||
|
Fee income/Net interest and fee income
|
23.81
|
|
19.38
|
|
22.03
|
|
21.76
|
|
|||||||
|
Efficiency ratio
(2)
|
57.90
|
|
60.35
|
|
58.81
|
|
61.63
|
|
|||||||
|
GROWTH
|
|||||||||||||||
|
Total commercial loans, (annualized)
|
6
|
%
|
37
|
%
|
8
|
%
|
37
|
%
|
|||||||
|
Total loans, (annualized)
|
3
|
|
29
|
|
7
|
|
28
|
|
|||||||
|
Total deposits, (annualized)
|
7
|
|
14
|
|
4
|
|
24
|
|
|||||||
|
Total net revenues, (compared to prior year)
|
10
|
|
17
|
|
13
|
|
19
|
|
|||||||
|
Earnings per share, (compared to prior year)
|
8
|
|
2
|
|
31
|
|
34
|
|
|||||||
|
Adjusted earnings per share, (compared to prior year)
(2)
|
6
|
|
17
|
|
6
|
|
17
|
|
|||||||
|
FINANCIAL DATA:
(In millions)
(1)
|
|
|
|
|
|
|
|
|
|||||||
|
Total assets
|
$
|
7,931
|
|
$
|
7,804
|
|
$
|
7,931
|
|
$
|
7,804
|
|
|||
|
Total earning assets
|
7,229
|
|
7,130
|
|
7,229
|
|
7,130
|
|
|||||||
|
Total investments
|
1,162
|
|
1,439
|
|
1,162
|
|
1,439
|
|
|||||||
|
Total borrowings
|
1,138
|
|
1,301
|
|
1,138
|
|
1,301
|
|
|||||||
|
Total loans
|
6,047
|
|
5,665
|
|
6,047
|
|
5,665
|
|
|||||||
|
Allowance for loan losses
|
43
|
|
38
|
|
43
|
|
38
|
|
|||||||
|
Total intangible assets
|
348
|
|
337
|
|
348
|
|
337
|
|
|||||||
|
Total deposits
|
5,750
|
|
5,507
|
|
5,750
|
|
5,507
|
|
|||||||
|
Total common stockholders’ equity
|
933
|
|
882
|
|
933
|
|
882
|
|
|||||||
|
Net Income
|
16.4
|
|
14.7
|
|
48.3
|
|
33.5
|
|
|||||||
|
Adjusted income
(2)
|
17.4
|
|
16.2
|
|
50.4
|
|
43.1
|
|
|||||||
70
|
At or for the
|
At or for the
|
||||||||||||||
|
Three Months Ended September 30,
|
Nine Months Ended September 30,
|
||||||||||||||
|
2016
|
2015
|
2016
|
2015
|
||||||||||||
|
ASSET QUALITY AND CONDITION RATIOS
(1)(5)
|
|||||||||||||||
|
Net charge-offs (annualized)/average loans
|
0.20
|
%
|
0.26
|
%
|
0.22
|
%
|
0.26
|
%
|
|||||||
|
Allowance for loan losses/total loans
|
0.71
|
|
0.67
|
|
0.71
|
|
0.67
|
|
|||||||
|
Loans/deposits
|
105
|
|
103
|
|
105
|
|
103
|
|
|||||||
|
Shareholders' equity to total assets
|
11.76
|
|
11.30
|
|
11.76
|
|
11.30
|
|
|||||||
|
Tangible shareholders' equity to tangible assets
(2)
|
7.70
|
|
7.30
|
|
7.70
|
|
7.30
|
|
|||||||
|
FOR THE PERIOD:
(In thousands)
(1)
|
|
|
|
|
|
|
|
|
|||||||
|
Net interest income
|
$
|
57,971
|
|
$
|
56,971
|
|
$
|
173,109
|
|
$
|
155,101
|
|
|||
|
Non-interest income
|
18,941
|
|
12,698
|
|
49,126
|
|
42,040
|
|
|||||||
|
Provision for loan losses
|
4,734
|
|
4,240
|
|
13,262
|
|
12,295
|
|
|||||||
|
Non-interest expense
|
48,844
|
|
49,378
|
|
142,212
|
|
148,551
|
|
|||||||
|
Net income
|
16,381
|
|
14,701
|
|
48,339
|
|
33,504
|
|
|||||||
|
Adjusted Income
(2)
|
17,418
|
|
16,151
|
|
50,421
|
|
43,081
|
|
|||||||
(1) Adjusted measurements are non-GAAP financial measures that are adjusted to exclude net non-operating charges primarily related to acquisitions and restructuring activities. Refer to the Reconciliation of Non-GAAP Financial Measures on page 76 for additional information.
|
(2)
|
Non-GAAP financial measure.
|
(3) All performance ratios are annualized and are based on average balance sheet amounts, where applicable.
(4) Fully taxable equivalent considers the impact of tax advantaged investment securities and loans.
(5) Generally accepted accounting principles require that loans acquired in a business combination be recorded at fair value, whereas loans from business activities are recorded at cost. The fair value of loans acquired in a business combination includes expected loan losses, and there is no loan loss allowance recorded for these loans at the time of acquisition. Accordingly, the ratio of the loan loss allowance to total loans is reduced as a result of the existence of such loans, and this measure is not directly comparable to prior periods. Similarly, net loan charge-offs are normally reduced for loans acquired in a business combination since these loans are recorded net of expected loan losses. Therefore, the ratio of net loan charge-offs to average loans is reduced as a result of the existence of such loans, and this measure is not directly comparable to prior periods. Other institutions may have loans acquired in a business combination, and therefore there may be no direct comparability of these ratios between and among other institutions.
71
AVERAGE BALANCES AND AVERAGE YIELDS/RATES
The following table presents average balances and an analysis of average rates and yields on an annualized fully taxable equivalent basis for the periods included:
|
|
Three Months Ended September 30,
|
Nine Months Ended September 30,
|
|||||||||||||||||||
|
|
2016
|
2015
|
2016
|
2015
|
|||||||||||||||||
|
($ In millions)
|
Average
Balance
|
Yield/Rate
(FTE basis)
|
Average
Balance
|
Yield/Rate
(FTE basis)
|
Average
Balance
|
Yield/Rate
(FTE basis)
|
Average
Balance
|
Yield/Rate
(FTE basis)
|
|||||||||||||
|
Assets
|
|||||||||||||||||||||
|
Loans:
|
|
|
|
|
|
|
|
|
|
|
|
|
|
|
|
|
|||||
|
Commercial real estate
|
$
|
2,261
|
|
4.28
|
%
|
$
|
1,949
|
|
4.47
|
%
|
$
|
2,171
|
|
4.30
|
%
|
$
|
1,828
|
|
4.35
|
%
|
|
|
Commercial and industrial loans
|
1,010
|
|
5.15
|
|
999
|
|
4.79
|
|
1,028
|
|
5.04
|
|
897
|
|
4.04
|
|
|||||
|
Residential mortgages
|
1,839
|
|
3.60
|
|
1,664
|
|
3.74
|
|
1,799
|
|
3.69
|
|
1,566
|
|
3.92
|
|
|||||
|
Consumer loans
|
900
|
|
3.41
|
|
814
|
|
3.29
|
|
851
|
|
3.42
|
|
801
|
|
3.25
|
|
|||||
|
Total loans
(1)
|
6,010
|
|
4.10
|
|
5,426
|
|
4.14
|
|
5,849
|
|
4.13
|
|
5,092
|
|
4.01
|
|
|||||
|
Investment securities
(2)
|
1,198
|
|
3.26
|
|
1,354
|
|
2.92
|
|
1,263
|
|
3.27
|
|
1,277
|
|
3.00
|
|
|||||
|
Short term investments & loans held for sale
(3)
|
40
|
|
1.69
|
|
52
|
|
1.34
|
|
46
|
|
1.30
|
|
60
|
|
1.29
|
|
|||||
|
Total interest-earning assets
|
7,248
|
|
3.94
|
|
6,832
|
|
3.87
|
|
7,158
|
|
3.94
|
|
6,429
|
|
3.77
|
|
|||||
|
Intangible assets
|
349
|
|
|
|
330
|
|
|
|
343
|
|
|
|
303
|
|
|
|
|||||
|
Other non-interest earning assets
|
360
|
|
|
|
379
|
|
|
|
352
|
|
|
|
346
|
|
|
|
|||||
|
Total assets
|
$
|
7,957
|
|
|
|
$
|
7,541
|
|
|
|
$
|
7,853
|
|
|
|
$
|
7,078
|
|
|
|
|
|
Liabilities and shareholders’ equity
|
|||||||||||||||||||||
|
Deposits:
|
|
|
|
|
|
|
|
|
|
|
|
|
|
|
|
|
|||||
|
NOW
|
$
|
475
|
|
0.12
|
%
|
$
|
475
|
|
0.14
|
%
|
$
|
484
|
|
0.13
|
%
|
$
|
453
|
|
0.15
|
%
|
|
|
Money market
|
1,448
|
|
0.46
|
|
1,474
|
|
0.42
|
|
1,423
|
|
0.47
|
|
1,440
|
|
0.40
|
|
|||||
|
Savings
|
608
|
|
0.12
|
|
616
|
|
0.15
|
|
608
|
|
0.12
|
|
575
|
|
0.16
|
|
|||||
|
Time
|
2,095
|
|
1.10
|
|
1,795
|
|
0.90
|
|
2,069
|
|
1.05
|
|
1,591
|
|
0.91
|
|
|||||
|
Total interest-bearing deposits
|
4,626
|
|
0.67
|
|
4,360
|
|
0.55
|
|
4,584
|
|
0.65
|
|
4,059
|
|
0.54
|
|
|||||
|
Borrowings and notes
(4)
|
1,247
|
|
1.53
|
|
1,210
|
|
0.80
|
|
1,239
|
|
1.37
|
|
1,210
|
|
0.80
|
|
|||||
|
Total interest-bearing liabilities
|
5,873
|
|
0.85
|
|
5,570
|
|
0.61
|
|
5,823
|
|
0.80
|
|
5,269
|
|
0.60
|
|
|||||
|
Non-interest-bearing demand deposits
|
1,085
|
|
|
|
1,011
|
|
|
|
1,048
|
|
|
|
952
|
|
|
|
|||||
|
Other non-interest earning liabilities
|
100
|
|
|
|
108
|
|
|
|
89
|
|
|
|
74
|
|
|
|
|||||
|
Total liabilities
|
7,058
|
|
|
|
6,689
|
|
|
|
6,960
|
|
|
|
6,295
|
|
|
|
|||||
|
Total shareholders’ equity
(2)
|
899
|
|
|
|
852
|
|
|
|
893
|
|
|
|
783
|
|
|
|
|||||
|
Total liabilities and stockholders’ equity
|
$
|
7,957
|
|
|
|
$
|
7,541
|
|
|
|
$
|
7,853
|
|
|
|
$
|
7,078
|
|
|
|
|
72
|
Three Months Ended September 30,
|
Nine Months Ended September 30,
|
||||||||||||||||||||
|
2016
|
2015
|
2016
|
2015
|
||||||||||||||||||
|
Average
Balance
|
Yield/Rate
(FTE basis)
|
Average
Balance
|
Yield/Rate
(FTE basis)
|
Average
Balance
|
Yield/Rate
(FTE basis)
|
Average
Balance
|
Yield/Rate
(FTE basis)
|
||||||||||||||
|
Net interest spread
|
|
|
3.09
|
%
|
|
|
3.26
|
%
|
|
|
3.14
|
%
|
|
|
3.17
|
%
|
|||||
|
Net interest margin
(5)
|
|
|
3.25
|
|
|
|
3.37
|
|
|
|
3.30
|
|
|
|
3.29
|
|
|||||
|
Cost of funds
|
|
|
0.72
|
|
|
|
0.51
|
|
|
|
0.68
|
|
|
|
0.51
|
|
|||||
|
Cost of deposits
|
|
|
0.54
|
|
|
|
0.45
|
|
|
|
0.53
|
|
|
|
0.43
|
|
|||||
|
Supplementary data
|
|
|
|
|
|
|
|
|
|
|
|
|
|
|
|
|
|||||
|
Total deposits (In millions)
|
$
|
5,711
|
|
|
|
$
|
5,371
|
|
|
|
$
|
5,632
|
|
|
|
$
|
5,011
|
|
|
|
|
|
Fully taxable equivalent income adj. (In thousands)
(6)
|
1,190
|
|
|
|
1,131
|
|
|
|
1,171
|
|
|
|
1,029
|
|
|
|
|||||
|
(1)
|
The average balances of loans include nonaccrual loans and deferred fees and costs.
|
|
(2)
|
The average balance for securities available for sale is based on amortized cost. The average balance of equity also reflects this adjustment.
|
|
(3)
|
Interest income on loans held for sale is included in loan interest income on the income statement.
|
|
(4)
|
The average balances of borrowings includes the capital lease obligation presented under other liabilities on the consolidated balance sheet.
|
|
(5)
|
Purchased loan accretion totaled $2.2 million and $2.7 million for the three months ended
September 30, 2016
and 2015, respectively. Purchased loan accretion totaled $6.3 million and $5.2 million for the
nine
months ended
September 30, 2016
and 2015, respectively.
|
|
(6)
|
Fully taxable equivalent considers the impact of tax advantaged investment securities and loans.
|
73
NON-GAAP FINANCIAL MEASURES
This document contains certain non-GAAP financial measures in addition to results presented in accordance with U.S Generally Accepted Accounting Principles (“GAAP”). These non-GAAP measures are intended to provide the reader with additional supplemental perspectives on operating results, performance trends, and financial condition. Non-GAAP financial measures are not a substitute for GAAP measures; they should be read and used in conjunction with the Company’s GAAP financial information. The Company’s non-GAAP measures may not be comparable to similar non-GAAP information which may be presented by other companies. In all cases, it should be understood that non-GAAP operating measures do not depict amounts that accrue directly to the benefit of shareholders. An item which management excludes when computing non-GAAP adjusted earnings can be of substantial importance to the Company’s results and condition for any particular quarter or year. A reconciliation of non-GAAP financial measures to GAAP measures is provided below.
The Company utilizes the non-GAAP measure of adjusted earnings in evaluating operating trends, including components for operating revenue and expense. These measures exclude amounts which the Company views as unrelated to its normalized operations, including securities gains/losses, merger costs, restructuring costs, and systems conversion costs. These adjustments are presented net of an adjustment for related income tax expense. This adjustment is determined as the difference between the GAAP tax rate and the effective tax rate applicable to adjusted income. The Company calculates several non-GAAP performance measures based on its measure of adjusted earnings, including adjusted earnings per share, adjusted return on assets, adjusted return on equity, and
the efficiency ratio. The Company views these amounts as important to understanding its performance trends, particularly due to the impact of accounting standards related to merger and acquisition activity. Several of these measures are used as performance metrics in assessing the achievement of short and long term incentive compensation for management. Analysts also rely on these measures in estimating and evaluating the Company’s performance. Management also believes that the computation of non-GAAP earnings and earnings per share may facilitate the comparison of the Company to other companies in the financial services industry. The Company adjusts certain equity related measures to exclude intangible assets due to the importance of these measures to the investment community and as components of regulatory capital supervision.
Charges related to merger and acquisition activity consist primarily of severance/benefit related expenses, contract termination costs, systems conversion costs, variable compensation, and professional fees. Restructuring costs primarily consist of costs and losses associated with the disposition of assets and lease terminations, together with executive severance. During the most recent quarter, revenue included the gain recorded on the sale of the two branches, which the Company does not include in its measures of adjusted revenues and earnings.
74
RECONCILIATION OF NON-GAAP FINANCIAL MEASURES
The following table summarizes the reconciliation of non-GAAP items recorded for the time periods and dates indicated:
|
|
|
At or for the Three Months Ended
|
At or for the Nine Months Ended
|
|||||||||||
|
|
|
September 30, 2016
|
September 30, 2015
|
September 30, 2016
|
September 30, 2015
|
|||||||||
|
(in thousands)
|
|
|||||||||||||
|
GAAP Net income
|
|
$
|
16,381
|
|
$
|
14,701
|
|
$
|
48,339
|
|
$
|
33,504
|
|
|
|
Adj: Gain on sale of securities, net
|
|
(78
|
)
|
(49
|
)
|
(101
|
)
|
(2,467
|
)
|
|||||
|
Adj: Net gain on sale of branches
|
|
(563
|
)
|
—
|
|
(563
|
)
|
—
|
|
|||||
|
Adj: Merger and acquisition expense
|
|
1,453
|
|
2,987
|
|
2,681
|
|
11,927
|
|
|||||
|
Adj: Restructuring and conversion expense
|
|
717
|
|
374
|
|
1,147
|
|
4,566
|
|
|||||
|
Adj: Income taxes
|
|
(492
|
)
|
(1,862
|
)
|
(1,082
|
)
|
(4,449
|
)
|
|||||
|
Total adjusted income (non-GAAP)
|
(A)
|
$
|
17,418
|
|
$
|
16,151
|
|
$
|
50,421
|
|
$
|
43,081
|
|
|
|
GAAP Total revenue
|
|
$
|
76,912
|
|
$
|
69,669
|
|
$
|
222,235
|
|
$
|
197,141
|
|
|
|
Adj: Gain on sale of securities, net
|
|
(78
|
)
|
(49
|
)
|
(101
|
)
|
(2,467
|
)
|
|||||
|
Adj: Net gain on branch sales
|
|
(563
|
)
|
—
|
|
(563
|
)
|
—
|
|
|||||
|
Total operating revenue (non-GAAP)
|
(B)
|
$
|
76,271
|
|
$
|
69,620
|
|
$
|
221,571
|
|
$
|
194,674
|
|
|
|
GAAP Total non-interest expense
|
|
$
|
48,844
|
|
$
|
49,378
|
|
$
|
142,212
|
|
$
|
148,551
|
|
|
|
Less: Total non-operating expense (see above)
|
|
(2,170
|
)
|
(3,361
|
)
|
(3,828
|
)
|
(16,493
|
)
|
|||||
|
Operating non-interest expense (non-GAAP)
|
(C)
|
$
|
46,674
|
|
$
|
46,017
|
|
$
|
138,384
|
|
$
|
132,058
|
|
|
|
(in millions, except per share data)
|
|
|
|
|
|
|
|
|||||||
|
Total average assets
|
(D)
|
$
|
7,957
|
|
$
|
7,541
|
|
$
|
7,852
|
|
$
|
7,078
|
|
|
|
Total average shareholders’ equity
|
(E)
|
899
|
|
852
|
|
893
|
|
783
|
|
|||||
|
Total average tangible shareholders’ equity
|
(F)
|
550
|
|
522
|
|
551
|
|
480
|
|
|||||
|
Total tangible shareholders’ equity, period-end
(1)
|
(G)
|
584
|
|
545
|
|
584
|
|
545
|
|
|||||
|
Total tangible assets, period-end
(1)
|
(H)
|
7,583
|
|
7,468
|
|
7,583
|
|
7,468
|
|
|||||
|
Total common shares outstanding, period-end (thousands)
|
(I)
|
31,122
|
|
30,949
|
|
31,122
|
|
30,949
|
|
|||||
|
Average diluted shares outstanding (thousands)
|
(J)
|
30,811
|
|
30,069
|
|
30,757
|
|
27,847
|
|
|||||
|
Earnings per share, diluted
|
$
|
0.53
|
|
$
|
0.49
|
|
$
|
1.58
|
|
$
|
1.20
|
|
||
|
Adjusted earnings per share, diluted
|
(A/J)
|
0.57
|
|
0.54
|
|
1.64
|
|
1.55
|
|
|||||
|
Book value per share, period-end
|
29.97
|
|
28.48
|
|
29.97
|
|
28.48
|
|
||||||
|
Tangible book value per share, period-end
|
(G/I)
|
18.78
|
|
17.61
|
|
18.78
|
|
17.61
|
|
|||||
|
Total shareholders' equity/total assets
|
11.76
|
|
11.30
|
|
11.76
|
|
11.30
|
|
||||||
|
Total tangible shareholder's equity/total tangible assets
|
(G)/(H)
|
7.70
|
|
7.30
|
|
7.70
|
|
7.30
|
|
|||||
|
Performance ratios
(2)
|
|
|
|
|
|
|
|
|||||||
|
GAAP return on assets
|
0.82
|
%
|
0.78
|
%
|
0.82
|
%
|
0.63
|
%
|
||||||
|
Adjusted return on assets
|
(A/D)
|
0.88
|
|
0.86
|
|
0.86
|
|
0.81
|
|
|||||
|
GAAP return on equity
|
7.29
|
|
6.90
|
|
7.21
|
|
5.71
|
|
||||||
|
Adjusted return on equity
|
(A/E)
|
7.75
|
|
7.58
|
|
7.53
|
|
7.34
|
|
|||||
|
Adjusted return on tangible equity
(3)
|
(A/F)
|
12.99
|
|
12.78
|
|
12.55
|
|
12.43
|
|
|||||
|
Efficiency ratio
|
(C-M)/(B+K+N)
|
57.90
|
|
60.35
|
|
58.81
|
|
61.63
|
|
|||||
75
|
|
|
At or for the Three Months Ended
|
At or for the Nine Months Ended
|
|||||||||||
|
|
|
September 30, 2016
|
September 30, 2015
|
September 30, 2016
|
September 30, 2015
|
|||||||||
|
(in thousands)
|
|
|||||||||||||
|
Supplementary data
(in thousands)
|
|
|
|
|
|
|
|
|||||||
|
Tax benefit on tax-credit investments
(4)
|
(K)
|
$
|
1,852
|
|
$
|
4,029
|
|
$
|
6,217
|
|
$
|
12,098
|
|
|
|
Non-interest income charge on tax-credit investments
(5)
|
(L)
|
(1,525
|
)
|
(2,851
|
)
|
(4,564
|
)
|
(8,554
|
)
|
|||||
|
Net income on tax-credit investments
|
(K+L)
|
327
|
|
1,178
|
|
1,653
|
|
3,543
|
|
|||||
|
Intangible amortization
|
(M)
|
749
|
|
887
|
|
2,355
|
|
2,722
|
|
|||||
|
Fully taxable equivalent income adjustment
|
(N)
|
1,200
|
|
1,131
|
|
3,154
|
|
3,088
|
|
|||||
_______________________________________
|
(1)
|
Total tangible shareholders’ equity is computed by taking total shareholders’ equity less the intangible assets at period-end. Total tangible assets is computed by taking total assets less the intangible assets at period-end.
|
|
(2)
|
Ratios are annualized and based on average balance sheet amounts, where applicable.
|
|
(3)
|
Adjusted return on tangible equity is computed by dividing the total adjusted income adjusted for the tax-affected amortization of intangible assets, assuming a 40% marginal rate, by tangible equity.
|
|
(4)
|
The tax benefit is the direct reduction to the income tax provision due to tax credits and deductions generated from investments in historic rehabilitation, low-income housing, new market projects, and renewable energy projects.
|
|
(5)
|
The non-interest income charge is the reduction to the tax-advantaged commercial project investments, which are incurred as the tax credits are generated.
|
76
SUMMARY
Net income and earnings per share increased year to year for both the third quarter and first nine months of 2016 due to expanded operations and improved profitability, including the benefit from merger and restructuring activities charged against 2015 results. Growth was reflected in the 13% increase in nine month revenue, which generated positive operating leverage and an increase in the nine month ROA to 0.82%. Berkshire’s quarterly shareholder dividend increased by 5% to $0.20 per share in 2016, which provided a 2.9% annualized yield compared to the average closing price of Berkshire’s stock in the most recent quarter.
Berkshire’s results include the Hampden operations acquired on April 17, 2015, the Firestone operations acquired on August 7, 2015, and the 44 Business Capital operations acquired on April 29, 2016. As a result, many measures of revenue, expense, income, and average balances increased compared to prior periods, and per share measures were affected by new shares issued for merger consideration. Third quarter operations in both years included the contributions from both of the 2015 acquisitions.
The Company uses the non-GAAP measure of adjusted earnings, and related metrics, to evaluate the results of its operations. The use of this measure, and its reconciliation to GAAP, is discussed further in a later section of this report. Third quarter GAAP earnings per share increased by 8% to $0.53 in 2016 from $0.49 in 2015. Adjusted earnings per share increased by 6% to $0.57 from $0.54. The 44 Business Capital operations acquired in 2016 contributed $0.02 to earnings per share in the most recent quarter. The third quarter net contribution of tax credit investments decreased by $0.03 per share to $0.01 in 2016 from $0.04 in 2015. The GAAP ROA improved to 0.82% in 2016, while the adjusted ROA reached 0.88%, which is the highest quarterly result in several years.
Third quarter financial highlights included the following (comparisons are to prior quarter unless otherwise stated):
|
•
|
7% increase in net revenue
|
|
•
|
6% annualized commercial loan growth
|
|
•
|
7% annualized deposit growth
|
|
•
|
17% increase in fee income
|
|
•
|
3.25% net interest margin (fully taxable equivalent)
|
|
•
|
57.9% efficiency ratio (non-GAAP financial measure)
|
|
•
|
0.26% non-performing assets/assets
|
|
•
|
0.20% net loan charge-offs/average loans
|
Berkshire’s strategy to increase fee income resulted in a 17% increase in third quarter fee income over the prior quarter and a 32% increase year over year. This growth was primarily due to loan related fees and mortgage banking revenue. In the third quarter, the Company promoted Michael Carroll to the new position of EVP, Specialty Lending, to oversee small business lending, Firestone (equipment lending) and 44 Business Capital (SBA lending). Berkshire is a leading SBA lender in several of its markets and in September gained the number one ranking for the number of SBA 7(a) Loan Program originations in Connecticut for the first time. Berkshire made further progress with its new Boston Congress Street branch which is expected to open for business early in 2017. This will be among the first Berkshire branches to feature virtual teller technology which further automates routine service and frees resources for improved sales and service. Berkshire also moved forward with its First Choice Bank acquisition in Princeton, New Jersey, which is targeted for completion before year-end 2016. The Company completed the sale of two New York branches in the most recent quarter and announced plans to consolidate three more branches in the first quarter of 2017. The Company also recently entered into a definitive agreement to acquire the assets of an established financial advisory practice based in Rutland, Vermont, which will serve that regional market as well as adding additional financial advisory capabilities.
Longer term U.S. Treasury interest rates reached record low levels around midyear 2016 reflecting the “lower for longer” market expectations about low interest rates that are pressuring industry profitability. As a result, Berkshire anticipates that asset yield compression will further pressure industry earnings and the Company is pursuing further revenue diversification and operating efficiencies with the goal of supporting future earnings growth. The lower
77
interest rates spurred demand for residential mortgages and commercial interest rate swaps in the third quarter and also supported revenues related to portfolio loan sales and gains on recoveries of acquired impaired loans. These revenue sources contributed to the higher fee income and more than offset the reduced tax credit benefit in the most recent quarter.
The First Choice acquisition is expected to bring Berkshire’s total assets to approximately $9 billion by year-end 2016 and moves the Company towards the $10 billion regulatory threshold that impose additional requirements and costs on its operations. These regulatory costs are primarily related to consumer compliance, capital analysis, and risk management. The Company estimates that it has absorbed nearly $5 million of these costs in its current annualized expense run rate. The Company believes that at this time it has absorbed the majority of the annual expense burden required for this threshold. Once it crosses the threshold, it expects to lose bank card interchange fee revenue which will be generally similar in magnitude to the regulatory expense burden described above. The Company believes that it has ample time and possible scenarios to manage its growth through this transition and to achieve the size and scale efficiencies sufficient to offset these impacts on its returns on assets and equity. The Company recently recruited Gregory Lindenmuth as EVP and Chief Risk Officer, who will oversee the Company’s preparations for the increased regulatory requirements at the $10 billion threshold. Mr. Lindenmuth was previously a senior federal regulatory examination official.
COMPARISON OF FINANCIAL CONDITION AT SEPTEMBER 30, 2016 AND DECEMBER 31, 2015
Summary:
Berkshire produced 6% loan growth and 3% deposit growth in the first nine months of 2016. The investment portfolio declined by 16% as lower yielding securities were sold in order to support the net interest margin and fund loan growth. Asset quality metrics remained comparatively favorable. Total assets increased by $100 million, or 1%, to $7.9 billion. Proceeds from investment sales also funded a 10% decrease in borrowings. The Company has maintained a modestly asset sensitive interest rate risk profile which would benefit operations if future interest rate increases occur. Liquidity was reduced slightly as a result of the loan growth. For the year-to-date, total book value per share increased by 5% to $29.97 and tangible book value per share (a non-GAAP financial measure) increased by 5% to $18.78. Retained earnings improved Berkshire’s capital metrics while also supporting business expansion and the higher dividend. In addition to expanding the business and operating profitability, the First Choice acquisition is targeted to improve both capital and liquidity metrics, including the benefit of Berkshire shares to be issued as merger consideration.
Securities:
The Company continues to position the portfolio as a source of liquidity and income. The portfolio was managed to support the net interest margin and fund loan growth for the year-to-date in 2016. The Company will further evaluate the portfolio when the First Choice Bank acquisition is completed.
Total investment securities decreased by $218 million, or 16%, during the first nine months of 2016 due to the deleveraging of the investment portfolio through the sale of lower margin investment securities. The balance of medium term agency collateralized mortgage obligations decreased by $291 million to $542 million during this time. Proceeds were reinvested in loans and funded the paydown of borrowings. Additionally, proceeds were invested in purchases of higher yielding securities available for sale. This resulted in increases of $62 million in agency commercial mortgage-backed securities, $17 million in municipal bonds, and $21 million in equity securities. These actions offset the further impact of yield compression on the mortgage backed securities portfolio, which is the primary component of investment securities. The total yield on the securities portfolio increased to 3.26% in the third quarter of 2016, compared to 2.96% in the fourth quarter of 2015. The average life of the bond portfolio increased to 5.3 years at September 30, 2016, compared to 4.9 years at the start of the year. The mix change towards longer maturities was generally offset by the shorter expected average lives of mortgage backed securities based on the drop in long term interest rates. Debt investment securities purchased in 2016 were all investment grade or investment grade equivalent.
Loans.
Berkshire is expanding and deepening its lending activities through organic growth and acquisitions, including a focus on its specialized lending areas. The Company uses secondary markets and a growing network of financial institution partners in managing and diversifying its portfolio, as well as supporting its fee income objectives.
78
Total loans increased by $322 million, growing by 6% during the first nine months of 2016. This included a $267 million increase in commercial real estate loans and a $105 million increase in consumer loans. Commercial and industrial loans decreased by $53 million and residential mortgages were flat. Third quarter trends were generally reflective of nine month trends as well.
The growth in commercial real estate loans reflected strong demand in the Company’s markets, including the impacts of increased economic activity, ongoing low interest rates, and changes in competitive conditions. Originations were concentrated in Berkshire’s New York and Connecticut markets. Some larger loans were variable rate and were paired with interest rate swaps (which increased by $185 million for the first nine months of 2016). Loan growth in 2016 has been largely in the category of investor commercial real estate, based on longstanding relationships in Berkshire’s regional markets. Growth included the $36 million of non-guaranteed portions of SBA loans purchased as part of the 44 Business Capital acquisition in the second quarter. Growth also included increased loans to retail and multi-tenanted properties with strong anchors, multifamily properties, and healthcare related properties. Due to its asset management strategies in recent years, Berkshire has been positioned to support its markets while also managing well within regulatory guidelines for commercial real estate lending. Berkshire’s total commercial real estate exposure measured 265% of regulatory capital at period-end, compared to the 300% regulatory monitoring guidelines (based on regulatory definitions). Commercial construction loan exposure was 37% of regulatory capital, compared to the 100% guideline. Berkshire monitors its commercial lending risk using the enhanced processes required for banks exceeding the monitoring thresholds even though it is well margined below those thresholds. The decrease in commercial and industrial loans included seasonal paydowns in specialized lending along with reductions in targeted lower profitability participated loans. Total commercial and industrial loans and owner occupied commercial mortgages added up to $1.57 billion at September 30, 2016, and comprised 47% of total commercial balances at that date.
Residential mortgage balances were unchanged at $1.82 billion for the first nine months of 2016. Residential mortgage originations were boosted by stronger demand in 2016 which resulted from the low interest rates that emerged in the first half of the year. Berkshire originates residential mortgages across its regional footprint. Berkshire’s mortgage originations totaled $596 million for the year-to-date. The Company sells most fixed rate conforming mortgage originations into the secondary market on a servicing released basis to generate revenue and manage interest rate risk. Most originations of jumbo mortgages are retained. Additionally, the company’s wholesale transactions with regional financial institutions included purchases totaling $150 million and sales totaling $238 million for the first nine months of 2016. The Company has a growing network of financial institution partners who participate in these mortgage transactions. The planned merger with First Choice Bank is targeted to substantially increase Berkshire’s mortgage banking business. First Choice originated $1.9 billion in residential mortgages for sale in the first nine months of 2016. Berkshire’s consumer loans increased by $105 million for 2016 year-to-date as a result of the expansion of the indirect auto dealer network across the footprint of the Company’s franchise. Berkshire originates prime new and used auto loans. Growth moderated in the third quarter as Berkshire adjusted its programs based on secondary market conditions.
Despite the ongoing pressure of yield compression related to low interest rates, the Company used management of its loan mix to mostly offset this compression in 2016. The yield benefited from the 25 basis point increase in short term rates in December 2015. Additionally, the yield benefited from higher yielding loans from the Firestone acquisition in the third quarter of 2015 and the higher yield assigned to the unguaranteed SBA loan participations from the 44 Business Capital acquisition. The total loan yield decreased to 4.10% in the third quarter of 2016 compared to 4.15% in the fourth quarter of 2015. The loan yield includes purchased loan accretion, which consists primarily of recoveries of purchased credit impaired loans. Measured before accretion, the loan yield decreased to 3.95% in the most recent quarter, compared to 3.98% in the final quarter of 2015.
At the end of the most recent quarter, 41% of loans contractually repriced within one year, 21% repriced in one to five years, and 38% repriced over five years. At year-end 2015, approximately 32% of the loan portfolio was scheduled to reprice within one year, 27% was scheduled to reprice in one - five years, and 41% was scheduled to reprice over five years. As noted in the above securities discussion, the drop in interest rates at midyear is believed to have reduced the overall duration and average life of the loan portfolio and to have contributed to an increase in the premium fair value of the portfolio over book value.
79
Asset Quality.
Asset quality metrics remained favorable and generally improved slightly from the prior quarter and the start of the year. Third quarter annualized net loan charge-offs measured 0.20% of average loans and period-end non-performing assets were 0.26% of total assets. Accruing delinquent loans were 0.31% of total loans, including accruing loans over 90 days past due measuring 0.07% of total loans. Loans identified as troubled debt restructurings decreased slightly to $22 million. Loans which became non-accruing totaled $7 million which was within the general run rate range of $4-10 million experienced for a number of recent quarters. At period-end, the total contractual balance of purchased credit impaired loans was $30 million, with a $15 million carrying value. The $15 million discount included $5 million in accretable yield and $10 million in nonaccretable discount. The 44 Business Capital business combination included impaired loans with a book value of $6.2 million and a fair value of $2.6 million, including $0.7 million in accretable discount.
Loan Loss Allowance
. The determination of the allowance for loan losses is a critical accounting estimate. The Company considers the allowance for loan losses appropriate to cover probable losses which can be reasonably estimated in the loan portfolio as of the balance sheet date. Under accounting standards for business combinations, acquired loans are recorded at fair value with no loan loss allowance on the date of acquisition. A loan loss allowance is recorded by the Company for the emergence of new probable and estimable losses on acquired loans which were not impaired as of the acquisition date. Because of the accounting for acquired loans, some measures of the loan loss allowance are not comparable to periods prior to the acquisition date or to peer measures.
The loan loss allowance increased by $4 million, or 10%, in the first nine months of 2016. The ratio of the allowance to total loans increased slightly to 0.71% from 0.69% over this period. The allowance on loans from business activities remained unchanged at 0.76% of related loans; net annualized charge-offs of these loans measured 0.21% in the first nine months of 2016. The allowance on acquired loans increased to 0.46% from 0.41% of related loans; net annualized charge-offs of these loans measured 0.23% in the first nine months of 2016. At period-end, the allowance provided 3.4X coverage of annualized year-to-date net charge-offs and 2.1X coverage of period-end non-accrual loans. Criticized loans decreased to 1.6% of total assets from 1.9% at the start of the year due primarily to a $14 million decrease in criticized loans from business activities, including an $8 million decrease to $52 million in potential problem loans, which the Company defines as substandard accruing loans from business activities. The ratio of criticized assets to the total of the Bank’s Tier 1 Capital plus the loan loss allowance declined to 20% from 24% during the first nine months of 2016.
Deposits.
Berkshire increased its deposits in 2016 while also selling two outlying branches with $30 million in deposits. Total deposits increased by $161 million, or 3% for the year-to-date. Time deposits and money market accounts were the primary contributors to overall growth. Berkshire focuses on demand deposits, which grew by 3% for the first nine months of 2016, including both personal and commercial accounts. Personal account balances accounted for $90 million of the total deposit growth. Accounts over $250,000 increased by $249 million for the nine month period. The cost of deposits increased to 0.54% in the most recent quarter from 0.48% in the fourth quarter of 2015. This was primarily driven by higher time deposit costs, reflecting both the upward resetting of brokered deposits following the December rate increase, along with current market rates for raising new funds to support growth. Based on annual deposit summary reports as of midyear published by the FDIC, over the latest year Berkshire gained deposit market share in the median city in all major regional markets in which it competes.
The loans/deposits ratio increased to 105% at period-end compared to 102% at the start of the year and is expected to improve when the First Choice merger is completed.
Borrowings.
Total borrowings decreased by $125 million in the first nine months of 2016, which was largely funded with proceeds from investment sales. The decrease was mostly in short term Federal Home Loan Bank advances. The cost of borrowings increased to 1.53% in the most recent quarter from 0.96% in the fourth quarter of 2016. This increase included the impact of the 0.25% rate increase on the short term variable rate loans which constitute the preponderance of borrowings. Additionally, it included the approximate 0.50% impact from the activation of forward starting swaps in 2016 and which were fully active in the most recent quarter.
80
Derivative Financial Instruments and Hedging Activities.
The notional balance of derivative financial instruments increased by $486 million, or 36%, to $1.85 billion in the first nine months of 2016. This included a $370 million increase in economic hedges related to commercial loan interest rate swaps reflecting strong customer demand for fixed rate loan protection in the low rate environment that developed in 2016. The Company recognizes loan fee income on the sale of these financial instruments, as further discussed in a later section. Customer swaps issued by the Bank are backed by similar swaps transacted with the Company’s national financial institution counterparties. As a result, the $370 million increase represented approximately $185 million in commercial customer loan transactions. Hedging instruments related to mortgage banking increased by $98 million in 2016 due to increased volume of interest rate locks due to strong demand by mortgage customers for purchase and refinancing commitments in the attractive borrowing environment.
At year-end 2015, the Company had $300 million of forward starting interest rate swaps which were scheduled to become active during the first three quarters of 2016, and which are now all fully active including swaps that activated in the third quarter. These are all fixed payment swaps with a 2.29% weighted average pay rate and a 2.5 year average remaining maturity at period-end. They are hedging borrowings that had a 0.52% variable rate cost at period-end. The Company anticipates that this cost will increase in the future and that the net cost of these fixed rate hedges will correspondingly decline. The unrealized loss on these swaps increased to $11 million from $9 million over the first nine months and this was the primary component of the overall net loss on derivative financial instruments, which increased to $14 million from $11 million over this period. Most of this loss (after tax) is reflected in changes in other comprehensive income which is a component of shareholders’ equity.
Shareholders’ Equity.
Berkshire’s capital metrics improved in the first nine months of 2016, largely due to the benefit of retained earnings, which were sufficient to support dividends and organic growth as well as higher capital ratios. Total equity increased by $45 million, or 5%, including the benefit of $30 million in retained earnings. Additionally, accumulated other comprehensive income increased by $12 million due to the net after-tax impact on the fair value of available for sale securities and derivative instruments in the lower rate environment at period end. Book value per share increased by 5% to $29.97 and the ratio of equity to assets improved to 11.8% from 11.3%.
The Company also evaluates changes in tangible book value, a non-GAAP financial measure which is a commonly considered valuation metric used by the investment community and which parallels some regulatory capital measures. Tangible book value increased by $31 million, or 6%, and is net of goodwill and other intangible assets. The 44 Business Capital business combination resulted in a $16 million increase in goodwill. Tangible book value per share increased by 5% to $18.78 during the first nine months of 2016. The ratio of tangible equity to tangible assets increased to 7.7% at the end of the most recent quarter, compared to 7.4% at the start of the year. The Company and the Bank remained Well Capitalized under regulatory guidelines at period-end.
The Company is implementing stress test processes which are required for banks that reach the $10 billion threshold. These include the evaluation of capital adequacy under severely stressed economic conditions. The Company plans to run through its first dry run of this testing in 2017. The Company will be further evaluating its capital structure based on the additional risk analysis that will result from this work. The Company expects to have this stress test functionality fully operating by the end of 2017.
COMPARISON OF OPERATING RESULTS FOR THE THREE MONTHS AND NINE MONTHS ENDED SEPTEMBER 30, 2016 AND 2015
Summary.
Berkshire’s results include the Hampden operations acquired on April 17, 2015, the Firestone operations acquired on August 7, 2015, and the 44 Business Capital operations acquired on April 29, 2016. For nine month results, many measures of revenue, expense, income, and average balances increased compared to 2015 since Hampden and Firestone were not owned for the full period in 2015. Per share measures were also affected by new shares issued for merger consideration. Much of the following discussion will focus on third quarter results which are more directly comparable because they include operations of Hampden and Firestone in both years. Additionally, some comparisons are made to the second quarter of 2016 to illustrate current trends.
81
As noted previously, Berkshire uses a non-GAAP measure of adjusted net income (or adjusted earnings) to supplement its evaluation of its operating results. Adjusted net income excludes certain amounts not viewed as related to its normalized operations. These adjusting items consist primarily of merger, acquisition, conversion, and restructuring expenses, together with gains recorded on securities. Berkshire views its net merger related costs as part of the economic investment for its acquisitions. Please see the Non-GAAP reconciliation section of this discussion for more discussion and information about adjusted net income and other non-GAAP financial measures discussed in this report.
Third quarter GAAP net income increased by 11% to $16 million from year to year, while GAAP EPS increased by 8% to $0.53 including the impact of additional shares issued. Nine month GAAP net income increased by 44% to $48 million, while GAAP EPS increased by 31% to $1.57.
Third quarter adjusted EPS increased by 6% to $0.57 in 2016 from $0.54 in 2015. Compared to the prior year, third quarter operations in 2016 included a $0.02 contribution from 44 Business Capital but had a $0.03 reduction in the contribution from tax credit investment projects. Third quarter operations in 2016 also included the full benefit of cost saves achieved from Hampden, together with stronger mortgage banking results and other organic revenue gains.
Third quarter return on equity and return on assets improved year-over-year on both a GAAP and adjusted basis. GAAP return on assets improved to 0.82% and adjusted return on assets improved to 0.88%. Third quarter profitability benefited from higher fee income and improved efficiency, which more than offset a declining net interest margin. Fee income improved from 20% to 24% of total revenue. The efficiency ratio improved to 57.9% from 60.4%. The efficiency ratio is a non-GAAP financial measure that compares adjusted expenses and revenues to assess how well the Company is managing its costs. Return on equity improved to 7.75% while adjusted return on tangible equity improved to 13.0%. This non-GAAP financial measure compares adjusted earnings to average tangible equity in order to measure the rate of internal capital generation to support ongoing growth and dividends
Revenue.
Year over year, nine month revenue increased by 13% and third quarter net revenue increased by 10%. This included the benefit of a 7% increase compared to the second quarter of 2016. Annualized third quarter revenue per share increased to $9.99 in 2016 from $9.27 in the prior year. The $7 million year-over-year pickup in third quarter revenue was primarily driven by a $4 million improvement in fee income, together with a $1 million increase in net interest income and a net increase of $2 million in other non-interest income.
Net Interest Income.
The $1 million year-over-year increase in third quarter net interest income was driven by an 11% increase in average loan balances due primarily to organic growth in all major lending categories. Total average earning assets increased by 6%. The benefit of volume growth was largely offset by a decrease in the net interest margin to 3.25% from 3.37% for these periods. This 0.12% decrease included an approximate 0.09% impact from the activation of forward starting interest rate swaps in 2016, which increased the effective pay rate on $300 million in borrowings. Results in the most recent quarter included the full impact of these costs, which have a remaining contractual life of 2.5 years.
The Company estimates that its net interest income marginally benefited from the 0.25% increase in short term interest rates, but this benefit was more than offset by the flattening of the yield curve and the yield compression related to ongoing low interest rates. Based on the market’s forward interest rate expectation, the Company’s models indicate modest margin pressure from these forces in the coming quarters. Net interest income also includes the benefit of accretion from purchased credit impaired loans, including recoveries.
Loan accretion totaled $2.2 million in the third quarter and $6.3 million in the first nine months of 2016, compared to $2.7 million and $5.2 million in the same periods of 2015. The Company measures its net interest margin before purchased loan accretion, and this non-GAAP measure decreased in the third quarter to 3.13% in 2016 from 3.22% in 2015. The Company expects to record significant discount on purchased credit impaired loans related to the First Choice Bank acquisition and this may add significant new accretion benefit depending on final purchased loan accounting impacts. Other elements of net interest income, including deposit costs, may also be impacted by the First Choice acquisition.
82
Non-Interest Income.
Third quarter non-interest income increased year-over-year by $6.2 million, or 49%, to $18.9 million in 2016. This included a $4.4 million increase over the second quarter of 2016. Total fee income increased by $4.4 million year-over-year due to a $3.6 million pickup in loan related fees and a $1.2 million gain in mortgage banking revenues. The major contributors to loan related fees are commercial loan interest rate swap revenue, SBA loan sale gains, and gains on the sale of portfolio loans. All of these categories increased from year to year and benefited from the lower interest rates prevailing in 2016. Third quarter swap revenues grew by $0.9 million to $1.5 million and were related to stronger commercial real estate loan originations. SBA loan sale gains totaled $1.0 million in the most recent quarter and were contributed by the new 44 Business Capital operations. Gains on portfolio loan sales increased by $1.2 million to $1.5 million as Berkshire increased its financial institution banking business. The gain in mortgage banking revenues was due to higher volumes and stronger pricing spreads based on stronger demand for mortgage originations in the favorable interest rate environment in 2016. The $0.3 million decrease in deposit related fees was primarily due to lower overdraft fee collections. The category of other non-interest income in the most recent quarter included $0.9 million related to bank owned life insurance and was net of $1.5 million in charges for the amortization of tax credit related investments. This charge was $2.9 million in the third quarter of 2015.These charges are more than offset by credits to income tax expense related to these projects. The year to year decrease was due to lower qualifying investments as further addressed in the following discussion of income tax expense. Non-interest income in the most recent quarter included $0.7 million in financial institution banking income and a $0.6 million gain arising from the sale of the two branches previously discussed.
Loan Loss Provision.
The provision for loan losses increased year-to-year by $1.0 million for the first nine months and $0.5 million for the third quarter. The provision for loan losses is a charge to earnings in an amount sufficient to maintain the allowance for loan losses at a level deemed adequate by the Company. It is an estimate of the probable and estimable loan losses in the portfolio as of period-end. The level of the allowance is a critical accounting estimate and the level of the allowance was included in the discussion of financial condition. The amount of the provision exceeded net charge-offs, as the allowance has risen due to loan portfolio growth resulting from loan originations.
Non-Interest Expense.
Nine month non-interest expense decreased by $6.3 million, or 4%. Third quarter non-interest expense decreased by $0.5 million, or 1%. These decreases were due to merger and restructuring charges, which decreased by $12.7 million for the nine month period and by $1.2 million for the third quarter. Elevated charges in 2015 were due primarily to the Hampden acquisition. The non-GAAP measure of adjusted expenses excludes these charges. Adjusted expenses increased by $6.3 million, or 5%, for the first nine months of the year. This nine month increase was primarily due to the impact of Hampden and Firestone, which were not owned for the full nine months in 2015. Third quarter adjusted expenses increased by $0.7 million, or 1%. This quarterly increase was related to the revenue increase, which measured 10% and included the new 44 Business Capital operations acquired in 2016. Expenses also benefited from completion of Hampden cost saves and restructuring activities in the second half of 2015. The improvement in the efficiency ratio reflected the positive operating leverage from the strong revenue growth with little growth in adjusted expenses. Annualized third quarter adjusted expense measured 2.35% of average assets in 2016 compared to 2.44% in 2015. Full time equivalent positions at September 30, 2016 totaled 1,208, compared to 1,169 a year earlier.
Income Tax Expense.
The effective tax rate was 8% in the first nine months of 2015, but has been in the range of 25-30% during the first three quarters of 2016. This is due to the lower volume of qualifying tax credit investment projects as a result of new IRS guidance in 2016. Such investment projects continue to be developed by commercial relationships in Berkshire’s markets and they continue to provide an attractive but reduced return. As a result, the Company expects to continue to invest at current levels and to continue to post an effective tax rate on normal operations in the 25-30% range for the foreseeable future. Merger related charges are expected to reduce the GAAP tax rate below this normalized range. At current levels, the Company’s normalized effective tax rate before the benefit of tax credit investment projects is in the area of 35%. While these projects are expected to keep this rate in the 25-30% range, the benefit of the tax credits is substantially offset by charges to amortize these investments which are recorded in other non-interest income. The net benefit to earnings per share of these projects was $0.01 in the most recent quarter and the Company expects an annualized benefit of approximately $0.04 per share for the
83
foreseeable future. Quarterly benefits are expected to be variable depending on the timing of project closings and completions.
Total Comprehensive Income.
Total comprehensive income includes net income together with other comprehensive income. Other comprehensive income consists primarily of changes in the net fair value of available for sale securities and derivative hedges, net of related income taxes. These changes normally result from changes in market interest rates. Securities prices generally move inversely to interest rates and the value of the Company’s fixed payment swaps generally moves in the same direction as interest rates, as measured on the date of the balance sheet. The changes for the larger and longer direction securities portfolio often exceed the changes related to swaps. In the first nine months of 2016, longer term interest rates decreased and as a result, other comprehensive income was positive. In the first nine months of 2015, longer term interest rates generally increased and the result was an other comprehensive loss. In both years, the direction of interest rates changed in the third quarter, and therefore there was a loss in the third quarter of 2016 compared to income in 2015.
Acquisitions.
The acquisition of certain business operations and assets related to 44 Business Capital was completed on April 29, 2016 and is described in Note 2 of the financial statement. This acquisition, located in the greater Philadelphia area, provides access to attractive mid-Atlantic commercial lending markets. 44 Business Capital specializes in originating SBA 7(a) guaranteed business loans, which generally exceed $1 million in loan size. This business sells the guaranteed portions of the loans and the Bank retains the unguaranteed portion. The business generates gains on the sale of these loans which is reported in loan related fee income. The Bank retains the servicing rights on sold loans; the notional balance of this servicing portfolio was $148 million at acquisition date, and the fair value premium was approximately 2.4% of the notional balance. The unguaranteed portion of the loans had a contractual balance of $43 million and was valued at $37 million at acquisition, representing a fair value discount of approximately 14% of the contractual balance. This business is complementary to Berkshire’s existing SBA loan program which generates smaller SBA loans. 44 Business Capital is also located within the market served by First Choice Bank and Berkshire expects to develop synergies between those operations, as well as with Berkshire’s Firestone Financial equipment lending operations. Berkshire organized its new Specialty Lending group in the most recent quarter which will oversee these operations. The 44 Business Capital acquisition by Berkshire Bank was financed primarily with cash and resulted in $16 million in goodwill that was recorded. Including merger costs, Berkshire estimates that this acquisition resulted in tangible book value dilution of $0.52 per share which the Company targets to earn back from earnings accretion within five years including a first year ramp up period. The Company is targeting an IRR in excess of 15% for this transaction. No cost savings were targeted with this acquisition. The pro forma analysis in the financial statement (assuming that the acquisition was completed on January 1, 2015) estimates that pro forma Berkshire earnings per share would have been $1.28 in the first nine months of 2015 including 44 Business Capital operations, compared to the $1.20 actual result without this business line. Pro forma combined results under these assumptions in the first nine months of 2016 would have been $1.60 in earnings per share (before acquisition expenses) compared to the $1.57 actually posted by the Company during this period. These results are qualified as set forth in the financial statement, and do not include the business expansion and synergies that Berkshire plans to develop this business and to achieve its payback goals.
The notes to the financial statements describe the pending acquisition of First Choice Bank. Berkshire expects to issue approximately 4.3 million common shares as consideration for the First Choice common and preferred stock. Based on the $27.71 closing price of Berkshire stock at period-end, the common stock consideration is valued at approximately $120 million. The actual valuation will be based on the stock price on the date the merger is completed. At September 30, 2016, First Choice reported $1.1 billion in assets, including $462 million in investment securities, $452 million in loans, and $885 million in deposits.
Liquidity and Cash Flows.
Berkshire manages its liquidity and cash flows with the goal of meeting expected as well as stressed cash needs for the foreseeable future. For the first nine months of 2016, Berkshire used deposit growth and securities sales to fund loan growth and pay down borrowings. Loan growth included the purchase of loans related to the 44 Business Capital business combination. The loans/deposits ratio increased to 105% from 102% over the nine months. At period-end, the Company had approximately $608 million in borrowing availability with the Federal Home Loan Bank, compared to $576 million at the start of the year. The Bank is exploring options
84
to increase the amounts of collateral available to support potential advance availability under the Federal Reserve Bank secured lending facility. The First Choice acquisition is expected to provide significant new liquidity to the combined Company. Additionally, the First Choice acquisition is intended to provide access to new deposit funding sources in attractive mid-Atlantic markets. Also, the sophisticated operations of the First Choice national mortgage banking business is expected to improve Berkshire’s overall access to national secondary mortgage markets.
Berkshire generally plans that over the medium term, deposit growth will be the primary source of funds and loan growth will be the primary use of funds. The Bank is diversifying its deposit sources including institutional and wholesale sources as part of the expansion of its liquidity management program and to provide additional options for managing its funds costs and asset liability objectives. In select cases, the Bank provides insured brokered reciprocal money market deposits to large institutional accounts to supplement its deposit insurance protection. The Bank is also expanding its use of short term institutional borrowings and FHLBB borrowings will continue to be a significant source of liquidity for daily operations and borrowings targeted for specific asset/liability purposes. The Company also uses interest rate swaps in managing its funds sources and uses.
Berkshire Hills Bancorp had a cash balance totaling $43 million as of September 30, 2016 which was on deposit with Berkshire Bank. The primary long run routine sources of funds for the Parent are expected to be dividends from Berkshire Bank and Berkshire Insurance Group, as well as cash from the exercise of stock options. The Bank paid $24 million in dividends to the Parent in the first nine months of 2016. The Parent also received $11 million in accumulated receivables from its subsidiaries during this period. The Parent purchased $18 million in equity securities during the first nine months of the year. Additionally, the Parent sometimes uses cash as an element of merger consideration and sometimes acquires cash as a source of funds as a result of business combinations. The Parent has a line of credit with a correspondent bank which was increased from $10 million to $15 million in 2016 due to the growth of the Company. This line was undrawn at the start of the year and was fully drawn at September 30, 2016.
Capital Resources.
Please see the “Shareholders’ Equity” section of the Comparison of Financial Condition for a discussion of shareholders’ equity together with the note on Shareholders' Equity in the consolidated financial statements. At September 30, 2016, the regulatory capital ratios of the Bank and the Company continued to be consistent with the requirements to be classified as “Well Capitalized.” Additional information about regulatory capital is contained in the notes to the consolidated financial statements and in the 2015 Form 10-K.
Berkshire views its earnings and related internal capital generation as a primary source of capital to support dividends and growth of the franchise. Additionally, the Company generally uses the issuance of common stock as the primary source of consideration for bank acquisitions, and such acquisitions may result in net increases or decreases in its capital ratios. Berkshire’s long term objective is to generate a double digit annual return on equity, and the Company evaluates lending, investment, and acquisition decisions with this objective as a benchmark. The Company also evaluates its return on tangible equity as an indicator of its capital generation to support ongoing balance sheet growth. The Risk Management and Capital Committee of Berkshire’s Board of Directors is responsible for assisting the Board in planning for future capital needs and for ensuring compliance with regulations pertaining to capital structure and levels. The Company believes that the market for its stock is an additional capital resource over the long run and that Berkshire’s common stock is a significant resource available as merger consideration in the event of future acquisitions and business combinations. Additionally, the Company continues to monitor market conditions for other forms of regulatory capital such as preferred stock or subordinated debt, which are additional potential future capital resources to the Company and/ or the Bank. The Company continues to enhance its internal processes for evaluating capital adequacy under various scenarios including stressed conditions.
The Company has initiated stress test processes which are required for banks that reach the $10 billion threshold. These include the evaluation of capital adequacy under severely stressed economic conditions. The Company plans to execute its first dry run of this testing in 2017. The Company will be further evaluating its capital structure based on the additional risk analysis that will result from this work. The Company expects to have this stress test functionality fully operating by the end of 2017.
85
On April 29, 2016, the Company issued approximately 45 thousand shares of stock as a component of the consideration paid for the Bank’s acquisition of the assets and operations of 44 Business Capital LLC. The Company’s agreement to acquire First Choice Bank utilizes Berkshire’s common stock as 100% of the merger consideration. The Company expects to issue approximately 4.3 million common shares to complete this transaction, which is targeted for the fourth quarter of 2016. This transaction, together with the planned deposit deleveraging, is expected to contribute positively to the capital adequacy ratios of the Company.
Off-Balance Sheet Arrangements and Contractual Obligations.
In the normal course of operations, Berkshire engages in a variety of financial transactions that, in accordance with generally accepted accounting principles are not recorded in the Company’s financial statements. These transactions involve, to varying degrees, elements of credit, interest rate, and liquidity risk. Such transactions are used primarily to manage customers’ requests for funding and take the form of loan commitments and lines of credit. Further information about the Company’s off-balance sheet arrangements and information relating to payments due under contractual obligations is presented in the 2015 Form 10-K. Changes in the fair value of derivative financial instruments and hedging activities are included on the balance sheet and information related to these matters is reported in the related footnote to the consolidated financial statements, and was included in management’s discussion of changes in financial condition. In the first nine months of 2016, the Company completed the acquisition of assets and operations related to 44 Business Capital. Berkshire expects to enter into more derivative financial contracts and off-balance sheet arrangements as a result of taking on the SBA loan secondary marketing operations of 44 Business Capital, as well as other initiatives it is pursuing as part of its financial institutions banking initiative. At September 30, Berkshire had an agreement to acquire First Choice Bank, subject to customary regulatory and shareholder approvals. The Company expects to complete this transaction in the fourth quarter of 2016. First Choice has a national mortgage banking operation with significant secondary market activity which is expected to increase the overall off-balance sheet arrangements and contractual obligations for the combined company. Berkshire also has an agreement to acquire certain assets and operations of Ronald Lazzaro, PC (“Lazzaro”) and an agreement to sell the operations and related assets of Renaissance Investment Group (“Renaissance:”), which was completed on October 31, 2016. Taken together, these two transactions will have no significant net effect on wealth assets under management, Renaissance is a registered investment advisor based in Lenox, Massachusetts. Lazzaro is a financial planning team based in Rutland, Vermont. The Bank has agreed to pay $10.2 million, including $3.4 million in future contingent consideration comprised of cash and stock. The Company is targeting that these two transactions together will be accretive to future earnings per share after targeted costs saves are completed. They are targeted to be more complementary to operations and to provide better opportunities for synergies and revenue expansion.
Fair Value Measurements.
The Company records fair value measurements of certain assets and liabilities, as described in the related note in the financial statements. There were no significant changes in the fair value measurement methodologies at September 30, 2016 compared to December 31, 2015. The Company compares the carrying value to fair value for major categories of financial assets and liabilities. The biggest difference relates to loans, and the change in the premium value of loans during the first nine months of the year was primarily related to the decrease in long term interest rates. The fair value of net loans exceeded carrying value by 1.3% at period-end 2016, compared to 0.7% at the end of 2015.
APPLICATION OF CRITICAL ACCOUNTING POLICIES AND ACCOUNTING ESTIMATES, AND RECENT ACCOUNTING PRONOUNCEMENTS
The Company’s significant accounting policies are described in Note 1 to the consolidated financial statements in this Form 10-Q and in the most recent Form 10-K. Please see those policies in conjunction with this discussion. The accounting and reporting policies followed by the Company conform, in all material respects, to accounting principles generally accepted in the United States and to general practices within the financial services industry. The preparation of financial statements in conformity with accounting principles generally accepted in the United States requires management to make estimates and assumptions that affect the amounts reported in the financial statements and accompanying notes. While the Company bases estimates on historical experience, current information and other factors deemed to be relevant, actual results could differ from those estimates.
86
The SEC defines “critical accounting policies” as those that require application of management’s most difficult, subjective or complex judgments, often as a result of the need to make estimates about the effect of matters that are inherently uncertain and may change in future periods. Please see those policies in conjunction with this discussion. Management believes that the following policies would be considered critical under the SEC’s definition:
Allowance for Loan Losses.
The allowance for loan losses represents probable credit losses that are inherent in the loan portfolio at the financial statement date and which may be estimated. Management uses historical information, as well as current economic data, to assess the adequacy of the allowance for loan losses as it is affected by changing economic conditions and various external factors, which may impact the portfolio in ways currently unforeseen. Although management believes that it uses appropriate available information to establish the allowance for loan losses, future additions to the allowance may be necessary if certain future events occur that cause actual results to differ from the assumptions used in making the evaluation. Conditions in the local economy and real estate values could require the Company to increase provisions for loan losses, which would negatively impact earnings.
Acquired Loans.
Loans that the Company acquired in business combinations are initially recorded at fair value with no carryover of the related allowance for credit losses. Determining the fair value of the loans involves estimating the amount and timing of principal and interest cash flows initially expected to be collected on the loans and discounting those cash flows at an appropriate market rate of interest. Going forward, the Company continues to evaluate reasonableness of expectations for the timing and the amount of cash to be collected. Subsequent decreases in expected cash flows may result in changes in the amortization or accretion of fair market value adjustments, and in some cases may result in the loan being considered impaired. For collateral dependent loans with deteriorated credit quality, the Company estimates the fair value of the underlying collateral of the loans. These values are discounted using market derived rates of return, with consideration given to the period of time and costs associated with the foreclosure and disposition of the collateral.
Income Taxes.
Significant management judgment is required in determining income tax expense and deferred tax assets and liabilities. The Company uses the asset and liability method of accounting for income taxes in which deferred tax assets and liabilities are established for the temporary differences between the financial reporting basis and the tax basis of the Company's assets and liabilities. The realization of the net deferred tax asset generally depends upon future levels of taxable ordinary income, taxable capital gain income, and the existence of prior years' taxable income, to which "carry back" refund claims could be made. A valuation allowance is maintained for deferred tax assets that management estimates are more likely than not to be unrealizable based on available evidence at the time the estimate is made. In determining the valuation allowance, the Company uses historical and forecasted future operating results, including a review of the eligible carry-forward periods, tax planning opportunities and other relevant considerations. In particular, income tax benefits and deferred tax assets generated from tax-advantaged commercial development projects are based on management's assessment and interpretation of applicable tax law as it currently stands. These underlying assumptions can change from period to period. For example, tax law changes or variances in projected taxable ordinary income or taxable capital gain income could result in a change in the deferred tax asset or the valuation allowance. Should actual factors and conditions differ materially from those considered by management, the actual realization of the net deferred tax asset could differ materially from the amounts recorded in the financial statements. If the Company is not able to realize all or part of its net deferred tax asset in the future, an adjustment to the deferred tax asset in excess of the valuation allowance would be charged to income tax expense in the period such determination is made.
Goodwill and Identifiable Intangible Assets.
Goodwill and identifiable intangible assets are recorded as a result of business acquisitions and combinations. These assets are evaluated for impairment annually or whenever events or changes in circumstances indicate the carrying value of these assets may not be recoverable. When these assets are evaluated for impairment, if the carrying amount exceeds fair value, an impairment charge is recorded to income. The fair value is based on observable market prices, when practicable. Other valuation techniques may be used when market prices are unavailable, including estimated discounted cash flows and analysis of market pricing multiples. These types of analyses contain uncertainties because they require management to make assumptions and
87
to apply judgment to estimate industry economic factors and the profitability of future business strategies. In the event of future changes in fair value, the Company may be exposed to an impairment charge that could be material.
Determination of Other-Than-Temporary Impairment of Securities.
The Company evaluates debt and equity securities within the Company's available for sale and held to maturity portfolios for other-than-temporary impairment ("OTTI"), at least quarterly. If the fair value of a debt security is below the amortized cost basis of the security, OTTI is required to be recognized if any of the following are met: (1) the Company intends to sell the security; (2) it is "more likely than not" that the Company will be required to sell the security before recovery of its amortized cost basis; or (3) for debt securities, the present value of expected cash flows is not sufficient to recover the entire amortized cost basis. For all impaired debt securities that the Company intends to sell, or more likely than not will be required to sell, the full amount of the loss is recognized as OTTI through earnings. Credit-related OTTI for all other impaired debt securities is recognized through earnings. Noncredit related OTTI for such debt securities is recognized in other comprehensive income, net of applicable taxes. In evaluating its marketable equity securities portfolios for OTTI, the Company considers its intent and ability to hold an equity security to recovery of its cost basis in addition to various other factors, including the length of time and the extent to which the fair value has been less than cost and the financial condition and near term prospects of the issuer. Any OTTI on marketable equity securities is recognized immediately through earnings. Should actual factors and conditions differ materially from those expected by management, the actual realization of gains or losses on investment securities could differ materially from the amounts recorded in the financial statements.
Fair Value of Financial Instruments.
The Company uses fair value measurements to record fair value adjustments to certain financial instruments and to determine fair value disclosures. Trading assets, securities available for sale, and derivative instruments are recorded at fair value on a recurring basis. Additionally, from time to time, the Company may be required to record at fair value other assets on a nonrecurring basis, or to establish a loss allowance or write-down based on the fair value of impaired assets. Further, the notes to financial statements include information about the extent to which fair value is used to measure assets and liabilities, the valuation methodologies used and its impact to earnings. For financial instruments not recorded at fair value, the notes to financial statements disclose the estimate of their fair value. Due to the judgments and uncertainties involved in the estimation process, the estimates could result in materially different results under different assumptions and conditions.
88
There were no material changes to the way that the Company measures market risk in the first nine months of 2016. For further discussion about the Company’s Quantitative and Qualitative Aspects of Market Risk, please review Item 7A of the Report 10-K filed for the fiscal year ended December 31, 2015. Berkshire’s objective is to maintain a neutral or asset sensitive interest rate risk profile, as measured by the sensitivity of net interest income to market interest rate changes. The Company measures this sensitivity primarily by evaluating the impact of ramped and shocked interest rate changes on net interest income in the one year, two year, and three year time horizons, including parallel shifts and yield curve twists and the market’s forward yield curve at the measurement date. The Company also evaluates its equity at risk from interest rate changes through discounted cash flow analysis. This measure assesses the present value changes to equity based on long term impacts of rate changes beyond the time horizons evaluated for net interest income at risk. Due to its growth and changes in the market risk environment, the Company has undertaken initiatives to review its processes of modeling loan and deposit behaviors. The Company has also contracted to upgrade and enhance its interest rate risk modeling systems and is working with third party vendors to expand the inputs and outputs of its modeling processes. As a result, the Company anticipates that there may be changes to its market risk measurement process by year-end 2016. The Company views its current processes as adequate for measuring and monitoring market risk and is undertaking these processes as part of its infrastructure development to support further growth and diversification. Any material impacts to its assessment of its market risk and any significant changes in methodology will be evaluated to ascertain their impact on modeling results and conclusions.
As of September 30, 2016, the Company remained modestly asset sensitive in most interest rate parallel shift scenarios. Increases in interest rates which result from a parallel shift in the yield curve generally result in higher interest income in most future periods compared to the base scenario of unchanged interest rates. Interest income increases approximately 3% in the second year in a 200 basis point upward parallel ramped shift compared to this base scenario. This reflects the repricing of assets in an upward rate environment, together with the benefit of the fixed payment swaps. Interest income increases by approximately 2% in the first year of a 100 basis point upward ramped shift. In most scenarios, the increase in interest income gets larger in year two and then larger again in year three. The Company became more asset sensitive in the third quarter. This included the benefit of growth in demand deposits, lower overnight borrowings, and reductions in mortgage and investment balances.
If interest rates remain unchanged, the Company’s net interest income could be negatively impacted compared to the current run rate due to the ongoing effects of asset yield compression which have pressured industry margins in recent years. The forward interest rate curve at period-end anticipates a future flattening of the yield curve. The Company also evaluates its projections under the scenario of the forward interest rate curve. The Company was asset sensitive at September 30, 2016 based on the forward curve at that date, but with less benefit compared to the above parallel shift scenarios.
Through its pricing disciplines and mix of business, Berkshire’s goal is to manage its balance sheet to support the net interest margin in the “lower for longer” market expectation that developed around midyear 2016. The Company anticipates that the margin will modestly decrease in 2017 from the impact of yield compression on changes related to business activities excluding any merger impacts from the First Choice acquisition. First Choice Bank operates with a lower net interest margin and is viewed by Berkshire as having a liability sensitive interest rate profile. Berkshire evaluated these impacts with its merger analytics and the projections of attractive returns on this investment include the longer term expected operations of this business combination.
In addition to modeling market risk in relation to net interest income, the Company also models net income at risk in various interest rate scenarios. Various sources of fee income, including interest rate swap income and mortgage banking revenue, are sensitive to interest rates. Other components of revenue and expense are also considered and net income estimates include the impact of income taxes on modeled changes. Management considers the risks to net income in evaluating its overall asset liability management and strategies. As part of the modeling initiatives that management is currently undertaking, the Company will also be enhancing its modeling of net income at risk as well as integrating with its capital stress testing initiatives. Additionally, these initiatives will include the modeling impacts of First Choice Bank and its relatively higher proportion of non-interest income at risk based on its mortgage banking operations.
89
The Company also estimates the sensitivity of the economic value of its equity to interest rate shocks. The Company seeks to avoid having excess long term earnings at risk when interest rates rise in the long term future, as anticipated. At September 30, 2016, the Company estimated that the economic value of equity would decrease by approximately 8% in the event of a 200 basis point upward interest rate shock, which was within the Company’s policy limits. This compares to 11% at the start of the year; the decrease includes the benefit of third quarter activity that increased the asset sensitivity of net interest income. This estimate is subject to numerous assumptions and uncertainties and is not intended as a projection of future operating results.
In a prolonged low rate environment, Berkshire has a number of business strategies to support its net interest income and margin objectives. These include changes in volumes and mix of interest bearing assets and liabilities, some of which are discussed above. The Company also evaluates its pricing strategies on an ongoing basis, and considers its investment, borrowings, and derivatives strategies in managing its income and risk profile. Due to the limitations and uncertainties relating to model assumptions, the modeled computations should not be relied on as projections of income. Further, the computations do not reflect any actions that management may undertake in response to changes in interest rates.
90
a) Disclosure controls and procedures.
The principal executive officers, including the principal financial officer, based on their evaluation of disclosure controls and procedures (as defined in Exchange Act Rules 13a-15(e) and 15d-15(e)) as of the end of the period covered by this Quarterly Report on Form 10-Q, have concluded that the Company’s disclosure controls and procedures were effective.
b) Changes in internal control over financial reporting.
There were no changes in the Company’s internal control over financial reporting that occurred during the last fiscal quarter that have materially affected, or are reasonably likely to materially affect, the Company’s internal control over financial reporting.
91
As of September 30, 2016, neither the Company nor the Bank was involved in any pending legal proceedings believed by management to be material to the Company’s financial condition or results of operations. Periodically, there have been various claims and lawsuits involving the Bank, such as claims to enforce liens, condemnation proceedings on properties in which the Bank holds security interests, claims involving the making and servicing of real property loans, and other issues incident to the Bank’s business. However, other than the items noted below, neither the Company nor the Bank is a party to any pending legal proceedings that it believes, in the aggregate, would have a material adverse effect on the financial condition or operations of the Company.
On April 28, 2016, Berkshire Hills and Berkshire Bank were served with a complaint filed in the United States District Court, District of Massachusetts, Springfield Division. The complaint was filed by an individual Berkshire Bank depositor, who claims to have filed the complaint on behalf of a purported class of Berkshire Bank depositors, and alleges violations of the Electronic Funds Transfer Act and certain regulations thereunder, among other matters. On July 15, 2016, the complaint was amended to add purported claims under the Massachusetts Consumer Protection Act. The complaint seeks, in part, compensatory, consequential, statutory, and punitive damages. Berkshire Hills and Berkshire Bank deny the allegations contained in the complaint and are vigorously defending this lawsuit.
On November 3, 2016, the Massachusetts Supreme Judicial Court issued a slip opinion containing an appellate ruling in favor of the Massachusetts Insurers Insolvency Fund (the “Fund”) in a civil case entitled, Massachusetts Insurers Insolvency Fund v. Berkshire Bank, Appeal no. SJC-12019. At issue in this case is the Fund’s right to recover from Berkshire Bank under M.G.L Ch. 175D, § 17 (3), workers compensation benefits paid by the Fund to a former employee after the workers compensation insurer previously responsible for paying those benefits failed. In earlier proceedings in the Massachusetts Superior Court, the trial judge had entered summary judgment in Berkshire Bank’s favor, finding that Berkshire Bank had no liability to the Fund in this instance. The Supreme Judicial Court reversed and remanded the case to the trial court for entry of judgment in favor of the Fund on the issue of liability. The case was originally bifurcated in the trial court to resolve the issue of liability first, and no evidence has been presented to date regarding the amount of any damages that Berkshire Bank may owe to the Fund. Further proceedings will now be required in the trial court to determine the amount of any such damages.
In addition to the other information set forth in this report, you should carefully consider the factors discussed below and in Part I, “Item 1A. Risk Factors” in our Annual Report on Form 10-K for the year ended December 31, 2015, which could materially affect our business, financial condition or future results. The risks described in this form are not the only risks that we face. Additional risks and uncertainties not currently known to us or that we currently deem to be immaterial also may materially adversely affect our business, financial condition and/or operating results.
There is no assurance when or even if the merger of First Choice Bank with and into Berkshire Bank will be completed.
Completion of the merger of First Choice Bank with and into Berkshire Bank is subject to satisfaction or waiver of a number of conditions set forth in the merger agreement. There can be no assurance that the Company, Berkshire Bank, and First Choice Bank will be able to satisfy the closing conditions or that closing conditions beyond their control will be satisfied or waived.
The Company, Berkshire Bank, and First Choice Bank can agree at any time to terminate the merger agreement, even if First Choice Bank stockholders have already voted to approve the merger agreement. The Company and First Choice Bank can also terminate the merger agreement under other specified circumstances.
Regulatory approvals may not be received, may take longer than expected or impose conditions that are not presently anticipated.
92
Before the merger may be completed, certain approvals or consents must be obtained from the various bank regulatory and other authorities in the United States, the State of New Jersey, and the Commonwealth of Massachusetts. There can be no assurance as to whether the federal or state regulatory approval will be received or the timing of the approvals. The Company is not obligated to complete the merger if the regulatory approvals received in connection with the completion of the merger include any conditions or restrictions that would constitute a "material adverse effect" as defined in the merger agreement. While the Company does not currently expect that any such conditions or restrictions would be imposed, there can be no assurance that they will not be, and such conditions or restrictions could have the effect of delaying or preventing completion of the merger.
Goodwill incurred in the merger may negatively affect the Company's financial condition.
To the extent that the merger consideration, consisting of the number of shares of the Company common stock issued or to be issued in the merger, exceeds the fair value of the net assets, including identifiable intangibles of First Choice Bank, that amount will be reported as goodwill by the Company. In accordance with current accounting guidance, goodwill will not be amortized but will be evaluated for impairment at least annually. A failure to realize expected benefits of the merger could adversely impact the carrying value of the goodwill recognized in the merger, and in turn negatively affect the Company's financial condition.
Berkshire Bank may be unable to successfully integrate First Choice Bank’s operations or otherwise realize the expected benefits from the merger, which would adversely affect the Company's results of operations and financial condition.
The merger involves the integration of two companies that have previously operated independently. The difficulties of combining the operations of the two companies include:
•
Integrating personnel with diverse business backgrounds;
•
Combining different corporate cultures; and
•
Retaining key employees.
The process of integrating operations could cause an interruption of, or loss of momentum in, the activities of the business and the loss of key personnel. The integration of the two companies will require the experience and expertise of certain key employees of First Choice Bank and its subsidiary, First Choice Loan Services, who are expected to be retained by Berkshire Bank. Berkshire Bank may not be successful in retaining these employees for the time period necessary to successfully integrate First Choice Bank’s and First Choice Loan Services’ operations with those of Berkshire Bank. The diversion of management's attention and any delay or difficulty encountered in connection with the merger and the integration of the two companies' operations could have an adverse effect on the business and results of operation of the Company following the merger.
The success of the merger will depend, in part, on the Company's ability to realize the anticipated benefits and cost savings from combining the business of First Choice Bank with and into Berkshire Bank. If Berkshire Bank is unable to successfully integrate First Choice Bank and successfully manage First Choice Loan Services as a wholly owned subsidiary, the anticipated benefits and cost savings of the merger may not be realized fully or may take longer to realize than expected. For example, the Company may fail to realize the anticipated increase in earning and cost savings anticipated to be derived from the acquisition. In addition, as with regard to any merger, a significant decline in asset valuations or cash flows may also cause the Company not to realize expected benefits.
93
(a) Recent Sales of Unregistered Securities
The Company occasionally engages in the practice of transferring unregistered securities for the purpose of completing business transactions. These shares are issued to vendors or other organizations as consideration for services performed in accordance with each contract. During the nine months ended September 30, 2016 and September 30, 2015, the Company transferred 50,120 shares and 4,269 shares, respectively.
(b) Not applicable.
(c) The following table provides certain information with regard to shares repurchased by the Company in the third quarter of 2016:
|
Total number of
|
Average price
|
Total number of shares
purchased as part of
publicly announced
|
Maximum number of
shares that may yet
be purchased under
|
||||||||||
|
Period
|
shares purchased
|
paid per share
|
plans or programs
|
the plans or programs
|
|||||||||
|
July 1-31, 2016
|
—
|
|
$
|
—
|
|
—
|
|
500,000
|
|
||||
|
August 1-31, 2016
|
—
|
|
—
|
|
—
|
|
500,000
|
|
|||||
|
September 1-30, 2016
|
—
|
|
—
|
|
—
|
|
500,000
|
|
|||||
|
Total
|
—
|
|
$
|
—
|
|
—
|
|
500,000
|
|
||||
On December 2, 2015, the Company announced that its Board of Directors authorized a new stock repurchase program, pursuant to which the Company may repurchase up to 500 thousand shares of the Company's common stock, representing approximately 1.6% of the Company’s then outstanding shares. The timing of the purchases will depend on certain factors, including but not limited to, market conditions and prices, available funds, and alternative uses of capital. The stock repurchase program may be carried out through open-market purchases, block trades, negotiated private transactions or pursuant to a trading plan adopted in accordance with Rule 10b5-1 under the Securities Exchange Act of 1934. Any repurchased shares will be recorded as treasury shares. The repurchase plan will continue until it is completed or terminated by the Board of Directors. As of September 30, 2016, no shares had been purchased under this program.
None.
Not applicable.
None.
94
|
2.1
|
|
Agreement and Plan of Merger, dated as of November 3, 2014, by and between Berkshire Hills Bancorp, Inc. and Hampden Bancorp, Inc. (1)
|
|
2.2
|
Agreement and Plan of Merger, dated as of May 21, 2015, by and among Firestone Financial Corp., Berkshire Hills Bancorp, Inc., Berkshire Bank, Jacob Acquisition LLC, and David S. Cohen, solely in his capacity as the representative of the Firestone security holders (2)
|
|
|
2.3
|
Agreement and Plan of Merger, dated as of June 24, 2016, by and among Berkshire Hills Bancorp, Inc., Berkshire Bank, and First Choice Bank (3)
|
|
|
3.1
|
|
Certificate of Incorporation of Berkshire Hills Bancorp, Inc. (4)
|
|
3.2
|
|
Amended and Restated Bylaws of Berkshire Hills Bancorp, Inc. (5)
|
|
4.1
|
|
Form of Common Stock Certificate of Berkshire Hills Bancorp, Inc. (4)
|
|
10.1
|
|
Three-Year Executive Change in Control Agreement by and among Berkshire Bank, Berkshire Hills Bancorp, Inc., and James M. Moses (6)
|
|
11.0
|
|
Statement re: Computation of Per Share Earnings is incorporated herein by reference to Part II, Item 8, “Financial Statements and Supplementary Data”
|
|
31.1
|
|
Certification of Chief Executive Officer pursuant to Section 302 of the Sarbanes-Oxley Act of 2002
|
|
31.2
|
|
Certification of Chief Financial Officer pursuant to Section 302 of the Sarbanes-Oxley Act of 2002
|
|
32.1
|
|
Certification of Chief Executive Officer pursuant to Section 906 of the Sarbanes-Oxley Act of 2002
|
|
32.2
|
|
Certification of Chief Financial Officer pursuant to Section 906 of the Sarbanes-Oxley Act of 2002
|
|
101
|
|
Shareholder Interactive data files pursuant to Rule 405 of Regulation S-T: (i) the Consolidated Statements of Condition, (ii) the Consolidated Statements of Income, (iii) the Consolidated Statements of Comprehensive Income, (iv) the Consolidated Statements of Changes in Shareholders’ Equity, (v) the Consolidated Statements of Cash Flows, and (vi) the Notes to Consolidated Financial Statements tagged as blocks of text and in detail.
|
_______________________________________
|
(1)
|
Incorporated by reference from the Exhibits to the Form 8-K filed on November 4, 2014.
|
|
(2)
|
Incorporated herein by reference from the Exhibits to the Form 8-K as filed on May 22, 2015.
|
|
(3)
|
Incorporated herein by reference from the Exhibits to the Form 8-K as filed on June 27, 2016.
|
|
(4)
|
Incorporated herein by reference from the Exhibits to Form S-1, Registration Statement and amendments thereto, initially filed on March 10, 2000, Registration No. 333-32146.
|
|
(5)
|
Incorporated herein by reference from the Exhibits to the Form 8-K as filed on April 28, 2015.
|
|
(6)
|
Incorporated herein by reference from the Exhibits to the Form 8-K as filed on September 23, 2016.
|
95
SIGNATURES
Pursuant to the requirements of the Securities Exchange Act of 1934, the registrant has duly caused this report to be signed on its behalf by the undersigned thereunto duly authorized.
|
|
BERKSHIRE HILLS BANCORP, INC.
|
|
|
|
|
|
|
|
|
|
|
Dated: November 9, 2016
|
By:
|
/s/ Michael P. Daly
|
|
|
Michael P. Daly
|
|
|
|
Chief Executive Officer
|
|
|
|
|
|
|
|
|
|
|
Dated: November 9, 2016
|
By:
|
/s/ James M. Moses
|
|
|
James M. Moses
|
|
|
|
Senior Executive Vice President, Chief Financial Officer
|
|
96
TABLE OF CONTENTS
Part IItem 1. Consolidated Financial Statements (unaudited)Note 1. Basis Of PresentationNote 2. AcquisitionNote 3. Trading SecurityNote 4. Securities Available For Sale and Held To MaturityNote 5. LoansNote 6. Loan Loss AllowanceNote 7. DepositsNote 8. Borrowed FundsNote 9. Capital Ratios and Shareholders EquityNote 10. Earnings Per ShareNote 11. Stock-based Compensation PlansNote 12. Derivative Financial Instruments and Hedging ActivitiesNote 13. Fair Value MeasurementsNote 14. Net Interest Income After Provision For Loan LossesNote 15. Subsequent EventsItem 2. Management S Discussion and Analysis Of Financial Condition and Results Of OperationsItem 3. Quantitative and Qualitative Disclosures About Market RiskItem 4. Controls and ProceduresPart IIItem 1. Legal ProceedingsItem 1A. Risk FactorsItem 2. Unregistered Sales Of Equity Securities and Use Of ProceedsItem 3. Defaults Upon Senior SecuritiesItem 4. Mine Safety DisclosuresItem 5. Other InformationItem 6. Exhibits