Use these links to rapidly review the document
UNITED STATES
SECURITIES AND EXCHANGE COMMISSION
WASHINGTON, D.C. 20549
FORM 20-F
|
(Mark One)
|
|
|
|
o
|
|
REGISTRATION STATEMENT PURSUANT TO SECTION 12(b) or (g) OF THE
SECURITIES EXCHANGE ACT OF 1934
|
|
OR
|
||
|
ý
|
|
ANNUAL REPORT PURSUANT TO SECTION 13 OR 15(d) OF THE SECURITIES EXCHANGE ACT OF 1934
|
|
For the fiscal year ended December 31, 2017
|
||
|
OR
|
||
|
o
|
|
TRANSITION REPORT PURSUANT TO SECTION 13 OR 15(d) OF THE SECURITIES EXCHANGE ACT OF 1934
|
|
OR
|
||
|
o
|
|
SHELL COMPANY REPORT PURSUANT TO SECTION 13 OR 15(d) OF THE SECURITIES EXCHANGE ACT OF 1934
|
Commission file number: 001-37775
Brookfield Business Partners L.P.
(Exact name of Registrant as specified in its charter)
N/A
Translation of Registrant's name into English)
Bermuda
(Jurisdiction of incorporation or organization)
73 Front Street Hamilton, HM 12 Bermuda
(Address of principal executive offices)
Brookfield Business Partners L.P.
73 Front Street
Hamilton, HM 12
Bermuda
Tel: +441-294-3309
(Name, Telephone, Email and/or Facsimile number and Address of Company Contact Person)
Securities registered or to be registered pursuant to Section 12(b) of the Act.
|
Title of each class
|
|
Name of each exchange on which registered
|
|
Limited Partnership Units
|
|
New York Stock Exchange
|
|
Limited Partnership Units
|
|
Toronto Stock Exchange
|
Securities registered or to be registered pursuant to Section 12(g) of the Act.
None
Securities for which there is a reporting obligation pursuant to Section 15(d) of the Act.
None
Indicate the number of outstanding shares of each of the issuer's classes of capital or common stock as of the close of the period covered by the annual report:
66,185,798 Limited Partnership Units as of
December 31, 2017
.
Indicate by check mark if the registrant is a well-known seasoned issuer, as defined in Rule 405 of the Securities Act.
Yes
o
No
ý
If this report is an annual or transition report, indicate by check mark if the registrant is not required to file reports pursuant to Section 13 or 15(d) of the Securities Exchange Act of 1934.
Yes
o
No
ý
Indicate by check mark whether the registrant (1) has filed all reports required to be filed by Section 13 or 15(d) of the Securities Exchange Act of 1934 during the preceding 12 months (or for such shorter period that the registrant was required to file such reports), and (2) has been subject to such filing requirements for the past 90 days.
Yes
ý
No
o
Indicate by check mark whether the registrant has submitted electronically and posted on its corporate Web site, if any, every Interactive Data File required to be submitted and posted pursuant to Rule 405 of Regulation S-T (§232.405 of this chapter) during the preceding 12 months (or for such shorter period that the registrant was required to submit and post such files).
Yes
ý
No
o
Indicate by check mark whether the registrant is a large accelerated filer, an accelerated filer, a non-accelerated filer, or an emerging growth company. See definitions of "accelerated filer," "large accelerated filer," and "emerging growth company" in Rule 12b-2 of the Exchange Act. (Check one):
|
Large accelerated filer
o
|
|
Accelerated filer
o
|
|
Non-accelerated filer
ý
|
Emerging growth company
o
|
|
If an emerging growth company that prepares its financial statements in accordance with U.S. GAAP, indicate by check mark if the registrant has elected not to use the extended transition period for complying with any new or revised financial accounting standards provided pursuant to Section 13(a) of the Exchange Act.
o
Indicate by check mark which basis of accounting the registrant has used to prepare the financial statements included in this filing:
|
o
U.S. GAAP
|
|
ý
International Financial Reporting Standards as issued by the
International Accounting Standards Board
|
|
o
Other
|
If "Other" has been checked in response to the previous question, indicate by check mark which financial statement item the registrant has elected to follow.
Item 17
o
Item 18
o
If this is an annual report, indicate by check mark whether the registrant is a shell company (as defined in Rule 12b-2 of the Exchange Act).
Yes
o
No
ý
Table of Contents
|
|
|
|
Page
|
|
i
|
Brookfield Business Partners
|
|
|
|||
|
Brookfield Business Partners
|
ii
|
INTRODUCTION AND USE OF CERTAIN TERMS
We have prepared this Form 20-F using a number of conventions, which you should consider when reading the information contained herein. Unless otherwise indicated or the context otherwise requires, in this Form 20-F all financial information is presented in accordance with International Financial Reporting Standards, or IFRS, as issued by the International Accounting Standards Board, or IASB, other than certain non-IFRS financial measures which are defined under "Use of Non-IFRS Measures".
In this Form 20-F, unless the context suggests otherwise, references to "we", "us" and "our" are to our company, the Holding LP, the Holding Entities and the operating businesses, each as defined below, taken together on a consolidated basis. Unless the context suggests otherwise, in this Form 20-F references to:
|
•
|
"assets under management" mean assets managed by us or by Brookfield on behalf of our third party investors, as well as our own assets, and also include capital commitments that have not yet been drawn. Our calculation of assets under management may differ from that employed by other asset managers and, as a result, this measure may not be comparable to similar measures presented by other asset managers;
|
|
•
|
"attributable to the partnership" and "attributable to unitholders" means attributable to parent company prior to spin-off on June 20, 2016 and to limited partner, general partner and redemption-exchange unitholders post spin-off. Post spin-off, equity is also attributable to preferred shareholders and Special LP unitholders;
|
|
•
|
"Australia" means Australia and New Zealand;
|
|
•
|
"Backlog" represents an estimate of revenue to be recognized in future financial periods from contracts currently secured. Backlog is not indicative of future revenue, as we cannot guarantee that the revenue projected in our backlog will be realized or that it will exceed cost and generate profit. Projects may remain in our backlog for an extended period of time. Furthermore, variations in projects may occur with respect to contracts included in our backlog that could reduce the dollar amount of our backlog and the revenue and profits that we eventually realize;
|
|
•
|
"BBU General Partner" means Brookfield Business Partners Limited, a wholly-owned subsidiary of Brookfield Asset Management;
|
|
•
|
"Bermuda Holdco" means Brookfield BBP Bermuda Holdings Limited;
|
|
•
|
"boe" or "BOE" means barrels of oil equivalent, with six thousand cubic feet of natural gas being equivalent to one barrel of oil;
|
|
•
|
"boe/d" or "BOE/d" means barrels of oil equivalent per day;
|
|
•
|
"Brookfield" means Brookfield Asset Management and any subsidiary of Brookfield Asset Management, other than us;
|
|
•
|
"Brookfield Asset Management" means Brookfield Asset Management Inc.;
|
|
•
|
"CanHoldco" means Brookfield BBU Canada Holdings Inc.;
|
|
•
|
"CBCA" means the Canada Business Corporations Act;
|
|
•
|
"CDS" means Clearing and Depository Services Inc.;
|
|
•
|
"CGU" means cash generating units;
|
|
•
|
"Company EBITDA" means Company FFO excluding the impact of realized disposition gains, interest expense, cash taxes, and realized disposition gains, current income taxes and interest expense related to equity accounted investments;
|
|
•
|
"Company FFO" means funds from operations, which is calculated as net income excluding the impact of depreciation and amortization, deferred income taxes, breakage and transaction costs, non-cash valuation gains or losses and other items;
|
|
•
|
"Consortium" means our company and the various institutional clients of Brookfield Asset Management;
|
|
•
|
"DTC" means the Depository Trust Company;
|
|
•
|
"EBITDA" means earnings before interest, taxes, depreciation and amortization;
|
|
1
|
Brookfield Business Partners
|
|
•
|
"FATCA" means Foreign Account Tax Compliance provisions of the Hiring Incentives to Restore Employment Act of 2010;
|
|
•
|
“GP Units” means general partnership units in our company;
|
|
•
|
"GrafTech" means GrafTech International Ltd.;
|
|
•
|
"Holding Entities" means the primary holding subsidiaries of the Holding LP, from time to time, through which it indirectly holds all of our interests in our operating businesses, including CanHoldo, US Holdco and Bermuda Holdco;
|
|
•
|
"Holding LP" means Brookfield Business L.P.;
|
|
•
|
"Holding LP Limited Partnership Agreement" means the amended and restated limited partnership agreement of the Holding LP;
|
|
•
|
"IASB" means the International Accounting Standards Board;
|
|
•
|
"incentive distribution" means the distribution payable to holders of Special LP Units as described under "Related Party Transactions—Incentive Distributions";
|
|
•
|
"LIBOR" means the London Interbank offered rate;
|
|
•
|
"Licensing Agreement" means the licensing agreement which our company and the Holding LP have entered into;
|
|
•
|
"limited partners" means the holders of our units;
|
|
•
|
"Limited Partnership Agreements" means our Limited Partnership Agreement and Holding LP Limited Partnership Agreement;
|
|
•
|
"Managing General Partner Units" means the general partner interests in the Holding LP having the rights and obligations specified in the Holding LP Limited Partnership Agreement;
|
|
•
|
"Master Services Agreement" means the master services agreement among the Service Recipients, the Service Providers, and certain other subsidiaries of Brookfield Asset Management who are parties thereto;
|
|
•
|
"Mboe" or "MBOE" means thousand barrels of oil equivalent;
|
|
•
|
"MBOE/d" or "MBOE/d" means thousand barrels of oil equivalent per day;
|
|
•
|
"McDaniel" means McDaniel & Associates Consultants Ltd;
|
|
•
|
"Mcf" means one thousand cubic feet;
|
|
•
|
"MI 61-101" means Multilateral Instrument 61-101—Protection of Minority Security Holders in Special Transactions;
|
|
•
|
"MMboe" means million barrels of oil equivalent;
|
|
•
|
"MMbtu" means one million British thermal units;
|
|
•
|
"MMcf/d" means million cubic feet per day;
|
|
•
|
"NAREIT" means National Association of Real Estate Investment Trusts, Inc.;
|
|
•
|
"NI 51-102" means National Instrument 51-102—Continuous Disclosure Obligations;
|
|
•
|
"Non-Resident Subsidiaries" means the subsidiaries of Holding LP that are corporations and that are not resident or deemed to be resident in Canada for purposes of the Tax Act;
|
|
•
|
"Non-U.S. Holder" means a beneficial owner of one or more units, other than a U.S. Holder or an entity classified as a partnership or other fiscally transparent entity for U.S. federal tax purposes;
|
|
•
|
"NYSE" means the New York Stock Exchange;
|
|
•
|
"NYSE Euronext" means NYSE Euronext Inc.;
|
|
•
|
"oil and gas" means crude oil and natural gas;
|
|
Brookfield Business Partners
|
2
|
|
•
|
"operating businesses" means the businesses in which the Holding Entities hold interests and that directly or indirectly hold our operations and assets other than entities in which the Holding Entities hold interests for investment purposes only of less than 5% of the equity securities;
|
|
•
|
"our business" means our business of owning and operating business services and industrial operations, both directly and through our Holding Entities and other intermediary entities;
|
|
•
|
"our company" or "our partnership" means Brookfield Business Partners L.P., a Bermuda exempted limited partnership;
|
|
•
|
"our Limited Partnership Agreement" means the amended and restated limited partnership agreement of our company;
|
|
•
|
"our operations" means the business services and industrial operations we own;
|
|
•
|
"parent company" means Brookfield Asset Management;
|
|
•
|
"REALPAC" means the Real Property Association of Canada;
|
|
•
|
"Redemption-Exchange Mechanism" means the mechanism by which Brookfield may request redemption of its redemption-exchange units in whole or in part in exchange for cash, subject to the right of our company to acquire such interests (in lieu of such redemption) in exchange for units of our company;
|
|
•
|
"redemption-exchange units" means the non-voting limited partnership interests in the Holding LP that are redeemable for cash, subject to the right of our company to acquire such interests (in lieu of such redemption) in exchange for units of our company, pursuant to the Redemption-Exchange Mechanism;
|
|
•
|
"Relationship Agreement" means the agreement under which Brookfield Asset Management has agreed that we will serve as the primary entity through which Brookfield will own and operate its business services and industrial operations;
|
|
•
|
"Sarbanes-Oxley Act" means the Sarbanes-Oxley Act of 2002;
|
|
•
|
"SEC" means the U.S. Securities and Exchange Commission;
|
|
•
|
"Service Providers" means the affiliates of Brookfield that provide services to us pursuant to our Master Services Agreement, which are expected to be Brookfield Asset Management (Barbados) Inc., Brookfield Asset Management Private Institutional Capital Adviser (Private Equity), L.P., Brookfield Canadian Business Advisor L.P., Brookfield Canadian GP L.P. and Brookfield Global Business Advisors Limited, which are wholly-owned subsidiaries of Brookfield Asset Management, and unless the context otherwise requires, any other affiliate of Brookfield that is appointed by Brookfield Global Business Advisor Limited from time to time to act as a Service Provider pursuant to our Master Services Agreement or to whom the Service Providers have subcontracted for the provision of such services;
|
|
•
|
"Service Recipients" means our company, the Holding LP, the Holding Entities and, at the option of the Holding Entities, any wholly-owned subsidiary of a Holding Entity excluding any operating business;
|
|
•
|
"Special LP Units" means special limited partnership units of the Holding LP;
|
|
•
|
"spin-off" means the special dividend of our units by Brookfield Asset Management completed on June 20, 2016;
|
|
•
|
"Tax Act" means the Income Tax Act (Canada), together with the regulation thereunder;
|
|
•
|
"TSX" means the Toronto Stock Exchange;
|
|
•
|
"unitholders" means the holders of our units;
|
|
•
|
"units" or "LP Units" means the non-voting limited partnership units in our company;
|
|
•
|
"US Holdco" means Brookfield BBP US Holdings LLC;
|
|
•
|
"U.S. Holder" means a beneficial owner of one or more of our units that is for U.S. federal tax purposes (i) an individual citizen or resident of the United States; (ii) a corporation (or other entity treated as a corporation for U.S. federal income tax purposes) created or organized in or under the laws of the United States, any state thereof or the District of Columbia, (iii) an estate the income of which is subject to U.S. federal income taxation regardless of its source; or (iv) a trust (a) that is subject to the primary supervision of a court within the United States and all substantial decisions of which one or more U.S. persons have the authority to control or (b) that has a valid election in effect under applicable Treasury Regulations to be treated as a U.S. person;
|
|
•
|
“Westinghouse” means Westinghouse Electric Company; and
|
|
3
|
Brookfield Business Partners
|
|
•
|
“Westinghouse Acquisition” means the transaction described under "History and Development of our Company”
|
Historical Performance and Market Data
This Form 20-F contains information relating to our business as well as historical performance and market data for Brookfield Asset Management and certain of its operating platforms. When considering this data, you should bear in mind that historical results and market data may not be indicative of the future results that you should expect from us.
Financial Information
The financial information contained in this Form 20-F is presented in United States dollars and, unless otherwise indicated, has been prepared in accordance with International Financial Reporting Standards as issued by the International Accounting Standards Board, or IFRS. All figures are unaudited unless otherwise indicated. In this Form 20-F, all references to "$" are to United States dollars, references to "A$" are to Australian dollars, references to "R$" are to Brazilian Reais, references to "£" are to British Pounds and references to "C$" are to Canadian dollars.
Use of Non-IFRS Measures
Our company evaluates its performance using net income attributable to parent company. In addition to this measure reported in accordance with IFRS, we also use Company FFO and Company EBITDA (defined below) to evaluate our performance. When determining Company FFO and Company EBITDA, we include our proportionate share of Company FFO and Company EBITDA of equity accounted investments, respectively. We believe our presentation of Company FFO and Company EBITDA is useful to investors because it supplements investors' understanding of our operating performance by providing information regarding our ongoing performance that excludes items we believe do not directly affect our core operations. Our presentation of Company FFO and Company EBITDA also gives investors comparability of our ongoing performance across periods.
We define Company FFO as net income excluding the impact of depreciation and amortization, deferred income taxes, breakage and transaction costs, non-cash valuation gains or losses and other items. Company FFO is presented net to unitholders. Our definition of Company FFO may differ from the definition of FFO used by other organizations, as well as the definition of funds from operations used by the Real Property Association of Canada ("
REALPAC
") and the National Association of Real Estate Investment Trusts, Inc. ("
NAREIT
"), in part because the NAREIT definition is based on U.S. GAAP, as opposed to IFRS. Company FFO has limitations as an analytical tool as it does not include depreciation and amortization expense, deferred income taxes and non-cash valuation gains/losses and impairment charges.
We define Company EBITDA as Company FFO excluding the impact of realized disposition gains, interest expense, current income taxes, and realized disposition gains, current income taxes and interest expense related to equity accounted investments. Company EBITDA is presented net to unitholders. Company EBITDA has limitations as an analytical tool as it does not include realized disposition gains, interest expense, and current income taxes, as well as depreciation and amortization expense, deferred income taxes and non-cash valuation gains/losses and impairment charges.
Company FFO and Company EBITDA do not have a standard meaning prescribed by IFRS and therefore may not be comparable to similar measures presented by other companies. Because Company FFO and Company EBITDA have these limitations, Company FFO and Company EBITDA should not be considered as the sole measures of our performance and should not be considered in isolation from, or as a substitute for, analysis of our results as reported under IFRS. However, Company FFO and Company EBITDA are key measures that we use to evaluate the performance of our operations.
For a reconciliation of Company FFO and Company EBITDA to net income attributable to unitholders, see page 82 of this Form 20-F. We urge you to review the IFRS financial measures in this Form 20-F, including the financial statements, the notes thereto, and the other financial information contained herein, and not to rely on any single financial measure to evaluate our company.
|
Brookfield Business Partners
|
4
|
SPECIAL NOTE REGARDING FORWARD-LOOKING STATEMENTS
This Form 20-F contains “forward-looking information” and “forward-looking statements” within the meaning of applicable securities laws, rules and regulations.
Forward-looking statements include statements that are predictive in nature, depend upon or refer to future events or conditions, include statements regarding our operations, business, financial condition, expected financial results, performance, prospects, opportunities, priorities, targets, goals, ongoing objectives, strategies and outlook, as well as the outlook for North American and international economies for the current fiscal year and subsequent periods, and include words such as “expects”, “anticipates”, “plans”, “believes”, “estimates”, “seeks”, “intends”, “targets”, “projects”, “forecasts”, “likely”, or negative versions thereof and other similar expressions, or future or conditional verbs such as “may”, “will”, “should”, “would” and “could”.
Although these forward-looking statements and information are based upon our beliefs, assumptions and expectations that we believe are reasonable, the reader should not place undue reliance on such forward-looking statements and information because they involve known and unknown risks, uncertainties and other factors, many of which are beyond our control, which may cause our actual results, performance or achievements to differ materially from anticipated future results, performance or achievement expressed or implied by such forward-looking statements and information.
Factors that could cause actual results to differ materially from those contemplated or implied by forward-looking statements include, but are not limited to:
|
•
|
changes in the general economy;
|
|
•
|
general economic and business conditions that could impact our ability to access capital markets and credit markets;
|
|
•
|
the cyclical nature of most of our operations;
|
|
•
|
exploration and development may not result in commercially productive assets;
|
|
•
|
actions of competitors;
|
|
•
|
foreign currency risk;
|
|
•
|
our ability to complete previously announced acquisitions or other transactions, on the timeframe contemplated or at all;
|
|
•
|
risks associated with, and our ability to derive fully anticipated benefits from, future or existing acquisitions, joint ventures, investments or dispositions;
|
|
•
|
actions or potential actions that could be taken by our co-venturers, partners, fund investors or co-tenants;
|
|
•
|
risks commonly associated with a separation of economic interest from control;
|
|
•
|
failure to maintain effective internal controls;
|
|
•
|
actions or potential actions that could be taken by our parent company, or its subsidiaries (other than the partnership);
|
|
•
|
the departure of some or all of Brookfield's key professionals;
|
|
•
|
pending or threatened litigation;
|
|
•
|
changes to legislation and regulations;
|
|
•
|
possible environmental liabilities and other contingent liabilities;
|
|
•
|
our ability to obtain adequate insurance at commercially reasonable rates;
|
|
•
|
our financial condition and liquidity;
|
|
•
|
alternative technologies could impact the demand for, or use of, the businesses and assets that we own and operate and could impair or eliminate the competitive advantage of our businesses and assets;
|
|
•
|
downgrading of credit ratings and adverse conditions in the credit markets;
|
|
•
|
changes in financial markets, foreign currency exchange rates, interest rates or political conditions;
|
|
•
|
the impact of the potential break-up of political-economic unions (or the departure of a union member);
|
|
•
|
the general volatility of the capital markets and the market price of our limited partnership units; and
|
|
•
|
other risks and factors discussed in this Form 20-F in Item 3.D., "Risk Factors" and as detailed from time to time in other documents we file with the securities regulators in Canada and the United States.
|
We qualify any and all of our forward-looking statements by these cautionary factors.
We caution that the foregoing list of important factors that may affect future results is not exhaustive. When evaluating our forward-looking statements or information, investors and others should carefully consider the foregoing factors and other uncertainties and potential events. Except as required by law, we undertake no obligation to publicly update or revise any forward-looking statements or information, whether written or oral, that may be as a result of new information, future events or otherwise.
|
5
|
Brookfield Business Partners
|
Not applicable.
Not applicable.
3.A. SELECTED FINANCIAL DATA
The following tables present selected financial data for our company as at and for the periods indicated:
|
|
Year Ended December 31,
|
||||||||||||||||||
|
(US$ Millions, except per unit amounts)
|
2017
|
2016
|
2015
|
2014
|
2013
|
||||||||||||||
|
Statements of Operating Results Data
|
|||||||||||||||||||
|
Revenues
|
$
|
22,823
|
|
$
|
7,960
|
|
$
|
6,753
|
|
$
|
4,622
|
|
$
|
4,884
|
|
||||
|
Direct operating costs
|
(21,876
|
)
|
(7,386
|
)
|
(6,132
|
)
|
(4,099
|
)
|
(4,440
|
)
|
|||||||||
|
General and administrative expenses
|
(340
|
)
|
(269
|
)
|
(224
|
)
|
(179
|
)
|
(199
|
)
|
|||||||||
|
Depreciation and amortization expense
|
(371
|
)
|
(286
|
)
|
(257
|
)
|
(147
|
)
|
(125
|
)
|
|||||||||
|
Interest expense
|
(202
|
)
|
(90
|
)
|
(65
|
)
|
(28
|
)
|
(27
|
)
|
|||||||||
|
Equity accounted income, net
|
69
|
|
68
|
|
4
|
|
26
|
|
26
|
|
|||||||||
|
Impairment expense, net
|
(39
|
)
|
(261
|
)
|
(95
|
)
|
(45
|
)
|
(4
|
)
|
|||||||||
|
Gain on acquisitions/dispositions, net
|
267
|
|
57
|
|
269
|
|
—
|
|
101
|
|
|||||||||
|
Other income (expenses), net
|
(108
|
)
|
(11
|
)
|
70
|
|
13
|
|
(4
|
)
|
|||||||||
|
Income (loss) before income tax
|
223
|
|
(218
|
)
|
323
|
|
163
|
|
212
|
|
|||||||||
|
Current income tax expense
|
(30
|
)
|
(25
|
)
|
(49
|
)
|
(27
|
)
|
(43
|
)
|
|||||||||
|
Deferred income tax (expense) recovery
|
22
|
|
41
|
|
(5
|
)
|
9
|
|
45
|
|
|||||||||
|
Net income (loss)
|
$
|
215
|
|
$
|
(202
|
)
|
$
|
269
|
|
$
|
145
|
|
$
|
214
|
|
||||
|
Attributable to:
|
|
|
|
|
|
||||||||||||||
|
Limited partners
|
$
|
(58
|
)
|
$
|
3
|
|
$
|
—
|
|
$
|
—
|
|
$
|
—
|
|
||||
|
General partner
|
—
|
|
—
|
|
—
|
|
—
|
|
—
|
|
|||||||||
|
Brookfield Asset Management Inc.
(2)
|
—
|
|
(35
|
)
|
208
|
|
93
|
|
184
|
|
|||||||||
|
Non-controlling interests attributable to:
|
|
|
|
|
|
||||||||||||||
|
Redemption-Exchange Units held by Brookfield Asset Management Inc.
(1)
|
(60
|
)
|
3
|
|
—
|
|
—
|
|
—
|
|
|||||||||
|
Special Limited Partners
|
142
|
|
—
|
|
—
|
|
—
|
|
—
|
|
|||||||||
|
Interest of others in operating subsidiaries
|
191
|
|
(173
|
)
|
61
|
|
52
|
|
30
|
|
|||||||||
|
Net income (loss)
|
$
|
215
|
|
$
|
(202
|
)
|
$
|
269
|
|
$
|
145
|
|
$
|
214
|
|
||||
|
Basic and diluted earnings per limited partner unit
(3) (4)
|
$
|
(1.04
|
)
|
$
|
0.06
|
|
|
|
|
||||||||||
____________________________________
|
(1)
|
For the periods subsequent to June 20, 2016.
|
|
(2)
|
For the periods prior to June 20, 2016.
|
|
(3)
|
Comparative figures for the years ended December 31, 2015, 2014, and 2013 are not representative of performance, as units were spun out on June 20, 2016.
|
|
(4)
|
Average number of partnership units outstanding on a fully diluted time weighted average basis, assuming the exchange of redemption exchange units held by Brookfield Asset Management for limited partnership units, for the year ended
December 31, 2017
was 113.5 million (2016: 92.9 million).
|
|
Brookfield Business Partners
|
6
|
|
(US$ Millions)
Statements of Financial Position Data
|
December 31,
2017 |
December 31,
2016 |
December 31,
2015 |
||||||||
|
Cash and cash equivalents
|
$
|
1,106
|
|
$
|
1,050
|
|
$
|
354
|
|
||
|
Total assets
|
$
|
15,804
|
|
$
|
8,193
|
|
$
|
7,635
|
|
||
|
Borrowings
|
$
|
3,265
|
|
$
|
1,551
|
|
$
|
2,074
|
|
||
|
Equity Attributable to:
|
|
|
|
||||||||
|
Limited partners
|
$
|
1,585
|
|
$
|
1,206
|
|
$
|
—
|
|
||
|
General partner
|
—
|
|
—
|
|
—
|
|
|||||
|
Brookfield Asset Management Inc.
|
—
|
|
—
|
|
1,787
|
|
|||||
|
Non-controlling interests attributable to:
|
|
|
|
||||||||
|
Redemption-Exchange Units, Preferred Shares and Special Limited Partnership Units held by Brookfield Asset Management Inc
|
1,453
|
|
1,295
|
|
—
|
|
|||||
|
Interests of others in operating subsidiaries
|
3,026
|
|
1,537
|
|
1,297
|
|
|||||
|
Total equity
|
$
|
6,064
|
|
$
|
4,038
|
|
$
|
3,084
|
|
||
Not applicable.
3.C. REASONS FOR THE OFFER AND USE OF PROCEEDS
Not applicable.
3.D. RISK FACTOR
S
Your holding of units of our company involves substantial risks. You should carefully consider the following factors in addition to the other information set forth in this Form 20-F. If any of the following risks actually occur, our business, financial condition and results of operations and the value of your units would likely suffer.
Risks Relating to Our Operations
Risks Relating to our Operations Generally
Our company has a limited operating history and the historical financial information included herein does not fully reflect the operating results we would have achieved during the periods presented, and therefore may not be a reliable indicator of our future financial performance.
Our company was formed on January 18, 2016 and completed its separation from Brookfield on June 20, 2016, and accordingly has a limited operating history as a standalone company. Our limited operating history makes it difficult to assess our ability to operate profitably and make distributions to unitholders. Although most of our assets and operating businesses have been under Brookfield's control prior to the formation of our company, their combined results as reflected in the historical financial statements included in this Form 20-F may not be indicative of our future financial condition or operating results. We urge you to carefully consider the basis on which the historical financial information included herein was prepared and presented.
The completion of new acquisitions can have the effect of significantly increasing the scale and scope of our operations, including operations in new geographic areas and industry sectors, and the Service Providers may have difficulty managing these additional operations. In addition, acquisitions involve risks to our business.
A key part of our company's strategy involves seeking acquisition opportunities. For example, a number of our current operations have only recently been acquired. We have also recently announced additional acquisitions, such as our proposed acquisition of Westinghouse. Acquisitions may increase the scale, scope and diversity of our operating businesses. We depend on the diligence and skill of Brookfield's and our professionals to effectively manage us, integrating acquired businesses with our existing operations. These individuals may have difficulty managing additional acquired businesses and may have other responsibilities within Brookfield's asset management business. If any such acquired businesses are not effectively integrated and managed, our existing business, financial condition and results of operations may be adversely affected.
|
7
|
Brookfield Business Partners
|
Future acquisitions, which may include Westinghouse, will likely involve some or all of the following risks, which could materially and adversely affect our business, financial condition or results of operations: the difficulty of integrating the acquired operations and personnel into our current operations; potential disruption of our current operations; diversion of resources, including Brookfield's time and attention; the difficulty of managing the growth of a larger organization; the risk of entering markets and/or industries in which we have little experience; the risk of becoming involved in labour, commercial or regulatory disputes or litigation related to the new enterprise; risk of environmental or other liabilities associated with the acquired business; and the risk of a change of control resulting from an acquisition triggering rights of third parties or government agencies under contracts with, or authorizations held by the operating business being acquired. While it is our practice to conduct extensive due diligence investigations into businesses being acquired, it is possible that due diligence may fail to uncover all material risks in the business being acquired, or to identify a change of control trigger in a material contract or authorization, or that a contractual counterparty or government agency may take a different view on the interpretation of such a provision to that taken by us, thereby resulting in a dispute.
We may acquire distressed companies and these acquisitions may subject us to increased risks, including the incurrence of additional legal or other expenses.
As part of our acquisition strategy, we may acquire distressed companies. This could involve acquisitions of securities of companies in event-driven special situations, such as acquisitions, tender offers, bankruptcies, recapitalizations, spinoffs, corporate and financial restructurings, litigation or other liability impairments, turnarounds, management changes, consolidating industries and other catalyst-oriented situations. For example, we recently announced our proposed acquisition of Westinghouse, which filed for Chapter 11 bankruptcy protection in April 2017. Acquisitions of distressed companies involve substantial financial and business risks that can result in substantial or total losses. Among the problems involved in assessing and making acquisitions in troubled issuers is the fact that it frequently may be difficult to obtain information as to the condition of such issuer. If, during the diligence process, we fail to identify issues specific to a company or the environment in which we operate, we may be forced to later write down or write off assets, restructure our operations, or incur impairment or other charges that may result in other reporting losses.
As a consequence of our company's role as an acquirer of distressed companies, we may be subject to increased risk of incurring additional legal, indemnification or other expenses, even if we are not named in any action. In distressed situations, litigation often follows when disgruntled shareholders, creditors and other parties seek to recover losses from poorly performing investments. The enhanced litigation risk for distressed companies is further elevated by the potential that Brookfield or our company may have controlling or influential positions in these companies.
We operate in a highly competitive market for acquisition opportunities.
Our acquisition strategy is dependent to a significant extent on Brookfield's ability to identify acquisition opportunities that are suitable for us. We face competition for acquisitions primarily from investment funds, operating companies acting as strategic buyers, commercial and investment banks and commercial finance companies. Many of these competitors are substantially larger and have considerably greater financial, technical and marketing resources than are available to us. Some of these competitors may also have higher risk tolerances or different risk assessments, which could allow them to consider a wider variety of acquisitions and to offer terms that we are unable or unwilling to match. To finance our acquisitions, we will need to compete for equity capital from institutional investors and other equity providers, including Brookfield, and our ability to consummate acquisitions will be dependent on such capital continuing to be available. Increases in interest rates could also make it more difficult to consummate acquisitions because our competitors may have a lower cost of capital, which may enable them to bid higher prices for assets. In addition, because of our affiliation with Brookfield, there is a higher risk that when we participate with Brookfield and others in joint ventures, partnerships and consortiums on acquisitions, we may become subject to antitrust or competition laws that we would not be subject to if we were acting alone. These factors may create competitive disadvantages for us with respect to acquisition opportunities.
We cannot provide any assurance that the competitive pressures we face will not have a material adverse effect on our business, financial condition and results of operations or that Brookfield will be able to identify and make acquisitions on our behalf that are consistent with our objectives or that generate attractive returns for our unitholders. We may lose acquisition opportunities in the future if we do not match prices, structures and terms offered by competitors, if we are unable to access sources of equity or obtain indebtedness at attractive rates or if we become subject to antitrust or competition laws. Alternatively, we may experience decreased rates of return and increased risks of loss if we match prices, structures and terms offered by competitors.
|
Brookfield Business Partners
|
8
|
We may not be able to complete proposed acquisitions on our anticipated timeframe, or at all.
We can provide no assurance that we will be able to complete our previously announced acquisitions on our anticipated timeframe, or at all. We regularly enter into agreements to make acquisitions, which are often subject to a number of closing conditions. These conditions may include: financing conditions (which may require access to credit and/or capital markets); third party consents; and/or antitrust regulatory approval and other industry-specific regulatory approvals. If we are unable to satisfy these conditions in the manner or in the timeframe contemplated, our proposed acquisitions may be delayed, and we may also be required to modify the terms of our acquisitions. These delays and/or modifications may be significant and could have a material adverse impact on our business, operating results and financial condition.
In addition, if we are unable to satisfy one or more closing conditions, we may not be able to complete the acquisition at all, and in certain circumstances, we or the target company may elect to terminate the acquisition agreement voluntarily, which may result in the payment of substantial termination or “break-up” fees. Any such termination of a proposed acquisition could have a material adverse impact on our business, operating results and financial condition.
For example, we have recently entered in to an agreement to acquire Westinghouse. The closing of the Westinghouse acquisition is subject to a number of customary and industry-specific closing conditions, and will likely require us to obtain significant financing. While we currently anticipate that the acquisition will close in the third quarter of 2018, we can provide no assurance that it will be completed in that timeframe, or at all.
We use leverage and such indebtedness may result in our company, the Holding LP or our operating businesses being subject to certain covenants which restrict our ability to engage in certain types of activities or to make distributions to equity.
Many of our Holding Entities and operating businesses have entered into credit facilities or have incurred other forms of debt, including for acquisitions. The total quantum of exposure to debt within our company is significant, and we may become more leveraged in the future.
Leveraged assets are more sensitive to declines in revenues, increases in expenses and interest rates and adverse economic, market and industry developments. A leveraged company's income and net assets also tend to increase or decrease at a greater rate than would otherwise be the case if money had not been borrowed. As a result, the risk of loss associated with a leveraged company, all other things being equal, is generally greater than for companies with comparatively less debt. In addition, the use of indebtedness in connection with an acquisition may give rise to negative tax consequences to certain investors. Leverage may also result in a requirement for short-term liquidity, which may force the sale of assets at times of low demand and/or prices for such assets. This may mean that we are unable to realize fair value for the assets in a sale.
Our credit facilities also contain, and will contain in the future, covenants applicable to the relevant borrower and events of default. Covenants can relate to matters including limitations on financial indebtedness, dividends, acquisitions, or minimum amounts for interest coverage, adjusted EBITDA, cash flow or net worth. If an event of default occurs, or minimum covenant requirements are not satisfied, this can result in a requirement to immediately repay any drawn amounts or the imposition of other restrictions including a prohibition on the payment of distributions to equity.
We may not be able to access the credit and capital markets at the times and in the amounts needed to satisfy capital expenditure requirements, to fund new acquisitions or otherwise.
General economic and business conditions that impact the debt or equity markets could impact the availability and cost of credit for us. We have revolving credit facilities and other short-term borrowings. The amount of interest charged on these will fluctuate based on changes in short-term interest rates. Any economic event that affects interest rates or the ability to refinance borrowings could materially adversely impact our financial condition.
Some of our operations require significant capital expenditures, and proposed acquisitions often require significant financing. If we are unable to generate enough cash to finance necessary capital expenditures and to fund acquisitions through existing liquidity and/or operating cash flow, then we may be required to issue additional equity or incur additional indebtedness. The issue of additional equity would be dilutive to existing unitholders at the time. Any additional indebtedness would increase our leverage and debt payment obligations, and may negatively impact our business, financial condition and results of operations.
|
9
|
Brookfield Business Partners
|
In addition, Brookfield owns approximately 63 million redemption-exchange units. At any time after two years from the date of spin-off, or June 20, 2018, the holders of redemption-exchange units have the right to require the Holding LP to redeem all or a portion of the redemption-exchange units for cash, subject to our company's right to acquire such interests (in lieu of redemption) in exchange for our units. Although the decision to exercise the exchange right and deliver units (or not to do so) is a decision that will be made solely by a majority of our independent directors, and therefore Brookfield will not be able to prevent us from delivering units in satisfaction of the redemption request, if our independent directors did not determine to satisfy the redemption request by delivering our units, we would be required to satisfy such redemption request using cash. To the extent we were unable to fund such cash payment from operating cash flow, we may be required to incur indebtedness or otherwise access the capital markets, including through the issuance of our units, to satisfy any shortfall which will depend on several factors, some of which are out of our control, including, among other things, general economic conditions, our results of operations and financial condition, restrictions imposed by the terms of any indebtedness that is incurred to finance our operations or to fund liquidity needs, levels of operating and other expenses and contingent liabilities.
Our business relies on continued access to capital to fund new acquisitions and capital projects. While we aim to prudently manage our capital requirements and ensure access to capital is always available, it is possible we may overcommit ourselves or misjudge the requirement for capital or the availability of capital. Such a misjudgment could result in negative financial consequences or, in extreme cases, bankruptcy.
Changes in our credit ratings may have an adverse effect on our financial position and ability to raise capital.
We cannot assure you that any credit rating assigned to us or any of our subsidiaries or their debt securities will remain in effect for any given period of time or that any rating will not be lowered or withdrawn entirely by the relevant rating agency. A lowering or withdrawal of such ratings may have an adverse effect on our financial position and ability to raise capital.
All of our operating businesses are highly cyclical and subject to general economic conditions and risks relating to the economy.
Many industries, including the industries in which we operate, are impacted by adverse events in the broader economy and/or financial markets. A slowdown in the financial markets and/or the global economy or the local economies of the regions in which we operate, including, but not limited to, new home construction, employment rates, business conditions, inflation, fuel and energy costs, commodity prices, lack of available credit, the state of the financial markets, interest rates and tax rates may adversely affect our growth and profitability. For example, a worldwide recession, a period of below-trend growth in developed countries, a slowdown in emerging markets or significant declines in commodity factors could have a material adverse effect on our business, financial condition and results of operations, if such increased levels of volatility and market turmoil were to persist for an extended duration. These and other unforeseen adverse events in the global economy could negatively impact our operations and the trading price of our units could be further adversely impacted.
The demand for products and services provided by our operating businesses is, in part, dependent upon and correlated to general economic conditions and economic growth of the regions applicable to the relevant asset. Poor economic conditions or lower economic growth in a region or regions may, either directly or indirectly, reduce demand for the products and/or services provided by our operating businesses. In particular, the sectors in which we operate are highly cyclical, and we are subject to cyclical fluctuations in global economic conditions and end-use markets. We are unable to predict the future course of industry variables or the strength, pace or sustainability of the global economic recovery and the effects of government intervention. Negative economic conditions, such as an economic downturn, a prolonged recovery period or disruptions in the financial markets, could have a material adverse effect on our business, financial condition or results or operations.
Alternative technologies could impact the demand for, or use of, the businesses and assets that we own and operate and could impair or eliminate the competitive advantage of our businesses and assets.
There are alternative technologies that may impact the demand for, or use of, the businesses and assets that we own and operate. While some such alternative technologies are in earlier stages of development, ongoing research and development activities may improve such alternative technologies. For example, development of electric vehicles may reduce the need and demand for road fuel distribution, and if new technologies emerge that are able to deliver real estate services at lower prices, more efficiently or more conveniently, such technologies could adversely impact our ability to compete. If this were to happen, the competitive advantage of our businesses and assets may be significantly impaired or eliminated and our business, financial condition, results of operations and cash flow could be materially and adversely affected as a result.
|
Brookfield Business Partners
|
10
|
All of our operating businesses are subject to changes in government policy and legislation.
Our operations are located in many different jurisdictions, each with its own government and legal system. Our financial condition and results of operations could be affected by changes in fiscal or other government policies, changes in monetary policy, as well as by regulatory changes or administrative practices, or other political or economic developments in the jurisdictions in which we operate, such as: interest rates; currency fluctuations; exchange controls and restrictions; inflation; liquidity of domestic financial and capital markets; policies relating to climate change or policies relating to tax; and other political, social, economic and environmental and occupational health and safety developments that may occur in or affect the countries in which our operating businesses are located or conduct business or the countries in which the customers of our operating businesses are located or conduct business or both.
In the case of our industrial operations, we cannot predict the impact of future economic conditions, energy conservation measures, alternative energy requirements or governmental regulation, all of which could reduce the demand for the products and services provided by such businesses or the availability of commodities we rely upon to conduct our operations. It is difficult to predict government policies and what form of laws and regulations will be adopted or how they will be construed by the relevant courts, or to the extent which any changes may adversely affect us.
We are subject to foreign currency risk and our use of or failure to use derivatives to hedge certain financial positions may adversely affect the performance of our operations.
A significant portion of our current operations are in countries where the U.S. dollar is not the functional currency. These operating businesses pay distributions in currencies other than the U.S. dollar, which we must convert to U.S. dollars prior to making distributions, and certain of our operating businesses have revenues denominated in currencies different from U.S. dollars, which is utilized in our financial reporting, thus exposing us to currency risk. Fluctuations in currency exchange rates or a significant depreciation in the value of certain foreign currencies (for example, the Brazilian real) could reduce the value of cash flows generated by our operating businesses or could make it more expensive for our customers to purchase our services, and could have a material adverse effect on our business, financial condition and results of operations.
When managing our exposure to such market risks, we may use forward contracts, options, swaps, caps, collars and floors or pursue other strategies or use other forms of derivative instruments. However, a significant portion of this risk may remain unhedged. We may also choose to establish unhedged positions in the ordinary course of business. The success of any hedging or other derivative transactions that we enter into generally will depend on our ability to structure contracts that appropriately offset our risk position. As a result, while we may enter into such transactions in order to reduce our exposure to market risks, unanticipated market changes may result in poorer overall investment performance than if the derivative transaction had not been executed. Such transactions may also limit the opportunity for gain if the value of a hedged position increases.
The
Dodd-Frank Wall Street Reform and Consumer Protection Act
, or the Dodd-Frank Act, and similar laws in other jurisdictions impose rules and regulations governing federal and other governmental oversight of the over-the-counter derivatives market and its participants. These regulations may impose additional costs and regulatory scrutiny on our company. We cannot predict the effect of changing derivatives legislation on our hedging costs, our hedging strategy or its implementation, or the composition of the risks we hedge.
It can be very difficult or expensive to obtain the insurance we need for our business operations.
We maintain insurance both as a corporate risk management strategy and in some cases to satisfy the requirements of contracts entered into in the course of our operations. Although in the past we have generally been able to cover our insurance needs, there can be no assurances that we can secure all necessary or appropriate insurance in the future, or that such insurance can be economically secured. We monitor the financial health of the insurance companies from which we procure insurance, but if any of our third party insurers fail, abruptly cancel our coverage or otherwise cannot satisfy their insurance requirements to us, then our overall risk exposure and operational expenses could be increased and some of our business operations could be interrupted.
Performance of our operating businesses may be harmed by future labour disruptions and economically unfavourable collective bargaining agreements.
Several of our current operations have workforces that are unionized or that in the future may become unionized and, as a result, are or will be required to negotiate the wages, benefits and other terms with many of their employees collectively. If an operating business were unable to negotiate acceptable contracts with any of its unions as existing agreements expire, it could experience a significant disruption of its operations, higher ongoing labour costs and restrictions on its ability to maximize the efficiency of its operations, which could have the potential to adversely impact our financial condition.
|
11
|
Brookfield Business Partners
|
In addition, in some jurisdictions where we operate, labour forces have a legal right to strike which may have an impact on our operations, either directly or indirectly, for example if a critical upstream or downstream counterparty was itself subject to a labour disruption which impacted our business.
Our operations are exposed to occupational health and safety and accident risks.
Our operations are highly exposed to the risk of accidents that may give rise to personal injury, loss of life, disruption to service and economic loss, including, for example, resulting from related litigation. Some of the tasks undertaken by employees and contractors are inherently dangerous and have the potential to result in serious injury or death.
We are subject to increasingly stringent laws and regulations governing health and safety matters. Occupational health and safety legislation and regulations differ in each jurisdiction. Any breach of these obligations, or serious accidents involving our employees, contractors or members of the public could expose us or our operating businesses to adverse regulatory consequences, including the forfeit or suspension of operating licenses, potential litigation, claims for material financial compensation, reputational damage, fines or other legislative sanction, which have the potential to adversely impact our financial condition. Furthermore, where we do not control a business, we have a limited ability to influence their health and safety practices and outcomes.
We are subject to litigation risks that could result in significant liabilities that could adversely affect our operations.
We are at risk of becoming involved in disputes and possible litigation, the extent of which cannot be ascertained. Any material or costly dispute or litigation could adversely affect the value of our assets or our future financial performance. We could be subject to various legal proceedings concerning disputes of a commercial nature, or to claims in the event of bodily injury or material damage. The final outcome of any proceeding could have a negative impact on the business, financial condition or results of operations of our company.
In addition, under certain circumstances, we may ourselves commence litigation. There can be no assurance that litigation, once begun, would be resolved in our favour.
We will also be exposed to risk of litigation by third parties or government regulators if our management is alleged to have committed an act or acts of gross negligence, willful misconduct or dishonesty or breach of contract or organizational documents or to violate applicable law. In such actions, we would likely be obligated to bear legal, settlement and other costs (which may exceed our available insurance coverage).
We may have operations in jurisdictions with less developed legal systems, which could create potential difficulties in obtaining effective legal redress.
Some of our operations are located in jurisdictions with less developed legal systems than those in more established economies. In these jurisdictions, our company could be faced with potential difficulties in obtaining effective legal redress; a higher degree of discretion on the part of governmental authorities; a lack of judicial or administrative guidance on interpreting applicable rules and regulations; inconsistencies or conflicts between and within various laws, regulations, decrees, orders and resolutions; and relative inexperience of the judiciary and courts in such matters.
In addition, in some jurisdictions, the commitment of local business people, government officials and agencies and the judicial system to abide by legal requirements and negotiated agreements could be uncertain, creating particular concerns with respect to permits, approvals and licenses required or desirable for, or agreements entered into in connection with, businesses in any such jurisdiction. These may be susceptible to revision or cancellation and legal redress may be uncertain or delayed. There can be no assurance that joint ventures, licenses, permits or approvals (or applications for licenses, permits or approvals) or other legal arrangements will not be adversely affected by the actions of government authorities or others and the effectiveness of and enforcement of such arrangements in these jurisdictions cannot be assured.
We do not control all of the businesses in which we own interests and therefore we may not be able to realize some or all of the benefits that we expect to realize from those interests.
We do not have control of certain of the businesses in which we own interests and we may take non-controlling positions in other businesses in the future. Such businesses may make financial or other decisions that we do not agree with. Because we do not have the ability to exercise control over such businesses, we may not be able to realize some or all of the benefits that we expect to realize from our ownership interests in them, including, for example, expected distributions. In addition, we must rely on the internal controls and financial reporting controls of such businesses and their failure to maintain effective controls or comply with applicable standards may adversely affect us.
|
Brookfield Business Partners
|
12
|
From time to time, we may have significant interests in public companies, and changes in the market prices of the stock of such public companies, particularly during times of increased market volatility, could have a negative impact on our financial condition and results of operations.
From time to time, we may hold significant interests in public companies, and changes in the market prices of the stock of such public companies could have a material impact on our financial condition and results of operations. Global securities markets have been highly volatile, and continued volatility may have a material negative impact on our consolidated financial position and results of operations.
We are exposed to the risk of environmental damage and costs associated with compliance with environmental laws.
Certain of our operating businesses are involved in using, handling or transporting substances that are toxic, combustible or otherwise hazardous to the environment and may be in close proximity to environmentally sensitive areas or densely populated communities. If a leak, spill or other environmental incident occurred, it could result in substantial fines or penalties being imposed by regulatory authorities, revocation of licenses or permits required to operate the business or the imposition of more stringent conditions in those licenses or permits, or legal claims for compensation (including punitive damages) by affected stakeholders. For example, such risks are present in our Brazilian operations, which include the largest private water and sewage treatment operations in Brazil. In addition, some of our operating businesses may be subject to regulations or rulings made by environmental agencies that conflict with existing obligations we have under concession or other permitting agreements. Resolution of such conflicts may lead to uncertainty and increased risk of delays or cost overruns on projects. In addition to fines, these laws and regulations sometimes require evaluation and registration or the installation of costly pollution control or safety equipment or costly changes in operations to limit pollution or decrease the likelihood of injuries. Certain of our current industrial manufacturing operations are also subject to increasingly stringent environmental laws and regulations relating to our current and former properties, neighboring properties and our current raw materials, products and operations. All of these risks could require us to incur costs or become the basis of new or increased liabilities that could be material and could have the potential to significantly impact our value or financial performance.
We are exposed to the risk of increasingly onerous environmental legislation and the broader impacts of climate change.
With an increasing global focus and public sensitivity to environmental sustainability and environmental regulation becoming more stringent, we could be subject to further environmental related responsibilities and associated liability. For example, many jurisdictions in which our company operates and invests are considering implementing, or have implemented, schemes relating to the regulation of carbon emissions. As a result, there is a risk that demand for some of the commodities supplied by certain of our operations will be reduced. The nature and extent of future regulation in the various jurisdictions in which our operations are situated is uncertain, but is expected to become more complex and stringent.
It is difficult to assess the impact of any such changes on our company. These changes may result in increased costs to our operations that may not be able to be passed onto customers and may have an adverse impact on prospects for growth of some of our businesses. To the extent such regimes (such as carbon emissions schemes or other carbon emissions regulations) become applicable to our operations (and the costs of such regulations are not able to be fully passed on to consumers), our financial performance may be impacted due to costs applied to carbon emissions and increased compliance costs.
We are also subject to a wide range of laws and regulations relating to the protection of the environment and pollution. Standards are set by these laws and regulations regarding certain aspects of environmental quality and reporting, provide for penalties and other liabilities for the violation of such standards, and establish, in certain circumstances, obligations to remediate and rehabilitate current and former facilities and locations where our operations are, or were, conducted. These laws and regulations may have a detrimental impact on our company's financial performance through increased compliance costs or otherwise. Any breach of these obligations, or even incidents relating to the environment that do not amount to a breach, could adversely affect the results of our operating businesses and their reputations and expose them to claims for financial compensation or adverse regulatory consequences.
Our operations may also be exposed directly or indirectly to the broader impacts of climate change, including extreme weather events, export constraints on commodities, increased resource prices and restrictions on energy and water usage.
|
13
|
Brookfield Business Partners
|
Some of our current operations are structured as joint ventures, partnerships and consortium arrangements, and we intend to continue to operate in this manner in the future, which will reduce Brookfield's and our control over our operations and may subject us to additional obligations.
An integral part of our strategy is to participate with institutional investors in Brookfield-sponsored or co-sponsored consortiums for single asset acquisitions and as a partner in or alongside Brookfield-sponsored or co-sponsored partnerships that target acquisitions that suit our profile. Such arrangements involve risks not present where a third party is not involved, including the possibility that partners or co-venturers might become bankrupt or otherwise fail to fund their share of required capital contributions. Additionally, partners or co-venturers might at any time have economic or other business interests or goals different from us and Brookfield. We generally owe fiduciary duties to our partners in our joint venture and partnership arrangements.
Joint ventures, partnerships and consortium investments generally provide for a reduced level of control over an acquired company because governance rights are shared with others. Accordingly, decisions relating to the underlying operations, including decisions relating to the management and operation and the timing and nature of any exit, are often made by a majority vote of the investors or by separate agreements that are reached with respect to individual decisions. For example, when we participate with institutional investors in Brookfield-sponsored or co-sponsored consortiums for asset acquisitions and as a partner in or alongside Brookfield-sponsored or co-sponsored partnerships, there is often a finite term to the investment, which could lead to the business being sold prior to the date we would otherwise choose. In addition, such operations may be subject to the risk that business, financial or management decisions are made with which we do not agree or the management of the operating business at issue may take risks or otherwise act in a manner that does not serve our interests. Because we may not have the ability to exercise sole control over such operations, we may not be able to realize some or all of the benefits that we believe will be created from our and Brookfield's involvement. If any of the foregoing were to occur, our business, financial condition and results of operations could suffer as a result.
In addition, because some of our current operations are structured as joint ventures, partnerships or consortium arrangements, the sale or transfer of interests in some of our operations are subject to rights of first refusal or first offer, tag along rights or drag along rights and some agreements provide for buy-sell or similar arrangements, any of which could be exercised outside of our control and accordingly could have an adverse impact on us.
We rely on the use of technology, which may not be able to accommodate our growth or may increase in cost, and may become subject to cyber-terrorism or other compromises and shut-downs.
We operate in businesses that are dependent on information systems and other technology, such as computer systems used for information storage, processing, administrative and commercial functions as well as the machinery and other equipment used in certain parts of our operations. In addition, our businesses rely on telecommunication services to interface with their business networks and customers. The information and embedded systems of key business partners and regulatory agencies are also important to our operations. We rely on this technology functioning as intended. Our information systems and technology may not continue to be able to accommodate our growth, and the cost of maintaining such systems may increase from its current level. Such a failure to accommodate growth, or an increase in costs related to such information systems, could have a material adverse effect on us.
We rely heavily on our financial, accounting, communications and other data processing systems. Our information technology systems may be subject to cyber-terrorism or other compromises and shut-downs, which may result in unauthorized access to our proprietary information, destruction of our data or disability, degradation or sabotage of our systems, often through the introduction of computer viruses, cyber-attacks and other means, and could originate from a wide variety of sources, including internal or unknown third parties. We cannot predict what effects such cyber-attacks or compromises or shut-downs may have on our business, and the consequences could be material. Cyber incidents may remain undetected for an extended period, which could exacerbate these consequences. Further, machinery and equipment used by our operating businesses may fail due to wear and tear, latent defect, design or operator errors or early obsolescence, among other things.
If our information systems and other technology are compromised, do not operate or are disabled, such could have a material adverse effect on our business prospects, financial condition, results of operations and cash flow.
We may suffer a significant loss resulting from fraud, bribery, corruption or other illegal acts, inadequate or failed internal processes or systems, or from external events.
Brookfield, our company and our operating businesses are subject to a number of laws and regulations governing payments and contributions to public officials or other third parties, including restrictions imposed by the U.S.
Foreign Corrupt Practices Act of 1977
and similar laws in non-U.S. jurisdictions, such as the U.K.
Bribery Act 2010
and the Canadian
Corruption of Foreign Public Officials Act
.
|
Brookfield Business Partners
|
14
|
Different laws that are applicable to us and our operating businesses may contain conflicting provisions, making our compliance more difficult. The policies and procedures we have implemented to protect against non-compliance with anti-bribery and corruption legislation may be inadequate. If we fail to comply with such laws and regulations, we could be exposed to claims for damages, financial penalties, reputational harm, restrictions on our operations and other liabilities, which could negatively affect our operating results and financial condition. In addition, we may be subject to successor liability for violations under these laws or other acts of bribery committed by our operating businesses.
Risks Relating to Our Construction Operations
Our construction operations are vulnerable to the cyclical nature of the construction market.
The demand for our construction services is dependent upon the existence of projects with engineering, procurement, construction and management needs. For example, a substantial portion of the revenues from our construction operations derives from residential, commercial and office projects in Australia, the United Kingdom, Canada, India and the Middle East. Capital expenditures by our clients may be influenced by factors such as prevailing economic conditions and expectations about economic trends, technological advances, consumer confidence, domestic and international political, military, regulatory and economic conditions and other similar factors.
Our revenue and earnings from our construction operations are largely dependent on the award of new contracts which we do not directly control.
A substantial portion of the revenue and earnings of our construction operations is generated from large-scale project awards. The timing of project awards is unpredictable and outside of our control. Awards often involve complex and lengthy negotiations and competitive bidding processes. These processes can be impacted by a wide variety of factors including a client's decision to not proceed with the development of a project, governmental approvals, financing contingencies and overall market and economic conditions. We may not win contracts that we have bid upon due to price, a client's perception of our ability to perform and/or perceived technology advantages held by others. Many of our competitors may be inclined to take greater or unusual risks or agree to terms and conditions in a contract that we might not deem acceptable. Because a significant portion of our revenue is generated from large projects, the results of our construction operations can fluctuate quarterly and annually depending on whether and when large project awards occur and the commencement and progress of work under large contracts already awarded. As a result, we are subject to the risk of losing new awards to competitors or the risk that revenue may not be derived from awarded projects as quickly as anticipated.
We may experience reduced profits or losses under contracts if costs increase above estimates.
Generally, our construction operations are performed under contracts that include cost and schedule estimates in relation to our services. Inaccuracies in these estimates may lead to cost overruns that may not be paid by our clients, thereby resulting in reduced profits or in losses. If a contract is significant or there are one or more events that impact a contract or multiple contracts, cost overruns could have a material impact on our reputation or our financial results, negatively impacting the financial condition, results of operations or cash flow of our construction operations. A portion of our ongoing construction projects are in fixed-price contracts, where we bear a significant portion of the risk for cost overruns. Reimbursable contract types, such as those that include negotiated hourly billing rates, may restrict the kinds or amounts of costs that are reimbursable, therefore exposing us to risk that we may incur certain costs in executing these contracts that are above our estimates and not recoverable from our clients. If we fail to accurately estimate the resources and time necessary for these types of contracts, or fail to complete these contracts within the timeframes and costs we have agreed upon, there could be a material impact on the financial results as well as reputation of our construction operations. Risks under our construction contracts which could result in cost overruns, project delays or other problems can also include:
|
•
|
difficulties related to the performance of our clients, partners, subcontractors, suppliers or other third parties;
|
|
•
|
changes in local laws or difficulties or delays in obtaining permits, rights of way or approvals;
|
|
•
|
unanticipated technical problems, including design or engineering issues;
|
|
•
|
insufficient or inadequate project execution tools and systems needed to record, track, forecast and control cost and schedule;
|
|
•
|
unforeseen increases in, or failures to, properly estimate the cost of raw materials, components, equipment, labour or the inability to timely obtain them;
|
|
•
|
delays or productivity issues caused by weather conditions;
|
|
•
|
incorrect assumptions related to productivity, scheduling estimates or future economic conditions; and
|
|
15
|
Brookfield Business Partners
|
|
•
|
project modifications creating unanticipated costs or delays.
|
These risks tend to be exacerbated for longer-term contracts because there is an increased risk that the circumstances under which we based our original cost estimates or project schedules will change with a resulting increase in costs. In many of these contracts, we may not be able to obtain compensation for additional work performed or expenses incurred, and if a project is not executed on schedule, we may be required to pay liquidated damages. In addition, these losses may be material and can, in some circumstances, equal or exceed the full value of the contract. In such circumstances, the financial condition, results of operations and cash flow of our construction operations could be negatively impacted.
We enter into performance guarantees which may result in future payments.
In the ordinary course of our construction operations, we enter into various agreements providing performance assurances and guarantees to clients on behalf of certain unconsolidated and consolidated partnerships, joint ventures and other jointly executed contracts. These agreements are entered into primarily to support the project execution commitments of these entities. The performance guarantees have various expiration dates ranging from mechanical completion of the project being constructed to a period extending beyond contract completion in certain circumstances. Any future payments under a performance guarantee could negatively impact the financial condition, results of operations and cash flow of our construction business.
Risks Relating to Our Business Services Operations
There are risks associated with the residential real estate industry in Canada and the United States.
The performance of our residential real estate brokerage services is dependent upon receipt of royalties, which in turn is dependent on the level of residential real estate transactions. The real estate industry is affected by all of the factors that affect the economy in general, and in addition may be affected by the aging network of real estate agents and brokers across Canada and the United States. In addition, there is pressure on the rate of commissions charged to the consumer and internet use by real estate consumers has led to a questioning of the value of traditional residential real estate services. Finally, changes to mortgage and lending rules in Canada that are implemented or contemplated from time to time have the potential to negatively impact residential housing prices and/or the number of residential real estate transactions in Canada, either or both of which could in turn reduce commissions and therefore royalties.
There are risks associated with our facilities management operations.
A general decline in the value and performance of commercial real estate and rental rates can lead to a reduction in management fees, a significant portion of which are generally based on the value of and revenue produced by the properties to which we provide services. Moreover, there is significant competition on an international, regional and local level for the provision of facilities management services. Depending on the service, we face competition from other residential real estate service providers, institutional lenders, insurance companies, investment banking firms, accounting firms, technology firms, consulting firms, firms providing outsourcing of various types and companies that self-provide their residential real estate services with in-house capabilities. Finally, our ability to conduct our facilities management services may be adversely impacted by disruptions to the infrastructure that supports our business and the communities in which they are located. Such disruptions could include disruptions to electrical, communications, information technology, transportation or other services used in the course of providing our facilities management services.
There are risks associated with our financial advisory services business.
The performance of our financial advisory services business is directly related to the quantum and size of transactions in which we participate. Market downturns that affect the frequency and magnitude of capital raising and other transactions will likely have a negative impact on our financial advisory services business. In addition, our financial advisory services business may be adversely affected by other factors, such as (i) intensified competition from peers as a result of the increasing pressures on financial services companies (ii) reductions in infrastructure spending by governments, (iii) increased regulation and the cost of compliance with such regulation, and (iv) the bankruptcy or other failure of companies for which we have performed investment banking services. It is difficult to predict how long current financial market and economic conditions will continue, whether they will deteriorate and if they do, how our business will be adversely affected. If one or more of the foregoing risks occur, revenues from our financial advisory services business will likely decline.
|
Brookfield Business Partners
|
16
|
There are risks associated with our road fuel distribution business.
Fluctuations in fuel product prices or a significant decrease in demand for road fuel in the areas we serve could significantly reduce our revenues and, therefore, could adversely affect our business, results of operations and financial condition. Our road fuel distribution business is dependent on various trends, such as trends in automobile and commercial truck traffic, travel and tourism in our areas of operation, and these trends can change. Furthermore, seasonal fluctuations, alternative technological advancements or regulatory action, including government-imposed fuel efficiency standards, may affect demand for motor fuel. Because certain of our operating costs and expenses, such as our general and administrative costs, are fixed and do not vary with the volumes of road fuel we distribute, our costs and expenses might not decrease ratably or at all should we experience a reduction in our volumes distributed. As a result, if our fuel distribution volumes decrease or if there is an event which significantly interrupts the supply of fuel to our customers, our business, reputation, results of operations and financial condition could be adversely affected.
Furthermore, there are dangers inherent in storage and processing of fuel products and the movement of fuel products by ship, train and truck, including deliveries to customer sites, that could cause disruptions in our operations or expose our business to potentially significant losses, costs or liabilities. These activities bring us into contact with members of the public and with the environment. Road fuel is stored in underground and above ground storage tanks at sites that we own or operate and at consignment sites where we retain title to the road fuel that we sell. Our operations are subject to significant hazards and risks inherent in storing motor fuel. These hazards and risks include, but are not limited to, fires, explosions, spills, discharges and other releases, any of which could result in distribution difficulties and disruptions, environmental pollution, governmentally-imposed fines or clean-up obligations, personal injury or wrongful death claims and other damage to our properties and the properties of others. Any such event could significantly disrupt our operations or expose us to significant liabilities, to the extent such liabilities are not covered by insurance. Therefore, the occurrence of such an event could adversely affect the operations and financial condition of our business.
There are risks associated with our gaming business.
The operations of our gaming business are conducted pursuant to operational services agreements with provincial lottery and gaming corporations. Although the agreements are renewable, there is no guarantee that we will continue to satisfy the conditions required for renewal. Additionally, when the renewal term expires, we may not be able to enter into new agreements that are the same as those historically, which may result in decreased revenues, increased operating costs or closure of an operation. Under the operational services agreements, the lottery and gaming corporations have the ability to suspend or terminate our right to provide services under the agreements for certain specified reasons. If we operate gaming in a manner inconsistent with the Criminal Code of Canada or applicable anti-money laundering legislation, violate provincial gaming laws or prejudice the integrity of gaming, the provincial lottery corporations may terminate one or more of our operational services agreements. If one or more of the operational services agreements are terminated, this will seriously impact the business.
Furthermore, the operations of our gaming business are contingent upon obtaining and maintaining all necessary licenses, permits, approvals, registrations, findings of suitability, orders and authorizations. The laws, regulations and ordinances requiring these licenses, permits and other approvals generally relate to the responsibility, financial stability and character of the owners and managers of gaming operations, as well as persons financially interested or involved in gaming operations.
Regulatory authorities have broad powers to request detailed financial and other information, to limit, condition, suspend or revoke a registration, gaming license or related approvals to approve changes in our operations, and to levy fines or require forfeiture of assets for violations of gaming laws or regulations. Complying with gaming laws, regulations and license requirements is costly. Any change in the laws, regulations or licenses applicable to our business or a violation of any current or future laws or regulations applicable to our business or gaming licenses could require us to make substantial expenditures or forfeit assets, and would negatively affect our gaming operations.
Risks Related to Our Energy Operations
Substantial declines in the prices of the resources we produce have reduced the revenues of our industrial operations, and sustained prices at those or lower levels would reduce our revenue and adversely affect the operating results and cash flows of our industrial operations.
The results of our industrial operations are substantially dependent upon the prices we receive for the resources we produce. Those prices depend on factors beyond our control. In recent years, commodity prices have declined significantly. Sustained depressed levels or future declines of the price of resources such as oil, gas, limestone and palladium and other metals may adversely affect the operating results and cash flows of our industrial operations.
|
17
|
Brookfield Business Partners
|
Our derivative risk management activities could result in financial losses.
In the past, commodity prices have been extremely volatile, and we expect this volatility to continue. To mitigate the effect of commodity price volatility on the results of our industrial operations, our strategy is to enter into derivative arrangements covering a portion of our resource production. These derivative arrangements are subject to mark-to-market accounting treatment, and the changes in fair value of the contracts will be reported in our statements of operations each quarter, which may result in significant non-cash gains or losses. These derivative contracts may also expose us to risk of financial loss in certain circumstances, including when production is less than the contracted derivative volumes, the counterparty to the derivative contract defaults on its contract obligations or the derivative contracts limit the benefit our industrial operations would otherwise receive from increases in commodity prices.
Our oil and gas operations are subject to all the risks normally incidental to oil and gas exploration, development and production.
Our oil and gas operations are subject to all the risks normally incidental to oil and gas development and production, including:
|
•
|
blowouts, cratering, explosions and fires;
|
|
•
|
adverse weather effects;
|
|
•
|
environmental hazards such as gas leaks, oil spills, pipeline and vessel ruptures and unauthorized discharges of gasses, brine, well stimulation and completion fluids or other pollutants into the surface and subsurface environment;
|
|
•
|
high costs, shortages or delivery delays of equipment, labour or other services or water and sand for hydraulic fracturing;
|
|
•
|
facility or equipment malfunctions, failures or accidents;
|
|
•
|
title problems;
|
|
•
|
pipe or cement failures or casing collapses;
|
|
•
|
compliance with environmental and other governmental requirements;
|
|
•
|
lost or damaged oilfield workover and service tools;
|
|
•
|
unusual or unexpected geological formations or pressure or irregularities in formations;
|
|
•
|
natural disasters; and
|
|
•
|
the availability of critical materials, equipment and skilled labour.
|
Our exposure to risks related to our oil and gas operations may increase as our drilling activity expands and we seek to directly provide fracture stimulation, water distribution and disposal and other services internally. Any of these risks could result in substantial losses to our company due to injury or loss of life, damage to or destruction of wells, production facilities or other property, environmental damage, regulatory investigations and penalties and suspension of operations.
Drilling for oil and gas also involves numerous risks, including the risk that we will not encounter commercially productive oil or gas reservoirs. The wells we participate in may not be productive and we may not recover all or any portion of our investment in those wells. The costs of drilling, completing and operating wells are often uncertain, and drilling operations may be curtailed, delayed or canceled as a result of a variety of factors including, but not limited to:
|
•
|
unexpected drilling conditions;
|
|
•
|
pressure or irregularities in formations;
|
|
•
|
equipment failures or accidents;
|
|
•
|
fires, explosions, blow-outs and surface cratering;
|
|
•
|
marine risks such as capsizing, collisions and hurricanes;
|
|
•
|
other adverse weather conditions; and
|
|
•
|
increase in cost of, or shortages or delays in the delivery of equipment.
|
|
Brookfield Business Partners
|
18
|
Future drilling activities may not be successful and, if unsuccessful, this failure could have an adverse effect on our future results of operations and financial condition. While all drilling, whether developmental or exploratory, involves these risks, exploratory drilling involves greater risks of dry holes or failure to find commercial quantities of hydrocarbons.
The marketability of our oil and gas production is dependent upon compressors, gathering lines, pipelines and other facilities, certain of which we do not control. When these facilities are unavailable, our operations can be interrupted and our revenues reduced.
The marketability of our oil and gas production depends in part upon the availability, proximity and capacity of oil and gas pipelines owned by third parties. In general, we do not control these transportation facilities and our access to them may be limited or denied. A significant disruption in the availability of these transportation facilities or compression and other production facilities could adversely impact our ability to deliver to market or produce our oil and gas and thereby result in our inability to realize the full economic potential of our production. If, in the future, we are unable, for any sustained period, to implement acceptable delivery or transportation arrangements or encounter compression or other production related difficulties, we will be required to shut in or curtail production from the field. Any such shut in or curtailment, or an inability to obtain favorable terms for delivery of the oil and gas produced from the field, would adversely affect our financial condition and results of operations.
If any of the third party pipelines and other facilities and service providers upon which we depend to move production to market become partially or fully unavailable to transport or process our production, or if quality specifications or physical requirements such as compression are altered by such third parties so as to restrict our ability to transport our production on those pipelines or facilities, our revenues could be adversely affected. Restrictions on our ability to move our oil and gas to market may have several other adverse effects, including fewer potential purchasers (thereby potentially resulting in a lower selling price) or, in the event we were unable to market and sustain production from a particular lease for an extended time, possible loss of a lease due to lack of production.
Growth of our marine transportation and offshore oil production-related services business depends on continued growth in global and regional demands for such services.
Our marine transportation and offshore oil production-related services business depends on continued growth in global and regional demands for such services, which could be negatively affected by a number of factors, including:
|
•
|
decreases in the actual or projected price of oil, which could lead to a reduction in or termination of production of oil at certain fields we service or a reduction in exploration for or development of new offshore oil fields;
|
|
•
|
increases in the production of oil in areas linked by pipelines to consuming areas, the extension of existing, or the development of new, pipeline systems in markets we may serve, the conversion of existing non-oil pipelines to oil pipelines in those markets, or the termination of production or abandonment of an oil field;
|
|
•
|
decreases in the consumption of oil due to increases in its price relative to other energy sources, other factors making consumption of oil less attractive, or energy conservation measures;
|
|
•
|
significant installment payments for acquisitions of newbuilding vessels or for the conversion of existing vessels prior to their delivery and generation of revenue;
|
|
•
|
reliance on a limited number of customers for a substantial majority of our revenues and on joint venture partners to assist us in operating our businesses and competing in our markets;
|
|
•
|
availability of new, alternative energy sources; and
|
|
•
|
negative global or regional economic or political conditions, particularly in oil consuming regions, which could reduce energy consumption or its growth. Reduced demand for offshore marine transportation, processing, storage services, offshore accommodation or towing and offshore installation services would have a material adverse effect on our future growth and could harm our business, results of operations and financial condition.
|
Marine transportation and oil production is inherently risky, particularly in the extreme conditions in which many of our vessels operate. An incident involving significant loss of product or environmental contamination by any of our vessels could harm our reputation and business.
Vessels and their cargoes and oil production facilities we service are at risk of being damaged or lost because of events such as:
|
•
|
marine disasters;
|
|
•
|
bad weather;
|
|
19
|
Brookfield Business Partners
|
|
•
|
mechanical failures;
|
|
•
|
grounding, capsizing, fire, explosions and collisions;
|
|
•
|
piracy;
|
|
•
|
human error; and
|
|
•
|
war and terrorism.
|
A portion of our shuttle tanker fleet and our towage fleet, an FSO unit, and the Voyageur Spirit and Petrojarl Knarr FPSO units operate in the North Sea. Harsh weather conditions in this region and other regions in which our vessels operate may increase the risk of collisions, oil spills, or mechanical failures.
An accident involving any of our vessels could result in any of the following:
|
•
|
death or injury to persons, loss of property or damage to the environment and natural resources;
|
|
•
|
delays in the delivery of cargo;
|
|
•
|
loss of revenues from charters or contracts of affreightment;
|
|
•
|
liabilities or costs to recover any spilled oil or other petroleum products and to restore the eco-system affected by the spill;
|
|
•
|
governmental fines, penalties or restrictions on conducting business;
|
|
•
|
higher insurance rates; and
|
|
•
|
damage to our reputation and customer relationships generally.
|
Any of these results could have a material adverse effect on our business, financial condition and operating results. In addition, any damage to, or environmental contamination involving, oil production facilities serviced could suspend that service and result in loss of revenues.
Our recontracting of existing vessels and our future growth depends on our ability to expand relationships with existing customers and obtain new customers, for which we expect to face substantial competition.
One of our principal objectives is to enter into additional long-term, fixed-rate time charters and contracts of affreightment, including the redeployment of our assets as their current charter contracts expire. The process of obtaining new long-term time charters and contracts of affreightment is highly competitive and generally involves an intensive screening process and competitive bids, and often extends for several months. Shuttle tanker, FSO, FPSO, towing and offshore installation vessel and UMS contracts are awarded based upon a variety of factors relating to the vessel operator, including:
|
•
|
industry relationships and reputation for customer service and safety;
|
|
•
|
experience and quality of ship operations;
|
|
•
|
quality, experience and technical capability of the crew;
|
|
•
|
relationships with shipyards and the ability to get suitable berths;
|
|
•
|
construction management experience, including the ability to obtain on-time delivery of new vessels or conversions according to customer specifications;
|
|
•
|
willingness to accept operational risks pursuant to the charter, such as allowing termination of the charter for force majeure events; and
|
|
•
|
competitiveness of the bid in terms of overall price.
|
We expect competition for providing services for potential offshore projects from other experienced companies, including state-sponsored entities. Our competitors may have greater financial resources than us. This increased competition may cause greater price competition for charters. As a result of these factors, we may be unable to expand our relationships with existing customers or to obtain new customers on a profitable basis, if at all, which would have a material adverse effect on our business, results of operations and financial condition.
|
Brookfield Business Partners
|
20
|
Risks Related to Our Industrial Operations
There are risks associated with ownership and operation of water, wastewater and industrial water treatment businesses in Brazil, any of which may adversely affect our financial condition.
In April 2017, together with institutional partners, we acquired a 70% controlling interest in the largest private water company in Brazil, which has been rebranded BRK Ambiental. Our ownership of BRK Ambiental subjects us to the risks incidental to the ownership and operation of water, wastewater and industrial water treatment businesses in Brazil, any of which may adversely affect our financial condition, results of operations and cash flows, including the following risks:
|
•
|
The government may impose restrictions on water usage as a response to regional or seasonal drought, which may result in decreased use of water services, even if our water supplies are sufficient to serve our customers. Moreover, reductions in water consumption, including changed consumer behaviour, may persist even after drought restrictions are repealed and the drought has ended.
|
|
•
|
The business will require significant capital expenditures and may suffer if we fail to secure appropriate funding to make investments, or if we experience delays in completing major capital expenditure projects.
|
|
•
|
In the event that water contamination occurs, there may be injury, damage or loss of life to our customers, employees or others, in addition to government enforcement actions, litigation, adverse publicity and reputational damage.
|
|
•
|
Water and wastewater businesses may be subject to organized efforts to convert their assets to public ownership and operation through exercise of the governmental power of eminent domain, or another similar authorized process. Moreover, there is a risk that any efforts to resist may be costly, distracting or unsuccessful.
|
|
•
|
Water related businesses are subject to extensive governmental economic regulation including with respect to the approval of rates.
|
Exploration and development may not result in commercially productive assets.
Exploration and development involves numerous risks, including the risk that no commercially productive asset will result from such activities. The cost of exploration and development is often uncertain and may depart from our expectations due to unexpected geological conditions, equipment failures or accidents, adverse weather conditions, regulatory restrictions on access to land and the cost and availability of personnel required to complete our exploration and development activities. The exploration and development activities of our industrial operations may not be successful and, if unsuccessful, such failure could have an adverse effect on our future results of operations and financial condition.
Our metals operations are subject to all the risks normally incidental to metals mining and processing.
Our metals operations are subject to all the risks normally incidental to metals mining and processing, including:
|
•
|
metallurgical and other processing problems;
|
|
•
|
geotechnical problems;
|
|
•
|
unusual and unexpected rock formations;
|
|
•
|
ground or slope failures or underground cave-ins;
|
|
•
|
environmental contamination;
|
|
•
|
industrial accidents;
|
|
•
|
fires;
|
|
•
|
flooding and periodic interruptions due to inclement or hazardous weather conditions or other acts of nature;
|
|
•
|
organized labour disputes or work slow-downs;
|
|
•
|
mechanical equipment failure and facility performance problems;
|
|
•
|
the availability of critical materials, equipment and skilled labour; and
|
|
•
|
effective management of tailings facilities.
|
Any of these risks could result in substantial losses to our company due to injury or loss of life, damage to or destruction of properties or production facilities, environmental damage, regulatory investigations and penalties and suspension of operations.
|
21
|
Brookfield Business Partners
|
Our industrial manufacturing operations are dependent on supplies of raw materials and results of operations could deteriorate if that supply is substantially disrupted for an extended period.
Raw material supply factors such as allocations, economic cyclicality, seasonality, pricing, quality, timeliness of delivery, transportation and warehousing costs may affect the raw material sourcing decisions we make. In the event of significant unanticipated increase in demand for our products, we may in the future be unable to manufacture certain products in a quantity sufficient to meet customer demand in any particular period without an adequate supply of raw materials.
The various raw materials used in our industrial operations are sourced and traded throughout the world and are subject to pricing volatility. Although we try to manage our exposure to raw material price volatility through the pricing of our products, there can be no assurance that the industry dynamics will allow us to continue to reduce our exposure by passing on raw material price increases to our customers.
Risks Relating to Our Relationship with Brookfield
Brookfield exercises substantial influence over us and we are highly dependent on the Service Providers.
Brookfield is the sole shareholder of the BBU General Partner. As a result of its ownership of the BBU General Partner, Brookfield is able to control the appointment and removal of the BBU General Partner's directors and, accordingly, exercises substantial influence over our company and over the Holding LP, for which our company is the managing general partner. Our company and the Holding LP do not have any employees and depend on the management and administration services provided by the Service Providers. Brookfield personnel and support staff that provide services to us are not required to have as their primary responsibility the management and administration of our company or the Holding LP, or to act exclusively for either of us. Any failure to effectively manage our current operations or to implement our strategy could have a material adverse effect on our business, financial condition and results of operations.
Brookfield has no obligation to source acquisition opportunities for us and we may not have access to all acquisitions that Brookfield identifies.
Our ability to grow depends on Brookfield's ability to identify and present us with acquisition opportunities. Brookfield established our company to be Brookfield's flagship public company for its business services and industrial operations, but Brookfield has no obligation to source acquisition opportunities for us. In addition, Brookfield has not agreed to commit to us any minimum level of dedicated resources for the pursuit of acquisitions. There are a number of factors which could materially and adversely impact the extent to which suitable acquisition opportunities are made available from Brookfield, including the following:
|
•
|
It is an integral part of Brookfield's (and our) strategy to pursue acquisitions through consortium arrangements with institutional investors, strategic partners or financial sponsors and to form partnerships to pursue such acquisitions on a specialized or global basis. Although Brookfield has agreed with us that it will not enter any such arrangements that are suitable for us without giving us an opportunity to participate in them, there is no minimum level of participation to which we will be entitled.
|
|
•
|
The same professionals within Brookfield's organization that are involved in acquisitions that are suitable for us are responsible for the consortiums and partnerships referred to above, as well as having other responsibilities within Brookfield's broader asset management business. Limits on the availability of such individuals could result in a limitation on the number of acquisition opportunities sourced for us.
|
|
•
|
Brookfield will only recommend acquisition opportunities that it believes are suitable for us. Our focus is on assets where we believe that our operations-oriented strategy can be deployed to create value in our business services and industrial operations. Accordingly, opportunities where Brookfield cannot play an active role in influencing the underlying business or managing the underlying assets that are not consistent with our acquisition strategy may not be suitable for us, even though they may be attractive from a purely financial perspective. Legal, regulatory, tax and other commercial considerations will likewise be an important consideration in determining whether an opportunity is suitable and will limit our ability to participate in certain acquisitions and may limit our ability to have more than 50% of our assets concentrated in a single jurisdiction.
|
|
•
|
In addition to structural limitations, the question of whether a particular acquisition is suitable is highly subjective and is dependent on a number of factors including our liquidity position at the relevant time, the risk profile of the opportunity, its fit with the balance of our operations and other factors. If Brookfield determines that an opportunity is not suitable for us, it may still pursue such opportunity on its own behalf, or on behalf of a Brookfield-sponsored partnership or consortium such as Brookfield Property Partners, Brookfield Infrastructure Partners and Brookfield Renewable Partners.
|
In making these determinations, Brookfield may be influenced by factors that result in a misalignment or conflict of interest. See Item 7.B., "Related Party Transactions—Conflicts of Interest and Fiduciary Duties."
|
Brookfield Business Partners
|
22
|
We rely on related parties for a portion of our revenues, particularly in respect of our construction services operations.
We may enter into contracts for service with related parties, including Brookfield. For example, our construction services business provides construction services to properties owned and operated by Brookfield. We are subject to risks as a result of our reliance on these related parties, including the risk that the business terms of our arrangements with them are not as fair to us and that our management is subject to conflicts of interest that may not be resolved in our favor. In addition, if our transactions with these related parties cease, it could have a material adverse effect on our business, financial condition and results of operations.
The departure of some or all of Brookfield's professionals could prevent us from achieving our objectives.
We depend on the diligence, skill and business contacts of Brookfield's professionals and the information and opportunities they generate during the normal course of their activities. Our future success will depend on the continued service of these individuals, who are not obligated to remain employed with Brookfield. Brookfield has experienced departures of key professionals in the past and may do so in the future, and we cannot predict the impact that any such departures will have on our ability to achieve our objectives. The departure of a significant number of Brookfield's professionals for any reason, or the failure to appoint qualified or effective successors in the event of such departures, could have a material adverse effect on our ability to achieve our objectives. Our Limited Partnership Agreement and our Master Services Agreement do not require Brookfield to maintain the employment of any of its professionals or to cause any particular professionals to provide services to us or on our behalf.
Control of our company and/or the BBU General Partner may be transferred to a third party without unitholder consent.
The BBU General Partner may transfer its general partnership interest to a third party in a merger or consolidation or in a transfer of all or substantially all of its assets without the consent of our unitholders. Furthermore, at any time, the shareholder of the BBU General Partner may sell or transfer all or part of its shares in the BBU General Partner without the approval of our unitholders. If a new owner were to acquire ownership of the BBU General Partner and to appoint new directors or officers of its own choosing, it would be able to exercise substantial influence over our policies and procedures and exercise substantial influence over our management and the types of acquisitions that we make. Such changes could result in our capital being used to make acquisitions in which Brookfield has no involvement or in making acquisitions that are substantially different from our targeted acquisitions. Additionally, we cannot predict with any certainty the effect that any transfer in the control of our company or the BBU General Partner would have on the trading price of our units or our ability to raise capital or make acquisitions in the future, because such matters would depend to a large extent on the identity of the new owner and the new owner's intentions. As a result, our future would be uncertain and our business, financial condition and results of operations may suffer.
Brookfield may increase its ownership of our company and the Holding LP relative to other unitholders.
Brookfield currently holds approximately 49% of the issued and outstanding interests in the Holding LP through Special LP Units and redemption-exchange units. The redemption-exchange units are redeemable for cash or exchangeable for our units in accordance with the Redemption-Exchange Mechanism, which could result in Brookfield eventually owning approximately 68% of our issued and outstanding units (including other issued and outstanding units that Brookfield currently owns).
Brookfield may also reinvest incentive distributions in exchange for redemption-exchange units or our units. Additional units of the Holding LP acquired, directly or indirectly, by Brookfield are redeemable for cash or exchangeable for our units in accordance with the Redemption-Exchange Mechanism. See Item 10.B., "Description of the Holding LP Limited Partnership Agreement—Redemption-Exchange Mechanism". Brookfield may also purchase additional units of our company in the market. Any of these events may result in Brookfield increasing its ownership of our company.
Our Master Services Agreement and our other arrangements with Brookfield do not impose on Brookfield any fiduciary duties to act in the best interests of our unitholders.
Our Master Services Agreement and our other arrangements with Brookfield do not impose on Brookfield any duty (statutory or otherwise) to act in the best interests of the Service Recipients, nor do they impose other duties that are fiduciary in nature. As a result, the BBU General Partner, a wholly-owned subsidiary of Brookfield Asset Management, in its capacity as the BBU General Partner, has sole authority to enforce the terms of such agreements and to consent to any waiver, modification or amendment of their provisions, subject to approval by a majority of our independent directors in accordance with our conflicts protocol.
|
23
|
Brookfield Business Partners
|
In addition, the Bermuda Limited Partnership Act of 1883, or the Bermuda Partnership Act, under which our company and the Holding LP were established, does not impose statutory fiduciary duties on a general partner of a limited partnership in the same manner that certain corporate statutes, such as the CBCA or the Delaware Revised Uniform Limited Partnership Act, impose fiduciary duties on directors of a corporation. In general, under applicable Bermudian legislation, a general partner has certain limited duties to its limited partners, such as the duty to render accounts, account for private profits and not compete with the partnership in business. In addition, Bermudian common law recognizes that a general partner owes a duty of utmost good faith to its limited partners. These duties are, in most respects, similar to duties imposed on a general partner of a limited partnership under U.S. and Canadian law. However, to the extent that the BBU General Partner owes any such fiduciary duties to our company and unitholders, these duties have been modified pursuant to our Limited Partnership Agreement as a matter of contract law, with the exception of the duty of our General Partner to act in good faith, which cannot be modified. We have been advised by Bermudian counsel that such modifications are not prohibited under Bermudian law, subject to typical qualifications as to enforceability of contractual provisions, such as the application of general equitable principles. This is similar to Delaware law which expressly permits modifications to the fiduciary duties owed to partners, other than an implied contractual covenant of good faith and fair dealing.
Our Limited Partnership Agreement contains various provisions that modify the fiduciary duties that might otherwise be owed to our company and our unitholders, including when conflicts of interest arise. Specifically, our Limited Partnership Agreement states that no breach of our Limited Partnership Agreement or a breach of any duty, including fiduciary duties, may be found for any matter that has been approved by a majority of the independent directors of the BBU General Partner. In addition, when resolving conflicts of interest, our Limited Partnership Agreement does not impose any limitations on the discretion of the independent directors or the factors which they may consider in resolving any such conflicts. The independent directors of the BBU General Partner can therefore take into account the interests of third parties, including Brookfield and, where applicable, any Brookfield managed consortia or partnership, when resolving conflicts of interest and may owe fiduciary duties to such third parties, managed consortium or partnerships. Additionally, any fiduciary duty that is imposed under any applicable law or agreement is modified, waived or limited to the extent required to permit the BBU General Partner to undertake any affirmative conduct or to make any decisions, so long as such action is reasonably believed to be in, or not inconsistent with, the best interests of our company.
In addition, our Limited Partnership Agreement provides that the BBU General Partner and its affiliates do not have any obligation under our Limited Partnership Agreement, or as a result of any duties stated or implied by law or equity, including fiduciary duties, to present business or acquisition opportunities to our company, the Holding LP, any Holding Entity or any other holding entity established by us. They also allow affiliates of the BBU General Partner to engage in activities that may compete with us or our activities. Additionally, any failure by the BBU General Partner to consent to any merger, consolidation or combination will not result in a breach of our Limited Partnership Agreement or any other provision of law. Our Limited Partnership Agreement prohibits our limited partners from advancing claims that otherwise might raise issues as to compliance with fiduciary duties or applicable law. These modifications to the fiduciary duties are detrimental to our unitholders because they restrict the remedies available for actions that might otherwise constitute a breach of fiduciary duty and permit conflicts of interest to be resolved in a manner that is not in the best interests of our company or the best interests of our unitholders. See Item 7.B., "Related Party Transactions—Conflicts of Interest and Fiduciary Duties".
Our organizational and ownership structure may create significant conflicts of interest that may be resolved in a manner that is not in our best interests or the best interests of our unitholders.
Our organizational and ownership structure involves a number of relationships that may give rise to conflicts of interest between us and our unitholders, on the one hand, and Brookfield, on the other hand. In certain instances, the interests of Brookfield may differ from our interests and our unitholders, including with respect to the types of acquisitions made, the timing and amount of distributions by our company, the redeployment of returns generated by our operations, the use of leverage when making acquisitions and the appointment of outside advisors and service providers, including as a result of the reasons described under Item 7.B., "Related Party Transactions—Conflicts of Interest and Fiduciary Duties".
In addition, the Service Providers, affiliates of Brookfield, provide management services to us pursuant to our Master Services Agreement. Pursuant to our Master Services Agreement, we pay a quarterly base management fee to the Service Providers equal to 0.3125% (1.25% annually) of the total capitalization of our company. For purposes of calculating the base management fee, the total capitalization of our company is equal to the quarterly volume-weighted average trading price of a unit on the principal stock exchange for our units (based on trading volumes) multiplied by the number of units outstanding at the end of the quarter (assuming full conversion of the redemption-exchange units into units), plus the value of securities of the other Service Recipients that are not held by us, plus all outstanding third party debt with recourse to a Service Recipient, less all cash held by such entities. This relationship may give rise to conflicts of interest between us and our unitholders, on the one hand, and Brookfield, on the other, as Brookfield's interests may differ from our interests and those of our unitholders.
|
Brookfield Business Partners
|
24
|
The arrangements we have with Brookfield may create an incentive for Brookfield to take actions which would have the effect of increasing distributions and fees payable to it, which may be to the detriment of us and our unitholders. For example, because the base management fee is calculated based on our market value, it may create an incentive for Brookfield to increase or maintain our market value over the near-term when other actions may be more favourable to us or our unitholders. Similarly, Brookfield may take actions to decrease distributions on our units or defer acquisitions in order to increase our market value in the near-term when making such distributions or acquisitions may be more favourable to us or our unitholders.
Our arrangements with Brookfield were negotiated in the context of an affiliated relationship and may contain terms that are less favourable than those which otherwise might have been obtained from unrelated parties.
The terms of our arrangements with Brookfield were effectively determined by Brookfield in the context of the spin-off. While the BBU General Partner's independent directors are aware of the terms of these arrangements and have approved the arrangements on our behalf, they did not negotiate the terms. These terms, including terms relating to compensation, contractual and fiduciary duties, conflicts of interest and Brookfield's ability to engage in outside activities, including activities that compete with us, our activities and limitations on liability and indemnification, may be less favourable than otherwise might have resulted if the negotiations had involved unrelated parties. Under our Limited Partnership Agreement, persons who acquire our units and their transferees will be deemed to have agreed that none of those arrangements constitutes a breach of any duty that may be owed to them under our Limited Partnership Agreement or any duty stated or implied by law or equity.
The BBU General Partner may be unable or unwilling to terminate our Master Services Agreement.
Our Master Services Agreement provides that the Service Recipients may terminate the agreement only if: the Service Providers default in the performance or observance of any material term, condition or covenant contained in the agreement in a manner that results in material harm to the Service Recipients and the default continues unremedied for a period of 30 days after written notice of the breach is given to the Service Providers; the Service Providers engage in any act of fraud, misappropriation of funds or embezzlement against any Service Recipient that results in material harm to the Service Recipients; the Service Providers are grossly negligent in the performance of their duties under the agreement and such negligence results in material harm to the Service Recipients; or upon the happening of certain events relating to the bankruptcy or insolvency of the Service Providers. The BBU General Partner cannot terminate the agreement for any other reason, including if the Service Providers or Brookfield experience a change of control, and there is no fixed term to the agreement. In addition, because the BBU General Partner is an affiliate of Brookfield, it likely will be unwilling to terminate our Master Services Agreement, even in the case of a default. If the Service Providers' performance does not meet the expectations of investors, and the BBU General Partner is unable or unwilling to terminate our Master Services Agreement, the market price of our units could suffer. Furthermore, the termination of our Master Services Agreement would terminate our company's rights under the Relationship Agreement and our Licensing Agreement. See Item 7.B., "Related Party Transactions—Relationship Agreement" and "Related Party Transactions—Licensing Agreement".
The liability of the Service Providers is limited under our arrangements with them and we have agreed to indemnify the Service Providers against claims that they may face in connection with such arrangements, which may lead them to assume greater risks when making decisions relating to us than they otherwise would if acting solely for their own account.
Under our Master Services Agreement, the Service Providers have not assumed any responsibility other than to provide or arrange for the provision of the services described in our Master Services Agreement in good faith and will not be responsible for any action that the BBU General Partner takes in following or declining to follow its advice or recommendations. In addition, under our Limited Partnership Agreement, the liability of the BBU General Partner and its affiliates, including the Service Providers, is limited to the fullest extent permitted by law to conduct involving bad faith, fraud or willful misconduct or, in the case of a criminal matter, action that was known to have been unlawful. The liability of the Service Providers under our Master Services Agreement is similarly limited, except that the Service Providers are also liable for liabilities arising from gross negligence. In addition, we have agreed to indemnify the Service Providers to the fullest extent permitted by law from and against any claims, liabilities, losses, damages, costs or expenses incurred by them or threatened in connection with our business, investments and activities or in respect of or arising from our Master Services Agreement or the services provided by the Service Providers, except to the extent that such claims, liabilities, losses, damages, costs or expenses are determined to have resulted from the conduct in respect of which such persons have liability as described above. These protections may result in the Service Providers tolerating greater risks when making decisions than otherwise would be the case, including when determining whether to use and the extent of leverage in connection with acquisitions. The indemnification arrangements to which the Service Providers are a party may also give rise to legal claims for indemnification that are adverse to us and our unitholders.
|
25
|
Brookfield Business Partners
|
Risks Relating to Our Structure
Our company is a holding entity and currently we rely on the Holding LP and, indirectly, the Holding Entities and our operating businesses to provide us with the funds necessary to meet our financial obligations.
Our company is a holding entity and its material assets consist solely of interests in the Holding Entities, through which we hold all of our interests in our operating businesses. Our company has no independent means of generating revenue. As a result, we depend on distributions and other payments from the Holding LP and, indirectly, the Holding Entities and our operating businesses to provide us with the funds necessary to meet our financial obligations at the partnership level. The Holding LP, the Holding Entities and our operating businesses are legally distinct from us and some of them are or may become restricted in their ability to pay dividends and distributions or otherwise make funds available to us pursuant to local law, regulatory requirements and their contractual agreements, including agreements governing their financing arrangements. Any other entities through which we may conduct operations in the future will also be legally distinct from us and may be similarly restricted in their ability to pay dividends and distributions or otherwise make funds available to us under certain conditions. The Holding LP, the Holding Entities and our operating businesses will generally be required to service their debt obligations before making distributions to us or their parent entities, as applicable, thereby reducing the amount of our cash flow available to our company to meet our financial obligations.
We anticipate that the only distributions that we will receive in respect of our company's managing general partnership interests in the Holding LP will consist of amounts that are intended to assist our company to pay expenses as they become due and to make distributions to our unitholders in accordance with our company's distribution policy.
We may be subject to the risks commonly associated with a separation of economic interest from control or the incurrence of debt at multiple levels within an organizational structure.
Our ownership and organizational structure is similar to structures whereby one company controls another company which in turn holds controlling interests in other companies; thereby, the company at the top of the chain may control the company at the bottom of the chain even if its effective equity position in the bottom company is less than a controlling interest. Brookfield is the sole shareholder of the BBU General Partner and, as a result of such ownership of the BBU General Partner, Brookfield is able to control the appointment and removal of the BBU General Partner's directors and, accordingly, exercises substantial influence over us. In turn, we often have a majority controlling interest or a significant influence in our operating businesses. Although Brookfield currently has an effective equity interest in our business of approximately 68% as a result of ownership of our units, general partnership units, redemption-exchange units and Special LP Units, over time Brookfield may reduce this interest while still maintaining its controlling interest, and, therefore, Brookfield may use its control rights in a manner that conflicts with the interests of our other unitholders. For example, despite the fact that we have a conflicts protocol in place, which addresses the requirement for independent approval and other requirements for transactions in which there is greater potential for a conflict of interest to arise, including transactions with affiliates of Brookfield, because Brookfield will be able to exert substantial influence over us, there is a greater risk of transfer of assets at non-arm's length values to Brookfield and its affiliates. In addition, debt incurred at multiple levels within the chain of control could exacerbate the separation of economic interest from controlling interest at such levels, thereby creating an incentive to increase our leverage. Any such increase in debt would also make us more sensitive to declines in revenues, increases in expenses and interest rates and adverse market conditions. The servicing of any such debt would also reduce the amount of funds available to pay distributions to us and ultimately to our unitholders and could reduce total returns to unitholders.
|
Brookfield Business Partners
|
26
|
Our company is not, and does not intend to become, regulated as an investment company under the U.S. Investment Company Act of 1940, or the Investment Company Act, (and similar legislation in other jurisdictions), and, if our company were deemed an "investment company" under the Investment Company Act, applicable restrictions could make it impractical for us to operate as contemplated.
The Investment Company Act (and similar legislation in other jurisdictions) provides certain protections to investors and imposes certain restrictions on companies that are required to be regulated as investment companies. Among other things, such rules limit or prohibit transactions with affiliates, impose limitations on the issuance of debt and equity securities and impose certain governance requirements. Our company has not been and does not intend to become regulated as an investment company and our company intends to conduct its activities so it will not be deemed to be an investment company under the Investment Company Act (and similar legislation in other jurisdictions). In order to ensure that we are not deemed to be an investment company, we may be required to materially restrict or limit the scope of our operations or plans. We will be limited in the types of acquisitions that we may make, and we may need to modify our organizational structure or dispose of assets which we would not otherwise dispose. Moreover, if anything were to happen which causes our company to be deemed an investment company under the Investment Company Act, it would be impractical for us to operate as contemplated. Agreements and arrangements between and among us and Brookfield would be impaired, the type and number of acquisitions that we would be able to make as a principal would be limited and our business, financial condition and results of operations would be materially adversely affected. Accordingly, we would be required to take extraordinary steps to address the situation, such as the amendment or termination of our Master Services Agreement, the restructuring of our company and the Holding Entities, the amendment of our Limited Partnership Agreement or the dissolution of our company, any of which could materially adversely affect the value of our units. In addition, if our company were deemed to be an investment company under the Investment Company Act, it would be taxable as a corporation for U.S. federal income tax purposes, and such treatment could materially adversely affect the value of our units.
Our company is an "SEC foreign issuer" under Canadian securities regulations and a "foreign private issuer" under U.S. securities law. Therefore, we are exempt from certain requirements of Canadian securities laws and from requirements applicable to U.S. domestic registrants listed on the NYSE.
Although our company is a reporting issuer in Canada, we are an "SEC foreign issuer" and exempt from certain Canadian securities laws relating to disclosure obligations and proxy solicitation, subject to certain conditions. Therefore, there may be less publicly available information in Canada about our company than would be available if we were a typical Canadian reporting issuer.
Although we are subject to the periodic reporting requirement of the U.S.
Securities Exchange Act of 1934
, as amended, and the rules and regulations promulgated thereunder, or the Exchange Act, the periodic disclosure required of foreign private issuers under the Exchange Act is different from periodic disclosure required of U.S. domestic registrants. Therefore, there may be less publicly available information about our company than is regularly published by or about other public limited partnerships in the United States. Our company is exempt from certain other sections of the Exchange Act to which U.S. domestic issuers are subject, including the requirement to provide our unitholders with information statements or proxy statements that comply with the Exchange Act. In addition, insiders and large unitholders of our company are not obligated to file reports under Section 16 of the Exchange Act, and we will be permitted to follow certain home country corporate governance practices instead of those otherwise required under the NYSE Listed Company Manual for domestic issuers. We currently intend to follow the same corporate practices as would be applicable to U.S. domestic limited partnerships. However, we may in the future elect to follow our home country law for certain of our corporate governance practices, as permitted by the rules of the NYSE, in which case our unitholders would not be afforded the same protection as provided under NYSE corporate governance standards. Following our home country governance practices as opposed to the requirements that would otherwise apply to a U.S. domestic limited partnership listed on the NYSE may provide less protection than is accorded to investors of U.S. domestic issuers.
|
27
|
Brookfield Business Partners
|
Our failure to maintain effective internal controls could have a material adverse effect on our business in the future and the price of our units.
As a public company, we are subject to the reporting requirements of the Exchange Act, the Sarbanes-Oxley Act, and stock exchange rules promulgated in response to the Sarbanes-Oxley Act. A number of our current operating subsidiaries are and potential future acquisitions will be private companies and their systems of internal controls over financial reporting may be less developed as compared to public company requirements. In addition, we routinely exclude recently acquired companies from our evaluation of internal controls. For example, for our fiscal year ended December 31, 2017, we excluded BRK Ambiental, Greenergy, and our fuel marketing business, which collectively represented
46%
of our total assets,
32%
of our net assets,
63%
of our revenue and
7%
of our net income for the year. Any failure to maintain adequate internal controls over financial reporting or to implement required, new or improved controls, or difficulties encountered in their implementation, could cause material weaknesses or significant deficiencies in our internal controls over financial reporting and could result in errors or misstatements in our consolidated financial statements that could be material. If we or our independent registered public accounting firm were to conclude that our internal controls over financial reporting were not effective, investors could lose confidence in our reported financial information and the price of our units could decline. Our failure to achieve and maintain effective internal controls could have a material adverse effect on our business, our ability to access capital markets and investors' perception of us. In addition, material weaknesses in our internal controls could require significant expense and management time to remediate.
Risks Relating to Our Units
Our unitholders do not have a right to vote on company matters or to take part in the management of our company.
Under our Limited Partnership Agreement, our unitholders are not entitled to vote on matters relating to our company, such as acquisitions, dispositions or financing, or to participate in the management or control of our company. In particular, our unitholders do not have the right to remove the BBU General Partner, to cause the BBU General Partner to withdraw from our company, to cause a new general partner to be admitted to our company, to appoint new directors to the BBU General Partner's board of directors, to remove existing directors from the BBU General Partner's board of directors or to prevent a change of control of the BBU General Partner. In addition, except for certain fundamental matters and related party transactions, our unitholders' consent rights apply only with respect to certain amendments to our Limited Partnership Agreement as described in Item 10.B., "Memorandum and Articles of Association—Description of our Units and our Limited Partnership Agreement". As a result, unlike holders of common stock of a corporation, our unitholders are not able to influence the direction of our company, including its policies and procedures, or to cause a change in its management, even if they are unsatisfied with the performance of our company. Consequently, our unitholders may be deprived of an opportunity to receive a premium for their units in the future through a sale of our company and the trading price of our units may be adversely affected by the absence or a reduction of a takeover premium in the trading price.
The market price of our units may be volatile.
The market price of our units may be highly volatile and could be subject to wide fluctuations. Some of the factors that could negatively affect the price of our units include: general market and economic conditions, including disruptions, downgrades, credit events and perceived problems in the credit markets; actual or anticipated variations in our quarterly operating results or distributions on our units; actual or anticipated variations or trends in market interest rates; changes in our operating businesses or asset composition; write-downs or perceived credit or liquidity issues affecting our assets; market perception of our company, our business and our assets, including investor sentiment regarding diversified holding companies such as our company; our level of indebtedness and/or adverse market reaction to any indebtedness we incur in the future; our ability to raise capital on favourable terms or at all; loss of any major funding source; the termination of our Master Services Agreement or additions or departures of our or Brookfield's key personnel; changes in market valuations of similar companies and partnerships; speculation in the press or investment community regarding us or Brookfield; and changes in U.S. tax laws that make it impractical or impossible for our company to continue to be taxable as a partnership for U.S. federal income tax purposes. Securities markets in general have experienced extreme volatility that has often been unrelated to the operating performance of particular companies or partnerships. Any broad market fluctuations may adversely affect the trading price of our units.
|
Brookfield Business Partners
|
28
|
We may issue additional units in the future, including in lieu of incurring indebtedness, which may dilute existing holders of our units. We may also issue securities that have rights and privileges that are more favourable than the rights and privileges accorded to our unitholders.
Under our Limited Partnership Agreement, subject to the terms of any of our securities then outstanding, we may issue additional partnership securities, including units, preferred units and options, rights, warrants and appreciation rights relating to partnership securities for any purpose and for such consideration and on such terms and conditions as the BBU General Partner may determine. Subject to the terms of any of our securities then outstanding, the BBU General Partner's board of directors will be able to determine the class, designations, preferences, rights, powers and duties of any additional partnership securities, including any rights to share in our profits, losses and distributions, any rights to receive partnership assets upon our dissolution or liquidation and any redemption, conversion and exchange rights. Subject to the terms of any of our securities then outstanding, the BBU General Partner may use such authority to issue such additional securities. The sale or issuance of a substantial number of our units or other equity related securities of our company in the public markets, or the perception that such sales or issuances could occur, could depress the market price of our units and impair our ability to raise capital through the sale of additional units. In addition, at any time after two years from the date of the spin-off, or June 20, 2018, the holders of redemption-exchange units will have the right to require the Holding LP to redeem all or a portion of the redemption-exchange units for cash, subject to our company's right to acquire such interests (in lieu of redemption) in exchange for the issuance of our units to such holders. We cannot predict the effect that future sales or issuances of our units or other equity-related securities would have on the market price of our units. Subject to the terms of any of our securities then outstanding, holders of units will not have any pre-emptive right or any right to consent to or otherwise approve the issuance of any securities or the terms on which any such securities may be issued.
A unitholder who elects to receive our distributions in Canadian dollars is subject to foreign currency risk associated with our company's distributions.
A significant number of our unitholders will reside in countries where the U.S. dollar is not the functional currency. We intend to declare our distributions in U.S. dollars but unitholders may, at their option, elect settlement in Canadian dollars. For unitholders who so elect, the value received in Canadian dollars from the distribution will be determined based on the exchange rate between the U.S. dollar and the Canadian dollar at the time of payment. As such, if the U.S. dollar depreciates significantly against the Canadian dollar, the value received by a unitholder who elects to receive our distributions in Canadian dollars will be adversely affected.
U.S. investors in our units may find it difficult or impossible to enforce service of process and enforcement of judgments against us and directors and officers of the BBU General Partner and the Service Providers.
We were established under the laws of Bermuda, and most of our subsidiaries are organized in jurisdictions outside of the United States. In addition, certain of our executive officers are located outside of the United States. Certain of the directors and officers of the BBU General Partner and the Service Providers reside outside of the United States. A substantial portion of our assets are, and the assets of the directors and officers of the BBU General Partner and the Service Providers may be, located outside of the United States. It may not be possible for investors to effect service of process within the United States upon the directors and officers of the BBU General Partner and the Service Providers. It may also not be possible to enforce against us or the directors and officers of the BBU General Partner and the Service Providers, judgments obtained in U.S. courts predicated upon the civil liability provisions of applicable securities law in the United States.
Canadian investors in our units may find it difficult or impossible to enforce service of process and enforcement of judgments against us and the directors and officers of the BBU General Partner and the Service Providers.
We were established under the laws of Bermuda, and most of our subsidiaries are organized in jurisdictions outside of Canada. In addition, certain of our executive officers are located outside of Canada. Certain of the directors and officers of the BBU General Partner and the Service Providers reside outside of Canada. A substantial portion of our assets are, and the assets of the directors and officers of the BBU General Partner and the Service Providers may be, located outside of Canada. It may not be possible for investors to effect service of process within Canada upon the directors and officers of the BBU General Partner and the Service Providers. It may also not be possible to enforce against us or the directors and officers of the BBU General Partner and the Service Providers judgments obtained in Canadian courts predicated upon the civil liability provisions of applicable securities laws in Canada.
|
29
|
Brookfield Business Partners
|
Risks Related to Taxation
General
Changes in tax law and practice may have a material adverse effect on the operations of our company, the Holding Entities and the operating businesses and, as a consequence, the value of our assets and the net amount of distributions payable to our unitholders.
Our structure, including the structure of the Holding Entities and the operating businesses, is based on prevailing taxation law and practice in the local jurisdictions in which we operate. Any change in tax legislation (including in relation to taxation rates) and practice in these jurisdictions could adversely affect these entities, as well as the net amount of distributions payable to our unitholders. Taxes and other constraints that would apply to our operating businesses in such jurisdictions may not apply to local institutions or other parties, and such parties may therefore have a significantly lower effective cost of capital and a corresponding competitive advantage in pursuing such acquisitions.
Our company's ability to make distributions depends on it receiving sufficient cash distributions from its underlying operations, and we cannot assure our unitholders that our company will be able to make cash distributions to them in amounts that are sufficient to fund their tax liabilities.
Our Holding Entities and operating businesses may be subject to local taxes in each of the relevant territories and jurisdictions in which they operate, including taxes on income, profits or gains and withholding taxes. As a result, our company's cash available for distribution is indirectly reduced by such taxes, and the post-tax return to our unitholders is similarly reduced by such taxes. We intend for future acquisitions to be assessed on a case-by-case basis and, where possible and commercially viable, structured so as to minimize any adverse tax consequences to our unitholders as a result of making such acquisitions.
In general, a unitholder that is subject to income tax in Canada or the United States must include in income its allocable share of our company's items of income, gain, loss and deduction (including, so long as it is treated as a partnership for tax purposes, our company's allocable share of those items of the Holding LP) for each of our company's fiscal years ending with or within such unitholder's tax year. See Item 10.E., "Taxation—Certain Material Canadian Federal Income Tax Considerations" and Taxation—Certain Material U.S. Federal Income Tax Considerations". However, the cash distributed to a unitholder may not be sufficient to pay the full amount of such unitholder's tax liability in respect of its investment in our company, because each unitholder's tax liability depends on such unitholder's particular tax situation and the tax treatment of the underlying activities or assets of our company. If our company is unable to distribute cash in amounts that are sufficient to fund our unitholders' tax liabilities, each of our unitholders will still be required to pay income taxes on its share of our company's taxable income.
Our unitholders may be subject to non-U.S., state and local taxes and return filing requirements as a result of owning our units.
Based on our expected method of operation and the ownership of our operating businesses indirectly through corporate Holding Entities, we do not expect any unitholder, solely as a result of owning our units, to be subject to any additional income taxes imposed on a net basis or additional tax return filing requirements in any jurisdiction in which we conduct activities or own property. However, our method of operation and current structure may change, and there can be no assurance that our unitholders, solely as a result of owning our units, will not be subject to certain taxes, including non-U.S., state and local income taxes, unincorporated business taxes and estate, inheritance or intangible taxes imposed by the various jurisdictions in which we do business or own property now or in the future, even if our unitholders do not reside in any of these jurisdictions. Consequently, our unitholders may also be required to file non-U.S., state and local income tax returns in some or all of these jurisdictions. Further, our unitholders may be subject to penalties for failure to comply with these requirements. It is the responsibility of each unitholder to file all U.S. federal, non-U.S., state and local tax returns that may be required of such unitholder.
Our unitholders may be exposed to transfer pricing risks.
To the extent that our company, the Holding LP, the Holding Entities or the operating businesses enter into transactions or arrangements with parties with whom they do not deal at arm's length, including Brookfield, the relevant tax authorities may seek to adjust the quantum or nature of the amounts received or paid by such entities if they consider that the terms and conditions of such transactions or arrangements differ from those that would have been made between persons dealing at arm's length. This could result in more tax (and penalties and interest) being paid by such entities, and therefore the return to investors could be reduced. For Canadian tax purposes, a transfer pricing adjustment may in certain circumstances result in additional income being allocated to a unitholder with no corresponding cash distribution or in a dividend being deemed to be paid by a Canadian-resident to a non-arm's length non-resident, which deemed dividend is subject to Canadian withholding tax.
|
Brookfield Business Partners
|
30
|
The BBU General Partner believes that the base management fee and any other amount that is paid to the Service Providers will be commensurate with the value of the services being provided by the Service Providers and comparable to the fees or other amounts that would be agreed to in an arm's-length arrangement. However, no assurance can be given in this regard. If the relevant tax authority were to assert that an adjustment should be made under the transfer pricing rules to an amount that is relevant to the computation of the income of the Holding LP or our company, such assertion could result in adjustments to amounts of income (or loss) allocated to our unitholders by our company for tax purposes. In addition, we might also be liable for transfer pricing penalties in respect of transfer pricing adjustments unless reasonable efforts were made to determine, and use, arm's-length transfer prices. Generally, reasonable efforts in this regard are only considered to be made if contemporaneous documentation has been prepared in respect of such transactions or arrangements that support the transfer pricing methodology.
The U.S. Internal Revenue Service, or IRS, or Canada Revenue Agency, or CRA, may not agree with certain assumptions and conventions that our company uses in order to comply with applicable U.S. and Canadian federal income tax laws or that our company uses to report income, gain, loss, deduction and credit to our unitholders.
Our company will apply certain assumptions and conventions in order to comply with applicable tax laws and to report income, gain, deduction, loss and credit to a unitholder in a manner that reflects such unitholder's beneficial ownership of partnership items, taking into account variation in ownership interests during each taxable year because of trading activity. However, these assumptions and conventions may not be in compliance with all aspects of the applicable tax requirements. A successful IRS or CRA challenge to such assumptions or conventions could adversely affect the amount of tax benefits available to our unitholders and could require that items of income, gain, deduction, loss, or credit, including interest deductions, be adjusted, reallocated or disallowed in a manner that adversely affects our unitholders. See Item 10.E., "Taxation—Certain Material Canadian Federal Income Tax Considerations" and "Taxation—Certain Material U.S. Federal Income Tax Considerations."
United States
If our company or the Holding LP were to be treated as a corporation for U.S. federal income tax purposes, the value of our units might be adversely affected.
The value of our units to unitholders will depend in part on the treatment of our company and the Holding LP as partnerships for U.S. federal income tax purposes. However, in order for our company to be treated as a partnership for U.S. federal income tax purposes, 90% or more of our company's gross income for every taxable year must consist of qualifying income, as defined in Section 7704 of the
U.S. Internal Revenue Code of 1986
, as amended, or the U.S. Internal Revenue Code, and our company must not be required to register, if it were a U.S. corporation, as an investment company under the Investment Company Act and related rules. Although the BBU General Partner intends to manage our company's affairs so that our company will not need to be registered as an investment company if it were a U.S. corporation and so that it will meet the 90% test described above in each taxable year, our company may not meet these requirements, or current law may change so as to cause, in either event, our company to be treated as a corporation for U.S. federal income tax purposes. If our company (or the Holding LP) were treated as a corporation for U.S. federal income tax purposes, adverse U.S. federal income tax consequences could result for our unitholders and our company (or the Holding LP, as applicable), as described in greater detail in Item 10.E., "Taxation—Certain Material U.S. Federal Income Tax Considerations—Partnership Status of Our Company and the Holding LP."
We may be subject to U.S. backup withholding tax or other U.S. withholding taxes if any unitholder fails to comply with U.S. tax reporting rules or if the IRS or other applicable state or local taxing authority does not accept our withholding methodology, and such excess withholding tax cost will be an expense borne by our company and, therefore, by all of our unitholders on a pro rata basis.
We may become subject to U.S. "backup" withholding tax or other U.S. withholding taxes with respect to any unitholder who fails to timely provide our company (or the applicable clearing agent or other intermediary) with an IRS Form W-9 or IRS Form W-8, as the case may be, or if the withholding methodology we use is not accepted by the IRS or other applicable state or local taxing authority. See Item 10.E., "Taxation—Certain Material U.S. Federal Income Tax Considerations—Administrative Matters—Withholding and Backup Withholding". To the extent that any unitholder fails to timely provide the applicable form (or such form is not properly completed), or should the IRS or other applicable state or local taxing authority not accept our withholding methodology, our company might treat such U.S. backup withholding taxes or other U.S. withholding taxes as an expense, which would be borne indirectly by all of our unitholders on a pro rata basis. As a result, our unitholders that fully comply with their U.S. tax reporting obligations may bear a share of such burden created by other unitholders that do not comply with the U.S. tax reporting rules.
|
31
|
Brookfield Business Partners
|
Tax-exempt organizations may face certain adverse U.S. tax consequences from owning our units.
The BBU General Partner intends to use commercially reasonable efforts to structure the activities of our company and the Holding LP, respectively, to avoid generating income connected with the conduct of a trade or business (which income generally would constitute "unrelated business taxable income", or UBTI, to the extent allocated to a tax-exempt organization). However, neither our company nor the Holding LP is prohibited from incurring indebtedness, and no assurance can be provided that neither our company nor the Holding LP will generate UBTI attributable to debt-financed property in the future. In particular, UBTI includes income attributable to debt-financed property, and neither our company nor the Holding LP is prohibited from financing the acquisition of property with debt. The potential for income to be characterized as UBTI could make our units an unsuitable investment for a tax-exempt organization. Each tax-exempt organization should consult its own tax adviser to determine the U.S. federal income tax consequences of an investment in our units.
If our company were engaged in a U.S. trade or business, non-U.S. persons would face certain adverse U.S. tax consequences from owning our units.
The BBU General Partner intends to use commercially reasonable efforts to structure the activities of our company and the Holding LP to avoid generating income treated as effectively connected with a U.S. trade or business, including effectively connected income attributable to the sale of a "United States real property interest", as defined in the U.S. Internal Revenue Code. If our company were deemed to be engaged in a U.S. trade or business, or to realize gain from the sale or other disposition of a U.S. real property interest, Non-U.S. Holders (as defined in Item 10.E., "Taxation—Certain Material U.S. Federal Income Tax Considerations") generally would be required to file U.S. federal income tax returns and could be subject to U.S. federal withholding tax at the highest marginal U.S. federal income tax rates applicable to ordinary income. Under the Tax Cuts and Jobs Act (as defined below), if, contrary to expectation, our company were engaged in a U.S. trade or business, then gain or loss from the sale of our units by a Non-U.S. Holder would be treated as effectively connected with such trade or business to the extent that such Non-U.S. Holder would have had effectively connected gain or loss had our company sold all of its assets at their fair market value as of the date of such sale. In such case, any such effectively connected gain generally would be taxable at the regular graduated U.S. federal income tax rates, and the amount realized from such sale generally would be subject to a 10% U.S. federal withholding tax. See Item 10.E., "Taxation—Certain Material U.S. Federal Income Tax Considerations—Consequences to Non-U.S. Holders".
To meet U.S. federal income tax and other objectives, our company and the Holding LP may acquire assets through U.S. and non-U.S. Holding Entities that are treated as corporations for U.S. federal income tax purposes, and such Holding Entities may be subject to corporate income tax.
To meet U.S. federal income tax and other objectives, our company and the Holding LP may acquire assets through U.S. and non-U.S. Holding Entities that are treated as corporations for U.S. federal income tax purposes, and such Holding Entities may be subject to corporate income tax. Consequently, items of income, gain, loss, deduction or credit realized in the first instance by the operating businesses will not flow, for U.S. federal income tax purposes, directly to the Holding LP, our company or our unitholders, and any such income or gain may be subject to a corporate income tax, in the United States or other jurisdictions, at the level of the Holding Entity. Any such additional taxes may adversely affect our company's ability to maximize its cash flow.
Our unitholders taxable in the United States may be viewed as holding an indirect interest in an entity classified as a "passive foreign investment company" for U.S. federal income tax purposes.
U.S. Holders may face adverse U.S. tax consequences arising from the ownership of a direct or indirect interest in a "passive foreign investment company", or PFIC. See Item 10.E., "Taxation—Certain Material U.S. Federal Income Tax Considerations—Consequences to U.S. Holders—Passive Foreign Investment Companies". Based on our organizational structure, as well as our expected income and assets, the BBU General Partner currently believes that a U.S. Holder is unlikely to be regarded as owning an interest in a PFIC solely by reason of owning our units for the taxable year ending
December 31,
2018
. However, there can be no assurance that a future entity in which our company acquires an interest will not be classified as a PFIC with respect to a U.S. Holder, because PFIC status is a factual determination that depends on the assets and income of a given entity and must be made on an annual basis. Each U.S. Holder should consult its own tax adviser regarding the implication of the PFIC rules for an investment in our units.
Tax gain or loss from the disposition of our units could be more or less than expected.
If a U.S. Holder sells units that it holds, then it generally will recognize gain or loss for U.S. federal income tax purposes equal to the difference between the amount realized and its adjusted tax basis in such units. Prior distributions to a unitholder in excess of the total net taxable income allocated to such unitholder will have decreased such unitholder's tax basis in our units. Therefore, such excess distributions will increase a unitholder's taxable gain or decrease such unitholder's taxable loss when our units are sold, and may result in a taxable gain even if the sale price is less than the original cost. A portion of the amount realized, whether or not representing gain, could be ordinary income to such unitholder.
|
Brookfield Business Partners
|
32
|
Our company structure involves complex provisions of U.S. federal income tax law for which no clear precedent or authority may be available. The tax characterization of our company structure is also subject to potential legislative, judicial, or administrative change and differing interpretations, possibly on a retroactive basis.
The U.S. federal income tax treatment of our unitholders depends in some instances on determinations of fact and interpretations of complex provisions of U.S. federal income tax law for which no clear precedent or authority may be available. Unitholders should be aware that the U.S. federal income tax rules, particularly those applicable to partnerships, are constantly under review by the Congressional tax-writing committees and other persons involved in the legislative process, the IRS, the Treasury Department and the courts, frequently resulting in changes which could adversely affect the value of our units or cause our company to change the way it conducts its activities. For example, changes to the U.S. federal tax laws and interpretations thereof could make it more difficult or impossible for our company to be treated as a partnership that is not taxable as a corporation for U.S. federal income tax purposes, change the character or treatment of portions of our company's income, reduce the net amount of distributions available to our unitholders or otherwise affect the tax considerations of owning our units. In addition, our company's organizational documents and agreements permit the BBU General Partner to modify our limited partnership agreement, without the consent of our unitholders, to address such changes. These modifications could have a material adverse impact on our unitholders. See Item 10.E., "Taxation—Certain Material U.S. Federal Income Tax Considerations—Administrative Matters—New Legislation or Administrative or Judicial Action".
Our company's delivery of required tax information for a taxable year may be subject to delay, which could require a unitholder who is a U.S. taxpayer to request an extension of the due date for such unitholder's income tax return.
Our company has agreed to use commercially reasonable efforts to provide U.S. tax information (including IRS Schedule K-1 information needed to determine a unitholder's allocable share of our company's income, gain, losses and deductions) no later than 90 days after the close of each calendar year. However, providing this U.S. tax information to our unitholders will be subject to delay in the event of, among other reasons, the late receipt of any necessary tax information from lower-tier entities. It is therefore possible that, in any taxable year, a unitholder will need to apply for an extension of time to file such unitholder's tax returns. In addition, unitholders that do not ordinarily have U.S. federal tax filing requirements will not receive a Schedule K-1 and related information unless such unitholders request it within 60 days after the close of each calendar year. See Item 10.E., "Taxation—Certain Material U.S. Federal Income Tax Considerations—Administrative Matters—Information Returns and Audit Procedures".
If the IRS makes an audit adjustment to our income tax returns, it may assess and collect any taxes (including penalties and interest) resulting from such audit adjustment directly from us, which could adversely affect our unitholders.
Under the Bipartisan Budget Act of 2015, for taxable years beginning after December 31, 2017, if the IRS makes an audit adjustment to our income tax returns, it may assess and collect any taxes (including penalties and interest) resulting from such audit adjustment directly from our company instead of unitholders (as under prior law). We may be permitted to elect to have the BBU General Partner and our unitholders take such audit adjustment into account in accordance with their interests in us during the taxable year under audit. However, there can be no assurance that we will choose to make such election or that it will be available in all circumstances. If we do not make the election, we may be required pay taxes, penalties or interest as a result of an audit adjustment. As a result, our current unitholders might bear some or all of the cost of the tax liability resulting from such audit adjustment, even if our current unitholders did not own our units during the taxable year under audit. The foregoing considerations also apply with respect to our company's interest in the Holding LP.
Under the Foreign Account Tax Compliance provisions of the Hiring Incentives to Restore Employment Act of 2010, or FATCA, certain payments made or received by our company may be subject to a 30% federal withholding tax, unless certain requirements are met.
Under FATCA, a 30% withholding tax may apply to certain payments of U.S.-source income made to our company, the Holding LP, the Holding Entities or the operating businesses, or by our company to a unitholder, unless certain requirements are met, as described in greater detail in Item 10.E., "Taxation—Certain Material U.S. Federal Income Tax Considerations—Administrative Matters—Foreign Account Tax Compliance". The 30% withholding tax may also apply to certain payments made on or after January 1, 2019 that are attributable to U.S.-source income or that constitute gross proceeds from the disposition of property that could produce U.S.-source dividends or interest. To ensure compliance with FATCA, information regarding certain unitholders' ownership of our units may be reported to the IRS or to a non-U.S. governmental authority. Unitholders should consult their own tax advisers regarding the consequences under FATCA of an investment in our units.
|
33
|
Brookfield Business Partners
|
The effect of comprehensive U.S. tax reform legislation on our company and unitholders, whether adverse or favorable, is uncertain.
On December 22, 2017, the U.S. president signed into law H.R. 1, “An Act to provide for reconciliation pursuant to titles II and V of the concurrent resolution on the budget for fiscal year 2018”, or, informally, the Tax Cuts and Jobs Act. Among a number of significant changes to the U.S. federal income tax laws, the Tax Cuts and Jobs Act reduces the marginal U.S. corporate income tax rate from 35% to 21%, limits the deduction for net interest expense, shifts the United States toward a modified territorial tax system, and imposes new taxes to combat erosion of the U.S. federal income tax base. The effect of the Tax Cuts and Jobs Act on our company, the Holding LP, the Holding Entities, the operating businesses, and unitholders, whether adverse or favorable, is uncertain, and may not become evident for some period of time. Unitholders are urged to consult their own tax advisers regarding the implications of the Tax Cuts and Jobs Act for an investment in our units.
Canada
If the subsidiaries that are corporations (the "Non-Resident Subsidiaries") and that are not resident or deemed to be resident in Canada for purposes of the Income Tax Act (Canada) (together with the regulations thereunder, the "Tax Act") and that are "controlled foreign affiliates" (as defined in the Tax Act and referred to herein as "CFAs") in which the Holding LP directly holds an equity interest earn income that is "foreign accrual property income" (as defined in the Tax Act and referred to herein as "FAPI"), our unitholders may be required to include amounts allocated from our company in computing their income for Canadian federal income tax purposes even though there may be no corresponding cash distribution.
Certain of the Non-Resident Subsidiaries in which the Holding LP directly holds an equity interest are expected to be CFAs of the Holding LP. If any CFA of the Holding LP or any direct or indirect subsidiary thereof that is itself a CFA of the Holding LP (an "
Indirect CFA
"), earns income that is characterized as FAPI in a particular taxation year of the CFA or Indirect CFA, the FAPI allocable to the Holding LP must be included in computing the income of the Holding LP for Canadian federal income tax purposes for the fiscal period of the Holding LP in which the taxation year of that CFA or Indirect CFA ends, whether or not the Holding LP actually receives a distribution of that FAPI. Our company will include its share of such FAPI of the Holding LP in computing its income for Canadian federal income tax purposes and our unitholders will be required to include their proportionate share of such FAPI allocated from our company in computing their income for Canadian federal income tax purposes. As a result, our unitholders may be required to include amounts in their income for Canadian federal income tax purposes even though they have not and may not receive an actual cash distribution of such amounts. The Tax Act contains anti-avoidance rules to address certain foreign tax credit generator transactions (the "
Foreign Tax Credit Generator Rules
"). Under the Foreign Tax Credit Generator Rules, the "foreign accrual tax", as defined in the Tax Act, applicable to a particular amount of FAPI included in the Holding LP's income in respect of a particular "foreign affiliate", as defined in the Tax Act, of the Holding LP may be limited in certain specified circumstances. See Item 10.E., "Taxation—Certain Material Canadian Federal Income Tax Considerations".
The Canadian federal income tax consequences to our unitholders could be materially different in certain respects from those described in this Form 20-F if our company or the Holding LP is a "SIFT partnership" as defined in the Tax Act.
Under the rules in the Tax Act applicable to a "SIFT partnership" (the "
SIFT Rules
"), certain income and gains earned by a "SIFT partnership" will be subject to income tax at the partnership level at a rate similar to a corporation, and allocations of such income and gains to its partners will be taxed as a dividend from a "taxable Canadian corporation" as defined in the Tax Act. In particular, a "SIFT partnership" will be required to pay a tax on the total of its income from businesses carried on in Canada, income from "non-portfolio properties" as defined in the Tax Act other than taxable dividends, and taxable capital gains from dispositions of "non-portfolio properties". "Non-portfolio properties" include, among other things, equity interests or debt of corporations, trusts or partnerships that are resident in Canada, and of non-resident persons or partnerships the principal source of income of which is one or any combination of sources in Canada (other than a "portfolio investment entity" as defined in the Tax Act), that are held by the "SIFT partnership" and have a fair market value that is greater than 10% of the equity value of such entity, or that have, together with debt or equity that the "SIFT partnership" holds of entities affiliated (within the meaning of the Tax Act) with such entity, an aggregate fair market value that is greater than 50% of the equity value of the "SIFT partnership". The tax rate that is applied to the above mentioned sources of income and gains is set at a rate equal to the "net corporate income tax rate", plus the "provincial SIFT tax rate", each as defined in the Tax Act.
A partnership will be a "SIFT partnership" throughout a taxation year if at any time in the taxation year (i) it is a "Canadian resident partnership" as defined in the Tax Act, (ii) "investments", as defined in the Tax Act, in the partnership are listed or traded on a stock exchange or other public market and (iii) it holds one or more "non-portfolio properties". For these purposes, a partnership will be a "Canadian resident partnership" at a particular time if (a) it is a "Canadian partnership" as defined in the Tax Act at that time, (b) it would, if it were a corporation, be resident in Canada (including, for greater certainty, a partnership that has its central management and control located in Canada) or (c) it was formed under the laws of a province. A "Canadian partnership" for these purposes is a partnership all of whose members are resident in Canada or are partnerships that are "Canadian partnerships".
|
Brookfield Business Partners
|
34
|
Under the SIFT Rules, our company and the Holding LP could each be a "SIFT partnership" if it is a "Canadian resident partnership". However, the Holding LP would not be a "SIFT partnership" if our company is a "SIFT partnership" regardless of whether the Holding LP is a "Canadian resident partnership" on the basis that the Holding LP would be an "excluded subsidiary entity" as defined in the Tax Act. Our company and the Holding LP will be a "Canadian resident partnership" if the central management and control of these partnerships is located in Canada. This determination is a question of fact and is expected to depend on where the BBU General Partner is located and exercises central management and control of the respective partnerships. Based on the place of its incorporation, governance and activities, the BBU General Partner does not expect that its central management and control will be located in Canada such that the SIFT Rules should not apply to our company or to the Holding LP at any relevant time. However, no assurance can be given in this regard. If our company or the Holding LP is a "SIFT partnership", the Canadian federal income tax consequences to our unitholders could be materially different in certain respects from those described in Item 10.E., "Taxation—Certain Material Canadian Federal Income Tax Considerations". In addition, there can be no assurance that the SIFT Rules will not be revised or amended in the future such that the SIFT Rules will apply.
Unitholders may be required to include imputed amounts in their income for Canadian federal income tax purposes in accordance with section 94.1 of the Tax Act.
Section 94.1 of the Tax Act contains rules relating to interests in entities that are not resident or deemed to be resident in Canada for purposes of the Tax Act or not situated in Canada, other than a CFA of the taxpayer (the "
Non-Resident Entities
"), that could in certain circumstances cause income to be imputed to unitholders for Canadian federal income tax purposes, either directly or by way of allocation of such income imputed to our company or to the Holding LP. See Item 10.E., "Taxation—Certain Material Canadian Federal Income Tax Considerations."
Our units may or may not continue to be "qualified investments" under the Tax Act for registered plans.
Provided that our units are listed on a "designated stock exchange" as defined in the Tax Act (which currently includes the NYSE and the TSX), our units will be "qualified investments" under the Tax Act for a trust governed by a registered retirement savings plan ("
RRSP
"), deferred profit sharing plan, registered retirement income fund ("
RRIF
"), registered education savings plan ("
RESP
"), registered disability savings plan ("
RDSP
") and a tax-free savings account ("
TFSA
"), each as defined in the Tax Act. However, there can be no assurance that our units will continue to be listed on a "designated stock exchange". There can also be no assurance that tax laws relating to "qualified investments" will not be changed. Taxes may be imposed in respect of the acquisition or holding of non-qualified investments by such registered plans and certain other taxpayers and with respect to the acquisition or holding of "prohibited investments" as defined in the Tax Act by an RRSP, RRIF, TFSA, RDSP or RESP.
Generally, our units will not be a "prohibited investment" for a trust governed by an RRSP, RRIF, TFSA, RDSP or RESP, provided that the annuitant under the RRSP or RRIF, the holder of the TFSA or RDSP or the subscriber of the RESP, as the case may be, deals at arm's length with our company for purposes of the Tax Act and does not have a "significant interest", as defined in the Tax Act for purposes of the prohibited investment rules, in our company. Unitholders who hold our units in an RRSP, RRIF, TFSA, RDSP or RESP should consult with their own tax advisors regarding the application of the foregoing prohibited investment rules having regard to their particular circumstances.
Unitholders' foreign tax credits for Canadian federal income tax purposes will be limited if the Foreign Tax Credit Generator Rules apply in respect of the foreign "business-income tax" or "non-business-income tax", each as defined in the Tax Act, paid by our company or the Holding LP to a foreign country.
Under the Foreign Tax Credit Generator Rules, the foreign "business-income tax" or "non-business-income tax" for Canadian federal income tax purposes for any taxation year may be limited in certain circumstances. If the Foreign Tax Credit Generator Rules apply, the allocation to a unitholder of foreign "business-income tax" or "non-business-income tax" paid by our company or the Holding LP, and therefore, such unitholder's foreign tax credits for Canadian federal income tax purposes, will be limited. See Item 10.E., "Taxation—Certain Material Canadian Federal Income Tax Considerations".
Unitholders who are not and are not deemed to be resident in Canada for purposes of the Tax Act and who do not use or hold, and are not deemed to use or hold, their units of our company in connection with a business carried on in Canada ("Non-Canadian Limited Partners"), may be subject to Canadian federal income tax with respect to any Canadian source business income earned by our company or the Holding LP if our company or the Holding LP were considered to carry on business in Canada.
If our company or the Holding LP were considered to carry on business in Canada for purposes of the Tax Act, Non-Canadian Limited Partners would be subject to Canadian federal income tax on their proportionate share of any Canadian source business income earned or considered to be earned by our company, subject to the potential application of the safe harbour rule in section 115.2 of the Tax Act and any relief that may be provided by any relevant income tax treaty or convention.
|
35
|
Brookfield Business Partners
|
The BBU General Partner intends to manage the affairs of our company and the Holding LP, to the extent possible, so that they do not carry on business in Canada and are not considered or deemed to carry on business in Canada for purposes of the Tax Act. Nevertheless, because the determination of whether our company or the Holding LP is carrying on business and, if so, whether that business is carried on in Canada, is a question of fact that is dependent upon the surrounding circumstances, the CRA might contend successfully that either or both of our company and the Holding LP carries on business in Canada for purposes of the Tax Act.
If our company or the Holding LP is considered to carry on business in Canada or is deemed to carry on business in Canada for the purposes of the Tax Act, Non-Canadian Limited Partners that are corporations would be required to file a Canadian federal income tax return for each taxation year in which they are a Non-Canadian Limited Partner regardless of whether relief from Canadian taxation is available under an applicable income tax treaty or convention. Non-Canadian Limited Partners who are individuals would only be required to file a Canadian federal income tax return for any taxation year in which they are allocated income from our company from carrying on business in Canada that is not exempt from Canadian taxation under the terms of an applicable income tax treaty or convention.
Non-Canadian Limited Partners may be subject to Canadian federal income tax on capital gains realized by our company or the Holding LP on dispositions of "taxable Canadian property" as defined in the Tax Act.
A Non-Canadian Limited Partner will be subject to Canadian federal income tax on its proportionate share of capital gains realized by our company or the Holding LP on the disposition of "taxable Canadian property" other than "treaty protected property" as defined in the Tax Act. "Taxable Canadian property" includes, but is not limited to, property that is used or held in a business carried on in Canada and shares of corporations that are not listed on a "designated stock exchange" if more than 50% of the fair market value of the shares is derived from certain Canadian properties during the 60-month period immediately preceding the particular time. Property of our company and the Holding LP generally will be "treaty-protected property" to a Non-Canadian Limited Partner if the gain from the disposition of the property would, because of an applicable income tax treaty or convention, be exempt from tax under the Tax Act. The BBU General Partner does not expect our company and the Holding LP to realize capital gains or losses from dispositions of "taxable Canadian property". However, no assurance can be given in this regard. Non-Canadian Limited Partners will be required to file a Canadian federal income tax return in respect of a disposition of "taxable Canadian property" by our company or the Holding LP unless the disposition is an "excluded disposition" for the purposes of section 150 of the Tax Act. However, Non-Canadian Limited Partners that are corporations will still be required to file a Canadian federal income tax return in respect of a disposition of "taxable Canadian property" that is an "excluded disposition" for the purposes of section 150 of the Tax Act if tax would otherwise be payable under Part I of the Tax Act by such Non-Canadian Limited Partners in respect of the disposition but is not because of an applicable income tax treaty or convention (otherwise than in respect of a disposition of "taxable Canadian property" that is "treaty-protected property" of the corporation). In general, an "excluded disposition" is a disposition of property by a taxpayer in a taxation year where: (a) the taxpayer is a non-resident of Canada at the time of the disposition; (b) no tax is payable by the taxpayer under Part I of the Tax Act for the taxation year; (c) the taxpayer is not liable to pay any amounts under the Tax Act in respect of any previous taxation year (other than certain amounts for which the CRA holds adequate security); and (d) each "taxable Canadian property" disposed of by the taxpayer in the taxation year is either: (i) "excluded property" as defined in subsection 116(6) of the Tax Act; or (ii) property in respect of the disposition of which a certificate under subsection 116(2), (4) or (5.2) of the Tax Act has been issued by the CRA. Non-Canadian Limited Partners should consult their own tax advisors with respect to the requirements to file a Canadian federal income tax return in respect of a disposition of "taxable Canadian property" by our company or the Holding LP.
|
Brookfield Business Partners
|
36
|
Non-Canadian Limited Partners may be subject to Canadian federal income tax on capital gains realized on the disposition of our units if our units are "taxable Canadian property".
Any capital gain arising from the disposition or deemed disposition of our units by a Non-Canadian Limited Partner will be subject to taxation in Canada, if, at the time of the disposition or deemed disposition, our units are "taxable Canadian property" of the Non-Canadian Limited Partner, unless our units are "treaty-protected property" to such Non-Canadian Limited Partner. In general, our units will not constitute "taxable Canadian property" of any Non-Canadian Limited Partner at the time of disposition or deemed disposition, unless (a) at any time in the 60-month period immediately preceding the disposition or deemed disposition, more than 50% of the fair market value of our units was derived, directly or indirectly (excluding through a corporation, partnership or trust, the shares or interests in which were not themselves "taxable Canadian property"), from one or any combination of: (i) real or immovable property situated in Canada; (ii) "Canadian resource properties" as defined in the Tax Act; (iii) "timber resource properties" as defined in the Tax Act; and (iv) options in respect of, or interests in, or for civil law rights in, such property, whether or not such property exists, or (b) our units are otherwise deemed to be "taxable Canadian property". Since our company's assets will consist principally of units of the Holding LP, our units would generally be "taxable Canadian property" at a particular time if the units of the Holding LP held by our company derived, directly or indirectly (excluding through a corporation, partnership or trust, the shares or interests in which were not themselves "taxable Canadian property"), more than 50% of their fair market value from properties described in (i) to (iv) above, at any time in the 60-month period preceding the particular time. The BBU General Partner does not expect our units to be "taxable Canadian property" of any Non-Canadian Limited Partner at any time but no assurance can be given in this regard. See Item 10.E., "Taxation—Certain Material Canadian Federal Income Tax Considerations". Even if our units constitute "taxable Canadian property", units of our company will be "treaty protected property" if the gain on the disposition of our units is exempt from tax under the Tax Act under the terms of an applicable income tax treaty or convention. If our units constitute "taxable Canadian property", Non-Canadian Limited Partners will be required to file a Canadian federal income tax return in respect of a disposition of our units unless the disposition is an "excluded disposition" (as discussed above). If our units constitute "taxable Canadian property", Non-Canadian Limited Partners should consult their own tax advisors with respect to the requirement to file a Canadian federal income tax return in respect of a disposition of our units.
Non-Canadian Limited Partners may be subject to Canadian federal income tax reporting and withholding tax requirements on the disposition of "taxable Canadian property".
Non-Canadian Limited Partners who dispose of "taxable Canadian property", other than "excluded property" and certain other property described in subsection 116(5.2) of the Tax Act, (or who are considered to have disposed of such property on the disposition of such property by our company or the Holding LP), are obligated to comply with the procedures set out in section 116 of the Tax Act and obtain a certificate pursuant to the Tax Act. In order to obtain such certificate, the Non-Canadian Limited Partner is required to report certain particulars relating to the transaction to CRA not later than 10 days after the disposition occurs. The BBU General Partner does not expect our units to be "taxable Canadian property" of any Non-Canadian Limited Partner and does not expect our company or the Holding LP to dispose of property that is "taxable Canadian property" but no assurance can be given in these regards.
|
37
|
Brookfield Business Partners
|
Payments of dividends or interest (other than interest not subject to Canadian federal withholding tax) by residents of Canada to the Holding LP will be subject to Canadian federal withholding tax and we may be unable to apply a reduced rate taking into account the residency or entitlement to relief under an applicable income tax treaty or convention of our unitholders.
Our company and the Holding LP will each be deemed to be a non-resident person in respect of certain amounts paid or credited or deemed to be paid or credited to them by a person resident or deemed to be resident in Canada, including dividends or interest. Dividends or interest (other than interest not subject to Canadian federal withholding tax) paid or deemed to be paid by a person resident or deemed to be resident in Canada to the Holding LP will be subject to withholding tax under Part XIII of the Tax Act at the rate of 25%. However, the CRA's administrative practice in similar circumstances is to permit the rate of Canadian federal withholding tax applicable to such payments to be computed by looking through the partnership and taking into account the residency of the partners (including partners who are resident in Canada) and any reduced rates of Canadian federal withholding tax that any non-resident partners may be entitled to under an applicable income tax treaty or convention, provided that the residency status and entitlement to treaty benefits can be established. In determining the rate of Canadian federal withholding tax applicable to amounts paid by the Holding Entities to the Holding LP, the BBU General Partner expects the Holding Entities to look-through the Holding LP and our company to the residency of the partners of our company (including partners who are resident in Canada) and to take into account any reduced rates of Canadian federal withholding tax that non-resident partners may be entitled to under an applicable income tax treaty or convention in order to determine the appropriate amount of Canadian federal withholding tax to withhold from dividends or interest paid to the Holding LP. However, there can be no assurance that the CRA will apply its administrative practice in this context. If the CRA's administrative practice is not applied and the Holding Entities withhold Canadian federal withholding tax from applicable payments on a look-through basis, the Holding Entities may be liable for additional amounts of Canadian federal withholding tax plus any associated interest and penalties. Under the
Canada—United States Tax Convention (1980)
(the "
Treaty
"), a Canadian resident payer is required in certain circumstances to look-through fiscally transparent partnerships, such as our company and the Holding LP, to the residency and Treaty entitlements of their partners and take into account the reduced rates of Canadian federal withholding tax that such partners may be entitled to under the Treaty.
While the BBU General Partner expects the Holding Entities to look-through our company and the Holding LP in determining the rate of Canadian federal withholding tax applicable to amounts paid or deemed to be paid by the Holding Entities to the Holding LP, we may be unable to accurately or timely determine the residency of our unitholders for purposes of establishing the extent to which Canadian federal withholding taxes apply or whether reduced rates of withholding tax apply to some or all of our unitholders. In such a case, the Holding Entities will withhold Canadian federal withholding tax from all payments made to the Holding LP that are subject to Canadian federal withholding tax at the rate of 25%. Canadian resident unitholders will be entitled to claim a credit for such taxes against their Canadian federal income tax liability but Non-Canadian Limited Partners will need to take certain steps to receive a refund or credit in respect of any such Canadian federal withholding taxes withheld equal to the difference between the withholding tax at a rate of 25% and the withholding tax at the reduced rate they are entitled to under an applicable income tax treaty or convention. See Item 10.E., "Taxation—Certain Material Canadian Federal Income Tax Considerations" for further detail. Unitholders should consult their own tax advisors concerning all aspects of Canadian federal withholding taxes.
|
Brookfield Business Partners
|
38
|
4.A. HISTORY AND DEVELOPMENT OF OUR COMPANY
Our company was established on January 18, 2016 as a Bermuda exempted limited partnership registered under the Bermuda Limited Partnership Act 1883, as amended, and the Bermuda Exempted Partnerships Act 1992, as amended. Our head and registered office is 73 Front Street, 5th Floor, Hamilton HM 12, Bermuda, and our telephone number is +441 294 3309. Our units are listed on the NYSE and the TSX under the symbols "BBU" and "BBU.UN", respectively.
We were established by Brookfield Asset Management as its primary vehicle to own and operate business services and industrial operations on a global basis. On June 20, 2016, Brookfield Asset Management completed the spin-off of its business services and industrial operations to our company, which was effected by way of a special dividend of units of our company to holders of Brookfield Asset Management's Class A and B limited voting shares. Each holder of the shares received one unit for every 50 shares, representing approximately 45% of our units, with Brookfield retaining the remaining units. Prior to the spin-off, Brookfield effected a reorganization so that our then-current operations are held by the Holding Entities, the common shares of which are wholly-owned by Holding LP. In consideration, Brookfield received a combination of our units, general partnership units, redemption-exchange units of the Holding LP and Special LP Units. Brookfield currently owns 68% of our company on a fully exchanged basis. BBU General Partner, our general partner, is an indirect wholly-owned subsidiary of Brookfield Asset Management. In addition, wholly-owned subsidiaries of Brookfield Asset Management provide management services to us pursuant to our Master Services Agreement.
Recent Business Developments
The following table outlines significant transactions and events that transpired in our business during the year:
|
Date
|
Segment
|
Event
|
||
|
January 2017
|
Industrial Operations
|
On January 20, 2017, we sold our bath and shower products manufacturing business. We acquired this business at the beginning of the U.S. housing crisis which had severely reduced the business' revenue. We were able to reposition the business by appointing a new management team, redefining strategy, reducing costs, and focusing on new product development. In 2016, the business generated strong sales and ran a lean operation, making it an opportune time for us to monetize the business and recycle capital. Based on our approximate 40% interest in the business, our share of the proceeds after transaction and other costs was $141 million, with an accounting gain of approximately $84 million, net of taxes.
|
||
|
April 2017
|
Industrial Operations
|
On April 25, 2017, together with institutional partners, we invested approximately $1 billion to acquire a 70% controlling stake in the core water, wastewater and industrial water treatment business of Odebrecht Ambiental. A future payment to the seller of up to R$350 million may be made should the business achieve certain performance milestones in the three years after acquisition. On May 30, 2017, we purchased an 87.5% direct interest in Odebrecht Ambiental Ativos Maduros S.A., a BRK Ambiental joint venture in related assets for $116 million, with the partnership's share being $43 million. The businesses were subsequently renamed to “BRK Ambiental”. Our share of the equity commitment was $383 million, representing an economic ownership in the company of approximately 26%.
|
||
|
May 2017
|
Business Services
|
On May 10, 2017, together with institutional partners, we acquired an 85% controlling stake in Greenergy Fuels Holdings Limited (“Greenergy”), with the remaining 15% held by the company’s management team. Our share of the equity commitment was approximately £36 million (approximately $45 million), representing an economic ownership in the company of approximately 14%.
|
||
|
July 2017
|
Business Services
|
On July 17, 2017, together with institutional partners, we completed the acquisition of 213 retail gas stations and associated kiosks in Canada through BCP IV Service Station LP ("fuel marketing business") for approximately $423 million which was funded with debt and equity. The share of the equity investment attributable to unitholders was approximately $43 million for an approximate 26% ownership interest in the business.
|
||
|
39
|
Brookfield Business Partners
|
|
August 2017
|
Energy
|
On August 15, 2017, we sold an oil and gas producer ("Insignia Energy") in Western Canada. We first invested in this business in 2008 and throughout the years, the business had assembled a high-quality portfolio of natural gas resource properties, which represented a strong asset base and a significant drilling inventory in Western Canada. However, the business had been impacted by substantially lower commodity prices, instead of investing additional capital to maintain production, we decided to divest this business. Based on our approximate 38% ownership interest in the business, our share of the proceeds after transaction and other costs was $9 million, resulting in a net loss of approximately $16 million, net of taxes.
|
||
|
September 2017
|
Energy
|
On September 25, 2017, together with institutional partners, we acquired a 60% stake in Teekay Offshore ("marine energy services business"). The share of the equity investment attributable to unitholders was $317 million and included an approximate 25% ownership interest in the business, participation in a loan payable by Teekay Offshore, warrants issued by Teekay Offshore, and an ownership share of Teekay Offshore's General Partner.
|
||
|
September 2017
|
Corporate and Other
|
On September 26, 2017, the partnership issued 13,340,000 limited partnership units at a price of $30 per unit, for gross proceeds of approximately $400 million before equity issuance costs of approximately $8 million. Concurrently, Holding LP issued 6,945,000 million redemption-exchange units to Brookfield at $28.80 per unit for additional proceeds of approximately $200 million. The unit offering resulted in a decrease in Brookfield's ownership in the partnership from 75% to 69%.
|
||
|
October 2017
|
Business Services
|
On October 2, 2017, together with institutional partners, we provided a $123 million first lien secured loan to Total Environment Group. Our share of the investment was approximately $32 million.
|
||
|
October 2017
|
Corporate and Other
|
On October 26, 2017, the underwriters exercised their over-allotment option to purchase an additional 1,000,500 units at a price of $30.00 per unit, for gross proceeds of approximately $30 million less equity issuance costs of approximately $1 million. The exercise of over-allotment resulted in a decrease in Brookfield's ownership in the partnership from 69% to 68%.
|
||
|
January 2018
|
Business Services
|
On January 4, 2018, together with institutional partners, we entered into a definitive agreement to acquire 100% of Westinghouse Electric Company (“Westinghouse”) for an initial purchase price of approximately $4.6 billion, expected to be funded with approximately $1 billion of equity, approximately $3 billion of long-term debt financing and the balance by the assumption of certain pension, environmental and other operating obligations. Closing of the transaction remains subject to bankruptcy court approval and customary closing conditions is expected to occur in the third quarter of 2018. Prior to or following closing, a portion of our investment may be syndicated to other institutional investors.
|
||
|
January 2018
|
Industrial Operations
|
On January 5, 2018, together with institutional partners, we reached a definitive agreement to acquire a controlling interest in the Schoeller Allibert Group B.V. (“Schoeller Allibert”) for a purchase price of approximately €205 million. The founding Schoeller family will continue to hold the remaining interest in Schoeller Allibert. Closing of the transaction remains subject to customary closing conditions and is anticipated to be in the second quarter of 2018. Prior to or following closing, a portion of our investment may be syndicated to other institutional investors.
|
||
|
January 2018
|
Business Services
|
On January 23, 2018, together with institutional partners, we closed our transaction with Ontario Lottery and Gaming Corporation, in partnership with our gaming partner, to operate and manage three gaming facilities in the Greater Toronto Area (the "GTA Bundle") for a minimum period of 22 years. Our partnership has the option to develop a new site and extend the concession period by 10 years. Our share of the equity investment attributable to unitholders was approximately C$22 million for an approximate 13% ownership interest in the business.
|
||
|
February 2018
|
Industrial Operations
|
On February 15, 2018, our graphite electrode manufacturing business completed a $1.5 billion debt offering and used approximately $400 million of the proceeds to pay down existing debt and distributed the balance of approximately $1.1 billion to its shareholders. Our share of the distribution was approximately $380 million. Recently, there have been significant developments at the business which positioned the business for materially improved financial and operational results. We executed on our operational improvement strategy realizing annualized savings and completed a long-term contracting initiative, executing 3 to 5 year take or pay contracts, for between 60% to 65% of our production capacity, at a weighted average selling price of $9,700/MT.
|
||
|
Brookfield Business Partners
|
40
|
Consistent with our company's strategy and in the normal course of business, we are engaged in discussions, and have in place various binding and/or non-binding agreements, with respect to possible business acquisitions and dispositions. However, there can be no assurance that these discussions or agreements will result in a transaction or, if they do, what the final terms or timing of such transactions would be. Our company expects to continue current discussions and actively pursue these and other acquisitions and disposition opportunities.
Since the spin-off, we have made approximately $309 million of capital expenditures, primarily in our industrial operations and energy segments
.
We are pursuing additional projects consistent with our strategy, as described in Item 4.B., "Business Overview". For a description of our principal capital expenditures in the last three fiscal years by segment, see Item 5.A, ‘‘Operating Results’’.
4.B. BUSINESS OVERVIEW
Overview
We are a business services and industrials company, focused on owning and operating high-quality businesses that are either low-cost producers and/or benefit from high barriers to entry. We are Brookfield's primary vehicle for business services and industrial operations. Our principal business services include construction services, residential real estate services, facilities management, and road fuel distribution and marketing. Our principal industrial operations are comprised of oil and gas exploration and production, marine energy services, palladium and aggregates mining, the production of graphite electrodes, the manufacturing and supply of engineered precast systems and pipe products, and the distribution, collection, and treatment of water. Prior to the spin-off, we acquired from Brookfield our initial operations, which we refer to as the Business.
The charts below provide a breakdown of total assets of
$15.8 billion
as at
December 31, 2017
and revenue of
$22.8 billion
for the year ended
December 31, 2017
by operating segment and region.

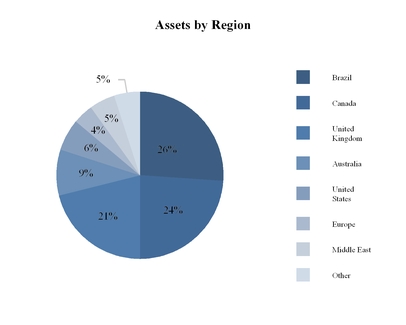
|
41
|
Brookfield Business Partners
|

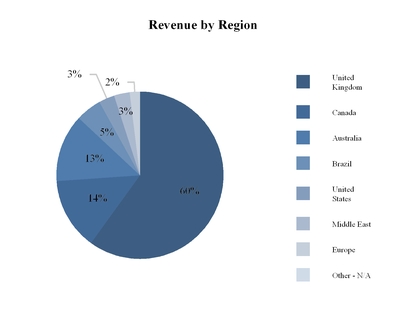
We seek to build value through enhancing the cash flows of our businesses, pursuing an operations-oriented acquisition strategy and opportunistically recycling capital generated from operations and dispositions into our existing platforms, new acquisitions and investments. We look to ensure that each of our businesses has a clear, concise business strategy built on its competitive advantages, while focusing on profitability, sustainable operating, product margins and cash flows. We emphasize downside protection by utilizing business plans that do not rely exclusively on top-line growth or excessive leverage.
We plan to grow by acquiring positions of control or significant influence in businesses at attractive valuations and by enhancing earnings of the businesses we operate. In addition to pursuing accretive acquisitions within our current platforms, we will opportunistically pursue transactions to build new platforms or make investments where our expertise, or the broader Brookfield platforms, provide insight into global demand for goods and commodities to source acquisitions that are not available or obvious to competitors. We may partner with others, primarily institutional capital, to make acquisitions that we may not otherwise be able to make on our own. Accordingly, an integral part of our strategy is to participate with institutional investors in Brookfield-sponsored or co-sponsored consortiums for single asset acquisitions and as a partner in or alongside Brookfield-sponsored or co-sponsored partnerships that target acquisitions that suit our profile. Brookfield has a strong track record of leading such consortiums and partnerships and actively managing underlying assets to improve performance. Brookfield has agreed that it will not sponsor such arrangements that are suitable for us in the business services and industrial operations sectors unless we are given an opportunity to participate. See Item 7.B. "Related Party Transactions—Relationship Agreement".
Business Services
Our business services principally provide services relating to facilities management, road fuel distribution and marketing, residential real estate, logistics, and financial advisory, where the broader Brookfield platform provides a competitive advantage. Our focus is on building high-quality platforms benefiting from barriers to entry through scale and predictable, recurring cash flows and where quality of service and/or a global footprint are competitive differentiators. In keeping with our overall strategy, we seek to pursue accretive acquisitions to grow our existing platforms and create new ones and to opportunistically make investments where our operating footprint provides us with an advantage in doing so.
Our business services are typically defined by medium to long-term contracts, which include the services to be performed and the margin to be earned to perform such services. While we still retain overall timing, volume of services and performance risks, there is limited risk to the actual margin earned to provide the services. The result is stable long-term margins which allow management to focus on the successful performance of services and generating new business. Our business services activities are seasonal in nature and affected by the general level of economic activity and related volume of services purchased by our clients.
Many of our clients consist of corporations and government agencies. These customers are often large credit-worthy counterparties thereby reducing risks to cash flow streams. The goodwill that we have created with our customers gives us the ability to generate future business through the cross-selling of other services, particularly in connection with global clients, where consistency of performance on a global basis is important.
|
Brookfield Business Partners
|
42
|
The charts below provide a breakdown of revenues for our business services segment by region and business unit for the year ended
December 31, 2017
.


The table below provides a breakdown of revenues for our business services segment by region:
|
|
Year Ended December 31,
|
|||||||||||
|
(US$ Millions)
|
2017
|
2016
|
2015
|
|||||||||
|
United Kingdom
|
$
|
12,125
|
|
$
|
44
|
|
$
|
58
|
|
|||
|
Canada
|
2,453
|
|
1,102
|
|
1,102
|
|
763
|
|
||||
|
Brazil
|
672
|
|
1
|
|
2
|
|
||||||
|
United States
|
451
|
|
500
|
|
586
|
|
||||||
|
Australia
|
376
|
|
340
|
|
274
|
|
||||||
|
Other
|
147
|
|
19
|
|
8
|
|
||||||
|
Total
|
$
|
16,224
|
|
$
|
2,006
|
|
$
|
1,691
|
|
|||
Facilities Management
Our integrated facilities management ("IFM") business manages over 30,000 locations and over 300 million square feet across North America, Australia, New Zealand and Asia with a goal of delivering services that drive sustainable cost reductions for our clients.
Our facilities management business provides design and project management, professional services and strategic workplace consulting to customers from sectors that range from government, military, financial institutions, utilities, industrial and corporate offices. Our contract expirations range from month-to-month to 25 years. We seek to provide a cost effective outsourcing alternative for IFM services to our customers by leveraging our scale, expertise and self-perform capabilities. We believe that we are differentiated from our competitors as a result of 20 years of developed best practices in our core competency of being a "hard facilities management" provider via our mobile fleet of technicians and in-house expertise and our integrated technology platform that allows customers to obtain real time insight into all aspects of their facilities. Our IFM business benefits from high retention rates, which we believe demonstrates our ability to add value to our customers.
These businesses have largely been built on an "outsourcing" model—providing services that are often deemed non-core to the operations of our customers' business. We believe that there is a growing trend where organizations are increasingly looking to outsource their real estate facilities management services, which therefore provides several opportunities for new business and expansion.
|
43
|
Brookfield Business Partners
|
Road
Fuel Distribution and Marketing
We are a provider of road fuel distribution in the U.K. with significant import and storage infrastructure, an extensive distribution network, and long-term diversified customer relationships. Included in the revenue and direct operating costs for this business is a duty payable to the government of the U.K. which is recorded gross within revenues and direct costs, without impact on the margin generated by the business. In addition, our fuel marketing business has strong customer loyalty through the PC Optimum loyalty program and is one of the largest gas station networks in Canada, with 213 retail gas stations and associated convenience kiosks.
Residential Real Estate Service
We provide services to residential real estate brokers through franchise arrangements under a number of brands in Canada, including the nationally recognized brand Royal Lepage, and in the United States through a joint venture with Berkshire Hathaway, operating under the brand name Berkshire Hathaway HomeServices, which was established in 2012. We also directly operate residential brokerages in select cities in Canada and provide valuations and related analytic services to financial institutions in Canada where we process an average of 180,000 residential property appraisals per year.
We also provide condominium management services and are the largest condominium property management company in Ontario, Canada with over 80,000 units under management.
Logistics
We are a full service provider of relocation and related consulting services to individuals and institutions on a global basis. With offices in Asia, Europe, North America and South America, we have the expertise and resources to provide globally integrated, customizable services to our clients. Client contracts are typically executed for three to five year terms. We identify opportunities from different sources, including through relationships with current and former clients, subscriber services, suppliers and other partners within the industry and through internal business development. With the number of suppliers involved in an employee's relocation or assignment, effective supply chain management is crucial to the overall success of a company's mobility program. We maintain a network of independent suppliers that enables us to support our clients and their transferred employees around the world. Our dedicated supply chain management team is focused on supplier selection, training and performance and handles the screening, selection, monitoring and managing of our supplier network. A portion of our business service activity is seasonal in nature and is affected by the general level of economic activity and related volume of services purchased by our clients. For example, most moves typically occur in the spring and summer months, during school year breaks and we also experience peaks in activity from some government clients corresponding with the start of their fiscal year.
We also operate five high-quality, modern cold storage facilities in Canada with inventory management and customer service capabilities.
Financial Advisory Services
Our financial advisory services business provides merger and acquisition advisory, debt placement, project finance, asset brokerage and structured transaction services with expertise in real assets, particularly property, power and infrastructure. We operate on a global basis with an expanding network that includes offices in North America, South America, Europe, Asia and Australia.
Construction Services
Our construction services business is a global contractor with a focus on high-quality construction, primarily on large-scale, complex landmark buildings and social infrastructure. Construction projects are generally delivered through contracts whereby we take responsibility for design, program, procurement and construction for a defined price. Our business is based on a subcontractor model where we engage reputable specialists to perform specific scopes of work and whose obligations mirror those contained within the main construction contract. A smaller part of the business is construction management whereby we charge a fee for coordination of the sub-trades employed by the client. Founded in Perth, Australia in 1962, our construction services business was acquired by Brookfield as part of the privatization of Multiplex Group in 2007. Some of our landmark projects include Principal Place in London, King Street Wharf in Sydney, Fiona Stanley Hospital and Optus Stadium in Perth and City of Lights Office in Abu Dhabi. Today, we operate in Australia, Europe and the Middle East across a broad range of sectors, including: office, residential, hospitality and leisure, social infrastructure, retail and mixed use properties. We are also strategically targeting markets in Canada and India.
|
Brookfield Business Partners
|
44
|
The table below provides a breakdown of revenues for our construction services segment by region:
|
|
Year Ended December 31,
|
||||||||||
|
(US$ Millions)
|
2017
|
2016
|
2015
|
||||||||
|
Australia
|
$
|
2,508
|
|
$
|
2,150
|
|
$
|
2,011
|
|
||
|
United Kingdom
|
1,501
|
|
1,395
|
|
963
|
|
|||||
|
Middle East
|
590
|
|
732
|
|
688
|
|
|||||
|
Other
|
51
|
|
110
|
|
171
|
|
|||||
|
Total
|
$
|
4,650
|
|
$
|
4,387
|
|
$
|
3,833
|
|
||
A significant portion of our revenue is generated from large projects, the results of our construction operations can fluctuate quarterly and annually depending on whether and when large project awards occur and the commencement and progress of work under large contracts already awarded. However, we believe the financial strength and stability of our construction services business and the mature and robust risk management processes we have adopted position us to effectively service our current client base and attract new clients. Historically, approximately two thirds of our work has been competitively tendered, with the balance being staged or direct negotiations. We identify opportunities from a number of different sources: for example, through invitations to tender, direct request from clients and/or their consultants and internal business development. We review available contracts and decide which contracts to pursue based on different factors including size, duration, experience, geographic location, margins and risk associated with the contract and/or client. Generally, we are required to post between 5% and 10% of contract value as performance security under our contracts. The guarantees and bonds issued to clients are typically secured by indemnities against subcontractors. At
December 31, 2017
, our backlog of construction projects was approximately $8.7 billion, with a weighted average remaining project life of 2.0 years.
The charts below provide a breakdown of backlog for our construction services segment by sector and region as at
December 31, 2017
.

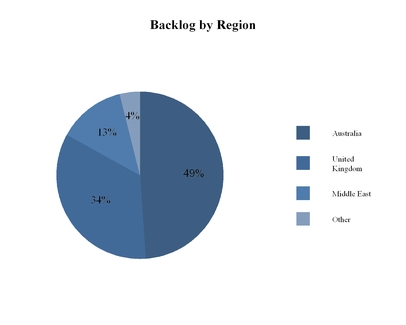
Our clients benefit from our ability to share knowledge and resources across our business, as well as Brookfield's broader platforms, applying international best-practice initiatives and our experience to their projects. In addition, we seek to execute each project using a tailored approach that also includes our commitment to safety and quality and the benefit of a deep supplier and subcontractor network. Our client base includes both private and public sector entities which, combined with our geographical spread, provides some protection against market fluctuations driven by economic cycles.
|
45
|
Brookfield Business Partners
|
Growth prospects differ from region to region. In Australia, we have strong market positions in Sydney, Melbourne and Perth but have opportunities for growth in Brisbane and in other large regional centers. In Europe, we believe our most compelling growth opportunity is to increase our market share in U.K. private sector work, primarily in the commercial and residential spaces in London, as well as future opportunities in social infrastructure. In the Middle East, we proactively reduced the scale of our operations over the past year, only contracting under strict terms and conditions for certain clients. The region is experiencing a period of economic and political adjustment, with reduced liquidity for developers and as such we have adjusted our targets and forecasts in the region.
Other markets that we have been strategically targeting are Canada and India. Our first project in Canada was in 2010 when we secured the contract to oversee the completion of a large hotel & residential tower project in downtown Toronto. Since then we have secured other projects covering the commercial, hotel and residential sectors. We are now also leveraging our global experience to assist local developers with how to best integrate construction considerations into early development plans. We have a very small presence in the Indian market, and together with a local partner, we consider opportunities to pursue high-quality, large, complex buildings projects for sophisticated private developers across India.
We believe we are well-positioned in the industry for the following principal reasons:
|
•
|
Our large and diverse global construction business.
Since 1962, our business has delivered over $70 billion
of work to date and approximately 1,000 projects across diverse sectors and geographies for a varied client base. Our projects under contract at
December 31, 2017
were valued at almost $16 billion, consisting of 95 projects. Our global platform provides us with access to leading edge construction techniques and technologies and a deep supply chain network. The size, geographical and sector spread of our global business limits our exposure to concentration risk, whether in relation to client, project, subcontractor or country risk.
|
|
•
|
Our strong market position, extensive experience and proven track record.
We have received numerous industry awards for innovative design, which demonstrates our ability to deliver leading solutions to fit our clients' needs. A strong market position in our principal regions, Australia, Europe and the Middle East, allows us to attract top talent and secure competitive pricing from our subcontractors. We have long-standing and positive relationships with many subcontractors across the regions in which we operate. This allows us to be more selective in the projects we bid and consequently increases the likelihood of tender and delivery success. We are conscious of our market share in any given region and what is sustainable given market dynamics and resource availability.
|
|
•
|
Our strong risk management culture.
We aim to outperform in all aspects of construction, including commercial and operational risk management, to deliver both a safe and rewarding project. Governance of risk commences at a very early stage and involves all levels of the business. Any commitment to bid on a project requires agreement through a formal credit committee process, and robust credit charters are in place for each region, identifying standard acceptable commercial risk profiles. As part of our disciplined approach, we maintain and document project controls across all regions, including through the use of a project communication application, review of subcontractor financial strength, appropriate subcontractor security and comprehensive insurance reviews.
|
|
•
|
Our track record is underpinned by our high level of contracted revenue.
With little or no debt in the business and with our focus on cost, schedule, safety and quality, we are able to consistently complete complex projects. Our repeated delivery of successful outcomes for clients facilitates the replacement of our projects under contract. We believe that our ability to withstand changing economic cycles is a testament to the strength and proficiency of our business and team.
|
Industrial Operations
Our industrial operations segment consists primarily of (i) specialty metal and aggregates mining operations in Canada, (ii) select industrial manufacturing operations, comprised principally of the global production of graphite electrodes and the manufacturing of infrastructure support products in Canada, and (iii) the distribution, collection, and treatment of water in Brazil.
|
Brookfield Business Partners
|
46
|
The table below provides a breakdown of revenues for our industrial operations by region:
|
|
Year Ended December 31,
|
||||||||||
|
(US$ Millions)
|
2017
|
2016
|
2015
|
||||||||
|
Brazil
|
$
|
580
|
|
$
|
51
|
|
$
|
18
|
|
||
|
Canada
|
486
|
|
532
|
|
460
|
|
|||||
|
Europe
|
314
|
|
261
|
|
117
|
|
|||||
|
United States
|
203
|
|
365
|
|
260
|
|
|||||
|
Other
|
79
|
|
71
|
|
37
|
|
|||||
|
Total
|
$
|
1,662
|
|
$
|
1,280
|
|
$
|
892
|
|
||
The charts below provide a breakdown of revenues for our industrial operations segment by region and business unit for the year ended
December 31, 2017
.
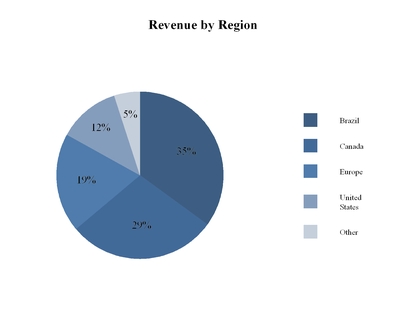
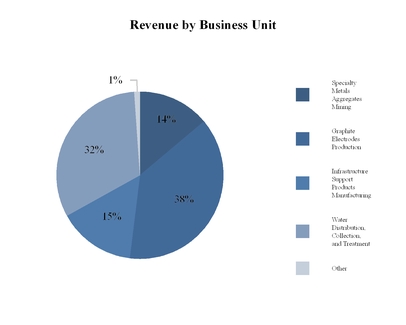
Specialty Metals and Aggregates Mining
Our mining operations currently consist of a limestone aggregates quarry located in northern Alberta, that supplies the Alberta oil sands industry, and a palladium mining operation that has been operating the Lac des Iles mine, or LDI mine, located in Ontario, Canada since 1993.
Our industrial minerals operations in Alberta are principally comprised of the operation and development of a limestone mine located in the heart of the Athabasca oil sands region approximately 60 km north of Fort McMurray, Alberta. Current operations are focused on the sale of limestone aggregates to large oil sands customers that require significant quantities of aggregates to build out roads, bridges, lay down areas, facility pads, dams, water systems and other critical infrastructure. In addition to our current limestone mining operations, we also hold leases for limestone and other minerals covering approximately one million acres in the surrounding area that encompass a large portion of the mineable Athabasca oil sands region of Alberta.
|
47
|
Brookfield Business Partners
|
Consolidation in the platinum group metals industry throughout 2017 has resulted in our palladium mining operation being the only pure play producer of palladium globally. Palladium is a specialty metal in the platinum group of metals, primarily used in the manufacture of catalytic converters for automobiles. We acquired the mine by converting our senior secured loan position, which we have held since 2013, into an ownership position when the mine underwent a recapitalization in 2015. Since acquiring control of the mine, we have embarked on several initiatives targeted at expanding production and reserves and reducing cash costs. There are very few palladium producing regions worldwide and few known economically viable ore bodies. Russia and South Africa, which are known to be higher-risk jurisdictions, account for approximately 80% of global palladium production. Growth in palladium mine supply is constrained, due to political, infrastructure cost and labour issues in South Africa, declining palladium production in Russia and a limited number of new projects on the horizon in the near term.
The primary underground deposits on our property are the Offset and Roby zones. The mine presently uses both a ramp and a shaft to access underground operations which currently employs both the long hole open stope and sub-level shrinkage mining method. Ore from the underground mine is blended with low grade stockpiles on surface to feed the mill. During September 2017, the mill transitioned to full-time processing from the previous 14-day on 14-day off batch schedule.
Our palladium mining operation has exploration potential near the LDI mine, where a number of growth targets on its properties have been identified, and is engaged in an exploration program aimed at increasing its palladium reserves and resources. As an established precious metals producer on a permitted property, the operation has the potential to convert exploration success into production and cash flow.
Graphite Electrodes Production
We are a manufacturer of a broad range of high quality graphite electrodes. Graphite electrodes are essential to the production of electric arc furnace ("EAF") steel. A significant portion of our sales is tied to the steel production industry. We also manufacture petroleum needle coke, which is the key raw material in the production of graphite electrodes. We completed the acquisition of this business in August 2015, at what we believe was a low point in the industry cycle, driven primarily by oversupply and downward price pressure in the steel market.
Graphite electrodes are key components of the conductive power systems used to produce steel and non-ferrous metals. Approximately 90% of our graphite electrodes sold are consumed in the EAF steel melting process, the steel making technology used by all "mini-mills". The vast majority of these mini-mills use alternating electric current and typically use nine electrodes (three columns of three) at one time. These mini-mills consume approximately three graphite electrodes every eight to ten operating hours when operating at a typical number of production cycles. We believe that mini-mills constitute the higher long-term growth sector of the steel industry and that there is currently no commercially viable substitute for graphite electrodes in EAF steel making. The remaining approximately 10% of electrodes sold are primarily used in various other ferrous and non-ferrous melting applications, BOF production, fused materials, chemical processing, and alloy metals.
The total manufacturing time of a graphite electrode and its associated connecting pin is on average approximately six months from needle coke production to customer delivery. We manufacture graphite electrodes ranging in size up to 30 inches in diameter and over 11 feet in length, and weighing as much as 5,900 pounds (2.6 metric tons). The manufacture of graphite electrodes includes six main processes: screening of raw materials (needle coke) and blending with coal tar pitch followed by forming, or extrusion, of the electrode, baking the electrode, impregnating the electrode with a special pitch that improves strength, re-baking the electrode, graphitizing the electrode using electric resistance furnaces, and machining.
We purchase other raw materials from a variety of sources and believe that the quality and cost of our raw materials on the whole is competitive with those available to our competitors. Our needle coke production allows us to be the only vertically integrated graphite electrode manufacturer. We believe that we are the world's second largest petroleum-based needle coke producer and assuming normal annual maintenance, a product mix of only normal premium petroleum needle coke production and related by-products, the annual capacity is approximately 140,000 metric tons and currently supply a substantial portion of graphite electrode facilities' needle coke requirements.
|
Brookfield Business Partners
|
48
|
Our manufacturing facilities principally consist of four graphite electrode facilities located in Spain, France, the United States and Mexico, a petroleum needle coke facility in the United States, an electrode machining center in Brazil and specialty graphite and carbon products manufacturing facilities and sales offices across the globe. We currently have the operating capability, depending on product demand and mix, to manufacture approximately 195,000 metric tons of graphite electrodes. Our strategy is to be a low-cost, high quality producer in an industry where there are high barriers to entry given the high capital investment and the extensive product, process and material science knowledge required in the production process.
We sell our products globally and primarily through our direct sales force, independent sales representatives and distributors, all of whom are trained and experienced with our products. We have a large customer technical service organization, with supporting application engineering, scientific groups, and engineers and specialists around the world.
Infrastructure Support Products Manufacturing
Our operations manufacture and market a comprehensive range of infrastructure products and engineered construction solutions. We service in a diverse cross-section of industries in Canada, as well as selected markets globally. These markets include Canada's national and regional public infrastructure markets and private sector markets in agricultural drainage, building construction and natural resources.
The demand for our products is cyclical and is driven by public infrastructure spending, commercial development, natural resources activity, residential construction and agricultural drainage requirements. We generate our business by participating in bids for our engineered precast products and, for our other products, through established customer relationships with a diverse base of clients across industries and end-markets.
Water Distribution and Sewage Treatment
During the second quarter of 2017, we acquired a controlling stake in the largest private water company in Brazil, which we renamed BRK Ambiental. BRK Ambiental provides water and sewage services to a broad range of residential, industrial, commercial and governmental customers. These services include water and sewage collection, treatment and distribution. BRK Ambiental operates primarily through long-term, inflation-adjusted concession and Public Private Partnerships ("PPP") contracts with municipalities or take-or-pay contracts with industrial customers throughout Brazil. As part of its service contract, the company invests significant capital to improve and expand the service offerings. The company currently serves over 15 million people with an average remaining contract duration of 25 years.
Energy
Our energy operations leverage the history and pedigree of Brookfield as an owner and operator of capital intensive and/or commodity-related businesses. Our energy operations business has been built using the acquisition strategy that we have adopted for our business generally and is comprised of a marine energy services business held through an equity affiliate; Canadian oil and gas exploration and production, principally through our coal-bed methane, or CBM, platform in Alberta, Canada; offshore Western Australia oil and gas exploration and production held through an equity affiliate; and well servicing and contract drilling operations primarily located in the Western Canadian Sedimentary Basin, or WCSB.
The table below provides a breakdown of revenues for our energy operations by region:
|
Year Ended December 31,
|
|||||||||||
|
(US$ Millions)
|
2017
|
2016
|
2015
|
||||||||
|
Canada
|
$
|
276
|
|
$
|
212
|
|
$
|
316
|
|
||
|
United States
|
1
|
|
62
|
|
17
|
|
|||||
|
Australia
|
—
|
|
12
|
|
4
|
|
|||||
|
Other
|
3
|
|
—
|
|
—
|
|
|||||
|
Total
|
$
|
280
|
|
$
|
286
|
|
$
|
337
|
|
||
|
49
|
Brookfield Business Partners
|
The charts below provide a breakdown of revenues and assets for our energy segment by region for the year ended and as at
December 31, 2017
.
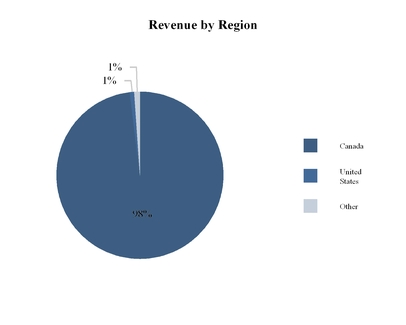

Marine Energy Services
Our marine energy services business is an international provider of marine transportation, off-shore oil production, facility storage, long-distance towing and offshore installation, maintenance and safety services to the oil industry. As a fee-based business focused on critical services, it has limited direct commodity exposure and the company has a substantial portfolio of medium to long-term, fixed-rate contracts with high quality, primarily investment grade counterparties. In addition, most services the business provides have high switching costs, represent a modest part of the overall cost of production and are required for its customers to generate revenue.
Specifically, our marine energy services business operates shuttle tankers (highly specialized vessels with dynamic positioning systems used for offloading from offshore oil installations), FPSOs (floating production storage and offloading units), FSOs (floating storage and offloading units) and long-haul towage vessels, also with highly specialized capabilities including dynamic positioning. The business operates in selected oil regions globally, including the North Sea (Norway and United Kingdom), Brazil and Canada.
Oil and Gas Operations
Our global oil and gas properties produce approximately 97,000 boe/d
1,2,3
, of which 46,000 boe/d
3
is from our Canadian properties, and 51,000 boe/d
2,3
is from our Australian properties. 99% of production from our Canadian properties is natural gas and 75% of production from our Australian properties is contracted offshore natural gas.
Operational results and financial condition are dependent upon the prices received for oil and gas production. Oil and gas prices have fluctuated widely in recent years. Such prices are primarily determined by economic and political factors. Supply and demand factors, as well as weather and conditions in other oil and gas regions of the world also impact prices. Any upward or downward movement in oil and gas prices could have an effect on the oil and gas platform's financial condition.
Canadian Oil and Gas Operations
Our CBM properties are characterized by long-life, low-decline reserves located at shallow depths and are low-risk with low-cost drilling and production with little to no associated water. We believe this ensures an ability to generate cash flow break even in a low underlying commodity price environment. Our CBM properties are located along the Horseshoe Canyon coal trend in the central part of the Province of Alberta and include over 7,000 miles of gathering pipelines and a significant number of facilities with the capacity to process over 500 MMcf/d of natural gas.
|
Brookfield Business Partners
|
50
|
We have implemented a hedging policy for our Canadian operations using, amongst other instruments, collars and fixed price swaps to hedge our gross natural gas production on a three year rolling basis, including a minimum of 50% in year one, 30% in year two and up to 10% for year three. Currently, our Canadian operations have 48 Bcf of natural gas hedged in 2018 and 13 Bcf of natural gas hedged in 2019. These hedging activities could expose our company to losses or gains.
Australian Oil and Gas Operations
Our Australian properties were acquired in June 2015 and are held through a joint venture formed prior to the acquisition. As at December 31, 2017, our company's equity accounted portion in such properties was approximately 9%. Our Australian business is focused on low-cost, base producing assets with low-risk development projects. We produce approximately 51,000 boe/d
1,3
of oil and gas from nine fields, being one of the largest suppliers of natural gas into the Western Australian domestic market. Our operations also benefit from a vast exploration portfolio covering more than ten million net acres and critical onshore and offshore infrastructure, comprised of interests in three domestic gas plants and two floating production, storage and offloading vessels that produce oil for the Asian oil markets.
Our strategy is to deliver stable, natural-gas weighted production and strong free cash flow due to our predicable reservoir performance, low cost of production and established infrastructure position. We will also pursue growth initiatives based on (i) a gas-focused exploitation strategy leveraging existing infrastructure, (ii) identified, low-risk infill and sidetrack drilling in existing oil producing fields and (iii) a balanced oil and gas focused exploration strategy seeking to advance our portfolio of exploration acreage into new productive areas. We also expect external growth opportunities may surface in the current market environment, and we believe we are well positioned to capitalize on such opportunities by virtue of our established operations in the region, our position in the domestic gas market and our infrastructure position, which currently has capacity that allows for growth.
Our Australian operations and resulting cash flows are comparatively sheltered from commodity movements, with 115 MMboe of total company oil and gas reserves (not our company's net equity interest) hedged or contracted at December 31, 2017. Our strong existing customer base and attractive long-term contract profile are enhanced further through a long-term gas sales agreement with an existing customer, one of the largest users of natural gas in Western Australia. Under the terms of our arrangement, we have a long-term "take or pay" contract commencing in 2020 at a base price that compares favorably to our full-cycle supply cost. The result of these arrangements is that approximately 80% of our oil and gas production volumes are subject to customer contracts or fixed price swaps in 2018.
____________________________________
|
(1)
|
We have adopted the standard of 6 Mcf:1 Bbl when converting natural gas to oil equivalent. BOEs may be misleading, particularly if used in isolation. A BOE conversion ratio of 6 Mcf:1 Bbl is based on an energy equivalency conversion method primarily applicable at the burner tip and does not represent a value equivalency at the wellhead. Given the value ratio based on the current price of crude oil as compared to natural gas is significantly different from the energy equivalency of 6 Mcf:1 Bbl, utilizing a conversion ratio at 6 Mcf:1 Bbl may be misleading as an indication of value. All production data is presented as property working interest, before deduction of royalties.
|
|
(2)
|
Represents full company interest production, not our company's equity interest.
|
|
(3)
|
Property working interest, but before deduction of royalties.
|
Well Servicing Operations
Our energy operations also include contract drilling and well-servicing operations, primarily located in the Western Canadian Sedimentary Basin, or WCSB. In November 2017, we closed the acquisition of a competitor’s Canadian business operations to become the largest production servicing platform in Western Canada by operating hours Source: Canadian Association of Oilfield and Drilling Contractors, or CAODC., which now includes 149 service rigs, ten coil rigs, nine telescopic double drilling rigs and 13 swabbing rigs. A significant portion of the servicing revenue is derived from large national and international oil and gas companies which operate in Alberta, Canada. Our well servicing operations have continued to experience industry leading utilization. We are well positioned to adjust to our customers oilfield servicing needs and explore opportunities that would give our platform increase size to accommodate such.
We experience seasonality in this business, as the ability to move heavy equipment safely and efficiently in Western Canadian oil and gas fields is dependent on weather conditions. Additionally, our well servicing operations are impacted by the cyclical nature of the oil and gas sector. Volatility of commodity prices and changes in capital and operating budgets of upstream oil and gas companies impact the level of drilling and servicing activity.
Corporate and Other
Corporate and other includes corporate cash and liquidity management, as well as activities related to the management of the partnership's relationship with Brookfield.
|
51
|
Brookfield Business Partners
|
Our Growth Strategy
We seek to build value through enhancing the cash flows of our businesses, pursuing an operations-oriented acquisition strategy and opportunistically recycling capital generated from operations and dispositions into our existing platforms, new acquisitions and investments. We look to ensure that each of our businesses has a clear, concise business strategy built on its competitive advantages, while focusing on profitability, sustainable operating product margins and cash flows. We emphasize downside protection by utilizing business plans that do not rely exclusively on top-line growth or excessive leverage.
We plan to grow by acquiring positions of control or significant influence in businesses at attractive valuations and by enhancing earnings of the businesses we operate. In addition to pursuing accretive acquisitions within our current operations, we plan to opportunistically build new platforms or make investments where our expertise, or the broader Brookfield platforms, provide insight into global demand for goods and commodities to source acquisitions that are not available or obvious to competitors.
We offer a long-term ownership structure to companies whose management teams are seeking additional sources of capital but prefer not to be public as a standalone business. From time to time, we will recycle capital opportunistically, but we will have the ability to own and operate businesses for the long-term.
Consistent with Brookfield's history as an owner/operator, our strategy is to:
•
build and operate businesses with sustainable cash flows to reduce risk and lower cost of capital;
•
utilize an active management approach focused on strategic, operational and/or financial improvements;
•
acquire businesses on a value basis; deploying contrarian thinking to target out of favor sectors; and
|
•
|
make direct acquisitions or add-on acquisitions within existing platforms and/or in sectors where we believe we possess competitive advantages.
|
In addition, we may make opportunistic investments in private and public securities of businesses where we can leverage our operating footprint or the broader Brookfield platform to provide us with a competitive advantage.
Intellectual Property
Our company and the Holding LP have each entered into a licensing agreement with Brookfield pursuant to which Brookfield has granted a non-exclusive, royalty-free license to use the name "Brookfield" and the Brookfield logo. Other than under this limited license, we do not have a legal right to the "Brookfield" name and the Brookfield logo.
Brookfield may terminate the licensing agreement effective immediately upon termination of our Master Services Agreement or with respect to any licensee upon 30 days' prior written notice of termination if any of the following occurs:
|
•
|
the licensee defaults in the performance of any material term, condition or agreement contained in the agreement and the default continues for a period of 30 days after written notice of the breach is given to the licensee;
|
|
•
|
the licensee assigns, sublicenses, pledges, mortgages or otherwise encumbers the intellectual property rights granted to it pursuant to the licensing agreement;
|
|
•
|
certain events relating to a bankruptcy or insolvency of the licensee; or
|
•
the licensee ceases to be an affiliate of Brookfield.
A termination of the licensing agreement with respect to one or more licensees will not affect the validity or enforceability of the agreement with respect to any other licensees.
Governmental, Legal and Arbitration Proceedings
We are not currently subject to any material governmental, legal or arbitration proceedings which may have or have had a significant impact on our company's financial position or profitability, nor are we aware of any such proceedings that are pending or threatened.
We are occasionally named as a party in various claims and legal proceedings which arise during the normal course of our business. We review each of these claims, including the nature of the claim, the amount in dispute or claimed and the availability of insurance coverage. Although there can be no assurance as to the resolution of any particular claim, we do not believe that the outcome of any claims or potential claims of which we are currently aware will have a material adverse effect on us.
|
Brookfield Business Partners
|
52
|
Facilities
Our principal registered offices located in Bermuda, with our operations primarily located in Canada, Australia, Europe, the United States, Brazil and the Middle East. In total, we lease and own approximately 2.9 million square feet and 4.5 million square feet of space, respectively, across these locations for such operations, including office, warehouse and manufacturing space. We consider our primary facilities are:
|
•
|
Approximately 1.4 million square feet of manufacturing and warehouse facilities in the United States related to our graphite electrode manufacturing business;
|
|
•
|
Approximately 3.6 million square feet of office, retail, and manufacturing and warehouse facilities in Canada related to our infrastructure support products manufacturing business, our logistics businesses, and our fuel marketing business; and
|
|
•
|
Approximately 0.7 million square feet of manufacturing and warehouse facilities in Europe related to our graphite electrode manufacturing business.
|
Our leases expire at various times during the coming years. We believe that our current facilities are suitable and adequate to meet our current needs and that suitable additional or substitute space will be available as needed to accommodate continuing and expanding of our operations.
|
53
|
Brookfield Business Partners
|
4.C. ORGANIZATIONAL STRUCTURE
Organizational Chart
The chart below represents a simplified summary of our organizational structure. All ownership interests indicated below are 100% unless otherwise indicated. "GP Interest" denotes a general partnership interest and "LP Interest" denotes a limited partnership interest. Certain subsidiaries through which Brookfield Asset Management holds units of our company and the redemption-exchange units have been omitted. This chart should be read in conjunction with the explanation of our ownership and organizational structure below.
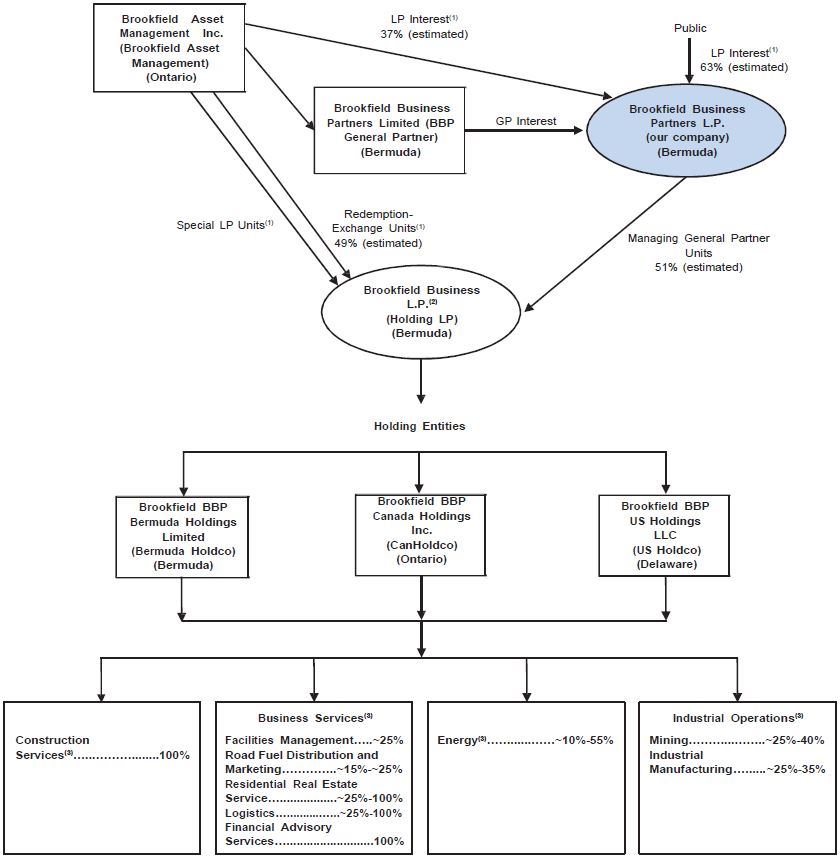
____________________________________
|
Brookfield Business Partners
|
54
|
|
(1)
|
Public holders of our units currently own approximately 63% of our units and Brookfield currently owns approximately 37% of our units. Our company's sole direct investment is a managing general partnership interest in the Holding LP. Brookfield also owns a limited partnership interest in the Holding LP through Brookfield's ownership of redemption-exchange units and Special LP Units. Brookfield indirectly owns 100% of the redemption-exchange units of Holding LP, which represent 49% of our units on a fully diluted basis. The redemption-exchange units are redeemable for cash or exchangeable for our units in accordance with the Redemption-Exchange Mechanism, which could result in Brookfield owning approximately 68% of our units issued and outstanding, with public holders of our units owning approximately 32% of the units of our company issued and outstanding, in each case on a fully exchanged basis. Brookfield's interest in our company consists of a combination of our units and general partner interests, the redemption-exchange units and the Special LP Units. The Special LP units entitle the holder to receive incentive distributions. See Item 7.B., "Related Party Transactions—Incentive Distributions". The BBU General Partner has adopted a distribution policy pursuant to which we intend to make quarterly cash distributions to public holders of our units. In general, quarterly cash distributions will be made from distributions received by our company on its Managing General Partner Units. Distributions of available cash (if any) by the Holding LP will be made in accordance with the Holding LP Limited Partnership Agreement, which generally provides for distributions to be made by the Holding LP to all owners of the Holding LP's partnership interests (including the Managing General Partner Units owned by us and the Special LP Units and redemption-exchange units owned by Brookfield) on a pro rata basis. Our company currently owns approximately 66 million Managing General Partner Units and Brookfield currently owns approximately 63 million redemption-exchange units and four Special LP Units. However, if available cash in a quarter is not sufficient to pay the quarterly distribution amount, currently $0.0625 per unit, to the owners of all the Holding LP interests, then we can elect to defer distributions on the redemption-exchange units and accrue such deficiency for payment from available cash in future quarters. See "Distribution Policy" and Item 10.B., "Description of the Holding LP Limited Partnership Agreement—Distributions".
|
|
(2)
|
The Holding LP currently owns, directly or indirectly, all of the common shares or equity interests, as applicable, of the Holding Entities. Brookfield has subscribed for $5 million of preferred shares of each of CanHoldco and two of our other subsidiaries, which preferred shares will be entitled to vote with the common shares of the applicable entity. Brookfield currently has an aggregate of 1% of the votes of each of the three entities.
|
|
(3)
|
Certain of the operating businesses and intermediate holding companies that are directly or indirectly owned by the Holding Entities and that directly or indirectly hold our operations are not shown on the chart. All percentages listed represent our economic interest in the applicable entity or group of assets, which may not be the same as our voting interest in those entities and groups of assets. All interests are rounded to the nearest one percent and are calculated as at the date of this Form 20-F.
|
The following table provides the percentage of voting securities owned, or controlled or directed, directly or indirectly, by us, and our economic interest in our operating businesses included in our organizational chart set out above.
|
Significant Subsidiaries
|
Jurisdiction of
Organization
|
Voting Securities
|
Economic Interest
|
||||
|
Construction Services
|
|
|
|
||||
|
Multiplex
|
Australia
|
100
|
%
|
100
|
%
|
||
|
Business Services
|
|
|
|
||||
|
Greenergy Fuels Holdings Limited
|
United Kingdom
|
85
|
%
|
14
|
%
|
||
|
BGIS Global Integrated Solutions Canada L.P.
|
Canada
|
100
|
%
|
26
|
%
|
||
|
Industrial Operations
|
|
|
|
||||
|
GrafTech International Ltd.
|
United States of America
|
100
|
%
|
34
|
%
|
||
|
BRK Ambiental
|
Brazil
|
70
|
%
|
26
|
%
|
||
|
North American Palladium Ltd.
|
Canada
|
92
|
%
|
23
|
%
|
||
|
Energy
|
|
|
|
||||
|
Ember Resources Inc.
|
Canada
|
100
|
%
|
41
|
%
|
||
Our Company
Our company was established on January 18, 2016 as a Bermuda exempted limited partnership registered under the Bermuda Limited Partnership Act, and the Bermuda Exempted Partnerships Act of 1992, as amended. Our head and registered office is 73 Front Street, 5th Floor, Hamilton HM 12, Bermuda and our telephone number is +441 294-3309.
On June 20, 2016, Brookfield Asset Management completed the spin-off of its business services and industrial operations to our company, which was effected by way of a special dividend of units of our company to holders of Brookfield Asset Management's Class A and B limited voting shares. We are Brookfield's flagship public company for its business services and industrial operations and the primary entity through which Brookfield owns and operates these businesses on a global basis. We are positioned to provide unitholders with the opportunity to benefit from Brookfield's global presence, operating experience, execution capabilities and relationships.
|
55
|
Brookfield Business Partners
|
Holding LP
Our company's sole direct investment is a managing general partnership interest in the Holding LP. Brookfield owns units of our company and indirectly owns 100% of the redemption-exchange units of the Holding LP that, in aggregate, represent approximately a 68% interest in our company, assuming that all of the redemption-exchange units of Holding LP are exchanged for units of our company pursuant to the redemption-exchange mechanism. Brookfield also owns a special limited partnership interest in the Holding LP that entitles it to receive incentive distributions from the Holding LP. See Item 10.B., "Description of the Holding LP Limited Partnership Agreement—Distributions" and "Related Party Transactions—Incentive Distributions".
Our Service Providers
The Service Providers, wholly-owned subsidiaries of Brookfield Asset Management, provide management services to us pursuant to our Master Services Agreement. The senior management team that is principally responsible for providing us with management services include many of the same executives that have successfully overseen and grown Brookfield's business services and industrial operations, including Cyrus Madon who is a Senior Managing Partner of Brookfield Asset Management and Head of its Private Equity Group.
The BBU General Partner
The BBU General Partner, a wholly-owned subsidiary of Brookfield Asset Management, has sole authority for the management and control of our company. Holders of our units, in their capacities as such, may not take part in the management or control of the activities and affairs of our company and do not have any right or authority to act for or to bind our company or to take part or interfere in the conduct or management of our company. See Item 10.B., "Memorandum and Articles of Association—Description of our Units and our Limited Partnership Agreement".
Holding Entities
Our company indirectly holds its interests in our operating businesses through the Holding Entities, which are recently formed entities. The Holding LP owns, directly or indirectly, all of the common shares or equity interests, as applicable, of the Holding Entities. In addition, Brookfield has subscribed for $5 million of preferred shares of each of CanHoldco and two of our other subsidiaries. See Item 7.B., "Related Party Transactions—Relationship Agreement" for further detail.
4.D. PROPERTY, PLANTS AND EQUIPMENT
See Item 4.B., "Business Overview".
Not applicable.
5.A. OPERATING RESULTS
Introduction
This management’s discussion and analysis of our operating results and financial condition i
ncluded in Item 5. of this Form 20-F, or MD&A, of Brookfield Business Partners L.P. and subsidiaries, (collectively, the partnership, or we, or our), covers the financial position of our partnership as at
December 31, 2017
and
December 31, 2016
, and
results of operations for the years ended
December 31, 2017
,
2016
, and
2015
. The information in this MD&A should be read in conjunction with the
audited consolidated financial statements as at
December 31, 2017
and
December 31, 2016
, and
each of the years in the three years ended
December 31, 2017
included elsewhere in this Form 20-F, which are prepared in accordance with IFRS as issued by the IASB.
In addition to historical information, this MD&A contains forward-looking statements. Readers are cautioned that these forward-looking statements are subject to risks and uncertainties that could cause actual results to differ materially from those reflected in the forward-looking statements. See ‘‘Special Note Regarding Forward-Looking Statements’’ in the forepart of this Form 20-F.
Continuity of Interests
On June 20, 2016, Brookfield completed the spin-off of the partnership by way of a special dividend of a portion of our limited partnership units to holders of Brookfield's Class A and B limited voting shares (the "spin-off"). On June 1, 2016, we acquired substantially all of the business services and industrial operations of Brookfield, and received $250 million in cash from Brookfield. In consideration, Brookfield received (i) approximately 55% of our LP Units, and 100% of our GP Units, (ii) Special LP Units, and redemption-exchange units of the Holding LP, representing an approximate 52% limited partnership interest in
|
Brookfield Business Partners
|
56
|
Holding LP, and (iii) $15 million of preferred shares of certain of our subsidiaries. As at
December 31, 2017
, Brookfield holds an approximate 68% ownership interest in the partnership on a fully exchanged basis. Holders of the GP Units, LP Units, Special LP Units, and Redemption-Exchange Units will be collectively referred to throughout this MD&A as "unitholders". The LP Units and Redemption-Exchange Units have the same economic attributes in all respects, except that the Redemption-Exchange Units may, at the request of Brookfield, be redeemed in whole or in part for cash in an amount equal to the market value of one LP Unit multiplied by the number of Redemption-Exchange Units to be redeemed (subject to certain adjustments). As a result, Brookfield, as holder of the Redemption-Exchange Units, participates in earnings and distributions on a per unit basis equivalent to the per unit participation of the LP Units of the partnership. However, given the redemption feature referenced above and the fact that they were issued by our subsidiary, we present the Redemption-Exchange Units as a component of non-controlling interests.
Brookfield directly and indirectly controlled the Business prior to the spin-off and continues to control the partnership subsequent to the spin-off through its interests in the partnership. Accordingly, we have reflected the Business and its financial position and results of operations using Brookfield's carrying values prior to the spin-off.
To reflect the continuity of interests, this MD&A provides comparative information of the Business for the periods prior to the spin-off, as previously reported by Brookfield.
Basis of Presentation
For periods prior to the spin-off on June 20, 2016, our results represent a carve out of the assets, liabilities, revenues, expenses, and cash flows of the Business that was contributed to us and included allocations of general corporate expenses of the pre-spin-off business. These expenses, prior to the spin-off, relate to certain operational oversight functions and associated information technology, facilities and other overhead costs and have been allocated based on headcount. These allocated expenses have been included, as appropriate, in our consolidated statements of operating results prior to the spin-off. These allocations may not, however, reflect the expense we would have incurred as an independent publicly traded company for the periods presented. Subsequent to the spin-off, we no longer allocated general corporate expenses of the parent company as the functions to which they related to are now provided through the Master Services Agreement with Brookfield.
We also discuss the results of operations on a segment basis, consistent with how we manage and view our business. Our operating segments are: (i) construction services, (ii) business services, (iii) energy, (iv) industrial operations, and (v) corporate and other.
Non-IFRS measures used in this MD&A are reconciled to or calculated from such financial information. All dollar references, unless otherwise stated, are in millions of U.S. Dollars. Australian Dollars are identified as "A$", Brazilian Reais are identified as "R$", British Pounds are identified as "
£",
and Canadian Dollars are identified as "C$".
Overview of our Business
The partnership is a Bermuda exempted limited partnership registered under the Bermuda Limited Partnership Act of 1883, as amended, and the Bermuda Exempted Partnerships Act of 1992, as amended.
We were established by Brookfield to be its flagship public partnership for its business services and industrial operations. Our operations are primarily located in Canada, Australia, the United Kingdom, the United States, Brazil and the Middle East. The partnership is focused on owning and operating high quality businesses that are low cost producers and/or benefit from high barriers to entry. We seek to build value through enhancing the cash flows of our businesses, pursuing an operations oriented acquisition strategy and opportunistically recycling capital generated from operations and dispositions into our existing operations, new acquisitions and investments. The partnership’s goal is to generate returns to unitholders primarily through capital appreciation with a modest distribution yield.
|
57
|
Brookfield Business Partners
|
Operating Segments
We have five operating segments which are organized based on how management views business activities within particular sectors:
|
i.
|
Business services, including facilities management, road fuel distribution and marketing, residential real estate, logistics and financial advisory services;
|
|
ii.
|
Construction services, which include construction management and contracting services;
|
|
iii.
|
Industrial operations, including select manufacturing, mining, and distribution operations;
|
|
iv.
|
Energy operations, including oil and gas production, marine energy services and related businesses; and
|
|
v.
|
Corporate and other, which includes corporate cash and liquidity management, and activities related to the management of the partnership's relationship with Brookfield.
|
The charts below provide a breakdown by operating segment of total assets of
$15.8 billion
as at
December 31, 2017
and of total revenues of
$22.8 billion
for the year ended
December 31, 2017
.
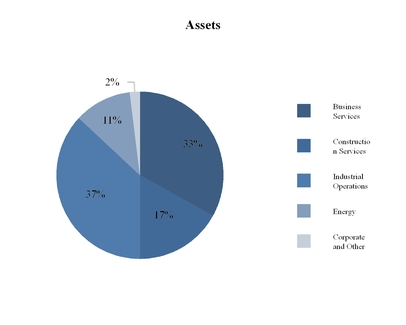
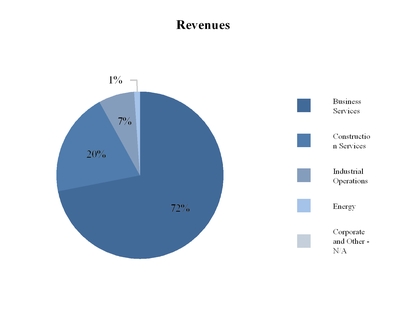
Business Services
The majority of our revenue in this segment is generated from Greenergy, our road fuel storage and distribution business, with our facilities management business, relocation services business and fuel marketing business also contributing significant revenues.
Our road fuel storage and distribution business is the largest provider of road fuels in the United Kingdom with significant import and storage infrastructure, an extensive distribution network and long-term customer relationships. Included in the revenue and direct operating costs for this business is a duty payable to the government of the U.K. which is recorded gross within revenues and direct costs, without impact on the margin generated by the business. We completed the acquisition of Greenergy on May 10, 2017.
Within our facilities management business, we provide property management, building operations and maintenance and other value-added solutions, as well as strategic advisory services to a variety of customers across various sectors including government, military, financial institutions, utilities, industrial and corporate offices. During the year ended
December 31, 2017
, our facilities management business completed a tuck-in acquisition and began to expand operations in Asia.
Through our relocation services business, we provide global employee relocation and related services to individuals and institutions and earn various fees by managing the process of employee relocation, home sale and expense management on behalf of our clients.
|
Brookfield Business Partners
|
58
|
On July 17, 2017, we acquired 213 retail gas stations and associated convenience kiosks of a fuel marketing business in Canada, which we believe already benefits from significant scale and strong customer loyalty through the PC Optimum loyalty program. During the year ended
December 31, 2017
, we began rebranding the gas stations to Mobil and we expect to complete the rebranding process in 2018.
Some of our business services activities are seasonal in nature and are affected by the general level of economic activity and related volume of services purchased by our clients.
Construction Services
Our construction services business is a global contractor with a focus on high-quality construction, primarily on large-scale and complex landmark buildings and social infrastructure. Construction projects are generally delivered through contracts whereby we take responsibility for design, program, procurement and construction for a defined price. The majority of construction activities are typically subcontracted to reputable specialists whose obligations mirror those contained within the main construction contract. A smaller part of the business is construction management, whereby we charge a fee for coordination of the sub-trades employed by the client. We are typically required to provide warranties for completed works, either as specifically defined in a client contract or required under local regulatory requirements. We issue bank guarantees and insurance bonds to clients and receive guarantees and/or cash retentions from subcontractors.
We recognize revenue and costs by reference to the stage of completion of the contract activity at the reporting date, measured as the proportion of contract costs incurred for work performed to date relative to the estimated total contract costs. A large portion of construction revenues and costs are earned and incurred in Australia and Europe, and are impacted primarily by the fluctuations in the Australian Dollar and British Pound. Given the cyclical nature of the construction industry and because a significant portion of our revenue is generated from large projects, the results from our construction operations can fluctuate quarterly and annually, depending on the level of work during a period. As we operate across the globe, our business is impacted by the general economic conditions and economic growth of the particular region in which we provide construction services.
I
ndustrial Operations
Our industrial operations segment includes manufacturing, mining and distribution activities in a variety of businesses. During the second quarter of 2017, we acquired a controlling stake in the largest private water company in Brazil ("BRK Ambiental"). BRK Ambiental provides water and sewage services, including collection, treatment and distribution, to a broad range of residential, industrial, commercial and governmental customers through long-term, inflation-adjusted concession, PPP and take-or pay contracts throughout Brazil. We believe the business can capture a growing share of the water and sewage improvements planned in Brazil over the next two decades, enabling the deployment of significant additional capital with stable, attractive risk-adjusted returns.
Our industrial operations segment also includes a manufacturer of graphite electrodes, and needle coke products used in the production of graphite electrodes. Graphite electrodes are primarily used in electric arc furnaces in mini-mill steel making and a significant portion of our sales are to the steel production industry. We completed the acquisition of this business in August 2015, at what we believe was a low point in the industry cycle, driven primarily by the oversupply and downward price pressure in the steel market. This is a capital-intensive business with significant barriers to entry and requires technical expertise to build and profitably operate. We have streamlined our processes with shorter lead times, lower costs, higher quality products and superior service, which should allow us to generate cash flows and returns as we come out of the trough in this cyclical business. We have seen tightness of graphic electrode supply and higher demand in 2017, which has led to a substantial increase in pricing.
In June 2015, we acquired operations that manufacture and market a comprehensive range of infrastructure products and engineered construction solutions. We acquired these operations by converting our term loan position, which we acquired in 2011, into an ownership position pursuant to a plan of arrangement under the
Companies' Creditors Arrangement Act (Canada)
. Prior to the recapitalization, our consolidated results included interest and fees on our loan position. We manufacture and market corrugated high-density polyethylene pipe, or HDPE pipe, corrugated steel pipe, or CSP, and other drainage related products, including small bridge structures. We also manufacture and market engineered precast concrete systems such as parking garages, bridges, sport venues and building envelopes, as well as standard precast concrete products, such as steps, paving stones and utility vaults. We service customers in a diverse cross-section of industries that are located in every region of Canada, including Canada's national and regional public infrastructure markets and private sector markets in agricultural drainage, building construction and natural resources. Growth and profitability in these operations are directly impacted by the demand for infrastructure, but the diverse factors driving infrastructure investment activity generally result in relative stability of demand.
In addition, we hold interests in specialty metal and aggregates mining operations in Canada. The mining operations currently consist of a limestone aggregates quarry located in northern Alberta, Canada and the Lac des Iles, or LDI, mine in Ontario, Canada. The limestone quarry has 459.2 million tonnes of proven mineral reserves and 539.5 million tonnes of probable mineral reserves.
Total sales volume for
2017
was 2.1 million tonnes.
|
59
|
Brookfield Business Partners
|
As at May 29, 2017, the LDI mine had an estimated 38.5 million tonnes total proven and probable reserves with an average grade of 2.25 g/t palladium. The LDI mine has announced a new life of mine plan which increases production to an estimated 214,400 payable ounces of palladium per year over a 9.5-year mine life. The LDI mine has met and exceeded targeted underground production rate of 6,000 tonnes per day, ahead of the original 2017 production plan. Decommissioning liabilities relating to legal and constructive obligations for future site reclamation and closure of the mine sites are recognized when incurred and a liability and corresponding asset are recorded at management’s best estimate. Reclamation costs are secured by a letter of credit and estimated closure and restoration costs are provided for in the accounting period when the obligation arising from the related disturbance occurs.
Energy
Our energy business is primarily comprised of oil and gas exploration and production, principally through our coal-bed methane, or CBM, platform in central Alberta, Canada, and an offshore oil and gas operation that serves the Western Australian market. Our energy business now includes energy-related service operations in Canada, the North Sea and Brazil.
Our Canadian properties produce approximately 46,000 barrels of oil equivalent per day, or BOE/D, 99% of which is natural gas from our CBM platform, after disposing approximately 2,000 BOE/D of production during the year ended December 31, 2017. Our CBM properties are characterized by long-life, low-decline reserves located at shallow depths and are low-risk with low-cost capital projects. Revenue from the sale of oil and gas is recognized when title to the product transfers to the purchasers based on volumes delivered and contractual delivery points and prices. Revenue from the production of gas, in which we have an interest with other producers, is recognized based on our working interest. Revenues are exposed to fluctuations in commodity prices, however; we aim to enter into contracts to hedge production, when appropriate.
Our Western Australian properties were acquired in June 2015 and are held through an investment in an associate. We account for these operations by the equity method of accounting. Production at our Western Australian oil and gas operations is approximately 51,000 BOE/D, and we are one of the largest suppliers of gas into the Western Australian domestic market. The operations include critical infrastructure comprised of three domestic gas plants and two floating production, storage and offloading vessels. We recognize oil and natural gas revenues when working interest production is sold to a purchaser at fixed or determinable prices, when delivery has occurred and title has transferred and collectability of the revenue is reasonably assured. Revenues are exposed to fluctuations in commodity prices; however, for our natural gas production we aim to enter into long-term contracts and have hedged our shorter life conventional oil production through to the end of 2019. As at December 31, 2017, we had 115 million barrels of oil equivalent, or MMBOE of total company oil and gas reserves (not the partnership's net equity interest) under long-term contracts or financially hedged.
In our energy segment, we expect to incur future costs associated with dismantlement, abandonment and restoration of our assets. The present value of the estimated future costs to dismantle, abandon and restore are added to the capitalized costs of our assets and recorded as a long-term liability.
Our energy operations also include contract drilling and well-servicing operations, primarily located in the Western Canadian Sedimentary Basin, or WCSB. Our energy-related contract drilling and well-servicing revenues are based upon orders and contracts with customers that include fixed or determinable prices and are based upon daily, hourly or contracted rates. A significant portion of the servicing revenue is derived from large national and international oil and gas companies which operate in Alberta, Canada. We experience seasonality in this business as the ability to move heavy equipment safely and efficiently in western Canadian oil and gas fields is dependent on weather conditions. Activity levels during the first and fourth quarter are typically the most robust, as the frost creates a stable ground mass that allows for easy access to well sites and easier drilling and service rig movement, while the second quarter is traditionally the slowest due to road bans during spring break up. During the year ended
December 31, 2017
, our Canadian well-servicing operation completed a tuck-in acquisition of the service and swabbing rig assets and ongoing operations of another well-servicing operation in the WSCB. In addition, our Canadian well-servicing operation completed a rights offering during the year which resulted in an increase in our economic interest in the business from approximately 39% to approximately 56%.
Our energy operations also include our equity interest in Teekay Offshore Partners L.P. ("Teekay Offshore"), a marine energy services business. As a fee-based business focused on critical services, the business has limited direct commodity exposure and has a substantial portfolio of medium to long-term, fixed-rate contracts with high quality, primarily investment grade counterparties. Our share of the equity investment attributable to unitholders in this marine energy services business was approximately $317 million and was completed on September 25, 2017.
Corporate and Other
Corporate and other includes corporate cash and liquidity management, as well as activities related to the management of the partnership's relationship with Brookfield.
|
Brookfield Business Partners
|
60
|
Outlook
We will seek to increase the cash flows from our operations through acquisitions and organic growth opportunities as described below. We believe our global scale and leading operating platform allows us to efficiently allocate capital around the world toward those sectors and geographies where we see the greatest opportunities to realize our targeted returns. We also actively seek to monetize assets on our balance sheet as they mature and reinvest the proceeds into higher yielding investment strategies, further enhancing returns.
Within our business services segment, we are continuing to grow our facilities management business globally to handle large multi-site client portfolios and increase self-perform service capabilities. We are also growing our road fuels marketing and distribution platform through tuck-in acquisitions, expanding into new regions and new product lines. At our newly acquired gaming facilities, our long-term growth strategy includes enhancing guest experience and expanding properties to incorporate state-of-the-art facilities, hotels and premier entertainment venues. Our construction services business is one of the strongest operators globally and we continue to win new work and increase our backlog in core markets as we focus on returning to more historical levels of profitability. Our industrial operations include a number of emerging businesses which have the potential to generate increased cash flows, the most significant business being GrafTech, our graphite electrode production operation. We have executed operational improvements and sales contracting initiatives and expect to generate significantly enhanced cash flows from the business over the next three to five years. We are pursuing an initial public offering of GrafTech’s shares. The proceeds distributed from the IPO will fund a meaningful part of our acquisition activity in the coming year, and a public listing of GrafTech will give us liquidity for our shares in the company in case we wish to redeploy capital in the future to fund our growth.
Subsequent to year-end, together with institutional partners we reached a definitive agreement to acquire an iconic American company, Westinghouse Electric Company (“Westinghouse”), for a purchase price of approximately $4.6 billion. Based in Pennsylvania, Westinghouse generates stable cash flows and its services and products are critical to the success of its customers. Its technology leads the industry and there are opportunities for growth within both existing and new markets, and Westinghouse continues to introduce its AP1000 design into many regions where nuclear capacity is increasing. In January 2018, we also entered into a definitive agreement alongside institutional partners to acquire a controlling interest in Schoeller Allibert, one of Europe’s largest manufacturers of returnable plastic packaging systems. We believe the company is well positioned to be a leader in the returnable packaging industry which is growing from an increased global focus on sustainability, waste reduction, e-commerce and logistics automation. We also hope to replicate this partnership approach with family-owned businesses in Germany, and more broadly in Europe.
Geographically, our strategy is to take a long-term view on the regions where Brookfield has an established presence, and to invest further during periods of market weakness. For example, we recently acquired a 70% interest in BRK Ambiental, the largest private water company in Brazil, as that country emerges from recession. We believe there will be considerable opportunities to expand BRK Ambiental’s operations while achieving strong, risk adjusted returns on capital. In India, the government has made strides in making the operating and legal environments more investor friendly and the expected GDP growth rate is projected to be strong, making it another attractive market to invest in for the long-term.
The opportunities for our partnership to increase cash flows through acquisitions and organic growth are based on assumptions about our business and markets that management believes are reasonable in the circumstances. There can be no assurance as to growth in our cash flows, or capital deployed for acquisitions or organic growth. See “
Special Note Regarding Forward-Looking Statements
" included in this Form 20-F.
|
61
|
Brookfield Business Partners
|
Review of Consolidated Results of Operations
The table below summarizes our results of operations for the years ended
December 31, 2017
,
2016
and
2015
. Further details on our results of operations and our financial performance are presented within the "Segment Analysis" section.
|
|
Change
|
|||||||||||||||||||
|
|
Year Ended December 31,
|
|||||||||||||||||||
|
(US$ Millions, except per unit amounts)
|
2017
|
2016
|
2015
|
2017 vs 2016
|
2016 vs 2015
|
|||||||||||||||
|
Revenues
|
$
|
22,823
|
|
$
|
7,960
|
|
$
|
6,753
|
|
$
|
14,863
|
|
$
|
1,207
|
|
|||||
|
Direct operating costs
|
(21,876
|
)
|
(7,386
|
)
|
(6,132
|
)
|
(14,490
|
)
|
(1,254
|
)
|
||||||||||
|
General and administrative expenses
|
(340
|
)
|
(269
|
)
|
(224
|
)
|
(71
|
)
|
(45
|
)
|
||||||||||
|
Depreciation and amortization expense
|
(371
|
)
|
(286
|
)
|
(257
|
)
|
(85
|
)
|
(29
|
)
|
||||||||||
|
Interest expense
|
(202
|
)
|
(90
|
)
|
(65
|
)
|
(112
|
)
|
(25
|
)
|
||||||||||
|
Equity accounted income, net
|
69
|
|
68
|
|
4
|
|
1
|
|
64
|
|
||||||||||
|
Impairment expense, net
|
(39
|
)
|
(261
|
)
|
(95
|
)
|
222
|
|
(166
|
)
|
||||||||||
|
Gain (loss) on acquisitions/dispositions, net
|
267
|
|
57
|
|
269
|
|
210
|
|
(212
|
)
|
||||||||||
|
Other (expenses) income, net
|
(108
|
)
|
(11
|
)
|
70
|
|
(97
|
)
|
(81
|
)
|
||||||||||
|
Income (loss) before income tax
|
223
|
|
(218
|
)
|
323
|
|
441
|
|
(541
|
)
|
||||||||||
|
Current income tax (expense) recovery
|
(30
|
)
|
(25
|
)
|
(49
|
)
|
(5
|
)
|
24
|
|
||||||||||
|
Deferred income tax recovery (expense)
|
22
|
|
41
|
|
(5
|
)
|
(19
|
)
|
46
|
|
||||||||||
|
Net income (loss)
|
$
|
215
|
|
$
|
(202
|
)
|
$
|
269
|
|
$
|
417
|
|
$
|
(471
|
)
|
|||||
|
Attributable to:
|
|
|
|
|||||||||||||||||
|
Limited partners
(1)
|
$
|
(58
|
)
|
$
|
3
|
|
$
|
—
|
|
$
|
(61
|
)
|
$
|
3
|
|
|||||
|
Brookfield Asset Management
(2)
|
—
|
|
(35
|
)
|
208
|
|
35
|
|
(243
|
)
|
||||||||||
|
Non-controlling interests attributable to:
|
||||||||||||||||||||
|
Redemption-Exchange Units held by Brookfield Asset Management
(1)
|
(60
|
)
|
3
|
|
—
|
|
(63
|
)
|
3
|
|
||||||||||
|
Special limited partners
|
142
|
|
—
|
|
—
|
|
142
|
|
—
|
|
||||||||||
|
Interest of others in operating subsidiaries
|
191
|
|
(173
|
)
|
61
|
|
364
|
|
(234
|
)
|
||||||||||
|
$
|
215
|
|
$
|
(202
|
)
|
$
|
269
|
|
$
|
417
|
|
$
|
(471
|
)
|
||||||
|
Basic and diluted earnings per limited partner unit
(3) (4) (5)
|
$
|
(1.04
|
)
|
$
|
0.06
|
|
||||||||||||||
____________________________________
|
(1)
|
For the periods subsequent to June 20, 2016.
|
|
(2)
|
For the periods prior to June 20, 2016.
|
|
(3)
|
Average number of partnership units outstanding on a fully diluted time weighted average basis, assuming the exchange of redemption exchange units held by Brookfield Asset Management for limited partnership units, for the year ended
December 31, 2017
was 113.5 million (2016: 92.9 million).
|
|
(4)
|
Income (loss) attributed to limited partnership units on a fully diluted basis is reduced by incentive distributions paid to special limited partnership unitholders during the year ended
December 31, 2017
.
|
|
(5)
|
Comparative figures for the year ended December 31, 2015 are not representative of performance, as units were spun out on June 20, 2016.
|
|
Brookfield Business Partners
|
62
|
Comparison of the Years Ended
December 31, 2017
and
December 31, 2016
For the year ended
December 31, 2017
, we reported net income of
$215 million
, with
$24 million
of net income attributable to unitholders. Our net income in 2017 was primarily attributable to the sale of our bath and shower products manufacturing business in January 2017, which resulted in a net gain on the disposition of $233 million, with an $84 million net gain attributable to unitholders, net of taxes. In addition, our industrial operations segment benefited from improved performance in our graphite electrode manufacturing business and our palladium mining operation. Our energy segment benefited from higher gas prices due to hedging and higher drilling rates and greater utilization of our rigs in our Canadian well-servicing operation. Our business services segment benefited from higher contributions from our residential real estate services and relocation services businesses, which were partially offset by lower contributions from our financial advisory services business. Net income was also partially offset by the $16 million loss on sale, net of taxes, of Insignia Energy in our energy segment, lower results in our construction services business, and higher management and corporate expenses. This compares to a net loss of
$202 million
, with a
$29 million
net loss attributable to unitholders, for the year ended
December 31, 2016
. The net loss during the year ended
December 31, 2016
was primarily attributable to impairment charges related to the non-core assets held for sale within our graphite electrode manufacturing business and on an investment security in our energy segment. The decrease was also attributable to lower realized natural gas pricing and production in our Canadian energy operations as well as lower gains on acquisitions and dispositions relative to the year ended
December 31, 2015
.
Revenue
For the year ended
December 31, 2017
, revenue increased by
$14,863 million
, to
$22,823 million
, compared to
$7,960 million
for the year ended
December 31, 2016
. The increase in revenues was primarily due to the acquisition of Greenergy during the year. Included in the revenue and direct operating costs for Greenergy is duty payable to the government of the U.K. The duty is considered a production cost, rather than a sales tax, as Greenergy is obligated for the tax and passes this cost to the customer; this flow through duty amount is recorded gross within revenues and direct costs without impact on the margin generated by the business. In addition, the 2017 acquisitions of BRK Ambiental and our fuel marketing business both contributed to the incremental revenues during the year. Our facilities management business in our business services segment benefited from both higher project volumes and tuck-in acquisitions which resulted in increased revenues. Revenues in our construction services business increased as we continued to turn over a higher level of activity and maintain a consistent backlog. Revenues in our industrial operations segment increased due to improved pricing at our graphite electrode manufacturing business and increased sales volume and pricing at our palladium mining operations. This was partially offset by a decrease in revenues from the sale of our bath and shower products manufacturing business in our industrial operations segment in January 2017.
Direct
Operating
Costs
For the year ended
December 31, 2017
, direct operating costs increased by
$14,490 million
, to
$21,876 million
from
$7,386 million
for the year ended
December 31, 2016
. The increase in direct operating costs was primarily related to the acquisition of Greenergy during the year. As noted, included in the revenue and direct operating costs for Greenergy is a duty payable to the government of the U.K., which are recorded gross within revenues and direct costs without impact on the margin generated by the business. In addition, the acquisitions of BRK Ambiental and our fuel marketing business both contributed to the increase in direct operating costs during the year. Direct operating costs within our facilities management business, our graphite electrode manufacturing business, and our palladium mining operations also increased in line with revenues. Direct operating costs within our construction services business increased due to higher project costs in the Middle East. This was partially offset by a decrease in direct operating costs resulting from the sale of our bath and shower products manufacturing business.
General and Administrative Expenses
For the year ended
December 31, 2017
, general and administrative, G&A, expenses increased by
$71 million
to
$340 million
from
$269 million
from the same period in the prior year. G&A expenses increased due to the acquisitions of BRK Ambiental, Greenergy, and our fuel marketing business during the year, which contributed a total of $73 million to G&A expenses for the year ended
December 31, 2017
. G&A expenses also increased due to higher management fees and corporate expenses as only the latter half of 2016 relates to periods post spin-off. The increase was partially offset by the sale of our bath and shower products manufacturing business during the year, which had contributed approximately $30 million to G&A expenses for the year ended
December 31, 2016
.
Depreciation and Amortization Expense
Depreciation and amortization, D&A, expense includes depletion related to oil and gas assets, depreciation of property, plant and equipment, or PP&E, as well as the amortization of intangible assets. The highest contribution to D&A expense is from our industrial operations and energy segments. The D&A expense from our industrial operations segment is primarily depreciation on PP&E assets at our graphite electrode manufacturing operations and BRK Ambiental. The D&A expense in our energy segment is largely from our oil and gas assets, where PP&E is depleted on a unit-of-production basis over the proved plus probable reserves.
|
63
|
Brookfield Business Partners
|
We use National Instrument 51-101 -
Standards of Disclosure for Oil and Gas Activities
, or NI 51-101, as the basis for defining and calculating proved and probable reserves for purposes of the D&A expense calculations. D&A is generally consistent year-over-year with large changes typically due to the addition or disposal of depreciable assets.
For the year ended
December 31, 2017
, D&A expense increased by
$85 million
compared to the same period ended
December 31, 2016
. The increase in D&A was mainly due to the acquisitions of BRK Ambiental, Greenergy, and our fuel marketing business during the year.
Interest Expense
For the year ended
December 31, 2017
, interest expense increased by
$112 million
when compared to the year ended
December 31, 2016
. The increase is due to the inclusion of borrowing costs related to BRK Ambiental, Greenergy, and our fuel marking business, all of which were acquired during the year.
Equity Accounted Income, net
For the year ended
December 31, 2017
, equity accounted income increased by
$1 million
relative to prior year. The increase was primarily related to the revaluation gain on the step up of an investment from a joint venture to a consolidated entity within our Western Australian energy operation, which was partially offset by the reorganization of the ownership group and a partial sell down to institutional partners in the latter half of 2016. The increase was further offset by the pick up of the net loss in our marine energy services business, which incurred transaction costs from the acquisition in September 2017 and recognized an impairment loss on one of its floating production storage and offloading units.
Impairment Expense, net
For the year ended
December 31, 2017
, impairment expense decreased by
$222 million
to
$39 million
from
$261 million
, when compared to the year ended
December 31, 2016
. During the year ended
December 31, 2017
, we recognized impairment on certain non-core assets held for sale within our graphite electrode manufacturing business in our industrial operations segment and on an intangible asset in our construction services segment. This impairment was substantially less than the impairment that was recognized on the aforementioned assets within our graphite electrode manufacturing business in the prior year. In addition, the decrease was also attributable to impairment recognized on an investment security held in our energy segment in the prior period.
Goodwill
increased
by
$402 million
to
$1,554 million
as at
December 31, 2017
, which was primarily due to the acquisitions of our fuel marketing business and Greenergy, as well as the positive effect of the fluctuations in the foreign exchange rates on the conversion of our construction services and facilities management operations' goodwill balances to USD. During the year ended
December 31, 2017
, these acquisitions generated goodwill of $315 million and there were no indicators of goodwill impairment since the acquisitions.
Gains on Acquisitions/Dispositions, net
For the year ended
December 31, 2017
, we recorded a net gain on dispositions of
$267 million
. These gains were primarily related to the sale of our bath and shower products manufacturing business in January 2017, in which we realized a gain of $233 million, or $84 million attributable to unitholders, net of taxes. We also disposed of public investment securities during the year ended
December 31, 2017
in our energy, business services and industrial operations segments for realized gains of approximately $50 million, or $12 million attributable to unitholders. These gains were partially offset by the loss on the sale of Insignia Energy in our energy segment during the year. For the year ended
December 31, 2016
, we recorded a net gain on dispositions of
$57 million
primarily related to the sale of corporate bonds and equity securities in our energy and industrial operations segments.
Other (Expenses) Income, net
For the year ended
December 31, 2017
, other expenses of
$108 million
primarily related to provisions taken in our construction services business and a decrease on the revaluation of an investment security and warrants within our energy segment during the year. Also included in other expenses for the year ended
December 31, 2017
were transaction costs incurred on the acquisitions and dispositions that were completed during the year, which were partially offset by unrealized gains on hedges in our Canadian energy operations and a bargain purchase gain recognized on an acquisition made by our Canadian well-servicing operations. For the year ended
December 31, 2016
, other expenses of
$11 million
primarily related to unrealized losses on the hedges in our Canadian energy operations, which were partially offset by derecognition gains related to the repurchase of bonds of our graphite electrode manufacturing business.
|
Brookfield Business Partners
|
64
|
Income Tax Expense
For the year ended
December 31, 2017
, current income tax expense was
$30 million
and deferred income tax recovery was
$22 million
, compared to a
$25 million
current income tax expense and a
$41 million
deferred income tax recovery in
2016
. The increase in total tax expense to $8 million for the year ended
December 31, 2017
compared to a total tax recovery of $16 million for the year ended
December 31, 2016
was primarily attributable to the higher taxable income for the year ended
December 31, 2017
, which attracted a higher tax expense when compared to the pre-tax net loss for the same period in the prior year.
Our effective tax rate for the year ended
December 31, 2017
was 3% (
2016
- 7%), while our composite income tax rate was 27% (
2016
- 27%). Our consolidated net income included income attributable to non-controlling ownership interests in flow through entities (for example, partnerships), while our consolidated tax provision includes only our proportionate share of the tax provision of these entities. This gave rise to a 17%
reduction in our effective tax rate. In addition, the capital gain incurred on the sale of an investment in our industrial operations segment was subject to a 50% inclusion rate, giving a further 6% reduction in our effective tax rate.
Comparison of the Years Ended
December 31, 2016
and
December 31, 2015
For the year ended
December 31, 2016
, we reported a net loss of
$202 million
, with
$29 million
of the net loss attributable to unitholders and the parent company. This was due to higher impairment expenses, lower gains on acquisitions and dispositions and lower other income for the year ended
December 31, 2016
compared to the same period in
2015
. During
2016
, we recognized a
$121 million
impairment expense in our industrial operations segment related to our graphite electrode manufacturing business and a $137 million impairment expense on an investment security within our energy segment. In addition, the decrease was partially attributable to lower realized natural gas prices and production in our Canadian energy operations relative to
2015
. This was partially offset by
$57 million
of one-time gains related to the sales of investment securities, and a higher contribution from our Western Australian energy operations during the year, which we had acquired in June 2015. This compares to net income of
$269 million
, with
$208 million
of net income attributable to the parent company for the year ended
December 31, 2015
. This was primarily attributable to
$269 million
of one-time gains related to the acquisitions made during
2015
, and other income of
$70 million
primarily related to deferred fee and interest income on a loan to our palladium mining operations prior to acquiring control of the business.
Revenue
For the year ended
December 31, 2016
, revenue increased by
$1,207 million
, to
$7,960 million
, compared to
$6,753 million
for the year ended
December 31, 2015
. The increase in revenue was driven by a higher level of activity in our construction services segment and a higher contribution from our business services segment due to the acquisition of our U.S. data center facilities manager, as well as the completion of onboarding of projects won early in the year in our facilities management business. In addition, our industrial operations segment benefited from the acquisitions of our palladium mining operation and our graphite electrode manufacturing business completed in the latter half of 2015. These increases were partially offset by a decrease in revenue in our energy segment as our Canadian energy operations were impacted by weaker natural gas prices during the year.
Direct Operating Costs
For the year ended
December 31, 2016
, direct operating costs increased by
$1,254 million
, to
$7,386 million
, compared to
$6,132 million
for the year ended
December 31, 2015
. The increase in direct operating costs was driven by higher contributions from our construction services, business services and industrial operations segments, which were in line with revenue increases, as described above.
General and Administrative Expenses
For the year ended
December 31, 2016
, G&A expenses increased by
$45 million
to
$269 million
from
$224 million
, primarily due to the acquisitions completed within our industrial operations segment in the latter half of 2015 as a full year of G&A expenses related to the operations was incurred during the year ended
December 31, 2016
. In addition,
G&A expenses increased due to the inclusion of management fees and corporate expenses of
$17 million
for the period related to post spin-off during the year ended
December 31, 2016
.
Depreciation and Amortization Expense
For the year ended
December 31, 2016
, depreciation and amortization expense increased by
$29 million
compared to the year ended
December 31, 2015
, largely as a result of the acquisition of our graphite electrode manufacturing business in August 2015. This increase was partially offset by a decrease in depletion expense in our Canadian energy operations resulting from an increase in the size of our reserve base.
|
65
|
Brookfield Business Partners
|
Interest Expense
For the year ended
December 31, 2016
, interest expense increased by
$25 million
when compared to the year ended
December 31, 2015
. This is primarily attributable to the increase in interest expense of
$19 million
in our industrial operations segment as a result of full year of interest expense associated with our graphite electrode manufacturing business acquired in August 2015.
Equity Accounted Income, net
For the year ended
December 31, 2016
, equity accounted income increased by
$64 million
relative to 2015. The income was largely contributed from our Western Australia energy operation, which we acquired in June 2015. The contribution from this operation increased as we realized gains on oil hedges and incurred lower exploration costs in 2016 when compared to the year ended
December 31, 2015
, which was partially offset by a reorganization and a partial sell down to institutional partners.
Impairment Expense, net
For the year ended
December 31, 2016
, impairment expense increased by
$166 million
when compared to the same period in 2015. In 2016,
we recognized impairment expenses of $121 million on the non-core assets held for sale within our graphite electrode manufacturing business in our industrial operations segment and of $137 million related to an investment security held in our energy segment. The increase is primarily due to a lower amount of impairment expense that was recognized in our business services segment on a public security and in our energy segment due to a weaker commodity price environment.
We invested, as part of a Brookfield-led consortium, in TCEH Corp., a merchant power generator in Texas, that had filed for bankruptcy protection. Compared to our cost, the trading price of our debt investment declined and was recorded as a mark to market adjustment through Other Comprehensive Income (‘‘OCI’’), which was reflected in our spin-off equity. In October 2016, TCEH Corp. emerged from bankruptcy as Vistra Energy Corp. and we received proceeds, including equity securities, in exchange for our debt. We fair value our equity securities and have released the historical mark to market loss from OCI to the statement of operating results, resulting in an impairment expense for the year ended 2016.
In April 2016, our graphite electrode manufacturing business within our industrial operations segment entered into a plan to sell certain of its non-core business and as such, the related assets and liabilities have all been classified as asset held for sale. The fair value of the business was determined utilizing the market approach and as a result, the partnership recorded $121 million of impairment charge for the year ended December 31, 2016 to align the carrying value with estimated fair value.
Goodwill increased by $28 million to $1,152 million as at
December 31, 2016
primarily due to the acquisition of our U.S. data center facilities management business and our facilities management business, as well as foreign currency movements. During the year ended
December 31, 2016
, our acquisitions generated goodwill of $39 million and there have been no indicators of goodwill impairment since the acquisitions.
Gains on Acquisitions/Dispositions, net
For the year ended
December 31, 2016
, we recorded net gains on dispositions of
$57 million
. These gains were primarily related to the disposition of corporate bonds and equity securities held as available for sale investments in our energy and industrial operations segments. During 2016, we acquired debt and equity securities at attractive valuations in businesses with high quality assets and solid long-term fundamentals and opportunistically exited the majority of these securities later in the year. For the year ended
December 31, 2015
, the gain on acquisition/dispositions was
$269 million
which was primarily attributable to the gain on the acquisition of oil and gas assets within our Canadian CBM platform and of our infrastructure support manufacturing business. In addition, we recorded a gain on the step-up acquisition of our facilities management business during 2015.
Other Income (Expenses), net
For the year ended
December 31, 2016
, other expenses of
$11 million
related to unrealized losses on the hedges in our Canadian energy operations and corporate expenses related to the spin-off in June 2016, which were partially offset by derecognition gains related to the repurchase of bonds of our graphite electrode manufacturing business.
For the year ended
December 31, 2015
, other income of
$70 million
primarily related to deferred fee and interest income on our loan investment to our palladium mining operation. Because we began consolidating this operation in 2016, the income was the result of the effective settlement of the preexisting; relationship on acquisition. Other income was also attributable to the revaluation gain recorded on Canadian dollar-denominated debt within our facilities management business.
|
Brookfield Business Partners
|
66
|
Income Tax Expense
For the year ended
December 31, 2016
, the current income tax expense was
$25 million
and the deferred income tax recovery was
$41 million
, compared to a
$49 million
current income tax expense and a
$5 million
deferred income tax expense for the same period in
2015
. The change in total tax recovery to $16 million for the year ended
December 31, 2016
compared to a total tax expense of $54 million for the year ended
December 31, 2015
was primarily attributable to the pre-tax net loss that occurred in 2016.
Our effective tax rate for the year ended
December 31, 2016
was 7% (
2015
- 17%), while our composite income tax rate was 27% (
2015
- 27%). The primary reason for the difference in the effective and composite income tax rate in
2016
was that no deferred tax asset was recognized for a portion of the losses in
2016
.
Summary of Results
Quarterly Results
Total revenues and net income (loss) for the eight most recent quarters were as follows:
|
(US$ Millions, except per unit amounts)
|
2017
|
2016
|
|||||||||||||||||||||||||||||
|
Q4
|
Q3
|
Q2
|
Q1
|
Q4
|
Q3
|
Q2
|
Q1
|
||||||||||||||||||||||||
|
Three months ended
|
|||||||||||||||||||||||||||||||
|
Revenues
|
$
|
8,379
|
|
$
|
7,640
|
|
$
|
4,870
|
|
$
|
1,934
|
|
$
|
2,232
|
|
$
|
2,043
|
|
$
|
2,008
|
|
$
|
1,677
|
|
|||||||
|
Direct operating costs
|
(8,034
|
)
|
(7,295
|
)
|
(4,673
|
)
|
(1,874
|
)
|
(2,064
|
)
|
(1,889
|
)
|
(1,865
|
)
|
(1,569
|
)
|
|||||||||||||||
|
General and administrative expenses
|
(107
|
)
|
(95
|
)
|
(76
|
)
|
(62
|
)
|
(72
|
)
|
(70
|
)
|
(64
|
)
|
(62
|
)
|
|||||||||||||||
|
Depreciation and amortization expense
|
(109
|
)
|
(109
|
)
|
(88
|
)
|
(65
|
)
|
(67
|
)
|
(71
|
)
|
(76
|
)
|
(72
|
)
|
|||||||||||||||
|
Interest expense
|
(67
|
)
|
(66
|
)
|
(50
|
)
|
(19
|
)
|
(19
|
)
|
(24
|
)
|
(23
|
)
|
(24
|
)
|
|||||||||||||||
|
Equity accounted income (loss), net
|
8
|
|
37
|
|
14
|
|
10
|
|
(7
|
)
|
28
|
|
20
|
|
27
|
|
|||||||||||||||
|
Impairment expense, net
|
(9
|
)
|
—
|
|
(23
|
)
|
(7
|
)
|
(155
|
)
|
—
|
|
(106
|
)
|
—
|
|
|||||||||||||||
|
Gain on acquisitions/dispositions
|
—
|
|
(14
|
)
|
9
|
|
272
|
|
—
|
|
29
|
|
28
|
|
—
|
|
|||||||||||||||
|
Other income (expense), net
|
(72
|
)
|
(41
|
)
|
(9
|
)
|
14
|
|
9
|
|
11
|
|
(21
|
)
|
(10
|
)
|
|||||||||||||||
|
Income (loss) before income tax
|
(11
|
)
|
57
|
|
(26
|
)
|
203
|
|
(143
|
)
|
57
|
|
(99
|
)
|
(33
|
)
|
|||||||||||||||
|
Current income tax (expense)/recovery
|
(11
|
)
|
(19
|
)
|
(4
|
)
|
4
|
|
(7
|
)
|
(8
|
)
|
(7
|
)
|
(3
|
)
|
|||||||||||||||
|
Deferred income tax (expense)/recovery
|
16
|
|
6
|
|
4
|
|
(4
|
)
|
16
|
|
3
|
|
15
|
|
7
|
|
|||||||||||||||
|
Net income (loss)
|
$
|
(6
|
)
|
$
|
44
|
|
$
|
(26
|
)
|
$
|
203
|
|
$
|
(134
|
)
|
$
|
52
|
|
$
|
(91
|
)
|
$
|
(29
|
)
|
|||||||
|
Attributable to:
|
|
||||||||||||||||||||||||||||||
|
Limited partners
(1)
|
$
|
(79
|
)
|
$
|
(8
|
)
|
$
|
(3
|
)
|
$
|
32
|
|
$
|
(5
|
)
|
$
|
9
|
|
$
|
(1
|
)
|
$
|
—
|
|
|||||||
|
Brookfield Asset Management Inc.
(2)
|
—
|
|
—
|
|
—
|
|
—
|
|
—
|
|
—
|
|
(30
|
)
|
(5
|
)
|
|||||||||||||||
|
Non-controlling interests attributable to:
|
|||||||||||||||||||||||||||||||
|
Redemption-Exchange Units held Brookfield Asset Management Inc.
(1)
|
(83
|
)
|
(8
|
)
|
(3
|
)
|
34
|
|
(6
|
)
|
11
|
|
(2
|
)
|
—
|
|
|||||||||||||||
|
Special limited partners
|
117
|
|
25
|
|
|
|
|
|
|
|
|
|
|
|
|
|
|||||||||||||||
|
Interest of others
|
39
|
|
35
|
|
(20
|
)
|
137
|
|
(123
|
)
|
32
|
|
(58
|
)
|
(24
|
)
|
|||||||||||||||
|
Net income (loss)
|
$
|
(6
|
)
|
$
|
44
|
|
$
|
(26
|
)
|
$
|
203
|
|
$
|
(134
|
)
|
$
|
52
|
|
$
|
(91
|
)
|
$
|
(29
|
)
|
|||||||
|
Basic and diluted earnings (loss) per limited partner unit
(3) (4) (5)
|
$
|
(1.25
|
)
|
$
|
(0.15
|
)
|
$
|
(0.06
|
)
|
$
|
0.61
|
|
$
|
(0.13
|
)
|
$
|
0.22
|
|
$
|
(0.03
|
)
|
|
|
||||||||
|
(1)
|
For the periods subsequent to June 20, 2016.
|
|
(2)
|
For the periods prior to June 20, 2016.
|
|
(3)
|
Average number of partnership units outstanding on a fully diluted time weighted average basis, assuming the exchange of redemption exchange units held by Brookfield Asset Management for limited partnership units, for the three months ended
December 31, 2017
was 129.0 million and for the three months ended
December 31, 2016
was 93.9 million.
|
|
(4)
|
Income (loss) attributed to limited partnership units on a fully diluted basis is reduced by incentive distributions paid to special limited partnership unitholders during the three months ended September 30, 2017 and
December 31, 2017
.
|
|
(5)
|
Comparative figures for the three months ended March 31, 2016 are not representative of performance, as units were spun out on June 20, 2016.
|
|
67
|
Brookfield Business Partners
|
Revenue and operating costs vary from quarter to quarter primarily due to acquisitions and dispositions of businesses, fluctuations in foreign exchange rates, business and economic cycles, and weather and seasonality in underlying operations. Broader economic factors and commodity market volatility, in particular, have a significant impact on a number of our operations, specifically within our energy and industrial operations segments. Seasonality primarily affects our business services operations. Some of our business services operations will typically have stronger performance in the latter half of the year whereas others, such as our fuel distribution business, will generate stronger performance in the second and third quarters. On a consolidated basis, we do not expect seasonality to materially influence our results. Our energy operations are also impacted by seasonality, usually generating stronger results in the first and fourth quarters. Net income is impacted by periodic gains and losses on acquisitions, monetizations and impairments.
Review of Consolidated Financial Position
The following is a summary of the consolidated statements of financial position as at
December 31, 2017
and
December 31, 2016
:
|
Change
|
||||||||||||
|
(US$ Millions)
|
December 31, 2017
|
December 31, 2016
|
December 2017 vs December 2016
|
|||||||||
|
Assets
|
|
|
||||||||||
|
Cash and cash equivalents
|
$
|
1,106
|
|
$
|
1,050
|
|
$
|
56
|
|
|||
|
Financial assets
|
784
|
|
539
|
|
245
|
|
||||||
|
Accounts receivable, net
|
4,362
|
|
1,797
|
|
2,565
|
|
||||||
|
Inventory and other assets
|
1,577
|
|
647
|
|
930
|
|
||||||
|
Assets held for sale
|
14
|
|
264
|
|
(250
|
)
|
||||||
|
Property, plant and equipment
|
2,530
|
|
2,096
|
|
434
|
|
||||||
|
Deferred income tax assets
|
174
|
|
111
|
|
63
|
|
||||||
|
Intangible assets
|
3,094
|
|
371
|
|
2,723
|
|
||||||
|
Equity accounted investments
|
609
|
|
166
|
|
443
|
|
||||||
|
Goodwill
|
1,554
|
|
1,152
|
|
402
|
|
||||||
|
Total assets
|
$
|
15,804
|
|
$
|
8,193
|
|
$
|
7,611
|
|
|||
|
Liabilities and equity in net assets
|
|
|
|
|||||||||
|
Liabilities
|
|
|
|
|||||||||
|
Accounts payable and other
|
$
|
5,638
|
|
$
|
2,457
|
|
$
|
3,181
|
|
|||
|
Liabilities associated with assets held for sale
|
—
|
|
66
|
|
(66
|
)
|
||||||
|
Borrowings
|
3,265
|
|
1,551
|
|
1,714
|
|
||||||
|
Deferred income tax liabilities
|
837
|
|
81
|
|
756
|
|
||||||
|
Total liabilities
|
$
|
9,740
|
|
$
|
4,155
|
|
$
|
5,585
|
|
|||
|
Equity
|
||||||||||||
|
Limited partners
|
$
|
1,585
|
|
$
|
1,206
|
|
$
|
379
|
|
|||
|
General partner
|
—
|
|
—
|
|
—
|
|
||||||
|
Brookfield Asset Management Inc.
|
—
|
|
—
|
|
—
|
|
||||||
|
Non-controlling interests attributable to:
|
|
|||||||||||
|
Redemption-Exchange Units, Preferred Shares and Special Limited Partnership Units held by Brookfield Asset Management Inc.
|
1,453
|
|
1,295
|
|
158
|
|
||||||
|
Interest of others in operating subsidiaries
|
3,026
|
|
1,537
|
|
1,489
|
|
||||||
|
Total equity
|
6,064
|
|
4,038
|
|
2,026
|
|
||||||
|
Total liabilities and equity
|
$
|
15,804
|
|
$
|
8,193
|
|
$
|
7,611
|
|
|||
|
Brookfield Business Partners
|
68
|
Financial Assets
Financial assets
increased
by
$245 million
from
$539 million
as at
December 31, 2016
, to
$784 million
as at
December 31, 2017
. The increase was primarily due to the acquisition of Greenergy and the promissory note and warrants that we acquired as part of our investment in Teekay Offshore, as well a secured loan made to an Indian homebuilding company in our business services segment during the year. The increase was partially offset by the disposition of investment securities in our energy segment.
The following table presents financial assets by segment as at
December 31, 2017
and
December 31, 2016
:
|
(US$ Millions)
|
Business
Services
|
Construction
Services
|
Industrial
Operations
|
Energy
|
Corporate
and Other
|
Total
|
||||||||||||||||||
|
December 31, 2017
|
$
|
385
|
|
$
|
53
|
|
$
|
21
|
|
$
|
325
|
|
$
|
—
|
|
$
|
784
|
|
||||||
|
December 31, 2016
|
$
|
128
|
|
$
|
70
|
|
$
|
17
|
|
$
|
324
|
|
$
|
—
|
|
$
|
539
|
|
||||||
Accounts Receivable
Accounts receivable
increased
by
$2,565 million
from
$1,797 million
as at
December 31, 2016
, to
$4,362 million
as at
December 31, 2017
. The increase was primarily related to
the acquisitions of BRK Ambiental and Greenergy
, which together accounted for
$2,056 million
of the increase. The increase was also due to improved performance in our graphite electrode manufacturing business and palladium mining operation, as well as higher activity in our construction services segment.
Inventory and Other Assets
Inventory and other assets
increased
by
$930 million
from
$647 million
as at
December 31, 2016
, to
$1,577 million
as at
December 31, 2017
. The change in the balance was primarily related to
the acquisitions of BRK Ambiental, Greenergy and our fuel marketing business
, which together accounted for $977 million of the increase. Greenergy's inventory and other assets balance included fuel inventories and Renewable Transport Fuel Obligation ("RTFO") certificates. RTFOs are generated on the blending of biofuel into the Greenergy fuel supplies, and these certificates can be sold to other oil companies. The increase was partially offset by a decrease in work in progress as projects progressed in our construction services segment.
Assets Held for Sale
Assets held for sale were
$14 million
as at
December 31, 2017
, compared to
$264 million
as at
December 31, 2016
. In January 2017, we closed the sale of our bath and shower products manufacturing operations which resulted in a decrease of assets held for sale of $171 million. Certain non-core assets within our graphite electrode manufacturing business were sold during the year which also contributed $70 million to the decrease. The balance as at
December 31, 2017
relates to property, plant and equipment assets held for sale within our infrastructure support products manufacturing business.
Property, Plant & Equipment
Property, plant and equipment ("PP&E") was primarily related to our industrial operations, business services and energy segments. The PP&E balance of
$2,530 million
as at
December 31, 2017
increased by
$434 million
when compared to
$2,096 million
as at
December 31, 2016
. The increase was primarily related to
the acquisitions of BRK Ambiental, Greenergy, and our fuel marketing business during the year,
which contributed an aggregate of $468 million to the balance as at
December 31, 2017
. The increase was partially offset by the decrease in PP&E as a result of the sale of Insignia Energy during the year.
Intangible Assets
Intangible assets were primarily related to our industrial operations and business services segments. Intangible assets
increased
by
$2,723 million
, from
$371 million
as at
December 31, 2016
, to
$3,094 million
as at
December 31, 2017
. The increase in intangible assets was primarily due to the
acquisitions completed in 2017. Specifically, the acquisition of BRK Ambiental added $2,366 million of intangible assets, primarily comprised of concession agreements; Greenergy added $224 million, primarily comprised of customer relationships and technology; and our fuel marketing business added $163 million, primarily related to a loyalty program.
Equity Accounted Investments
Equity accounted investments
increased
by
$443 million
, from
$166 million
as at
December 31, 2016
to
$609 million
as at
December 31, 2017
, primarily due to
the acquisition of our marine energy services business in September 2017.
|
69
|
Brookfield Business Partners
|
Goodwill
Goodwill
increased
by
$402 million
from
$1,152 million
as at
December 31, 2016
, to
$1,554 million
as at
December 31, 2017
. This increase was primarily due to the acquisitions of our fuel marketing business and Greenergy, as well as the positive impact from foreign exchange rate movements.
Accounts Payable and Other
Accounts payable and other
increased
by
$3,181 million
from
$2,457 million
as at
December 31, 2016
, to
$5,638 million
as at
December 31, 2017
. The increase was primarily related to
the acquisitions of BRK Ambiental, Greenergy
, and our fuel marketing business which increased the balance in aggregate by
$2,755 million
.
The Greenergy accounts payable balance included flow through taxes and duties payable to the government of the U.K.
In addition, higher activity in our construction services segment increased the balance by approximately $296 million.
Borrowings
Borrowings are discussed in Item 5.B. "Liquidity and Capital Resources".
Equity Attributable to Unitholders
As at
December 31, 2017
, our capital structure was comprised of two classes of partnership units, LP Units and GP Units. LP Units entitle the holder to their proportionate share of distributions. GP Units entitle the holder the right to govern our financial and operating policies. See Item 10.B., "Memorandum and Articles of Association — Description of our Units and our Limited Partnership Agreement".
Holding LP's capital structure is comprised of three classes of partnership units: Special LP Units, managing general partner units and Redemption-Exchange Units held by Brookfield. In its capacity as the holder of the Special LP units of Holding LP, the special limited partner is entitled to receive incentive distributions based on a 20% increase in the unit price of the partnership over an initial threshold. See Item 10.B, "Memorandum and Articles of Association — Description of the Holding LP Limited Partnership Agreement".
The Board of Directors approved a $48 million incentive distribution payment, or $12 million per Special LP unit,
to Brookfield, payable on February 28, 2018
, based on the volume weighted average price of $31.19 (exceeding the previous incentive distribution threshold of $29.34/unit) and the time weighted average of 129 million units outstanding for the fourth quarter of 2017. Going forward the incentive distribution threshold is $31.19/unit.
As part of the spin-off, Brookfield also subscribed for $15 million of preferred shares of our holding entities.
On August 11, 2017, the Toronto Stock Exchange accepted a notice filed by us of our intention to commence a normal course issuer bid, or NCIB, for our LP Units. Under the NCIB, our Board of Directors authorized us to repurchase up to 5% of the issued and outstanding units as at August 11, 2017, or 2,592,264 units. No repurchases have been made under the NCIB as at the date of this Form 20-F.
On September 26, 2017, the partnership issued 13,340,000 LP Units at a price of $30 per unit, for gross proceeds of approximately $400 million before equity issuance costs of $8 million. Concurrently, Holding LP issued 6,945,000 redemption-exchange units to Brookfield at $28.80 per unit for additional proceeds of approximately $200 million. The unit offering resulted in a decrease in Brookfield's ownership in the partnership from 75% to 69% before giving effect to the over-allotment option.
On October 26, 2017, the underwriters exercised their over-allotment option to purchase an additional 1,000,500 units at a price of $30.00 per unit, for gross proceeds of approximately $30 million less equity issuance costs of approximately $1 million. The over-allotment option resulted in a decrease in Brookfield's ownership in the partnership from 69% to 68%.
As at
December 31, 2017
and
December 31, 2016
, the total number of partnership units outstanding are as follows:
|
UNITS
|
December 31, 2017
|
December 31, 2016
|
||||
|
GP Units
|
4
|
|
4
|
|
||
|
LP Units
|
66,185,798
|
|
51,845,298
|
|
||
|
Non-controlling interests:
|
|
|
||||
|
Redemption-Exchange Units, held by Brookfield
|
63,095,497
|
|
56,150,497
|
|
||
|
Special LP Units
|
4
|
|
4
|
|
||
There have been no changes in partnership units since
December 31, 2017
.
|
Brookfield Business Partners
|
70
|
Segment Analysis
IFRS 8,
Operating Segments
, requires operating segments to be determined based on internal reports that are regularly reviewed by our chief operating decision maker, or CODM, for the purpose of allocating resources to the segment and to assessing its performance. The key measures used by the CODM in assessing performance and in making resource allocation decisions are funds from operations, or Company FFO and Company EBITDA. Company FFO is calculated as net income excluding the impact of depreciation and amortization, deferred income taxes, breakage and transaction costs, non-cash gains or losses and other items. Company FFO is presented net to unitholders, or net to parent company. When determining Company FFO, we include our proportionate share of Company FFO of equity accounted investments. Company FFO is considered a key measure of our financial performance and we use Company FFO to assess operating results and our business performance. Company FFO is further adjusted as Company EBITDA to exclude the impact of realized disposition gains (losses), interest expense, current income taxes, and realized disposition gains, current income taxes and interest expenses related to equity accounted investments. Company EBITDA is presented net to unitholders, or net to parent company. See "Reconciliation to Non-IFRS Measures" for a more fulsome discussion, including a reconciliation to the most directly comparable IFRS measures.
The following table presents Company EBITDA and Company FFO for the years ended
December 31, 2017
,
2016
and
2015
:
|
|
Year Ended December 31,
|
|||||||||||
|
(US$ Millions)
|
2017
|
2016
|
2015
|
|||||||||
|
Revenues
|
$
|
22,823
|
|
$
|
7,960
|
|
$
|
6,753
|
|
|||
|
Direct operating costs
|
(21,876
|
)
|
(7,386
|
)
|
(6,132
|
)
|
||||||
|
General and administrative expenses
|
(340
|
)
|
(269
|
)
|
(224
|
)
|
||||||
|
Equity accounted Company EBITDA
|
108
|
|
167
|
|
115
|
|
||||||
|
Company EBITDA attributable to others
(1)
|
(475
|
)
|
(232
|
)
|
(214
|
)
|
||||||
|
Company EBITDA
(2) (3)
|
$
|
240
|
|
$
|
240
|
|
$
|
298
|
|
|||
|
Realized disposition gains, net
|
244
|
|
57
|
|
40
|
|
||||||
|
Interest expense
|
(202
|
)
|
(90
|
)
|
(65
|
)
|
||||||
|
Realized disposition gain, current income taxes and interest expenses related to equity accounted investments
|
(17
|
)
|
(9
|
)
|
(11
|
)
|
||||||
|
Current income taxes
|
(30
|
)
|
(25
|
)
|
(49
|
)
|
||||||
|
Company FFO attributable to others (net of Company EBITDA attributable to others)
(1)
|
17
|
|
27
|
|
51
|
|
||||||
|
Company FFO
(2) (3)
|
$
|
252
|
|
$
|
200
|
|
$
|
264
|
|
|||
____________________________________
|
(1)
|
Attributable to interests of others in our operating subsidiaries.
|
|
(2)
|
Attributable to parent company prior to the spin-off on June 20, 2016, and to limited partnership unitholders, general partnership unitholders, redemption-exchange unitholders, and special limited partnership unitholders post spin-off.
For the year ended
December 31, 2017
, equity is also attributable to preferred shareholders and Special LP unitholders.
|
|
(3)
|
Company FFO is a non-IFRS measure and is calculated as net income excluding the impact of depreciation and amortization, deferred income taxes, breakage and transaction costs, non-cash gains or losses and other items. When determining Company FFO, we include our proportionate share of Company FFO of equity accounted investments. Company FFO is further adjusted as Company EBITDA to exclude the impact of realized disposition gains (losses), interest expense, current income taxes, and realized disposition gain, current income taxes and interest expenses related to equity accounted investments. Company EBITDA and Company FFO are presented net to unitholders. For further information on Company FFO and Company EBITDA see the “Reconciliation of Non IFRS Measures” section of the MD&A.
|
Comparison of the Years Ended
December 31, 2017
and
December 31, 2016
For the year ended
December 31, 2017
, we reported Company EBITDA of
$240 million
, consistent with the year ended
December 31, 2016
. Company EBITDA for the year ended
December 31, 2017
was primarily due to the contribution from our industrial operations segment, specifically BRK Ambiental which was acquired in April 2017, and improved pricing and operational performance at our graphite electrode manufacturing business and our palladium mining operation, which together, contributed $47 million to Company EBITDA. Our energy segment benefited from an additional contribution of $34 million to Company EBITDA from the acquisition of our marine energy services business in September 2017. Company EBITDA for the year ended
December 31, 2017
was partially offset by lower results in our construction services segment, a lower contribution from our financial advisory services business, and higher management and corporate expenses.
|
71
|
Brookfield Business Partners
|
For the year ended
December 31, 2017
, we reported Company FFO of
$252 million
, representing an increase of $
52 million
compared to the year ended
December 31, 2016
. Company FFO benefited from the disposition of our bath and shower products manufacturing business in January 2017, resulting in a realized gain of $233 million, or $84 million attributable to unitholders, net of taxes. We also disposed of public investment securities for realized gains of approximately $50 million, or $12 million attributable to unitholders. This was partially offset by the loss on the sale of Insignia Energy in our energy segment of $48 million, or $16 million attributable to unitholders net of taxes in August 2017, and the fact that Company FFO in the prior period benefited from $57 million in gains related to the sale of investment securities during the year ended
December 31, 2016
.
Comparison of the Years Ended
December 31, 2016
and
December 31, 2015
For the year ended
December 31, 2016
, we reported Company EBITDA of
$240 million
, a decrease of
$58 million
relative to the year ended
December 31, 2015
. Company EBITDA decreased due to lower margins at our construction services segment, and at our energy and other industrial operations segments, primarily due to weak commodity pricing. In addition, the inclusion of corporate and other expenses in the period after spin-off negatively impacted Company EBITDA relative to 2015.
For the year ended
December 31, 2016
, the partnership reported Company FFO of
$200 million
, a decrease of
$64 million
relative to the year ended
December 31, 2015
. The decrease in Company FFO was primarily attributable to lower net realized disposition gains on investment securities for the year ended
December 31, 2016
relative to the year ended
December 31, 2015
. In addition, interest expense increased by
$25 million
which was largely due to the acquisition of our graphite electrode manufacturing business in late 2015.
Business Services
The
following table presents
Company EBITDA and Company FFO for
our business services segment for the years ended
December 31, 2017
,
2016
and
2015
:
|
|
Year Ended December 31,
|
|||||||||||
|
(US$ Millions)
|
2017
|
2016
|
2015
|
|||||||||
|
Revenues
|
$
|
16,224
|
|
$
|
2,006
|
|
$
|
1,691
|
|
|||
|
Direct operating costs
|
(15,864
|
)
|
(1,818
|
)
|
(1,528
|
)
|
||||||
|
General and administrative expenses
|
(135
|
)
|
(98
|
)
|
(92
|
)
|
||||||
|
Equity accounted Company EBITDA
|
28
|
|
23
|
|
22
|
|
||||||
|
Company EBITDA attributable to others
(1)
|
(170
|
)
|
(44
|
)
|
(21
|
)
|
||||||
|
Company EBITDA
(2) (3)
|
$
|
83
|
|
$
|
69
|
|
$
|
72
|
|
|||
|
Realized disposition gains, net
|
17
|
|
—
|
|
40
|
|
||||||
|
Interest expense
|
(47
|
)
|
(14
|
)
|
(13
|
)
|
||||||
|
Realized disposition gain, current income taxes and interest expenses related to equity accounted investments
|
—
|
|
—
|
|
—
|
|
||||||
|
Current income taxes
|
(21
|
)
|
(12
|
)
|
(20
|
)
|
||||||
|
Company FFO attributable to others (net of Company EBITDA attributable to others)
(1)
|
34
|
|
11
|
|
4
|
|
||||||
|
Company FFO
(2) (3)
|
$
|
66
|
|
$
|
54
|
|
$
|
83
|
|
|||
|
Brookfield Business Partners
|
72
|
The following table presents equity attributable to unitholders for our business services segment as at
December 31, 2017
,
2016
and
2015
:
|
(US$ Millions)
|
December 31, 2017
|
December 31, 2016
|
December 31, 2015
|
|||||||||
|
Total assets
|
$
|
5,246
|
|
$
|
1,690
|
|
$
|
1,429
|
|
|||
|
Total liabilities
|
$
|
4,236
|
|
$
|
1,068
|
|
$
|
958
|
|
|||
|
Interests of others in operating subsidiaries
(1)
|
$
|
562
|
|
$
|
265
|
|
$
|
162
|
|
|||
|
Equity attributable to unitholders
(2)
|
448
|
|
357
|
|
309
|
|
||||||
|
Total equity
|
$
|
1,010
|
|
$
|
622
|
|
$
|
471
|
|
|||
____________________________________
|
(1)
|
Attributable to interests of others in our operating subsidiaries.
|
|
(2)
|
Attributable to parent company prior to the spin-off on June 20, 2016 , and to limited partnership unitholders, general partnership unitholders, redemption-exchange unitholders, and special limited partnership unitholders post spin-off.
For the year ended
December 31, 2017
, equity is also attributable to preferred shareholders and Special LP unitholders.
|
|
(3)
|
Company FFO is a non-IFRS measure and is calculated as net income excluding the impact of depreciation and amortization, deferred income taxes, breakage and transaction costs, non-cash gains or losses and other items. When determining Company FFO, we include our proportionate share of Company FFO of equity accounted investments. Company FFO is further adjusted as Company EBITDA to exclude the impact of realized disposition gains (losses), interest expense, current income taxes, and realized disposition gain, current income taxes and interest expenses related to equity accounted investments. Company EBITDA and Company FFO are presented net to unitholders. For further information on Company FFO and Company EBITDA see the “Reconciliation of Non IFRS Measures” section of the MD&A.
|
Comparison of the Years Ended
December 31, 2017
and
December 31, 2016
Revenue from our business services segment for the year ended
December 31, 2017
was
$16,224 million
, an increase of
$14,218 million
compared to revenues in the same period in
2016
of
$2,006 million
. Direct operating costs increased by
$14,046 million
, to
$15,864 million
for the year ended
December 31, 2017
, from
$1,818 million
in the same period in
2016
. The increase in revenue and direct costs was primarily due to our acquisition of Greenergy in the second quarter of 2017. Included in the revenue and direct operating costs for Greenergy is a duty payable to the government of the U.K. which is recorded gross within revenues and direct costs without impact on the margin generated by the business. For the year ended
December 31, 2017
, the duty element included in revenues and direct operating costs was approximately $5,036 million. In addition, the acquisition of our fuel marketing business and higher project volumes in our facilities management business contributed to both the increase in revenue and direct operating costs during the year.
Company EBITDA in our business services segment was
$14 million
higher for the year ended
December 31, 2017
when compared to the year ended
December 31, 2016
. During the year ended
December 31, 2017
, Company EBITDA increased due to the contributions from the acquisitions of Greenergy and our fuel marketing business during the second and third quarters of 2017, respectively. In addition, the increase in EBITDA was driven by a higher contribution from our facilities management business primarily due to the recent tuck-in acquisitions and the execution of new contracts during the year. The increase was partially offset by lower contributions from our financial advisory service business.
Company FFO in our business services segment was
$66 million
for the year ended
December 31, 2017
, representing an increase of
$12 million
from
$54 million
in
2016
. The increase in Company FFO was primarily due to the aforementioned acquisitions in the business services segment and the realized gains from the sale of investment securities during the first and second quarters of 2017. In addition, our relocation services business realized a small gain on the strategic sale of certain client contracts during the first quarter of 2017. The increase in Company FFO was partially offset by a higher interest expense due to increased borrowings related to the acquisition of Greenergy and by lower contributions from our financial advisory service business.
Maintenance and growth capital expenditures for the year ended
December 31, 2017
were
$19 million
and
$6 million
, respectively. Capital expenditures were primarily in Greenergy and our fuel marketing business, which were both acquired in 2017. These expenditures were immaterial for our business services segment for the year ended
December 31, 2016
as the businesses were generally not capital intensive.
|
73
|
Brookfield Business Partners
|
Comparison of the Years Ended
December 31, 2016
and
December 31, 2015
Revenue from the business services segment was
$2,006 million
for the year ended
December 31, 2016
, compared to
$1,691 million
for the year ended
December 31, 2015
. Direct operating costs increased to
$1,818 million
for the year ended
December 31, 2016
, from
$1,528 million
for the year ended
December 31, 2015
. The increase was primarily attributable to incremental revenue and direct operations costs from our existing customers in our facilities management business, as well as the acquisition of our U.S. data center facilities management business in the latter half of 2016. The increase was partially offset by lower activity and volumes in our residential real estate services business.
Company EBITDA for the year ended
December 31, 2016
in our business services segment was
$69 million
compared to
$72 million
for the year ended
December 31, 2015
. The decrease is primarily attributable to the costs incurred related to the acquisitions made within our facilities management business. This was partially offset by a higher contribution from our relocation services business as we implemented cost management initiatives, decreasing direct operating costs and general and administrative expenses.
During the year ended
December 31, 2016
, our business services segment generated Company FFO of
$54 million
compared to
$83 million
in for the same period in
2015
. The decrease was primarily due to the fact that Company FFO in the prior year benefited from $40 million of realized disposition gains from the sale of a portion of our facilities management business to institutional partners. The decrease was partially offset by lower current income taxes during the year which was driven primarily by the derecognition of deferred tax assets in our residential real estate services business.
Maintenance and growth capital expenditures were immaterial for the year ended
December 31, 2015
in our business services segment.
Construction Services
The
following table presents
Company EBITDA and Company FFO for
our construction services segment for the years ended
December 31, 2017
,
2016
and
2015
:
|
|
Year Ended December 31,
|
|||||||||||
|
(US$ Millions)
|
2017
|
2016
|
2015
|
|||||||||
|
Revenues
|
$
|
4,650
|
|
$
|
4,387
|
|
$
|
3,833
|
|
|||
|
Direct operating costs
|
(4,584
|
)
|
(4,235
|
)
|
(3,670
|
)
|
||||||
|
General and administrative expenses
|
(47
|
)
|
(48
|
)
|
(45
|
)
|
||||||
|
Equity accounted Company EBITDA
|
—
|
|
—
|
|
3
|
|
||||||
|
Company EBITDA attributable to others
(1)
|
1
|
|
—
|
|
(1
|
)
|
||||||
|
Company EBITDA
(2) (3)
|
$
|
20
|
|
$
|
104
|
|
$
|
120
|
|
|||
|
Realized disposition gains, net
|
2
|
|
—
|
|
—
|
|
||||||
|
Interest expense
|
—
|
|
(1
|
)
|
(2
|
)
|
||||||
|
Realized disposition gain, current income taxes and interest expenses related to equity accounted investments
|
—
|
|
—
|
|
—
|
|
||||||
|
Current income taxes
|
5
|
|
(8
|
)
|
(20
|
)
|
||||||
|
Company FFO attributable to others (net of Company EBITDA attributable to others)
(1)
|
(1
|
)
|
(1
|
)
|
—
|
|
||||||
|
Company FFO
(2) (3)
|
$
|
26
|
|
$
|
94
|
|
$
|
98
|
|
|||
|
Brookfield Business Partners
|
74
|
The following table presents equity attributable to unitholders for our construction services segment as at
December 31, 2017
,
2016
and
2015
:
|
(US$ Millions)
|
December 31, 2017
|
December 31, 2016
|
December 31, 2015
|
|||||||||
|
Total assets
|
$
|
2,653
|
|
$
|
2,275
|
|
$
|
2,125
|
|
|||
|
Total liabilities
|
$
|
1,694
|
|
$
|
1,389
|
|
$
|
1,372
|
|
|||
|
Interests of others in operating subsidiaries
(1)
|
$
|
—
|
|
$
|
9
|
|
$
|
8
|
|
|||
|
Equity attributable to unitholders
(2)
|
959
|
|
877
|
|
745
|
|
||||||
|
Total equity
|
$
|
959
|
|
$
|
886
|
|
$
|
753
|
|
|||
____________________________________
|
(1)
|
Attributable to interests of others in our operating subsidiaries.
|
|
(2)
|
Attributable to parent company prior to the spin-off on June 20, 2016, and to limited partnership unitholders, general partnership unitholders, redemption-exchange unitholders, and special limited partnership unitholders post spin-off.
For the year ended
December 31, 2017
, equity is also attributable to preferred shareholders and Special LP unitholders.
|
|
(3)
|
Company FFO is a non-IFRS measure and is calculated as net income excluding the impact of depreciation and amortization, deferred income taxes, breakage and transaction costs, non-cash gains or losses and other items. When determining Company FFO, we include our proportionate share of Company FFO of equity accounted investments. Company FFO is further adjusted as Company EBITDA to exclude the impact of realized disposition gains (losses), interest expense, current income taxes, and realized disposition gain, current income taxes and interest expenses related to equity accounted investments. Company EBITDA and Company FFO are presented net to unitholders. For further information on Company FFO and Company EBITDA see the “Reconciliation of Non IFRS Measures” section of the MD&A.
|
Comparison of the Years Ended
December 31, 2017
and
December 31, 2016
We continue to turn over a high volume of work across our global operations, resulting in revenue increasing by 6% to
$4,650 million
for the year ended
December 31, 2017
, compared to
$4,387 million
for the year ended
December 31, 2016
. The revenue contribution on a regional basis for the year ended
December 31, 2017
was as follows: Australia 54% (
2016
- 49%); Europe 32% (
2016
- 32%); the Middle East 13% (
2016
- 17%); and Other 1% (
2016
- 2%). Direct operating costs increased by
$349 million
to
$4,584 million
for the year ended
December 31, 2017
, compared to
$4,235 million
for the year ended
December 31, 2016
, primarily due to increased project costs.
For the year ended
December 31, 2017
, our construction services operations contributed Company EBITDA of
$20 million
compared to
$104 million
for the year ended
December 31, 2016
. The decrease was primarily due to the underperformance at select projects, all of which were either completed in 2017 or will be completed in the first half of 2018. Our operations in Australia and Europe maintained strong levels of activity, while we have been selectively scaling back our Middle East operations.
Company FFO for the year ended
December 31, 2017
was
$26 million
, representing a decrease of
$68 million
when compared to the year ended
December 31, 2016
. The decrease in Company FFO was primarily due to the factors mentioned above, which were partially offset by lower current tax expense during the year.
As at
December 31, 2017
, we had 95 active projects; our backlog remained strong at $8.7 billion (
2016
- $7.3 billion) and represented approximately 2.0 years of work. The business continues to win jobs at targeted margins, securing approximately $1.8 billion of new work in the fourth quarter, including two properties in Australia and one property in the Middle East. We are also in advanced negotiations on several large projects across our portfolio, and are preferred bidders on a substantial amount of work, which, if successful, will further bolster backlog levels throughout the remainder of the year.
Maintenance and growth capital expenditures for year ended
December 31, 2017
were
$1 million
and
$14 million
compared to
$12 million
and
$12 million
for the year ended
December 31, 2016
and predominantly consisted of equipment purchases for utilization on our construction projects across our regions.
Comparison of the Years Ended
December 31, 2016
and
December 31, 2015
Revenue in our construction services segment increased by 14% to
$4,387 million
for the year ended
December 31, 2016
, from
$3,833 million
for the year ended
December 31, 2015
. The increase is primarily due to increased operations in our U.K. and Australian operations, which was partially offset by negative foreign currency variation as a result of the depreciation on the British pound relative to the U.S. dollar. The revenue contribution on a regional basis for the year ended
December 31, 2016
was as follows: Australia 49% (
2015
- 52%); U.K. 32% (
2015
- 25%); the Middle East 17% (
2015
- 18%); and Other 2% (
2015
- 5%).
|
75
|
Brookfield Business Partners
|
Our construction services segment generated Company EBITDA of
$104 million
for the year ended
December 31, 2016
, compared to
$120 million
for the year ended
December 31, 2015
. The decrease is primarily attributable to a reduced margin on an Australian contract, incremental earnings in 2015 upon finalizing a project in the U.K. and the impact of a weaker British pound. In addition, general and administrative expenses increased marginally as we invested in our operations to manage our backlog and higher project activity. This was partially offset by the positive contribution from more work performed during 2016.
Company FFO was
$94 million
for the year ended
December 31, 2016
, compared to
$98 million
for the year ended
December 31, 2015
. The lower level of Company EBITDA recognized in the 2016 was partially offset by a reduction of cash taxes following the reorganization of our holding structure as part of the formation and spin-off of the partnership.
As at
December 31, 2016
, we had 106 active projects compared to 96 projects as at
December 31, 2015
. Our backlog remained consistent at $7.3 billion (
2015
: $7.3 billion) and represented approximately 1.7 years of work as the positive benefit of new projects was offset by additional work performed during the year and negative foreign currency exchange, primarily in our U.K. operations. We also continue to win work at targeted margins in Australia and the Middle East.
Maintenance and growth capital expenditures for the year ended
December 31, 2015
were relatively minimal in our construction services segment.
|
Brookfield Business Partners
|
76
|
Industrial Operations
The
following table presents
Company EBITDA and Company FFO for
our industrial operations segment for the years ended
December 31, 2017
,
2016
and
2015
:
|
|
Year Ended December 31,
|
|||||||||||
|
(US$ Millions)
|
2017
|
2016
|
2015
|
|||||||||
|
Revenues
|
$
|
1,662
|
|
$
|
1,280
|
|
$
|
892
|
|
|||
|
Direct operating costs
|
(1,228
|
)
|
(1,160
|
)
|
(744
|
)
|
||||||
|
General and administrative expenses
|
(93
|
)
|
(89
|
)
|
(67
|
)
|
||||||
|
Equity accounted Company EBITDA
|
1
|
|
—
|
|
—
|
|
||||||
|
Company EBITDA attributable to others
(1)
|
(255
|
)
|
(20
|
)
|
(57
|
)
|
||||||
|
Company EBITDA
(2) (3)
|
$
|
87
|
|
$
|
11
|
|
$
|
24
|
|
|||
|
Realized disposition gains, net
|
237
|
|
32
|
|
—
|
|
||||||
|
Interest expense
|
(128
|
)
|
(44
|
)
|
(25
|
)
|
||||||
|
Realized disposition gain, current income taxes and interest expenses related to equity accounted investments
|
—
|
|
—
|
|
—
|
|
||||||
|
Current income taxes
|
(28
|
)
|
(4
|
)
|
(8
|
)
|
||||||
|
Company FFO attributable to others (net of Company EBITDA attributable to others)
(1)
|
(36
|
)
|
11
|
|
23
|
|
||||||
|
Company FFO
(2) (3)
|
$
|
132
|
|
$
|
6
|
|
$
|
14
|
|
|||
The following table presents equity attributable to unitholders for our industrial operations segment as at
December 31, 2017
,
2016
and
2015
:
|
(US$ Millions)
|
December 31, 2017
|
December 31, 2016
|
December 31, 2015
|
|||||||||
|
Total assets
|
$
|
5,839
|
|
$
|
2,047
|
|
$
|
2,214
|
|
|||
|
Total liabilities
|
$
|
3,189
|
|
$
|
895
|
|
$
|
1,124
|
|
|||
|
Interests of others in operating subsidiaries
(1)
|
$
|
1,989
|
|
$
|
780
|
|
$
|
672
|
|
|||
|
Equity attributable to unitholders
(2)
|
661
|
|
372
|
|
418
|
|
||||||
|
Total equity
|
$
|
2,650
|
|
$
|
1,152
|
|
$
|
1,090
|
|
|||
____________________________________
|
(1)
|
Attributable to interests of others in our operating subsidiaries.
|
|
(2)
|
Attributable to parent company prior to the spin-off on June 20, 2016, and to limited partnership unitholders, general partnership unitholders, redemption-exchange unitholders, and special limited partnership unitholders post spin-off.
For the year ended
December 31, 2017
, equity is also attributable to preferred shareholders and Special LP unitholders.
|
|
(3)
|
Company FFO is a non-IFRS measure and is calculated as net income excluding the impact of depreciation and amortization, deferred income taxes, breakage and transaction costs, non-cash gains or losses and other items. When determining Company FFO, we include our proportionate share of Company FFO of equity accounted investments. Company FFO is further adjusted as Company EBITDA to exclude the impact of realized disposition gains (losses), interest expense, current income taxes, and realized disposition gain, current income taxes and interest expenses related to equity accounted investments. Company EBITDA and Company FFO are presented net to unitholders. For further information on Company FFO and Company EBITDA see the “Reconciliation of Non IFRS Measures” section of the MD&A.
|
Comparison of the Years Ended
December 31, 2017
and
December 31, 2016
Revenue from our industrial operations segment for the year ended
December 31, 2017
was
$1,662 million
, representing an increase of
$382 million
compared to the same period in
2016
of
$1,280 million
. Direct operating costs increased by
$68 million
, to
$1,228 million
for the year ended
December 31, 2017
, from
$1,160 million
in the same period in
2016
. The increase in revenue and direct operating costs was primarily due to our acquisition of BRK Ambiental, partially offset by the sale of our bath and shower products manufacturing business in January 2017, which had contributed $306 million of revenue and $245 million of direct operating costs for the year ended
December 31, 2016
. The remaining increases in revenue and direct operating costs were due to stronger pricing and operational performance at our graphite electrode manufacturing business and our palladium mining operation.
|
77
|
Brookfield Business Partners
|
Company EBITDA in our industrial operations segment increased by
$76 million
for the year ended
December 31, 2017
, compared to the year ended
December 31, 2016
. The increase was primarily due to the acquisition of BRK Ambiental, stronger pricing and operational performance at our graphite electrode manufacturing business and palladium mining operation during the year. This was partially offset by the sale of our bath and shower products manufacturing business which had contributed $12 million to Company EBITDA during the year ended
December 31, 2016
.
Company FFO in our industrial operations segment was
$132 million
for the year ended
December 31, 2017
, compared to
$6 million
for the year ended
December 31, 2016
. In addition to the factors noted above, the increase was primarily due to the net gain of $84 million attributable to unitholders resulting from the sale of our bath and shower products manufacturing business in January 2017. The increase was partially offset by the increase in interest expense due to the acquisition of BRK Ambiental during the year.
Maintenance and growth capital expenditures, including capital expenditures related to mineral properties within our palladium mining operation and to intangible assets related to concession agreements within BRK Ambiental, for the year ended
December 31, 2017
were
$69 million
and
$104 million
respectively, compared to
$72 million
and
$8 million
for the year ended
December 31, 2016
. Capital expenditures were also incurred within our graphite electrode manufacturing business.
Comparison of the Years Ended
December 31, 2016
and
December 31, 2015
Revenue for other industrial operations for the year ended
December 31, 2016
, was
$1,280 million
, representing an increase of
$388 million
compared to
$892 million
for the year ended
December 31, 2015
. Direct operating costs increased by $416 million to
$1,160 million
in
2016
from
$744 million
in
2015
. The increases in revenues and direct operating costs were primarily related to a full year of accounting for the acquisitions completed in 2015. In June 2015, we completed the acquisition of our infrastructure support products manufacturing business as a result of a recapitalization whereby our debt position was converted into an equity interest in the business. In August 2015, we completed the acquisition of our graphite electrode manufacturing business.
During the year ended
December 31, 2016
, our industrial operations segment generated Company EBITDA of
$11 million
, compared to
$24 million
in
2015
. The decrease in Company EBITDA was primarily attributable to a lower contribution from our graphite electrode manufacturing business due to the oversupply and downward price pressure in the steel market. We have since then sold non-core assets and implemented operational improvements in the business in order to return to positive contributions to Company EBITDA. In addition, Company EBITDA for the year ended
December 31, 2015
benefited from a higher contribution from our infrastructure support products manufacturing business as a result of a prolonged annual business cycle due to unusually warm weather in 2015. The decrease in Company EBITDA was partially offset by a higher contribution from our bath and shower product manufacturing business relative to 2015 due to price increases and cost reductions.
During the year ended
December 31, 2016
, our industrial operations segment generated Company FFO of
$6 million
, compared to
$14 million
in
2015
.
Company FFO for the year ended
December 31, 2016
benefited from realized gains on the disposition of public security investments. This was partially offset by a higher interest expense in our graphite electrode manufacturing business as 2015 only represented a partial year of operations.
Maintenance and growth capital expenditures, including capital expenditures related to mineral properties within our palladium mining operation, for the year ended
December 31, 2016
were
$72 million
and
$8 million
respectively, compared to $35 million and $2 million for the year ended
December 31, 2015
. Capital expenditures were primarily in our graphite electrode manufacturing and palladium mining operations.
|
Brookfield Business Partners
|
78
|
Energy
The
following table presents
Company EBITDA and Company FFO for
our energy segment for the years ended
December 31, 2017
,
2016
and
2015
:
|
|
Year Ended December 31,
|
|||||||||||
|
(US$ Millions)
|
2017
|
2016
|
2015
|
|||||||||
|
Revenues
|
$
|
280
|
|
$
|
286
|
|
$
|
337
|
|
|||
|
Direct operating costs
|
(197
|
)
|
(173
|
)
|
(190
|
)
|
||||||
|
General and administrative expenses
|
(20
|
)
|
(17
|
)
|
(20
|
)
|
||||||
|
Equity accounted Company EBITDA
|
79
|
|
144
|
|
90
|
|
||||||
|
Company EBITDA attributable to others
(1)
|
(51
|
)
|
(168
|
)
|
(135
|
)
|
||||||
|
Company EBITDA
(2) (3)
|
$
|
91
|
|
$
|
72
|
|
$
|
82
|
|
|||
|
Realized disposition gains (loss), net
|
(12
|
)
|
25
|
|
—
|
|
||||||
|
Interest expense
|
(26
|
)
|
(30
|
)
|
(25
|
)
|
||||||
|
Realized disposition gain, current income taxes and interest expenses related to equity accounted investments
|
(17
|
)
|
(9
|
)
|
(11
|
)
|
||||||
|
Current income taxes
|
(4
|
)
|
(1
|
)
|
(1
|
)
|
||||||
|
Company FFO attributable to others (net of Company EBITDA attributable to others)
(1)
|
20
|
|
6
|
|
24
|
|
||||||
|
Company FFO
(2) (3)
|
$
|
52
|
|
$
|
63
|
|
$
|
69
|
|
|||
The following table presents equity attributable to unitholders for our energy segment as at
December 31, 2017
,
2016
and
2015
:
|
(US$ Millions)
|
December 31, 2017
|
December 31, 2016
|
December 31, 2015
|
|||||||||
|
Total assets
|
$
|
1,671
|
|
$
|
1,596
|
|
$
|
1,867
|
|
|||
|
Total liabilities
|
$
|
536
|
|
$
|
769
|
|
$
|
1,097
|
|
|||
|
Interests of others in operating subsidiaries
(1)
|
$
|
475
|
|
$
|
483
|
|
$
|
455
|
|
|||
|
Equity attributable to unitholders
(2)
|
660
|
|
344
|
|
315
|
|
||||||
|
Total equity
|
$
|
1,135
|
|
$
|
827
|
|
$
|
770
|
|
|||
____________________________________
|
(1)
|
Attributable to interests of others in our operating subsidiaries.
|
|
(2)
|
Attributable to parent company prior to the spin-off on June 20, 2016, and to limited partnership unitholders, general partnership unitholders, redemption-exchange unitholders, and special limited partnership unitholders post spin-off.
For the year ended
December 31, 2017
, equity is also attributable to preferred shareholders and Special LP unitholders.
|
|
(3)
|
Company FFO is a non-IFRS measure and is calculated as net income excluding the impact of depreciation and amortization, deferred income taxes, breakage and transaction costs, non-cash gains or losses and other items. When determining Company FFO, we include our proportionate share of Company FFO of equity accounted investments. Company FFO is further adjusted as Company EBITDA to exclude the impact of realized disposition gains (losses), interest expense, current income taxes, and realized disposition gain, current income taxes and interest expenses related to equity accounted investments. Company EBITDA and Company FFO are presented net to unitholders. For further information on Company FFO and Company EBITDA see the “Reconciliation of Non IFRS Measures” section of the MD&A.
|
Comparison of the Years Ended
December 31, 2017
and
December 31, 2016
Revenue from our energy segment for the year ended
December 31, 2017
was $
280 million
, representing a decrease of $
6 million
, while direct operating costs increased by $
24 million
, to $
197 million
, when compared to the same period in
2016
. The decrease in revenue was primarily due to a $23 million decrease from the lower interest income from a corporate bond investment which was converted to an equity position in October 2016. The decrease was partially offset by an increase in volumes in our Canadian well-servicing operations, which increased both revenues and direct costs and higher realized prices compared to prior year in our Canadian energy operations. Our realized natural gas pricing was 26% higher during the year ended
December 31, 2017
, compared to the year ended
December 31, 2016
due to our hedging program.
|
79
|
Brookfield Business Partners
|
Company EBITDA in our energy segment was $
91 million
for the year ended
December 31, 2017
compared to $
72 million
for the year ended
December 31, 2016
. Our energy segment benefited from the acquisition of our marine energy services business during the third quarter of 2017, as well as a higher contribution from our Canadian energy operations when compared to the prior year. The increase in Company EBITDA was partially offset by the reorganization of the ownership group and partial sell down to institutional partners of our Western Australian energy operations in the latter half of 2016.
Company FFO in our energy segment was $
52 million
for the year ended
December 31, 2017
compared to $
63 million
for the year ended
December 31, 2016
. In addition to the decrease in Company EBITDA, Company FFO decreased further due to the loss on the sale of Insignia Energy in August 2017 and the fact that 2016 benefited from net gains realized on the disposition of investment securities.
Our consolidated energy operations, excluding equity accounted investments, had maintenance and growth capital expenditures for the year ended
December 31, 2017
of
$24 million
and $
nil
, respectively, compared to
$22 million
and $
nil
, respectively, in the same period in
2016
.
Comparison of the Years Ended
December 31, 2016
and
December 31, 2015
Revenue from the energy segment was
$286 million
for the year ended
December 31, 2016
, compared to
$337 million
for the year ended
December 31, 2015
. Direct operating costs decreased to
$173 million
for the year ended
December 31, 2016
, from
$190 million
for the year ended
December 31, 2015
. The decrease in performance was largely due to lower revenues in our Canadian energy operations due to reduced pricing and consistent average annual production. Our realized natural gas pricing and average annual production were 34% and 2% lower in 2016 compared to 2015, respectively.
During the year ended
December 31, 2016
, our energy segment generated Company EBITDA of
$72 million
, compared to
$82 million
in
2015
. The decrease in Company EBITDA is primarily due to the aforementioned lower contributions from our Canadian energy operations, partially offset by an increase in contributions to Company EBITDA from our Western Australian energy operations which benefited from a full year of operations in 2016.
During the year ended
December 31, 2016
, our energy segment generated Company FFO of
$63 million
, compared to
$69 million
in
2015
. The decrease in Company FFO was primarily attributable to the aforementioned lower results in our Canadian energy operations, as well as higher interest expense in the business. The decrease was partially offset by a higher realized gain on disposition of corporate bonds held as available for sale investments. During 2016, we acquired high yield debt at attractive valuations in businesses with high quality assets and solid long-term fundamentals and opportunistically exited the majority of these securities later in the year.
Our consolidated energy operations, excluding equity accounted investments, had maintenance and growth capital expenditures for the year ended
December 31, 2016
of
$22 million
and $
nil
, respectively, compared to $42 million and $11 million, respectively, in the same period in
2015
. Capital expenditures in our Canadian energy operations were curtailed in 2016 as a result of the downturn in the oil and gas industry that started in 2015.
|
Brookfield Business Partners
|
80
|
Corporate and Other
The
following table presents
Company EBITDA and Company FFO for
our corporate and other segment for the years ended
December 31, 2017
,
2016
and
2015
:
|
|
Year Ended December 31,
|
|||||||||||
|
(US$ Millions)
|
2017
|
2016
|
2015
|
|||||||||
|
Revenues
|
$
|
7
|
|
$
|
1
|
|
$
|
—
|
|
|||
|
Direct operating costs
|
(3
|
)
|
—
|
|
—
|
|
||||||
|
General and administrative expenses
|
(45
|
)
|
(17
|
)
|
—
|
|
||||||
|
Equity accounted Company EBITDA
|
—
|
|
—
|
|
—
|
|
||||||
|
Company EBITDA attributable to others
(1)
|
—
|
|
—
|
|
—
|
|
||||||
|
Company EBITDA
(2) (3)
|
$
|
(41
|
)
|
$
|
(16
|
)
|
$
|
—
|
|
|||
|
Realized disposition gains, net
|
—
|
|
—
|
|
—
|
|
||||||
|
Interest expense
|
(1
|
)
|
(1
|
)
|
—
|
|
||||||
|
Realized disposition gain, current income taxes and interest expenses related to equity accounted investments
|
—
|
|
—
|
|
—
|
|
||||||
|
Current income taxes
|
18
|
|
—
|
|
—
|
|
||||||
|
Company FFO attributable to others (net of Company EBITDA attributable to others)
(1)
|
—
|
|
—
|
|
—
|
|
||||||
|
Company FFO
(2) (3)
|
$
|
(24
|
)
|
$
|
(17
|
)
|
$
|
—
|
|
|||
The following table presents equity attributable to unitholders for our corporate and other segment as at
December 31, 2017
,
2016
and
2015
:
|
(US$ Millions)
|
December 31, 2017
|
December 31, 2016
|
December 31, 2015
|
|||||||||
|
Total assets
|
$
|
395
|
|
$
|
585
|
|
$
|
—
|
|
|||
|
Total liabilities
|
$
|
85
|
|
$
|
34
|
|
$
|
—
|
|
|||
|
Interests of others in operating subsidiaries
(1)
|
—
|
|
—
|
|
—
|
|
||||||
|
Equity attributable to unitholders
(2)
|
310
|
|
551
|
|
—
|
|
||||||
|
Total equity
|
$
|
310
|
|
$
|
551
|
|
$
|
—
|
|
|||
____________________________________
|
(1)
|
Attributable to interests of others in our operating subsidiaries.
|
|
(2)
|
Attributable to parent company prior to the spin-off on June 20, 2016, and to limited partnership unitholders, general partnership unitholders, redemption-exchange unitholders, and special limited partnership unitholders post spin-off.
For the year ended
December 31, 2017
, equity is also attributable to preferred shareholders and Special LP unitholders.
|
|
(3)
|
Company FFO is a non-IFRS measure and is calculated as net income excluding the impact of depreciation and amortization, deferred income taxes, breakage and transaction costs, non-cash gains or losses and other items. When determining Company FFO, we include our proportionate share of Company FFO of equity accounted investments. Company FFO is further adjusted as Company EBITDA to exclude the impact of realized disposition gains (losses), interest expense, current income taxes, and realized disposition gain, current income taxes and interest expenses related to equity accounted investments. Company EBITDA and Company FFO are presented net to unitholders. For further information on Company FFO and Company EBITDA see the “Reconciliation of Non IFRS Measures” section of the MD&A.
|
Pursuant to our Master Services Agreement, we pay Brookfield a quarterly base management fee equal to 0.3125% (1.25% annually) of our total capitalization, plus third party debt with recourse, net of cash held by corporate entities. The management fees for the year ended
December 31, 2017
,
2016
and
2015
were
$33 million
,
$12 million
and nil, respectively. General and administrative costs relate to corporate expenses, including audit and director fees. The increase was due to the fact that the years ended
December 31, 2017
and
December 31, 2016
represented a full year and a 194-day period post spin-off, respectively.
The partnership has in place a Deposit Agreement with Brookfield whereby it may place funds on deposit with Brookfield as approved by the Board of Directors. Any deposit balance is due on demand and earns an agreed upon rate of interest based on market terms. As at
December 31, 2017
, the amount of the deposit was
$384 million
and was included in cash and cash equivalents.
|
81
|
Brookfield Business Partners
|
Reconciliation of Non-IFRS Measures
Company FFO
To measure our performance, amongst other measures, we focus on Company FFO. We define Company FFO as net income excluding the impact of depreciation and amortization, deferred income taxes, breakage and transaction costs, non-cash valuation gains or losses and other items. Company FFO is presented net to unitholders, or net to the parent company. Company FFO is a measure of operating performance that is not calculated in accordance with, and does not have any standardized meaning prescribed by, IFRS. Company FFO is therefore unlikely to be comparable to similar measures presented by other issuers. Company FFO has the following limitations as an analytical tool:
|
•
|
Company FFO does not include depreciation and amortization expense; because we own capital assets with finite lives, depreciation and amortization expense recognizes the fact that we must maintain or replace our asset base in order to preserve our revenue generating capability;
|
|
•
|
Company FFO does not include deferred income taxes, which may become payable if we own our assets for a long period of time; and
|
|
•
|
Company FFO does not include any non-cash fair value adjustments or mark-to-market adjustments recorded to net income.
|
Because of these limitations, Company FFO should not be considered as the sole measure of our performance and should not be considered in isolation from, or as a substitute for, analysis of our results as reported under IFRS. However, Company FFO is a key measure that we use to evaluate the performance of our operations.
When viewed with our IFRS results, we believe that Company FFO provides a more complete understanding of factors and trends affecting our underlying operations, including the impact of borrowing. Company FFO allows us to evaluate our businesses on the basis of cash return on invested capital by removing the effect of non-cash and other items. We add back depreciation and amortization as the depreciated cost base of our assets is reflected in the ultimate realized disposition gain or loss on disposal. We add back deferred income taxes because we do not believe this item reflects the present value of the actual cash tax obligations we will be required to pay, particularly if our operations are held for a long period of time. We add back non-cash valuation gains or losses recorded in net income as these are non-cash in nature and indicate a point in time approximation of value on long-term items. We also add back breakage and transaction costs as they are capital in nature.
Company EBITDA
We also use Company EBITDA as a measure of performance. We define Company EBITDA as Company FFO excluding the impact of realized disposition gains, interest expense, current income taxes, realized disposition gains, current income taxes and interest expense related to equity accounted investments. Company EBITDA is presented net to unitholders, or net to the parent company. Company EBITDA has limitations as an analytical tool as it does not include realized disposition gains, interest expense, and current income taxes, as well as depreciation and amortization expense, deferred income taxes and non-cash valuation gains/losses and impairment charges. Because of these limitations, Company EBITDA should not be considered as the sole measure of our performance and should not be considered in isolation from, or as a substitute for, analysis of our results as reported under IFRS. However, Company EBITDA is a key measure that we use to evaluate the performance of our operations.
When viewed with our IFRS results, we believe that Company EBITDA provides a more complete understanding of the ability of our businesses to generate recurring earnings which allows users to better understand and evaluate the underlying financial performance of our operations.
|
Brookfield Business Partners
|
82
|
The following table reconciles Company EBITDA and Company FFO to net income attributable to unitholders for the periods indicated:
|
|
Year Ended December 31,
|
|||||||||||
|
(US$ Millions)
|
2017
|
2016
|
2015
|
|||||||||
|
Revenues
|
$
|
22,823
|
|
$
|
7,960
|
|
$
|
6,753
|
|
|||
|
Direct operating costs
|
(21,876
|
)
|
(7,386
|
)
|
(6,132
|
)
|
||||||
|
General and administrative expenses
|
(340
|
)
|
(269
|
)
|
(224
|
)
|
||||||
|
Equity accounted investment Company EBITDA
(1)
|
108
|
|
167
|
|
115
|
|
||||||
|
Company EBITDA attributable to others
(2)
|
(475
|
)
|
(232
|
)
|
(214
|
)
|
||||||
|
Company EBITDA
|
$
|
240
|
|
$
|
240
|
|
$
|
298
|
|
|||
|
Realized disposition gain, net
(4)
|
244
|
|
57
|
|
40
|
|
||||||
|
Interest expense
|
(202
|
)
|
(90
|
)
|
(65
|
)
|
||||||
|
Equity accounted current taxes and interest
(1)
|
(17
|
)
|
(9
|
)
|
(11
|
)
|
||||||
|
Current income taxes
|
(30
|
)
|
(25
|
)
|
(49
|
)
|
||||||
|
Company FFO attributable to others
(2)
|
17
|
|
27
|
|
51
|
|
||||||
|
Company FFO
|
$
|
252
|
|
$
|
200
|
|
$
|
264
|
|
|||
|
Depreciation and amortization
|
(371
|
)
|
(286
|
)
|
(257
|
)
|
||||||
|
Realized disposition (gain)/loss recorded in prior periods
(4)
|
23
|
|
—
|
|
—
|
|
||||||
|
Impairment expense, net
|
(39
|
)
|
(261
|
)
|
(95
|
)
|
||||||
|
Gain on acquisition and disposition
|
—
|
|
—
|
|
229
|
|
||||||
|
Other income (expenses), net
|
(108
|
)
|
(11
|
)
|
70
|
|
||||||
|
Deferred income taxes
|
22
|
|
41
|
|
(5
|
)
|
||||||
|
Non-cash items attributable to equity accounted investments
(1)
|
(22
|
)
|
(90
|
)
|
(100
|
)
|
||||||
|
Non-cash items attributable to others
(2)
|
267
|
|
378
|
|
102
|
|
||||||
|
Net income attributable to unitholders
(3)
|
$
|
24
|
|
$
|
(29
|
)
|
$
|
208
|
|
|||
____________________________________
|
(1)
|
The sum of these amounts equates to equity accounted income of
$69 million
, as per our IFRS statement of operating results for year ended
December 31, 2017
, equity accounted income of
$68 million
for the year ended
December 31, 2016
and equity accounted income of
$4 million
for the year ended
December 31, 2015
.
|
|
(2)
|
Total cash and non-cash items attributable to the interest of others equals net income of
$191 million
, as per our IFRS statement of operating results for year ended
December 31, 2017
, net loss of
$173 million
for the year ended
December 31, 2016
and net income of
$61 million
for the year ended
December 31, 2015
.
|
|
(3)
|
Attributable to LP unitholders, GP unitholders, Redemption-Exchange unitholders, and Special LP unitholders post spin-off, and to parent company prior to the spin-off.
|
|
(4)
|
The sum of these amounts equates to net realized disposition gain of
$267 million
, as per our IFRS statement of operating results for year ended
December 31, 2017
, net realized disposition gain of
$57 million
for the year ended
December 31, 2016
and net realized disposition gain of
$269 million
for the year ended
December 31, 2015
.
|
The following table reconciles equity attributable to LP Units, GP Units, Redemption-Exchange Units, preferred shares and Special LP units to equity attributable to unitholders for the periods indicated:
|
Years ended December 31
|
||||||||
|
(US$ Millions)
|
2017
|
2016
|
||||||
|
Limited partners
|
$
|
1,585
|
|
$
|
1,206
|
|
||
|
General partner
|
—
|
|
—
|
|
||||
|
Non-controlling interests attributable to:
|
|
|
|
|
||||
|
Redemption-Exchange Units, Preferred Shares and Special LP Units held by Brookfield
|
1,453
|
|
1,295
|
|
||||
|
Equity attributable to unitholders
(1)
|
$
|
3,038
|
|
$
|
2,501
|
|
||
|
83
|
Brookfield Business Partners
|
The following table presents equity attributable to unitholders by segment as at
December 31, 2017
and
December 31, 2016
:
|
(US$ Millions)
|
Business
Services
|
Construction
Services
|
Industrial
Operations
|
Energy
|
Corporate
and Other
|
Total
|
||||||||||||||||||
|
December 31, 2017
|
$
|
448
|
|
$
|
959
|
|
$
|
661
|
|
$
|
660
|
|
$
|
310
|
|
$
|
3,038
|
|
||||||
|
December 31, 2016
|
$
|
357
|
|
$
|
877
|
|
$
|
372
|
|
$
|
344
|
|
$
|
551
|
|
$
|
2,501
|
|
||||||
___________________________________
|
(1)
|
Attributable to parent company prior to the spin-off on June 20, 2016, and to limited partnership unitholders, general partnership unitholders, redemption-exchange unitholders, and special limited partnership unitholders post spin-off.
For the year ended
December 31, 2017
, equity is also attributable to preferred shareholders and Special LP unitholders.
|
5.B. LIQUIDITY AND CAPITAL RESOURCES
We manage our liquidity and capital requirements through cash flows from operations, opportunistically monetizing mature operations, refinancing existing debt and businesses and through the use of credit facilities. We aim to maintain sufficient financial liquidity to be able to meet our on-going operating requirements and to maintain a modest distribution.
Our principal liquidity needs for the next year include meeting debt service payments and funding recurring expenses, required capital expenditures, committed acquisitions and acquisition opportunities as they arise. In addition, an integral part of our strategy is to pursue acquisitions through Brookfield-led consortium arrangements with institutional investors or strategic partners, and to form partnerships to pursue acquisitions on a specialized or global basis. Brookfield has an established track record of leading such consortiums and partnerships and actively managing underlying assets to improve performance. The "Recent Business Developments" section of Item 4.A. "History and Development of our Company" details recent acquisitions completed by the partnership. For example, the partnership, alongside institutional investors is currently committed to acquire 100% of Westinghouse for approximately $4.6 billion, expected to be funded with approximately $1 billion of equity, approximately $3 billion of long-term debt financing and the balance by the assumption of certain pension, environmental and other operating obligations. In addition, the partnership alongside institutional investors, is currently committed to acquire a controlling interest in Schoeller Allibert for a purchase price of approximately €205 million. We expect to fund our commitments with available liquidity.
Our principal sources of liquidity are financial assets, undrawn credit facilities, cash flow from our operations and access to public and private capital markets. In September 2017, we issued 13,340,000 LP Units to the public and 6,945,000 Redemption-Exchange Units to Brookfield for aggregate gross proceeds of $600 million, before $8 million in equity issuance costs. In October 2017, the underwriters exercised their over-allotment option to purchase an additional 1,000,500 units at a price of $30.00 per unit, for gross proceeds of approximately $30 million less equity issuance costs of approximately $1 million. For further detail, see "Equity Attributable to Unitholders" section of Item 5.A. "Operating Results".
The following table presents borrowings by segment as at
December 31, 2017
and
December 31, 2016
:
|
(US$ Millions)
|
Business
Services
|
Construction
Services
|
Industrial
Operations
|
Energy
|
Corporate
and Other
|
Total
|
||||||||||||||||||
|
December 31, 2017
|
$
|
1,178
|
|
$
|
12
|
|
$
|
1,693
|
|
$
|
382
|
|
$
|
—
|
|
$
|
3,265
|
|
||||||
|
December 31, 2016
|
$
|
472
|
|
$
|
7
|
|
$
|
527
|
|
$
|
545
|
|
$
|
—
|
|
$
|
1,551
|
|
||||||
As at
December 31, 2017
, the partnership had outstanding debt of $
3,265 million
as compared to
$1,551 million
as at
December 31, 2016
. The borrowings consist of the following:
|
(US$ Millions)
|
December 31, 2017
|
December 31, 2016
|
||||||
|
Term loans and credit facilities
|
$
|
1,745
|
|
$
|
1,091
|
|
||
|
Project financing
|
449
|
|
—
|
|
||||
|
Debentures
|
596
|
|
—
|
|
||||
|
Securitization program
|
249
|
|
238
|
|
||||
|
Senior notes
|
226
|
|
222
|
|
||||
|
Total Borrowings
|
$
|
3,265
|
|
$
|
1,551
|
|
||
|
Brookfield Business Partners
|
84
|
The partnership has credit facilities within its operating businesses with major financial institutions. The credit facilities are primarily composed of revolving and term operating facilities with variable interest rates. At the operating level, we endeavor to maintain prudent levels of debt which can be serviced through on-going operations. On a consolidated basis, our operations had borrowings totaling
$3,265 million
as at
December 31, 2017
, compared to
$1,551 million
at
December 31, 2016
. The increase of
$1,714 million
was primarily due to the acquisitions of BRK Ambiental and Greenergy during the year ended
December 31, 2017
, which added approximately $1,292 million and $277 million of debt, respectively. The majority of debt in these businesses is project level financing, debentures with equity support agreements, and credit facilities.
We finance our assets principally at the operating company level with debt that generally is not recourse to either the partnership or to our other operations and is generally secured against assets within the respective operating companies. Moreover, debt instruments at the operating company level do not cross-accelerate or cross-default to debt at other operating companies. This debt is in the form of revolving lines of credit, term loans and debt securities with varying maturities, ranging from 1-22 years. The weighted average maturity at
December 31, 2017
was 5.5 years and the weighted average interest rate on debt outstanding was 7.3%. As at
December 31, 2017
, the maximum borrowing capacity of our term loans and credit facilities at the operations and other subsidiaries level was $5.9 billion, of which $3.3 billion was drawn.
The use of the term loans and credit facilities is primarily related to on-going operations and capital expenditures, and to fund acquisitions. The interest rates charged on these facilities are based on market interest rates. These borrowings include customary covenants based on fixed charge coverage and debt-to-EBITDA ratios. Our operations are currently in compliance with all material covenant requirements of their term loans and credit facilities. In periods of difficult economic conditions, including challenging commodity pricing, we undertake proactive measures to avoid having any of our energy and industrial operations default under the terms of their facilities, including amending such debt instruments or, if necessary, seeking waivers from the lenders. Our ability to enter into an amendment or, if needed, obtain a waiver or otherwise refinance any such indebtedness depends on, among other things, the conditions of the capital markets and our financial conditions at such time.
One of our real estate services businesses has a securitization program under which it transfers an undivided co-ownership interest in eligible receivables on a fully serviced basis, for cash proceeds, at their fair value under the terms of the agreement. While the sale of the co-ownership interest is considered a legal sale, the partnership has determined that the asset derecognition criteria has not been met, as substantially all risk and rewards of ownership are not transferred. The program contains covenants related to maximum loss and default ratios (as defined by the agreement) and receivables turnover ratios as the debt is secured by the business' receivables. The partnership was in compliance with the covenants under the securitization program as at
December 31, 2017
.
Our graphite electrode manufacturing operation has senior unsecured notes that rank
pari passu
with all of its existing and future senior unsecured indebtedness. The indenture governing the senior notes contains customary covenants relating to limitations on liens and sale/leaseback transactions and we were in compliance with such covenants as at
December 31, 2017
. The senior notes bear interest at a rate of 6.375% per year, payable semi-annually in arrears and mature on November 15, 2020. In February 2018, our graphite electrode manufacturing operation completed a $1.5 billion debt offering. See Item 4.A. "History and Development of our Company - Recent Business Developments" for further details.
During the year ended December 31, 2017, the partnership entered into a revolving acquisition credit facility with Brookfield that permits borrowings of up to $500 million. The credit facility is guaranteed by the partnership, and each direct wholly-owned (in terms of outstanding common equity) subsidiary of the partnership or the Holding LP, that is not otherwise a borrower. The credit facility is available in U.S. or Canadian dollars, and advances are made by way of LIBOR, base rate, bankers' acceptance rate or prime rate loans. The credit facility bears interest at the specified LIBOR or bankers’ acceptance rate plus 3.75%, or the specified base rate or prime rate plus 2.75%. The credit facility also requires us to maintain a minimum deconsolidated net worth and contain restrictions on the ability of the borrowers and the guarantors to, among other things, incur liens, engage in certain mergers and consolidations or enter into speculative hedging arrangements. As at December 31, 2017, $nil has been drawn under this credit facility. Net proceeds above a specified threshold that are received by the borrowers from asset dispositions, debt incurrences or equity issuances by the borrowers or their subsidiaries must be used to pay down the credit facility (which can then be redrawn to fund future investments).
This new credit facility replaced two, three-year revolving credit facilities that were entered into on June 20, 2016 in connection with the spin-off of the partnership from Brookfield: (i) an operating credit facility that permitted borrowings of up to $200 million for working capital purposes; and (ii) a facility that permitted borrowings of up to $300 million for purposes of funding our acquisitions and investments.
|
85
|
Brookfield Business Partners
|
In August 2016, we entered into a $150 million unsecured bilateral facility with a group of Canadian and American banks. The credit facility is available in U.S. or Canadian dollars, and advances bear interest at the specified LIBOR or bankers' acceptance rate plus 2.75%, or the specified base rate or prime rate plus 1.75%. This facility has a two-year term, with a one year extension and will be used for general corporate purposes. In May 2017, the credit facility’s maturity date was amended and extended by one year to 2019, effective August 2017. In August 2017, the credit facility was increased by $100 million to $250 million. The bilateral working capital facility requires us to maintain a minimum tangible net worth and to maintain debt to capitalization ratios at the corporate level. As at
December 31, 2017
there was $nil drawn on this facility.
The table below outlines the partnership's consolidated net debt to capitalization as at
December 31, 2017
and
December 31, 2016
:
|
(US$ Millions)
|
December 31, 2017
|
December 31, 2016
|
||||||
|
Borrowings
|
$
|
3,265
|
|
$
|
1,551
|
|
||
|
Cash and cash equivalents
|
(1,106
|
)
|
(1,050
|
)
|
||||
|
Net debt
|
2,159
|
|
501
|
|
||||
|
Total equity
|
6,064
|
|
4,038
|
|
||||
|
Total capital and net debt
|
$
|
8,223
|
|
$
|
4,539
|
|
||
|
Net debt to capitalization ratio
|
26.3
|
%
|
11.0
|
%
|
||||
The partnership's general partner has implemented a distribution policy pursuant to which we intend to make quarterly cash distributions in an initial amount currently anticipated to be approximately $0.25 per unit on an annualized basis. On February 9, 2018, the Board of Directors of the partnership's general partner declared a dividend of $0.0625 per unit payable on March 29, 2018 to unitholders of record as at the close of business on February 28, 2018.
In addition, on December 29, 2017, the Board of Directors, on behalf of the partnership, in its capacity as the general partner of Brookfield Business L.P. ("Holding LP"), declared a dividend of $11.75 million per Special LP unit of Holding LP, payable on February 28, 2018. The volume weighted average price per unit was $31.19 per unit (exceeding the previous incentive distribution threshold of $29.34 per unit) and the units outstanding at year-end were 129 million units, resulting in a $48 million payable to Brookfield. Going forward, the incentive distribution threshold is $31.19/unit. For the year ended
December 31, 2017
, the total incentive distribution was $142 million.
Cash Flow
We believe that we currently have sufficient access to capital resources and will continue to use our available capital resources to fund our operations. Our future capital resources include cash flow from operations, borrowings and proceeds from potential future debt issues or equity offerings, if required.
As at
December 31, 2017
, we had cash and cash equivalents of
$1,106 million
, compared to
$1,050 million
as at
December 31, 2016
and
$354 million
as at
December 31, 2015
. The net cash flows for the years ended
December 31, 2017
,
2016
and
2015
were as follows:
|
|
Year Ended December 31,
|
|||||||||||
|
(US$ Millions)
|
2017
|
2016
|
2015
|
|||||||||
|
Cash flows provided by operating activities
|
$
|
290
|
|
$
|
229
|
|
$
|
332
|
|
|||
|
Cash flows provided by (used in) investing activities
|
(1,595
|
)
|
(96
|
)
|
(2,094
|
)
|
||||||
|
Cash flows provided by (used in) financing activities
|
1,353
|
|
586
|
|
1,971
|
|
||||||
|
Effect of foreign exchange rates on cash
|
8
|
|
(15
|
)
|
(18
|
)
|
||||||
|
Cash reclassified as held for sale
|
—
|
|
(8
|
)
|
—
|
|
||||||
|
$
|
56
|
|
$
|
696
|
|
$
|
191
|
|
||||
Cash Flow Provided by Operating Activities
Total cash flow provided by operating activities for the year ended
December 31, 2017
was
$290 million
compared to
$229 million
provided for the year ended
December 31, 2016
. The cash provided by operating activities during the year ended
December 31, 2017
was primarily attributable to the contributions from Greenergy, BRK Ambiental, and our fuel marketing business which were acquired throughout 2017. Increased activity in our graphite electrode manufacturing business also contributed to the increase in operating cash flows.
|
Brookfield Business Partners
|
86
|
Total cash flow provided by operating activities for the year ended
December 31, 2016
was
$229 million
compared to
$332 million
for the year ended
December 31, 2015
. The cash provided by operating activities during the year ended
December 31, 2016
was primarily attributable to activity in our construction services business, increased activity at our facilities management business and dividend and interest income from investment securities held in our energy segment.
Cash Flow Provided by (Used in) Investing Activities
Total cash flow used in investing activities was
$1,595 million
for the year ended
December 31, 2017
, compared to
$96 million
used during the year ended
December 31, 2016
. Our investing activities were primarily related to the acquisitions within our business services and industrial operations segments offset by the disposition of our bath and shower products manufacturing business, the disposition of Insignia Energy in our energy segment, as well as the sale of public investment securities in our energy and business services segments.
Total cash flow used in investing activities was
$96 million
for the year ended
December 31, 2016
compared to
$2,094 million
for the year ended
December 31, 2015
. Our investing activities were related to the acquisition and disposition of corporate bond and equity securities in our energy and industrial operations segments, as well as the two acquisitions within our facilities management business.
Cash Flow Provided by (Used in) Financing Activities
Total cash flow provided by financing activities was
$1,353 million
for the year ended
December 31, 2017
, compared to
$586 million
cash flow provided by financing activities for the year ended
December 31, 2016
. During the year ended
December 31, 2017
, our borrowings, net of repayments, were
$349 million
, and capital provided by others who have interests in our operating subsidiaries, net of distributions, was
$509 million
. In September 2017, we issued limited partnership units and redemption exchange units of Holding LP in exchange for gross proceeds of approximately $600 million, before $8 million in equity issuance costs, and issued an additional $30 million of limited partnership units in October 2017, before $1 million in equity issuance costs, as a result of the exercise of the over-allotment option. During the year ended
December 31, 2017
, $31 million was distributed to limited partners and redemption-exchange unitholders and $95 million was distributed to Special LP unitholders.
Total cash flow provided by financing activities was
$586 million
for the year ended
December 31, 2016
compared to
$1,971 million
for the year ended
December 31, 2015
. As part of the spin-off, we received $250 million in consideration for limited partnership units issued to Brookfield, which was placed on deposit with Brookfield and included in cash and cash equivalents at December 31, 2016. In December 2016, we issued limited partnership units and redemption-exchange units of Holding LP in exchange for gross proceeds of approximately $384 million. During the year ended
December 31, 2016
, our borrowings, net of repayments, were $534 million, and capital provided by others who have interests in our operating subsidiaries, net of distributions, was $416 million.
Market Risks
Market risk is defined for these purposes as the risk that the fair value or future cash flows of a financial instrument held by our partnership will fluctuate because of changes in market prices. Market risk includes the risk of changes in interest rates, currency exchange rates and changes in market prices due to factors other than interest rates or currency exchange rates, such as changes in equity prices, commodity prices or credit spreads.
Financial instruments held by our partnership that are subject to market risk include other financial assets, borrowings, derivative instruments, such as interest rate and foreign currency contracts, and marketable securities.
The partnership is exposed to price risks arising from marketable securities and other financial assets. As at
December 31, 2017
the balance of the portfolio was $461 million (
2016
: $426 million), a 10% change in the value of the portfolio would impact our equity by $46 million (
2016
: $43 million) and result in an impact on the consolidated statements of comprehensive income of $46 million (
2016
: $43 million).
Interest rate risk
The observable impacts on the fair values and future cash flows of financial instruments that can be directly attributable to interest rate risk include changes in the net income from financial instruments whose cash flows are determined with reference to floating interest rates and changes in the value of financial instruments whose cash flows are fixed in nature. A 10 basis point increase or decrease in the interest rates would not have a material impact on our net income.
|
87
|
Brookfield Business Partners
|
Foreign currency risk
We have operations in international markets denominated in currencies other than the U.S. dollar, primarily the Australian dollar, the Canadian dollar, the Brazilian real and the British pound. As a result, we are subject to foreign currency risk due to potential fluctuations in exchange rates between foreign currencies and the U.S. dollar. We structure our operations such that foreign operations are primarily conducted by entities with a functional currency which is the same as the economic environment in which the operations take place. As a result, the net income impact of currency risk associated with financial instruments is limited as its financial assets and liabilities are generally denominated in the functional currency of the subsidiary that holds the financial instrument. However, we are exposed to foreign currency risk on the net assets of its foreign currency denominated operations and foreign currency denominated debt. We manage foreign currency risk through hedging contracts, typically foreign exchange forward contracts. There is no assurance that hedging strategies, to the extent used, will fully mitigate the risk.
The table below outlines the impact on net income and other comprehensive income of a 10% change in the exchange rates between the U.S. dollar and the major foreign currencies:
|
|
2017
|
2016
|
2015
|
|||||||||||||||||||||
|
(US$ Millions)
|
OCI
|
Net income
|
OCI
|
Net income
|
OCI
|
Net income
|
||||||||||||||||||
|
USD/AUD
|
$
|
(88
|
)
|
$
|
—
|
|
$
|
(55
|
)
|
$
|
—
|
|
$
|
(79
|
)
|
$
|
—
|
|
||||||
|
USD/BRL
|
(33
|
)
|
—
|
|
—
|
|
—
|
|
—
|
|
—
|
|
||||||||||||
|
USD/CDN
|
(37
|
)
|
—
|
|
(50
|
)
|
—
|
|
(50
|
)
|
—
|
|
||||||||||||
|
USD/Other
|
(9
|
)
|
(20
|
)
|
(3
|
)
|
1
|
|
(1
|
)
|
1
|
|
||||||||||||
See also Note 4, "Fair Value of Financial Instruments", Note 25, "Derivative Financial Instruments" and Note 26, "Financial Risk Management" in our consolidated financial statements included in this Form 20-F.
Commodity price risk
Commodity price risk is the risk that the fair value of financial instruments will fluctuate as a result of changes in commodity prices. Our operating subsidiaries that are exposed to commodity risk attempt to mitigate commodity price risk through the use of commodity contracts. A 10 basis point increase or decrease in commodity prices, as they relate to financial instruments, would not have a material impact on our net income.
Our commodity exposure is primarily in our energy and industrial operations. We hedge this exposure where appropriate. See Item 4.B., "Business Overview - Energy" and Item 4.B., "Business Overview - Industrial Operations".
Related Party Transactions
We entered into a number of related party transactions with Brookfield as described in Note 24 in our consolidated financial statements included in this Form 20-F.
Critical Accounting Policies, Estimates and Judgments
The preparation of financial statements requires management to make critical judgments, estimates and assumptions that affect the reported amounts of assets and liabilities and disclosure of contingent assets and liabilities at the date of the financial statements and the reported amounts of revenues and expenses that are not readily apparent from other sources, during the reporting period. These estimates and associated assumptions are based on historical experience and other factors that are considered to be relevant. Actual results may differ from these estimates.
The estimates and underlying assumptions are reviewed on an ongoing basis. Revisions to accounting estimates are recognized in the period in which the estimate is revised if the revision affects only that period, or in the period of the revision and future periods if the revision affects both current and future periods.
Critical judgments made by management and utilized in the normal course of preparing our partnership's consolidated financial statements are outlined below.
For further reference on accounting policies, critical judgments and estimates, see our "Significant Accounting Policies" contained in Note 2 of our consolidated financial statements as at
December 31, 2017
and
2016
and for the years ended
December 31, 2017
,
2016
and
2015
, included in this Form 20-F. See Item 18. "Financial Statements".
|
Brookfield Business Partners
|
88
|
Business Combinations
The partnership accounts for business combinations using the acquisition method of accounting. The allocation of fair values to assets acquired and liabilities assumed through an acquisition requires numerous estimates that affect the valuation of certain assets and liabilities acquired including discount rates, operating costs, revenue estimates, commodity prices, future capital costs and other factors. The determination of the fair values may remain provisional for up to 12 months from the date of acquisition due to the time required to obtain independent valuations of individual assets and to complete assessments of provisions. When the accounting for a business combination has not been completed as at the reporting date, this is disclosed in the financial statements, including observations on the estimates and judgments made as at the reporting date.
Determination of Control
We consolidate an investee when we control the investee, with control existing if and only if we have power over the investee; exposure, or rights, to variable returns from our involvement with the investee; and the ability to use our power over the investee to affect the amount of the partnership's returns.
In determining if we have power over an investee, we make judgments when identifying which activities of the investee are relevant in significantly affecting returns of the investee and the extent of our existing rights that give us the current ability to direct the relevant activities of the investee. We also make judgments as to the amount of potential voting rights which provides us voting powers, the existence of contractual relationships that provide us voting power and the ability to appoint directors. We enter into voting agreements to provide the partnership with the ability to contractually direct the relevant activities of the investee (formally referred to as "power" within IFRS 10,
Consolidated Financial Statements
). In assessing if we have exposure, or rights, to variable returns from our involvement with the investee we make judgments concerning whether returns from an investee are variable and how variable those returns are on the basis of the substance of the arrangement, the size of those returns and the size of those returns relative to others, particularly in circumstances where our voting interest differs from our ownership interest in an investee. In determining if we have the ability to use our power over the investee to affect the amount of our returns we make judgments when we are an investor as to whether we are a principal or agent and whether another entity with decision-making rights is acting as an agent for us. If we determine that we are acting as an agent, as opposed to principal, we do not control the investee.
Common Control Transactions
IFRS 3,
Business Combinations
, does not include specific measurement guidance for transfers of businesses or subsidiaries between entities under common control. Accordingly, the partnership has developed an accounting policy to account for such transactions taking into consideration other guidance in the IFRS framework and pronouncements of other standard-setting bodies. The partnership's policy is to record assets and liabilities recognized as a result of transactions between entities under common control at the carrying values in the transferor's financial statements.
Indicators of Impairment
Judgment is applied when determining whether indicators of impairment exist when assessing the carrying values of the partnership's assets, including the determination of the partnership's ability to hold financial assets; the estimation of a cash generating unit's future revenues and direct costs; and the determination of discount rates, and when an asset's carrying value is above the value derived using publicly traded prices which are quoted in a liquid market.
For some of our assets forecasting the recoverability and economic viability of property and equipment requires an estimate of reserves. The process for estimating reserves is complex and requires significant interpretation and judgment. It is affected by economic conditions, production, operating and development activities, and is performed using available geological, geophysical, engineering and economic data.
Revenue Recognition
Certain of the partnership's subsidiaries use the percentage-of-completion method to account for their contract revenue. The stage of completion is measured by reference to actual costs incurred to date as a percentage of estimated total costs for each contract. Significant assumptions are required to estimate the total contract costs and the recoverable variation works that affect the stage of completion and the contract revenue respectively. In making these estimates, management has relied on past experience or where necessary, the work of experts.
Revenue from the sale of goods in our U.K. road fuel service operation represents net invoiced sales of fuel products and RTFO certificates, excluding value added taxes but including excise duty, which has been assessed to be a production tax and recorded as part of consideration received. Revenue is recognized at the point that title passes to the customer.
|
89
|
Brookfield Business Partners
|
Financial Instruments
Judgments inherent in accounting policies relating to derivative financial instruments relate to applying the criteria to the assessment of the effectiveness of hedging relationships. Estimates and assumptions used in determining the fair value of financial instruments are: equity and commodity prices; future interest rates; the credit worthiness of our partnership relative to its counterparties; the credit risk of the partnership's counterparties; estimated future cash flows; discount rates and volatility utilized in option valuations.
Decommissioning Liabilities
Decommissioning costs will be incurred at the end of the operating life of some of our oil and gas facilities and mining properties. These obligations are typically many years in the future and require judgment to estimate. The estimate of decommissioning costs can vary in response to many factors including changes in relevant legal regulatory, and environmental requirements, the emergence of new restoration techniques or experience at other production sites. Inherent in the calculations of these costs are assumptions and estimates including the ultimate settlement amounts, inflation factors, discount rates, and timing of settlements.
Other
Other estimates and assumptions utilized in the preparation of the partnership's financial statements are: the assessment or determination of recoverable amounts; depreciation and amortization rates and useful lives; estimation of recoverable amounts of cash generating units for impairment assessments of goodwill and intangible assets; and ability to utilize tax losses and other tax measurements.
Other critical judgments include the determination of functional currency.
Controls and Procedures
No changes were made in our internal control over financial reporting during the year ended
December 31, 2017
, that have materially affected, or are reasonably likely to materially affect, our internal control over financial reporting.
Excluded from our evaluation were controls over financial reporting at BRK Ambiental, for which control was acquired on April 25, 2017; Greenergy, for which control was acquired on May 10, 2017; and our fuel marketing business, for which control was acquired on July 17, 2017. The financial statements of these entities constitute
46%
of total assets,
32%
of net assets,
63%
of revenue and
7%
of net income of the consolidated financial statements of our partnership as of and for the year ending
December 31, 2017
.
Future Changes in Accounting Policies
Revenue from Contracts with Customers
IFRS 15, Revenue from Contracts with Customers ("IFRS 15") specifies how and when revenue should be recognized as well as requiring additional disclosures. IFRS 15 requires disclosure regarding the nature, amount, timing and uncertainty of revenue and cash flows arising from customer contracts. IFRS 15 supersedes IAS 18, Revenue, IAS 11, Construction Contracts and a number of revenue-related interpretations. IFRS 15 applies to nearly all contracts with customers: the main exceptions are leases, financial instruments and insurance contracts. IFRS 15 must be applied for periods beginning on or after January 1, 2018 with early application permitted.
The partnership will adopt the standard using the modified retrospective approach, in which a cumulative catch-up adjustment is recorded through opening retained earnings as of January 1, 2018 as if the standard had always been in effect and whereby comparative periods are not restated. The partnership has substantially completed the impact assessment across its group of companies and expects a reduction in opening retained earnings of approximatively $250 million, net of taxes, mainly from the Construction Services business. Revenue from the partnership’s construction services contracts will continue to be recognized over time; however, IFRS 15 requires a higher threshold of probability to be achieved prior to recognizing revenue from variable consideration such as incentives and claims and variations resulting from contract modifications. Revenue is currently recognized when it is probable that work performed will result in revenue whereas under the new standard, revenue is recognized when it is highly probable that a significant reversal of revenue will not occur for these modifications. Significant judgments and estimates are used in determining the impact, such as the assessment of the probability of customer approval of variations and acceptance of claims and estimation of project completion dates. Our implementation project is ongoing as we finalize our technical analysis and quantitative assessment and therefore all impacts are current estimates which are subject to finalization.
|
Brookfield Business Partners
|
90
|
Financial Instruments
In July 2014, the IASB issued the final publication of IFRS 9,
Financial Instruments
("IFRS 9") superseding the current IAS 39,
Financial Instruments: Recognition and Measurement
. IFRS 9 establishes principles for the financial reporting of financial assets and financial liabilities that will present relevant and useful information to users of financial statements for their assessment of the amounts, timing and uncertainty of an entity's future cash flows. This new standard also includes a new general hedge accounting standard which will align hedge accounting more closely with an entity's risk management activities. It does not fully change the types of hedging relationships or the requirement to measure and recognize ineffectiveness, however, it will provide more hedging strategies that are used for risk management to qualify for hedge accounting and introduce greater judgment to assess the effectiveness of a hedging relationship. IFRS 9 has a mandatory effective date for annual periods beginning on or after January 1, 2018 with early adoption permitted. The partnership has developed a detailed transition plan to implement IFRS 9. The partnership has substantially completed the impact assessment across its group of companies and expects no material adjustment upon adoption.
Our implementation project is ongoing as we finalize our technical analysis and quantitative assessment and therefore all impacts are current estimates which are subject to finalization.
Leases
IFRS 16,
Leases
, (‘‘IFRS 16’’) provides a single lessee accounting model, requiring recognition of assets and liabilities for all leases, unless the lease term is shorter than 12 months or the underlying asset has a low value. IFRS 16 supersedes IAS 17,
Leases,
and its related interpretative guidance. IFRS 16 must be applied for periods beginning on or after January 1, 2019 with early adoption permitted if IFRS 15 has also been adopted. The partnership is currently evaluating the impact of IFRS 16 on its financial statements.
IFRIC 22 Foreign Currency Transactions (“IFRIC 22”)
In December 2016, the IASB issued IFRIC 22, effective for annual periods beginning on or after January 1, 2018. The interpretation clarifies that the date of the transaction for the purpose of determining the exchange rate to use on initial recognition of the related asset, expense or income (or part of it) is the date on which an entity initially recognizes the non-monetary asset or non-monetary liability arising from the payment or receipt of advance consideration. The Interpretation may be applied either retrospectively or prospectively. The partnership has evaluated the impact of IFRIC 22 on its consolidated financial statements and the impact will not be significant.
IFRIC 23 Uncertainty over Income Tax Treatments (“IFRIC 23”)
In June 2017, the IASB published IFRIC 23, effective for annual periods beginning on or after January 1, 2019. The interpretation requires an entity to assess whether it is probable that a tax authority will accept an uncertain tax treatment used, or proposed to be used, by an entity in its income tax filings and to exercise judgment in determining whether each tax treatment should be considered independently or whether some tax treatments should be considered together. The decision should be based on which approach provides better predictions of the resolution of the uncertainty. An entity also has to consider whether it is probable that the relevant authority will accept each tax treatment, or group of tax treatments, assuming that the taxation authority with the right to examine any amounts reported to it will examine those amounts and will have full knowledge of all relevant information when doing so. The interpretation may be applied on either a fully retrospective basis or a modified retrospective basis without restatement of comparative information. The partnership is currently evaluating the impact of IFRIC 23 on its consolidated financial statements.
New
Accounting Policies Adopted
Income taxes
In January 2016, the IASB issued certain amendments to IAS 12,
Income Taxes
, to clarify the accounting for deferred tax assets for unrealized losses on debt instruments measured at fair value. A deductible temporary difference arises when the carrying amount of the debt instrument measured at fair value is less than the cost for tax purposes, irrespective of whether the debt instrument is held for sale or held to maturity. The recognition of the deferred tax asset that arises from this deductible temporary difference is considered in combination with other deferred taxes applying local tax law restrictions where applicable. In addition, when estimating future taxable profits, consideration can be given to recovering more than the asset’s carrying amount where probable. These amendments are effective for periods beginning on or after January 1, 2017. These amendments did not have a significant impact on the financial statements.
|
91
|
Brookfield Business Partners
|
Disclosures — Statement of cash flows
In January 2016, the IASB issued the amendments to IAS 7,
Statement of Cash Flows
, effective for annual periods beginning January 1, 2017. The IASB requires that the following changes in liabilities arising from financing activities are disclosed (to the extent necessary): (i) changes from financing cash flows; (ii) changes arising from obtaining or losing control of subsidiaries or other businesses; (iii) the effect of changes in foreign exchange rates; (iv) changes in fair values; and (v) other changes. These amendments have been applied and disclosed in Note 28 of the financial statements, with no comparatives required.
5.C. RESEARCH AND DEVELOPMENT, PATENTS AND LICENSES, ETC.
Not applicable.
5.D. TREND INFORMATION
See Item 5.A.—"Operating Results".
5.E. OFF-BALANCE SHEET ARRANGEMENTS
In the normal course of operations our operating subsidiaries have bank guarantees, insurance bonds and letters of credit outstanding to third parties. As at
December 31, 2017
, the total outstanding amount was approximately
$1.6 billion
. If these letters of credit or bonds are drawn upon, we will be obligated to reimburse the issuer of the letter of credit or bonds. The partnership does not conduct its operations, other than those of equity accounted investments, through entities that are not consolidated in the financial statements, and has not guaranteed or otherwise contractually committed to support any material financial obligations not reflected in the financial statements.
Our construction businesses and other operations are called upon to give, in the ordinary course of business, guarantees and indemnities in respect of the performance of controlled entities, associates and related parties of their contractual obligations. Any known losses have been brought to account.
In the normal course of operations, we execute agreements that provide for indemnification and guarantees to third parties in transactions such as business dispositions and acquisitions, construction projects, capital projects, and sales and purchases of assets and services. We have also agreed to indemnify our directors and certain of our officers and employees. The nature of substantially all of the indemnification undertakings prevents us from making a reasonable estimate of the maximum potential amount that we could be required to pay third parties, as many of the agreements do not specify a maximum amount and the amounts are dependent upon the outcome of future contingent events, the nature and likelihood of which cannot be determined at this time. Historically, we have made no significant payments under such indemnification agreements. In addition, we have also entered into indemnity agreements with Brookfield that relate to certain projects in the Middle East region that were in place prior to the spin-off. Under these indemnity agreements, Brookfield has agreed to indemnify us for the receipt of payments relating to such projects.
From time to time, we may be contingently liable with respect to litigation and claims that arise in the normal course of operations. On July 3, 2017, at our construction business, a customer called on an advance payment bank guarantee for an amount of approximately $32 million, associated with a project in the Middle East. Management successfully contested the claim, which was upheld in local courts. On February 22, 2018, the customer’s appeal of the court’s ruling resulted in the bank guarantees being paid due to the structural form of the guarantee. Management continues to counterclaim through local courts and any loss amount associated with this project cannot be measured and is not probable at this time.
Financial Instruments — Foreign Currency Hedging Strategy
To the extent that it is economical to do so, the partnership's strategy is to hedge a portion of its equity investments and/or cash flows exposed to foreign currencies. The partnership's foreign currency hedging strategy includes leveraging any natural hedges that may exist within the operations, utilizing local currency debt financing to the extent possible, and utilizing derivative contracts to the extent that natural hedges are insufficient.
|
Brookfield Business Partners
|
92
|
The following table presents our foreign currency equity positions, excluding interest of others in operating subsidiaries, as at
December 31, 2017
:
|
|
Net Investment Hedges
|
|||||||||||||||||||||||||||
|
(US$ Millions)
|
USD
|
CAD
|
AUD
|
BRL
|
GBP
|
EUR
|
Other
|
|||||||||||||||||||||
|
Net Equity
|
$
|
1,217
|
|
$
|
628
|
|
$
|
541
|
|
$
|
371
|
|
$
|
128
|
|
$
|
103
|
|
$
|
50
|
|
|||||||
|
Foreign Currency Hedges — US$
|
380
|
|
(257
|
)
|
(104
|
)
|
—
|
|
(19
|
)
|
—
|
|
—
|
|
||||||||||||||
As at
December 31, 2017
, we had hedges in place equal to approximately
21%
of our net equity investment in foreign currencies. Our primary unhedged exposure relates to our Brazilian Real investment and some of our Canadian operations where natural hedges exist within the businesses. For the year ended
December 31, 2017
, we recorded loss in comprehensive income of
$64 million
related to these contracts.
5.F. TABULAR DISCLOSURE OF CONTRACTUAL OBLIGATIONS
In the ordinary course of business, we enter into contractual arrangements that may require future cash payments. The table below outlines our contractual obligations as at
December 31, 2017
:
|
|
Payments as at December 31, 2017
|
|||||||||||||||||||
|
(US$ Millions)
|
Total
|
Less than
One Year
|
One-Two
Years
|
Three-Five
Years
|
Thereafter
|
|||||||||||||||
|
Borrowings
|
$
|
3,285
|
|
$
|
825
|
|
$
|
801
|
|
$
|
1,075
|
|
$
|
584
|
|
|||||
|
Finance lease obligations
|
17
|
|
11
|
|
4
|
|
2
|
|
—
|
|
||||||||||
|
Operating leases
|
648
|
|
107
|
|
85
|
|
182
|
|
274
|
|
||||||||||
|
Interest expense
|
79
|
|
32
|
|
23
|
|
24
|
|
—
|
|
||||||||||
|
Decommissioning liabilities
|
928
|
|
7
|
|
3
|
|
9
|
|
909
|
|
||||||||||
|
Pension obligations
|
125
|
|
12
|
|
12
|
|
36
|
|
65
|
|
||||||||||
|
Obligations under agreements
|
218
|
|
34
|
|
24
|
|
101
|
|
59
|
|
||||||||||
|
Total
|
$
|
5,300
|
|
$
|
1,028
|
|
$
|
952
|
|
$
|
1,429
|
|
$
|
1,891
|
|
|||||
5.G SAFE HARBOR
See "Special Note Regarding Forward-Looking Statements."
|
93
|
Brookfield Business Partners
|
6.A. DIRECTORS AND SENIOR MANAGEMENT
Governance
As required by law, our Limited Partnership Agreement provides for the management and control of our company by a general partner rather than a board of directors and officers. The BBU General Partner serves as our company's general partner and has a board of directors. The BBU General Partner has sole responsibility and authority for the central management and control of our company, which is exercised through its board of directors. Accordingly, references herein to "our directors" and "our board" refer to the board of directors of the BBU General Partner.
The following table presents certain information concerning our board of directors:
|
Name, Municipality of Residence and
Independence(1)
|
Age
|
Position with the
BBU General
Partner
|
Principal Occupation
|
|||
|
Jeffrey Blidner,
Toronto, Ontario, Canada
(Not Independent)
|
69
|
Board Chair and Director
|
Vice Chairman, Brookfield Asset Management
|
|||
|
David Court,
Toronto, Ontario, Canada
(Independent)
|
61
|
Director
|
Director Emeritus, McKinsey & Company
|
|||
|
Anthony Gardner
(2)
,
London, United Kingdom
(Independent)
|
54
|
Director
|
Former U.S. Ambassador to the European Union
|
|||
|
Stephen Girsky
(2)
,
New York, New York,
USA
(Independent)
|
55
|
Director
|
President, SJ Girsky & Co.
|
|||
|
David Hamill
(3)
,
Eastern Heights, Queensland, Australia
(Independent)
|
60
|
Director
|
Professional Director
|
|||
|
John Lacey
(4)
,
Thornhill, Ontario, Canada
(Independent)
|
74
|
Lead Independent Director
|
Chairman, Doncaster Consolidated Ltd.
|
|||
|
Don Mackenzie
(3)
,
Pembroke Parish, Bermuda
(Independent)
|
57
|
Director
|
Chairman and Owner of New Venture Holdings
|
|||
|
Patricia Zuccotti
(5)
,
Kirkland, Washington,
USA
(Independent)
|
70
|
Director
|
Corporate Director
|
|||
_______________________________________________________________________________
|
(1)
|
The mailing addresses for the directors are set forth under "Security Ownership".
|
|
(2)
|
Member of the governance and nominating committee.
|
|
(3)
|
Member of the audit committee.
|
|
(4)
|
Chair of the governance and nominating committee.
|
|
(5)
|
Chair of the audit committee.
|
Set forth below is biographical information for our directors.
Jeffrey Blidner.
Mr. Blidner is a Vice Chairman of Brookfield Asset Management responsible for strategic planning and fundraising. Mr. Blidner is also the Chief Executive Officer of Brookfield's Private Funds Group, Chairman and a director of Brookfield Renewable Partners and a director of Brookfield Asset Management, Brookfield Property Partners and Brookfield Infrastructure Partners. Prior to joining Brookfield in 2000, Mr. Blidner was a Senior Partner of a Canadian law firm.
|
Brookfield Business Partners
|
94
|
David Court.
David Court is a Director Emeritus at McKinsey & Company. Mr. Court was previously McKinsey’s Global Director of Technology, Digitization and Communications, led McKinsey’s global practice in harnessing digital data and advanced analytics from 2011 to 2015, and was a member of the firm’s Board of Directors and its Global Operating Committee. Mr. Court is a director of Canadian Tire Corporation and a member of the National Geographic International Council of Advisors and the Advisory Board for both the Queen’s University Business School and its Analytics Program. Mr. Court holds a BCom from Queen’s University and an MBA from Harvard Business School where he was a Baker Scholar.
Anthony Gardner.
Mr. Gardner served as U.S. Ambassador to the European Union from 2014 to 2017. Prior to his appointment, Mr. Gardner was Managing Director for six years at Palamon Capital Partners, a private equity firm based in London. Previously, Mr. Gardner served as an Executive Director in the leveraged finance departments of Bank of America and GE Capital and as a Director in the international acquisitions group of GE International. He has also worked at international law firms in London, Paris, New York, and Brussels. Mr. Gardner holds an A.B. in Government from Harvard University, an MPhil in International Relations from Oxford University, a JD from Columbia Law School, and a Masters in Finance from London Business School.
Stephen Girsky.
Mr. Girsky is Managing partner of VectolQ, an independent advisory firm based in New York, and serves on the board of directors of United States Steel Corporation, Drive.ai, an autonomous driving software company, and Valens Semiconductor Ltd. Mr. Girsky was previously the president of Centerbridge Industrial Partners and a managing director at Morgan Stanley and served in a number of capacities at General Motors Co., including the office of Vice Chairman. Mr. Girsky also served as Chairman of Adam Opel AG Supervisory Board and was President of General Motors Europe. Mr. Girsky holds a B.S. in mathematics from the University of California at Los Angeles and a M.B.A. from the Harvard Business School.
David Hamill.
Dr. Hamill is a professional director and was Treasurer of the State of Queensland in Australia from 1998 to 2001, Minister for Education from 1995 to 1996, and Minister for Transport and Minister Assisting the Premier on Economic and Trade Development from 1989 to 1995. Dr. Hamill retired from the Queensland Parliament in February 2001 and since that time has served as a non-executive director or chairman of a range of listed and private companies as well as not-for-profit and public sector entities. Dr. Hamill holds a Bachelor of Arts (Honours) from the University of Queensland, a Master of Arts from Oxford University and a Doctorate of Philosophy from University of Queensland and is a fellow of the Chartered Institute of Transport and the Australian Institute of Company Directors.
John Lacey.
Mr. Lacey is Chairman of Doncaster Consolidated Ltd. and a director of Whittington Investments Ltd. Mr. Lacey previously served as a consultant to the Chairman of the Board of George Weston Ltd., a Canadian food processing and distribution company, and Loblaw Companies Limited, a Canadian food retailer. Mr. Lacey was previously the Chairman of the board of directors of Alderwoods Group, Inc., an organization operating funeral cemeteries within North America, until 2006. Mr. Lacey is the former President and Chief Executive Officer of The Oshawa Group (now part of Sobeys Inc.) and a current director of Loblaw Companies Limited and TELUS Corporation.
Don Mackenzie.
Mr. Mackenzie is the Chairman and Owner of New Venture Holdings, a well-established privately owned holding company with operating company and real estate investments in Bermuda and Canada. Prior to moving to Bermuda in 1990, Mr. Mackenzie worked in the software and sales sector. Mr. Mackenzie acquired his first business in 1995, and New Venture Holdings was formed in 2000 to consolidate a number of operating investments under a holding company umbrella. Mr. Mackenzie has a Bachelor of Commerce from Queens University and an MBA from Schulich School of Business of York University.
Patricia Zuccotti.
Ms. Zuccotti is a director of Brookfield Renewable Partners L.P., where she is the Chair of the Audit Committee. She served as Senior Vice President, Chief Accounting and Controller of Expedia, Inc. from October 2005 to September 2011. Prior to joining Expedia, Ms. Zuccotti was the Director, Enterprise Risk Services of Deloitte & Touche LLP from June 2003 until October 2005. Ms. Zuccotti is a Certified Public Accountant (inactive) and received her Master's in Business Administration, majoring in accounting and finance, from the University of Washington and a Bachelor of Arts, majoring in political science, from Trinity College.
Our Management
The Service Providers, wholly-owned subsidiaries of Brookfield Asset Management, provide management services to us pursuant to our Master Services Agreement. Brookfield has built its business platform through the integration of formative portfolio acquisitions and single asset transactions over several decades and throughout all phases of the business cycle. The Service Providers' investment and asset management professionals are complemented by the depth of transactional and operational expertise throughout our operating segments which specialize in business services and industrial operations, generating significant returns. Members of Brookfield's senior management and other individuals from Brookfield's global affiliates are drawn upon to fulfill the Service Providers' obligations to provide us with management services under our Master Services Agreement.
|
95
|
Brookfield Business Partners
|
The following table presents certain information concerning the core senior management team that are principally responsible for our operations and their positions with the Service Providers.
|
Name
|
Age
|
Years of
Experience
|
Years at
Brookfield
|
Position with one of the Service Providers
|
|||||||
|
Cyrus Madon
|
52
|
|
29
|
|
19
|
|
Chief Executive Officer
|
||||
|
Craig J. Laurie
|
46
|
|
23
|
|
20
|
|
Chief Financial Officer
|
||||
Set forth below is biographical information for Messrs. Madon and Laurie.
Cyrus Madon.
Mr. Madon is a Senior Managing Partner of Brookfield Asset Management, Head of Brookfield's Private Equity Group and Chief Executive Officer of our company. Mr. Madon joined Brookfield in 1998 as Chief Financial Officer of Brookfield's real estate brokerage business. During his tenure he has held a number of senior roles across the organization, including head of Brookfield's corporate lending business. Mr. Madon began his career at Pricewaterhouse-Coopers where he worked in Corporate Finance and Recovery, both in Canada and the United Kingdom.
Craig Laurie.
Mr. Laurie is the Chief Financial Officer of our company. Mr. Laurie is also a Managing Partner of Brookfield Asset Management within the Private Equity Group. Mr. Laurie joined Brookfield Asset Management in 1997 and has held a number of senior finance positions with Brookfield Asset Management and associated companies, including from October 2008 to September 2015 the position of Executive Vice-President and Chief Financial Officer for Brookfield Residential Properties Inc. and predecessor companies. Prior to joining Brookfield Asset Management, Mr. Laurie worked in restructuring and advisory services at Deloitte & Touche. Mr. Laurie is a Chartered Accountant and holds a Bachelor of Commerce degree from Queen's University.
Our directors and officers and their associates, as a group, beneficially own, directly or indirectly, or exercise control and direction over, our units representing in the aggregate less than 1% of our issued and outstanding units on a fully exchanged basis.
6.B. COMPENSATION
The BBU General Partner pays to each of our independent directors $125,000 per year for serving on our board of directors and various board committees. Our other directors are not compensated in connection with their board service. The BBU General Partner pays the chair of the audit committee an additional $20,000 per year and the lead independent director an additional $10,000 per year.
The BBU General Partner currently does not have any employees. Pursuant to our Master Services Agreement, the Service Providers will provide or arrange for other service providers to provide day-to-day management and administrative services for our company, the Holding LP and the Holding Entities. The fees payable to the Service Providers under our Master Services Agreement are set forth under Item 7.B., "Major Shareholders and Related Party Transactions—Related Party Transactions—Our Master Services Agreement—Management Fee".
Pursuant to our Master Services Agreement, members of Brookfield's senior management and other individuals from Brookfield's global affiliates are drawn upon to fulfill obligations under our Master Services Agreement. However, these individuals, including the Brookfield employees identified in the table under Item 6.A., "Directors, Senior Management and Employees—Directors and Senior Management—Our Management", are not compensated by our company or the BBU General Partner. Instead, they continue to be compensated by Brookfield.
Pursuant to our Master Services Agreement, there may be instances in which an employee of Brookfield provides services in addition to those contemplated by our Master Services Agreement to the BBU General Partner, our company or any of our subsidiaries, or vice versa. In such cases, all or a portion of the compensation paid to an employee who provides services to the other party may be allocated to such other party.
6.C. BOARD PRACTICES
Board Structure, Practices and Committees
The structure, practices and committees of our board of directors, including matters relating to the size and composition of the board of directors, the election and removal of directors, requirements relating to board action and the powers delegated to board committees, are governed by the BBU General Partner's bye-laws. Our board of directors is responsible for supervising the management, control, power and authority of the BBU General Partner and our company except as required by applicable law or the bye-laws of the BBU General Partner. The following is a summary of certain provisions of those bye-laws that affect our governance.
|
Brookfield Business Partners
|
96
|
Size, Independence and Composition of the Board of Directors
Our board of directors may consist of between three (3) and eleven (11) directors or such other number of directors as may be determined from time to time by a resolution of the BBU General Partner's shareholders and subject to its bye-laws. Our board is currently set at eight (8) directors, a majority of whom are independent. In addition, the BBU General Partner's bye-laws provide that not more than 50% of the directors (as a group) or the independent directors (as a group) may be residents of any one jurisdiction (other than Bermuda and any other jurisdiction designated by the board of directors from time to time).
Lead Independent Director
Our board of directors has selected John Lacey to serve as the lead independent director. The lead independent director's primary role is to facilitate the functioning of the board (independently of the Service Providers and Brookfield), and to maintain and enhance the quality of our corporate governance practices. The lead independent director presides over the private sessions of our independent directors that take place following each meeting of the board and conveys the results of these meetings to the chair of the board. In addition, the lead independent director is available, when appropriate, for consultation and direct communication with unitholders or other stakeholders of our company.
Shareholders and other interested parties may communicate with any member of the board, including its chair, as well as the lead independent director and the independent directors as a group by contacting the Corporate Secretary's Office at 73 Front Street, 5
th
Floor, Hamilton, HM 12, Bermuda.
Election and Removal of Directors
Our board of directors is appointed by shareholders of BBU General Partner and each of our current directors will serve until the earlier of his or her death, resignation, removal from office or until a successor is appointed. Vacancies on the board of directors may be filled and additional directors may be added by a resolution of the BBU General Partner's shareholders or a vote of the directors then in office. A director may be removed from office by a resolution duly passed by the BBU General Partner's shareholders. A director will be automatically removed from the board of directors if he or she becomes bankrupt, insolvent or suspends payments to his or her creditors, or becomes prohibited by law from acting as a director.
Action by the Board of Directors
Our board of directors may take action in a duly convened meeting at which a quorum is present or by a written resolution signed by all directors then holding office. Our board of directors will hold a minimum of four meetings per year. When action is to be taken at a meeting of the board of directors, the affirmative vote of a majority of the votes cast is required for any action to be taken.
Transactions Requiring Approval by the Governance and Nominating Committee
Our governance and nominating committee has approved a conflicts policy which addresses the approval requirement and other requirements for transactions in which there is greater potential for a conflict of interest to arise. These transactions include:
|
•
|
the dissolution of our company;
|
|
•
|
any material amendment to our Master Services Agreement, our Limited Partnership Agreement or the Holding LP Limited Partnership Agreement;
|
|
•
|
any material service agreement or other arrangement pursuant to which Brookfield will be paid a fee, or other consideration other than any agreement or arrangement contemplated by our Master Services Agreement;
|
|
•
|
co-investments by us with Brookfield;
|
|
•
|
acquisitions by us from, and dispositions by us to, Brookfield;
|
|
•
|
any other material transaction involving us and Brookfield; and
|
|
•
|
termination of, or any determinations regarding indemnification under, our Master Services Agreement.
|
Our conflicts policy requires the transactions described above to be approved by our governance and nominating committee. Pursuant to our conflicts policy, our governance and nominating committee may grant approvals for any of the transactions described above in the form of general guidelines, policies or procedures in which case no further special approval will be required in connection with a particular transaction or matter permitted thereby. The conflicts policy can be amended at the discretion of our governance and nominating committee. See Item 7.B., "Related Party Transactions—Conflicts of Interest and Fiduciary Duties".
|
97
|
Brookfield Business Partners
|
Service Contracts
There are no service contracts with directors that provide benefits upon termination of office or services.
Transactions in which a Director has an Interest
A director who directly or indirectly has an interest in a contract, transaction or arrangement with the BBU General Partner, our company or certain of our affiliates is required to disclose the nature of his or her interest to the full board of directors. Such disclosure may generally take the form of a general notice given to the board of directors to the effect that the director has an interest in a specified company or firm and is to be regarded as interested in any contract, transaction or arrangement with that company or firm or its affiliates. A director may participate in any meeting called to discuss or any vote called to approve the transaction in which the director has an interest and no transaction approved by the board of directors will be void or voidable solely because the director was present at or participates in the meeting in which the approval was given provided that the board of directors or a board committee authorizes the transaction in good faith after the director's interest has been disclosed or the transaction is fair to the BBU General Partner and our company at the time it is approved.
Transactions Requiring Unitholder Approval
Limited partners have consent rights with respect to certain fundamental matters and related party transactions (in accordance with MI 61-101) and on any other matters that require their approval in accordance with applicable securities laws and stock exchange rules. See Item 10.B., "Description of the Holding LP Limited Partnership Agreement—Amendment of the Holding LP Limited Partnership Agreement", "Description of the Holding LP Limited Partnership Agreement—Opinion of Counsel and Limited Partner Approval" and "Description of the Holding LP Limited Partnership Agreement—Withdrawal of the Managing General Partner".
Audit Committee
Our board of directors is required to maintain an audit committee that operates pursuant to a written charter. The audit committee consists solely of independent directors and each member is financially literate, which is defined under our audit committee charter to mean having the ability to read and understand a set of financial statements that present a breadth and level of complexity of accounting issues that are generally comparable to the breadth and complexity of the issues that can reasonably be expected to be raised by our financial statements. Not more than 50% of the audit committee members may be residents of any one jurisdiction (other than Bermuda and any other jurisdiction designated by the board of directors from time to time). See Item 6.A., "Directors and Senior Management—Governance" for the names of our audit committee members.
The audit committee is responsible for assisting and advising our board of directors with respect to:
|
•
|
our accounting and financial reporting processes;
|
|
•
|
the integrity and audits of our financial statements;
|
|
•
|
our compliance with legal and regulatory requirements; and
|
|
•
|
the qualifications, performance and independence of our independent accountants.
|
The audit committee is responsible for engaging our independent auditors, reviewing the plans and results of each audit engagement with our independent auditors, approving professional services provided by our independent accountants, considering the range of audit and non-audit fees charged by our independent auditors and reviewing the adequacy of our internal accounting controls.
Governance and Nominating Committee
Our board of directors is required to maintain at all times a governance and nominating committee that operates pursuant to a written charter. The governance and nominating committee consists solely of independent directors and not more than 50% of the governance and nominating committee members may be residents of any one jurisdiction (other than Bermuda and any other jurisdiction designated by the board of directors from time to time).
The governance and nominating committee has approved a conflicts policy which addresses the approval and other requirements for transactions in which there is a greater potential for a conflict of interest to arise. The governance and nominating committee may be required to approve any such transactions. See "—Transactions Requiring Approval by the Governance and Nominating Committee".
|
Brookfield Business Partners
|
98
|
The governance and nominating committee is responsible for approving the appointment by the sitting directors of a person to the office of director and for recommending a slate of nominees for election as directors by the BBU General Partner's shareholders. The governance and nominating committee is responsible for assisting and advising the board of directors with respect to matters relating to the general operation of the board of directors, our governance, the governance of the BBU General Partner and the performance of the board of directors. The governance and nominating committee is responsible for reviewing and making recommendations to the board of directors of the BBU General Partner concerning the remuneration of directors and committee members and any changes in the fees to be paid pursuant to our Master Services Agreement.
Director Unit Ownership Requirements
The BBU General Partner believes that our directors can better represent our unitholders if they have economic exposure to our company themselves. Our company expects that directors should hold sufficient number of our units such that the acquisition costs of units held by such directors are equal to at least two times their annual retainer (the "
Unit Ownership Requirement
"), as determined by the board of directors from time to time.
Our directors are required to purchase our units on an annual basis in an amount not less than 20% of the Unit Ownership Requirement until such requirement has been met. Our directors are required to achieve the Unit Ownership Requirement within five years of joining the board. In the event of an increase in the annual retainer fee, our directors will have two years from the date of the change to comply with the Unit Ownership Requirement. In the case of directors who have served on our board less than five years at the date of the change, such directors will be required to comply with the Unit Ownership Requirement by the date that is the later of: (i) the fifth anniversary of their appointment to the board, and (ii) two years following the date of the change in retainer fee.
Status as Foreign Private Issuer
Because we qualify as a foreign private issuer under SEC rules, we are permitted to follow the corporate governance practices of Bermuda (the jurisdiction in which we are organized) in lieu of the NYSE corporate governance requirements that would otherwise be applicable to us. We currently follow the same corporate governance practices as would be applicable to U.S. domestic limited partnerships. However, we may in the future elect to follow Bermuda law for certain corporate governance practices, as permitted by the rules of NYSE, in which case our unitholders would not be afforded the same protection as provided under NYSE corporate governance standards. Following our home country governance practices as opposed to the requirements that would otherwise apply to a limited partnership listed on the NYSE may provide less protection than is accorded to investors of U.S. domestic issuers.
Indemnification and Limitations on Liability
Our Limited Partnership Agreement
The laws of Bermuda permit the partnership agreement of a limited partnership, such as our company, to provide for the indemnification of a partner, the officers and directors of a partner and any other person against any and all claims and demands whatsoever, except to the extent that the indemnification may be held by the courts of Bermuda to be contrary to public policy or to the extent that the laws of Bermuda prohibit indemnification against personal liability that may be imposed under specific provisions of the laws of Bermuda. The laws of Bermuda also permit a partnership to pay or reimburse an indemnified person's expenses in advance of a final disposition of a proceeding for which indemnification is sought. See Item 10.B., "Memorandum and Articles of Association—Description of our Units and our Limited Partnership Agreement—Indemnification; Limitations on Liability" for a description of the indemnification arrangements in place under our Limited Partnership Agreement.
The BBU General Partner's Bye-laws
The laws of Bermuda permit the bye-laws of an exempted company, such as the BBU General Partner, to provide for the indemnification of its officers, directors and shareholders and any other person designated by our company against any and all claims and demands whatsoever, except to the extent that the indemnification may be held by the courts of Bermuda to be contrary to public policy or to the extent that the laws of Bermuda prohibit indemnification against personal liability that may be imposed under specific provisions of Bermuda law, such as the prohibition under the Bermuda Companies Act 1981 to indemnify liabilities arising from fraud or dishonesty. The BBU General Partner's bye-laws provide that, as permitted by the laws of Bermuda, it will pay or reimburse an indemnified person's expenses in advance of a final disposition of a proceeding for which indemnification is sought.
|
99
|
Brookfield Business Partners
|
Under the BBU General Partner's bye-laws, the BBU General Partner is required to indemnify, to the fullest extent permitted by law, its affiliates, directors, officers, resident representative, shareholders and employees, any person who serves on a governing body of the Holding LP or any of its subsidiaries and certain others against any and all losses, claims, damages, liabilities, costs or expenses (including legal fees and expenses), judgments, fines, penalties, interest, settlements or other amounts arising from any and all claims, demands, actions, suits or proceedings, incurred by an indemnified person in connection with our operations and activities or in respect of or arising from their holding such positions, except to the extent that the claims, liabilities, losses, damages, costs or expenses are determined to have resulted from the indemnified person's bad faith, fraud or willful misconduct, or in the case of a criminal matter, action that the indemnified person knew to have been unlawful. In addition, under the BBU General Partner's bye-laws: (i) the liability of such persons has been limited to the fullest extent permitted by law and except to the extent that their conduct involves bad faith, fraud or willful misconduct, or in the case of a criminal matter, action that the indemnified person knew to have been unlawful; and (ii) any matter that is approved by the independent directors will not constitute a breach of any duties stated or implied by law or equity, including fiduciary duties. The BBU General Partner's bye-laws require it to advance funds to pay the expenses of an indemnified person in connection with a matter in which indemnification may be sought until it is determined that the indemnified person is not entitled to indemnification.
Insurance
We have obtained insurance coverage under which our directors are insured, subject to the limits of the policy, against certain losses arising our from claims made against such directors by reason of any acts or omissions covered under the policy in their respective capacities as directors, including certain liabilities under securities laws. The insurance applies in certain circumstances where we may not indemnify directors and officers for their acts or omissions.
6.D. EMPLOYEES
The BBU General Partner does not have any employees. Our company has entered into a Master Services Agreement with the Service Providers, pursuant to which each Service Provider and certain other affiliates of Brookfield provide, or arrange for other Service Providers to provide, day-to-day management and administrative services for our company, the Holding LP and the Holding Entities.
As at
December 31, 2017
, our operating companies had approximately 26,900 employees, including approximately 6,900 within our construction services business, approximately 9,800 in our business services segment, approximately 1,500 in our energy segment and approximately 8,700 in our industrial operations segment. Our employees are primarily based in North America (36%), Brazil (20%), Middle East (16%), Australia (12%), and the United Kingdom (9%). Our company believes that its employees are critical to its success and its relationships with its employees and with any labor organizations that represent its employees are good.
6.E. SHARE OWNERSHIP
Our directors and officers and their associates, as a group, beneficially own, directly or indirectly, or exercise control and direction over, our units representing in the aggregate less than 1% of our issued and outstanding units on a fully exchanged basis.
The Unit Option Plan
Our company has adopted a Unit Option Plan to enable our company to grant options to eligible persons should it be considered desirable to do so. The plan provides for the issuance of our units (or delivery of our units purchased in the open market) on the exercise of an option with a value equal to the amount, if any, by which the fair market value of a unit on the date of exercise exceeds the exercise price of the option.
The Unit Option Plan allows for the issuance of up to 5 million units, representing approximately 5% of the number of units (on a fully exchanged basis) outstanding. When our units are issued to a participant upon the exercise of an option, the number of units issued to the participant in respect of the in-the-money amount of the option will be deducted from the maximum number of units issuable under the Unit Option Plan.
The maximum number of our units issuable to any one person under the Unit Option Plan is 5% of the outstanding units (on a fully exchanged, non-diluted basis) less the aggregate number of our units reserved for issuance to such person under any other security based compensation arrangement of our company. The number of our units issuable to insiders, at any time, under the Unit Option Plan and all other security based compensation arrangements of our company cannot exceed 10% of the issued and outstanding units (on a fully exchanged basis). The number of our units issued to insiders, within any one-year period, under the Unit Option Plan and all other security based compensation arrangements of our company cannot exceed 10% of the issued and outstanding units (on a fully exchanged basis).
|
Brookfield Business Partners
|
100
|
The exercise price of an option under the Unit Option Plan is established at the time such option is granted, which shall be in U.S. dollars and shall not be less than the fair market value on the date of grant of such option (based on the closing price of a unit on the NYSE on the last trading day preceding the date of grant), and shall, in all cases, be not less than such amount required by applicable regulatory authorities from time to time. If the approval date for options to be granted falls within a blackout period, the effective grant date for such options will be no earlier than six business days after the date on which the blackout period ends, and the exercise price for such options shall not be less than the volume-weighted average price of a unit on the NYSE for the five business days preceding the effective grant date.
Our board of directors may determine vesting terms for options and may determine that an option shall be vested and exercisable in installments. Unless otherwise specified in the option agreement or other agreement with the participant, options become vested as to 20% on the first anniversary date after the grant and as to 20% on each subsequent anniversary date up to and including the fifth anniversary date of the grant. Our board of directors may determine the maximum period following the grant date during which a vested option may be exercised, subject to the provision that options shall not be exercisable later than 10 years after the date of grant, provided that, if an option would otherwise expire during a blackout period or within 10 days after the end of the blackout period, to the extent permitted by applicable law, the term of such option shall automatically be extended until 10 days after the end of the blackout period. To the extent permitted by law, our board of directors may, from time to time, delegate to an administrative committee or the chair thereof all or any of the powers conferred on our directors under the Unit Option Plan.
Eligible persons under the Unit Option Plan are: (i) officers or employees of our company or any affiliate of our company whose location of employment is within the United States, without regard to that individual's tax residence or citizenship and for which our units constitute "service recipient stock" within the meaning of Section 409A of the U.S. Internal Revenue Code; (ii) officers or employees of our company or any affiliate of our company whose location of employment is within the United Kingdom or any jurisdiction other than the United States, Australia or Canada, without regard to that individual's tax residence or citizenship; and (iii) any other persons (other than non-employee directors) so designated by our board of directors, subject to applicable laws and regulations. Options may not be assigned; however, the foregoing does not prohibit a holder from directing payments under the Unit Option Plan to his or her legal representative.
All options immediately cease to be exercisable if the holder ceases to be an eligible person under the Unit Option Plan for any reason, except termination without cause or due to a holder's death, retirement or continuous leave of absence as a result of disability or leave authorized by statute. If the holder's employment is terminated without cause or due to a continuous leave of absence as a result of disability or leave authorized by statute, the holder has 60 days after the holder's termination date to exercise vested options and options which have not vested by the termination date are cancelled on the termination date. If the holder's employment is terminated for cause, by resignation, or by a continuous leave of absence other than as a result of disability or leave authorized by statute, all options whether vested or not vested by the termination date are cancelled on the termination date. If the holder retires, vested options remain exercisable until the original expiry date and options which have not vested by the termination date are cancelled on the termination date. If the holder dies, the holder's legal representatives have six months to exercise vested options.
Our board of directors may make the following types of amendments to the Unit Option Plan without seeking unitholder approval: (i) amendments of a "housekeeping" or administrative nature, including any amendment for the purpose of curing any ambiguity, error or omission in the Unit Option Plan or to correct or supplement any provision of the Unit Option Plan that is inconsistent with any other provision of the Unit Option Plan; (ii) amendments necessary to comply with the provisions of applicable law (including the rules, regulations and policies of the TSX and the NYSE); (iii) amendments necessary for awards to qualify for favorable treatment under applicable tax laws; (iv) amendments to the vesting provisions of the Unit Option Plan or any option; (v) amendments to the termination or early termination provisions of the Unit Option Plan or any option, whether or not such option is held by an insider, provided any such amendment does not entail an extension beyond the original expiry date; and (vi) amendments necessary to suspend or terminate the Unit Option Plan.
|
101
|
Brookfield Business Partners
|
Unitholder approval is required for certain amendments to the Unit Option Plan, including: (i) any amendment to increase the number of our units issuable under the Unit Option Plan, including an increase to a fixed maximum number of units or a change from a fixed maximum number of units to a fixed maximum percentage; (ii) any amendment to the Unit Option Plan that increases the length of the period after a blackout period during which options may be exercised; (iii) any amendment which would result in the exercise price for any option granted under the Unit Option Plan being lower than the fair market value of our units at the time the option is granted; (iv) any amendment which reduces the exercise price of an option, except in connection with any change in our outstanding units by reason of any stock dividend or split, recapitalization, reorganization, amalgamation, consolidation, merger or other corporate change; (v) any amendment expanding the categories of eligible person which may permit the introduction or reintroduction of non-employee directors on a discretionary basis or any amendment to remove or exceed the insider participation limit; (vi) any amendment extending the term of an option beyond its original expiry date, or a date beyond the permitted automatic extension in the case of an option expiring during a blackout period; (vii) any amendment which would permit Options to be transferable or assignable other than for normal estate settlement purposes; (viii) any amendment to the amendment provisions; and (ix) amendments required to be approved by unitholders under applicable law (including the rules, regulations and policies of the TSX and the NYSE).
7.A. MAJOR SHAREHOLDERS
As at the date of this Form 20-F, there are 66,185,798 units of our company outstanding, or 129,281,295 units on a fully-exchanged basis. To our knowledge, as at the date of this Form 20-F, no person or company, other than Brookfield beneficially owns or controls or directs, directly or indirectly, more than 5% of our units on a fully-exchanged basis (based on reports filed under Section 13(d) or Section 13(g) of the Exchange Act).
As at
March 8, 2018
, 16,409 of our outstanding units were held by holders of record in the United States, not including units of our company held of record by DTC. As at
March 8, 2018
, DTC was the holder of record of 7,273,911 units.
As at
March 8, 2018
, 24,184,488 of our outstanding units were held by holders of record in Canada, not including units of our company held of record by CDS. As at
March 8, 2018
, CDS was the holder of record of 34,705,438 units.
The following table presents information regarding the beneficial ownership of our units, as at
December 31, 2017
, by each person or entity that beneficially owns 5% or more of our units (based on reports filed under Section 13(d) or Section 13(g) of the Exchange Act) on a fully-exchanged basis.
|
|
Units Outstanding
|
|
|||||||
|
Name and Address
|
Units Owned
|
Percentage
|
|
||||||
|
Brookfield Asset Management Inc.
|
|
|
|
||||||
|
Suite 300, Brookfield Place, 181 Bay Street
|
|
|
|
||||||
|
Toronto, Ontario M5J 2T3
|
87,879,747
|
|
68.0
|
%
|
(1
|
)
|
|||
|
Partners Limited
|
|
|
|
||||||
|
Suite 400, 51 Yonge Street
|
|
|
|
||||||
|
Toronto, Ontario M5E 1J1
|
89,613,876
|
|
69.3
|
%
|
(2
|
)
|
|||
|
(1)
|
Consists of 24,784,250 units and 63,095,497 redemption-exchange units. In addition, Brookfield has an indirect general partnership interest in the BPP General Partner. See also the information contained in this Form 20-F under Item 10.B., "Memorandum and Articles of Association—Description of our Units and our Limited Partnership Agreement".
|
|
(2)
|
Partners Limited is a corporation whose principal business mandate is to hold shares of Brookfield, directly or indirectly, for the long-term. Partners Limited owns all of Brookfield's Class B Limited Voting Shares entitling it to appoint one-half of the Board of Directors of Brookfield. In addition, Partners Limited owns 49% of the general partner units of Partners Value Investments LP. Partners Limited may be deemed to be the beneficial owner of 89,613,876 of our units, constituting approximately 69.3% of the issued and outstanding units, assuming that all of the redemption-exchange units are exchanged for our units pursuant to the Redemption-Exchange Mechanism described in Item 10.B "Description of the Holding LP Limited Partnership Agreement—Redemption-Exchange Mechanism." This amount includes 1,716,780 of our units beneficially held by Partners Value Investments LP. Partners Limited may be deemed to have the power (together with each of Brookfield and Partners Value Investments LP) to vote or direct the vote of the units beneficially owned by it or to dispose of such units other than 17,349 of our units with respect to which Partners Limited has sole voting and investment power.
|
Our major unitholders have the same voting rights as all other holders of our units.
|
Brookfield Business Partners
|
102
|
7.B. RELATED PARTY TRANSACTIONS
Brookfield Asset Management
Brookfield Asset Management is a global alternative asset manager with approximately $285 billion in assets under management. It has more than a 100-year history of owning and operating assets with a focus on real estate, renewable power, infrastructure and private equity. Brookfield Asset Management offers a range of public and private investment products and services, and is co-listed on the New York, Toronto and Euronext stock exchanges under the symbols BAM, BAM.A and BAMA, respectively.
Brookfield believes its operating experience is an essential differentiating factor in its past ability to generate significant risk-adjusted returns. In addition, Brookfield has demonstrated particular expertise in sourcing and executing large-scale multifaceted transactions across a wide spectrum of sectors and geographies.
As a global alternative asset manager, Brookfield brings a strong and proven corporate platform supporting legal, tax, operations oversight, investor reporting, portfolio administration and other client services functions. Brookfield's management team is multi-disciplinary, comprising investment and operations professionals, each with significant expertise in evaluating and executing acquisition opportunities on behalf of itself and institutional investors.
We are an affiliate of Brookfield and have a number of agreements and arrangements with Brookfield, as described below.
While we believe that our ongoing relationship with Brookfield provides us with a unique competitive advantage as well as access to opportunities that would otherwise not be available to us, we operate very differently from an independent, stand-alone entity. We describe below this relationship as well as potential conflicts of interest (and the methods for resolving them) and other material considerations arising from our relationship with Brookfield. We include only material related party transactions in the notes to our consolidated financial statements.
Our Master Services Agreement
The Service Recipients have entered into a Master Services Agreement pursuant to which the Service Providers have agreed to provide or arrange for other Service Providers to provide management and administration services to our company and the other Service Recipients.
The following is a summary of certain provisions of our Master Services Agreement. Because this description is only a summary of our Master Services Agreement, it does not necessarily contain all of the information that you may find useful. We therefore urge you to review our Master Services Agreement in its entirety. Our Master Services Agreement is filed as exhibit to this Form 20-F and is also available on our SEDAR profile at
www.sedar.com.
See also Item 10.C., "Material Contracts", Item 10.H., "Documents on Display" and Item 19., "Exhibits".
Appointment of the Service Providers and Services Rendered
Under our Master Services Agreement, the Service Recipients have appointed the Service Providers to provide or arrange for the provision by an appropriate Service Provider of the following services:
|
•
|
providing overall strategic advice to the applicable Service Recipients including advising with respect to the expansion of their business into new markets;
|
|
•
|
identifying, evaluating and recommending to the Service Recipients acquisitions or dispositions from time to time and, where requested to do so, assisting in negotiating the terms of such acquisitions or dispositions;
|
|
•
|
recommending and, where requested to do so, assisting in the raising of funds whether by way of debt, equity or otherwise, including the preparation, review or distribution of any prospectus or offering memorandum in respect thereof and assisting with communications support in connection therewith;
|
|
•
|
recommending to the Service Recipients suitable candidates to serve on the boards of directors or their equivalent governing bodies of the operating businesses;
|
|
•
|
making recommendations with respect to the exercise of any voting rights to which the Service Recipients are entitled in respect of the operating businesses;
|
|
•
|
making recommendations with respect to the payment of dividends or other distributions by the Service Recipients, including distributions by our company to our unitholders;
|
|
103
|
Brookfield Business Partners
|
|
•
|
monitoring and/or oversight of the applicable Service Recipient's accountants, legal counsel and other accounting, financial or legal advisors and technical, commercial, marketing and other independent experts, including making recommendations with respect to, and supervising the making of all tax elections, determinations and designations, the timely calculation and payment of taxes payable and the filing of all tax returns due, by each Service Recipient, and overseeing the preparation of the Service Recipients' annual consolidated financial statements and quarterly interim financial statements;
|
|
•
|
making recommendations in relation to and effecting, when requested to do so, the entry into insurance of each Service Recipient's assets, together with other insurances against other risks, including directors and officers insurance as the relevant Service Provider and the relevant board of directors or its equivalent governing body may from time to time agree;
|
|
•
|
arranging for individuals to carry out the functions of principal executive, accounting and financial officers for our company only for purposes of applicable securities laws; and
|
|
•
|
providing individuals to act as senior officers of the Service Recipients as agreed from time to time, subject to the approval of the relevant board of directors or its equivalent governing body.
|
Notwithstanding the foregoing, all investment advisory services (as defined in our Master Services Agreement) must be provided solely to the Holding LP.
The Service Providers' activities are subject to the supervision of the board of directors or equivalent governing body of BBU General Partner and of each of the other Service Recipients, as applicable. The relevant governing body remains responsible for all investment and divestment decisions made by the Service Recipient.
Any Service Provider may, from time to time, appoint an affiliate of Brookfield to act as a new Service Provider under our Master Services Agreement, effective upon the execution of a joinder agreement by the new Service Provider.
Management Fee
Pursuant to our Master Services Agreement, we pay a quarterly base management fee to the Service Providers equal to 0.3125% (1.25% annually) of the total capitalization of our company. For purposes of calculating the base management fee, our total capitalization of our company is equal to the quarterly volume-weighted average trading price of a unit on the principal stock exchange for our units (based on trading volumes) multiplied by the number of units outstanding at the end of the quarter (assuming full conversion of the redemption-exchange units into units), plus the value of securities of the other Service Recipients that are not held by us, plus all outstanding third party debt with recourse to a Service Recipient, less all cash held by such entities. For any quarter in which the BBU General Partner determines that there is insufficient available cash to pay the base management fee as well as the next regular distribution on our units, the Service Recipients may elect to pay all or a portion of the base management fee in our units or redemption-exchange units, subject to certain conditions. The aggregate base management fee for the year ended December 31, 2017 was approximately
$33 million
.
Brookfield has established and manages a number of private investment entities, managed accounts, joint ventures, consortiums, partnerships and investment funds whose investment objectives include the acquisition of businesses similar to those that we operate and Brookfield may in the future establish similar funds. Brookfield Asset Management has agreed that it will offer our company the opportunity to take up Brookfield's share of any acquisition through these consortium arrangements or by one of these entities that involves the acquisition of business services and industrial operations that are suitable for us, subject to certain limitations. To the extent that under any other arrangement involving Brookfield we are obligated to pay a base management fee (directly or indirectly through an equivalent arrangement) to the Service Providers (or any affiliate) on a portion of our capital that is comparable to the base management fee, the base management fee payable for each quarter in respect thereof generally will be reduced on a dollar-for-dollar basis by our proportionate share of the comparable base management fee (or equivalent amount) under such other arrangement for that quarter. The base management fee will not be reduced by the amount of any incentive distribution payable by any Service Recipient or operating entity to the Service Providers (or any other affiliate) (for which there is a separate credit mechanism under the Holding LP Limited Partnership Agreement), or any other fees that are payable by any operating entity to Brookfield for financial advisory, operations and maintenance, development, operations management and other services.
The only services that are currently contemplated to be provided by Brookfield that would not give rise to an offsetting reduction in the base management fee described above are in connection with the provision of insurance and information technology support where the Service Recipients and other members of the Brookfield group participate in group-wide centralized programs, together with other Brookfield affiliates, in order to benefit from economies of scale. While not currently contemplated, it is also possible that a Brookfield affiliate could be retained to provide operations or development services that are outside the scope of the Master Services Agreement, such as services related to residential land development, in which case any such fees would not result in offsetting reductions to the base management fee.
|
Brookfield Business Partners
|
104
|
Pursuant to our Master Services Agreement, there may be instances in which an employee of Brookfield provides services in addition to those contemplated by our Master Services Agreement to the BBU General Partner, our company or any of our subsidiaries, or vice versa. In such cases, all or a portion of the compensation paid to an employee who provides services to the other party may be allocated to such other party.
Reimbursement of Expenses and Certain Taxes
The relevant Service Recipient will reimburse the Service Providers for all other out-of-pocket fees, costs and expenses incurred in connection with the provision of the services including those of any third party. Such out-of-pocket fees, costs and expenses are expected to include, among other things: (i) fees, costs and expenses relating to any debt or equity financing; (ii) fees, costs and expenses incurred in connection with the general administration of any Service Recipient; (iii) taxes, licenses and other statutory fees or penalties levied against or in respect of a Service Recipient; (iv) amounts owed by the Service Providers under indemnification, contribution or similar arrangements; (v) fees, costs and expenses relating to our financial reporting, regulatory filings and investor relations and the fees, costs and expenses of agents, advisors and other persons who provide services to a Service Recipient; and (vi) any other fees, costs and expenses incurred by the Service Providers that are reasonably necessary for the performance by the Service Providers of their duties and functions under our Master Services Agreement. However, the Service Recipients are not required to reimburse the Service Providers for the salaries and other remuneration of their management, personnel or support staff who carry out any services or functions for such Service Recipients or overhead for such persons.
In addition, the Service Recipients are required to pay all fees, costs and expenses incurred in connection with the investigation, acquisition, holding or disposal of any asset or business that is made or that is proposed to be made by us. Such additional fees, expenses and costs represent out-of-pocket costs associated with investment activities that will be undertaken pursuant to our Master Services Agreement.
The Service Recipients are also required to pay or reimburse the Service Providers for all sales, use, value added, goods and services, harmonized sales, withholding or other similar taxes or customs duties or other governmental charges levied or imposed by reason of our Master Services Agreement, any service agreement or any agreement our Master Services Agreement contemplates, other than income taxes, corporation taxes, capital taxes or other similar taxes payable by the Service Providers, which are personal to the Service Providers.
Assignment
Our Master Services Agreement may not be assigned by the Service Providers without the prior written consent of our company except that (i) any Service Provider may subcontract or arrange for the provision of services by another Service Provider, provided that the Service Providers remain responsible for any services provided by such other Service Provider, and (ii) any of the Service Providers may assign the agreement to an affiliate or to a person that is its successor by way of merger, amalgamation, consolidation or acquisition of the business of the Service Provider.
Termination
Our Master Services Agreement continues in perpetuity until terminated in accordance with its terms. However, the Service Recipients may terminate our Master Services Agreement upon written notice of termination from the BBU General Partner to the Service Providers if any of the following occurs:
|
•
|
any of the Service Providers defaults in the performance or observance of any material term, condition or covenant contained in the agreement in a manner that results in material harm to the Service Recipients and the default continues unremedied for a period of 30 days after written notice of the breach is given to such Service Provider;
|
|
•
|
any of the Service Providers engages in any act of fraud, misappropriation of funds or embezzlement against any Service Recipient that results in material harm to the Service Recipients;
|
|
•
|
any of the Service Providers is grossly negligent in the performance of its obligations under the agreement and such gross negligence results in material harm to the Service Recipients; or
|
|
•
|
certain events relating to the bankruptcy or insolvency of each of the Service Providers.
|
The Service Recipients have no right to terminate for any other reason, including if any of the Service Providers or Brookfield experiences a change of control. The BBU General Partner may only terminate our Master Services Agreement on behalf of our company with the prior unanimous approval of our independent directors.
Our Master Services Agreement expressly provides that our Master Services Agreement may not be terminated by the BBU General Partner due solely to the poor performance or the underperformance of any of our operations.
|
105
|
Brookfield Business Partners
|
The Service Providers may terminate our Master Services Agreement upon written notice of termination to the Service Recipients if any Service Recipient defaults in the performance or observance of any material term, condition or covenant contained in the agreement in a manner that results in material harm to the Service Providers and the default continues unremedied for a period of 30 days after written notice of the breach is given to the Service Recipient. The Service Providers may also terminate our Master Services Agreement upon the occurrence of certain events relating to the bankruptcy or insolvency of the Service Recipients.
If our Master Services Agreement is terminated, the Licensing Agreements, the Relationship Agreement and any of Brookfield Asset Management's obligations under the Relationship Agreement will also terminate.
Indemnification and Limitations on Liability
Under our Master Services Agreement, the Service Providers have not assumed and do not assume any responsibility other than to provide or arrange for the provision of the services called for thereunder in good faith and will not be responsible for any action that the Service Recipients take in following or declining to follow the advice or recommendations of the Service Providers. In addition, under our Master Services Agreement, the Service Providers and the related indemnified parties will not be liable to the Service Recipients for any act or omission, except for conduct that involved bad faith, fraud, willful misconduct, gross negligence or in the case of a criminal matter, conduct that the indemnified person knew was unlawful. The maximum amount of the aggregate liability of the Service Providers or any of their affiliates, or of any director, officer, agent, subcontractor, contractor, delegate, member, partner, shareholder, employee or other representative of the Service Providers or any of their affiliates, will be equal to the amounts previously paid by the Service Recipients in respect of services pursuant to our Master Services Agreement in the two most recent calendar years. The Service Recipients have agreed to indemnify the Service Providers, their affiliates, directors, officers, agents, subcontractors, delegates, members, partners, shareholders and employees to the fullest extent permitted by law from and against any claims, liabilities, losses, damages, costs or expenses (including legal fees) incurred by an indemnified person or threatened in connection with any and all actions, suits, investigations, proceedings or claims of any kind whatsoever, whether arising under statute or action of a governmental authority or in connection with our respective businesses, investments and activities or in respect of or arising from our Master Services Agreement or the services provided by the Service Providers, except to the extent that the claims, liabilities, losses, damages, costs or expenses are determined to have resulted from the indemnified person's bad faith, fraud or willful misconduct, gross negligence or in the case of a criminal matter, action that the indemnified person knew to have been unlawful.
Outside Activities
Our Master Services Agreement does not prohibit the Service Providers or their affiliates from engaging in other business activities or sponsoring, or providing services to, third parties that compete directly or indirectly with the Service Recipients.
Other Services
Brookfield may provide services to our operating businesses which are outside the scope of our Master Services Agreement under arrangements that are on market terms and conditions and pursuant to which Brookfield will receive fees. The services that may be provided under these arrangements include financial advisory, operations and maintenance, development, operating management and other services.
Relationship Agreement
Our company, the Holding LP, the Holding Entities, the Service Providers and Brookfield Asset Management have entered into an agreement, referred to as the Relationship Agreement, that governs aspects of the relationship among them. Pursuant to the Relationship Agreement, Brookfield Asset Management has agreed that we will serve as the flagship public company for its business services and industrial operations and the primary entity through which Brookfield owns and operates these businesses on a global basis.
|
Brookfield Business Partners
|
106
|
An integral part of our strategy is to pursue acquisitions through consortium arrangements with institutional investors, strategic partners or financial sponsors and to form partnerships to pursue acquisitions on a specialized or global basis. Brookfield has also established and manages a number of private investment entities, managed accounts, joint ventures, consortiums, partnerships and investment funds whose investment objectives include the acquisition of businesses similar to those that we operate and Brookfield may in the future establish similar funds. Nothing in the Relationship Agreement will limit or restrict Brookfield from establishing or advising these or similar entities or limit or restrict any such entities from carrying out any acquisition. Brookfield Asset Management has agreed that it will offer us the opportunity to take up Brookfield's share of any acquisition through these consortium arrangements or by one of these entities that involves the acquisition of business services and industrial operations that are suitable for us, subject to certain limitations. We expect to invest in and/or alongside funds created, managed and sponsored by Brookfield. To the extent that we invest in or alongside funds created, managed or sponsored by Brookfield, we may pay a base management fee (directly or indirectly through an equivalent arrangement) on a portion of our capital that is comparable to the base management fee payable pursuant to our Master Services Agreement. In this case, the base management fee payable for each quarter pursuant to the Master Services Agreement generally will be reduced on a dollar-for-dollar basis by our proportionate share of the comparable base management fee (or equivalent amount) under such other arrangement for that quarter. The payment of base management fees under such other arrangements will not have any impact on the incentive distribution amount that Brookfield may be entitled to receive from the Holding LP. Brookfield may be entitled to performance or incentive distributions in respect of funds created, managed or sponsored by Brookfield, and we may invest in or alongside such funds. To the extent that any Holding Entity or any operating business pays to Brookfield any comparable performance or incentive distribution, the amount of any future incentive distributions payable in respect of our Special LP Units will be reduced in an equitable manner to avoid duplication of distributions; however, any such comparable performance or incentive distribution will not result in a reduction to the base management fee payable pursuant to the Master Services Agreement.
Under the terms of the Relationship Agreement, our company, the Holding LP and the Holding Entities have acknowledged and agreed that Brookfield carries on a diverse range of businesses worldwide, and that except as explicitly provided in the Relationship Agreement, the Relationship Agreement does not in any way limit or restrict Brookfield from carrying on its business.
Our ability to grow depends in part on Brookfield identifying and presenting us with acquisition opportunities. Brookfield's commitment to us and our ability to take advantage of opportunities is subject to a number of limitations such as our financial capacity, the suitability of the acquisition in terms of the underlying asset characteristics and its fit with our strategy, limitations arising from the tax and regulatory regimes that govern our affairs and certain other restrictions. Under the terms of the Relationship Agreement, our company, the Holding LP and the Holding Entities have acknowledged and agreed that, subject to providing us the opportunity to participate on the basis described above, Brookfield may pursue other business activities and provide services to third parties that compete directly or indirectly with us. In addition, Brookfield has established or advised, and may continue to establish or advise, other entities that rely on the diligence, skill and business contacts of Brookfield's professionals and the information and acquisition opportunities they generate during the normal course of their activities. Our company, the Holding LP and the Holding Entities have acknowledged and agreed that some of these entities may have objectives that overlap with our objectives or may acquire business services and industrial operations that could be considered appropriate acquisitions for us, and that Brookfield may have financial incentives to assist those other entities over us. If any of the Service Providers determines that an opportunity is not suitable for us, Brookfield may still pursue such opportunity on its own behalf. Our company, the Holding LP and the Holding Entities have further acknowledged and agreed that nothing in the Relationship Agreement will limit or restrict: (i) Brookfield's ability to make any investment recommendation or take any other action in connection with its public securities businesses; (ii) Brookfield from investing in any loans or debt securities or from taking any action in connection with any loan or debt security notwithstanding that the underlying collateral comprises or includes business services and industrial operations provided that the original purpose of the investment was not to acquire a controlling interest in such business services and industrial operations; or (iii) Brookfield from acquiring or holding an investment of less than 5% of the outstanding shares of a publicly traded company or from carrying out any other investment in a company or real estate portfolio where the underlying assets do not principally constitute business services and industrial operations. Due to the foregoing, we expect to compete from time to time with other affiliates of Brookfield Asset Management or other third parties for access to the benefits that we expect to realize from Brookfield Asset Management's involvement in our business.
In the event of the termination of our Master Services Agreement, the Relationship Agreement would also terminate, including Brookfield's commitments to provide us with acquisition opportunities, as described above.
|
107
|
Brookfield Business Partners
|
Under the Relationship Agreement, our company, the Holding LP and the Holding Entities have agreed that none of Brookfield nor any affiliate, director, officer, employee, contractor, agent, advisor, member, partner, shareholder or other representative of Brookfield, will be liable to us for any claims, liabilities, losses, damages, costs or expenses (including legal fees) arising in connection with the business and activities in respect of or arising from the Relationship Agreement, except to the extent that the claims, liabilities, losses, damages, costs or expenses (including legal fees) are determined to have resulted from the person's bad faith, fraud, willful misconduct or gross negligence, or in the case of a criminal matter, action that the person knew to have been unlawful. The maximum amount of the aggregate liability of Brookfield, or any of its affiliates, or of any director, officer, employee, contractor, agent, advisor, member, partner, shareholder or other representative of Brookfield, will be equal to the amounts previously paid in the two most recent calendar years by the Service Recipients pursuant to our Master Services Agreement.
Preferred Shares of Certain Holding Entities
Brookfield has provided $5 million of working capital to CanHoldco and two of our other subsidiaries for a total of $15 million, through a subscription for preferred shares of such entities. These preferred shares are entitled to receive a cumulative preferential cash dividend equal to 5% of their redemption value as and when declared by the board of directors of the applicable entity. The preferred shares are redeemable following the twentieth anniversary of the date of issue. The preferred shares will be entitled to vote with the common shares of the applicable entity and will have an aggregate of 1% of the votes to be cast in respect of the applicable entity.
Credit Facilities
In October 2017, we entered into a new credit agreement with Brookfield providing for borrowing of up to $500 million for purposes of funding our acquisitions and investments (the “New Brookfield Acquisition Facility”). The New Brookfield Acquisition Facility replaced two existing facilities with Brookfield that were in place when we were spun off from Brookfield Asset Management in June 2016, a $200 million operating credit facility for working capital purposes and a $300 million acquisition facility. Given our maturity as an organization and level of liquidity, we determined that an operating credit facility for working capital purposes was no longer necessary. We have not made any borrowings under these credit facilities to date.
Net proceeds above a specified threshold that are received by the borrowers from asset dispositions, debt incurrences or equity issuances by the borrowers or their subsidiaries must be used to pay down the New Brookfield Acquisition Facility (which can then be redrawn to fund future investments). The New Brookfield Acquisition Facility has an initial term ending in August 2019 and is extendible for one-year renewal periods by mutual agreement, subject to our paying an extension fee and being in compliance with the credit agreement.
The New Brookfield Acquisition Facility is guaranteed by our company and each direct wholly-owned (in terms of outstanding common equity) subsidiary of our company or Holding LP that is not otherwise a borrower, and provides for funds to be made available in U.S. or Canadian dollars at an interest rate based on LIBOR, base rate, bankers' acceptance rate or prime rate loans. The New Brookfield Acquisition Facility bears interest at the specified LIBOR or bankers' acceptance rate plus 3.75%, or the specified base rate or prime rate plus 2.75%.
In August 2017, our existing $150 million unsecured bilateral facility with a group of Canadian and American banks was increased by $100 million to an aggregate bilateral facility size of $250 million. This credit facility is available in U.S. or Canadian dollars, and advances bear interest at the specified LIBOR or bankers' acceptance rate plus 2.75%, or the specified base rate or prime rate plus 1.75%. This facility has a term ending in August 2019 and will be used for general corporate purposes. The bilateral working capital facility requires us to maintain a minimum tangible net worth and to maintain debt to capitalization ratios at the corporate level. The credit facility requires us to maintain a minimum deconsolidated net worth, and contain restrictions on the ability of the borrowers and the guarantors to, among other things, incur liens, engage in certain mergers and consolidations or enter into speculative hedging arrangements. We have not made any borrowings under this credit facility to date.
Redemption-Exchange Mechanism
At any time after two years from the date of the spin-off, or June 20, 2018, the holders of redemption-exchange units of the Holding LP have the right to require the Holding LP to redeem all or a portion of the redemption-exchange units for cash in an amount equal to the market value of one of our units multiplied by the number of units to be redeemed (subject to certain adjustments), subject to our right to acquire such interests (in lieu of redemption) in exchange for our units. See Item 10.B., "Description of the Holding LP Limited Partnership Agreement—Redemption-Exchange Mechanism". Taken together, the effect of the redemption right and the right of exchange is that the holders of redemption-exchange units will receive our units, or the value of such units, at our election. Should we determine not to exercise our right of exchange, cash required to fund a redemption of redemption-exchange units will likely be financed by a public offering of our units.
|
Brookfield Business Partners
|
108
|
Registration Rights Agreement
We have entered into a customary registration rights agreement with Brookfield pursuant to which we have agreed that, upon the request of Brookfield, we will file one or more registration statements to register for sale under the U.S. Securities Act of 1933, as amended, or the U.S. Securities Act, or one or more prospectuses to qualify the distribution in Canada of any of our units held by Brookfield (including units acquired pursuant to the Redemption-Exchange Mechanism). Under the registration rights agreement, we will not be required to file a U.S. registration statement or a Canadian prospectus unless Brookfield requests that units having a value of at least $50 million be registered or qualified. In the registration rights agreement, we have agreed to pay expenses in connection with such registration and sales, except for any underwriting discounts, commissions, or fees attributable to the sale of the units, which will be borne by the selling unitholder, and to indemnify Brookfield for, among other things, material misstatements or omissions in the registration statement and/or prospectus.
Incentive Distributions
As a result of holding Special LP Units, Brookfield will be entitled to receive from the Holding LP incentive distributions calculated as (a) 20% of the growth in the market value of our units quarter-over-quarter (but only after the market value exceeds the "Incentive Distribution Threshold" being initially $25.00 and adjusted at the beginning of each quarter to be equal to the greater of (i) our unit's market value for the previous quarter and (ii) the Incentive Distribution Threshold at the end of the previous quarter) multiplied by (b) the number of units outstanding at the end of the quarter (assuming full conversion of the redemption-exchange units into units). For the purposes of calculating incentive distributions, the market value of our units will be equal to the quarterly volume-weighted average price of our units on the principal stock exchange for our units (based on trading volumes). The incentive distribution amount, if any, will be calculated at the end of each calendar quarter and paid concurrently with any other distributions by the Holding LP in accordance with the Holding LP Limited Partnership Agreement. In the event that there is a decline in our units' market value during any quarter, there will be no repayment or clawback of any incentive distribution amounts previously received by Brookfield from Holding LP and no further incentive distributions will be payable by Holding LP unless and until the previous "Incentive Distribution Threshold" is exceeded. The Incentive Distribution Threshold will be adjusted in accordance with the Holding LP Limited Partnership Agreement in the event of transactions with a dilutive effect on the value of the units, including any quarterly cash distribution above the initial amount of $0.0625/unit. For any quarter in which we determine that there is insufficient cash to pay the incentive distribution, we may elect to pay all or a portion of this distribution in redemption-exchange units or may elect to defer all or a portion of the amount distributable for payment from available cash in future quarters. We believe these arrangements will create an incentive for Brookfield to manage our company in a way that helps us achieve our goal of creating value for our unitholders through capital appreciation while providing a modest distribution yield. For a further explanation of incentive distributions, see Item 10.B., "Description of the Holding LP Limited Partnership Agreement—Distributions". The aggregate incentive distribution for the year ended December 31, 2017 was approximately $142 million and the Incentive Distribution Threshold as at December 31, 2017 is $31.19.
Brookfield may, at its sole discretion, elect to reinvest incentive distributions in exchange for redemption-exchange units or our units.
Brookfield may be entitled to performance or incentive distributions in respect of funds created, managed or sponsored by Brookfield, and we may invest in or alongside such funds. To the extent that any Holding Entity or any operating business pays to Brookfield any comparable performance or incentive distribution, the amount of any future incentive distributions payable in respect of our Special LP Units will be reduced in an equitable manner to avoid duplication of distributions; however, any such comparable performance or incentive distribution will not result in a reduction to the base management fee payable pursuant to the Master Services Agreement.
General Partner Distributions
Pursuant to our Limited Partnership Agreement, the BBU General Partner is entitled to receive a general partner distribution equal to its pro rata share of the total distributions of our company, initially 0.2%.
Indemnification Arrangements
Subject to certain limitations, Brookfield and its directors, officers, agents, subcontractors, contractors, delegates, members, partners, shareholders and employees generally benefit from indemnification provisions and limitations on liability are included in our Limited Partnership Agreement, the BBU General Partner's bye-laws, the Holding LP Limited Partnership Agreement, our Master Services Agreement and other arrangements with Brookfield. See Item 7.B., "Related Party Transactions—Our Master Services Agreement", Item 10.B., "Memorandum and Articles of Association—Description of our Units and our Limited Partnership Agreement—Indemnification; Limitations on Liability" and Item 10.B., "Description of the Holding LP Limited Partnership Agreement—Indemnification; Limitations on Liability".
|
109
|
Brookfield Business Partners
|
Licensing Agreement
Our company and the Holding LP have each entered into a licensing agreement with Brookfield pursuant to which Brookfield has granted a non-exclusive, royalty-free license to use the name "Brookfield" and the Brookfield logo. Other than under this limited license, we do not have a legal right to the "Brookfield" name and the Brookfield logo. Brookfield Asset Management may terminate the licensing agreement immediately upon termination of our Master Services Agreement and it may be terminated in the circumstances described under Item 4.B., "Business Overview—Intellectual Property".
Conflicts of Interest and Fiduciary Duties
Our organizational and ownership structure and strategy involve a number of relationships that may give rise to conflicts of interest between our company and our unitholders, on the one hand, and Brookfield, on the other hand. In particular, conflicts of interest could arise, among other reasons, because:
|
•
|
in originating and recommending acquisition opportunities, Brookfield has significant discretion to determine the suitability of opportunities for us and to allocate such opportunities to us or to itself or third parties;
|
|
•
|
because of the scale of our typical acquisitions and because our strategy includes completing acquisitions through consortium or partnership arrangements with pension funds and other financial sponsors, we will likely make co-acquisitions with Brookfield and Brookfield-sponsored funds or Brookfield-sponsored or co-sponsored consortiums and partnerships involving third party investors to whom Brookfield will owe fiduciary duties, which it does not owe to us;
|
|
•
|
the same professionals within Brookfield's organization who are involved in acquisitions that are suitable for us are responsible for the consortiums and partnerships referred to above, as well as having other responsibilities within Brookfield's broader asset management business. Limits on the availability of such individuals will likewise result in a limitation on the availability of acquisition opportunities for us;
|
|
•
|
there may be circumstances where Brookfield will determine that an acquisition opportunity is not suitable for us because of the fit with our acquisition strategy, limits arising due to regulatory or tax considerations, limits on our financial capacity or because of the immaturity of the target assets and Brookfield is entitled to pursue the acquisition on its own behalf rather than offering us the opportunity to make the acquisition;
|
|
•
|
where Brookfield has made an acquisition, it may transfer it to us at a later date after the assets have been developed or we have obtained sufficient financing;
|
|
•
|
our relationship with Brookfield involves a number of arrangements pursuant to which Brookfield provides various services, access to financing arrangements and originates acquisition opportunities, and circumstances may arise in which these arrangements will need to be amended or new arrangements will need to be entered into;
|
|
•
|
as our arrangements with Brookfield were effectively determined by Brookfield in the context of the spin-off, they may contain terms that are less favorable than those which otherwise might have been negotiated between unrelated parties;
|
|
•
|
Brookfield is generally entitled to share in the returns generated by our operations, which could create an incentive for it to assume greater risks when making decisions than it otherwise would in the absence of such arrangements;
|
|
•
|
Brookfield is permitted to pursue other business activities and provide services to third parties that compete directly with our business and activities without providing us with an opportunity to participate, which could result in the allocation of Brookfield's resources, personnel and acquisition opportunities to others who compete with us;
|
|
•
|
Brookfield does not owe our company or our unitholders any fiduciary duties, which may limit our recourse against it; and
|
|
•
|
the liability of Brookfield and its directors is limited under our arrangements with them, and we have agreed to indemnify Brookfield and its directors against claims, liabilities, losses, damages, costs or expenses which they may face in connection with those arrangements, which may lead them to assume greater risks when making decisions than they otherwise would if such decisions were being made solely for its own account, or may give rise to legal claims for indemnification that are adverse to the interests of our unitholders.
|
|
Brookfield Business Partners
|
110
|
With respect to transactions in which there may be a conflict of interest, we may be required to seek the prior approval of its governance and nominating committee pursuant to a conflicts policy that has been approved by our governance and nominating committee. These transactions include: (i) the dissolution of our company; (ii) any material amendment to our Master Services Agreement, our Limited Partnership Agreement or the Holding LP Limited Partnership Agreement; (iii) any material service agreement or other arrangement pursuant to which Brookfield will be paid a fee, or other consideration other than any agreement or arrangement contemplated by our Master Services Agreement; (iv) co-investments by us with Brookfield; (v) acquisitions by us from, and dispositions by us to, Brookfield; (vi) any other material transaction involving us and Brookfield; and (vii) termination of, or any determinations regarding indemnification under, our Master Services Agreement. Pursuant to our conflicts policy, the governance and nominating committee may grant prior approvals for any of these transactions in the form of general guidelines, policies or procedures in which case no further special approval will be required in connection with a particular transaction or matter permitted thereby. In certain circumstances, these transactions may be related party transactions for the purposes of, and subject to certain requirements of, MI 61-101. MI 61-101 provides a number of circumstances in which a transaction between an issuer and a related party may be subject to valuation and minority approval requirements. See "Canadian Securities Law Exemptions" for application of MI 61-101 to our company.
The conflicts policy states that conflicts be resolved based on the principles of transparency, third-party validation and approvals. The policy recognizes the benefit to us of our relationship with Brookfield and our intent to pursue a strategy that seeks to maximize the benefits from this relationship. The policy also recognizes that the principal areas of potential application of the policy on an ongoing basis will be in connection with our acquisitions and our participation in Brookfield led consortiums and partnership arrangements, together with any management or service arrangements entered into in connection therewith or the ongoing operations of the underlying operating businesses.
In general, the policy provides that acquisitions that are carried out jointly by us and Brookfield, or in the context of a Brookfield-led or co-led consortium or partnership be carried out on the basis that the consideration paid by us be no more, on a per share or proportionate basis, than the consideration paid by Brookfield or other participants, as applicable. The policy also provides that any fees or carried interest payable in respect of our proportionate interest, or in respect of an acquisition made solely by us, must be credited in the manner contemplated by the Holding LP Limited Partnership Agreement, where applicable, or that such fees or carried interest must either have been negotiated with another arm's length participant or otherwise demonstrated to be on market terms (or better). The policy generally provides that if the acquisition involves the purchase by us of an asset from Brookfield, or the participation in a transaction involving the purchase by us and Brookfield of different assets, that a fairness opinion or, in some circumstances, a valuation or appraisal by a qualified expert be obtained. These requirements provided for in the conflicts policy are in addition to any disclosure, approval or valuation requirements that may arise under applicable law.
Our Limited Partnership Agreement and the Holding LP Limited Partnership Agreement, or together the Limited Partnership Agreements, contain various provisions that modify the fiduciary duties that might otherwise be owed to us and our unitholders. These duties include the duties of care and loyalty. In the absence of provisions in the Limited Partnership Agreements of our company and the Holding LP to the contrary, the duty of loyalty would generally prohibit the BBU General Partner and the Holding LP General Partner from taking any action or engaging in any transaction as to which it has a conflict of interest. The Limited Partnership Agreements of our company and the Holding LP each prohibit the limited partners from advancing claims that otherwise might raise issues as to compliance with fiduciary duties or applicable law. For example, the agreements provide that the BBU General Partner, the Holding LP General Partner and their affiliates do not have any obligation under the Limited Partnership Agreements of our company or the Holding LP, or as a result of any duties stated or implied by law or equity, including fiduciary duties, to present business or acquisition opportunities to our company, the Holding LP, any Holding Entity or any other holding entity established by us. They also allow affiliates of the BBU General Partner to engage in activities that may compete with us or our activities. In addition, the agreements permit the BBU General Partner to take into account the interests of third parties, including Brookfield, when resolving conflicts of interest.
These modifications to the fiduciary duties are detrimental to our unitholders because they restrict the remedies available for actions that might otherwise constitute a breach of fiduciary duty and permit conflicts of interest to be resolved in a manner that is not always in our best interests or the best interests of our unitholders. We believe it is necessary to modify the fiduciary duties that might otherwise be owed to us and our unitholders, as described above, due to our organizational and ownership structure and the potential conflicts of interest created thereby. Without modifying those duties, the ability of the BBU General Partner and the Holding LP General Partner to attract and retain experienced and capable directors and to take actions that we believe are necessary for the carrying out of our business would be unduly limited due to their concern about potential liability.
|
111
|
Brookfield Business Partners
|
Canadian Securities Law Exemptions
Multilateral Instrument 61-101—
Protection of Minority Security Holders in Special Transactions
, or MI 61-101, provides a number of circumstances in which a transaction between an issuer and a related party may be subject to valuation and minority approval requirements. An exemption from such requirements is available when the fair market value of the transaction is not more than 25% of the market capitalization of the issuer. Our company has been granted exemptive relief from the requirements of MI 61-101 that, subject to certain conditions, permit it to be exempt from the minority approval and valuation requirements for transactions that would have a value of less than 25% of our company's market capitalization, if the indirect equity interest in our company, which is held in the form of redemption-exchange units, is included in the calculation of our company's market capitalization. As a result, the 25% threshold, above which the minority approval and valuation requirements apply, is increased to include the approximately 49% economic interest in our company held in the form of redemption-exchange units.
Although our company is a reporting issuer in Canada, we are a "SEC foreign issuer" and exempt from certain Canadian securities laws relating to continuous disclosure obligations and proxy solicitation if our company complies with certain reporting requirements applicable in the United States, provided that the relevant documents filed with the SEC are filed in Canada and sent to our company's unitholders in Canada to the extent and in the manner and within the time required by applicable U.S. requirements. Therefore, there may be less publicly available information in Canada about us than is regularly published by or about other reporting issuers in Canada. Our company has undertaken to the provincial and territorial securities regulatory authorities in Canada that to the extent that it complies with the disclosure regime applicable to "foreign private issuers" under U.S. securities law:
|
•
|
our company will only rely on the exemption in Part 4 of National Instrument 71-102—
Continuous Disclosure and Other Exemptions Relating to Foreign Issuers
;
|
|
•
|
our company will not rely on any exemption from the disclosure regime applicable to foreign private issuers under U.S. securities laws;
|
|
•
|
our company will file its financial statements pursuant to Part 4 of National Instrument 51-102—
Continuous Disclosure Obligations
, or NI 51-102, except that our company does not have to comply with the conditions in section 4.2 of NI 51-102 if it files such financial statements on or before the date that it is required to file its prospectus with the SEC;
|
|
•
|
our company will file an interim financial report as set out in Part 4 of NI 51-102 and the management's discussion and analysis as set out in Part 5 of NI 51-102 for each period commencing on the first day of the financial year and ending nine, six or three months before the end of the financial year;
|
|
•
|
our company will file a material change report as set out in Part 7 of NI 51-102 in respect of any material change in the affairs of our company that is not reported or filed by our company on SEC Form 6-K; and
|
|
•
|
our company will include in any prospectus filed by our company financial statements or other information about any acquisition that would have been or would be a significant acquisition for the purposes of Part 8 of NI 51-102 that our company has completed, or has progressed to a state where a reasonable person would believe that the likelihood of our company completing the acquisition is high if the inclusion of the financial statements is necessary for the prospectus to contain full, true and plain disclosure of all material facts relating to the securities being distributed. The requirement to include financial statements or other information will be satisfied by including or incorporating by reference: (a) the financial statements or other information as set out in Part 8 of NI 51-102, or (b) satisfactory alternative financial statements or other information, unless at least nine months of the operations of the acquired business or related businesses are incorporated into our company's current annual financial statements included or incorporated by reference in the prospectus.
|
Our company is not subject to Canadian insider reporting requirements due to its status as a "SEC Foreign Issuer" under Canadian securities laws. However, our company is not intending to rely on the exemption that is available to it from the insider reporting requirements of Canadian securities laws.
Voting Agreements
We and Brookfield have determined that it is advisable for us to have control over certain of the entities through which we hold our operating businesses. Accordingly, we have entered into voting agreements to provide us, through the BBU General Partner, with voting rights over the specified entities.
|
Brookfield Business Partners
|
112
|
Pursuant to the voting agreements, voting rights with respect to any of the specified entities will be voted in accordance with the direction of our company or one of the Holding Entities with respect to certain matters, typically including: (i) the election of directors; (ii) any sale of all or substantially all of its assets; (iii) any merger, amalgamation, consolidation, business combination or other material corporate transaction, except in connection with any internal reorganization that does not result in a change of control; (iv) any plan or proposal for a complete or partial liquidation or dissolution, or any reorganization or any case, proceeding or action seeking relief under any existing laws or future laws relating to bankruptcy or insolvency; (v) any amendment to its governing documents; or (vi) any commitment or agreement to do any of the foregoing.
Deposit Agreement
We have in place a deposit agreement with Brookfield whereby we may place funds on deposit with Brookfield as approved by the Board of Directors. Any deposit balance is due on demand and earns an agreed upon rate of interest based on market terms. As at December 31, 2017, the amount of the deposit was
$384 million
and was included in cash and cash equivalents. For the fiscal year ended December 31, 2017, we earned interest income of approximately
$6 million
on monies deposited with Brookfield under this agreement.
INDEBTEDNESS OF DIRECTORS AND EXECUTIVE OFFICERS
To our knowledge, no current or former director, officer of employee of our company, nor any associate or affiliate of any of them is or was indebted to our company at any time.
INTEREST OF MANAGEMENT AND OTHERS IN MATERIAL TRANSACTIONS
Except as disclosed in this Form 20-F, no director or officer of the BBU General Partner or the Service Providers or other insider of our company, nor any associate or affiliate of the foregoing persons, has any existing or potential material conflict of interest with our company, the Holding LP or any of its subsidiaries or interest in any material transaction involving our company, the Holding LP or any of its subsidiaries.
7.C. INTERESTS OF EXPERTS AND COUNSEL
Not applicable.
8.A. CONSOLIDATED STATEMENTS AND OTHER FINANCIAL INFORMATION
See Item 18., "Financial Statements".
8.B. SIGNIFICANT CHANGES
Not applicable.
9.A. OFFER AND LISTING DETAILS
PRICE HISTORY
The following table sets forth the annual high and low prices for our units on the TSX and NYSE for the periods indicated since when-issued trading commenced on May 31, 2016:
TSX
|
Period
|
High
|
Low
|
||||||
|
May 31, 2016 to December 31, 2016
|
C$
|
42.75
|
|
C$
|
23.41
|
|
||
|
January 1, 2017 to December 31, 2017
|
C$
|
44.20
|
|
C$
|
31.29
|
|
||
NYSE
|
Period
|
High
|
Low
|
||||||
|
May 31, 2016 to December 31, 2016
|
$
|
31.02
|
|
$
|
18.01
|
|
||
|
January 1, 2017 to December 31, 2017
|
$
|
34.72
|
|
$
|
23.66
|
|
||
|
113
|
Brookfield Business Partners
|
The following table sets forth the quarterly high and low prices for our units on the TSX and NYSE for the periods indicated since when issued-trading commenced on May 31, 2016:
TSX
|
Period
|
High
|
Low
|
||||||
|
May 31, 2016 to June 30, 2016
|
C$
|
42.75
|
|
C$
|
23.41
|
|
||
|
July 1, 2016 to September 30, 2016
|
C$
|
35.00
|
|
C$
|
23.95
|
|
||
|
October 1, 2016 to December 31, 2016
|
C$
|
35.92
|
|
C$
|
29.35
|
|
||
|
January 1, 2017 to March 31, 2017
|
C$
|
34.75
|
|
C$
|
31.29
|
|
||
|
April 1, 2017 to June 30, 2017
|
C$
|
38.11
|
|
C$
|
32.13
|
|
||
|
July 1, 2017 to September 30, 2017
|
C$
|
38.84
|
|
C$
|
34.75
|
|
||
|
October 1, 2017 to December 31, 2017
|
C$
|
44.20
|
|
C$
|
36.35
|
|
||
NYSE
|
Period
|
High
|
Low
|
||||||
|
May 31, 2016 to June 30, 2016
|
$
|
31.02
|
|
$
|
18.01
|
|
||
|
July 1, 2016 to September 30, 2016
|
$
|
26.87
|
|
$
|
18.31
|
|
||
|
October 1, 2016 to December 31, 2016
|
$
|
26.86
|
|
$
|
21.72
|
|
||
|
January 1, 2017 to March 31, 2017
|
$
|
26.50
|
|
$
|
23.66
|
|
||
|
April 1, 2017 to June 30, 2017
|
$
|
27.87
|
|
$
|
24.15
|
|
||
|
July 1, 2017 to September 30, 2017
|
$
|
31.78
|
|
$
|
27.05
|
|
||
|
October 1, 2017 to December 31, 2017
|
$
|
34.72
|
|
$
|
29.00
|
|
||
The following table sets forth, for the periods indicated, the monthly high and low prices and trading volumes for our units on the TSX and NYSE for the most recent six months:
TSX
|
Period
|
High
|
Low
|
Volume
|
||||||||
|
2017
|
|
|
|
||||||||
|
September
|
C$
|
38.60
|
|
C$
|
36.00
|
|
1,812,884
|
|
|||
|
October
|
C$
|
38.46
|
|
C$
|
36.35
|
|
1,283,174
|
|
|||
|
November
|
C$
|
40.46
|
|
C$
|
37.45
|
|
1,399,299
|
|
|||
|
December
|
C$
|
44.20
|
|
C$
|
38.80
|
|
1,810,976
|
|
|||
|
2018
|
|
|
|
||||||||
|
January
|
C$
|
49.34
|
|
C$
|
43.00
|
|
2,198,924
|
|
|||
|
February
|
C$
|
48.32
|
|
C$
|
43.80
|
|
1,592,707
|
|
|||
|
March (March 1 to March 8)
|
C$
|
46.85
|
|
C$
|
43.36
|
|
271,503
|
|
|||
|
Brookfield Business Partners
|
114
|
NYSE
|
Period
|
High
|
Low
|
Volume
|
||||||||
|
2017
|
|
|
|
||||||||
|
September
|
$
|
31.78
|
|
$
|
29.01
|
|
659,197
|
|
|||
|
October
|
$
|
29.98
|
|
$
|
29.00
|
|
265,057
|
|
|||
|
November
|
$
|
31.50
|
|
$
|
29.71
|
|
321,326
|
|
|||
|
December
|
$
|
34.72
|
|
$
|
30.98
|
|
190,878
|
|
|||
|
2018
|
|||||||||||
|
January
|
$
|
40.00
|
|
$
|
34.19
|
|
327,197
|
|
|||
|
February
|
$
|
39.00
|
|
$
|
34.19
|
|
325,482
|
|
|||
|
March (March 1 to March 8)
|
$
|
36.09
|
|
$
|
33.80
|
|
42,478
|
|
|||
9.B. PLAN OF DISTRIBUTION
Not applicable.
9.C. MARKETS
Our units are listed on the NYSE and TSX under the symbols "BBU" and "BBU.UN", respectively.
9.D. SELLING SHAREHOLDERS
Not applicable.
9.E. DILUTION
Not applicable.
9.F. EXPENSES OF THE ISSUE
Not applicable.
10.A. SHARE CAPITAL
Not applicable.
10.B. MEMORANDUM AND ARTICLES OF ASSOCIATION
DESCRIPTION OF OUR UNITS AND OUR LIMITED PARTNERSHIP AGREEMENT
The following is a description of the material terms of our units and our Limited Partnership Agreement. Because this description is only a summary of the terms of our units and our Limited Partnership Agreement, it does not contain all of the information that you may find useful. For more complete information, you should read our Limited Partnership Agreement. The Limited Partnership Agreement is filed as exhibit to this Form 20-F and is also available on our SEDAR profile at
www.sedar.com.
See also Item 10.C., "Material Contracts", Item 10.H., "Documents on Display" and Item 19., "Exhibits".
Formation and Duration
Our company is a Bermuda exempted limited partnership registered under the Bermuda Limited Partnership Act and the Bermuda Exempted Partnerships Act 1992. Our company has a perpetual existence and will continue as a limited liability partnership unless terminated or dissolved in accordance with our Limited Partnership Agreement. The partnership interests consist of our units, which represent limited partnership interests in our company, and any additional partnership interests representing limited partnership interests that we may issue in the future as described below under "—Issuance of Additional Partnership Interests".
Management
As required by law, our Limited Partnership Agreement provides for the management and control of our company by a general partner, the BBU General Partner.
|
115
|
Brookfield Business Partners
|
Nature and Purpose
Under our Limited Partnership Agreement, the purpose of our company is to: acquire and hold interests in the Holding LP and, subject to the approval of the BBU General Partner, interests in any other entity; engage in any activity related to the capitalization and financing of our company's interests in such entities; serve as the managing general partner of the Holding LP and execute and deliver, and perform the functions of a managing general partner of the Holding LP specified in, the Holding LP Limited Partnership Agreement; and engage in any activity that is incidental to or in furtherance of the foregoing and that is approved by the BBU General Partner and that lawfully may be conducted by a limited partnership organized under the Bermuda Limited Partnership Act, the Bermuda Exempted Partnerships Act 1992 and our Limited Partnership Agreement.
Our Units
Our units are non-voting limited partnership interests in our company. A holder of our units does not hold a share of a body corporate. As holders of units of our company, holders do not have statutory rights normally associated with ownership of shares of a corporation including, for example, the right to bring "oppression" or "derivative" actions. The rights of holders of our units are based on our Limited Partnership Agreement, amendments to which may be proposed only by or with the consent of the BBU General Partner as described below under "—Amendment of Our Limited Partnership Agreement".
Our units represent a fractional limited partnership interest in our company and do not represent a direct investment in our assets and should not be viewed by investors as direct securities of our assets. Holders of our units are not entitled to the withdrawal or return of capital contributions in respect of our units, except to the extent, if any, that distributions are made to such holders pursuant to our Limited Partnership Agreement or upon the liquidation of our company as described below under "—Liquidation and Distribution of Proceeds" or as otherwise required by applicable law. Except to the extent expressly provided in our Limited Partnership Agreement, a holder of our units does not have priority over any other holder of our units, either as to the return of capital contributions or as to profits, losses or distributions. Our units have no par or other stated value.
Holders of our units do not have the ability to call meetings of unitholders, and holders of our units are not entitled to vote on matters relating to our company except as described below under "—No Management or Control; No Voting". Any action that may be taken at a meeting of unitholders may be taken without a meeting if written consent is solicited by or on behalf of the BBU General Partner and it receives approval of not less than the minimum percentage of support necessary to authorize or take such action at a meeting as described below under "—Meetings".
Redemption-Exchange Units
The redemption-exchange units are exchangeable into our units in accordance with the Redemption-Exchange Mechanism. For a further explanation of the Redemption-Exchange Mechanism, see Item 10.B., "Description of the Holding LP Limited Partnership Agreement—Redemption-Exchange Mechanism".
Issuance of Additional Partnership Interests
The BBU General Partner has broad rights to cause our company to issue additional partnership interests and may cause us to issue additional partnership interests (including new classes of partnership interests and options, rights, warrants and appreciation rights relating to such interests) for any partnership purpose, at any time and on such terms and conditions as it may determine at its sole discretion without the approval of any limited partners. Any additional partnership interests may be issued in one or more classes, or one or more series of classes, with such designations, preferences, rights, powers and duties (which may be senior to existing classes and series of partnership interests) as may be determined by the BBU General Partner in its sole discretion, all without the approval of our limited partners.
Investments in the Holding LP
If and to the extent that our company raises funds by way of the issuance of equity or debt securities, or otherwise, pursuant to a public offering, private placement or otherwise, an amount equal to the proceeds will be invested in securities of the Holding LP, unless otherwise agreed by us and the Holding LP.
Capital Contributions
No partner has the right to withdraw any or all of its capital contribution. The limited partners have no liability for further capital contributions to our company. Each limited partner's liability will be limited to the amount of capital such partner is obligated to contribute to our company for its limited partner interest plus its share of any undistributed profits and assets, subject to certain exceptions. See "—Limited Liability" below.
|
Brookfield Business Partners
|
116
|
Distributions
Distributions to partners of our company will be made only as determined by the BBU General Partner in its sole discretion. In general, quarterly cash distributions will be made from the distributions received by our company as a result of its ownership of Managing General Partner Units in Holding LP. However, the BBU General Partner will not be permitted to cause our company to make a distribution if it does not have sufficient cash on hand to make the distribution (including as a result of borrowing), the distribution would render it insolvent, or if, in the opinion of the BBU General Partner, the distribution would or might leave it with insufficient funds to meet any future or contingent obligations, or the distribution would contravene the Bermuda Limited Partnership Act. For greater certainty, our company, the Holding LP or one or more of the Holding Entities may (but none is obligated to) borrow money in order to obtain sufficient cash to make a distribution. The amount of taxes withheld or paid by us in respect of our units held by limited partners or the BBU General Partner shall be treated either as a distribution to such partner or as a general expense of our company, as determined by the BBU General Partner in its sole discretion.
Any distributions from our company will be made to the limited partners, and to the BBU General Partner on a pro rata basis. The BBU General Partner's pro rata share is currently 0.1%. Each limited partner will receive a pro rata share of the distributions made to all limited partners in accordance with the proportion of all outstanding units held by that limited partner. Except for receiving its pro rata share of distributions from our company, the BBU General Partner shall not be compensated for its services as the BBU General Partner but it shall be reimbursed for certain expenses.
Allocations of Income and Losses
Limited partners share in our net profits and net losses, generally in accordance with their respective percentage interest in our company.
Net income and net losses for U.S. federal income tax purposes will be allocated for each taxable year or other relevant period among our partners using a monthly, quarterly or other permissible convention pro rata on a per unit basis, except to the extent otherwise required by law or pursuant to tax elections made by our company. Each item of income, gain, loss and deduction so allocated to a partner of our company, generally will have the same source and character as though such partner had realized the item directly.
The income for Canadian federal income tax purposes of our company for a given fiscal year will be allocated to each partner in an amount calculated by multiplying such income by a fraction, the numerator of which is the sum of the distributions received by such partner with respect to such fiscal year and the denominator of which is the aggregate amount of the distributions made by our company to partners with respect to such fiscal year. To such end, any person who was a partner at any time during such fiscal year but who has transferred all of their units before the last day of that fiscal year may be deemed to be a partner on the last day of such fiscal year for the purposes of subsection 96(1) of the Tax Act. Generally, the source and character of items of income so allocated to a partner with respect to a fiscal year of our company will be the same source and character as the distributions received by such partner with respect to such fiscal year. The BBU General Partner may adjust allocations of items that would otherwise be made pursuant to the terms of our Limited Partnership Agreement to the extent necessary to avoid an adverse effect on our company's limited partners, subject to the approval of a committee of the board of directors of the BBU General Partner made up of independent directors.
If, with respect to a given fiscal year, no distribution is made by our company or we have a loss for Canadian federal income tax purposes, one quarter of the income, or loss, as the case may be, for Canadian federal income tax purposes of our company for such fiscal year, will be allocated to the partners of record at the end of each calendar quarter ending in such fiscal year pro rata to their respective percentage interests in our company. Generally, the source and character of such income or losses so allocated to a partner at the end of each calendar quarter will be the same source and character as the income or loss earned or incurred by us in such calendar quarter.
Limited Liability
Assuming that a limited partner does not participate in the control or management of our company or conduct the affairs of, sign or execute documents for or otherwise bind our company within the meaning of the Bermuda Limited Partnership Act and otherwise acts in conformity with the provisions of our Limited Partnership Agreement, such partner's liability under the Bermuda Limited Partnership Act and our Limited Partnership Agreement will be limited to the amount of capital such partner is obligated to contribute to our company for its limited partner interest plus its share of any undistributed profits and assets, except as described below.
|
117
|
Brookfield Business Partners
|
If it were determined, however, that a limited partner was participating in the control or management of our company or conducting the affairs of, signing or executing documents for or otherwise binding our company (or purporting to do any of the foregoing) within the meaning of the Bermuda Limited Partnership Act or the Bermuda Exempted Partnerships Act 1992, such limited partner would be liable as if it were a general partner of our company in respect of all debts of our company incurred while that limited partner was so acting or purporting to act. Neither our Limited Partnership Agreement nor the Bermuda Limited Partnership Act specifically provides for legal recourse against the BBU General Partner if a limited partner were to lose limited liability through any fault of the BBU General Partner. While this does preclude a limited partner from seeking legal recourse, we are not aware of any precedent for such a claim in Bermuda case law.
No Management or Control; Limited Voting
Our company's limited partners, in their capacities as such, may not take part in the management or control of the activities and affairs of our company and do not have any right or authority to act for or to bind our company or to take part or interfere in the conduct or management of our company. Limited partners are not entitled to vote on matters relating to our company or have access to the books and records of our company, although holders of units are entitled to consent to certain matters with respect to certain amendments to our Limited Partnership Agreement and certain matters with respect to the withdrawal of the BBU General Partner as described in further detail below. In addition, limited partners have consent rights with respect to certain fundamental matters and related party transactions (in accordance with MI 61-101) and on any other matters that require their approval in accordance with applicable laws and stock exchange rules. Each unit entitles the holder thereof to one vote for the purposes of any approvals of holders of units.
Meetings
The BBU General Partner may call special meetings of the limited partners at a time and place outside of Canada determined by the BBU General Partner on a date not less than 10 days nor more than 60 days after the mailing of notice of the meeting. The limited partners do not have the ability to call a special meeting. Only holders of record on the date set by the BBU General Partner (which may not be less than 10 nor more than 60 days before the meeting) are entitled to notice of any meeting.
Written consents may be solicited only by or on behalf of the BBU General Partner. Any such consent solicitation may specify that any written consents must be returned to us within the time period, which may not be less than 20 days, specified by the BBU General Partner.
For purposes of determining holders of partnership interests entitled to notice of, and participation in, a meeting, or to provide consents or give approvals to any action described above, the BBU General Partner may set a record date, which may be not less than 10 nor more than 60 days before the date by which record holders are requested in writing by the BBU General Partner to provide such consents. Only those holders of partnership interests on the record date established by the BBU General Partner will be entitled to provide consents with respect to matters as to which a consent right applies.
Amendment of Our Limited Partnership Agreement
Amendments to our Limited Partnership Agreement may be proposed only by or with the consent of the BBU General Partner. To adopt a proposed amendment, other than the amendments that do not require limited partner approval discussed below, the BBU General Partner must seek approval of a majority of our outstanding units required to approve the amendment, either by way of a meeting of the limited partners to consider and vote upon the proposed amendment or by written approval.
Prohibited Amendments
No amendment may be made that would:
|
1.
|
enlarge the obligations of any limited partner without its consent, except that any amendment that would have a material adverse effect on the rights or preferences of any class of partnership interests in relation to other classes of partnership interests may be consented to or approved by at least a majority of the type or class of partnership interests so affected; or
|
|
2.
|
enlarge the obligations of, restrict in any way any action by or rights of or reduce in any way the amounts distributable, reimbursable or otherwise payable by our company to the BBU General Partner or any of its affiliates without the consent of the BBU General Partner, which may be given or withheld in its sole discretion.
|
The provision of our Limited Partnership Agreement preventing the amendments having the effects described in clauses (1) and (2) above can be amended only upon the approval of the holders of at least 90% of the outstanding units.
|
Brookfield Business Partners
|
118
|
No Limited Partner Approval
Subject to applicable law, the BBU General Partner may generally make amendments to our Limited Partnership Agreement without the approval of any limited partner to reflect:
|
1.
|
a change in the name of our company, the location of our registered office or our registered agent;
|
|
2.
|
the admission, substitution or withdrawal of partners in accordance with our Limited Partnership Agreement;
|
|
3.
|
a change that the BBU General Partner determines is reasonable and necessary or appropriate for our company to qualify or to continue our company's qualification as an exempted limited partnership under the laws of Bermuda or a partnership in which the limited partners have limited liability under the laws of any jurisdiction, or is necessary or advisable in the opinion of the BBU General Partner to ensure that our company will not be treated as an association taxable as a corporation or otherwise taxed as an entity for tax purposes;
|
|
4.
|
an amendment that the BBU General Partner determines to be necessary or appropriate to address changes in tax regulations, legislation or interpretation;
|
|
5.
|
an amendment that is necessary, in the opinion of our counsel, to prevent our company or the BBU General Partner or its directors or officers from in any manner being subjected to the provisions of the U.S.
Investment Company Act of 1940
, as amended (the "Investment Company Act"), or similar legislation in other jurisdictions;
|
|
6.
|
an amendment that the BBU General Partner determines in its sole discretion to be necessary or appropriate in connection with the creation, authorization or issuance of any class or series of partnership interests or options, rights, warrants or appreciation rights relating to partnership securities;
|
|
7.
|
any amendment expressly permitted in our Limited Partnership Agreement to be made by the BBU General Partner acting alone;
|
|
8.
|
any amendment that the BBU General Partner determines in its sole discretion to be necessary or appropriate to reflect and account for the formation by our company of, or its investment in, any corporation, partnership, joint venture, limited liability company or other entity, as otherwise permitted by our Limited Partnership Agreement;
|
|
9.
|
a change in our company's fiscal year and related changes; or
|
|
10.
|
any other amendments substantially similar to any of the matters described in (1) through (9) above.
|
In addition, the BBU General Partner may make amendments to our Limited Partnership Agreement without the approval of any limited partner if those amendments, in the discretion of the BBU General Partner:
|
1.
|
do not adversely affect our company's limited partners considered as a whole (including any particular class of partnership interests as compared to other classes of partnership interests) in any material respect;
|
|
2.
|
are necessary or appropriate to satisfy any requirements, conditions or guidelines contained in any opinion, directive, order, ruling or regulation of any governmental agency or judicial authority;
|
|
3.
|
are necessary or appropriate to facilitate the trading of our units or to comply with any rule, regulation, guideline or requirement of any securities exchange on which our units or any other partnership interests are or will be listed for trading;
|
|
4.
|
are necessary or appropriate for any action taken by the BBU General Partner relating to splits or combinations of units under the provisions of our Limited Partnership Agreement; or
|
|
5.
|
are required to effect the intent expressed in the final registration statement and prospectus filed in connection with the spin-off or the intent of the provisions of our Limited Partnership Agreement or are otherwise contemplated by our Limited Partnership Agreement.
|
|
119
|
Brookfield Business Partners
|
Opinion of Counsel and Limited Partner Approval
The BBU General Partner will not be required to obtain an opinion of counsel that an amendment will not result in a loss of limited liability to the limited partners if one of the amendments described above under "—No Limited Partner Approval" should occur. No other amendments to our Limited Partnership Agreement will become effective without the approval of holders of at least 90% of our units, unless we obtain an opinion of counsel to the effect that the amendment will not (i) cause our company to be treated as an association taxable as a corporation or otherwise taxable as an entity for tax purposes (provided that for U.S. tax purposes the BBU General Partner has not made the election described below under "—Election to be Treated as a Corporation") or (ii) affect the limited liability under the Bermuda Limited Partnership Act of any of our company's or the Holding LP's limited partners.
In addition to the above restrictions, any amendment that would have a material adverse effect on the rights or preferences of any type or class of partnership interests in relation to other classes of partnership interests will also require the approval or consent of the holders of at least a majority of the outstanding partnership interests of the class so affected.
In addition, any amendment that reduces the voting percentage required to take any action must be approved by the written consent or affirmative vote of limited partners whose aggregate outstanding voting units constitute not less than the voting requirement sought to be reduced.
Sale or Other Disposition of Assets
Our Limited Partnership Agreement generally prohibits the BBU General Partner, without the prior approval of the holders of at least 66
2
/
3
% of the voting power of our units, from causing us to, among other things, sell, exchange or otherwise dispose of all or substantially all of our assets in a single transaction or a series of related transactions. However, the BBU General Partner, in its sole discretion, may mortgage, pledge, hypothecate or grant a security interest in all or substantially all of our assets (including for the benefit of third parties) without that approval. The BBU General Partner may also sell all or substantially all of our assets under any forced sale of any or all of our assets pursuant to the foreclosure of, or other realization upon, those encumbrances without that approval.
Take-Over Bids
If, within 120 days after the date of a take-over bid, as defined in the
Securities Act
(Ontario), the take-over bid is accepted by holders of not less than 90% of our outstanding units, other than our units held at the date of the take-over bid by the offeror or any affiliate or associate of the offeror, and the offeror acquires the units deposited or tendered under the take-over bid, the offeror will be entitled to acquire our units not deposited under the take-over bid on the same terms as the units acquired under the take-over bid.
Election to be Treated as a Corporation
If the BBU General Partner determines in its sole discretion that it is no longer in our company's best interests to continue as a partnership for U.S. federal income tax purposes, the BBU General Partner may elect to treat our company as an association or as a publicly traded partnership taxable as a corporation for U.S. federal (and applicable state) income tax purposes.
Termination and Dissolution
Our company will terminate upon the earlier to occur of: (i) the date on which all of our company's assets have been disposed of or otherwise realized by us and the proceeds of such disposals or realizations have been distributed to partners; (ii) the service of notice by the BBU General Partner, with the special approval of a majority of its independent directors, that in its opinion the coming into force of any law, regulation or binding authority renders illegal or impracticable the continuation of our company; or (iii) at the election of the BBU General Partner, if our company, as determined by the BBU General Partner, is required to register as an "investment company" under the Investment Company Act or similar legislation in other jurisdictions.
Our company will be dissolved upon the withdrawal of the BBU General Partner as the general partner of our company (unless a successor entity becomes the general partner as described in the following sentence or the withdrawal is effected in compliance with the provisions of our Limited Partnership Agreement that are described below under "—Withdrawal of the BBU General Partner") or the date on which any court of competent jurisdiction enters a decree of judicial dissolution of our company or an order to wind-up or liquidate the BBU General Partner without the appointment of a successor in compliance with the provisions of our Limited Partnership Agreement that are described below under "—Withdrawal of the BBU General Partner". Our company will be reconstituted and continue without dissolution if, within 30 days of the date of dissolution (and provided a notice of dissolution has not been provided to the Bermuda Monetary Authority), a successor general partner executes a transfer deed pursuant to which the new general partner assumes the rights and undertakes the obligations of the original general partner, but only if we receive an opinion of counsel that the admission of the new general partner will not result in the loss of limited liability of any limited partner.
|
Brookfield Business Partners
|
120
|
Liquidation and Distribution of Proceeds
Upon dissolution, unless our company is continued as a new limited partnership, the liquidator authorized to wind-up our company's affairs will, acting with all of the powers of the BBU General Partner that the liquidator deems necessary or appropriate in its judgment, liquidate our company's assets and apply the proceeds of the liquidation first, to discharge our company's liabilities as provided in our Limited Partnership Agreement and by law and thereafter to the partners pro rata according to the percentages of their respective partnership interests as of a record date selected by the liquidator. The liquidator may defer liquidation of our assets for a reasonable period of time or distribute assets to partners in kind if it determines that an immediate sale or distribution of all or some of our company's assets would be impractical or would cause undue loss to the partners.
Withdrawal of the BBU General Partner
The BBU General Partner may withdraw as the general partner without first obtaining approval of our unitholders by giving written notice to the other partners, and that withdrawal will not constitute a violation of our Limited Partnership Agreement.
Upon the withdrawal of a general partner, the holders of at least a majority of our units may select a successor to that withdrawing general partner. If a successor is not selected, or is selected but an opinion of counsel regarding limited liability, tax matters and the Investment Company Act (and similar legislation in other jurisdictions) cannot be obtained, our company will be dissolved, wound up and liquidated. See "—Termination and Dissolution" above.
In the event of the withdrawal of a general partner, where such withdrawal will violate our Limited Partnership Agreement, a successor general partner will have the option to purchase the general partnership interest of the departing general partner for a cash payment equal to its fair market value. Under all other circumstances where a general partner withdraws, the departing general partner will have the option to require the successor general partner to purchase the general partnership interest of the departing general partner for a cash payment equal to its fair market value. In each case, this fair market value will be determined by agreement between the departing general partner and the successor general partner. If no agreement is reached within 30 days of the general partner's departure, an independent investment banking firm or other independent expert selected by the departing general partner and the successor general partner will determine the fair market value. If the departing general partner and the successor general partner cannot agree upon an expert within 45 days of the general partner's departure, then an expert chosen by agreement of the experts selected by each of them will determine the fair market value.
If the option described above is not exercised by either the departing general partner or the successor general partner, the departing general partner's general partnership interest will automatically convert into units pursuant to a valuation of those interests as determined by an investment banking firm or other independent expert selected in the manner described in the preceding paragraph.
Transfer of the General Partnership Interest
The BBU General Partner may transfer all or any part of its general partnership interests without first obtaining approval of any unitholder. As a condition of this transfer, the transferee must: (i) agree to assume the rights and duties of the BBU General Partner to whose interest that transferee has succeeded; (ii) agree to assume and be bound by the provisions of our Limited Partnership Agreement; and (iii) furnish an opinion of counsel regarding limited liability, tax matters and the Investment Company Act (and similar legislation in other jurisdictions). Any transfer of the general partnership interest is subject to prior notice to and approval of the relevant Bermuda regulatory authorities. At any time, the members of the BBU General Partner may sell or transfer all or part of their shares in the BBU General Partner without the approval of the unitholders.
Partnership Name
If the BBU General Partner ceases to be the general partner of our company and our new general partner is not an affiliate of Brookfield, our company will be required by our Limited Partnership Agreement to change its name to a name that does not include "Brookfield" and which could not be capable of confusion in any way with such name. Our Limited Partnership Agreement explicitly provides that this obligation shall be enforceable and waivable by the BBU General Partner notwithstanding that it may have ceased to be the general partner of our company.
Transactions with Interested Parties
The BBU General Partner, its affiliates and their respective partners, members, directors, officers, employees and shareholders, which we refer to as "interested parties," may become limited partners or beneficially interested in limited partners and may hold, dispose of or otherwise deal with our units with the same rights they would have if the BBU General Partner was not a party to our Limited Partnership Agreement. An interested party will not be liable to account either to other interested parties or to our company, our company's partners or any other persons for any profits or benefits made or derived by or in connection with any such transaction.
|
121
|
Brookfield Business Partners
|
Our Limited Partnership Agreement permits an interested party to sell investments to, purchase assets from, vest assets in and contract or enter into any contract, arrangement or transaction with our company, the Holding LP, any of the Holding Entities, any operating business or, in general, any entity established by our company and may be interested in any such contract, transaction or arrangement and shall not be liable to account to any of our company, the Holding LP, any of the Holding Entities, any operating business or, in general, any entity established by our company or any other person in respect of any such contract, transaction or arrangement, or any benefits or profits made or derived therefrom, by virtue only of the relationship between the parties concerned, subject to the bye-laws of the BBU General Partner.
Outside Activities of the BBU General Partner; Conflicts of Interest
Under our Limited Partnership Agreement, the BBU General Partner is required to maintain as its sole activity the activity of acting as the general partner of our company and undertaking activities that are ancillary or related thereto. The BBU General Partner is not permitted to engage in any business or activity or incur or guarantee any debts or liabilities except in connection with or incidental to its performance as general partner or incurring, guaranteeing, acquiring, owning or disposing of debt or equity securities of the Holding LP, a Holding Entity or any other holding entity established by our company.
Our Limited Partnership Agreement provides that each person who is entitled to be indemnified by our company (other than the BBU General Partner), as described below under "—Indemnification; Limitation on Liability", will have the right to engage in businesses of every type and description and other activities for profit, and to engage in and possess interests in business ventures of any and every type or description, irrespective of whether: (i) such activities are similar to our activities; or (ii) such businesses and activities directly compete with, or disfavor or exclude, the BBU General Partner, our company, the Holding LP, any Holding Entity, any operating business or, in general, any entity established by us. Such business interests, activities and engagements will be deemed not to constitute a breach of our Limited Partnership Agreement or any duties stated or implied by law or equity, including fiduciary duties, owed to any of the BBU General Partner, our company, the Holding LP, any Holding Entity, any operating business and, in general, any entity established by us (or any of their respective investors), and shall be deemed not to be a breach of the BBU General Partner's fiduciary duties or any other obligation of any type whatsoever of the BBU General Partner. None of the BBU General Partner, our company, the Holding LP, any Holding Entity, any operating business, or, in general, any entity established by us or any other person shall have any rights by virtue of our Limited Partnership Agreement or our company relationship established thereby or otherwise in any business ventures of any person who is entitled to be indemnified by us as described below under "—Indemnification; Limitations on Liability".
The BBU General Partner and the other indemnified persons described in the preceding paragraph do not have any obligation under our Limited Partnership Agreement or as a result of any duties stated or implied by law or equity, including fiduciary duties, to present business or investment opportunities to our company, our limited partners, the Holding LP, any Holding Entity, any operating business or, in general, any entity established by us. These provisions do not affect any obligation of an indemnified person to present business or investment opportunities to our company, the Holding LP, any Holding Entity, any operating business or, in general, any entity established by our company pursuant to the Relationship Agreement or a separate written agreement between such persons.
Any conflicts of interest and potential conflicts of interest that are approved by the BBU General Partner's governance and nominating committee from time to time will be deemed to have been approved by all partners. Pursuant to our conflicts policy, by a majority vote, independent directors may grant approvals for any of the transactions described above in the form of general guidelines, policies or procedures in which case no further special approval will be required in connection with a particular transaction or matter permitted thereby. See Item 7.B., "Related Party Transactions—Conflicts of Interest and Fiduciary Duties".
|
Brookfield Business Partners
|
122
|
Indemnification; Limitations on Liability
Under our Limited Partnership Agreement, our company is required to indemnify to the fullest extent permitted by law the BBU General Partner and any of its affiliates (and their respective officers, directors, agents, shareholders, partners, members and employees), any person who serves on a governing body of the Holding LP, a Holding Entity, operating business or, in general, any entity established by us and any other person designated by the BBU General Partner as an indemnified person, in each case, against any and all losses, claims, damages, liabilities, costs and expenses (including legal fees and expenses), judgments, fines, penalties, interest, settlements and other amounts arising from any and all claims, demands, actions, suits or proceedings, whether civil, criminal, administrative or investigative, incurred by an indemnified person in connection with our activities or by reason of their holding such positions, except to the extent that the claims, liabilities, losses, damages, costs or expenses are determined to have resulted from the indemnified person's bad faith, fraud or willful misconduct, or in the case of a criminal matter, action that the indemnified person knew to have been unlawful. In addition, under our Limited Partnership Agreement: (i) the liability of such persons has been limited to the fullest extent permitted by law, except to the extent that their conduct involves bad faith, fraud or willful misconduct, or in the case of a criminal matter, action that the indemnified person knew to have been unlawful; and (ii) any matter that is approved by the independent directors of the BBU General Partner will not constitute a breach of our Limited Partnership Agreement or any duties stated or implied by law or equity, including fiduciary duties. Our Limited Partnership Agreement requires us to advance funds to pay the expenses of an indemnified person in connection with a matter in which indemnification may be sought until it is determined that the indemnified person is not entitled to indemnification.
Accounts, Reports and Other Information
Under our Limited Partnership Agreement, within the time required by applicable laws and regulations, including any rules of any applicable securities exchange, the BBU General Partner is required to prepare financial statements in accordance with IFRS or such other appropriate accounting principles as determined from time to time and make publicly available as of a date selected by the BBU General Partner in its sole discretion our financial statements together with a statement of the accounting policies used in their preparation, such information as may be required by applicable laws and regulations and such information as the BBU General Partner deems appropriate. Our annual financial statements must be audited by an independent accounting firm of international standing. Our quarterly financial statements may be unaudited and will be made available publicly as and within the time period required by applicable laws and regulations, including any rules of any applicable securities exchange.
The BBU General Partner is also required to use commercially reasonable efforts to prepare and send to the limited partners of our company on an annual basis a Schedule K-1 (or equivalent). However, unitholders that do not ordinarily have U.S. federal tax filing requirements will not receive a Schedule K-1 and related information unless such unitholders request it within 60 days after the close of each calendar year. The BBU General Partner will, where reasonably possible, prepare and send information required by the non-U.S. limited partners of our company for U.S. federal income tax reporting purposes. The BBU General Partner will also use commercially reasonable efforts to supply information required by limited partners of our company for Canadian federal income tax purposes.
Governing Law; Submission to Jurisdiction
Our Limited Partnership Agreement is governed by and will be construed in accordance with the laws of Bermuda. Under our Limited Partnership Agreement, each of our company's partners (other than governmental entities prohibited from submitting to the jurisdiction of a particular jurisdiction) will submit to the non-exclusive jurisdiction of any court in Bermuda in any dispute, suit, action or proceeding arising out of or relating to our Limited Partnership Agreement. Each partner waives, to the fullest extent permitted by law, any immunity from jurisdiction of any such court or from any legal process therein and further waives, to the fullest extent permitted by law, any claim of inconvenient forum, improper venue or that any such court does not have jurisdiction over the partner. Any final judgment against a partner in any proceedings brought in any court in Bermuda will be conclusive and binding upon the partner and may be enforced in the courts of any other jurisdiction of which the partner is or may be subject, by suit upon such judgment. The foregoing submission to jurisdiction and waivers will survive the dissolution, liquidation, winding up and termination of our company.
Transfers of Units
We are not required to recognize any transfer of our units until certificates, if any, evidencing such units are surrendered for registration of transfer. Each person to whom a unit is transferred (including any nominee holder or an agent or representative acquiring such unit for the account of another person) will be admitted to our company as a partner with respect to the unit so transferred subject to and in accordance with the terms of our Limited Partnership Agreement. Any transfer of a unit will not entitle the transferee to share in the profits and losses of our company, to receive distributions, to receive allocations of income, gain, loss, deduction or credit or any similar item or to any other rights to which the transferor was entitled until the transferee becomes a partner and a party to our Limited Partnership Agreement.
|
123
|
Brookfield Business Partners
|
By accepting a unit for transfer in accordance with our Limited Partnership Agreement, each transferee will be deemed to have:
|
•
|
executed our Limited Partnership Agreement and become bound by the terms thereof;
|
|
•
|
granted an irrevocable power of attorney to the BBU General Partner or the liquidator of our company and any officer thereof to act as such partner's agent and attorney-in-fact to execute, swear to, acknowledge, deliver, file and record in the appropriate public offices: (i) all certificates, documents or other instruments relating to the existence or qualification of our company as an exempted limited partnership (or a partnership in which the limited partners have limited liability) in Bermuda and in all jurisdictions in which our company may conduct activities and affairs or own property; any amendment, change, modification or restatement of our Limited Partnership Agreement, subject to the requirements of our Limited Partnership Agreement; the dissolution and liquidation of our company; the admission or withdrawal of any partner of our company or any capital contribution of any partner of our company; the determination of the rights, preferences and privileges of any class or series of units or other partnership interests of our company, and any tax election with any limited partner or general partner on behalf of our company or its partners; and (ii) subject to the requirements of our Limited Partnership Agreement, all ballots, consents, approvals, waivers, certificates, documents and other instruments necessary or appropriate, in the sole discretion of the BBU General Partner or the liquidator of our company, to make, evidence, give, confirm or ratify any voting consent, approval, agreement or other action that is made or given by our company's partners or is consistent with the terms of our Limited Partnership Agreement or to effectuate the terms or intent of our Limited Partnership Agreement;
|
|
•
|
made the consents and waivers contained in our Limited Partnership Agreement, including with respect to the approval of the transactions and agreements entered into in connection with our formation and the spin-off; and
|
|
•
|
ratified and confirmed all contracts, agreements, assignments and instruments entered into on behalf of our company in accordance with our Limited Partnership Agreement, including the granting of any charge or security interest over the assets of our company and the assumption of any indebtedness in connection with the affairs of our company.
|
The transfer of any unit and the admission of any new partner to our company will not constitute any amendment to our Limited Partnership Agreement.
Book-Based System
Our units may be represented in the form of one or more fully registered unit certificates held by, or on behalf of, CDS or DTC, as applicable, as custodian of such certificates for the participants of CDS or DTC, registered in the name of CDS or DTC or their respective nominee, and registration of ownership and transfers of our units may be effected through the book-based system administered by CDS or DTC as applicable.
DESCRIPTION OF THE HOLDING LP LIMITED PARTNERSHIP AGREEMENT
The following is a description of the material terms of the Holding LP Limited Partnership Agreement. You are not a limited partner of the Holding LP and do not have any rights under the Holding LP Limited Partnership Agreement. However, our company is the managing general partner of the Holding LP and is responsible for the management and control of the Holding LP.
We have included a summary of what we believe are the most important provisions of the Holding LP Limited Partnership Agreement because we conduct our operations through the Holding LP and the Holding Entities and our rights with respect to our company's interest in the Holding LP are governed by the terms of the Holding LP Limited Partnership Agreement. Because this description is only a summary of the terms of the agreement, it does not contain all of the information that you may find useful. For more complete information, you should read the Holding LP Limited Partnership Agreement. The agreement is filed as exhibit to this Form 20-F and is also available on our SEDAR profile at
www.sedar.com.
See also Item 10.C., "Material Contracts", Item 10.H., "Documents on Display" and Item 19., "Exhibits".
Formation and Duration
The Holding LP is a Bermuda exempted limited partnership registered under the Bermuda Limited Partnership Act and the Bermuda Exempted Partnerships Act 1992. The Holding LP has a perpetual existence and will continue as a limited liability partnership unless our company is terminated or dissolved in accordance with the Holding LP Limited Partnership Agreement.
Management
As required by law, the Holding LP Limited Partnership Agreement provides for the management and control of the Holding LP by its managing general partner, our company.
|
Brookfield Business Partners
|
124
|
Nature and Purpose
Under the Holding LP Limited Partnership Agreement, the purpose of the Holding LP is to: acquire and hold interests in the Holding Entities and, subject to the approval of our company, interests in any other entity; engage in any activity related to the capitalization and financing of the Holding LP's interests in such entities; and engage in any other activity that is incidental to or in furtherance of the foregoing and that is approved by our company and that lawfully may be conducted by a limited partnership organized under the Bermuda Limited Partnership Act, the Bermuda Exempted Partnerships Act 1992 and our Limited Partnership Agreement.
Units
The Holding LP's units are non-voting limited partnership interests in the Holding LP. Holders of units are not entitled to the withdrawal or return of capital contributions in respect of their units, except to the extent, if any, that distributions are made to such holders pursuant to the Holding LP Limited Partnership Agreement or upon the dissolution of the Holding LP as described below under "—Dissolution" or as otherwise required by applicable law. Holders of the Holding LP's units are not entitled to vote on matters relating to the Holding LP except as described below under "—No Management or Control; No Voting". Except to the extent expressly provided in the Holding LP Limited Partnership Agreement, a holder of Holding LP units will not have priority over any other holder of the Holding LP units, either as to the return of capital contributions or as to profits, losses or distributions. The Holding LP Limited Partnership Agreement does not contain any restrictions on ownership of the Holding LP units. The units of the Holding LP have no par or other stated value.
In connection with the spin-off, Brookfield's units in the Holding LP became the Special LP Units, the Managing General Partner Units were issued to our company and the redemption-exchange units were issued to Brookfield.
Issuance of Additional Partnership Interests
The Holding LP may issue additional partnership interests (including Managing General Partner Units, Special LP Units and redemption-exchange units as well as new classes of partnership interests and options, rights, warrants and appreciation rights relating to such interests) for any partnership purpose (including in connection with any distribution reinvestment plan or the Redemption-Exchange Mechanism), at any time and on such terms and conditions as our company may determine at its sole discretion without the approval of any limited partners. Any additional partnership interests may be issued in one or more classes, or one or more series of classes, with such designations, preferences, rights, powers and duties (which may be senior to existing classes and series of partnership interests) as may be determined by our company in its sole discretion, all without the approval of our limited partners.
Redemption-Exchange Mechanism
At any time after two years from the date of spin-off, or June 20, 2018, the holders of the redemption-exchange units have the right to require the Holding LP to redeem all or a portion of the redemption-exchange units for cash, subject to our company's right to acquire such interests for our units as described below. Any such holder may exercise its right of redemption by delivering a notice of redemption to the Holding LP and our company.
A holder of redemption-exchange units who delivers a notice of redemption will receive, on the redemption-exchange date and subject to our company's right to acquire such interests (in lieu of redemption) in exchange for our units, cash in an amount equal to the market value of one of our units (as determined by reference to the five day volume-weighted average trading price of our units on the principal stock exchange for our units based on trading volumes) multiplied by the number of units to be redeemed. Upon its receipt of the redemption notice, our company will have a right to elect, at its sole discretion, to acquire all (but not less than all) redemption-exchange units presented to the Holding LP for redemption in exchange for units of our company on a one-for-one basis. Upon a redemption, the holder's right to receive distributions with respect to the redemption-exchange units so redeemed will cease.
The date of exchange specified in any redemption notice may not be less than five business days nor more than twenty business days after the date upon which the redemption notice is received by the Holding LP and our company. At any time prior to the applicable redemption-exchange date, any holder of redemption-exchange units who delivers a redemption notice will be entitled to withdraw such redemption notice.
Brookfield's aggregate limited partnership interest in our company is approximately 68% as of the date of this Form 20-F if Brookfield exercised its redemption right on the redemption-exchange units in full and our company exercised our right to acquire such interests in exchange for our units.
|
125
|
Brookfield Business Partners
|
Distributions
Distributions by the Holding LP will be made in the sole discretion of our company. However, our company will not be permitted to cause the Holding LP to make a distribution if the Holding LP does not have sufficient cash on hand to make the distribution, the distribution would render the Holding LP insolvent or if, in the opinion of our company, the distribution would or might leave the Holding LP with insufficient funds to meet any future or contingent obligations, or the distribution would contravene the Bermuda Limited Partnership Act. For greater certainty, the Holding LP or one or more of the Holding Entities may (but neither is obligated to) borrow money in order to obtain sufficient cash to make a distribution.
Except as set forth below, prior to the dissolution of the Holding LP, distributions of available cash (if any), including cash that has been borrowed for such purpose, in any given quarter will be made by the Holding LP as follows, referred to as the Regular Distribution Waterfall:
|
•
|
first, 100% of any available cash to our company until our company has been distributed an amount equal to our expenses and outlays for the quarter properly incurred;
|
|
•
|
second, to the extent distributions in respect of redemption-exchange units have accrued in previous quarters (as described below), 100% to all the holders of redemption-exchange units pro rata in proportion to their respective percentage interests (which will be calculated using redemption-exchange units only) of all amounts that have been accrued in previous quarters and not yet recovered;
|
|
•
|
third, to the extent that incentive distributions have been deferred in previous quarters, 100% to the holder of the Special LP Units of all amounts that have been accrued in previous quarters and not yet recovered;
|
|
•
|
fourth, to all owners of the Holding LP's partnership interests, pro rata to their percentage interests up to the amount per unit of the then regular quarterly distribution (currently $0.0625 per unit) for such quarter;
|
|
•
|
fifth, 100% to the holder of the Special LP Units until an amount equal to the incentive distribution amount (see below for an explanation of the calculation of the incentive distribution amount) for the preceding quarter has been distributed provided that for any quarter in which our company determines that there is insufficient cash to pay the incentive distribution, our company may elect to pay all or a portion of this distribution in redemption-exchange units or may elect to defer all or a portion of the amount distributable for payment from available cash in future quarters; and
|
|
•
|
thereafter, any available cash then remaining to the owners of the Holding LP's partnership interests, pro rata to their percentage interests.
|
The expenses and outlays described in the first bullet point of the Regular Distribution Waterfall (as well as in the first bullet point below describing distributions in the context of a dissolution) include expenses that are to be incurred and paid by its company directly and are generally comprised of expenses that by their nature must be incurred by our company and not by any of our subsidiaries, such as stock exchange and listing fees, expenses related to capital market transactions, organizational expenses and similar customary expenses that would be incurred by a public holding entity that has no independent means of generating revenue. Such expenses and outlays do not include amounts payable to Brookfield, the Service Providers or any of their affiliates, including the base management fee, as those amounts, if any, will be paid by the Holding LP or one or more of its direct or indirect subsidiaries.
The incentive distribution amount for a quarter will be equal to (a) 20% of the growth in the market value of our units quarter-over-quarter (but only after the market value exceeds the "Incentive Distribution Threshold" being initially $25.00 and adjusted at the beginning of each quarter to be equal to the greater of (i) our unit's market value for the previous quarter and (ii) the Incentive Distribution Threshold at the end of the previous quarter) multiplied by (b) the number of units outstanding at the end of the last business day of the applicable quarter (assuming full conversion of the redemption-exchange units into units). For the purposes of calculating incentive distributions, the market value of our units will be equal to the quarterly volume-weighted average price of our units on the principal stock exchange for our units (based on trading volumes). The incentive distribution amount, if any, will be calculated at the end of each calendar quarter. The Incentive Distribution Threshold is $31.19 at the end of
December 2017
. The Incentive Distribution Threshold will be adjusted in accordance with the Holding LP Limited Partnership Agreement in the event of transactions with a dilutive effect on the value of the units including any quarterly cash distributions above the initial amount of $0.0625/unit.
If, prior to the dissolution of the Holding LP, available cash in any quarter is not sufficient to pay the regular quarterly distribution (currently $0.0625/unit), to the owners of all the Holding LP interests, pro rata to their percentage interest, then our company may elect to pay the distribution first to our company, in respect of the Managing General Partner Units of the Holding LP held by our company, and then to the holders of the redemption-exchange units to the extent practicable, and shall accrue any such deficiency for payment from available cash in future quarters as described above.
|
Brookfield Business Partners
|
126
|
If, prior to the dissolution of the Holding LP, available cash is deemed by our company, in its sole discretion, to be (i) attributable to sales or other dispositions of the Holding LP's assets, and (ii) representative of unrecovered capital, then such available cash shall be distributed to the partners of the Holding LP in proportion to the unrecovered capital attributable to the Holding LP interests held by the partners until such time as the unrecovered capital attributable to each such partnership interest is equal to zero. Thereafter, distributions of available cash made by the Holding LP (to the extent made prior to dissolution) will be made in accordance with the Regular Distribution Waterfall.
Upon the occurrence of an event resulting in the dissolution of the Holding LP, all cash and property of the Holding LP in excess of that required to discharge the Holding LP's liabilities will be distributed as follows: (i) to the extent such cash and/or property is attributable to a realization event occurring prior to the event of dissolution, such cash and/or property will be distributed in accordance with the Regular Distribution Waterfall and/or the distribution waterfall applicable to unrecovered capital, (ii) the aggregate amount of distributions previously deferred in respect of the redemption-exchange units and not previously recovered and (iii) all other cash and/or property will be distributed in the manner set forth below:
|
•
|
first, 100% to our company until our company has received an amount equal to the excess of: (i) the amount of our outlays and expenses incurred during the term of the Holding LP; over (ii) the aggregate amount of distributions received by our company pursuant to the first tier of the Regular Distribution Waterfall during the term of the Holding LP;
|
|
•
|
second, 100% to the partners of the Holding LP, in proportion to their respective amounts of unrecovered capital in the Holding LP;
|
|
•
|
third, to the extent that incentive distributions have been deferred in previous quarters, 100% to the holder of the Special LP Units of all amounts that have been accrued in previous quarters and not yet recovered;
|
|
•
|
fourth, to all owners of the Holding LP's partnership interests, pro rata to their percentage interests up to the amount per unit of the then regular quarterly distribution (currently $0.0625 per unit) for such quarter;
|
|
•
|
fifth, 100% to the holder of the Special LP Units until an amount equal to the incentive distribution amount (see above for an explanation of the calculation of the incentive distribution amount) for the preceding quarter has been distributed; and
|
|
•
|
thereafter, any available cash then remaining to the owners of the Holding LP's partnership interests, pro rata to their percentage interests.
|
Each partner's percentage interest is determined by the relative portion of all outstanding partnership interests held by that partner from time to time and is adjusted upon and reflects the issuance of additional partnership interests of the Holding LP. In addition, the unreturned capital attributable to each of our partnership interests, as well as certain of the distribution thresholds set forth above, may be adjusted pursuant to the terms of the Holding LP Limited Partnership Agreement so as to ensure the uniformity of the economic rights and entitlements of: (i) the previously outstanding Holding LP's partnership interests; and (ii) the subsequently-issued Holding LP's partnership interests.
The Holding LP Limited Partnership Agreement provides that, to the extent that any Holding Entity or any operating business pays to Brookfield any comparable performance or incentive distribution, the amount of any incentive distributions paid to the holder of the Special LP Units in accordance with the distribution entitlements described above will be reduced in an equitable manner to avoid duplication of distributions.
The holder of the Special LP Units may elect, at its sole discretion, to reinvest incentive distributions in redemption-exchange units or our units.
No Management or Control; No Voting
The Holding LP limited partners, in their capacities as such, may not take part in the management or control of the activities and affairs of the Holding LP and do not have any right or authority to act for or to bind the Holding LP or to take part or interfere in the conduct or management of the Holding LP. Limited partners are not entitled to vote on matters relating to the Holding LP, although holders of units are entitled to consent to certain matters as described below under "—Amendment of the Holding LP Limited Partnership Agreement", "Amendment of the Holding LP Limited Partnership Agreement—Opinion of Counsel and Limited Partner Approval" and "—Withdrawal of the Managing General Partner" which may be effected only with the consent of the holders of the percentages of outstanding units of the Holding LP specified below. For purposes of any approval required from holders of the Holding LP's units, if holders of redemption-exchange units are entitled to vote, they will be entitled to one vote per unit held subject to a maximum number of votes equal to 49% of the total voting power of all units of the Holding LP then issued and outstanding. Each unit entitles the holder thereof to one vote for the purposes of any approvals of holders of units.
|
127
|
Brookfield Business Partners
|
Meetings
Our company may call special meetings of the limited partners of the Holding LP at a time and place outside of Canada determined by us on a date not less than 10 days nor more than 60 days after the mailing of notice of the meeting. Special meetings of the limited partners may also be called by limited partners owning 50% or more of the outstanding partnership interests of the class or classes for which a meeting is proposed. For this purpose, our outstanding partnership interests do not include partnership interests owned by our company or Brookfield. Only holders of record on the date set by our company (which may not be less than 10 days nor more than 60 days before the meeting) are entitled to receive notice of any meeting.
Amendment of the Holding LP Limited Partnership Agreement
Amendments to the Holding LP Limited Partnership Agreement may be proposed only by or with the consent of our company. To adopt a proposed amendment, other than the amendments that do not require limited partner approval discussed below, our company must seek approval of a majority of the Holding LP's outstanding units required to approve the amendment, either by way of a meeting of the limited partners to consider and vote upon the proposed amendment or by written approval. For this purpose, the redemption-exchange units will not constitute a separate class and will vote together with the other outstanding limited partnership units of the Holding LP.
For purposes of any approval required from holders of the Holding LP's units, if holders of redemption-exchange units are entitled to vote, they will be entitled to one vote per unit held subject to a maximum number of votes equal to 49% of the total voting power of all units of the Holding LP then issued and outstanding.
Prohibited Amendments
No amendment may be made that would:
|
1.
|
enlarge the obligations of any limited partner of the Holding LP without its consent, except that any amendment that would have a material adverse effect on the rights or preferences of any class of partnership interests in relation to other classes of partnership interests may be approved by at least a majority of the type or class of partnership interests so affected; or
|
|
2.
|
enlarge the obligations of, restrict in any way any action by or rights of, or reduce in any way the amounts distributable, reimbursable or otherwise payable by the Holding LP to the BBU General Partner or any of its affiliates without the consent of the BBU General Partner which may be given or withheld in its sole discretion.
|
The provision of the Holding LP Limited Partnership Agreement preventing the amendments having the effects described in clauses (1) or (2) above can be amended upon the approval of the holders of at least 90% of the outstanding limited partnership units of the Holding LP.
No Limited Partner Approval
Subject to applicable law, our company may generally make amendments to the Holding LP Limited Partnership Agreement without the approval of any limited partner to reflect:
|
1.
|
a change in the name of the Holding LP, the location of the Holding LP's registered office or the Holding LP's registered agent;
|
|
2.
|
the admission, substitution, withdrawal or removal of partners in accordance with the Holding LP Limited Partnership Agreement;
|
|
3.
|
a change that our company determines is reasonable and necessary or appropriate for the Holding LP to qualify or to continue its qualification as an exempted limited partnership under the laws of Bermuda or a partnership in which the limited partners have limited liability under the laws of any jurisdiction, or is necessary or advisable in the opinion of our company to ensure that the Holding LP will not be treated as an association taxable as a corporation or otherwise taxed as an entity for tax purposes;
|
|
4.
|
an amendment that our company determines to be necessary or appropriate to address certain changes in tax regulations, legislation or interpretation;
|
|
5.
|
an amendment that is necessary, in the opinion of counsel, to prevent the Holding LP or our company or its directors or officers, from in any manner being subjected to the provisions of the Investment Company Act or similar legislation in other jurisdictions;
|
|
Brookfield Business Partners
|
128
|
|
6.
|
an amendment that our company determines in its sole discretion to be necessary or appropriate for the creation, authorization or issuance of any class or series of partnership interests or options, rights, warrants or appreciation rights relating to partnership interests;
|
|
7.
|
any amendment expressly permitted in the Holding LP Limited Partnership Agreement to be made by our company acting alone;
|
|
8.
|
any amendment that our company determines in its sole discretion to be necessary or appropriate to reflect and account for the formation or ownership by the Holding LP of, or its investment in, any corporation, partnership, joint venture, limited liability company or other entity, as otherwise permitted by the Holding LP Limited Partnership Agreement;
|
|
9.
|
a change in the Holding LP's fiscal year and related changes;
|
|
10.
|
any amendment concerning the computation or allocation of specific items of income, gain, expense or loss among the partners that, in the sole discretion of our company, is necessary or appropriate to: (i) comply with the requirements of applicable law; (ii) reflect the partners' interests in the Holding LP; or (iii) consistently reflect the distributions made by the Holding LP to the partners pursuant to the terms of the Holding LP Limited Partnership Agreement;
|
|
11.
|
any amendment that our company determines in its sole discretion to be necessary or appropriate to address any statute, rule, regulation, notice, or announcement that affects or could affect the U.S. federal income tax treatment of any allocation or distribution related to any interest of our company in the profits of the Holding LP; or
|
|
12.
|
any other amendments substantially similar to any of the matters described in (1) through (11) above.
|
In addition, our company may make amendments to the Holding LP Limited Partnership Agreement without the approval of any limited partner if those amendments, in the discretion of our company:
|
1.
|
do not adversely affect the Holding LP limited partners considered as a whole (including any particular class of partnership interests as compared to other classes of partnership interests) in any material respect;
|
|
2.
|
are necessary or appropriate to satisfy any requirements, conditions or guidelines contained in any opinion or binding directive, order, ruling or regulation of any governmental agency or judicial authority;
|
|
3.
|
are necessary or appropriate for any action taken by our company relating to splits or combinations or units or partnership interests under the provisions of the Holding LP Limited Partnership Agreement; or
|
|
4.
|
are required to effect the intent expressed in the final registration and prospectus filed in connection with the spin-off or the intent of the provisions of the Holding LP Limited Partnership Agreement or are otherwise contemplated by the Holding LP Limited Partnership Agreement.
|
Opinion of Counsel and Limited Partner Approval
Our company will not be required to obtain an opinion of counsel that an amendment will not result in a loss of limited liability to the limited partners if one of the amendments described above under "—No Limited Partner Approval" should occur. Any other amendment to the Holding LP Limited Partnership Agreement will only become effective either with the approval of at least 90% of the Holding LP's units, or if an opinion of counsel is obtained to effect that the amendment will not (i) cause the Holding LP to be treated as an association taxable as a corporation or otherwise taxable as an entity for tax purposes (provided that for U.S. tax purposes our company has not made the election described below under "—Election to be Treated as a Corporation"), or (ii) affect the limited liability under the Bermuda Limited Partnership Act of any of the Holding LP limited partners.
In addition to the above restrictions, any amendment that would have a material adverse effect on the rights or preferences of any type or class of partnership interests in relation to other classes of partnership interests will also require the approval of the holders of at least a majority of the outstanding partnership interests of the class so affected.
In addition, any amendment that reduces the voting percentage required to take any action must be approved by the written consent or affirmative vote of limited partners whose aggregate outstanding voting units constitute not less than the voting requirement sought to be reduced.
|
129
|
Brookfield Business Partners
|
Sale or Other Disposition of Assets
The Holding LP Limited Partnership Agreement generally prohibits our company, without the prior approval of the holders of a majority of the units of the Holding LP, from causing the Holding LP to, among other things, sell, exchange or otherwise dispose of all or substantially all of the Holding LP's assets in a single transaction or a series of related transactions, including by approving on the Holding LP's behalf the sale, exchange or other disposition of all or substantially all of the assets of the Holding LP's subsidiaries. However, our company, in its sole discretion, may mortgage, pledge, hypothecate or grant a security interest in all or substantially all of the Holding LP's assets (including for the benefit of persons who are not the Holding LP or the Holding LP's subsidiaries) without that approval. Our company may also sell all or substantially all of the Holding LP's assets under any forced sale of any or all of the Holding LP's assets pursuant to the foreclosure or other realization upon those encumbrances without that approval.
Election to be Treated as a Corporation
If we determine that it is no longer in the Holding LP's best interests to continue as a partnership for U.S. federal income tax purposes, we may elect to treat the Holding LP as an association or as a publicly traded partnership taxable as a corporation for U.S. federal (and applicable state) income tax purposes.
Dissolution
The Holding LP will dissolve and its affairs will be wound up upon the earlier of: (i) the service of notice by our company, with the approval of a majority of the members of the independent directors of the BBU General Partner, that in our opinion the coming into force of any law, regulation or binding authority renders illegal or impracticable the continuation of the Holding LP; (ii) the election of our company if the Holding LP, as determined by our company, is required to register as an "investment company" under the Investment Company Act or similar legislation in other jurisdictions; (iii) the date that our company withdraws from the Holding LP (unless a successor entity becomes the managing general partner of the Holding LP as described below under "—Withdrawal of the Managing General Partner"); (iv) the date on which any court of competent jurisdiction enters a decree of judicial dissolution of the Holding LP or an order to wind-up or liquidate our company without the appointment of a successor in compliance with the provisions of the Holding LP Limited Partnership Agreement that are described below under "—Withdrawal of the Managing General Partner"; or (v) the date on which our company decides to dispose of, or otherwise realize proceeds in respect of, all or substantially all of the Holding LP's assets in a single transaction or series of transactions.
The Holding LP will be reconstituted and continue without dissolution if within 30 days of the date of dissolution (and provided that a notice of dissolution with respect to the Holding LP has not been provided to the Bermuda Monetary Authority), a successor managing general partner executes a transfer deed pursuant to which the new managing general partner assumes the rights and undertakes the obligations of the original managing general partner, but only if the Holding LP receives an opinion of counsel that the admission of the new managing general partner will not result in the loss of limited liability of any limited partner of the Holding LP.
Withdrawal of the Managing General Partner
Our company may withdraw as managing general partner of the Holding LP without first obtaining approval of unitholders of the Holding LP by giving written notice, and that withdrawal will not constitute a violation of the Holding LP Limited Partnership Agreement.
Upon the withdrawal of our company, the holders of at least a majority of outstanding Special LP Units may select a successor to that withdrawing managing general partner. If a successor is not selected, or is selected but an opinion of counsel regarding limited liability, tax matters and the Investment Company Act (and similar legislation in other jurisdictions) cannot be obtained, the Holding LP will be dissolved, wound up and liquidated.
Our company may not be removed as managing general partner by the partners of the Holding LP.
|
Brookfield Business Partners
|
130
|
In the event of the withdrawal of a managing general partner as a result of certain events relating to the bankruptcy, insolvency or dissolution of that managing general partner, which withdrawal will violate the Holding LP Limited Partnership Agreement, a successor managing general partner will have the option to purchase the Managing General Partner Units of the departing managing general partner for a cash payment equal to its fair market value. Under all other circumstances where a managing general partner withdraws, the departing managing general partner will have the option to require the successor managing general partner to purchase the Managing General Partner Units of the departing managing general partner for a cash payment equal to its fair market value. In each case, this fair market value will be determined by agreement between the departing managing general partner and the successor managing general partner. If no agreement is reached within 30 days of the managing general partner's departure, an independent investment banking firm or other independent expert selected by the departing managing general partner and the successor managing general partner will determine the fair market value. If the departing managing general partner and the successor managing general partner cannot agree upon an expert within 45 days of the managing general partner's departure, then an expert chosen by agreement of the experts selected by each of them will determine the fair market value.
If the option described above is not exercised by either the departing managing general partner or the successor managing general partner, the departing managing general partner's Managing General Partner Units will automatically convert into units pursuant to a valuation of those interests as determined by an investment banking firm or other independent expert selected in the manner described in the preceding paragraph.
Transfer of the Managing General Partner Units
Our company may transfer all or any part of its Managing General Partner Units without first obtaining approval of any unitholder of the Holding LP. As a condition of this transfer, the transferee must: (i) agree to assume and be bound by the rights and duties of the managing general partner to whose interest that transferee has succeeded; (ii) agree to assume and be bound by the provisions of the Holding LP Limited Partnership Agreement; and (iii) furnish an opinion of counsel regarding limited liability, tax matters and the Investment Company Act (and similar legislation in other jurisdictions). Any transfer of the Managing General Partner Units is subject to prior notice to and approval of the relevant Bermuda regulatory authorities. At any time, the BBU General Partner may transfer all or any part of its general partnership interests in our company without the approval of our unitholders as described under Item 10.B., "Memorandum and Articles of Association—Description of our Units and our Limited Partnership Agreement—Transfer of the General Partnership Interest".
Transactions with Interested Parties
Our company, its affiliates and their respective partners, members, directors, officers, employees and shareholders, which we refer to as "interested parties", may become limited partners or beneficially interested in limited partners and may hold, dispose of or otherwise deal with units of the Holding LP with the same rights they would have if our company and the BBU General Partner were not a party to the Holding LP Limited Partnership Agreement. An interested party will not be liable to account either to other interested parties or to the Holding LP, its partners or any other persons for any profits or benefits made or derived by or in connection with any such transaction.
The Holding LP Limited Partnership Agreement permits an interested party to sell investments to, purchase assets from, vest assets in and enter into any contract, arrangement or transaction with our company, the Holding LP, any of the Holding Entities, any operating business or, in general, any entity established by the Holding LP and may be interested in any such contract, transaction or arrangement and shall not be liable to account either to the Holding LP, any of the Holding Entities, any operating business or, in general, any entity established by the Holding LP or any other person in respect of any such contract, transaction or arrangement, or any benefits or profits made or derived therefrom, by virtue only of the relationship between the parties concerned, subject to the bye-laws of the BBU General Partner.
Outside Activities of the Managing General Partner
In accordance with our Limited Partnership Agreement, our company is authorized to: (i) acquire and hold interests in the Holding LP and, subject to the approval of the BBU General Partner, interests in any other entity; (ii) engage in any activity related to the capitalization and financing of our company's interests in the Holding LP and such other entities; (iii) serve as the managing general partner of the Holding LP and execute and deliver, and perform the functions of a managing general partner specified in, the Holding LP Limited Partnership Agreement; and (iv) engage in any activity that is incidental to or in furtherance of the foregoing and that is approved by the BBU General Partner and that lawfully may be conducted by a limited partnership organized under the Bermuda Limited Partnership Act, the Bermuda Exempted Partnerships Act 1992 and our Limited Partnership Agreement.
|
131
|
Brookfield Business Partners
|
The Holding LP Limited Partnership Agreement provides that each person who is entitled to be indemnified by the Holding LP, as described below under "—Indemnification; Limitations on Liability", will have the right to engage in businesses of every type and description and other activities for profit, and to engage in and possess interests in business ventures of any and every type or description, irrespective of whether: (i) such businesses and activities are similar to our activities; or (ii) such businesses and activities directly compete with, or disfavor or exclude, the BBU General Partner, our company, the Holding LP, any Holding Entity, any operating business, or, in general, any entity established by the Holding LP. Such business interests, activities and engagements will be deemed not to constitute a breach of the Holding LP Limited Partnership Agreement or any duties stated or implied by law or equity, including fiduciary duties, owed to any of the BBU General Partner, our company, the Holding LP, any Holding Entity, any operating business and, in general, any entity established by the Holding LP (or any of their respective investors) and shall be deemed not to be a breach of our company's fiduciary duties or any other obligation of any type whatsoever of our company. None of the BBU General Partner, our company, the Holding LP, any Holding Entity, operating business, or, in general, any entity established by the Holding LP or any other person shall have any rights by virtue of the Holding LP Limited Partnership Agreement or our company relationship established thereby or otherwise in any business ventures of any person who is entitled to be indemnified by the Holding LP as described below under "—Indemnification; Limitations on Liability".
Our company and the other indemnified persons described in the preceding paragraph do not have any obligation under the Holding LP Limited Partnership Agreement or as a result of any duties stated or implied by law or equity, including fiduciary duties, to present business or investment opportunities to the Holding LP, the limited partners of the Holding LP, any Holding Entity, any operating business or, in general, any entity established by the Holding LP. These provisions do not affect any obligation of such indemnified person to present business or acquisition opportunities to our company, the Holding LP, any Holding Entity, any operating business or, in general, any entity established by the Holding LP pursuant to the Relationship Agreement or any separate written agreement between such persons.
Accounts, Reports and Other Information
Under the Holding LP Limited Partnership Agreement, our company is required to prepare financial statements in accordance with IFRS or such other appropriate accounting principles as determined from time to time by our company, in its sole discretion.
Our company is also required to use commercially reasonable efforts to prepare and send to the limited partners of the Holding LP on an annual basis a Schedule K-1 (or equivalent). Our company will also, where reasonably possible and applicable, prepare and send information required by the non-U.S. limited partners of the Holding LP for U.S. federal income tax reporting purposes.
Indemnification; Limitations on Liability
Under the Holding LP Limited Partnership Agreement, it is required to indemnify to the fullest extent permitted by law the BBU General Partner, our company and any of their respective affiliates (and their respective officers, directors, agents, shareholders, partners, members and employees), any person who serves on the board of directors or other governing body of the Holding LP, a Holding Entity, an operating business or, in general, any entity established by our company and any other person designated by its general partner as an indemnified person, in each case, against any and all losses, claims, damages, liabilities, costs and expenses (including legal fees and expenses), judgments, fines, penalties, interest, settlements and other amounts arising from any and all claims, demands, actions, suits or proceedings whether civil, criminal, administrative or investigative, incurred by an indemnified person in connection with our company's investments and activities or by reason of their holding such positions, except to the extent that the claims, liabilities, losses, damages, costs or expenses are determined to have resulted from the indemnified person's bad faith, fraud or willful misconduct, or in the case of a criminal matter, action that the indemnified person knew to have been unlawful. In addition, under the Holding LP Limited Partnership Agreement: (i) the liability of such persons has been limited to the fullest extent permitted by law, except to the extent that their conduct involves bad faith, fraud or willful misconduct, or in the case of a criminal matter, action that the indemnified person knew to have been unlawful; and (ii) any matter that is approved by the independent directors will not constitute a breach of any duties stated or implied by law or equity, including fiduciary duties. The Holding LP Limited Partnership Agreement requires Holding LP to advance funds to pay the expenses of an indemnified person in connection with a matter in which indemnification may be sought until it is determined that the indemnified person is not entitled to indemnification.
Governing Law
The Holding LP Limited Partnership Agreement is governed by and will be construed in accordance with the laws of Bermuda.
|
Brookfield Business Partners
|
132
|
10.C. MATERIAL CONTRACTS
The following are the only material contracts, other than the contracts entered into in the ordinary course of business, which have been entered into by us since our formation or which are proposed to be entered into by us:
|
1.
|
Master Services Agreement, dated June 1, 2016, by and among Brookfield Asset Management, the Service Recipients and the Service Providers described under the heading Item 7.B., "Related Party Transactions—Our Master Services Agreement";
|
|
2.
|
Relationship Agreement, dated June 1, 2016, by and among Brookfield Asset Management, our company, the Holding LP, the Holding Entities and the Service Providers described under the heading Item 7.B., "Related Party Transactions—Relationship Agreement";
|
|
3.
|
Registration Rights Agreement, dated June 1, 2016, between our company and Brookfield Asset Management described under the heading Item 7.B., "Related Party Transactions—Registration Rights Agreement";
|
|
4.
|
Credit Agreement, dated October 19, 2017, between BGIS US Inc. as lender, our company as guarantor and Holding LP, CanHoldco, Bermuda Holdco and US Holdco as borrowers described under the heading Item 7.B., "Related Party Transactions-Credit Facilities";
|
|
5.
|
Amended and Restated Limited Partnership Agreement of our company, dated May 31, 2016, described under the heading Item 10.B., "Memorandum and Articles of Association—Description of our Units and our Limited Partnership Agreement";
|
|
6.
|
Amended and Restated Limited Partnership Agreement of Holding LP, dated May 31, 2016, described under the heading Item 10.B., "Description of the Holding LP Limited Partnership Agreement";
|
|
7.
|
Voting Agreement, dated June 1, 2016, by and among Brookfield Asset Management, Brookfield CanGP Limited, Brookfield Canadian GP LP and CanHoldco described under the heading Item 7.B., "Related Party Transactions—Voting Agreements"; and
|
|
8.
|
Trade-Mark Sublicense Agreement, dated May 24, 2016, by and among Brookfield Asset Management Holdings Ltd., our company, and the Holding LP.
|
Copies of the agreements noted above are available, free of charge, from the BBU General Partner and are available electronically on the website of the SEC at
www.sec.gov
and on our SEDAR profile at
www.sedar.com
. Written requests for such documents should be directed to our Corporate Secretary at 73 Front Street, 5th Floor, Hamilton HM 12, Bermuda.
10.D. EXCHANGE CONTROLS
There are currently no governmental laws, decrees, regulations or other legislation of Bermuda which restrict the import or export of capital or the remittance of dividends, interest or other payments to non-residents of Bermuda holding our units.
10.E. TAXATION
The following summary discusses certain material U.S., Canadian, and Bermudian tax considerations related to the holding and disposition of our units as of the date hereof. Prospective purchasers of our units are advised to consult their own tax advisers concerning the consequences under the tax laws of the country of which they are resident or in which they are otherwise subject to tax of making an investment in our units.
|
133
|
Brookfield Business Partners
|
Certain Material U.S. Federal Income Tax Considerations
The following is a summary of certain material U.S. federal income tax considerations to unitholders relating to the receipt, holding and disposition of our units as of the date hereof. This summary is based on provisions of the U.S. Internal Revenue Code, on the regulations promulgated thereunder, or Treasury Regulations, and on published administrative rulings, judicial decisions and other applicable authorities, all as in effect on the date hereof and all of which are subject to change at any time, possibly with retroactive effect. This summary is necessarily general and may not apply to all categories of investors, some of whom may be subject to special rules, including, without limitation, persons that own (directly or indirectly, applying certain attribution rules) 5% or more of our units, dealers in securities or currencies, financial institutions or financial services entities, mutual funds, life insurance companies, persons that hold our units as part of a straddle, hedge, constructive sale or conversion transaction with other investments, persons whose units are loaned to a short seller to cover a short sale of units, persons whose functional currency is not the U.S. dollar, persons who have elected mark-to-market accounting, persons who hold our units through a partnership or other entity treated as a pass-through entity for U.S. federal income tax purposes, persons for whom our units are not a capital asset, persons who are liable for the alternative minimum tax and certain U.S. expatriates or former long-term residents of the United States. Tax-exempt organizations are addressed separately below. The actual tax consequences of the ownership and disposition of our units will vary depending on your individual circumstances.
For purposes of this discussion, a "U.S. Holder" is a beneficial owner of one or more of our units that is for U.S. federal tax purposes: (i) an individual citizen or resident of the United States; (ii) a corporation (or other entity treated as a corporation for U.S. federal income tax purposes) created or organized in or under the laws of the United States, any state thereof or the District of Columbia; (iii) an estate the income of which is subject to U.S. federal income taxation regardless of its source; or (iv) a trust (a) that is subject to the primary supervision of a court within the United States and all substantial decisions of which one or more U.S. persons have the authority to control or (b) that has a valid election in effect under applicable Treasury Regulations to be treated as a U.S. person.
A "Non-U.S. Holder" is a beneficial owner of one or more of our units, other than a U.S. Holder or an entity classified as a partnership or other fiscally transparent entity for U.S. federal tax purposes.
If a partnership holds our units, the tax treatment of a partner of such partnership generally will depend upon the status of the partner and the activities of the partnership. Partners of partnerships that hold our units should consult their own tax advisers.
This discussion does not constitute tax advice and is not intended to be a substitute for tax planning. You should consult your own tax adviser concerning the U.S. federal, state and local income tax consequences particular to your ownership and disposition of our units, as well as any tax consequences under the laws of any other taxing jurisdiction.
Partnership Status of Our Company and the Holding LP
Each of our company and the Holding LP has made a protective election to be classified as a partnership for U.S. federal tax purposes. An entity that is treated as a partnership for U.S. federal tax purposes incurs no U.S. federal income tax liability. Instead, each partner is generally required to take into account its allocable share of items of income, gain, loss, deduction or credit of the partnership in computing its U.S. federal income tax liability, regardless of whether cash distributions are made. Distributions of cash by a partnership to a partner generally are not taxable unless the amount of cash distributed to a partner is in excess of the partner's adjusted basis in its partnership interest.
An entity that would otherwise be classified as a partnership for U.S. federal income tax purposes may nonetheless be taxable as a corporation if it is a "publicly traded partnership", unless an exception applies. Our company is publicly traded. However, an exception, referred to as the "Qualifying Income Exception", exists with respect to a publicly traded partnership if (i) at least 90% of such partnership's gross income for every taxable year consists of "qualifying income" and (ii) the partnership would not be required to register under the Investment Company Act if it were a U.S. corporation. Qualifying income includes certain interest income, dividends, real property rents, gains from the sale or other disposition of real property and any gain from the sale or disposition of a capital asset or other property held for the production of income that otherwise constitutes qualifying income.
The BBU General Partner intends to manage the affairs of our company and the Holding LP so that our company will meet the Qualifying Income Exception in each taxable year. Accordingly, the BBU General Partner believes that our company will be treated as a partnership and not as an association taxable as a corporation for U.S. federal income tax purposes.
|
Brookfield Business Partners
|
134
|
If our company fails to meet the Qualifying Income Exception, other than a failure which is determined by the IRS to be inadvertent and which is cured within a reasonable time after discovery, or if our company is required to register under the Investment Company Act, our company will be treated as if it had transferred all of its assets, subject to liabilities, to a newly formed corporation, on the first day of the year in which our company fails to meet the Qualifying Income Exception, in return for stock in such corporation, and then distributed the stock to our unitholders in liquidation. This deemed contribution and liquidation could result in the recognition of gain (but not loss) to U.S. Holders, except that U.S. Holders generally would not recognize the portion of such gain attributable to stock or securities of non-U.S. corporations held by us. If, at the time of such contribution, our company were to have liabilities in excess of the tax basis of its assets, U.S. Holders generally would recognize gain in respect of such excess liabilities upon the deemed transfer. Thereafter, our company would be treated as a corporation for U.S. federal income tax purposes.
If our company were treated as a corporation in any taxable year, either as a result of a failure to meet the Qualifying Income Exception or otherwise, our company's items of income, gain, loss, deduction or credit would be reflected only on our company's tax return rather than being passed through to our unitholders, and our company would be subject to U.S. corporate income tax and potentially branch profits tax with respect to its income, if any, effectively connected with a U.S. trade or business. Moreover, under certain circumstances, our company might be classified as a PFIC for U.S. federal income tax purposes, and a U.S. Holder would be subject to the rules applicable to PFICs discussed below. See "—Consequences to U.S. Holders—Passive Foreign Investment Companies". Subject to the PFIC rules, distributions made to U.S. Holders would be treated as taxable dividend income to the extent of our company's current or accumulated earnings and profits. Any distribution in excess of current and accumulated earnings and profits would first be treated as a tax-free return of capital to the extent of a U.S. Holder's adjusted tax basis in its units. Thereafter, to the extent such distribution were to exceed a U.S. Holder's adjusted tax basis in its units, the distribution would be treated as a gain from the sale or exchange of such units. The amount of a distribution treated as a dividend could be eligible for reduced rates of taxation, provided certain conditions are met. In addition, dividends, interest and certain other passive income received by our company with respect to U.S. subsidiaries generally would be subject to U.S. withholding tax at a rate of 30% (although certain Non-U.S. Holders nevertheless might be entitled to certain treaty benefits in respect of their allocable share of such income) and U.S. Holders would not be allowed a tax credit with respect to any such tax withheld. In addition, the "portfolio interest" exemption would not apply to certain interest income of our company (although certain Non-U.S. Holders nevertheless might be entitled to certain treaty benefits in respect of their allocable share of such income). Depending on the composition of our assets, additional adverse U.S. federal income tax consequences could result under the anti-inversion rules described in Section 7874 of the U.S. Internal Revenue Code, as implemented by the Treasury Regulations and IRS administrative guidance.
Based on the foregoing consequences, the treatment of our company as a corporation could materially reduce a holder's after-tax return and therefore could result in a substantial reduction of the value of our units. If the Holding LP were to be treated as a corporation for U.S. federal income tax purposes, consequences similar to those described above would apply.
The remainder of this summary assumes that our company and the Holding LP will be treated as partnerships for U.S. federal tax purposes. Our company expects that a substantial portion of the items of income, gain, deduction, loss or credit realized by our company will be realized in the first instance by the Holding LP and allocated to our company for reallocation to our unitholders. Unless otherwise specified, references in this section to realization of our company's items of income, gain, loss, deduction or credit include a realization of such items by the Holding LP and the allocation of such items to our company.
Consequences to U.S. Holders
Holding of Our Units
Income and Loss
If you are a U.S. Holder, you will be required to take into account, as described below, your allocable share of our company's items of income, gain, loss, deduction and credit for each of our company's taxable years ending with or within your taxable year. Each item generally will have the same character and source as though you had realized the item directly. You must report such items without regard to whether any distribution has been or will be received from our company. Our company intends to make cash distributions to all unitholders on a quarterly basis in amounts generally expected to be sufficient to permit U.S. Holders to fund their estimated U.S. tax obligations (including U.S. federal, state and local income taxes) with respect to their allocable shares of our company's net income or gain. However, based upon your particular tax situation and simplifying assumptions that our company will make in determining the amount of such distributions, and depending upon whether you elect to reinvest such distributions pursuant to the distribution reinvestment plan, if available, your tax liability might exceed cash distributions made to you, in which case any tax liabilities arising from your ownership of our units would need to be satisfied from your own funds.
|
135
|
Brookfield Business Partners
|
With respect to U.S. Holders who are individuals, certain dividends paid by a corporation (including certain qualified foreign corporations) to our company and that are allocable to such U.S. Holders may qualify for reduced rates of taxation. A qualified foreign corporation includes a foreign corporation that is eligible for the benefits of specified income tax treaties with the United States. In addition, a foreign corporation is treated as a qualified corporation with respect to its shares that are readily tradable on an established securities market in the United States. Among other exceptions, U.S. Holders who are individuals will not be eligible for reduced rates of taxation on any dividends if the payer is a PFIC for the taxable year in which such dividends are paid or for the preceding taxable year. Dividends received by non-corporate U.S. Holders may be subject to an additional Medicare tax on unearned income of 3.8% (see "—Medicare Tax" below). U.S. Holders that are corporations may be entitled to a "dividends received deduction" in respect of dividends paid by U.S. corporations in which our company (through the Holding LP) owns stock. You should consult your own tax adviser regarding the application of the foregoing rules in light of your particular circumstances.
For U.S. federal income tax purposes, your allocable share of our company's items of income, gain, loss, deduction or credit will be governed by our Limited Partnership Agreement if such allocations have "substantial economic effect" or are determined to be in accordance with your interest in our company. Similarly, our company's allocable share of items of income, gain, loss, deduction or credit of the Holding LP will be governed by the Holding LP Limited Partnership Agreement if such allocations have "substantial economic effect" or are determined to be in accordance with our company's interest in the Holding LP. The BBU General Partner believes that, for U.S. federal income tax purposes, such allocations should be given effect, and the BBU General Partner intends to prepare and file tax returns based on such allocations. If the IRS were to successfully challenge the allocations made pursuant to either our Limited Partnership Agreement or the Holding LP Limited Partnership Agreement, then the resulting allocations for U.S. federal income tax purposes might be less favorable than the allocations set forth in such agreements.
Basis
You will have an initial tax basis in your units equal to the sum of (i) the amount of cash paid for our units (or, if you received your units pursuant to the spin-off, the amount of dividend income you recognized pursuant to the spin-off) and (ii) your share of our company's liabilities, if any. That basis will be increased by your share of our company's income and by increases in your share of our company's liabilities, if any. That basis will be decreased, but not below zero, by distributions you receive from our company, by your share of our company's losses and by any decrease in your share of our company's liabilities. Under applicable U.S. federal income tax rules, a partner in a partnership has a single, or "unitary", tax basis in his or her partnership interest. As a result, any amount you pay to acquire additional units (including through the distribution reinvestment plan, if available) will be averaged with the adjusted tax basis of units owned by you prior to the acquisition of such additional units.
For purposes of the foregoing rules, the rules discussed immediately below, and the rules applicable to a sale or exchange of our units, our company's liabilities generally will include our company's share of any liabilities of the Holding LP.
Limits on Deductions for Losses and Expenses
Your deduction of your allocable share of our company's losses will be limited to your tax basis in our units and, if you are an individual or a corporate holder that is subject to the "at risk" rules, to the amount for which you are considered to be "at risk" with respect to our company's activities, if that is less than your tax basis. In general, you will be at risk to the extent of your tax basis in our units, reduced by (i) the portion of that basis attributable to your share of our company's liabilities for which you will not be personally liable (excluding certain qualified non-recourse financing) and (ii) any amount of money you borrow to acquire or hold our units, if the lender of those borrowed funds owns an interest in our company, is related to you, or can look only to your units for repayment. Your at-risk amount generally will increase by your allocable share of our company's income and gain and decrease by distributions you receive from our company and your allocable share of losses and deductions. You must recapture losses deducted in previous years to the extent that distributions cause your at-risk amount to be less than zero at the end of any taxable year. Losses disallowed or recaptured as a result of these limitations will carry forward and will be allowable to the extent that your tax basis or at-risk amount, whichever is the limiting factor, subsequently increases. Upon the taxable disposition of our units, any gain recognized by you can be offset by losses that were previously suspended by the at-risk limitation, but may not be offset by losses suspended by the basis limitation. Any excess loss above the gain previously suspended by the at-risk or basis limitations may no longer be used. Under the Tax Cuts and Jobs Act, non-corporate taxpayers are not permitted to deduct “excess business losses” for taxable years beginning after December 31, 2017, and before January 1, 2026. You should consult your own tax adviser regarding the limitations on the deductibility of losses under the U.S. Internal Revenue Code.
Limitations on Deductibility of Organizational Expenses and Syndication Fees
In general, neither our company nor any U.S. Holder may deduct organizational or syndication expenses. Similar rules apply to organizational or syndication expenses incurred by the Holding LP. Syndication fees (which would include any sales or placement fees or commissions) must be capitalized and cannot be amortized or otherwise deducted.
|
Brookfield Business Partners
|
136
|
Limitations on Interest Deductions
Your share of our company's interest expense, if any, is likely to be treated as "investment interest" expense. For a non-corporate U.S. Holder, the deductibility of "investment interest" expense generally is limited to the amount of such holder's "net investment income". Net investment income includes gross income from property held for investment and amounts treated as portfolio income under the passive loss rules, less deductible expenses, other than interest, directly connected with the production of investment income, but generally does not include gains attributable to the disposition of property held for investment. Your share of our company's dividend and interest income will be treated as investment income, although "qualified dividend income" subject to reduced rates of tax in the hands of an individual will only be treated as investment income if such individual elects to treat such dividend as ordinary income not subject to reduced rates of tax. In addition, state and local tax laws may disallow deductions for your share of our company's interest expense. Under Section 163(j) of the U.S. Internal Revenue Code, as amended by the Tax Cuts and Jobs Act, additional limitations may apply to a corporate U.S. Holder's share of our company's interest expense, if any.
Deductibility of Partnership Investment Expenditures by Individual Partners and by Trusts and Estates
Under the Tax Cuts and Jobs Act, individuals and certain estates and trusts will not be permitted to claim miscellaneous itemized deductions for taxable years beginning after December 31, 2017, and before January 1, 2026. Such miscellaneous itemized deductions may include the operating expenses of our company, including our company's allocable share of the base management fee or any other management fees.
Treatment of Distributions
Distributions of cash by our company generally will not be taxable to you to the extent of your adjusted tax basis (described above) in our units. Any cash distributions in excess of your adjusted tax basis generally will be considered to be gain from the sale or exchange of our units (described below). Such gain generally will be treated as capital gain and will be long-term capital gain if your holding period for our units exceeds one year. A reduction in your allocable share of our liabilities, and certain distributions of marketable securities by our company, if any, will be treated similar to cash distributions for U.S. federal income tax purposes.
Sale or Exchange of Our Units
You will recognize gain or loss on the sale or taxable exchange of our units equal to the difference, if any, between the amount realized and your tax basis in our units sold or exchanged. Your amount realized will be measured by the sum of the cash or the fair market value of other property received plus your share of our company's liabilities, if any.
Gain or loss recognized by you upon the sale or exchange of our units generally will be taxable as capital gain or loss and will be long-term capital gain or loss if our units were held for more than one year as of the date of such sale or exchange. Assuming you have not elected to treat your share of our company's interest in any PFIC as a "qualified electing fund", gain attributable to such interest in a PFIC would be taxable in the manner described below in "—Passive Foreign Investment Companies". In addition, certain gain attributable to "unrealized receivables" or "inventory items" could be characterized as ordinary income rather than capital gain. For example, if our company were to hold debt acquired at a market discount, accrued market discount on such debt would be treated as "unrealized receivables". The deductibility of capital losses is subject to limitations.
Each U.S. Holder who acquires our units at different times and intends to sell all or a portion of our units within a year of the most recent purchase should consult its own tax adviser regarding the application of certain "split holding period" rules to such sale and the treatment of any gain or loss as long-term or short-term capital gain or loss.
Medicare Tax
U.S. Holders that are individuals, estates or trusts may be required to pay a 3.8% Medicare tax on the lesser of (i) the excess of such U.S. Holders' "modified adjusted gross income" (or "adjusted gross income" in the case of estates and trusts) over certain thresholds and (ii) such U.S. Holders' "net investment income" (or "undistributed net investment income" in the case of estates and trusts). Net investment income generally includes your allocable share of our company's income, as well as gain realized by you from a sale of our units. You should consult your own tax adviser regarding the implications of the 3.8% Medicare tax for your ownership and disposition of our units.
|
137
|
Brookfield Business Partners
|
Foreign Tax Credit Limitations
If you are a U.S. Holder, you generally will be entitled to a foreign tax credit with respect to your allocable share of creditable foreign taxes paid on our company's income and gain. Complex rules may, depending on your particular circumstances, limit the availability or use of foreign tax credits. Gain from the sale of our company's assets may be treated as U.S.-source gain. Consequently, you may not be able to use the foreign tax credit arising from any foreign taxes imposed on such gain unless the credit can be applied (subject to applicable limitations) against U.S. tax due on other income treated as derived from foreign sources. Certain losses that our company incurs may be treated as foreign-source losses, which could reduce the amount of foreign tax credits otherwise available.
Deduction for Qualified Business Income
Under the Tax Cuts and Jobs Act, for taxable years beginning after December 31, 2017, and before January 1, 2026, U.S. taxpayers who have domestic “qualified business income” from a partnership generally are entitled to deduct the lesser of such qualified business income or 20% of taxable income. The 20% deduction is also allowed for “qualified publicly traded partnership income”. A U.S. Holder’s allocable share of our company’s income is not expected to be treated as qualified business income or as qualified publicly traded partnership income.
Section 754 Election
Our company and the Holding LP have each made the election permitted by Section 754 of the U.S. Internal Revenue Code, or Section 754 Election. The Section 754 Election cannot be revoked without the consent of the IRS. The Section 754 Election generally requires our company to adjust the tax basis in its assets, or inside basis, attributable to a transferee of our units under Section 743(b) of the U.S. Internal Revenue Code to reflect the purchase price paid by the transferee for our units. This election does not apply to a person who purchases units directly from us. For purposes of this discussion, a transferee's inside basis in our company's assets will be considered to have two components: (i) the transferee's share of our company's tax basis in our company's assets, or common basis, and (ii) the adjustment under Section 743(b) of the U.S. Internal Revenue Code to that basis. The foregoing rules would also apply to the Holding LP.
Generally, a Section 754 Election would be advantageous to a transferee U.S. Holder if such holder's tax basis in its units were higher than such units' share of the aggregate tax basis of our company's assets immediately prior to the transfer. In that case, as a result of the Section 754 Election, the transferee U.S. Holder would have a higher tax basis in its share of our company's assets for purposes of calculating, among other items, such holder's share of any gain or loss on a sale of our company's assets. Conversely, a Section 754 Election would be disadvantageous to a transferee U.S. Holder if such holder's tax basis in its units were lower than such units' share of the aggregate tax basis of our company's assets immediately prior to the transfer. Thus, the fair market value of our units may be affected either favorably or adversely by the election.
Whether or not the Section 754 Election is made, if our units are transferred at a time when our company has a "substantial built-in loss" in its assets, our company will be obligated to reduce the tax basis in the portion of such assets attributable to such units.
The calculations involved in the Section 754 Election are complex, and the BBU General Partner advises that it will make such calculations on the basis of assumptions as to the value of our company assets and other matters. Each U.S. Holder should consult its own tax adviser as to the effects of the Section 754 Election.
Uniformity of Our Units
Because we cannot match transferors and transferees of our units, we must maintain the uniformity of the economic and tax characteristics of our units to a purchaser of our units. In the absence of uniformity, we may be unable to comply fully with a number of U.S. federal income tax requirements. A lack of uniformity can result from a literal application of certain Treasury Regulations to our company's Section 743(b) adjustments, a determination that our company's Section 704(c) allocations are unreasonable or other reasons. Section 704(c) allocations would be intended to reduce or eliminate the disparity between tax basis and the value of our company's assets in certain circumstances, including on the issuance of additional units. In order to maintain the fungibility of all of our units at all times, we will seek to achieve the uniformity of U.S. tax treatment for all purchasers of our units which are acquired at the same time and price (irrespective of the identity of the particular seller of our units or the time when our units are issued by our company), through the application of certain tax accounting principles that the BBU General Partner believes are reasonable for our company. However, the IRS may disagree with us and may successfully challenge our application of such tax accounting principles. Any non-uniformity could have a negative impact on the value of our units.
|
Brookfield Business Partners
|
138
|
Foreign Currency Gain or Loss
Our company's functional currency is the U.S. dollar, and our company's income or loss is calculated in U.S. dollars. It is likely that our company will recognize "foreign currency" gain or loss with respect to transactions involving non-U.S. dollar currencies. In general, foreign currency gain or loss is treated as ordinary income or loss. You should consult your own tax adviser regarding the tax treatment of foreign currency gain or loss.
Passive Foreign Investment Companies
U.S. Holders may be subject to special rules applicable to indirect investments in foreign corporations, including an investment through our company in a PFIC. A PFIC is defined as any foreign corporation with respect to which (after applying certain look-through rules) either (i) 75% or more of its gross income for a taxable year is "passive income" or (ii) 50% or more of its assets in any taxable year (generally based on the quarterly average of the value of its assets) produce or are held for the production of "passive income". There are no minimum stock ownership requirements for PFICs. If you hold an interest in a foreign corporation for any taxable year during which the corporation is classified as a PFIC with respect to you, then the corporation will continue to be classified as a PFIC with respect to you for any subsequent taxable year during which you continue to hold an interest in the corporation, even if the corporation's income or assets would not cause it to be a PFIC in such subsequent taxable year, unless an exception applies.
Subject to certain elections described below, any gain on the disposition of stock of a PFIC owned by you indirectly through our company, as well as income realized on certain "excess distributions" by such PFIC, would be treated as though realized ratably over the shorter of your holding period of our units or our company's holding period for the PFIC. Such gain or income generally would be taxable as ordinary income, and dividends paid by the PFIC would not be eligible for the preferential tax rates for dividends paid to non-corporate U.S. Holders. In addition, an interest charge would apply, based on the tax deemed deferred from prior years.
If you were to elect to treat your share of our company's interest in a PFIC as a "qualified electing fund", or QEF Election, for the first year you were treated as holding such interest, then in lieu of the tax consequences described in the paragraph immediately above, you would be required to include in income each year a portion of the ordinary earnings and net capital gains of the PFIC, even if not distributed to our company or to you. A QEF Election must be made by you on an entity-by-entity basis. To the extent reasonably practicable, we intend to timely provide you with information related to the PFIC status of each entity we are able to identify as a PFIC, including information necessary to make a QEF Election with respect to each such entity. Any such election should be made for the first year our company holds an interest in such entity or for the first year in which you hold our units, if later.
In the case of a PFIC that is a publicly traded foreign company, and in lieu of making a QEF Election, an election may be made to "mark to market" the stock of such publicly traded foreign company on an annual basis. Pursuant to such an election, you would include in each year as ordinary income the excess, if any, of the fair market value of such stock over its adjusted basis at the end of the taxable year. However, no assurance can be provided that any Holding Entity or operating business classified as a PFIC will be publicly traded. Thus, the mark-to-market election may not be available to a U.S. Holder in respect of its indirect ownership interest through our company in a PFIC.
Based on our organizational structure, as well as our expected income and assets, the BBU General Partner currently believes that a U.S. Holder is unlikely to be regarded as owning an interest in a PFIC solely by reason of owning our units for the taxable year ending December 31, 2018. However, there can be no assurance that a future entity in which our company acquires an interest will not be classified as a PFIC with respect to a U.S. Holder, because PFIC status is a factual determination that depends on the assets and income of a given entity and must be made on an annual basis. Moreover, we may decide to hold an existing or future operating business through a Holding Entity that would be a PFIC in order to ensure that our company satisfies the Qualifying Income Exception, among other reasons. See "—Corporate Structure" below. Accordingly, there can be no assurance that a current or future subsidiary will not qualify as a PFIC.
Subject to certain exceptions, a U.S. person who directly or indirectly owns an interest in a PFIC generally is required to file an annual report with the IRS, and the failure to file such report could result in the imposition of penalties on such U.S. person and in the extension of the statute of limitations with respect to federal income tax returns filed by such U.S. person. You should consult your own tax adviser regarding the PFIC rules, including the foregoing filing requirements, as well as the advisability of making a QEF Election or a mark-to-market election with respect to any PFIC in which you are treated as owning an interest through our company.
|
139
|
Brookfield Business Partners
|
Corporate Structure
To ensure that our company meets the Qualifying Income Exception for publicly traded partnerships (discussed above) and complies with certain requirements in our Limited Partnership Agreement, among other reasons, our company may structure certain acquisitions through an entity classified as a corporation for U.S. federal income tax purposes. Such acquisitions will be structured as determined in the sole discretion of the BBU General Partner generally to be efficient for our unitholders. However, because our unitholders will be located in numerous taxing jurisdictions, no assurance can be given that any such structure will benefit all our unitholders to the same extent, and such a structure might even result in additional tax burdens on some unitholders. As discussed above, if any such entity were a non-U.S. corporation, it might be considered a PFIC. If any such entity were a U.S. corporation, it would be subject to U.S. federal net income tax on its income, including any gain recognized on the disposition of its assets. In addition, if the asset were to involve U.S. real property, gain recognized on the disposition of the asset by a corporation generally would be subject to corporate-level tax, whether the corporation were a U.S. or a non-U.S. corporation.
U.S. Withholding Taxes
Although each U.S. Holder is required to provide us with an IRS Form W-9, we nevertheless may be unable to accurately or timely determine the tax status of our unitholders for purposes of determining whether U.S. withholding applies to payments made by our company to some or all of our unitholders. In such a case, payments made by our company to U.S. Holders might be subject to U.S. "backup" withholding at the applicable rate or other U.S. withholding taxes. You would be able to treat as a credit your allocable share of any U.S. withholding taxes paid in the taxable year in which such withholding taxes were paid and, as a result, you might be entitled to a refund of such taxes from the IRS. In the event you transfer or otherwise dispose of some or all of your units, special rules might apply for purposes of determining whether you or the transferee of such units were subject to U.S. withholding taxes in respect of income allocable to, or distributions made on account of, such units or entitled to refunds of any such taxes withheld. See below "Administrative Matters—Certain Effects of a Transfer of Units". You should consult your own tax adviser regarding the treatment of U.S. withholding taxes.
Transferor/Transferee Allocations
Our company may allocate items of income, gain, loss and deduction using a monthly convention, whereby any such items recognized in a given month by our company are allocated to our unitholders as of a specified date of such month. As a result, if you transfer your units, you might be allocated income, gain, loss and deduction realized by our company after the date of the transfer. Similarly, if you acquire additional units, you might be allocated income, gain, loss and deduction realized by our company prior to your ownership of such units.
Section 706 of the U.S. Internal Revenue Code generally governs allocations of items of partnership income and deductions between transferors and transferees of partnership interests, and the Treasury Regulations provide a safe harbor allowing a publicly traded partnership to use a monthly simplifying convention for such purposes. However, it is not clear that our company's allocation method complies with the requirements. If our company's convention were not permitted, the IRS might contend that our company's taxable income or losses must be reallocated among our unitholders. If such a contention were sustained, your tax liabilities might be adjusted to your detriment. The BBU General Partner is authorized to revise our company's method of allocation between transferors and transferees (as well as among investors whose interests otherwise vary during a taxable period).
U.S. Federal Estate Tax Consequences
If our units are included in the gross estate of a U.S. citizen or resident for U.S. federal estate tax purposes, then a U.S. federal estate tax might be payable in connection with the death of such person. Individual U.S. Holders should consult their own tax advisers concerning the potential U.S. federal estate tax consequences with respect to our units.
Certain Reporting Requirements
A U.S. Holder who invests more than $100,000 in our company may be required to file IRS Form 8865 reporting the investment with such U.S. Holder's U.S. federal income tax return for the year that includes the date of the investment. You may be subject to substantial penalties if you fail to comply with this and other information reporting requirements with respect to an investment in our units. You should consult your own tax adviser regarding such reporting requirements.
|
Brookfield Business Partners
|
140
|
U.S. Taxation of Tax-Exempt U.S. Holders of Our Units
Income recognized by a U.S. tax-exempt organization is exempt from U.S. federal income tax except to the extent of the organization's UBTI. UBTI is defined generally as any gross income derived by a tax-exempt organization from an unrelated trade or business that it regularly carries on, less the deductions directly connected with that trade or business. In addition, income arising from a partnership (or other entity treated as a partnership for U.S. federal income tax purposes) that holds operating assets or is otherwise engaged in a trade or business generally will constitute UBTI. Notwithstanding the foregoing, UBTI generally does not include any dividend income, interest income, certain other categories of passive income or capital gains realized by a tax-exempt organization, so long as such income is not "debt-financed", as discussed below. The BBU General Partner currently believes that our company should not be regarded as engaged in a trade or business, and anticipates that any operating assets held by our company will be held through entities that are treated as corporations for U.S. federal income tax purposes.
The exclusion from UBTI does not apply to income from "debt-financed property", which is treated as UBTI to the extent of the percentage of such income that the average acquisition indebtedness with respect to the property bears to the average tax basis of the property for the taxable year. If an entity treated as a partnership for U.S. federal income tax purposes incurs acquisition indebtedness, a tax-exempt partner in such partnership will be deemed to have acquisition indebtedness equal to its allocable portion of such acquisition indebtedness. If any such indebtedness were used by our company or by the Holding LP to acquire property, such property generally would constitute debt-financed property, and any income from or gain from the disposition of such debt-financed property allocated to a tax-exempt organization generally would constitute UBTI to such tax-exempt organization. In addition, even if such indebtedness were not used either by our company or by the Holding LP to acquire property but were instead used to fund distributions to our unitholders, if a tax-exempt organization subject to taxation in the United States were to use such proceeds to make an investment outside our company, the IRS might assert that such investment constitutes debt-financed property to such unitholder with the consequences noted above. The BBU General Partner does not expect our company or the Holding LP to directly incur debt to acquire property, and the BBU General Partner does not believe that our company or the Holding LP will generate UBTI attributable to debt-financed property in the future. Moreover, the BBU General Partner intends to use commercially reasonable efforts to structure our activities to avoid generating UBTI. However, neither our company nor the Holding LP is prohibited from incurring indebtedness, and no assurance can be provided that neither our company nor the Holding LP will generate UBTI attributable to debt-financed property in the future. Tax-exempt U.S. Holders should consult their own tax advisers regarding the tax consequences of an investment in our units.
Consequences to Non-U.S. Holders
Holding of Units and Other Considerations
Based on our organizational structure, as well as our company's expected income and assets, the BBU General Partner currently believes that our company is unlikely to earn income treated as effectively connected with a U.S. trade or business, including effectively connected income attributable to the sale of a "United States real property interest", as defined in the U.S. Internal Revenue Code. Moreover, the BBU General Partner intends to use commercially reasonable efforts to structure our activities to avoid the realization by our company and the Holding LP of income treated as effectively connected with a U.S. trade or business. If, as anticipated, our company is not treated as engaged in a U.S. trade or business or as deriving income which is treated as effectively connected with a U.S. trade or business, and provided that a Non-U.S. Holder is not itself engaged in a U.S. trade or business, then such Non-U.S. Holder generally will not be subject to U.S. tax return filing requirements solely as a result of owning our units and generally will not be subject to U.S. federal income tax on its allocable share of our company's interest and dividends from non-U.S. sources or gain from the sale or other disposition of securities or real property located outside of the United States.
However, there can be no assurance that the law will not change or that the IRS will not deem our company to be engaged in a U.S. trade or business. If, contrary to the BBU General Partner's expectations, our company is treated as engaged in a U.S. trade or business, then a Non-U.S. Holder generally would be required to file a U.S. federal income tax return, even if no effectively connected income were allocable to it. If our company were to have income treated as effectively connected with a U.S. trade or business, then a Non-U.S. Holder would be required to report that income and would be subject to U.S. federal income tax at the regular graduated rates. In addition, our company might be required to withhold U.S. federal income tax on such Non-U.S. Holder's distributive share of such income. A corporate Non-U.S. Holder might also be subject to branch profits tax at a rate of 30%, or at a lower treaty rate, if applicable. Under the Tax Cuts and Jobs Act, if, contrary to expectation, our company were engaged in a U.S. trade or business, then gain or loss from the sale of our units by a Non-U.S. Holder would be treated as effectively connected with such trade or business to the extent that such Non-U.S. Holder would have had effectively connected gain or loss had our company sold all of its assets at their fair market value as of the date of such sale. In such case, any such effectively connected gain generally would be taxable at the regular graduated U.S. federal income tax rates, and the amount realized from such sale generally would be subject to a 10% U.S. federal withholding tax. The 10% U.S. federal withholding tax temporarily is suspended with respect to the disposition of an interest in a publicly traded partnership until regulations or other guidance has been issued.
|
141
|
Brookfield Business Partners
|
In general, even if our company is not engaged in a U.S. trade or business, and assuming you are not otherwise engaged in a U.S. trade or business, you will nonetheless be subject to a withholding tax of 30% on the gross amount of certain U.S.-source income which is not effectively connected with a U.S. trade or business. Income subjected to such a flat tax rate is income of a fixed or determinable annual or periodic nature, including dividends and certain interest income. Such withholding tax may be reduced or eliminated with respect to certain types of income under an applicable income tax treaty between the United States and your country of residence or under the "portfolio interest" rules or other provisions of the U.S. Internal Revenue Code, provided that you provide proper certification as to your eligibility for such treatment. Notwithstanding the foregoing, and although each Non-U.S. Holder is required to provide us with an IRS Form W-8, we nevertheless may be unable to accurately or timely determine the tax status of our investors for purposes of establishing whether reduced rates of withholding apply to some or all of our investors. In such a case, your allocable share of distributions of U.S.-source dividend and interest income will be subject to U.S. withholding tax at a rate of 30%. Further, if you would not be subject to U.S. tax based on your tax status or otherwise were eligible for a reduced rate of U.S. withholding, you might need to take additional steps to receive a credit or refund of any excess withholding tax paid on your account, which could include the filing of a non-resident U.S. income tax return with the IRS. Among other limitations applicable to claiming treaty benefits, if you reside in a treaty jurisdiction which does not treat our company as a pass-through entity, you might not be eligible to receive a refund or credit of excess U.S. withholding taxes paid on your account. In the event you transfer or otherwise dispose of some or all of your units, special rules may apply for purposes of determining whether you or the transferee of such units are subject to U.S. withholding taxes in respect of income allocable to, or distributions made on account of, such units or entitled to refunds of any such taxes withheld. See "—Administrative Matters—Certain Effects of a Transfer of Units" below. You should consult your own tax adviser regarding the treatment of U.S. withholding taxes.
Special rules may apply to any Non-U.S. Holder (i) that has an office or fixed place of business in the United States; (ii) that is present in the United States for 183 days or more in a taxable year; or (iii) that is (a) a former citizen or long-term resident of the United States, (b) a foreign insurance company that is treated as holding a partnership interest in our company in connection with its U.S. business, (c) a PFIC or (d) a corporation that accumulates earnings to avoid U.S. federal income tax. You should consult your own tax adviser regarding the application of these special rules.
Taxes in Other Jurisdictions
Based on our expected method of operation and the ownership of our operating businesses indirectly through corporate Holding Entities, we do not expect any unitholder, solely as a result of owning our units, to be subject to any additional income taxes imposed on a net basis or additional tax return filing requirements in any jurisdiction in which we conduct activities or own property. However, our method of operation and current structure may change, and there can be no assurance that, solely as a result of owning our units, you will not be subject to certain taxes, including non-U.S., state and local income taxes, unincorporated business taxes and estate, inheritance or intangible taxes imposed by the various jurisdictions in which we do business or own property now or in the future, even if you do not reside in any of these jurisdictions. Consequently, you may also be required to file non-U.S., state and local income tax returns in some or all of these jurisdictions. Further, you may be subject to penalties for failure to comply with these requirements. It is your responsibility to file all U.S. federal, state, local and non-U.S. tax returns that may be required of you.
Income or gain from assets held by our company may be subject to withholding or other taxes in jurisdictions outside the United States, except to the extent an income tax treaty applies. If you wish to claim the benefit of an applicable income tax treaty, you might be required to submit information to one or more of our company, an intermediary or a tax authority in such jurisdiction. You should consult your own tax adviser regarding the U.S. federal, state, local and non-U.S. tax consequences of an investment in our company.
Administrative Matters
Information Returns and Audit Procedures
We have agreed to use commercially reasonable efforts to furnish to you, within 90 days after the close of each calendar year, U.S. tax information (including IRS Schedule K-1) which describes on a U.S. dollar basis your share of our company's income, gain, loss and deduction for our preceding taxable year. However, providing this U.S. tax information to our unitholders will be subject to delay in the event of, among other reasons, the late receipt of any necessary tax information from lower-tier entities. It is therefore possible that, in any taxable year, you will need to apply for an extension of time to file your tax returns. In addition, unitholders that do not ordinarily have U.S. federal tax filing requirements will not receive a Schedule K-1 and related information unless such unitholders request it within 60 days after the close of each calendar year. In preparing this U.S. tax information, we will use various accounting and reporting conventions, some of which have been mentioned in the previous discussion, to determine your share of income, gain, loss and deduction. The IRS may successfully contend that certain of these reporting conventions are impermissible, which could result in an adjustment to your income or loss.
|
Brookfield Business Partners
|
142
|
Our company may be audited by the IRS. Adjustments resulting from an IRS audit could require you to adjust a prior year's tax liability and result in an audit of your own tax return. Any audit of your tax return could result in adjustments not related to our company's tax returns, as well as those related to our company's tax returns. Under the Bipartisan Budget Act of 2015, for taxable years beginning after December 31, 2017, if the IRS makes an audit adjustment to our income tax returns, it may assess and collect any taxes (including penalties and interest) resulting from such audit adjustment directly from our company instead of unitholders (as under prior law). We may be permitted to elect to have the BBU General Partner and our unitholders take such audit adjustment into account in accordance with their interests in us during the taxable year under audit. However, there can be no assurance that we will choose to make such election or that it will be available in all circumstances. If we do not make the election, we may be required to pay taxes, penalties or interest as a result of an audit adjustment. As a result, our current unitholders might bear some or all of the cost of the tax liability resulting from such audit adjustment, even if our current unitholders did not own our units during the taxable year under audit. The foregoing considerations also apply with respect to our company's interest in the Holding LP.
For taxable years beginning on or before December 31, 2017, the BBU General Partner will act as our company's "tax matters partner". As the tax matters partner, the BBU General Partner will have the authority, subject to certain restrictions, to act on behalf of our company in connection with any administrative or judicial review of our company's items of income, gain, loss, deduction or credit. For taxable years beginning after December 31, 2017, a "partnership representative" designated by our company will have the sole authority to act on behalf of our company in connection with such administrative or judicial review. In Particular, our partnership representative will have the sole authority to bind both our former and current unitholders and to make certain elections on behalf of our company pursuant to the Bipartisan Budget Act of 2015.
The application of the Bipartisan Budget Act of 2015 to our company and our unitholders is uncertain and remains subject to Treasury Regulations and IRS guidance yet to be made final. You should consult your own tax adviser regarding the implications of the Bipartisan Budget Act of 2015 for an investment in our units.
Tax Shelter Regulations and Related Reporting Requirements
If we were to engage in a "reportable transaction", we (and possibly our unitholders) would be required to make a detailed disclosure of the transaction to the IRS in accordance with regulations governing tax shelters and other potentially tax-motivated transactions. A transaction may be a reportable transaction based upon any of several factors, including the fact that it is a type of tax avoidance transaction publicly identified by the IRS as a "listed transaction" or "transaction of interest", or that it produces certain kinds of losses exceeding certain thresholds. An investment in our company may be considered a "reportable transaction" if, for example, our company were to recognize certain significant losses in the future. In certain circumstances, a unitholder who disposes of an interest in a transaction resulting in the recognition by such holder of significant losses in excess of certain threshold amounts may be obligated to disclose its participation in such transaction. Certain of these rules are unclear, and the scope of reportable transactions can change retroactively. Therefore, it is possible that the rules may apply to transactions other than significant loss transactions.
Moreover, if we were to participate in a reportable transaction with a significant purpose to avoid or evade tax, or in any listed transaction, you might be subject to significant accuracy-related penalties with a broad scope, for those persons otherwise entitled to deduct interest on federal tax deficiencies, non-deductibility of interest on any resulting tax liability, and in the case of a listed transaction, an extended statute of limitations. We do not intend to participate in any reportable transaction with a significant purpose to avoid or evade tax, nor do we intend to participate in any listed transactions. However, no assurance can be provided that the IRS will not assert that we have participated in such a transaction.
You should consult your own tax adviser concerning any possible disclosure obligation under the regulations governing tax shelters with respect to the disposition of our units.
Taxable Year
Our company uses the calendar year as its taxable year for U.S. federal income tax purposes. Under certain circumstances which we currently believe are unlikely to apply, a taxable year other than the calendar year may be required for such purposes.
|
143
|
Brookfield Business Partners
|
Withholding and Backup Withholding
For each calendar year, we will report to you and to the IRS the amount of distributions that we pay, and the amount of tax (if any) that we withhold on these distributions. The proper application to our company of the rules for withholding under Sections 1441 through 1446 of the U.S. Internal Revenue Code (applicable to certain dividends, interest and amounts treated as effectively connected with a U.S. trade or business, among other items) is unclear. Because the documentation we receive may not properly reflect the identities of unitholders at any particular time (in light of possible sales of our units), we may over-withhold or under-withhold with respect to a particular unitholder. For example, we may impose withholding, remit such amount to the IRS and thus reduce the amount of a distribution paid to a Non-U.S. Holder. It may be the case, however, that the corresponding amount of our income was not properly allocable to such holder, and the appropriate amount of withholding should have been less than the actual amount withheld. Such Non-U.S. Holder would be entitled to a credit against the holder's U.S. federal income tax liability for all withholding, including any such excess withholding. However, if the withheld amount were to exceed the holder's U.S. federal income tax liability, the holder would need to apply for a refund to obtain the benefit of such excess withholding. Similarly, we may fail to withhold on a distribution, and it may be the case that the corresponding income was properly allocable to a Non-U.S. Holder and that withholding should have been imposed. In such case, we intend to pay the under-withheld amount to the IRS, and we may treat such under-withholding as an expense that will be borne indirectly by all unitholders on a pro rata basis (since we may be unable to allocate any such excess withholding tax cost to the relevant Non-U.S. Holder).
Under the backup withholding rules, you may be subject to backup withholding tax with respect to distributions paid unless: (i) you are an exempt recipient and demonstrate this fact when required; or (ii) provide a taxpayer identification number, certify as to no loss of exemption from backup withholding tax, and otherwise comply with the applicable requirements of the backup withholding tax rules. A U.S. Holder that is exempt should certify such status on a properly completed IRS Form W-9. A Non-U.S. Holder may qualify as an exempt recipient by submitting a properly completed IRS Form W-8. Backup withholding is not an additional tax. The amount of any backup withholding from a payment to you will be allowed as a credit against your U.S. federal income tax liability and may entitle you to a refund from the IRS, provided you supply the required information to the IRS in a timely manner.
If you do not timely provide our company, or the applicable nominee, broker, clearing agent or other intermediary, with IRS Form W-9 or IRS Form W-8, as applicable, or such form is not properly completed, then our company may become subject to U.S. backup withholding taxes in excess of what would have been imposed had our company or the applicable intermediary received properly completed forms from all unitholders. For administrative reasons, and in order to maintain the fungibility of our units, such excess U.S. backup withholding taxes, and if necessary similar items, may be treated by our company as an expense that will be borne indirectly by all unitholders on a pro rata basis (e.g., since it may be impractical for us to allocate any such excess withholding tax cost to the unitholders that failed to timely provide the proper U.S. tax forms).
Foreign Account Tax Compliance
FATCA imposes a 30% withholding tax on "withholdable payments" made to a "foreign financial institution" or a "non-financial foreign entity", unless such financial institution or entity satisfies certain information reporting or other requirements. Withholdable payments include certain U.S.-source income, such as interest, dividends and other passive income. Beginning January 1, 2019, withholdable payments also include gross proceeds from the sale or disposition of property that can produce U.S.-source interest or dividends. The BBU General Partner intends to ensure that our company complies with FATCA, including by entering into an agreement with the IRS if necessary, so as to ensure that the 30% withholding tax does not apply to any withholdable payments received by our company, the Holding LP, the Holding Entities, or the operating businesses. Nonetheless, the 30% withholding tax may also apply to your allocable share of distributions attributable to withholdable payments, unless you properly certify your FATCA status on IRS Form W-8 or IRS Form W-9 (as applicable) and satisfy any additional requirements under FATCA.
In compliance with FATCA, information regarding certain unitholders' ownership of our units may be reported to the IRS or to a non-U.S. governmental authority. FATCA remains subject to modification by an applicable intergovernmental agreement between the United States and another country, such as the agreement in effect between the United States and Bermuda for cooperation to facilitate the implementation of FATCA, or by future Treasury Regulations or guidance. You should consult your own tax adviser regarding the consequences under FATCA of an investment in our units.
|
Brookfield Business Partners
|
144
|
Information Reporting with Respect to Foreign Financial Assets
Under Treasury Regulations, certain U.S. persons that own "specified foreign financial assets" with an aggregate fair market value exceeding either $50,000 on the last day of the taxable year or $75,000 at any time during the taxable year generally are required to file an information report with respect to such assets with their tax returns. Significant penalties may apply to persons who fail to comply with these rules. Specified foreign financial assets include not only financial accounts maintained in foreign financial institutions, but also, unless held in accounts maintained by a financial institution, any stock or security issued by a non-U.S. person, any financial instrument or contract held for investment that has an issuer or counterparty other than a U.S. person and any interest in a foreign entity. The failure to report information required under the current regulations could result in substantial penalties and in the extension of the statute of limitations with respect to federal income tax returns filed by you. You should consult your own tax adviser regarding the possible implications of these Treasury Regulations for an investment in our units.
Certain Effects of a Transfer of Units
Our company may allocate items of income, gain, loss, deduction and credit using a monthly convention, whereby any such items recognized in a given month by our company are allocated to our unitholders as of a specified date of such month. Any U.S. withholding taxes applicable to dividends received by the Holding LP (and, in turn, our company) generally will be withheld by our company only when such dividends are paid. Because our company generally intends to distribute amounts received in respect of dividends shortly after receipt of such amounts, it is generally expected that any U.S. withholding taxes withheld by our company on such amounts will correspond to our unitholders who were allocated income and who received the distributions in respect of such amounts. The Holding LP may acquire debt obligations or other securities for which the accrual of interest or income thereon is not matched by a contemporaneous receipt of cash. Any such accrued interest or other income would be allocated pursuant to such monthly convention. Consequently, our unitholders may recognize income in excess of cash distributions received from our company, and any income so included by a unitholder would increase the basis such unitholder has in our units and would offset any gain (or increase the amount of loss) realized by such unitholder on a subsequent disposition of its units. In addition, U.S. withholding taxes generally would be withheld by our company only on the payment of cash in respect of such accrued interest or other income, and, therefore, it is possible that some unitholders would be allocated income which might be distributed to a subsequent unitholder, and such subsequent unitholder would be subject to withholding at the time of distribution. As a result, the subsequent unitholder, and not the unitholder who was allocated income, would be entitled to claim any available credit with respect to such withholding.
The Holding LP owns and will continue to own certain Holding Entities and operating businesses organized in non-U.S. jurisdictions, and income and gain from such entities and businesses may be subject to withholding and other taxes in such jurisdictions. If any such non-U.S. taxes were imposed on income allocable to a U.S. Holder, and such holder were thereafter to dispose of its units prior to the date distributions were made in respect of such income, under applicable provisions of the U.S. Internal Revenue Code and Treasury Regulations, the unitholder to whom such income was allocated (and not the unitholder to whom distributions were ultimately made) would, subject to other applicable limitations, be the party permitted to claim a credit for such non-U.S. taxes for U.S. federal income tax purposes. Thus, a unitholder may be affected either favorably or adversely by the foregoing rules. Complex rules may, depending on a unitholder's particular circumstances, limit the availability or use of foreign tax credits, and you are urged to consult your own tax adviser regarding all aspects of foreign tax credits.
Nominee Reporting
Persons who hold an interest in our company as a nominee for another person may be required to furnish to us:
|
(i)
|
the name, address and taxpayer identification number of the beneficial owner and the nominee;
|
|
(ii)
|
whether the beneficial owner is (a) a person that is not a U.S. person, (b) a foreign government, an international organization, or any wholly-owned agency or instrumentality of either of the foregoing, or (c) a tax-exempt entity;
|
|
(iii)
|
the amount and description of units held, acquired, or transferred for the beneficial owner; and
|
|
(iv)
|
specific information including the dates of acquisitions and transfers, means of acquisitions and transfers and acquisition cost for purchases, as well as the amount of net proceeds from sales.
|
Brokers and financial institutions may be required to furnish additional information, including whether they are U.S. persons and specific information on units they acquire, hold, or transfer for their own account. A penalty of $250 per failure (as adjusted for inflation), up to a maximum of $3,000,000 per calendar year (as adjusted for inflation), generally is imposed by the U.S. Internal Revenue Code for the failure to report such information to us. The nominee is required to supply the beneficial owner of our units with the information furnished to us.
|
145
|
Brookfield Business Partners
|
New Legislation or Administrative or Judicial Action
The U.S. federal income tax treatment of our unitholders depends, in some instances, on determinations of fact and interpretations of complex provisions of U.S. federal income tax law for which no clear precedent or authority may be available. You should be aware that the U.S. federal income tax rules, particularly those applicable to partnerships, are constantly under review (including currently) by the Congressional tax-writing committees and other persons involved in the legislative process, the IRS, the Treasury Department and the courts, frequently resulting in revised interpretations of established concepts, statutory changes, revisions to regulations and other modifications and interpretations, any of which could adversely affect the value of our units and be effective on a retroactive basis. For example, changes to the U.S. federal tax laws and interpretations thereof could make it more difficult or impossible for our company to be treated as a partnership that is not taxable as a corporation for U.S. federal income tax purposes, change the character or treatment of portions of our company's income (including changes that recharacterize certain allocations as potentially non-deductible fees), reduce the net amount of distributions available to our unitholders, or otherwise affect the tax considerations of owning our units. Such changes could also affect or cause our company to change the way it conducts its activities and adversely affect the value of our units.
Our company's organizational documents and agreements permit the BBU General Partner to modify our Limited Partnership Agreement from time to time, without the consent of our unitholders, to elect to treat our company as a corporation for U.S. federal tax purposes, or to address certain changes in U.S. federal income tax regulations, legislation or interpretation. In some circumstances, such revisions could have a material adverse impact on some or all of our unitholders.
THE FOREGOING DISCUSSION IS NOT INTENDED AS A SUBSTITUTE FOR CAREFUL TAX PLANNING. THE TAX MATTERS RELATING TO OUR COMPANY AND UNITHOLDERS ARE COMPLEX AND ARE SUBJECT TO VARYING INTERPRETATIONS. MOREOVER, THE EFFECT OF EXISTING INCOME TAX LAWS, THE MEANING AND IMPACT OF WHICH IS UNCERTAIN, AND OF PROPOSED CHANGES IN INCOME TAX LAWS WILL VARY WITH THE PARTICULAR CIRCUMSTANCES OF EACH UNITHOLDER, AND IN REVIEWING THIS ANNUAL REPORT ON FORM 20-F THESE MATTERS SHOULD BE CONSIDERED. EACH UNITHOLDER SHOULD CONSULT ITS OWN TAX ADVISER WITH RESPECT TO THE U.S. FEDERAL, STATE, LOCAL, AND OTHER TAX CONSEQUENCES OF ANY INVESTMENT IN OUR UNITS.
Certain Material Canadian Federal Income Tax Considerations
The following is a summary of the principal Canadian federal income tax consequences under the Tax Act of the holding and disposition of units of our company generally applicable to a unitholder who, for purposes of the Tax Act and at all relevant times, holds our units as capital property, deals at arm's length with and is not affiliated with our company, the Holding LP, the BBU General Partner and their respective affiliates (a “
Holder
”). Generally, our units will be considered to be capital property to a Holder, provided that the Holder does not use or hold our units in the course of carrying on a business of trading or dealing in securities and has not acquired them in one or more transactions considered to be an adventure or concern in the nature of trade.
This summary is not applicable to a Holder (i) that is a "financial institution" as defined in the Tax Act for purposes of the "mark-to-market" property rules, (ii) that is a "specified financial institution" as defined in the Tax Act, (iii) who makes or has made a functional currency reporting election pursuant to section 261 of the Tax Act, (iv) an interest in which would be a "tax shelter investment" as defined in the Tax Act or who acquires our units as a "tax shelter investment" (and this summary assumes that no such persons hold our units), (v) that has, directly or indirectly, a "significant interest" as defined in subsection 34.2(1) of the Tax Act in our company, (vi) if any affiliate of our company is, or becomes as part of a series of transactions that includes the acquisition of units of our company, a "foreign affiliate" for purposes of the Tax Act of such Holder or of any corporation that does not deal at arm's length with such Holder for purposes of the Tax Act; or (vii) that has entered or will enter into a "derivative forward agreement", as defined in the Tax Act, in respect of our units. Any such Holders should consult their own tax advisors with respect to an investment in our units.
This summary is based on the current provisions of the Tax Act, all specific proposals to amend the Tax Act publicly announced by or on behalf of the Minister of Finance (Canada) prior to the date hereof (the "
Tax Proposals
"), and the current published administrative and assessing policies and practices of the CRA. This summary assumes that all Tax Proposals will be enacted in the form proposed but no assurance can be given that the Tax Proposals will be enacted in the form proposed or at all. This summary does not otherwise take into account or anticipate any changes in law, whether by judicial, administrative or legislative decision or action, or changes in the CRA's administrative and assessing policies and practices, nor does it take into account provincial, territorial or foreign income tax legislation or considerations, which may differ significantly from those described herein. This summary is not exhaustive of all possible Canadian federal income tax consequences that may affect unitholders. Holders should consult their own tax advisors in respect of the provincial, territorial or foreign income tax consequences to them of holding and disposing of our units.
|
Brookfield Business Partners
|
146
|
This summary also assumes that neither our company nor the Holding LP is a "tax shelter" as defined in the Tax Act or a "tax shelter investment". However, no assurance can be given in this regard.
This summary also assumes that neither our company nor the Holding LP will be a "SIFT partnership" at any relevant time for purposes of the SIFT Rules on the basis that neither our company nor the Holding LP will be a "Canadian resident partnership" at any relevant time. However, there can be no assurance that the SIFT Rules will not be revised or amended such that the SIFT Rules will apply.
This summary does not describe the deductibility of interest on money borrowed to acquire our units nor whether any amounts in respect of our units could be “split income” for the purposes of the Tax Act or the Tax Proposals.
This summary is of a general nature only and is not intended to be, nor should it be construed to be, legal or tax advice to any particular Holder, and no representation with respect to the Canadian federal income tax consequences to any particular Holder is made. Consequently, Holders are advised to consult their own tax advisors with respect to their particular circumstances. See also Item 3.D., "Risk Factors—Risks Related to Taxation—Canada".
For purposes of the Tax Act, all amounts relating to the acquisition, holding or disposition of our units must be expressed in Canadian dollars including any distributions, adjusted cost base and proceeds of disposition. For purposes of the Tax Act, amounts denominated in a currency other than the Canadian dollar generally must be converted into Canadian dollars using the appropriate exchange rate determined in accordance with the detailed rules in the Tax Act in that regard.
Taxation of Canadian Resident Limited Partners
The following portion of the summary is generally applicable to a Holder who, for purposes of the Tax Act and at all relevant times, is resident or deemed to be resident in Canada (a "
Canadian Limited Partner
").
Computation of Income or Loss
Each Canadian Limited Partner is required to include (or, subject to the "at-risk rules" discussed below, entitled to deduct) in computing his or her income for a particular taxation year the Canadian Limited Partner's share of the income (or loss) of our company for its fiscal year ending in, or coincidentally with, the Canadian Limited Partner's taxation year end, whether or not any of that income is distributed to the Canadian Limited Partner in the taxation year and regardless of whether or not our units were held throughout such year.
Our company will not itself be a taxable entity and is not expected to be required to file an income tax return in Canada for any taxation year. However, the income (or loss) of our company for a fiscal period for purposes of the Tax Act will be computed as if it were a separate person resident in Canada and the partners will be allocated a share of that income (or loss) in accordance with our Limited Partnership Agreement. The income (or loss) of our company will include our company's share of the income (or loss) of the Holding LP for a fiscal year determined in accordance with the Holding LP's Limited Partnership Agreement. For this purpose, our company's fiscal year end and that of the Holding LP will be December 31.
The income for tax purposes of our company for a given fiscal year will be allocated to each Canadian Limited Partner in an amount calculated by multiplying such income that is allocable to unitholders by a fraction, the numerator of which is the sum of the distributions received by such Canadian Limited Partner with respect to such fiscal year and the denominator of which is the aggregate amount of the distributions made by our company to all partners with respect to such fiscal year.
If, with respect to a given fiscal year, no distribution is made by our company to unitholders or our company has a loss for tax purposes, one quarter of the income, or loss, as the case may be, for tax purposes for such fiscal year that is allocable to unitholders will be allocated to the unitholders of record at the end of each calendar quarter ending in such fiscal year in the proportion that the number of units of our company held at each such date by a unitholder is of the total number of units of our company that are issued and outstanding at each such date.
The income of our company as determined for purposes of the Tax Act may differ from its income as determined for accounting purposes and may not be matched by cash distributions. In addition, for purposes of the Tax Act, all income (or losses) of our company and the Holding LP must be calculated in Canadian currency. Where our company (or the Holding LP) holds investments denominated in U.S. dollars or other foreign currencies, gains and losses may be realized by our company (or the Holding LP) as a consequence of fluctuations in the relative values of the Canadian and foreign currencies.
In computing the income (or loss) of our company, deductions may be claimed in respect of reasonable administrative costs, interest and other expenses incurred by our company for the purpose of earning income, subject to the relevant provisions of the Tax Act. Our company may also deduct from its income for the year a portion of the reasonable expenses, if any, incurred by our company to issue our units. The portion of such issue expenses deductible by our company in a taxation year is 20% of such issue expenses, pro-rated where our company's taxation year is less than 365 days.
|
147
|
Brookfield Business Partners
|
In general, a Canadian Limited Partner's share of any income (or loss) of our company from a particular source will be treated as if it were income (or loss) of the Canadian Limited Partner from that source, and any provisions of the Tax Act applicable to that type of income (or loss) will apply to the Canadian Limited Partner. Our company will hold managing general partnership units of the Holding LP. In computing our company's income (or loss) under the Tax Act, the Holding LP will itself be deemed to be a separate person resident in Canada which computes its income (or loss) and allocates to its partners their respective share of such income (or loss). Accordingly, the source and character of amounts included in (or deducted from) the income of Canadian Limited Partners on account of income (or loss) earned by the Holding LP generally will be determined by reference to the source and character of such amounts when earned by the Holding LP.
A Canadian Limited Partner's share of taxable dividends received or considered to be received by our company in a fiscal year from a corporation resident in Canada will be treated as a dividend received by the Canadian Limited Partner and will be subject to the normal rules in the Tax Act applicable to such dividends, including the enhanced gross-up and dividend tax credit for "eligible dividends" as defined in the Tax Act when the dividend received by the Holding LP is designated as an "eligible dividend".
Foreign taxes paid by our company or the Holding LP and taxes withheld at source on amounts paid or credited to our company or the Holding LP (other than for the account of a particular partner) will be allocated pursuant to the governing partnership agreement. Each Canadian Limited Partner's share of the "business-income tax" and "non-business-income tax" paid to the government of a foreign country for a year will be creditable against its Canadian federal income tax liability to the extent permitted by the detailed foreign tax credit rules contained in the Tax Act. Although the foreign tax credit rules are designed to avoid double taxation, the maximum credit is limited. Because of this, and because of timing differences in recognition of expenses and income and other factors, the foreign tax credit rules may not provide a full foreign tax credit for the "business-income tax" and "non-business-income tax" paid by our company or the Holding LP to the government of a foreign country. The Tax Act contains anti-avoidance rules to address certain foreign tax credit generator transactions. Under the Foreign Tax Credit Generator Rules, the foreign "business-income tax" or "non-business-income tax" allocated to a Canadian Limited Partner for the purpose of determining such Canadian Limited Partner's foreign tax credit for any taxation year may be limited in certain circumstances, including where a Canadian Limited Partner's share of the income of our company or the Holding LP under the income tax laws of any country (other than Canada) under whose laws the income of our company or the Holding LP is subject to income taxation (the "
Relevant Foreign Tax Law
"), is less than the Canadian Limited Partner's share of such income for purposes of the Tax Act. For this purpose, a Canadian Limited Partner is not considered to have a lesser direct or indirect share of the income of our company or the Holding LP under the Relevant Foreign Tax Law than for the purposes of the Tax Act solely because, among other reasons, of a difference between the Relevant Foreign Tax Law and the Tax Act in the manner of computing the income of our company or the Holding LP or in the manner of allocating the income of our company or the Holding LP because of the admission or withdrawal of a partner. No assurance can be given that the Foreign Tax Credit Generator Rules will not apply to any Canadian Limited Partner. If the Foreign Tax Credit Generator Rules apply, the allocation to a Canadian Limited Partner of foreign "business-income tax" or "non-business-income tax" paid by our company or the Holding LP, and therefore such Canadian Limited Partner's foreign tax credits, will be limited.
Our company and the Holding LP will each be deemed to be a non-resident person in respect of certain amounts paid or credited or deemed to be paid or credited to them by a person resident or deemed to be resident in Canada, including dividends or interest. Dividends or interest (other than interest not subject to Canadian federal withholding tax) paid or deemed to be paid by a person resident or deemed to be resident in Canada to the Holding LP will be subject to withholding tax under Part XIII of the Tax Act at the rate of 25%. However, the CRA's administrative practice in similar circumstances is to permit the rate of Canadian federal withholding tax applicable to such payments to be computed by looking through the partnership and taking into account the residency of the partners (including partners who are resident in Canada) and any reduced rates of Canadian federal withholding tax that any non-resident partners may be entitled to under an applicable income tax treaty or convention, provided that the residency status and entitlement to the treaty benefits can be established. In determining the rate of Canadian federal withholding tax applicable to amounts paid by the Holding Entities to the Holding LP, the BBU General Partner expects the Holding Entities to look-through the Holding LP and our company to the residency of the partners of our company (including partners who are resident in Canada) and to take into account any reduced rates of Canadian federal withholding tax that non-resident partners may be entitled to under an applicable income tax treaty or convention in order to determine the appropriate amount of Canadian federal withholding tax to withhold from dividends or interest paid to the Holding LP. However, there can be no assurance that the CRA will apply its administrative practice in this context. Under the Treaty, a Canadian resident payer is required in certain circumstances to look-through fiscally transparent partnerships, such as our company and the Holding LP, to the residency and Treaty entitlements of their partners and to take into account the reduced rates of Canadian federal withholding tax that such partners may be entitled to under the Treaty.
|
Brookfield Business Partners
|
148
|
If our company incurs losses for tax purposes, each Canadian Limited Partner will be entitled to deduct in the computation of income for tax purposes the Canadian Limited Partner's share of any net losses for tax purposes of our company for its fiscal year to the extent that the Canadian Limited Partner's investment is "at-risk" within the meaning of the Tax Act. The Tax Act contains "at-risk rules" which may, in certain circumstances, restrict the deduction of a limited partner's share of any losses of a limited partnership. The BBU General Partner does not anticipate that our company or the Holding LP will incur losses but no assurance can be given in this regard. Accordingly, Canadian Limited Partners should consult their own tax advisors for specific advice with respect to the potential application of the "at-risk rules".
Section 94.1 of the Tax Act contains rules relating to interests held by a taxpayer in Non-Resident Entities that could, in certain circumstances, cause income to be imputed to Canadian Limited Partners, either directly or by way of allocation of such income imputed to our company or the Holding LP. These rules would apply if it is reasonable to conclude, having regard to all the circumstances, that one of the main reasons for the Canadian Limited Partner, our company or the Holding LP acquiring, holding or having an investment in a Non-Resident Entity is to derive a benefit from "portfolio investments" in certain assets from which the Non-Resident Entity may reasonably be considered to derive its value in such a manner that taxes under the Tax Act on income, profits and gains from such assets for any year are significantly less than they would have been if such income, profits and gains had been earned directly. In determining whether this is the case, section 94.1 of the Tax Act provides that consideration must be given to, among other factors, the extent to which the income, profits and gains for any fiscal period are distributed in that or the immediately following fiscal period. No assurance can be given that section 94.1 of the Tax Act will not apply to a Canadian Limited Partner, our company or the Holding LP. If these rules apply to a Canadian Limited Partner, our company or the Holding LP, income, determined by reference to a prescribed rate of interest plus two percent applied to the "designated cost", as defined in section 94.1 of the Tax Act, of the interest in the Non-Resident Entity, will be imputed directly to the Canadian Limited Partners or to our company or the Holding LP and allocated to the Canadian Limited Partner in accordance with the rules in section 94.1 of the Tax Act. The rules in section 94.1 of the Tax Act are complex and Canadian Limited Partners should consult their own tax advisors regarding the application of these rules to them in their particular circumstances.
Any Non-Resident Subsidiaries in which the Holding LP directly invests are expected to be CFAs of the Holding LP. Dividends paid to the Holding LP by a CFA of the Holding LP will be included in computing the income of the Holding LP. To the extent that any CFA or Indirect CFA of the Holding LP earns income that is characterized as FAPI in a particular taxation year of the CFA or Indirect CFA, the FAPI allocable to the Holding LP under the rules in the Tax Act must be included in computing the income of the Holding LP for Canadian federal income tax purposes for the fiscal period of the Holding LP in which the taxation year of that CFA or Indirect CFA ends, whether or not the Holding LP actually receives a distribution of that FAPI. Our company will include its share of such FAPI of the Holding LP in computing its income for Canadian federal income tax purposes and Canadian Limited Partners will be required to include their proportionate share of such FAPI allocated from our company in computing their income for Canadian federal income tax purposes. As a result, Canadian Limited Partners may be required to include amounts in their income even though they have not and may not receive an actual cash distribution of such amounts. If an amount of FAPI is included in computing the income of the Holding LP for Canadian federal income tax purposes, an amount may be deductible in respect of the "foreign accrual tax" applicable to the FAPI. Any amount of FAPI included in income net of the amount of any deduction in respect of "foreign accrual tax" will increase the adjusted cost base to the Holding LP of its shares of the particular CFA in respect of which the FAPI was included. At such time as the Holding LP receives a dividend of this type of income that was previously included in the Holding LP's income as FAPI, such dividend will effectively not be included in computing the income of the Holding LP and there will be a corresponding reduction in the adjusted cost base to the Holding LP of the particular CFA shares.
Under the Foreign Tax Credit Generator Rules, the "foreign accrual tax" applicable to a particular amount of FAPI included in the Holding LP's income in respect of a particular "foreign affiliate" of the Holding LP may be limited in certain specified circumstances, including where the direct or indirect share of the income of any member of the Holding LP (which is deemed for this purpose to include a Canadian Limited Partner) that is a person resident in Canada or a "foreign affiliate" of such a person is, under a Relevant Foreign Tax Law, less than such member's share of such income for purposes of the Tax Act. No assurance can be given that the Foreign Tax Credit Generator Rules will not apply to the Holding LP. For this purpose, a Canadian Limited Partner is not considered to have a lesser direct or indirect share of the income of the Holding LP under the Relevant Foreign Tax Law than for the purposes of the Tax Act solely because, among other reasons, of a difference between the Relevant Foreign Tax Law and the Tax Act in the manner of computing the income of the Holding LP or in the manner of allocating the income of the Holding LP because of the admission or withdrawal of a partner. If the Foreign Tax Credit Generator Rules apply, the "foreign accrual tax" applicable to a particular amount of FAPI included in the Holding LP's income in respect of a particular "foreign affiliate" of the Holding LP will be limited.
|
149
|
Brookfield Business Partners
|
Disposition of Our Units
The disposition (or deemed disposition) by a Canadian Limited Partner of our units will result in the realization of a capital gain (or capital loss) by such Canadian Limited Partner in the amount, if any, by which the proceeds of disposition of our units, less any reasonable costs of disposition, exceed (or are exceeded by) the adjusted cost base of such units. Subject to the general rules on averaging of cost base, the adjusted cost base of a Canadian Limited Partner's units of our company would generally be equal to: (i) the actual cost of our units (excluding any portion thereof financed with limited recourse indebtedness); plus (ii) the share of the income of our company allocated to the Canadian Limited Partner for fiscal years of our company ending before the relevant time in respect of our units; less (iii) the aggregate of the pro rata share of losses of our company allocated to the Canadian Limited Partner (other than losses which cannot be deducted because they exceed the Canadian Limited Partner's "at-risk" amount) for the fiscal years of our company ending before the relevant time in respect of our units; and less (iv) the Canadian Limited Partner's distributions received from our company made before the relevant time in respect of our units.
Where a Canadian Limited Partner disposes of all of its units of our company, it will no longer be a partner of our company. If, however, a Canadian Limited Partner is entitled to receive a distribution from our company after the disposition of all such units, then the Canadian Limited Partner will be deemed to dispose of such units at the later of: (i) the end of the fiscal year of our company during which the disposition occurred; and (ii) the date of the last distribution made by our company to which the Canadian Limited Partner was entitled. The share of the income (or loss) of our company for tax purposes for a particular fiscal year which is allocated to a Canadian Limited Partner who has ceased to be a partner will generally be added (or deducted) in the computation of the adjusted cost base of the Canadian Limited Partner's units of our company immediately prior to the time of the disposition.
A Canadian Limited Partner will generally realize a deemed capital gain if, and to the extent that, the adjusted cost base of the Canadian Limited Partner's units of our company is negative at the end of any fiscal year of our company. In such a case, the adjusted cost base of the Canadian Limited Partner's units of our company will be nil at the beginning of the next fiscal year of our company.
Canadian Limited Partners should consult their own tax advisors for advice with respect to the specific tax consequences to them of disposing of units of our company.
Taxation of Capital Gains and Capital Losses
In general, one-half of a capital gain realized by a Canadian Limited Partner must be included in computing such Canadian Limited Partner's income as a taxable capital gain. One-half of a capital loss is deducted as an allowable capital loss against taxable capital gains realized in the year and any remainder may be deducted against net taxable capital gains in any of the three years preceding the year or any year following the year to the extent and under the circumstances described in the Tax Act.
Special rules in the Tax Act may apply to disallow the one-half treatment on all or a portion of a capital gain realized on a disposition of our units if a partnership interest is acquired by a tax-exempt person or a non-resident person (or by a partnership or trust (other than certain trusts) of which a tax-exempt person or a non-resident person is a member or beneficiary, directly or indirectly through one or more partnerships or trusts (other than certain trusts)). Canadian Limited Partners contemplating such a disposition should consult their own tax advisors in this regard.
A Canadian Limited Partner that is throughout the relevant taxation year a "Canadian-controlled private corporation" as defined in the Tax Act may be liable to pay an additional refundable tax on its "aggregate investment income", as defined in the Tax Act, for the year, which is defined to include taxable capital gains.
Alternative Minimum Tax
Canadian Limited Partners that are individuals or trusts may be subject to the alternative minimum tax rules. Such Canadian Limited Partners should consult their own tax advisors.
Eligibility for Investment
Provided that our units are listed on a "designated stock exchange" (which currently includes the NYSE and the TSX), our units will be "qualified investments" under the Tax Act for a trust governed by an RRSP, deferred profit sharing plan, RRIF, RESP, RDSP, and a TFSA.
|
Brookfield Business Partners
|
150
|
Notwithstanding the foregoing, an annuitant under an RRSP or RRIF, a holder of a TFSA or RDSP or a subscriber of an RESP, as the case may be, will be subject to a penalty tax if our units held in the RRSP, RRIF, TFSA, RDSP or RESP, are a "prohibited investment" for the RRSP, RRIF, TFSA, RDSP or RESP, as the case may be. Generally, our units will not be a "prohibited investment" for a trust governed by an RRSP, RRIF, TFSA, RDSP or RESP provided that the annuitant under the RRSP or RRIF, the holder of the TFSA, or RDSP or the subscriber of the RESP, as applicable, deals at arm's length with our company for purposes of the Tax Act and does not have a "significant interest", for purposes of the prohibited investment rules, in our company. Canadian Limited Partners who will hold our units in an RRSP, RRIF, TFSA, RDSP or RESP should consult with their own tax advisors regarding the application of the foregoing prohibited investment rules having regard to their particular circumstances.
Taxation of Non-Canadian Limited Partners
The following portion of the summary is generally applicable to a Holder who, for purposes of the Tax Act and at all relevant times, is not, and is not deemed to be, resident in Canada and who does not use or hold and is not deemed to use or hold our units in connection with a business carried on in Canada (a "
Non-Canadian Limited Partner
").
The following portion of the summary assumes that (i) our units are not, and will not at any relevant time constitute, "taxable Canadian property" of any Non-Canadian Limited Partner, and (ii) our company and the Holding LP will not dispose of property that is "taxable Canadian property". "Taxable Canadian property" includes, but is not limited to, property that is used or held in a business carried on in Canada and shares of corporations that are not listed on a "designated stock exchange" if more than 50% of the fair market value of the shares is derived from certain Canadian properties in the 60-month period immediately preceding the particular time. In general, our units will not constitute "taxable Canadian property" of any Non-Canadian Limited Partner at the time of disposition or deemed disposition, unless (a) at any time in the 60-month period immediately preceding the disposition or deemed disposition, more than 50% of the fair market value of our units was derived, directly or indirectly (excluding through a corporation, partnership or trust, the shares or interests in which were not themselves "taxable Canadian property"), from one or any combination of: (i) real or immovable property situated in Canada; (ii) "Canadian resource properties"; (iii) "timber resource properties"; and (iv) options in respect of, or interests in, or for civil law rights in, such property, whether or not such property exists, or (b) our units are otherwise deemed to be "taxable Canadian property". Since our company's assets will consist principally of units of the Holding LP, our units would generally be "taxable Canadian property" at a particular time if our units of the Holding LP held by our company, derived, directly or indirectly (excluding through a corporation, partnership or trust, the shares or interests in which were not themselves "taxable Canadian property"), more than 50% of their fair market value from properties described in (i) to (iv) above, at any time in the 60-month period preceding the particular time. The BBU General Partner does not expect our units to be "taxable Canadian property" of any Non-Canadian Limited Partner and does not expect our company or the Holding LP to dispose of "taxable Canadian property". However, no assurance can be given in this regard. See Item 3.D. "Risk Factors—Risks related to Taxation—Canada".
The following portion of the summary also assumes that neither our company nor the Holding LP will be considered to carry on business in Canada. The BBU General Partner intends to organize and conduct the affairs of each of these entities, to the extent possible, so that neither of these entities should be considered to carry on business in Canada for purposes of the Tax Act. However, no assurance can be given in this regard. If either of these entities carry on business in Canada, the tax implications to our company or the Holding LP and to Non-Canadian Limited Partners may be materially and adversely different than as set out herein.
Special rules, which are not discussed in this summary, may apply to a Non-Canadian Limited Partner that is an insurer carrying on business in Canada and elsewhere.
Taxation of Income or Loss
A Non-Canadian Limited Partner will not be subject to Canadian federal income tax under Part I of the Tax Act on its share of income from a business carried on by our company (or the Holding LP) outside Canada or the non-business income earned by our company (or the Holding LP) from sources in Canada. However, a Non-Canadian Limited Partner may be subject to Canadian federal withholding tax under Part XIII of the Tax Act, as described below.
|
151
|
Brookfield Business Partners
|
Our company and the Holding LP will each be deemed to be a non-resident person in respect of certain amounts paid or credited or deemed to be paid or credited to them by a person resident or deemed to be resident in Canada, including dividends or interest. Dividends or interest (other than interest not subject to Canadian federal withholding tax) paid or deemed to be paid by a person resident or deemed to be resident in Canada to the Holding LP will be subject to withholding tax under Part XIII of the Tax Act at the rate of 25%. However, the CRA's administrative practice in similar circumstances is to permit the rate of Canadian federal withholding tax applicable to such payments to be computed by looking through the partnership and taking into account the residency of the partners (including partners who are resident in Canada) and any reduced rates of Canadian federal withholding tax that any non-resident partners may be entitled to under an applicable income tax treaty or convention, provided that the residency status and entitlement to the treaty benefits can be established. In determining the rate of Canadian federal withholding tax applicable to amounts paid by the Holding Entities to the Holding LP, the BBU General Partner expects the Holding Entities to look-through the Holding LP and our company to the residency of the partners of our company (including partners who are resident in Canada) and to take into account any reduced rates of Canadian federal withholding tax that Non-Canadian Limited Partners may be entitled to under an applicable income tax treaty or convention in order to determine the appropriate amount of Canadian federal withholding tax to withhold from dividends or interest paid to the Holding LP. However, there can be no assurance that the CRA will apply its administrative practice in this context. Under the Treaty, a Canadian resident payer is required in certain circumstances to look-through fiscally transparent partnerships, such as our company and the Holding LP, to the residency and Treaty entitlements of their partners and take into account the reduced rates of Canadian federal withholding tax that such partners may be entitled to under the Treaty.
Bermuda Tax Considerations
In Bermuda there are no taxes on profits, income or dividends, nor is there any capital gains tax, estate duty or death duty. Profits can be accumulated and it is not obligatory to pay dividends. As "exempted undertakings", exempted partnerships and overseas partnerships are entitled to apply for (and will ordinarily receive) an assurance pursuant to the Exempted Undertakings Tax Protection Act 1966 that, in the event that legislation introducing taxes computed on profits or income, or computed on any capital asset, gain or appreciation, is enacted, such taxes shall not be applicable to our company or any of its operations until March 31, 2015. Such an assurance may include the assurance that any tax in the nature of estate duty or inheritance tax shall not be applicable to the units, debentures or other obligations of our company.
Exempted partnerships and overseas partnerships fall within the definition of "international businesses" for the purposes of the Stamp Duties (International Businesses Relief) Act 1990, which means that instruments executed by or in relation to an exempted partnership or an overseas partnership are exempt from stamp duties (such duties were formerly applicable under the Stamp Duties Act 1976). Thus, stamp duties are not payable upon, for example, an instrument which effects the transfer or assignment of a unit in an exempted partnership or an overseas partnership, or the sale or mortgage of partnership assets; nor are they payable upon the partnership capital.
10.F. DIVIDENDS AND PAYING AGENTS
Not applicable.
10.G. STATEMENT BY EXPERTS
Not applicable.
10.H. DOCUMENTS ON DISPLAY
Our company is subject to the information filing requirements of the Exchange Act, and accordingly we are required to file periodic reports and other information with the SEC. As a foreign private issuer under the SEC's regulations, we file annual reports on Form 20-F and furnish other reports on Form 6-K. The information disclosed in our reports may be less extensive than that required to be disclosed in annual and quarterly reports on Forms 10-K and 10-Q required to be filed with the SEC by U.S. issuers. Moreover, as a foreign private issuer, we are not subject to the proxy requirements under Section 14 of the Exchange Act, and the BBU General Partner's directors and our principal unitholders are not subject to the insider short swing profit reporting and recovery rules under Section 16 of the Exchange Act. Our SEC filings are available at the SEC's website at
www.sec.gov
. You may also read and copy any document we file with the SEC at the public reference facilities maintained by the SEC at SEC Headquarters, Public Reference Section, 100 F Street, N.E., Washington D.C. 20549. You may obtain information on the operation of the SEC's public reference facilities by calling the SEC at 1-800-SEC-0330.
In addition, our company is required by Canadian securities laws to file documents electronically with Canadian securities regulatory authorities and these filings are available on our SEDAR profile at
www.sedar.com
. Written requests for such documents should be directed to our Corporate Secretary at 73 Front Street, 5th Floor, Hamilton HM 12, Bermuda.
|
Brookfield Business Partners
|
152
|
10.I. SUBSIDIARY INFORMATION
Not applicable.
See the information contained in this Form 20-F under Item 5.B., "Operating and Financial Review and Prospects—Liquidity and Capital Resources—Market Risks".
Not applicable.
None.
None.
Disclosure Controls and Procedures
As at
December 31, 2017
, an evaluation of the effectiveness of our "disclosure controls and procedures" (as defined in Rules 13a-15(e) and 15d-15(e) of the Exchange Act) was carried out under the supervision and with the participation of persons performing the functions of principal executive and principal financial officers for us and our Service Providers. Based upon that evaluation, the persons performing the functions of principal executive and principal financial officers for us have concluded that, as at
December 31, 2017
, our disclosure controls and procedures were effective: (i) to ensure that information required to be disclosed by us in the reports that we file or submit under the Exchange Act is recorded, processed, summarized and reported within the time periods specified in the Securities and Exchange Commission's rules and forms; and (ii) to ensure that information required to be disclosed by us in the reports that we file or submit under the Exchange Act is accumulated and communicated to our management, including the persons performing the functions of principal executive and principal financial officers for us, to allow timely decisions regarding required disclosure.
It should be noted that while our management, including persons performing the functions of principal executive and principal financial officers for us, believe our disclosure controls and procedures provide a reasonable level of assurance that such controls and procedures are effective, they do not expect that our disclosure controls and procedures or internal controls will prevent all error and all fraud. A control system, no matter how well conceived or operated, can provide only reasonable, not absolute, assurance that the objectives of the control system are met.
Management’s Annual Report on Internal
Control Over Financial Reporting
Our management is responsible for establishing and maintaining adequate internal control over financial reporting, as such term is defined in Rule 13a-15(f) under the Exchange Act. Under the supervision and with the participation of our management, including persons performing the functions of principal executive and principal financial officers for us, we conducted an evaluation of the effectiveness of our internal control over financial reporting as of
December 31, 2017
, based on the criteria set forth in
Internal Control—Integrated Framework (2013)
issued by the Committee of Sponsoring Organizations of the Treadway Commission. Based on evaluation under Internal Control—Integrated Framework, our management concluded that our internal control over financial reporting was effective as of
December 31, 2017
. Excluded from our evaluation were controls over financial reporting at BRK Ambiental, for which control was acquired on April 25, 2017; Greenergy, for which control was acquired on May 10, 2017; and our fuel marketing business, for which control was acquired on July 17, 2017. The financial statements of these entities constitute
46%
of total assets,
32%
of net assets,
63%
of revenue and
7%
of net income of the consolidated financial statements of our partnership as of and for the year ending
December 31, 2017
.
Internal control systems, no matter how well designed, have inherent limitations. Therefore, even those systems determined to be effective can provide only reasonable assurance with respect to financial statement preparation and presentation. Also, projections of any evaluation of effectiveness to future periods are subject to the risk that controls may become inadequate because of changes in conditions, or that the degree of compliance with the policies or procedures may deteriorate.
|
153
|
Brookfield Business Partners
|
Report of Independent Registered Public Accounting Firm
The effectiveness of our internal control over financial reporting as of
December 31, 2017
has been audited by Deloitte LLP, Independent Registered Public Accounting Firm, who have also audited the financial statements of our partnership, as stated in their reports which are included herein.
Changes in Internal Control
There was no change in our internal control over financial reporting during the year ended
December 31, 2017
, that has materially affected, or is reasonably likely to materially affect, our internal control over financial reporting.
ITEM 16.
16A. AUDIT COMMITTEE FINANCIAL EXPERT
Our board of directors has determined that Patricia Zuccotti possesses specific accounting and financial management expertise and that she is an audit committee financial expert as defined by the SEC and is independent within the meaning of the rules of the NYSE. Our board of directors has also determined that other members of the Audit Committee have sufficient experience and ability in finance and compliance matters to enable them to adequately discharge their responsibilities.
16B. CODE OF ETHICS
On May 5, 2017, the BBU General Partner updated its Code of Business Conduct and Ethics, or the Code, that applies to the members of the board of directors of the BBU General Partner, our company, any officers or employees of the BBU General Partners and any employees of the Services Providers performing obligations under the Master Services Agreement. The Code is reviewed and updated annually. We have posted a copy of the Code on our website at
www.bbu.brookfield.com
.
16C. PRINCIPAL ACCOUNTANT FEES AND SERVICES
The BBU General Partner has retained Deloitte LLP to act as our company's independent registered public accounting firm.
The table below summarizes the fees for professional services rendered by Deloitte LLP for the audit of our annual financial statements for the period ended
December 31, 2017
.
|
|
December 31,
2017 |
December 31,
2016 |
||||||||||||
|
(US$ Millions)
|
USD
|
%
|
USD
|
%
|
||||||||||
|
Audit fees
(1)
|
$
|
8.1
|
|
78
|
%
|
$
|
7.5
|
|
90
|
%
|
||||
|
Audit-related fees
(2)
|
1.7
|
|
17
|
%
|
0.5
|
|
6
|
%
|
||||||
|
Tax fees
(3)
|
0.5
|
|
5
|
%
|
0.3
|
|
4
|
%
|
||||||
|
Total
|
$
|
10.3
|
|
100
|
%
|
$
|
8.3
|
|
100
|
%
|
||||
_____________________________________________________________________
|
(1)
|
Audit fees include fees for services that would normally be provided by the external auditor in connection with statutory and regulatory filings or engagements, including fees for services necessary to perform an audit or review in accordance with generally accepted auditing standards. This category also includes services that generally only the external auditor reasonably can provide, including comfort letters, statutory audits, attest services, consents and assistance with and review of certain documents filed with securities regulatory authorities.
|
|
(2)
|
Audit-related fees are for assurance and related services, such as due diligence services, that traditionally are performed by the external auditor. More specifically, these services include, among others: employee benefit plan audits, accounting consultations and audits in connection with acquisitions, attest services that are not required by statute or regulation, and consultation concerning financial accounting and reporting standards.
|
|
(3)
|
Tax fees are principally for assistance in tax compliance and tax advisory services.
|
The audit committee of the BBU General Partner pre-approves all audit and non-audit services provided to our company by Deloitte LLP.
16D. EXEMPTIONS FROM THE LISTING STANDARDS FOR AUDIT COMMITTEES
Not applicable.
|
Brookfield Business Partners
|
154
|
16E. PURCHASES OF EQUITY SECURITIES BY THE ISSUER AND AFFILIATED PURCHASERS
On August 11, 2017, we announced that we renewed our normal course issuer bid, or NCIB, for our units. Under the NCIB, the board of directors of the BBU General Partner authorized us to repurchase up to 5% of our issued and outstanding units, or 2,592,264 units. Repurchases were authorized to commence on August 15, 2017 and will terminate on August 14, 2018, or earlier should we complete our repurchases prior to such date. All purchases will be made through facilities of the TSX or the NYSE, and all of our units acquired under the NCIB will be cancelled. During the year ended December 31, 2017, we did not repurchase any of our units.
16F. CHANGE IN REGISTRANT'S CERTIFYING ACCOUNTANT
None.
16G. CORPORATE GOVERNANCE
Our corporate practices are not materially different from those required of U.S. domestic limited partnerships under the NYSE Listing Standards.
16H. MINING SAFETY DISCLOSURE
Pursuant to Section 1503(a) of the Dodd-Frank Wall Street Reform and Consumer Protection Act of 2010, issuers that are operators, or that have a subsidiary that is an operator, of a coal or other mine in the United States are required to disclose in their periodic reports filed with the SEC information regarding specified health and safety violations, orders and citations, related assessments and legal actions, and mining-related fatalities under the regulation of the Federal Mine Safety and Health Administration, or the MSHA, under the Federal Mine Safety and Health Act of 1977, as amended, or the Mine Act. During the fiscal year ended
December 31, 2017
, our company did not have any mines in the United States subject to regulation by MSHA under the Mine Act.
Not applicable.
See the list of financial statements beginning on page F-1 which are filed as part of the annual report on Form 20-F.
|
155
|
Brookfield Business Partners
|
|
Number
|
Description
|
||
|
1.1
|
|
||
|
1.2
|
|
||
|
1.3
|
|
||
|
4.1
|
|
||
|
4.2
|
|
||
|
4.3
|
|
||
|
4.4
|
|
||
|
4.5
|
|
||
|
4.6
|
|
||
|
4.7
|
|
||
|
8.1
|
|
List of subsidiaries of Brookfield Business Partners L.P. (incorporated by reference to Item 4.C., Organizational Structure)
|
|
|
12.1
|
|
||
|
12.2
|
|
||
|
13.1
|
|
||
|
13.2
|
|
||
|
15.1
|
|
||
|
101.INS
|
|
XBRL Instance Document
|
|
|
101.SCH
|
|
XBRL Taxonomy Extension Schema Document
|
|
|
101.CAL
|
|
XBRL Taxonomy Extension Calculation Linkbase Document
|
|
|
101.DEF
|
|
XBRL Taxonomy Extension Definition Linkbase Document
|
|
|
101.LAB
|
|
XBRL Taxonomy Extension Label Linkbase Document
|
|
|
101.PRE
|
|
XBRL Taxonomy Extension Presentation Linkbase Document
|
|
|
(1)
|
Filed as an exhibit to Amendment No. 3 to the Registration Statement on Form F-1 on February 26, 2016 and incorporated herein by reference.
|
|
(2)
|
Incorporated by reference to the company's Current Report on Form 6-K filed on June 22, 2016.
|
* Filed herewith.
The registrant hereby agrees to furnish to the SEC at its request copies of long-term debt instruments defining the rights of holders of outstanding long-term debt that are not required to be filed herewith.
|
Brookfield Business Partners
|
156
|
SIGNATURES
The registrant hereby certifies that it meets all of the requirements for filing on Form 20-F and that it has duly caused and authorized the undersigned to sign this annual report on its behalf.
|
|
BROOKFIELD BUSINESS PARTNERS L.P.
, by its general
partner,
BROOKFIELD BUSINESS PARTNERS LIMITED
|
|||
|
|
By:
|
/s/
Jane Sheere
|
||
|
|
|
Name:
|
Jane Sheere
|
|
|
|
|
Title:
|
Secretary
|
|
|
Date: March 9, 2018
|
||||
|
157
|
Brookfield Business Partners
|
INDEX TO FINANCIAL STATEMENTS
|
|
|
Page
|
|
Consolidated financial statements for Brookfield Business Partners L.P. as at December 31, 2017 and 2016 and for each of the years in the three-years ended December 31, 2017
|
|
F-1
|
|
Brookfield Business Partners
|
F-1
|
INDEX TO THE CONSOLIDATED FINANCIAL STATEMENTS FOR
BROOKFIELD BUSINESS PARTNERS L.P.
Audited Consolidated Financial Statements of Brookfield Business Partners L.P.
|
|
Page
|
|
F-2
|
Brookfield Business Partners
|
REPORT OF INDEPENDENT REGISTERED PUBLIC ACCOUNTING FIRM
To the Board of Directors and Unitholders of Brookfield Business Partners L.P.
Opinion on the Financial Statements
We have audited the accompanying consolidated statements of financial position of Brookfield Business Partners L.P. and subsidiaries (the “Partnership”) as of December 31, 2017 and 2016, the related consolidated statements of operating results, comprehensive income (loss), changes in equity, and cash flow, for each of the three years in the period ended December 31, 2017, and the related notes (collectively referred to as the "financial statements"). In our opinion, the financial statements present fairly, in all material respects, the financial position of the Partnership as of December 31, 2017 and 2016, and the results of its operations and its cash flows for each of the three years in the period ended December 31, 2017, in conformity with International Financial Reporting Standards as issued by the International Accounting Standards Board.
We have also audited, in accordance with the standards of the Public Company Accounting Oversight Board (United States) (PCAOB), the Partnership’s internal control over financial reporting as of December 31, 2017, based on criteria established in
Internal Control - Integrated Framework (2013) issued by the Committee of Sponsoring Organizations of the Treadway Commission
and our report dated March 9, 2018 expressed an unqualified opinion on the Partnership’s internal control over financial reporting.
Basis for Opinion
These financial statements are the responsibility of the Partnership’s management. Our responsibility is to express an opinion on the Partnership’s financial statements based on our audits. We are a public accounting firm registered with the PCAOB and are required to be independent with respect to the Partnership in accordance with the U.S. federal securities laws and the applicable rules and regulations of the Securities and Exchange Commission and the PCAOB. Further, we are required to be independent of the Partnership in accordance with the ethical requirements that are relevant to our audit of the financial statements in Canada and to fulfill our other ethical responsibilities in accordance with these requirements.
We conducted our audits in accordance with the standards of the PCAOB and Canadian generally accepted auditing standards. Those standards require that we plan and perform the audit to obtain reasonable assurance about whether the financial statements are free of material misstatement, whether due to error or fraud. Our audits included performing procedures to assess the risks of material misstatement of the financial statements, whether due to error or fraud, and performing procedures that respond to those risks. Such procedures included examining, on a test basis, evidence regarding the amounts and disclosures in the financial statements. Our audits also included evaluating the accounting principles used and significant estimates made by management, as well as evaluating the overall presentation of the financial statements. We believe that our audits provide a reasonable basis for our opinion.
/s/ Deloitte LLP
Chartered Professional Accountants
Licensed Public Accountants
Toronto, Canada
March 9, 2018
We have served as the Partnership's auditor since 2015.
|
F-3
|
Brookfield Business Partners
|
REPORT OF INDEPENDENT REGISTERED PUBLIC ACCOUNTING FIRM
To the Board of Directors and Unitholders of Brookfield Business Partners L.P.
Opinion on Internal Control over Financial Reporting
We have audited the internal control over financial reporting of Brookfield Business Partners L.P. and subsidiaries (the “Partnership”) as of December 31, 2017, based on criteria established in
Internal Control - Integrated Framework (2013) issued by the Committee of Sponsoring Organizations of the Treadway Commission (COSO)
. In our opinion, the Partnership maintained, in all material respects, effective internal control over financial reporting as of December 31, 2017, based on criteria established in Internal Control - Integrated Framework (2013) issued by COSO.
We have also audited, in accordance with the standards of the Public Company Accounting Oversight Board (United States) (PCAOB) and Canadian generally accepted auditing standards, the consolidated financial statements as of and for the year ended December 31, 2017 of the Partnership and our report dated March 9, 2018, expressed an unqualified opinion on those financial statements.
As described in Management’s Annual Report on Internal Control over Financial Reporting, management excluded from its assessment the internal control over financial reporting at Odebrecht Ambiental and Odebrecht Ambiental Ativos Maduros S.A. (collectively “BRK Ambiental”) which were acquired on April 25, 2017 and May 30, 2017, respectively; Greenergy Fuels Holdings Limited (“Greenergy”) which was acquired on May 10, 2017; and BCP IV Service Station LP (“Fuel Marketing Business”) which was acquired on July 17, 2017 and whose financial statements constitute 32% and 46% of net and total assets, respectively, 63% of total revenue and 7% of net income of the consolidated financial statement amounts as of and for the year ended December 31, 2017. Accordingly, our audit did not include the internal control over financial reporting at BRK Ambiental, Greenergy and Fuel Marketing Business.
Basis for Opinion
The Partnership’s management is responsible for maintaining effective internal control over financial reporting and for its assessment of the effectiveness of internal control over financial reporting, included in the accompanying Management’s Annual Report on Internal Control over Financial Reporting.Our responsibility is to express an opinion on the Partnership’s internal control over financial reporting based on our audit. We are a public accounting firm registered with the PCAOB and are required to be independent with respect to the Partnership in accordance with the U.S. federal securities laws and the applicable rules and regulations of the Securities and Exchange Commission and the PCAOB.
We conducted our audit in accordance with the standards of the PCAOB. Those standards require that we plan and perform the audit to obtain reasonable assurance about whether effective internal control over financial reporting was maintained in all material respects. Our audit included obtaining an understanding of internal control over financial reporting, assessing the risk that a material weakness exists, testing and evaluating the design and operating effectiveness of internal control based on the assessed risk, and performing such other procedures as we considered necessary in the circumstances. We believe that our audit provides a reasonable basis for our opinion.
Definition and Limitations of Internal Control over Financial Reporting
A company’s internal control over financial reporting is a process designed to provide reasonable assurance regarding the reliability of financial reporting and the preparation of financial statements for external purposes in accordance with International Financial Reporting Standards as issued by the International Accounting Standards Board. A company’s internal control over financial reporting includes those policies and procedures that (1) pertain to the maintenance of records that, in reasonable detail, accurately and fairly reflect the transactions and dispositions of the assets of the company; (2) provide reasonable assurance that transactions are recorded as necessary to permit preparation of financial statements in accordance with International Financial Reporting Standards as issued by the International Accounting Standards Board, and that receipts and expenditures of the company are being made only in accordance with authorizations of management and directors of the company; and (3) provide reasonable assurance regarding prevention or timely detection of unauthorized acquisition, use, or disposition of the company’s assets that could have a material effect on the financial statements.
|
Brookfield Business Partners
|
F-4
|
Because of its inherent limitations, internal control over financial reporting may not prevent or detect misstatements. Also, projections of any evaluation of effectiveness to future periods are subject to the risk that controls may become inadequate because of changes in conditions, or that the degree of compliance with the policies or procedures may deteriorate.
/s/ Deloitte LLP
Chartered Professional Accountants
Licensed Public Accountants
Toronto, Canada
March 9, 2018
|
F-5
|
Brookfield Business Partners
|
CONSOLIDATED FINANCIAL STATEMENTS FOR
BROOKFIELD BUSINESS PARTNERS L.P.
|
(US$ MILLIONS)
|
Notes
|
December 31, 2017
|
December 31, 2016
|
||||||||
|
Assets
|
|
|
|
||||||||
|
Cash and cash equivalents
|
4
|
|
$
|
1,106
|
|
$
|
1,050
|
|
|||
|
Financial assets
|
5
|
|
361
|
|
433
|
|
|||||
|
Accounts and other receivable, net
|
6
|
|
3,454
|
|
1,703
|
|
|||||
|
Inventory, net
|
7
|
|
1,068
|
|
229
|
|
|||||
|
Assets held for sale
|
8
|
|
14
|
|
264
|
|
|||||
|
Other assets
|
9
|
|
430
|
|
397
|
|
|||||
|
Current assets
|
|
|
6,433
|
|
4,076
|
|
|||||
|
Financial assets
|
5
|
|
423
|
|
106
|
|
|||||
|
Accounts and other receivable, net
|
6
|
|
908
|
|
94
|
|
|||||
|
Other assets
|
9
|
|
79
|
|
21
|
|
|||||
|
Property, plant and equipment
|
11
|
|
2,530
|
|
2,096
|
|
|||||
|
Deferred income tax assets
|
18
|
|
174
|
|
111
|
|
|||||
|
Intangible assets
|
12
|
|
3,094
|
|
371
|
|
|||||
|
Equity accounted investments
|
14
|
|
609
|
|
166
|
|
|||||
|
Goodwill
|
13
|
|
1,554
|
|
1,152
|
|
|||||
|
Total assets
|
27
|
|
$
|
15,804
|
|
$
|
8,193
|
|
|||
|
Liabilities and equity
|
|
|
|
||||||||
|
Liabilities
|
|
|
|
||||||||
|
Accounts payable and other
|
15
|
|
$
|
4,865
|
|
$
|
2,079
|
|
|||
|
Liabilities associated with assets held for sale
|
8
|
|
—
|
|
66
|
|
|||||
|
Borrowings
|
17
|
|
825
|
|
411
|
|
|||||
|
Current liabilities
|
|
|
5,690
|
|
2,556
|
|
|||||
|
Accounts payable and other
|
15
|
|
773
|
|
378
|
|
|||||
|
Borrowings
|
17
|
|
2,440
|
|
1,140
|
|
|||||
|
Deferred income tax liabilities
|
18
|
|
837
|
|
81
|
|
|||||
|
Total liabilities
|
|
|
$
|
9,740
|
|
$
|
4,155
|
|
|||
|
Equity
|
|
|
|
||||||||
|
Limited partners
|
19
|
|
$
|
1,585
|
|
$
|
1,206
|
|
|||
|
Non-controlling interests attributable to:
|
|
|
|
||||||||
|
Redemption-Exchange Units, Preferred Shares and Special Limited Partnership Units held by Brookfield Asset Management Inc.
|
19
|
|
1,453
|
|
1,295
|
|
|||||
|
Interest of others in operating subsidiaries
|
10
|
|
3,026
|
|
1,537
|
|
|||||
|
Total equity
|
|
|
6,064
|
|
4,038
|
|
|||||
|
Total liabilities and equity
|
|
|
$
|
15,804
|
|
$
|
8,193
|
|
|||
The accompanying notes are an integral part of the consolidated financial statements.
|
F-6
|
Brookfield Business Partners
|
CONSOLIDATED FINANCIAL STATEMENTS FOR
BROOKFIELD BUSINESS PARTNERS L.P.
CONSOLIDATED STATEMENTS OF OPERATING RESULTS
|
(US$ MILLIONS, except per unit amounts)
|
Notes
|
2017
|
2016
|
2015
|
|||||||||||
|
Revenues
|
27
|
|
$
|
22,823
|
|
$
|
7,960
|
|
$
|
6,753
|
|
||||
|
Direct operating costs
|
7, 21
|
|
(21,876
|
)
|
(7,386
|
)
|
(6,132
|
)
|
|||||||
|
General and administrative expenses
|
27
|
|
(340
|
)
|
(269
|
)
|
(224
|
)
|
|||||||
|
Depreciation and amortization expense
|
27
|
|
(371
|
)
|
(286
|
)
|
(257
|
)
|
|||||||
|
Interest expense
|
27
|
|
(202
|
)
|
(90
|
)
|
(65
|
)
|
|||||||
|
Equity accounted income, net
|
14
|
|
69
|
|
68
|
|
4
|
|
|||||||
|
Impairment expense, net
|
5, 7, 11, 13
|
|
(39
|
)
|
(261
|
)
|
(95
|
)
|
|||||||
|
Gain on acquisitions/dispositions, net
|
3, 5, 8
|
|
267
|
|
57
|
|
269
|
|
|||||||
|
Other income (expenses), net
|
3
|
|
(108
|
)
|
(11
|
)
|
70
|
|
|||||||
|
Income (loss) before income tax
|
|
|
223
|
|
(218
|
)
|
323
|
|
|||||||
|
Income tax (expense) recovery
|
|
||||||||||||||
|
Current
|
18
|
|
(30
|
)
|
(25
|
)
|
(49
|
)
|
|||||||
|
Deferred
|
18
|
|
22
|
|
41
|
|
(5
|
)
|
|||||||
|
Net income (loss)
|
|
|
$
|
215
|
|
$
|
(202
|
)
|
$
|
269
|
|
||||
|
Attributable to:
|
|
||||||||||||||
|
Limited partners
(1)
|
|
|
$
|
(58
|
)
|
$
|
3
|
|
$
|
—
|
|
||||
|
Brookfield Asset Management Inc.
(2)
|
|
|
—
|
|
(35
|
)
|
208
|
|
|||||||
|
Non-controlling interests attributable to:
|
|
||||||||||||||
|
Redemption-Exchange Units held by Brookfield Asset Management Inc.
(1)
|
|
|
(60
|
)
|
3
|
|
—
|
|
|||||||
|
Special Limited Partners
|
19
|
|
142
|
|
—
|
|
—
|
|
|||||||
|
Interest of others in operating subsidiaries
|
|
|
191
|
|
(173
|
)
|
61
|
|
|||||||
|
|
|
$
|
215
|
|
$
|
(202
|
)
|
$
|
269
|
|
|||||
|
Basic and diluted earnings per limited partner unit
|
19
|
|
$
|
(1.04
|
)
|
$
|
0.06
|
|
|||||||
____________________________________
|
(1)
|
For the periods subsequent to June 20, 2016.
|
|
(2)
|
For the periods prior to June 20, 2016.
|
The accompanying notes are an integral part of the consolidated financial statements.
|
F-7
|
Brookfield Business Partners
|
CONSOLIDATED FINANCIAL STATEMENTS FOR
BROOKFIELD BUSINESS PARTNERS L.P.
|
(US$ MILLIONS)
|
Notes
|
2017
|
2016
|
2015
|
|||||||||
|
Net income (loss)
|
|
$
|
215
|
|
$
|
(202
|
)
|
$
|
269
|
|
|||
|
Other comprehensive income (loss):
|
|
||||||||||||
|
Items that may be reclassified subsequently to profit or loss:
|
|
||||||||||||
|
Foreign currency translation
|
|
$
|
127
|
|
$
|
37
|
|
$
|
(309
|
)
|
|||
|
Available-for-sale securities
|
5
|
8
|
|
166
|
|
(98
|
)
|
||||||
|
Net investment and cash flow hedges
|
4
|
(25
|
)
|
(3
|
)
|
23
|
|
||||||
|
Equity accounted investment
|
14
|
(5
|
)
|
(79
|
)
|
85
|
|
||||||
|
Taxes on the above items
|
18
|
(1
|
)
|
6
|
|
(9
|
)
|
||||||
|
|
104
|
|
127
|
|
(308
|
)
|
|||||||
|
Items that will not be reclassified subsequently to profit or loss:
|
|||||||||||||
|
Revaluation of pension obligations
|
29
|
5
|
|
6
|
|
(1
|
)
|
||||||
|
Total other comprehensive income (loss)
|
109
|
|
133
|
|
(309
|
)
|
|||||||
|
Comprehensive income (loss)
|
|
$
|
324
|
|
$
|
(69
|
)
|
$
|
(40
|
)
|
|||
|
Attributable to:
|
|
||||||||||||
|
Limited partners
(1)
|
|
$
|
(29
|
)
|
$
|
(5
|
)
|
$
|
—
|
|
|||
|
Brookfield Asset Management Inc.
(2)
|
|
—
|
|
15
|
|
45
|
|
||||||
|
Non-controlling interests attributable to:
|
|
||||||||||||
|
Redemption-Exchange Units held by Brookfield Asset Management Inc.
(1)
|
|
(28
|
)
|
(5
|
)
|
—
|
|
||||||
|
Special Limited Partners
|
142
|
|
—
|
|
—
|
|
|||||||
|
Interest of others in operating subsidiaries
|
|
239
|
|
(74
|
)
|
(85
|
)
|
||||||
|
|
$
|
324
|
|
$
|
(69
|
)
|
$
|
(40
|
)
|
||||
____________________________________
|
(1)
|
For the periods subsequent to June 20, 2016.
|
|
(2)
|
For the periods prior to June 20, 2016.
|
The accompanying notes are an integral part of the consolidated financial statements.
|
F-8
|
Brookfield Business Partners
|
CONSOLIDATED FINANCIAL STATEMENTS FOR
BROOKFIELD BUSINESS PARTNERS L.P.
CONSOLIDATED STATEMENTS OF CHANGES IN EQUITY
|
|
|
|
|
|
|
|
|
Non-controlling interests
|
|
||||||||||||||||||||||||||||||||||||||||||
|
|
Brookfield Asset Management Inc.
|
Limited Partners
|
Redemption-Exchange Units held by
Brookfield Asset Management Inc.
|
Special Limited Partners
|
Preferred Shares
|
|
|
||||||||||||||||||||||||||||||||||||||||||||
|
(US$ MILLIONS)
|
Equity
|
Accumulated
other
comprehensive
income
(loss)
(1)
|
Brookfield
Asset
Management
Inc.
|
Capital
|
Retained
earnings
|
Accumulated
other
comprehensive
income
(loss)
(1)
|
Limited
Partners
|
Capital
|
Retained
earnings
|
Accumulated
other
comprehensive
income
(loss)
(1)
|
Redemption-
Exchange
Units
|
Retained Earnings
|
Capital
|
Interest of
others in
operating
subsidiaries
|
Total
Equity
|
||||||||||||||||||||||||||||||||||||
|
Balance as at January 1, 2017
|
$
|
—
|
|
$
|
—
|
|
$
|
—
|
|
$
|
1,345
|
|
$
|
2
|
|
$
|
(141
|
)
|
$
|
1,206
|
|
$
|
1,474
|
|
$
|
3
|
|
$
|
(197
|
)
|
$
|
1,280
|
|
$
|
—
|
|
$
|
15
|
|
$
|
1,537
|
|
$
|
4,038
|
|
||||||
|
Net income (loss)
|
—
|
|
—
|
|
—
|
|
—
|
|
(58
|
)
|
—
|
|
(58
|
)
|
—
|
|
(60
|
)
|
—
|
|
(60
|
)
|
142
|
|
—
|
|
191
|
|
215
|
|
|||||||||||||||||||||
|
Other comprehensive income (loss)
|
—
|
|
—
|
|
—
|
|
—
|
|
—
|
|
29
|
|
29
|
|
—
|
|
—
|
|
32
|
|
32
|
|
—
|
|
—
|
|
48
|
|
109
|
|
|||||||||||||||||||||
|
Total comprehensive income (loss)
|
—
|
|
—
|
|
—
|
|
—
|
|
(58
|
)
|
29
|
|
(29
|
)
|
—
|
|
(60
|
)
|
32
|
|
(28
|
)
|
142
|
|
—
|
|
239
|
|
324
|
|
|||||||||||||||||||||
|
Contributions
|
—
|
|
—
|
|
—
|
|
—
|
|
—
|
|
—
|
|
—
|
|
—
|
|
—
|
|
—
|
|
—
|
|
—
|
|
—
|
|
5
|
|
5
|
|
|||||||||||||||||||||
|
Distributions
(2)
|
—
|
|
—
|
|
—
|
|
—
|
|
(15
|
)
|
—
|
|
(15
|
)
|
—
|
|
(16
|
)
|
—
|
|
(16
|
)
|
(142
|
)
|
—
|
|
(388
|
)
|
(561
|
)
|
|||||||||||||||||||||
|
Acquisition of Interest
(3)
|
—
|
|
—
|
|
—
|
|
—
|
|
—
|
|
—
|
|
—
|
|
—
|
|
—
|
|
—
|
|
—
|
|
—
|
|
—
|
|
1,639
|
|
1,639
|
|
|||||||||||||||||||||
|
Unit Issuance
(2)
|
—
|
|
—
|
|
—
|
|
421
|
|
—
|
|
—
|
|
421
|
|
200
|
|
—
|
|
—
|
|
200
|
|
—
|
|
—
|
|
—
|
|
621
|
|
|||||||||||||||||||||
|
Other
|
—
|
|
—
|
|
—
|
|
—
|
|
2
|
|
—
|
|
2
|
|
—
|
|
2
|
|
—
|
|
2
|
|
—
|
|
—
|
|
(6
|
)
|
(2
|
)
|
|||||||||||||||||||||
|
Balance as at December 31, 2017
|
$
|
—
|
|
$
|
—
|
|
$
|
—
|
|
$
|
1,766
|
|
$
|
(69
|
)
|
$
|
(112
|
)
|
$
|
1,585
|
|
$
|
1,674
|
|
$
|
(71
|
)
|
$
|
(165
|
)
|
$
|
1,438
|
|
$
|
—
|
|
$
|
15
|
|
$
|
3,026
|
|
$
|
6,064
|
|
||||||
|
Balance as at January 1, 2016
|
$
|
2,147
|
|
$
|
(360
|
)
|
$
|
1,787
|
|
$
|
—
|
|
$
|
—
|
|
$
|
—
|
|
$
|
—
|
|
$
|
—
|
|
$
|
—
|
|
$
|
—
|
|
$
|
—
|
|
$
|
—
|
|
$
|
—
|
|
$
|
1,297
|
|
$
|
3,084
|
|
||||||
|
Net income (loss)
|
(35
|
)
|
—
|
|
(35
|
)
|
—
|
|
3
|
|
—
|
|
3
|
|
—
|
|
3
|
|
—
|
|
3
|
|
—
|
|
—
|
|
(173
|
)
|
(202
|
)
|
|||||||||||||||||||||
|
Other comprehensive income (loss)
|
—
|
|
50
|
|
50
|
|
—
|
|
—
|
|
(8
|
)
|
(8
|
)
|
—
|
|
—
|
|
(8
|
)
|
(8
|
)
|
—
|
|
—
|
|
99
|
|
133
|
|
|||||||||||||||||||||
|
Total comprehensive income (loss)
|
(35
|
)
|
50
|
|
15
|
|
—
|
|
3
|
|
(8
|
)
|
(5
|
)
|
—
|
|
3
|
|
(8
|
)
|
(5
|
)
|
—
|
|
—
|
|
(74
|
)
|
(69
|
)
|
|||||||||||||||||||||
|
Contributions
|
78
|
|
—
|
|
78
|
|
—
|
|
—
|
|
—
|
|
—
|
|
—
|
|
—
|
|
—
|
|
—
|
|
—
|
|
—
|
|
456
|
|
534
|
|
|||||||||||||||||||||
|
Distributions
|
(18
|
)
|
—
|
|
(18
|
)
|
—
|
|
(6
|
)
|
—
|
|
(6
|
)
|
—
|
|
(6
|
)
|
—
|
|
(6
|
)
|
—
|
|
—
|
|
(40
|
)
|
(70
|
)
|
|||||||||||||||||||||
|
Net increase (decrease) in Brookfield Asset Management Inc. investment
|
13
|
|
(8
|
)
|
5
|
|
—
|
|
—
|
|
—
|
|
—
|
|
—
|
|
—
|
|
—
|
|
—
|
|
—
|
|
—
|
|
53
|
|
58
|
|
|||||||||||||||||||||
|
Ownership Changes
(4)
|
—
|
|
—
|
|
—
|
|
—
|
|
5
|
|
(2
|
)
|
3
|
|
—
|
|
6
|
|
(2
|
)
|
4
|
|
—
|
|
—
|
|
(155
|
)
|
(148
|
)
|
|||||||||||||||||||||
|
Unit Issuance
(2)
|
—
|
|
—
|
|
—
|
|
192
|
|
—
|
|
—
|
|
192
|
|
192
|
|
—
|
|
—
|
|
192
|
|
—
|
|
—
|
|
—
|
|
384
|
|
|||||||||||||||||||||
|
Reorganization
(5)
|
(2,185
|
)
|
318
|
|
(1,867
|
)
|
1,153
|
|
—
|
|
(131
|
)
|
1,022
|
|
1,282
|
|
—
|
|
(187
|
)
|
1,095
|
|
—
|
|
15
|
|
—
|
|
265
|
|
|||||||||||||||||||||
|
Balance as at December 31, 2016
|
$
|
—
|
|
$
|
—
|
|
$
|
—
|
|
$
|
1,345
|
|
$
|
2
|
|
$
|
(141
|
)
|
$
|
1,206
|
|
$
|
1,474
|
|
$
|
3
|
|
$
|
(197
|
)
|
$
|
1,280
|
|
$
|
—
|
|
$
|
15
|
|
$
|
1,537
|
|
$
|
4,038
|
|
||||||
|
F-9
|
Brookfield Business Partners
|
|
Non-controlling interests
|
|||||||||||||||||||||||||||||||||||||||||||||||||||
|
|
Brookfield Asset Management Inc.
|
Limited Partners
|
Redemption-Exchange Units held by
Brookfield Asset Management Inc. |
Special Limited Partners
|
Preferred Shares
|
|
|
||||||||||||||||||||||||||||||||||||||||||||
|
(US$ MILLIONS)
|
Equity
|
Accumulated
other
comprehensive
income
(loss)
(1)
|
Brookfield
Asset Management Inc. |
Capital
|
Retained
earnings |
Accumulated
other
comprehensive
income
(loss)
(1)
|
Limited
Partners |
Capital
|
Retained
earnings |
Accumulated
other
comprehensive
income
(loss)
(1)
|
Redemption-
Exchange Units |
Retained Earnings
|
Preferred
shareholder's capital |
Interest of
others in operating subsidiaries |
Total
Equity |
||||||||||||||||||||||||||||||||||||
|
Balance as at January 1, 2015
|
$
|
1,705
|
|
$
|
(205
|
)
|
$
|
1,500
|
|
$
|
—
|
|
$
|
—
|
|
$
|
—
|
|
$
|
—
|
|
$
|
—
|
|
$
|
—
|
|
$
|
—
|
|
$
|
—
|
|
$
|
—
|
|
$
|
—
|
|
$
|
635
|
|
$
|
2,135
|
|
||||||
|
Net income (loss)
|
208
|
|
—
|
|
208
|
|
—
|
|
—
|
|
—
|
|
—
|
|
—
|
|
—
|
|
—
|
|
—
|
|
—
|
|
—
|
|
61
|
|
269
|
|
|||||||||||||||||||||
|
Other comprehensive income (loss)
|
—
|
|
(163
|
)
|
(163
|
)
|
—
|
|
—
|
|
—
|
|
—
|
|
—
|
|
—
|
|
—
|
|
—
|
|
—
|
|
—
|
|
(146
|
)
|
(309
|
)
|
|||||||||||||||||||||
|
Total comprehensive income (loss)
|
208
|
|
(163
|
)
|
45
|
|
—
|
|
—
|
|
—
|
|
—
|
|
—
|
|
—
|
|
—
|
|
—
|
|
—
|
|
—
|
|
(85
|
)
|
(40
|
)
|
|||||||||||||||||||||
|
Contributions
|
566
|
|
—
|
|
566
|
|
—
|
|
—
|
|
—
|
|
—
|
|
—
|
|
—
|
|
—
|
|
—
|
|
—
|
|
—
|
|
858
|
|
1,424
|
|
|||||||||||||||||||||
|
Distributions
|
(404
|
)
|
—
|
|
(404
|
)
|
—
|
|
—
|
|
—
|
|
—
|
|
—
|
|
—
|
|
—
|
|
—
|
|
—
|
|
—
|
|
(253
|
)
|
(657
|
)
|
|||||||||||||||||||||
|
Net increase (decrease) in Brookfield Asset Management Inc. investment
|
72
|
|
8
|
|
80
|
|
—
|
|
—
|
|
—
|
|
—
|
|
—
|
|
—
|
|
—
|
|
—
|
|
—
|
|
—
|
|
142
|
|
222
|
|
|||||||||||||||||||||
|
Balance as at December 31, 2015
|
$
|
2,147
|
|
$
|
(360
|
)
|
$
|
1,787
|
|
$
|
—
|
|
$
|
—
|
|
$
|
—
|
|
$
|
—
|
|
$
|
—
|
|
$
|
—
|
|
$
|
—
|
|
$
|
—
|
|
$
|
—
|
|
$
|
—
|
|
$
|
1,297
|
|
$
|
3,084
|
|
||||||
____________________________________
|
(1)
|
See Note 20 for additional information.
|
|
(2)
|
See Note 19 for additional information on distributions as it relates to the Special Limited Partners and for additional information on the unit issuance.
|
|
(3)
|
See Note 3 Acquisition of Businesses.
|
|
(4)
|
See Note 14 for additional information on ownership changes as it relates to interest of others in operating subsidiaries
|
|
(5)
|
See Note 1(b) and 2(b) for details regarding the spin-off and reorganization.
|
The accompanying notes are an integral part of the consolidated financial statements.
|
F-10
|
Brookfield Business Partners
|
CONSOLIDATED FINANCIAL STATEMENTS FOR
BROOKFIELD BUSINESS PARTNERS L.P.
|
(US$ MILLIONS)
|
Notes
|
2017
|
2016
|
2015
|
||||||||||
|
Operating Activities
|
|
|
|
|||||||||||
|
Net income (loss)
|
|
$
|
215
|
|
$
|
(202
|
)
|
$
|
269
|
|
||||
|
Adjusted for the following items:
|
|
|||||||||||||
|
Equity accounted income, net
|
|
(69
|
)
|
(68
|
)
|
(4
|
)
|
|||||||
|
Impairment expense, net
|
5, 7, 11, 13
|
39
|
|
261
|
|
95
|
|
|||||||
|
Depreciation and amortization expense
|
|
371
|
|
286
|
|
257
|
|
|||||||
|
Gain on acquisitions/dispositions, net
|
3, 5, 8
|
(267
|
)
|
(57
|
)
|
(269
|
)
|
|||||||
|
Provisions and other items
|
|
114
|
|
41
|
|
(81
|
)
|
|||||||
|
Deferred income tax expense (recovery)
|
18
|
(22
|
)
|
(41
|
)
|
5
|
|
|||||||
|
Changes in non-cash working capital, net
|
28
|
(91
|
)
|
9
|
|
60
|
|
|||||||
|
Cash from operating activities
|
|
290
|
|
229
|
|
332
|
|
|||||||
|
Financing Activities
|
|
|
|
|||||||||||
|
Proceeds from borrowings, net
|
|
1,694
|
|
474
|
|
1,618
|
|
|||||||
|
Repayment of borrowings
|
|
(1,345
|
)
|
(1,008
|
)
|
(549
|
)
|
|||||||
|
Capital provided by limited partners and Redemption-Exchange Unitholders
|
19
|
621
|
|
634
|
|
—
|
|
|||||||
|
Capital provided by preferred shareholders
|
—
|
|
15
|
|
—
|
|
||||||||
|
Capital provided by others who have interests in operating subsidiaries
|
|
897
|
|
456
|
|
977
|
|
|||||||
|
Capital provided by Brookfield Asset Management Inc.
|
|
—
|
|
78
|
|
638
|
|
|||||||
|
Distributions to limited partners and Redemption-Exchange Unitholders
|
|
(31
|
)
|
(12
|
)
|
—
|
|
|||||||
|
Distributions to Special Limited Partners
|
19
|
(95
|
)
|
—
|
|
—
|
|
|||||||
|
Distributions to others who have interests in operating subsidiaries
|
|
(388
|
)
|
(40
|
)
|
(253
|
)
|
|||||||
|
Distributions to Brookfield Asset Management Inc.
|
|
—
|
|
(11
|
)
|
(460
|
)
|
|||||||
|
Cash from (used in) financing activities
|
|
1,353
|
|
586
|
|
1,971
|
|
|||||||
|
Investing Activities
|
|
|
|
|||||||||||
|
Acquisitions
|
|
|
|
|||||||||||
|
Subsidiaries, net of cash acquired
|
3
|
(1,668
|
)
|
(63
|
)
|
(1,476
|
)
|
|||||||
|
Property, plant and equipment and intangible assets
|
|
(240
|
)
|
(144
|
)
|
(139
|
)
|
|||||||
|
Equity accounted investments
|
|
(208
|
)
|
—
|
|
(365
|
)
|
|||||||
|
Financial assets
|
|
(290
|
)
|
(447
|
)
|
(202
|
)
|
|||||||
|
Dispositions and distributions
|
|
|||||||||||||
|
Subsidiaries, net of cash disposed
|
|
383
|
|
—
|
|
—
|
|
|||||||
|
Property, plant and equipment
|
|
17
|
|
22
|
|
58
|
|
|||||||
|
Equity accounted investments
|
|
60
|
|
149
|
|
47
|
|
|||||||
|
Financial assets
|
|
259
|
|
327
|
|
—
|
|
|||||||
|
Proceeds from sale of assets held for sale
|
—
|
|
15
|
|
—
|
|
||||||||
|
Net settlement of foreign exchange hedges
|
|
(12
|
)
|
19
|
|
2
|
|
|||||||
|
Restricted cash and deposits
|
|
104
|
|
26
|
|
(19
|
)
|
|||||||
|
Cash from (used in) investing activities
|
|
(1,595
|
)
|
(96
|
)
|
(2,094
|
)
|
|||||||
|
Cash
|
|
|
|
|||||||||||
|
Change during the period
|
|
48
|
|
719
|
|
209
|
|
|||||||
|
Impact of foreign exchange on cash
|
|
8
|
|
(15
|
)
|
(18
|
)
|
|||||||
|
Cash reclassified as assets held for sale
|
7
|
—
|
|
(8
|
)
|
—
|
|
|||||||
|
Balance, beginning of year
|
|
1,050
|
|
354
|
|
163
|
|
|||||||
|
Balance, end of year
|
|
$
|
1,106
|
|
$
|
1,050
|
|
$
|
354
|
|
||||
Supplemental cash flow information is presented in Note 28
The accompanying notes are an integral part of the consolidated financial statements.
|
F-11
|
Brookfield Business Partners
|
BROOKFIELD BUSINESS PARTNERS L.P.
NOTES TO CONSOLIDATED FINANCIAL STATEMENTS
As at December 31, 2017 and 2016 and for the years ended December 31, 2017, 2016 and 2015
(a)
Brookfield Business Partners L.P.
Brookfield Business Partners L.P. and its subsidiaries, (collectively, "the partnership") own and operate business services and industrial operations ("the Business") on a global basis. Brookfield Business Partners L.P. was registered as a limited partnership established under the laws of Bermuda, and organized pursuant to a limited partnership agreement as amended on May 31, 2016, and as further amended on June 17, 2016. Brookfield Business Partners L.P. is a subsidiary of Brookfield Asset Management Inc. ("Brookfield Asset Management" or "Brookfield" or the "parent company"). Brookfield Business Partners L.P.'s limited partnership units are listed on the New York Stock Exchange and the Toronto Stock Exchange under the symbols "BBU" and "BBU.UN", respectively. The registered head office of Brookfield Business Partners L.P. is 73 Front Street, 5th Floor, Hamilton HM 12, Bermuda.
Brookfield Business Partners L.P.’s sole direct investment is a managing general partnership interest (the ‘‘Managing GP Units’’) in Brookfield Business L.P. (the ‘‘Holding LP’’), which holds the partnership’s interests in the business services and industrial operations.
The partnership’s principal business services include construction services, residential real estate services, road fuel distribution and marketing, logistics and facilities management. The partnership’s principal industrial operations are comprised of oil and gas production, marine energy services, palladium and aggregates mining, the production of graphite electrodes, water and sewage treatment operations and the manufacturing of engineered precast systems and pipe products. The partnership’s operations are primarily located in Canada, Australia, the United Kingdom, the United States, Brazil and the Middle East.
(b)
Spin-off of business services and industrial operations
On June 20, 2016, Brookfield completed the spin-off of the partnership (the ‘‘spin-off’’), which was effected by way of a special dividend of units of Brookfield Business Partners L.P. to holders of Brookfield’s Class A and B limited voting shares as of June 2, 2016. Each holder of Brookfield shares received
one
limited partnership unit for approximately every 50 Brookfield shares. Brookfield shareholders received approximately
45%
of the limited partnership units of Brookfield Business Partners L.P., with Brookfield retaining the remaining limited partnership units of Brookfield Business Partners L.P.
Prior to the spin-off, Brookfield effected a reorganization so that the partnership’s business services and industrial operations that were historically owned and operated by Brookfield, both directly and through its operating entities, were acquired by subsidiaries of the Holding LP, (the ‘‘holding entities’’). In addition, Brookfield transferred
$250 million
in cash to the holding entities. The holding entities were established to hold the partnership’s interest in the Business. In consideration, Brookfield received (i) approximately
55%
of the limited partnership (‘‘LP’’) units and
100%
of the general partner units of Brookfield Business Partners L.P., (ii) special limited partnership units (‘‘Special LP Units’’) and redemption-exchange units of Holding LP (‘‘redemption- exchange units’’), representing an approximate
52%
limited partnership interest in the Holding LP, and (iii)
$15 million
of preferred shares of the holding entities, (‘‘preferred shares’’). On spin-off, Brookfield held approximately
79%
of the partnership interest on a fully exchanged basis. As at December 31, 2017, Brookfield's interest in the partnership was
68%
on a fully exchanged basis. Further details are described in Note 19.
Throughout these consolidated financial statements, reference to ‘‘attributable to the unitholder’ means attributable to limited partnership unitholders, general partnership unitholders, redemption-exchange unitholders and special limited partnership unitholders post spin-off and to parent company pre spin-off.
|
F-12
|
Brookfield Business Partners
|
BROOKFIELD BUSINESS PARTNERS L.P.
NOTES TO CONSOLIDATED FINANCIAL STATEMENTS (Continued)
As at December 31, 2017 and 2016 and for the years ended December 31, 2017, 2016 and 2015
The following describes the agreements resulting from the spin-off:
(i) Redemption-exchange units
As part of the spin-off, Holding LP issued redemption-exchange units for the transfer of the Business. At any time after
two years
from the date of the spin-off, or
June 20, 2018, the redemption-exchange units may, at the request of the holder, be redeemed in whole or in part, for cash in an amount equal to the market value of one of Brookfield Business Partners L.P.’s limited partnership units multiplied by the number of units to be redeemed (subject to certain customary adjustments). This right is subject to Brookfield Business Partners L.P.’s right, at its sole discretion, to elect to acquire any unit presented for redemption in exchange for
one
of Brookfield Business Partners L.P.’s limited partnership units (subject to certain customary adjustments). If Brookfield Business Partners L.P. elects not to exchange the redemption-exchange units for limited partnership units of Brookfield Business Partners
L.P., the redemption-exchange units are required to be redeemed for cash. The redemption-exchange units provide the holder the direct economic benefits and exposures to the underlying performance of Holding LP and accordingly to the variability of the distributions of Holding LP, whereas Brookfield Business Partners L.P.’s unitholders have indirect access to the economic benefits and exposures of Holding LP through direct ownership interest in Brookfield Business Partners L.P. which owns a direct interest in Holding LP through its Managing GP Units.
(ii) Preferred shares
As part of the spin-off, Brookfield subscribed for an aggregate of
$15 million
of preferred shares of
three
of the partnership’s subsidiaries. The preferred shares are entitled to receive a cumulative preferential cash dividend equal to
5%
of their redemption value per annum as and when declared by the board of the directors of the applicable entity and are redeemable at the option of the applicable entity at any time after the twentieth anniversary of their issuance.
(iii) Credit facilities
As part of the spin-off, the partnership entered into a credit agreement with Brookfield (the ‘‘Brookfield Credit Agreements’’) providing for
two
,
three
-year revolving credit facilities. One constitutes an operating credit facility that permitted borrowings of up to
$200 million
for working capital purposes and the other constitutes an acquisition facility that permitted borrowings of up to
$300 million
for purposes of funding our acquisitions and investments. In October 2017, the
two
credit facilities were combined into
one
revolving credit facility that permits borrowings of up to
$500 million
. Further details of the Brookfield Credit Agreements are described in Note 17.
(iv) Other arrangements with Brookfield
The partnership entered into a Master Services Agreement (the ‘‘Master Services Agreement’’) with affiliates of Brookfield, (the ‘‘Service Providers’’), to provide management services to the partnership. Key decision makers of the partnership are employees of the ultimate parent company and provide management services to the partnership under this Master Services Agreement. Pursuant to the Master Services Agreement, the partnership pays a base management fee to the Service Providers equal to
1.25%
of the total capitalization of Brookfield Business Partners L.P. per annum (
0.3125%
per quarter). Through its holding of Special LP Units in the Holding LP, Brookfield also receives incentive distributions based on a
20%
increase in the unit price of Brookfield Business Partners L.P. over an initial threshold based on the volume weighted average price of the units, subject to a high watermark. Further details of this arrangement are described in Note 19.
As part of the spin-off, the partnership entered into a Deposit Agreement with Brookfield, (the ‘‘Deposit Agreement’’). From time to time, the partnership may place funds on deposit with Brookfield. The deposit balance is due on demand and earns an agreed upon rate of interest. The terms of any such deposit are on market terms.
|
F-13
|
Brookfield Business Partners
|
BROOKFIELD BUSINESS PARTNERS L.P.
NOTES TO CONSOLIDATED FINANCIAL STATEMENTS (Continued)
As at December 31, 2017 and 2016 and for the years ended December 31, 2017, 2016 and 2015
|
(a)
|
Basis of presentation
|
These consolidated financial statements of the partnership and its subsidiaries (‘‘financial statements’’) have been prepared in accordance with International Financial Reporting Standards (‘‘IFRS’’) as issued by the International Accounting Standards Board (‘‘IASB’’). The financial statements are prepared on a going concern basis and have been presented in U.S. dollars rounded to the nearest million unless otherwise indicated. The accounting policies and methodologies set out below have been applied consistently, with the exception of certain comparative figures which have been reclassified to conform to the current period’s presentation. Policies not effective for the current accounting period are described later in Note 2 (ad), under Future Changes in Accounting Policies.
For the periods prior to June 20, 2016, the partnership’s results represented a carve-out of the assets, liabilities, revenues, expenses, and cash flows of the Business that was contributed to the partnership and included allocations of general corporate expenses of the parent company. These expenses, prior to the spin-off, relate to certain operations oversight functions and associated information technology, facilities and other overhead costs and have been allocated based on headcount. These allocated expenses have been included as appropriate in the partnership’s consolidated statements of operating results prior to the spin-off. These allocations may not, however, reflect the expense the partnership would have incurred as an independent publicly-traded company for the periods presented.
Subsequent to the spin-off, the partnership is no longer allocated general corporate expenses of the parent company as the functions to which they related are now provided through the Master Services Agreement. The base management fee related to the services received under the Master Services Agreement has been recorded as part of general and administrative expenses in the consolidated financial statements.
These financial statements were approved by the partnership’s Board of Directors and authorized for issue on March 9, 2018.
|
(b)
|
Continuity of interests
|
Brookfield Business Partners L.P. was established on January 18, 2016 by Brookfield and on June 20, 2016 Brookfield completed the spin-off of the Business to holders of Brookfield’s Class A and B limited voting shares. Brookfield directly and indirectly controlled the Business prior to the spin-off and continues to control the partnership subsequent to the spin-off through its interests in the partnership. As a result of this continuing common control, there is insufficient substance to justify a change in the measurement of the Business. In accordance with the partnership’s and Brookfield’s accounting policy, the partnership has reflected the Business in its financial position and results of operations using Brookfield’s carrying values, prior to the spin-off.
To reflect this continuity of interests these financial statements provide comparative information of the Business for the periods prior to the spin-off, as previously reported by Brookfield. The economic and accounting impact of contractual relationships created or modified in conjunction with the spin-off (see Note 1(b)) have been reflected prospectively from the date of the spin-off and have not been reflected in the results of operations or financial position of the partnership prior to June 20, 2016, as such items were in fact not created or modified prior thereto. Accordingly, the financial information for the periods prior to June 20, 2016 is presented based on the historical financial information for the Business as previously reported by Brookfield. For the period after completion of the spin-off, the results are based on the actual results of the partnership, including the adjustments associated with the spin-off and the execution of several new and amended agreements including management service and relationship agreements (see Note 24). Therefore, net income (loss) and comprehensive income (loss) not attributable to interests of others in operating subsidiaries has been allocated to Brookfield prior to June 20, 2016 and allocated to the limited partners, the general partner, redemption-exchange unitholders, and special limited partners on and after June 20, 2016.
|
F-14
|
Brookfield Business Partners
|
BROOKFIELD BUSINESS PARTNERS L.P.
NOTES TO CONSOLIDATED FINANCIAL STATEMENTS (Continued)
As at December 31, 2017 and 2016 and for the years ended December 31, 2017, 2016 and 2015
Prior to June 20, 2016, intercompany transactions between the partnership and Brookfield have been included in these financial statements and are considered to be forgiven at the time the transaction, are recorded and reflected as a ‘‘Net increase/(decrease) in Brookfield Asset Management Inc. investment’’. ‘‘Net increase/(decrease) in Brookfield Asset Management Inc. investment’’ as shown in the consolidated statements of changes in equity represents the parent company’s historical investment in the partnership, accumulated net income and the net effect of the transactions and allocations from the parent company. The total net effect of transactions with the parent company is reflected in the consolidated statements of cash flow as a financing activity and in the consolidated statements of financial position as ‘‘Equity attributable to Brookfield Asset Management Inc.’’
|
(c)
|
Basis of consolidation
|
The consolidated financial statements include the accounts of the partnership and its consolidated subsidiaries, which are the entities over which the partnership has control. An investor controls an investee when it is exposed, or has rights, to variable returns from its involvement with the investee and has the ability to affect those returns through its power over the investee. Non-controlling interests in the equity of the partnership’s subsidiaries held by others and the redemption-exchange units, Special LP Units and preferred shares held by Brookfield in the Holding LP and the holding entities respectively are shown separately in equity in the consolidated statements of financial position. Intercompany transactions within the partnership have been eliminated.
As part of the spin-off, Brookfield Business Partners L.P., through its Managing GP Units, became the managing general partner of Holding LP, and thus controls Holding LP. The partnership entered into agreements with various affiliates of Brookfield, whereby the partnership was assigned Brookfield’s voting or general partner kick-out rights and effectively controls the subsidiaries of Holding LP with respect to which the agreements were put in place. Accordingly, the partnership consolidates the accounts of Holding LP and its subsidiaries.
|
(d)
|
Redemption-exchange units
|
As described in Note 1(b)(i), the partnership’s equity interests include limited partnership units held by public unitholders and Brookfield, as well as redemption-exchange units held by Brookfield. The redemption-exchange units have the same economic attributes in all respects as the limited partnership units, except that the redemption-exchange units provide Brookfield the right to request that its units be redeemed for cash consideration. In the event that Brookfield exercises this right, the partnership has the right, at its sole discretion, to satisfy the redemption request with limited partnership units of Brookfield Business Partners L.P., rather than cash, on a
one
-for-one basis. The redemption-exchange units provide Brookfield with the direct economic benefits and exposures to the underlying performance of the Holding LP and accordingly to the variability of the distributions of the Holding LP, whereas the partnership’s unitholders have indirect access to the economic benefits and exposures of the Holding LP through direct ownership interest in the partnership which owns a direct interest in the Holding LP. Accordingly, the redemption-exchange units have been presented within non-controlling interests. The redemption-exchange units are issued capital of the Holding LP and as a result are not adjusted for changes in market value.
|
(e)
|
Preferred shares and Special Limited Partner units
|
As described in Note 1(b)(ii), the partnership’s equity interests include preferred shares and Special Limited Partner units held by Brookfield. The partnership and its subsidiaries are not obligated to redeem the preferred shares and accordingly, they have been determined to be equity of the applicable entities and are reflected as a component of non-controlling interest in the consolidated statements of financial position.
|
(f)
|
Interests in other entities
|
|
(i)
|
Subsidiaries
|
These consolidated financial statements include the accounts of the partnership and subsidiaries over which the partnership has control. Subsidiaries are consolidated from the date of acquisition, being the date on which the partnership obtained control, and continue to be consolidated until the date when control is lost. The partnership controls an investee when it is exposed, or has rights, to variable returns from its involvement with the investee and has the ability to affect those returns through its power over the investee.
|
F-15
|
Brookfield Business Partners
|
BROOKFIELD BUSINESS PARTNERS L.P.
NOTES TO CONSOLIDATED FINANCIAL STATEMENTS (Continued)
As at December 31, 2017 and 2016 and for the years ended December 31, 2017, 2016 and 2015
Non-controlling interests may be initially measured either at fair value or at the non-controlling interests’ proportionate share of the fair value of the acquiree’s identifiable net assets. The choice of measurement basis is made on an acquisition by acquisition basis. Subsequent to acquisition, the carrying amount of non-controlling interests is the amount of those interests at initial recognition plus the non-controlling interests’ share of subsequent changes in partnership capital in addition to changes in ownership interests. Total comprehensive income (loss) is attributed to non-controlling interests, even if this results in the non-controlling interests having a deficit balance.
All intercompany balances, transactions, revenues and expenses are eliminated in full.
The following provides information about our partnership's wholly-owned subsidiaries as of
December 31, 2017
and 2016:
|
Defined Name
|
Name of entity
|
Country of incorporation
|
Voting interest (%)
|
Economic interest (%)
|
||||||||||||
|
2017
|
2016
|
2017
|
2016
|
|||||||||||||
|
Business Services
|
||||||||||||||||
|
Financial advisory services business
|
BFIN
|
Canada
|
100
|
%
|
100
|
%
|
100
|
%
|
100
|
%
|
||||||
|
Residential real estate services business
|
Brookfield RPS Limited
|
Canada
|
100
|
%
|
100
|
%
|
100
|
%
|
100
|
%
|
||||||
|
Construction Services
|
||||||||||||||||
|
Construction services business
|
Multiplex
|
Australia
|
100
|
%
|
100
|
%
|
100
|
%
|
100
|
%
|
||||||
|
F-16
|
Brookfield Business Partners
|
BROOKFIELD BUSINESS PARTNERS L.P.
NOTES TO CONSOLIDATED FINANCIAL STATEMENTS (Continued)
As at December 31, 2017 and 2016 and for the years ended December 31, 2017, 2016 and 2015
The following table presents details of non-wholly owned subsidiaries of our partnership:
|
Defined Name
|
Name of entity
|
Country of incorporation
|
Voting interest (%)
|
Economic interest (%)
|
||||||||||||
|
2017
|
2016
|
2017
|
2016
|
|||||||||||||
|
Business Services
|
||||||||||||||||
|
Condominium management services business
|
Crossbridge Condominium Services Ltd.
|
Canada
|
90
|
%
|
80
|
%
|
90
|
%
|
80
|
%
|
||||||
|
IT storage facilities management business
|
WatServ
|
Canada
|
75
|
%
|
75
|
%
|
75
|
%
|
75
|
%
|
||||||
|
Fuel marketing business
|
BG Fuels
|
Canada
|
100
|
%
|
—
|
|
26
|
%
|
—
|
|
||||||
|
Australian facilities management business
|
BGIS Australia Pty Ltd.
|
Australia
|
100
|
%
|
100
|
%
|
26
|
%
|
26
|
%
|
||||||
|
Canadian facilities management business
|
BGIS Global Integrated Solutions Canada L.P.
|
Canada
|
100
|
%
|
100
|
%
|
26
|
%
|
26
|
%
|
||||||
|
Cold storage logistics
|
Nova Cold Logistics
|
Canada
|
100
|
%
|
100
|
%
|
25
|
%
|
25
|
%
|
||||||
|
Road fuel distribution business
|
Greenergy Fuels Holding Limited
|
United Kingdom
|
85
|
%
|
—
|
|
14
|
%
|
—
|
|
||||||
|
Industrial operations
|
||||||||||||||||
|
Limestone mining operations
|
Hammerstone Corporation
|
Canada
|
100
|
%
|
100
|
%
|
39
|
%
|
39
|
%
|
||||||
|
Graphite electrode manufacturing business
|
GrafTech International Ltd.
|
United States of America
|
100
|
%
|
100
|
%
|
34
|
%
|
34
|
%
|
||||||
|
Water distribution and sewage treatment company
|
BRK Ambiental
|
Brazil
|
70
|
%
|
—
|
|
26
|
%
|
—
|
|
||||||
|
Infrastructure support products manufacturing business
|
Armtec L.P.
|
Canada
|
100
|
%
|
100
|
%
|
25
|
%
|
25
|
%
|
||||||
|
Palladium mining operation
|
North American Palladium Ltd.
|
Canada
|
92
|
%
|
92
|
%
|
23
|
%
|
23
|
%
|
||||||
|
Energy
|
||||||||||||||||
|
Canadian well-servicing operation
|
CWC Energy Services Corp.
|
Canada
|
78
|
%
|
72
|
%
|
56
|
%
|
39
|
%
|
||||||
|
Canadian energy operation
|
Ember Resources Inc.
|
Canada
|
100
|
%
|
100
|
%
|
41
|
%
|
41
|
%
|
||||||
|
(ii)
|
Associates and joint ventures
|
Associates are entities over which the partnership exercises significant influence. Significant influence is the power to participate in the financial and operating policy decisions of the investee but without control or joint control over those policies. Joint ventures are joint arrangements whereby the parties that have joint control of the arrangement have the rights to the net assets of the joint arrangement. Joint control is the contractually agreed sharing of control over an arrangement, which exists only when decisions about the relevant activities require unanimous consent of the parties sharing control. The partnership accounts for associates and joint ventures using the equity method of accounting within equity accounted investments in the consolidated statements of financial position.
Interests in associates and joint ventures accounted for using the equity method are initially recognized at cost. At the time of initial recognition, if the cost of the associate or joint venture is lower than the proportionate share of the investment’s underlying fair value, the partnership records a gain on the difference between the cost and the underlying fair value of the investment in net income. If the cost of the associate or joint venture is greater than the partnership’s proportionate share of the underlying fair value, goodwill relating to the associate or joint venture is included in the carrying amount of the investment.
|
F-17
|
Brookfield Business Partners
|
BROOKFIELD BUSINESS PARTNERS L.P.
NOTES TO CONSOLIDATED FINANCIAL STATEMENTS (Continued)
As at December 31, 2017 and 2016 and for the years ended December 31, 2017, 2016 and 2015
Subsequent to initial recognition, the carrying value of the partnership interest in an associate or joint venture is adjusted for the partnership’s share of comprehensive income and distributions of the investee. Profit and losses resulting from transactions with an associate or joint venture are recognized in the consolidated financial statements based on the interests of unrelated investors in the investee. The carrying value of associates or joint ventures is assessed for impairment at each reporting date. Impairment losses on equity accounted investments may be subsequently reversed in net income. Further information on the impairment of long-lived assets is available in Note 2(n).
|
(g)
|
Foreign currency translation
|
The U.S. dollar is the functional and presentation currency of the partnership. Each of the partnership’s subsidiaries and equity accounted investments determines its own functional currency and items included in the financial statements of each subsidiary and equity accounted investment are measured using that functional currency.
Assets and liabilities of foreign operations having a functional currency other than the U.S. dollar are translated at the rate of exchange prevailing at the reporting date and revenues and expenses at average rates during the period. Gains or losses on translation are included as a component of equity.
On disposal of a foreign operation resulting in the loss of control, the component of other comprehensive income due to accumulated foreign currency translation relating to that foreign operation is reclassified to net income. Gains or losses on foreign currency denominated balances and transactions that are designated as hedges of net investments in these operations are reported in the same manner. On partial disposal of a foreign operation in which control is retained, the proportionate share of the component of other comprehensive income or loss relating to that foreign operation is reclassified to non-controlling interests in that foreign operation.
Foreign currency denominated monetary assets and liabilities are translated using the rate of exchange prevailing at the reporting date and non-monetary assets and liabilities are measured at historic cost and are translated at the rate of exchange at the transaction date. Revenues and expenses are measured at average rates during the period. Gains or losses on translation of these items are included in net income or loss. Gains and losses on transactions which hedge these items are also included in net income or loss.
|
(h)
|
Business combinations
|
Business acquisitions, in which control is acquired, are accounted for using the acquisition method, other than those between and among entities under common control. The consideration of each acquisition is measured at the aggregate of the fair values at the acquisition date of assets transferred by the acquirer, liabilities incurred or assumed, and equity instruments issued by the partnership in exchange for control of the acquiree. Acquisition related costs are recognized in the consolidated statements of operating results as incurred and included in other income (expenses), net.
Where applicable, the consideration for the acquisition includes any asset or liability resulting from a contingent consideration arrangement, measured at its acquisition-date fair value. Subsequent changes in fair values are adjusted against the cost of the acquisition where they qualify as measurement period adjustments. All other subsequent changes in the fair value of contingent consideration classified as liabilities will be recognized in the consolidated statements of operating results, whereas changes in the fair values of contingent consideration classified within equity are not subsequently re-measured.
Where a business combination is achieved in stages, the partnership’s previously held interests in the acquired entity are remeasured to fair value at the acquisition date, that is, the date the partnership attains control and the resulting gain or loss, if any, is recognized in the consolidated statements of operating results. Amounts arising from interests in the acquiree prior to the acquisition date that have previously been recognized in other comprehensive income are reclassified to the consolidated statements of operating results, where such treatment would be appropriate if that interest were disposed of.
|
F-18
|
Brookfield Business Partners
|
BROOKFIELD BUSINESS PARTNERS L.P.
NOTES TO CONSOLIDATED FINANCIAL STATEMENTS (Continued)
As at December 31, 2017 and 2016 and for the years ended December 31, 2017, 2016 and 2015
If the initial accounting for a business combination is incomplete by the end of the reporting period in which the acquisition occurs, the partnership reports provisional amounts for the items for which the accounting is incomplete. Those provisional amounts are adjusted during the measurement period, or additional assets or liabilities are recognized, to reflect new information obtained about facts and circumstances that existed as of the acquisition date that, if known, would have affected the amounts recognized as of that date.
The measurement period is the period from the date of acquisition to the date the partnership obtains complete information about facts and circumstances that existed as of the acquisition date. The measurement period is subject to a maximum of one year subsequent to the acquisition date.
If, after reassessment, the partnership’s interest in the fair value of the acquiree’s identifiable net assets exceeds the sum of the consideration transferred, the amount of any non-controlling interests in the acquiree and the fair value of the acquirer’s previously held equity interest in the acquiree if any, the excess is recognized immediately in income as a bargain purchase gain.
Contingent liabilities acquired in a business combination are initially measured at fair value at the date of acquisition. At the end of subsequent reporting periods, such contingent liabilities are measured at the higher of the amount that would be recognized in accordance with IAS 37, Provisions, Contingent Liabilities and Contingent Assets, or IAS 37, and the amount initially recognized less cumulative amortization recognized in accordance with IAS 18, Revenue, or IAS 18.
|
(i)
|
Cash and cash equivalents
|
Cash and cash equivalents include cash on hand, non-restricted deposits and short-term investments with original maturities of three months or less.
|
(j)
|
Accounts and other receivable, net
|
Accounts and other receivable , net include trade receivables, construction retentions and other unbilled receivables, which are recognized initially at fair value and subsequently measured at amortized cost using the effective interest method, less any allowance for uncollectable amounts.
Trade receivables related to the partnership’s mining operations are recognized at fair value.
|
(k)
|
Inventories
|
Inventories, with the exception of certain fuel inventories, are valued at the lower of cost and net realizable value. Cost is determined using specific identification where possible and practicable or using the first-in, first-out or weighted average method. Costs include direct and indirect expenditures incurred in bringing the inventory to its existing condition and location. Net realizable value represents the estimated selling price in the ordinary course of business, less the estimated costs of completion and the estimated costs necessary to make the sale.
Fuel inventories are traded in active markets and are purchased with the view to resell in the near future, generating a profit from fluctuations in prices or margins. As a result, fuel inventories are carried at market value by reference to prices in a quoted active market, in accordance with the commodity broker-trader exemption granted by IAS 2,
Inventories
. Change in fair value less costs to sell, are recognized in the unaudited interim condensed consolidated statement of operating results through direct operating costs. Fuel products that are held for extended periods in order to benefit from future anticipated increases in fuel prices or located in territories where no active market exists are recognized at the lower of cost and net realizable value. Products and chemicals used in the production of biofuels are valued at the lower of cost and net realizable value.
|
(l)
|
Renewable Transport Fuel Obligation (RTFO)
|
Under the UK government's Renewable Transport Fuel Obligation ("RTFO") Order, which regulates biofuels used for transport and non-road mobile machinery, our UK road fuel service operation is required to meet annual targets for the supply of biofuels. The obligations which arise are either settled by cash or through the delivery of certificates which are generated by blending biofuels. To the extent that the partnership generates certificates in excess of its current year obligation, these can either be carried forward to offset up to
25%
of the next year’s obligation or sold to other parties.
|
F-19
|
Brookfield Business Partners
|
BROOKFIELD BUSINESS PARTNERS L.P.
NOTES TO CONSOLIDATED FINANCIAL STATEMENTS (Continued)
As at December 31, 2017 and 2016 and for the years ended December 31, 2017, 2016 and 2015
Certificates generated or purchased during the year which will be used to settle the current obligation are recognized in inventory at the lower of cost and net realizable value. Where certificates are generated, cost is deemed to be the average cost of blending biofuels during the year in which the certificates are generated.
Certificates held for sale to third parties are recognized in inventory at fair value. There is no externally quoted marketplace for the valuation of RTFO certificates. In order to value these contracts, the partnership has adopted a pricing methodology combining both observable inputs based on market data and assumptions developed internally based on observable market activity. Changes in market prices of the certificates and the quantity of tickets considered to be realizable through external sales are recognized immediately in the consolidated statement of operating results. Certificates for which no active market is deemed to exist are not recognized.
The liability associated with the obligations under the RTFO Order is recognized in the year in which the obligation arises and is valued by reference to either the cost of generating the certificates which will be surrendered to meet the obligation or the expected future cash outflow where the obligation is settled. The liability is recorded in accounts payable and other.
|
(m)
|
Related party transactions
|
In the normal course of operations, the partnership enters into various transactions on market terms with related parties, which have been measured at their exchange value and are recognized in the consolidated financial statements. Related party transactions are further described in Note 24.
|
(n)
|
Property, plant and equipment, or PP&E
|
Items of PP&E are measured at cost less accumulated depreciation and accumulated impairment losses, if any. Cost includes expenditures that are directly attributable to the acquisition of the asset. The cost of assets includes the cost of materials and direct labour, any other costs directly attributable to bringing the assets to a working condition for their intended use, and the cost of dismantling and removing the items and restoring the site on which they are located.
Depreciation of an asset commences when it is available for use. PP&E are depreciated on a straight line basis over the estimated useful lives of each component of the assets as follows:
|
Buildings
|
Up to 50 years
|
|
Leasehold improvements
|
Up to 40 years but not exceeding the term of the lease
|
|
Machinery and equipment
|
Up to 20 years
|
|
Oil and gas related equipment
|
Up to 10 years
|
Depreciation on PP&E is calculated on a straight-line basis so as to write-off the net cost of each asset over its expected useful life to its estimated residual value. Leasehold improvements are depreciated over the period of the lease or estimated useful life, whichever is the shorter, using the straight-line method. The estimated useful lives, residual values and depreciation methods are reviewed at the end of each annual reporting period, with the effect of any changes recognized on a prospective basis.
With respect to our oil and natural gas assets, pre-license costs are costs incurred before the legal rights to explore a specific area have been obtained and are expensed in the period in which they are incurred. Once the legal right to explore has been acquired, costs directly associated with an exploration well are initially capitalized as exploration and evaluation, or E&E, costs. Such E&E costs may include costs of license acquisition, technical services and studies, seismic acquisition, exploration drilling and testing. E&E costs are not depleted and are carried forward until technical feasibility and commercial viability has been determined. All such carried costs are subject to technical, commercial and management review at each reporting period and where indicators of impairment exist, such costs are charged to E&E expense.
|
F-20
|
Brookfield Business Partners
|
BROOKFIELD BUSINESS PARTNERS L.P.
NOTES TO CONSOLIDATED FINANCIAL STATEMENTS (Continued)
As at December 31, 2017 and 2016 and for the years ended December 31, 2017, 2016 and 2015
Upon determination that proved and/or probable reserves exist and the technology exists to extract the resource economically, E&E assets attributable to those reserves are first tested for impairment and then reclassified to oil and gas properties within PP&E. The net carrying value of oil and gas properties is depleted using the unit-of-production method based on estimated proved plus probable oil and natural gas reserves. Future development costs, which are the estimated costs necessary to bring those reserves into production, are included in the depletable base. For purposes of this calculation, oil and natural gas reserves are converted to a common unit of measurement on the basis of their relative energy content where six thousand cubic feet of natural gas equates to one barrel of oil.
With respect to our mining assets, exploration costs relating to properties are charged to earnings in the year in which they are incurred. When it is determined that a mining property can be economically developed as a result of reserve potential and subsequent exploration, expenditures are capitalized. Determination as to reserve potential is based on the results of studies, which indicate whether production from a property is economically feasible. Upon commencement of commercial production of a development project these costs are amortized using the unit-of-production method over the proven and probable reserves.
As part of its mining operations, the partnership incurs stripping costs both during the development phase and production phase of its operations. Stripping costs incurred as part of development stage mining activities incurred by the partnership are deferred and capitalized as part of mining properties. Stripping costs incurred during the production stage are incurred in order to produce inventory or to improve access to ore which will be mined in the future. Where the costs are incurred to produce inventory, the production stripping costs are accounted for as a cost of producing those inventories. Where the costs are incurred to improve access to ore which will be mined in the future, the costs are deferred and capitalized as a stripping activity asset (included in mining interest) if the following criteria are met: improved access to the ore body is probable; the component of the ore body can be accurately identified; and the costs relating to the stripping activity associated with the component can be reliably measured. If these criteria are not met the costs are expensed in the period in which they are incurred. The stripping activity asset is subsequently depleted using the units-of-production depletion method over the life of the identified component of the ore body to which access has been improved as a result of the stripping activity.
|
(o)
|
Asset impairment
|
At each reporting date the partnership assesses whether for assets, other than those measured at fair value with changes in values recorded in net income, there is any indication that such assets are impaired. This assessment includes a review of internal and external factors which includes, but is not limited to, changes in the technological, political, economic or legal environment in which the entity operates in, structural changes in the industry, changes in the level of demand, physical damage and obsolescence due to technological changes. An impairment is recognized if the recoverable amount, determined as the higher of the estimated fair value less costs of disposal or the discounted future cash flows generated from use and eventual disposal from an asset or cash generating unit is less than their carrying value. The projections of future cash flows take into account the relevant operating plans and management’s best estimate of the most probable set of conditions anticipated to prevail. Where an impairment loss subsequently reverses, the carrying amount of the asset or cash generating unit is increased to the lesser of the revised estimate of recoverable amount and the carrying amount that would have been recorded had no impairment loss been recognized previously.
|
(p)
|
Intangible assets
|
Intangible assets acquired in a business combination and recognized separately from goodwill are initially recognized at their fair value at the acquisition date. The partnership’s intangible assets are comprised primarily of water and sewage system, concession rights, computer software, trademarks, distribution networks, patents, product development, customer relationships, loyalty program and technology.
|
F-21
|
Brookfield Business Partners
|
BROOKFIELD BUSINESS PARTNERS L.P.
NOTES TO CONSOLIDATED FINANCIAL STATEMENTS (Continued)
As at December 31, 2017 and 2016 and for the years ended December 31, 2017, 2016 and 2015
Subsequent to initial recognition, intangible assets acquired in a business combination are reported at cost less accumulated amortization and accumulated impairment losses, on the same basis as intangible assets acquired separately. Intangible assets are amortized on a straight line basis over the following periods:
|
Water and sewage concession agreements
|
Up to 40 years
|
|
Computer software
|
Up to 10 years
|
|
Customer relationships
|
Up to 30 years
|
|
Patents, trademarks and proprietary technology
|
Up to 40 years
|
|
Product development costs
|
Up to 5 years
|
|
Distribution networks
|
Up to 25 years
|
|
Loyalty program
|
Up to 15 years
|
Gains or losses arising from derecognition of an intangible asset are measured as the difference between the net disposal proceeds and the carrying amount of the asset and are recognized in profit or loss when the asset is derecognized.
Service concession arrangements which provide the partnership the right to charge users for the services are accounted for as an intangible asset under IFRIC 12, Service Concession Arrangements. Water and sewage concession agreements were acquired as part of the acquisition of BRK Ambiental, the Brazilian water, wastewater and industrial water and sewerage services company and were initially recognized at their fair values. Further information on the acquisition is available in Note 3.
Loyalty program represents the partnership's contractual right to issue loyalty points through a pre-existing loyalty program. The loyalty program was acquired as part of the acquisition of our fuel marketing business and was initially recognized at fair value. Further information on the acquisition is available in Note 3.
|
(q)
|
Goodwill
|
Goodwill represents the excess of the price paid for the acquisition of an entity over the fair value of the net tangible and intangible assets and liabilities acquired. Goodwill is allocated to the cash generating unit or units to which it relates. The partnership identifies cash generating units as identifiable groups of assets that are largely independent of the cash inflows from other assets or groups of assets.
Goodwill is evaluated for impairment on an annual basis. Impairment is determined for goodwill by assessing if the carrying value of a cash generating unit, including the allocated goodwill, exceeds its recoverable amount determined as the greater of the estimated fair value less costs of disposal or the value in use. Impairment losses recognized in respect of a cash generating unit are first allocated to the carrying value of goodwill and any excess is allocated to the carrying amount of assets in the cash generating unit. Any goodwill impairment is charged to profit or loss in the period in which the impairment is identified. Impairment losses on goodwill are not subsequently reversed.
On disposal of a subsidiary, the attributable amount of goodwill is included in the determination of the gain or loss on disposal of the operation.
|
(r)
|
Revenue recognition
|
Revenue is recognized to the extent that it is probable that the economic benefits will flow to the partnership and the revenue and costs incurred or to be incurred can be reliably measured. Revenue is measured at the fair value of the consideration received or receivable. Amounts disclosed as revenue are net of estimated customer returns, trade allowances, rebates and other similar allowances.
The partnership recognizes revenue when the specific criteria have been met for each of the partnership’s activities as described below. Cash received by the partnership from customers is recorded as deferred revenue until revenue recognition criteria are met.
|
F-22
|
Brookfield Business Partners
|
BROOKFIELD BUSINESS PARTNERS L.P.
NOTES TO CONSOLIDATED FINANCIAL STATEMENTS (Continued)
As at December 31, 2017 and 2016 and for the years ended December 31, 2017, 2016 and 2015
(i) Construction Services
Revenues from construction contracts are recognized using the percentage-of-completion method once the outcome of the construction contract can be estimated reliably, in proportion to the stage of completion of the contract, and to the extent to which collectability is reasonably assured. The stage of completion is measured by reference to actual costs incurred as a percentage of estimated total costs of each contract. When the outcome cannot be reliably determined, contract costs are expensed as incurred and revenue is only recorded to the extent that the costs are determined to be recoverable. Where it is probable that a loss will arise from a construction contract, the excess of total expected costs over total expected revenue is recognized as an expense immediately. Other service revenues are recognized when the services are provided.
(ii) Business Services
The fees and related costs for providing real estate, road fuel distribution and marketing, facilities management, logistics or other services are recognized over the period in which the services are provided.
The partnership also has revenues from home sales, home referral fees and other service fees:
|
•
|
Cost-plus home sale contracts: Cost-plus fee contracts primarily relate to contractual agreements where the partnership bears no risk of loss with respect to costs incurred. Under the terms of these contracts, the partnership is also generally protected against losses from changes in real estate market conditions. Revenues and related costs associated with the purchase and resale of residences are recognized on a net basis over the period in which services are provided.
|
|
•
|
Fixed fee home sale contracts: the partnership earns a fixed fee based upon a percentage of the acquisition cost of the residential property. This fee revenue is recognized when the home is acquired as substantially all services have been performed at this time. At the same time, all closing costs and any expected loss on sale of the applicable property are accrued. The revenues and expenses related to these contracts are recorded on a gross basis.
|
|
•
|
Home referral fees: These are earned primarily from real estate brokers associated with home sale transactions. The referral fee is recognized upon the binding agreement date of a real estate transaction or when the property is sold.
|
|
•
|
The fees and related costs related to providing real estate, road fuel distribution and marketing, facilities management, logistics or other services are recognized over the period in which the services are provided.
|
Revenue from the sale of goods in our UK road fuel service operation represents net invoiced sales of fuel products and RTFO certificates, excluding value added taxes but including excise duty, which has been assessed to be a production tax and recorded as part of consideration received. Revenue is recognized at the point that title passes to the customer.
(iii) Industrial Operations
Revenue from our industrial operations primarily consists of revenues from the sale of goods and rendering of services. Sales are recognized when the product is shipped, title passes and collectability is reasonably assured. Services revenues are recognized when the services are provided.
Revenue from our mining business are made under provisional pricing arrangements. Revenue from the sale of palladium and by-product metals is provisionally recognized based on quoted market prices upon the delivery of concentrate to the smelter or designated shipping point, which is when title transfers and significant rights and obligations of ownership pass. The business’ smelter contract provides for final prices to be determined by quoted market prices in a period subsequent to the date of concentrate delivery. The period between provisional invoicing and final pricing, or settlement period, is typically between
30
and
150 days
. These provisional sales contain an embedded derivative instrument which represents the forward contract for which the provisional sale is subsequently adjusted and is required to be separated from the host contract. Accordingly, the fair value of the final sales price adjustment is re-estimated by reference to forward market prices at each period end and changes in fair value are recognized as an adjustment to revenue. As a result, the accounts receivable amounts related to this business are recorded at fair value.
|
F-23
|
Brookfield Business Partners
|
BROOKFIELD BUSINESS PARTNERS L.P.
NOTES TO CONSOLIDATED FINANCIAL STATEMENTS (Continued)
As at December 31, 2017 and 2016 and for the years ended December 31, 2017, 2016 and 2015
(iv) Energy
Revenue from the sale of oil and gas is recognized when title of the product passes to an external party, based on volumes delivered and contractual delivery points and prices. Revenue for the production in which the partnership has an interest with other producers is recognized based on the partnership’s working interest. Revenue is measured net of royalties to reflect the deduction for other parties’ proportionate share of the revenue.
(v) Investments in Financial Assets
Dividend and interest income on investments in other financial assets are recorded within revenues when declared or on an accrual basis using the effective interest method.
Revenue from loans and notes receivable, less a provision for uncollectible amounts, is recorded on the accrual basis using the effective interest method.
|
(s)
|
Contract work in progress
|
The gross amount due from customers for contract work for all contracts in progress for which costs incurred plus recognized profits (less recognized losses) exceed progress billings, is generally presented as an asset. Progress billings not yet paid by customers and retentions are included within the trade and other receivables balance. The gross amounts due to customers for contract work for all contracts in progress for which progress billings exceed costs incurred plus recognized profits (less recognized losses) is generally presented as a liability.
Construction work in progress on construction contracts is stated at cost plus profit recognized to date calculated in accordance with the percentage of completion method, including retentions payable and receivable, less a provision for foreseeable losses and progress payments received to date.
|
(t)
|
Financial instruments and hedge accounting
|
The following summarizes the partnership’s classification and measurement of financial assets and liabilities:
|
|
Classification
|
Measurement
|
Statement of Financial Position Account
|
||
|
Financial assets
|
|||||
|
Cash and cash equivalents
|
Loans and receivables
|
Amortized cost
|
Cash and cash equivalents
|
||
|
Accounts receivable
|
Loans and receivables / FVTPL
(1)
|
Amortized cost / Fair value
|
Accounts and other receivable, net
|
||
|
Restricted cash and
deposits
|
Loans and receivables
|
Amortized cost
|
Financial assets
|
||
|
Equity securities designated as available-for-sale ("AFS")
|
AFS
|
Fair Value
|
Financial assets
|
||
|
Derivative Assets
|
FVTPL
(1)
|
Fair Value
|
Financial assets
|
||
|
Other financial assets
|
Loans and Receivables / AFS
|
Amortized cost / Fair value
|
Financial assets
|
||
|
Financial liabilities
|
|||||
|
Borrowings
|
Other liabilities
|
Amortized cost
|
Borrowings
|
||
|
Accounts payable and other
|
Other liabilities
|
Amortized cost
|
Accounts payable and other
|
||
|
Derivative liabilities
|
FVTPL
(1)
|
Fair value
|
Accounts payable and other
|
||
(1) Fair value through profit or loss, or FVTPL. Derivatives are FVTPL except derivatives in a hedging relationship.
|
F-24
|
Brookfield Business Partners
|
BROOKFIELD BUSINESS PARTNERS L.P.
NOTES TO CONSOLIDATED FINANCIAL STATEMENTS (Continued)
As at December 31, 2017 and 2016 and for the years ended December 31, 2017, 2016 and 2015
The partnership maintains a portfolio of marketable securities comprised of liquid equity and debt securities. The marketable securities are recognized on their trade date and are classified as available-for-sale. They are subsequently measured at fair value at each reporting date with the change in fair value recorded in other comprehensive income. When a decline in the fair value of an available-for-sale financial asset has been recognized in other comprehensive income and there is objective evidence that the asset is impaired, the cumulative loss that had been recognized in other comprehensive income is reclassified from equity to profit or loss as a reclassification adjustment.
The partnership selectively utilizes derivative financial instruments primarily to manage financial risks, including commodity price risk and foreign exchange risks. Derivative financial instruments are recorded at fair value. Hedge accounting is applied when the derivative is designated as a hedge of a specific exposure and there is assurance that it will continue to be highly effective as a hedge based on an expectation of offsetting cash flows or fair value. Hedge accounting is discontinued prospectively when the derivative no longer qualifies as a hedge or the hedging relationship is terminated. Once discontinued, the cumulative change in fair value of a derivative that was previously recorded in other comprehensive income by the application of hedge accounting is recognized in profit or loss over the remaining term of the original hedging relationship as amounts related to the hedged item are recognized in profit or loss. The assets or liabilities relating to unrealized mark-to-market gains and losses on derivative financial instruments are recorded in financial assets and financial liabilities, respectively.
(i) Items classified as hedges
Realized and unrealized gains and losses on foreign exchange contracts and foreign currency debt that are designated as hedges of currency risks relating to a net investment in a subsidiary with a functional currency other than the U.S. dollar are included in equity and are included in net income in the period in which the subsidiary is disposed of or to the extent partially disposed and control is not retained. Derivative financial instruments that are designated as hedges to offset corresponding changes in the fair value of assets and liabilities and cash flows are measured at estimated fair value with changes in fair value recorded in profit or loss or as a component of equity, as applicable.
Unrealized gains and losses on interest rate contracts designated as hedges of future variable interest payments are included in equity as a cash flow hedge when the interest rate risk relates to an anticipated variable interest payment. The periodic exchanges of payments on interest rate swap contracts designated as hedges of debt are recorded on an accrual basis as an adjustment to interest expense. The periodic exchanges of payments on interest rate contracts designated as hedges of future interest payments are amortized into profit or loss over the term of the corresponding interest payments.
(ii) Items not classified as hedges
Derivative financial instruments that are not designated as hedges are recorded at estimated fair value, and gains and losses arising from changes in fair value are recognized in net income in the period the changes occur. Realized and unrealized gains on other derivatives not designated as hedges are recorded in other income (expenses), net.
Other financial assets are classified as loans and receivables or available-for-sale securities based on their nature and use within the partnership’s business and are recorded initially at fair value. Other financial assets classified as available-for-sale are subsequently measured at fair value at each reporting date with the change in fair value recorded in other comprehensive income. Other financial assets classified as loans and receivables are subsequently measured at amortized cost using the effective interest method, less any impairment. Assets classified as loans and receivables are impaired when there exists objective evidence that the financial asset is impaired.
|
(u)
|
Fair value measurement
|
Fair value is the price that would be received to sell an asset or paid to transfer a liability in an orderly transaction between market participants at the measurement date, regardless of whether that price is directly observable or estimated using another valuation technique. In estimating the fair value of an asset or a liability, the partnership takes into account the characteristics of the asset or liability if market participants would take those characteristics into account when pricing the asset or liability at the measurement date.
|
F-25
|
Brookfield Business Partners
|
BROOKFIELD BUSINESS PARTNERS L.P.
NOTES TO CONSOLIDATED FINANCIAL STATEMENTS (Continued)
As at December 31, 2017 and 2016 and for the years ended December 31, 2017, 2016 and 2015
Fair value measurement is disaggregated into three hierarchical levels: Level 1, 2 or 3. Fair value hierarchical levels are directly based on the degree to which the inputs to the fair value measurement are observable. The levels are as follows:
|
Level 1 -
|
Inputs are unadjusted, quoted prices in active markets for identical assets or liabilities at the measurement date.
|
|
Level 2 -
|
Inputs (other than quoted prices included in Level 1) are either directly or indirectly observable for the asset or liability through correlation with market data at the measurement date and for the duration of the asset’s or liability’s anticipated life.
|
|
Level 3 -
|
Inputs are unobservable and reflect management’s best estimate of what market participants would use in pricing the asset or liability at the measurement date. Consideration is given to the risk inherent in the valuation technique and the risk inherent in the inputs in determining the estimate.
|
Further information on fair value measurements is available in Note 4.
|
(v)
|
Income taxes
|
Brookfield Business Partners L.P. is a flow-through entity for tax purposes and as such is not subject to Bermudian taxation. However, income taxes are recognized for the amount of taxes payable by the holding entities, and any direct or indirect corporate subsidiaries of such holding entities. Income tax expense represents the sum of the tax accrued in the period and deferred income tax.
The separate returns method was used to determine taxes for periods prior to June 20, 2016.
(i) Current income tax
Current income tax assets and liabilities are measured at the amount expected to be paid to tax authorities, net of recoveries based on the tax rates and laws enacted or substantively enacted at the reporting date.
(ii) Deferred income tax
Deferred income tax liabilities are provided for using the liability method on temporary differences between the tax bases used in the computation of taxable income and carrying amounts of assets and liabilities in the consolidated financial statements. Deferred income tax assets are recognized for all deductible temporary differences, carry forward of unused tax credits and unused tax losses, to the extent that it is probable that deductions, tax credits and tax losses can be utilized. Such deferred income tax assets and liabilities are not recognized if the temporary difference arises from goodwill or from the initial recognition of other assets and liabilities in a transaction that affects neither the taxable income nor the accounting income, other than in a business combination. The carrying amount of deferred income tax assets are reviewed at each reporting date and reduced to the extent it is no longer probable that the income tax asset will be recovered.
Deferred income tax liabilities are recognized for taxable temporary differences associated with investments in subsidiaries and equity accounted investments, and interests in joint ventures, except where the partnership is able to control the reversal of the temporary difference and it is probable that the temporary differences will not reverse in the foreseeable future. Deferred income tax assets arising from deductible temporary differences associated with such investments and interests are only recognized to the extent that it is probable that there will be sufficient taxable income against which to utilize the benefits of the temporary differences and they are expected to reverse in the foreseeable future.
Deferred income tax assets and liabilities are measured at the tax rates that are expected to apply in the period in which the liability is settled or the asset realized, based on tax rates and tax laws that have been enacted or substantively enacted by the end of the reporting period. The measurement of deferred income tax liabilities and assets reflect the tax consequences that would follow from the manner in which the partnership expects, at the end of the reporting period, to recover or settle the carrying amount of its assets and liabilities.
|
F-26
|
Brookfield Business Partners
|
BROOKFIELD BUSINESS PARTNERS L.P.
NOTES TO CONSOLIDATED FINANCIAL STATEMENTS (Continued)
As at December 31, 2017 and 2016 and for the years ended December 31, 2017, 2016 and 2015
Deferred income tax assets and liabilities are offset when there is a legally enforceable right to set off current tax assets against current tax liabilities and when they relate to income taxes levied by the same taxation authority within a single taxable entity or the partnership intends to settle its current tax assets and liabilities on a net basis in the case where there exist different taxable entities in the same taxation authority and when there is a legally enforceable right to set off current tax assets against current tax liabilities.
|
(w)
|
Provisions
|
Provisions are recognized when the partnership has a present obligation either legal or constructive as a result of a past event, it is probable that the partnership will be required to settle the obligation, and a reliable estimate can be made of the amount of the obligation.
The amount recognized as a provision is the best estimate of the consideration required to settle the present obligation at the end of the reporting period, taking into account the risks and uncertainties surrounding the obligation. Where a provision is measured using the cash flows estimated to settle the obligation, its carrying amount is the present value of those cash flows.
When some or all of the economic benefits required to settle a provision are expected to be recovered from a third party, the receivable is recognized as an asset if it is virtually certain that reimbursement will be received and the amount of the receivable can be measured reliably.
(i) Provisions for defects
Provisions made for defects are based on a standard percentage charge of the aggregate contract value of completed construction projects and represents a provision for potential latent defects that generally manifest over a period of time following practical completion.
Claims against the partnership are also recorded as part of provisions for defects when it is probable that the partnership will be required to settle the obligation and a reliable estimate can be made of the amount of the obligation.
(ii) Decommissioning liability
Certain of the partnership’s subsidiaries are engaged in oil and gas and mining activities. For these businesses, there are typically decommissioning liabilities related to the requirement to remediate the property where operations are conducted.
The partnership recognizes a decommissioning liability in the period in which it has a present legal or constructive liability and a reasonable estimate of the amount can be made. Liabilities are measured based on current requirements, technology and price levels and the present value is calculated using amounts discounted over the useful economic lives of the assets. Amounts are discounted using a rate that reflects the risks specific to the liability. On a periodic basis, management reviews these estimates and changes, if any, will be applied prospectively. The fair value of the estimated decommissioning liability is recorded as a long term liability, with a corresponding increase in the carrying amount of the related asset. The capitalized amount is depleted on a unit-of-production basis over the life of the proved plus probable reserves. The liability amount is increased in each reporting period due to the passage of time, and the amount of accretion is charged to finance expense in the period. Periodic revisions to the estimated timing of cash flows, to the original estimated undiscounted cost and to changes in the discount rate can also result in an increase or decrease to the decommissioning liability. Actual costs incurred upon settlement of the obligation are recorded against the decommissioning liability to the extent of the liability recorded.
|
(x)
|
Pensions and other post-employment benefits
|
Certain of the partnership’s subsidiaries offer post-employment benefits to its employees by way of a defined contribution plan. Payments to defined contribution pension plans are expensed as they fall due.
|
F-27
|
Brookfield Business Partners
|
BROOKFIELD BUSINESS PARTNERS L.P.
NOTES TO CONSOLIDATED FINANCIAL STATEMENTS (Continued)
As at December 31, 2017 and 2016 and for the years ended December 31, 2017, 2016 and 2015
Certain of the partnership’s subsidiaries offer defined benefit plans. Defined benefit pension expense, which includes the current year’s service cost, is included in Direct operating costs within the consolidated statements of operating results. For each defined benefit plan, we recognize the present value of our defined benefit obligations less the fair value of the plan assets, as a defined benefit asset or liability reported as other assets or accounts payable and other in our consolidated statements of financial position. The partnership’s obligations under its defined benefit pension plans are determined periodically through the preparation of actuarial valuations.
The cost of pensions and other retirement benefits earned by employees is actuarially determined using the projected unit credit method (also known as the projected benefit method pro-rated on service) and management’s best estimate of plan investment performance, salary escalation, retirement ages of employees and their expected future longevity.
For the purposes of calculating the expected return on plan assets, those assets are valued at fair value.
The partnership recognizes actuarial gains and losses in other comprehensive income (loss) in the period in which those gains and losses occur.
|
(y)
|
Assets held for sale
|
Non-current assets and disposal groups are classified as held for sale if their carrying amount will be recovered principally through a sale transaction rather than through continuing use. This condition is regarded as met only when the sale is highly probable and the non-current asset or disposal group is available for immediate sale in its present condition. Management must be committed to the sale, which should be expected to qualify for recognition as a completed sale within one year from the date of classification subject to limited exceptions.
Non-current assets and disposal groups classified as held for sale are measured at the lower of their previous carrying amount and fair value less costs to sell and are classified as current. Once classified as held for sale, property, plant and equipment and intangible assets, are not depreciated or amortized, respectively.
|
(z)
|
Critical accounting judgments and key sources of estimation uncertainty
|
The preparation of financial statements requires management to make critical judgments, estimates and assumptions that affect the reported amounts of assets and liabilities and disclosure of contingent assets and liabilities at the date of the financial statements and the reported amounts of revenues and expenses that are not readily apparent from other sources, during the reporting period. These estimates and associated assumptions are based on historical experience and other factors that are considered to be relevant. Actual results may differ from these estimates.
The estimates and underlying assumptions are reviewed on an ongoing basis. Revisions to accounting estimates are recognized in the period in which the estimate is revised if the revision affects only that period, or in the period of the revision and future periods if the revision affects both current and future periods.
Critical judgments made by management and utilized in the normal course of preparing the partnership’s consolidated financial statements are outlined below.
(i) Business Combinations
The partnership accounts for business combinations using the acquisition method of accounting. The allocation of fair values to assets acquired and liabilities assumed through an acquisition requires numerous estimates that affect the valuation of certain assets and liabilities acquired including discount rates, operating costs, revenue estimates, commodity prices, future capital costs and other factors. The determination of the fair values may remain provisional for up to 12 months from the date of acquisition due to the time required to obtain independent valuations of individual assets and to complete assessments of provisions. When the accounting for a business combination has not been completed as of the reporting date, this is disclosed in the financial statements, including observations on the estimates and judgments made as of the reporting date.
|
F-28
|
Brookfield Business Partners
|
BROOKFIELD BUSINESS PARTNERS L.P.
NOTES TO CONSOLIDATED FINANCIAL STATEMENTS (Continued)
As at December 31, 2017 and 2016 and for the years ended December 31, 2017, 2016 and 2015
(ii) Determination of Control
We consolidate an investee when we control the investee, with control existing if and only if we have power over the investee; exposure, or rights, to variable returns from our involvement with the investee; and the ability to use our power over the investee to affect the amount of the partnership’s returns.
In determining if we have power over an investee, we make judgments when identifying which activities of the investee are relevant in significantly affecting returns of the investee and the extent of our existing rights that give us the current ability to direct the relevant activities of the investee. We also make judgments as to the amount of potential voting rights which provides us voting powers, the existence of contractual relationships that provide us voting power and the ability to appoint directors. We enter into voting agreements to provide the partnership with the ability to contractually direct the relevant activities of the investee (formally referred to as ‘‘power’’ within IFRS 10, Consolidated Financial Statements). In assessing if we have exposure, or rights, to variable returns from our involvement with the investee we make judgments concerning whether returns from an investee are variable and how variable those returns are on the basis of the substance of the arrangement, the size of those returns and the size of those returns relative to others, particularly in circumstances where our voting interest differs from our ownership interest in an investee. In determining if we have the ability to use our power over the investee to affect the amount of our returns we make judgments when we are an investor as to whether we are a principal or agent and whether another entity with decision- making rights is acting as an agent for us. If we determine that we are acting as an agent, as opposed to a principal, we do not control the investee.
(iii) Common Control Transactions
IFRS 3, Business Combinations (‘‘IFRS 3’’) does not include specific measurement guidance for transfers of businesses or subsidiaries between entities under common control. Accordingly, the partnership has developed an accounting policy to account for such transactions taking into consideration other guidance in the IFRS framework and pronouncements of other standard-setting bodies. The partnership’s policy is to record assets and liabilities recognized as a result of transactions between entities under common control at the carrying values in the transferor’s financial statements.
(iv) Indicators of Impairment
Judgment is applied when determining whether indicators of impairment exist when assessing the carrying values of the partnership’s assets, including: the determination of the partnership’s ability to hold financial assets; the estimation of a cash generating unit’s future revenues and direct costs; and the determination of discount rates, and when an asset’s carrying value is above the value derived using publicly traded prices which are quoted in a liquid market.
For some of our assets forecasting the recoverability and economic viability of property and equipment requires an estimate of reserves. The process for estimating reserves is complex and requires significant interpretation and judgment. It is affected by economic conditions, production, operating and development activities, and is performed using available geological, geophysical, engineering and economic data.
(v) Revenue Recognition
Certain of the partnership’s subsidiaries use the percentage-of-completion method to account for their contract revenue. The stage of completion is measured by reference to actual costs incurred to date as a percentage of estimated total costs for each contract. Significant assumptions are required to estimate the total contract costs and the recoverable variation works that affect the stage of completion and the contract revenue respectively. In making these estimates, management has relied on past experience or where necessary, the work of experts.
(vi) Financial Instruments
Judgments inherent in accounting policies relating to derivative financial instruments relate to applying the criteria to the assessment of the effectiveness of hedging relationships. Estimates and assumptions used in determining the fair value of financial instruments are: equity and commodity prices; future interest rates; the credit worthiness of the partnership relative to its counterparties; the credit risk of the partnership’s counterparties; estimated future cash flows; discount rates and volatility utilized in option valuations.
|
F-29
|
Brookfield Business Partners
|
BROOKFIELD BUSINESS PARTNERS L.P.
NOTES TO CONSOLIDATED FINANCIAL STATEMENTS (Continued)
As at December 31, 2017 and 2016 and for the years ended December 31, 2017, 2016 and 2015
(vii) Decommissioning Liabilities
Decommissioning costs will be incurred at the end of the operating life of some of our oil and gas facilities and mining properties. These obligations are typically many years in the future and require judgment to estimate. The estimate of decommissioning costs can vary in response to many factors including changes in relevant legal regulatory, and environmental requirements, the emergence of new restoration techniques or experience at other production sites. Inherent in the calculations of these costs are assumptions and estimates including the ultimate settlement amounts, inflation factors, discount rates, and timing of settlements.
(viii) Oil and Gas Properties
The process of estimating the partnership’s proved and probable oil and gas reserves requires significant judgment and estimates. Factors such as the availability of geological and engineering data, reservoir performance data, acquisition and divestment activity, drilling of new wells, development costs and commodity prices all impact the determination of the partnership’s estimates of its oil and gas reserves. Future development costs are based on estimated proved and probable reserves and include estimates for the cost of drilling, completing and tie in of the proved undeveloped and probable additional reserves and may vary based on geography, geology, depth, and complexity. Any changes in these estimates are accounted for on a prospective basis. Oil and natural gas reserves also have a direct impact on the assessment of the recoverability of asset carrying values reported in the financial statements.
(ix) Other
Other estimates and assumptions utilized in the preparation of the partnership’s financial statements are: the assessment or determination of recoverable amounts; depreciation and amortization rates and useful lives; estimation of recoverable amounts of cash-generating units for impairment assessments of goodwill and intangible assets; and ability to utilize tax losses and other tax measurements.
Other critical judgments include the determination of functional currency.
|
(aa)
|
Earnings (loss) per Limited Partnership Unit
|
The partnership calculates basic earnings (loss) per unit by dividing net income attributable to limited partners by the weighted average number of limited partnership units outstanding during the period. For the purpose of calculating diluted earnings (loss) per unit, the partnership adjusts net income (loss) attributable to limited partners, and the weighted average number of limited partnership units outstanding, for the effects of all dilutive potential limited partnership units.
|
(ab)
|
Leases
|
Leases are classified as finance leases when the terms of the lease transfer substantially all the risks and rewards incidental to ownership of the lease to the lessee. All other leases are classified as operating leases.
Assets held under finance leases are initially recognized at their fair value or, if lower, at amounts equal to the present value of the minimum lease payments, each determined at the inception of the lease. The corresponding liability to the lessor is included in the consolidated statements of financial position as a finance lease obligation within accounts payable and other.
Lease payments are apportioned between finance charges and reduction of the lease obligation so as to achieve a constant rate of interest on the remaining balance of the liability. Finance charges are charged directly against income.
Finance lease assets are amortized on a straight line basis over the estimated useful life of the asset.
|
F-30
|
Brookfield Business Partners
|
BROOKFIELD BUSINESS PARTNERS L.P.
NOTES TO CONSOLIDATED FINANCIAL STATEMENTS (Continued)
As at December 31, 2017 and 2016 and for the years ended December 31, 2017, 2016 and 2015
|
(ac)
|
Segments
|
Our operating segments are components of the business for which discrete financial information is reviewed regularly by our Chief Operating Decision Maker (the "CODM") to assess performance and make decisions regarding resource allocation. We have assessed our CODM to be our Chief Executive Officer and Chief Financial Officer. Our operating segments are Construction Services, Business Services, Energy, Industrial Operations and Corporate and Other.
|
(ad)
|
Future Changes in Accounting Policies
|
(i) Revenue from Contracts with Customers
IFRS 15, Revenue from Contracts with Customers ("IFRS 15") specifies how and when revenue should be recognized as well as requiring additional disclosures. IFRS 15 requires disclosure regarding the nature, amount, timing and uncertainty of revenue and cash flows arising from customer contracts. IFRS 15 supersedes IAS 18, Revenue, IAS 11, Construction Contracts and a number of revenue-related interpretations. IFRS 15 applies to nearly all contracts with customers: the main exceptions are leases, financial instruments and insurance contracts. IFRS 15 must be applied for periods beginning on or after January 1, 2018 with early application permitted.
The partnership will adopt the standard using the modified retrospective approach, in which a cumulative catch-up adjustment is recorded through opening retained earnings as of January 1, 2018 as if the standard had always been in effect and whereby comparative periods are not restated. The partnership has substantially completed the impact assessment across its group of companies and expects a reduction in opening retained earnings of approximatively $250 million, net of taxes, mainly from the Construction Services business. Revenue from the partnership’s construction services contracts will continue to be recognized over time; however, IFRS 15 requires a higher threshold of probability to be achieved prior to recognizing revenue from variable consideration such as incentives and claims and variations resulting from contract modifications. Revenue is currently recognized when it is probable that work performed will result in revenue whereas under the new standard, revenue is recognized when it is highly probable that a significant reversal of revenue will not occur for these modifications. Significant judgments and estimates are used in determining the impact, such as the assessment of the probability of customer approval of variations and acceptance of claims and estimation of project completion dates. Our implementation project is ongoing as we finalize our technical analysis and quantitative assessment and therefore all impacts are current estimates which are subject to finalization.
(ii) Financial Instruments
In July 2014, the IASB issued the final publication of IFRS 9,
Financial Instruments
("IFRS 9") superseding the current IAS 39,
Financial Instruments: Recognition and Measurement
. IFRS 9 establishes principles for the financial reporting of financial assets and financial liabilities that will present relevant and useful information to users of financial statements for their assessment of the amounts, timing and uncertainty of an entity's future cash flows. This new standard also includes a new general hedge accounting standard which will align hedge accounting more closely with an entity's risk management activities. It does not fully change the types of hedging relationships or the requirement to measure and recognize ineffectiveness, however, it will provide more hedging strategies that are used for risk management to qualify for hedge accounting and introduce greater judgment to assess the effectiveness of a hedging relationship. IFRS 9 has a mandatory effective date for annual periods beginning on or after January 1, 2018 with early adoption permitted. The partnership has developed a detailed transition plan to implement IFRS 9. The partnership has substantially completed the impact assessment across its group of companies and expects no material adjustment upon adoption.
Our implementation project is ongoing as we finalize our technical analysis and quantitative assessment and therefore all impacts are current estimates which are subject to finalization.
(iii) Leases
IFRS 16,
Leases
, (‘‘IFRS 16’’) provides a single lessee accounting model, requiring recognition of assets and liabilities for all leases, unless the lease term is shorter than 12 months or the underlying asset has a low value. IFRS 16 supersedes IAS 17,
Leases,
and its related interpretative guidance. IFRS 16 must be applied for periods beginning on or after January 1, 2019 with early adoption permitted if IFRS 15 has also been adopted. The partnership is currently evaluating the impact of IFRS 16 on its financial statements.
|
F-31
|
Brookfield Business Partners
|
BROOKFIELD BUSINESS PARTNERS L.P.
NOTES TO CONSOLIDATED FINANCIAL STATEMENTS (Continued)
As at December 31, 2017 and 2016 and for the years ended December 31, 2017, 2016 and 2015
(iv) IFRIC 22 Foreign Currency Transactions (“IFRIC 22”)
In December 2016, the IASB issued IFRIC 22, effective for annual periods beginning on or after January 1, 2018. The interpretation clarifies that the date of the transaction for the purpose of determining the exchange rate to use on initial recognition of the related asset, expense or income (or part of it) is the date on which an entity initially recognizes the non-monetary asset or non-monetary liability arising from the payment or receipt of advance consideration. The Interpretation may be applied either retrospectively or prospectively. The partnership has evaluated the impact of IFRIC 22 on its consolidated financial statements and the impact will not be significant.
(v) IFRIC 23 Uncertainty over Income Tax Treatments (“IFRIC 23”)
In June 2017, the IASB published IFRIC 23, effective for annual periods beginning on or after January 1, 2019. The interpretation requires an entity to assess whether it is probable that a tax authority will accept an uncertain tax treatment used, or proposed to be used, by an entity in its income tax filings and to exercise judgment in determining whether each tax treatment should be considered independently or whether some tax treatments should be considered together. The decision should be based on which approach provides better predictions of the resolution of the uncertainty. An entity also has to consider whether it is probable that the relevant authority will accept each tax treatment, or group of tax treatments, assuming that the taxation authority with the right to examine any amounts reported to it will examine those amounts and will have full knowledge of all relevant information when doing so. The interpretation may be applied on either a fully retrospective basis or a modified retrospective basis without restatement of comparative information. The partnership is currently evaluating the impact of IFRIC 23 on its consolidated financial statements.
|
(ae)
|
New Accounting Policies Adopted
|
(i) Income taxes
In January 2016, the IASB issued certain amendments to IAS 12,
Income Taxes
, to clarify the accounting for deferred tax assets for unrealized losses on debt instruments measured at fair value. A deductible temporary difference arises when the carrying amount of the debt instrument measured at fair value is less than the cost for tax purposes, irrespective of whether the debt instrument is held for sale or held to maturity. The recognition of the deferred tax asset that arises from this deductible temporary difference is considered in combination with other deferred taxes applying local tax law restrictions where applicable. In addition, when estimating future taxable profits, consideration can be given to recovering more than the asset’s carrying amount where probable. These amendments are effective for periods beginning on or after January 1, 2017. These amendments did not have a significant impact on the financial statements.
(ii) Disclosures-Statement of cash flows
In January 2016, the IASB issued the amendments to IAS 7,
Statement of Cash Flows
, effective for annual periods beginning January 1, 2017. The IASB requires that the following changes in liabilities arising from financing activities are disclosed (to the extent necessary): (i) changes from financing cash flows; (ii) changes arising from obtaining or losing control of subsidiaries or other businesses; (iii) the effect of changes in foreign exchange rates; (iv) changes in fair values; and (v) other changes. These amendments have been applied and disclosed in Note 28 of the financial statements, with no comparatives required.
When determining the basis of accounting for the partnership’s investees, the partnership evaluates the degree of influence that the partnership exerts directly or through an arrangement over the investees' relevant activities. Control is obtained when the partnership has power over the acquired entities and an ability to use its power to affect the returns of these entities.
The partnership accounts for business combinations using the acquisition method of accounting, pursuant to which the cost of acquiring a business is allocated to its identifiable tangible and intangible assets and liabilities on the basis of the estimated fair values at the date of acquisition.
|
F-32
|
Brookfield Business Partners
|
BROOKFIELD BUSINESS PARTNERS L.P.
NOTES TO CONSOLIDATED FINANCIAL STATEMENTS (Continued)
As at December 31, 2017 and 2016 and for the years ended December 31, 2017, 2016 and 2015
(a)
Acquisitions completed in 2017
The following summarizes the consideration transferred, assets acquired and liabilities assumed at the applicable acquisition dates:
|
(US$ MILLIONS)
|
Business Services
(1)
|
Industrial Operations
(1)
|
Energy
(1)
|
||||||||
|
Cash
|
$
|
198
|
|
$
|
383
|
|
$
|
12
|
|
||
|
Contingent consideration
|
13
|
|
—
|
|
—
|
|
|||||
|
Total Consideration
(2)
|
$
|
211
|
|
$
|
383
|
|
$
|
12
|
|
||
|
(US$ MILLIONS)
|
|||||||||||
|
Cash and cash equivalents
|
$
|
39
|
|
$
|
296
|
|
$
|
—
|
|
||
|
Accounts receivable and other
|
1,248
|
|
978
|
|
—
|
|
|||||
|
Inventory
|
690
|
|
10
|
|
—
|
|
|||||
|
Equity accounted investments
|
122
|
|
109
|
|
—
|
|
|||||
|
Property, plant and equipment
|
264
|
|
200
|
|
39
|
|
|||||
|
Intangible assets
|
403
|
|
2,467
|
|
—
|
|
|||||
|
Goodwill
|
325
|
|
17
|
|
—
|
|
|||||
|
Deferred income tax assets
|
9
|
|
50
|
|
—
|
|
|||||
|
Financial assets
|
106
|
|
—
|
|
—
|
|
|||||
|
Other assets
|
—
|
|
65
|
|
—
|
|
|||||
|
Acquisition gain
|
—
|
|
—
|
|
(7
|
)
|
|||||
|
Accounts payable and other
|
(1,885
|
)
|
(227
|
)
|
—
|
|
|||||
|
Borrowings
|
(210
|
)
|
(1,468
|
)
|
—
|
|
|||||
|
Deferred income tax liabilities
|
(58
|
)
|
(746
|
)
|
(2
|
)
|
|||||
|
Net assets acquired before non-controlling interest
|
1,053
|
|
1,751
|
|
30
|
|
|||||
|
Non-controlling interest
(3) (4)
|
(842
|
)
|
(1,368
|
)
|
(18
|
)
|
|||||
|
Net Assets Acquired
|
$
|
211
|
|
$
|
383
|
|
$
|
12
|
|
||
________________
|
(1)
|
The initial fair values of all acquired assets, liabilities and goodwill for this acquisition have been determined on a preliminary basis at the end of the reporting period.
|
|
(2)
|
Excludes consideration attributable to non-controlling interest, which represents the interest of others in operating subsidiaries.
|
|
(3)
|
Non‑controlling interest recognized on business combinations, were measured at fair value for Business Services and Energy.
|
|
(4)
|
Non‑controlling interest recognized on business combinations, were measured at the proportionate share of fair value of the assets acquired and liabilities assumed for Industrial Operations.
|
Business Services
Fuel Holdings Limited ("Greenergy")
On May 10, 2017, the partnership acquired, together with institutional investors, an
85%
interest in Greenergy, a U.K. road fuel business. The partnership's economic interest of
14%
was acquired for consideration of
$79 million
attributable to the partnership. The partnership has an
85%
voting interest in this business, which provides us with control over the business. Accordingly, the partnership consolidates this business for financial reporting purposes.
|
F-33
|
Brookfield Business Partners
|
BROOKFIELD BUSINESS PARTNERS L.P.
NOTES TO CONSOLIDATED FINANCIAL STATEMENTS (Continued)
As at December 31, 2017 and 2016 and for the years ended December 31, 2017, 2016 and 2015
The contingent consideration contemplates potential earn outs based on reaching specific EBITDA targets over
five years
following closing, as well as achieving certain cash distribution and investment targets. Possible undiscounted earn outs payable ranges from
$6
to
$12 million
. As of the acquisition date, the partnership has recorded contingent consideration of
$11 million
.
Prior to closing the acquisition, the partnership had entered into a cash flow hedge, which generated a gain of
$12 million
, on closing. The partnership had elected to recognize and accordingly, reclassify the associated gains from other comprehensive income to include them in the initial fair value of net asset acquired.
Acquisition costs of
$7 million
were expensed at the acquisition date and recorded as other expenses on the consolidated statement of operating results. Goodwill of
$93 million
was acquired, which represents the expected growth the partnership expects to receive from the integration of the operations. Goodwill recognized is
no
t deductible for income tax purposes.
The partnership’s results from operations for the year ended
December 31, 2017
includes
$1,917 million
of revenue and
$2 million
of net income attributable to the partnership from the acquisition. If the acquisition had been effective January 1, 2017, the partnership would have recorded revenue of approximately
$2,865 million
and net income of approximately
$4 million
attributable to the partnership for the year ended
December 31, 2017
.
On October 31, 2017, the partnership, through Greenergy, completed
two
separate tuck-in acquisitions, acquiring an
85%
interest in Inver Energy, an Irish road fuel business, and an
85%
interest in Canadian Operators Petroleum, for combined consideration of
$10 million
attributable to the partnership. On acquisition, the partnership, through Greenergy, had a
14%
economic interest and an
85%
voting interest each of these businesses, which provides the partnership with control over the businesses. Accordingly, the partnership, through Greenergy, consolidates these businesses for financial reporting purposes.
Acquisition costs of less than a million were expensed at the acquisition date and recorded as other expenses on the consolidated statement of operating results. Goodwill of
$9 million
was acquired, which represents the expected growth and synergies the partnership expects to receive from the integration of the operations. Goodwill recognized is
no
t deductible for income tax purposes.
The partnership’s results from operations for the year ended December 31, 2017 includes
$17 million
of revenue and less than a million of net income attributable to the partnership from the
two
tuck-in acquisitions. If these acquisitions had been effective January 1, 2017, the partnership would have recorded revenue of approximately
$92 million
for the year ended December 31, 2017 and net income of less than a million attributable to the partnership for the year ended December 31, 2017.
Fuel Marketing
On July 17, 2017, together with institutional partners, the partnership acquired
213
retail gas stations and associated convenience kiosks ("fuel marketing business") across Canada for consideration of
$110 million
attributable to the partnership. On acquisition, the partnership had a
26%
economic interest and a
100%
voting interest in this business, which gives the partnership control over the business. Accordingly, the partnership consolidates this business for financial reporting purposes.
The gas stations will be rebranded as Mobil as part of an agreement with Imperial Oil, marking the introduction of the Mobil fuel brand into Canada. The gas stations will continue to allow customers to collect points through an existing loyalty program. An intangible asset was recognized on acquisition for the loyalty program.
Prior to the closing of the acquisition, the partnership had entered into a cash flow hedge, which generated a gain of
$3 million
on closing. The partnership elected to recognize and accordingly, reclassify the associated gains from other comprehensive income to include them in the initial fair value of net assets acquired.
Acquisition costs of
$4 million
were expensed at the acquisition date and recorded as other expenses in the consolidated statement of operating results. Goodwill of
$211 million
was acquired, which represents the expected growth and synergies the partnership expects to receive from the integration of the operations. Goodwill recognized is deductible for income tax purposes.
The partnership’s results from operations for the year ended December 31, 2017 includes
$161 million
of revenue and less than
$2 million
of net income attributable to the partnership from the acquisition. If the acquisition had been effective January 1, 2017, the partnership would have recorded revenue of approximately
$353 million
and net income of approximately
$4 million
attributable to the partnership for the year ended December 31, 2017.
|
F-34
|
Brookfield Business Partners
|
BROOKFIELD BUSINESS PARTNERS L.P.
NOTES TO CONSOLIDATED FINANCIAL STATEMENTS (Continued)
As at December 31, 2017 and 2016 and for the years ended December 31, 2017, 2016 and 2015
Other
On June 19, 2017, one of the partnership's subsidiaries acquired a real estate brokerage operation in Quebec, Canada for total consideration of approximately
$9 million
attributable to the partnership. On acquisition, the partnership had a
100%
economic interest and a
100%
voting interest in this business, which gives us control over the business. Accordingly, the partnership consolidates this business for financial reporting purposes. Acquisition costs of less than
$1 million
were expensed at the acquisition date and recorded as other expenses on the
consolidated statement of operating results.
Goodwill of
$9 million
was acquired, which represents the synergies the partnership expects to receive from the integration of the operations. Goodwill recognized is
no
t deductible for income tax purposes.
The partnership’s results from operations for the year ended December 31, 2017 includes
$2 million
of revenue and less than
$1 million
of net income attributable to the partnership from the acquisition. If the acquisition had been effective January 1, 2017, the partnership would have recorded revenue of approximately
$7 million
and net income of approximately
$1 million
attributable to the partnership for the year ended
December 31, 2017
.
Industrial Operations
BRK Ambiental
On April 25, 2017, the partnership acquired, together with institutional investors, a
70%
interest in BRK Ambiental, a wastewater and industrial water treatment business in Brazil, which had a
12.5%
voting interest in BRK Ambiental - Ativos Maduros S.A. (“OAMA”), an industrial water treatment business. OAMA is accounted for by BRK Ambiental using the equity method. Subsequently, on May 30, 2017, the partnership acquired, together with institutional investors, the remaining
87.5%
voting interest in OAMA and began consolidating the businesses. On acquisition of BRK Ambiental, its
12.5%
voting interest in OAMA was re-measured at fair value as part of the purchase price allocation. Given the brief duration of time between the two closing dates,
no
remeasurement gain or loss was recognized.
On acquisition of the businesses, the partnership had approximately a
27%
economic interest, which combined with our voting interest, provides us with control over both BRK Ambiental and OAMA. Accordingly, the partnership consolidates the businesses for financial statement purposes. As at December 31, 2017, the partnership holds
$35 million
of the consideration in escrow, which will be released to the seller over the next
five years
on each anniversary date of closing. Acquisition costs of
$11 million
were expensed at the acquisition dates and recorded as other expenses on the consolidated statement of operating results. Goodwill of approximately
$17 million
was acquired, which represents the expected growth that the partnership expects to receive from the integration of the operations. Goodwill recognized is
no
t deductible for income tax purposes.
The partnership’s results from the combined operations for the year ended
December 31, 2017
, includes
$132 million
of revenue and
$5 million
of net income attributable to the partnership from the acquisition. If the acquisition had been effective January 1, 2017, the partnership would have recorded revenue of approximately
$199 million
for the year ended
December 31, 2017
and net income of approximately
$17 million
attributable to the partnership for the year ended December 31, 2017.
Energy
On November 5, 2017, one of the partnership's subsidiaries acquired a bundle of service and swabbing rig assets in Alberta, Canada for total consideration of approximately
$12 million
attributable to the partnership. On acquisition, the partnership had a
40%
economic interest and a
73%
voting interest in this business, which give us control over the business. Accordingly, the partnership consolidates this business for financial reporting purposes. Acquisition costs of a million were expensed at the acquisition date and recorded as other expenses on the consolidated statement of operating results. A bargain purchase gain of
$7 million
was recognized as the seller was motivated to exit the Canadian market.
The partnership’s results from operations for the year ended December 31, 2017 includes
$3 million
of revenue and
$1 million
of net income attributable to the partnership from the acquisition. If the acquisition had been effective January 1, 2017, the partnership would have recorded revenue of approximately
$13 million
for the year ended December 31, 2017 and net income of approximately
$2 million
attributable to the partnership for the year ended December 31, 2017.
|
F-35
|
Brookfield Business Partners
|
BROOKFIELD BUSINESS PARTNERS L.P.
NOTES TO CONSOLIDATED FINANCIAL STATEMENTS (Continued)
As at December 31, 2017 and 2016 and for the years ended December 31, 2017, 2016 and 2015
|
(b)
|
Acquisitions completed in 2016
|
The following summarizes the consideration transferred, assets acquired and liabilities assumed at the applicable acquisition date:
|
(US$ MILLIONS)
|
Business Services
|
||
|
Total Consideration
|
$
|
19
|
|
|
(US$ MILLIONS)
|
|||
|
Net working capital
|
$
|
1
|
|
|
Intangible assets
|
36
|
|
|
|
Goodwill
|
39
|
|
|
|
Net assets acquired before non-controlling interest
|
76
|
|
|
|
Non-controlling interest
(1)
|
(57
|
)
|
|
|
Net Assets Acquired
|
$
|
19
|
|
______________
(1)
Non‑controlling interests recognized on business combinations were measured at fair value.
Business Services - Facilities Management
On August 1, 2016, the partnership acquired, together with institutional investors, an
85%
interest in a data center facility management services provider in the United States for consideration of
$9 million
attributable to the partnership. On acquisition, the partnership had a
24%
economic interest and an
85%
voting interest in this business, which provides us with control over the business. Accordingly, we consolidate this business for financial reporting purposes. Acquisition costs of less than
$1 million
were expensed at the acquisition date and recorded as other expenses on the consolidated statement of operating results. Goodwill of
$22 million
was acquired, which represents the synergies we expect to receive from the integration of the operations. Goodwill recognized is
no
t deductible for income tax purposes.
The partnership’s results from operations for the year ended December 31, 2016, includes
$27 million
of revenue and $
2 million
of net income attributable to the partnership from the acquisition. If the acquisition had been effective January 1, 2016, the partnership's revenue would have increased by approximately
$37 million
and net income would have increased by less than
$1 million
attributable to the partnership for the year ended December 31, 2016.
On December 31, 2016, we acquired, in partnership with institutional investors, a
100%
interest in a Canadian real estate facility management business for consideration of
$10 million
attributable to the partnership. On acquisition, we had a
26%
economic interest and a
100%
voting interest in this business, which provides us with control over the business. Accordingly, we consolidate this business for financial reporting purposes. Acquisition costs of less than
$1 million
were expensed at the acquisition date and recorded as other expenses in the consolidated statements of operating results. Goodwill of
$17 million
was recognized, which represents the synergies we expect to receive from the integration of the operations. Goodwill recognized is
no
t deductible for income tax purposes.
Our partnership’s results from operations for the year ended December 31, 2016, does not include any revenue or net income attributable to the partnership from the acquisition as the acquisition closed on December 30, 2016. If the acquisition had been effective January 1, 2016, the pro forma revenue of our partnership would have increased by
$233 million
for the year ended December 31, 2016 and pro forma net income would have increased by
$8 million
attributable to the partnership for the year ended December 31, 2016.
|
F-36
|
Brookfield Business Partners
|
BROOKFIELD BUSINESS PARTNERS L.P.
NOTES TO CONSOLIDATED FINANCIAL STATEMENTS (Continued)
As at December 31, 2017 and 2016 and for the years ended December 31, 2017, 2016 and 2015
The fair value of a financial instrument is the price that would be received to sell an asset or paid to transfer a liability in an orderly transaction between market participants at the measurement date. Fair values are determined by reference to quoted bid or ask prices, as appropriate. Where bid and ask prices are unavailable, the closing price of the most recent transaction of that instrument is used. In the absence of an active market, fair values are determined based on prevailing market rates such as bid and ask prices, as appropriate for instruments with similar characteristics and risk profiles or internal or external valuation models, such as option pricing models and discounted cash flow analysis, using observable market inputs.
Fair values determined using valuation models require the use of assumptions concerning the amount and timing of estimated future cash flows and discount rates. In determining those assumptions, the partnership looks primarily to external readily observable market inputs such as interest rate yield curves, currency rates, and price and rate volatilities as applicable. Financial instruments classified as fair value through profit or loss are carried at fair value on the consolidated statements of financial position and changes in fair values are recognized in profit or loss.
The following table provides the details of financial instruments and their associated financial instrument classifications as at
December 31, 2017
:
|
(US$ MILLIONS)
|
FVTPL
|
Available for
sale securities
|
Loans and
Receivables/
Other Liabilities
|
Total
|
||||||||||||
|
MEASUREMENT BASIS
|
(Fair Value)
|
(Fair Value
through OCI)
|
(Amortized
Cost)
|
|
||||||||||||
|
Financial assets
|
|
|
|
|
||||||||||||
|
Cash and cash equivalents
|
$
|
—
|
|
$
|
—
|
|
$
|
1,106
|
|
$
|
1,106
|
|
||||
|
Accounts receivable, net (current and non-current)
(1)
|
50
|
|
—
|
|
4,312
|
|
4,362
|
|
||||||||
|
Other assets (current and non-current)
(2)
|
—
|
|
—
|
|
195
|
|
195
|
|
||||||||
|
Financial assets (current and non-current)
(3)
|
116
|
|
429
|
|
239
|
|
784
|
|
||||||||
|
Total
|
$
|
166
|
|
$
|
429
|
|
$
|
5,852
|
|
$
|
6,447
|
|
||||
|
Financial liabilities
|
|
|
|
|
||||||||||||
|
Accounts payable and other
(4)
|
$
|
159
|
|
—
|
|
$
|
3,766
|
|
$
|
3,925
|
|
|||||
|
Borrowings (current and non-current)
|
—
|
|
—
|
|
3,265
|
|
3,265
|
|
||||||||
|
Total
|
$
|
159
|
|
$
|
—
|
|
$
|
7,031
|
|
$
|
7,190
|
|
||||
____________________________________
|
(1)
|
Accounts receivable recognized at fair value relates to our mining business.
|
|
(2)
|
Excludes prepayments and other assets of
$314 million
.
|
|
(3)
|
Refer to Hedging Activities in note 4(a) below.
|
|
(4)
|
Excludes provisions, decommissioning liabilities, deferred revenue, work in progress, post-employment benefits and various tax and duties of
$1,713 million
.
|
Included in cash and cash equivalents as at
December 31, 2017
is
$556 million
of cash (2016:
$519 million
) and
$550 million
of cash equivalents (2016:
$531 million
) which includes
$384 million
on deposit with Brookfield (2016:
$519 million
), as described in Note 24.
The fair value of all financial assets and liabilities as at
December 31, 2017
were consistent with carrying value with the exception of the borrowings at one of our industrial operations, where fair value determined using Level 1 inputs was
$195 million
(2016:
$204 million
) versus a book value of
$227 million
(2016:
$221 million
), and the promissory note receivable from Teekay Offshore Partners L.P. ("Teekay Offshore"), where fair value was
$88 million
versus a book value of
$70 million
.
|
F-37
|
Brookfield Business Partners
|
BROOKFIELD BUSINESS PARTNERS L.P.
NOTES TO CONSOLIDATED FINANCIAL STATEMENTS (Continued)
As at December 31, 2017 and 2016 and for the years ended December 31, 2017, 2016 and 2015
The following table provides the allocation of financial instruments and their associated financial instrument classifications as at
December 31, 2016
:
|
(US$ MILLIONS)
|
FVTPL
|
Available for
sale securities
|
Loans and
Receivables/
Other Liabilities
|
Total
|
||||||||||||
|
MEASUREMENT BASIS
|
(Fair Value)
|
(Fair Value
through OCI)
|
(Amortized
Cost)
|
|
||||||||||||
|
Financial assets
|
|
|
|
|
||||||||||||
|
Cash and cash equivalents
|
$
|
—
|
|
$
|
—
|
|
$
|
1,050
|
|
$
|
1,050
|
|
||||
|
Accounts receivable, net (current and non-current)
(1)
|
42
|
|
—
|
|
1,755
|
|
1,797
|
|
||||||||
|
Other assets (current and non-current)
(2)
|
—
|
|
—
|
|
309
|
|
309
|
|
||||||||
|
Financial assets (current and non-current)
(3)
|
34
|
|
432
|
|
73
|
|
539
|
|
||||||||
|
Total
|
$
|
76
|
|
$
|
432
|
|
$
|
3,187
|
|
$
|
3,695
|
|
||||
|
Financial liabilities
|
|
|
|
|
|
|
|
|
||||||||
|
Accounts payable and other
(4)
|
$
|
32
|
|
—
|
|
$
|
2,222
|
|
$
|
2,254
|
|
|||||
|
Borrowings (current and non-current)
|
—
|
|
—
|
|
1,551
|
|
1,551
|
|
||||||||
|
Total
|
$
|
32
|
|
$
|
—
|
|
$
|
3,773
|
|
$
|
3,805
|
|
||||
____________________________________
|
(1)
|
Accounts receivable recognized at fair value relates to our mining business.
|
|
(2)
|
Excludes prepayments and other assets of
$109 million
.
|
|
(3)
|
Refer to Hedging Activities in note 4(a) below.
|
|
(4)
|
Excludes provisions and decommissioning liabilities of
$203 million
.
|
|
(a)
|
Hedging activities
|
The partnership uses foreign exchange contracts and foreign currency denominated debt instruments to manage foreign currency exposures arising from net investments in foreign operations. For the year ended
December 31, 2017
, unrealized pre-tax net losses of
$64 million
(2016: net gain of
$9 million
, 2015: net gain of
$23 million
) were recorded in other comprehensive income for the effective portion of hedges of net investments in foreign operations. As at
December 31, 2017
, there was an unrealized derivative asset balance of
$5 million
(2016:
$21 million
) and derivative liability balance of
$27 million
(2016:
$1 million
) relating to derivative contracts designated as net investment hedges.
The partnership uses commodity swap contracts to hedge the sale price of its gas contracts and foreign exchange contracts to hedge highly probable future transactions. A number of these contracts are designated as cash flow hedges. For the year ended
December 31, 2017
, unrealized pre-tax net gains of
$40 million
(2016:
$12 million
, 2015:
$nil
) were recorded in other comprehensive income for the effective portion of cash flow hedges. As at
December 31, 2017
, there was an unrealized derivative asset balance of $
29 million
(2016: $
nil
) and derivative liability balance of
$nil
(2016:
$12 million
) relating to the derivative contracts designated as cash flow hedges.
Other derivative instruments are measured at fair value, with changes in fair value recognized in the consolidated statements of operating results.
|
F-38
|
Brookfield Business Partners
|
BROOKFIELD BUSINESS PARTNERS L.P.
NOTES TO CONSOLIDATED FINANCIAL STATEMENTS (Continued)
As at December 31, 2017 and 2016 and for the years ended December 31, 2017, 2016 and 2015
|
(b)
|
Fair Value Hierarchical Levels — financial instruments
|
Level 3 assets and liabilities measured at fair value on a recurring basis include
$257 million
(2016:
$108 million
) of financial assets and
$64 million
(
December 31, 2016
:
$nil
) of financial liabilities, which are measured at fair value using valuation inputs based on management's best estimates.
There were no transfers between levels during the year ended
December 31, 2017
. The following table categorizes financial assets and liabilities, which are carried at fair value, based upon the level of input as at
December 31, 2017
and 2016:
|
|
2017
|
2016
|
||||||||||||||||||||||
|
(US$ MILLIONS)
|
Level 1
|
Level 2
|
Level 3
|
Level 1
|
Level 2
|
Level 3
|
||||||||||||||||||
|
Financial assets
|
|
|
|
|
|
|
||||||||||||||||||
|
Common shares
|
$
|
207
|
|
$
|
—
|
|
$
|
—
|
|
$
|
192
|
|
$
|
—
|
|
$
|
—
|
|
||||||
|
Corporate bonds
|
—
|
|
—
|
|
—
|
|
143
|
|
—
|
|
—
|
|
||||||||||||
|
Accounts receivable
|
—
|
|
50
|
|
—
|
|
—
|
|
42
|
|
—
|
|
||||||||||||
|
Loans and notes receivable
|
—
|
|
—
|
|
1
|
|
—
|
|
—
|
|
8
|
|
||||||||||||
|
Derivative assets
|
15
|
|
66
|
|
34
|
|
—
|
|
23
|
|
9
|
|
||||||||||||
|
Other financial assets
|
—
|
|
—
|
|
222
|
|
—
|
|
—
|
|
91
|
|
||||||||||||
|
$
|
222
|
|
$
|
116
|
|
$
|
257
|
|
$
|
335
|
|
$
|
65
|
|
$
|
108
|
|
|||||||
|
Financial liabilities
|
|
|
|
|
|
|
|
|
|
|
|
|
||||||||||||
|
Derivative liabilities
|
$
|
30
|
|
$
|
65
|
|
$
|
—
|
|
$
|
—
|
|
$
|
32
|
|
$
|
—
|
|
||||||
|
Other financial liabilities
|
—
|
|
—
|
|
64
|
|
—
|
|
—
|
|
—
|
|
||||||||||||
|
$
|
30
|
|
$
|
65
|
|
$
|
64
|
|
$
|
—
|
|
$
|
32
|
|
$
|
—
|
|
|||||||
As part of the investment in Teekay Offshore, the partnership acquired warrants that are recorded as Level 3 derivative assets. On initial recognition, the transaction price differed from the fair value of the warrants, resulting in a deferred gain of
$11 million
. The deferred gain will be recognized in the consolidated statement of operating results when the warrants are settled.
The following table summarizes the valuation techniques and key inputs used in the fair value measurement of Level 2 financial instruments:
|
(US$ MILLIONS)
Type of asset/liability
|
Carrying value
December 31, 2017 |
Valuation technique(s) and key input(s)
|
||||
|
Derivative assets
|
$
|
66
|
|
Fair value of derivative contracts incorporates quoted market prices, or in their absence internal valuation models corroborated with observable market data; and for foreign exchange and commodity derivatives, observable forward exchange rates and commodity prices, respectively, at the end of the reporting period.
|
||
|
Derivative liabilities
|
$
|
65
|
|
Fair value of derivative contracts incorporates quoted market prices, or in their absence internal valuation models corroborated with observable market data; and for foreign exchange and commodity derivatives, observable forward exchange rates and commodity prices, respectively, at the end of the reporting period.
|
||
|
Accounts receivable
|
$
|
50
|
|
Accounts receivable represents amounts due from customers for sales of metals concentrate subject to provisional pricing, which was fair valued using forward metal prices and foreign exchange rates applicable for the month of final settlement.
|
||
Fair values determined using valuation models (Level 3 financial assets and liabilities) require the use of unobservable inputs, including assumptions concerning the amount and timing of estimated future cash flows and discount rates. In determining those unobservable inputs, the partnership uses observable external market inputs such as interest rate yield curves, currency rates, and price and rate volatilities, as applicable, to develop assumptions regarding those unobservable inputs.
|
F-39
|
Brookfield Business Partners
|
BROOKFIELD BUSINESS PARTNERS L.P.
NOTES TO CONSOLIDATED FINANCIAL STATEMENTS (Continued)
As at December 31, 2017 and 2016 and for the years ended December 31, 2017, 2016 and 2015
The following table summarizes the valuation techniques and significant unobservable inputs used in the fair value measurement Level 3 financial instruments:
|
(US$ MILLIONS)
Type of asset/liability
|
Carrying value December 31,
2017 |
Valuation technique(s)
|
Significant unobservable input(s)
|
Relationship of unobservable
input(s) to fair value
|
||||||
|
Loans and notes receivables
|
$
|
1
|
|
Expected present value
|
Forecasted revenue growth
|
Increases (decreases) in revenue growth increase (decrease) fair value
|
||||
|
Derivative assets
|
$
|
34
|
|
Black-Scholes model
|
Volatility
|
Increases (decreases) in volatility increase (decrease) fair value
|
||||
|
Other financial assets - secured debentures
|
$
|
176
|
|
Discounted cash flows
|
Cash flows
|
Increases (decreases) in future cash flows increase (decrease) fair value
|
||||
|
Other financial assets - available-for-sale equity instruments
|
$
|
35
|
|
Private share trade comparables
|
Private share trades
|
Increases (decreases) in private share trade prices increase (decrease) fair value
|
||||
|
Other financial assets - available-for-sale debt instruments
|
$
|
11
|
|
Discounted cash flows
|
Cash flows
|
Increases (decreases) in future cash flows increase (decrease) fair value
|
||||
|
Other financial liabilities
|
$
|
64
|
|
Scenario-based expected present value
|
Forecasted EBITDA of acquired entities
|
Increases (decreases) in forecasted EBITDA increase (decrease) fair value
|
||||
The following table presents the change in the balance of financial assets classified as Level 3 as at
December 31, 2017
and 2016:
|
(US$ MILLIONS)
|
2017
|
2016
|
|||||
|
Balance at beginning of year
|
$
|
108
|
|
$
|
8
|
|
|
|
Fair value change recorded in net income
|
(18
|
)
|
10
|
|
|||
|
Fair value change recorded in other comprehensive income
|
11
|
|
—
|
|
|||
|
Additions
(1)
|
164
|
|
97
|
|
|||
|
Disposals
|
(8
|
)
|
(7
|
)
|
|||
|
Balance at end of period
|
$
|
257
|
|
$
|
108
|
|
|
____________________________________
|
(1)
|
In 2017,
$34 million
of the additions relate to available-for-sale equity instruments assumed on the acquisition of Greenergy,
$39 million
of the additions relate to warrants acquired by the partnership as part of its investment in Teekay Offshore, and
$91 million
relates to a secured debenture investment in a homebuilding company. In 2016,
$25 million
of the additions relate to other financial assets that were received as a result of one of the partnership’s investments emerging from bankruptcy,
$66 million
relates to a secured debenture investment in a homebuilding company and the remaining
$6 million
relates to a note receivable from the sale of certain assets.
|
|
(c)
|
Offsetting of financial assets and liabilities
|
Financial assets and liabilities are offset with the net amount reported in the consolidated statements of financial position where the partnership currently has a legally enforceable right to offset and there is an intention to settle on a net basis or realize the asset and settle the liability simultaneously. As at
December 31, 2017
,
$21 million
gross, of financial assets (
2016
:
$20 million
) and
$21 million
gross, of financial liabilities (
2016
:
$11 million
) were offset in the consolidated statements of financial position related to derivative financial instruments.
|
F-40
|
Brookfield Business Partners
|
BROOKFIELD BUSINESS PARTNERS L.P.
NOTES TO CONSOLIDATED FINANCIAL STATEMENTS (Continued)
As at December 31, 2017 and 2016 and for the years ended December 31, 2017, 2016 and 2015
|
(US$ MILLIONS)
|
2017
|
2016
|
||||||
|
Current
|
|
|
||||||
|
Marketable securities
(1)
|
$
|
207
|
|
$
|
335
|
|
||
|
Restricted cash
|
68
|
|
71
|
|
||||
|
Derivative contracts
|
75
|
|
23
|
|
||||
|
Loans and notes receivable
|
11
|
|
4
|
|
||||
|
Total current
|
$
|
361
|
|
$
|
433
|
|
||
|
Non-current
|
|
|
||||||
|
Marketable securities
(1)
|
$
|
1
|
|
$
|
—
|
|
||
|
Restricted cash
|
11
|
|
—
|
|
||||
|
Derivative contracts
|
7
|
|
9
|
|
||||
|
Loans and notes receivable
|
150
|
|
6
|
|
||||
|
Other financial assets
(2)
|
254
|
|
91
|
|
||||
|
Total non-current
|
$
|
423
|
|
$
|
106
|
|
||
____________________________________
|
(1)
|
During the year ended
December 31, 2017
the partnership recognized
$49 million
(
2016
:
$57 million
), of net gains on disposition of marketable securities.
|
|
(2)
|
Other financial assets includes secured debentures to homebuilding companies in our business services segment.
|
As part of the investment in Teekay Offshore, the partnership acquired a promissory note bearing interest at
10%
per annum. On initial recognition, the purchase price of
$69 million
differed from the fair value of
$88 million
, resulting in a deferred gain of
$19 million
. The deferred gain will be recognized in the consolidated statements of operating results from acquisition to maturity of the promissory note based on the effective interest rate method.
|
(US$ MILLIONS)
|
2017
|
2016
|
||||||
|
Current, net
|
$
|
3,454
|
|
$
|
1,703
|
|
||
|
Non-current, net
|
||||||||
|
Retainer on customer contracts
|
197
|
|
94
|
|
||||
|
Billing rights
|
711
|
|
—
|
|
||||
|
Total Non-current, net
|
$
|
908
|
|
$
|
94
|
|
||
|
Total
|
$
|
4,362
|
|
$
|
1,797
|
|
||
The
increase
in accounts and other receivable, net from
December 31, 2016
is primarily attributable to the acquisitions in our business services and industrial operations segments during the year ended
December 31, 2017
. This accounts for a
$2,056 million
movement in accounts receivable as at
December 31, 2017
compared to
December 31, 2016
.
Billing rights represent unbilled rights arising at BRK Ambiental from revenue earned from the construction on public concessions contracts classified as financial assets, which are recognized when there is an unconditional right to receive cash or other financial asset from the concession authority for the construction services.
Our construction services business has a retention balance, which is comprised of amounts that have been earned but held back until the satisfaction of certain conditions specified in the contract are met. The retention balance included in the current accounts receivable balance as at
December 31, 2017
was
$125 million
(2016:
$97 million
), and the retention balance included in the non-current accounts receivable balance as at
December 31, 2017
was
$111 million
(2016:
$92 million
).
|
F-41
|
Brookfield Business Partners
|
BROOKFIELD BUSINESS PARTNERS L.P.
NOTES TO CONSOLIDATED FINANCIAL STATEMENTS (Continued)
As at December 31, 2017 and 2016 and for the years ended December 31, 2017, 2016 and 2015
The amount of accounts receivable and other written down for bad debts was as follows:
|
(US$ MILLIONS)
|
2017
|
2016
|
2015
|
|||||||||
|
Allowance for doubtful accounts - beginning
|
$
|
7
|
|
$
|
10
|
|
9
|
|
||||
|
Add: increase in allowance
|
39
|
|
2
|
|
6
|
|
||||||
|
Deduct: bad debt write offs
|
(6
|
)
|
(5
|
)
|
(5
|
)
|
||||||
|
Allowance for doubtful accounts - ending
|
$
|
40
|
|
$
|
7
|
|
$
|
10
|
|
|||
The increase in allowance for doubtful accounts is primarily attributable to the acquisition of BRK Ambiental during the year ended
December 31, 2017
.
|
(US$ MILLIONS)
|
2017
|
2016
|
||||||
|
Current
|
||||||||
|
Raw materials and consumables
|
$
|
138
|
|
$
|
75
|
|
||
|
Fuel products
(3)
|
612
|
|
—
|
|
||||
|
Work in progress
|
94
|
|
59
|
|
||||
|
RTFO certificates
(1)
|
193
|
|
—
|
|
||||
|
Finished goods other
(2)
|
31
|
|
95
|
|
||||
|
Carrying amount of inventories
|
$
|
1,068
|
|
$
|
229
|
|
||
____________________________________
|
(1)
|
$60 million
of RTFO certificates are held for trading and recorded at fair value. There is no externally quoted marketplace for the valuation of RTFO certificates. In order to value these contracts, the partnership has adopted a pricing methodology combining both observable inputs based on market data and assumptions developed internally based on observable market activity.
|
|
(2)
|
Finished goods other inventory is mainly composed of properties acquired in our real estate services business as well as some finished goods inventory in the industrials segment.
|
|
(3)
|
Fuel products are traded in active markets and are purchased with a view to resale in the near future. As a result, stocks of fuel products are recorded at fair value based on quoted market prices.
|
The
increase
in inventory from
December 31, 2016
is primarily attributable to the acquisitions in our business services segment, which accounts for
$804 million
of the increase in inventory as at
December 31, 2017
compared to
December 31, 2016
.
Inventories recognized as cost of sales during the year ended
December 31, 2017
amounted to
$12,701 million
(
2016
:
$1,017 million
). The amount of inventory written down was as follows:
|
(US$ MILLIONS)
|
2017
|
2016
|
2015
|
|||||||||
|
Inventory obsolescence provision - balance at beginning of year
|
$
|
9
|
|
$
|
14
|
|
14
|
|
||||
|
Increase (decrease) in provision due to inventory obsolescence
|
(5
|
)
|
(5
|
)
|
—
|
|
||||||
|
Inventory obsolescence provision - balance at end of year
|
$
|
4
|
|
$
|
9
|
|
$
|
14
|
|
|||
|
F-42
|
Brookfield Business Partners
|
BROOKFIELD BUSINESS PARTNERS L.P.
NOTES TO CONSOLIDATED FINANCIAL STATEMENTS (Continued)
As at December 31, 2017 and 2016 and for the years ended December 31, 2017, 2016 and 2015
|
(US$ MILLIONS)
|
2017
|
2016
|
||||||
|
Cash and cash equivalents
|
$
|
—
|
|
$
|
8
|
|
||
|
Accounts and other receivable, net
|
—
|
|
56
|
|
||||
|
Inventory
|
—
|
|
75
|
|
||||
|
Property, plant and equipment
|
14
|
|
58
|
|
||||
|
Intangible assets and goodwill
|
—
|
|
67
|
|
||||
|
Assets held for sale
|
$
|
14
|
|
$
|
264
|
|
||
|
Accounts payable and other
|
$
|
—
|
|
$
|
66
|
|
||
|
Liabilities classified as held for sale
|
$
|
—
|
|
$
|
66
|
|
||
Industrial Operations - Graphite electrode manufacturing business
During the year ended
December 31, 2017
, our graphite electrode manufacturing business within our industrial operations segment recorded a
$8 million
charge to align the carrying value of the assets to estimated fair value. In July 2017, the assets were sold for proceeds consistent with the estimated fair value of
$28 million
.
Industrial Operations - Infrastructure support products manufacturing business
During the year ended
December 31, 2017
, our infrastructure support products manufacturing business sold assets held for sale for proceeds of
$27 million
. At
December 31, 2017
, certain land and buildings related to our infrastructure support products manufacturing business remain as held for sale.
Industrial Operations - Bath and shower products manufacturing business
In January 2017, together with institutional partners, the partnership completed the sale of its bath and shower products manufacturing business for proceeds of
$357 million
after transaction costs and other items, with an associated gain of
$233 million
recorded during the year ended
December 31, 2017
.
Energy - Oil and natural gas business
During the year ended
December 31, 2017
, our oil and natural gas business within our energy segment recorded a
$23 million
charge to align the carrying value of assets to the estimated fair value. In August 2017, the partnership completed the sale for proceeds of
$24 million
, with an associated loss of
$24 million
recorded during the year ended
December 31, 2017
.
|
F-43
|
Brookfield Business Partners
|
BROOKFIELD BUSINESS PARTNERS L.P.
NOTES TO CONSOLIDATED FINANCIAL STATEMENTS (Continued)
As at December 31, 2017 and 2016 and for the years ended December 31, 2017, 2016 and 2015
|
(US$ MILLIONS)
|
2017
|
2016
|
||||||
|
Current
|
|
|
||||||
|
Work in progress
(1)
|
$
|
195
|
|
$
|
309
|
|
||
|
Prepayments and other assets
|
235
|
|
88
|
|
||||
|
Total current
|
$
|
430
|
|
$
|
397
|
|
||
|
Non-current
|
|
|
||||||
|
Prepayments and other assets
|
$
|
79
|
|
$
|
21
|
|
||
|
Total non-current
|
$
|
79
|
|
$
|
21
|
|
||
____________________________________
|
(1)
|
See Note 16 for additional information.
|
The increase in other assets from
December 31, 2017
is primarily attributable to the acquisitions in our business services and industrial operations segments, which account for
$161 million
of the increase in prepayments and other assets, partially offset by a decrease in work in progress in our construction services business compared to
December 31, 2016
.
The following tables present the gross assets and liabilities as well as gross amounts of revenue, net income, other comprehensive income and distributions from the partnership’s investments in material non-wholly owned subsidiaries for the years ended
December 31, 2017
,
2016
and
2015
:
|
Year Ended December 31, 2017
|
|||||||||||||||||||||||||||||||||||||||
|
Total
|
Profit/(loss) allocated to others ownership interest
|
Distributions to others ownership interest
|
Equity to others ownership interest
|
||||||||||||||||||||||||||||||||||||
|
(US$ MILLIONS)
|
Current assets
|
Non-current assets
|
Current liabilities
|
Non-current liabilities
|
Revenue
|
Profit/(loss)
|
OCI
|
||||||||||||||||||||||||||||||||
|
Business services
|
$
|
2,606
|
|
$
|
1,744
|
|
$
|
2,774
|
|
$
|
948
|
|
$
|
15,676
|
|
$
|
45
|
|
$
|
11
|
|
$
|
35
|
|
$
|
46
|
|
$
|
476
|
|
|||||||||
|
Industrial operations
|
1,016
|
|
4,820
|
|
582
|
|
2,600
|
|
1,646
|
|
15
|
|
(20
|
)
|
18
|
|
25
|
|
1,988
|
|
|||||||||||||||||||
|
Energy
|
79
|
|
992
|
|
322
|
|
131
|
|
267
|
|
(19
|
)
|
61
|
|
(14
|
)
|
—
|
|
350
|
|
|||||||||||||||||||
|
Total
|
$
|
3,701
|
|
$
|
7,556
|
|
$
|
3,678
|
|
$
|
3,679
|
|
$
|
17,589
|
|
$
|
41
|
|
$
|
52
|
|
$
|
39
|
|
$
|
71
|
|
$
|
2,814
|
|
|||||||||
|
Year Ended December 31, 2016
|
|||||||||||||||||||||||||||||||||||||||
|
Total
|
Profit/(loss) allocated to others ownership interest
|
Distributions to others ownership interest
|
Equity to others ownership interest
|
||||||||||||||||||||||||||||||||||||
|
(US$ MILLIONS)
|
Current assets
|
Non-current assets
|
Current liabilities
|
Non-current liabilities
|
Revenue
|
Profit/(loss)
|
OCI
|
||||||||||||||||||||||||||||||||
|
Business services
|
$
|
437
|
|
$
|
494
|
|
$
|
402
|
|
$
|
253
|
|
$
|
1,347
|
|
$
|
25
|
|
$
|
5
|
|
$
|
15
|
|
$
|
8
|
|
$
|
198
|
|
|||||||||
|
Industrial operations
|
728
|
|
1,262
|
|
282
|
|
563
|
|
1,279
|
|
(226
|
)
|
28
|
|
(148
|
)
|
—
|
|
774
|
|
|||||||||||||||||||
|
Energy
|
47
|
|
1,087
|
|
67
|
|
459
|
|
212
|
|
(97
|
)
|
14
|
|
(58
|
)
|
10
|
|
357
|
|
|||||||||||||||||||
|
Total
|
$
|
1,212
|
|
$
|
2,843
|
|
$
|
751
|
|
$
|
1,275
|
|
$
|
2,838
|
|
$
|
(298
|
)
|
$
|
47
|
|
$
|
(191
|
)
|
$
|
18
|
|
$
|
1,329
|
|
|||||||||
|
Brookfield Business Partners
|
F-44
|
BROOKFIELD BUSINESS PARTNERS L.P.
NOTES TO CONSOLIDATED FINANCIAL STATEMENTS (Continued)
As at December 31, 2017 and 2016 and for the years ended December 31, 2017, 2016 and 2015
|
Year Ended December 31, 2015
|
|||||||||||||||||||||||||||||||||||||||
|
Total
|
Profit/(loss) allocated to others ownership interest
|
Distributions to others ownership interest
|
Equity to others ownership interest
|
||||||||||||||||||||||||||||||||||||
|
(US$ MILLIONS)
|
Current assets
|
Non-current assets
|
Current liabilities
|
Non-current liabilities
|
Revenue
|
Profit/(loss)
|
OCI
|
||||||||||||||||||||||||||||||||
|
Business services
|
$
|
274
|
|
$
|
420
|
|
$
|
232
|
|
$
|
213
|
|
$
|
917
|
|
$
|
126
|
|
$
|
(24
|
)
|
$
|
15
|
|
$
|
13
|
|
$
|
152
|
|
|||||||||
|
Industrial operations
|
692
|
|
1,499
|
|
287
|
|
817
|
|
855
|
|
(31
|
)
|
(58
|
)
|
(18
|
)
|
3
|
|
673
|
|
|||||||||||||||||||
|
Energy
|
54
|
|
1,190
|
|
33
|
|
524
|
|
314
|
|
70
|
|
(120
|
)
|
40
|
|
2
|
|
407
|
|
|||||||||||||||||||
|
Total
|
$
|
1,020
|
|
$
|
3,109
|
|
$
|
552
|
|
$
|
1,554
|
|
$
|
2,086
|
|
$
|
165
|
|
$
|
(202
|
)
|
$
|
37
|
|
$
|
18
|
|
$
|
1,232
|
|
|||||||||
The following table outlines the composition of accumulated non-controlling interest ("NCI") related to the interest of others presented in the partnership's Consolidated Statements of Financial Position:
|
(US$ MILLIONS)
|
2017
|
2016
|
||||||
|
NCI related to material non-wholly owned subsidiaries
|
|
|
||||||
|
Business services
|
$
|
476
|
|
$
|
198
|
|
||
|
Industrial operations
|
1,988
|
|
774
|
|
||||
|
Energy
|
350
|
|
357
|
|
||||
|
Total NCI in material non-wholly owned subsidiaries
|
$
|
2,814
|
|
$
|
1,329
|
|
||
|
Total individually immaterial NCI balances
|
212
|
|
208
|
|
||||
|
Total NCI
|
$
|
3,026
|
|
$
|
1,537
|
|
||
|
F-45
|
Brookfield Business Partners
|
BROOKFIELD BUSINESS PARTNERS L.P.
NOTES TO CONSOLIDATED FINANCIAL STATEMENTS (Continued)
As at December 31, 2017 and 2016 and for the years ended December 31, 2017, 2016 and 2015
|
(US$ MILLIONS)
|
Land
|
Building
|
Machinery and Equipment
|
Oil and Gas Properties
|
Mineral Property Assets
|
Others
|
Total Assets
|
|||||||||||||||||||||
|
Gross Carrying Amount
|
|
|
||||||||||||||||||||||||||
|
Balance at January 1, 2016
|
$
|
102
|
|
$
|
223
|
|
$
|
941
|
|
$
|
1,362
|
|
$
|
250
|
|
$
|
81
|
|
$
|
2,959
|
|
|||||||
|
Additions (cash and non-cash)
|
—
|
|
2
|
|
73
|
|
15
|
|
34
|
|
10
|
|
134
|
|
||||||||||||||
|
Disposals (cash and non-cash)
|
—
|
|
(1
|
)
|
(19
|
)
|
(87
|
)
|
(1
|
)
|
(5
|
)
|
(113
|
)
|
||||||||||||||
|
Acquisitions through business combinations
(1)
|
—
|
|
—
|
|
—
|
|
—
|
|
—
|
|
—
|
|
—
|
|
||||||||||||||
|
Transfers and assets reclassified as held for sale
(4)
|
(20
|
)
|
(65
|
)
|
(81
|
)
|
—
|
|
—
|
|
(31
|
)
|
(197
|
)
|
||||||||||||||
|
Net foreign currency exchange differences
|
7
|
|
4
|
|
3
|
|
43
|
|
7
|
|
2
|
|
66
|
|
||||||||||||||
|
Balance at December 31, 2016
|
$
|
89
|
|
$
|
163
|
|
$
|
917
|
|
$
|
1,333
|
|
$
|
290
|
|
$
|
57
|
|
$
|
2,849
|
|
|||||||
|
Additions (cash and non-cash)
|
—
|
|
24
|
|
105
|
|
19
|
|
29
|
|
18
|
|
195
|
|
||||||||||||||
|
Disposals (cash and non-cash)
|
—
|
|
—
|
|
(22
|
)
|
(251
|
)
|
—
|
|
(2
|
)
|
(275
|
)
|
||||||||||||||
|
Acquisitions through business combinations
(1)
|
21
|
|
211
|
|
245
|
|
—
|
|
—
|
|
26
|
|
503
|
|
||||||||||||||
|
Transfers and assets reclassified as held for sale
(4)
|
(12
|
)
|
(3
|
)
|
7
|
|
—
|
|
(7
|
)
|
(1
|
)
|
(16
|
)
|
||||||||||||||
|
Net foreign currency exchange differences
|
5
|
|
2
|
|
58
|
|
80
|
|
23
|
|
1
|
|
169
|
|
||||||||||||||
|
Balances at December 31, 2017
|
$
|
103
|
|
$
|
397
|
|
$
|
1,310
|
|
$
|
1,181
|
|
$
|
335
|
|
$
|
99
|
|
$
|
3,425
|
|
|||||||
|
Accumulated Depreciation and Impairment
|
||||||||||||||||||||||||||||
|
Balance at January 1, 2016
|
$
|
—
|
|
$
|
(37
|
)
|
$
|
(184
|
)
|
$
|
(323
|
)
|
$
|
(9
|
)
|
$
|
(42
|
)
|
(595
|
)
|
||||||||
|
Depreciation/depletion/impairment expense
|
—
|
|
(9
|
)
|
(90
|
)
|
(94
|
)
|
(13
|
)
|
(10
|
)
|
(216
|
)
|
||||||||||||||
|
Disposals
|
—
|
|
—
|
|
10
|
|
—
|
|
—
|
|
4
|
|
14
|
|
||||||||||||||
|
Transfers and assets reclassified as held for sale
(4)
|
—
|
|
17
|
|
17
|
|
—
|
|
—
|
|
25
|
|
59
|
|
||||||||||||||
|
Net foreign currency exchange differences
|
—
|
|
—
|
|
(6
|
)
|
(8
|
)
|
—
|
|
(1
|
)
|
(15
|
)
|
||||||||||||||
|
Balances at December 31, 2016
(2) (3)
|
$
|
—
|
|
$
|
(29
|
)
|
$
|
(253
|
)
|
$
|
(425
|
)
|
$
|
(22
|
)
|
$
|
(24
|
)
|
$
|
(753
|
)
|
|||||||
|
Depreciation/depletion/impairment expense
|
—
|
|
(15
|
)
|
(106
|
)
|
—
|
|
(17
|
)
|
(13
|
)
|
(151
|
)
|
||||||||||||||
|
Disposals
|
—
|
|
—
|
|
16
|
|
35
|
|
—
|
|
1
|
|
52
|
|
||||||||||||||
|
Transfers and assets reclassified as held for sale
(4)
|
—
|
|
—
|
|
(4
|
)
|
—
|
|
5
|
|
—
|
|
1
|
|
||||||||||||||
|
Net foreign currency exchange differences
|
—
|
|
—
|
|
(17
|
)
|
(24
|
)
|
(2
|
)
|
(1
|
)
|
(44
|
)
|
||||||||||||||
|
Balances at December 31, 2017
(2) (3)
|
$
|
—
|
|
$
|
(44
|
)
|
$
|
(364
|
)
|
$
|
(414
|
)
|
$
|
(36
|
)
|
$
|
(37
|
)
|
$
|
(895
|
)
|
|||||||
|
Net book value
|
||||||||||||||||||||||||||||
|
December 31, 2016
|
$
|
89
|
|
$
|
134
|
|
$
|
664
|
|
$
|
908
|
|
$
|
268
|
|
$
|
33
|
|
$
|
2,096
|
|
|||||||
|
December 31, 2017
|
$
|
103
|
|
$
|
353
|
|
$
|
946
|
|
$
|
767
|
|
$
|
299
|
|
$
|
62
|
|
$
|
2,530
|
|
|||||||
____________________________________
|
(1)
|
See Note 3 for additional information.
|
|
(2)
|
Includes accumulated impairment losses of
$6 million
(
2016
:
$6 million
) for machinery and equipment and
$57 million
(
2016
:
$86 million
) for oil and gas properties.
|
|
(3)
|
As at
December 31, 2017
a total of
$745 million
(
2016
:
$925 million
) of future development costs were included in the depletion calculation.
|
|
(4)
|
See Note 8 for additional information.
|
|
F-46
|
Brookfield Business Partners
|
BROOKFIELD BUSINESS PARTNERS L.P.
NOTES TO CONSOLIDATED FINANCIAL STATEMENTS (Continued)
As at December 31, 2017 and 2016 and for the years ended December 31, 2017, 2016 and 2015
|
(US$ MILLIONS)
|
Water and sewage concession agreements
|
Customer relationships
|
Computer software, patents trademarks and proprietary technology
|
Loyalty program
|
Distribution networks and other
|
Total assets
|
|||||||||||||||||
|
Gross Carrying Amount:
|
|
||||||||||||||||||||||
|
Balance at January 1, 2016
|
$
|
—
|
|
$
|
371
|
|
$
|
180
|
|
$
|
—
|
|
$
|
77
|
|
$
|
628
|
|
|||||
|
Additions, net
|
—
|
|
—
|
|
17
|
|
—
|
|
1
|
|
18
|
|
|||||||||||
|
Acquisitions through business combinations
(1)
|
—
|
|
36
|
|
—
|
|
—
|
|
—
|
|
36
|
|
|||||||||||
|
Assets reclassified as held for sale
(3)
|
—
|
|
(1
|
)
|
(77
|
)
|
—
|
|
(52
|
)
|
(130
|
)
|
|||||||||||
|
Net foreign currency exchange differences
|
—
|
|
—
|
|
—
|
|
—
|
|
2
|
|
2
|
|
|||||||||||
|
Balances at December 31, 2016
|
$
|
—
|
|
$
|
406
|
|
$
|
120
|
|
$
|
—
|
|
$
|
28
|
|
$
|
554
|
|
|||||
|
Additions, net
|
67
|
|
1
|
|
18
|
|
—
|
|
12
|
|
98
|
|
|||||||||||
|
Acquisitions through business combinations
(1)
|
2,189
|
|
376
|
|
38
|
|
163
|
|
104
|
|
2,870
|
|
|||||||||||
|
Disposition
|
(3
|
)
|
(59
|
)
|
(14
|
)
|
—
|
|
—
|
|
(76
|
)
|
|||||||||||
|
Net foreign currency exchange differences
|
(100
|
)
|
6
|
|
10
|
|
—
|
|
(2
|
)
|
(86
|
)
|
|||||||||||
|
Balance at December 31, 2017
|
$
|
2,153
|
|
$
|
730
|
|
$
|
172
|
|
$
|
163
|
|
$
|
142
|
|
$
|
3,360
|
|
|||||
|
Accumulated Depreciation and Impairment
|
|||||||||||||||||||||||
|
Balance at January 1, 2016
|
$
|
—
|
|
$
|
(107
|
)
|
$
|
(48
|
)
|
$
|
—
|
|
$
|
(28
|
)
|
$
|
(183
|
)
|
|||||
|
Amortization expense
|
—
|
|
(26
|
)
|
(13
|
)
|
—
|
|
(13
|
)
|
(52
|
)
|
|||||||||||
|
Assets reclassified as held for sale
(3)
|
—
|
|
—
|
|
23
|
|
—
|
|
29
|
|
52
|
|
|||||||||||
|
Net foreign currency exchange differences
|
—
|
|
—
|
|
—
|
|
—
|
|
—
|
|
—
|
|
|||||||||||
|
Balance at December 31, 2016
(2)
|
$
|
—
|
|
$
|
(133
|
)
|
$
|
(38
|
)
|
$
|
—
|
|
$
|
(12
|
)
|
$
|
(183
|
)
|
|||||
|
Amortization expense
|
(57
|
)
|
(50
|
)
|
(15
|
)
|
(5
|
)
|
(5
|
)
|
(132
|
)
|
|||||||||||
|
Assets reclassified as held for sale
(3)
|
—
|
|
—
|
|
—
|
|
—
|
|
—
|
|
—
|
|
|||||||||||
|
Net foreign currency exchange differences
|
—
|
|
(7
|
)
|
(2
|
)
|
—
|
|
—
|
|
(9
|
)
|
|||||||||||
|
Disposal
|
—
|
|
49
|
|
9
|
|
—
|
|
—
|
|
58
|
|
|||||||||||
|
Balance at December 31, 2017
(2)
|
$
|
(57
|
)
|
$
|
(141
|
)
|
$
|
(46
|
)
|
$
|
(5
|
)
|
$
|
(17
|
)
|
$
|
(266
|
)
|
|||||
|
Net book value
|
|||||||||||||||||||||||
|
December 31, 2016
|
$
|
—
|
|
$
|
273
|
|
$
|
82
|
|
$
|
—
|
|
$
|
16
|
|
$
|
371
|
|
|||||
|
December 31, 2017
|
$
|
2,096
|
|
$
|
589
|
|
$
|
126
|
|
$
|
158
|
|
$
|
125
|
|
$
|
3,094
|
|
|||||
____________________________________
|
(1)
|
See Note 3 for additional information.
|
|
(2)
|
Accumulated impairment losses of $
nil
(
2016
:
$7 million
) and $
nil
(
2016
:
$3 million
) were reclassified as held for sale during
2017
for patents and trademarks and distribution networks, respectively.
No
impairment losses were reversed in
2016
or
2017
.
|
|
(3)
|
See Note 8 for additional information.
|
|
F-47
|
Brookfield Business Partners
|
BROOKFIELD BUSINESS PARTNERS L.P.
NOTES TO CONSOLIDATED FINANCIAL STATEMENTS (Continued)
As at December 31, 2017 and 2016 and for the years ended December 31, 2017, 2016 and 2015
The terms and conditions of the water and sewage concession agreements, including fees that can be charged to the users and the duties to be performed by the operator, are regulated by various grantors, the majority of which are municipal governments across Brazil. The concession agreements provide the operator the right to charge fees to users using the services of the operator over the term of the concessions in exchange for water treatment services, ongoing and regular maintenance work on water distributions assets, and improvements to the water treatment and distribution system. Fees are revised annually for inflation in Brazil. The concession arrangements have expiration dates that range from 2037 to 2055 at which point the underlying concessions assets will be returned to the various grantors.
|
(US$ MILLIONS)
|
2017
|
2016
|
||||||
|
Balance at beginning of year
|
$
|
1,152
|
|
$
|
1,124
|
|
||
|
Acquisitions through business combinations
(1)
|
342
|
|
39
|
|
||||
|
Impairment losses
(2)
|
—
|
|
(3
|
)
|
||||
|
Assets reclassified as held for sale
(3)
|
—
|
|
(4
|
)
|
||||
|
Foreign currency translation
|
60
|
|
(4
|
)
|
||||
|
Balance at end of year
|
$
|
1,554
|
|
$
|
1,152
|
|
||
____________________________________
|
(1)
|
See Note 3 for additional information.
|
|
(2)
|
For the year ended
December 31, 2016
an impairment of goodwill of
$3 million
was recorded in one of our real estate services business.
|
|
(3)
|
See Note 8 for additional information.
|
Goodwill is allocated to the following segments as at
December 31, 2017
and
2016
:
|
(US$ MILLIONS)
|
2017
|
2016
|
||||||
|
Construction services
|
$
|
789
|
|
$
|
743
|
|
||
|
Business services
|
579
|
|
238
|
|
||||
|
Industrial operations
|
186
|
|
171
|
|
||||
|
Total
|
$
|
1,554
|
|
$
|
1,152
|
|
||
|
F-48
|
Brookfield Business Partners
|
BROOKFIELD BUSINESS PARTNERS L.P.
NOTES TO CONSOLIDATED FINANCIAL STATEMENTS (Continued)
As at December 31, 2017 and 2016 and for the years ended December 31, 2017, 2016 and 2015
The following table presents the ownership interest, voting interest, and carrying values of the partnership's equity accounted investments as at
December 31, 2017
and
2016
:
|
(US$ MILLIONS)
|
Economic interest
|
Voting interest
|
Carrying value
|
||||||||||||||||
|
2017
|
2016
|
2017
|
2016
|
2017
|
2016
|
||||||||||||||
|
Business services
|
28%-67%
|
|
28%-60%
|
|
28%-60%
|
|
28%-50%
|
|
$
|
212
|
|
$
|
80
|
|
|||||
|
Construction services
|
50%-90%
|
|
50%-90%
|
|
50%-90%
|
|
50
|
%
|
1
|
|
1
|
|
|||||||
|
Industrial operations
|
50
|
%
|
—
|
|
50
|
%
|
—
|
|
102
|
|
—
|
|
|||||||
|
Energy
|
14%-25%
|
|
14
|
%
|
29%-60%
|
|
29
|
%
|
294
|
|
85
|
|
|||||||
|
Total
|
$
|
609
|
|
$
|
166
|
|
|||||||||||||
The following table represents the change in the balance of equity accounted investments:
|
(US$ MILLIONS)
|
2017
|
2016
|
||||||
|
Balance at beginning of year
|
$
|
166
|
|
$
|
492
|
|
||
|
Acquisitions through business combinations
(1)
|
231
|
|
—
|
|
||||
|
Additions
|
208
|
|
—
|
|
||||
|
Dispositions
(2)
|
—
|
|
(289
|
)
|
||||
|
Share of net income
|
69
|
|
68
|
|
||||
|
Share of other comprehensive income
|
(5
|
)
|
(79
|
)
|
||||
|
Distributions received
|
(59
|
)
|
(25
|
)
|
||||
|
Foreign currency translation
|
(1
|
)
|
(1
|
)
|
||||
|
Balance at end of period
|
$
|
609
|
|
$
|
166
|
|
||
____________________________________
|
(1)
|
See Note 3 for additional information.
|
|
(2)
|
Dispositions of equity accounted investments in
2016
relates to the sell down and reorganization of our Western Australia energy operations during the year. As a result, the partnership now consolidates a smaller portion of the interest of the institutional investors resulting in a decrease in the balance of equity accounted investment and a corresponding decrease in the interest of others.
|
The acquisitions of BRK Ambiental and Greenergy during 2017 resulted in a
$231 million
increase in equity accounted investments from
December 31, 2016
.
Additionally, on September 25, 2017, the partnership acquired, together with institutional investors, a
60%
economic interest in Teekay Offshore Partners LP and
49%
voting interest in Teekay Offshore's General Partner. The partnership acquired a limited partnership interest in Teekay Offshore Partners LP, as well as warrants and a promissory note for total consideration of
$317 million
. The acquisition of the limited partnership units resulted in an addition of
$208 million
to equity accounted investments from
December 31, 2016
, whereas the acquired warrants and promissory note are recorded separately on the consolidated statements of financial position as financial assets at FVTPL and amortized cost, respectively.
For the year ended
December 31, 2017
, the partnership received total distributions from equity accounted investments of $
59 million
, including a distribution of
$34 million
from our Western Australian energy operation within our energy segment.
|
F-49
|
Brookfield Business Partners
|
BROOKFIELD BUSINESS PARTNERS L.P.
NOTES TO CONSOLIDATED FINANCIAL STATEMENTS (Continued)
As at December 31, 2017 and 2016 and for the years ended December 31, 2017, 2016 and 2015
The following tables present the gross assets and liabilities of the partnership's equity accounted investments:
|
Year Ended December 31, 2017
|
|||||||||||||||||||||||||||||||||||
|
Total
|
Attributable to
|
||||||||||||||||||||||||||||||||||
|
(US$ MILLIONS)
|
Current assets
|
Non-current assets
|
Total assets
|
Current liabilities
|
Non-current liabilities
|
Total liabilities
|
Total net assets
|
Other ownership interests
|
Partnership's share
(2)
|
||||||||||||||||||||||||||
|
Business services
|
$
|
97
|
|
$
|
488
|
|
$
|
585
|
|
$
|
139
|
|
$
|
206
|
|
$
|
345
|
|
$
|
240
|
|
$
|
93
|
|
$
|
147
|
|
||||||||
|
Construction services
|
262
|
|
11
|
|
273
|
|
215
|
|
56
|
|
271
|
|
2
|
|
1
|
|
1
|
|
|||||||||||||||||
|
Industrial operations
|
44
|
|
342
|
|
386
|
|
23
|
|
159
|
|
182
|
|
204
|
|
102
|
|
102
|
|
|||||||||||||||||
|
Energy
|
799
|
|
8,441
|
|
9,240
|
|
1,370
|
|
6,431
|
|
7,801
|
|
1,439
|
|
1,173
|
|
266
|
|
|||||||||||||||||
|
Total
|
$
|
1,202
|
|
$
|
9,282
|
|
$
|
10,484
|
|
$
|
1,747
|
|
$
|
6,852
|
|
$
|
8,599
|
|
$
|
1,885
|
|
$
|
1,369
|
|
$
|
516
|
|
||||||||
|
Year Ended December 31, 2016
|
|||||||||||||||||||||||||||||||||||
|
Total
|
Attributable to
|
||||||||||||||||||||||||||||||||||
|
(US$ MILLIONS)
|
Current assets
|
Non-current assets
|
Total assets
|
Current liabilities
|
Non-current liabilities
|
Total liabilities
|
Total net assets
|
Other ownership interests
|
Partnership's share
(2)
|
||||||||||||||||||||||||||
|
Business services
|
$
|
69
|
|
$
|
96
|
|
$
|
165
|
|
$
|
47
|
|
$
|
87
|
|
$
|
134
|
|
$
|
31
|
|
$
|
17
|
|
$
|
14
|
|
||||||||
|
Construction services
|
193
|
|
22
|
|
215
|
|
136
|
|
77
|
|
213
|
|
2
|
|
1
|
|
1
|
|
|||||||||||||||||
|
Energy
(1)
|
355
|
|
3,784
|
|
4,139
|
|
511
|
|
3,292
|
|
3,803
|
|
336
|
|
304
|
|
32
|
|
|||||||||||||||||
|
Total
|
$
|
617
|
|
$
|
3,902
|
|
$
|
4,519
|
|
$
|
694
|
|
$
|
3,456
|
|
$
|
4,150
|
|
$
|
369
|
|
$
|
322
|
|
$
|
47
|
|
||||||||
____________________________________
|
(1)
|
In April 2016, the partnership sold a
12%
interest in an Energy business for
$79 million
. The partnership also picked up a lower proportionate share in the business in
2016
resulting from a reorganization and sell down to our institutional partners. Following the sale and reorganization, the partnership continued to hold a
9%
economic interest and a
29%
voting interest, giving the partnership significant influence over the investee. Accordingly, the partnership accounts for the investments using the equity method.
|
|
(2)
|
Attributable to limited partner and redemption-exchange unitholders.
|
Certain of the partnership's equity accounted investments are subject to restrictions over the extent to which they can remit funds to the partnership in the form of cash dividends, or repayments of loans and advances as a results of borrowing arrangements, regulatory restrictions and other contractual requirements.
|
F-50
|
Brookfield Business Partners
|
BROOKFIELD BUSINESS PARTNERS L.P.
NOTES TO CONSOLIDATED FINANCIAL STATEMENTS (Continued)
As at December 31, 2017 and 2016 and for the years ended December 31, 2017, 2016 and 2015
The following tables present the gross amounts of revenue, net income, other comprehensive income and distributions from the partnership's equity accounted investments for the year ended
December 31, 2017
,
2016
and
2015
:
|
Year Ended December 31, 2017
|
|||||||||||||||||||||||||||||||
|
Total
|
Attributable to other ownership interests
|
Attributable
to partnership
|
|||||||||||||||||||||||||||||
|
(US$ MILLIONS)
|
Revenue
|
Net income
|
OCI
|
Total
|
Comprehensive income
|
Distributions
|
Comprehensive income
|
Distributions
|
|||||||||||||||||||||||
|
Business services
|
$
|
189
|
|
$
|
81
|
|
$
|
—
|
|
$
|
81
|
|
$
|
54
|
|
$
|
45
|
|
$
|
27
|
|
$
|
22
|
|
|||||||
|
Construction services
|
208
|
|
—
|
|
—
|
|
—
|
|
—
|
|
—
|
|
—
|
|
—
|
|
|||||||||||||||
|
Industrial operations
|
54
|
|
5
|
|
—
|
|
5
|
|
3
|
|
2
|
|
2
|
|
2
|
|
|||||||||||||||
|
Energy
|
1,058
|
|
297
|
|
(38
|
)
|
259
|
|
224
|
|
170
|
|
35
|
|
35
|
|
|||||||||||||||
|
Total
|
$
|
1,509
|
|
$
|
383
|
|
$
|
(38
|
)
|
$
|
345
|
|
$
|
281
|
|
$
|
217
|
|
$
|
64
|
|
$
|
59
|
|
|||||||
|
Year Ended December 31, 2016
|
|||||||||||||||||||||||||||||||
|
Total
|
Attributable to other ownership interests
|
Attributable
to partnership
|
|||||||||||||||||||||||||||||
|
(US$ MILLIONS)
|
Revenue
|
Net income
|
OCI
|
Total
|
Comprehensive income
|
Distributions
|
Comprehensive income
|
Distributions
|
|||||||||||||||||||||||
|
Business services
|
$
|
120
|
|
$
|
49
|
|
$
|
—
|
|
$
|
49
|
|
$
|
32
|
|
$
|
38
|
|
$
|
17
|
|
$
|
20
|
|
|||||||
|
Construction services
|
283
|
|
—
|
|
—
|
|
—
|
|
—
|
|
—
|
|
—
|
|
—
|
|
|||||||||||||||
|
Energy
|
941
|
|
99
|
|
(138
|
)
|
(39
|
)
|
(35
|
)
|
17
|
|
(4
|
)
|
5
|
|
|||||||||||||||
|
Total
|
$
|
1,344
|
|
$
|
148
|
|
$
|
(138
|
)
|
$
|
10
|
|
$
|
(3
|
)
|
$
|
55
|
|
$
|
13
|
|
$
|
25
|
|
|||||||
|
Year Ended December 31, 2015
|
|||||||||||||||||||||||||||||||
|
Total
|
Attributable to other ownership interests
|
Attributable to partnership
|
|||||||||||||||||||||||||||||
|
(US$ MILLIONS)
|
Revenue
|
Net income
|
OCI
|
Total
|
Comprehensive income
|
Distributions
|
Comprehensive income
|
Distributions
|
|||||||||||||||||||||||
|
Business services
|
$
|
232
|
|
$
|
55
|
|
$
|
—
|
|
$
|
55
|
|
$
|
36
|
|
$
|
37
|
|
$
|
19
|
|
$
|
18
|
|
|||||||
|
Construction services
|
332
|
|
3
|
|
—
|
|
3
|
|
—
|
|
—
|
|
3
|
|
—
|
|
|||||||||||||||
|
Energy
|
548
|
|
(37
|
)
|
178
|
|
141
|
|
74
|
|
31
|
|
67
|
|
28
|
|
|||||||||||||||
|
Total
|
$
|
1,112
|
|
$
|
21
|
|
$
|
178
|
|
$
|
199
|
|
$
|
110
|
|
$
|
68
|
|
$
|
89
|
|
$
|
46
|
|
|||||||
|
F-51
|
Brookfield Business Partners
|
BROOKFIELD BUSINESS PARTNERS L.P.
NOTES TO CONSOLIDATED FINANCIAL STATEMENTS (Continued)
As at December 31, 2017 and 2016 and for the years ended December 31, 2017, 2016 and 2015
Two
of the partnership's equity accounted investments are publicly listed entities with active pricing in a liquid market. The fair value based on the publicly listed price in comparison to the partnership's carrying value is as follows:
|
December 31, 2017
|
December 31, 2016
|
|||||||||||||||
|
(US$ MILLIONS)
|
Public price
|
Carrying value
|
Public price
|
Carrying value
|
||||||||||||
|
Business services
|
$
|
44
|
|
$
|
—
|
|
$
|
39
|
|
$
|
—
|
|
||||
|
Energy
|
242
|
|
201
|
|
—
|
|
—
|
|
||||||||
|
Total
|
$
|
286
|
|
$
|
201
|
|
$
|
39
|
|
$
|
—
|
|
||||
|
(US$ MILLIONS)
|
2017
|
2016
|
||||||
|
Current:
|
|
|
||||||
|
Accounts payable
|
$
|
1,451
|
|
$
|
1,325
|
|
||
|
Accrued and other liabilities
(1) (2)
|
2,992
|
|
476
|
|
||||
|
Work in progress
(3)
|
341
|
|
239
|
|
||||
|
Provisions and decommissioning liabilities
|
81
|
|
39
|
|
||||
|
Total current
|
$
|
4,865
|
|
$
|
2,079
|
|
||
|
Non-current:
|
|
|
||||||
|
Accounts payable
|
$
|
113
|
|
$
|
91
|
|
||
|
Accrued and other liabilities
(2)
|
435
|
|
123
|
|
||||
|
Work in progress
(3)
|
86
|
|
—
|
|
||||
|
Provisions and decommissioning liabilities
|
139
|
|
164
|
|
||||
|
Total non-current
|
$
|
773
|
|
$
|
378
|
|
||
____________________________________
|
(1)
|
Includes bank overdrafts of
$581 million
as at December 31, 2017.
|
|
(2)
|
Includes defined benefit pension obligation of
$38 million
(
$1 million
current and
$37 million
non-current) and post-retirement benefits obligation of
$28 million
(
$2 million
current and
$26 million
non-current) as at
December 31, 2017
.
|
|
(3)
|
See Note 16 for additional information.
|
The increase in accounts payable and other from
December 31, 2016
is primarily attributable to the acquisitions in our business services and industrial operations segments during the year ended
December 31, 2017
. This accounts for a
$2,755 million
movement in accounts payable and other as at
December 31, 2017
compared to
December 31, 2016
.
The partnership's exposure to currency and liquidity risk related to accounts payables is disclosed in Note 26.
|
F-52
|
Brookfield Business Partners
|
BROOKFIELD BUSINESS PARTNERS L.P.
NOTES TO CONSOLIDATED FINANCIAL STATEMENTS (Continued)
As at December 31, 2017 and 2016 and for the years ended December 31, 2017, 2016 and 2015
The following table presents the change in the provision balances for the partnership:
|
(US$ MILLIONS)
|
Decommissioning liability
(1)
|
Provisions for defects
|
Other
|
Total provisions
|
||||||||||||
|
Balance at January 1, 2016
|
$
|
192
|
|
$
|
48
|
|
$
|
19
|
|
$
|
259
|
|
||||
|
Additional provisions recognized
|
3
|
|
8
|
|
41
|
|
52
|
|
||||||||
|
Reduction arising from payments/derecognition
|
(3
|
)
|
(7
|
)
|
(28
|
)
|
(38
|
)
|
||||||||
|
Accretion expenses
|
9
|
|
1
|
|
—
|
|
10
|
|
||||||||
|
Change in discount rate
|
(1
|
)
|
—
|
|
—
|
|
(1
|
)
|
||||||||
|
Change in other estimates
|
(71
|
)
|
—
|
|
(9
|
)
|
(80
|
)
|
||||||||
|
Net foreign currency exchange differences
|
5
|
|
(3
|
)
|
(1
|
)
|
1
|
|
||||||||
|
Balance at December 31, 2016
|
$
|
134
|
|
$
|
47
|
|
$
|
22
|
|
$
|
203
|
|
||||
|
Additional provisions recognized
|
8
|
|
12
|
|
77
|
|
97
|
|
||||||||
|
Reduction arising from payments/derecognition
|
(2
|
)
|
(17
|
)
|
(15
|
)
|
(34
|
)
|
||||||||
|
Accretion expenses
|
7
|
|
—
|
|
—
|
|
7
|
|
||||||||
|
Change in discount rate
|
(51
|
)
|
—
|
|
—
|
|
(51
|
)
|
||||||||
|
Change in other estimates
(2)
|
(14
|
)
|
—
|
|
(3
|
)
|
(17
|
)
|
||||||||
|
Net foreign currency exchange differences
|
11
|
|
3
|
|
1
|
|
15
|
|
||||||||
|
Balance at December 31, 2017
|
$
|
93
|
|
$
|
45
|
|
$
|
82
|
|
$
|
220
|
|
||||
____________________________________
|
(1)
|
Decommissioning liability results primarily from ownership interest in oil and natural gas wells and facilities, mining facilities and retail gas stations. The liability represents the estimated cost to reclaim and abandon the wells and facilities and takes into account the estimated timing of the cost to be incurred in future periods. The liability was determined using a risk rate between
1.7%
and
8.5%
(
2016
:
1.8%
and
6.5%
) and an inflation rate between
1.4%
and
2%
(
2016
:
2%
), determined as appropriate for the underlying subsidiaries.
|
|
(2)
|
The reduction in the decommissioning liability is due to a change in the timing of future remediation costs at one of our oil and gas subsidiaries.
|
A summary of the partnership's contracts in progress are below:
|
(US$ MILLIONS)
|
2017
|
2016
|
2015
|
|||||||||
|
Contract costs incurred to date
|
$
|
12,129
|
|
$
|
9,761
|
|
$
|
7,372
|
|
|||
|
Profit recognized to date (less recognized losses)
|
558
|
|
498
|
|
470
|
|
||||||
|
12,687
|
|
10,259
|
|
7,842
|
|
|||||||
|
Less: progress billings
|
(12,919
|
)
|
(10,189
|
)
|
(7,883
|
)
|
||||||
|
Contract work in progress (liability)
|
$
|
(232
|
)
|
$
|
70
|
|
$
|
(41
|
)
|
|||
|
Comprising:
|
|
|
||||||||||
|
Amounts due from customers — work in progress (current)
|
$
|
195
|
|
$
|
309
|
|
$
|
204
|
|
|||
|
Amounts due to customers — creditors (current / non-current)
|
(427
|
)
|
(239
|
)
|
(245
|
)
|
||||||
|
Net work in progress
|
$
|
(232
|
)
|
$
|
70
|
|
$
|
(41
|
)
|
|||
|
F-53
|
Brookfield Business Partners
|
BROOKFIELD BUSINESS PARTNERS L.P.
NOTES TO CONSOLIDATED FINANCIAL STATEMENTS (Continued)
As at December 31, 2017 and 2016 and for the years ended December 31, 2017, 2016 and 2015
|
(US$ MILLIONS)
|
Business Services
|
Construction Services
|
Industrial Operations
|
Energy
|
Total Borrowings
|
|||||||||||||||
|
2018
|
$
|
269
|
|
$
|
3
|
|
$
|
208
|
|
$
|
342
|
|
$
|
822
|
|
|||||
|
2019
|
409
|
|
3
|
|
341
|
|
1
|
|
754
|
|
||||||||||
|
2020
|
75
|
|
3
|
|
463
|
|
—
|
|
541
|
|
||||||||||
|
2021
|
26
|
|
2
|
|
87
|
|
39
|
|
154
|
|
||||||||||
|
2022
|
337
|
|
1
|
|
73
|
|
—
|
|
411
|
|
||||||||||
|
Thereafter
|
62
|
|
—
|
|
521
|
|
—
|
|
583
|
|
||||||||||
|
Total - December 31, 2017
|
$
|
1,178
|
|
$
|
12
|
|
$
|
1,693
|
|
$
|
382
|
|
$
|
3,265
|
|
|||||
|
Total - December 31, 2016
|
$
|
471
|
|
$
|
7
|
|
$
|
528
|
|
$
|
545
|
|
$
|
1,551
|
|
|||||
Total current and non-current borrowings as at
December 31, 2017
were
$3,265 million
(
December 31, 2016
:
$1,551 million
). The increase of
$1,714 million
compared to December 31, 2016 is primarily attributable to the acquisitions of businesses within our business services and industrial operations segments.
The partnership acquired
$58 million
of borrowings in the form of long-term shareholder loan notes, which are repayable in 2027 and bear interest at
8%
as a result of the acquisition in our business services segment. The loans are repayable to the institutional investors and reinvesting management.
Some of the partnership's businesses have credit facilities in which they borrow and repay on a monthly basis. This movement has been shown on a net basis in the partnership's consolidated statements of cash flow.
As described in Note 1(b)(iii), the partnership entered into a credit agreement with Brookfield ("Brookfield Credit Agreements") for
two
,
three
-year revolving credit facilities with variable interest rates. One constitutes an operating credit facility that permits borrowings of up to
$200 million
for working capital purposes and the other constitutes an acquisition facility that permits borrowings of up to
$300 million
for purposes of funding acquisitions and investments. In October 2017, the
two
credit facilities were combined into
one
revolving credit facility that permits borrowings of up to
$500 million
for purposes of funding acquisitions and investments. As at
December 31, 2017
, the credit facilities under the Brookfield Credit Agreements remain undrawn.
In August 2016, the partnership entered into a
$150 million
unsecured bilateral credit facility with a group of Canadian and American banks. The credit facility is available in U.S. or Canadian dollars, and advances bear interest at the specified LIBOR or bankers' acceptance rate plus
2.75%
, or the specified base rate or prime rate plus
1.75%
. This facility had a
two
year term, with a
one year
extension and will be used for general corporate purposes. In May 2017, the credit facility's maturity date was amended and extended by
one year
to 2019, effective August 2017. In August 2017, the credit facility was increased by
$100 million
to an aggregate facility of
$250 million
. As at
December 31, 2017
, the facility remains undrawn and the partnership was in compliance with all covenants.
The partnership has credit facilities within its operating businesses with major financial institutions. The credit facilities are primarily composed of revolving term credit facilities and revolving operating facilities with variable interest rates. In certain cases, the facilities may have financial covenants which are generally in the form of interest coverage ratios and leverage ratios. One of the partnership's real estate services businesses within our business services segment has a securitization program under which it transfers an undivided co-ownership interest in eligible receivables on a fully serviced basis, for cash proceeds, at their fair value under the terms of the agreement. While the sale of the co-ownership interest is considered a legal sale, the partnership has determined that the asset derecognition criteria has not been met as substantially all risk and rewards of ownership are not transferred.
|
Brookfield Business Partners
|
F-54
|
BROOKFIELD BUSINESS PARTNERS L.P.
NOTES TO CONSOLIDATED FINANCIAL STATEMENTS (Continued)
As at December 31, 2017 and 2016 and for the years ended December 31, 2017, 2016 and 2015
The weighted average interest rates of borrowings are as follows:
|
Weighted Average %
|
Business Services
|
Construction Services
|
Industrial Operations
|
Energy
|
Weighted Average
|
||||||||||
|
Total - December 31, 2017
|
4.06
|
%
|
2.37
|
%
|
9.93
|
%
|
6.09
|
%
|
7.33
|
%
|
|||||
|
Total - December 31, 2016
|
2.63
|
%
|
2.14
|
%
|
5.16
|
%
|
4.30
|
%
|
4.07
|
%
|
|||||
Borrowings by currency are as follows:
|
(US$ MILLIONS, except as noted)
|
December 31,
2017 |
Local Currency
|
December 31,
2016 |
Local Currency
|
||||||||||
|
British pounds
|
46
|
|
36
|
|
29
|
|
23
|
|
||||||
|
U.S. dollars
|
974
|
|
974
|
|
848
|
|
848
|
|
||||||
|
Canadian dollars
|
936
|
|
1,090
|
|
652
|
|
876
|
|
||||||
|
Euro
|
17
|
|
14
|
|
—
|
|
—
|
|
||||||
|
Brazilian reais
|
1,292
|
|
4,271
|
|
—
|
|
—
|
|
||||||
|
Other
|
—
|
|
2
|
|
22
|
|
36
|
|
||||||
|
Total
|
$
|
3,265
|
|
$
|
1,551
|
|
||||||||
Income taxes are recognized for the amount of taxes payable by the partnership's corporate subsidiaries and for the impact of deferred income tax assets and liabilities related to such subsidiaries.
The major components of income tax expense include the following for the years ended
December 31
:
|
(US$ MILLIONS)
|
2017
|
2016
|
2015
|
|||||||||
|
Current income taxes expense/(recovery)
|
$
|
30
|
|
$
|
25
|
|
$
|
49
|
|
|||
|
Deferred income tax expense/(recovery):
|
||||||||||||
|
Origination and reversal of temporary differences
|
(14
|
)
|
(32
|
)
|
15
|
|
||||||
|
Recovery arising from previously unrecognized tax assets
|
(10
|
)
|
(8
|
)
|
(13
|
)
|
||||||
|
Change of tax rates and imposition of new legislations
|
2
|
|
(1
|
)
|
3
|
|
||||||
|
Total deferred income taxes
|
(22
|
)
|
(41
|
)
|
5
|
|
||||||
|
Income taxes
|
$
|
8
|
|
$
|
(16
|
)
|
$
|
54
|
|
|||
|
F-55
|
Brookfield Business Partners
|
BROOKFIELD BUSINESS PARTNERS L.P.
NOTES TO CONSOLIDATED FINANCIAL STATEMENTS (Continued)
As at December 31, 2017 and 2016 and for the years ended December 31, 2017, 2016 and 2015
The below reconciliation has been prepared using a composite statutory-rate for jurisdictions where our partnership's subsidiaries operate.
The partnership's effective tax rate is different from our partnership's composite income tax rate due to the following differences set out below:
|
2017
|
2016
|
2015
|
|||||||
|
Statutory income tax rate
|
27
|
%
|
27
|
%
|
27
|
%
|
|||
|
Increase (reduction) in rate resulting from:
|
|||||||||
|
Portion of gains subject to different tax rates
|
(6
|
)
|
(1
|
)
|
(14
|
)
|
|||
|
International operations subject to different tax rates
|
5
|
|
3
|
|
(4
|
)
|
|||
|
Taxable income attribute to non-controlling interest
|
(18
|
)
|
6
|
|
(4
|
)
|
|||
|
Recognition of deferred tax assets
|
(5
|
)
|
2
|
|
1
|
|
|||
|
Non-recognition of the benefit of current year's tax losses
|
(1
|
)
|
(29
|
)
|
11
|
|
|||
|
Other
|
1
|
|
(1
|
)
|
—
|
|
|||
|
Effective income tax rate
|
3
|
%
|
7
|
%
|
17
|
%
|
|||
Deferred income tax assets and liabilities as at
December 31, 2017
and
2016
relate to the following:
|
(US$ MILLIONS)
|
December 31, 2017
|
December 31, 2016
|
||||||
|
Non-capital losses (Canada)
|
$
|
83
|
|
$
|
76
|
|
||
|
Capital losses (Canada)
|
—
|
|
—
|
|
||||
|
Losses (U.S.)
|
7
|
|
5
|
|
||||
|
Losses (International)
|
122
|
|
—
|
|
||||
|
Difference in basis
|
(875
|
)
|
(51
|
)
|
||||
|
Total net deferred tax (liability)/asset
|
$
|
(663
|
)
|
$
|
30
|
|
||
|
Reflected in the statement of financial position as follows:
|
||||||||
|
Deferred income tax assets
|
174
|
|
111
|
|
||||
|
Deferred income tax liabilities
|
(837
|
)
|
(81
|
)
|
||||
|
Total net deferred tax (liability)/asset
|
$
|
(663
|
)
|
$
|
30
|
|
||
The deferred income tax movements are as follows:
|
(US$ MILLIONS)
|
December 31, 2017
|
December 31, 2016
|
||||||
|
Opening net deferred tax assets
|
$
|
30
|
|
$
|
(38
|
)
|
||
|
Recognized in income
|
22
|
|
41
|
|
||||
|
Recognized in other comprehensive income
|
—
|
|
6
|
|
||||
|
Recognized in other
(1)
|
(715
|
)
|
21
|
|
||||
|
Net deferred tax (liability)/assets
|
$
|
(663
|
)
|
$
|
30
|
|
||
____________________________________
|
(1)
|
The Other category primarily relates to adjustments made to our partnership's equity related to acquisitions and dispositions and the foreign exchange impact of the deferred tax asset calculated in the functional currency of the operating entities.
|
|
Brookfield Business Partners
|
F-56
|
BROOKFIELD BUSINESS PARTNERS L.P.
NOTES TO CONSOLIDATED FINANCIAL STATEMENTS (Continued)
As at December 31, 2017 and 2016 and for the years ended December 31, 2017, 2016 and 2015
The following table details the expiry date, if applicable, of the unrecognized deferred tax assets:
|
(US$ MILLIONS)
|
December 31, 2017
|
December 31, 2016
|
||||||
|
2018
|
$
|
1
|
|
$
|
—
|
|
||
|
2019
|
—
|
|
1
|
|
||||
|
2020 and after
|
272
|
|
264
|
|
||||
|
Do not expire
|
47
|
|
37
|
|
||||
|
Total
|
$
|
320
|
|
$
|
302
|
|
||
The components of the income taxes in other comprehensive income for the years ended
December 31, 2017
,
2016
, and
2015
are set out below:
|
(US$ MILLIONS)
|
2017
|
2016
|
2015
|
|||||||||
|
Available-for-sale securities
|
$
|
(1
|
)
|
$
|
1
|
|
$
|
(2
|
)
|
|||
|
Net investment hedges
|
(8
|
)
|
3
|
|
3
|
|
||||||
|
Cash flow hedges
|
10
|
|
(3
|
)
|
8
|
|
||||||
|
Equity accounted investments
|
(1
|
)
|
(7
|
)
|
—
|
|
||||||
|
Total deferred tax (expense) recovery in other comprehensive income
|
$
|
—
|
|
$
|
(6
|
)
|
$
|
9
|
|
|||
As at
December 31, 2017
, Brookfield Business Partners L.P.'s capital structure was comprised of two classes of partnership units; limited partnership units and general partnership units. Limited partnership units entitle the holder to their proportionate share of distributions. General partnership units entitle the holder the right to govern the financial and operating policies of Brookfield Business Partners L.P.
The general partnership units are not quantitatively material to the financial statements and therefore have not been separately presented on the consolidated statements for financial position.
Holding LP's capital structure is comprised of three classes of partnership units: managing general partner units held by Brookfield Business Partners L.P., special limited partner units held by Brookfield and redemption-exchange units held by Brookfield.
In its capacity as the holder of the special limited partner units of the Holding LP, the special limited partner is entitled to incentive distribution rights which are based on a
20%
increase in the unit price of the partnership over an initial threshold based on the volume-weighted average price of the units, subject to a high water mark. Distributions of
$142 million
were declared during the year ended December 31, 2017, of which
$95 million
have been paid. This related to an aggregate increase of
$6.19
/unit during the year ended December 31, 2017 from
$25.00
/unit to
$31.19
/unit. The threshold was reset to
$31.19
/unit.
Holding LP has issued
63 million
redemption-exchange units to Brookfield. Both the L.P. and G.P. units issued by Brookfield Business Partners L.P. and the redemption-exchange units issued by the Holding LP have the same economic attributes in all respects, except for the redemption right described in Note 1(b)(i).
As part of the spin-off, Brookfield subscribed for
$15 million
of preferred shares and
$250 million
of limited partnership units. The rights of the preferred shareholders are described in Note 1(b)(ii).
For the year ended
December 31, 2017
, the partnership distributed dividends to limited partner, general partner and redemption-exchange unitholders of
$31 million
, or approximately
$0.25
per partnership unit (2016:
$12 million
). For the year ended
December 31, 2017
, the partnership distributed to others who have interests in the operating subsidiaries
$388 million
, primarily related to the sale of the bath and shower products manufacturing business and dividend income (2016:
$40 million
).
|
F-57
|
Brookfield Business Partners
|
BROOKFIELD BUSINESS PARTNERS L.P.
NOTES TO CONSOLIDATED FINANCIAL STATEMENTS (Continued)
As at December 31, 2017 and 2016 and for the years ended December 31, 2017, 2016 and 2015
Equity offering
In December 2016, the partnership issued
8,000,000
limited partnership units at
$25
per unit, for gross proceeds of
$200 million
before
$8 million
in equity issuance costs. Concurrently, Holding LP issued
8,000,000
redemption-exchange units to Brookfield for proceeds of
$192 million
. The equity offering resulted in a decrease in Brookfield’s ownership in the partnership from
79%
to
75%
.
On September 26, 2017, the partnership issued
13,340,000
limited partnership units at
$30
per unit, for gross proceeds of approximately
$400 million
before
$8 million
in equity issuance costs. Concurrently, Holding LP issued approximately
6,945,000
redemption-exchange units to Brookfield for proceeds of approximately
$200 million
. The equity offering resulted in a decrease in Brookfield’s ownership in the partnership from
75%
to
69%
, before giving effect to the over-allotment option.
On October 26, 2017, the underwriters for the public offering of the limited partnership units that closed on September 26, 2017 purchased an additional
1,000,500
limited partnership units at a price of
$30
per unit, pursuant to the exercise of the underwriter's over-allotment option. The partnership received additional gross proceeds of approximately
$30 million
from the over-allotment option before approximately
$1 million
in equity issuance costs. This resulted in a decrease in Brookfield's ownership of the partnership to
68%
.
|
(a)
|
General and Limited Partnership Units
|
General and limited partnership units outstanding are as follows:
|
General Partner Units
|
Limited Partnership Units
|
Total
|
||||||||||||||||
|
UNITS
|
2017
|
2016
|
2017
|
2016
|
2017
|
2016
|
||||||||||||
|
Authorized and issued
|
||||||||||||||||||
|
Opening balance
|
|
4
|
|
|
—
|
|
|
51,845,298
|
|
|
—
|
|
|
51,845,302
|
|
|
—
|
|
|
Issued on spin-off
|
—
|
|
4
|
|
—
|
|
33,845,298
|
|
—
|
|
33,845,302
|
|
||||||
|
Issued for cash
|
—
|
|
—
|
|
14,340,500
|
|
18,000,000
|
|
14,340,500
|
|
18,000,000
|
|
||||||
|
On issue at December 31
|
4
|
|
4
|
|
66,185,798
|
|
51,845,298
|
|
66,185,802
|
|
51,845,302
|
|
||||||
The weighted average number of general partner units outstanding for the year ended
December 31, 2017
was
4
(
2016
:
4
). The weighted average number of limited partnership units outstanding for the year ended
December 31, 2017
was
55.5 million
(
2016
:
44.3 million
).
|
(b)
|
Redemption-Exchange Units held by Brookfield
|
|
Redemption-Exchange Units held by Brookfield
|
||||||
|
UNITS
|
2017
|
2016
|
||||
|
Authorized and issued
|
||||||
|
Opening balance
|
|
56,150,497
|
|
|
—
|
|
|
Issued on spin-off
|
—
|
|
48,150,497
|
|
||
|
Issued for cash
|
6,945,000
|
|
8,000,000
|
|
||
|
On issue at December 31
|
63,095,497
|
|
56,150,497
|
|
||
The weighted average number of redemption-exchange units outstanding for the year ended
December 31, 2017
was
58 million
(
2016
:
48.6 million
).
|
F-58
|
Brookfield Business Partners
|
BROOKFIELD BUSINESS PARTNERS L.P.
NOTES TO CONSOLIDATED FINANCIAL STATEMENTS (Continued)
As at December 31, 2017 and 2016 and for the years ended December 31, 2017, 2016 and 2015
|
(c)
|
Special Limited Partner Units held by Brookfield
|
|
Special Limited Partner Units held by Brookfield
|
||||||
|
UNITS
|
2017
|
2016
|
||||
|
Authorized and issued
|
||||||
|
Opening balance
|
|
4
|
|
|
—
|
|
|
Issued on spin-off
|
—
|
|
4
|
|
||
|
On issue at December 31
|
4
|
|
4
|
|
||
The weighted average number of special limited partner units outstanding for the year ended
December 31, 2017
was
4
(
2016
:
4
).
|
(d)
|
Preferred Shares held by Brookfield
|
(e)
|
Preferred Shares held by Brookfield
|
||||||
|
UNITS
|
2017
|
2016
|
||||
|
Authorized and issued
|
||||||
|
Opening balance
|
|
200,002
|
|
|
—
|
|
|
Issued on spin-off
|
—
|
|
200,002
|
|
||
|
On issue at December 31
|
200,002
|
|
200,002
|
|
||
Earnings per limited partner unit
Net loss attributable to limited partnership unitholders was
$58 million
for the year ended
December 31, 2017
. The weighted average number of limited partnership units was
55.5 million
for the year ended
December 31, 2017
.
|
(a)
|
Attributable to Limited Partners
|
|
(US$ MILLIONS)
|
Foreign currency
translation
|
Available for sale
|
Other
(1)
|
Accumulated other
comprehensive
income (loss)
|
||||||||||||
|
Balance as at January 1, 2017
|
$
|
(148
|
)
|
$
|
4
|
|
$
|
3
|
|
$
|
(141
|
)
|
||||
|
Other comprehensive income (loss)
|
37
|
|
2
|
|
(10
|
)
|
29
|
|
||||||||
|
Balance as at December 31, 2017
|
$
|
(111
|
)
|
$
|
6
|
|
$
|
(7
|
)
|
$
|
(112
|
)
|
||||
____________________________________
|
(1)
|
Represents net investment hedges, cash flow hedges and other reserves.
|
|
F-59
|
Brookfield Business Partners
|
BROOKFIELD BUSINESS PARTNERS L.P.
NOTES TO CONSOLIDATED FINANCIAL STATEMENTS (Continued)
As at December 31, 2017 and 2016 and for the years ended December 31, 2017, 2016 and 2015
|
(US$ MILLIONS)
|
Foreign currency
translation
|
Available for sale
|
Other
(1)
|
Accumulated other
comprehensive
income (loss)
|
||||||||||||
|
Balance as at January 1, 2016
|
$
|
—
|
|
$
|
—
|
|
$
|
—
|
|
$
|
—
|
|
||||
|
Other comprehensive income (loss)
|
(21
|
)
|
13
|
|
—
|
|
(8
|
)
|
||||||||
|
Ownership changes
|
—
|
|
—
|
|
(2
|
)
|
(2
|
)
|
||||||||
|
Unit issuance / reorganization
|
(127
|
)
|
(9
|
)
|
5
|
|
(131
|
)
|
||||||||
|
Balance as at December 31, 2016
|
$
|
(148
|
)
|
$
|
4
|
|
$
|
3
|
|
$
|
(141
|
)
|
||||
____________________________________
|
(1)
|
Represents net investment hedges, cash flow hedges and other reserves.
|
|
(b)
|
Attributable to General Partner and Special Limited Partners
|
Accumulated other comprehensive income attributable to general partner and special limited partners has not been disclosed as collectively these partners hold
8
units, thus the figures are immaterial.
|
(c)
|
Attributable to Non-controlling interest — Redemption-Exchange Units held by Brookfield Asset Management Inc.
|
|
(US$ MILLIONS)
|
Foreign currency
translation
|
Available for sale
|
Other
(1)
|
Accumulated other
comprehensive
income (loss)
|
||||||||||||
|
Balance as at January 1, 2017
|
$
|
(205
|
)
|
$
|
2
|
|
$
|
6
|
|
$
|
(197
|
)
|
||||
|
Other comprehensive income (loss)
|
40
|
|
2
|
|
(10
|
)
|
32
|
|
||||||||
|
Balance as at December 31, 2017
|
$
|
(165
|
)
|
$
|
4
|
|
$
|
(4
|
)
|
$
|
(165
|
)
|
||||
____________________________________
|
(1)
|
Represents net investment hedges, cash flow hedges and other reserves.
|
|
(US$ MILLIONS)
|
Foreign currency
translation
|
Available for sale
|
Other
(1)
|
Accumulated other
comprehensive
income (loss)
|
||||||||||||
|
Balance as at January 1, 2016
|
$
|
—
|
|
$
|
—
|
|
$
|
—
|
|
$
|
—
|
|
||||
|
Other comprehensive income (loss)
|
(24
|
)
|
15
|
|
1
|
|
(8
|
)
|
||||||||
|
Ownership changes
|
—
|
|
—
|
|
(2
|
)
|
(2
|
)
|
||||||||
|
Unit issuance / reorganization
|
(181
|
)
|
(13
|
)
|
7
|
|
(187
|
)
|
||||||||
|
Balance as at December 31, 2016
|
$
|
(205
|
)
|
$
|
2
|
|
$
|
6
|
|
$
|
(197
|
)
|
||||
____________________________________
|
(1)
|
Represents net investment hedges, cash flow hedges and other reserves.
|
|
F-60
|
Brookfield Business Partners
|
BROOKFIELD BUSINESS PARTNERS L.P.
NOTES TO CONSOLIDATED FINANCIAL STATEMENTS (Continued)
As at December 31, 2017 and 2016 and for the years ended December 31, 2017, 2016 and 2015
|
(d)
|
Attributable to Brookfield Asset Management Inc.
|
|
(US$ MILLIONS)
|
Foreign currency
translation
|
Available for sale
|
Other
(1)
|
Accumulated other
comprehensive
income (loss)
|
||||||||||||
|
Balance as at January 1, 2016
|
$
|
(358
|
)
|
$
|
(35
|
)
|
$
|
33
|
|
$
|
(360
|
)
|
||||
|
Other comprehensive income (loss)
|
53
|
|
13
|
|
(16
|
)
|
50
|
|
||||||||
|
Net increase/decrease in parent company investment
|
(3
|
)
|
—
|
|
(5
|
)
|
(8
|
)
|
||||||||
|
Balance as at Unit issuance/reorganization
|
308
|
|
22
|
|
(12
|
)
|
318
|
|
||||||||
|
Balance as at December 31, 2016
|
$
|
—
|
|
$
|
—
|
|
$
|
—
|
|
$
|
—
|
|
||||
____________________________________
|
(1)
|
Represents net investment hedges, cash flow hedges and other reserves.
|
|
(US$ MILLIONS)
|
Foreign currency
translation
|
Available for sale
|
Other
(1)
|
Accumulated other
comprehensive
income (loss)
|
||||||||||||
|
Balance as at January 1, 2015
|
$
|
(193
|
)
|
$
|
(12
|
)
|
$
|
—
|
|
$
|
(205
|
)
|
||||
|
Other comprehensive income (loss)
|
(176
|
)
|
(23
|
)
|
36
|
|
(163
|
)
|
||||||||
|
Net increase/decrease in parent company investment
|
11
|
|
—
|
|
(3
|
)
|
8
|
|
||||||||
|
Balance as at Unit issuance/reorganization
|
—
|
|
—
|
|
—
|
|
—
|
|
||||||||
|
Balance as at December 31, 2015
|
$
|
(358
|
)
|
$
|
(35
|
)
|
$
|
33
|
|
$
|
(360
|
)
|
||||
____________________________________
|
(1)
|
Represents net investment hedges, cash flow hedges and other reserves.
|
The partnership has no key employees or directors and does not remunerate key management personnel.
Details of the allocations of costs incurred by Brookfield on behalf of our partnership are disclosed in Note 24.
Key decision makers of the partnership are all employees of the ultimate parent company or its subsidiaries, which provides management services under the master services agreement with Brookfield.
Direct operating costs include all attributable expenses except interest, depreciation and amortization, impairment expense, other expenses, and taxes and primarily relate to cost of sales and compensation. The following table lists direct operating costs for the year ended
2017
,
2016
, and
2015
by nature:
|
(US$ MILLIONS)
|
2017
|
2016
|
2015
|
|||||||||
|
Cost of sales
|
$
|
20,276
|
|
$
|
6,021
|
|
$
|
5,006
|
|
|||
|
Compensation
|
1,568
|
|
1,346
|
|
1,110
|
|
||||||
|
Property taxes, sales taxes and other
|
32
|
|
19
|
|
16
|
|
||||||
|
Total
|
$
|
21,876
|
|
$
|
7,386
|
|
$
|
6,132
|
|
|||
|
F-61
|
Brookfield Business Partners
|
BROOKFIELD BUSINESS PARTNERS L.P.
NOTES TO CONSOLIDATED FINANCIAL STATEMENTS (Continued)
As at December 31, 2017 and 2016 and for the years ended December 31, 2017, 2016 and 2015
In the normal course of operations, the partnership's operating subsidiaries have bank guarantees, insurance bonds and letters of credit outstanding to third parties. As at
December 31, 2017
the total outstanding amount was
$1,614 million
(
2016
:
$1,093 million
). The partnership does not conduct its operations, other than those of equity accounted investments, through entities that are not consolidated in these financial statements, and has not guaranteed or otherwise contractually committed to support any material financial obligations not reflected in these financial statements.
The partnership and its subsidiaries are contingently liable with respect to litigation and claims that arise in the normal course of operations. It is not expected that any of the ongoing litigation and claims as at
December 31, 2017
could result in a material settlement liability to our partnership.
Escrow and Trust Deposits
As a service to its customers,
two
of the partnership's operating subsidiaries administer escrow and trust deposits which represent undisbursed amounts received for the settlement of certain transactions. These escrow and trust deposits as at
December 31, 2017
totaled
$96 million
(
2016
:
$73 million
). These escrow and trust deposits are not assets of the partnership and, therefore, are excluded from the accompanying consolidated statements of financial position. However, the partnership remains contingently liable for the disposition of these deposits.
|
(a)
|
Commitments
|
In the normal course of business, the partnership will enter into contractual obligations which relate to the gathering, processing and transportation delivery agreements for oil and gas products in our energy business. As at
December 31, 2017
our partnership had
$200 million
(
2016
:
$35 million
) of such commitments outstanding. Also in the normal course of business, the partnership will enter into supply agreements for raw materials and capital items in our industrial operations. As at
December 31, 2017
, the partnership had
$1 million
(
2016
:
$11 million
) of such commitments outstanding. Finally, in the normal course of business, the partnership will enter into contractual obligations which relate primarily to expenditures on property, plant and equipment, and intangible assets within business services. As at December 31, 2017, the partnership had
$17 million
(2016: $
nil
) of such commitments outstanding.
|
(b)
|
Obligations under finance leases
|
As at
December 31, 2017
the minimum lease payments for the partnership's assets under finance lease are as follows:
|
(US$ MILLIONS)
|
1 Year
|
2-5 Years
|
Total
|
|||||||||
|
Minimum lease payments
|
$
|
11
|
|
$
|
6
|
|
$
|
17
|
|
|||
|
Total finance lease obligations
|
$
|
11
|
|
$
|
6
|
|
$
|
17
|
|
|||
|
(c)
|
Obligations under operating leases
|
As at
December 31, 2017
the minimum lease payments for the partnership's assets under operating lease are as follows:
|
(US$ MILLIONS)
|
1 Year
|
2-5 Years
|
5+ Years
|
Total
|
||||||||||||
|
Minimum lease payments
|
$
|
107
|
|
$
|
267
|
|
$
|
274
|
|
$
|
648
|
|
||||
|
Total operating lease obligations
|
$
|
107
|
|
$
|
267
|
|
$
|
274
|
|
$
|
648
|
|
||||
Lease expenses recognized during the year ended
December 31, 2017
totaled
$125 million
(2016:
$48 million
, 2015:
$35 million
).
|
F-62
|
Brookfield Business Partners
|
BROOKFIELD BUSINESS PARTNERS L.P.
NOTES TO CONSOLIDATED FINANCIAL STATEMENTS (Continued)
As at December 31, 2017 and 2016 and for the years ended December 31, 2017, 2016 and 2015
In the normal course of operations, the partnership entered into the transactions below with related parties on exchange value. These transactions have been measured at fair value and are recognized in the financial statements.
|
(a)
|
Corporate allocations and parent company’s investment
|
As discussed in Note 2(a), prior to the spin-off, general corporate expenses of Brookfield were allocated to our partnership. General corporate expenses allocated to our partnership for the year ended
December 31, 2017
were $
nil
(2016:
$6 million
, 2015:
$6 million
).
|
(b)
|
Transactions with the parent company
|
As at
December 31, 2017
,
$nil
(2016: $
nil
) was drawn on the credit facilities under the Brookfield Credit Agreements.
As described in Note 1(b)(iv), at the time of the spin-off, the partnership entered into a Deposit Agreement with Brookfield. From time to time, the partnership may place funds on deposit with Brookfield. The deposit balance is due on demand and earns a market rate interest. As at
December 31, 2017
,
$384 million
(
2016
:
$519 million
) was on deposit in relation to this agreement and was included in cash and cash equivalents. For the year ended
December 31, 2017
, the partnership earned interest income of
$6 million
(
2016
:
$1 million
) on these deposits.
As described in Note 1(b)(iv), at the time of the spin-off, the partnership entered into a Master Services Agreement with its Service Providers, which are wholly-owned subsidiaries of Brookfield. For purposes of calculating the base management fee, the total capitalization of Brookfield Business Partners L.P. is equal to the quarterly volume-weighted average trading price of a unit on the principal stock exchange for the partnership units (based on trading volumes) multiplied by the number of units outstanding at the end of the quarter (assuming full conversion of the redemption-exchange units into units of Brookfield Business Partners L.P.), plus the value of securities of the other Service Recipients that are not held by the partnership, plus all outstanding third party debt with recourse to a Service Recipient, less all cash held by such entities. The base management fee for the year ended
December 31, 2017
was
$33 million
(
2016
:
$12 million
).
In its capacity as the holder of the special limited partner (“Special LP”) units of Holding LP, Brookfield is entitled to incentive distribution rights. The total incentive distribution for the year ended December 31, 2017 was
$142 million
(
2016
:
$nil
).
The partnership entered into a number of hedges of net investments in foreign operations with Brookfield. For the year ended
December 31, 2017
, unrealized losses of $
nil
(
2016
:
$9 million
gain; 2015:
$nil
). The total amount recorded as a financial asset as at
December 31, 2017
is $
nil
(
2016
:
$12 million
) and the total amount recorded as a financial liability as at
December 31, 2017
is
$nil
(
2016
:
$nil
).
In addition, at the time of spin-off, the partnership entered into indemnity agreements with Brookfield that relate to certain projects in certain regions that were in place prior to the spin-off. Under these indemnity agreements, Brookfield has agreed to indemnify us for the receipt of payments relating to such projects.
|
F-63
|
Brookfield Business Partners
|
BROOKFIELD BUSINESS PARTNERS L.P.
NOTES TO CONSOLIDATED FINANCIAL STATEMENTS (Continued)
As at December 31, 2017 and 2016 and for the years ended December 31, 2017, 2016 and 2015
|
(c)
|
Other
|
The following table summarizes other transactions the partnership has entered into with related parties:
|
|
Year Ended
|
||||||||||
|
(US$ MILLIONS)
|
December 31, 2017
|
December 31, 2016
|
December 31, 2015
|
||||||||
|
Transactions during the period
(1)
|
|
|
|
||||||||
|
Construction revenues
|
$
|
357
|
|
$
|
359
|
|
$
|
413
|
|
||
|
Business services revenues
|
1
|
|
8
|
|
—
|
|
|||||
|
$
|
358
|
|
$
|
367
|
|
$
|
413
|
|
|||
____________________________________
|
(1)
|
Within our construction services business, the partnership provides construction services to an affiliate of Brookfield. Within our business services segment, the partnership provides real estate financial advisory services to affiliates of Brookfield.
|
|
(US$ MILLIONS)
|
December 31, 2017
|
December 31, 2016
|
|||||
|
Balances at end of period:
|
|
|
|||||
|
Accounts receivable
|
$
|
64
|
|
$
|
97
|
|
|
|
Accounts payable and other
|
$
|
106
|
|
$
|
47
|
|
|
Equity in net assets attributable to parent company
"Net increase (decrease) in parent company investment" as shown in the consolidated statements of changes in equity represent the parent company's historical investment in our partnership, accumulated net income and the net effect of the transactions and allocations from the parent company. The total net effect of transactions with the parent company is reflected in the consolidated statements of cash flow as a financing activity and in the consolidated statements of financial position as "Equity in net assets attributable to parent company". All significant intercompany transactions between the partnership and the parent company have been considered to be forgiven at the time the transaction is recorded and reflected as "net increase (decrease) in parent company investment".
|
F-64
|
Brookfield Business Partners
|
BROOKFIELD BUSINESS PARTNERS L.P.
NOTES TO CONSOLIDATED FINANCIAL STATEMENTS (Continued)
As at December 31, 2017 and 2016 and for the years ended December 31, 2017, 2016 and 2015
The partnership's activities expose it to a variety of financial risks, including market risk (currency risk, interest rate risk, commodity risk and other price risks), credit risk and liquidity risk. The partnership and its subsidiaries selectively use derivative financial instruments principally to manage these risks.
The aggregate notional amounts of the partnership's derivative positions at
December 31, 2017
and
2016
were as follows:
|
(US$ MILLIONS)
|
Note
|
2017
|
2016
|
|||||||
|
Foreign exchange contracts
(1)
|
(a)
|
$
|
1,243
|
|
$
|
761
|
|
|||
|
Commodity contracts
|
(b)
|
—
|
|
—
|
|
|||||
|
|
$
|
1,243
|
|
$
|
761
|
|
||||
____________________________________
|
(1)
|
Notional amounts are presented on a net basis for those derivative instruments that are offset.
|
Other Information Regarding Derivative Financial Instruments
The following table presents the notional amounts underlying the partnership's derivative instruments by term to maturity as at
December 31, 2017
and the comparative notional amounts as at
December 31, 2016
, for both derivatives that are classified as fair value through profit of loss and derivatives that qualify for hedge accounting:
|
2017
|
2016
|
||||||||||||||||
|
(US$ MILLIONS)
|
Note
|
< 1 year
|
1 to 5 years
|
Total notional amount
|
Total notional amount
|
||||||||||||
|
Fair value through profit or loss
|
|||||||||||||||||
|
Foreign exchange contracts
|
(a)
|
$
|
286
|
|
$
|
—
|
|
$
|
286
|
|
$
|
36
|
|
||||
|
Commodity swap contracts
|
(b)
|
—
|
|
—
|
|
—
|
|
—
|
|
||||||||
|
Option contracts
|
(c)
|
—
|
|
—
|
|
—
|
|
—
|
|
||||||||
|
Elected for hedge accounting
|
|||||||||||||||||
|
Foreign exchange contracts
|
(a)
|
957
|
|
—
|
|
957
|
|
725
|
|
||||||||
|
$
|
1,243
|
|
$
|
—
|
|
$
|
1,243
|
|
$
|
761
|
|
||||||
|
F-65
|
Brookfield Business Partners
|
BROOKFIELD BUSINESS PARTNERS L.P.
NOTES TO CONSOLIDATED FINANCIAL STATEMENTS (Continued)
As at December 31, 2017 and 2016 and for the years ended December 31, 2017, 2016 and 2015
|
(a)
|
Foreign exchange contracts
|
The partnership held the following foreign exchange contracts with notional amounts at
December 31, 2017
and
2016
.
|
Notional amount (U.S. Dollars)
|
Average exchange rate
|
||||||||||||
|
2017
|
2016
|
2017
|
2016
|
||||||||||
|
Foreign exchange contracts
|
|||||||||||||
|
Australian Dollars
|
|||||||||||||
|
Buy
|
$
|
(319
|
)
|
$
|
(10
|
)
|
0.76
|
|
0.74
|
|
|||
|
Sell
(1)
|
510
|
|
485
|
|
0.75
|
|
0.74
|
|
|||||
|
Euros
|
|||||||||||||
|
Buy
|
(11
|
)
|
—
|
|
1.15
|
|
—
|
|
|||||
|
Sell
|
46
|
|
43
|
|
1.20
|
|
1.06
|
|
|||||
|
Canadian Dollars
|
|||||||||||||
|
Buy
|
(1
|
)
|
(18
|
)
|
0.79
|
|
0.74
|
|
|||||
|
Sell
|
786
|
|
260
|
|
0.78
|
|
0.76
|
|
|||||
|
British Pounds
|
|||||||||||||
|
Buy
|
(118
|
)
|
—
|
|
1.33
|
|
—
|
|
|||||
|
Sell
|
208
|
|
—
|
|
1.33
|
|
—
|
|
|||||
|
Indian Rupees
|
|||||||||||||
|
Sell
|
154
|
|
—
|
|
0.01
|
|
—
|
|
|||||
|
Japanese Yen
|
|||||||||||||
|
Sell
|
3
|
|
3
|
|
0.01
|
|
0.01
|
|
|||||
|
Mexican Pesos
|
|||||||||||||
|
Buy
|
(5
|
)
|
(2
|
)
|
0.05
|
|
0.05
|
|
|||||
|
Chinese Yuan
|
|||||||||||||
|
Buy
|
(11
|
)
|
—
|
|
0.15
|
|
—
|
|
|||||
|
South Africa Rand
|
|||||||||||||
|
Sell
|
1
|
|
—
|
|
0.08
|
|
—
|
|
|||||
|
$
|
1,243
|
|
$
|
761
|
|
||||||||
____________________________________
|
(1)
|
As at December 31, 2016, a number of foreign exchange contracts were with a related party. As at December 31, 2017, no foreign exchange contracts were with a related party.
|
|
F-66
|
Brookfield Business Partners
|
BROOKFIELD BUSINESS PARTNERS L.P.
NOTES TO CONSOLIDATED FINANCIAL STATEMENTS (Continued)
As at December 31, 2017 and 2016 and for the years ended December 31, 2017, 2016 and 2015
|
(b)
|
Commodity Contracts
|
The partnership held the following commodity contracts as at
December 31, 2017
:
|
(US$ MILLIONS)
|
Total volume
|
Weighted average
price range
|
Remaining term
|
Fair market
value asset (liability)
|
|||||
|
Commodity swap - natural gas
|
260,663 Mcf/d
|
(USD$/Mcf) - $1.98 - $2.76
|
Jan 2018 - Mar 2019
|
$
|
27
|
|
|||
|
Commodity swap - palladium
|
67,850 Ounces
|
(USD$/Oz) - $908 - $995
|
Jan 2018 - May 2018
|
(7
|
)
|
||||
|
Commodity swap - fuel oil
|
3,087,000 Barrels
|
(USD$/Barrel) - $41 - $55
|
Jan 2018 - Jun 2022
|
5
|
|
||||
|
Sales and purchase contracts - gasoline
|
688,827 m3
|
(USD$/m3) - $315 - $581
|
Jan 2018 - Nov 2018
|
2
|
|
||||
|
Sales and purchase contracts - diesel
|
891,719 m3
|
(USD$/m3) - $250 - $598
|
Jan 2018 - Dec 2018
|
(1
|
)
|
||||
|
Sales and purchase contracts - fatty acid methyl esters
|
414,067 m3
|
(USD$/m3) - $868- $1079
|
Jan 2018 - Dec 2018
|
1
|
|
||||
|
Commodity swaps and futures - diesel, diesel premia, gasoline, crude
|
1,206,707 m3
|
(USD$/m3) - $334 - $548
|
Jan 2018 - Jun 2019
|
(11
|
)
|
||||
|
Commodity swaps and futures - ethanol, biodiesel premia, wheat
|
280,270 m3
|
(USD$/m3) - $249 - $495
|
Jan 2018 - Sep 2018
|
3
|
|
||||
|
$
|
19
|
|
|||||||
|
(c)
|
Option contracts
|
At
December 31, 2017
, our company held call options with a fair value of $
12 million
(
2016
:
$20 million
) and offsetting put options with a fair value of $
10 million
(
2016
:
$11 million
) related to one of our equity accounted investments. The fair value of the options as at
December 31, 2017
was determined using level 3 inputs. Refer to Note 4 for further information.
|
F-67
|
Brookfield Business Partners
|
BROOKFIELD BUSINESS PARTNERS L.P.
NOTES TO CONSOLIDATED FINANCIAL STATEMENTS (Continued)
As at December 31, 2017 and 2016 and for the years ended December 31, 2017, 2016 and 2015
The partnership recognizes that risk management is an integral part of good management practice.
The partnership is exposed to the following risks as a result of holding financial instruments: capital risk; commodity price risk; liquidity risk; market risk (i.e., interest rate risk and foreign currency risk); and credit risk. The following is a description of these risks and how they are managed:
|
(a)
|
Capital Risk Management
|
The capital structure of our partnership consists of debt, offset by cash, and equity comprised of accumulated gains.
|
(US$ MILLIONS)
|
2017
|
2016
|
||||||
|
Borrowings
|
$
|
3,265
|
|
$
|
1,551
|
|
||
|
Cash
|
(1,106
|
)
|
(1,050
|
)
|
||||
|
Net debt
|
2,159
|
|
501
|
|
||||
|
Total equity
|
6,064
|
|
4,038
|
|
||||
|
Total capital and net debt
|
$
|
8,223
|
|
$
|
4,539
|
|
||
|
Net debt to capitalization ratio
|
26
|
%
|
11
|
%
|
||||
The partnership
manages its debt exposure by financing its operations on a non-recourse basis with prudent levels of debt, ensuring a diversity of funding sources as well as managing its maturity profile. The partnership also borrows in the currency where the asset operates, where possible, in order to hedge its currency risk.
The partnership’s financing plan is to fund its recurring growth capital expenditures with cash flow generated by its operations after maintenance capital expenditure, as well as debt financing that is sized to maintain its credit profile. To fund large scale development projects and acquisitions, our partnership will evaluate a variety of capital sources including proceeds from selling non-core and mature assets, equity and debt financing. The partnership will seek to raise additional equity if our partnership believes it can earn returns on these investments in excess of the cost of the incremental partnership capital.
As disclosed within Note 17, the partnership has various loan facilities in place. In certain cases, the facilities have financial covenants which are generally in the form of interest coverage ratios and leverage ratios. The partnership does not have any market capitalization covenants attached to any of its borrowings, nor does it have any other externally imposed capital requirements.
(b) Commodity Price Ris
k
Commodity price risk is the risk that the fair value of financial instruments will fluctuate as a result of changes in commodity prices. Certain of our partnership’s operating subsidiaries are exposed to commodity risk. A 10 basis point increase or decrease in commodity prices, as it relates to financial instruments, does not have a material impact on our partnership’s net income.
(c) Liquidity Risk Management
The partnership maintains sufficient financial liquidity to be able to meet on-going operating requirements and to be able to participate in acquisitions. Principal liquidity needs for the next year include, funding recurring expenses, meeting debt service payments, funding required capital expenditures and funding acquisition opportunities as they arise. The operating subsidiaries of our partnership also generate liquidity by accessing capital markets on an opportunistic basis.
|
F-68
|
Brookfield Business Partners
|
BROOKFIELD BUSINESS PARTNERS L.P.
NOTES TO CONSOLIDATED FINANCIAL STATEMENTS (Continued)
As at December 31, 2017 and 2016 and for the years ended December 31, 2017, 2016 and 2015
The following tables detail the contractual maturities for our partnership’s financial liabilities. The tables reflect the undiscounted cash flows of financial liabilities based on the earliest date on which our partnership can be required to pay. The tables include both interest and principal cash flows:
|
December 31, 2017
|
|||||||||||||||||||
|
(US$ MILLIONS)
|
Less than 1 year
|
1-2 years
|
2-5 years
|
5+ years
|
Total contractual cash flows
|
||||||||||||||
|
Non-derivative financial liabilities
|
|||||||||||||||||||
|
Accounts payable and other liabilities
(1)
|
$
|
4,677
|
|
$
|
280
|
|
$
|
155
|
|
$
|
118
|
|
$
|
5,230
|
|
||||
|
Interest-bearing liabilities
|
825
|
|
801
|
|
1,075
|
|
584
|
|
3,285
|
|
|||||||||
|
Finance lease liabilities
|
11
|
|
4
|
|
2
|
|
—
|
|
17
|
|
|||||||||
|
(1)
|
Excludes
$285 million
of decommissioning liabilities, other provisions, and post-employment benefits,
$17 million
of capital leases, and
$106 million
of loans and notes payable.
|
|
December 31, 2016
|
|||||||||||||||||||
|
(US$ MILLIONS)
|
Less than 1 year
|
1-2 years
|
2-5 years
|
5+ years
|
Total contractual cash flows
|
||||||||||||||
|
Non-derivative financial liabilities
|
|||||||||||||||||||
|
Accounts payable and other liabilities
(1)
|
$
|
2,007
|
|
$
|
132
|
|
$
|
1
|
|
$
|
1
|
|
$
|
2,141
|
|
||||
|
Interest-bearing liabilities
|
411
|
|
647
|
|
510
|
|
4
|
|
1,572
|
|
|||||||||
|
Finance lease liabilities
|
8
|
|
6
|
|
2
|
|
—
|
|
16
|
|
|||||||||
|
(1)
|
Excludes
$279 million
of dec
ommissioning liabilities, other provisions, and post-employment benefits,
$16 million
of capital leases, and
$21 million
of loans and notes payable.
|
(d) Market Risk
Market risk is defined for these purposes as the risk that the fair value or future cash flows of a financial instrument held by our partnership will fluctuate because of changes in market prices. Market risk includes the risk of changes in interest rates, currency exchange rates and changes in market prices due to factors other than interest rates or currency exchange rates, such as changes in equity prices, commodity prices or credit spreads.
Financial instruments held by our partnership that are subject to market risk include other financial assets, borrowings, derivative instruments, such as interest rate and foreign currency contracts, and marketable securities.
The partnership is exposed to price risks arising from marketable securities and other financial assets. As at
December 31, 2017
the balance of the portfolio was $
461 million
(
2016
:
$426 million
), a 10% change in the value of the portfolio would impact our equity by
$46 million
(
2016
:
$43 million
) and result in an impact on the consolidated statements of comprehensive income of
$46 million
(
2016
:
$43 million
).
Interest Rate Risk Management
The observable impacts on the fair values and future cash flows of financial instruments that can be directly attributable to interest rate risk include changes in the net income from financial instruments whose cash flows are determined with reference to floating interest rates and changes in the value of financial instruments whose cash flows are fixed in nature. A 10 basis point increase or decrease in the interest rates does not have a material impact on our partnership’s net income.
|
F-69
|
Brookfield Business Partners
|
BROOKFIELD BUSINESS PARTNERS L.P.
NOTES TO CONSOLIDATED FINANCIAL STATEMENTS (Continued)
As at December 31, 2017 and 2016 and for the years ended December 31, 2017, 2016 and 2015
Foreign Currency Risk Management
Changes in currency rates will impact the carrying value of financial instruments and our partnership’s net investment and cash flows denominated in currencies other than the U.S. dollar. The tables below set out our partnership’s currency exposure at
December 31, 2017
and
2016
:
|
2017
|
||||||||||||||||||||||||||||||||
|
USD
|
AUD
|
GBP
|
CAD
|
EUR
|
BRL
|
Other
|
Total
|
|||||||||||||||||||||||||
|
Assets
|
||||||||||||||||||||||||||||||||
|
Current assets
|
$
|
1,482
|
|
$
|
497
|
|
$
|
1,871
|
|
$
|
1,232
|
|
$
|
142
|
|
$
|
487
|
|
$
|
722
|
|
$
|
6,433
|
|
||||||||
|
Non-current assets
|
1,655
|
|
817
|
|
512
|
|
2,329
|
|
204
|
|
3,535
|
|
319
|
|
9,371
|
|
||||||||||||||||
|
$
|
3,137
|
|
$
|
1,314
|
|
$
|
2,383
|
|
$
|
3,561
|
|
$
|
346
|
|
4,022
|
|
$
|
1,041
|
|
$
|
15,804
|
|
||||||||||
|
Liabilities
|
||||||||||||||||||||||||||||||||
|
Current liabilities
|
$
|
817
|
|
$
|
594
|
|
$
|
2,108
|
|
$
|
1,294
|
|
$
|
81
|
|
$
|
306
|
|
$
|
490
|
|
$
|
5,690
|
|
||||||||
|
Non-current liabilities
|
816
|
|
78
|
|
143
|
|
743
|
|
28
|
|
2,096
|
|
146
|
|
4,050
|
|
||||||||||||||||
|
$
|
1,633
|
|
$
|
672
|
|
$
|
2,251
|
|
$
|
2,037
|
|
$
|
109
|
|
$
|
2,402
|
|
$
|
636
|
|
$
|
9,740
|
|
|||||||||
|
Non-controlling interest
(1)
|
430
|
|
101
|
|
4
|
|
897
|
|
134
|
|
1,250
|
|
210
|
|
3,026
|
|
||||||||||||||||
|
Net investment to the partnership
|
$
|
1,074
|
|
$
|
541
|
|
$
|
128
|
|
$
|
627
|
|
$
|
103
|
|
$
|
370
|
|
$
|
195
|
|
$
|
3,038
|
|
||||||||
____________________________________
|
(1)
|
Relates to the interests of others.
|
|
2016
|
||||||||||||||||||||||||||||
|
USD
|
AUD
|
GBP
|
CAD
|
EUR
|
Other
|
Total
|
||||||||||||||||||||||
|
Assets
|
||||||||||||||||||||||||||||
|
Current assets
|
$
|
1,366
|
|
$
|
361
|
|
$
|
384
|
|
$
|
1,197
|
|
$
|
62
|
|
$
|
706
|
|
$
|
4,076
|
|
|||||||
|
Non-current assets
|
930
|
|
732
|
|
51
|
|
1,862
|
|
162
|
|
380
|
|
4,117
|
|
||||||||||||||
|
$
|
2,296
|
|
$
|
1,093
|
|
$
|
435
|
|
$
|
3,059
|
|
$
|
224
|
|
$
|
1,086
|
|
$
|
8,193
|
|
||||||||
|
Liabilities
|
||||||||||||||||||||||||||||
|
Current liabilities
|
$
|
345
|
|
$
|
434
|
|
$
|
419
|
|
$
|
860
|
|
$
|
25
|
|
$
|
473
|
|
$
|
2,556
|
|
|||||||
|
Non-current liabilities
|
620
|
|
74
|
|
35
|
|
794
|
|
27
|
|
49
|
|
1,599
|
|
||||||||||||||
|
$
|
965
|
|
$
|
508
|
|
$
|
454
|
|
$
|
1,654
|
|
$
|
52
|
|
$
|
522
|
|
$
|
4,155
|
|
||||||||
|
Non-controlling interest
(1)
|
416
|
|
99
|
|
3
|
|
828
|
|
114
|
|
77
|
|
1,537
|
|
||||||||||||||
|
Net investment to the partnership
|
$
|
915
|
|
$
|
486
|
|
$
|
(22
|
)
|
$
|
577
|
|
$
|
58
|
|
$
|
487
|
|
$
|
2,501
|
|
|||||||
____________________________________
|
(1)
|
Relates to the interests of others.
|
|
F-70
|
Brookfield Business Partners
|
BROOKFIELD BUSINESS PARTNERS L.P.
NOTES TO CONSOLIDATED FINANCIAL STATEMENTS (Continued)
As at December 31, 2017 and 2016 and for the years ended December 31, 2017, 2016 and 2015
The partnership is structured such that its foreign operations are primarily conducted by entities with a functional currency which is the same as the economic environment in which the operations take place. As a result, the net income impact of currency risk associated with financial instruments is limited as its financial assets and liabilities are generally denominated in the functional currency of the subsidiary that holds the financial instrument. However, our partnership is exposed to foreign currency risk on the net assets of its foreign currency denominated operations. The partnership’s exposures to foreign currencies and the sensitivity of net income and other comprehensive income, on a pre-tax basis, to a 10% change in the exchange rates relative to the United States dollar is summarized below:
|
|
December 31, 2017
|
||||||||||
|
(US$ MILLIONS)
|
Equity attributable to unitholders - (Originating currency)
|
OCI attributable to unitholders
|
Net income attributable to unitholders
|
||||||||
|
Australian dollar
|
$
|
1,266
|
|
$
|
(88
|
)
|
$
|
—
|
|
||
|
Canadian dollar
|
791
|
|
(37
|
)
|
—
|
|
|||||
|
Brazilian real
|
1,095
|
|
(33
|
)
|
—
|
|
|||||
|
Other
|
484
|
|
(9
|
)
|
(20
|
)
|
|||||
|
|
December 31, 2016
|
||||||||||
|
(US$ MILLIONS)
|
Equity attributable to unitholders - (Originating currency)
|
OCI attributable to unitholders
|
Net income attributable to unitholders
|
||||||||
|
Australian dollar
|
$
|
1,271
|
|
$
|
(55
|
)
|
$
|
—
|
|
||
|
Canadian dollar
|
773
|
|
(50
|
)
|
—
|
|
|||||
|
Other
|
343
|
|
(3
|
)
|
1
|
|
|||||
|
|
December 31, 2015
|
||||||||||
|
(US$ MILLIONS)
|
Equity attributable to unitholders - (originating Currency)
|
OCI attributable to unitholders
|
Net income attributable to unitholders
|
||||||||
|
Australian dollar
|
$
|
1,115
|
|
$
|
(79
|
)
|
$
|
—
|
|
||
|
Canadian dollar
|
701
|
|
(50
|
)
|
—
|
|
|||||
|
Other
|
77
|
|
(1
|
)
|
1
|
|
|||||
(e) Credit Risk Management
Credit risk is the risk of loss due to the failure of a borrower or counterparty to fulfill its contractual obligations. The partnership’s exposure to credit risk in respect of financial instruments relates primarily to counterparty obligations regarding derivative contracts, loans receivable and credit investments such as corporate bonds.
The partnership assesses the credit worthiness of each counterparty before entering into contracts and ensures that counterparties meet minimum credit quality requirements. The partnership evaluates and monitors counterparty credit risk for derivative financial instruments and endeavours to minimize counterparty credit risk through diversification, collateral arrangements, and other credit risk mitigation techniques. Substantially all of our partnership’s derivative financial instruments involve either counterparties that are banks or other financial institutions. The partnership does not have any significant credit risk exposure to any single counterparty.
|
F-71
|
Brookfield Business Partners
|
BROOKFIELD BUSINESS PARTNERS L.P.
NOTES TO CONSOLIDATED FINANCIAL STATEMENTS (Continued)
As at December 31, 2017 and 2016 and for the years ended December 31, 2017, 2016 and 2015
Our operations are organized into
five
operating segments which are regularly reviewed by our CODM for the purpose of allocating resources to the segment and to assess its performance. The key measures used by the CODM in assessing performance and in making resource allocation decisions are company funds from operations, or Company FFO, and Company EBITDA.
Company FFO is calculated as net income excluding the impact of depreciation and amortization, deferred income taxes, breakage and transaction costs, non-cash valuation gains or losses and other items. When determining Company FFO, we include our proportionate share of Company FFO of equity accounted investments.
Company FFO is further adjusted as Company EBITDA to exclude the impact of realized disposition gains (losses), interest expenses, current income taxes, and realized disposition gains, current income taxes and interest expenses related to equity accounted investments.
|
F-72
|
Brookfield Business Partners
|
BROOKFIELD BUSINESS PARTNERS L.P.
NOTES TO CONSOLIDATED FINANCIAL STATEMENTS (Continued)
As at December 31, 2017 and 2016 and for the years ended December 31, 2017, 2016 and 2015
|
|
Year Ended December 31, 2017
|
|||||||||||||||||||||||
|
|
Total attributable to the partnership
|
|||||||||||||||||||||||
|
(US$ MILLIONS)
|
Business
Services
|
Construction
Services
|
Industrial
Operations
|
Energy
|
Corporate
and Other
|
Total
|
||||||||||||||||||
|
Revenues
(6)
|
$
|
16,224
|
|
$
|
4,650
|
|
$
|
1,662
|
|
$
|
280
|
|
$
|
7
|
|
$
|
22,823
|
|
||||||
|
Direct operating costs
|
(15,864
|
)
|
(4,584
|
)
|
(1,228
|
)
|
(197
|
)
|
(3
|
)
|
(21,876
|
)
|
||||||||||||
|
General and administrative expenses
|
(135
|
)
|
(47
|
)
|
(93
|
)
|
(20
|
)
|
(45
|
)
|
(340
|
)
|
||||||||||||
|
Equity accounted Company EBITDA
(3)
|
28
|
|
—
|
|
1
|
|
79
|
|
—
|
|
108
|
|
||||||||||||
|
Company EBITDA attributable to others
(4)
|
(170
|
)
|
1
|
|
(255
|
)
|
(51
|
)
|
—
|
|
(475
|
)
|
||||||||||||
|
Company EBITDA
|
83
|
|
20
|
|
87
|
|
91
|
|
(41
|
)
|
240
|
|
||||||||||||
|
Realized disposition gain/(loss), net
(5)
|
17
|
|
2
|
|
237
|
|
(12
|
)
|
—
|
|
244
|
|
||||||||||||
|
Interest expense
|
(47
|
)
|
—
|
|
(128
|
)
|
(26
|
)
|
(1
|
)
|
(202
|
)
|
||||||||||||
|
Realized disposition gain, current income taxes and interest expenses related to equity accounted investments
(3)
|
—
|
|
—
|
|
—
|
|
(17
|
)
|
—
|
|
(17
|
)
|
||||||||||||
|
Current income taxes
|
(21
|
)
|
5
|
|
(28
|
)
|
(4
|
)
|
18
|
|
(30
|
)
|
||||||||||||
|
Company FFO attributable to others (net of Company EBITDA attributable to others)
(4)
|
34
|
|
(1
|
)
|
(36
|
)
|
20
|
|
—
|
|
17
|
|
||||||||||||
|
Company FFO
(1)
|
66
|
|
26
|
|
132
|
|
52
|
|
(24
|
)
|
252
|
|
||||||||||||
|
Depreciation and amortization expense
(2)
|
|
|
|
|
|
|
|
|
|
|
(371
|
)
|
||||||||||||
|
Realized disposition (gain)/loss recorded in prior periods
(5)
|
23
|
|
||||||||||||||||||||||
|
Impairment expense, net
|
|
|
|
|
|
|
|
|
|
|
(39
|
)
|
||||||||||||
|
Other income (expense), net
|
|
|
|
|
|
|
|
|
|
|
(108
|
)
|
||||||||||||
|
Deferred income taxes
|
|
|
|
|
|
|
|
|
|
|
22
|
|
||||||||||||
|
Non-cash items attributable to equity accounted investments
(3)
|
|
|
|
|
|
|
|
|
|
|
(22
|
)
|
||||||||||||
|
Non-cash items attributable to others
(4)
|
|
|
|
|
|
|
|
|
|
|
267
|
|
||||||||||||
|
Net income (loss) attributable to unitholders
(1)
|
|
|
|
|
|
|
|
|
|
|
$
|
24
|
|
|||||||||||
____________________________________
|
(1)
|
Company FFO and net income attributable to unitholders include net income and Company FFO attributable to limited partnership unitholders, general partnership unitholders, redemption-exchange unitholders, and special limited partnership unitholders.
|
|
(2)
|
For the year ended
December 31, 2017
, depreciation and amortization by segment is as follows: Business Services
$74 million
, Construction Services
$24 million
, Industrial Operations
$175 million
, Energy
$98 million
, Corporate and Other $
nil
.
|
|
(3)
|
The sum of these amounts equates to equity accounted income of
$69 million
.
|
|
(4)
|
Total cash and non-cash items attributable to the interest of others equals net income of
$191 million
as per the consolidated statements of operating results.
|
|
(5)
|
The sum of these amounts equates to the loss on acquisitions / dispositions, net of
$267 million
.
|
|
(6)
|
For the year ended
December 31, 2017
, revenues by business unit in our Business Services segment are as follows: Facilities Management
$1,775 million
, Road Fuel Distribution and Marketing
$13,842 million
, Residential Real Estate Services
$108 million
, Logistics
$447 million
, Financial Advisory
$32 million
, and Other
$20 million
.
|
|
F-73
|
Brookfield Business Partners
|
BROOKFIELD BUSINESS PARTNERS L.P.
NOTES TO CONSOLIDATED FINANCIAL STATEMENTS (Continued)
As at December 31, 2017 and 2016 and for the years ended December 31, 2017, 2016 and 2015
|
|
Year Ended December 31, 2016
|
|||||||||||||||||||||||
|
|
Total attributable to the partnership
|
|||||||||||||||||||||||
|
(US$ MILLIONS)
|
Business
Services
|
Construction
Services
|
Industrial
Operations
|
Energy
|
Corporate
and Other
|
Total
|
||||||||||||||||||
|
Revenues
(5)
|
$
|
2,006
|
|
$
|
4,387
|
|
$
|
1,280
|
|
$
|
286
|
|
$
|
1
|
|
$
|
7,960
|
|
||||||
|
Direct operating costs
|
(1,818
|
)
|
(4,235
|
)
|
(1,160
|
)
|
(173
|
)
|
—
|
|
(7,386
|
)
|
||||||||||||
|
General and administrative expenses
|
(98
|
)
|
(48
|
)
|
(89
|
)
|
(17
|
)
|
(17
|
)
|
(269
|
)
|
||||||||||||
|
Equity accounted Company EBITDA
(3)
|
23
|
|
—
|
|
—
|
|
144
|
|
—
|
|
167
|
|
||||||||||||
|
Company EBITDA attributable to others
(4)
|
(44
|
)
|
—
|
|
(20
|
)
|
(168
|
)
|
—
|
|
(232
|
)
|
||||||||||||
|
Company EBITDA
|
69
|
|
104
|
|
11
|
|
72
|
|
(16
|
)
|
240
|
|
||||||||||||
|
Realized disposition gain/(loss), net
|
—
|
|
—
|
|
32
|
|
25
|
|
—
|
|
57
|
|
||||||||||||
|
Interest expense
|
(14
|
)
|
(1
|
)
|
(44
|
)
|
(30
|
)
|
(1
|
)
|
(90
|
)
|
||||||||||||
|
Realized disposition gain, current income taxes and interest expenses related to equity accounted investments
(3)
|
—
|
|
—
|
|
—
|
|
(9
|
)
|
—
|
|
(9
|
)
|
||||||||||||
|
Current income taxes
|
(12
|
)
|
(8
|
)
|
(4
|
)
|
(1
|
)
|
—
|
|
(25
|
)
|
||||||||||||
|
Company FFO attributable to others (net of Company EBITDA attributable to others)
(4)
|
11
|
|
(1
|
)
|
11
|
|
6
|
|
—
|
|
27
|
|
||||||||||||
|
Company FFO
(1)
|
54
|
|
94
|
|
6
|
|
63
|
|
(17
|
)
|
200
|
|
||||||||||||
|
Depreciation and amortization expense
(2)
|
|
|
|
|
|
|
|
|
|
|
(286
|
)
|
||||||||||||
|
Impairment expense, net
|
|
|
|
|
|
|
|
|
|
|
(261
|
)
|
||||||||||||
|
Other income (expense), net
|
|
|
|
|
|
|
|
|
|
|
(11
|
)
|
||||||||||||
|
Deferred income taxes
|
|
|
|
|
|
|
|
|
|
|
41
|
|
||||||||||||
|
Non-cash items attributable to equity accounted investments
(3)
|
|
|
|
|
|
|
|
|
|
|
(90
|
)
|
||||||||||||
|
Non-cash items attributable to others
(4)
|
|
|
|
|
|
|
|
|
|
|
378
|
|
||||||||||||
|
Net income (loss) attributable to unitholders
(1)
|
|
|
|
|
|
|
|
|
|
|
$
|
(29
|
)
|
|||||||||||
____________________________________
|
(1)
|
Company FFO and net income attributable to unitholders include net income and Company FFO attributable to limited partnership unitholders, general partnership unitholders, redemption-exchange unitholders, and special limited partnership unitholders and net income and Company FFO attributable to the parent company prior to the spin-off on June 20, 2016.
|
|
(2)
|
For the year ended
December 31, 2016
, depreciation and amortization by segment is as follows; Business Services $
33 million
, Construction Services $
19 million
, Industrial Operations $
120 million
, Energy $
114 million
, Corporate and Other $
nil
.
|
|
(3)
|
The sum of these amounts equates to equity accounted income of
$68 million
.
|
|
(4)
|
Total cash and non-cash items attributable to the interest of others equals net loss of
$173 million
as per the consolidated statements of operating results.
|
|
(5)
|
For the year ended
December 31, 2016
, revenues by business unit in our Business Services segment are as follows: Facilities Management
$1,294 million
, Residential Real Estate Services
$619 million
, Financial Advisory
$64 million
, and Other
$29 million
.
|
|
F-74
|
Brookfield Business Partners
|
BROOKFIELD BUSINESS PARTNERS L.P.
NOTES TO CONSOLIDATED FINANCIAL STATEMENTS (Continued)
As at December 31, 2017 and 2016 and for the years ended December 31, 2017, 2016 and 2015
|
|
Year Ended December 31, 2015
|
|||||||||||||||||||||||
|
|
Total attributable to the partnership
|
|||||||||||||||||||||||
|
(US$ MILLIONS)
|
Business
Services
|
Construction
Services
|
Industrial
Operations
|
Energy
|
Corporate
and Other
|
Total
|
||||||||||||||||||
|
Revenues
(6)
|
$
|
1,691
|
|
$
|
3,833
|
|
$
|
892
|
|
$
|
337
|
|
$
|
—
|
|
$
|
6,753
|
|
||||||
|
Direct operating costs
|
(1,528
|
)
|
(3,670
|
)
|
(744
|
)
|
(190
|
)
|
—
|
|
(6,132
|
)
|
||||||||||||
|
General and administrative expenses
|
(92
|
)
|
(45
|
)
|
(67
|
)
|
(20
|
)
|
—
|
|
(224
|
)
|
||||||||||||
|
Equity accounted Company EBITDA
(3)
|
22
|
|
3
|
|
—
|
|
90
|
|
—
|
|
115
|
|
||||||||||||
|
Company EBITDA attributable to others
(4)
|
(21
|
)
|
(1
|
)
|
(57
|
)
|
(135
|
)
|
—
|
|
(214
|
)
|
||||||||||||
|
Company EBITDA
|
72
|
|
120
|
|
24
|
|
82
|
|
—
|
|
298
|
|
||||||||||||
|
Realized disposition gain/(loss), net
(5)
|
40
|
|
—
|
|
—
|
|
—
|
|
—
|
|
40
|
|
||||||||||||
|
Interest expense
|
(13
|
)
|
(2
|
)
|
(25
|
)
|
(25
|
)
|
—
|
|
(65
|
)
|
||||||||||||
|
Realized disposition gain, current income taxes and interest expenses related to equity accounted investments
(3)
|
—
|
|
—
|
|
—
|
|
(11
|
)
|
—
|
|
(11
|
)
|
||||||||||||
|
Current income taxes
|
(20
|
)
|
(20
|
)
|
(8
|
)
|
(1
|
)
|
—
|
|
(49
|
)
|
||||||||||||
|
Company FFO attributable to others (net of Company EBITDA attributable to others)
(4)
|
4
|
|
—
|
|
23
|
|
24
|
|
—
|
|
51
|
|
||||||||||||
|
Company FFO
(1)
|
83
|
|
98
|
|
14
|
|
69
|
|
—
|
|
264
|
|
||||||||||||
|
Depreciation and amortization expense
(2)
|
|
|
|
|
|
|
|
|
|
|
(257
|
)
|
||||||||||||
|
Impairment expense, net
|
|
|
|
|
|
|
|
|
|
|
(95
|
)
|
||||||||||||
|
Gain on acquisitions
(5)
|
229
|
|
||||||||||||||||||||||
|
Other income (expense), net
|
|
|
|
|
|
|
|
|
|
|
70
|
|
||||||||||||
|
Deferred income taxes
|
|
|
|
|
|
|
|
|
|
|
(5
|
)
|
||||||||||||
|
Non-cash items attributable to equity accounted investments
(3)
|
|
|
|
|
|
|
|
|
|
|
(100
|
)
|
||||||||||||
|
Non-cash items attributable to others
(4)
|
|
|
|
|
|
|
|
|
|
|
102
|
|
||||||||||||
|
Net income (loss) attributable to parent
(1)
|
|
|
|
|
|
|
|
|
|
|
$
|
208
|
|
|||||||||||
____________________________________
|
(1)
|
Company FFO and net income attributable to parent company.
|
|
(2)
|
For the year ended December 31, 2015, depreciation and amortization by segment is as follows: Business Services
$34 million
, Construction Services
$21 million
, Industrial Operations
$54 million
, Energy
$148 million
, Corporate and Other $
nil
.
|
|
(3)
|
The sum of these amounts equates to equity accounted income of
$4 million
.
|
|
(4)
|
Total cash and non-cash items attributable to the interest of others equals net income of
$61 million
as per the consolidated statements of operating results.
|
|
(5)
|
The sum of these amounts equates to the loss on acquisitions / dispositions, net of
$269 million
.
|
|
(6)
|
For the year ended December 31, 2015, revenues by business unit in our Business Services segment are as follows: Facilities Management
$873 million
, Residential Real Estate Services
$740 million
, Financial Advisory
$61 million
, and Other
$17 million
.
|
|
F-75
|
Brookfield Business Partners
|
BROOKFIELD BUSINESS PARTNERS L.P.
NOTES TO CONSOLIDATED FINANCIAL STATEMENTS (Continued)
As at December 31, 2017 and 2016 and for the years ended December 31, 2017, 2016 and 2015
Segment Assets
For the purpose of monitoring segment performance and allocating resources between segments, the CODM monitors the assets, including investments accounted for using the equity method, attributable to each segment.
The following is an analysis of the partnership's assets by reportable operating segment as at
December 31, 2017
and
2016
:
|
|
As at December 31, 2017
|
|||||||||||||||||||||||
|
|
Total attributable to the partnership
|
|||||||||||||||||||||||
|
(US$ MILLIONS)
|
Business
Services
|
Construction
Services
|
Industrial
Operations
|
Energy
|
Corporate
and Other
|
Total
|
||||||||||||||||||
|
Total assets
|
$
|
5,246
|
|
$
|
2,653
|
|
$
|
5,839
|
|
$
|
1,671
|
|
$
|
395
|
|
$
|
15,804
|
|
||||||
|
|
As at December 31, 2016
|
|||||||||||||||||||||||
|
|
Total attributable to the partnership
|
|||||||||||||||||||||||
|
(US$ MILLIONS)
|
Business
Services
|
Construction
Services
|
Industrial
Operations
|
Energy
|
Corporate
and Other
|
Total
|
||||||||||||||||||
|
Total assets
|
$
|
1,690
|
|
$
|
2,275
|
|
$
|
2,047
|
|
$
|
1,596
|
|
$
|
585
|
|
$
|
8,193
|
|
||||||
Geographic Information
Revenues from external customers
|
(US$ MILLIONS)
|
2017
|
2016
|
2015
|
|||||||||
|
United Kingdom
|
$
|
13,637
|
|
$
|
1,451
|
|
$
|
1,027
|
|
|||
|
Canada
|
3,273
|
|
1,954
|
|
1,713
|
|
||||||
|
Australia
|
2,884
|
|
2,502
|
|
2,289
|
|
||||||
|
Brazil
|
1,252
|
|
52
|
|
20
|
|
||||||
|
United States of America
|
655
|
|
927
|
|
863
|
|
||||||
|
Middle East
|
593
|
|
732
|
|
688
|
|
||||||
|
Europe
|
411
|
|
251
|
|
107
|
|
||||||
|
Other
|
118
|
|
91
|
|
46
|
|
||||||
|
Total revenues
|
$
|
22,823
|
|
$
|
7,960
|
|
$
|
6,753
|
|
|||
During the year ended
December 31, 2017
, Greenergy generated revenues of
$3,052 million
and
$2,712 million
from two external customers, respectively, for the sale and delivery of fuel, which are both higher than
10%
of our partnership's total revenues. Other than the two customers mentioned, the partnership has no revenues from any one major customer which are higher than 10% of our partnership's total revenues.
|
F-76
|
Brookfield Business Partners
|
BROOKFIELD BUSINESS PARTNERS L.P.
NOTES TO CONSOLIDATED FINANCIAL STATEMENTS (Continued)
As at December 31, 2017 and 2016 and for the years ended December 31, 2017, 2016 and 2015
Non-current Assets
(1)
|
(US$ MILLIONS)
|
2017
|
2016
|
||||||
|
United Kingdom
|
$
|
918
|
|
$
|
51
|
|
||
|
Canada
|
2,355
|
|
1,863
|
|
||||
|
Australia
|
909
|
|
817
|
|
||||
|
Brazil
|
3,545
|
|
17
|
|
||||
|
United States of America
|
471
|
|
522
|
|
||||
|
Middle East
|
138
|
|
293
|
|
||||
|
Europe
|
401
|
|
332
|
|
||||
|
Other
|
634
|
|
222
|
|
||||
|
Total non-current assets
|
$
|
9,371
|
|
$
|
4,117
|
|
||
____________________________________
|
(1)
|
Non-current assets are comprised of property, plant and equipment, intangible assets, equity accounted investments, goodwill and other non-current assets.
|
|
|
Year Ended December 31
|
||||||||||
|
(US$ MILLIONS)
|
2017
|
2016
|
2015
|
||||||||
|
Interest paid
|
$
|
103
|
|
$
|
74
|
|
46
|
|
|||
|
Income taxes paid
|
$
|
41
|
|
$
|
9
|
|
4
|
|
|||
Amounts paid and received for interest were reflected as operating cash flows in the consolidated statements of cash flow.
Details of "Changes in non-cash working capital, net" on the consolidated statements of cash flow are as follows:
|
|
Year Ended December 31
|
|||||||||||
|
(US$ MILLIONS)
|
2017
|
2016
|
2015
|
|||||||||
|
Accounts receivable
|
$
|
(520
|
)
|
$
|
(55
|
)
|
(516
|
)
|
||||
|
Inventory
|
(259
|
)
|
60
|
|
52
|
|
||||||
|
Prepayments and other
|
185
|
|
(123
|
)
|
(122
|
)
|
||||||
|
Accounts payable and other
|
503
|
|
127
|
|
646
|
|
||||||
|
Changes in non-cash working capital, net
|
$
|
(91
|
)
|
$
|
9
|
|
$
|
60
|
|
|||
|
F-77
|
Brookfield Business Partners
|
BROOKFIELD BUSINESS PARTNERS L.P.
NOTES TO CONSOLIDATED FINANCIAL STATEMENTS (Continued)
As at December 31, 2017 and 2016 and for the years ended December 31, 2017, 2016 and 2015
The following table presents the change in the balance of liabilities arising from financing activities as at December 31, 2017:
|
(US$ MILLIONS)
|
Borrowings
|
|||
|
Balance at January 1, 2017
|
$
|
1,551
|
|
|
|
Cash flows
|
349
|
|
||
|
Non-cash changes:
|
||||
|
Acquisitions / (Disposition) of subsidiaries
|
1,386
|
|
||
|
Foreign currency translation
|
(7
|
)
|
||
|
Fair value
|
—
|
|
||
|
Other changes
|
(14
|
)
|
||
|
Balance at December 31, 2017
|
$
|
3,265
|
|
|
The partnership maintains several defined benefit pension plans within our industrial operations segment during the year. These plans are administered in various countries, the most significant of which is in the U.S. The U.S. plan was curtailed in a prior fiscal year with benefits frozen as of the date of curtailment. We continue to make quarterly contributions of
1%
of each employee’s total eligible pay. We also provide life insurance for eligible retired employees. These benefits are provided through various insurance companies and the estimated net post-retirement benefit costs are accrued during the employees’ credited service periods.
|
F-78
|
Brookfield Business Partners
|
BROOKFIELD BUSINESS PARTNERS L.P.
NOTES TO CONSOLIDATED FINANCIAL STATEMENTS (Continued)
As at December 31, 2017 and 2016 and for the years ended December 31, 2017, 2016 and 2015
The following table shows the changes in the present value of the defined benefit obligation and the fair value of plan assets as at
December 31, 2017
:
|
Defined benefit pension plan
|
Post-retirement
plan
|
|||||||||||||||
|
(US$ MILLIONS)
|
2017
|
2016
|
2017
|
2016
|
||||||||||||
|
Changes in defined benefit obligation
|
||||||||||||||||
|
Defined benefit obligation at beginning of year
|
$
|
162
|
|
$
|
165
|
|
$
|
29
|
|
$
|
30
|
|
||||
|
Service cost
|
1
|
|
1
|
|
—
|
|
(1
|
)
|
||||||||
|
Interest cost
|
6
|
|
6
|
|
1
|
|
2
|
|
||||||||
|
Foreign currency exchange changes
|
—
|
|
(1
|
)
|
(1
|
)
|
1
|
|
||||||||
|
Actuarial gain due to financial assumption changes
|
6
|
|
4
|
|
—
|
|
—
|
|
||||||||
|
Actuarial gain due to demographic assumption changes
|
(1
|
)
|
(2
|
)
|
—
|
|
—
|
|
||||||||
|
Actuarial experience adjustments
|
(1
|
)
|
(1
|
)
|
(2
|
)
|
(1
|
)
|
||||||||
|
Benefits paid
|
(9
|
)
|
(10
|
)
|
1
|
|
(2
|
)
|
||||||||
|
Defined benefit obligation at end of year
|
$
|
164
|
|
$
|
162
|
|
$
|
28
|
|
$
|
29
|
|
||||
|
Changes in fair value of plan assets
|
||||||||||||||||
|
Fair value of plan assets at beginning of year
|
$
|
(116
|
)
|
$
|
(108
|
)
|
$
|
—
|
|
$
|
—
|
|
||||
|
Interest income
|
(4
|
)
|
(4
|
)
|
—
|
|
—
|
|
||||||||
|
Return on plan assets (excluding interest income)
|
(9
|
)
|
(5
|
)
|
—
|
|
—
|
|
||||||||
|
Employer contributions
|
(7
|
)
|
(9
|
)
|
—
|
|
—
|
|
||||||||
|
Employer direct settlements
|
—
|
|
(1
|
)
|
(2
|
)
|
(1
|
)
|
||||||||
|
Benefits paid from employer
|
1
|
|
1
|
|
2
|
|
1
|
|
||||||||
|
Benefits paid from plan assets
|
8
|
|
9
|
|
—
|
|
—
|
|
||||||||
|
Administrative expenses paid from plan assets
|
1
|
|
1
|
|
—
|
|
—
|
|
||||||||
|
Fair value of plan assets at year end
|
$
|
(126
|
)
|
$
|
(116
|
)
|
$
|
—
|
|
$
|
—
|
|
||||
|
Net liability at end of year
|
$
|
38
|
|
$
|
46
|
|
$
|
28
|
|
$
|
29
|
|
||||
The net liabilities for the defined benefit and post-retirement plans are recorded within accounts payable and other in the consolidated statements of financial position.
The following table summarizes the defined benefit obligation and the fair value of plan assets by geography as at
December 31, 2017
:
|
(US$ MILLIONS)
|
United States
|
Canada
|
Other
|
Total
|
||||||||||||
|
Defined benefit pension plan
|
||||||||||||||||
|
Defined benefit obligation
|
$
|
140
|
|
$
|
4
|
|
$
|
20
|
|
$
|
164
|
|
||||
|
Fair value of plan assets
|
(110
|
)
|
(3
|
)
|
(13
|
)
|
(126
|
)
|
||||||||
|
Net liability
|
$
|
30
|
|
$
|
1
|
|
$
|
7
|
|
$
|
38
|
|
||||
|
Post-retirement plan
|
||||||||||||||||
|
Defined benefit obligation at end of year
|
$
|
9
|
|
$
|
13
|
|
$
|
6
|
|
$
|
28
|
|
||||
|
Net liability
|
$
|
9
|
|
$
|
13
|
|
$
|
6
|
|
$
|
28
|
|
||||
|
F-79
|
Brookfield Business Partners
|
BROOKFIELD BUSINESS PARTNERS L.P.
NOTES TO CONSOLIDATED FINANCIAL STATEMENTS (Continued)
As at December 31, 2017 and 2016 and for the years ended December 31, 2017, 2016 and 2015
The following table summarizes the defined benefit obligation and the fair value of plan assets by geography as at
December 31, 2016
:
|
(US$ MILLIONS)
|
United States
|
Canada
|
Other
|
Total
|
||||||||||||
|
Defined benefit pension plan
|
||||||||||||||||
|
Defined benefit obligation
|
$
|
140
|
|
$
|
4
|
|
$
|
18
|
|
$
|
162
|
|
||||
|
Fair value of plan assets
|
(101
|
)
|
(3
|
)
|
(12
|
)
|
(116
|
)
|
||||||||
|
Net liability
|
$
|
39
|
|
$
|
1
|
|
$
|
6
|
|
$
|
46
|
|
||||
|
Post-retirement plan
|
||||||||||||||||
|
Defined benefit obligation at end of year
|
$
|
11
|
|
$
|
14
|
|
$
|
4
|
|
$
|
29
|
|
||||
|
Net liability
|
$
|
11
|
|
$
|
14
|
|
$
|
4
|
|
$
|
29
|
|
||||
Amounts recognized in respect of these defined benefit and post-retirement plans during the year are as follows:
|
Defined benefit pension plan
|
Post-retirement
plan
|
|||||||||||||||
|
(US$ MILLIONS)
|
2017
|
2016
|
2017
|
2016
|
||||||||||||
|
Amounts recognized in profit and loss
|
||||||||||||||||
|
Current service cost
|
$
|
1
|
|
$
|
1
|
|
$
|
—
|
|
$
|
—
|
|
||||
|
Net interest expense
|
2
|
|
2
|
|
1
|
|
1
|
|
||||||||
|
Administrative expense
|
1
|
|
1
|
|
—
|
|
—
|
|
||||||||
|
Total expense recognized in profit and loss
|
$
|
4
|
|
$
|
4
|
|
$
|
1
|
|
$
|
1
|
|
||||
|
Amounts recognized in other comprehensive income
|
||||||||||||||||
|
Return on plan assets (excluding amounts included in net interest expense)
|
$
|
(7
|
)
|
$
|
(6
|
)
|
$
|
—
|
|
$
|
—
|
|
||||
|
Actuarial gains and losses arising from changes in demographic assumptions
|
(1
|
)
|
(2
|
)
|
—
|
|
—
|
|
||||||||
|
Actuarial gains and losses arising from changes in financial assumptions
|
6
|
|
4
|
|
—
|
|
—
|
|
||||||||
|
Actuarial gains and losses arising from experience adjustments
|
(1
|
)
|
(1
|
)
|
(2
|
)
|
(1
|
)
|
||||||||
|
Total expense (gain) recognized in other comprehensive income
|
$
|
(3
|
)
|
$
|
(5
|
)
|
$
|
(2
|
)
|
$
|
(1
|
)
|
||||
|
Total expense (gain) recognized in comprehensive income
|
$
|
1
|
|
$
|
(1
|
)
|
$
|
(1
|
)
|
$
|
—
|
|
||||
The expense recorded in profit and loss is recognized within general and administrative expenses in the consolidated statements of operating results.
The defined benefit pension plans expose our partnership to certain actuarial risks such as investment risk, interest rate risk, and compensation risk. The present value of the defined benefit obligation is calculated using a discount rate. If the return on plan assets is below this rate, a plan deficit occurs. We mitigate this investment risk by establishing a sound investment policy to be followed by the investment manager. Our investment policy requires plan assets to be invested in a diversified portfolio and is set based on both asset return and local statutory requirements. A change in interest and compensation rates will also affect the defined benefit obligation. A sensitivity analysis of the discount rate and compensation rate is provided below.
|
F-80
|
Brookfield Business Partners
|
BROOKFIELD BUSINESS PARTNERS L.P.
NOTES TO CONSOLIDATED FINANCIAL STATEMENTS (Continued)
As at December 31, 2017 and 2016 and for the years ended December 31, 2017, 2016 and 2015
The following table summarizes the fair value of plan assets by category as at December 31, 2017:
|
(US$ MILLIONS)
|
Level 1
|
Level 2
(1)
|
Level 3
(2)
|
Total
|
||||||||||||
|
Cash and cash equivalents
|
$
|
2
|
|
$
|
—
|
|
$
|
—
|
|
$
|
2
|
|
||||
|
Equity instruments
|
1
|
|
18
|
|
—
|
|
19
|
|
||||||||
|
Debt instruments
|
2
|
|
90
|
|
—
|
|
92
|
|
||||||||
|
Investment funds
|
—
|
|
—
|
|
—
|
|
—
|
|
||||||||
|
Fixed insurance contracts
|
—
|
|
—
|
|
13
|
|
13
|
|
||||||||
|
Total plan assets
|
$
|
5
|
|
$
|
108
|
|
$
|
13
|
|
$
|
126
|
|
||||
____________________________________
|
(1)
|
Level 2 assets represent the net asset value of the underlying assets held by the investment fund. The assets are valued by the fund administrator.
|
|
(2)
|
Level 3 assets consist of insurance rights and equity and debt instruments pooled in an actively invested collective profit sharing arrangement with other third-party employers. The assets are valued using non-observable inputs by the plan administrator.
|
Significant Assumptions
The partnership annually re-evaluates assumptions and estimates used in projecting the defined benefit and post-retirement liabilities. These assumptions and estimates may affect the carrying value of the defined benefit and post-retirement plan liabilities in our consolidated statements of financial position. The significant actuarial assumptions adopted are as follows:
Defined benefit plan
|
Discount rate
|
3.2% to 3.5%
|
|
|
Rate of compensation increase
|
1.6
|
%
|
Post-retirement plan
|
Discount rate
|
3.5% to 5.1%
|
|
Health care cost trend on covered charges:
|
|
|
Immediate trend rate
|
6.9% to 8.5%
|
|
Ultimate trend rate
|
5.0% to 6.2%
|
These assumptions have a significant impact on the defined benefit and post-retirement liabilities reported in the consolidated statement of financial position. The following table presents a sensitivity analysis of each assumption with the related impact on these liabilities as at
December 31, 2017
:
|
(US$ MILLIONS)
|
Percentage increase
|
Impact on liability
|
Percentage decrease
|
Impact on liability
|
||||||||||
|
Defined benefit pension plan
|
||||||||||||||
|
Discount rate
|
0.25% to 1%
|
|
$
|
(5
|
)
|
0.25% to 1%
|
|
$
|
5
|
|
||||
|
Rate of compensation increase
|
0.5
|
%
|
1
|
|
0.5
|
%
|
(1
|
)
|
||||||
|
Post-retirement plan
|
||||||||||||||
|
Discount rate
|
0.25% to 1%
|
|
$
|
(2
|
)
|
0.25% to 1%
|
|
$
|
2
|
|
||||
|
Health care cost trend rates
|
0.5% to 1%
|
|
1
|
|
0.5% to 1%
|
|
(1
|
)
|
||||||
|
F-81
|
Brookfield Business Partners
|
BROOKFIELD BUSINESS PARTNERS L.P.
NOTES TO CONSOLIDATED FINANCIAL STATEMENTS (Continued)
As at December 31, 2017 and 2016 and for the years ended December 31, 2017, 2016 and 2015
The sensitivity analysis above has been determined based on reasonably possible changes of the respective assumptions occurring as at
December 31, 2017
, while holding all other assumptions constant. These analyses may not be representative of the actual change in the defined benefit and post-retirement obligations as it is unlikely that the change in assumptions would occur in isolation of one another.
The following table summarizes future planned benefit payments under our defined benefit and post-retirement plans as at
December 31, 2017
:
|
(US$ MILLIONS)
|
Defined benefit pension plan
|
Post-retirement plan
|
||||||
|
2018
|
$
|
10
|
|
$
|
2
|
|
||
|
2019
|
10
|
|
2
|
|
||||
|
2020
|
10
|
|
2
|
|
||||
|
2021
|
10
|
|
2
|
|
||||
|
2022
|
10
|
|
2
|
|
||||
|
Thereafter
|
52
|
|
13
|
|
||||
|
Total
|
$
|
102
|
|
$
|
23
|
|
||
|
(a)
|
Distribution
|
On February 9, 2018, the Board of Directors declared a quarterly distribution in the amount of
$0.0625
per unit, payable on March 29, 2018 to unitholders of record as at the close of business on February 28, 2018.
|
(b)
|
Acquisition of the GTA Bundle
|
On January 23, 2018, the partnership, together with institutional partners and and an operating partner, entered into a Casino Operating and Services Agreement ("COSA") with the Ontario Lottery and Gaming Corporation ("OLG") to operate certain gaming facilities in the Greater Toronto Area (the "GTA Bundle").
This agreement was entered into by Ontario Gaming GTA LP ("OGGLP"), a newly formed partnership in which Brookfield and the operating partner each hold a
49%
interest. Clairvest Group Inc. will hold the remaining
2%
interest. On the date of the COSA execution, OGGLP assumed responsibility for the day-to-day operations and assets in the GTA Bundle, and will have the exclusive right to operate these assets for a minimum period of
twenty-two years
. The operating partner will operate the gaming facilities within the GTA Bundle on behalf of OGGLP.
|
(c)
|
Agreement to Acquire Westinghouse Electric Company
|
On January 4, 2018, the partnership, together with institutional partners, entered into an agreement to acquire
100%
of Westinghouse Electric Company (“Westinghouse”), a leading global provider of infrastructure services to the nuclear power generation industry for an initial purchase price of approximately
$4.6 billion
. The transaction is expected to be funded with approximately
$1 billion
of equity, approximately
$3 billion
of long-term debt financing and the balance by the assumption of certain pension, environmental and other operating obligations. The partnership committed to fund up to approximately
50%
of the existing liquidity, with the balance coming from institutional partners. Prior to or following closing, a portion of the partnership's investment may be syndicated to other institutional investors.
Closing of the transaction remains subject to Bankruptcy Court approval and customary closing conditions including, among others, regulatory approvals. Closing is expected to occur in the third quarter of 2018.
|
F-82
|
Brookfield Business Partners
|
BROOKFIELD BUSINESS PARTNERS L.P.
NOTES TO CONSOLIDATED FINANCIAL STATEMENTS (Continued)
As at December 31, 2017 and 2016 and for the years ended December 31, 2017, 2016 and 2015
|
(d)
|
Agreement to Acquire Schoeller Allibert
|
On January 5, 2018, the partnership, together with institutional partners, entered into an agreement to acquire a controlling interest in the Schoeller Allibert Group B.V. (“Schoeller Allibert”), one of Europe’s largest manufacturers of returnable plastic packaging systems for
€205 million
. The partnership committed to fund up to
€50 million
of the equity on closing using existing liquidity. The partnership completed the transaction by partnering with the founding Schoeller family who will continue to hold the remaining interest in the Company through Schoeller Group and is expected to be a long-term partner in growing the business. Schoeller Allibert has
€210 million
in
8%
Senior Secured Notes due in 2021 currently outstanding and the terms of the notes permit the issuance of additional notes and, in certain circumstances, holders may tender their notes for repurchase following the occurrence of a change of control. Prior to or following closing, a portion of the partnership's investment may be syndicated to other institutional investors.
Closing of the transaction remains subject to customary conditions, including, among others, regulatory approvals and is expected to occur in the second quarter of 2018.
|
(e)
|
Graphite Electrode Manufacturing Business Distribution
|
On February 15, 2018, our graphite electrode manufacturing business completed a
$1.5 billion
debt offering and used approximately
$400 million
of the proceeds to pay down existing debt and distributed the balance of approximately
$1.1 billion
to its shareholders. The share of the distribution attributable to the partnership was approximately
$380 million
.
|
F-83
|
Brookfield Business Partners
|
TABLE OF CONTENTS
Part IItem 1. Identity Of Directors, Senior Management and AdvisersItem 2. Offer Statistics and Expected TimetableItem 3. Key InformationItem 4. Information on Our CompanyItem 4A. Unresolved Staff CommentsItem 5. Operating and Financial Review and ProspectsItem 6 Directors, Senior Management and EmployeesItem 7. Major Shareholders and Related Party TransactionsItem 8. Financial InformationItem 9. The Offer and ListingItem 10. Additional InformationItem 11. Quantitative and Qualitative Disclosures About Market RiskItem 12. Description Of Securities Other Than Equity SecuritiesPart IIItem 13. Defaults, Dividend Arrearages and DelinquenciesItem 14. Material Modifications To The Rights Of Security Holders and Use Of ProceedsItem 15. Controls and ProceduresPart IIIItem 17. Financial StatementsItem 18. Financial StatementsItem 19. ExhibitsNote 1. Nature and Description Of The PartnershipNote 2. Significant Accounting PoliciesNote 3. Acquisition Of BusinessesNote 4. Fair Value Of Financial InstrumentsNote 5. Financial AssetsNote 6. Accounts and Other Receivable, NetNote 7. Inventory, NetNote 8. Assets Held For SaleNote 9. Other AssetsNote 10. Non-wholly Owned SubsidiariesNote 11. Property, Plant and EquipmentNote 12. Intangible AssetsNote 13. GoodwillNote 14. Equity Accounted InvestmentsNote 15. Accounts Payable and OtherNote 16. Contracts in ProgressNote 17. BorrowingsNote 18. Income TaxesNote 19. EquityNote 20. Accumulated Other Comprehensive IncomeNote 21. Direct Operating CostsNote 22. Guarantees and ContingenciesNote 23. Contractual CommitmentsNote 24. Related Party TransactionsNote 25. Derivative Financial InstrumentsNote 26. Financial Risk ManagementNote 27. Segment InformationNote 28. Supplemental Cash Flow InformationNote 29. Post-employment BenefitsNote 30. Subsequent Events