BATH & BODY WORKS, INC.
10-Ks and 10-Qs
|
|
|
|
|
|
|
|
|
|
|
|
|
|
|
|
|
|
|
|
|
|
|
|
|
|
|
|
|
|
|
|
|
|
|
|
|
|
|
|
|
|
|
|
|
|
|
|
|
|
|
|
|
|
|
|
|
|
|
UNITED STATES
SECURITIES AND EXCHANGE COMMISSION
Washington, D. C. 20549
______________________________________________________
FORM 10-K
______________________________________________________
(Mark One)
|
ý
|
ANNUAL REPORT PURSUANT TO SECTION 13 OR 15(d) OF THE SECURITIES EXCHANGE ACT OF 1934
|
For the fiscal year ended
February 2, 2019
OR
|
¨
|
TRANSITION REPORT PURSUANT TO SECTION 13 OR 15(d) OF THE SECURITIES EXCHANGE ACT OF 1934 [NO FEE REQUIRED]
|
For the transition period from to
Commission file number 1-8344
______________________________________________________
L BRANDS, INC.
(Exact name of registrant as specified in its charter)
_________________________________________________
|
Delaware
(State or other jurisdiction
of incorporation or organization)
|
31-1029810
(I.R.S. Employer Identification No.)
|
|
|
Three Limited Parkway,
Columbus, Ohio
(Address of principal executive offices)
|
43230
(Zip Code)
|
|
Registrant’s telephone number, including area code (614) 415-7000
______________________________________________________
Securities registered pursuant to Section 12(b) of the Act:
|
Title of each class
|
Name of each exchange on which registered
|
|
|
Common Stock, $.50 Par Value
|
The New York Stock Exchange
|
|
Securities registered pursuant to Section 12(g) of the Act: None.
Indicate by check mark if the registrant is a well-known seasoned issuer, as defined in Rule 405 of the Securities Act. Yes
ý
No
¨
Indicate by check mark if the registrant is not required to file reports pursuant to Section 13 or Section 15(d) of the Act. Yes
¨
No
ý
Indicate by check mark whether the registrant (1) has filed all reports required to be filed by Section 13 or 15(d) of the Securities Exchange Act of 1934 during the preceding 12 months (or for such shorter period that the registrant was required to file such reports), and (2) has been subject to such filing requirements for the past 90 days. Yes
ý
No
¨
Indicate by check mark whether the registrant has submitted electronically and posted on its corporate Website, if any, every Interactive Data File required to be submitted and posted pursuant to Rule 405 of Regulation S-T during the preceding 12 months (or for such shorter period that the registrant was required to submit and post such files). Yes
ý
No
¨
Indicate by check mark if disclosure of delinquent filers pursuant to Item 405 of Regulation S-K is not contained herein, and will not be contained, to the best of registrant’s knowledge, in definitive proxy or information statements incorporated by reference in Part III of this Form 10-K or any amendment to this Form 10-K.
ý
Indicate by check mark whether the registrant is a large accelerated filer, an accelerated filer, a non-accelerated filer, a smaller reporting company, or emerging growth company. See the definitions of “large accelerated filer,” “accelerated filer,” “smaller reporting company,” and "emerging growth company" in Rule 12b-2 of the Exchange Act.
Large accelerated filer
ý
Accelerated filer
¨
Non-accelerated filer
¨
Smaller reporting company
¨
Emerging growth company
¨
If an emerging growth company, indicate by check mark if the registrant has elected not to use the extended transition period for complying with any new or revised financial accounting standards provided pursuant to Section 13(a) of the Exchange Act.
¨
Indicate by check mark whether the registrant is a shell company (as defined in Rule 12b-2 of the Exchange Act). Yes
¨
No
ý
The aggregate market value of the registrant’s Common Stock held by non-affiliates of the registrant as of the last business day of the registrant’s most recently completed second fiscal quarter was:
$7,461,100,982
.
Number of shares outstanding of the registrant’s Common Stock as of
March 15, 2019
:
275,196,908
.
DOCUMENTS INCORPORATED BY REFERENCE
Portions of the Registrant’s Proxy Statement for the Registrant’s
2019
Annual Meeting of Stockholders are incorporated by reference into Part III.
Table of Contents
|
|
|
Page No.
|
|
Part I
|
||
|
Item 1.
|
||
|
Item 1A.
|
||
|
Item 1B.
|
||
|
Item 2.
|
||
|
Item 3.
|
||
|
Item 4.
|
||
|
Part II
|
||
|
Item 5.
|
||
|
Item 6.
|
||
|
Item 7.
|
||
|
Item 7A.
|
||
|
Item 8.
|
||
|
Item 9.
|
||
|
Item 9A.
|
||
|
Item 9B.
|
||
|
Part III
|
||
|
Item 10.
|
||
|
Item 11.
|
||
|
Item 12.
|
||
|
Item 13.
|
||
|
Item 14.
|
||
|
Part IV
|
||
|
Item 15.
|
||
|
Item 16.
|
||
PART I
ITEM 1. BUSINESS.
General
L Brands, Inc. (“we” or “the Company”) operates in the highly competitive specialty retail business. Founded in 1963 in Columbus, Ohio, we have evolved from an apparel-based specialty retailer to a segment leader focused on women’s intimate and other apparel, personal care, beauty and home fragrance products. We sell our merchandise through company-owned specialty retail stores in the United States (“U.S.”), Canada, the United Kingdom ("U.K."), Ireland and Greater China (China and Hong Kong); through websites; and through international franchise, license and wholesale partners (collectively, "partners").
Victoria’s Secret
Victoria’s Secret, including PINK, is a specialty retailer of women's intimate and other apparel with fashion-inspired collections and prestige fragrances. We sell our Victoria’s Secret products online and at more than
1,200
Victoria’s Secret and PINK company-owned stores in the U.S., Canada, U.K., Ireland and Greater China. Additionally, Victoria’s Secret and PINK have more than
430
stores in more than
70
countries operating under franchise, license and wholesale arrangements.
Bath & Body Works
Bath & Body Works, which sells products under the Bath & Body Works, White Barn, C.O. Bigelow and other brand names, is one of the leading specialty retailers of body care, home fragrance products, soaps and sanitizers. We sell our Bath & Body Works products online and at more than
1,700
Bath & Body Works company-owned stores in the U.S. and Canada. Additionally, Bath & Body Works has more than
230
stores in more than
30
other countries operating under franchise, license and wholesale arrangements.
Divestiture and Closure
La Senza
On January 6, 2019, we completed the sale of the La Senza business to an affiliate of Regent LP, a global private equity firm. For additional information, see Note
6
to the Consolidated Financial Statements included in Item
8
. Financial Statements and Supplementary Data.
Henri Bendel
In January 2019, we closed all of our Henri Bendel stores and the e-commerce website. For additional information, see Note
6
to the Consolidated Financial Statements included in Item
8
. Financial Statements and Supplementary Data.
Acquisition
Greater China
In April 2016, we reacquired the franchise rights to operate Victoria's Secret Beauty and Accessories stores in Greater China, including 26 stores already open at the time of acquisition. For additional information, see Note
5
to the Consolidated Financial Statements included in Item
8
. Financial Statements and Supplementary Data.
Fiscal Year
Our fiscal year ends on the Saturday nearest to January 31. As used herein, “
2018
”, “
2016
,” “
2015
” and “
2014
” refer to the
52
-week periods ended
February 2, 2019
,
January 28, 2017
,
January 30, 2016
and
January 31, 2015
, respectively. "
2017
" refers to the 53-week period ended
February 3, 2018
.
Real Estate
Company-owned Retail Stores
Our company-owned retail stores are located in shopping malls, lifestyle centers and street locations in the U.S., Canada, U.K., Ireland and Greater China. As a result of our strong brands and established retail presence, we have been able to lease high-traffic locations in most retail centers in which we operate.
1
The following table provides the number of our company-owned retail stores in operation for each brand as of
February 2, 2019
and
February 3, 2018
.
|
February 2, 2019
|
February 3, 2018
|
||||
|
Victoria’s Secret U.S.
|
1,098
|
|
1,124
|
|
|
|
Victoria’s Secret Canada
|
45
|
|
46
|
|
|
|
Bath & Body Works U.S.
|
1,619
|
|
1,592
|
|
|
|
Bath & Body Works Canada
|
102
|
|
102
|
|
|
|
Victoria's Secret U.K. / Ireland
|
26
|
|
24
|
|
|
|
Victoria's Secret China
|
15
|
|
7
|
|
|
|
Victoria's Secret Beauty and Accessories China
|
38
|
|
29
|
|
|
|
La Senza U.S.
|
—
|
|
5
|
|
|
|
La Senza Canada
|
—
|
|
119
|
|
|
|
Henri Bendel
|
—
|
|
27
|
|
|
|
Total
|
2,943
|
3,075
|
|
||
The following table provides the changes in the number of our company-owned retail stores operated for the past five fiscal years:
|
Beginning
of Year
|
Opened
|
Closed
|
Acquired (a)
|
|
Sold (b)
|
End of Year
|
|||||||||||
|
2018
|
3,075
|
|
88
|
|
(90
|
)
|
—
|
|
(130
|
)
|
2,943
|
|
|||||
|
2017
|
3,074
|
|
66
|
|
(65
|
)
|
—
|
|
—
|
|
3,075
|
|
|||||
|
2016
|
3,005
|
|
72
|
|
(29
|
)
|
26
|
|
—
|
|
3,074
|
|
|||||
|
2015
|
2,969
|
|
72
|
|
(36
|
)
|
—
|
|
—
|
|
3,005
|
|
|||||
|
2014
|
2,923
|
|
81
|
|
(35
|
)
|
—
|
|
—
|
|
2,969
|
|
|||||
_______________
(a) Relates to the acquisition of Victoria's Secret Beauty and Accessories franchise stores in Greater China. For additional
information see Note
5
to the Consolidated Financial Statements included in Item
8
. Financial Statements and Supplementary Data.
(b) Relates to the sale of the La Senza business. For additional information see Note
6
to the Consolidated Financial
Statements included in Item
8
. Financial Statements and Supplementary Data.
Franchise, License and Wholesale Arrangements
In addition to our company-owned stores, our products are sold at hundreds of partner locations in more than 70 countries. Under these arrangements, third parties operate stores that sell our products under our brand names. Revenue recognized under franchise and license arrangements generally consists of royalties earned and recognized upon sale of merchandise by franchise and license partners to retail customers. Revenue is generally recognized under wholesale and sourcing arrangements at the time the title passes to the partner. We continue to increase the number of locations under these types of arrangements as part of our international expansion.
The following table provides the number of our international stores operated by our partners for each business as of
February 2, 2019
and
February 3, 2018
.
|
February 2, 2019
|
February 3, 2018
|
||||
|
Victoria’s Secret Beauty and Accessories
|
383
|
|
397
|
|
|
|
Victoria’s Secret
|
56
|
|
37
|
|
|
|
Bath & Body Works
|
235
|
|
185
|
|
|
|
La Senza
|
—
|
|
194
|
|
|
|
Total
|
674
|
813
|
|
||
2
Our Strengths
We believe the following competitive strengths contribute to our leading market position, differentiate us from our competitors and will drive future growth:
Industry Leading Brands
We have developed and operate brands that have come to represent an aspirational lifestyle. Our brands allow us to target markets across the economic spectrum, across demographics and across the world. We believe that our three brands, Victoria's Secret, PINK and Bath & Body Works, are highly recognizable, which provides us with a competitive advantage.
|
•
|
At Victoria’s Secret, we market glamorous and sexy product lines to our customers. While bras and panties are the core of what we do, this brand also gives our customers choices in beauty products, fragrances, sleepwear, loungewear, athletic attire and personal care accessories.
|
|
•
|
At PINK, we market products to the college-aged woman. While bras and panties are the core of what we do, this brand also gives our customers choices in apparel, loungewear, athletic attire and accessories.
|
|
•
|
Bath & Body Works caters to our customers’ entire well-being, providing shower gels and lotions, aromatherapy, home fragrance, soaps and sanitizers and body care accessories.
|
In-Store Experience and Store Operations
We view our customers' in-store experience as an important vehicle for communicating the image of each brand. We utilize visual presentation of merchandise, in-store marketing, music and our sales associates to reinforce the image represented by the brands.
Our in-store marketing is designed to convey the principal elements and personality of each brand. The store design, furniture, fixtures and music are all carefully planned and coordinated to create a unique shopping experience. Every brand displays merchandise uniformly to ensure a consistent store experience, regardless of location. Store managers receive detailed plans designating fixture and merchandise placement to ensure coordinated execution of the company-wide merchandising strategy.
Our sales associates and managers are a central element in creating the atmosphere of the stores by providing a high level of customer service.
Digital Experience
In addition to our in-store experience, we strive to create a customer-centric digital platform that integrates the digital and physical brand experience. Our digital presence, including social media, our websites and our mobile applications, allows us to get to know our customers better and communicate with them anytime and anywhere.
Product Development, Sourcing and Logistics
We believe a large part of our success comes from frequent and innovative product launches, which include bra launches at Victoria’s Secret and PINK and new fragrance and other product launches at Bath & Body Works. Our merchant, design and sourcing teams have a long history of bringing innovative products to our customers. Additionally, we believe that our sourcing and production function (Mast Global) has a long and deep presence in the key sourcing markets including those in the U.S. and Asia, which helps us partner with the best manufacturers to get high-quality products quickly.
Experienced and Committed Management Team
We were founded in 1963 and have been led since inception by Leslie H. Wexner. Our senior management team has a wealth of retail and business experience at L Brands, Inc. and other companies such as The Gap, Ralph Lauren, Tory Burch, Starbucks, Land's End, Levi Strauss, Boots, The Home Depot and Yum Brands. We believe that we have one of the most experienced management teams in retail.
Additional Information
Merchandise Vendors
During
2018
, we purchased merchandise from approximately
340
vendors located throughout the world. No vendor provided
10%
or more of our merchandise purchases.
3
Distribution and Merchandise Inventory
Most of our merchandise is shipped to our distribution centers in the Columbus, Ohio, area. We use a variety of shipping terms that result in the transfer of title of the merchandise at either the point of origin or point of destination.
Our policy is to maintain sufficient quantities of inventories on hand in our retail stores and distribution centers to enable us to offer customers an appropriate selection of current merchandise. We emphasize rapid turnover and take markdowns as required to keep merchandise fresh and current.
Information Systems
Our management information systems consist of a full range of retail, financial and merchandising systems. The systems include applications related to point-of-sale, e-commerce, merchandising, planning, sourcing, logistics, inventory management, data security and support systems including human resources and finance.
Seasonal Business
Our operations are seasonal in nature and consist of two principal selling seasons: Spring (the first and second quarters) and Fall (the third and fourth quarters). The fourth quarter, including the holiday season, accounted for approximately one-third of our net sales for
2018
,
2017
and
2016
and is typically our most profitable quarter. Accordingly, cash requirements are highest in the third quarter as our inventories build in advance of the holiday season.
Working Capital
We fund our business operations through a combination of available cash and cash equivalents and cash flows generated from operations. In addition, our credit facilities are available for additional working capital needs and investment opportunities.
Regulation
We and our products are subject to regulation by various federal, state, local and foreign regulatory authorities. We are subject to a variety of tax and customs regulations and international trade arrangements.
Trademarks and Patents
Our trademarks and patents, which constitute our primary intellectual property, have been registered or are the subject of pending applications in the United States Patent and Trademark Office and with the registries of many foreign countries and/or are protected by common law. We believe our products are identified by our intellectual property and, thus, our intellectual property is of significant value. Accordingly, we intend to maintain our intellectual property and related registrations and vigorously protect our intellectual property assets against infringement.
Segment Information
We have three reportable segments: Victoria’s Secret, Bath & Body Works and Victoria's Secret and Bath & Body Works International. For additional information, including the financial results of our reportable segments, see Note
22
to the Consolidated Financial Statements included in Item
8
. Financial Statements and Supplementary Data.
Other Information
For additional information about our business, including our net sales and profits for the last three years and selling square footage, see Item
7
. Management’s Discussion and Analysis of Financial Condition and Results of Operations.
Competition
The sale of women's intimate and other apparel, home fragrance, personal care and beauty products and accessories through retail stores is a highly competitive business with numerous competitors, including individual and chain specialty stores, department stores and discount retailers. Brand image, marketing, design, price, service, assortment and quality are the principal competitive factors in retail store sales. Our online businesses compete with numerous online merchandisers. Image presentation, fulfillment and the factors affecting retail store sales discussed above are the principal competitive factors in online sales.
Associate Relations
As of
February 2, 2019
, we employed approximately
88,900
associates;
63,400
of whom were part-time. In addition, temporary associates are hired during peak periods, such as the holiday season.
4
Executive Officers of Registrant
Set forth below is certain information regarding our executive officers.
Leslie H. Wexner, 81, has been our Chief Executive Officer since our founding in 1963 and Chairman of the Board of Directors since 1975.
Stuart B. Burgdoerfer, 55, has been our Executive Vice President and Chief Financial Officer since April 2007.
Charles C. McGuigan, 62, has been our Chief Operating Officer since May 2012 and our Chief Executive Officer and President of Mast Global since February 2011.
Shelley B. Milano, 62, has been our Chief Human Resources Officer since April 2018.
James L. Bersani, 60, has been our President of Real Estate since March 2014 and has led our Real Estate function since April 2006.
Available Information
We are subject to the reporting requirements of the Exchange Act and its rules and regulations. The Exchange Act requires us to file reports, proxy statements and other information with the U.S. Securities and Exchange Commission ("SEC"). Copies of these reports, proxy statements and other information can be read and copied at:
SEC Public Reference Room
100 F Street NE
Washington, D.C. 20549
Information on the operation of the Public Reference Room may be obtained by calling the SEC at 1-800-SEC-0330. The SEC maintains a website that contains reports, proxy statements and other information regarding issuers that file electronically with the SEC. These materials may be obtained electronically by accessing the SEC's website at
www.sec.gov
. Our annual reports on Form 10-K, quarterly reports on Form 10-Q, current reports on Form 8-K and amendments to these reports filed or furnished pursuant to Section 13(a) or 15(d) of the Exchange Act are available, free of charge, on our website at
www
.
lb.com
.
Copies of any of the above-referenced documents will also be made available, free of charge, upon written request to:
L Brands, Inc.
Investor Relations Department
Three Limited Parkway
Columbus, Ohio 43230
5
ITEM 1A. RISK FACTORS.
We caution that any forward-looking statements (as such term is defined in the Private Securities Litigation Reform Act of 1995) contained in this report or made by our company or our management involve risks and uncertainties and are subject to change based on various factors, many of which are beyond our control. Accordingly, our future performance and financial results may differ materially from those expressed or implied in any such forward-looking statements. Words such as “estimate,” “project,” “plan,” “believe,” “expect,” “anticipate,” “intend,” “planned,” “potential” and any similar expressions may identify forward-looking statements. Risks associated with the following factors, among others, in some cases have affected and in the future could affect our financial performance and actual results and could cause actual results to differ materially from those expressed or implied in any forward-looking statements included in this report or otherwise made by our company or our management:
|
•
|
general economic conditions, consumer confidence, consumer spending patterns and market disruptions including severe weather conditions, natural disasters, health hazards, terrorist activities, financial crises, political crises or other major events, or the prospect of these events;
|
|
•
|
the seasonality of our business;
|
|
•
|
the dependence on mall traffic and the availability of suitable store locations on appropriate terms;
|
|
•
|
our ability to grow through new store openings and existing store remodels and expansions;
|
|
•
|
our ability to successfully expand internationally and related risks;
|
|
•
|
our independent franchise, license and wholesale partners;
|
|
•
|
our direct channel businesses;
|
|
•
|
our ability to protect our reputation and our brand images;
|
|
•
|
our ability to attract customers with marketing, advertising and promotional programs;
|
|
•
|
our ability to protect our trade names, trademarks and patents;
|
|
•
|
the highly competitive nature of the retail industry and the segments in which we operate;
|
|
•
|
consumer acceptance of our products and our ability to manage the life cycle of our brands, keep up with fashion trends, develop new merchandise and launch new product lines successfully;
|
|
•
|
our ability to source, distribute and sell goods and materials on a global basis, including risks related to:
|
|
•
|
political instability, significant health hazards, environmental hazards or natural disasters;
|
|
•
|
duties, taxes and other charges;
|
|
•
|
legal and regulatory matters;
|
|
•
|
volatility in currency exchange rates;
|
|
•
|
local business practices and political issues;
|
|
•
|
potential delays or disruptions in shipping and transportation and related pricing impacts;
|
|
•
|
disruption due to labor disputes; and
|
|
•
|
changing expectations regarding product safety due to new legislation;
|
|
•
|
our geographic concentration of vendor and distribution facilities in central Ohio;
|
|
•
|
fluctuations in foreign currency exchange rates;
|
|
•
|
stock price volatility;
|
|
•
|
our ability to pay dividends and related effects;
|
|
•
|
our ability to maintain our credit rating;
|
|
•
|
our ability to service or refinance our debt;
|
|
•
|
shareholder activism matters;
|
|
•
|
our ability to retain key personnel;
|
|
•
|
our ability to attract, develop and retain qualified associates and manage labor-related costs;
|
|
•
|
the ability of our vendors to deliver products in a timely manner, meet quality standards and comply with applicable laws and regulations;
|
6
|
•
|
fluctuations in product input costs;
|
|
•
|
our ability to adequately protect our assets from loss and theft;
|
|
•
|
fluctuations in energy costs;
|
|
•
|
increases in the costs of mailing, paper and printing;
|
|
•
|
claims arising from our self-insurance;
|
|
•
|
liabilities arising from divested businesses;
|
|
•
|
our ability to implement and maintain information technology systems and to protect associated data;
|
|
•
|
our ability to maintain the security of customer, associate, third-party or company information;
|
|
•
|
our ability to comply with regulatory requirements;
|
|
•
|
legal and compliance matters; and
|
|
•
|
tax, trade and other regulatory matters.
|
We are not under any obligation and do not intend to make publicly available any update or other revisions to any of the forward-looking statements contained in this report to reflect circumstances existing after the date of this report or to reflect the occurrence of future events even if experience or future events make it clear that any expected results expressed or implied by those forward-looking statements will not be realized.
The following discussion of risk factors contains “forward-looking statements.” These risk factors may be important to understanding any statement in this Form 10-K, other filings or in any other discussions of our business. The following information should be read in conjunction with Item
7
. Management’s Discussion and Analysis of Financial Condition and Results of Operation and Item
8
. Financial Statements and Supplementary Data.
In addition to the other information set forth in this report, the reader should carefully consider the following factors which could materially affect our business, financial condition or future results. The risks described below are not our only risks. Additional risks and uncertainties not currently known or that are currently deemed to be immaterial may also adversely affect our business, operating results and/or financial condition in a material way.
Our net sales, profit results and cash flows are sensitive to, and may be affected by, general economic conditions, consumer confidence, spending patterns, weather or other market disruptions.
Our net sales, profit, cash flows and future growth may be affected by negative local, regional, national or international political or economic trends or developments that reduce the consumers’ ability or willingness to spend, including the effects of national and international security concerns such as war, terrorism or the threat thereof. In addition, market disruptions due to natural disasters, health hazards or other major events or the prospect of these events could also impact consumer spending and confidence levels. Purchases of women’s intimate and other apparel, beauty and personal care products and accessories often decline during periods when economic or market conditions are unsettled or weak. In such circumstances, we may increase the number of promotional sales, which could have a material adverse effect on our results of operations, financial condition and cash flows.
The decision by the U.K. to leave the European Union (“Brexit”) has increased the uncertainty in the economic and political environment in Europe. The U.K.’s withdrawal is currently scheduled to take place in the first half of 2019, unless a further extension is agreed to; however, ongoing uncertainty remains as to what kind of post-Brexit agreement between the U.K. and the European Union, if any, may be approved by the U.K. parliament. Our business in the U.K. may be adversely impacted by this uncertainty, fluctuations in currency exchange rates, changes in trade policies, or changes in labor, immigration, tax or other laws.
Extreme weather conditions in the areas in which our stores are located, particularly in markets where we have multiple stores, could adversely affect our business. For example, heavy snowfall, rainfall or other extreme weather conditions over a prolonged period might make it difficult for our customers to travel to our stores and thereby reduce our sales and profitability.
Our net sales, operating income, cash and inventory levels fluctuate on a seasonal basis.
We experience major seasonal fluctuations in our net sales and operating income, with a significant portion of our operating income typically realized during the fourth quarter holiday season. Any decrease in sales or margins during this period could have a material adverse effect on our results of operations, financial condition and cash flows.
7
Seasonal fluctuations also affect our cash and inventory levels, since we usually order merchandise in advance of peak selling periods and sometimes before new fashion trends are confirmed by customer purchases. We must carry a significant amount of inventory, especially before the holiday season selling period. If we are not successful in selling inventory, we may have to sell the inventory at significantly reduced prices or may not be able to sell the inventory at all, which could have a material adverse effect on our results of operations, financial condition and cash flows.
Our net sales depend on a volume of traffic to our stores and the availability of suitable lease space.
Most of our stores are located in retail shopping areas including malls and other types of retail centers. Sales at these stores are derived, in part, from the volume of traffic in those retail areas. Our stores benefit from the ability of the retail center and other attractions in an area, including “destination” retail stores, to generate consumer traffic in the vicinity of our stores. Sales volume and retail traffic may be adversely affected by factors that we cannot control, such as economic downturns or changes in consumer demographics in a particular area, consumer trends away from brick-and-mortar retail toward online shopping, competition from internet and other retailers and other retail areas where we do not have stores, the closing or decline in popularity of other stores in the shopping areas where our stores are located and the deterioration in the financial condition of the operators or developers of the shopping areas in which our stores are located.
Part of our future growth is significantly dependent on our ability to operate stores in desirable locations with capital investment and lease costs providing the opportunity to earn a reasonable return. We cannot be sure as to when or whether such desirable locations will become available at reasonable costs. Some of our store locations, such as our Victoria’s Secret flagship stores, require significant upfront capital investment and have material lease commitments. Additionally, we are dependent upon the suitability of the lease spaces that we currently use. The leases that we enter into are generally noncancelable leases with initial terms of 10 years. If we determine that it is no longer economical to operate a store and decide to close it, we may remain obligated under the applicable lease for, among other things, payment of the base rent for the balance of the lease term.
These risks could have a material adverse effect on our ability to grow and our results of operations, financial condition and cash flows.
Our ability to grow depends in part on new store openings and existing store remodels and expansions.
Our continued growth and success will depend in part on our ability to open and operate new stores and expand and remodel existing stores on a timely and profitable basis. Accomplishing our new and existing store expansion goals will depend upon a number of factors, including the ability to partner with developers and landlords to obtain suitable sites for new and expanded stores at acceptable costs, the hiring and training of qualified personnel and the integration of new stores into existing operations. There can be no assurance we will be able to achieve our store expansion goals, manage our growth effectively, successfully integrate the planned new stores into our operations or operate our new, remodeled and expanded stores profitably. These risks could have a material adverse effect on our ability to grow and results of operations, financial condition and cash flows.
Our plans for international expansion include risks that could impact our results and reputation.
We intend to further expand into international markets, including mainland China, through partner arrangements and/or company-owned stores. The risks associated with our expansion into international markets include difficulties in attracting customers due to a lack of customer familiarity with our brands, our lack of familiarity with local customer preferences and seasonal differences in the market. Any of these difficulties may lead to disruption in the overall timing of our international expansion efforts or increased costs. Further, entry into other markets may bring us into competition with new competitors or with existing competitors with an established market presence. Other risks include general economic conditions in specific countries or markets, volatility in the geopolitical landscape, restrictions on the repatriation of funds held internationally, disruptions or delays in shipments, changes in diplomatic and trade relationships, political instability and foreign governmental regulation. Such expansions will also have upfront investment costs that may not be accompanied by sufficient revenues to achieve typical or expected operational and financial performance.
We also have risks related to identifying suitable partners. In addition, certain aspects of these arrangements are not directly within our control, such as the ability of these third parties to meet their projections regarding store openings and sales and their compliance with federal and local law. We cannot ensure the profitability or success of our expansion into international markets.
Further, our results of operations and financial condition may be adversely affected by fluctuations in currency exchange rates. See “Fluctuations in foreign currency exchange rates could impact our financial condition and results of operations” below.
These risks could have a material adverse effect on our results of operations, financial condition and cash flows.
8
Our licensees, franchisees and wholesalers could take actions that could harm our business or brand images.
We have global representation through independently owned stores operated by our partners. Although we have criteria to evaluate and select prospective partners, the level of control we can exercise over our partners is limited, and the quality and success of their operations may be diminished by any number of factors beyond our control. For example, our partners may not have the business acumen or financial resources necessary to successfully operate stores in a manner consistent with our standards and may not hire and train qualified store managers and other personnel. Our brand image and reputation may suffer materially, and our sales could decline if our partners do not operate successfully. These risks could have an adverse effect on our results of operations, financial condition and cash flows.
Our direct channel businesses include risks that could have an effect on our results.
Our direct operations are subject to numerous risks that could have a material adverse effect on our results. Risks include, but are not limited to, the difficulty in recreating the in-store experience through our direct channels; domestic or international resellers purchasing merchandise and reselling it outside our control; our ability to anticipate and implement innovations in technology and logistics in order to appeal to existing and potential customers who increasingly rely on multiple channels to meet their shopping needs; the failure of and risks related to the systems that operate our web infrastructure, websites and the related support systems, including computer viruses, theft of customer information, privacy concerns, telecommunication failures and electronic break-ins and similar disruptions.
Our failure to maintain efficient and uninterrupted order-taking and fulfillment operations could also have a material adverse effect on our results. The satisfaction of our online customers depends on their timely receipt of merchandise. If we encounter difficulties with the distribution facilities, or if the facilities were to shut down for any reason, including as a result of fire, natural disaster or work stoppage, we could face shortages of inventory; incur significantly higher costs and longer lead times associated with distributing our products to our customers; and cause customer dissatisfaction.
Any of these issues could have a material adverse effect on our operations, financial condition and cash flows.
Our ability to protect our reputation could have a material effect on our brand images.
Our ability to maintain our reputation is critical to our brand images. Our reputation could be jeopardized if we fail to maintain high standards for merchandise quality and integrity. Any negative publicity, including information publicized through traditional or social media platforms and similar venues such as blogs, websites and other forums, may affect our reputation and brand and, consequently, reduce demand for our merchandise, even if such publicity is unverified or inaccurate.
Failure to comply with ethical, social, product, labor and environmental standards, or related political considerations, could also jeopardize our reputation and potentially lead to various adverse consumer actions, including boycotts. Failure to comply with local laws and regulations, to maintain an effective system of internal controls, to maintain the security of customer, associate, third-party or company information or to provide accurate and timely financial statement information could also hurt our reputation. Damage to our reputation or loss of consumer confidence for any of these or other reasons could have a material adverse effect on our results of operations, financial condition and cash flows, as well as require additional resources to rebuild our reputation.
If our marketing, advertising and promotional programs are unsuccessful, or if our competitors are more effective with their programs than we are, our revenue or results of operations may be adversely affected.
Customer traffic and demand for our merchandise are influenced by our advertising, marketing and promotional activities, the name recognition and reputation of our brands and the location of and service offered in our stores. Although we use marketing, advertising and promotional programs to attract customers through various media, including social media, websites, mobile applications, email, print and television, some of our competitors may expend more for their programs than we do, or use different approaches than we do, which may provide them with a competitive advantage. Our programs may not be effective or could require increased expenditures, which could have a material adverse effect on our revenue and results of operations.
Our ability to adequately protect our trade names, trademarks and patents could have an impact on our brand images and ability to penetrate new markets.
We believe that our trade names, trademarks and patents are important assets and an essential element of our strategy. We have obtained or applied for federal registration of these trade names, trademarks and patents and have applied for or obtained registrations in many foreign countries. There can be no assurance that we will obtain such registrations or that the registrations we obtain will prevent the imitation of our products or infringement of our intellectual property rights by others. In particular, the laws of certain foreign countries may not protect proprietary rights to the same extent as the laws of the U.S. If any third-party copies our products or our stores in a manner that projects lesser quality or carries a negative connotation, it could have a
9
material adverse effect on our brand image and reputation as well as our results of operations, financial condition and cash flows.
Our ability to compete favorably in our highly competitive segment of the retail industry could impact our results.
The sale of women’s intimate and other apparel, personal care products and accessories is highly competitive. We compete for sales with a broad range of other retailers, including individual and chain specialty stores, department stores and discount retailers. In addition to the traditional store-based retailers, we also compete with direct marketers or retailers that sell similar lines of merchandise and who target customers through online channels. Brand image, marketing, design, price, service, assortment, quality, image presentation and fulfillment are all competitive factors in both the store-based and online channels.
Some of our competitors may have greater financial, marketing and other resources available and trends across our product categories may favor our competitors. We rely to a greater degree than some of our competitors on physical locations in shopping malls and centers and so declines in traffic to such locations may affect us more significantly than our competitors. Some of our competitors sell their products in stores that are located in the same shopping malls and centers as our stores. In addition to competing for sales, we compete for favorable site locations and lease terms in shopping malls and centers.
Increased competition, combined with declines in mall traffic, could result in price reductions, increased marketing expenditures and loss of pricing power and market share, any of which could have a material adverse effect on our results of operations, financial condition and cash flows.
Our ability to manage the life cycle of our brands and to remain current with fashion trends and launch new product lines successfully could impact the image and relevance of our brands.
Our success depends in part on management’s ability to effectively manage the life cycle of our brands and to anticipate and respond to changing fashion preferences and consumer demands and to translate market trends into appropriate, salable product offerings in advance of the actual time of sale to the customer. Customer demands and fashion trends change rapidly. If we are unable to successfully anticipate, identify or react to changing styles or trends or we misjudge the market for our products or any new product lines, our sales will be lower, potentially resulting in significant amounts of unsold finished goods inventory. In response, we may be forced to increase our marketing promotions or price markdowns. These risks could have a material adverse effect on our brand image and reputation as well as our results of operations, financial condition and cash flows.
We may be impacted by our ability to adequately source, distribute and sell merchandise and other materials on a global basis.
We source merchandise and other materials directly in international markets and in our domestic market. We distribute merchandise and other materials globally to our partners in international locations and to our stores. Many of our imports and exports are subject to a variety of customs regulations and international trade arrangements, including existing or potential duties, tariffs or safeguard quotas. We compete with other companies for production facilities.
We also face a variety of other risks generally associated with doing business on a global basis. For example:
|
•
|
political instability, significant health hazards, environmental hazards or natural disasters which could negatively affect international economies, financial markets and business activity;
|
|
•
|
imposition of new or retaliatory trade duties, sanctions or taxes and other charges on imports or exports;
|
|
•
|
evolving, new or complex legal and regulatory matters;
|
|
•
|
volatility in currency exchange rates;
|
|
•
|
local business practice and political issues (including issues relating to compliance with domestic or international labor standards) which may result in adverse publicity or threatened or actual adverse consumer actions, including boycotts;
|
|
•
|
potential delays or disruptions in shipping and transportation and related pricing impacts;
|
|
•
|
disruption due to labor disputes; and
|
|
•
|
changing expectations regarding product safety due to new legislation or other factors.
|
We also rely upon third-party transportation providers for substantially all of our product shipments, including shipments to and from our distribution centers, to our stores and to our customers. Our utilization of these delivery services for shipments is subject to risks, including increases in labor costs and fuel prices, which would increase our shipping costs, and associate strikes and inclement weather, which may impact our transportation providers’ ability to provide delivery services that adequately meet our shipping needs.
10
Our future performance will depend upon these and the other factors listed above which are beyond our control and could have a material adverse effect on our results of operations, financial condition and cash flows.
We rely on a number of vendor and distribution facilities located in the same vicinity, making our business susceptible to local and regional disruptions or adverse conditions.
To achieve the necessary speed and agility in producing our beauty, personal care and home fragrance products, we rely heavily on vendor and distribution facilities in close proximity to our headquarters in Central Ohio. As a result of geographic concentration of the vendor and distribution facilities that we rely upon, our operations are susceptible to local and regional factors, such as accidents, system failures, economic and weather conditions, natural disasters, demographic and population changes, and other unforeseen events and circumstances. Any significant interruption in the operations of these facilities could lead to inventory issues or increased costs, which could have a material adverse effect on our results of operations, financial condition and cash flows.
Fluctuations in foreign currency exchange rates could impact our financial condition and results of operations.
We are exposed to foreign currency exchange rate risk with respect to our sales, profits, assets and liabilities denominated in currencies other than the U.S. dollar. In addition, our royalty arrangements are calculated based on sales in local currency and, as such, we are exposed to foreign currency exchange rate fluctuations. Although we use foreign currency forward contracts to hedge certain foreign currency risks, these measures may not succeed in offsetting all of the short-term negative impacts of foreign currency rate movements on our business and results of operations. Hedging would generally not be effective in offsetting the long-term impact of sustained shifts in foreign exchange rates on our business results. As a result, the fluctuation in the value of the U.S. dollar against other currencies could have a material adverse effect on our results of operations, financial condition and cash flows.
Our stock price may be volatile.
Our stock price may fluctuate substantially as a result of variations in our actual or projected performance or the financial performance of other companies in the retail industry. Any guidance that we provide is based on goals that we believe are reasonably attainable at the time guidance is given. If, or when, we announce actual results that differ from those that have been predicted by us, outside investment analysts or others, our stock price could be adversely affected. Investors who rely on these predictions when making investment decisions with respect to our securities do so at their own risk.
In addition, the stock market may experience price and volume fluctuations that are unrelated or disproportionate to operating performance.
If we are unable to pay quarterly dividends at intended levels, our reputation and stock price may be harmed.
Our dividend program requires the use of a portion of our cash flow. Our ability to pay dividends will depend on our ability to generate sufficient cash flows from operations in the future. This ability may be subject to certain economic, financial, competitive and other factors that are beyond our control. Our Board of Directors may, at its discretion, decrease the level of dividends or entirely discontinue the payment of dividends at any time. On November 19, 2018, our Board of Directors announced that it planned to reduce our annual ordinary dividend to $1.20 per share from $2.40 per share, beginning with the quarterly dividend paid in March 2019. Any failure to pay dividends after we have announced our intention to do so may negatively impact our reputation, investor confidence in us and our stock price.
Our ability to maintain our credit rating could affect our ability to access capital and could increase our interest expense.
The credit rating agencies periodically review our capital structure and the quality and stability of our earnings. A deterioration in our capital structure or the quality and stability of our earnings could result in a downgrade of our credit rating. Any negative ratings actions could constrain the capital available to our company or our industry and could limit our access to funding for our operations. We are dependent upon our ability to access capital at rates and on terms we determine to be attractive. If our ability to access capital becomes constrained, our interest costs will likely increase, which could have a material adverse effect on our results of operations, financial condition and cash flows. Additionally, changes to our credit rating could affect our future interest costs.
We may be impacted by our ability to service or refinance our debt.
We currently have substantial indebtedness. Some of our debt agreements contain covenants which require maintenance of certain financial ratios and also, under certain conditions, restrict our ability to pay dividends, repurchase common shares and make other restricted payments as defined in those agreements. Our cash flow from operations provides the primary source of
11
funds for our debt service payments. If our cash flow from operations declines, we may be unable to service or refinance our current debt.
Shareholder activism could cause us to incur significant expense, hinder execution of our business strategy and impact our stock price.
Shareholder activism, which can take many forms and arise in a variety of situations, could result in substantial costs and divert management’s and our board’s attention and resources from our business. Additionally, such shareholder activism could give rise to perceived uncertainties as to our future, adversely affect our relationships with our associates, customers or service providers and make it more difficult to attract and retain qualified personnel. Also, we may be required to incur significant fees and other expenses related to activist shareholder matters, including for third-party advisors. Our stock price could be subject to significant fluctuation or otherwise be adversely affected by the events, risks and uncertainties of any shareholder activism.
We may be impacted by our ability to recruit, train and retain key personnel.
We believe we have benefited substantially from the leadership and experience of our senior executives, including Leslie H. Wexner, Chairman of the Board of Directors and Chief Executive Officer. The loss of the services of any of these individuals could have a material adverse effect on our business. Competition for key personnel in the retail industry is intense, and our future success will also depend on our ability to recruit, train and retain other qualified key personnel.
We may be impacted by our ability to attract, develop and retain qualified associates and manage labor-related costs.
We believe our competitive advantage is providing a positive, engaging and satisfying experience for each individual customer, which requires us to have highly trained and engaged associates. Our success depends in part upon our ability to attract, develop and retain a sufficient number of qualified associates, including store personnel and talented merchants. The turnover rate in the retail industry is generally high, and qualified individuals of the requisite caliber and number needed to fill these positions may be in short supply in some areas. Competition for such qualified individuals or changes in labor and healthcare laws could require us to incur higher labor costs. Our inability to recruit a sufficient number of qualified individuals in the future may delay planned openings of new stores or affect the speed with which we expand. Delayed store openings, significant increases in associate turnover rates or significant increases in labor-related costs could have a material adverse effect on our results of operations, financial condition and cash flows.
We may be impacted by our vendors’ ability to manufacture and deliver products in a timely manner, meet quality standards and comply with applicable laws and regulations.
We purchase products from third-party vendors. Factors outside our control, such as production or shipping delays or quality problems, could disrupt merchandise deliveries and result in lost sales, cancellation charges or excessive markdowns.
In addition, quality problems could result in a product liability judgment or a widespread product recall that may negatively impact our sales and profitability for a period of time depending on product availability, competition reaction and consumer attitudes. Even if the product liability claim is unsuccessful or is not fully pursued, the negative publicity surrounding any assertions could adversely impact our reputation with existing and potential customers and our brand image.
Our business could also suffer if our third-party vendors fail to comply with applicable laws and regulations. While our internal and vendor operating guidelines promote ethical business practices and our associates visit and monitor the operations of our third-party vendors, we do not control these vendors or their practices. The violation of labor, environmental or other laws by third-party vendors used by us, or the divergence of a third-party vendor’s or partner’s labor or environmental practices from those generally accepted as ethical or appropriate, could interrupt or otherwise disrupt the shipment of finished products to us or damage our reputation.
These risks could have a material adverse effect on our results of operations, financial condition and cash flows.
Our results may be affected by fluctuations in product input costs.
Product input costs, including freight, labor and raw materials, fluctuate. These fluctuations may result in an increase in our production costs. We may not be able to, or may elect not to, pass these increases on to our customers which may adversely impact our profit margins. These risks could have a material adverse effect on our results of operations, financial condition and cash flows.
12
Our ability to adequately protect our assets from loss and theft.
Our assets are subject to loss, including those caused by illegal or unethical conduct by associates, customers, vendors or unaffiliated third parties. We have experienced events such as inventory shrinkage in the past, and we cannot assure that incidences of loss and theft will decrease in the future or that the measures we are taking will effectively reduce these losses. Higher rates of loss or increased security costs to combat theft could have a material adverse effect on our results of operations, financial condition and cash flows.
Our results may be affected by fluctuations in energy costs.
Energy costs have fluctuated in the past. These fluctuations may result in an increase in our transportation costs for distribution, utility costs for our retail stores and costs to purchase products from our manufacturers. A continual rise in energy costs could adversely affect consumer spending and demand for our products and increase our operating costs, both of which could have a material adverse effect on our results of operations, financial condition and cash flows.
We may be impacted by increases in costs of mailing, paper and printing.
Postal rate increases and paper and printing costs will affect the cost of our order fulfillment and promotional mailings. We rely on discounts from the basic postal rate structure, such as discounts for bulk mailings and sorting. Future paper and postal rate increases could adversely impact our earnings if we are unable to recover these costs or if we are unable to implement more efficient printing, mailing, delivery and order fulfillment systems. These risks could have a material adverse effect on our results of operations, financial condition and cash flows.
We self-insure certain risks and may be impacted by unfavorable claims experience.
We are self-insured for various types of insurable risks including associate medical benefits, workers’ compensation, property, general liability and automobile up to certain stop-loss limits. Claims are difficult to predict and may be volatile. Any adverse claims experience could have a material adverse effect on our results of operations, financial condition and cash flows.
Retained or contingent liabilities from businesses that we divest could adversely affect our financial results.
In the fourth quarter of 2018, we completed the sale of La Senza to an affiliate of Regent LP, a global private equity firm. As a result of this divestiture, we may incur unexpected contingent liabilities, including with respect to leases assumed by the buyer. Our divestiture activities may also present financial and operational risks. Those risks may include difficulties separating personnel, financial and other systems, and indemnities and potential disputes with the buyer of La Senza. Any of these factors could adversely affect our financial condition and results of operations.
We significantly rely on our ability to implement and sustain information technology systems and to protect associated data.
Our success depends, in part, on the secure and uninterrupted performance of our information technology systems. Our information technology systems, as well as those of our service providers, are vulnerable to damage from a variety of sources, including telecommunication failures, malicious human acts and natural disasters. Moreover, despite network security measures, some of our servers and those of our service providers are potentially vulnerable to physical or electronic break-ins, computer viruses and similar disruptive problems. Additionally, these types of problems could result in a breach of confidential customer, merchandise, financial or other important information which could result in damage to our reputation and/or litigation. The increased use of smartphones, tablets and other mobile devices may also heighten these and other operational risks. Despite the precautions we have taken, unanticipated problems may nevertheless cause failures in our information technology systems. Sustained or repeated system disruptions that interrupt our ability to process orders and deliver products to the stores, impact our consumers’ ability to access our websites in a timely manner or expose confidential customer information, merchandise, financial or other important information could have a material adverse effect on our results of operations, financial condition and cash flows.
In addition, from time to time, we make modifications and upgrades to the information technology systems for point-of-sale, e-commerce, merchandising, planning, sourcing, logistics, inventory management and support systems including human resources and finance. Modifications involve replacing legacy systems with successor systems, making changes to legacy systems or acquiring new systems with new functionality. We are aware of inherent risks associated with replacing these systems, including not accurately capturing data and system disruptions. Information technology system disruptions, if not anticipated and appropriately mitigated, could have a material adverse effect on our operations, financial condition and cash flows.
13
Our ability to maintain the security of customer, associate, third-party or company information could have an impact on our reputation and our results.
Information systems are susceptible to an increasing threat of continually evolving cybersecurity risks. Any significant compromise or breach of our data security could significantly damage our reputation with our customers, associates, investors and other third parties; cause the disclosure of confidential customer, associate, third-party or company information; cause our customers to stop shopping with us; and result in significant legal, regulatory and financial liabilities and lost revenues. While we train our associates and have implemented systems and processes to protect against unauthorized access to our information systems and prevent data loss, there is no guarantee that these procedures are adequate to safeguard against all data security breaches. In addition to our own networks and databases, we use third-party service providers to store, process and transmit certain of this information on our behalf. Although we contractually require these service providers to implement and use reasonable security measures, we cannot control third parties and cannot guarantee that a security breach will not occur in their systems. We have confidential security measures in place to protect our physical facilities and information technology systems from attacks. Despite these measures, we may be vulnerable to targeted or random security breaches, phishing attacks, denial of service attacks, acts of vandalism, computer viruses, misplaced or lost data, programming and/or human errors or similar events.
The regulatory environment related to information security, data collection and privacy is increasingly rigorous, with new and constantly changing requirements applicable to our business, and compliance with those requirements could result in additional costs, such as costs related to organizational changes, implementing additional protection technologies, training associates and engaging consultants. Additionally, we could incur lost revenues and face increased litigation as a result of any potential cybersecurity breach.
These risks could have a material adverse effect on our results of operations, financial condition and cash flows.
We may be impacted by our ability to comply with regulatory requirements.
We are subject to numerous regulatory requirements. Our policies, procedures and internal controls are designed to comply with all applicable foreign and domestic laws and regulations, including those required by the Sarbanes-Oxley Act of 2002, the U.S. Foreign Corrupt Practices Act, the U.K. Bribery Act, the SEC and the New York Stock Exchange (the “NYSE”), among others. Although we have put in place policies and procedures aimed at ensuring legal and regulatory compliance, our associates, subcontractors, vendors, licensees, franchisees and other third parties could take actions that violate these laws and regulations. Any violations of such laws or regulations could have an adverse effect on our reputation, market price of our common stock, results of operations, financial condition and cash flows.
It can be difficult to comply with sometimes conflicting regulations in local, national or foreign jurisdictions as well as new or changing regulations. Also, changes in such laws could make operating our business more expensive or require us to change the way we do business. For example, changes in product safety or other consumer protection laws could lead to increased costs for certain merchandise, or additional labor costs associated with readying merchandise for sale. It may be difficult for us to oversee regulatory changes impacting our business, and our responses to changes in the law could be costly and may negatively impact our operations.
We may be adversely impacted by certain compliance or legal matters.
We, along with third parties we do business with, are subject to complex compliance and litigation risks. Actions filed against us from time to time include commercial, tort, intellectual property, customer, employment, wage and hour, data privacy, securities, anti-corruption and other claims, including purported class action lawsuits. The cost of defending against these types of claims against us or the ultimate resolution of such claims, whether by settlement or adverse court decision, may harm our business. Further, potential claimants may be encouraged to bring suits based on a settlement from us or adverse court decisions against us. We cannot currently assess the likely outcome of such suits, but if the outcome were negative, it could have a material adverse effect on our reputation, results of operations, financial condition and cash flows.
In addition, we may be impacted by litigation trends, including class action lawsuits involving consumers and shareholders, that could have a material adverse effect on our reputation, the market price of our common stock, results of operations, financial condition and cash flows.
We may be impacted by changes in taxation, trade and other regulatory requirements.
We are subject to income tax in local, national and international jurisdictions. In addition, our products are subject to import and excise duties and/or sales or value-added taxes in many jurisdictions. We are also subject to the examination of our tax returns and other tax matters by the Internal Revenue Service and other tax authorities and governmental bodies. We regularly
14
assess the likelihood of an adverse outcome resulting from these examinations to determine the adequacy of our provision for taxes. There can be no assurance as to the outcome of these examinations. Fluctuations in tax rates and duties, changes in tax legislation or regulation or adverse outcomes of these examinations could have a material adverse effect on our results of operations, financial condition and cash flows.
There is increased uncertainty with respect to tax policy and trade relations between the U.S. and other countries. Major developments in tax policy or trade relations, such as the imposition of unilateral tariffs on imported products, could have a material adverse effect on our results of operations, financial condition and cash flows.
ITEM 1B. UNRESOLVED STAFF COMMENTS.
None.
ITEM 2. PROPERTIES.
The following table provides the location, use and size of our distribution, corporate and product development facilities as of
February 2, 2019
:
|
Location
|
Use
|
Approximate
Square
Footage
|
|||
|
Columbus, Ohio area
|
Corporate, distribution and shipping
|
6,938,000
|
|
||
|
New York
|
Office, sourcing and product development/design
|
495,000
|
|
||
|
Kettering, Ohio
|
Call center
|
94,000
|
|
||
|
Montreal, Quebec, Canada
|
Office
|
60,000
|
|
||
|
Hong Kong
|
Office and sourcing
|
60,000
|
|
||
|
Mainland China
|
Office
|
35,000
|
|
||
|
Various international locations
|
Office and sourcing
|
160,000
|
|
||
United States
Our business for the Victoria’s Secret, Bath & Body Works and Victoria's Secret and Bath & Body Works International segments is principally conducted from office, distribution and shipping facilities located in the Columbus, Ohio, area. Additional facilities are located in New York and Kettering, Ohio.
Our distribution and shipping facilities consist of
eight
buildings located in the Columbus, Ohio, area. These buildings, including attached office space, comprise approximately
6.9 million
square feet.
As of
February 2, 2019
, we operate
2,717
retail stores located in leased facilities, primarily in malls and shopping centers, throughout the U.S. A substantial portion of these lease commitments consists of store leases generally with an initial term of
10
years. The store leases expire at various dates between
2019
and
2033
.
Typically, when space is leased for a retail store in a mall or shopping center, we supply all improvements, including interior walls, floors, ceilings, fixtures and decorations. The cost of improvements varies widely, depending on the design, size and location of the store. In certain cases, the landlord of the property may provide an allowance to fund all or a portion of the cost of improvements, serving as a lease incentive. Rental terms for new locations usually include a fixed minimum rent plus a percentage of sales in excess of a specified amount. We usually pay certain operating costs such as common area maintenance, utilities, insurance and taxes. For additional information, see Note
17
to the Consolidated Financial Statements included in Item
8
. Financial Statements and Supplementary Data.
International
Canada
We lease offices in the Montreal, Quebec, and Toronto, Ontario, areas.
As of
February 2, 2019
, we operate
147
retail stores located in leased facilities, primarily in malls and shopping centers, throughout the Canadian provinces. These lease commitments consist of store leases with initial terms of
5
to 10 years expiring on various dates between
2019
and
2030
.
15
United Kingdom / Ireland
As of
February 2, 2019
, we operate
26
retail stores in leased facilities in the U.K. and Ireland. These lease commitments consist of store leases with initial terms ranging from 10 to 35 years expiring on various dates between
2021
and
2045
.
Greater China
We lease offices in Shanghai, Shenzhen and Hong Kong within Greater China.
As of
February 2, 2019
, we operate
53
retail stores in leased facilities in Greater China. These lease commitments consist of store leases with initial terms ranging from 3 to 15 years expiring on various dates between 2019 and 2032.
Other International
As of
February 2, 2019
, we also have global representation through stores operated by our partners:
|
•
|
383
Victoria’s Secret Beauty and Accessories stores in
70
countries;
|
|
•
|
235
Bath & Body Works stores in more than
30
countries;
|
|
•
|
47
Victoria's Secret stores in
21
countries; and
|
|
•
|
9
PINK stores in
4
countries.
|
We also operate sourcing-related office facilities in various international locations.
ITEM 3. LEGAL PROCEEDINGS.
We are a defendant in a variety of lawsuits arising in the ordinary course of business. Actions filed against our Company from time to time include commercial, tort, intellectual property, customer, employment, data privacy, securities and other claims, including purported class action lawsuits. Although it is not possible to predict with certainty the eventual outcome of any litigation, in the opinion of management, our current legal proceedings are not expected to have a material adverse effect on our results of operations, financial condition and cash flows.
ITEM 4. MINE SAFETY DISCLOSURES.
Not applicable.
16
PART II
ITEM 5. MARKET FOR REGISTRANT’S COMMON EQUITY, RELATED STOCKHOLDER MATTERS AND ISSUER PURCHASES OF EQUITY SECURITIES.
Our common stock (“LB”) is traded on the NYSE. As of
February 2, 2019
, there were approximately
35,000
shareholders of record. However, including active associates who participate in our stock purchase plan, associates who own shares through our sponsored retirement plans and others holding shares in broker accounts under street names, we estimate the shareholder base to be approximately
148,000
.
The following table provides our quarterly market prices and cash dividends per share for
2018
and
2017
:
|
|
Market Price
|
Cash Dividend
per Share
|
|||||||||
|
|
High
|
Low
|
|||||||||
|
2018
|
|||||||||||
|
Fourth quarter
|
$
|
38.00
|
|
$
|
23.71
|
|
$
|
0.60
|
|
||
|
Third quarter
|
33.97
|
|
25.89
|
|
0.60
|
|
|||||
|
Second quarter
|
38.14
|
|
30.42
|
|
0.60
|
|
|||||
|
First quarter
|
51.13
|
|
33.88
|
|
0.60
|
|
|||||
|
2017
|
|
|
|
||||||||
|
Fourth quarter
|
$
|
63.10
|
|
$
|
42.54
|
|
$
|
0.60
|
|
||
|
Third quarter
|
46.66
|
|
35.00
|
|
0.60
|
|
|||||
|
Second quarter
|
55.98
|
|
43.35
|
|
0.60
|
|
|||||
|
First quarter
|
60.46
|
|
43.04
|
|
0.60
|
|
|||||
In November 2018, our Board of Directors reduced our annual ordinary dividend to $1.20 per share from $2.40 per share, beginning with the quarterly dividend paid in March 2019.
In February 2019, our Board of Directors declared our first quarter of
2019
dividend of
$0.30
per share. This dividend was distributed on
March 8, 2019
to shareholders of record at the close of business on
February 22, 2019
.
17
The following graph shows the changes, over the past five-year period, in the value of $100 invested in our common stock, the Standard & Poor’s ("S&P") 500 Composite Stock Price Index and the Standard & Poor’s 500 Retail Composite Index.
COMPARISON OF FIVE YEAR CUMULATIVE TOTAL RETURN (a) (b) (c) (d)
AMONG L BRANDS, INC., THE S&P 500 INDEX AND THE S&P RETAIL COMPOSITE INDEX
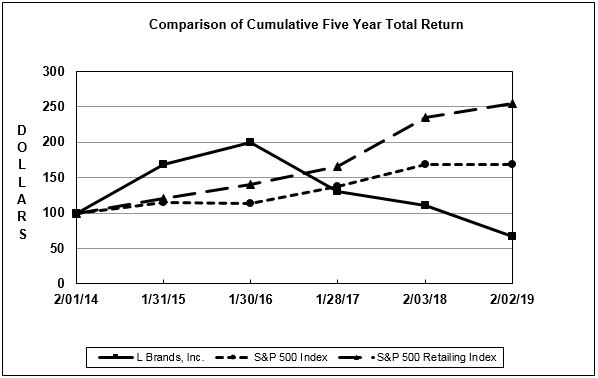
_______________
|
(a)
|
This table represents $100 invested in stock or in index at the closing price on
February 1, 2014
, including reinvestment of dividends.
|
|
(b)
|
The January 28, 2017 cumulative total return includes the $2 special dividend in March 2016.
|
|
(c)
|
The January 30, 2016 cumulative total return includes the $2 special dividend in March 2015.
|
|
(d)
|
The January 31, 2015 cumulative total return includes the $1 special dividend in March 2014.
|
The following table provides our repurchases of our common stock during the fourth quarter of
2018
:
|
Period
|
Total
Number of
Shares
Purchased (a)
|
Average Price
Paid per
Share (b)
|
Total Number
of Shares
Purchased as
Part of Publicly
Announced
Programs (c)
|
Maximum
Dollar Value of Shares
that May
Yet be Purchased
Under the Programs (c)
|
||||||||||
|
|
(in thousands)
|
|
(in thousands)
|
|||||||||||
|
November 2018
|
4
|
|
$
|
33.64
|
|
—
|
|
$
|
78,677
|
|
||||
|
December 2018
|
4
|
|
28.58
|
|
—
|
|
78,677
|
|
||||||
|
January 2019
|
13
|
|
27.17
|
|
—
|
|
78,677
|
|
||||||
|
Total
|
21
|
|
|
|
—
|
|
||||||||
________________
|
(a)
|
The total number of shares repurchased includes shares repurchased as part of publicly announced programs, with the remainder relating to shares repurchased in connection with tax payments due upon vesting of employee restricted stock awards and the use of our stock to pay the exercise price on employee stock options.
|
|
(b)
|
The average price paid per share includes any broker commissions.
|
|
(c)
|
For additional share repurchase program information, see Note
20
to the Consolidated Financial Statements included in Item
8
. Financial Statements and Supplementary Data.
|
18
ITEM 6. SELECTED FINANCIAL DATA.
|
|
Fiscal Year Ended
|
|||||||||||||||||||
|
|
February 2, 2019
|
February 3, 2018 (a)
|
January 28, 2017
|
January 30, 2016
|
January 31, 2015
|
|||||||||||||||
|
Summary of Operations
|
(in millions)
|
|||||||||||||||||||
|
Net Sales
|
$
|
13,237
|
|
$
|
12,632
|
|
$
|
12,574
|
|
$
|
12,154
|
|
$
|
11,454
|
|
|||||
|
Gross Profit
|
4,899
|
|
4,959
|
|
5,125
|
|
5,204
|
|
4,808
|
|
||||||||||
|
Operating Income (b)
|
1,237
|
|
1,728
|
|
2,003
|
|
2,192
|
|
1,953
|
|
||||||||||
|
Net Income (c)
|
644
|
|
983
|
|
1,158
|
|
1,253
|
|
1,042
|
|
||||||||||
|
|
(as a percentage of net sales)
|
|||||||||||||||||||
|
Gross Profit
|
37.0
|
%
|
39.3
|
%
|
40.8
|
%
|
42.8
|
%
|
42.0
|
%
|
||||||||||
|
Operating Income
|
9.3
|
%
|
13.7
|
%
|
15.9
|
%
|
18.0
|
%
|
17.1
|
%
|
||||||||||
|
Net Income
|
4.9
|
%
|
7.8
|
%
|
9.2
|
%
|
10.3
|
%
|
9.1
|
%
|
||||||||||
|
Per Share Results
|
|
|
|
|
||||||||||||||||
|
Net Income Per Basic Share
|
$
|
2.33
|
|
$
|
3.46
|
|
$
|
4.04
|
|
$
|
4.30
|
|
$
|
3.57
|
|
|||||
|
Net Income Per Diluted Share
|
$
|
2.31
|
|
$
|
3.42
|
|
$
|
3.98
|
|
$
|
4.22
|
|
$
|
3.50
|
|
|||||
|
Dividends Per Share
|
$
|
2.40
|
|
$
|
2.40
|
|
$
|
4.40
|
|
$
|
4.00
|
|
$
|
2.36
|
|
|||||
|
Weighted Average Diluted Shares Outstanding (in millions)
|
279
|
|
287
|
|
291
|
|
297
|
|
298
|
|
||||||||||
|
Other Financial Information
|
(in millions)
|
|||||||||||||||||||
|
Cash and Cash Equivalents
|
$
|
1,413
|
|
$
|
1,515
|
|
$
|
1,934
|
|
$
|
2,548
|
|
$
|
1,681
|
|
|||||
|
Total Assets
|
8,090
|
|
8,149
|
|
8,170
|
|
8,493
|
|
7,476
|
|
||||||||||
|
Working Capital
|
1,274
|
|
1,262
|
|
1,451
|
|
2,281
|
|
1,520
|
|
||||||||||
|
Net Cash Provided by Operating Activities
|
1,377
|
|
1,406
|
|
1,990
|
|
2,027
|
|
1,877
|
|
||||||||||
|
Capital Expenditures
|
629
|
|
707
|
|
990
|
|
727
|
|
715
|
|
||||||||||
|
Long-term Debt
|
5,739
|
|
5,707
|
|
5,700
|
|
5,715
|
|
4,722
|
|
||||||||||
|
Other Long-term Liabilities
|
1,004
|
|
924
|
|
831
|
|
904
|
|
820
|
|
||||||||||
|
Shareholders’ Equity (Deficit)
|
(869
|
)
|
(753
|
)
|
(729
|
)
|
(259
|
)
|
18
|
|
||||||||||
|
Comparable Sales Increase (Decrease) (d)
|
3
|
%
|
(3
|
%)
|
2
|
%
|
5
|
%
|
4
|
%
|
||||||||||
|
Comparable Store Sales Increase (Decrease) (d)
|
(1
|
%)
|
(4
|
%)
|
1
|
%
|
5
|
%
|
4
|
%
|
||||||||||
|
Return on Average Assets
|
8
|
%
|
12
|
%
|
14
|
%
|
16
|
%
|
14
|
%
|
||||||||||
|
Current Ratio
|
1.6
|
|
1.6
|
|
1.7
|
|
2.2
|
|
1.9
|
|
||||||||||
|
Stores and Associates at End of Year
|
||||||||||||||||||||
|
Number of Stores (e)
|
2,943
|
|
3,075
|
|
3,074
|
|
3,005
|
|
2,969
|
|
||||||||||
|
Selling Square Feet (in thousands) (e)
|
12,396
|
|
12,656
|
|
12,395
|
|
11,902
|
|
11,536
|
|
||||||||||
|
Number of Associates
|
88,900
|
|
93,200
|
|
93,600
|
|
87,900
|
|
80,100
|
|
||||||||||
________________
|
(a)
|
The fiscal year ended February 3, 2018 ("2017") represents a 53-week fiscal year.
|
|
(b)
|
Operating income includes the effect of the following items:
|
|
(i)
|
In 2018, a
$99 million
loss on the sale of La Senza, an
$81 million
charge related to the impairment of certain Victoria's Secret store assets and
$20 million
of Henri Bendel closure costs.
|
|
(ii)
|
In 2016, a
$35 million
charge related to strategic actions at Victoria's Secret, including severance charges, fabric cancellations and the write-off of catalogue paper.
|
19
|
(c)
|
In addition to the items previously discussed in (b), net income includes the effect of the following items:
|
|
(i)
|
In 2017, a
$92 million
tax benefit related to changes in U.S. tax legislation partially offset by a
$29 million
loss associated with the early extinguishment of our 2019 Notes.
|
|
(ii)
|
In 2016, a
$70 million
gain related to a
$124 million
cash distribution from Easton Town Center, LLC, a
$42 million
tax benefit related to the favorable resolution of a discrete income tax matter, partially offset by a
$22 million
loss associated with the early extinguishment of our 2017 Notes.
|
|
(iii)
|
In 2015, a
$69 million
gain related to the divestiture of our remaining ownership interest in our third-party apparel sourcing business.
|
For additional information on these items, see the Notes to the Consolidated Financial Statements included in Item
8
. Financial Statements and Supplementary Data.
The effect of the items described in (b) and (c) above decreased earnings per share by $0.51 in 2018, and increased earnings per share by $0.22 in 2017, and $0.23 in 2016 and 2015.
|
(d)
|
The percentage change in comparable sales represents direct and comparable store sales. The percentage change in comparable store sales represents the change in sales at comparable stores only and excludes the change in sales from our direct channels. A store is typically included in the calculation of comparable sales when it has been open or owned 12 months or more and it has not had a change in selling square footage of 20% or more. Additionally, stores of a given brand are excluded if total selling square footage for the brand in the mall changes by 20% or more through the opening or closing of a second store. The percentage change in comparable sales is calculated on a comparable calendar period as opposed to a fiscal basis. Therefore, the percentage change in comparable sales for 2018, 2016, 2015 and 2014 were calculated on a 52-to-52-week basis, and the percentage change in comparable sales for 2017 was calculated on a 53-to-53-week basis. Comparable sales attributable to our international stores are calculated on a constant currency basis.
|
|
(e)
|
Number of stores and selling square feet excludes independently owned Victoria's Secret Beauty and Accessories, Victoria's Secret, PINK, Bath & Body Works and La Senza stores operated by our partners.
|
ITEM 7. MANAGEMENT’S DISCUSSION AND ANALYSIS OF FINANCIAL CONDITION AND RESULTS OF OPERATIONS.
The following discussion and analysis of financial condition and results of operations are based upon our Consolidated Financial Statements, which have been prepared in accordance with accounting principles generally accepted in the United States of America ("GAAP") as codified in the Accounting Standards Codification ("ASC"). The following information should be read in conjunction with our financial statements and the related notes included in Item
8
. Financial Statements and Supplementary Data.
Our operating results are generally impacted by economic changes and, therefore, we monitor the retail environment using, among other things, certain key industry performance indicators including competitor performance and mall traffic data. These can provide insight into consumer spending patterns and shopping behavior in the current retail environment and assist us in assessing our performance as well as the potential impact of industry trends on our future operating results. Additionally, we evaluate a number of key performance indicators including comparable sales, gross profit, operating income and other performance metrics such as sales per average selling square foot and inventory per selling square foot in assessing our performance.
Executive Overview
We have a multi-year goal to grow our business and increase operating margins for our brands by focusing on these key business priorities:
|
•
|
Grow our business in North America;
|
|
•
|
Extend our brands internationally; and
|
|
•
|
Focus on the fundamentals of our business.
|
We also continue to focus on:
|
•
|
Attracting and retaining top talent;
|
|
•
|
Maintaining a strong cash and liquidity position while optimizing our capital structure; and
|
|
•
|
Returning value to our shareholders.
|
20
The following is a discussion regarding certain of our key business priorities:
Grow our business in North America
Our number one priority is improving performance at Victoria's Secret by staying close to our customer, improving our assortment and improving the customer experience in stores and online. We have new leaders at Victoria's Secret Lingerie and PINK, and we are looking at every aspect of our business: our marketing, brand positioning, internal talent, real estate portfolio, direct business and cost structure. We are focused on improving our merchandise assortment. We believe we have significant opportunities to improve our merchandise, making sure we have a robust product pipeline, fashion that our customers really want with high emotional content. We will also be expanding our assortment to include new and previously exited categories, but doing some things differently through new licensing opportunities in eyewear and swimwear.
The core of Bath & Body Works is its body care, home fragrance products, soaps and sanitizers which together make up the majority of sales and profits for the business. We see clear opportunities for substantial growth in these categories by focusing on product newness and innovation and expanding into under-penetrated market and price segments. We will continue to invest in the White Barn concept, which continues to yield strong results. In
2019
, we plan to increase our square footage at Bath & Body Works North America by about 3% through the opening of approximately 25 net new Bath & Body Works stores and the remodeling of existing stores.
Our Victoria’s Secret and Bath & Body Works direct businesses, with $2.5 billion in sales and operating margins in excess of 20%, are growing rapidly at a mid-to-high-teens rate. Our investment in technology and logistics will increase substantially in 2019 for initiatives supporting our direct businesses.
Extend our brands internationally
We believe there is substantial opportunity for international growth. We have separate, dedicated teams that have taken a methodical, "test and learn" approach to expansion. We expand our presence outside of North America by opening company-owned stores, as well as by increasing the number of stores operated by our international partners.
|
•
|
Victoria’s Secret International Stores
— We have made significant progress in expanding Victoria's Secret internationally. During 2018, we opened eight new Victoria's Secret full-assortment stores in Greater China, bringing the total to 15. In 2019, we have plans to open three to five new Victoria's Secret full-assortment stores in Greater China.
|
Further, our partners opened 15 Victoria's Secret full-assortment and four PINK stores in 2018, bringing the totals to
47
Victoria's Secret full-assortment stores and
nine
PINK stores. There were notable openings in Australia, Costa Rica, Indonesia, Italy, Malaysia and Thailand. Our partners plan to open approximately 20 Victoria's Secret full-assortment stores and one or two PINK stores in
2019
.
|
•
|
Victoria's Secret Beauty and Accessories Stores
— During 2018, we opened nine net new Victoria's Secret Beauty and Accessories stores in Greater China, bringing the total to
38
. In
2019
, we expect to open six to ten net new Victoria's Secret Beauty and Accessories stores in Greater China. Additionally, our partners operate
383
Victoria's Secret Beauty and Accessories stores in 70 countries worldwide. These stores are located in local markets, airports and tourist destinations, and are focused on Victoria’s Secret branded beauty and accessory products.
|
|
•
|
Bath & Body Works International Stores
— Our partners opened 50 net new Bath & Body Works stores in
2018
, bringing the total in the Middle East, Latin America, Southeast Asia and Europe to
235
. Our partners plan to open approximately 50 additional stores in
2019
.
|
Focus on the fundamentals of our business
We are focused on the fundamentals of our business which include knowing our customers, focusing on core merchandise categories, inventory management, speed and agility, managing real estate and store selling and execution. In terms of speed and agility, we are focused on inventory discipline through lead-time reductions and in-season agility to increase sales and reduce promotional activity. In terms of real estate, we will continue to proactively and rigorously review our portfolio, and we will continue to open and close stores when we believe it makes sense to do so. Finally, we continue to optimize our store selling and execution by concentrating on a better store experience and developing, retaining and investing in talented, trained and productive store associates.
2018
Overview
Our performance continues to be mixed. Growth in operating income at Bath & Body Works was more than offset by a decline at Victoria’s Secret and Victoria's Secret and Bath & Body Works International. Our net sales
increased
$605 million
to
$13.237 billion
driven by a comparable sales increase of
3%
. Our operating income decreased
$491 million
to
$1.237 billion
, and our operating income rate decreased to
9.3%
from
13.7%
.
21
|
•
|
Victoria’s Secret has underperformed - major merchandise misses have resulted in increased promotion which negatively impacted margin rates. Victoria’s Secret segment comparable sales declined 2% for the year, and operating income declined 50%. By business unit:
|
|
◦
|
In Victoria’s Secret Lingerie, 2018 comparable sales declined in the low-single digit range. We are seeing some improved performance in our newer bra launches. However, growth in new styles has not been enough to offset the decline in older styles. We made a substantial investment in sleepwear for the Holiday season, and the category delivered strong growth over last year.
|
|
◦
|
PINK comparable sales declined in the mid-single digit range in 2018, as fashion misses in apparel drove a decline in performance.
|
|
◦
|
Victoria’s Secret Beauty, with improved fashion, delivered low-double digit comparable sales growth in 2018.
|
|
•
|
Bath & Body Works has an experienced team with strong merchandising skills. They have a close connection to the customer and a fast and agile supply chain, resulting in another record year, on top of a record 2017. In 2018, Bath & Body Works comparable sales increased 11%, and operating income increased 13%. Sales in the direct channel increased 30%. We ended the year with more than 600 newly remodeled stores, which include the White Barn store design. These stores are driving significant sales growth and, importantly, present a new, compelling store experience for customers.
|
|
•
|
Revenue in our Victoria's Secret and Bath & Body Works International segment increased by 20% in 2018, and operating income declined, as improved performance in our franchise businesses was offset by underperformance in the U.K. and our investment in China.
|
Our recent overall performance at Victoria's Secret has been below our expectations, and we are determined to do better. By executing our strategy, focusing on the fundamentals, staying close to our customers and leveraging the strength of our brands, we are focused on meeting or exceeding the expectations of our stakeholders - customers, associates and shareholders.
At the end of the year, we made significant changes in our business to focus resources on core categories to enhance performance and accelerate growth. These actions include:
|
◦
|
Closing Henri Bendel;
|
|
◦
|
Selling the La Senza business; and
|
|
◦
|
Reducing our regular dividend to reduce debt levels.
|
We believe these decisions will strengthen our company.
For additional information related to our
2018
financial performance, see “Results of Operations –
2018
Compared to
2017
.”
We are committed to returning value to our shareholders. During
2018
, we paid
$666 million
in dividends and repurchased
$196 million
of our common stock. We use cash flow generated from operating and financing activities to fund our dividends and share repurchase programs. Since 2000, we have returned approximately
$21 billion
to shareholders through dividends and share repurchases.
22
Adjusted Financial Information
In addition to our results provided in accordance with GAAP above and throughout this Form 10-K, provided below are non-GAAP measurements which present operating income, net income and earnings per share in
2018
,
2017
and
2016
on an adjusted basis, which remove certain special items. We believe that these special items are not indicative of our ongoing operations due to their size and nature. We use adjusted financial information as key performance measures of results of operations for the purpose of evaluating performance internally. These non-GAAP measurements are not intended to replace the presentation of our financial results in accordance with GAAP. Instead, we believe that the presentation of adjusted financial information provides additional information to investors to facilitate the comparison of past and present operations. Further, our definition of adjusted financial information may differ from similarly titled measures used by other companies. The table below reconciles the GAAP financial measures to the non-GAAP financial measures.
|
(in millions, except per share amounts)
|
2018
|
2017
|
2016
|
||||||||
|
Detail of Special Items included in Operating Income - Income (Expense)
|
|||||||||||
|
Loss on Divestiture of La Senza (a)
|
$
|
(99
|
)
|
$
|
—
|
|
$
|
—
|
|
||
|
Victoria's Secret Store Asset Impairment (b)
|
(81
|
)
|
—
|
|
—
|
|
|||||
|
Henri Bendel Closure Costs (c)
|
(20
|
)
|
—
|
|
—
|
|
|||||
|
Victoria's Secret Restructuring (d)
|
—
|
|
—
|
|
(35
|
)
|
|||||
|
Total Special Items included in Operating Income
|
$
|
(200
|
)
|
$
|
—
|
|
$
|
(35
|
)
|
||
|
Detail of Special Items included in Other Income (Loss) - Income (Loss)
|
|||||||||||
|
Loss on Extinguishment of Debt (e)
|
$
|
—
|
|
$
|
(45
|
)
|
$
|
(36
|
)
|
||
|
Gain on Distribution from Easton Town Center, LLC (f)
|
—
|
|
—
|
|
108
|
|
|||||
|
Total Special Items included in Other Income (Loss)
|
$
|
—
|
|
|
$
|
(45
|
)
|
|
$
|
72
|
|
|
Detail of Special Items included in Provision for Income Taxes - Benefit (Provision)
|
|||||||||||
|
Tax Benefit related to Changes in U.S. Tax Legislation (g)
|
$
|
—
|
|
$
|
92
|
|
$
|
—
|
|
||
|
Tax Benefit from the Settlement of a Discrete Tax Matter (h)
|
—
|
|
—
|
|
42
|
|
|||||
|
Tax Effect of Special Items included in Operating Income and Other Income (Loss)
|
58
|
|
16
|
|
(11
|
)
|
|||||
|
Total Special Items included in Provision for Income Taxes
|
$
|
58
|
|
|
$
|
108
|
|
|
$
|
31
|
|
|
Reconciliation of Reported Operating Income to Adjusted Operating Income
|
|||||||||||
|
Reported Operating Income
|
$
|
1,237
|
|
$
|
1,728
|
|
$
|
2,003
|
|
||
|
Special Items included in Operating Income
|
200
|
|
—
|
|
35
|
|
|||||
|
Adjusted Operating Income
|
$
|
1,437
|
|
$
|
1,728
|
|
$
|
2,037
|
|
||
|
Reconciliation of Reported Net Income to Adjusted Net Income
|
|||||||||||
|
Reported Net Income
|
$
|
644
|
|
$
|
983
|
|
$
|
1,158
|
|
||
|
Special Items included in Net Income
|
142
|
|
(63
|
)
|
(68
|
)
|
|||||
|
Adjusted Net Income
|
$
|
786
|
|
$
|
920
|
|
$
|
1,090
|
|
||
|
Reconciliation of Reported Earnings Per Diluted Share to Adjusted Earnings Per Diluted Share
|
|||||||||||
|
Reported Earnings Per Diluted Share
|
$
|
2.31
|
|
$
|
3.42
|
|
$
|
3.98
|
|
||
|
Special Items included in Earnings Per Diluted Share
|
0.51
|
|
(0.22
|
)
|
(0.23
|
)
|
|||||
|
Adjusted Earnings Per Diluted Share
|
$
|
2.82
|
|
$
|
3.20
|
|
$
|
3.74
|
|
||
________________
|
(a)
|
In the fourth quarter of 2018, we recognized a
$99 million
(
$55 million
after-tax) loss on the sale of La Senza. For additional information see Note
6
, "Restructuring Activities" included in Item
8
. Financial Statements and Supplementary Data.
|
|
(b)
|
In the third quarter of 2018, we recognized an
$81 million
(
$73 million
after-tax) impairment charge related to certain Victoria's Secret store assets. For additional information see Note
8
, "Property and Equipment, Net" included in Item
8
. Financial Statements and Supplementary Data.
|
23
|
(c)
|
In the third quarter of 2018, we recognized
$20 million
(
$15 million
after-tax) of closure costs related to the closure of the Henri Bendel business. For additional information see Note
6
, "Restructuring Activities" included in Item
8
. Financial Statements and Supplementary Data.
|
|
(d)
|
In the first quarter of 2016, we made strategic changes within the Victoria’s Secret segment designed to focus the brand on its core merchandise categories and streamline operations. As a result of these changes, we recorded charges related to severance and related costs, fabric cancellations and catalogue paper write-offs. For additional information see Note
6
, "Restructuring Activities" included in Item
8
. Financial Statements and Supplementary Data.
|
|
(e)
|
In the fourth quarter of 2017, we redeemed our $500 million 8.50% Senior Unsecured Notes due June 2019 resulting in a pre-tax loss on extinguishment of
$45 million
(after-tax loss of
$29 million
). In the second quarter of 2016, we redeemed our
$700 million
6.90% Senior Unsecured Notes due July 2017 resulting in a pre-tax loss on extinguishment of
$36 million
(after-tax loss of
$22 million
). For additional information see Note
13
, "Long-term Debt and Borrowing Facilities" included in Item
8
. Financial Statements and Supplementary Data.
|
|
(f)
|
In the second quarter of 2016, we received a
$124 million
cash distribution from Easton Town Center, LLC resulting in a pre-tax gain of
$108 million
(after-tax gain of
$70 million
). For additional information see Note
10
, "Equity Investments" included in Item
8
. Financial Statements and Supplementary Data.
|
|
(g)
|
In the fourth quarter of 2017, we recorded a
$92 million
tax benefit related to changes in U.S. tax legislation. For additional information see Note
12
, "Income Taxes" included in Item
8
. Financial Statements and Supplementary Data.
|
|
(h)
|
In the fourth quarter of 2016, we recorded a
$42 million
tax benefit related to the favorable resolution of a discrete income tax matter. For additional information see Note
12
, "Income Taxes" included in Item
8
. Financial Statements and Supplementary Data.
|
2019
Outlook
The global retail sector and our business continue to face an uncertain environment and, as a result, we will continue to manage our business thoughtfully, and we will focus on the execution of the retail fundamentals.
At the same time, we are aggressively focusing on bringing compelling merchandise assortments, marketing and store and online experiences to our customers. We will look for, and seek to capitalize on, those opportunities available to us.
Company-Owned Store Data
The following table compares
2018
company-owned store data to the comparable periods for
2017
and
2016
:
|
|
|
|
|
% Change
|
|||||||||||||
|
|
2018
|
2017
|
2016
|
2018
|
2017
|
||||||||||||
|
Sales per Average Selling Square Foot
|
|||||||||||||||||
|
Victoria’s Secret U.S.
|
$
|
757
|
|
$
|
784
|
|
$
|
844
|
|
(3
|
%)
|
(7
|
%)
|
||||
|
Bath & Body Works U.S.
|
891
|
|
844
|
|
831
|
|
6
|
%
|
2
|
%
|
|||||||
|
Sales per Average Store (in thousands)
|
|
|
|
|
|
|
|
||||||||||
|
Victoria’s Secret U.S.
|
$
|
4,880
|
|
$
|
5,003
|
|
$
|
5,288
|
|
(2
|
%)
|
(5
|
%)
|
||||
|
Bath & Body Works U.S.
|
2,279
|
|
2,107
|
|
2,010
|
|
8
|
%
|
5
|
%
|
|||||||
|
Average Store Size (selling square feet)
|
|
|
|
|
|
|
|
||||||||||
|
Victoria’s Secret U.S.
|
6,484
|
|
6,415
|
|
6,349
|
|
1
|
%
|
1
|
%
|
|||||||
|
Bath & Body Works U.S.
|
2,585
|
|
2,532
|
|
2,459
|
|
2
|
%
|
3
|
%
|
|||||||
|
Total Selling Square Feet (in thousands)
|
|
|
|
|
|
|
|
||||||||||
|
Victoria’s Secret U.S.
|
7,119
|
|
7,210
|
|
7,181
|
|
(1
|
%)
|
—
|
%
|
|||||||
|
Bath & Body Works U.S.
|
4,185
|
|
4,032
|
|
3,912
|
|
4
|
%
|
3
|
%
|
|||||||
24
The following table represents company-owned store data for
2018
:
|
Stores Operating at
|
Stores Operating at
|
|||||||||||||
|
February 3, 2018
|
Opened
|
Closed
|
Sold (a)
|
February 2, 2019
|
||||||||||
|
Victoria’s Secret U.S.
|
1,124
|
|
3
|
|
(29
|
)
|
—
|
|
1,098
|
|
||||
|
Victoria’s Secret Canada
|
46
|
|
—
|
|
(1
|
)
|
—
|
|
45
|
|
||||
|
Total Victoria's Secret
|
1,170
|
|
3
|
|
(30
|
)
|
—
|
|
1,143
|
|
||||
|
Bath & Body Works U.S.
|
1,592
|
|
54
|
|
(27
|
)
|
—
|
|
1,619
|
|
||||
|
Bath & Body Works Canada
|
102
|
|
1
|
|
(1
|
)
|
—
|
|
102
|
|
||||
|
Total Bath & Body Works
|
1,694
|
|
55
|
|
(28
|
)
|
—
|
|
1,721
|
|
||||
|
Victoria's Secret U.K. / Ireland
|
24
|
|
2
|
|
—
|
|
—
|
|
26
|
|
||||
|
Victoria's Secret Beauty and Accessories
|
29
|
|
13
|
|
(4
|
)
|
—
|
|
38
|
|
||||
|
Victoria's Secret China
|
7
|
|
8
|
|
—
|
|
—
|
|
15
|
|
||||
|
Total Victoria's Secret and Bath & Body Works International
|
60
|
|
23
|
|
(4
|
)
|
—
|
|
79
|
|
||||
|
Henri Bendel
|
27
|
|
—
|
|
(27
|
)
|
—
|
|
—
|
|
||||
|
La Senza U.S.
|
5
|
|
7
|
|
—
|
|
(12
|
)
|
—
|
|
||||
|
La Senza Canada
|
119
|
|
—
|
|
(1
|
)
|
(118
|
)
|
—
|
|
||||
|
Total L Brands Stores
|
3,075
|
|
88
|
|
(90
|
)
|
(130
|
)
|
2,943
|
|
||||
_______________
(a) Relates to the divestiture of La Senza. For additional information see Note
6
, "Restructuring Activities"
included in Item
8
. Financial Statements and Supplementary Data.
The following table represents company-owned store data for
2017
:
|
Stores Operating at
|
Stores Operating at
|
||||||||||
|
January 28, 2017
|
Opened
|
Closed
|
February 3, 2018
|
||||||||
|
Victoria’s Secret U.S.
|
1,131
|
|
13
|
|
(20
|
)
|
1,124
|
|
|||
|
Victoria’s Secret Canada
|
46
|
|
2
|
|
(2
|
)
|
46
|
|
|||
|
Total Victoria's Secret
|
1,177
|
|
15
|
|
(22
|
)
|
1,170
|
|
|||
|
Bath & Body Works U.S.
|
1,591
|
|
32
|
|
(31
|
)
|
1,592
|
|
|||
|
Bath & Body Works Canada
|
102
|
|
—
|
|
—
|
|
102
|
|
|||
|
Total Bath & Body Works
|
1,693
|
|
32
|
|
(31
|
)
|
1,694
|
|
|||
|
Victoria's Secret U.K. / Ireland
|
18
|
|
6
|
|
—
|
|
24
|
|
|||
|
Victoria's Secret Beauty and Accessories
|
31
|
|
4
|
|
(6
|
)
|
29
|
|
|||
|
Victoria's Secret China
|
—
|
|
7
|
|
—
|
|
7
|
|
|||
|
Total Victoria's Secret and Bath & Body Works International
|
49
|
|
17
|
|
(6
|
)
|
60
|
|
|||
|
Henri Bendel
|
29
|
|
—
|
|
(2
|
)
|
27
|
|
|||
|
La Senza U.S.
|
4
|
|
1
|
|
—
|
|
5
|
|
|||
|
La Senza Canada
|
122
|
|
1
|
|
(4
|
)
|
119
|
|
|||
|
Total L Brands Stores
|
3,074
|
|
66
|
|
(65
|
)
|
3,075
|
|
|||
25
The following table represents company-owned store data for
2016
:
|
Stores Operating at
|
Stores Operating at
|
|||||||||||||
|
January 30, 2016
|
Opened
|
Acquired (a)
|
Closed
|
January 28, 2017
|
||||||||||
|
Victoria’s Secret U.S.
|
1,118
|
|
23
|
|
—
|
|
(10
|
)
|
1,131
|
|
||||
|
Victoria’s Secret Canada
|
46
|
|
—
|
|
—
|
|
—
|
|
46
|
|
||||
|
Total Victoria's Secret
|
1,164
|
|
23
|
|
—
|
|
(10
|
)
|
1,177
|
|
||||
|
Bath & Body Works U.S.
|
1,574
|
|
30
|
|
—
|
|
(13
|
)
|
1,591
|
|
||||
|
Bath & Body Works Canada
|
98
|
|
5
|
|
—
|
|
(1
|
)
|
102
|
|
||||
|
Total Bath & Body Works
|
1,672
|
|
35
|
|
—
|
|
(14
|
)
|
1,693
|
|
||||
|
Victoria's Secret U.K.
|
14
|
|
4
|
|
—
|
|
—
|
|
18
|
|
||||
|
Victoria's Secret Beauty and Accessories
|
—
|
|
6
|
|
26
|
|
(1
|
)
|
31
|
|
||||
|
Total Victoria's Secret and Bath & Body Works International
|
14
|
|
10
|
|
26
|
|
(1
|
)
|
49
|
|
||||
|
Henri Bendel
|
29
|
|
—
|
|
—
|
|
—
|
|
29
|
|
||||
|
La Senza U.S.
|
—
|
|
4
|
|
—
|
|
—
|
|
4
|
|
||||
|
La Senza Canada
|
126
|
|
—
|
|
—
|
|
(4
|
)
|
122
|
|
||||
|
Total L Brands Stores
|
3,005
|
|
72
|
|
26
|
|
(29
|
)
|
3,074
|
|
||||
_______________
(a) Relates to the acquisition of Victoria's Secret Beauty and Accessories franchise stores in Greater China. For additional
information see Note
5
, "Acquisition" included in Item
8
. Financial Statements and Supplementary Data.
Noncompany-Owned Store Data
The following table represents noncompany-owned store data for
2018
:
|
Stores Operating at
|
Stores Operating at
|
|||||||||||||
|
February 3, 2018
|
Opened
|
Closed
|
Sold (a)
|
February 2, 2019
|
||||||||||
|
Victoria’s Secret Beauty & Accessories
|
397
|
|
32
|
|
(46
|
)
|
—
|
|
383
|
|
||||
|
Victoria's Secret
|
37
|
|
19
|
|
—
|
|
—
|
|
56
|
|
||||
|
Bath & Body Works
|
185
|
|
56
|
|
(6
|
)
|
—
|
|
235
|
|
||||
|
La Senza
|
194
|
|
2
|
|
(17
|
)
|
(179
|
)
|
—
|
|
||||
|
Total
|
813
|
|
109
|
|
(69
|
)
|
(179
|
)
|
674
|
|
||||
_______________
(a) Relates to the divestiture of La Senza. For additional information see Note
6
, "Restructuring Activities"
included in Item
8
. Financial Statements and Supplementary Data.
The following table represents noncompany-owned store data for
2017
:
|
Stores Operating at
|
Stores Operating at
|
||||||||||
|
January 28, 2017
|
Opened
|
Closed
|
February 3, 2018
|
||||||||
|
Victoria’s Secret Beauty & Accessories
|
391
|
|
34
|
|
(28
|
)
|
397
|
|
|||
|
Victoria's Secret
|
28
|
|
9
|
|
—
|
|
37
|
|
|||
|
Bath & Body Works
|
159
|
|
28
|
|
(2
|
)
|
185
|
|
|||
|
La Senza
|
203
|
|
4
|
|
(13
|
)
|
194
|
|
|||
|
Total
|
781
|
|
75
|
|
(43
|
)
|
813
|
|
|||
26
The following table represents noncompany-owned store data for
2016
:
|
Stores Operating at
|
Stores Operating at
|
|||||||||||||
|
January 30, 2016
|
Opened
|
Closed
|
Transferred (a)
|
January 28, 2017
|
||||||||||
|
Victoria’s Secret Beauty & Accessories
|
373
|
|
56
|
|
(12
|
)
|
(26
|
)
|
391
|
|
||||
|
Victoria's Secret
|
19
|
|
9
|
|
—
|
|
—
|
|
28
|
|
||||
|
Bath & Body Works
|
125
|
|
36
|
|
(2
|
)
|
—
|
|
159
|
|
||||
|
La Senza
|
221
|
|
6
|
|
(24
|
)
|
—
|
|
203
|
|
||||
|
Total
|
738
|
|
107
|
|
(38
|
)
|
(26
|
)
|
781
|
|
||||
_______________
(a) Relates to the acquisition of Victoria's Secret Beauty and Accessories franchise stores in Greater China. For additional
information see Note
5
, "Acquisition" included in Item
8
. Financial Statements and Supplementary Data.
Results of Operations—
2018
Compared to
2017
We utilize the retail calendar for reporting. As such, the results for 2018 represent the 52-week period ended February 2, 2019, and the results for 2017 represent the 53-week period ended February 3, 2018.
Operating Income
The following table provides our segment operating income (loss) and operating income rates (expressed as a percentage of net sales) for
2018
in comparison to
2017
:
|
|
|
|
Operating Income Rate
|
||||||||||
|
2018
|
|
2017
|
2018
|
2017
|
|||||||||
|
|
(in millions)
|
|
|
||||||||||
|
Victoria’s Secret
|
$
|
462
|
|
$
|
932
|
|
6.3
|
%
|
12.6
|
%
|
|||
|
Bath & Body Works
|
1,077
|
|
953
|
|
23.3
|
%
|
23.0
|
%
|
|||||
|
Victoria's Secret and Bath & Body Works International
|
(37
|
)
|
5
|
|
(6.2
|
%)
|
1.0
|
%
|
|||||
|
Other (a)
|
(265
|
)
|
(162
|
)
|
(42.5
|
%)
|
(27.1
|
%)
|
|||||
|
Total Operating Income
|
$
|
1,237
|
|
$
|
1,728
|
|
9.3
|
%
|
13.7
|
%
|
|||
________________
|
(a)
|
Includes Mast Global, Henri Bendel, Corporate and La Senza results prior to January 6, 2019.
|
For
2018
, operating income
decreased
$491 million
to
$1.237 billion
, and the operating income rate
decreased
to
9.3%
from
13.7%
. The drivers of the operating income results are discussed in the following sections.
Net Sales
The following table provides net sales for
2018
in comparison to
2017
:
|
2018
|
2017
|
% Change
|
||||||||
|
|
(in millions)
|
|
||||||||
|
Victoria’s Secret Stores (a)
|
$
|
5,628
|
|
$
|
5,879
|
|
(4
|
%)
|
||
|
Victoria’s Secret Direct
|
1,747
|
|
1,508
|
|
16
|
%
|
||||
|
Total Victoria’s Secret
|
7,375
|
|
7,387
|
|
—
|
%
|
||||
|
Bath & Body Works Stores (a)
|
3,907
|
|
3,589
|
|
9
|
%
|
||||
|
Bath & Body Works Direct
|
724
|
|
559
|
|
30
|
%
|
||||
|
Total Bath & Body Works
|
4,631
|
|
4,148
|
|
12
|
%
|
||||
|
Victoria's Secret and Bath & Body Works International
|
605
|
|
502
|
|
20
|
%
|
||||
|
Other (b)
|
626
|
|
595
|
|
5
|
%
|
||||
|
Total Net Sales
|
$
|
13,237
|
|
$
|
12,632
|
|
5
|
%
|
||
________________
|
(a)
|
Includes company-owned stores in the U.S. and Canada.
|
|
(b)
|
Includes Mast Global, Henri Bendel and La Senza results prior to January 6, 2019.
|
27
The following table provides a reconciliation of net sales for
2017
to
2018
:
|
Victoria’s
Secret
|
Bath &
Body Works
|
Victoria’s Secret
and
Bath & Body
Works
International
|
Other
|
Total
|
|||||||||||||||
|
|
|||||||||||||||||||
|
2017 Net Sales
|
$
|
7,387
|
|
$
|
4,148
|
|
$
|
502
|
|
$
|
595
|
|
$
|
12,632
|
|
||||
|
Comparable Store Sales
|
(318
|
)
|
256
|
|
(31
|
)
|
6
|
|
(87
|
)
|
|||||||||
|
Sales Associated with New, Closed and Non-comparable Remodeled Stores, Net
|
(58
|
)
|
67
|
|
93
|
|
(25
|
)
|
77
|
|
|||||||||
|
Foreign Currency Translation
|
(4
|
)
|
(5
|
)
|
2
|
|
(3
|
)
|
(10
|
)
|
|||||||||
|
Direct Channels
|
181
|
|
165
|
|
28
|
|
13
|
|
387
|
|
|||||||||
|
Private Label Credit Card
|
187
|
|
—
|
|
—
|
|
—
|
|
187
|
|
|||||||||
|
International Wholesale, Royalty and Other
|
—
|
|
—
|
|
11
|
|
40
|
|
51
|
|
|||||||||
|
2018 Net Sales
|
$
|
7,375
|
|
$
|
4,631
|
|
$
|
605
|
|
$
|
626
|
|
$
|
13,237
|
|
||||
The following table compares
2018
comparable sales to
2017
:
|
2018
|
2017
|
||||
|
Comparable Sales (Stores and Direct) (a)
|
|||||
|
Victoria's Secret (b)
|
(2
|
%)
|
(8
|
%)
|
|
|
Bath & Body Works (b)
|
11
|
%
|
5
|
%
|
|
|
Total Comparable Sales
|
3
|
%
|
(3
|
%)
|
|
|
Comparable Store Sales (a)
|
|||||
|
Victoria’s Secret (b)
|
(6
|
%)
|
(8
|
%)
|
|
|
Bath & Body Works (b)
|
8
|
%
|
2
|
%
|
|
|
Total Comparable Store Sales
|
(1
|
%)
|
(4
|
%)
|
|
________________
|
(a)
|
The percentage change in comparable sales represents direct and comparable store sales. The percentage change in comparable store sales represents the change in sales at comparable stores only and excludes the change in sales from our direct channels. A store is typically included in the calculation of comparable sales when it has been open or owned 12 months or more and it has not had a change in selling square footage of 20% or more. Additionally, stores of a given brand are excluded if total selling square footage for the brand in the mall changes by 20% or more through the opening or closing of a second store. The percentage change in comparable sales is calculated on a comparable calendar period as opposed to a fiscal basis. Therefore, the percentage change in comparable sales for 2018 was calculated on a 52-to-52-week basis, and the percentage change in comparable sales for 2017 was calculated on a 53-to-53-week basis. Comparable sales attributable to our international stores are calculated on a constant currency basis.
|
|
(b)
|
Includes company-owned stores in the U.S. and Canada.
|
The results by segment are as follows:
Victoria’s Secret
For
2018
, net sales
decreased
$12 million
to
$7.375 billion
; comparable sales
decreased
2%
; and comparable store sales
decreased
6%
. PINK comparable sales decreased in the mid-single digit range, primarily driven by merchandise performance in apparel and the exit of swim. Victoria's Secret Lingerie comparable sales decreased in the low-single digit range, primarily driven by declines in unconstructed and sport bras, due to merchandise performance and category resets, partially offset by increases in sleep and panties. Victoria's Secret Beauty comparable sales increased low-double digits, driven by the merchandise assortment. Additionally, net sales increased as a result of the change in presentation for income received from our Victoria's Secret private label credit card arrangement.
The
decrease
in comparable store sales was driven by lower average unit retail and reduced traffic.
28
Bath & Body Works
For
2018
, net sales
increased
$483 million
to
$4.631 billion
; comparable sales
increased
11%
; and comparable store sales
increased
8%
. Net sales increased in most categories including home fragrance, body care and soaps and sanitizers, which incorporated newness, innovation and fashion.
The
increase
in comparable store sales was driven by higher average dollar sales and conversion.
Victoria's Secret and Bath & Body Works International
For
2018
, net sales
increased
$103 million
to
$605 million
due to new company-owned Victoria's Secret stores, direct channel growth in Greater China and additional stores opened by our partners.
Other
For
2018
, net sales
increased
$31 million
to
$626 million
primarily due to an increase in wholesale sales to our international partners, partially offset by a decline in La Senza as we divested this business on January 6, 2019.
Gross Profit
For
2018
, our gross profit
decreased
$60 million
to
$4.899 billion
, and our gross profit rate (expressed as a percentage of net sales)
decreased
to
37.0%
from
39.3%
primarily as a result of:
Victoria’s Secret
For
2018
, the gross profit decrease was driven by lower merchandise margin dollars related to the decrease in net sales, increased promotional activity to drive traffic and clear inventory, $70 million of store asset impairment charges related to certain stores in the U.S. and Canada and increased distribution and fulfillment expenses related to higher direct channel sales.
The gross profit rate decrease was driven by a decline in the merchandise margin rate due to increased promotional activity and the store asset impairment charges.
Bath & Body Works
For
2018
, the gross profit increase was driven by higher merchandise margin dollars related to the increase in net sales and reduced promotional activity, partially offset by higher occupancy expenses due to higher distribution and fulfillment expenses related to higher direct channel sales and investments in store real estate.
The gross profit rate increase was driven by lower promotional activity.
Victoria's Secret and Bath & Body Works International
For
2018
, the gross profit decrease was primarily driven by $31 million of store asset impairment charges related to certain Victoria's Secret stores in the U.K. and higher occupancy expenses due to investments in store real estate in Greater China, partially offset by increased merchandise margin dollars related to higher net sales in Greater China and additional stores opened by our partners.
The gross profit rate decrease was driven by the store asset impairment charges and investments in store real estate.
General, Administrative and Store Operating Expenses
For
2018
, our general, administrative and store operating expenses
increased
$332 million
to
$3.563 billion
driven by the change in presentation for income received from our Victoria's Secret private label credit card arrangement, incremental wage investments, higher selling expenses related to higher sales volumes at Bath & Body Works and new company-owned stores in Greater China.
The general, administrative and store operating expense rate
increased
to 26.9% from 25.6% due to the presentation change for income received from our Victoria's Secret private label credit card and incremental wage investments.
Loss on Divestiture of La Senza
In 2018, we recognized a pre-tax loss on the sale of La Senza of
$99 million
, primarily related to the recognition of
$45 million
of accumulated translation adjustments, as well as the loss related to the transfer of the net working capital and long-lived store assets to the buyer.
29
Other Income and Expenses
Interest Expense
The following table provides the average daily borrowings and average borrowing rates for
2018
and
2017
:
|
2018
|
2017
|
||||||
|
Average daily borrowings (in millions)
|
$
|
5,853
|
|
$
|
5,827
|
|
|
|
Average borrowing rate (in percentages)
|
6.6
|
%
|
7.0
|
%
|
|||
For
2018
, our interest expense
decreased
$21 million
to
$385 million
due to a lower average borrowing rate partially offset by higher average daily borrowings.
Other Income (Loss)
For
2018
, our other income (loss)
increased
$
15 million
to $5 million of income primarily driven by a $45 million pre-tax loss on extinguishment of the 2019 Notes recognized in 2017, partially offset by fewer distributions received from our Easton investments and the negative impacts of foreign exchange.
Provision for Income Taxes
For
2018
, our effective tax rate decreased to
24.9%
from
25.1%
. The
2018
rate was lower than our combined estimated federal and state statutory rate primarily due to the tax effects of the divestiture of the La Senza business. The
2017
rate was lower than our combined estimated federal and state statutory rate primarily due to the benefit related to changes in U.S. tax legislation.
Results of Operations—Fourth Quarter of
2018
Compared to Fourth Quarter of
2017
We utilize the retail calendar for reporting. As such, the results for the fourth quarter of 2018 represent the 13-week period ended February 2, 2019, and the results for the fourth quarter of 2017 represent the 14-week period ended February 3, 2018.
Operating Income
The following table provides our segment operating income (loss) and operating income rates (expressed as a percentage of net sales) for the fourth quarter of
2018
in comparison to the fourth quarter of
2017
:
|
|
Fourth Quarter
|
Operating Income Rate
|
|||||||||||
|
2018
|
2017
|
2018
|
2017
|
||||||||||
|
|
(in millions)
|
|
|
||||||||||
|
Victoria’s Secret
|
$
|
301
|
|
$
|
457
|
|
11.9
|
%
|
17.1
|
%
|
|||
|
Bath & Body Works
|
607
|
|
557
|
|
31.1
|
%
|
31.0
|
%
|
|||||
|
Victoria's Secret and Bath & Body Works International
|
19
|
|
4
|
|
9.8
|
%
|
2.3
|
%
|
|||||
|
Other (a)
|
(127
|
)
|
(31
|
)
|
(71.0
|
%)
|
(16.1
|
%)
|
|||||
|
Total Operating Income
|
$
|
800
|
|
$
|
987
|
|
16.5
|
%
|
20.5
|
%
|
|||
________________
|
(a)
|
Includes Mast Global, Henri Bendel, Corporate and La Senza results prior to January 6, 2019.
|
For the fourth quarter of
2018
, operating income
decreased
$187 million
to
$800 million
, and the operating income rate
decreased
to
16.5%
from
20.5%
. The drivers of the operating income results are discussed in the following sections.
30
Net Sales
The following table provides net sales for the fourth quarter of
2018
in comparison to the fourth quarter of
2017
:
|
Fourth Quarter
|
2018
|
2017
|
% Change
|
||||||||
|
(in millions)
|
|
||||||||||
|
Victoria’s Secret Stores (a)
|
$
|
1,849
|
|
$
|
2,038
|
|
(9
|
%)
|
|||
|
Victoria’s Secret Direct
|
683
|
|
631
|
|
8
|
%
|
|||||
|
Total Victoria’s Secret
|
2,532
|
|
2,669
|
|
(5
|
%)
|
|||||
|
Bath & Body Works Stores (a)
|
1,626
|
|
1,545
|
|
5
|
%
|
|||||
|
Bath & Body Works Direct
|
325
|
|
249
|
|
30
|
%
|
|||||
|
Total Bath & Body Works
|
1,951
|
|
1,794
|
|
9
|
%
|
|||||
|
Victoria's Secret and Bath & Body Works International
|
190
|
|
170
|
|
12
|
%
|
|||||
|
Other (b)
|
179
|
|
190
|
|
(6
|
%)
|
|||||
|
Total Net Sales
|
$
|
4,852
|
|
$
|
4,823
|
|
1
|
%
|
|||
________________
|
(a)
|
Includes company-owned stores in the U.S. and Canada.
|
|
(b)
|
Includes Mast Global, Henri Bendel and La Senza results prior to January 6, 2019.
|
The following table provides a reconciliation of net sales for the fourth quarter of
2018
to the fourth quarter of
2017
:
|
Fourth Quarter
|
Victoria’s
Secret
|
Bath & Body
Works
|
Victoria’s Secret
and
Bath & Body
Works
International
|
Other
|
Total
|
|||||||||||||||
|
(in millions)
|
||||||||||||||||||||
|
2017 Net Sales
|
$
|
2,669
|
|
$
|
1,794
|
|
$
|
170
|
|
$
|
190
|
|
$
|
4,823
|
|
|||||
|
Comparable Store Sales
|
(135
|
)
|
109
|
|
(7
|
)
|
5
|
|
(28
|
)
|
||||||||||
|
Sales Associated with New, Closed and Non-comparable Remodeled Stores, Net
|
(95
|
)
|
(23
|
)
|
23
|
|
(22
|
)
|
(117
|
)
|
||||||||||
|
Foreign Currency Translation
|
(4
|
)
|
(5
|
)
|
(5
|
)
|
(3
|
)
|
(17
|
)
|
||||||||||
|
Direct Channels
|
29
|
|
76
|
|
7
|
|
6
|
|
118
|
|
||||||||||
|
Private Label Credit Card Income
|
68
|
|
—
|
|
—
|
|
—
|
|
68
|
|
||||||||||
|
International, Wholesale, Royalty and Other
|
—
|
|
—
|
|
2
|
|
3
|
|
5
|
|
||||||||||
|
2018 Net Sales
|
$
|
2,532
|
|
$
|
1,951
|
|
$
|
190
|
|
$
|
179
|
|
$
|
4,852
|
|
|||||
The following table compares fourth quarter of
2018
comparable sales to fourth quarter of
2017
:
|
Fourth Quarter
|
2018
|
2017
|
||||
|
Comparable Sales (Stores and Direct) (a)
|
||||||
|
Victoria's Secret (b)
|
(3
|
%)
|
(1
|
%)
|
||
|
Bath & Body Works (b)
|
12
|
%
|
6
|
%
|
||
|
Total Comparable Sales
|
3
|
%
|
2
|
%
|
||
|
Comparable Store Sales (a)
|
||||||
|
Victoria’s Secret (b)
|
(7
|
%)
|
(6
|
%)
|
||
|
Bath & Body Works (b)
|
8
|
%
|
4
|
%
|
||
|
Total Comparable Store Sales
|
(1
|
%)
|
(2
|
%)
|
||
________________
|
(a)
|
The percentage change in comparable sales represents direct and comparable store sales. The percentage change in comparable store sales represents the change in sales at comparable stores only and excludes the change in sales from our direct channels. A store is typically included in the calculation of comparable sales when it has been open or owned 12 months or more and it has not had a change in selling square footage of 20% or more. Additionally, stores of a given brand are excluded if total selling square footage for the brand in the mall changes by 20% or more through the opening or closing of a second store. The percentage change in comparable sales are calculated on a comparable
|
31
calendar period as opposed to a fiscal basis. Therefore, the percentage change in comparable sales for 2018 was calculated on a 13-to-13-week basis, and the percentage change in comparable sales for 2017 was calculated on a 14-to-14-week basis. Comparable sales attributable to our international stores are calculated on a constant currency basis.
|
(b)
|
Includes company-owned stores in the U.S. and Canada.
|
The results by segment are as follows:
Victoria’s Secret
For the fourth quarter of
2018
, net sales
decreased
$137 million
to
$2.532 billion
; comparable sales decreased
3%
; and comparable store sales
decreased
7%
. PINK comparable sales decreased in the low-double digit range, primarily driven by merchandise performance in apparel. Victoria's Secret Lingerie comparable sales were about flat, primarily driven by declines in intimate apparel, due to merchandise performance and category resets, offset by an increase in sleep. Victoria's Secret Beauty comparable sales increased in the mid-single digit range, driven by the merchandise assortment. Additionally, net sales increased as a result of the change in presentation for income received from our Victoria's Secret private label credit card arrangement.
The decrease in comparable store sales was driven by lower average unit retail and reduced traffic.
Bath & Body Works
For the fourth quarter of
2018
, net sales
increased
$157 million
to
$1.951 billion
; comparable sales increased
12%
; and comparable store sales
increased
8%
. Net sales increased in most categories including home fragrance, body care and soaps and sanitizers, which incorporated newness, innovation and fashion.
The increase in comparable store sales was driven by higher average dollar sales and conversion.
Victoria's Secret and Bath & Body Works International
For the fourth quarter of
2018
, net sales
increased
$20 million
to
$190 million
, due to new company-owned Victoria's Secret stores, direct channel growth in Greater China and additional stores opened by our partners. These increases were partially offset by a decline at Victoria's Secret U.K.
Other
For the fourth quarter of
2018
, net sales
decreased
$11 million
to
$179 million
due to declines in La Senza and Henri Bendel as we divested La Senza and closed Henri Bendel in the quarter.
Gross Profit
For the fourth quarter of
2018
, our gross profit
decreased
$72 million
to
$1.968 billion
, and our gross profit rate (expressed as a percentage of net sales)
decreased
to
40.6%
from
42.3%
primarily as a result of:
Victoria’s Secret
For the fourth quarter of
2018
, the gross profit decrease was driven by lower merchandise margin dollars related to the decrease in net sales, increased promotional activity to drive traffic and clear inventory and due to $20 million of store asset impairment charges related to certain stores in the U.S.
The gross profit rate decrease was driven by a decline in the merchandise margin rate due to increased promotional activity and the store asset impairment charges.
Bath & Body Works
For the fourth quarter of
2018
, the gross profit increase was driven by higher merchandise margin dollars related to the increase in net sales and reduced promotional activity, partially offset by higher occupancy expenses due to higher distribution and fulfillment expenses related to higher direct channel sales and investments in store real estate.
The gross profit rate increase was driven by lower promotional activity.
Victoria's Secret and Bath & Body Works International
For the fourth quarter of
2018
, the gross profit increase was driven by higher merchandise margin dollars related to higher net sales in Greater China and additional stores opened by our partners.
The gross profit rate increase was driven by buying and occupancy leverage on higher net sales.
32
General, Administrative and Store Operating Expenses
For the fourth quarter of
2018
, our general, administrative and store operating expenses
increased
$
16 million
to
$1.069 billion
primarily driven by the change in presentation for income received from our Victoria's Secret private label credit card arrangement, incremental wage investments and higher selling expenses related to higher sales volumes at Bath & Body Works, partially offset by lower selling expenses and fashion show costs at Victoria's Secret.
The general, administrative and store operating expense rate
increased
to
22.0%
from
21.8%
due to the presentation change for income received from our Victoria's Secret private label credit card and incremental wage investments.
Loss on Divestiture of La Senza
In the fourth quarter of 2018, we recognized a pre-tax loss on the sale of La Senza of
$99 million
, primarily related to the recognition of
$45 million
of accumulated translation adjustments, as well as the loss related to the transfer of the net working capital and long-lived store assets to the buyer.
Other Income and Expense
Interest Expense
The following table provides the average daily borrowings and average borrowing rates for the fourth quarter of
2018
and
2017
:
|
Fourth Quarter
|
2018
|
2017
|
||||||
|
Average daily borrowings (in millions)
|
$
|
5,880
|
|
$
|
5,893
|
|
||
|
Average borrowing rate (in percentages)
|
6.4
|
%
|
6.9
|
%
|
||||
For the fourth quarter of
2018
, our interest expense
decreased
$13 million
to
$93 million
due to a lower average borrowing rate and lower average daily borrowings.
Other Income (Loss)
For the fourth quarter of
2018
, our other income (loss) increased $42 million to $4 million of income primarily driven by a $45 million pre-tax loss on extinguishment of the 2019 Notes recognized in the fourth quarter of 2017.
Provision for Income Taxes
For the fourth quarter of
2018
, our effective tax rate increased to 24.0% from 21.1%. The
2018
rate was lower than our combined estimated federal and state statutory rate primarily due to the tax effects of the divestiture of the La Senza business. The
2017
rate was lower than our combined estimated federal and state statutory rate primarily due to the benefit related to changes in U.S. tax legislation.
Results of Operations—2017 Compared to 2016
We utilize the retail calendar for reporting. As such, the results for fiscal 2017 represent the 53-week period ended February 3, 2018, and the results for 2016 represent the 52-week period ended January 28, 2017. The extra week accounted for approximately $160 million in incremental net sales and an estimated $46 million in incremental operating income in 2017.
Operating Income
The following table provides our segment operating income (loss) and operating income rates (expressed as a percentage of net sales) for 2017 in comparison to 2016:
|
|
|
|
Operating Income Rate
|
||||||||||
|
2017
|
2016
|
2017
|
2016
|
||||||||||
|
|
(in millions)
|
|
|
||||||||||
|
Victoria’s Secret
|
$
|
932
|
|
$
|
1,173
|
|
12.6
|
%
|
15.1
|
%
|
|||
|
Bath & Body Works
|
953
|
|
907
|
|
23.0
|
%
|
23.6
|
%
|
|||||
|
Victoria's Secret and Bath & Body Works International
|
5
|
|
40
|
|
1.0
|
%
|
9.4
|
%
|
|||||
|
Other (a)
|
(162
|
)
|
(117
|
)
|
(27.1
|
%)
|
(22.6
|
%)
|
|||||
|
Total Operating Income
|
$
|
1,728
|
|
$
|
2,003
|
|
13.7
|
%
|
15.9
|
%
|
|||
________________
|
(a)
|
Includes Mast Global, La Senza, Henri Bendel and Corporate.
|
33
For 2017, operating income decreased $275 million to $1.728 billion, and the operating income rate decreased to 13.7% from 15.9%. The drivers of the operating income results are discussed in the following sections.
Net Sales
The following table provides net sales for 2017 in comparison to 2016:
|
2017
|
2016
|
% Change
|
||||||||
|
|
(in millions)
|
|
||||||||
|
Victoria’s Secret Stores (a)
|
$
|
5,879
|
|
$
|
6,199
|
|
(5
|
%)
|
||
|
Victoria’s Secret Direct
|
1,508
|
|
1,582
|
|
(5
|
%)
|
||||
|
Total Victoria’s Secret
|
7,387
|
|
7,781
|
|
(5
|
%)
|
||||
|
Bath & Body Works Stores (a)
|
3,589
|
|
3,400
|
|
6
|
%
|
||||
|
Bath & Body Works Direct
|
559
|
|
452
|
|
24
|
%
|
||||
|
Total Bath & Body Works
|
4,148
|
|
3,852
|
|
8
|
%
|
||||
|
Victoria's Secret and Bath & Body Works International
|
502
|
|
423
|
|
19
|
%
|
||||
|
Other (b)
|
595
|
|
518
|
|
15
|
%
|
||||
|
Total Net Sales
|
$
|
12,632
|
|
$
|
12,574
|
|
—
|
%
|
||
________________
|
(a)
|
Includes company-owned stores in the U.S. and Canada.
|
|
(b)
|
Includes Mast Global, La Senza, Henri Bendel and Corporate.
|
The following table provides a reconciliation of net sales for 2016 to 2017:
|
Victoria’s
Secret
|
Bath &
Body Works
|
Victoria’s Secret
and
Bath & Body
Works
International
|
Other
|
Total
|
|||||||||||||||
|
|
|||||||||||||||||||
|
2016 Net Sales
|
$
|
7,781
|
|
$
|
3,852
|
|
$
|
423
|
|
$
|
518
|
|
$
|
12,574
|
|
||||
|
Comparable Store Sales
|
(472
|
)
|
73
|
|
(15
|
)
|
(7
|
)
|
(421
|
)
|
|||||||||
|
Sales Associated with New, Closed and Non-comparable Remodeled Stores, Net
|
146
|
|
110
|
|
64
|
|
3
|
|
323
|
|
|||||||||
|
Foreign Currency Translation
|
6
|
|
6
|
|
(3
|
)
|
5
|
|
14
|
|
|||||||||
|
Direct Channels
|
(74
|
)
|
107
|
|
25
|
|
13
|
|
71
|
|
|||||||||
|
International Wholesale, Royalty and Other
|
—
|
|
—
|
|
8
|
|
63
|
|
71
|
|
|||||||||
|
2017 Net Sales
|
$
|
7,387
|
|
$
|
4,148
|
|
$
|
502
|
|
$
|
595
|
|
$
|
12,632
|
|
||||
The following table compares 2017 comparable sales to 2016:
|
2017
|
2016
|
||||
|
Comparable Sales (Stores and Direct) (a)
|
|||||
|
Victoria's Secret (b)
|
(8
|
%)
|
—
|
%
|
|
|
Bath & Body Works (b)
|
5
|
%
|
6
|
%
|
|
|
Total Comparable Sales
|
(3
|
%)
|
2
|
%
|
|
|
Comparable Store Sales (a)
|
|||||
|
Victoria’s Secret (b)
|
(8
|
%)
|
(1
|
%)
|
|
|
Bath & Body Works (b)
|
2
|
%
|
3
|
%
|
|
|
Total Comparable Store Sales
|
(4
|
%)
|
1
|
%
|
|
________________
|
(a)
|
The percentage change in comparable sales represents direct and comparable store sales. The percentage change in comparable store sales represents the change in sales at comparable stores only and excludes the change in sales from our direct channels. A store is typically included in the calculation of comparable sales when it has been open or owned 12 months or more and it has not had a change in selling square footage of 20% or more. Additionally, stores of
|
34
a given brand are excluded if total selling square footage for the brand in the mall changes by 20% or more through the opening or closing of a second store. The percentage change in comparable sales are calculated on a comparable calendar period as opposed to a fiscal basis. Therefore, the percentage change in comparable sales for 2017 was calculated on a 53-to-53-week basis, and the percentage change in comparable sales for 2016 was calculated on a 52-to-52-week basis. Comparable sales attributable to our international stores are calculated on a constant currency basis.
|
(b)
|
Includes company-owned stores in the U.S. and Canada.
|
The results by segment are as follows:
Victoria’s Secret
For 2017, net sales decreased $394 million to $7.387 billion; comparable sales and comparable store sales both decreased 8%. Net sales decreased primarily due to strategic decisions to exit the swim and apparel categories, a decline in core bra sales and a decline in panties as we reposition the category. These results were partially offset by increases in PINK, sport and beauty driven by merchandise assortment that incorporated newness, innovation and fashion.
The decrease in comparable store sales was driven primarily by a decrease in total transactions due to reduced traffic, impacted significantly by the exit of certain categories.
Bath & Body Works
For 2017, net sales increased $296 million to $4.148 billion; comparable sales increased 5%; and comparable store sales increased 2%. Net sales increased in the home fragrance and body care categories, which incorporated newness, innovation and fashion.
The increase in comparable store sales was primarily driven by higher average unit retail.
Victoria's Secret and Bath & Body Works International
For 2017, net sales increased $79 million to $502 million primarily related to new company-owned Victoria's Secret stores and direct channel growth in Greater China and additional stores opened by our partners.
Other
For 2017, net sales increased $77 million to $595 million primarily due to an increase in wholesale sales to our international partners.
Gross Profit
For 2017, our gross profit decreased $166 million to $4.959 billion, and our gross profit rate (expressed as a percentage of net sales) decreased to 39.3% from 40.8% primarily as a result of:
Victoria’s Secret
For 2017, the gross profit decrease was driven by lower merchandise margin dollars related to the decrease in net sales.
The gross profit rate decrease was driven by deleverage of buying and occupancy expenses on lower sales and a lower merchandise margin rate primarily due to increased promotional activity, partially offset by lower catalogue costs and other cost reductions.
Bath & Body Works
For 2017, the gross profit increase was driven by higher merchandise margin dollars related to the increase in net sales, partially offset by higher occupancy expenses due to investments in store real estate.
The gross profit rate decrease was driven by a decrease in the merchandise margin rate primarily due to increased promotional activity, mix of category sales and channel mix.
Victoria's Secret and Bath & Body Works International
For 2017, the gross profit increase was driven by increased merchandise margin dollars related to higher net sales in Greater China and additional stores opened by our partners. These increases were partially offset by higher occupancy expenses due to investments in store real estate in Greater China and at Victoria's Secret U.K.
The gross profit rate decrease was driven by an increase in occupancy expenses due to investments in store real estate in Greater China and at Victoria's Secret U.K.
35
General, Administrative and Store Operating Expenses
For 2017, our general, administrative and store operating expenses increased $109 million to $3.231 billion primarily driven by an increase in marketing expenses due to increased direct mail at Victoria's Secret, higher selling expenses at Bath & Body Works and in Greater China due to the increase in net sales, and as a result of our investment in Greater China. These increases were partially offset by lower selling expenses related to lower sales volumes at Victoria's Secret and severance charges recorded in the first quarter of 2016 related to the Victoria's Secret restructuring.
The general, administrative and store operating expense rate increased to 25.6% from 24.8% primarily due to increased marketing expenses.
Other Income and Expenses
Interest Expense
The following table provides the average daily borrowings and average borrowing rates for 2017 and 2016:
|
2017
|
2016
|
||||||
|
Average daily borrowings (in millions)
|
$
|
5,827
|
|
$
|
5,827
|
|
|
|
Average borrowing rate (in percentages)
|
7.0
|
%
|
6.8
|
%
|
|||
For 2017, our interest expense increased $12 million to $406 million due to a higher average borrowing rate and the impact of the extra week in 2017.
Other Income (Loss)
For 2017, our other income (loss) decreased $97 million to a $10 million loss. Activity in 2016 included a distribution received from Easton Town Center, LLC resulting in a pre-tax gain of $108 million, partially offset by a $36 million pre-tax loss on extinguishment of the 2017 Notes. In 2017, we recognized a $45 million pre-tax loss on extinguishment of the 2019 Notes, partially offset by gains related to distributions from certain of our Easton investments.
Provision for Income Taxes
For 2017, our effective tax rate decreased to 25.1% from 31.7%. The 2017 rate was lower than our combined estimated federal and state statutory rate primarily due to the benefit related to changes in U.S. tax legislation. The 2016 rate was lower than our combined estimated federal and state statutory rate primarily due to the resolution of certain tax matters.
Results of Operations—Fourth Quarter of 2017 Compared to Fourth Quarter of 2016
We utilize the retail calendar for reporting. As such, the results for the fourth quarter of 2017 represent the 14-week period ended February 3, 2018, and the results for the fourth quarter of 2016 represent the 13-week period ended January 28, 2017. The extra week accounted for approximately $160 million in incremental net sales and an estimated $46 million in incremental operating income in 2017.
Operating Income
The following table provides our segment operating income (loss) and operating income rates (expressed as a percentage of net sales) for the fourth quarter of 2017 in comparison to the fourth quarter of 2016:
|
|
Fourth Quarter
|
Operating Income Rate
|
|||||||||||
|
2017
|
2016
|
2017
|
2016
|
||||||||||
|
|
(in millions)
|
|
|
||||||||||
|
Victoria’s Secret
|
$
|
457
|
|
$
|
494
|
|
17.1
|
%
|
19.1
|
%
|
|||
|
Bath & Body Works
|
557
|
|
502
|
|
31.0
|
%
|
31.0
|
%
|
|||||
|
Victoria's Secret and Bath & Body Works International
|
4
|
|
10
|
|
2.3
|
%
|
8.3
|
%
|
|||||
|
Other (a)
|
(31
|
)
|
(18
|
)
|
(16.1
|
%)
|
(11.7
|
%)
|
|||||
|
Total Operating Income
|
$
|
987
|
|
$
|
988
|
|
20.5
|
%
|
22.0
|
%
|
|||
________________
|
(a)
|
Includes Mast Global, La Senza, Henri Bendel and Corporate.
|
For the fourth quarter of 2017, operating income decreased $1 million to $987 million, and the operating income rate decreased to 20.5% from 22.0%. The drivers of the operating income results are discussed in the following sections.
36
Net Sales
The following table provides net sales for the fourth quarter of 2017 in comparison to the fourth quarter of 2016:
|
Fourth Quarter
|
2017
|
2016
|
% Change
|
||||||||
|
(in millions)
|
|
||||||||||
|
Victoria’s Secret Stores (a)
|
$
|
2,038
|
|
$
|
2,063
|
|
(1
|
%)
|
|||
|
Victoria’s Secret Direct
|
631
|
|
526
|
|
20
|
%
|
|||||
|
Total Victoria’s Secret
|
2,669
|
|
2,589
|
|
3
|
%
|
|||||
|
Bath & Body Works Stores (a)
|
1,545
|
|
1,422
|
|
9
|
%
|
|||||
|
Bath & Body Works Direct
|
249
|
|
198
|
|
26
|
%
|
|||||
|
Total Bath & Body Works
|
1,794
|
|
1,620
|
|
11
|
%
|
|||||
|
Victoria's Secret and Bath & Body Works International
|
170
|
|
124
|
|
37
|
%
|
|||||
|
Other (b)
|
190
|
|
156
|
|
21
|
%
|
|||||
|
Total Net Sales
|
$
|
4,823
|
|
$
|
4,489
|
|
7
|
%
|
|||
________________
|
(a)
|
Includes company-owned stores in the U.S. and Canada.
|
|
(b)
|
Includes Mast Global, La Senza, Henri Bendel and Corporate.
|
The following table provides a reconciliation of net sales for the fourth quarter of 2017 to the fourth quarter of 2016:
|
Fourth Quarter
|
Victoria’s
Secret
|
Bath & Body
Works
|
Victoria’s Secret
and
Bath & Body
Works
International
|
Other
|
Total
|
|||||||||||||||
|
(in millions)
|
||||||||||||||||||||
|
2016 Net Sales
|
$
|
2,589
|
|
$
|
1,620
|
|
$
|
124
|
|
$
|
156
|
|
$
|
4,489
|
|
|||||
|
Comparable Store Sales
|
(116
|
)
|
52
|
|
(8
|
)
|
(2
|
)
|
(74
|
)
|
||||||||||
|
Sales Associated with New, Closed and Non-comparable Remodeled Stores, Net
|
87
|
|
66
|
|
24
|
|
3
|
|
180
|
|
||||||||||
|
Foreign Currency Translation
|
4
|
|
5
|
|
5
|
|
3
|
|
17
|
|
||||||||||
|
Direct Channels
|
105
|
|
51
|
|
14
|
|
6
|
|
176
|
|
||||||||||
|
International, Wholesale, Royalty and Other
|
—
|
|
—
|
|
11
|
|
24
|
|
35
|
|
||||||||||
|
2017 Net Sales
|
$
|
2,669
|
|
$
|
1,794
|
|
$
|
170
|
|
$
|
190
|
|
$
|
4,823
|
|
|||||
The following table compares fourth quarter of 2017 comparable sales to fourth quarter of 2016:
|
Fourth Quarter
|
2017
|
2016
|
||||
|
Comparable Sales (Stores and Direct) (a)
|
||||||
|
Victoria's Secret (b)
|
(1
|
%)
|
(3
|
%)
|
||
|
Bath & Body Works (b)
|
6
|
%
|
5
|
%
|
||
|
Total Comparable Sales
|
2
|
%
|
—
|
%
|
||
|
Comparable Store Sales (a)
|
||||||
|
Victoria’s Secret (b)
|
(6
|
%)
|
(2
|
%)
|
||
|
Bath & Body Works (b)
|
4
|
%
|
2
|
%
|
||
|
Total Comparable Store Sales
|
(2
|
%)
|
—
|
%
|
||
________________
|
(a)
|
The percentage change in comparable sales represents direct and comparable store sales. The percentage change in comparable store sales represents the change in sales at comparable stores only and excludes the change in sales from our direct channels. A store is typically included in the calculation of comparable sales when it has been open or owned 12 months or more and it has not had a change in selling square footage of 20% or more. Additionally, stores of a given brand are excluded if total selling square footage for the brand in the mall changes by 20% or more through the opening or closing of a second store. The percentage change in comparable sales are calculated on a comparable calendar period as opposed to a fiscal basis. Therefore, the percentage change in comparable sales for 2017 was
|
37
calculated on a 14-to-14-week basis, and the percentage change in comparable sales for 2016 was calculated on a 13-to-13-week basis. Comparable sales attributable to our international stores are calculated on a constant currency basis.
|
(b)
|
Includes company-owned stores in the U.S. and Canada.
|
The results by segment are as follows:
Victoria’s Secret
For the fourth quarter of 2017, net sales increased $80 million to $2.669 billion; comparable sales decreased 1%; and comparable store sales decreased 6%. Net sales increased in PINK, beauty and sport apparel driven by merchandise assortment that incorporated newness, innovation and fashion. These results were partially offset by a decrease in lingerie sales driven by a decline in unconstructed and sport bra performance.
The decrease in comparable store sales was driven primarily by lower traffic and lower average unit retail.
Bath & Body Works
For the fourth quarter of 2017, net sales increased $174 million to $1.794 billion; comparable sales increased 6%; and comparable store sales increased 4%. Net sales increased in the home fragrance and body care categories, which incorporated newness, innovation and fashion.
The increase in comparable store sales was driven by higher average unit retail.
Victoria's Secret and Bath & Body Works International
For the fourth quarter of 2017, net sales increased $46 million to $170 million, primarily related to new company-owned Victoria's Secret stores and direct channel growth in Greater China and additional stores opened by our partners.
Other
For the fourth quarter of 2017, net sales increased $34 million to $190 million primarily due to an increase in wholesale sales to our international partners.
Gross Profit
For the fourth quarter of 2017, our gross profit increased $96 million to $2.040 billion, and our gross profit rate (expressed as a percentage of net sales) decreased to 42.3% from 43.3% primarily as a result of:
Victoria’s Secret
For the fourth quarter of 2017, the gross profit increase was driven by higher merchandise margin dollars related to the increase in net sales, partially offset by an increase in distribution and fulfillment expenses related to higher direct channel sales.
The gross profit rate decrease was driven by a decrease in the merchandise margin rate primarily due to increased promotional activity.
Bath & Body Works
For the fourth quarter of 2017, the gross profit increase was driven by higher merchandise margin dollars related to the increase in net sales, partially offset by higher occupancy expenses due to investments in store real estate and distribution and fulfillment expenses related to higher direct channel sales.
The gross profit rate decrease was driven by a decrease in the merchandise margin rate primarily due to increased promotional activity, partially offset by leverage of buying and occupancy expenses on higher sales.
Victoria's Secret and Bath & Body Works International
For the fourth quarter of 2017, the gross profit increase was driven by increased merchandise margin dollars related to higher net sales in Greater China and additional stores opened by our partners, partially offset by higher occupancy expenses due to investments in store real estate in Greater China and at Victoria's Secret U.K.
The gross profit rate decrease was driven by an increase in occupancy expenses due to investments in store real estate in Greater China and at Victoria's Secret U.K.
General, Administrative and Store Operating Expenses
For the fourth quarter of 2017, our general, administrative and store operating expenses increased $97 million to $1.053 billion driven by higher selling expenses due to higher sales volumes and an increase in marketing expenses primarily due to increased direct mail at Victoria's Secret.
38
The general, administrative and store operating expense rate increased to 21.8% from 21.3% primarily due to increased marketing expenses.
Other Income and Expense
Interest Expense
The following table provides the average daily borrowings and average borrowing rates for the fourth quarter of 2017 and 2016:
|
Fourth Quarter
|
2017
|
2016
|
||||||
|
Average daily borrowings (in millions)
|
$
|
5,893
|
|
$
|
5,779
|
|
||
|
Average borrowing rate (in percentages)
|
6.9
|
%
|
6.9
|
%
|
||||
For the fourth quarter of 2017, our interest expense increased $8 million to $106 million due to the impact of the extra week in 2017 and an increase in average daily borrowings.
Other Income (Loss)
For the fourth quarter of 2017, our other income (loss) decreased $42 million to a $38 million loss primarily driven by a $45 million pre-tax loss on extinguishment of the 2019 Notes.
Provision for Income Taxes
For the fourth quarter of 2017, our effective tax rate decreased to 21.1% from 29.2%. The 2017 rate was lower than our combined estimated federal and state statutory rate primarily due to the benefit related to changes in U.S. tax legislation. The 2016 rate was lower than our combined estimated federal and state statutory rate primarily due to the resolution of certain tax matters.
FINANCIAL CONDITION
Liquidity and Capital Resources
Liquidity, or access to cash, is an important factor in determining our financial stability. We are committed to maintaining adequate liquidity. Cash generated from our operating activities provides the primary resources to support current operations, growth initiatives, seasonal funding requirements and capital expenditures. Our cash provided from operations is impacted by our net income and working capital changes. Our net income is impacted by, among other things, sales volume, seasonal sales patterns, success of new product introductions, profit margins and income taxes. Historically, sales are higher during the fourth quarter of the fiscal year due to seasonal and holiday-related sales patterns. Generally, our need for working capital peaks during the summer and fall months as inventory builds in anticipation of the holiday period. The majority of our cash and cash equivalents were held by domestic subsidiaries as of
February 2, 2019
. Our cash and cash equivalents held by foreign subsidiaries were
$413 million
as of
February 2, 2019
.
We are committed to returning value to our shareholders. During
2018
, we paid
$666 million
in dividends and repurchased
$196 million
of our common stock. We use cash flow generated from operating and financing activities to fund our dividends and share repurchase programs.
39
The following table provides our outstanding debt balance, net of unamortized debt issuance costs and discounts, as of
February 2, 2019
and
February 3, 2018
:
|
February 2,
2019 |
February 3,
2018 |
||||||
|
(in millions)
|
|||||||
|
Senior Debt with Subsidiary Guarantee
|
|||||||
|
$1 billion, 6.875% Fixed Interest Rate Notes due November 2035 (“2035 Notes”)
|
$
|
990
|
|
$
|
990
|
|
|
|
$956 million, 5.625% Fixed Interest Rate Notes due February 2022 (“2022 Notes”)
|
952
|
|
994
|
|
|||
|
$780 million, 6.625% Fixed Interest Rate Notes due April 2021 (“2021 Notes”)
|
776
|
|
994
|
|
|||
|
$700 million, 6.75% Fixed Interest Rate Notes due July 2036 (“2036 Notes”)
|
693
|
|
693
|
|
|||
|
$500 million, 5.625% Fixed Interest Rate Notes due October 2023 (“2023 Notes”)
|
498
|
|
497
|
|
|||
|
$500 million, 5.25% Fixed Interest Rate Notes due February 2028 (“2028 Notes”)
|
496
|
|
495
|
|
|||
|
$338 million, 7.00% Fixed Interest Rate Notes due May 2020 (“2020 Notes”)
|
337
|
|
398
|
|
|||
|
$297 million, 6.694% Fixed Interest Rate Notes due January 2027 ("2027 Notes")
|
273
|
|
—
|
|
|||
|
Secured Foreign Facilities
|
91
|
|
1
|
|
|||
|
Total Senior Debt with Subsidiary Guarantee
|
$
|
5,106
|
|
$
|
5,062
|
|
|
|
Senior Debt
|
|||||||
|
$350 million, 6.95% Fixed Interest Rate Debentures due March 2033 (“2033 Notes”)
|
$
|
348
|
|
$
|
348
|
|
|
|
$300 million, 7.60% Fixed Interest Rate Notes due July 2037 (“2037 Notes”)
|
297
|
|
297
|
|
|||
|
Unsecured Foreign Facilities
|
60
|
|
87
|
|
|||
|
Total Senior Debt
|
$
|
705
|
|
$
|
732
|
|
|
|
Total
|
$
|
5,811
|
|
$
|
5,794
|
|
|
|
Current Debt
|
(72
|
)
|
(87
|
)
|
|||
|
Total Long-term Debt, Net of Current Portion
|
$
|
5,739
|
|
$
|
5,707
|
|
|
Exchange of Notes
In June 2018, we completed private offers to exchange
$62 million
,
$220 million
and
$44 million
of outstanding 2020 Notes, 2021 Notes and 2022 Notes, respectively, for
$297 million
of newly issued
6.694%
notes due in January 2027 and
$52 million
in cash consideration, which included a
$24 million
exchange premium. The exchange was treated as a modification under ASC 470,
Debt
, and no gain or loss was recognized. The exchange premium will be amortized through the maturity date of January 2027 and is included within Long-term Debt on the
February 2, 2019
Consolidated Balance Sheet. The obligation to pay principal and interest on the 2027 Notes is jointly and severally guaranteed on a full and unconditional basis by certain of our 100% owned subsidiaries (the “Guarantors”).
Issuance of Notes
In January 2018, we issued
$500 million
of
5.25%
notes due in February 2028. The obligation to pay principal and interest on these notes is jointly and severally guaranteed on a full and unconditional basis by the Guarantors. The proceeds from the issuance were
$495 million
, which were net of issuance costs of
$5 million
. These issuance costs are being amortized through the maturity date of February 2028 and are included within Long-term Debt on the Consolidated Balance Sheets.
Redemption of Notes
In January 2018, we used the proceeds from the 2028 Notes to redeem the
$500 million
2019 Notes for
$540 million
. In the fourth quarter of 2017, we recognized a pre-tax loss on extinguishment of this debt of
$45 million
(after-tax loss of
$29 million
), which includes write-offs of unamortized issuance costs and discounts and losses related to terminated interest rate swaps associated with the 2019 Notes. This loss is included in Other Income (Loss) in the 2017 Consolidated Statement of Income.
Secured Revolving Facility
We and the Guarantors guarantee and pledge collateral to secure a revolving credit facility ("Secured Revolving Facility"). The Secured Revolving Facility has aggregate availability of
$1 billion
and expires in May 2022. The Secured Revolving Facility allows us and certain of our non-U.S. subsidiaries to borrow and obtain letters of credit in U.S. dollars, Canadian dollars, Euros, Hong Kong dollars or British pounds.
The Secured Revolving Facility fees related to committed and unutilized amounts are
0.25%
per annum, and the fees related to outstanding letters of credit are
1.50%
per annum. In addition, the interest rate on outstanding U.S. dollar borrowings is the
40
London Interbank Offered Rate ("LIBOR") plus
1.50%
per annum. The interest rate on outstanding foreign denominated borrowings is the applicable benchmark rate plus
1.50%
per annum.
The Secured Revolving Facility contains fixed charge coverage and debt to EBITDA financial covenants. We are required to maintain a fixed charge coverage ratio of not less than
1.75
to
1.00
and a consolidated debt to consolidated EBITDA ratio not exceeding
4.00
to
1.00
for the most recent four-quarter period. In addition, the Secured Revolving Facility provides that investments and restricted payments may be made, without limitation on amount, if (a) at the time of and after giving effect to such investment or restricted payment, the ratio of consolidated debt to consolidated EBITDA for the most recent four-quarter period is less than
3.00
to
1.00
and (b) no default or event of default exists. As of
February 2, 2019
, we were in compliance with both of our financial covenants, and the ratio of consolidated debt to consolidated EBITDA was less than
3.00
to
1.00
.
During
2018
, we borrowed, and made payments of,
$92 million
under the Secured Revolving Facility. As of
February 2, 2019
, there were no borrowings outstanding under the Secured Revolving Facility.
The Secured Revolving Facility supports our letter of credit program. We had
$9 million
of outstanding letters of credit as of
February 2, 2019
that reduced our remaining availability under the Secured Revolving Facility.
Secured Foreign Facilities
We and the Guarantors guarantee and pledge collateral to secure revolving and term loan bank facilities ("Secured Foreign Facilities") used by certain of our Greater China subsidiaries to support their operations. The Secured Foreign Facilities, which allow borrowings in U.S. dollars and Chinese Yuan, have availability totaling
$100 million
. The interest rates on outstanding borrowings are based upon the applicable benchmark rate for the currency of each borrowing. During
2018
, we borrowed
$107 million
and made payments of
$17 million
under the Secured Foreign Facilities. The maximum daily amount outstanding at any point in time in
2018
was
$99 million
. Borrowings on the Secured Foreign Facilities mature between February 2019 and May 2022. As of
February 2, 2019
, borrowings of
$12 million
are included within Current Debt on the Consolidated Balance Sheet and the remaining borrowings are included within Long-term Debt.
Unsecured Foreign Facilities
We guarantee unsecured revolving and term loan bank facilities ("Unsecured Foreign Facilities") used by certain of our Greater China subsidiaries to support their operations. The Unsecured Foreign Facilities, which allow borrowings in U.S. dollars and Chinese Yuan, have availability totaling
$100 million
. The interest rates on outstanding borrowings are based upon the applicable benchmark rate for the currency of each borrowing. During
2018
, we borrowed
$65 million
and made payments of
$92 million
under the Unsecured Foreign Facilities. The maximum daily amount outstanding at any point in time in 2018 was
$90 million
. Borrowings on the Unsecured Foreign Facilities mature between March 2019 and December 2019. As of
February 2, 2019
, borrowings of
$60 million
are included within Current Debt on the Consolidated Balance Sheet.
Working Capital and Capitalization
We believe that our available short-term and long-term capital resources are sufficient to fund foreseeable requirements.
The following table provides a summary of our working capital position and capitalization as of
February 2, 2019
,
February 3, 2018
and
January 28, 2017
:
|
February 2, 2019
|
February 3, 2018
|
January 28, 2017
|
|||||||||
|
|
(in millions)
|
||||||||||
|
Net Cash Provided by Operating Activities
|
$
|
1,377
|
|
$
|
1,406
|
|
$
|
1,990
|
|
||
|
Capital Expenditures
|
629
|
|
707
|
|
990
|
|
|||||
|
Working Capital
|
1,274
|
|
1,262
|
|
1,451
|
|
|||||
|
Capitalization:
|
|||||||||||
|
Long-term Debt
|
5,739
|
|
5,707
|
|
5,700
|
|
|||||
|
Shareholders’ Equity (Deficit)
|
(869
|
)
|
(753
|
)
|
(729
|
)
|
|||||
|
Total Capitalization
|
$
|
4,870
|
|
$
|
4,954
|
|
$
|
4,971
|
|
||
|
Remaining Amounts Available Under Credit Agreements (a)
|
$
|
991
|
|
$
|
991
|
|
$
|
992
|
|
||
________________
|
(a)
|
Letters of credit issued reduce our remaining availability under the Secured Revolving Facility. We had outstanding letters of credit that reduce our remaining availability under the Secured Revolving Facility of
$9 million
as of
February 2, 2019
and
February 3, 2018
, and $8 million as of
January 28, 2017
.
|
41
The following table provides certain measures of liquidity and capital resources as of
February 2, 2019
,
February 3, 2018
and
January 28, 2017
:
|
February 2, 2019
|
February 3, 2018
|
January 28, 2017
|
||||||
|
Debt-to-capitalization Ratio (a)
|
118
|
%
|
115
|
%
|
115
|
%
|
||
|
Cash Flow to Capital Investment
|
219
|
%
|
199
|
%
|
201
|
%
|
||
________________
|
(a)
|
Long-term debt divided by total capitalization.
|
Credit Ratings
Our borrowing costs under our Secured Revolving Facility and Secured Foreign Facilities are linked to our credit ratings. If we receive an upgrade or downgrade to our corporate credit ratings, the borrowing costs could decrease or increase, respectively. The guarantees of our obligations under the Secured Revolving Facility and Secured Foreign Facilities by the Guarantors and the security interests granted in our and the Guarantors’ collateral securing such obligations are released if our credit ratings are higher than a certain level. Additionally, the restrictions imposed under the Secured Revolving Facility and Secured Foreign Facilities on our ability to make investments and to make restricted payments cease to apply if our credit ratings are higher than certain levels. Credit rating downgrades by any of the agencies do not accelerate the repayment of any of our debt.
The following table provides our credit ratings as of
February 2, 2019
:
|
|
Moody’s
|
S&P
|
|
|
Corporate
|
Ba1
|
BB
|
|
|
Senior Unsecured Debt with Subsidiary Guarantee
|
Ba1
|
BB
|
|
|
Senior Unsecured Debt
|
Ba2
|
B+
|
|
|
Outlook
|
Stable
|
Negative
|
|
Common Stock Share Repurchases
Our Board of Directors will determine share repurchase authorizations giving consideration to our levels of profit and cash flow, capital requirements, current and forecasted liquidity, the restrictions placed upon us by our borrowing arrangements as well as financial and other conditions existing at the time. We use cash flow generated from operating and financing activities to fund our share repurchase programs. The timing and amount of any repurchases will be made at our discretion, taking into account a number of factors, including market conditions.
Under the authority of our Board of Directors, we repurchased shares of our common stock under the following repurchase programs during fiscal
2018
,
2017
and
2016
:
|
|
Shares Repurchased
|
Amount Repurchased
|
Average Stock
Price of
Shares
Repurchased
within
Program
|
||||||||||||||||||||||||||
|
Repurchase Program
|
Amount Authorized
|
2018
|
2017
|
2016
|
2018
|
2017
|
2016
|
||||||||||||||||||||||
|
|
(in millions)
|
(in thousands)
|
(in millions)
|
|
|||||||||||||||||||||||||
|
March 2018
|
$
|
250
|
|
4,852
|
|
NA
|
|
NA
|
|
$
|
171
|
|
NA
|
|
NA
|
|
$
|
35.29
|
|
||||||||||
|
September 2017
|
250
|
|
527
|
|
3,858
|
|
NA
|
|
25
|
|
$
|
202
|
|
NA
|
|
$
|
51.72
|
|
|||||||||||
|
February 2017
|
250
|
|
NA
|
|
5,500
|
|
NA
|
|
NA
|
|
240
|
|
NA
|
|
$
|
43.57
|
|
||||||||||||
|
February 2016
|
500
|
|
NA
|
|
51
|
|
5,719
|
|
NA
|
|
3
|
|
$
|
438
|
|
$
|
76.47
|
|
|||||||||||
|
Total
|
5,379
|
|
9,409
|
|
5,719
|
|
$
|
196
|
|
$
|
445
|
|
$
|
438
|
|
||||||||||||||
In March 2018, our Board of Directors approved a new
$250 million
share repurchase program, which included the
$23 million
remaining under the September 2017 repurchase program.
In September 2017, our Board of Directors approved a
$250 million
share repurchase program, which included the
$10 million
remaining under the February 2017 repurchase program.
In February 2017, our Board of Directors approved a
$250 million
share repurchase program, which included the
$59 million
remaining under the February 2016 repurchase program.
42
In February 2016, our Board of Directors approved a
$500 million
share repurchase program, which included the
$17 million
remaining under the June 2015 repurchase program.
The March 2018 repurchase program had
$79 million
remaining as of
February 2, 2019
.
There were
$2 million
of share repurchases reflected in Accounts Payable on the
February 3, 2018
Consolidated Balance Sheet.
Treasury Stock Retirement
In November 2017, we retired
36 million
shares of our treasury stock. The retirement resulted in a reduction of
$2.036 billion
in Treasury Stock,
$18 million
in the par value of Common Stock,
$82 million
in Paid-in Capital and
$1.936 billion
in Retained Earnings.
Dividend Policy and Procedures
Our Board of Directors will determine future dividends after giving consideration to our levels of profit and cash flow, capital requirements, current and forecasted liquidity, the restrictions placed upon us by our borrowing arrangements as well as financial and other conditions existing at the time. We use cash flow generated from operating and financing activities to fund our dividends and share repurchase programs.
Under the authority and declaration of our Board of Directors, we paid the following dividends during fiscal
2018
,
2017
and
2016
:
|
Ordinary Dividends
|
Special Dividends
|
Total Dividends
|
Total Paid
|
||||||||||||
|
(per share)
|
(in millions)
|
||||||||||||||
|
2018
|
|||||||||||||||
|
Fourth Quarter
|
$
|
0.60
|
|
$
|
—
|
|
$
|
0.60
|
|
$
|
166
|
|
|||
|
Third Quarter
|
0.60
|
|
—
|
|
0.60
|
|
165
|
|
|||||||
|
Second Quarter
|
0.60
|
|
—
|
|
0.60
|
|
167
|
|
|||||||
|
First Quarter
|
0.60
|
|
—
|
|
0.60
|
|
168
|
|
|||||||
|
2018 Total
|
$
|
2.40
|
|
$
|
—
|
|
$
|
2.40
|
|
$
|
666
|
|
|||
|
2017
|
|||||||||||||||
|
Fourth Quarter
|
$
|
0.60
|
|
$
|
—
|
|
$
|
0.60
|
|
$
|
170
|
|
|||
|
Third Quarter
|
0.60
|
|
—
|
|
0.60
|
|
172
|
|
|||||||
|
Second Quarter
|
0.60
|
|
—
|
|
0.60
|
|
172
|
|
|||||||
|
First Quarter
|
0.60
|
|
—
|
|
0.60
|
|
172
|
|
|||||||
|
2017 Total
|
$
|
2.40
|
|
$
|
—
|
|
$
|
2.40
|
|
$
|
686
|
|
|||
|
2016
|
|||||||||||||||
|
Fourth Quarter
|
$
|
0.60
|
|
$
|
—
|
|
$
|
0.60
|
|
$
|
172
|
|
|||
|
Third Quarter
|
0.60
|
|
—
|
|
0.60
|
|
173
|
|
|||||||
|
Second Quarter
|
0.60
|
|
—
|
|
0.60
|
|
173
|
|
|||||||
|
First Quarter
|
0.60
|
|
2.00
|
|
2.60
|
|
750
|
|
|||||||
|
2016 Total
|
$
|
2.40
|
|
$
|
2.00
|
|
$
|
4.40
|
|
$
|
1,268
|
|
|||
In November 2018, our Board of Directors reduced our annual ordinary dividend to $1.20 per share from $2.40 per share, beginning with the quarterly dividend paid in March 2019.
Subsequent to
February 2, 2019
, our Board of Directors declared the first quarter of
2019
ordinary dividend of
$0.30
per share.
43
Cash Flow
The following table provides a summary of our cash flow activity for the fiscal years ended
February 2, 2019
,
February 3, 2018
and
January 28, 2017
:
|
2018
|
2017
|
2016
|
|||||||||
|
|
(in millions)
|
||||||||||
|
Cash and Cash Equivalents, Beginning of Year
|
$
|
1,515
|
|
$
|
1,934
|
|
$
|
2,548
|
|
||
|
Net Cash Flows Provided by Operating Activities
|
1,377
|
|
1,406
|
|
1,990
|
|
|||||
|
Net Cash Flows Used for Investing Activities
|
(609
|
)
|
(698
|
)
|
(833
|
)
|
|||||
|
Net Cash Flows Used for Financing Activities
|
(872
|
)
|
(1,127
|
)
|
(1,765
|
)
|
|||||
|
Effects of Exchange Rate Changes on Cash
|
2
|
|
—
|
|
(6
|
)
|
|||||
|
Net Decrease in Cash and Cash Equivalents
|
(102
|
)
|
(419
|
)
|
(614
|
)
|
|||||
|
Cash and Cash Equivalents, End of Year
|
$
|
1,413
|
|
$
|
1,515
|
|
$
|
1,934
|
|
||
Operating Activities
Net cash provided by operating activities in
2018
was
$1.377 billion
, including net income of
$644 million
. Net income included depreciation of
$590 million
, long-lived store asset impairment charges of $101 million, loss on divestiture of La Senza of
$99 million
, share-based compensation expense of
$97 million
and deferred income tax benefit of
$52 million
. Other changes in assets and liabilities represent items that had a current period cash flow impact, such as changes in working capital. The most significant item in working capital was a decrease in operating cash flow of $113 million associated with a decrease in income taxes payable.
Net cash provided by operating activities in 2017 was $1.406 billion, including net income of $983 million. Net income included depreciation of $571 million, deferred income tax benefit of $108 million, share-based compensation expense of $102 million, loss on extinguishment of debt of $45 million and gains on distributions from Easton investments of $20 million. Other changes in assets and liabilities represent items that had a current period cash flow impact, such as changes in working capital. The most significant item in working capital was a decrease in operating cash flow of $137 million associated with an increase in inventory.
Net cash provided by operating activities in 2016 was $1.990 billion, including net income of $1.158 billion. Net income included depreciation of $518 million, deferred income tax expense of $110 million, gains on distributions from Easton investments of $112 million, share-based compensation expense of $96 million and loss on extinguishment of debt of $36 million. Other changes in assets and liabilities represent items that had a current period cash flow impact, such as changes in working capital. The most significant item in working capital was an increase in operating cash flow of $117 million associated with an increase in income taxes payable.
Investing Activities
Net cash used for investing activities in
2018
was
$609 million
consisting primarily of
$629 million
of capital expenditures partially offset by a
$16 million
return of capital from Easton investments. The capital expenditures included $487 million for opening new stores and remodeling and improving existing stores. Remaining capital expenditures were primarily related to spending on technology and infrastructure to support growth.
Net cash used for investing activities in 2017 was $698 million consisting primarily of $707 million of capital expenditures and purchase of marketable securities of $10 million, partially offset by a $29 million return of capital from Easton investments. The capital expenditures included $601 million for opening new stores and remodeling and improving existing stores. Remaining capital expenditures were primarily related to spending on technology and infrastructure to support growth.
Net cash used for investing activities in 2016 was $833 million consisting primarily of $990 million of capital expenditures and $33 million related to the acquisition of our Victoria's Secret Beauty and Accessories franchise partner's operations and stores in Greater China (net of cash acquired), partially offset by a $119 million return of capital from Easton investments, proceeds from the sale of assets of $53 million and proceeds from the sale of marketable securities of $10 million. The capital expenditures included $772 million for opening new stores and remodeling and improving existing stores. Remaining capital expenditures were primarily related to spending on technology and infrastructure to support growth.
We anticipate spending approximately
$600 million
for capital expenditures in
2019
relating to remodeling and improving existing stores and opening new stores, as well as investments in technology and logistics for initiatives supporting our direct businesses and other retail capabilities.
44
Financing Activities
Net cash used for financing activities in
2018
was
$872 million
consisting primarily of quarterly dividend payments totaling
$2.40
per share, or
$666 million
, payments for repurchases of common stock of
$198 million
and payment of long-term debt related to our exchange of notes of
$52 million
, partially offset by $63 million of net new borrowings under our foreign facilities.
Net cash used for financing activities in 2017 was $1.127 billion consisting primarily of quarterly dividend payments totaling $2.40 per share, or $686 million, $540 million to redeem our 2019 Notes, repurchases of common stock of $446 million and tax payments related to share-based awards of $32 million. These were partially offset by the net proceeds of $495 million from the 2028 Notes issuance, $52 million of net new borrowings under our foreign facilities and proceeds from the exercise of stock options of $38 million.
Net cash used for financing activities in 2016 was $1.765 billion consisting primarily of quarterly and special dividend payments totaling $4.40 per share, or $1.268 billion, $742 million to redeem our 2017 Notes, repurchases of common stock of $435 million and tax payments related to share-based awards of $58 million. These were partially offset by the net proceeds of $692 million from the 2036 Notes issuance, $29 million of net new borrowings under our foreign facilities and proceeds from the exercise of stock options of $20 million.
Contingent Liabilities and Contractual Obligations
The following table provides our contractual obligations, aggregated by type, including the maturity profile as of
February 2, 2019
:
|
|
Payments Due by Period
|
||||||||||||||||||||||
|
|
Total
|
Less
Than 1
Year
|
1-3
Years
|
4-5
Years
|
More
than 5
Years
|
Other
|
|||||||||||||||||
|
|
(in millions)
|
||||||||||||||||||||||
|
Long-term Debt (a)
|
$
|
9,532
|
|
$
|
439
|
|
$
|
1,793
|
|
$
|
2,020
|
|
$
|
5,280
|
|
$
|
—
|
|
|||||
|
Operating Lease Obligations (b)
|
4,808
|
|
698
|
|
1,306
|
|
1,066
|
|
1,738
|
|
—
|
|
|||||||||||
|
Purchase Obligations (c)
|
1,165
|
|
1,110
|
|
48
|
|
5
|
|
2
|
|
—
|
|
|||||||||||
|
Other Liabilities (d)
|
462
|
|
92
|
|
14
|
|
5
|
|
31
|
|
320
|
|
|||||||||||
|
Total
|
$
|
15,967
|
|
$
|
2,339
|
|
$
|
3,161
|
|
$
|
3,096
|
|
$
|
7,051
|
|
$
|
320
|
|
|||||
________________
|
(a)
|
Long-term debt obligations relate to our principal and interest payments for outstanding notes and debentures. Interest payments have been estimated based on the coupon rate for fixed rate obligations. Interest obligations exclude amounts which have been accrued through
February 2, 2019
. For additional information, see Note
13
to the Consolidated Financial Statements included in Item
8
. Financial Statements and Supplementary Data.
|
|
(b)
|
Operating lease obligations primarily represent minimum payments due under store lease agreements. For additional information, see Note
17
to the Consolidated Financial Statements included in Item
8
. Financial Statements and Supplementary Data.
|
|
(c)
|
Purchase obligations primarily include purchase orders for merchandise inventory and other agreements to purchase goods or services that are enforceable and legally binding and that specify all significant terms, including: fixed or minimum quantities to be purchased; fixed, minimum or variable price provisions; and the approximate timing of the transactions.
|
|
(d)
|
Other liabilities primarily include future payments relating to our nonqualified supplemental retirement plan of
$278 million
which have been reflected under “Other” as the timing of these future payments is not known until an associate leaves the Company or otherwise requests an in-service distribution. Other liabilities also include future estimated payments associated with unrecognized tax benefits. The “Less Than 1 Year” category includes
$84 million
of these tax items because it is reasonably possible that the amounts could change in the next 12 months due to audit settlements or resolution of uncertainties. The remaining portion totaling $42 million is included in the “Other” category as it is not reasonably possible that the amounts could change in the next 12 months. In addition, we have a remaining liability of $31 million related to the deemed repatriation tax on our undistributed foreign earnings resulting from the Tax Cuts and Jobs Act. The tax liability will be paid over the next seven years. For additional information, see Note
12
to the Consolidated Financial Statements in Item
8
. Financial Statements and Supplementary Data.
|
In connection with the sale of La Senza, we have remaining guarantees of
$76 million
related to lease payments under the current terms of noncancelable leases expiring at various dates through 2028. These guarantees include minimum rent and additional payments covering taxes, common area costs and certain other expenses and relate to leases that commenced prior to
45
the disposition of the business. We recognized an initial liability of
$5 million
representing the estimated fair value of our obligation as guarantor in accordance with ASC 460,
Guarantees.
In connection with the disposition of a certain other business, we have remaining guarantees of
$6 million
related to lease payments under the current terms of noncancelable leases expiring at various dates through
2021
. These guarantees include minimum rent and additional payments covering taxes, common area costs and certain other expenses and relate to leases that commenced prior to the disposition of the business. In certain instances, our guarantee may remain in effect if the term of a lease is extended. We have not recorded a liability with respect to these guarantee obligations as of
February 2, 2019
or
February 3, 2018
as we concluded that payments under these guarantees were not probable.
In connection with noncancelable operating leases of certain assets, we provided residual value guarantees to the lessor if the leased assets cannot be sold for an amount in excess of a specified minimum value at the conclusion of the lease term. The leases expire at various dates through 2021, and the total amount of the guarantees is
$94 million
. We recorded a liability of
$11 million
and
$3 million
related to these guarantee obligations as of
February 2, 2019
and
February 3, 2018
, respectively, which are included in Other Long-term Liabilities on the Consolidated Balance Sheets.
Off Balance Sheet Arrangements
We have no off balance sheet arrangements as defined by Regulation 229.303 Item 303 (a) (4).
Recently Issued Accounting Pronouncements
Revenue from Contracts with Customers
In May 2014, the Financial Accounting Standards Board (“FASB”) issued ASC 606,
Revenue from Contracts with Customers
, which was further clarified and amended in 2015 and 2016. This guidance requires companies to recognize revenue in a manner that depicts the transfer of promised goods or services to customers in amounts that reflect the consideration to which a company expects to be entitled in exchange for those goods or services. The new standard also results in enhanced disclosures about the nature, amount, timing and uncertainty of revenue and cash flows arising from contracts with customers.
We adopted the standard in the first quarter of 2018 under the modified retrospective approach. Under the standard, income from the Victoria's Secret private label credit card arrangement, which was historically presented as a reduction to General, Administrative and Store Operating Expenses, is presented as revenue. Further, historical accounting related to loyalty points earned under the Victoria's Secret customer loyalty program changed as we now defer revenue associated with customer loyalty points until the points are redeemed using a relative stand-alone selling price method. The standard also changed accounting for sales returns which requires balance sheet presentation on a gross basis.
In the first quarter of 2018, we recorded a cumulative catch-up adjustment resulting in a reduction to opening retained earnings, net of tax, of
$28 million
. The cumulative adjustment primarily related to the deferral of revenue related to outstanding points, net of estimated forfeitures, under the Victoria's Secret customer loyalty program. In addition, Net Sales and General, Administrative and Store Operating Expenses both increased
$187 million
in the 2018 Consolidated Statement of Income. Further, gross presentation of our sales return reserve resulted in a
$5 million
increase in Other Current Assets and Accrued Expenses and Other on the
February 2, 2019
Consolidated Balance Sheet.
Fair Value of Financial Instruments
In January 2016, the FASB issued ASC 321,
Investments - Equity Securities
, which addresses certain aspects of the recognition, measurement, presentation and disclosure of financial instruments. The standard requires the recognition of changes in the fair value of marketable equity securities in net income as compared to historical treatment in accumulated other comprehensive income on the balance sheet. We adopted the standard in the first quarter of 2018 and recorded an increase to opening retained earnings, net of tax, of
$2 million
.
Leases
In February 2016, the FASB issued ASC 842,
Leases
, which is effective beginning in fiscal 2019 and requires companies classified as lessees to account for most leases on their balance sheets but recognize expenses on their income statements in a manner similar to today’s accounting. The standard also will result in enhanced quantitative and qualitative disclosures, including significant judgments made by management, to provide greater insight into the extent of revenue and expense recognized and expected to be recognized from existing leases. In July 2018, the FASB approved an amendment to the standard that provides companies a transition option that would not require earlier periods to be restated upon adoption.
46
We will adopt the standard in the first quarter of 2019 and apply the standard prospectively as of the adoption date. As allowed by the new standard, we elected the package of transition practical expedients but have elected to not apply the hindsight practical expedient to our leases at transition.
Substantially all of our leases, including our retail store locations, are subject to operating lease accounting under the new standard. We expect to recognize right-of-use assets of approximately
$3.3 billion
and related lease liabilities of approximately
$3.7 billion
on our Consolidated Balance Sheet upon adoption at the beginning of fiscal 2019. These balances will change as our lease portfolio changes due to execution of lease modifications or new leases. The right-of-use assets are based upon the lease liabilities adjusted for deferred rent liabilities and unamortized landlord construction allowances. We will continue to recognize rent expense in the Consolidated Statements of Income on a straight-line basis over the lease term.
Hedging Activities
In August 2017, the FASB issued Accounting Standards Update ("ASU") 2017-12,
Targeted Improvements to Accounting for Hedging Activities
, which is intended to better align risk management activities and financial reporting for hedging relationships. The standard eliminates the requirement to separately measure and report hedge ineffectiveness and generally requires the entire change in the fair value of a hedging instrument to be presented in the same income statement line as the hedged item. It also eases certain documentation and assessment requirements. We will adopt the standard in the first quarter of fiscal 2019. We do not expect this standard to have a material impact on our consolidated results of operations, financial position or cash flows.
Goodwill
In January 2017, the FASB issued ASU 2017-04,
Simplifying the Test for Goodwill Impairment
, which simplifies the subsequent measurement of goodwill. The standard eliminates the second step from the goodwill impairment test, which requires a hypothetical purchase price allocation to determine the implied fair value of goodwill. Under the new standard, the goodwill impairment charge will be the excess of the reporting unit's carrying value over its fair value, not to exceed the total amount of goodwill allocated to the reporting unit. This guidance will be effective beginning in fiscal 2020, with early adoption permitted. We do not expect this standard to have a material impact on our consolidated results of operations, financial position or cash flows.
Impact of Inflation
While it is difficult to accurately measure the impact of inflation due to the imprecise nature of the estimates required, we believe the effects of inflation, if any, on the results of operations and financial condition have been minor.
Critical Accounting Policies and Estimates
The preparation of financial statements in conformity with generally accepted accounting principles requires management to adopt accounting policies related to estimates and assumptions that affect the reported amounts of assets and liabilities at the date of the financial statements and the reported amounts of revenues and expenses during the reporting period, as well as the related disclosure of contingent assets and liabilities at the date of the financial statements. On an ongoing basis, management evaluates its accounting policies, estimates and judgments, including those related to inventories, long-lived assets, claims and contingencies, income taxes and revenue recognition. Management bases our estimates and judgments on historical experience and various other factors that are believed to be reasonable under the circumstances. Actual results may differ from these estimates. Management has discussed the development and selection of our critical accounting policies and estimates with the Audit Committee of our Board of Directors and believes the following assumptions and estimates are most significant to reporting our results of operations and financial position.
Inventories
Inventories are principally valued at the lower of cost or net realizable value, on a weighted-average cost basis.
We record valuation adjustments to our inventories if the cost of inventory on hand exceeds the amount we expect to realize from the ultimate sale or disposal of the inventory. These estimates are based on management’s judgment regarding future demand and market conditions and analysis of historical experience. If actual demand or market conditions are different than those projected by management, future period merchandise margin rates may be unfavorably or favorably affected by adjustments to these estimates.
We also record inventory loss adjustments for estimated physical inventory losses that have occurred since the date of the last physical inventory. These estimates are based on management’s analysis of historical results and operating trends.
Management believes that the assumptions used in these estimates are reasonable and appropriate. A 10% increase or decrease in the inventory valuation adjustment would have impacted net income by approximately
$5 million
for
2018
. A 10% increase
47
or decrease in the estimated physical inventory loss adjustment would have impacted net income by approximately
$5 million
for
2018
.
Valuation of Long-lived Assets
Property and equipment are reviewed for impairment whenever events or changes in circumstances indicate that the carrying amount of the asset may not be recoverable. Assets are grouped at the lowest level for which they are largely independent of other assets or asset groups. If the estimated undiscounted future cash flows related to the asset or asset group are less than the carrying value, we recognize a loss equal to the difference between the carrying value and the estimated fair value, usually determined by the estimated discounted future cash flows of the asset or asset group. When a decision has been made to dispose of property and equipment prior to the end of the previously estimated useful life, depreciation estimates are revised to reflect the use of the asset over the shortened estimated useful life.
Goodwill is reviewed for impairment each year in the fourth quarter and may be reviewed more frequently if certain events occur or circumstances change. We have the option to either first perform a qualitative assessment to determine whether it is more likely than not that each reporting unit's fair value is less than its carrying value (including goodwill), or to proceed directly to the quantitative assessment which requires a comparison of the fair value of each reporting unit's fair value to its carrying value (including goodwill). If we determine that the fair value of a reporting unit is less than its carrying value, we then estimate the fair value of all assets and liabilities of that reporting unit, including the implied fair value of goodwill, through either estimated discounted future cash flows or market-based methodologies. If the carrying value of goodwill exceeds the implied fair value, we recognize an impairment charge equal to the difference. Our reporting units are determined in accordance with the provisions of ASC 350,
Intangibles - Goodwill and Other
. Our reporting units that have goodwill are Victoria's Secret, Bath & Body Works and Greater China.
Intangible assets with indefinite lives are reviewed for impairment each year in the fourth quarter and may be reviewed more frequently if certain events occur or circumstances change. We have the option to either first perform a qualitative assessment to determine whether it is more likely than not that the indefinite-lived intangible asset is impaired, or to proceed directly to the quantitative assessment which requires a comparison of the fair value of the intangible asset to its carrying value. To determine if the fair value of the asset is less than its carrying amount, we will estimate the fair value, usually determined by the estimated discounted future cash flows of the asset, and compare that value with its carrying amount. If the carrying value of the intangible asset exceeds the fair value, we recognize an impairment charge equal to the difference.
We estimate the fair value of property and equipment, goodwill and intangible assets in accordance with the provisions of ASC 820,
Fair Value Measurement
. If future economic conditions are different than those projected by management, future impairment charges may be required.
Claims and Contingencies
We are subject to various claims and contingencies related to lawsuits, insurance, regulatory and other matters arising out of the normal course of business. Our determination of the treatment of claims and contingencies in the Consolidated Financial Statements is based on management’s view of the expected outcome of the applicable claim or contingency. We consult with legal counsel on matters related to litigation and seek input from both internal and external experts with respect to matters in the ordinary course of business. We accrue a liability if the likelihood of an adverse outcome is probable and the amount is reasonably estimable. If the likelihood of an adverse outcome is only reasonably possible (as opposed to probable) or if an estimate is not reasonably determinable, disclosure of a material claim or contingency is disclosed in the Notes to the Consolidated Financial Statements included in Item
8
. Financial Statements and Supplementary Data.
Income Taxes
We account for income taxes under the asset and liability method. Under this method, taxes currently payable or refundable are accrued, and deferred tax assets and liabilities are recognized for the estimated future tax consequences attributable to differences between the financial statement carrying amounts of existing assets and liabilities and their respective tax bases. Deferred tax assets are also recognized for realizable operating loss and tax credit carryforwards. Deferred tax assets and liabilities are measured using enacted income tax rates in effect for the year in which those temporary differences are expected to be recovered or settled. The effect on deferred tax assets and liabilities of a change in income tax rates is recognized in our Consolidated Statement of Income in the period that includes the enactment date. A valuation allowance is recorded to reduce the carrying amounts of deferred tax assets if it is more likely than not that such assets will not be realized.
Significant judgment is required in determining the provision for income taxes and related accruals, deferred tax assets and liabilities. In determining our provision for income taxes, we consider permanent differences between book and tax income and statutory income tax rates. Our effective income tax rate is affected by items including changes in tax law, the tax jurisdiction of new stores or business ventures and the level of earnings.
48
We follow the authoritative guidance included in ASC 740,
Income Taxes
, which contains a two-step approach to recognize and measure uncertain tax positions. The first step is to evaluate the tax position for recognition by determining if the available evidence indicates it is more likely than not that the position will be sustained on audit, including resolution of related appeals or litigation processes, if any. The second step is to measure the tax benefit as the largest amount which is more than 50% likely of being realized upon ultimate settlement. We consider many factors when evaluating and estimating our tax positions and tax benefits, which may require periodic adjustments and for which actual outcomes may differ from forecasted outcomes. Our policy is to include interest and penalties related to uncertain tax positions in income tax expense.
Our income tax returns, like those of most companies, are periodically audited by domestic and foreign tax authorities. These audits include questions regarding our tax filing positions, including the timing and amount of deductions and the allocation of income among various tax jurisdictions. At any one time, multiple tax years are subject to audit by the various tax authorities. A number of years may elapse before a particular matter for which we have established an accrual is audited and fully resolved or clarified. We adjust our tax contingencies accrual and income tax provision in the period in which matters are effectively settled with tax authorities at amounts different from our established accrual, when the statute of limitations expires for the relevant taxing authority to examine the tax position or when more information becomes available.
Revenue Recognition
In the first quarter of 2018, we adopted ASC 606,
Revenue from Contracts with Customers
, using the modified retrospective approach.
We recognize revenue based on the amount we expect to receive when control of the goods or services is transferred to our customer. We recognize sales upon customer receipt of merchandise, which for direct channel revenues reflect an estimate of shipments that have not yet been received by our customer based on shipping terms and historical delivery times. Our shipping and handling revenues are included in Net Sales with the related costs included in Costs of Goods Sold, Buying and Occupancy in our Consolidated Statements of Income. We also provide a reserve for projected merchandise returns based on historical experience. Net Sales exclude sales and other similar taxes collected from customers.
We offer certain loyalty programs that allow customers to earn points based on purchasing activity. As customers accumulate points and reach point thresholds, they can use the points to purchase merchandise in stores or online. We allocate revenue to points earned on qualifying purchases and defer recognition until the points are redeemed. The amount of revenue deferred is based on the relative stand-alone selling price method, which includes an estimate for points not expected to be redeemed based on historical experience.
We sell gift cards with no expiration dates to customers. We do not charge administrative fees on unused gift cards. We recognize revenue from gift cards when they are redeemed by the customer. In addition, we recognize revenue on unredeemed gift cards where the likelihood of the gift card being redeemed is remote and there is no legal obligation to remit the unredeemed gift cards to relevant jurisdictions (gift card breakage). Gift card breakage revenue is recognized in proportion, and over the same period, as actual gift card redemptions. We determine the gift card breakage rate based on historical redemption patterns. Gift card breakage is included in Net Sales in our Consolidated Statements of Income.
Revenue earned in connection with Victoria’s Secret's private label credit card arrangement is recognized over the term of the license arrangement and is included in Net Sales in our 2018 Consolidated Statement of Income.
We also recognize revenues associated with franchise, license, wholesale and sourcing arrangements. Revenue recognized under franchise and license arrangements generally consists of royalties earned and recognized upon sale of merchandise by franchise and license partners to retail customers. Revenue is generally recognized under wholesale and sourcing arrangements at the time the title passes to the partner.
ITEM 7A. QUANTITATIVE AND QUALITATIVE DISCLOSURES ABOUT MARKET RISK.
Market Risk
The market risk inherent in our financial instruments represents the potential loss in fair value, earnings or cash flows arising from adverse changes in foreign currency exchange rates or interest rates. We may use derivative financial instruments like foreign currency forward contracts, cross-currency swaps and interest rate swap arrangements to manage exposure to market risks. We do not use derivative financial instruments for trading purposes.
Foreign Exchange Rate Risk
We have operations in foreign countries which expose us to market risk associated with foreign currency exchange rate fluctuations. Our Canadian dollar, British pound, Chinese Yuan, Hong Kong dollar and Euro denominated earnings are subject to exchange rate risk as substantially all our merchandise sold in Canada, the U.K., Ireland and Greater China is sourced
49
through U.S. dollar transactions. Although we utilize foreign currency forward contracts to partially offset risks associated with Canadian dollar and British pound denominated earnings, these measures may not succeed in offsetting all the short-term impact of foreign currency rate movements and generally may not be effective in offsetting the long-term impact of sustained shifts in foreign currency rates.
Further, although our royalty arrangements with our international partners are denominated in U.S. dollars, the royalties we receive in U.S. dollars are calculated based on sales in the local currency. As a result, our royalties in these arrangements are exposed to foreign currency exchange rate fluctuations.
Interest Rate Risk
Our investment portfolio primarily consists of interest-bearing instruments that are classified as cash and cash equivalents based on their original maturities. Our investment portfolio is maintained in accordance with our investment policy, which specifies permitted types of investments, specifies credit quality standards and maturity profiles and limits credit exposure to any single issuer. The primary objective of our investment activities is the preservation of principal, the maintenance of liquidity and the maximization of interest income while minimizing risk. Typically, our investment portfolio is primarily comprised of U.S. government obligations, U.S. Treasury and AAA-rated money market funds, commercial paper and bank deposits. Given the short-term nature and quality of investments in our portfolio, we do not believe there is any material risk to principal associated with increases or decreases in interest rates.
Excluding our Foreign Facilities, all of our long-term debt as of
February 2, 2019
has fixed interest rates. We will from time to time adjust our exposure to interest rate risk by entering into interest rate swap arrangements. Our exposure to interest rate changes is limited to the fair value of the debt issued, which would not have a material impact on our earnings or cash flows.
Fair Value of Financial Instruments
The following table provides a summary of the principal value and estimated fair value of outstanding publicly traded debt as of
February 2, 2019
and
February 3, 2018
:
|
February 2, 2019
|
February 3, 2018
|
||||||
|
|
(in millions)
|
||||||
|
Long-term Debt:
|
|||||||
|
Principal Value
|
$
|
5,722
|
|
$
|
5,750
|
|
|
|
Fair Value, Estimated (a)
|
5,340
|
|
5,943
|
|
|||
|
Foreign Currency Cash Flow Hedges (b)
|
(2
|
)
|
9
|
|
|||
________________
|
(a)
|
The estimated fair value is based on reported transaction prices. The estimates presented are not necessarily indicative of the amounts that we could realize in a current market exchange.
|
|
(b)
|
Hedge arrangements are in a net liability (asset) position.
|
As of
February 2, 2019
, we believe that the carrying values of accounts receivable, accounts payable, accrued expenses and current debt approximate fair value because of their short maturity.
Concentration of Credit Risk
We maintain cash and cash equivalents and derivative contracts with various major financial institutions. We monitor the relative credit standing of financial institutions with whom we transact and limit the amount of credit exposure with any one entity. Typically, our investment portfolio is primarily comprised of U.S. government obligations, U.S. Treasury and AAA-rated money market funds, commercial paper and bank deposits. We also periodically review the relative credit standing of franchise, license and wholesale partners and other entities to which we grant credit terms in the normal course of business.
50
ITEM 8. FINANCIAL STATEMENTS AND SUPPLEMENTARY DATA.
L BRANDS, INC.
INDEX TO CONSOLIDATED FINANCIAL STATEMENTS
|
|
Page No.
|
Our fiscal year ends on the Saturday nearest to January 31. Fiscal years are designated in the Consolidated Financial Statements and Notes by the calendar year in which the fiscal year commences. The results for
2018
and
2016
refer to the 52-week periods ended
February 2, 2019
and
January 28, 2017
, respectively. The results for
2017
refer to the 53-week period ended
February 3, 2018
.
51
Management’s Report on Internal Control Over Financial Reporting
Management is responsible for establishing and maintaining adequate internal control over financial reporting as defined in Rules 13a-15(f) and 15d-15(f) under the Securities Exchange Act of 1934. The Company’s internal control system is designed to provide reasonable assurance to the Company’s management and Board of Directors regarding the preparation and fair presentation of published financial statements. Because of its inherent limitations, internal control over financial reporting may not prevent or detect misstatements. Therefore, even those systems determined to be effective can provide only reasonable assurance with respect to financial statement preparation and presentation. Also, projections of any evaluation of effectiveness to future periods are subject to the risk that controls may become inadequate because of changes in conditions, or that the degree of compliance with the policies or procedures may deteriorate.
Management assessed the effectiveness of the Company’s internal control over financial reporting as of
February 2, 2019
. In making this assessment, management used the criteria established in Internal Control-Integrated Framework issued by the Committee of Sponsoring Organizations of the Treadway Commission (2013 framework) (the COSO criteria).
Based on our assessment and the COSO criteria, management believes that the Company maintained effective internal control over financial reporting as of
February 2, 2019
.
The Company’s independent registered public accounting firm, Ernst & Young LLP, has issued an attestation report on the Company’s internal control over financial reporting. Ernst & Young LLP’s report appears on the following page and expresses an unqualified opinion on the effectiveness of the Company’s internal control over financial reporting as of
February 2, 2019
.
52
Report of Independent Registered Public Accounting Firm
To the Board of Directors and Shareholders of L Brands, Inc.
Opinion on Internal Control over Financial Reporting
We have audited L Brands, Inc.’s internal control over financial reporting as of February 2, 2019, based on criteria established in Internal Control-Integrated Framework issued by the Committee of Sponsoring Organizations of the Treadway Commission (2013 framework) (the COSO criteria). In our opinion, L Brands, Inc. (the Company) maintained, in all material respects, effective internal control over financial reporting as of February 2, 2019, based on the COSO criteria.
We also have audited, in accordance with the standards of the Public Company Accounting Oversight Board (United States) (PCAOB), the Consolidated Balance Sheets of L Brands, Inc. as of February 2, 2019 and February 3, 2018 and the related Consolidated Statements of Income, Comprehensive Income, Total Equity (Deficit), and Cash Flows for each of the three years in the period ended February 2, 2019, and the related notes and our report dated March 22, 2019 expressed an unqualified opinion thereon.
Basis for Opinion
The Company’s management is responsible for maintaining effective internal control over financial reporting and for its assessment of the effectiveness of internal control over financial reporting included in the accompanying Management’s Report on Internal Control Over Financial Reporting. Our responsibility is to express an opinion on the Company’s internal control over financial reporting based on our audit. We are a public accounting firm registered with the PCAOB and are required to be independent with respect to the Company in accordance with the U.S. federal securities laws and the applicable rules and regulations of the Securities and Exchange Commission and the PCAOB.
We conducted our audit in accordance with the standards of the PCAOB. Those standards require that we plan and perform the audit to obtain reasonable assurance about whether effective internal control over financial reporting was maintained in all material respects.
Our audit included obtaining an understanding of internal control over financial reporting, assessing the risk that a material weakness exists, testing and evaluating the design and operating effectiveness of internal control based on the assessed risk, and performing such other procedures as we considered necessary in the circumstances. We believe that our audit provides a reasonable basis for our opinion.
Definition and Limitations of Internal Control Over Financial Reporting
A company’s internal control over financial reporting is a process designed to provide reasonable assurance regarding the reliability of financial reporting and the preparation of financial statements for external purposes in accordance with generally accepted accounting principles. A company’s internal control over financial reporting includes those policies and procedures that (1) pertain to the maintenance of records that, in reasonable detail, accurately and fairly reflect the transactions and dispositions of the assets of the company; (2) provide reasonable assurance that transactions are recorded as necessary to permit preparation of financial statements in accordance with generally accepted accounting principles, and that receipts and expenditures of the company are being made only in accordance with authorizations of management and directors of the company; and (3) provide reasonable assurance regarding prevention or timely detection of unauthorized acquisition, use, or disposition of the company’s assets that could have a material effect on the financial statements.
Because of its inherent limitations, internal control over financial reporting may not prevent or detect misstatements. Also, projections of any evaluation of effectiveness to future periods are subject to the risk that controls may become inadequate because of changes in conditions, or that the degree of compliance with the policies or procedures may deteriorate.
/s/ Ernst & Young LLP
Grandview Heights, Ohio
March 22, 2019
53
Report of Independent Registered Public Accounting Firm
To the Board of Directors and Shareholders of L Brands, Inc.
Opinion on the Financial Statements
We have audited the accompanying Consolidated Balance Sheets of L Brands, Inc. (the Company) as of February 2, 2019 and February 3, 2018, the related Consolidated Statements of Income, Comprehensive Income, Total Equity (Deficit), and Cash Flows for each of the three years in the period ended February 2, 2019, and the related notes (collectively referred to as the “consolidated financial statements”). In our opinion, the consolidated financial statements present fairly, in all material respects, the financial position of the Company at February 2, 2019 and February 3, 2018, and the results of its operations and its cash flows for each of the three years in the period ended February 2, 2019, in conformity with U.S. generally accepted accounting principles.
We also have audited, in accordance with the standards of the Public Company Accounting Oversight Board (United States) (PCAOB), the Company’s internal control over financial reporting as of February 2, 2019, based on criteria established in Internal Control-Integrated Framework issued by the Committee of Sponsoring Organizations of the Treadway Commission (2013 framework), and our report dated March 22, 2019 expressed an unqualified opinion thereon.
Basis for Opinion
These financial statements are the responsibility of the Company’s management. Our responsibility is to express an opinion on the Company’s financial statements based on our audits. We are a public accounting firm registered with the PCAOB and are required to be independent with respect to the Company in accordance with the U.S. federal securities laws and the applicable rules and regulations of the Securities and Exchange Commission and the PCAOB.
We conducted our audits in accordance with the standards of the PCAOB. Those standards require that we plan and perform the audit to obtain reasonable assurance about whether the financial statements are free of material misstatement, whether due to error or fraud. Our audits included performing procedures to assess the risks of material misstatement of the financial statements, whether due to error or fraud, and performing procedures that respond to those risks. Such procedures included examining, on a test basis, evidence regarding the amounts and disclosures in the financial statements. Our audits also included evaluating the accounting principles used and significant estimates made by management, as well as evaluating the overall presentation of the financial statements. We believe that our audits provide a reasonable basis for our opinion.
/s/ Ernst & Young LLP
We have served as the Company’s auditor since 2003.
Grandview Heights, Ohio
March 22, 2019
54
L BRANDS, INC.
CONSOLIDATED STATEMENTS OF INCOME
(in millions except per share amounts)
|
2018
|
|
2017
|
|
2016
|
|||||||
|
Net Sales
|
$
|
13,237
|
|
$
|
12,632
|
|
$
|
12,574
|
|
||
|
Costs of Goods Sold, Buying and Occupancy
|
(8,338
|
)
|
(7,673
|
)
|
(7,449
|
)
|
|||||
|
Gross Profit
|
4,899
|
|
4,959
|
|
5,125
|
|
|||||
|
General, Administrative and Store Operating Expenses
|
(3,563
|
)
|
(3,231
|
)
|
(3,122
|
)
|
|||||
|
Loss on Divestiture of La Senza
|
(99
|
)
|
—
|
|
—
|
|
|||||
|
Operating Income
|
1,237
|
|
1,728
|
|
2,003
|
|
|||||
|
Interest Expense
|
(385
|
)
|
(406
|
)
|
(394
|
)
|
|||||
|
Other Income (Loss)
|
5
|
|
(10
|
)
|
87
|
|
|||||
|
Income Before Income Taxes
|
857
|
|
1,312
|
|
1,696
|
|
|||||
|
Provision for Income Taxes
|
213
|
|
329
|
|
538
|
|
|||||
|
Net Income
|
$
|
644
|
|
$
|
983
|
|
$
|
1,158
|
|
||
|
Net Income Per Basic Share
|
$
|
2.33
|
|
$
|
3.46
|
|
$
|
4.04
|
|
||
|
Net Income Per Diluted Share
|
$
|
2.31
|
|
$
|
3.42
|
|
$
|
3.98
|
|
||
L BRANDS, INC.
CONSOLIDATED STATEMENTS OF COMPREHENSIVE INCOME
(in millions)
|
2018
|
2017
|
2016
|
|||||||||
|
Net Income
|
$
|
644
|
|
$
|
983
|
|
$
|
1,158
|
|
||
|
Other Comprehensive Income (Loss), Net of Tax:
|
|||||||||||
|
Foreign Currency Translation
|
(20
|
)
|
23
|
|
(19
|
)
|
|||||
|
Reclassification of Foreign Currency Translation to Earnings
|
45
|
|
—
|
|
—
|
|
|||||
|
Unrealized Gain (Loss) on Cash Flow Hedges
|
10
|
|
(20
|
)
|
(8
|
)
|
|||||
|
Reclassification of Cash Flow Hedges to Earnings
|
2
|
|
7
|
|
7
|
|
|||||
|
Unrealized Gain (Loss) on Marketable Securities
|
—
|
|
2
|
|
(5
|
)
|
|||||
|
Reclassification of Gain on Marketable Securities to Earnings
|
—
|
|
—
|
|
(3
|
)
|
|||||
|
Total Other Comprehensive Income (Loss), Net of Tax
|
37
|
|
12
|
|
(28
|
)
|
|||||
|
Total Comprehensive Income
|
$
|
681
|
|
$
|
995
|
|
$
|
1,130
|
|
||
The accompanying Notes are an integral part of these Consolidated Financial Statements.
55
L BRANDS, INC.
CONSOLIDATED BALANCE SHEETS
(in millions except par value amounts)
|
February 2,
2019 |
February 3,
2018 |
||||||
|
ASSETS
|
|||||||
|
Current Assets:
|
|||||||
|
Cash and Cash Equivalents
|
$
|
1,413
|
|
$
|
1,515
|
|
|
|
Accounts Receivable, Net
|
367
|
|
310
|
|
|||
|
Inventories
|
1,248
|
|
1,240
|
|
|||
|
Other
|
232
|
|
228
|
|
|||
|
Total Current Assets
|
3,260
|
|
3,293
|
|
|||
|
Property and Equipment, Net
|
2,818
|
|
2,893
|
|
|||
|
Goodwill
|
1,348
|
|
1,348
|
|
|||
|
Trade Names
|
411
|
|
411
|
|
|||
|
Deferred Income Taxes
|
62
|
|
14
|
|
|||
|
Other Assets
|
191
|
|
190
|
|
|||
|
Total Assets
|
$
|
8,090
|
|
$
|
8,149
|
|
|
|
LIABILITIES AND EQUITY (DEFICIT)
|
|||||||
|
Current Liabilities:
|
|||||||
|
Accounts Payable
|
$
|
711
|
|
$
|
717
|
|
|
|
Accrued Expenses and Other
|
1,082
|
|
1,029
|
|
|||
|
Current Debt
|
72
|
|
87
|
|
|||
|
Income Taxes
|
121
|
|
198
|
|
|||
|
Total Current Liabilities
|
1,986
|
|
2,031
|
|
|||
|
Deferred Income Taxes
|
226
|
|
238
|
|
|||
|
Long-term Debt
|
5,739
|
|
5,707
|
|
|||
|
Other Long-term Liabilities
|
1,004
|
|
924
|
|
|||
|
Shareholders’ Equity (Deficit):
|
|||||||
|
Preferred Stock—$1.00 par value; 10 shares authorized; none issued
|
—
|
|
—
|
|
|||
|
Common Stock—$0.50 par value; 1,000 shares authorized; 283 and 283 shares issued; 275 and 280 shares outstanding, respectively
|
141
|
|
141
|
|
|||
|
Paid-in Capital
|
771
|
|
678
|
|
|||
|
Accumulated Other Comprehensive Income
|
59
|
|
24
|
|
|||
|
Retained Earnings (Deficit)
|
(1,482
|
)
|
(1,434
|
)
|
|||
|
Less: Treasury Stock, at Average Cost; 8 and 3 shares, respectively
|
(358
|
)
|
(162
|
)
|
|||
|
Total L Brands, Inc. Shareholders’ Equity (Deficit)
|
(869
|
)
|
(753
|
)
|
|||
|
Noncontrolling Interest
|
4
|
|
2
|
|
|||
|
Total Equity (Deficit)
|
(865
|
)
|
(751
|
)
|
|||
|
Total Liabilities and Equity (Deficit)
|
$
|
8,090
|
|
$
|
8,149
|
|
|
The accompanying Notes are an integral part of these Consolidated Financial Statements.
56
L BRANDS, INC.
CONSOLIDATED STATEMENTS OF TOTAL EQUITY (DEFICIT)
(in millions except per share amounts)
|
|
Common Stock
|
Paid-In
Capital
|
Accumulated
Other
Comprehensive
Income
|
Retained
Earnings (Accumulated Deficit)
|
Treasury
Stock, at
Average
Cost
|
Noncontrolling Interest
|
Total Equity (Deficit)
|
|||||||||||||||||||||||
|
Shares
Outstanding
|
Par
Value
|
|||||||||||||||||||||||||||||
|
Balance, January 30, 2016
|
290
|
|
$
|
156
|
|
$
|
545
|
|
$
|
40
|
|
$
|
315
|
|
$
|
(1,315
|
)
|
$
|
1
|
|
$
|
(258
|
)
|
|||||||
|
Net Income
|
—
|
|
—
|
|
—
|
|
—
|
|
1,158
|
|
—
|
|
—
|
|
1,158
|
|
||||||||||||||
|
Other Comprehensive Income (Loss)
|
—
|
|
—
|
|
—
|
|
(28
|
)
|
—
|
|
—
|
|
—
|
|
(28
|
)
|
||||||||||||||
|
Total Comprehensive Income
|
—
|
|
—
|
|
—
|
|
(28
|
)
|
1,158
|
|
—
|
|
—
|
|
1,130
|
|
||||||||||||||
|
Cash Dividends ($4.40 per share)
|
—
|
|
—
|
|
—
|
|
—
|
|
(1,268
|
)
|
—
|
|
—
|
|
(1,268
|
)
|
||||||||||||||
|
Repurchase of Common Stock
|
(6
|
)
|
—
|
|
—
|
|
—
|
|
—
|
|
(438
|
)
|
—
|
|
(438
|
)
|
||||||||||||||
|
Share-based Compensation and Other
|
2
|
|
1
|
|
105
|
|
—
|
|
—
|
|
—
|
|
1
|
|
107
|
|
||||||||||||||
|
Balance, January 28, 2017
|
286
|
|
$
|
157
|
|
$
|
650
|
|
$
|
12
|
|
$
|
205
|
|
$
|
(1,753
|
)
|
$
|
2
|
|
$
|
(727
|
)
|
|||||||
|
Net Income
|
—
|
|
—
|
|
—
|
|
—
|
|
983
|
|
—
|
|
—
|
|
983
|
|
||||||||||||||
|
Other Comprehensive Income (Loss)
|
—
|
|
—
|
|
—
|
|
12
|
|
—
|
|
—
|
|
—
|
|
12
|
|
||||||||||||||
|
Total Comprehensive Income
|
—
|
|
—
|
|
—
|
|
12
|
|
983
|
|
—
|
|
—
|
|
995
|
|
||||||||||||||
|
Cash Dividends ($2.40 per share)
|
—
|
|
—
|
|
—
|
|
—
|
|
(686
|
)
|
—
|
|
—
|
|
(686
|
)
|
||||||||||||||
|
Repurchase of Common Stock
|
(9
|
)
|
—
|
|
—
|
|
—
|
|
—
|
|
(445
|
)
|
—
|
|
(445
|
)
|
||||||||||||||
|
Treasury Share Retirement
|
—
|
|
(18
|
)
|
(82
|
)
|
—
|
|
(1,936
|
)
|
2,036
|
|
—
|
|
—
|
|
||||||||||||||
|
Share-based Compensation and Other
|
3
|
|
2
|
|
110
|
|
—
|
|
—
|
|
—
|
|
—
|
|
112
|
|
||||||||||||||
|
Balance, February 3, 2018
|
280
|
|
$
|
141
|
|
$
|
678
|
|
$
|
24
|
|
$
|
(1,434
|
)
|
$
|
(162
|
)
|
$
|
2
|
|
$
|
(751
|
)
|
|||||||
|
Cumulative Effect of Accounting Changes
|
—
|
|
—
|
|
—
|
|
(2
|
)
|
(26
|
)
|
—
|
|
—
|
|
(28
|
)
|
||||||||||||||
|
Balance, February 4, 2018
|
280
|
|
141
|
|
678
|
|
22
|
|
(1,460
|
)
|
(162
|
)
|
2
|
|
(779
|
)
|
||||||||||||||
|
Net Income
|
—
|
|
—
|
|
—
|
|
—
|
|
644
|
|
—
|
|
—
|
|
644
|
|
||||||||||||||
|
Other Comprehensive Income (Loss)
|
—
|
|
—
|
|
—
|
|
37
|
|
—
|
|
—
|
|
—
|
|
37
|
|
||||||||||||||
|
Total Comprehensive Income
|
—
|
|
—
|
|
—
|
|
37
|
|
644
|
|
—
|
|
—
|
|
681
|
|
||||||||||||||
|
Cash Dividends ($2.40 per share)
|
—
|
|
—
|
|
—
|
|
—
|
|
(666
|
)
|
—
|
|
—
|
|
(666
|
)
|
||||||||||||||
|
Repurchase of Common Stock
|
(5
|
)
|
—
|
|
—
|
|
—
|
|
—
|
|
(196
|
)
|
—
|
|
(196
|
)
|
||||||||||||||
|
Share-based Compensation and Other
|
—
|
|
—
|
|
93
|
|
—
|
|
—
|
|
—
|
|
2
|
|
95
|
|
||||||||||||||
|
Balance, February 2, 2019
|
275
|
|
$
|
141
|
|
$
|
771
|
|
$
|
59
|
|
$
|
(1,482
|
)
|
$
|
(358
|
)
|
$
|
4
|
|
$
|
(865
|
)
|
|||||||
The accompanying Notes are an integral part of these Consolidated Financial Statements.
57
L BRANDS, INC.
CONSOLIDATED STATEMENTS OF CASH FLOWS
(in millions)
|
2018
|
2017
|
2016
|
|||||||||
|
Operating Activities
|
|||||||||||
|
Net Income
|
$
|
644
|
|
$
|
983
|
|
$
|
1,158
|
|
||
|
Adjustments to Reconcile Net Income to Net Cash Provided by (Used for) Operating Activities:
|
|||||||||||
|
Depreciation of Long-lived Assets
|
590
|
|
571
|
|
518
|
|
|||||
|
Amortization of Landlord Allowances
|
(43
|
)
|
(47
|
)
|
(46
|
)
|
|||||
|
Long-lived Store Asset Impairment Charges
|
101
|
|
—
|
|
—
|
|
|||||
|
Loss on Divestiture of La Senza
|
99
|
|
—
|
|
—
|
|
|||||
|
Deferred Income Taxes
|
(52
|
)
|
(108
|
)
|
110
|
|
|||||
|
Share-based Compensation Expense
|
97
|
|
102
|
|
96
|
|
|||||
|
Gains on Distributions from Easton Investments
|
(8
|
)
|
(20
|
)
|
(112
|
)
|
|||||
|
Unrealized Losses on Marketable Equity Securities
|
6
|
|
—
|
|
—
|
|
|||||
|
Loss on Extinguishment of Debt
|
—
|
|
45
|
|
36
|
|
|||||
|
Gain on Sale of Marketable Equity Securities
|
—
|
|
—
|
|
(4
|
)
|
|||||
|
Changes in Assets and Liabilities, Net of Assets and Liabilities related to Divestiture and Acquisition:
|
|||||||||||
|
Accounts Receivable
|
(63
|
)
|
(13
|
)
|
(44
|
)
|
|||||
|
Inventories
|
(40
|
)
|
(137
|
)
|
30
|
|
|||||
|
Accounts Payable, Accrued Expenses and Other
|
29
|
|
50
|
|
31
|
|
|||||
|
Income Taxes Payable
|
(113
|
)
|
(40
|
)
|
117
|
|
|||||
|
Other Assets and Liabilities
|
130
|
|
20
|
|
100
|
|
|||||
|
Net Cash Provided by Operating Activities
|
1,377
|
|
1,406
|
|
1,990
|
|
|||||
|
Investing Activities
|
|||||||||||
|
Capital Expenditures
|
(629
|
)
|
(707
|
)
|
(990
|
)
|
|||||
|
Return of Capital from Easton Investments
|
16
|
|
29
|
|
119
|
|
|||||
|
Purchase of Marketable Securities
|
—
|
|
(10
|
)
|
—
|
|
|||||
|
Proceeds from Sale of Assets
|
—
|
|
—
|
|
53
|
|
|||||
|
Proceeds from Sale of Marketable Equity Securities
|
—
|
|
—
|
|
10
|
|
|||||
|
Acquisition, Net of Cash Acquired of $1
|
—
|
|
—
|
|
(33
|
)
|
|||||
|
Other Investing Activities
|
4
|
|
(10
|
)
|
8
|
|
|||||
|
Net Cash Used for Investing Activities
|
(609
|
)
|
(698
|
)
|
(833
|
)
|
|||||
|
Financing Activities
|
|||||||||||
|
Proceeds from Issuance of Long-term Debt, Net of Issuance Costs
|
—
|
|
495
|
|
692
|
|
|||||
|
Payment of Long-term Debt
|
(52
|
)
|
(540
|
)
|
(742
|
)
|
|||||
|
Borrowings from Secured Revolving Facility
|
92
|
|
—
|
|
—
|
|
|||||
|
Repayments of Secured Revolving Facility
|
(92
|
)
|
—
|
|
—
|
|
|||||
|
Borrowings from Foreign Facilities
|
172
|
|
96
|
|
35
|
|
|||||
|
Repayments of Foreign Facilities
|
(109
|
)
|
(44
|
)
|
(6
|
)
|
|||||
|
Dividends Paid
|
(666
|
)
|
(686
|
)
|
(1,268
|
)
|
|||||
|
Repurchases of Common Stock
|
(198
|
)
|
(446
|
)
|
(435
|
)
|
|||||
|
Tax Payments related to Share-based Awards
|
(13
|
)
|
(32
|
)
|
(58
|
)
|
|||||
|
Proceeds from Exercise of Stock Options
|
1
|
|
38
|
|
20
|
|
|||||
|
Financing Costs and Other
|
(7
|
)
|
(8
|
)
|
(3
|
)
|
|||||
|
Net Cash Used for Financing Activities
|
(872
|
)
|
(1,127
|
)
|
(1,765
|
)
|
|||||
|
Effects of Exchange Rate Changes on Cash
|
2
|
|
—
|
|
(6
|
)
|
|||||
|
Net Decrease in Cash and Cash Equivalents
|
(102
|
)
|
(419
|
)
|
|
(614
|
)
|
||||
|
Cash and Cash Equivalents, Beginning of Year
|
1,515
|
|
1,934
|
|
2,548
|
|
|||||
|
Cash and Cash Equivalents, End of Year
|
$
|
1,413
|
|
$
|
1,515
|
|
$
|
1,934
|
|
||
The accompanying Notes are an integral part of these Consolidated Financial Statements.
58
L BRANDS, INC.
NOTES TO CONSOLIDATED FINANCIAL STATEMENTS
1. Description of Business and Summary of Significant Accounting Policies
Description of Business
L Brands, Inc. (“the Company”) operates in the highly competitive specialty retail business. The Company is a specialty retailer of women’s intimate and other apparel, personal care, beauty and home fragrance products. The Company sells its merchandise through company-owned specialty retail stores in the U.S., Canada, U.K., Ireland and Greater China, and through its websites and other channels. The Company's other international operations are primarily through franchise, license and wholesale partners. The Company currently operates the following retail brands:
|
•
|
Victoria’s Secret
|
|
•
|
PINK
|
|
•
|
Bath & Body Works
|
Fiscal Year
The Company's fiscal year ends on the Saturday nearest to January 31. As used herein, “
2018
” and "
2016
" refer to the 52-week periods ended
February 2, 2019
and
January 28, 2017
, respectively. “
2017
” refers to the 53-week period ended
February 3, 2018
.
Basis of Consolidation
The Consolidated Financial Statements include the accounts of the Company and its subsidiaries. All significant intercompany balances and transactions have been eliminated in consolidation.
The Company accounts for investments in unconsolidated entities where it exercises significant influence, but does not have control, using the equity method. Under the equity method of accounting, the Company recognizes its share of the investee's net income or loss. Losses are only recognized to the extent the Company has positive carrying value related to the investee. Carrying values are only reduced below
zero
if the Company has an obligation to provide funding to the investee. The Company’s share of net income or loss of unconsolidated entities from which the Company purchases merchandise or merchandise components is included in Costs of Goods Sold, Buying and Occupancy in the Consolidated Statements of Income. The Company’s share of net income or loss of all other unconsolidated entities is included in Other Income (Loss) in the Consolidated Statements of Income. The Company’s equity method investments are required to be reviewed for impairment when it is determined there may be an other than temporary loss in value.
La Senza
On January 6, 2019, the Company completed the sale of the La Senza business. For additional information, see Note
6
, "Restructuring Activities."
Cash and Cash Equivalents
Cash and Cash Equivalents include cash on hand, demand deposits with financial institutions and highly liquid investments with original maturities of less than
90
days. The Company’s outstanding checks, which totaled
$13 million
as of
February 2, 2019
and
$14 million
as of
February 3, 2018
, are included in Accounts Payable on the Consolidated Balance Sheets.
Concentration of Credit Risk
The Company maintains cash and cash equivalents and derivative contracts with various major financial institutions. The Company monitors the relative credit standing of financial institutions with whom the Company transacts and limits the amount of credit exposure with any one entity. Typically, the Company’s investment portfolio is primarily comprised of U.S. government obligations, U.S. Treasury and AAA-rated money market funds, commercial paper and bank deposits.
The Company also periodically reviews the relative credit standing of franchise, license and wholesale partners and other entities to which the Company grants credit terms in the normal course of business. The Company records an allowance for uncollectable accounts when it becomes probable that the counterparty will be unable to pay.
Marketable Equity Securities
These investments are recorded at fair value in other current assets on the Consolidated Balance Sheets. Beginning in 2018, the Company recognizes unrealized holding gains and losses in Other Income (Loss) in the Consolidated Statements of Income.
59
Prior to 2018, unrealized holding gains and losses were recorded, net of tax, as a component of accumulated other comprehensive income.
Inventories
Inventories are principally valued at the lower of cost or net realizable value, on a weighted-average cost basis.
The Company records valuation adjustments to its inventories if the cost of inventory on hand exceeds the amount it expects to realize from the ultimate sale or disposal of the inventory. These estimates are based on management’s judgment regarding future demand and market conditions and analysis of historical experience.
The Company also records inventory loss adjustments for estimated physical inventory losses that have occurred since the date of the last physical inventory. These estimates are based on management’s analysis of historical results and operating trends.
Advertising Costs
Advertising and marketing costs are expensed at the time the promotion first appears in media, in the store or when the advertising is mailed. Advertising and marketing costs totaled
$476 million
for
2018
,
$383 million
for
2017
and
$325 million
for
2016
.
Property and Equipment
The Company’s property and equipment are recorded at cost and depreciation is computed on a straight-line basis using the following depreciable life ranges:
|
Category of Property and Equipment
|
Depreciable Life Range
|
|
|
Software, including software developed for internal use
|
3 - 7 years
|
|
|
Store related assets
|
3 - 10 years
|
|
|
Leasehold improvements
|
Shorter of lease term or 10 years
|
|
|
Non-store related building and site improvements
|
10 - 15 years
|
|
|
Other property and equipment
|
20 years
|
|
|
Buildings
|
30 years
|
|
When a decision has been made to dispose of property and equipment prior to the end of the previously estimated useful life, depreciation estimates are revised to reflect the use of the asset over the shortened estimated useful life. The Company’s cost of assets sold or retired and the related accumulated depreciation are removed from the accounts with any resulting gain or loss included in net income. Maintenance and repairs are charged to expense as incurred. Major renewals and betterments that extend useful lives are capitalized.
Property and equipment are reviewed for impairment whenever events or changes in circumstances indicate that the carrying amount of the asset may not be recoverable. Assets are grouped at the lowest level for which they are largely independent of other assets or asset groups. If the estimated undiscounted future cash flows related to the asset or asset group are less than the carrying value, the Company recognizes a loss equal to the difference between the carrying value and the estimated fair value, usually determined by the estimated discounted future cash flows of the asset or asset group.
Goodwill and Intangible Assets
The Company has certain intangible assets resulting from business combinations and acquisitions that are recorded at cost. Intangible assets with finite lives are amortized on a straight-line basis over their respective estimated useful lives.
Goodwill is reviewed for impairment each year in the fourth quarter and may be reviewed more frequently if certain events occur or circumstances change. The Company has the option to either first perform a qualitative assessment to determine whether it is more likely than not that each reporting unit's fair value is less than its carrying value (including goodwill), or to proceed directly to the quantitative assessment which requires a comparison of the fair value of each reporting unit's fair value to its carrying value (including goodwill). If the Company determines that the fair value of a reporting unit is less than its carrying value, the Company then estimates the fair value of all assets and liabilities of that reporting unit, including the implied fair value of goodwill, through either estimated discounted future cash flows or market-based methodologies. If the carrying value of goodwill exceeds the implied fair value, the Company recognizes an impairment charge equal to the difference. The Company's reporting units are determined in accordance with the provisions of ASC 350,
Intangibles - Goodwill and Other
. The Company's reporting units that have goodwill are Victoria's Secret, Bath & Body Works and Greater China.
60
Intangible assets with indefinite lives are reviewed for impairment each year in the fourth quarter and may be reviewed more frequently if certain events occur or circumstances change. The Company has the option to either first performs a qualitative assessment to determine whether it is more likely than not that the indefinite-lived intangible asset is impaired, or to proceed directly to the quantitative assessment which requires a comparison of the fair value of the intangible asset to its carrying value. To determine if the fair value of the asset is less than its carrying amount, the Company will estimate the fair value, usually determined by the estimated discounted future cash flows of the asset, and compare that value with its carrying amount. If the carrying value of the intangible asset exceeds the fair value, the Company recognizes an impairment charge equal to the difference.
If future economic conditions are different than those projected by management, future impairment charges may be required.
Leases and Leasehold Improvements
The Company has leases that contain predetermined fixed escalations of minimum rentals and/or rent abatements subsequent to taking possession of the leased property. The Company recognizes the related rent expense on a straight-line basis commencing upon the store possession date. The Company records the difference between the recognized rental expense and amounts payable under the leases as deferred lease credits. The Company’s liability for predetermined fixed escalations of minimum rentals and/or rent abatements totaled
$220 million
as of
February 2, 2019
and
$210 million
as of
February 3, 2018
. These liabilities are included in Other Long-term Liabilities on the Consolidated Balance Sheets.
The Company receives construction allowances from landlords related to its retail stores. These allowances are generally comprised of cash amounts received by the Company from its landlords as part of the negotiated lease terms. The Company records a receivable and a landlord allowance at the lease commencement date (date of initial possession of the store). The landlord allowance is amortized on a straight-line basis as a reduction of rent expense over the term of the lease (including the pre-opening build-out period), and the receivable is reduced as amounts are received from the landlord. The Company’s unamortized portion of landlord allowances, which totaled
$278 million
as of
February 2, 2019
and
$293 million
as of
February 3, 2018
, is included in Other Long-term Liabilities on the Consolidated Balance Sheets.
The Company also has leasehold improvements which are amortized over the shorter of their estimated useful lives or the period from the date the assets are placed in service to the end of the initial lease term. Leasehold improvements made after the inception of the initial lease term are depreciated over the shorter of their estimated useful lives or the remaining lease term, including renewal periods, if reasonably assured.
For information regarding the future impacts as a result of the Company's adoption of ASC 842,
Leases,
in the first quarter of 2019, refer to Note 2, "New Accounting Pronouncements."
Foreign Currency Translation
The functional currency of the Company’s foreign operations is generally the applicable local currency. Assets and liabilities are translated into U.S. dollars using the current exchange rates in effect as of the balance sheet date, while revenues and expenses are translated at the average exchange rates for the period. The Company’s resulting translation adjustments are recorded as a component of accumulated other comprehensive income (loss) in shareholders’ equity. Accumulated foreign currency translation adjustments are reclassified to net income when realized upon sale or upon complete or substantially complete liquidation of the investment in the foreign entity.
Derivative Financial Instruments
The Company uses derivative financial instruments to manage exposure to foreign currency exchange rates and interest rates. The Company does not use derivative instruments for trading purposes. All derivative instruments are recorded on the Consolidated Balance Sheets at fair value.
For derivative financial instruments that are designated and qualify as cash flow hedges, the effective portion of the gain or loss on the derivative instrument is reported as a component of accumulated other comprehensive income (loss) in shareholders’ equity and reclassified into earnings in the same period during which the hedged item affects earnings. Gains and losses that are reclassified into earnings are recognized in the same line item on the Consolidated Statement of Income as the underlying hedged item. Gains and losses on the derivative representing hedge ineffectiveness, if any, are recognized in current earnings.
For derivative financial instruments that are designated and qualify as fair value hedges, the change in the fair value of the derivative instrument has an equal and offsetting impact to the carrying value of the liability on the balance sheet.
For derivative financial instruments that are not designated as hedging instruments, the gain or loss on the derivative instrument is recognized in current earnings in Other Income (Loss) on the Consolidated Statements of Income.
61
Fair Value
The authoritative guidance included in ASC 820,
Fair Value Measurement,
defines fair value as the exchange price that would be received for an asset or paid to transfer a liability (an exit price) in the principal or most advantageous market for the asset or liability in an orderly transaction between market participants. This authoritative guidance further establishes a three-level fair value hierarchy that prioritizes the inputs used to measure fair value. This hierarchy requires entities to maximize the use of observable inputs and minimize the use of unobservable inputs. The three levels of inputs used to measure fair value are as follows:
|
•
|
Level 1—Quoted market prices in active markets for identical assets or liabilities.
|
|
•
|
Level 2—Observable inputs other than quoted market prices included in Level 1, such as quoted prices of similar assets and liabilities in active markets; quoted prices for identical or similar assets and liabilities in markets that are not active; or other inputs that are observable or can be corroborated by observable market data.
|
|
•
|
Level 3—Unobservable inputs that are supported by little or no market activity and that are significant to the fair value of the assets and liabilities. This includes certain pricing models, discounted cash flow methodologies and similar techniques that use significant unobservable inputs.
|
The Company estimates the fair value of financial instruments, property and equipment and goodwill and intangible assets in accordance with the provisions of ASC 820
.
Income Taxes
The Company accounts for income taxes under the asset and liability method. Under this method, taxes currently payable or refundable are accrued, and deferred tax assets and liabilities are recognized for the estimated future tax consequences attributable to differences between the financial statement carrying amounts of existing assets and liabilities and their respective tax bases. Deferred tax assets are also recognized for realizable operating loss and tax credit carryforwards. Deferred tax assets and liabilities are measured using enacted income tax rates in effect for the year in which those temporary differences are expected to be recovered or settled. The effect on deferred tax assets and liabilities of a change in income tax rates is recognized in the Company’s Consolidated Statement of Income in the period that includes the enactment date. A valuation allowance is recorded to reduce the carrying amounts of deferred tax assets if it is more likely than not that such assets will not be realized.
In determining the Company’s provision for income taxes, the Company considers permanent differences between book and tax income and statutory income tax rates. The Company’s effective income tax rate is affected by items including changes in tax law, the tax jurisdiction of new stores or business ventures and the level of earnings.
The Company follows a two-step approach to recognize and measure uncertain tax positions. The first step is to evaluate the tax position for recognition by determining if the available evidence indicates it is more likely than not that the position will be sustained on audit, including resolution of related appeals or litigation processes, if any. The second step is to measure the tax benefit as the largest amount which is more than
50%
likely of being realized upon ultimate settlement. The Company considers many factors when evaluating and estimating its tax positions and tax benefits, which may require periodic adjustments and for which actual outcomes may differ from forecasted outcomes.
The Company’s income tax returns, like those of most companies, are periodically audited by domestic and foreign tax authorities. These audits include questions regarding the Company’s tax filing positions, including the timing and amount of deductions and the allocation of income among various tax jurisdictions. At any one time, multiple tax years are subject to audit by the various tax authorities. A number of years may elapse before a particular matter for which the Company has established an accrual is audited and fully resolved or clarified. The Company adjusts its tax contingencies accrual and income tax provision in the period in which matters are effectively settled with tax authorities at amounts different from its established accrual, when the statute of limitations expires for the relevant taxing authority to examine the tax position or when more information becomes available. The Company includes its tax contingencies accrual, including accrued penalties and interest, in Other Long-term Liabilities on the Consolidated Balance Sheets unless the liability is expected to be paid within one year. Changes to the tax contingencies accrual, including accrued penalties and interest, are included in Provision for Income Taxes on the Consolidated Statements of Income.
Self-Insurance
The Company is self-insured for medical, workers’ compensation, property, general liability and automobile liability up to certain stop-loss limits. Such costs are accrued based on known claims and an estimate of incurred but not reported (“IBNR”) claims. IBNR claims are estimated using historical claim information and actuarial estimates.
62
Noncontrolling Interest
Noncontrolling interest represents the portion of equity interests of consolidated affiliates not owned by the Company.
Share-based Compensation
The Company recognizes all share-based payments to employees and directors as compensation cost over the service period based on their estimated fair value on the date of grant. The Company estimates award forfeitures at the time awards are granted and adjusts, if necessary, in subsequent periods based on historical experience and expected future forfeitures.
Compensation cost is recognized over the service period for the fair value of awards that actually vest. Compensation expense for awards without a performance condition is recognized, net of estimated forfeitures, using a single award approach (each award is valued as one grant, irrespective of the number of vesting tranches). Compensation expense for awards with a performance condition is recognized, net of estimated forfeitures, using a multiple award approach (each vesting tranche is valued as one grant).
Revenue Recognition
In the first quarter of 2018, the Company adopted ASC 606,
Revenue from Contracts with Customers
, using the modified retrospective approach. Results for 2018 are presented under ASC 606, while prior period consolidated financial statements have not been adjusted and continue to be presented under the accounting standards in effect for those periods.
The Company recognizes revenue based on the amount it expects to receive when control of the goods or services is transferred to the customer. The Company recognizes sales upon customer receipt of merchandise, which for direct channel revenues reflect an estimate of shipments that have not yet been received by the customer based on shipping terms and historical delivery times. The Company’s shipping and handling revenues are included in Net Sales with the related costs included in Costs of Goods Sold, Buying and Occupancy in the Consolidated Statements of Income. The Company also provides a reserve for projected merchandise returns based on historical experience. Net Sales exclude sales and other similar taxes collected from customers.
The Company offers certain loyalty programs that allow customers to earn points based on purchasing activity. As customers accumulate points and reach point thresholds, they can use the points to purchase merchandise in stores or online. The Company allocates revenue to points earned on qualifying purchases and defers recognition until the points are redeemed. The amount of revenue deferred is based on the relative stand-alone selling price method, which includes an estimate for points not expected to be redeemed based on historical experience.
The Company sells gift cards with no expiration dates to customers. The Company does not charge administrative fees on unused gift cards. The Company recognizes revenue from gift cards when they are redeemed by the customer. In addition, the Company recognizes revenue on unredeemed gift cards where the likelihood of the gift card being redeemed is remote and there is no legal obligation to remit the unredeemed gift cards to relevant jurisdictions (gift card breakage). Gift card breakage revenue is recognized in proportion, and over the same period, as actual gift card redemptions. The Company determines the gift card breakage rate based on historical redemption patterns. Gift card breakage is included in Net Sales in the Consolidated Statements of Income.
Revenue earned in connection with Victoria’s Secret's private label credit card arrangement is recognized over the term of the license arrangement and is included in Net Sales in the 2018 Consolidated Statement of Income.
The Company also recognizes revenues associated with franchise, license, wholesale and sourcing arrangements. Revenue recognized under franchise and license arrangements generally consists of royalties earned and recognized upon sale of merchandise by franchise and license partners to retail customers. Revenue is generally recognized under wholesale and sourcing arrangements at the time the title passes to the partner.
Costs of Goods Sold, Buying and Occupancy
The Company’s costs of goods sold include merchandise costs, net of discounts and allowances, freight and inventory shrinkage. The Company’s buying and occupancy expenses primarily include payroll, benefit costs and operating expenses for its buying departments and distribution network, rent, common area maintenance, real estate taxes, utilities, maintenance, fulfillment expenses and depreciation for the Company’s stores, warehouse facilities and equipment.
63
General, Administrative and Store Operating Expenses
The Company’s general, administrative and store operating expenses primarily include payroll and benefit costs for its store-selling and administrative departments (including corporate functions), marketing, advertising and other operating expenses not specifically categorized elsewhere in the Consolidated Statements of Income.
Use of Estimates in the Preparation of Financial Statements
The preparation of financial statements in conformity with U.S. generally accepted accounting principles requires management to make estimates and assumptions that affect the reported amounts of assets and liabilities at the date of the financial statements and the reported amounts of revenues and expenses during the reporting period, as well as the related disclosure of contingent assets and liabilities at the date of the financial statements. Actual results may differ from those estimates, and the Company revises its estimates and assumptions as new information becomes available.
2. New Accounting Pronouncements
Revenue from Contracts with Customers
In May 2014, the FASB issued ASC 606,
Revenue from Contracts with Customers
, which was further clarified and amended in 2015 and 2016. This guidance requires companies to recognize revenue in a manner that depicts the transfer of promised goods or services to customers in amounts that reflect the consideration to which a company expects to be entitled in exchange for those goods or services. The new standard also results in enhanced disclosures about the nature, amount, timing and uncertainty of revenue and cash flows arising from contracts with customers.
The Company adopted the standard in the first quarter of 2018 under the modified retrospective approach. Under the standard, income from the Victoria's Secret private label credit card arrangement, which was historically presented as a reduction to General, Administrative and Store Operating Expenses, is presented as revenue. Further, historical accounting related to loyalty points earned under the Victoria's Secret customer loyalty program changed as the Company now defers revenue associated with customer loyalty points until the points are redeemed using a relative stand-alone selling price method. The standard also changed accounting for sales returns which requires balance sheet presentation on a gross basis.
In the first quarter of 2018, the Company recorded a cumulative catch-up adjustment resulting in a reduction to opening retained earnings, net of tax, of
$28 million
. The cumulative adjustment primarily related to the deferral of revenue related to outstanding points, net of estimated forfeitures, under the Victoria's Secret customer loyalty program. In addition, Net Sales and General, Administrative and Store Operating Expenses both increased
$187 million
in the 2018 Consolidated Statement of Income. Further, gross presentation of the Company's sales return reserve resulted in a
$5 million
increase in Other Current Assets and Accrued Expenses and Other on the
February 2, 2019
Consolidated Balance Sheet.
Fair Value of Financial Instruments
In January 2016, the FASB issued ASC 321,
Investments - Equity Securities
, which addresses certain aspects of the recognition, measurement, presentation and disclosure of financial instruments. The standard requires the recognition of changes in the fair value of marketable equity securities in net income as compared to historical treatment in accumulated other comprehensive income on the balance sheet. The Company adopted the standard in the first quarter of 2018 and recorded an increase to opening retained earnings, net of tax, of
$2 million
.
Leases
In February 2016, the FASB issued ASC 842,
Leases
, which is effective beginning in fiscal 2019 and requires companies classified as lessees to account for most leases on their balance sheets but recognize expenses on their income statements in a manner similar to today’s accounting. The standard also will result in enhanced quantitative and qualitative disclosures, including significant judgments made by management, to provide greater insight into the extent of revenue and expense recognized and expected to be recognized from existing leases. In July 2018, the FASB approved an amendment to the standard that provides companies a transition option that would not require earlier periods to be restated upon adoption.
The Company will adopt the standard in the first quarter of 2019 and apply the standard prospectively as of the adoption date. As allowed by the new standard, the Company elected the package of transition practical expedients but has elected to not apply the hindsight practical expedient to its leases at transition.
Substantially all of the Company's leases, including our retail store locations, are subject to operating lease accounting under the new standard. The Company expects to recognize right-of-use assets of approximately
$3.3 billion
and related lease liabilities of approximately
$3.7 billion
in its Consolidated Balance Sheet upon adoption at the beginning of fiscal 2019. These balances will change as the lease portfolio changes due to execution of lease modifications or new leases. The right-of-use
64
assets are based upon the lease liabilities adjusted for deferred rent liabilities and unamortized landlord construction allowances. The Company will continue to recognize rent expense in the Consolidated Statements of Income on a straight-line basis over the lease term.
Hedging Activities
In August 2017, the FASB issued ASU 2017-12,
Targeted Improvements to Accounting for Hedging Activities
, which is intended to better align risk management activities and financial reporting for hedging relationships. The standard eliminates the requirement to separately measure and report hedge ineffectiveness and generally requires the entire change in the fair value of a hedging instrument to be presented in the same income statement line as the hedged item. It also eases certain documentation and assessment requirements. The Company will adopt the standard in the first quarter of fiscal 2019. The Company does not expect this standard to have a material impact on its consolidated results of operations, financial position or cash flows.
Goodwill
In January 2017, the FASB issued ASU 2017-04,
Simplifying the Test for Goodwill Impairment
, which simplifies the subsequent measurement of goodwill. The standard eliminates the second step from the goodwill impairment test, which requires a hypothetical purchase price allocation to determine the implied fair value of goodwill. Under the new standard, the goodwill impairment charge will be the excess of the reporting unit's carrying value over its fair value, not to exceed the total amount of goodwill allocated to the reporting unit. This guidance will be effective beginning in fiscal 2020, with early adoption permitted. The Company does not expect this standard to have a material impact on its consolidated results of operations, financial position or cash flows.
3. Revenue Recognition
In the first quarter of 2018, the Company adopted ASC 606,
Revenue from Contracts with Customers
, using the modified retrospective approach. Results for 2018 are presented under ASC 606, while prior period consolidated financial statements have not been adjusted and continue to be presented under the accounting standards in effect for those periods.
Accounts receivable, net from revenue-generating activities were
$150 million
as of
February 2, 2019
and
$144 million
as of the beginning of the period upon adoption of the new standard. Accounts receivable primarily relate to amounts due from the Company's franchise, license and wholesale partners. Under these arrangements, payment terms are typically 60 to 75 days.
The Company records deferred revenue when cash payments are received in advance of transfer of control of goods or services. Deferred revenue primarily relates to gift cards, loyalty and private label credit card programs and direct channel shipments, which are all impacted by seasonal and holiday-related sales patterns. The balance of deferred revenue was
$331 million
as of
February 2, 2019
and
$320 million
as of the beginning of the period upon adoption of the new standard. The Company recognized
$224 million
as revenue in
2018
from amounts recorded as deferred revenue at the beginning of the period. The Company's deferred revenue balance would have been
$287 million
as of
February 2, 2019
under accounting standards in effect prior to the adoption of the new standard. As of
February 2, 2019
, the Company recorded deferred revenues of
$316 million
within Accrued Expenses and Other, and
$15 million
within Other Long-term Liabilities on the Consolidated Balance Sheet.
The following table provides a disaggregation of Net Sales for
2018
,
2017
and
2016
:
|
2018
|
2017 (a)(b)
|
2016 (a)
|
|||||||||
|
(in millions)
|
|||||||||||
|
Victoria’s Secret Stores (c)
|
$
|
5,628
|
|
$
|
5,879
|
|
$
|
6,199
|
|
||
|
Victoria’s Secret Direct
|
1,747
|
|
1,508
|
|
1,582
|
|
|||||
|
Victoria’s Secret North America
|
7,375
|
|
7,387
|
|
7,781
|
|
|||||
|
Bath & Body Works Stores (c)
|
3,907
|
|
3,589
|
|
3,400
|
|
|||||
|
Bath & Body Works Direct
|
724
|
|
559
|
|
452
|
|
|||||
|
Bath & Body Works North America
|
4,631
|
|
4,148
|
|
3,852
|
|
|||||
|
Victoria's Secret and Bath & Body Works International (d)
|
605
|
|
502
|
|
423
|
|
|||||
|
Other (e)
|
626
|
|
595
|
|
518
|
|
|||||
|
Total Net Sales
|
$
|
13,237
|
|
$
|
12,632
|
|
$
|
12,574
|
|
||
_______________
|
(a)
|
2017 and 2016 amounts have not been adjusted under the modified retrospective approach.
|
65
|
(b)
|
2017 represents a 53-week fiscal year.
|
|
(c)
|
Includes company-owned stores in the U.S. and Canada.
|
|
(d)
|
Includes company-owned stores in the U.K., Ireland and Greater China, direct sales in Greater China and wholesale sales, royalties and other fees associated with non-company owned stores.
|
|
(e)
|
Includes wholesale revenues from the Company's sourcing function, Henri Bendel store and direct sales, and La Senza store and direct sales prior to January 6, 2019.
|
4. Earnings Per Share
Earnings per basic share is computed based on the weighted-average number of outstanding common shares. Earnings per diluted share include the weighted-average effect of dilutive options and restricted stock on the weighted-average shares outstanding.
The following table provides shares utilized for the calculation of basic and diluted earnings per share for
2018
,
2017
and
2016
:
|
2018
|
2017 (a)
|
2016
|
||||||
|
(in millions)
|
||||||||
|
Weighted-average Common Shares:
|
||||||||
|
Issued Shares
|
283
|
|
308
|
|
314
|
|
||
|
Treasury Shares
|
(7
|
)
|
(24
|
)
|
(27
|
)
|
||
|
Basic Shares
|
276
|
|
284
|
|
287
|
|
||
|
Effect of Dilutive Options and Restricted Stock
|
3
|
|
3
|
|
4
|
|
||
|
Diluted Shares
|
279
|
|
287
|
|
291
|
|
||
|
Anti-dilutive Options and Awards (b)
|
5
|
|
4
|
|
2
|
|
||
________________
|
(a)
|
In November 2017, the Company retired
36 million
shares of its Treasury Stock.
|
|
(b)
|
These options and awards were excluded from the calculation of diluted earnings per share because their inclusion would have been anti-dilutive.
|
5. Acquisition
On April 18, 2016, the Company completed the acquisition of 100% of the shares of American Beauty Limited for a total purchase price of
$44 million
. This agreement included the reacquisition of the franchise rights from one of our partners to operate Victoria's Secret Beauty and Accessories stores in Greater China, including
26
stores already open at the time of acquisition. The purchase price included
$10 million
in forgiveness of liabilities owed to the Company from the pre-existing relationship. As a result of this acquisition, the Company's financial statements include the financial results of American Beauty Limited, which are reported as part of the Victoria's Secret and Bath & Body Works International segment.
The total purchase price was allocated to the net tangible and intangible assets acquired based on their estimated fair value. Such estimated fair values require management to make estimates and judgments, especially with respect to intangible assets. The allocation of the purchase price to goodwill was complete as of the second quarter of
2016
. Goodwill related to the acquisition is not deductible for tax purposes.
The allocation of the purchase price to the fair value of assets acquired and liabilities assumed is as follows:
|
(in millions)
|
|||
|
Cash and Cash Equivalents
|
$
|
1
|
|
|
Inventories
|
3
|
|
|
|
Property and Equipment
|
10
|
|
|
|
Goodwill
|
30
|
|
|
|
Other Assets
|
3
|
|
|
|
Current Liabilities
|
(3
|
)
|
|
|
Net Assets Acquired
|
$
|
44
|
|
|
Forgiveness of Liabilities Owed to the Company
|
(10
|
)
|
|
|
Consideration Paid
|
$
|
34
|
|
66
6. Restructuring Activities
La Senza
On January 6, 2019, in an effort to increase shareholder value and in order to focus on its larger core businesses, the Company divested its ownership interest in La Senza to an affiliate of Regent LP, a global private equity firm. Regent LP assumed La Senza’s operating assets and liabilities in exchange for potential future consideration upon the sale or other monetization of La Senza, as defined in the agreement. In the fourth quarter of 2018, the Company recognized a pre-tax loss on the divestiture of
$99 million
, primarily related to
$45 million
of accumulated foreign currency translation adjustments reclassified into earnings that were previously recognized as a component of equity, as well as losses related to the transfer of the net working capital and long-lived store assets to the buyer. The loss is included in Loss on Divestiture of La Senza in the 2018 Consolidated Statement of Income. The after-tax loss on the divestiture was
$55 million
, which includes
$44 million
of tax benefits primarily associated with the recognition of previously unrecognized deferred tax assets.
In conjunction with the transaction, the Company has guaranteed certain lease payments under the current terms of noncancelable leases. For additional information, see Note
18
, "Commitments and Contingencies."
Additionally, the Company will continue to provide support to La Senza in various operational areas including logistics, technology and merchandise sourcing for periods of time ranging from one month to eighteen months.
Henri Bendel
In the fourth quarter of 2018, the Company closed all Henri Bendel stores and ceased selling merchandise online.
The Company announced the planned closure of Henri Bendel in the third quarter of 2018. As a result, the Company recognized a pre-tax charge, primarily cash, consisting of lease termination costs, severance and other costs of
$20 million
in the third quarter. In the fourth quarter of 2018, the Company recognized an additional pre-tax charge of
$3 million
, primarily related to contract termination and employee retention costs. Restructuring charges of
$14 million
and
$9 million
are included in Costs of Goods Sold, Buying and Occupancy and General, Administrative and Store Operating Expenses, respectively, in the 2018 Consolidated Statement of Income. Through the fourth quarter of 2018, the Company made cash payments of
$16 million
. The remaining balance of
$7 million
is included in Accrued Expenses and Other on the
February 2, 2019
Consolidated Balance Sheet.
Victoria's Secret
During the first quarter of 2016, the Company made strategic changes within the Victoria’s Secret segment designed to focus the brand on its core merchandise categories, streamline operations and emphasize brand building and loyalty-enhancing marketing and advertising rather than using traditional catalogues and offers. As a result of these actions, the Company recorded charges related to cancellations of fabric commitments for non-go forward merchandise and a reserve against paper that was previously intended for future catalogues. These costs, totaling
$11 million
, including non-cash charges of
$10 million
, are included in Costs of Goods Sold, Buying and Occupancy on the 2016 Consolidated Statement of Income. These actions also resulted in the elimination of approximately
200
positions primarily in the Company's Ohio and New York home offices. Severance and related costs associated with these eliminations, totaling
$24 million
, are included in General, Administrative and Store Operating Expenses on the 2016 Consolidated Statement of Income. The Company recognized a total pre-tax charge of
$35 million
for these items in the first quarter of 2016.
7. Inventories
The following table provides details of inventories as of
February 2, 2019
and
February 3, 2018
:
|
February 2,
2019 |
February 3,
2018 |
||||||
|
(in millions)
|
|||||||
|
Finished Goods Merchandise
|
$
|
1,107
|
|
$
|
1,121
|
|
|
|
Raw Materials and Merchandise Components
|
141
|
|
119
|
|
|||
|
Total Inventories
|
$
|
1,248
|
|
$
|
1,240
|
|
|
67
8. Property and Equipment, Net
The following table provides details of property and equipment, net as of
February 2, 2019
and
February 3, 2018
:
|
February 2,
2019 |
February 3,
2018 |
||||||
|
(in millions)
|
|||||||
|
Land and Improvements
|
$
|
116
|
|
$
|
116
|
|
|
|
Buildings and Improvements
|
492
|
|
484
|
|
|||
|
Furniture, Fixtures, Software and Equipment
|
3,725
|
|
3,757
|
|
|||
|
Leasehold Improvements
|
2,277
|
|
2,251
|
|
|||
|
Construction in Progress
|
123
|
|
79
|
|
|||
|
Total
|
6,733
|
|
6,687
|
|
|||
|
Accumulated Depreciation and Amortization
|
(3,915
|
)
|
(3,794
|
)
|
|||
|
Property and Equipment, Net
|
$
|
2,818
|
|
$
|
2,893
|
|
|
Depreciation expense was
$590 million
in
2018
,
$571 million
in
2017
and
$518 million
in
2016
.
During
2018
, the Company concluded that the negative operating results for certain of its Victoria's Secret stores were an indicator of potential impairment of the related long-lived store assets. The Company determined that the estimated undiscounted future cash flows were less than the carrying values and, as a result, recognized a loss equal to the difference between the carrying values and the estimated fair values, determined by the estimated discounted future cash flows. As a result, the Company recognized impairment charges of
$81 million
and
$20 million
in the third and fourth quarter of 2018, respectively. These charges are included in Costs of Goods Sold, Buying & Occupancy in the
2018
Consolidated Statement of Income. Impairment charges of
$70 million
, related to stores in the U.S. and Canada, were recorded within the Victoria's Secret segment. Impairment charges of
$31 million
, related to stores in the U.K., were recorded within the Victoria's Secret and Bath & Body Works International segment.
In
2016
, the Company completed a sale and leaseback transaction under a noncancelable operating lease of a certain asset. The carrying value of the asset sold under this arrangement was
$51 million
. Proceeds of
$51 million
are included in Proceeds from Sale of Assets within the Investing Activities section of the
2016
Consolidated Statement of Cash Flows. For additional information, see Note
18
, "Commitments and Contingencies."
9. Goodwill and Trade Names
Goodwill
The following table provides detail regarding the composition of goodwill for the fiscal years ended
February 2, 2019
and
February 3, 2018
:
|
February 2, 2019
|
February 3, 2018
|
||||||
|
|
(in millions)
|
||||||
|
Victoria's Secret
|
$
|
690
|
|
$
|
690
|
|
|
|
Bath & Body Works
|
628
|
|
628
|
|
|||
|
Victoria's Secret and Bath & Body Works International
|
30
|
|
30
|
|
|||
|
Goodwill
|
$
|
1,348
|
|
$
|
1,348
|
|
|
In 2016, the Company reacquired from one of its partners the franchise rights to operate Victoria's Secret Beauty and Accessories stores in Greater China, including
26
stores already open at the time of acquisition. As a result of the acquisition, the Company recognized
$30 million
of goodwill within the Victoria's Secret and Bath & Body Works International reportable segment. For additional information, see Note
5
, "Acquisition."
The Company tests for goodwill impairment at the reporting unit level. The Company's reporting units with goodwill balances at
February 2, 2019
were Victoria's Secret, Bath & Body Works and Greater China.
68
Intangible Assets—Indefinite Lives
Intangible assets with indefinite lives represent the Victoria’s Secret and Bath & Body Works trade names. The following table provides additional detail regarding the composition of trade names as of
February 2, 2019
and
February 3, 2018
:
|
February 2, 2019
|
February 3, 2018
|
||||||
|
|
(in millions)
|
||||||
|
Victoria's Secret
|
$
|
246
|
|
$
|
246
|
|
|
|
Bath & Body Works
|
165
|
|
165
|
|
|||
|
Trade Names
|
$
|
411
|
|
$
|
411
|
|
|
10. Equity Investments
Easton Investments
The Company has land and other investments in Easton, a planned community in Columbus, Ohio, that integrates office, hotel, retail, residential and recreational space. These investments, totaling
$89 million
as of
February 2, 2019
and
$81 million
as of
February 3, 2018
, are recorded in Other Assets on the Consolidated Balance Sheets.
Included in the Company’s Easton investments are equity interests in Easton Town Center, LLC (“ETC”) and Easton Gateway, LLC (“EG”), entities that own and develop commercial entertainment and shopping centers. The Company’s investments in ETC and EG are accounted for using the equity method of accounting. The Company has a majority financial interest in ETC and EG, but another unaffiliated member manages them, and certain significant decisions regarding ETC and EG require the consent of unaffiliated members in addition to the Company.
The Company received cash distributions of
$16 million
and
$29 million
from certain of its Easton investments during
2018
and
2017
, respectively, which are included as return of capital within Investing Activities of the Consolidated Statements of Cash Flows. As a result of these distributions, the Company recognized pre-tax gains totaling
$8 million
and
$20 million
during
2018
and
2017
, respectively, which are included in Other Income (Loss) in the Consolidated Statements of Income.
In 2016, ETC refinanced its bank loan. In conjunction with the loan refinancing, the Company received a cash distribution from ETC of
$124 million
and recognized a pre-tax gain of
$108 million
(after-tax gain of
$70 million
). The gain is included in Other Income (Loss) on the 2016 Consolidated Statement of Income and the return of capital is included within the Investing Activities section of the 2016 Consolidated Statement of Cash Flows.
11. Accrued Expenses and Other
The following table provides additional information about the composition of accrued expenses and other as of
February 2, 2019
and
February 3, 2018
:
|
February 2,
2019 |
February 3, 2018
|
||||||
|
(in millions)
|
|||||||
|
Deferred Revenue, Principally from Gift Card Sales (a)
|
$
|
316
|
|
$
|
267
|
|
|
|
Compensation, Payroll Taxes and Benefits
|
215
|
|
196
|
|
|||
|
Taxes, Other than Income
|
78
|
|
102
|
|
|||
|
Interest
|
92
|
|
101
|
|
|||
|
Rent
|
39
|
|
43
|
|
|||
|
Accrued Claims on Self-insured Activities
|
45
|
|
37
|
|
|||
|
Returns Reserve (a)
|
27
|
|
20
|
|
|||
|
Other
|
270
|
|
263
|
|
|||
|
Total Accrued Expenses and Other
|
$
|
1,082
|
|
$
|
1,029
|
|
|
_______________
|
(a)
|
The Company adopted ASC 606,
Revenue from Contracts with Customers
, under the modified retrospective approach. As such, balances as of
February 3, 2018
have not been adjusted.
|
69
12. Income Taxes
Current income tax expense represents the amounts expected to be reported on the Company’s income tax returns, and deferred tax expense or benefit represents the change in net deferred tax assets and liabilities. Deferred tax assets and liabilities are determined based on the difference between the financial statement and tax bases of assets and liabilities as measured by the enacted tax rates that will be in effect when these differences reverse. Valuation allowances are recorded as appropriate to reduce deferred tax assets to the amount considered likely to be realized.
On December 22, 2017, the Tax Cuts and Jobs Act (the "TCJA") was enacted into law. The legislation significantly changes U.S. tax law by, among other things, lowering corporate income tax rates and imposing a repatriation tax on deemed repatriated earnings of foreign subsidiaries. The TCJA reduces the U.S. corporate income tax rate from a maximum of
35%
to a flat
21%
rate, effective January 1, 2018.
On December 22, 2017, the SEC staff issued Staff Accounting Bulletin No. 118 (“SAB 118”) to address the application of GAAP in situations when a registrant does not have the necessary information available, prepared or analyzed (including computations) in reasonable detail to complete the accounting for certain income tax effects of the TCJA. The ultimate impact may differ from provisional amounts, due to changes in interpretations and assumptions the Company has made regarding application of the TCJA as well as additional regulatory guidance that may be issued. The Company recognized
$159 million
tax benefit related to revaluing the ending net deferred tax liabilities and recognized
$67 million
of tax expense related to the deemed mandatory repatriation in its consolidated financial statements for the year ended February 3, 2018. As of February 2, 2019, the Company has completed its determination of the accounting implications of the TCJA.
The following table provides the components of the Company’s provision for income taxes for fiscal
2018
,
2017
and
2016
:
|
2018
|
2017
|
2016
|
|||||||||
|
|
(in millions)
|
||||||||||
|
Current:
|
|||||||||||
|
U.S. Federal
|
$
|
212
|
|
$
|
366
|
|
$
|
345
|
|
||
|
U.S. State
|
37
|
|
49
|
|
62
|
|
|||||
|
Non-U.S.
|
16
|
|
22
|
|
21
|
|
|||||
|
Total
|
265
|
|
437
|
|
428
|
|
|||||
|
Deferred:
|
|||||||||||
|
U.S. Federal
|
(4
|
)
|
(114
|
)
|
99
|
|
|||||
|
U.S. State
|
2
|
|
6
|
|
8
|
|
|||||
|
Non-U.S.
|
(50
|
)
|
—
|
|
3
|
|
|||||
|
Total
|
(52
|
)
|
(108
|
)
|
110
|
|
|||||
|
Provision for Income Taxes
|
$
|
213
|
|
$
|
329
|
|
$
|
538
|
|
||
The non-U.S. component of pre-tax income, arising principally from overseas operations, was a loss of
$14 million
, income of
$99 million
and income of
$134 million
for
2018
,
2017
and
2016
, respectively.
The following table provides the reconciliation between the statutory federal income tax rate and the effective tax rate for fiscal
2018
,
2017
and
2016
:
|
2018
|
2017
|
2016
|
||||||
|
Federal Income Tax Rate
|
21.0
|
%
|
33.7
|
%
|
35.0
|
%
|
||
|
State Income Taxes, Net of Federal Income Tax Effect
|
6.0
|
%
|
3.6
|
%
|
3.4
|
%
|
||
|
Impact of Non-U.S. Operations
|
0.8
|
%
|
(1.5
|
%)
|
(1.2
|
%)
|
||
|
Divestiture of La Senza
|
(2.7
|
%)
|
—
|
%
|
—
|
%
|
||
|
U.S. Net Deferred Tax Liability Remeasurement
|
—
|
%
|
(12.1
|
%)
|
—
|
%
|
||
|
Deemed Mandatory Repatriation
|
—
|
%
|
5.1
|
%
|
—
|
%
|
||
|
Share-Based Compensation
|
1.0
|
%
|
(1.0
|
%)
|
—
|
%
|
||
|
Uncertain Tax Positions
|
(0.5
|
%)
|
(1.2
|
%)
|
(4.1
|
%)
|
||
|
Other Items, Net
|
(0.7
|
%)
|
(1.5
|
%)
|
(1.4
|
%)
|
||
|
Effective Tax Rate
|
24.9
|
%
|
25.1
|
%
|
31.7
|
%
|
||
70
Deferred Taxes
The following table provides the effect of temporary differences that cause deferred income taxes as of
February 2, 2019
and
February 3, 2018
. Deferred tax assets and liabilities represent the future effects on income taxes resulting from temporary differences and carryforwards at the end of the respective year.
|
|
February 2, 2019
|
February 3, 2018
|
|||||||||||||||||||||
|
Assets
|
Liabilities
|
Total
|
Assets
|
Liabilities
|
Total
|
||||||||||||||||||
|
(in millions)
|
|||||||||||||||||||||||
|
Operating Loss Carryforwards
|
$
|
217
|
|
$
|
—
|
|
$
|
217
|
|
$
|
202
|
|
$
|
—
|
|
$
|
202
|
|
|||||
|
Non-qualified Retirement Plan
|
64
|
|
—
|
|
64
|
|
62
|
|
—
|
|
62
|
|
|||||||||||
|
Leases
|
50
|
|
—
|
|
50
|
|
47
|
|
—
|
|
47
|
|
|||||||||||
|
Share-based Compensation
|
47
|
|
—
|
|
47
|
|
46
|
|
—
|
|
46
|
|
|||||||||||
|
Deferred Revenue
|
28
|
|
—
|
|
28
|
|
15
|
|
—
|
|
15
|
|
|||||||||||
|
Property and Equipment
|
—
|
|
(278
|
)
|
(278
|
)
|
—
|
|
(266
|
)
|
(266
|
)
|
|||||||||||
|
Trade Names and Other Intangibles
|
—
|
|
(93
|
)
|
(93
|
)
|
—
|
|
(91
|
)
|
(91
|
)
|
|||||||||||
|
Other Assets
|
—
|
|
(60
|
)
|
(60
|
)
|
—
|
|
(60
|
)
|
(60
|
)
|
|||||||||||
|
Other, Net
|
60
|
|
(27
|
)
|
33
|
|
57
|
|
(24
|
)
|
33
|
|
|||||||||||
|
Valuation Allowance
|
(172
|
)
|
—
|
|
(172
|
)
|
(212
|
)
|
—
|
|
(212
|
)
|
|||||||||||
|
Total Deferred Income Taxes
|
$
|
294
|
|
$
|
(458
|
)
|
$
|
(164
|
)
|
$
|
217
|
|
$
|
(441
|
)
|
$
|
(224
|
)
|
|||||
As of
February 2, 2019
, the Company had available for state income tax purposes net operating loss carryforwards which expire, if unused, in the years
2019 through 2037
. For those states where the Company has determined that it is more likely than not that the state net operating loss carryforwards will not be realized, a valuation allowance has been provided.
As of
February 2, 2019
, the Company had available for non-U.S. tax purposes net operating loss carryforwards which have an indefinite life and net operating loss carryforwards which expire, if unused, in the years
2028 through 2038
. For certain jurisdictions where the Company has determined that it is more likely than not that the net operating loss carryforwards will not be realized, a valuation allowance has been provided on those net operating loss carryforwards as well as other net deferred tax assets.
Income tax payments were
$324 million
for
2018
,
$494 million
for
2017
and
$469 million
for
2016
.
Uncertain Tax Positions
The following table summarizes the activity related to the Company’s unrecognized tax benefits for U.S. federal, state & non-U.S. tax jurisdictions for
2018
,
2017
and
2016
, without interest and penalties:
|
2018
|
2017
|
2016
|
|||||||||
|
(in millions)
|
|||||||||||
|
Gross Unrecognized Tax Benefits, as of the Beginning of the Fiscal Year
|
$
|
67
|
|
$
|
90
|
|
$
|
248
|
|
||
|
Increases to Unrecognized Tax Benefits for Prior Years
|
35
|
|
3
|
|
3
|
|
|||||
|
Decreases to Unrecognized Tax Benefits for Prior Years
|
(25
|
)
|
(22
|
)
|
(73
|
)
|
|||||
|
Increases to Unrecognized Tax Benefits as a Result of Current Year Activity
|
44
|
|
7
|
|
18
|
|
|||||
|
Decreases to Unrecognized Tax Benefits Relating to Settlements with Taxing Authorities
|
—
|
|
(2
|
)
|
(98
|
)
|
|||||
|
Decreases to Unrecognized Tax Benefits as a Result of a Lapse of the Applicable Statute of Limitations
|
(7
|
)
|
(9
|
)
|
(8
|
)
|
|||||
|
Gross Unrecognized Tax Benefits, as of the End of the Fiscal Year
|
$
|
114
|
|
$
|
67
|
|
$
|
90
|
|
||
Of the
$114 million
,
$67 million
and
$90 million
of total unrecognized tax benefits at
February 2, 2019
,
February 3, 2018
, and
January 28, 2017
, respectively, approximately
$104 million
,
$46 million
and
$62 million
, respectively, represent the amount of unrecognized tax benefits that, if recognized, would favorably affect the effective income tax rate in future periods. These amounts are net of the offsetting tax effects from other tax jurisdictions.
Of the total unrecognized tax benefits, it is reasonably possible that
$84 million
could change in the next 12 months due to audit settlements, expiration of statute of limitations or other resolution of uncertainties. Due to the uncertain and complex application of tax regulations, it is possible that the ultimate resolution of audits may result in amounts which could be different
71
from this estimate. In such case, the Company will record additional tax expense or tax benefit in the period in which such matters are effectively settled.
The Company recognizes interest and penalties related to unrecognized tax benefits as components of income tax expense. The Company recognized an income tax benefit from interest and penalties of
$5 million
,
$2 million
and
$3 million
in
2018
,
2017
and
2016
, respectively. The Company has accrued
$12 million
and
$17 million
for the payment of interest and penalties as of
February 2, 2019
and
February 3, 2018
, respectively. Accrued interest and penalties are included within Other Long-term Liabilities on the Consolidated Balance Sheets.
The Company files U.S. federal income tax returns as well as income tax returns in various states and in non-U.S. jurisdictions. The Company is a participant in the Compliance Assurance Process ("CAP"), which is a program made available by the Internal Revenue Service ("IRS") to certain qualifying large taxpayers, under which participants work collaboratively with the IRS to identify and resolve potential tax issues through open, cooperative and transparent interaction prior to the annual filing of their federal income tax return. The IRS is currently examining the Company's 2017 consolidated U.S. federal income tax return.
The Company is also subject to various U.S. state and local income tax examinations for the years
2012 to 2017
. Finally, the Company is subject to multiple non-U.S. tax jurisdiction examinations for the years
2007 to 2017
. In some situations, the Company determines that it does not have a filing requirement in a particular tax jurisdiction. Where no return has been filed, no statute of limitations applies. Accordingly, if a tax jurisdiction reaches a conclusion that a filing requirement does exist, additional years may be reviewed by the tax authority. The Company believes it has appropriately accounted for uncertainties related to this issue.
72
13. Long-term Debt and Borrowing Facilities
The following table provides the Company’s outstanding debt balance, net of unamortized debt issuance costs and discounts, as of
February 2, 2019
and
February 3, 2018
:
|
February 2,
2019 |
February 3,
2018 |
||||||
|
(in millions)
|
|||||||
|
Senior Debt with Subsidiary Guarantee
|
|||||||
|
$1 billion, 6.875% Fixed Interest Rate Notes due November 2035 (“2035 Notes”)
|
$
|
990
|
|
|
$
|
990
|
|
|
$956 million, 5.625% Fixed Interest Rate Notes due February 2022 (“2022 Notes”)
|
952
|
|
994
|
|
|||
|
$780 million, 6.625% Fixed Interest Rate Notes due April 2021 (“2021 Notes”)
|
776
|
|
994
|
|
|||
|
$700 million, 6.75% Fixed Interest Rate Notes due July 2036 (“2036 Notes”)
|
693
|
|
693
|
|
|||
|
$500 million, 5.625% Fixed Interest Rate Notes due October 2023 (“2023 Notes”)
|
498
|
|
497
|
|
|||
|
$500 million, 5.25% Fixed Interest Rate Notes due February 2028 (“2028 Notes”)
|
496
|
|
495
|
|
|||
|
$338 million, 7.00% Fixed Interest Rate Notes due May 2020 (“2020 Notes”)
|
337
|
|
398
|
|
|||
|
$297 million, 6.694% Fixed Interest Rate Notes due January 2027 ("2027 Notes")
|
273
|
|
—
|
|
|||
|
Secured Foreign Facilities
|
91
|
|
1
|
|
|||
|
Total Senior Debt with Subsidiary Guarantee
|
$
|
5,106
|
|
$
|
5,062
|
|
|
|
Senior Debt
|
|
|
|||||
|
$350 million, 6.95% Fixed Interest Rate Debentures due March 2033 (“2033 Notes”)
|
$
|
348
|
|
$
|
348
|
|
|
|
$300 million, 7.60% Fixed Interest Rate Notes due July 2037 (“2037 Notes”)
|
297
|
|
297
|
|
|||
|
Unsecured Foreign Facilities
|
60
|
|
87
|
|
|||
|
Total Senior Debt
|
$
|
705
|
|
$
|
732
|
|
|
|
Total
|
$
|
5,811
|
|
$
|
5,794
|
|
|
|
Current Debt
|
(72
|
)
|
(87
|
)
|
|||
|
Total Long-term Debt, Net of Current Portion
|
$
|
5,739
|
|
$
|
5,707
|
|
|
The following table provides principal payments due on outstanding debt in the next
five
fiscal years and the remaining years thereafter:
|
Fiscal Year (in millions)
|
|
||
|
2019
|
$
|
72
|
|
|
2020
|
347
|
|
|
|
2021
|
789
|
|
|
|
2022
|
1,018
|
|
|
|
2023
|
500
|
|
|
|
Thereafter
|
$
|
3,147
|
|
Cash paid for interest was
$380 million
in
2018
,
$391 million
in
2017
and
$387 million
in
2016
.
Exchange of Notes
In June 2018, the Company completed private offers to exchange
$62 million
,
$220 million
and
$44 million
of outstanding 2020 Notes, 2021 Notes and 2022 Notes, respectively, for
$297 million
of newly issued
6.694%
notes due in January 2027 and
$52 million
in cash consideration, which included a
$24 million
exchange premium. The exchange was treated as a modification under ASC 470,
Debt
, and no gain or loss was recognized. The exchange premium will be amortized through the maturity date of January 2027 and is included within Long-term Debt on the
February 2, 2019
Consolidated Balance Sheet. The obligation to pay principal and interest on the 2027 Notes is jointly and severally guaranteed on a full and unconditional basis by certain of the Company's 100% owned subsidiaries (the “Guarantors”).
Issuance of Notes
In January 2018, the Company issued
$500 million
of
5.25%
notes due in February 2028. The obligation to pay principal and interest on these notes is jointly and severally guaranteed on a full and unconditional basis by the Guarantors. The proceeds from the issuance were
$495 million
, which were net of issuance costs of
$5 million
. These issuance costs are being amortized through the maturity date of February 2028 and are included within Long-term Debt on the Consolidated Balance Sheets.
73
Redemption of Notes
In January 2018, the Company used the proceeds from the 2028 Notes to redeem the
$500 million
2019 Notes for
$540 million
. In the fourth quarter of 2017, the Company recognized a pre-tax loss on extinguishment of this debt of
$45 million
(after-tax loss of
$29 million
), which includes write-offs of unamortized issuance costs and discounts and losses related to terminated interest rate swaps associated with the 2019 Notes. This loss is included in Other Income (Loss) in the 2017 Consolidated Statement of Income.
Secured Revolving Facility
The Company and the Guarantors guarantee and pledge collateral to secure a revolving credit facility. The Secured Revolving Facility has aggregate availability of
$1 billion
and expires in May 2022. The Secured Revolving Facility allows the Company and certain of the Company's non-U.S. subsidiaries to borrow and obtain letters of credit in U.S. dollars, Canadian dollars, Euros, Hong Kong dollars or British pounds.
The Secured Revolving Facility fees related to committed and unutilized amounts are
0.25%
per annum, and the fees related to outstanding letters of credit are
1.50%
per annum. In addition, the interest rate on outstanding U.S. dollar borrowings is LIBOR plus
1.50%
per annum. The interest rate on outstanding foreign denominated borrowings is the applicable benchmark rate plus
1.50%
per annum.
The Secured Revolving Facility contains fixed charge coverage and debt to EBITDA financial covenants. The Company is required to maintain a fixed charge coverage ratio of not less than
1.75
to
1.00
and a consolidated debt to consolidated EBITDA ratio not exceeding
4.00
to
1.00
for the most recent four-quarter period. In addition, the Secured Revolving Facility provides that investments and restricted payments may be made, without limitation on amount, if (a) at the time of and after giving effect to such investment or restricted payment, the ratio of consolidated debt to consolidated EBITDA for the most recent four-quarter period is less than
3.00
to
1.00
and (b) no default or event of default exists. As of
February 2, 2019
, the Company was in compliance with both of its financial covenants, and the ratio of consolidated debt to consolidated EBITDA was less than
3.00
to
1.00
.
During
2018
, the Company borrowed, and made payments of,
$92 million
under the Secured Revolving Facility. As of
February 2, 2019
, there were no borrowings outstanding under the Secured Revolving Facility.
The Secured Revolving Facility supports the Company’s letter of credit program. The Company had
$9 million
of outstanding letters of credit as of
February 2, 2019
that reduced its remaining availability under the Secured Revolving Facility.
Secured Foreign Facilities
The Company and the Guarantors guarantee and pledge collateral to secure revolving and term loan bank facilities used by certain of the Company's Greater China subsidiaries to support their operations. The Secured Foreign Facilities, which allow borrowings in U.S. dollars and Chinese Yuan, have availability totaling
$100 million
. The interest rates on outstanding borrowings are based upon the applicable benchmark rate for the currency of each borrowing. During
2018
, the Company borrowed
$107 million
and made payments of
$17 million
under the Secured Foreign Facilities. The maximum daily amount outstanding at any point in time in
2018
was
$99 million
. Borrowings on the Secured Foreign Facilities mature between February 2019 and May 2022. As of
February 2, 2019
, borrowings of
$12 million
are included within Current Debt on the Consolidated Balance Sheet and the remaining borrowings are included within Long-term Debt.
Unsecured Foreign Facilities
The Company guarantees unsecured revolving and term loan bank facilities used by certain of the Company's Greater China subsidiaries to support their operations. The Unsecured Foreign Facilities, which allow borrowings in U.S. dollars and Chinese Yuan, have availability totaling
$100 million
. The interest rates on outstanding borrowings are based upon the applicable benchmark rate for the currency of each borrowing. During
2018
, the Company borrowed
$65 million
and made payments of
$92 million
under the Unsecured Foreign Facilities. The maximum daily amount outstanding at any point in time in 2018 was
$90 million
. Borrowings on the Unsecured Foreign Facilities mature between March 2019 and December 2019. As of
February 2, 2019
, borrowings of
$60 million
are included within Current Debt on the Consolidated Balance Sheet.
74
14. Derivative Financial Instruments
Foreign Exchange Derivative Instruments
The earnings of the Company's wholly owned foreign businesses are subject to exchange rate risk as substantially all their merchandise is sourced through U.S. dollar transactions. The Company uses foreign currency forward contracts designated as cash flow hedges to mitigate this foreign currency exposure for its Canadian and U.K. businesses. These forward contracts currently have a maximum term of
18
months. Amounts are reclassified from accumulated other comprehensive income upon sale of the hedged merchandise to the customer. These gains and losses are recognized in Costs of Goods Sold, Buying and Occupancy in the Consolidated Statements of Income.
The Company had a cross-currency swap related to an intercompany loan of approximately CAD
$170 million
that matured in January 2018 which was designated as a cash flow hedge of foreign currency exchange risk. This cross-currency swap mitigated the exposures to fluctuations in the U.S. dollar-Canadian dollar exchange rate related to the Company's Canadian operations. Changes in the U.S. dollar-Canadian dollar exchange rate and the related swap settlements resulted in reclassification of amounts from accumulated other comprehensive income to earnings to completely offset foreign currency transaction gains and losses recognized on the intercompany loan.
The Company uses foreign currency forward contracts to mitigate the impact of fluctuations in foreign currency exchange rates relative to recognized payable balances denominated in non-functional currencies. The fair value of these non-designated foreign currency forward contracts is not significant as of
February 2, 2019
.
The following table provides the U.S. dollar notional amount of outstanding foreign currency derivative financial instruments as of
February 2, 2019
and
February 3, 2018
:
|
February 2,
2019 |
February 3,
2018 |
||||||
|
(in millions)
|
|||||||
|
Notional Amount
|
$
|
147
|
|
$
|
217
|
|
|
The following table provides a summary of the fair value and balance sheet classification of outstanding derivative financial instruments designated as foreign currency cash flow hedges as of
February 2, 2019
and
February 3, 2018
:
|
February 2,
2019 |
February 3,
2018 |
||||||
|
(in millions)
|
|||||||
|
Other Current Assets
|
$
|
2
|
|
$
|
—
|
|
|
|
Accrued Expenses and Other
|
—
|
|
8
|
|
|||
|
Other Long-term Liabilities
|
—
|
|
1
|
|
|||
The following table provides a summary of the pre-tax financial statement effect of the gains and losses on derivative financial instruments designated as foreign currency cash flow hedges for
2018
and
2017
:
|
2018
|
2017
|
||||||
|
|
(in millions)
|
||||||
|
Gain (Loss) Recognized in Accumulated Other Comprehensive Income
|
$
|
11
|
|
$
|
(21
|
)
|
|
|
(Gain) Loss Reclassified from Accumulated Other Comprehensive Income into Costs of Goods Sold, Buying and Occupancy Expense (a)
|
2
|
|
(1
|
)
|
|||
|
(Gain) Loss Reclassified from Accumulated Other Comprehensive Income into Other Income (Loss) (b)
|
—
|
|
8
|
|
|||
|
(a)
|
Represents reclassification of amounts from accumulated other comprehensive income to earnings when the hedged merchandise is sold to the customer.
No
ineffectiveness was associated with these foreign currency cash flow hedges.
|
|
(b)
|
Represents reclassification of amounts from accumulated other comprehensive income to earnings to completely offset foreign currency transaction gains and losses recognized on the intercompany loan.
|
The Company estimates that
$3 million
of net gains included in accumulated other comprehensive income as of
February 2, 2019
related to foreign currency forward contracts designated as cash flow hedges will be reclassified into earnings within the
75
following 12 months. Actual amounts ultimately reclassified depend on the exchange rates in effect when derivative contracts that are currently outstanding mature.
15. Fair Value Measurements
The following table provides a summary of assets and liabilities measured in the consolidated financial statements at fair value on a recurring basis as of
February 2, 2019
and
February 3, 2018
:
|
Level 1
|
Level 2
|
Level 3
|
Total
|
||||||||||||
|
|
(in millions)
|
||||||||||||||
|
As of February 2, 2019
|
|||||||||||||||
|
Assets:
|
|||||||||||||||
|
Cash and Cash Equivalents
|
$
|
1,413
|
|
$
|
—
|
|
$
|
—
|
|
$
|
1,413
|
|
|||
|
Marketable Equity Securities
|
11
|
|
—
|
|
—
|
|
11
|
|
|||||||
|
Foreign Currency Cash Flow Hedges
|
—
|
|
2
|
|
—
|
|
2
|
|
|||||||
|
As of February 3, 2018
|
|||||||||||||||
|
Assets:
|
|||||||||||||||
|
Cash and Cash Equivalents
|
$
|
1,515
|
|
$
|
—
|
|
$
|
—
|
|
$
|
1,515
|
|
|||
|
Marketable Equity Securities
|
17
|
|
—
|
|
—
|
|
17
|
|
|||||||
|
Liabilities:
|
|
|
|||||||||||||
|
Foreign Currency Cash Flow Hedges
|
—
|
|
9
|
|
—
|
|
9
|
|
|||||||
The Company's Level 1 fair value measurements use unadjusted quoted prices in active markets for identical assets. The Company's marketable equity securities are classified as Level 1 fair value measurements as they are traded with sufficient frequency and volume to enable the Company to obtain pricing information on an ongoing basis.
In January 2016, the FASB issued ASC 321,
Investments - Equity Securities
. The standard requires the recognition of changes in the fair value of the Company's marketable equity securities in net income as compared to historical treatment in accumulated other comprehensive income. The Company adopted the standard in the first quarter of 2018. The Company recognized unrealized losses of
$6 million
in 2018 related to its marketable equity securities in Other Income (Loss) in the 2018 Consolidated Statement of Income.
In 2017, the Company purchased
$10 million
of marketable equity securities which are classified as available-for-sale. The cash payment is included in Purchases of Marketable Equity Securities in the Investing Activities section of the 2017 Consolidated Statement of Cash Flows.
In 2015, the Company purchased
$10 million
in marketable equity securities. In the first quarter of 2016, the Company sold a portion of this investment for
$10 million
and recognized a pre-tax gain of
$4 million
(after-tax gain of
$3 million
). The gain is included in Other Income (Loss) in the 2016 Consolidated Statement of Income, and the cash proceeds are included in Proceeds from Sale of Marketable Equity Securities in the Investing Activities section of the 2016 Consolidated Statement of Cash Flows.
The Company’s Level 2 fair value measurements use market approach valuation techniques. The primary inputs to these techniques include benchmark interest rates and foreign currency exchange rates, as applicable to the underlying instruments.
76
The following table provides a summary of the principal value and estimated fair value of outstanding publicly traded debt as of
February 2, 2019
and
February 3, 2018
:
|
February 2,
2019 |
February 3,
2018 |
||||||
|
|
(in millions)
|
||||||
|
Principal Value
|
$
|
5,722
|
|
$
|
5,750
|
|
|
|
Fair Value (a)
|
5,340
|
|
5,943
|
|
|||
________________
|
(a)
|
The estimated fair value of the Company’s publicly traded debt is based on reported transaction prices which are considered Level 2 inputs in accordance with ASC 820,
Fair Value Measurement
. The estimates presented are not necessarily indicative of the amounts that the Company could realize in a current market exchange.
|
Management believes that the carrying values of accounts receivable, accounts payable, accrued expenses and current debt approximate fair value because of their short maturity.
16. Comprehensive Income
Comprehensive Income includes gains and losses on derivative instruments and foreign currency translation adjustments. The cumulative gains and losses on these items are included in Accumulated Other Comprehensive Income on the Consolidated Balance Sheets and Consolidated Statements of Shareholders' Equity (Deficit).
The following table provides the rollforward of accumulated other comprehensive income for
2018
:
|
Foreign Currency Translation
|
Cash Flow Hedges
|
Marketable Equity Securities
|
Accumulated Other Comprehensive Income
|
||||||||||||
|
(in millions)
|
|||||||||||||||
|
Balance as of February 3, 2018
|
$
|
32
|
|
$
|
(10
|
)
|
$
|
2
|
|
$
|
24
|
|
|||
|
Amount reclassified to Retained Earnings upon adoption of ASC 321
|
—
|
|
—
|
|
(2
|
)
|
(2
|
)
|
|||||||
|
Balance as of February 4, 2018
|
32
|
|
(10
|
)
|
—
|
|
22
|
|
|||||||
|
Other Comprehensive Income (Loss) Before Reclassifications
|
(20
|
)
|
11
|
|
—
|
|
(9
|
)
|
|||||||
|
Amounts Reclassified from Accumulated Other Comprehensive Income
|
45
|
|
2
|
|
—
|
|
47
|
|
|||||||
|
Tax Effect
|
—
|
|
(1
|
)
|
—
|
|
(1
|
)
|
|||||||
|
Current-period Other Comprehensive Income
|
25
|
|
12
|
|
—
|
|
37
|
|
|||||||
|
Balance as of February 2, 2019
|
$
|
57
|
|
$
|
2
|
|
$
|
—
|
|
$
|
59
|
|
|||
As a result of the divestiture of La Senza, the Company reclassified out of accumulated other comprehensive income and into earnings
$45 million
of accumulated foreign-currency translation adjustments related to La Senza. For additional information, see Note
6
, "Restructuring Activities."
The following table provides the rollforward of accumulated other comprehensive income for
2017
:
|
Foreign Currency Translation
|
Cash Flow Hedges
|
Marketable Equity Securities
|
Accumulated Other Comprehensive Income
|
||||||||||||
|
|
(in millions)
|
||||||||||||||
|
Balance as of January 28, 2017
|
$
|
9
|
|
$
|
3
|
|
$
|
—
|
|
$
|
12
|
|
|||
|
Other Comprehensive Income (Loss) Before Reclassifications
|
23
|
|
(21
|
)
|
2
|
|
4
|
|
|||||||
|
Amounts Reclassified from Accumulated Other Comprehensive Income
|
—
|
|
7
|
|
—
|
|
7
|
|
|||||||
|
Tax Effect
|
—
|
|
1
|
|
—
|
|
1
|
|
|||||||
|
Current-period Other Comprehensive Income (Loss)
|
23
|
|
(13
|
)
|
2
|
|
12
|
|
|||||||
|
Balance as of February 3, 2018
|
$
|
32
|
|
$
|
(10
|
)
|
$
|
2
|
|
$
|
24
|
|
|||
77
The following table provides a summary of the reclassification adjustments out of accumulated other comprehensive income related to derivative financial instruments designated as foreign currency cash flow hedges for
2018
and
2017
:
|
Location on Consolidated Statements of Income
|
(Gain) Loss Reclassified from Accumulated Other Comprehensive Income
|
|||||||
|
2018
|
2017
|
|||||||
|
(in millions)
|
||||||||
|
Costs of Goods Sold, Buying and Occupancy
|
$
|
2
|
|
$
|
(1
|
)
|
||
|
Other Income (Loss)
|
—
|
|
8
|
|
||||
|
Provision for Income Taxes
|
—
|
|
—
|
|
||||
|
Net Income
|
$
|
2
|
|
$
|
7
|
|
||
17. Leases
For information regarding the future impacts as a result of the Company's adoption of ASC 842,
Leases,
in the first quarter of 2019, refer to Note 2, "New Accounting Pronouncements."
Operating Leases
The Company is committed to noncancelable leases with remaining terms generally from
one
to
ten
years. A substantial portion of the Company’s leases consist of store leases generally with an initial term of
ten
years. Annual store rent consists of a fixed minimum amount and/or contingent rent based on a percentage of sales exceeding a stipulated amount. Store lease terms generally require additional payments covering certain operating costs such as common area maintenance, utilities, insurance and taxes. These additional payments are excluded from the table below.
The following table provides rent expense for
2018
,
2017
and
2016
:
|
2018
|
2017
|
2016
|
|||||||||
|
|
(in millions)
|
||||||||||
|
Store Rent:
|
|||||||||||
|
Fixed Minimum
|
$
|
663
|
|
$
|
642
|
|
$
|
607
|
|
||
|
Contingent
|
72
|
|
67
|
|
71
|
|
|||||
|
Total Store Rent
|
735
|
|
709
|
|
678
|
|
|||||
|
Office, Equipment and Other
|
98
|
|
94
|
|
87
|
|
|||||
|
Gross Rent Expense
|
833
|
|
803
|
|
765
|
|
|||||
|
Sublease Rental Income
|
(2
|
)
|
(2
|
)
|
(2
|
)
|
|||||
|
Total Rent Expense
|
$
|
831
|
|
$
|
801
|
|
$
|
763
|
|
||
The following table provides the Company’s minimum rent commitments under noncancelable operating leases in the next
five
fiscal years and the remaining years thereafter:
|
Fiscal Year (in millions) (a)
|
|
||
|
2019
|
$
|
698
|
|
|
2020
|
676
|
|
|
|
2021
|
630
|
|
|
|
2022
|
562
|
|
|
|
2023
|
504
|
|
|
|
Thereafter
|
$
|
1,738
|
|
________________
|
(a)
|
Excludes additional payments covering taxes, common area costs and certain other expenses generally required by store lease terms.
|
Capital Leases
The Company leases certain fulfillment equipment under capital leases that expire at various dates through 2023. The Company recorded
$26 million
of capital lease assets, net of accumulated amortization, in Property and Equipment, Net on the
February 2, 2019
Consolidated Balance Sheet. Additionally, the Company recorded capital lease liabilities of
$8 million
and
78
$19 million
in Accrued Expenses and Other and Other Long-term Liabilities, respectively, on the
February 2, 2019
Consolidated Balance Sheet.
Asset Retirement Obligations
The Company has asset retirement obligations related to certain company-owned international stores that contractually obligate the Company to remove leasehold improvements at the end of a lease. The Company’s liability for asset retirement obligations totaled
$18 million
as of
February 2, 2019
and
$9 million
as of
February 3, 2018
. These liabilities are included in Other Long-term Liabilities on the Consolidated Balance Sheets.
18. Commitments and Contingencies
The Company is subject to various claims and contingencies related to lawsuits, taxes, insurance, regulatory and other matters arising out of the normal course of business. Actions filed against the Company from time to time include commercial, tort, intellectual property, customer, employment, data privacy, securities and other claims, including purported class action lawsuits. Management believes that the ultimate liability arising from such claims and contingencies, if any, is not likely to have a material adverse effect on the Company’s results of operations, financial condition or cash flows.
Guarantees
In connection with the sale of La Senza, the Company has remaining guarantees of
$76 million
related to lease payments under the current terms of noncancelable leases expiring at various dates through 2028. These guarantees include minimum rent and additional payments covering taxes, common area costs and certain other expenses and relate to leases that commenced prior to the disposition of the business. The Company recognized an initial liability of
$5 million
representing the estimated fair value of its obligation as guarantor in accordance with ASC 460,
Guarantees.
In connection with the disposition of a certain other business, the Company has remaining guarantees of
$6 million
related to lease payments under the current terms of noncancelable leases expiring at various dates through
2021
. These guarantees include minimum rent and additional payments covering taxes, common area costs and certain other expenses and relate to leases that commenced prior to the disposition of the business. In certain instances, the Company’s guarantee may remain in effect if the term of a lease is extended. The Company has not recorded a liability with respect to these guarantee obligations as of
February 2, 2019
or
February 3, 2018
as it concluded that payments under these guarantees were not probable.
In connection with noncancelable operating leases of certain assets, the Company provided residual value guarantees to the lessor if the leased assets cannot be sold for an amount in excess of a specified minimum value at the conclusion of the lease term. The leases expire at various dates through 2021, and the total amount of the guarantees is
$94 million
. The Company recorded a liability of
$11 million
and
$3 million
related to these guarantee obligations as of
February 2, 2019
and
February 3, 2018
, respectively, which are included in Other Long-term Liabilities on the Consolidated Balance Sheets.
19. Retirement Benefits
The Company sponsors a tax-qualified defined contribution retirement plan and a non-qualified supplemental retirement plan for substantially all of its associates within the U.S. Participation in the tax-qualified plan is available to associates who meet certain age and service requirements. Participation in the non-qualified plan is available to associates who meet certain age, service, job level and compensation requirements.
The qualified plan permits participating associates to elect contributions up to the maximum limits allowable under the Internal Revenue Code. The Company matches associate contributions according to a predetermined formula and contributes additional amounts based on a percentage of the associates’ eligible annual compensation and years of service. Associate contributions and Company matching contributions vest immediately. Additional Company contributions and the related investment earnings are subject to vesting based on years of service. Total expense recognized related to the qualified plan was
$76 million
for
2018
,
$68 million
for
2017
and
$67 million
for
2016
.
The non-qualified plan is an unfunded plan which provides benefits beyond the Internal Revenue Code limits for qualified defined contribution plans. The plan permits participating associates to elect contributions up to a maximum percentage of eligible compensation. The Company matches associate contributions according to a predetermined formula and contributes additional amounts based on a percentage of the associates’ eligible compensation and years of service. The plan also permits participating associates to defer additional compensation up to a maximum amount which the Company does not match. Associates’ accounts are credited with interest using a fixed rate determined by the Company and reviewed by the Compensation Committee of the Board of Directors, prior to the beginning of each year. Associate contributions and the related interest vest immediately. Company contributions, along with related interest, are subject to vesting based on years of service. Associates may elect in-service distributions for the unmatched additional deferred compensation component only. The
79
remaining vested portion of associates’ accounts in the plan will be distributed upon termination of employment in either a lump sum or in annual installments over a specified period of up to
10
years.
The following table provides the Company’s annual activity for this plan and year-end liability, included in Other Long-term Liabilities on the Consolidated Balance Sheets, as of
February 2, 2019
and
February 3, 2018
:
|
February 2,
2019 |
February 3,
2018 |
||||||
|
(in millions)
|
|||||||
|
Balance at Beginning of Year
|
$
|
269
|
|
$
|
258
|
|
|
|
Contributions:
|
|||||||
|
Associate
|
10
|
|
9
|
|
|||
|
Company
|
11
|
|
9
|
|
|||
|
Interest
|
13
|
|
11
|
|
|||
|
Distributions
|
(25
|
)
|
(18
|
)
|
|||
|
Balance at End of Year
|
$
|
278
|
|
$
|
269
|
|
|
Total expense recognized related to the non-qualified plan was
$24 million
for
2018
,
$20 million
for
2017
and
$26 million
for
2016
.
20. Shareholders’ Equity (Deficit)
Common Stock Share Repurchases
Under the authority of the Company’s Board of Directors, the Company repurchased shares of its common stock under the following repurchase programs for fiscal
2018
,
2017
and
2016
:
|
|
Shares Repurchased
|
Amount Repurchased
|
Average Stock
Price of
Shares
Repurchased
within
Program
|
||||||||||||||||||||||||||
|
Repurchase Program
|
Amount Authorized
|
2018
|
2017
|
2016
|
2018
|
2017
|
2016
|
||||||||||||||||||||||
|
|
(in millions)
|
(in thousands)
|
(in millions)
|
|
|||||||||||||||||||||||||
|
March 2018
|
$
|
250
|
|
4,852
|
|
NA
|
|
NA
|
|
$
|
171
|
|
NA
|
|
NA
|
|
$
|
35.29
|
|
||||||||||
|
September 2017
|
250
|
|
527
|
|
3,858
|
|
NA
|
|
25
|
|
$
|
202
|
|
NA
|
|
$
|
51.72
|
|
|||||||||||
|
February 2017
|
250
|
|
NA
|
|
5,500
|
|
NA
|
|
NA
|
|
240
|
|
NA
|
|
$
|
43.57
|
|
||||||||||||
|
February 2016
|
500
|
|
NA
|
|
51
|
|
5,719
|
|
NA
|
|
3
|
|
$
|
438
|
|
$
|
76.47
|
|
|||||||||||
|
Total
|
5,379
|
|
9,409
|
|
5,719
|
|
$
|
196
|
|
$
|
445
|
|
$
|
438
|
|
||||||||||||||
In March 2018, the Company's Board of Directors approved a new
$250 million
share repurchase program, which included the
$23 million
remaining under the September 2017 repurchase program.
In September 2017, the Company's Board of Directors approved a
$250 million
share repurchase program, which included the
$10 million
remaining under the February 2017 repurchase program.
In February 2017, the Company's Board of Directors approved a
$250 million
share repurchase program, which included the
$59 million
remaining under the February 2016 repurchase program.
In February 2016, the Company's Board of Directors approved a
$500 million
share repurchase program, which included the
$17 million
remaining under the June 2015 repurchase program.
The March 2018 repurchase program had
$79 million
remaining as of
February 2, 2019
.
There were
$2 million
of share repurchases reflected in Accounts Payable on the
February 3, 2018
Consolidated Balance Sheet.
Treasury Stock Retirement
In November 2017, the Company retired
36 million
shares of its treasury stock. The retirement resulted in a reduction of
$2.036 billion
in Treasury Stock,
$18 million
in the par value of Common Stock,
$82 million
in Paid-in Capital and
$1.936 billion
in Retained Earnings.
80
Dividends
Under the authority and declaration of the Board of Directors, the Company paid the following dividends during fiscal
2018
,
2017
and
2016
:
|
Ordinary Dividends
|
Special Dividends
|
Total Dividends
|
Total Paid
|
||||||||||||
|
(per share)
|
(in millions)
|
||||||||||||||
|
2018
|
|||||||||||||||
|
Fourth Quarter
|
$
|
0.60
|
|
$
|
—
|
|
$
|
0.60
|
|
$
|
166
|
|
|||
|
Third Quarter
|
0.60
|
|
—
|
|
0.60
|
|
165
|
|
|||||||
|
Second Quarter
|
0.60
|
|
—
|
|
0.60
|
|
167
|
|
|||||||
|
First Quarter
|
0.60
|
|
—
|
|
0.60
|
|
168
|
|
|||||||
|
2018 Total
|
$
|
2.40
|
|
$
|
—
|
|
$
|
2.40
|
|
$
|
666
|
|
|||
|
2017
|
|||||||||||||||
|
Fourth Quarter
|
$
|
0.60
|
|
$
|
—
|
|
$
|
0.60
|
|
$
|
170
|
|
|||
|
Third Quarter
|
0.60
|
|
—
|
|
0.60
|
|
172
|
|
|||||||
|
Second Quarter
|
0.60
|
|
—
|
|
0.60
|
|
172
|
|
|||||||
|
First Quarter
|
0.60
|
|
—
|
|
0.60
|
|
172
|
|
|||||||
|
2017 Total
|
$
|
2.40
|
|
$
|
—
|
|
$
|
2.40
|
|
$
|
686
|
|
|||
|
2016
|
|||||||||||||||
|
Fourth Quarter
|
$
|
0.60
|
|
$
|
—
|
|
$
|
0.60
|
|
$
|
172
|
|
|||
|
Third Quarter
|
0.60
|
|
—
|
|
0.60
|
|
173
|
|
|||||||
|
Second Quarter
|
0.60
|
|
—
|
|
0.60
|
|
173
|
|
|||||||
|
First Quarter
|
0.60
|
|
2.00
|
|
2.60
|
|
750
|
|
|||||||
|
2016 Total
|
$
|
2.40
|
|
$
|
2.00
|
|
$
|
4.40
|
|
$
|
1,268
|
|
|||
Subsequent to
February 2, 2019
, the Company's Board of Directors declared the first quarter of
2019
ordinary dividend of
$0.30
per share.
21. Share-based Compensation
Plan Summary
In 2015, the Company's shareholders approved the 2015 Stock Option and Performance Incentive Plan ("2015 Plan"). The 2015 Plan provides for the grant of incentive stock options, non-qualified stock options, stock appreciation rights, restricted stock, performance-based restricted stock, performance units and unrestricted shares. The Company grants stock options at a price equal to the fair market value of the stock on the date of grant. Stock options have a maximum term of
10
years. Stock options generally vest ratably over
three
to
five
years. Restricted stock generally vests (the restrictions lapse) at the end of a
three
-year period or on a graded basis over a
five
-year period.
Under the Company’s plans,
160 million
options, restricted and unrestricted shares have been authorized to be granted to employees and directors. There were
9 million
options and shares available for grant as of
February 2, 2019
.
From time to time the Company's Board of Directors will declare special dividends. In accordance with the anti-dilutive provisions of the stock plan, in these circumstances the Company adjusts both the exercise price and the number of share-based awards outstanding as of the record date of the special dividends. The aggregate fair value, the aggregate intrinsic value and the ratio of the exercise price to the market price are approximately equal immediately before and after the adjustments. Therefore, no compensation expense is recognized.
81
Stock Options
The following table provides the Company’s stock option activity for the fiscal year ended
February 2, 2019
:
|
Number of
Shares
|
Weighted
Average
Option
Price Per
Share
|
Weighted
Average
Remaining
Contractual
Life
|
Aggregate
Intrinsic
Value
|
|||||||||
|
|
(in thousands)
|
|
(in years)
|
(in thousands)
|
||||||||
|
Outstanding as of February 3, 2018
|
4,472
|
|
$
|
57.03
|
|
|||||||
|
Granted
|
1,438
|
|
39.06
|
|
||||||||
|
Exercised
|
(84
|
)
|
14.52
|
|
||||||||
|
Cancelled
|
(534
|
)
|
53.72
|
|
||||||||
|
Outstanding as of February 2, 2019
|
5,292
|
|
$
|
53.14
|
|
6.48
|
$
|
3,384
|
|
|||
|
Vested and Expected to Vest as of February 2, 2019 (a)
|
5,124
|
|
53.44
|
|
6.40
|
3,384
|
|
|||||
|
Options Exercisable as of February 2, 2019
|
2,759
|
|
55.11
|
|
4.76
|
3,384
|
|
|||||
________________
|
(a)
|
The number of options expected to vest includes an estimate of expected forfeitures.
|
Intrinsic value for stock options is the difference between the current market value of the Company’s stock and the option strike price. The total intrinsic value of options exercised was
$2 million
for
2018
,
$44 million
for
2017
and
$30 million
for
2016
.
The total fair value at grant date of option awards vested was
$9 million
for
2018
and
$10 million
for
2017
and
2016
.
The Company’s total unrecognized compensation cost, net of estimated forfeitures, related to nonvested options was
$13 million
as of
February 2, 2019
. This cost is expected to be recognized over a weighted-average period of
2.3
years.
The weighted-average estimated fair value of stock options granted was
$6.76
per share for
2018
,
$5.96
per share for
2017
and
$11.72
per share for
2016
.
Cash received from stock options exercised was
$1 million
for
2018
,
$38 million
for
2017
and
$20 million
for
2016
. Tax benefits realized from tax deductions associated with stock options exercised were less than
$1 million
for
2018
,
$16 million
for
2017
and
$9 million
for
2016
.
The Company uses the Black-Scholes option-pricing model for valuation of options granted to employees and directors. The Company’s determination of the fair value of options is affected by the Company’s stock price as well as assumptions regarding a number of highly complex and subjective variables. These variables include, but are not limited to, the Company’s expected stock price volatility over the term of the awards and projected employee stock option exercise behaviors.
The following table contains the weighted-average assumptions used during
2018
,
2017
and
2016
:
|
2018
|
2017
|
2016
|
||||||
|
Expected Volatility
|
36
|
%
|
28
|
%
|
25
|
%
|
||
|
Risk-free Interest Rate
|
2.5
|
%
|
1.5
|
%
|
1.1
|
%
|
||
|
Dividend Yield
|
5.8
|
%
|
5.1
|
%
|
3.3
|
%
|
||
|
Expected Life (in years)
|
2.9
|
|
3.0
|
|
4.1
|
|
||
The majority of the Company’s stock-based compensation awards are granted on an annual basis in the first quarter of each year. The expected volatility assumption is based on the Company’s analysis of historical volatility. The risk-free interest rate assumption is based upon the average daily closing rates during the period for U.S. treasury notes that have a life which approximates the expected life of the option. The dividend yield assumption is based on the Company’s history and expectation of dividend payouts in relation to the stock price at the grant date. The expected life of employee stock options represents the weighted-average period the stock options are expected to remain outstanding.
82
Restricted Stock
The following table provides the Company’s restricted stock activity for the fiscal year ended
February 2, 2019
:
|
Number of
Shares
|
Weighted
Average
Grant Date
Fair Value
|
|||||
|
|
(in thousands)
|
|
||||
|
Unvested as of February 3, 2018
|
5,699
|
|
$
|
57.97
|
|
|
|
Granted
|
2,938
|
|
30.43
|
|
||
|
Vested
|
(1,255
|
)
|
68.38
|
|
||
|
Cancelled
|
(693
|
)
|
44.61
|
|
||
|
Unvested as of February 2, 2019
|
6,689
|
|
$
|
45.29
|
|
|
The Company’s total intrinsic value of restricted stock vested was
$44 million
for
2018
,
$86 million
for
2017
and
$140 million
for
2016
.
The Company’s total fair value at grant date of awards vested was
$86 million
for
2018
,
$87 million
for
2017
and
$68 million
for
2016
. Fair value of restricted stock awards is based on the market value of an unrestricted share on the grant date adjusted for anticipated dividend yields.
As of
February 2, 2019
, there was
$108 million
of total unrecognized compensation cost, net of estimated forfeitures, related to unvested restricted stock. That cost is expected to be recognized over a weighted-average period of
2.3
years.
The weighted-average estimated fair value of restricted stock granted was
$30.43
per share for
2018
,
$39.21
per share for
2017
and
$75.09
per share for
2016
.
Tax benefits realized from tax deductions associated with restricted stock vested were
$10 million
for
2018
,
$32 million
for
2017
and
$61 million
for
2016
.
Income Statement Impact
The following table provides share-based compensation expense included in the Consolidated Statements of Income for
2018
,
2017
and
2016
:
|
2018
|
2017
|
2016
|
|||||||||
|
|
(in millions)
|
||||||||||
|
Costs of Goods Sold, Buying and Occupancy
|
$
|
29
|
|
$
|
32
|
|
$
|
31
|
|
||
|
General, Administrative and Store Operating Expenses
|
68
|
|
70
|
|
65
|
|
|||||
|
Total Share-based Compensation Expense
|
$
|
97
|
|
$
|
102
|
|
$
|
96
|
|
||
Share-based compensation expense is based on awards that are ultimately expected to vest. The Company estimates forfeitures at the time of grant and adjusts, if necessary, in subsequent periods based on historical experience and expected future termination rates.
The tax benefit associated with recognized share-based compensation expense was
$20 million
for
2018
,
$23 million
for
2017
and
$32 million
for
2016
.
22. Segment Information
The Company has
three
reportable segments: Victoria’s Secret, Bath & Body Works and Victoria's Secret and Bath & Body Works International.
The Victoria’s Secret segment sells women’s intimate and other apparel, personal care and beauty products under the Victoria’s Secret and PINK brand names. Victoria’s Secret merchandise is sold online and through retail stores located in the U.S. and Canada.
The Bath & Body Works segment sells body care, home fragrance products, soaps and sanitizers under the Bath & Body Works, White Barn, C.O. Bigelow and other brand names. Bath & Body Works merchandise is sold online and at retail stores located in the U.S. and Canada.
83
The Victoria's Secret and Bath & Body Works International segment includes the Victoria's Secret and Bath & Body Works company-owned and partner-operated stores located outside of the U.S. and Canada, as well as the online business in Greater China. This segment includes the following:
|
•
|
Victoria's Secret International, comprised of company-owned stores in the U.K., Ireland and Greater China, as well as stores operated by partners under franchise and license arrangements;
|
|
•
|
Victoria's Secret Beauty and Accessories, comprised of company-owned stores in Greater China, as well as stores operated by partners under franchise, license and wholesale arrangements, which feature Victoria's Secret branded beauty and accessories products in travel retail and other locations; and
|
|
•
|
Bath & Body Works International stores operated by partners under franchise, license and wholesale arrangements.
|
Other consists of the following:
|
•
|
Mast Global, a merchandise sourcing and production function serving the Company and its international partners;
|
|
•
|
La Senza, which sold women's intimate apparel online and through company-owned stores located in Canada and the U.S., as well as stores operated by partners under franchise and license arrangements;
|
|
•
|
Henri Bendel, which sold handbags, jewelry and other accessory products online and through company-owned stores; and
|
|
•
|
Corporate functions including non-core real estate, equity investments and other governance functions such as treasury and tax.
|
In January 2019, the Company completed the sale of the La Senza business and closed all of its Henri Bendel stores and the website. For additional information, see Note
6
, "Restructuring Activities."
The following table provides the Company’s segment information as of and for the fiscal years ended
February 2, 2019
,
February 3, 2018
and
January 28, 2017
:
|
Victoria’s
Secret
|
Bath & Body
Works
|
Victoria’s Secret
and
Bath &
Body Works
International
|
Other
|
Total
|
|||||||||||||||
|
|
(in millions)
|
||||||||||||||||||
|
February 2, 2019
|
|||||||||||||||||||
|
Net Sales
|
$
|
7,375
|
|
$
|
4,631
|
|
$
|
605
|
|
$
|
626
|
|
$
|
13,237
|
|
||||
|
Depreciation and Amortization
|
280
|
|
121
|
|
43
|
|
103
|
|
547
|
|
|||||||||
|
Operating Income (Loss) (a)
|
462
|
|
1,077
|
|
(37
|
)
|
(265
|
)
|
1,237
|
|
|||||||||
|
Total Assets (b)
|
3,129
|
|
1,898
|
|
842
|
|
2,221
|
|
8,090
|
|
|||||||||
|
Capital Expenditures
|
150
|
|
242
|
|
97
|
|
140
|
|
629
|
|
|||||||||
|
February 3, 2018
|
|||||||||||||||||||
|
Net Sales
|
$
|
7,387
|
|
$
|
4,148
|
|
$
|
502
|
|
$
|
595
|
|
$
|
12,632
|
|
||||
|
Depreciation and Amortization
|
279
|
|
101
|
|
30
|
|
114
|
|
524
|
|
|||||||||
|
Operating Income (Loss)
|
932
|
|
953
|
|
5
|
|
(162
|
)
|
1,728
|
|
|||||||||
|
Total Assets (b)
|
3,369
|
|
1,753
|
|
800
|
|
2,227
|
|
8,149
|
|
|||||||||
|
Capital Expenditures
|
270
|
|
232
|
|
111
|
|
94
|
|
707
|
|
|||||||||
|
January 28, 2017
|
|||||||||||||||||||
|
Net Sales
|
$
|
7,781
|
|
$
|
3,852
|
|
$
|
423
|
|
$
|
518
|
|
$
|
12,574
|
|
||||
|
Depreciation and Amortization
|
252
|
|
91
|
|
17
|
|
112
|
|
472
|
|
|||||||||
|
Operating Income (Loss)
|
1,173
|
|
907
|
|
40
|
|
(117
|
)
|
2,003
|
|
|||||||||
|
Total Assets (b)
|
3,285
|
|
1,632
|
|
593
|
|
2,660
|
|
8,170
|
|
|||||||||
|
Capital Expenditures
|
460
|
|
250
|
|
68
|
|
212
|
|
990
|
|
|||||||||
________________
|
(a)
|
Victoria's Secret and Victoria's Secret and Bath & Body Works International includes long-lived store asset impairment charges of
$70 million
and
$31 million
, respectively, and Other includes a loss on sale of La Senza of
$99 million
and Henri Bendel closures costs of
$23 million
. For additional information see Note 6, “Restructuring Activities" and Note 8, “Property and Equipment, Net."
|
|
(b)
|
Assets are allocated to the operating segments based on decision making authority relevant to the applicable assets.
|
The Company’s international net sales include sales from company-owned stores, royalty revenue from franchise and license arrangements, wholesale revenues and direct sales shipped internationally. Certain of these sales are subject to the impact of
84
fluctuations in foreign currency. The Company's international net sales across all segments totaled
$1.683 billion
in
2018
,
$1.553 billion
in
2017
and
$1.408 billion
in
2016
. The Company’s internationally based long-lived assets were
$454 million
as of
February 2, 2019
and
$451 million
as of
February 3, 2018
.
23. Quarterly Financial Data (Unaudited)
The following table provides summarized quarterly financial data for
2018
:
|
|
Fiscal Quarter Ended
|
||||||||||||||
|
|
May 5,
2018
|
August 4,
2018
|
November 3,
2018 (a)(b)
|
February 2,
2019 (c)
|
|||||||||||
|
|
(in millions except per share data)
|
||||||||||||||
|
Net Sales
|
$
|
2,626
|
|
$
|
2,984
|
|
$
|
2,775
|
|
$
|
4,852
|
|
|||
|
Gross Profit
|
944
|
|
1,059
|
|
928
|
|
1,968
|
|
|||||||
|
Operating Income
|
155
|
|
228
|
|
54
|
|
800
|
|
|||||||
|
Income (Loss) Before Income Taxes
|
59
|
|
129
|
|
(41
|
)
|
710
|
|
|||||||
|
Net Income (Loss)
|
48
|
|
99
|
|
(43
|
)
|
540
|
|
|||||||
|
Net Income (Loss) Per Basic Share (d)
|
$
|
0.17
|
|
$
|
0.36
|
|
$
|
(0.16
|
)
|
$
|
1.96
|
|
|||
|
Net Income (Loss) Per Diluted Share (d)
|
$
|
0.17
|
|
$
|
0.36
|
|
$
|
(0.16
|
)
|
$
|
1.94
|
|
|||
________________
|
(a)
|
Gross profit includes the effect of an
$81 million
charge (
$73 million
after-tax) related to the impairment of certain Victoria's Secret store assets.
|
|
(b)
|
Operating income includes the effect of
$20 million
(
$15 million
after-tax) of Henri Bendel closure costs.
|
|
(c)
|
Operating income includes the effect of a pre-tax loss of
$99 million
(
$55 million
after-tax) related to the divestiture of La Senza.
|
|
(d)
|
Due to changes in stock prices during the year and timing of issuances and repurchases of shares, the cumulative total of quarterly net income per share amounts may not equal the net income per share for the year.
|
The following table provides summarized quarterly financial data for
2017
:
|
|
Fiscal Quarter Ended
|
||||||||||||||
|
|
April 29,
2017 |
July 29,
2017 |
October 28,
2017 |
February 3,
2018 (a)(b)(c) |
|||||||||||
|
|
(in millions except per share data)
|
||||||||||||||
|
Net Sales
|
$
|
2,437
|
|
$
|
2,755
|
|
$
|
2,618
|
|
$
|
4,823
|
|
|||
|
Gross Profit
|
903
|
|
1,028
|
|
989
|
|
2,040
|
|
|||||||
|
Operating Income
|
209
|
|
301
|
|
232
|
|
987
|
|
|||||||
|
Income Before Income Taxes
|
118
|
|
217
|
|
135
|
|
842
|
|
|||||||
|
Net Income
|
94
|
|
139
|
|
86
|
|
664
|
|
|||||||
|
Net Income Per Basic Share (d)
|
$
|
0.33
|
|
$
|
0.48
|
|
$
|
0.30
|
|
$
|
2.36
|
|
|||
|
Net Income Per Diluted Share (d)
|
$
|
0.33
|
|
$
|
0.48
|
|
$
|
0.30
|
|
$
|
2.33
|
|
|||
________________
|
(a)
|
Net income includes the effect of a pre-tax loss of
$45 million
(
$29 million
after-tax) associated with the early extinguishment of the 2019 Notes.
|
|
(b)
|
Includes the effect of a
$92 million
tax benefit related to changes in U.S. tax legislation.
|
|
(c)
|
The Company utilizes the retail calendar for reporting. As such, the results for fiscal 2017 represent the 53-week period ended February 3, 2018 and the fourth quarter consists of a 14-week period.
|
|
(d)
|
Due to changes in stock prices during the year and timing of issuances and repurchases of shares, the cumulative total of quarterly net income per share amounts may not equal the net income per share for the year.
|
24. Supplemental Guarantor Financial Information
The Company’s 2020 Notes, 2021 Notes, 2022 Notes, 2023 Notes, 2027 Notes, 2028 Notes, 2035 Notes, 2036 Notes, Secured Revolving Facility and Secured Foreign Facilities are jointly and severally guaranteed on a full and unconditional basis by the Guarantors. The Company is a holding company, and its most significant assets are the stock of its subsidiaries. The Guarantors represent: (a) substantially all of the sales of the Company’s domestic subsidiaries, (b) more than
90%
of the assets owned by the Company’s domestic subsidiaries, other than real property, certain other assets and intercompany investments and balances, and (c) more than
95%
of the accounts receivable and inventory directly owned by the Company’s domestic subsidiaries.
85
The following supplemental financial information sets forth for the Company and its guarantor and non-guarantor subsidiaries: the Condensed Consolidating Balance Sheets as of
February 2, 2019
and
February 3, 2018
and the Condensed Consolidating Statements of Income, Comprehensive Income and Cash Flows for the years ended
February 2, 2019
,
February 3, 2018
and
January 28, 2017
.
L BRANDS, INC.
CONDENSED CONSOLIDATING BALANCE SHEET
(in millions)
|
|
February 2, 2019
|
||||||||||||||||||
|
|
L Brands, Inc.
|
Guarantor
Subsidiaries
|
Non-guarantor
Subsidiaries
|
Eliminations
|
Consolidated
L Brands, Inc.
|
||||||||||||||
|
ASSETS
|
|||||||||||||||||||
|
Current Assets:
|
|||||||||||||||||||
|
Cash and Cash Equivalents
|
$
|
—
|
|
$
|
997
|
|
$
|
416
|
|
$
|
—
|
|
$
|
1,413
|
|
||||
|
Accounts Receivable, Net
|
—
|
|
241
|
|
126
|
|
—
|
|
367
|
|
|||||||||
|
Inventories
|
—
|
|
1,093
|
|
155
|
|
—
|
|
1,248
|
|
|||||||||
|
Other
|
—
|
|
139
|
|
93
|
|
—
|
|
232
|
|
|||||||||
|
Total Current Assets
|
—
|
|
2,470
|
|
790
|
|
—
|
|
3,260
|
|
|||||||||
|
Property and Equipment, Net
|
—
|
|
1,922
|
|
896
|
|
—
|
|
2,818
|
|
|||||||||
|
Goodwill
|
—
|
|
1,318
|
|
30
|
|
—
|
|
1,348
|
|
|||||||||
|
Trade Names
|
—
|
|
411
|
|
—
|
|
—
|
|
411
|
|
|||||||||
|
Net Investments in and Advances to/from Consolidated Affiliates
|
4,755
|
|
19,737
|
|
2,047
|
|
(26,539
|
)
|
—
|
|
|||||||||
|
Deferred Income Taxes
|
—
|
|
9
|
|
53
|
|
—
|
|
62
|
|
|||||||||
|
Other Assets
|
127
|
|
15
|
|
670
|
|
(621
|
)
|
191
|
|
|||||||||
|
Total Assets
|
$
|
4,882
|
|
$
|
25,882
|
|
$
|
4,486
|
|
$
|
(27,160
|
)
|
$
|
8,090
|
|
||||
|
LIABILITIES AND EQUITY (DEFICIT)
|
|||||||||||||||||||
|
Current Liabilities:
|
|||||||||||||||||||
|
Accounts Payable
|
$
|
—
|
|
$
|
363
|
|
$
|
348
|
|
$
|
—
|
|
$
|
711
|
|
||||
|
Accrued Expenses and Other
|
92
|
|
597
|
|
393
|
|
—
|
|
1,082
|
|
|||||||||
|
Current Debt
|
—
|
|
—
|
|
72
|
|
—
|
|
72
|
|
|||||||||
|
Income Taxes
|
(7
|
)
|
100
|
|
28
|
|
—
|
|
121
|
|
|||||||||
|
Total Current Liabilities
|
85
|
|
1,060
|
|
841
|
|
—
|
|
1,986
|
|
|||||||||
|
Deferred Income Taxes
|
1
|
|
(44
|
)
|
269
|
|
—
|
|
226
|
|
|||||||||
|
Long-term Debt
|
5,661
|
|
606
|
|
79
|
|
(607
|
)
|
5,739
|
|
|||||||||
|
Other Long-term Liabilities
|
59
|
|
852
|
|
107
|
|
(14
|
)
|
1,004
|
|
|||||||||
|
Total Equity (Deficit)
|
(924
|
)
|
23,408
|
|
3,190
|
|
(26,539
|
)
|
(865
|
)
|
|||||||||
|
Total Liabilities and Equity (Deficit)
|
$
|
4,882
|
|
$
|
25,882
|
|
$
|
4,486
|
|
$
|
(27,160
|
)
|
$
|
8,090
|
|
||||
86
L BRANDS, INC.
CONDENSED CONSOLIDATING BALANCE SHEET
(in millions)
|
|
February 3, 2018
|
||||||||||||||||||
|
|
L Brands, Inc.
|
Guarantor
Subsidiaries
|
Non-guarantor
Subsidiaries
|
Eliminations
|
Consolidated
L Brands, Inc.
|
||||||||||||||
|
ASSETS
|
|||||||||||||||||||
|
Current Assets:
|
|||||||||||||||||||
|
Cash and Cash Equivalents
|
$
|
—
|
|
$
|
1,164
|
|
$
|
351
|
|
$
|
—
|
|
$
|
1,515
|
|
||||
|
Accounts Receivable, Net
|
—
|
|
186
|
|
124
|
|
—
|
|
310
|
|
|||||||||
|
Inventories
|
—
|
|
1,095
|
|
145
|
|
—
|
|
1,240
|
|
|||||||||
|
Other
|
—
|
|
132
|
|
96
|
|
—
|
|
228
|
|
|||||||||
|
Total Current Assets
|
—
|
|
2,577
|
|
716
|
|
—
|
|
3,293
|
|
|||||||||
|
Property and Equipment, Net
|
—
|
|
1,984
|
|
909
|
|
—
|
|
2,893
|
|
|||||||||
|
Goodwill
|
—
|
|
1,318
|
|
30
|
|
—
|
|
1,348
|
|
|||||||||
|
Trade Names
|
—
|
|
411
|
|
—
|
|
—
|
|
411
|
|
|||||||||
|
Net Investments in and Advances to/from Consolidated Affiliates
|
4,973
|
|
18,298
|
|
2,106
|
|
(25,377
|
)
|
—
|
|
|||||||||
|
Deferred Income Taxes
|
—
|
|
10
|
|
4
|
|
—
|
|
14
|
|
|||||||||
|
Other Assets
|
129
|
|
18
|
|
654
|
|
(611
|
)
|
190
|
|
|||||||||
|
Total Assets
|
$
|
5,102
|
|
$
|
24,616
|
|
$
|
4,419
|
|
$
|
(25,988
|
)
|
$
|
8,149
|
|
||||
|
LIABILITIES AND EQUITY (DEFICIT)
|
|||||||||||||||||||
|
Current Liabilities:
|
|||||||||||||||||||
|
Accounts Payable
|
$
|
2
|
|
$
|
349
|
|
$
|
366
|
|
$
|
—
|
|
$
|
717
|
|
||||
|
Accrued Expenses and Other
|
101
|
|
529
|
|
399
|
|
—
|
|
1,029
|
|
|||||||||
|
Current Debt
|
—
|
|
—
|
|
87
|
|
—
|
|
87
|
|
|||||||||
|
Income Taxes
|
6
|
|
174
|
|
18
|
|
—
|
|
198
|
|
|||||||||
|
Total Current Liabilities
|
109
|
|
1,052
|
|
870
|
|
—
|
|
2,031
|
|
|||||||||
|
Deferred Income Taxes
|
(2
|
)
|
(46
|
)
|
286
|
|
—
|
|
238
|
|
|||||||||
|
Long-term Debt
|
5,706
|
|
597
|
|
1
|
|
(597
|
)
|
5,707
|
|
|||||||||
|
Other Long-term Liabilities
|
64
|
|
774
|
|
100
|
|
(14
|
)
|
924
|
|
|||||||||
|
Total Equity (Deficit)
|
(775
|
)
|
22,239
|
|
3,162
|
|
(25,377
|
)
|
(751
|
)
|
|||||||||
|
Total Liabilities and Equity (Deficit)
|
$
|
5,102
|
|
$
|
24,616
|
|
$
|
4,419
|
|
$
|
(25,988
|
)
|
$
|
8,149
|
|
||||
87
L BRANDS, INC.
CONDENSED CONSOLIDATING STATEMENT OF INCOME
(in millions)
|
|
2018
|
||||||||||||||||||
|
|
L Brands, Inc.
|
Guarantor
Subsidiaries
|
Non-guarantor
Subsidiaries
|
Eliminations
|
Consolidated
L Brands, Inc.
|
||||||||||||||
|
Net Sales
|
$
|
—
|
|
$
|
12,467
|
|
$
|
3,780
|
|
$
|
(3,010
|
)
|
$
|
13,237
|
|
||||
|
Costs of Goods Sold, Buying and Occupancy
|
—
|
|
(8,015
|
)
|
(2,996
|
)
|
2,673
|
|
(8,338
|
)
|
|||||||||
|
Gross Profit
|
—
|
|
4,452
|
|
784
|
|
(337
|
)
|
4,899
|
|
|||||||||
|
General, Administrative and Store Operating Expenses
|
(9
|
)
|
(3,304
|
)
|
(482
|
)
|
232
|
|
(3,563
|
)
|
|||||||||
|
Loss on Divestiture of La Senza
|
—
|
|
(24
|
)
|
(75
|
)
|
—
|
|
(99
|
)
|
|||||||||
|
Operating Income (Loss)
|
(9
|
)
|
1,124
|
|
227
|
|
(105
|
)
|
1,237
|
|
|||||||||
|
Interest Expense
|
(379
|
)
|
(108
|
)
|
(6
|
)
|
108
|
|
(385
|
)
|
|||||||||
|
Other Income (Loss)
|
—
|
|
13
|
|
(8
|
)
|
—
|
|
5
|
|
|||||||||
|
Income (Loss) Before Income Taxes
|
(388
|
)
|
1,029
|
|
213
|
|
3
|
|
857
|
|
|||||||||
|
Provision (Benefit) for Income Taxes
|
12
|
|
100
|
|
101
|
|
—
|
|
213
|
|
|||||||||
|
Equity in Earnings, Net of Tax
|
1,044
|
|
169
|
|
353
|
|
(1,566
|
)
|
—
|
|
|||||||||
|
Net Income (Loss)
|
$
|
644
|
|
$
|
1,098
|
|
$
|
465
|
|
$
|
(1,563
|
)
|
$
|
644
|
|
||||
L BRANDS, INC.
CONDENSED CONSOLIDATING STATEMENT OF COMPREHENSIVE INCOME
(in millions)
|
|
2018
|
||||||||||||||||||
|
|
L Brands, Inc.
|
Guarantor
Subsidiaries
|
Non-guarantor
Subsidiaries
|
Eliminations
|
Consolidated
L Brands, Inc. |
||||||||||||||
|
Net Income (Loss)
|
$
|
644
|
|
$
|
1,098
|
|
$
|
465
|
|
$
|
(1,563
|
)
|
$
|
644
|
|
||||
|
Other Comprehensive Income (Loss), Net of Tax:
|
|||||||||||||||||||
|
Foreign Currency Translation
|
—
|
|
—
|
|
(20
|
)
|
—
|
|
(20
|
)
|
|||||||||
|
Reclassification of Foreign Currency Translation to Earnings
|
—
|
|
—
|
|
45
|
|
—
|
|
45
|
|
|||||||||
|
Unrealized Gain (Loss) on Cash Flow Hedges
|
—
|
|
—
|
|
10
|
|
—
|
|
10
|
|
|||||||||
|
Reclassification of Cash Flow Hedges to Earnings
|
—
|
|
—
|
|
2
|
|
—
|
|
2
|
|
|||||||||
|
Total Other Comprehensive Income (Loss), Net of Tax
|
—
|
|
—
|
|
37
|
|
—
|
|
37
|
|
|||||||||
|
Total Comprehensive Income (Loss)
|
$
|
644
|
|
$
|
1,098
|
|
$
|
502
|
|
$
|
(1,563
|
)
|
$
|
681
|
|
||||
88
L BRANDS, INC.
CONDENSED CONSOLIDATING STATEMENT OF INCOME
(in millions)
|
|
2017
|
||||||||||||||||||
|
|
L Brands, Inc.
|
Guarantor
Subsidiaries
|
Non-guarantor
Subsidiaries
|
Eliminations
|
Consolidated
L Brands, Inc. |
||||||||||||||
|
Net Sales
|
$
|
—
|
|
$
|
11,931
|
|
$
|
3,728
|
|
$
|
(3,027
|
)
|
$
|
12,632
|
|
||||
|
Costs of Goods Sold, Buying and Occupancy
|
—
|
|
(7,463
|
)
|
(2,868
|
)
|
2,658
|
|
(7,673
|
)
|
|||||||||
|
Gross Profit
|
—
|
|
4,468
|
|
860
|
|
(369
|
)
|
4,959
|
|
|||||||||
|
General, Administrative and Store Operating Expenses
|
(10
|
)
|
(3,063
|
)
|
(426
|
)
|
268
|
|
(3,231
|
)
|
|||||||||
|
Operating Income (Loss)
|
(10
|
)
|
1,405
|
|
434
|
|
(101
|
)
|
1,728
|
|
|||||||||
|
Interest Expense
|
(403
|
)
|
(99
|
)
|
(13
|
)
|
109
|
|
(406
|
)
|
|||||||||
|
Other Income (Loss)
|
(46
|
)
|
11
|
|
25
|
|
—
|
|
(10
|
)
|
|||||||||
|
Income (Loss) Before Income Taxes
|
(459
|
)
|
1,317
|
|
446
|
|
8
|
|
1,312
|
|
|||||||||
|
Provision (Benefit) for Income Taxes
|
65
|
|
316
|
|
(52
|
)
|
—
|
|
329
|
|
|||||||||
|
Equity in Earnings, Net of Tax
|
1,507
|
|
522
|
|
412
|
|
(2,441
|
)
|
—
|
|
|||||||||
|
Net Income (Loss)
|
$
|
983
|
|
$
|
1,523
|
|
$
|
910
|
|
$
|
(2,433
|
)
|
$
|
983
|
|
||||
L BRANDS, INC.
CONDENSED CONSOLIDATING STATEMENT OF COMPREHENSIVE INCOME
(in millions)
|
|
2017
|
||||||||||||||||||
|
|
L Brands, Inc.
|
Guarantor
Subsidiaries
|
Non-guarantor
Subsidiaries
|
Eliminations
|
Consolidated
L Brands, Inc. |
||||||||||||||
|
Net Income (Loss)
|
$
|
983
|
|
$
|
1,523
|
|
$
|
910
|
|
$
|
(2,433
|
)
|
$
|
983
|
|
||||
|
Other Comprehensive Income (Loss), Net of Tax:
|
|||||||||||||||||||
|
Foreign Currency Translation
|
—
|
|
—
|
|
23
|
|
—
|
|
23
|
|
|||||||||
|
Unrealized Gain (Loss) on Cash Flow Hedges
|
—
|
|
—
|
|
(20
|
)
|
—
|
|
(20
|
)
|
|||||||||
|
Reclassification of Cash Flow Hedges to Earnings
|
—
|
|
—
|
|
7
|
|
—
|
|
7
|
|
|||||||||
|
Unrealized Gain (Loss) on Marketable Securities
|
—
|
|
—
|
|
2
|
|
—
|
|
2
|
|
|||||||||
|
Total Other Comprehensive Income (Loss), Net of Tax
|
—
|
|
|
—
|
|
|
12
|
|
|
—
|
|
|
12
|
|
|||||
|
Total Comprehensive Income (Loss)
|
$
|
983
|
|
$
|
1,523
|
|
$
|
922
|
|
$
|
(2,433
|
)
|
$
|
995
|
|
||||
89
L BRANDS, INC.
CONDENSED CONSOLIDATING STATEMENT OF INCOME
(in millions)
|
|
2016
|
||||||||||||||||||
|
|
L Brands, Inc.
|
Guarantor
Subsidiaries
|
Non-guarantor
Subsidiaries
|
Eliminations
|
Consolidated
L Brands, Inc. |
||||||||||||||
|
Net Sales
|
$
|
—
|
|
$
|
11,959
|
|
$
|
3,533
|
|
$
|
(2,918
|
)
|
$
|
12,574
|
|
||||
|
Costs of Goods Sold, Buying and Occupancy
|
—
|
|
(7,277
|
)
|
(2,854
|
)
|
2,682
|
|
(7,449
|
)
|
|||||||||
|
Gross Profit
|
—
|
|
4,682
|
|
679
|
|
(236
|
)
|
5,125
|
|
|||||||||
|
General, Administrative and Store Operating Expenses
|
(8
|
)
|
(2,843
|
)
|
(457
|
)
|
186
|
|
(3,122
|
)
|
|||||||||
|
Operating Income (Loss)
|
(8
|
)
|
1,839
|
|
222
|
|
(50
|
)
|
2,003
|
|
|||||||||
|
Interest Expense
|
(394
|
)
|
(60
|
)
|
(11
|
)
|
71
|
|
(394
|
)
|
|||||||||
|
Other Income (Loss)
|
(35
|
)
|
3
|
|
119
|
|
—
|
|
87
|
|
|||||||||
|
Income (Loss) Before Income Taxes
|
(437
|
)
|
1,782
|
|
330
|
|
21
|
|
1,696
|
|
|||||||||
|
Provision (Benefit) for Income Taxes
|
(10
|
)
|
432
|
|
116
|
|
—
|
|
538
|
|
|||||||||
|
Equity in Earnings, Net of Tax
|
1,585
|
|
39
|
|
376
|
|
(2,000
|
)
|
—
|
|
|||||||||
|
Net Income (Loss)
|
$
|
1,158
|
|
$
|
1,389
|
|
$
|
590
|
|
$
|
(1,979
|
)
|
$
|
1,158
|
|
||||
L BRANDS, INC.
CONDENSED CONSOLIDATING STATEMENT OF COMPREHENSIVE INCOME
(in millions)
|
|
2016
|
||||||||||||||||||
|
|
L Brands, Inc.
|
Guarantor
Subsidiaries
|
Non-guarantor
Subsidiaries
|
Eliminations
|
Consolidated
L Brands, Inc. |
||||||||||||||
|
Net Income (Loss)
|
$
|
1,158
|
|
$
|
1,389
|
|
$
|
590
|
|
$
|
(1,979
|
)
|
$
|
1,158
|
|
||||
|
Other Comprehensive Income (Loss), Net of Tax:
|
|||||||||||||||||||
|
Foreign Currency Translation
|
—
|
|
—
|
|
(19
|
)
|
—
|
|
(19
|
)
|
|||||||||
|
Unrealized Gain (Loss) on Cash Flow Hedges
|
—
|
|
—
|
|
(8
|
)
|
—
|
|
(8
|
)
|
|||||||||
|
Reclassification of Cash Flow Hedges to Earnings
|
—
|
|
—
|
|
7
|
|
—
|
|
7
|
|
|||||||||
|
Unrealized Gain (Loss) on Marketable Securities
|
—
|
|
—
|
|
(5
|
)
|
—
|
|
(5
|
)
|
|||||||||
|
Reclassification of Gain on Marketable Securities to Earnings
|
—
|
|
—
|
|
(3
|
)
|
—
|
|
(3
|
)
|
|||||||||
|
Total Other Comprehensive Income (Loss), Net of Tax
|
—
|
|
|
—
|
|
|
(28
|
)
|
|
—
|
|
|
(28
|
)
|
|||||
|
Total Comprehensive Income (Loss)
|
$
|
1,158
|
|
$
|
1,389
|
|
$
|
562
|
|
$
|
(1,979
|
)
|
$
|
1,130
|
|
||||
90
L BRANDS, INC.
CONDENSED CONSOLIDATING STATEMENT OF CASH FLOWS
(in millions)
|
|
2018
|
||||||||||||||||||
|
|
L Brands, Inc.
|
Guarantor
Subsidiaries
|
Non-guarantor
Subsidiaries
|
Eliminations
|
Consolidated
L Brands, Inc. |
||||||||||||||
|
Net Cash Provided by (Used for) Operating Activities
|
$
|
(424
|
)
|
$
|
1,541
|
|
$
|
260
|
|
$
|
—
|
|
$
|
1,377
|
|
||||
|
Investing Activities:
|
|||||||||||||||||||
|
Capital Expenditures
|
—
|
|
(398
|
)
|
(231
|
)
|
—
|
|
(629
|
)
|
|||||||||
|
Return of Capital from Easton Investments
|
—
|
|
—
|
|
16
|
|
—
|
|
16
|
|
|||||||||
|
Net Investments in Consolidated Affiliates
|
—
|
|
—
|
|
(21
|
)
|
21
|
|
—
|
|
|||||||||
|
Other Investing Activities
|
—
|
|
4
|
|
—
|
|
—
|
|
4
|
|
|||||||||
|
Net Cash Provided by (Used for) Investing Activities
|
—
|
|
(394
|
)
|
(236
|
)
|
21
|
|
(609
|
)
|
|||||||||
|
Financing Activities:
|
|||||||||||||||||||
|
Payment of Long-term Debt
|
(52
|
)
|
—
|
|
—
|
|
—
|
|
(52
|
)
|
|||||||||
|
Borrowings from Secured Revolving Facility
|
92
|
|
—
|
|
—
|
|
—
|
|
92
|
|
|||||||||
|
Repayments of Secured Revolving Facility
|
(92
|
)
|
—
|
|
—
|
|
—
|
|
(92
|
)
|
|||||||||
|
Borrowings from Foreign Facilities
|
—
|
|
—
|
|
172
|
|
—
|
|
172
|
|
|||||||||
|
Repayments of Foreign Facilities
|
—
|
|
—
|
|
(109
|
)
|
—
|
|
(109
|
)
|
|||||||||
|
Dividends Paid
|
(666
|
)
|
—
|
|
—
|
|
—
|
|
(666
|
)
|
|||||||||
|
Repurchases of Common Stock
|
(198
|
)
|
—
|
|
—
|
|
—
|
|
(198
|
)
|
|||||||||
|
Tax Payments related to Share-based Awards
|
(13
|
)
|
—
|
|
—
|
|
—
|
|
(13
|
)
|
|||||||||
|
Net Financing Activities and Advances to/from Consolidated Affiliates
|
1,355
|
|
(1,310
|
)
|
(24
|
)
|
(21
|
)
|
—
|
|
|||||||||
|
Proceeds from Exercise of Stock Options
|
1
|
|
—
|
|
—
|
|
—
|
|
1
|
|
|||||||||
|
Financing Costs and Other
|
(3
|
)
|
(4
|
)
|
—
|
|
—
|
|
(7
|
)
|
|||||||||
|
Net Cash Provided by (Used for) Financing Activities
|
424
|
|
(1,314
|
)
|
39
|
|
(21
|
)
|
(872
|
)
|
|||||||||
|
Effects of Exchange Rate Changes on Cash
|
—
|
|
—
|
|
2
|
|
—
|
|
2
|
|
|||||||||
|
Net Increase (Decrease) in Cash and Cash Equivalents
|
—
|
|
(167
|
)
|
65
|
|
—
|
|
(102
|
)
|
|||||||||
|
Cash and Cash Equivalents, Beginning of Year
|
—
|
|
1,164
|
|
351
|
|
—
|
|
1,515
|
|
|||||||||
|
Cash and Cash Equivalents, End of Year
|
$
|
—
|
|
$
|
997
|
|
$
|
416
|
|
$
|
—
|
|
$
|
1,413
|
|
||||
91
L BRANDS, INC.
CONDENSED CONSOLIDATING STATEMENT OF CASH FLOWS
(in millions)
|
|
2017
|
||||||||||||||||||
|
|
L Brands, Inc.
|
Guarantor
Subsidiaries
|
Non-guarantor
Subsidiaries
|
Eliminations
|
Consolidated
L Brands, Inc. |
||||||||||||||
|
Net Cash Provided by (Used for) Operating Activities
|
$
|
(401
|
)
|
$
|
1,353
|
|
$
|
454
|
|
$
|
—
|
|
$
|
1,406
|
|
||||
|
Investing Activities:
|
|||||||||||||||||||
|
Capital Expenditures
|
—
|
|
(495
|
)
|
(212
|
)
|
—
|
|
(707
|
)
|
|||||||||
|
Return of Capital from Easton Investments
|
—
|
|
—
|
|
29
|
|
—
|
|
29
|
|
|||||||||
|
Purchase of Marketable Securities
|
—
|
|
—
|
|
(10
|
)
|
—
|
|
(10
|
)
|
|||||||||
|
Other Investing Activities
|
—
|
|
(1
|
)
|
(9
|
)
|
—
|
|
(10
|
)
|
|||||||||
|
Net Cash Provided by (Used for) Investing Activities
|
—
|
|
(496
|
)
|
(202
|
)
|
—
|
|
(698
|
)
|
|||||||||
|
Financing Activities:
|
|||||||||||||||||||
|
Proceeds from Issuance of Long-term Debt, Net of Issuance Costs
|
495
|
|
—
|
|
—
|
|
—
|
|
495
|
|
|||||||||
|
Payment of Long-term Debt
|
(540
|
)
|
—
|
|
—
|
|
—
|
|
(540
|
)
|
|||||||||
|
Borrowings from Foreign Facilities
|
—
|
|
—
|
|
96
|
|
—
|
|
96
|
|
|||||||||
|
Repayments of Foreign Facilities
|
—
|
|
—
|
|
(44
|
)
|
—
|
|
(44
|
)
|
|||||||||
|
Dividends Paid
|
(686
|
)
|
—
|
|
—
|
|
—
|
|
(686
|
)
|
|||||||||
|
Repurchases of Common Stock
|
(446
|
)
|
—
|
|
—
|
|
—
|
|
(446
|
)
|
|||||||||
|
Tax Payments related to Share-based Awards
|
(32
|
)
|
—
|
|
—
|
|
—
|
|
(32
|
)
|
|||||||||
|
Net Financing Activities and Advances to/from Consolidated Affiliates
|
1,577
|
|
(1,252
|
)
|
(325
|
)
|
—
|
|
—
|
|
|||||||||
|
Proceeds from Exercise of Stock Options
|
38
|
|
—
|
|
—
|
|
—
|
|
38
|
|
|||||||||
|
Financing Costs and Other
|
(5
|
)
|
(3
|
)
|
—
|
|
—
|
|
(8
|
)
|
|||||||||
|
Net Cash Provided by (Used for) Financing Activities
|
401
|
|
(1,255
|
)
|
(273
|
)
|
—
|
|
(1,127
|
)
|
|||||||||
|
Effects of Exchange Rate Changes on Cash
|
—
|
|
—
|
|
—
|
|
—
|
|
—
|
|
|||||||||
|
Net Increase (Decrease) in Cash and Cash Equivalents
|
—
|
|
(398
|
)
|
(21
|
)
|
—
|
|
(419
|
)
|
|||||||||
|
Cash and Cash Equivalents, Beginning of Year
|
—
|
|
1,562
|
|
372
|
|
—
|
|
1,934
|
|
|||||||||
|
Cash and Cash Equivalents, End of Year
|
$
|
—
|
|
$
|
1,164
|
|
$
|
351
|
|
$
|
—
|
|
$
|
1,515
|
|
||||
92
L BRANDS, INC.
CONDENSED CONSOLIDATING STATEMENT OF CASH FLOWS
(in millions)
|
|
2016
|
||||||||||||||||||
|
|
L Brands, Inc.
|
Guarantor
Subsidiaries
|
Non-guarantor
Subsidiaries
|
Eliminations
|
Consolidated
L Brands, Inc. |
||||||||||||||
|
Net Cash Provided by (Used for) Operating Activities
|
$
|
(404
|
)
|
$
|
1,885
|
|
$
|
509
|
|
$
|
—
|
|
$
|
1,990
|
|
||||
|
Investing Activities:
|
|||||||||||||||||||
|
Capital Expenditures
|
—
|
|
(705
|
)
|
(285
|
)
|
—
|
|
(990
|
)
|
|||||||||
|
Return of Capital from Easton Investments
|
—
|
|
—
|
|
119
|
|
—
|
|
119
|
|
|||||||||
|
Proceeds from Sale of Assets
|
—
|
|
—
|
|
53
|
|
—
|
|
53
|
|
|||||||||
|
Proceeds from Sale of Marketable Securities
|
—
|
|
—
|
|
10
|
|
—
|
|
10
|
|
|||||||||
|
Acquisition, Net of Cash Acquired of $1
|
—
|
|
—
|
|
(33
|
)
|
—
|
|
(33
|
)
|
|||||||||
|
Other Investing Activities
|
—
|
|
(2
|
)
|
10
|
|
—
|
|
8
|
|
|||||||||
|
Net Cash Provided by (Used for) Investing Activities
|
—
|
|
(707
|
)
|
(126
|
)
|
—
|
|
(833
|
)
|
|||||||||
|
Financing Activities:
|
|||||||||||||||||||
|
Proceeds from Issuance of Long-term Debt, Net of Issuance Costs
|
692
|
|
—
|
|
—
|
|
—
|
|
692
|
|
|||||||||
|
Payment of Long-term Debt
|
(742
|
)
|
—
|
|
—
|
|
—
|
|
(742
|
)
|
|||||||||
|
Borrowings from Foreign Facilities
|
—
|
|
—
|
|
35
|
|
—
|
|
35
|
|
|||||||||
|
Repayments of Foreign Facilities
|
—
|
|
—
|
|
(6
|
)
|
—
|
|
(6
|
)
|
|||||||||
|
Dividends Paid
|
(1,268
|
)
|
—
|
|
—
|
|
—
|
|
(1,268
|
)
|
|||||||||
|
Repurchases of Common Stock
|
(435
|
)
|
—
|
|
—
|
|
—
|
|
(435
|
)
|
|||||||||
|
Tax Payments related to Share-based Awards
|
(58
|
)
|
—
|
|
—
|
|
—
|
|
(58
|
)
|
|||||||||
|
Net Financing Activities and Advances to/from Consolidated Affiliates
|
2,195
|
|
(1,803
|
)
|
(392
|
)
|
—
|
|
—
|
|
|||||||||
|
Proceeds from Exercise of Stock Options
|
20
|
|
—
|
|
—
|
|
—
|
|
20
|
|
|||||||||
|
Financing Costs and Other
|
—
|
|
(3
|
)
|
—
|
|
—
|
|
(3
|
)
|
|||||||||
|
Net Cash Provided by (Used for) Financing Activities
|
404
|
|
|
(1,806
|
)
|
|
(363
|
)
|
|
—
|
|
|
(1,765
|
)
|
|||||
|
Effects of Exchange Rate Changes on Cash
|
—
|
|
—
|
|
(6
|
)
|
—
|
|
(6
|
)
|
|||||||||
|
Net Increase (Decrease) in Cash and Cash Equivalents
|
—
|
|
(628
|
)
|
14
|
|
—
|
|
(614
|
)
|
|||||||||
|
Cash and Cash Equivalents, Beginning of Year
|
—
|
|
2,190
|
|
358
|
|
—
|
|
2,548
|
|
|||||||||
|
Cash and Cash Equivalents, End of Year
|
$
|
—
|
|
$
|
1,562
|
|
$
|
372
|
|
$
|
—
|
|
$
|
1,934
|
|
||||
93
ITEM 9. CHANGES IN AND DISAGREEMENTS WITH ACCOUNTANTS ON ACCOUNTING AND FINANCIAL DISCLOSURE.
None.
ITEM 9A. CONTROLS AND PROCEDURES.
Evaluation of disclosure controls and procedures.
As of the end of the period covered by this report, we carried out an evaluation, under the supervision and with the participation of our management, including our Chief Executive Officer and Chief Financial Officer, of the effectiveness of the design and operation of our disclosure controls and procedures, as such term is defined in Rules 13a-15(e) and 15d-15(e) of the Exchange Act. Based upon that evaluation, our Chief Executive Officer and Chief Financial Officer concluded that as of the end of the period covered by this report, our disclosure controls and procedures were effective and designed to ensure that information required to be disclosed by us in reports we file or submit under the Exchange Act is (1) recorded, processed, summarized and reported within the time periods specified in SEC rules and forms, and (2) accumulated and communicated to our management, including our Chief Executive Officer and Chief Financial Officer, to allow timely decisions regarding required disclosure.
Management’s Report on Internal Control Over Financial Reporting
. Management’s Report on Internal Control Over Financial Reporting as of
February 2, 2019
is set forth in Item
8
. Financial Statements and Supplementary Data.
Attestation Report of the Registered Public Accounting Firm
. The Report of Independent Registered Public Accounting Firm on Internal Control Over Financial Reporting as of
February 2, 2019
is set forth in Item
8
. Financial Statements and Supplementary Data.
Changes in internal control over financial reporting.
There were no changes in our internal control over financial reporting that occurred in the fourth quarter
2018
that have materially affected, or are reasonably likely to materially affect, our internal control over financial reporting.
ITEM 9B. OTHER INFORMATION.
None.
94
PART III
ITEM 10. DIRECTORS AND EXECUTIVE OFFICERS AND CORPORATE GOVERNANCE.
Information regarding our directors, executive officers and corporate governance is set forth under the captions “ELECTION OF DIRECTORS—Nominees and Directors”, “—Director Independence”, “—Board Leadership Structure ”, “—Risk Oversight; Certain Compensation Matters”, “—Cybersecurity Risk", “—Review of Strategic Plans and Capital Structure", “—Social Responsibility", “—Human Capital Management", “—Succession Planning", “—Information Concerning Board Meeting Attendance”, “—Committees of the Board”, “—Meetings of the Company's Non-Management Directors”, “—Communications with Stockholders”, “—Attendance at Annual Meetings”, “—Code of Conduct, Related Person Transaction Policy and Associated Matters”, “—Copies of the Company’s Code of Conduct, Corporate Governance Principles, Policy and Committee Charters”, and “SECURITY OWNERSHIP OF DIRECTORS AND MANAGEMENT” in the Proxy Statement and is incorporated herein by reference. Information regarding compliance with Section 16(A) of the Securities Exchange Act of 1934, as amended, is set forth under the caption “SECTION 16(a) BENEFICIAL OWNERSHIP REPORTING COMPLIANCE” in the Proxy Statement and is incorporated herein by reference. Information regarding executive officers is set forth herein under the caption “Executive Officers of Registrant” in Part I.
ITEM 11. EXECUTIVE COMPENSATION.
Information regarding executive compensation is set forth under the caption “COMPENSATION-RELATED MATTERS” in the Proxy Statement and is incorporated herein by reference.
ITEM 12. SECURITY OWNERSHIP OF CERTAIN BENEFICIAL OWNERS AND MANAGEMENT AND RELATED STOCKHOLDER MATTERS.
Information regarding the security ownership of certain beneficial owners and management is set forth under the captions “SECURITY OWNERSHIP OF DIRECTORS AND MANAGEMENT” in the Proxy Statement and “SHARE OWNERSHIP OF PRINCIPAL STOCKHOLDERS” in the Proxy Statement and is incorporated herein by reference.
The following table summarizes share and exercise price information about L Brands’ equity compensation plans as of
February 2, 2019
.
|
Plan category
|
(a) Number of
securities to be issued
upon exercise of
outstanding options,
warrants and rights
|
(b) Weighted-average
exercise price of
outstanding options,
warrants and rights
|
|
(c) Number of securities
remaining available for
future issuance under
equity compensation
plan (excluding
securities reflected in
column (a))
|
||||||
|
Equity compensation plans approved by security holders (1)
|
12,392,717
|
|
$
|
53.14
|
|
(2)
|
9,109,757
|
|
||
|
Equity compensation plans not approved by security holders
|
—
|
|
—
|
|
—
|
|
||||
|
Total
|
12,392,717
|
|
$
|
53.14
|
|
9,109,757
|
|
|||
________________
|
(1)
|
Includes the following plans: L Brands, Inc. 2015 Stock Option and Performance Incentive Plan, L Brands, Inc. 2011 Stock Option and Performance Incentive Plan and L Brands, Inc. 1993 Stock Option and Performance Incentive Plan (2009 Restatement). There are no shares remaining available for grant under the 2011 Plan or 1993 Plan.
|
|
(2)
|
Does not include outstanding rights to receive Common Stock upon the vesting of restricted share awards or settlement of deferred stock units.
|
ITEM 13. CERTAIN RELATIONSHIPS AND RELATED TRANSACTIONS AND DIRECTOR INDEPENDENCE.
Information regarding certain relationships and related transactions is set forth under the caption “ELECTION OF DIRECTORS—Nominees and Directors” and “—Director Independence” in the Proxy Statement and is incorporated herein by reference.
ITEM 14. PRINCIPAL ACCOUNTANT FEES AND SERVICES.
Information regarding principal accountant fees and services is set forth under the captions “INDEPENDENT REGISTERED PUBLIC ACCOUNTANTS—Audit Fees”, “—Audit Related Fees”, “—Tax Fees”, “—All Other Fees” and “—Pre-approval Policies and Procedures” in the Proxy Statement and is incorporated herein by reference.
95
PART IV
ITEM 15. EXHIBITS, FINANCIAL STATEMENT SCHEDULES
|
(a)
|
(1)
|
Consolidated Financial Statements
|
||
|
The following consolidated financial statements of L Brands, Inc. are filed as part of this report under Item 8. Financial Statements and Supplementary Data:
|
||||
|
Management’s Report on Internal Control Over Financial Reporting
|
||||
|
Report of Independent Registered Public Accounting Firm on Internal Control Over Financial Reporting
|
||||
|
Report of Independent Registered Public Accounting Firm on Consolidated Financial Statements
|
||||
|
Consolidated Statements of Income for the Years Ended February 2, 2019, February 3, 2018 and January 28, 2017
|
||||
|
Consolidated Statements of Comprehensive Income for the Years Ended February 2, 2019, February 3, 2018 and January 28, 2017
|
||||
|
Consolidated Balance Sheets as of February 2, 2019 and February 3, 2018
|
||||
|
Consolidated Statements of Total Equity (Deficit) for the Years Ended February 2, 2019, February 3, 2018 and January 28, 2017
|
||||
|
Consolidated Statements of Cash Flows for the Years Ended February 2, 2019, February 3, 2018 and January 28, 2017
|
||||
|
Notes to Consolidated Financial Statements
|
||||
|
(2)
|
Financial Statement Schedules
|
|||
|
Schedules have been omitted because they are not required or are not applicable or because the
information required to be set forth therein either is not material or is included in the financial
statements or notes thereto.
|
||||
|
(3)
|
List of Exhibits
|
|||
|
3.
|
Articles of Incorporation and Bylaws.
|
|||
|
3.1
|
||||
|
3.2
|
||||
|
4.
|
Instruments Defining the Rights of Security Holders.
|
|||
|
4.1
|
||||
|
4.2
|
Proposed form of Debt Warrant Agreement for Warrants attached to Debt Securities, with proposed form of Debt Warrant Certificate incorporated by reference to Exhibit 4.2 to the Company’s Registration Statement on Form S-3 (File No. 33-53366) originally filed with the Securities and Exchange Commission (the “SEC”) on October 16, 1992, as amended by Amendment No. 1 thereto, filed with the SEC on February 23, 1993 (the “1993 Form S-3”). (P)
|
|||
|
4.3
|
Proposed form of Debt Warrant Agreement for Warrants not attached to Debt Securities, with proposed form of Debt Warrant Certificate incorporated by reference to Exhibit 4.3 to the 1993 Form S-3. (P)
|
|||
|
4.4
|
||||
96
|
4.5
|
||||
|
4.6
|
||||
|
4.7
|
||||
|
4.8
|
||||
|
4.9
|
||||
|
4.10
|
||||
|
4.11
|
||||
|
4.12
|
||||
|
4.13
|
||||
|
4.14
|
||||
|
4.15
|
||||
|
4.16
|
||||
|
4.17
|
||||
97
|
4.18
|
||||
|
4.19
|
||||
|
4.20
|
||||
|
4.21
|
||||
|
4.22
|
||||
|
4.23
|
|
|||
|
4.24
|
||||
|
4.25
|
||||
|
4.26
|
||||
|
10.
|
Material Contracts.
|
|||
|
10.1
|
Officers’ Benefits Plan incorporated by reference to Exhibit 10.4 to the Company’s Annual Report on Form 10-K for the fiscal year ended January 28, 1989 (the “1988 Form 10-K”).** (P)
|
|||
|
10.2
|
||||
|
10.3
|
||||
|
10.4
|
||||
|
10.5
|
||||
|
10.6
|
||||
|
10.7
|
||||
98
|
10.8
|
||||
|
10.9
|
||||
|
10.10
|
||||
|
10.11
|
||||
|
10.12
|
||||
|
10.13
|
||||
|
10.14
|
||||
|
10.15
|
||||
|
10.16
|
||||
|
10.17
|
||||
|
10.18
|
||||
|
21.
|
||||
|
23.1
|
||||
|
24.
|
||||
|
31.1
|
||||
|
31.2
|
||||
|
32.
|
||||
|
101.INS
|
XBRL Instance Document
|
|||
|
101.SCH
|
XBRL Taxonomy Extension Schema Document
|
|||
|
101.CAL
|
XBRL Taxonomy Extension Calculation Linkbase Document
|
|||
|
101.DEF
|
XBRL Taxonomy Definition Linkbase Document
|
|||
|
101.LAB
|
XBRL Taxonomy Extension Label Linkbase Document
|
|||
|
101.PRE
|
XBRL Taxonomy Extension Presentation Linkbase Document
|
|||
________________
99
|
**
|
Identifies management contracts or compensatory plans or arrangements.
|
|
(P)
|
Paper Exhibits
|
|
(b)
|
Exhibits.
|
The exhibits to this report are listed in section (a)(3) of Item 15 above.
|
(c)
|
Not applicable.
|
ITEM 16. FORM 10-K SUMMARY.
None.
100
SIGNATURES
Pursuant to the requirements of Section 13 or l5(d) of the Securities Exchange Act of 1934, the registrant has duly caused this report to be signed on its behalf by the undersigned, thereunto duly authorized.
Date:
March 22, 2019
|
L BRANDS, INC. (Registrant)
|
||
|
By:
|
/s/ STUART B. BURGDOERFER
|
|
|
Stuart B. Burgdoerfer,
Executive Vice President and Chief Financial Officer
|
||
Pursuant to the requirements of the Securities Exchange Act of 1934, this report has been signed below by the following persons on behalf of the registrant and in the capacities indicated on
February 2, 2019
:
|
Signature
|
Title
|
|
|
/s/ LESLIE H. WEXNER*
|
Chairman of the Board of Directors and Chief Executive Officer
|
|
|
Leslie H. Wexner
|
(Principal Executive Officer)
|
|
|
/s/ STUART B. BURGDOERFER
|
Executive Vice President and Chief Financial Officer
|
|
|
Stuart B. Burgdoerfer
|
(Principal Financial Officer and Principal Accounting Officer)
|
|
|
/s/ PATRICIA S. BELLINGER*
|
Director
|
|
|
Patricia S. Bellinger
|
||
|
/s/ E. GORDON GEE*
|
Director
|
|
|
E. Gordon Gee
|
||
|
/s/ DENNIS S. HERSCH*
|
Director
|
|
|
Dennis S. Hersch
|
||
|
/s/ DONNA A. JAMES*
|
Director
|
|
|
Donna A. James
|
||
|
/s/ DAVID T. KOLLAT*
|
Director
|
|
|
David T. Kollat
|
||
|
/s/ MICHAEL G. MORRIS*
|
Director
|
|
|
Michael G. Morris
|
||
|
/s/ ROBERT H. SCHOTTENSTEIN*
|
Director
|
|
|
Robert H. Schottenstein
|
||
|
/s/ STEPHEN D. STEINOUR*
|
Director
|
|
|
Stephen D. Steinour
|
||
|
/s/ ALLAN R. TESSLER*
|
Director
|
|
|
Allan R. Tessler
|
||
|
/s/ ABIGAIL S. WEXNER*
|
Director
|
|
|
Abigail S. Wexner
|
||
|
/s/ RAYMOND ZIMMERMAN*
|
Director
|
|
|
Raymond Zimmerman
|
||
|
*
|
The undersigned, by signing his name hereto, does hereby sign this report on behalf of each of the above-indicated directors of the registrant pursuant to powers of attorney executed by such directors.
|
|
By:
|
/s/ STUART B. BURGDOERFER
|
|
Stuart B. Burgdoerfer
Attorney-in-fact
|
|
101
SECURITIES AND EXCHANGE COMMISSION
Washington, D.C. 20549
Form 10-K
ANNUAL REPORT PURSUANT TO SECTION 13 OR 15(d) OF
THE SECURITIES EXCHANGE ACT OF 1934
L BRANDS, INC.
(exact name of Registrant as specified in its charter)
EXHIBITS
102
EXHIBIT INDEX
|
Exhibit No.
|
Document
|
|
|
21
|
Subsidiaries of the Registrant.
|
|
|
23.1
|
Consent of Ernst & Young LLP.
|
|
|
24
|
Powers of Attorney.
|
|
|
31.1
|
Section 302 Certification of CEO.
|
|
|
31.2
|
Section 302 Certification of CFO.
|
|
|
32
|
Section 906 Certification (by CEO and CFO).
|
|
|
101.INS
|
XBRL Instance Document
|
|
|
101.SCH
|
XBRL Taxonomy Extension Schema Document
|
|
|
101.CAL
|
XBRL Taxonomy Extension Calculation Linkbase Document
|
|
|
101.DEF
|
XBRL Taxonomy Definition Linkbase Document
|
|
|
101.LAB
|
XBRL Taxonomy Extension Label Linkbase Document
|
|
|
101.PRE
|
XBRL Taxonomy Extension Presentation Linkbase Document
|
|
103
TABLE OF CONTENTS
Part IItem 1. BusinessItem 1A. Risk FactorsItem 1B. Unresolved Staff CommentsItem 2. PropertiesItem 3. Legal ProceedingsItem 4. Mine Safety DisclosuresPart IIItem 5. Market For Registrant S Common Equity, Related Stockholder Matters and Issuer Purchases Of Equity SecuritiesItem 6. Selected Financial DataItem 7. Management S Discussion and Analysis Of Financial Condition and Results Of OperationsItem 7A. Quantitative and Qualitative Disclosures About Market RiskItem 8. Financial Statements and Supplementary DataItem 9. Changes in and Disagreements with Accountants on Accounting and Financial DisclosureItem 9A. Controls and ProceduresItem 9B. Other InformationPart IIIItem 10. Directors and Executive Officers and Corporate GovernanceItem 11. Executive CompensationItem 12. Security Ownership Of Certain Beneficial Owners and Management and Related Stockholder MattersItem 13. Certain Relationships and Related Transactions and Director IndependenceItem 14. Principal Accountant Fees and ServicesPart IVItem 15. Exhibits, Financial Statement SchedulesItem 16. Form 10-k Summary