BRUNSWICK CORP
10-Ks and 10-Qs
|
|
|
|
|
|
|
|
|
|
|
|
|
|
|
|
|
|
|
|
|
|
|
|
|
|
|
|
|
|
|
|
|
|
|
|
|
|
|
|
|
|
|
|
|
|
|
|
|
|
|
|
|
|
|
|
UNITED STATES
SECURITIES AND EXCHANGE COMMISSION
Washington, D.C. 20549
FORM 10-K
|
x
|
ANNUAL REPORT PURSUANT TO SECTION 13 OR 15(d) OF THE SECURITIES EXCHANGE ACT OF 1934
|
For the fiscal year ended
December 31, 2016
or
|
o
|
TRANSITION REPORT PURSUANT TO SECTION 13 OR 15(d) OF THE SECURITIES EXCHANGE ACT OF 1934
|
Commission file number 1-1043
____________

Brunswick Corporation
(Exact name of registrant as specified in its charter)
|
Delaware
|
|
36-0848180
|
|
(State or other jurisdiction of incorporation or organization)
|
|
(I.R.S. Employer Identification No.)
|
1 N. Field Court, Lake Forest, Illinois 60045-4811
(Address of principal executive offices, including zip code)
(847) 735-4700
(Registrant’s telephone number, including area code)
Securities registered pursuant to Section 12(b) of the Act:
Title of each class
Name of each exchange on which registered
Common Stock ($0.75 par value)
New York Stock Exchange, Chicago Stock Exchange
Securities registered pursuant to Section 12(g) of the Act:
None
Indicate by check mark if the registrant is a well-known seasoned issuer, as defined in Rule 405 of the Securities Act. Yes
x
No
o
Indicate by check mark if the registrant is not required to file reports pursuant to Section 13 or Section 15(d) of the Act. Yes
o
No
x
Indicate by check mark whether the registrant (1) has filed all reports required to be filed by Section 13 or 15(d) of the Securities Exchange Act of 1934 during the preceding 12 months (or for such shorter period that the registrant was required to file such reports), and (2) has been subject to such filing requirements for the past 90 days. Yes
x
No
o
Indicate by check mark whether the registrant has submitted electronically and posted on its corporate Web site, if any, every Interactive Data File required to be submitted and posted pursuant to Rule 405 of Regulation S-T (§232.405 of this chapter) during the preceding 12 months (or for such shorter period that the registrant was required to submit and post such files). Yes
x
No
o
Indicate by check mark if disclosure of delinquent filers pursuant to Item 405 of Regulation S-K (Section 229.405) is not contained herein, and will not be contained, to the best of registrant's knowledge, in the definitive proxy or information statements incorporated by reference in Part III of this Form 10-K or any amendment to this Form 10-K.
x
Indicate by check mark whether the registrant is a large accelerated filer, an accelerated filer, a non-accelerated filer, or a smaller reporting company. See the definitions of “large accelerated filer,” “accelerated filer” and “smaller reporting company” in Rule 12b-2 of the Exchange Act. (Check one):
|
Large accelerated filer
|
x
|
Accelerated filer
|
o
|
|
Non-accelerated filer
|
o
(Do not check if a smaller reporting company)
|
Smaller reporting company
|
o
|
Indicate by check mark whether the registrant is a shell company (as defined in Rule 12b-2 of the Exchange Act). Yes
o
No
x
As of
July 1, 2016
, the last business day of the registrant’s most recently completed second fiscal quarter, the aggregate market value of the voting stock of the registrant held by non-affiliates was
$4,174,908,537
. Such number excludes stock beneficially owned by officers and directors. This does not constitute an admission that they are affiliates.
The number of shares of Common Stock ($0.75 par value) of the registrant outstanding as of February 15, 2017 was
89,524,751
.
DOCUMENTS INCORPORATED BY REFERENCE
Part III of this Report on Form 10-K incorporates by reference certain information that will be set forth in the Company's definitive Proxy Statement for the Annual Meeting of Shareholders scheduled to be held on May 3, 2017.
BRUNSWICK CORPORATION
INDEX TO ANNUAL REPORT ON FORM 10-K
December 31, 2016
TABLE OF CONTENTS
|
PART I
|
Page
|
|
|
PART II
|
||
|
PART III
|
||
|
PART IV
|
||
Brunswick Corporation is a Delaware corporation incorporated on December 31, 1907. We are a leading global designer, manufacturer and marketer of recreation products including marine engines, boats, fitness equipment and active recreation products. Our engine-related products include: outboard, sterndrive and inboard engines; trolling motors; propellers; engine control systems; and marine parts and accessories. Our boat offerings include: fiberglass pleasure boats; yachts and sport yachts; sport cruisers and sport boats; offshore fishing boats; aluminum and fiberglass fishing boats; pontoon boats; utility boats; deck boats; inflatable boats; and heavy-gauge aluminum boats. Our fitness products include cardiovascular and strength training equipment for both the commercial and consumer markets. We also sell products for active aging, rehabilitation, productive well-being, a complete line of billiards tables and other game room tables and accessories.
In 2016, we continued the successful execution of our growth strategy, emphasizing product leadership with innovative products and advanced features, as well as completing targeted, strategic acquisitions and expanding production capacity. We expect 2017 will reflect continued focus on growth, including investments in new products, productivity and efficiency initiatives, acquisitions and other growth-related investments. In the longer term, our strategy remains consistent: to design, develop and introduce high-quality products featuring innovative technology and styling; to distribute products through a model that benefits our partners - dealers and distributors; to provide world-class service to our customers; to develop and maintain low-cost manufacturing processes and to continually improve productivity and efficiency; to manufacture and distribute products globally with local and regional styling; to continue implementing our capital strategy, which includes maintaining strong cash and liquidity positions, allocating capital to organic growth initiatives and strategic acquisition opportunities, funding pension obligations and continuing to return capital to shareholders through dividends and share repurchases; and to attract and retain skilled employees. These strategic objectives support our plans to grow by expanding our existing businesses. Our primary objective is to enhance shareholder value by achieving returns on investments that exceed our cost of capital.
Refer to
Note 6 –
Segment Information
and
Note 2 –
Discontinued Operations
in the Notes to Consolidated Financial Statements for additional information regarding our segments and discontinued operations, including net sales, operating earnings and total assets by segment.
Marine Engine Segment
The Marine Engine segment, which had net sales of
$2,441.1 million
in
2016
, consists of the Mercury Marine Group (Mercury Marine). We believe our Marine Engine segment is a world leader in the manufacturing and sale of recreational marine engines and marine parts and accessories.
Mercury Marine manufactures and markets a full range of outboard, sterndrive and inboard engine and propulsion systems under the Mercury, Mercury MerCruiser, Mariner, Mercury Racing, Mercury Sport Jet, Mercury Jet Drive, Mercury Diesel, Sea Pro, Axius and Zeus brand names. In addition, Mercury Marine manufactures and markets marine parts and accessories under the Quicksilver, Mercury Precision Parts, Mercury Propellers, Attwood, Garelick, Whale, Land 'N' Sea, Kellogg Marine Supply, Payne's Marine Group, BLA, Seachoice and MotorGuide brand names, including marine electronics and control integration systems, steering systems, instruments, controls, propellers, trolling motors, fuel systems, service parts and lubricants. Mercury Marine also supplies integrated, high-speed diesel propulsion systems to the worldwide recreational and commercial marine markets.
Mercury Marine's outboard, sterndrive and inboard engines are sold to independent boat builders, local, state and foreign governments and to Brunswick's Boat segment. In addition, Mercury Marine sells outboard engines through a global network of more than 6,000 marine dealers and distributors, specialty marine retailers and marine service centers. White River Marine Group, LLC and its subsidiaries (including Tracker Boats) is Mercury Marine’s most significant external customer.
Mercury Marine manufactures four-stroke outboard engine models ranging from 2.5 to 400 horsepower and two-stroke OptiMax outboard engines, all of which feature Mercury's direct fuel injection (DFI) technology, ranging from 150 to 300 horsepower. All of these low-emission engines are in compliance with applicable U.S. Environmental Protection Agency (EPA) requirements. Mercury Marine's four-stroke outboard engines include Verado, a collection of supercharged outboards ranging from 175 to 400 horsepower, and Mercury Marine's naturally aspirated four-stroke outboards, ranging from 2.5 to 150 horsepower, including the 75 to 115 horsepower FourStroke, introduced in 2014, which has become known for its light weight, fuel efficiency and performance. Mercury Marine also manufactures two-stroke, non-DFI engines for certain markets outside the United States. In addition, most of Mercury's sterndrive and inboard engines are now available with catalyst exhaust treatment and monitoring systems, and all
1
are compliant with applicable U.S. state and federal environmental regulations. Mercury also makes engines that comply with global emissions and noise regulations.
Mercury Marine and Mercury Racing manufacture inboard and sterndrive engine models ranging from 115 to 1,650 horsepower. In 2016, Mercury Racing debuted the 32-valve DOHC SB4 7.0 automotive aftermarket crate engine, which adapts a high performance valve train to a customized LS based engine and produces 775 naturally aspirated horsepower, significantly improved performance and durability.
To promote advanced propulsion systems with improved handling, performance and efficiency, Mercury Marine manufactures and markets advanced boat steering and engine control systems under the brand names of Mercury, Zeus and Axius. In 2016, Mercury officially launched Active Trim, an auto-trimming device that simplifies boat operation while improving engine performance and fuel efficiency.
Mercury Marine produces its gasoline sterndrive and outboard engines domestically in Fond du Lac, Wisconsin, with outboard engines also produced internationally in China and Japan. Mercury Marine manufactures 40, 50 and 60 horsepower four-stroke outboard engines in a facility in China, and produces smaller outboard engines in Japan pursuant to a joint venture with its partner, Tohatsu Corporation. Mercury Marine sources engine components from a global supply base and manufactures additional engine component parts at its Fond du Lac facility and plants in Florida and Mexico. Mercury Marine also operates a remanufacturing business for engines and service parts in Wisconsin. In addition, Mercury Marine has an equity ownership interest in Bella-Veneet Oy, which manufactures boats under the brand names Bella, Flipper and Aquador in Finland.
In March 2016, Mercury introduced VesselView Mobile, unveiling a digital application that instantly provides users access to their boat’s SmartCraft® digital data. VesselView Mobile, along with Mercury's Electronic Steering Helm (introduced in February 2016), each earned Innovation Awards at the 2016 International Boatbuilders Exhibition and Conference. Mercury also earned “Green Master” designation from the Wisconsin Sustainable Business Council for the sixth consecutive year, a program measuring a broad range of sustainability issues ranging from energy and water conservation to waste management, community outreach and education.
On November 18, 2016, Brunswick acquired substantially all of the assets of Payne's Marine Group (Payne's), based in Victoria, British Columbia, Canada. Payne's is a leading wholesale distributor of marine parts and accessories in Canada. We believe this acquisition will broaden the reach of our marine parts and accessories distribution network in the Canadian market.
Our parts and accessories distribution and products businesses include: Land 'N' Sea, Kellogg Marine Supply, BLA, Payne's, Attwood Marine, Garelick Mfg. Co. and Whale. These businesses are leading manufacturers and distributors of marine parts and accessories throughout North America, Europe and Asia-Pacific, offering same-day or next-day delivery service to a broad array of marine service facilities.
Intercompany sales to Brunswick's Boat segment represented approximately 12 percent of Mercury Marine's sales in 2016. Domestic demand for the Marine Engine segment's products is seasonal, with sales generally highest in the second calendar quarter of the year.
Boat Segment
The Boat segment consists of the Brunswick Boat Group (Boat Group), which manufactures and markets: fiberglass pleasure boats; yachts and sport yachts; sport cruisers and sport boats; offshore fishing boats; aluminum and fiberglass fishing boats; pontoon boats; utility boats; deck boats; inflatable boats; and heavy-gauge aluminum boats. We believe that the Boat Group, which had net sales of
$1,369.9 million
during
2016
, is a world leader in the manufacturing and sale of pleasure motorboats.
The Boat Group manages Brunswick's boat brands; evaluates and optimizes the Boat segment's boat portfolio; promotes recreational boating services and activities to enhance the consumer experience and dealer profitability; and speeds the introduction of new technologies into boat manufacturing and design processes.
The Boat Group includes the following boat brands: Sea Ray L-Class yachts, yachts, sport yachts, sport cruisers and sport boats; Bayliner sport cruisers, runabouts and Heyday wake boats; Meridian yachts; Boston Whaler and Lund fiberglass fishing boats; Crestliner, Cypress Cay, Harris, Lowe, Lund and Princecraft aluminum fishing, utility, pontoon boats and deck boats; and Thunder Jet heavy-gauge aluminum boats. The Boat Group also includes a commercial and governmental sales unit that sells products to commercial customers, as well as to the United States government and state, local and foreign governments. The Boat Group procures most of its outboard engines, gasoline sterndrive engines and gasoline inboard engines from Brunswick's Marine Engine segment.
2
The Boat Group also includes several Brunswick boat brands based in Europe and Asia-Pacific, such as Quicksilver, Uttern and Rayglass (including Protector and Legend), which are typically equipped with Mercury Marine engines and often include other parts and accessories supplied by Mercury Marine.
The Boat Group operates manufacturing facilities in Florida, Indiana, Minnesota, Missouri, Tennessee, Washington, Brazil, Canada, Mexico, New Zealand and Portugal, and owns an inactive manufacturing facility in North Carolina. The Boat Group utilizes contract manufacturing facilities in Poland.
On July 1, 2016, Brunswick acquired substantially all of the assets of privately held Thunder Jet Boats, Inc. (Thunder Jet), which is based in Clarkston, Washington. Thunder Jet is a designer and builder of heavy-gauge aluminum boats. We believe this acquisition will add breadth and depth to the Boat Group's overall product portfolio, including in the growing heavy-gauge aluminum market. Thunder Jet is managed within the Boat Group.
The Boat Group sells its products through a global network of approximately 3,000 dealer and distributor locations, which may carry more than one of Brunswick's boat brands. Sales to the Boat Group's largest dealer, MarineMax, Inc., which has multiple locations and carries a number of the Boat Group's product lines, represented approximately 24 percent of Boat Group sales in 2016. Domestic demand for pleasure boats is seasonal, with sales generally highest in the second calendar quarter of the year.
Fitness Segment
Our Fitness segment is comprised of the Fitness division (Fitness), which designs, manufactures and markets a full line of reliable, high-quality cardiovascular fitness equipment (including treadmills, total body cross-trainers, stair climbers and stationary exercise bicycles) and strength-training equipment under the Life Fitness, Hammer Strength, Cybex, Indoor Cycling Group and SCIFIT brands. The Fitness segment also includes InMovement products for productive well-being and our active recreation business, including billiards tables, accessories and game room furniture.
We believe that our Fitness segment, which had net sales of
$980.4 million
during
2016
, is the world's largest manufacturer of commercial fitness equipment and a leading manufacturer of high-quality consumer fitness equipment. Fitness' commercial customers include health clubs, corporations, schools and universities, hotels, professional and collegiate sports teams, retirement and assisted living facilities and the military and governmental agencies. Planet Fitness Inc. is the segment's most significant customer. Fitness makes commercial sales through its direct sales force, domestic dealers and international distributors. Consumer products are available at specialty retailers, select mass merchants, sporting goods stores, through international distributors and on the Life Fitness website.
The billiards business was established in 1845 and is Brunswick's heritage business. The billiards business designs and markets billiards tables, table tennis tables and Air Hockey tables, as well as game room furniture and related accessories, under the Brunswick and Contender brands. InMovement is a business dedicated to addressing workplace inactivity and combating the harmful effects of a sedentary lifestyle by offering products designed to incorporate subtle movement into employee work habits.
On January 20, 2016, we acquired 100 percent of privately held Cybex International, Inc. (Cybex), a leading manufacturer of commercial fitness equipment, which is currently based in Medway, Massachusetts. Cybex offers a full line of cardiovascular and strength products. We believe the acquisition will expand the Fitness segment's participation in key markets, including commercial fitness, and add to our manufacturing footprint to meet current and future demand more effectively. On August 31, 2016, we acquired 100 percent of Indoor Cycling Group (ICG), a market leader specializing in the design of indoor cycling equipment, based in Nuremburg, Germany. We believe the ICG acquisition will strengthen our position in indoor cycling and provide a strong foundation to expand in the growing group exercise market. Cybex and ICG are managed within the Fitness segment.
The Fitness segment's principal manufacturing facilities are located in Illinois, Kentucky, Massachusetts, Minnesota, Oklahoma, Wisconsin and Hungary, with principal third party contract manufacturing partners in China and Taiwan. Fitness distributes its products worldwide from regional warehouses and production facilities. Demand for Fitness products is seasonal, with sales generally highest in the fourth quarter of the year.
Discontinued Operations
On July 17, 2014, we entered into an agreement to sell our retail bowling business to AMF Bowling Centers, Inc. (AMF). In connection with our decision to sell the bowling centers, we also announced our intention to divest our bowling products business. The billiards business, which was previously reported in the Bowling & Billiards segment, remains part of the Company and is
3
being reported in the Fitness segment for all periods presented. On September 18, 2014, we completed the sale of our retail bowling business to AMF. On May 22, 2015, we completed the sale of our bowling products business to BlueArc Capital Management L.L.C. As a result of these actions, these businesses, which were previously recorded in the Bowling & Billiards segment, are reported as discontinued operations in the Consolidated Statements of Operations for all periods presented. We do not have or anticipate having any significant continuing involvement or continuing cash flows associated with these businesses. Refer to
Note 2 –
Discontinued Operations
in the Notes to Consolidated Financial Statements for additional information regarding discontinued operations.
Financial Services
Through our Brunswick Financial Services Corporation subsidiary, we own a 49 percent interest in a joint venture, Brunswick Acceptance Company, LLC (BAC). Under the terms of the joint venture agreement, BAC provides secured wholesale inventory floorplan financing to our boat and engine dealers. Prior to March 1, 2016, CDF Ventures, LLC (CDFV), a subsidiary of GE Capital Corporation (GECC), owned the remaining 51 percent. On March 1, 2016, GECC sold its Commercial Distribution Finance business, including CDFV and its interest in the BAC joint venture, to Wells Fargo & Company. The transaction did not have a material effect on BAC.
Effective July 31, 2015, the joint venture was extended through December 31, 2019. The joint venture agreement contains provisions allowing for the renewal of the agreement or purchase of the other party's interest in the joint venture at the end of its term. Alternatively, either partner may terminate the agreement at the end of its term. In June 2016, the parties amended the joint venture agreement to adjust a financial covenant that was conformed to the maximum leverage ratio test contained in our revolving credit facility described in
Note 16 –
Debt
in the Notes to Consolidated Financial Statements.
Additionally, we offer financial services through Brunswick Product Protection Corporation, which provides marine dealers the opportunity to offer extended product warranties to retail customers, and through Blue Water Dealer Services, Inc., which provides retail financial services to marine dealers. Each company allows us to offer a more complete line of financial services to our boat and marine engine dealers and their customers.
Refer to
Note 10 –
Financial Services
in the Notes to Consolidated Financial Statements for more information about our financial services.
Distribution
We utilize distributors, dealers and retailers (Dealers) for the majority of our boat sales and significant portions of our sales of marine engine, fitness and billiards products. We have over 16,000 Dealers serving our business segments worldwide. Our marine Dealers typically carry one or more of the following product categories - boats, engines and related parts and accessories.
We own Land 'N' Sea, Kellogg Marine Supply and Payne's Marine Group, which comprise the primary parts and accessories distribution platforms for our Marine Engine segment in North America. We believe that these businesses, collectively, are the leading distributors of marine parts and accessories throughout North America, with 20 distribution warehouses located throughout the United States and Canada offering same-day or next-day delivery service to a broad array of marine service facilities and Dealers. We also believe we are the leading parts and accessories distributor in the Asia-Pacific region.
Our Dealers are independent companies or proprietors that range in size from small, family-owned businesses to a large, publicly-traded corporation with substantial revenues and multiple locations. Some Dealers sell our products exclusively, while a majority also carry competitors' and complementary products. We partner with our boat dealer network to improve quality, service, distribution and delivery of parts and accessories to enhance the boating customer's experience.
Demand for a significant portion of our products is seasonal, and a number of our Dealers are relatively small and/or highly-leveraged. As a result, many dealers secure floor plan financing from BAC or other third party finance companies, enabling them to provide stable channels for our products. In addition to the financing BAC offers, we may also provide our Dealers with incentive programs, loan guarantees, inventory repurchase commitments and financing receivable arrangements, under which we are obligated to repurchase inventory or receivables from a finance company in the event of a Dealer's default. We believe that these arrangements are in our best interest; however, these arrangements expose us to credit and business risk. Our business units, along with BAC, maintain active credit operations to manage this financial exposure, and we continually seek opportunities to sustain and improve the financial health of our various distribution channel partners. Refer to
Note 8 –
Financing Receivables
and
Note 13 –
Commitments and Contingencies
in the Notes to Consolidated Financial Statements for further discussion of these arrangements.
4
International Operations
Our sales to customers in markets other than the United States were
$1,457.0 million
(32 percent of net sales),
$1,377.9 million
(33 percent of net sales) and
$1,438.7 million
(37 percent of net sales) in
2016
,
2015
and
2014
, respectively. We transact a portion of our sales in non-U.S. markets in local currencies, while a meaningful portion of our product costs are denominated in U.S. dollars as a result of our U.S. manufacturing operations. As a result, the strengthening or weakening of the U.S. dollar affects the financial results of our non-U.S. operations.
Non-U.S. sales are set forth in
Note 6 –
Segment Information
in the Notes to Consolidated Financial Statements and are also included in the table below, which details our non-U.S. sales by region:
|
(in millions)
|
2016
|
2015
|
2014
|
||||||||
|
Europe
|
$
|
569.2
|
|
$
|
506.0
|
|
$
|
533.5
|
|
||
|
Canada
|
284.6
|
|
282.9
|
|
302.4
|
|
|||||
|
Asia-Pacific
|
363.1
|
|
307.9
|
|
286.0
|
|
|||||
|
Latin America
|
151.2
|
|
183.2
|
|
219.0
|
|
|||||
|
Africa & Middle East
|
88.9
|
|
97.9
|
|
97.8
|
|
|||||
|
Total
|
$
|
1,457.0
|
|
$
|
1,377.9
|
|
$
|
1,438.7
|
|
||
Marine Engine segment non-U.S. sales represented approximately 47
percent of our non-U.S. sales in
2016
. The segment's principal non-U.S. operations include the following:
|
•
|
Distribution, sales, service and applications engineering offices in Australia, Belgium, Brazil, Canada, China, Malaysia, New Zealand and Singapore;
|
|
•
|
Sales or representative offices in Dubai, Finland, France, Italy, Japan, Norway, Russia, Sweden and Switzerland;
|
|
•
|
A component manufacturing facility in Mexico;
|
|
•
|
An outboard engine assembly plant in Suzhou, China;
|
|
•
|
An outboard engine assembly plant operated by a joint venture in Japan; and
|
|
•
|
A parts and accessories manufacturing facility in Northern Ireland.
|
Boat segment non-U.S. sales comprised approximately 23 percent of our non-U.S. sales in
2016
. The Boat Group manufactures or assembles a portion of its products in Brazil, Canada, Mexico, New Zealand and Portugal, as well as in boat plants owned and operated by third parties in Poland that perform contract manufacturing for us, and are sold worldwide through Dealers. The Boat Group has sales or import offices in Belgium, Brazil, Canada, France, Italy, the Netherlands, New Zealand, Norway, Poland and Sweden.
Fitness segment non-U.S. sales comprised approximately 30
percent of our non-U.S. sales in
2016
. Life Fitness sells its products worldwide and has sales and distribution centers in Brazil, Germany, Hong Kong, Japan, the Netherlands, Spain and the United Kingdom. The Fitness segment manufactures strength-training equipment and select lines of cardiovascular equipment in Hungary for its international markets, and has relationships with third party contract manufacturing partners in China and Taiwan.
Raw Materials and Supplies
We purchase a wide variety of raw materials from our supplier base, including aluminum, resins, oil and steel, as well as product parts and components, such as engine blocks and boat windshields. The prices for these raw materials, parts and components fluctuate depending on market conditions. Significant increases in the cost of such materials would raise our production costs, which could reduce profitability if we did not recoup the increased costs through higher product prices.
As our manufacturing operations continued to raise production levels in 2016, our need for raw materials and supplies increased. During 2016, we experienced some shortages or delayed delivery of certain materials, parts and supplies essential to our manufacturing operations. We have addressed and will continue to address this issue by identifying alternative suppliers, working to secure adequate inventories of critical supplies and continually monitoring the capabilities of our supplier base. In 2017, we anticipate our suppliers will need to increase their manufacturing operations to meet the rising demand for their products and, in many cases, may need to hire additional workers in order to fulfill the orders placed by us and other customers.
We also continue to expand our global procurement operations to better leverage purchasing power across our divisions and to improve supply chain and cost efficiencies. We mitigate commodity price risk on certain raw material purchases by entering into fixed priced contracts to mitigate exposure related to changes in commodity prices.
5
Intellectual Property
We have, and continue to obtain, patent rights covering certain features of our products and processes. By law, our patent rights, which consist of patents and patent licenses, have limited lives and expire periodically. We believe that our patent rights are important to our competitive position in all of our business segments. Our trademark rights have indefinite lives, and many are well known to the public and are considered to be valuable assets. Most of our intellectual property is owned by U.S. entities.
In the Marine Engine segment, patent rights principally relate to features of outboard engines and inboard-outboard drives, hybrid drives and pod drives, including: die-cast powerheads; cooling and exhaust systems; drivetrain, clutch and gearshift mechanisms; boat/engine mountings; shock-absorbing tilt mechanisms; ignition systems; propellers; marine vessel control systems; fuel and oil injection systems; supercharged engines; outboard mid-section structures; segmented cowls; hydraulic trim, tilt and steering; screw compressor charge air cooling systems; a range of proprietary metal alloys; and airflow silencers.
In the Boat segment, patent rights principally relate to processes for manufacturing fiberglass hulls, decks and components for boat products, as well as patent rights related to interiors and other boat features and components.
In the Fitness segment, patent rights principally relate to fitness equipment designs and components, including patents covering internal processes, programming functions, displays, design features and styling, as well as billiards table designs and components and active workplace furniture and equipment.
The following are our principal trademarks:
Marine Engine Segment:
Attwood, Axius, Garelick, Kellogg Marine Supply, Land 'N' Sea, Mariner, MerCruiser, Mercury, Mercury Marine, Mercury Precision Parts, Mercury Propellers, Mercury Racing, MotorGuide, OptiMax, Quicksilver, Seachoice, SeaPro, SmartCraft, Sport-Jet, Swivl-Eze, Valiant, Verado, Whale and Zeus.
Boat Segment:
Bayliner, Boston Whaler, Crestliner, Cypress Cay, Harris, Heyday, Lowe, Lund, Master Dealer, Meridian, Princecraft, Protector, Quicksilver, Rayglass, Sea Ray, Thunder Jet and Uttern.
Fitness Segment:
Air Hockey, Brunswick, Contender, Cybex, Flex Deck, Gold Crown, Hammer Strength, Indoor Cycling Group, InMovement, Lifecycle, Life Fitness and SCIFIT.
Competitive Conditions and Position
We believe that we have a reputation for quality in each of our highly competitive lines of business. We compete in various markets by: utilizing efficient production techniques; developing and strengthening our leading brands; developing and promoting innovative technological advancements; undertaking effective marketing, advertising and sales efforts; providing high-quality, innovative products at competitive prices; and offering extensive aftermarket products.
Strong competition exists in each of our product groups, but no single enterprise competes with us in all product groups. In each product area, competitors range in size from large, highly-diversified companies to small, single-product businesses. We also indirectly compete with businesses that offer alternative leisure products or activities.
The following summarizes our competitive position in each segment:
Marine Engine Segment:
We believe the Marine Engine segment is a world leader in the manufacture and sale of recreational and commercial marine engines and marine parts and accessories. The marine engine market is highly competitive among several major international companies that comprise the majority of the market, including Japanese-based outboard engine manufacturers, as well as several smaller companies including Chinese manufacturers. Competitive advantage in this segment is a function of product features, technological leadership, quality, service, pricing, performance and durability, along with effective promotion and distribution.
Boat Segment:
We believe that the Boat segment is a world leader in the manufacture and sale of pleasure motorboats. There are several major manufacturers of pleasure and offshore fishing boats, along with hundreds of smaller manufacturers. Consequently, this business is both highly competitive and highly fragmented. We believe that we have the broadest range of boat product offerings in the world, with boats ranging in size from 10 to 65 feet. In all of our boat operations, we compete on the basis of product features, technology, quality, brand strength, dealer service, pricing, performance, value, durability and styling, along with effective promotion and distribution.
6
Fitness Segment:
We believe we are the world's largest manufacturer of commercial fitness equipment and a leading manufacturer of high-quality consumer fitness equipment and billiards tables. The fitness equipment industry is highly competitive among several major international companies that comprise the majority of the market, as well as many smaller manufacturers, which creates a highly fragmented, competitive landscape. Many of our fitness equipment offerings include industry-leading product features, and we place significant emphasis on introducing innovative fitness equipment to the market. Competitive focus is also placed on product quality, technology, service, pricing, state-of-the-art biomechanics and effective promotional activities. The billiards industry continues to experience competitive pressure from low-cost billiards manufacturers outside the United States, and InMovement products also face competition, primarily from furniture manufacturers and distributors.
Research and Development
We strive to improve our competitive position in all of our segments by continuously investing in research and development to drive innovation in our products and manufacturing technologies. Our research and development investments support the introduction of new products and enhancements to existing products. Research and development expenses were 3.1 percent of net sales in
2016
,
2015
and
2014
. Research and development expenses by segment are discussed in
Note 6 –
Segment Information
.
Number of Employees
The number of employees worldwide is shown below by segment:
|
December 31, 2016
|
December 31, 2015
|
||||||||||
|
Total
|
Union (domestic)
|
Total
|
Union (domestic)
|
||||||||
|
Marine Engine
(A)
|
6,112
|
|
1,926
|
|
5,686
|
|
1,803
|
|
|||
|
Boat
|
5,071
|
|
—
|
|
4,539
|
|
—
|
|
|||
|
Fitness
|
2,893
|
|
139
|
|
2,209
|
|
143
|
|
|||
|
Corporate
(B)
|
339
|
|
—
|
|
311
|
|
—
|
|
|||
|
Total
(C)
|
14,415
|
|
2,065
|
|
12,745
|
|
1,946
|
|
|||
(A) The number of Marine Engine employees as of December 31, 2015 has been adjusted from the amount reported on the 2015 Form 10-K due to the exclusion of certain employees related to an acquisition completed in the latter part of 2015.
(B) Corporate numbers include certain information technology employees and shared services.
(C) All employee numbers exclude temporary employees.
The Company believes that the relationships between its employees, any labor unions and the Company remain stable.
Environmental Requirements
Refer to
Note 13 –
Commitments and Contingencies
in the Notes to Consolidated Financial Statements for a description of certain environmental proceedings.
Available Information
Brunswick maintains an Internet website at http://www.brunswick.com that includes links to our Annual Report on Form 10-K, Quarterly Reports on Form 10-Q, Current Reports on Form 8-K and any amendments to those reports, and proxy statements (SEC Filings). The SEC Filings are available without charge as soon as reasonably practicable following the time that they are filed with, or furnished to, the SEC. Shareholders and other interested parties may request email notification of the posting of these documents through the Investors section of our website.
7
The Company's operations and financial results are subject to certain risks and uncertainties, including those described below, which could adversely affect our business, financial condition, results of operations, cash flows and the trading price of our common stock.
Worldwide economic conditions have hurt our industries, businesses and results of operations and may continue to do so.
In times of economic uncertainty and contraction, consumers tend to have less discretionary income and to defer expenditures for discretionary items, which adversely affects our financial performance, especially in the marine businesses. Although we have worked to expand the portions of our portfolio that are less susceptible to economic cycles, a portion of the business remains cyclical and sensitive to personal spending levels. In addition, general economic conditions in certain international markets, including Latin America, Africa and the Middle East and Canada, continue to be challenging with respect to weak currencies, commodity market impacts and corresponding weak economic conditions.
Deterioration in general economic conditions that in turn diminishes consumer confidence or discretionary income may reduce our sales, or we may decide to lower pricing for our products, thus adversely affecting our financial results, including increasing the potential for future impairment charges. Further, most of our products are used for recreation, and consumers’ limited discretionary income in times of economic hardship may be diverted to other activities that occupy their time, such as other forms of recreation, religious, cultural or community activities. We cannot predict the timing or strength of economic recovery, either worldwide or in the specific markets in which we compete.
Changes in currency exchange rates can adversely affect our results.
Some of our sales are denominated in a currency other than the U.S. dollar. Consequently, a strong U.S. dollar may adversely affect reported revenues. We have hedging programs in place to reduce our risk to currency fluctuations; however, we cannot hedge against all currency risks, especially over the long term. We maintain a portion of our cost structure in currencies other than the U.S. dollar, which partially mitigates the impact of a strengthening U.S. dollar. This includes manufacturing operations for boats in Europe and Canada, fitness equipment in Europe, and smaller outboard engines manufactured and purchased from our joint venture in Japan. We also continue to evaluate the supply chain and cost structure for opportunities to further mitigate foreign currency risks.
We sell products manufactured in the U.S. into certain international markets in U.S. dollars, including to Canada, Europe and Latin America. Demand for our products in these markets may be diminished by a strengthening U.S. dollar. Some of our competitors with cost positions based outside the U.S., including Asian-based outboard engine and fitness equipment manufacturers, European-based large fiberglass boat manufacturers and a European-based fitness equipment manufacturer, may have an improved cost position due to a strengthening U.S. dollar, which could result in pricing pressures on our products. These factors existed throughout 2015 and 2016, but we do not believe they resulted in any material change in our competitive position.
An inability to make targeted acquisitions or failure to successfully integrate newly acquired businesses could negatively impact financial results.
Our growth initiatives include making strategic acquisitions, which depend on the availability of suitable targets at acceptable terms and our ability to complete the deals. In order to manage our acquisition strategy, we conduct rigorous due diligence, involve various functions and continually review our strategy and target acquisitions, all of which we believe mitigates our acquisition risks. However, we cannot assure that acquisitions will be consummated or that, if consummated, they will be successful. Acquisitions pose risks such as our ability to project and evaluate market demand, maximize potential synergies and cost savings; make accurate accounting estimates; and achieve anticipated business objectives. As we continue to grow, in part, through acquisitions, our success depends on our ability to anticipate and effectively manage these risks. If acquired businesses do not achieve projected results, our growth may be limited and our results adversely affected.
In addition, acquisitions present integration risks, including that the acquisition may:
|
•
|
disrupt operations in core, adjacent or acquired businesses;
|
|
•
|
require more time than anticipated to be fully integrated into Company operations and systems;
|
|
•
|
create more costs than projected;
|
|
•
|
divert management attention;
|
|
•
|
create the potential of losing customer, supplier or other critical business relationships; and
|
|
•
|
pose difficulties retaining employees.
|
8
If we fail to timely and successfully integrate new businesses into existing operations, we may see higher production costs, lost sales or otherwise diminished earnings and financial results.
Failure to successfully implement our strategic plan and growth initiatives could have a material adverse effect on our business and financial condition.
Our ability to continue generating strong cash flow and profits depends partly on the sustained successful execution of our strategic plan and growth initiatives, including making acquisitions and expanding into new adjacent markets and customers. To address risks associated with our plan and growth initiatives, we have established processes to regularly review, manage and modify our plans, and we believe we have appropriate oversight to monitor initiatives and their impact. Our strategic plan and growth initiatives require significant capital investment and management attention, however, which could result in the diversion of these resources from the core business and other business issues and opportunities. Additionally, any new initiative is subject to certain risks, including customer acceptance, competition, the ability to manufacture products on schedule and to specification, the ability to create the necessary supply chain and/or the ability to attract and retain qualified management and other personnel. There is no assurance that we will be able to develop and successfully implement our strategic plan and growth initiatives to a point at which they will become profitable or generate positive cash flow.
Fiscal concerns may negatively impact worldwide credit conditions and adversely affect our industries, businesses and financial condition.
Fiscal policy could have a material adverse impact on worldwide economic conditions, the financial markets and availability of credit and, consequently, may negatively affect our industries, businesses and overall financial condition. Customers often finance purchases of our products, particularly boats. Credit market conditions continued to improve in 2016, but remained less favorable overall than those in existence prior to the decline in marine retail demand beginning in 2007. While interest rates are generally lower, there continue to be fewer lenders, tighter underwriting and loan approval criteria, greater down payment requirements and negative loan equity, particularly in larger products. If credit conditions worsen, and adversely affect the ability of customers to finance potential purchases at acceptable terms and interest rates, it could result in a decrease in sales or delay improvement in sales.
Dealer or distributor inability to secure adequate access to capital could adversely affect our sales.
Our dealers require adequate liquidity to finance their operations, including purchasing our products. Dealers are subject to numerous risks and uncertainties that could unfavorably affect their liquidity positions, including, among other things, continued access to adequate financing sources on a timely basis on reasonable terms. These financing sources are vital to our ability to sell products through our distribution network, particularly to boat and engine dealers. Entities affiliated with Wells Fargo & Company, including BAC, the Company’s 49 percent owned joint venture, finance a significant portion of our boat and engine sales to dealers through floorplan financing to marine dealers.
Many factors continue to influence the availability and terms of financing that our dealer floorplan financing providers offer, including:
|
•
|
their ability to access certain capital markets, such as the securitization and the commercial paper markets, and to fund their operations in a cost effective manner;
|
|
•
|
the performance of their overall credit portfolios;
|
|
•
|
their willingness to accept the risks associated with lending to marine dealers; and
|
|
•
|
the overall creditworthiness of those dealers.
|
Our sales could be adversely affected if financing terms change unfavorably or if BAC were to be terminated. This could require dealers to find alternative sources of financing, including our direct financing to dealers, which could require additional capital to fund the associated receivables.
Our financial results could be adversely affected if we are unable to maintain effective distribution.
We rely on third-party dealers and distributors to sell the majority of our products, particularly in the marine businesses. Maintaining a reliable network of dealers is essential to our success. We face competition from other manufacturers in attracting and retaining distributors and independent boat dealers. A significant deterioration in the number or effectiveness of our dealers and distributors could have a material adverse effect on our financial results.
Although at present we believe dealer health to be generally favorable, weakening demand for marine products could hurt our dealers’ financial performance. In particular, reduced cash flow from decreases in sales and tightening credit markets may
9
impair dealers' ability to fund operations. Inability to fund operations can force dealers to cease business, and we may be unable to obtain alternate distribution in the vacated market. An inability to obtain alternate distribution could unfavorably affect our net sales through reduced market presence. If economic conditions deteriorate, we anticipate that dealer failures or voluntary market exits would increase, especially if overall retail demand materially declines.
Finally, labor disruption at major ports and shipping hubs around the world may adversely affect our ability to transport raw materials to our facilities and products to our distributors and end-use customers, potentially resulting in increased transportation costs and lost sales.
Adverse economic, credit and capital market conditions could have a negative impact on our financial results.
We do not frequently rely on short-term capital markets to meet our working capital requirements, fund capital expenditures, pay dividends or fund employee benefit programs; however, we do maintain short-term borrowing facilities that can be used to meet these capital requirements. In addition, over the long term, we may determine that it is necessary to access the capital markets to refinance existing long-term indebtedness or for other initiatives.
Adverse global economic conditions, market volatility and regulatory uncertainty could lead to volatility and disruptions in the capital and credit markets. This could adversely affect our ability to access capital and credit markets or increase the cost to do so, which could have a negative impact on our business, financial results and competitive position.
Inventory reductions by major dealers, retailers and independent boat builders could adversely affect our financial results.
The Company and our dealers, retailers and other distributors could decide to reduce the number of units they hold, particularly if demand trails forecasted levels or if new product introductions are expected to replace older products. Such efforts tend to result in wholesale sales reductions in excess of retail sales reductions and would likely result in lower production levels of our products, causing lower rates of absorption of fixed costs in our manufacturing facilities and lower margins. While we continue to work to keep dealer inventories at appropriate levels, potential inventory reductions remain a risk to our future sales and results of operations.
We may be required to repurchase inventory or accounts of certain dealers.
We have agreements with certain third-party finance companies to provide financing to our customers, enabling them to purchase our products. In connection with these agreements, we may either have obligations to repurchase our products from the finance company, or may have recourse obligations to the finance company on the dealer’s receivables. These obligations may be triggered if our dealers default on their debt obligations to the finance companies.
Our maximum contingent obligation to repurchase inventory and our maximum contingent recourse obligations on customer receivables are less than the total balances of dealer financings outstanding under these programs, because our obligations under certain of these arrangements are subject to caps, or are limited based on the age of product. Our risk related to these arrangements is mitigated by the proceeds we receive on the resale of repurchased product to other dealers, or by recoveries on receivables purchased under the recourse obligations.
Our inventory repurchase obligations relate primarily to the inventory floorplan credit facilities of our boat and engine dealers. Our actual historical repurchase experience related to these arrangements has been substantially less than our maximum contractual obligations. If dealers file for bankruptcy or cease operations, however, we could incur losses associated with the repurchase of our products. In addition, as the repurchases may be triggered by dealer bankruptcies, our net sales and earnings may be unfavorably affected as a result of reduced market coverage and the associated decline in sales.
Declines in marine industry demand could cause an increase in future repurchase activity, or could require us to incur losses in excess of established reserves. In addition, our cash flow and loss experience could be adversely affected if repurchased inventory is not successfully distributed to other dealers in a timely manner, or if the recovery rate on the resale of the product declines. The finance companies could require changes in repurchase or recourse terms that would result in an increase in our contractual contingent obligations.
Loss of key customers could harm our business.
In each segment, we have important relationships with key customers. If we lost such a key customer, our business could be adversely effected. In addition, certain customers could try to negotiate more favorable pricing of our products, which could depress earnings. In an effort to mitigate the risk associated with reliance on key customer accounts, we continually monitor such relationships and maintain a complete and competitive product lineup.
10
Our success depends upon the continued strength of our brands.
We believe that our brands, including Mercury, Life Fitness, Sea Ray, Boston Whaler and Lund, significantly contribute to our success, and that maintaining and enhancing these brands is important to expanding our customer base. A failure to adequately promote and protect our brands could adversely affect our business and results of operations. Further, in connection with the divestiture of the bowling businesses, we licensed certain trademarks and servicemarks, including use of the name “Brunswick,” to the acquiring companies. Our reputation may be adversely affected by the purchasers' inappropriate use of the marks or of the name Brunswick, including potential negative publicity, loss of confidence or other damage to our image due to this licensed use.
We have a fixed cost base that can affect our profitability in a declining sales environment.
The fixed cost levels of operating production facilities can put pressure on profit margins when sales and production decline. We have maintained discipline over our fixed cost base during the economic recovery; however, our profitability is dependent, in part, on our ability to spread fixed costs over an increasing number of products sold and shipped, and if we are required to reduce our rate of production, gross margins could be negatively affected if we are unable to lower fixed costs accordingly. Consequently, decreased demand or the need to reduce inventories can lower our ability to absorb fixed costs and materially impact our results.
Successfully managing the expansion of our manufacturing footprint is critical to our operating and financial results.
Over the past four years, we have made strategic capital investments in capacity expansion activities that will enable our businesses to successfully capture growth opportunities and enhance product offerings. Recently, we initiated or completed expansion activities at our facilities in Edgewater, Florida; Ramsey and Owatonna, Minnesota; Fond du Lac, Wisconsin; and Petit-Rechain, Belgium. We must carefully manage these capital improvement projects and expansions to ensure they meet cost targets, comply with applicable environmental, safety and other regulations and uphold high-quality workmanship.
Moving production to a different plant or expanding capacity at an existing facility involves risks, including difficulties initiating production within the cost and timeframe estimated, supplying product to customers when expected, integrating new products and attracting sufficient skilled workers to handle additional production demands. If we fail to meet these objectives, it could adversely affect our ability to meet customer demand for products and increase the cost of production versus projections, both of which could result in a significant adverse impact on operating and financial results. Additionally, plants experiencing demand increases may face manufacturing inefficiencies; additional expenses, including higher wages; and cost inefficiencies, which could exceed projections and negatively impact financial results.
Our financial results may be adversely affected by increased costs, disruption of supply or defects in raw materials, parts and product components we buy from third-party suppliers.
We rely on third-parties to supply raw materials used in the manufacturing process, including oil, aluminum, copper, steel and resins, as well as product parts and components. The prices for these raw materials, parts and components fluctuate depending on market conditions and, in some instances, commodity prices. Substantial increases in the prices of raw materials, parts and components would increase our operating costs, and could reduce our profitability if we could not recoup the increased costs through higher product prices. Similarly, if a critical supplier were to close its operations, cease manufacturing or otherwise fail to deliver an essential component necessary to our manufacturing operations, that could detrimentally affect our ability to manufacture and sell our products, resulting in an interruption in business operations and/or a loss of sales.
In addition, some components used in our manufacturing processes, including certain engine components, furniture, upholstery and boat windshields, are available from a sole supplier or a limited number of suppliers. Operational and financial difficulties that these or other suppliers may face in the future could adversely affect their ability to supply us with the parts and components we need, which could significantly disrupt our operations. It may be difficult to find a replacement supplier for a limited or sole source raw material, part or component without significant delay or on commercially reasonable terms. In addition, an uncorrected defect or supplier's variation in a raw material, part or component, either unknown to us or incompatible with our manufacturing process, could jeopardize our ability to manufacture products.
Some additional supply risks that could disrupt our operations, impair our ability to deliver products to customers and negatively affect our financial results include:
|
•
|
financial pressures on our suppliers due to a weakening economy or unfavorable conditions in other end markets;
|
|
•
|
a deterioration of our relationships with suppliers; or
|
|
•
|
events such as natural disasters, power outages or labor strikes.
|
11
These risks are exacerbated in the case of single-source suppliers, and the exclusive supplier of a key component potentially could exert significant bargaining power over price, quality, warranty claims or other terms.
We continue to increase production; consequently, our need for raw materials and supplies continues to increase. Our suppliers must be prepared to ramp up operations and, in many cases, hire additional workers and/or expand capacity in order to fulfill our orders and those of other customers. Cost increases, defects or sustained interruptions in the supply of raw materials, parts or components due to delayed start-up periods our suppliers experience as they increase production efforts create risks to our operations and financial results. The Company experienced periodic supply shortages in 2016. We continue to address these issues by identifying alternative suppliers for key materials and components, working to secure adequate inventories of critical supplies and continually monitoring the capabilities of our supplier base. In the future, however, we may experience shortages, delayed delivery and/or increased prices for key materials, parts and supplies that are essential to our manufacturing operations.
Our pension funding requirements and expenses are affected by certain factors outside our control.
Our funding obligations and pension expense for our four U.S. qualified pension plans are driven by the performance of assets set aside in trusts for these plans, the discount rate used to value the plans’ liabilities, actuarial data and experience and legal and regulatory funding requirements. Changes in these factors could have an adverse impact on our results of operations, liquidity or shareholders’ equity. In addition, a small portion of our pension plan assets are invested in equity securities, which can experience significant declines if economic conditions or financial markets weaken. The level of the Company's funding of our qualified pension plan liabilities was approximately 78 percent as of December 31, 2016. Our future pension expense and funding requirements could increase due to the effect of adverse changes in the discount rate and asset levels along with a decline in the estimated return on plan assets. In addition, changes to legal regulations could require us to make increased contributions to the pension plans; these contributions could be material and negatively affect cash flow.
We are currently mitigating these risks by maintaing an asset allocation with a high percentage of fixed income investments and by lowering plan liabilities by transferring obligations to a third party through annuity purchases.
The timing and amount of our share repurchases are subject to a number of uncertainties.
During the fourth quarter of 2014, the Company announced that the Board of Directors had authorized the discretionary repurchase of up to $200 million of our outstanding common stock, to be systematically completed in the open market or through privately negotiated transactions. In February 2016, the Board increased our existing share repurchase authorization by $300 million. The remaining authorization under these programs is $240 million. The amount and timing of share repurchases are based on a variety of factors. Important considerations that could cause us to limit, suspend or delay stock repurchases include:
|
•
|
unfavorable market conditions;
|
|
•
|
the trading price of the Company's common stock;
|
|
•
|
the nature of other investment opportunities available to us from time to time; and
|
|
•
|
the availability of cash.
|
Delaying, limiting or suspending our stock repurchase program may negatively affect our stock price and earnings per share.
Higher energy and fuel costs can affect our results.
Higher energy and fuel costs increase operating expenses at our manufacturing facilities and the cost of shipping products to customers. In addition, increases in energy costs can adversely affect the pricing and availability of petroleum-based raw materials such as resins and foam that are used in many of our marine products. Higher fuel prices may also have an adverse effect on demand for marine retail products, as they increase the cost of boat ownership and possibly affect product use.
Our profitability may suffer as a result of competitive pricing and other pressures.
The introduction of lower-priced alternative products or services by other companies can hurt our competitive position in all of our businesses. We are constantly subject to competitive pressures in which predominantly international manufacturers may pursue a strategy of aggressive pricing, particularly during periods when their local currency weakens versus the U.S. dollar. Such pricing pressure may limit our ability to increase prices for our products in response to raw material and other cost increases and negatively affect our profit margins.
In addition, international boat builders continue to expand distribution in U.S. markets, mainly in the large fiberglass boat segment, thereby introducing additional product options into a market in which we believe we are a market leader. The market
12
for large boats grew slightly in 2016, and could expand, but as new entrants introduce potentially lower cost product alternatives, demand could be diverted away from our premium products.
Finally, our independent boat builder customers may react negatively to potential competition for their products from Brunswick’s own boat brands, which can lead them to purchase marine engines and marine engine supplies from competing marine engine manufacturers and may negatively affect demand for our products.
Our ability to remain competitive depends on successfully introducing new products and meeting customer expectations.
We believe that our customers look for and expect quality, innovation and advanced features when evaluating products and making purchasing decisions. Our ability to remain competitive and meet our growth objectives may be adversely affected by difficulties or delays in product development, such as an inability to develop viable new products, gain market acceptance of new products, generate sufficient capital to fund new product development or obtain adequate intellectual property protection for new products. To meet ever-changing consumer demands, both timing of market entry and pricing of new products are critical. As a result, we may not be able to introduce new products that are necessary to remain competitive in all markets that we serve. Furthermore, we must continue to meet or exceed customers' expectations regarding product quality and after-sales service.
Our business operations could be negatively impacted by an outage or breach of our information technology systems.
We manage our global business operations through a variety of information technology (IT) systems which we continually enhance to increase efficiency and security. We depend on these systems for commercial transactions, customer interactions, manufacturing, branding, employee tracking and other applications. Some of the systems are based on legacy technology and operate with a minimal level of available support, and recent acquisitions using other systems have added to the complexity of our IT infrastructure. We are working to upgrade, streamline and integrate these systems and have invested in strategies to prevent a failure or breach but, like those of other companies, our systems are susceptible to outages due to natural disasters, power loss, computer viruses, security breaches and similar events. If a legacy system or another of the Company's key IT systems were to fail or if our IT systems were unable to communicate effectively, this could result in missed or delayed sales or lost opportunities for cost reduction or efficient cash management.
We exchange information with hundreds of trading partners across all aspects of our commercial operations. A breakdown, outage, malicious intrusion, random attack or other disruption of communications could result in erroneous transactions or loss of reputation and confidence. We have numerous e-commerce and e-marketing portals and our systems may contain personal information in connection with human resources, financial services or other business operations; therefore, we must continue to be diligent in protecting against malicious cyber attacks. A successful breach could result in a disruption of services, fraudulent transactions or disclosure of confidential information. This could negatively affect our relationships with customers or trading partners, lead to potential claims against the Company and damage our image and reputation.
We manufacture and sell products that create exposure to potential claims and litigation.
Our manufacturing footprint expansions and the products we produce could result in product quality, warranty, personal injury, property damage and other issues, thereby increasing the risk of litigation and potential liability. To address this risk, we have established a global, enterprise-wide program charged with the responsibility for addressing, reviewing and reporting on product integrity issues. Historically, the resolution of such claims has not had a materially adverse effect on our business, and we maintain what we believe to be adequate insurance coverage to mitigate a portion of these risks. However, we may experience material losses in the future, incur significant costs to defend claims or issue product recalls, or experience claims in excess of our insurance coverage or that are not covered by insurance. Furthermore, our reputation may be adversely affected by such claims, whether or not successful, including potential negative publicity about our products. We record reserves for known potential liabilities, but there is the possibility that actual losses may exceed these reserves and therefore negatively impact earnings.
If our intellectual property protection is inadequate, others may be able to use our technologies and impair our ability to compete, which could have a material adverse effect on our financial condition and results of operations.
We regard much of the technology underlying our products as proprietary. We rely on a combination of patents, trademark, copyright and trade secret laws; employee and third-party non-disclosure agreements; and other contracts to establish and protect our technology and other intellectual property rights. However, we remain subject to risks, including:
|
•
|
the steps we take to protect our proprietary technology may be inadequate to prevent misappropriation of our technology;
|
|
•
|
third parties may independently develop similar technology;
|
|
•
|
agreements containing protections may be breached or terminated;
|
|
•
|
we may not have adequate remedies for breaches;
|
13
|
•
|
existing patent, trademark, copyright and trade secret laws may afford limited protection;
|
|
•
|
a third party could copy or otherwise obtain and use our products or technology without authorization;
|
|
•
|
we may be required to litigate to defend against infringement claims or to protect our intellectual property rights; and
|
|
•
|
we may not prevail in intellectual property litigation.
|
Policing unauthorized use of our intellectual property is difficult, particularly outside the U.S., and litigating intellectual property claims may result in substantial cost and divert management’s attention. Further, we may not prevail in litigation, forcing us to seek licenses or royalty arrangements from third parties, which we may not be able to obtain on reasonable terms, or an order or requirement to stop manufacturing, using, selling or distributing products that included challenged intellectual property, which could harm our business.
Compliance with environmental, zoning and other laws and regulations may increase costs and reduce demand for our products.
We are subject to federal, state, local and foreign laws and regulations, including product safety, environmental, health and safety and other regulations. While we believe that we maintain the requisite licenses and permits and that we are in material compliance with applicable laws and regulations, a failure to satisfy these and other regulatory requirements could result in fines or penalties, and compliance could increase the cost of operations. The adoption of additional laws, rules and regulations, including higher emissions standards, could increase our manufacturing costs, increase consumer pricing and reduce consumer demand for our products. In addition, we are unable to predict with any reasonable degree of certainty whether reforms or repeal of current laws, rules or regulations under a new administration will positively or negatively affect our operations or financial results.
Environmental restrictions, boat plant emission restrictions and permitting and zoning requirements can limit production capacity, access to water for boating, marina and storage space. While future licensing requirements, including any licenses imposed on recreational boating, are not expected to be unduly restrictive, they may deter potential customers, thereby reducing our sales. Furthermore, regulations allowing the sale of fuel containing higher levels of ethanol for automobiles, which is not appropriate or intended for use in marine engines, may nonetheless result in increased warranty, service costs, product dissatisfaction and other claims against the Company if boaters mistakenly use this fuel in marine engines, causing damage to and the degradation of components in their marine engines.
Our manufacturing processes involve the use, handling, storage and contracting for recycling or disposal of hazardous or toxic substances or wastes. Accordingly, we are subject to regulations regarding these substances, and the misuse or mishandling of such substances could expose us to liabilities, including claims for property, personal injury or natural resources damages, or fines. We are also subject to laws requiring the cleanup of contaminated property, including cleanup efforts currently underway. If a release of hazardous substances occurs at or from one of our current or former properties or another location where we have disposed of hazardous materials, we may be held liable for the contamination, regardless of knowledge or whether we were at fault, and the amount of such liability could be material.
Additionally, we are subject to laws governing our relationships with employees, including, but not limited to, employment obligations as a federal contractor and employee wage, hour and benefit issues, such as pension funding and health care benefits. Changes to legislation or regulations governing employment obligations could increase the cost of our operations.
Changes in income tax laws or enforcement could have a material adverse impact on our financial results.
Changes in domestic and international tax laws could positively or negatively impact our tax provision, cash flow and/or tax related balance sheet amounts, including our deferred tax asset values. As a result of the administration change in the United States, the likelihood that changes may occur has increased. We are currently unable to predict with a reasonable degree of certainty what the legal changes will be and the potential outcome on our financial statements. Any changes in law will likely have broader implications, including impacts to the economy, currency markets, inflation environment, consumer behavior and/or competitive dynamics, which may positively or negatively impact the Company.
An impairment in the carrying value of goodwill, trade names and other long-lived assets could negatively affect our consolidated results of operations and net worth.
Goodwill and indefinite-lived intangible assets, such as our trade names, are recorded at fair value at the time of acquisition and are not amortized, but are reviewed for impairment at least annually or more frequently if impairment indicators arise. In evaluating the potential for impairment of goodwill and trade names, we make assumptions regarding future operating performance, business trends and market and economic conditions. Such analyses further require us to make certain assumptions about sales, operating margins, growth rates and discount rates. Uncertainties are inherent in evaluating and applying these factors to the assessment of goodwill and trade name recoverability. We could be required to evaluate the recoverability of goodwill or trade
14
names prior to the annual assessment if we experience business disruptions, unexpected significant declines in operating results, a divestiture of a significant component of our business or declines in market capitalization.
We also continually evaluate whether events or circumstances have occurred that indicate the remaining estimated useful lives of our definite-lived intangible assets and other long-lived assets may warrant revision or whether the remaining balance of such assets may not be recoverable. We use an estimate of the related undiscounted cash flow over the remaining life of the asset in measuring whether the asset is recoverable.
If the future operating performance of the Company's reporting units is not sufficient, we could be required to record non-cash impairment charges. Impairment charges could substantially affect our reported earnings in the periods such charges are recorded. In addition, impairment charges could indicate a reduction in business value which could limit our ability to obtain adequate financing in the future. As of December 31, 2016, goodwill was approximately 13 percent of total assets and included $387 million of goodwill related to the Life Fitness segment, $25 million of goodwill related to the Marine Engine segment and $2 million of goodwill related to the Boat segment.
Some of our operations are conducted by joint ventures that are not operated solely for our benefit.
We share ownership and management responsibilities with jointly owned companies such as BAC, Bella and Tohatsu Marine Corporation. These joint ventures may not have the same goals, strategies, priorities or resources as the Company because they are intended to be operated for the benefit of all co-owners, rather than for our exclusive benefit. If such a conflict occurred, it could negatively impact or sales or financial results.
A significant portion of our revenue is derived from international sources, which creates additional uncertainty.
We intend to continue to expand our international operations and customer base as part of our growth strategy. Sales outside the United States, especially in emerging markets, are subject to various risks, including government embargoes or foreign trade restrictions, foreign currency effects, tariffs, customs duties, inflation, difficulties in enforcing agreements and collecting receivables through foreign legal systems, compliance with international laws, treaties and regulations and unexpected changes in regulatory environments, disruptions in distribution, dependence on foreign personnel and unions, as well as economic and social instability. In addition, there may be tax inefficiencies in repatriating cash from non-U.S. subsidiaries, or tax laws that affect this process may change.
Instability, including, but not limited to, political events, civil unrest and an increase in criminal activity, in locations where we maintain a significant presence could adversely impact our manufacturing and business operations. Decreased stability poses a risk of business interruption and delays in shipments of materials, components and finished goods, as well as a risk of decreased local retail demand for our products.
In addition, global political and economic uncertainty and shifts, such as the U.K.’s referendum on membership in the European Union, pose risks of volatility in global markets, which could affect our operations and financial results. Changes in U.S. policy regarding foreign trade or manufacturing may create negative sentiment about the U.S. among non-U.S. customers, employees or prospective employees, which could adversely affect our business, sales, hiring and employee retention. If we continue to expand our business globally, our success will depend, in part, on our ability to anticipate and effectively manage these and other risks, which could materially impact international operations or the business as a whole.
Our operations are dependent on our ability to attract and retain key contributors and on the successful implementation of our succession plans.
Much of our future success depends on, among other factors, our ability to attract and retain qualified personnel, including executives and skilled labor. If we are not successful in these efforts, we may be unable to meet our operating goals and plans, which may impact our financial results. In order to manage this risk, we perform an annual review of management succession plans with the Board of Directors, including reviewing executive officer and other important positions. We believe this helps to substantially mitigate the risk associated with key contributor transitions. In addition, we continuously develop and improve recruiting and training programs to attract and retain an experienced and skilled workforce.
Adverse weather conditions and climate events can have a negative effect on marine revenues.
Changes in seasonal weather conditions can have a significant effect on our operating and financial results, especially in the marine businesses. Sales of our marine products are typically stronger just before and during spring and summer, and favorable weather during these months generally has had a positive effect on consumer demand. Conversely, unseasonably cool weather, excessive rainfall or drought conditions during these periods can reduce demand. Additionally, climate changes, regardless of
15
the cause, resulting in environmental changes including, but not limited to, severe weather, changing sea levels, poor water conditions or reduced access to water, could disrupt or negatively affect our business.
Catastrophic events, including natural and environmental disasters, could have a negative effect on our operations and financial results.
Hurricanes, floods, earthquakes, storms and catastrophic natural or environmental disasters could disrupt our distribution channel, operations or supply chain and decrease consumer demand. If a catastrophic event takes place in one of our major sales markets, our sales could be diminished. Additionally, if such an event occurs near our business, manufacturing facilities or key suppliers' facilities, business operations and/or operating systems could be interrupted. We could be uniquely affected by a catastrophic event due to the location of certain of our boat facilities in coastal Florida and the size of the manufacturing operation in Fond du Lac, Wisconsin.
None.
Our headquarters are in Lake Forest, Illinois. We have numerous manufacturing plants, distribution warehouses, sales offices and product test sites around the world. Research and development facilities are primarily located at manufacturing sites.
We believe our facilities are suitable and adequate for our current needs and are well maintained and in good operating condition. Most plants and warehouses are of modern, single-story construction, providing efficient manufacturing and distribution operations. We believe our manufacturing facilities have the capacity, or we are investing to increase capacity, to meet current and anticipated demand. We own our Lake Forest, Illinois headquarters and most of our principal plants. Refer to
Note 3 –
Restructuring, Integration and Impairment Activities
in the Notes to Consolidated Financial Statements regarding our decision to put the corporate headquarters facility up for sale.
The principal facilities used in our operations are in the following locations:
Marine Engine Segment
Leased facilities include: Fresno, California; Old Lyme, Connecticut; Largo, Miramar and Pompano Beach, Florida; Lowell, Michigan; St. Paul Park, Minnesota; Brisbane and Melbourne, Australia; Toronto, Ontario, Canada; Kuala Lumpur, Malaysia; Auckland, New Zealand; Bangor, Northern Ireland; and Singapore.
Owned facilities include: Panama City and St. Cloud, Florida; Atlanta, Georgia; Brookfield, Fond du Lac and Oshkosh, Wisconsin; Petit Rechain, Belgium; Victoria and Burnaby, British Columbia, Canada; Milton and Oakville Ontario, Canada; Suzhou, China; and Juarez, Mexico.
Boat Segment
Leased facilities include: Santa Catarina, Brazil; Auckland, New Zealand; and Brunswick Commercial and Government Products in Edgewater, Florida.
Owned facilities include: Edgewater, Merritt Island (Sykes Creek) and Palm Coast, Florida; Fort Wayne, Indiana; New York Mills, Minnesota; Lebanon, Missouri; Vonore, Tennessee; Clarkston, Washington; Petit Rechain, Belgium; Princeville, Quebec, Canada; Reynosa, Mexico; and Vila Nova de Cerveira, Portugal.
Fitness Segment
Leased facilities include: Rosemont, Illinois; a portion of the Franklin Park, Illinois facility; Tulsa, Oklahoma; Nuremberg, Germany.
Owned facilities include: a portion of the Franklin Park, Illinois facility; Falmouth, Kentucky; Medway, Massachusetts; Owatonna and Ramsey, Minnesota; Bristol and Delavan, Wisconsin; and Kiskoros, Hungary.
16
Refer to
Note 13 –
Commitments and Contingencies
in the Notes to Consolidated Financial Statements for information about the Company's legal proceedings.
Not applicable.
17
Executive Officers of the Registrant
Brunswick's Executive Officers are listed in the following table:
|
Officer
|
Present Position
|
Age
|
||
|
Mark D. Schwabero
|
Chairman and Chief Executive Officer
|
64
|
||
|
William L. Metzger
|
Senior Vice President and Chief Financial Officer
|
55
|
||
|
Huw S. Bower
|
Vice President and President - Brunswick Boat Group
|
42
|
||
|
Christopher F. Dekker
|
Vice President, General Counsel and Secretary
|
48
|
||
|
Jaime A. Irick
|
Vice President and President - Fitness
|
42
|
||
|
John C. Pfeifer
|
Vice President and President - Mercury Marine
|
51
|
||
|
Brenna Preisser
|
Vice President and Chief Human Resources Officer
|
39
|
||
|
Daniel J. Tanner
|
Vice President and Controller
|
59
|
||
Mark D. Schwabero
was named Chairman and Chief Executive Officer of Brunswick in February 2016. He served as President and Chief Operating Officer of Brunswick from 2014 to 2016 and as Vice President and President - Mercury Marine from December 2008 to May 2014. Previously, Mr. Schwabero was President - Mercury Outboards from 2004 to 2008.
William L. Metzger
was named Senior Vice President and Chief Financial Officer of Brunswick in March 2013. Previously, he served as Vice President and Treasurer of Brunswick from 2001 to 2013 and in a number of positions of increasing responsibility since his employment with Brunswick began in 1987.
Huw S. Bower
was named Vice President and President - Brunswick Boat Group in April 2016. Previously, he served as President - Boston Whaler Group from 2013 to 2016, as President - Lowe Boats from 2010 to 2013 and in positions of increasing responsibility since he started with Brunswick in 2006.
Christopher F. Dekker
was named Vice President, General Counsel and Secretary of Brunswick in October 2014. Prior to his appointment, Mr. Dekker served as Brunswick's Associate General Counsel, with responsibilities for litigation, employment and compliance matters, from 2010 to 2014.
Jaime A. Irick
was named Vice President and President - Fitness in January 2017. Prior to his appointment, Mr. Irick served as Chief Commercial Officer for Current, Powered by GE, a digital power service enabling real-time decisions regarding energy use. Mr. Irick was employed by General Electric for 14 years, in several business units, serving in a variety of roles of increasing responsibility.
John C. Pfeifer
was named Vice President and President - Mercury Marine in May 2014. Prior to his appointment, he was Vice President - Global Operations for Mercury Marine from 2012 to 2014. He had previously been President of Brunswick Marine in EMEA (Europe, Middle East and Africa) from 2008 to 2014 after joining Brunswick in 2006 as President of the Brunswick Asia Pacific Group.
Brenna Preisser
was named Vice President and Chief Human Resources Officer of Brunswick in March 2016. Previously, Ms. Preisser served as Senior Director – Human Resources for Brunswick from 2015 to 2016 and as Vice President – Human Resources for Life Fitness from 2013 to 2015. Ms. Preisser held a number of positions of increasing responsibility since she began her employment with Brunswick in 2004.
Daniel J. Tanner
was named Vice President and Controller of Brunswick in February 2016. Previously, he served as Assistant Vice President - Finance from 2015 to 2016, as Group Financial Officer for Life Fitness from 2003 to 2015 and as Director – Financial Planning and Analysis for Brunswick from 2001 to 2003.
18
Brunswick's common stock is traded on the New York and Chicago Stock Exchanges. Quarterly information with respect to the high and low prices for the common stock and the dividends declared on the common stock is set forth in
Note 22 –
Quarterly Data (unaudited)
in the Notes to Consolidated Financial Statements. As of
February 15, 2017
, there were
8,627
shareholders of record of the Company's common stock.
In the first, second, third and fourth quarter of
2016
, Brunswick paid quarterly dividends on its common stock of
$0.15
,
$0.15
,
$0.15
and
$0.165
per share, respectively. In the first, second, third and fourth quarter of
2015
, Brunswick paid quarterly dividends on its common stock of
$0.125
,
$0.125
,
$0.125
and
$0.15
per share, respectively. Brunswick expects to continue to pay quarterly dividends at the discretion of the Board of Directors, subject to continued capital availability and a determination that cash dividends continue to be in the best interest of the Company's shareholders.
Brunswick's dividend and share repurchase policies may be affected by, among other things, the Company's views on future liquidity, potential future capital requirements and restrictions contained in certain credit agreements.
Performance Graph
Comparison of Five-Year Cumulative Total Shareholder Return among Brunswick, S&P 500 Index and S&P 500 Global Industry Classification Standard (GICS) Consumer Discretionary Index
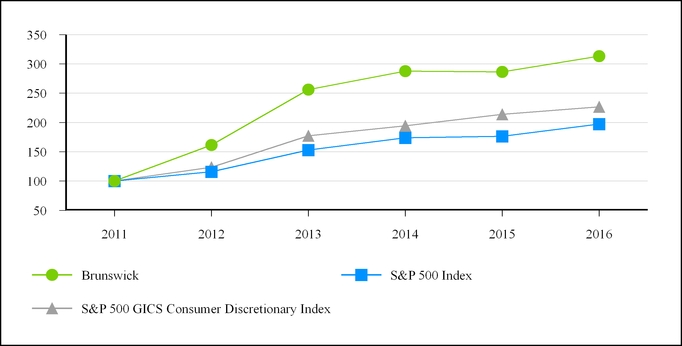
|
2011
|
2012
|
2013
|
2014
|
2015
|
2016
|
|||||||
|
Brunswick
|
100.00
|
|
161.42
|
|
256.26
|
|
287.83
|
|
286.54
|
|
313.03
|
|
|
S&P 500 GICS Consumer Discretionary Index
|
100.00
|
|
123.62
|
|
177.17
|
|
194.20
|
|
213.85
|
|
226.60
|
|
|
S&P 500 Index
|
100.00
|
|
115.95
|
|
153.11
|
|
173.87
|
|
176.32
|
|
197.17
|
|
The basis of comparison is a $100 investment at December 31,
2011
in each of: (i) Brunswick, (ii) the S&P 500 Index and (iii) the S&P 500 GICS Consumer Discretionary Index. All dividends are assumed to be reinvested. The S&P 500 GICS Consumer Discretionary Index encompasses industries including automotive, household durable goods, textiles and apparel and leisure equipment. Brunswick believes the companies included in this index provide the most representative sample of enterprises that are in primary lines of business that are similar to Brunswick's.
19
Issuer Purchases of Equity Securities
The Company has executed share repurchases against authorization approved by the Board of Directors in 2014 and 2016. In 2016, the Company repurchased
$120 million
of stock under these authorizations and as of
December 31, 2016
, the remaining authorization was
$240 million
.
During the three months ended
December 31, 2016
, the Company repurchased the following shares of its common stock:
|
Period
|
Total Number of Shares Purchased
|
Weighted Average Price Paid per Share
|
Total Number of Shares Purchased as Part of Publicly Announced Program
|
Maximum Amount of Dollars that May Yet Be Used to Purchase Shares Under the Program
|
|||||||||
|
October 2 to October 29
|
202,968
|
|
$
|
47.63
|
|
202,968
|
|
||||||
|
October 30 to November 26
|
389,983
|
|
43.65
|
|
389,983
|
|
|||||||
|
November 27 to December 31
|
61,965
|
|
53.24
|
|
61,965
|
|
|||||||
|
Total
|
654,916
|
|
$
|
45.79
|
|
654,916
|
|
$
|
239,794,299
|
|
|||
20
The selected historical financial data presented below as of and for the years ended December 31,
2016
,
2015
and
2014
has been derived from, and should be read in conjunction with, the historical consolidated financial statements of the Company, including the notes thereto, and Item 7 of this report, including the
Matters Affecting Comparability
section. The selected historical financial data presented below as of and for the years ended December 31,
2013
and
2012
has been derived from the consolidated financial statements of the Company for those years and are not included in this Annual Report Form 10-K.
|
(in millions, except per share data)
|
2016
|
2015
|
2014
|
2013
|
2012
|
||||||||||||||
|
Results of operations data
|
|||||||||||||||||||
|
Net sales
|
$
|
4,488.5
|
|
$
|
4,105.7
|
|
$
|
3,838.7
|
|
$
|
3,599.7
|
|
$
|
3,416.8
|
|
||||
|
Operating earnings
(A) (B)
|
409.0
|
|
331.7
|
|
328.5
|
|
281.8
|
|
237.2
|
|
|||||||||
|
Earnings before interest, loss on early extinguishment of debt and income taxes
(A) (B) (C)
|
415.4
|
|
340.8
|
|
316.6
|
|
282.1
|
|
235.7
|
|
|||||||||
|
Earnings before income taxes
(A) (B) (C)
|
389.7
|
|
315.2
|
|
287.9
|
|
208.9
|
|
156.0
|
|
|||||||||
|
Net earnings from continuing operations
(A) (B) (C) (F)
|
274.4
|
|
227.4
|
|
194.9
|
|
756.8
|
|
124.6
|
|
|||||||||
|
Discontinued operations
|
|||||||||||||||||||
|
Net earnings (loss) from discontinued operations, net of tax
(D) (E)
|
1.6
|
|
14.0
|
|
50.8
|
|
12.4
|
|
(74.6
|
)
|
|||||||||
|
Net earnings
(A) (B) (C) (D) (E) (F)
|
$
|
276.0
|
|
$
|
241.4
|
|
$
|
245.7
|
|
$
|
769.2
|
|
$
|
50.0
|
|
||||
|
Basic earnings (loss) per common share
|
|||||||||||||||||||
|
Earnings from continuing operations
(A) (B) (C) (F)
|
$
|
3.01
|
|
$
|
2.45
|
|
$
|
2.08
|
|
$
|
8.30
|
|
$
|
1.39
|
|
||||
|
Net earnings (loss) from discontinued operations, net of tax
(D) (E)
|
0.02
|
|
0.15
|
|
0.55
|
|
0.13
|
|
(0.83
|
)
|
|||||||||
|
Net earnings
(A) (B) (C) (D) (E) (F)
|
$
|
3.03
|
|
$
|
2.60
|
|
$
|
2.63
|
|
$
|
8.43
|
|
$
|
0.56
|
|
||||
|
Average shares used for computation of basic earnings (loss) per share
|
91.2
|
|
93.0
|
|
93.6
|
|
91.2
|
|
89.8
|
|
|||||||||
|
Diluted earnings (loss) per common share
|
|||||||||||||||||||
|
Earnings from continuing operations
(A) (B) (C) (F)
|
$
|
2.98
|
|
$
|
2.41
|
|
$
|
2.05
|
|
$
|
8.07
|
|
$
|
1.35
|
|
||||
|
Net earnings (loss) from discontinued operations, net of tax
(D) (E)
|
0.02
|
|
0.15
|
|
0.53
|
|
0.13
|
|
(0.81
|
)
|
|||||||||
|
Net earnings
(A) (B) (C) (D) (E) (F)
|
$
|
3.00
|
|
$
|
2.56
|
|
$
|
2.58
|
|
$
|
8.20
|
|
$
|
0.54
|
|
||||
|
Average shares used for computation of diluted earnings (loss) per share
|
92.0
|
|
94.3
|
|
95.1
|
|
93.8
|
|
92.4
|
|
|||||||||
|
(A)
|
2016
,
2015
and
2014
results include
$55.1 million
,
$82.3 million
and
$27.9 million
, respectively, of pension settlement charges as discussed in
Note 17 –
Postretirement Benefits
in the Notes to Consolidated Financial Statements.
|
|
(B)
|
2016
,
2015
,
2014
,
2013
and
2012
results include
$15.6 million
,
$12.4 million
,
$4.2 million
,
$16.5 million
and
$25.4 million
of pretax restructuring, integration and impairment charges, respectively.
|
|
(C)
|
2014 results include a
$20.2 million
charge related to the impairment of a marine equity method investment as discussed in
Note 9 –
Investments
in the Notes to Consolidated Financial Statements.
|
|
(D)
|
Net earnings (loss) from discontinued operations, net of tax in
2015
includes a pre-tax and after-tax Gain on disposal of discontinued operations of
$12.8 million
. Net earnings (loss) from discontinued operations, net of tax in
2014
includes a Gain on disposal of discontinued operations, net of tax of
$52.6 million
(a pre-tax gain of
$65.6 million
and a net tax provision of
$13.0 million
). Net earnings (loss) from discontinued operations in
2013
includes a Gain on disposal of discontinued operations, net of tax of
$1.6 million
(a pre-tax loss of
$1.4 million
and a net tax benefit of
$3.0 million
). Net earnings (loss) from discontinued operations in
2012
includes an impairment charge on assets held for sale, net of tax of
$53.2 million
(
$52.7 million
pre-tax). See
Note 2 –
Discontinued Operations
in the Notes to Consolidated Financial Statements for further discussion.
|
|
(E)
|
Net earnings (loss) from discontinued operations includes restructuring, integration and impairment charges, net of tax of
$4.9 million
and
$14.9 million
in
2013
and
2012
, respectively.
|
|
(F)
|
Net earnings from continuing operations includes an income tax benefit of
$599.5 million
from the reversal of deferred tax valuation allowance reserves in
2013
.
|
21
|
(in millions, except per share and other data)
|
2016
|
2015
|
2014
|
2013
|
2012
|
||||||||||||||
|
Balance sheet data
|
|||||||||||||||||||
|
Total assets of continuing operations
|
$
|
3,284.7
|
|
$
|
3,152.5
|
|
$
|
3,087.9
|
|
$
|
2,670.3
|
|
$
|
2,156.7
|
|
||||
|
Debt
|
|||||||||||||||||||
|
Short-term
|
$
|
5.9
|
|
$
|
6.0
|
|
$
|
5.5
|
|
$
|
6.4
|
|
$
|
8.2
|
|
||||
|
Long-term
|
436.5
|
|
442.5
|
|
446.3
|
|
449.0
|
|
557.2
|
|
|||||||||
|
Total debt
|
442.4
|
|
448.5
|
|
451.8
|
|
455.4
|
|
565.4
|
|
|||||||||
|
Common shareholders' equity
(A)
|
1,440.1
|
|
1,281.3
|
|
1,171.5
|
|
1,038.4
|
|
77.7
|
|
|||||||||
|
Total capitalization
|
$
|
1,882.5
|
|
$
|
1,729.8
|
|
$
|
1,623.3
|
|
$
|
1,493.8
|
|
$
|
643.1
|
|
||||
|
Cash flow data
|
|||||||||||||||||||
|
Net cash provided by operating activities of continuing operations
|
$
|
425.7
|
|
$
|
338.3
|
|
$
|
246.9
|
|
$
|
172.2
|
|
$
|
144.1
|
|
||||
|
Depreciation and amortization
|
103.9
|
|
88.9
|
|
81.2
|
|
71.4
|
|
72.9
|
|
|||||||||
|
Capital expenditures
|
193.9
|
|
132.5
|
|
124.8
|
|
126.5
|
|
97.9
|
|
|||||||||
|
Investments
|
5.1
|
|
0.9
|
|
0.2
|
|
(1.5
|
)
|
1.7
|
|
|||||||||
|
Cash dividends paid
|
55.4
|
|
48.3
|
|
41.7
|
|
9.1
|
|
4.5
|
|
|||||||||
|
Other data
|
|||||||||||||||||||
|
Dividends declared per share
|
$
|
0.615
|
|
$
|
0.525
|
|
$
|
0.45
|
|
$
|
0.10
|
|
$
|
0.05
|
|
||||
|
Book value per share
(A)
|
15.77
|
|
14.11
|
|
12.64
|
|
11.24
|
|
0.87
|
|
|||||||||
|
Return on beginning shareholders' equity
(A)
|
21.5
|
%
|
20.6
|
%
|
23.7
|
%
|
NM
|
|
161.8
|
%
|
|||||||||
|
Effective tax rate from continuing operations
|
29.6
|
%
|
27.9
|
%
|
32.3
|
%
|
NM
|
|
20.1
|
%
|
|||||||||
|
Debt-to-capitalization rate
(A)
|
23.5
|
%
|
25.9
|
%
|
27.8
|
%
|
30.5
|
%
|
87.9
|
%
|
|||||||||
|
Number of employees
(B)
|
14,415
|
|
12,745
|
|
12,165
|
|
15,701
|
|
16,177
|
|
|||||||||
|
Number of shareholders of record
|
8,683
|
|
9,009
|
|
9,488
|
|
10,243
|
|
10,900
|
|
|||||||||
|
Common stock price (NYSE)
|
|||||||||||||||||||
|
High
|
$
|
56.30
|
|
$
|
56.63
|
|
$
|
51.94
|
|
$
|
46.48
|
|
$
|
29.09
|
|
||||
|
Low
|
36.05
|
|
46.08
|
|
38.95
|
|
30.42
|
|
18.49
|
|
|||||||||
|
Close (last trading day)
|
54.54
|
|
50.51
|
|
51.26
|
|
46.06
|
|
29.09
|
|
|||||||||
NM = Not meaningful
|
(A)
|
The Company recorded an income tax benefit of
$599.5 million
for the year ending December 31, 2013, from the reversal of deferred tax valuation allowance reserves.
|
|
(B)
|
The number of employees as of December 31, 2015, has been adjusted from the amount reported on the 2015 Form 10-K due to the exclusion of certain employees related to an acquisition completed in the latter part of 2015.
|
The Notes to Consolidated Financial Statements should be read in conjunction with the above summary.
22
Certain statements in Management’s Discussion and Analysis are based on non-GAAP financial measures. GAAP refers to generally accepted accounting principles in the United States. Specifically, the discussion of the Company’s cash flows includes an analysis of free cash flows and total liquidity, the discussion of the Company's net sales includes a discussion of net sales on a constant currency basis and excluding acquisitions, and the discussion of the Company's earnings includes a presentation of operating earnings excluding pension settlement charges, restructuring, integration and impairment charges and diluted earnings per common share, as adjusted. A “non-GAAP financial measure” is a numerical measure of a registrant’s historical or future financial performance, financial position or cash flows that excludes amounts, or is subject to adjustments that have the effect of excluding amounts, that are included in the most directly comparable measure calculated and presented in accordance with GAAP in the consolidated statements of operations, balance sheets or statements of cash flows of the issuer; or includes amounts, or is subject to adjustments that have the effect of including amounts, that are excluded from the most directly comparable measure so calculated and presented. Non-GAAP financial measures do not include operating and statistical measures.
The Company includes certain non-GAAP financial measures in Management’s Discussion and Analysis, as Brunswick’s management believes that these measures and the information they provide are useful to investors because they permit investors to view Brunswick’s performance using the same tools that management uses and to better evaluate the Company’s ongoing business performance. Brunswick does not provide forward-looking guidance for certain financial measures on a GAAP basis because it is unable to predict certain items contained in the GAAP measures without unreasonable efforts. These items may include pension settlement charges, restructuring and integration costs, special tax items and certain other unusual adjustments.
Certain statements in Management’s Discussion and Analysis are forward-looking as defined in the Private Securities Litigation Reform Act of 1995. Forward-looking statements are based on current expectations, estimates and projections about Brunswick’s business and by their nature address matters that are, to different degrees, uncertain. Words such as “may,” “could,” “expect,” “intend,” “target,” “plan,” “seek,” “estimate,” “believe,” “predict,” “outlook” and similar expressions are intended to identify forward-looking statements. Such statements are not guarantees of future performance and involve certain risks and uncertainties that may cause actual results to differ materially from expectations as of the date of this filing. These risks include, but are not limited to, those set forth under Item 1A of this Annual Report on Form 10-K. Forward-looking statements speak only as of the date on which they are made and Brunswick does not undertake any obligation to update them to reflect events or circumstances after the date of this Annual Report.
Overview and Outlook
General
The Company's
2016
results represent the seventh consecutive year of strong improvements in operating performance. The Company looked to achieve the following financial objectives in
2016
:
|
•
|
Deliver revenue growth;
|
|
•
|
Increase earnings before income taxes, as well as deliver slight improvements in both gross margin and operating margin percentages; and
|
|
•
|
Continue to generate strong free cash flow and execute against the Company's capital strategy.
|
Achievements against the Company's financial objectives in
2016
were as follows:
Deliver revenue growth:
|
•
|
Ended the year with a 9 percent increase in net sales when compared with
2015
on a GAAP basis and 10 percent on a constant currency basis, due to the following:
|
|
•
|
Benefits from the Company's acquisition strategy, particularly in the Fitness segment;
|
|
•
|
Strong growth rates in fiberglass outboard boats and marine parts and accessories, as well as solid performances in aluminum boats, outboard engines and fiberglass sterndrive/inboard boats;
|
23
|
•
|
The Marine Engine and Boat segments benefited from solid fundamentals and growth in the U.S. marine market, which was supported by stable boating participation, favorable replacement cycle dynamics and innovative products introduced throughout the marketplace;
|
|
•
|
Continued market share gains and mix benefits in both the Marine Engine and Boat segments including benefits from recent product introductions;
|
|
•
|
Fitness segment net sales benefited from solid demand, particularly in overall global commercial fitness markets;
|
|
•
|
International sales for the Company increased 6 percent in
2016
when compared with
2015
on a GAAP basis. On a constant currency basis, international net sales increased 7 percent, primarily due to increased sales in European and Asia-Pacific markets, partially offset by weak demand in certain markets such as Latin America and the Middle East and Africa.
|
Experience an increase in earnings before income taxes, as well as a slight improvements in both gross margin and operating margin percentages:
|
•
|
Reported earnings before income taxes of
$389.7 million
in
2016
compared with earnings before income taxes of
$315.2 million
in
2015
;
|
|
•
|
Improved gross margin by 20 basis points when compared with
2015
, driven by benefits from volume increases and cost reductions, including benefits from efficiency and sourcing initiatives as well as lower commodity costs, partially offset by the unfavorable impact from foreign exchange; and
|
|
•
|
Operating margin improved by 100 basis points when compared with the prior year and benefited from decreased pension settlement charges, partially offset by increased restructuring, integration and impairment charges compared with the prior year.
|
Continue to generate strong free cash flow and execute against the Company's capital strategy:
|
•
|
Generated strong free cash flow of
$233.8 million
in
2016
,
an increase
of
$41.2 million
compared to
2015
, enabling the Company to continue executing its capital strategy as follows:
|
|
•
|
Funded investments in growth:
|
|
•
|
Through acquisitions, including the
$276.1 million
invested in the Fitness, Boat and Marine Engine segments during
2016
;
|
|
•
|
Organically through capital expenditures, which included investments in new products as well as capacity expansions focused in the engine and fitness businesses;
|
|
•
|
Contributed
$74.6 million
to the Company's defined benefit pension plans; and
|
|
•
|
Enhanced shareholder returns by repurchasing
$120.3 million
of common stock under the Company’s share repurchase program and increased cash dividends paid to shareholders to
$55.4 million
.
|
|
•
|
Ended the year with
$458.2 million
of cash and marketable securities, a net decrease of $210.6 million from the prior year, primarily due to the acquisitions and shareholder return expenditures discussed above, partially offset by strong free cash flow.
|
Net earnings increased to
$274.4 million
in
2016
from
$227.4 million
in
2015
. The
2016
results include an income tax provision of
$115.3 million
, which included an income tax charge of $1.1 million, primarily associated with the impact of recent changes in tax laws partially offset by the reassessment of tax reserves and favorable valuation allowance adjustments
.
The
2015
results reflect an income tax provision of $87.8 million, which includes a net tax benefit of $12.1 million primarily associated with the internal restructuring of foreign entities and settling prior year audits
.
24
Discontinued Operations
The Company completed the sale of its retail bowling and bowling products businesses on May 22, 2015 and September 18, 2014, respectively. Refer to
Note 2 –
Discontinued Operations
for further information. The Billiards business, which was previously reported in the former Bowling & Billiards segment, remains part of the Company and is being reported in the Fitness segment for all periods presented. The Company's results for all periods presented, as discussed in Management's Discussion and Analysis, reflect continuing operations only, unless otherwise noted.
Outlook for
2017
The Company expects
2017
to be another year of outstanding earnings growth with excellent free cash flow generation. The Company is targeting 6 percent to 8 percent sales growth when compared with
2016
, which includes the continuation of solid market growth in the U.S. and Europe and improving market conditions in certain international markets. Additionally, sales growth is expected to benefit from the success of new products, market share gains and the impact of completed acquisitions, which are expected to account for about 1 percent of growth. The Company expects growth in both outboard and inboard/sterndrive boats as well as growth in the outboard engine and marine parts and accessories businesses, reflecting a stable pricing environment for larger horsepower engines and market share gains in targeted areas. The Company also anticipates growth in the Boat segment will also benefit from recently introduced products and higher average selling prices. In the Fitness segment, the Company anticipates continued growth in global commercial fitness markets, as well as contributions from new products, particularly in the second half of 2017.
The Company expects to have higher earnings before income taxes in
2017
resulting from increased revenue and improvements in both gross margin and operating margin levels due to benefits from volume leverage, cost reductions related to efficiency initiatives and modest positive product mix factors. The Company projects operating expenses to increase in 2017 including incremental investments to support growth; however, on a percentage of sales basis, are expected to be slightly lower than 2016.
The Company is planning for its effective tax rate in
2017
to be approximately 31 percent based on existing tax law.
25
Restructuring, Integration and Impairment Activities
Restructuring, integration and impairment charges
recorded in the Consolidated Statements of Operations during
2016
,
2015
and
2014
by reportable segment are summarized below:
|
(in millions)
|
2016
|
2015
|
2014
|
||||||||
|
Boat
|
$
|
0.6
|
|
$
|
7.7
|
|
$
|
1.5
|
|
||
|
Fitness
|
12.7
|
|
—
|
|
—
|
|
|||||
|
Corporate
|
2.3
|
|
4.7
|
|
2.7
|
|
|||||
|
Total
|
$
|
15.6
|
|
$
|
12.4
|
|
$
|
4.2
|
|
||
In 2016, the Company recognized restructuring and integration charges within the Fitness segment, primarily related to the acquisitions of Cybex International, Inc. (Cybex) and Indoor Cycling Group GmbH (ICG).
In the fourth quarters of 2016 and 2015, the Company recognized impairment charges within the Corporate segment, primarily in connection with its decision to sell its corporate headquarters facility in Lake Forest, Illinois.
In the fourth quarter of 2016, the Company also recorded restructuring charges related to the realignment of certain executive positions within the Boat segment. The Company plans to achieve annual savings of approximately $1 million related to this action, with the full benefit being realized in 2018. Future cost savings will primarily be reflected in
Selling, general and administrative expense
as reported in the Company's Consolidated Statements of Operations.
In 2015, the Company recorded impairment charges for certain long-lived assets in Brazil as a result of unfavorable market conditions and declining currency values.
In the fourth quarter of 2015, the Company recorded charges related to the restructuring of personnel, primarily within the Boat segment and IT organizations. The Company did not incur additional charges in 2016 related to these actions and achieved annual savings of approximately $3 million. Cost savings are reflected in
Selling, general and administrative expense
as reported in the Company's Consolidated Statements of Operations.
See
Note 3 –
Restructuring, Integration and Impairment Activities
in the Notes to Consolidated Financial Statements for further details.
On January 18, 2017, the Company announced the appointment of Jaime Irick as the president of the Fitness segment. In 2017, the Company anticipates it will incur restructuring and integration charges of approximately $11 million to $13 million within the Fitness segment as a result of the integration of Cybex and the management transition discussed above.
26
Matters Affecting Comparability
Certain events occurred during
2016
,
2015
and
2014
that the Company believes affect the comparability of the results of operations. The tables below summarize the impact of changes in currency exchange rates as well as the impact of recent acquisitions on the Company's net sales:
|
Net Sales
|
2016 vs. 2015
% Change
|
2015 vs. 2014
% Change
|
|||||||||||||||||||||
|
(in millions)
|
2016
|
2015
|
2014
|
GAAP
|
Constant Currency
|
Acquisition Contribution
|
GAAP
|
Constant Currency
|
Acquisition Contribution
|
||||||||||||||
|
Marine Engine
|
$
|
2,441.1
|
|
$
|
2,314.3
|
|
$
|
2,189.4
|
|
5%
|
6%
|
1%
|
6%
|
10%
|
4%
|
||||||||
|
Boat
|
1,369.9
|
|
1,274.6
|
|
1,135.8
|
|
7%
|
8%
|
1%
|
12%
|
16%
|
—%
|
|||||||||||
|
Marine eliminations
|
(302.9
|
)
|
(277.8
|
)
|
(255.8
|
)
|
|||||||||||||||||
|
Total Marine
|
3,508.1
|
|
3,311.1
|
|
3,069.4
|
|
6%
|
6%
|
1%
|
8%
|
12%
|
2%
|
|||||||||||
|
Fitness
|
980.4
|
|
794.6
|
|
769.3
|
|
23%
|
24%
|
19%
|
3%
|
7%
|
1%
|
|||||||||||
|
Total
|
$
|
4,488.5
|
|
$
|
4,105.7
|
|
$
|
3,838.7
|
|
9%
|
10%
|
5%
|
7%
|
11%
|
2%
|
||||||||
Changes in foreign currency rates.
Percentage changes in net sales expressed in constant currency reflect the impact that changes in currency exchange rates had on comparisons of net sales. To determine this information, net sales transacted in currencies other than U.S. dollars have been translated to U.S. dollars using the average exchange rates that were in effect during the comparative period. The percentage change in net sales expressed on a constant currency basis better reflects the changes in the underlying business trends, excluding the impact of translation arising from foreign currency exchange rate fluctuations. Approximately 20 percent of the Company's annual net sales are transacted in a currency other than the U.S. dollar. The Company's most material exposures include sales in Euros, Canadian dollars, Australian dollars, British pounds and Brazilian reais.
Additionally, operating earnings comparisons were negatively affected by foreign exchange rates by approximately $14 million, or 4 percent, in 2016 when compared with 2015, and were negatively affected by foreign exchange rates by approximately $28 million, or 8 percent, in 2015 when compared with 2014. These estimates include the impact of translation on all sales and costs transacted in a currency other than the U.S. dollar, benefits from hedging activities of $3 million and $12 million for 2016 and 2015, respectively, and pricing actions in certain international markets in response to the strengthening U.S. dollar.
Acquisitions.
The Company completed acquisitions during
2016
,
2015
and
2014
that affect the comparability of net sales. The impacts on consolidated and segment sales comparisons are reflected above. Refer to
Note 4 –
Acquisitions
in the Notes to Consolidated Financial Statements for further information.
Pension settlement charges.
In the fourth quarters of
2016
,
2015
and
2014
, the Company recognized $55.1 million, $82.3 million and $27.9 million of charges, respectively, related to actions taken to settle a portion of its pension obligations. These actions included transferring certain plan obligations to a third party by purchasing annuities on behalf of plan participants in 2016 and 2015 and making lump-sum payments directly to certain plan participants in 2015 and 2014. These costs are reflected in
Pension settlement charge
on the Consolidated Statements of Operations. See
Note 17 –
Postretirement Benefits
in the Notes to Consolidated Financial Statements for further details.
Restructuring, integration and impairment charges.
During
2016
, the Company recorded restructuring, integration and impairment charges of $15.6 million, compared with charges of $12.4 million in
2015
and $4.2 million in
2014
. See
Note 3 –
Restructuring, Integration and Impairment Activities
in the Notes to Consolidated Financial Statements for further details.
Impairment of equity method investment
. In the fourth quarter of 2014, the Company recorded a
$20.2 million
impairment charge for an equity method investment in order to reflect the fair value of the Company’s equity method investment in a Finnish boat manufacturer as discussed in
Note 9 –
Investments
in the Notes to Consolidated Financial Statements
.
The charge is reported as Impairment of equity method investment in the Consolidated Statement of Operations.
Tax items.
The Company recognized an income tax provision in
2016
of
$115.3 million
, which included a net charge of $1.1 million primarily associated with the impact of recent changes in tax law, partially offset by the reassessment of tax reserves and favorable valuation allowance adjustments. The Company recognized an income tax provision of $87.8 million in
2015
, which included a net tax benefit of $12.1 million, primarily associated with the internal restructuring of foreign entities and settling prior
27
year audits
.
The Company recognized an income tax provision in
2014
of $93.0 million, which included a net benefit of $6.4 million primarily associated with the reversal of tax valuation allowance reserves.
See
Note 12 –
Income Taxes
in Notes to Consolidated Financial Statements for further details.
Results of Operations
Consolidated
The following table sets forth certain amounts, ratios and relationships calculated from the Consolidated Statements of Operations for the
year
s ended December 31,
2016
,
2015
and
2014
:
|
2016 vs. 2015
Increase/(Decrease) |
2015 vs. 2014
Increase/(Decrease) |
||||||||||||||||||||||||
|
(in millions, except per share data)
|
2016
|
2015
|
2014
|
$
|
%
|
$
|
%
|
||||||||||||||||||
|
Net sales
|
$
|
4,488.5
|
|
$
|
4,105.7
|
|
$
|
3,838.7
|
|
$
|
382.8
|
|
9.3
|
%
|
$
|
267.0
|
|
7.0
|
%
|
||||||
|
Gross margin
(A)
|
1,225.1
|
|
1,114.6
|
|
1,036.8
|
|
110.5
|
|
9.9
|
%
|
77.8
|
|
7.5
|
%
|
|||||||||||
|
Pension settlement charge
|
55.1
|
|
82.3
|
|
27.9
|
|
(27.2
|
)
|
(33.0
|
)%
|
54.4
|
|
NM
|
|
|||||||||||
|
Restructuring, integration and impairment charges
|
15.6
|
|
12.4
|
|
4.2
|
|
3.2
|
|
25.8
|
%
|
8.2
|
|
NM
|
|
|||||||||||
|
Operating earnings
|
409.0
|
|
331.7
|
|
328.5
|
|
77.3
|
|
23.3
|
%
|
3.2
|
|
1.0
|
%
|
|||||||||||
|
Net earnings from continuing operations
(B)
|
274.4
|
|
227.4
|
|
194.9
|
|
47.0
|
|
20.7
|
%
|
32.5
|
|
16.7
|
%
|
|||||||||||
|
Diluted earnings per common share from continuing operations
(B)
|
$
|
2.98
|
|
$
|
2.41
|
|
$
|
2.05
|
|
$
|
0.57
|
|
23.7
|
%
|
$
|
0.36
|
|
17.6
|
%
|
||||||
|
Expressed as a percentage of Net sales:
|
|
|
|
|
|
|
|
|
|
|
|||||||||||||||
|
Gross margin
|
27.3
|
%
|
27.1
|
%
|
27.0
|
%
|
|
|
20 bpts
|
|
10 bpts
|
|
|||||||||||||
|
Selling, general and administrative expense
|
13.5
|
%
|
13.7
|
%
|
14.5
|
%
|
|
|
(20) bpts
|
|
(80) bpts
|
|
|||||||||||||
|
Research and development expense
|
3.1
|
%
|
3.1
|
%
|
3.1
|
%
|
|
|
0 bpts
|
|
(0) bpts
|
|
|||||||||||||
|
Operating margin
|
9.1
|
%
|
8.1
|
%
|
|
8.6
|
%
|
|
|
100 bpts
|
|
(50) bpts
|
|
||||||||||||
NM = not meaningful
bpts = basis points
|
(A)
|
Gross margin is defined as Net sales less Cost of sales as presented in the Consolidated Statements of Operations.
|
|
(B)
|
Net earnings from continuing operations in 2014 includes a $20.2 million charge for an impairment of an equity method investment.
|
2016
vs.
2015
Net sales increased during 2016 when compared with 2015 due to increases across all segments. Marine Engine segment net sales increased due to strong growth in the marine parts and accessories businesses as well as solid growth in outboard engines. Both of these categories benefited from favorable market conditions and market share gains while sterndrive engines declined, reflecting unfavorable demand trends. Boat segment net sales increased due to strong growth rates in fiberglass outboard boats as well as solid growth rates in aluminum boats and fiberglass sterndrive and inboard boats. Fitness segment net sales increased, reflecting the benefit of recent acquisitions and growth in international markets while revenues in the U.S. increased modestly. International net sales for the Company increased 6 percent in 2016 on a GAAP basis when compared with 2015. On a constant currency basis, international net sales increased 7 percent in 2016 driven by strong increases in European and Asia-Pacific markets, partially offset by decreases in Latin America, especially Brazil, and Africa and the Middle East.
Gross margin percentage increased slightly in 2016 when compared with the same prior year period related to benefits from volume increases and cost reductions, including benefits from efficiency and sourcing initiatives as well as lower commodity costs, partially offset by the unfavorable impact from foreign exchange.
28
Selling, general and administrative expense decreased as a percentage of net sales during 2016 when compared with 2015, mainly due to higher net sales partially offset by increases related to acquisitions and investments to support growth.
Research and development expense increased in 2016 when compared with 2015 as the Company continued to increase its funding of investments in new products, but remained flat as a percentage of net sales.
In 2016 and 2015, the Company recorded $55.1 million and $82.3 million, respectively, of charges related to pension settlement payments as discussed in
Note 17 –
Postretirement Benefits
in the Notes to Consolidated Financial Statements.
During 2016, the Company recorded restructuring, integration and impairment charges of $15.6 million compared with $12.4 million in 2015. See
Note 3 –
Restructuring, Integration and Impairment Activities
in the Notes to Consolidated Financial Statements for further details.
The Company recognized equity earnings of $4.3 million and $3.7 million in 2016 and 2015, respectively, which were mainly related to the Company's marine joint ventures. The Company recognized $2.1 million and $5.4 million in 2016 and 2015, respectively, in
Other income, net
, which includes unfavorable foreign exchange adjustments in 2016 and the amortization of deferred income related to a trademark licensing agreement with AMF Bowling Centers, Inc (AMF) in both periods. See
Note 2 –
Discontinued Operations
for discussion of the trademark agreement with AMF.
Net interest expense increased slightly in 2016 compared with 2015.
The Company recognized an income tax provision in 2016 of $115.3 million, which included a net charge of $1.1 million primarily associated with the impact of recent changes in tax law partially offset by the reassessment of tax reserves and favorable valuation allowance adjustments. The Company recognized an income tax provision of $87.8 million in 2015, which included a net tax benefit of $12.1 million, primarily associated with the internal restructuring of foreign entities and settling prior year audits
.
The effective tax rate, which is calculated as the income tax benefit or provision as a percentage of pre-tax income, was 29.6 percent and 27.9 percent for 2016 and 2015, respectively. See
Note 12 –
Income Taxes
in the Notes to Consolidated Financial Statements for further details.
Operating earnings, Net earnings from continuing operations and Diluted earnings per common share from continuing operations increased in 2016 when compared with 2015, primarily due to the factors discussed in the preceding paragraphs. Diluted earnings per common share from continuing operations also benefited from the impact of common stock repurchases.
Diluted earnings from continuing operations per common share, as adjusted
–
defined as Diluted earnings from continuing operations per common share, excluding the earnings or loss per share impact for Pension settlement charge, Restructuring, integration and impairment charges and special tax items
–
increased by $0.55 per share, or 19 percent, to $3.48 per share for 2016 when compared with $2.93 per share for 2015. For 2016, Pension settlement charge was $0.38 per share, Restructuring, integration and impairment charges were $0.11 per share and special tax items were a net charge of $0.01 per share. In 2015, Pension settlement charge was $0.54 per share, Restructuring, integration and impairment charges were $0.11 per share and special tax items were a net benefit of $0.13 per share.
2015
vs.
2014
Net sales increased during 2015 when compared with 2014 on both a GAAP basis and a constant currency basis due to increases across all segments, all of which benefited from the success of new products. Marine Engine segment net sales increased due to solid growth in the marine parts and accessories businesses, which benefited from acquisitions, as well as solid increases in outboard engines, which benefited from market share gains, partially offset by declines in sterndrive engines.
Boat segment net sales increased due to strong growth rates in fiberglass outboard boats and fiberglass sterndrive and inboard boats, as well as solid gains in the sales of aluminum boats. The Boat segment's net sales also reflected higher average selling prices resulting from a favorable shift in mix and growth in wholesale unit shipments. Fitness segment net sales included growth in the U.S. to health clubs, local and federal governments and hospitality customers. Fitness segment net sales also benefited from an acquisition in the third quarter of 2015. International net sales for the Company decreased 4 percent in 2015 on a GAAP basis when compared with 2014. On a constant currency basis, international net sales increased 7 percent in 2015 driven by strong increases in European and Asia-Pacific markets, partially offset by decreases in Latin America, especially Brazil.
Gross margin percentage increased slightly in 2015 when compared with the same prior year period related to benefits from lower commodity costs and sourcing initiatives along with a more favorable product mix and volume increases, mostly offset by
29
the unfavorable impact from foreign exchange, planned manufacturing costs associated with new product introductions, capacity expansions and production ramp-ups, as well as less favorable warranty adjustments compared with 2014.
Selling, general and administrative expense decreased as a percentage of net sales during 2015 when compared with 2014 as operating expenses benefited from focused expense management as well as a favorable impact from foreign exchange. Partially offsetting these factors was an increase in expenses related to acquired businesses.
Research and development expense increased in 2015 when compared with 2014 as the Company increased investment spending to support long-term growth initiatives.
In 2015 and 2014, the Company recorded an $82.3 million and $27.9 million, respectively, charge related to pension settlement payments as discussed in
Note 17 –
Postretirement Benefits
in the Notes to Consolidated Financial Statements.
During 2015, the Company recorded restructuring charges of $12.4 million compared with $4.2 million in 2014. See
Note 3 –
Restructuring, Integration and Impairment Activities
in the Notes to Consolidated Financial Statements for further details.
In 2014, the Company recorded a
$20.2 million
impairment charge for an equity method investment as discussed in
Note 9 –
Investments
in the Notes to Consolidated Financial Statements
.
The Company recognized equity earnings of $3.7 million and $1.8 million in 2015 and 2014, respectively, which were mainly related to the Company's marine joint ventures. The Company recognized $5.4 million and $6.5 million in 2015 and 2014, respectively, in
Other income, net
, which includes the amortization of deferred income related to a trademark licensing agreement with AMF Bowling Centers, Inc as discussed in
Note 2 –
Discontinued Operations
.
Interest expense decreased $2.0 million in 2015 compared with 2014, due primarily to benefits from fixed-to-floating interest rate swaps entered into during 2014.
The Company recognized an income tax provision of $87.8 million, which included a net tax benefit of $12.1 million, primarily associated with the internal restructuring of foreign entities and settling prior year audits. The Company recognized an income tax provision of $93.0 million for 2014, which included a net tax benefit of $6.4 million, primarily associated with the reversal of tax valuation allowance reserves. The effective tax rate, which is calculated as the income tax benefit or provision as a percentage of pre-tax income, was 27.9 percent and 32.3 percent for 2015 and 2014, respectively. See
Note 12 –
Income Taxes
in the Notes to Consolidated Financial Statements for further details.
Operating earnings, Net earnings from continuing operations and Diluted earnings per common share from continuing operations increased in 2015 when compared with 2014, primarily due to the factors discussed in the preceding paragraphs. Diluted earnings per common share from continuing operations also benefited from the impact of common stock repurchases.
Diluted earnings from continuing operations per common share, as adjusted
–
defined as Diluted earnings from continuing operations per common share, excluding the earnings or loss per share impact for Pension settlement charge, Restructuring, integration and impairment charges, Impairment of equity method investment and special tax items
–
increased by $0.51 per share, or 21 percent, to $2.93 per share for 2015 when compared with $2.42 per share for 2014. For 2015, Pension settlement charge was $0.54 per share, Restructuring, integration and impairment charges were $0.11 per share and special tax items were a net benefit of $0.13 per share. In 2014, Pension settlement charge was $0.19 per share, Restructuring, integration and impairment charges were $0.04 per share, Impairment charge for an equity investment was $0.21 per share and special tax items were a net benefit of $0.07 per share.
The Company completed the sale of its bowling products business in the second quarter of 2015 and recorded an after-tax gain of $10.3 million. The Company completed the sale of its retail bowling business in the third quarter of 2014 and recorded an after-tax gain of $55.1 million. In 2015, sales from discontinued operations were $37.5 million, pre-tax earnings from discontinued operations were $14.3 million and the income tax provision from discontinued operations was $0.3 million. In 2014, sales from discontinued operations were $236.0 million, pre-tax earnings from discontinued operations were $61.8 million and the income tax provision from discontinued operations was $11.0 million.
Segments
The Company operates in three operating and reportable segments: Marine Engine, Boat and Fitness. Refer to
Note 6 –
Segment Information
in the Notes to Consolidated Financial Statements for details on the segment operations.
30
Marine Engine Segment
The following table sets forth Marine Engine segment results for the years ended December 31,
2016
,
2015
and
2014
:
|
2016 vs. 2015
Increase/(Decrease) |
2015 vs. 2014
Increase/(Decrease) |
||||||||||||||||||||||||
|
(in millions)
|
2016
|
2015
|
2014
|
$
|
%
|
$
|
%
|
||||||||||||||||||
|
Net sales
|
$
|
2,441.1
|
|
$
|
2,314.3
|
|
$
|
2,189.4
|
|
$
|
126.8
|
|
5.5
|
%
|
$
|
124.9
|
|
5.7
|
%
|
||||||
|
Operating earnings
|
378.0
|
|
350.4
|
|
309.1
|
|
27.6
|
|
7.9
|
%
|
41.3
|
|
13.4
|
%
|
|||||||||||
|
Operating margin
|
15.5
|
%
|
15.1
|
%
|
14.1
|
%
|
|
|
40 bpts
|
|
100 bpts
|
|
|||||||||||||
__________
bpts = basis points
2016
vs.
2015
Net sales for the Marine Engine segment increased in 2016 when compared with 2015. The increase was mainly due to strong growth in the marine parts and accessories businesses, which included benefits from favorable market trends, market share gains, acquisitions during 2016 and 2015 and new product launches. The segment also experienced a solid increase in outboard engine net sales, driven by continued favorable retail demand trends in overall U.S. and European markets and market share gains, reflecting benefits from recently launched products. The segment reported a decrease in sterndrive engine net sales due to the continuing shift to outboards and unfavorable global retail demand trends.
Acquisitions completed in 2016 and 2015 accounted for 1 percentage point of the Marine Engine segment's overall revenue growth rate in 2016. International net sales were 32 percent of the segment's net sales in 2016, and increased 4 percent from the prior year on a GAAP basis. On a constant currency basis, international net sales increased 5 percent in 2016, which included gains in Europe, Asia-Pacific and Canada, partially offset by declines in Africa and the Middle East and Latin America.
Marine Engine segment operating earnings increased in 2016 as a result of higher net sales and cost reductions, including benefits from efficiency and sourcing initiatives as well as lower commodity costs. Partially offsetting these factors were an unfavorable impact from foreign exchange and growth-related investments including new product development activities.
2015
vs.
2014
Net sales for the Marine Engine segment increased in 2015 when compared with 2014. The increase was mainly due to solid growth in net sales in the marine parts and accessories businesses, which benefited from acquisitions completed in 2015 and 2014, new product launches and market share gains. The segment also experienced a solid increase in outboard engine net sales, driven by continued favorable retail demand trends and the success of recently launched new products. Partially offsetting these factors was an unfavorable impact from foreign exchange and a decrease in sterndrive engine net sales due to continuing unfavorable global retail demand trends. Acquisitions completed in 2015 and 2014 accounted for 4 percentage points of the Marine Engine segment's overall revenue growth rate in 2015. International net sales were 37 percent of the segment's net sales in 2015, a decrease of 5 percent from the prior year on a GAAP basis. On a constant currency basis, international net sales increased 10 percent in 2015, which included increases in most international regions, which more than offset weakness in Russia and Latin America, especially Brazil.
Marine Engine segment operating earnings increased in 2015 as a result of higher net sales, a favorable product mix including benefits from recently launched outboard products, and cost reductions, including benefits from plant efficiencies, lower commodity costs and savings related to sourcing initiatives. Partially offsetting these factors were the unfavorable effects of foreign exchange.
31
Boat Segment
The following table sets forth Boat segment results for the years ended December 31,
2016
,
2015
and
2014
:
|
2016 vs. 2015
Increase/(Decrease) |
2015 vs. 2014
Increase/(Decrease) |
||||||||||||||||||||||||
|
(in millions)
|
2016
|
2015
|
2014
|
$
|
%
|
$
|
%
|
||||||||||||||||||
|
Net sales
|
$
|
1,369.9
|
|
$
|
1,274.6
|
|
$
|
1,135.8
|
|
$
|
95.3
|
|
7.5
|
%
|
$
|
138.8
|
|
12.2
|
%
|
||||||
|
Restructuring, integration and impairment charges
(A)
|
0.6
|
|
7.7
|
|
1.5
|
|
(7.1
|
)
|
NM
|
|
6.2
|
|
NM
|
|
|||||||||||
|
Operating earnings
|
60.8
|
|
37.6
|
|
17.2
|
|
23.2
|
|
61.7
|
%
|
20.4
|
|
NM
|
|
|||||||||||
|
Operating margin
|
4.4
|
%
|
2.9
|
%
|
1.5
|
%
|
|
|
150 bpts
|
|
140 bpts
|
|
|||||||||||||
__________
NM = not meaningful
bpts = basis points
|
(A)
|
See
Note 3 –
Restructuring, Integration and Impairment Activities
in the Notes to Consolidated Financial Statements for further details.
|
2016
vs.
2015
Boat segment net sales increased in 2016 when compared with 2015 due to growth in fiberglass outboard boats, aluminum boats and fiberglass sterndrive and inboard boats. Net sales growth benefited from higher average selling prices, resulting from a favorable shift in mix as well as a slight increase in global wholesale unit shipments; however, the increase was slightly below global retail unit growth for the year. Additionally, net sales benefited from recently introduced new products and market share gains. An acquisition accounted for 1 percentage point of the Boat segment's overall revenue growth rate in 2016. International net sales were 25 percent of the segment's net sales in 2016, a decrease of 4 percent from the prior year on a GAAP basis.
On a constant currency basis, international net sales decreased 3 percent when compared with the same prior year period, mainly due to net sales decreases in Latin America, especially Brazil, Canada and Africa and the Middle East, partially offset by increases in the Europe and Asia-Pacific regions.
Boat segment operating earnings increased in 2016 when compared with 2015 due to lower restructuring and impairment charges, higher net sales and benefits from lower commodity costs and savings related to sourcing initiatives. These factors were partially offset by increases in revenue and profit-enhancing investments.
2015
vs.
2014
Boat segment net sales increased in 2015 when compared with 2014, due to strong growth rates for fiberglass outboard boats and fiberglass sterndrive and inboard boats as well as solid gains in aluminum boats. Segment net sales also reflected higher average selling prices resulting from a favorable shift in mix and an increase in global wholesale unit shipments, both of which reflected the success of new products. International net sales were 28 percent of the segment's net sales in 2015, a decrease of 8 percent from the prior year on a GAAP basis. On a constant currency basis, international net sales increased 2 percent when compared with the same prior year period due to increases in Europe and Latin America excluding Brazil, partially offset by decreases in Canada and Asia-Pacific.
The Boat segment operating earnings increased in 2015 when compared with 2014 due to higher net sales and a more favorable product mix, as well as lower commodity costs and savings related to sourcing initiatives and cost reductions, partially offset by higher restructuring and impairment charges, planned manufacturing cost increases associated with new product integrations, plant capacity expansions and production ramp-ups.
32
Fitness Segment
The following table sets forth Fitness segment results for the years ended December 31,
2016
,
2015
and
2014
:
|
2016 vs. 2015
Increase/(Decrease) |
2015 vs. 2014
Increase/(Decrease) |
||||||||||||||||||||||||
|
(in millions)
|
2016
|
2015
|
2014
|
$
|
%
|
$
|
%
|
||||||||||||||||||
|
Net sales
|
$
|
980.4
|
|
$
|
794.6
|
|
$
|
769.3
|
|
$
|
185.8
|
|
23.4
|
%
|
$
|
25.3
|
|
3.3
|
%
|
||||||
|
Restructuring, integration and impairment charges
(A)
|
12.7
|
|
—
|
|
—
|
|
12.7
|
|
NM
|
|
—
|
|
—
|
%
|
|||||||||||
|
Operating earnings
|
117.3
|
|
116.5
|
|
115.3
|
|
0.8
|
|
0.7
|
%
|
1.2
|
|
1.0
|
%
|
|||||||||||
|
Operating margin
|
12.0
|
%
|
14.7
|
%
|
15.0
|
%
|
|
|
(270) bpts
|
|
(30) bpts
|
|
|||||||||||||
__________
NM = not meaningful
bpts = basis points
|
(A)
|
See
Note 3 –
Restructuring, Integration and Impairment Activities
in the Notes to Consolidated Financial Statements for further details.
|
2016
vs.
2015
Fitness segment net sales increased in 2016 when compared with 2015. Acquisitions completed in 2016 and 2015 contributed 19 percentage points to the Fitness segment's revenue growth rate in 2016. Net sales also benefited from overall growth in international markets as well as growth in the U.S., reflecting increased sales to commercial fitness customers including the impact of declines in sales to local and federal governments. International net sales were 45 percent of the segment's net sales in 2016 and increased 19 percent compared with the prior year on a GAAP basis. On a constant currency basis and excluding acquisitions, the segment's international net sales increased 7 percent when compared with the prior year due to strength in Asia-Pacific and Europe, partially offset by slight declines in other international markets.
Fitness segment operating earnings increased slightly in 2016 when compared with the prior year. The increase was primarily due to higher net sales, mostly offset by increased restructuring and integration costs, increases in growth-related investments, a net unfavorable impact of sales mix and purchase accounting adjustments related to the three acquisitions completed since 2015.
2015
vs.
2014
Fitness segment net sales increased in 2015 when compared with 2014 on both a GAAP basis and a constant currency basis, reflecting higher sales in the U.S. to health clubs, local and federal governments and hospitality customers. The acquisition of SCIFIT accounted for 1 percentage point of the Fitness segment's overall revenue growth rate in 2015. Net sales in all regions benefited from recently introduced successful new products. International net sales were 46 percent of the segment's net sales in 2015 and decreased 2 percent compared with the same prior year period on a GAAP basis. On a constant currency basis the segment's international net sales increased 7 percent when compared with the same prior year period due to net sales increases in certain regions including Asia-Pacific, Europe and the Middle East.
Fitness segment operating earnings increased slightly in 2015 compared with 2014 due to higher net sales, cost reductions and savings related to sourcing initiatives, partially offset by an unfavorable impact from foreign exchange, the absence of a favorable warranty adjustment in the first quarter of 2014 and transaction costs associated with the segment's acquisition strategy.
33
Corporate/Other
The following table sets forth Corporate/Other results for the years ended December 31,
2016
,
2015
and
2014
:
|
2016 vs. 2015
Increase/(Decrease) |
2015 vs. 2014
Increase/(Decrease) |
||||||||||||||||||||||||
|
(in millions)
|
2016
|
2015
|
2014
|
$
|
%
|
$
|
%
|
||||||||||||||||||
|
Restructuring, integration and impairment charges
(A)
|
$
|
2.3
|
|
$
|
4.7
|
|
$
|
2.7
|
|
$
|
(2.4
|
)
|
(51.1
|
)%
|
$
|
2.0
|
|
74.1
|
%
|
||||||
|
Operating loss
|
(77.3
|
)
|
(78.8
|
)
|
(70.4
|
)
|
(1.5
|
)
|
(1.9
|
)%
|
8.4
|
|
11.9
|
%
|
|||||||||||
|
(A)
|
See
Note 3 –
Restructuring, Integration and Impairment Activities
in the Notes to Consolidated Financial Statements for further details.
|
Corporate operating expenses decreased in 2016 compared with 2015 due mostly to the decline in restructuring and impairment charges.
Corporate operating expenses increased in 2015 compared with 2014 due to increased charges relating to share-based compensation expense and higher restructuring and impairment charges.
Cash Flow, Liquidity and Capital Resources
The following table sets forth an analysis of free cash flow for the
year
s ended December 31,
2015
,
2014
and
2013
:
|
(in millions)
|
2016
|
2015
|
2014
|
||||||||
|
Net cash provided by operating activities of continuing operations
|
$
|
425.7
|
|
$
|
338.3
|
|
$
|
246.9
|
|
||
|
Net cash provided by (used for):
|
|
|
|
|
|
|
|||||
|
Capital expenditures
|
(193.9
|
)
|
(132.5
|
)
|
(124.8
|
)
|
|||||
|
Proceeds from the sale of property, plant and equipment
|
1.9
|
|
2.4
|
|
5.8
|
|
|||||
|
Effect of exchange rate changes on cash and cash equivalents
|
0.1
|
|
(15.6
|
)
|
(11.6
|
)
|
|||||
|
Total free cash flow from continuing operations
(A)
|
$
|
233.8
|
|
$
|
192.6
|
|
$
|
116.3
|
|
||
(A) The Company defines Free cash flow from continuing operations as cash flow from operating and investing activities of continuing operations (excluding cash provided by or used for acquisitions and investments, transfers to/reductions in restricted cash, purchases or sales/maturities of marketable securities and other investing activities) and the effect of exchange rate changes on cash and cash equivalents. Free cash flow from continuing operations is not intended as an alternative measure of cash flow from operations, as determined in accordance with generally accepted accounting principles (GAAP) in the United States. The Company uses this financial measure, both in presenting its results to shareholders and the investment community and in its internal evaluation and management of its businesses. Management believes that this financial measure and the information it provides are useful to investors because it permits investors to view Brunswick’s performance using the same tool that management uses to gauge progress in achieving its goals. Management believes that the non-GAAP financial measure Free cash flow from continuing operations is also useful to investors because it is an indication of cash flow that may be available to fund investments in future growth initiatives.
Brunswick’s major sources of funds for investments, acquisitions, dividend payments and share repurchase programs are cash generated from operating activities, available cash and marketable securities balances and selected borrowings. The Company evaluates potential acquisitions, divestitures and joint ventures in the ordinary course of business.
2016 Cash Flow
In 2016, net cash provided by operating activities of continuing operations totaled $425.7 million. The primary driver of the cash provided by operating activities was net earnings from continuing operations net of non-cash expense items. An increase in working capital had a negative effect on net cash provided by operating activities. Working capital is defined as Accounts and notes receivable, Inventories and Prepaid expenses and other, net of Accounts payable and Accrued expenses as presented in the Consolidated Balance Sheets excluding the impact of acquisitions and non-cash adjustments. Net inventories increased by $48.2 million due to increases in production to support higher sales volumes. Accrued expenses decreased $20.8 million which included the impact of the payments of deferred compensation in connection with recent executive management transitions. Partially offsetting these items was an increase in Accounts payable of $39.2 million, which was partially due to the timing of payments.
Net cash used for investing activities of continuing operations during 2016 totaled $484.5 million, which included capital expenditures of $193.9 million. The Company's capital spending is focused on new product introductions, capacity expansion
34
projects in all segments and other high priority, profit-enhancing projects. Cash paid for acquisitions, net of cash acquired, totaled $276.1 million. See
Note 4 –
Acquisitions
in the Notes to Consolidated Financial Statements for further details on the Company's acquisitions. Additionally, the Company had net purchases of marketable securities of $24.3 million during the year. See
Note 9 –
Investments
in the Notes to Consolidated Financial Statements for further details on the Company's investments.
Cash flows used for financing activities of continuing operations were $172.4 million during 2016. The cash outflow was primarily the result of common stock repurchases and cash dividends paid to common stock shareholders.
2015 Cash Flow
In 2015, net cash provided by operating activities of continuing operations totaled $338.3 million. The primary driver of the cash provided by operating activities was net earnings from continuing operations net of non-cash expense items. An increase in working capital had a negative effect on net cash provided by operating activities. Accrued expenses decreased $34.2 million during 2015, primarily driven by a reduction in insurance reserves related to the settlement of a product liability matter that was mostly offset by a related reduction in accounts receivable reflecting the impact of insurance proceeds, as well as a reduction in accrued payroll costs due to timing of payrolls.
Net inventories increased $15.2 million due to increases in production to support higher sales volumes and new product introductions; however, increases were at a lower rate than the prior year. Accounts and notes receivable increased $12.3 million, primarily driven by higher fourth quarter sales across all segments.
Net cash used for investing activities of continuing operations during 2015 totaled $84.3 million, which included capital expenditures of $132.5 million. The Company's capital spending was focused on new product introductions, capacity expansion projects in all segments, and other high priority, profit-enhancing projects. Cash paid for the acquisitions of BLA, SCIFIT and
Garelick net of cash acquired, totaled $29.7 million. See
Note 4 –
Acquisitions
in the Notes to Consolidated Financial Statements for further details on the Company's acquisitions.
The Company had net proceeds from marketable securities of $71.7 million in 2015. See
Note 9 –
Investments
in the Notes to Consolidated Financial Statements for further details on the Company's investments.
Cash flows used for financing activities of continuing operations were $168.8 million during 2015. The cash outflow was primarily the result of common stock repurchases and cash dividends paid to common stock shareholders.
2014 Cash Flow
In 2014, net cash provided by operating activities of continuing operations totaled $246.9 million.
The primary driver of the cash provided by operating activities was net earnings from continuing operations net of non-cash expense items. An increase in working capital had a negative effect on net cash provided by operating activities. Net inventories increased $57.1 million due to increases in production and finished goods to support successful new product introductions and to meet seasonal requirements in advance of the 2015 marine selling season. Accounts and notes receivable increased $24.0 million, primarily driven by higher fourth quarter sales across all segments. Partially offsetting these items was an increase in Accounts payable of $13.0 million, which was a result of increased production.
Net cash used for investing activities of continuing operations during 2014 totaled $239.9 million, which included capital expenditures of $124.8 million. The Company's capital spending was focused on new product introductions and growth initiatives, capacity expansion projects in all segments, and high priority, profit-maintaining capital and investments targeting operating cost reductions. The Company also had net purchases of marketable securities of $70.5 million in 2014. Cash paid for the acquisitions of Whale and Bell, net of cash acquired, totaled $41.5 million in 2014. The Company also transferred $9.1 million to restricted cash in 2014. Partially offsetting these items were $5.8 million in proceeds from the sale of property, plant and equipment in the normal course of business mainly in the Company's Boat segment.
Cash flows used for financing activities of continuing operations were $60.7 million during 2014. The cash outflow was primarily the result of cash dividends paid to common stock shareholders and common stock repurchases.
35
Liquidity and Capital Resources
The Company views its highly liquid assets as of
December 31, 2016
and
2015
as:
|
(in millions)
|
2016
|
2015
|
|||||
|
Cash and cash equivalents
|
$
|
422.4
|
|
$
|
657.3
|
|
|
|
Short-term investments in marketable securities
|
35.8
|
|
11.5
|
|
|||
|
Total cash, cash equivalents and marketable securities
|
$
|
458.2
|
|
$
|
668.8
|
|
|
The following table sets forth an analysis of Total liquidity as of
December 31, 2016
and
2015
:
|
(in millions)
|
2016
|
2015
|
|||||
|
Cash, cash equivalents and marketable securities
|
$
|
458.2
|
|
$
|
668.8
|
|
|
|
Amounts available under lending facilities
(A)
|
295.7
|
|
296.2
|
|
|||
|
Total liquidity
(B)
|
$
|
753.9
|
|
$
|
965.0
|
|
|
(A) In June 2016, the Company amended and restated its existing credit agreement, dated as of March 2011, as amended and restated as of June 2014. See
Note 16 –
Debt
in the Notes to Consolidated Financial Statements for further details on the Company's lending facility.
(B) The Company defines Total liquidity as Cash and cash equivalents and Short-term investments in marketable securities as presented in the Consolidated Balance Sheets, plus amounts available for borrowing under its lending facilities. Total liquidity is not intended as an alternative measure to Cash and cash equivalents and Short-term investments in marketable securities as determined in accordance with GAAP in the United States. The Company uses this financial measure, both in presenting its results to shareholders and the investment community and in its internal evaluation and management of its businesses. Management believes that this financial measure and the information it provides are useful to investors because it permits investors to view the Company’s performance using the same metric that management uses to gauge progress in achieving its goals. Management believes that the non-GAAP financial measure Total liquidity is also useful to investors because it is an indication of the Company’s available highly liquid assets and immediate sources of financing.
Cash, cash equivalents and marketable securities totaled
$458.2 million
as of
December 31, 2016
, a decrease of $210.6 million from
$668.8 million
as of
December 31, 2015
. Total debt as of
December 31, 2016
and
December 31, 2015
was
$442.4 million
and
$448.5 million
, respectively. The Company's debt-to-capitalization ratio improved to
23.5
percent as of
December 31, 2016
, from
25.9
percent as of
December 31, 2015
.
Management believes that the Company has adequate sources of liquidity to meet the Company's short-term and long-term needs. The next significant long-term debt maturity is not until 2021.
The Company has executed share repurchases against authorization approved by the Board of Directors in 2014 and 2016. In 2016, the Company repurchased
$120 million
of stock under these authorizations and as of
December 31, 2016
, the remaining authorization was
$240 million
. The Company plans to repurchase approximately $100 million of shares in 2017.
Quarterly dividend payments in 2017 are expected to be consistent with 2016 levels.
The Company's plan assumes an increase in net earnings in 2017 when compared with 2016. The Company plans to make cash contributions to its defined benefit pension plans of approximately $75 million in 2017. Net activity in working capital is projected to reflect a usage of cash in 2017 in the range of $30 million to $50 million. Additionally, the Company is planning for capital expenditures of approximately $185 million to $195 million, reflecting substantial new product investments in the outboard engine and fitness businesses and continued capacity investments to support new products and growth. Including these factors, the Company plans to generate free cash flow in 2017 in excess of $250 million.
The aggregate funded status of the Company's qualified defined benefit pension plans, measured as a percentage of the projected benefit obligation, was approximately 78 percent at December 31, 2016 compared with approximately 74 percent at December 31, 2015. As of December 31, 2016, the Company's qualified defined benefit pension plans were underfunded on an aggregate projected benefit obligation basis by $199.1 million which represented a $63.3 million improvement from 2015. This improvement was due to contributions of $70 million and strong asset returns, partially offset by a decrease in the discount rate. See
Note 17 –
Postretirement Benefits
in the Notes to Consolidated Financial Statements for more details.
The Company contributed $70.0 million to its qualified defined benefit pension plans both in 2016 and 2015. The Company also contributed $4.6 million and $3.6 million to fund benefit payments in its nonqualified defined benefit pension plan in 2016
36
and 2015, respectively. Planned Company contributions for 2017 are subject to change based on market conditions, pension funding regulations and Company discretion.
Financial Services
Refer to
Note 10 –
Financial Services
in the Notes to Consolidated Financial Statements for more information about the Company's financial services.
Off-Balance Sheet Arrangements
Guarantees.
The Company has reserves to cover potential losses associated with guarantees and repurchase obligations based on historical experience and current facts and circumstances. Historical cash requirements and losses associated with these obligations have not been significant. See
Note 13 –
Commitments and Contingencies
in the Notes to Consolidated Financial Statements for a description of these arrangements.
Contractual Obligations
The following table sets forth a summary of the Company's contractual cash obligations as of
December 31, 2016
:
|
Payments due by period
|
|||||||||||||||||||
|
(in millions)
|
Total
|
Less than 1 year
|
1-3 years
|
3-5 years
|
More than 5 years
|
||||||||||||||
|
Contractual Obligations
|
|||||||||||||||||||
|
Debt
(A)
|
$
|
449.7
|
|
$
|
5.9
|
|
$
|
11.4
|
|
$
|
158.2
|
|
$
|
274.2
|
|
||||
|
Interest payments on long-term debt
|
216.1
|
|
26.2
|
|
52.4
|
|
52.4
|
|
85.1
|
|
|||||||||
|
Operating leases
(B)
|
151.3
|
|
37.6
|
|
56.0
|
|
24.5
|
|
33.2
|
|
|||||||||
|
Purchase obligations
(C)
|
224.3
|
|
222.5
|
|
1.8
|
|
—
|
|
—
|
|
|||||||||
|
Deferred management compensation
(D)
|
44.8
|
|
5.1
|
|
2.0
|
|
2.0
|
|
35.7
|
|
|||||||||
|
Other long-term liabilities
(E)
|
165.5
|
|
23.1
|
|
85.8
|
|
33.8
|
|
22.8
|
|
|||||||||
|
Total contractual obligations
|
$
|
1,251.7
|
|
$
|
320.4
|
|
$
|
209.4
|
|
$
|
270.9
|
|
$
|
451.0
|
|
||||
|
(A)
|
See
Note 16 –
Debt
in the Notes to Consolidated Financial Statements for additional information on the Company's debt. “Debt” refers to future cash principal payments. Debt also includes the Company's capital leases as discussed in
Note 21 –
Leases
in the Notes to Consolidated Financial Statements.
|
|
(B)
|
See
Note 21 –
Leases
in the Notes to Consolidated Financial Statements for additional information.
|
|
(C)
|
Purchase obligations represent agreements with suppliers and vendors at the end of
2016
for raw materials and other supplies as part of the normal course of business.
|
|
(D)
|
Amounts primarily represent long-term deferred compensation plans for Company management. Payments are assumed to be equal to the remaining liability.
|
|
(E)
|
Other long-term liabilities include amounts recorded as secured obligations for lease and other long-term receivables originated by the Company and assigned to third parties where the transfer of assets do not meet the conditions for a sale as a result of the Company's contingent obligation to repurchase the receivables in the event of customer non-payment. Amounts above also include obligations under deferred revenue arrangements and future projected payments related to the Company's nonqualified pension plans. The Company is not required to make any contributions to the qualified pension plan in 2017; however,
$4.1 million
of scheduled retiree health care and life insurance benefit plan payments due within one year are included in other long-term liabilities. Due to the high degree of uncertainty regarding the potential future cash outflows associated with these plans, the Company is unable to provide a reasonably reliable estimate of the amounts and periods in which any additional liabilities might be paid beyond 2017.
|
Legal Proceedings
See
Note 13 –
Commitments and Contingencies
in the Notes to Consolidated Financial Statements for disclosure related to certain legal and environmental proceedings.
37
Environmental Regulation
In its Marine Engine segment, Brunswick continues to develop engine technologies to reduce engine emissions to comply with current and future emissions requirements. The Boat segment continues to pursue fiberglass boat manufacturing technologies and techniques to reduce air emissions at its boat manufacturing facilities. The costs associated with these activities may have an adverse effect on segment operating margins and may affect short-term operating results. Environmental regulatory bodies in the United States and other countries may impose higher emissions standards and/or other environmental regulatory requirements than are currently in effect. The Company complies with current regulations and expects to comply fully with any new regulations; compliance will increase the cost of these products for the Company and the industry, but is not expected to have a material adverse effect on Brunswick's competitive position.
Critical Accounting Policies
The preparation of the consolidated financial statements in accordance with accounting principles generally accepted in the United States requires management to make certain estimates and assumptions that affect the amount of reported assets and liabilities and disclosure of contingent assets and liabilities at the date of the consolidated financial statements and revenues and expenses during the periods reported. Actual results may differ from those estimates. If current estimates for the cost of resolving any specific matters are later determined to be inadequate, results of operations could be adversely affected in the period in which additional provisions are required. The Company has discussed the development and selection of the critical accounting policies with the Audit Committee of the Board of Directors and believes the following are the most critical accounting policies that could have an effect on Brunswick's reported results.
Revenue Recognition and Sales Incentives.
Brunswick's revenue is derived primarily from the sale of boats, marine engines, marine parts and accessories, fitness equipment and active recreation products. Revenue is recognized in accordance with the terms of the sale, primarily upon shipment to customers, once the sales price is fixed or determinable and collectability is reasonably assured. Brunswick offers discounts and sales incentives that include retail promotions and rebates that are recorded as reductions of revenues in Net sales in the Consolidated Statements of Operations. The estimated liability and reduction in revenues for sales incentives is recorded at the later of when the program has been communicated to the customer or at the time of sale. Revenues from freight are included as a part of Net sales in the Consolidated Statements of Operations, whereas shipping, freight and handling costs are included in Cost of sales.
In May 2014, the FASB issued a final standard on revenue recognition that will supersede most current revenue recognition guidance. Refer to
Note 1 –
Significant Accounting Policies
for further discussion of the new revenue recognition standard.
Warranty Reserves.
The Company records a liability for product warranties at the time revenue is recognized. The liability is estimated using historical warranty experience, projected claim rates and expected costs per claim. The Company adjusts its liability for specific warranty matters when they become known and the exposure can be estimated. The Company's warranty liabilities are affected by product failure rates as well as material usage and labor costs incurred in correcting a product failure. If actual costs differ from estimated costs, the Company must make a revision to the warranty liability.
Goodwill and Other Intangibles.
Goodwill and other intangible assets primarily result from business acquisitions. The excess of cost over net assets of businesses acquired is recorded as goodwill. The Company reviews these assets for impairment at least annually and whenever events or changes in circumstances indicate that the carrying value may not be recoverable. All three of the Company's reporting units have a goodwill balance.
For both 2016 and 2015, the Company determined through qualitative assessment that it was not “more likely than not” that the fair values of its reporting units are less than their carrying values; as a result, the Company was not required to perform the two-step impairment test in either year. The Company did not record any goodwill impairments in
2016
,
2015
or
2014
.
The Company calculated the fair value of its reporting units considering both the income approach and the guideline public company method. The income approach calculates the fair value of the reporting unit using a discounted cash flow approach utilizing a Gordon Growth model. Internally forecasted future cash flows, which the Company believes reasonably approximate market participant assumptions, are discounted using a weighted average cost of capital (Discount Rate) developed for each reporting unit. The Discount Rate is developed using market observable inputs, as well as considering whether or not there is a measure of risk related to the specific reporting unit’s forecasted performance. Fair value under the guideline public company method is determined by applying market multiples for that reporting unit’s comparable public companies to the unit’s financial results. The key uncertainties in these calculations are the assumptions used in a reporting unit’s forecasted future performance, including revenue growth and operating margins, as well as the perceived risk associated with those forecasts, and selecting representative market multiples.
38
The Company's primary intangible assets are customer relationships and trade names acquired in business combinations. The costs of amortizable intangible assets are amortized over their expected useful lives, typically between
three
and
fifteen
years, using the straight-line method. Intangible assets that are subject to amortization are evaluated for impairment using a process similar to that used to evaluate long-lived assets described below. Intangible assets not subject to amortization are assessed for impairment at least annually and whenever events or changes in circumstances indicate that the carrying value may not be recoverable. The impairment test for indefinite-lived intangible assets consists of a comparison of the fair value of the intangible asset with its carrying amount. An impairment loss is recognized for the amount by which the carrying value exceeds the fair value of the asset. The fair value of trade names is measured using a relief-from-royalty approach, which assumes the value of the trade name is the discounted cash flows of the amount that would be paid to third parties had the Company not owned the trade name and instead licensed the trade name from another company. Higher royalty rates are assigned to premium brands within the marketplace based on name recognition and profitability, while other brands receive lower royalty rates. The basis for future cash flow projections is internal revenue forecasts by brand, which the Company believes represent reasonable market participant assumptions, to which the selected royalty rate is applied. These future cash flows are discounted using the applicable Discount Rate as well as any potential risk premium to reflect the inherent risk of holding a standalone intangible asset. The key uncertainties in this calculation are the selection of an appropriate royalty rate and assumptions used in developing internal revenue growth forecasts, as well as the perceived risk associated with those forecasts in developing the Discount Rate.
The Company did not record any intangible asset impairments during
2016
,
2015
or
2014
.
Long-Lived Assets.
The Company continually evaluates whether events and circumstances have occurred that indicate the remaining estimated useful lives of its definite-lived intangible assets--excluding goodwill and indefinite-lived trade names--and other long-lived assets may warrant revision or that the remaining balance of such assets may not be recoverable. Once an impairment indicator is identified, the Company tests for recoverability of the related asset group using an estimate of undiscounted cash flows over the remaining asset group's life. If an asset group's carrying value is not recoverable, the Company records an impairment loss based on the excess of the carrying value of the asset group over the long-lived asset group's fair value. Fair value is determined using observable inputs, including the use of appraisals from independent third parties, when available, and, when observable inputs are not available, based on the Company's assumptions of the data that market participants would use in pricing the asset or liability, based on the best information available in the circumstances. Specifically, the Company uses discounted cash flows to determine the fair value of the asset when observable inputs are unavailable. The Company tested its long-lived asset balances for impairment as indicators presented themselves during
2016
,
2015
or
2014
, resulting in impairment charges of
$2.4 million
,
$11.9 million
and
$1.5 million
, respectively, which are recognized in Restructuring, integration and impairment charges and Selling, general and administrative expense in the Consolidated Statements of Operations.
Litigation.
In the normal course of business, the Company is subject to claims and litigation, including obligations assumed or retained as part of acquisitions and divestitures. The Company accrues for litigation exposure based upon its assessment, made in consultation with counsel, of the likely range of exposure stemming from the claim. In light of existing reserves, the Company's litigation claims, when finally resolved, will not, in the opinion of management, have a material adverse effect on the Company's consolidated financial position, results of operations or cash flows.
Environmental.
The Company accrues for environmental remediation-related activities for which commitments or clean-up plans have been developed and for which costs can be reasonably estimated. Accrued amounts are generally determined in coordination with third-party experts on an undiscounted basis and do not consider recoveries from third parties until such recoveries are realized. In light of existing reserves, the Company's environmental claims, when finally resolved, will not, in the opinion of management, have a material adverse effect on the Company's consolidated financial position, results of operations or cash flows.
Postretirement Benefit Reserves.
Postretirement costs and obligations are actuarially determined and are affected by assumptions, including the discount rate, the estimated future return on plan assets, the increase in costs of health care benefits, mortality assumptions and other factors. The Company evaluates assumptions used on a periodic basis and makes adjustments to these liabilities as necessary.
Income Taxes.
Deferred taxes are recognized for the future tax effects of temporary differences between financial and income tax reporting using tax rates in effect for the years in which the differences are expected to reverse. The Company evaluates the realizability of net deferred tax assets and, as necessary, records valuation allowances against them. The Company estimates its tax obligations based on historical experience and current tax laws and litigation. The judgments made at any point in time may change based on the outcome of tax audits and settlements of tax litigation, as well as changes due to new tax laws and regulations and the Company's application of those laws and regulations. These factors may cause the Company's tax rate and deferred tax balances to increase or decrease.
39
Recent Accounting Pronouncements
See
Note 1 –
Significant Accounting Policies
in the Notes to Consolidated Financial Statements for the recent accounting pronouncements that have been adopted during the year ended
December 31, 2016
, or will be adopted in future periods.
The Company is exposed to market risk from changes in foreign currency exchange rates, commodity prices and interest rates. The Company enters into various hedging transactions to mitigate these risks in accordance with guidelines established by the Company's management. The Company does not use financial instruments for trading or speculative purposes.
The Company uses foreign currency forward and option contracts to manage foreign exchange rate exposure related to anticipated transactions, and assets and liabilities that are subject to risk from foreign currency rate changes. The Company's principal currency exposures relate to the Euro, Japanese yen, Canadian dollar, Australian dollar, British pound and Brazilian real. The Company hedges certain anticipated transactions with financial instruments whose maturity date, along with the realized gain or loss, occurs on or near the execution of the anticipated transaction. The Company manages foreign currency exposure of certain assets or liabilities through the use of derivative financial instruments such that the gain or loss on the derivative financial instrument offsets the loss or gain recognized on the asset or liability, respectively.
Certain raw materials the Company uses are exposed to the effect of changing commodity prices. Accordingly, the Company may use commodity swap agreements, futures contracts and supplier agreements to manage fluctuations in prices of anticipated purchases of certain raw materials, including aluminum, copper and natural gas.
From time-to-time, the Company enters into forward-starting interest rate swaps to hedge the interest rate risk associated with the future issuance of long-term debt. There were no forward-starting interest rate swaps outstanding at
December 31, 2016
and
2015
. The Company uses fixed-to-floating interest rate swaps to convert a portion of the Company's long-term debt from fixed-to-floating rate debt. An interest rate swap is entered into with the expectation that the change in the fair value of the interest rate swap will offset the change in the fair value of the debt instrument attributable to changes in the benchmark interest rate. Each period, the change in the fair value of the interest rate swap asset or liability is recorded as a change in the fair value of the corresponding debt instrument.
The following analyses provide quantitative information regarding the Company's exposure to foreign currency exchange rate risk, commodity price risk and interest rate risk as it relates to its derivative financial instruments. The Company uses a model to evaluate the sensitivity of the fair value of financial instruments with exposure to market risk that assumes instantaneous, parallel shifts in exchange rates and commodity prices. For options and instruments with nonlinear returns, models appropriate to the instrument are utilized to determine the impact of market shifts. There are certain shortcomings inherent in the sensitivity analyses presented, primarily due to the assumption that exchange rates change in a parallel fashion.
The amounts shown below represent the estimated reduction in fair market value that the Company would incur on its derivative financial instruments from a 10 percent adverse change in quoted foreign currency rates, commodity prices and interest rates.
|
(in millions)
|
2016
|
2015
|
|||||
|
Risk Category
|
|||||||
|
Foreign exchange
|
$
|
36.1
|
|
$
|
34.1
|
|
|
|
Commodity prices
(A)
|
—
|
|
0.7
|
|
|||
|
Interest rates
|
1.8
|
|
1.8
|
|
|||
|
(A)
|
As of
December 31, 2016
, there were no outstanding derivative financial instruments related to commodities.
|
|
See Index to Financial Statements and Financial Statement Schedule on page
44
.
|
None.
40
Conclusion Regarding the Effectiveness of Disclosure Controls and Procedures
Under the supervision and with the participation of the Company's management, including the Chief Executive Officer and the Chief Financial Officer of the Company (its principal executive officer and principal financial officer, respectively), the Company has evaluated its disclosure controls and procedures (as defined in Securities Exchange Act Rules 13a -15(e) and 15d -15(e)) as of the end of the period covered by this Annual Report on Form 10-K. Based upon that evaluation, the Chief Executive Officer and Chief Financial Officer have concluded that the Company's disclosure controls and procedures are effective.
Management's Report on Internal Control Over Financial Reporting
Pursuant to Section 404 of the Sarbanes-Oxley Act of 2002, the Company included a report of management's assessment of the effectiveness of its internal control over financial reporting as part of this Annual Report on Form 10-K for the fiscal year ended
December 31, 2016
. Management's report is included in the Company's
2016
Financial Statements under the captions entitled “Report of Management on Internal Control Over Financial Reporting” and is incorporated herein by reference.
Changes in Internal Control Over Financial Reporting
There have been no changes in the Company's internal control over financial reporting during the quarter ended
December 31, 2016
, that have materially affected, or are reasonably likely to materially affect, the Company's internal control over financial reporting.
None.
41
Information pursuant to this Item with respect to our Directors, the Company's Audit Committee and the Company's code of ethics is incorporated by reference from the discussion under the headings Proposal No. 1: Election of Directors and Corporate Governance in the Company's Proxy Statement for the Annual Meeting of Shareholders to be held on May 3, 2017 (Proxy Statement). Information pursuant to this Item with respect to compliance with Section 16(a) of the Securities Exchange Act of 1934 is incorporated by reference from the discussion under the heading Section 16(a) Beneficial Ownership Reporting Compliance in the Proxy Statement.
The information required by Item 401 of Regulation S-K regarding executive officers is included under “Executive Officers of the Registrant” following Item 4 in Part I of this Annual Report.
Information pursuant to this Item with respect to compensation paid to our Directors is incorporated by reference from the discussion under the heading Director Compensation in the Proxy Statement. Information pursuant to this Item with respect to executive compensation is incorporated by reference from the discussion under the heading Executive Compensation in the Proxy Statement.
Information pursuant to this Item with respect to the securities of the Company owned by the Directors and certain officers of the Company, by the Directors and officers of the Company as a group and by the persons known to the Company to own beneficially more than 5 percent of the outstanding voting securities of the Company is incorporated by reference from the discussion under the heading Stock Held by Directors, Executive Officers and Principal Shareholders in the Proxy Statement. Information pursuant to this Item with respect to securities authorized for issuance under the Company's equity compensation plans is hereby incorporated by reference from the discussion under the heading Equity Compensation Plan Information in the Proxy Statement.
Information pursuant to this Item with respect to certain relationships and related transactions is incorporated from the discussion under the headings Proposal No. 1: Election of Directors and Corporate Governance in the Proxy Statement.
Information pursuant to this Item with respect to fees for professional services rendered by the Company's independent registered public accounting firm and the Audit Committee's policy on pre-approval of audit and permissible non-audit services of the Company's independent registered public accounting firm is incorporated by reference from the discussion in the Proxy Statement under the heading Proposal No. 3: Ratification of the Appointment of Independent Registered Public Accounting Firm.
42
|
The financial statements and schedule filed as part of this Annual Report on Form 10-K are listed in the accompanying Index to Financial Statements and Financial Statement Schedule on page
44
. The exhibits filed as a part of this Annual Report are listed in the accompanying Exhibit Index on page
101
.
|
43
Index to Financial Statements and Financial Statement Schedule
Brunswick Corporation
|
Page
|
|
|
Financial Statements:
|
|
|
Financial Statement Schedule:
|
|
44
BRUNSWICK CORPORATION
REPORT OF MANAGEMENT ON INTERNAL CONTROL OVER FINANCIAL REPORTING
The Company's management is responsible for the preparation, integrity and objectivity of the financial statements and other financial information presented in this Annual Report. The financial statements have been prepared in conformity with accounting principles generally accepted in the United States and reflect the effects of certain estimates and judgments made by management.
The Company's management is also responsible for establishing and maintaining adequate internal control over financial reporting, as defined in Securities Exchange Act Rule 13a-15(f). Under the supervision and with the participation of the Company's management, including the Chief Executive Officer and the Chief Financial Officer, the Company conducted an evaluation of the effectiveness of its internal control over financial reporting based on the framework in Internal Control - Integrated Framework issued by the Committee of Sponsoring Organizations of the Treadway Commission (2013 framework).
Based on the Company's evaluation under the framework in Internal Control - Integrated Framework, management concluded that internal control over financial reporting was effective as of
December 31, 2016
. The effectiveness of internal control over financial reporting as of
December 31, 2016
has been audited by Deloitte & Touche LLP, an independent registered public accounting firm, as stated in its attestation report, which is included herein.
Brunswick Corporation
Lake Forest, Illinois
February 17, 2017
45
BRUNSWICK CORPORATION
REPORT OF INDEPENDENT REGISTERED PUBLIC ACCOUNTING FIRM
To the Board of Directors and Shareholders of Brunswick Corporation
Lake Forest, Illinois
We have audited the internal control over financial reporting of Brunswick Corporation and subsidiaries (the "Company") as of December 31, 2016, based on criteria established in
Internal Control - Integrated Framework (2013)
issued by the Committee of Sponsoring Organizations of the Treadway Commission. The Company's management is responsible for maintaining effective internal control over financial reporting and for its assessment of the effectiveness of internal control over financial reporting, included in the accompanying Report of Management on Internal Control over Financial Reporting. Our responsibility is to express an opinion on the Company's internal control over financial reporting based on our audit.
We conducted our audit in accordance with the standards of the Public Company Accounting Oversight Board (United States). Those standards require that we plan and perform the audit to obtain reasonable assurance about whether effective internal control over financial reporting was maintained in all material respects. Our audit included obtaining an understanding of internal control over financial reporting, assessing the risk that a material weakness exists, testing and evaluating the design and operating effectiveness of internal control based on the assessed risk, and performing such other procedures as we considered necessary in the circumstances. We believe that our audit provides a reasonable basis for our opinion.
A company's internal control over financial reporting is a process designed by, or under the supervision of, the company's principal executive and principal financial officers, or persons performing similar functions, and effected by the company's board of directors, management, and other personnel to provide reasonable assurance regarding the reliability of financial reporting and the preparation of financial statements for external purposes in accordance with generally accepted accounting principles. A company's internal control over financial reporting includes those policies and procedures that (1) pertain to the maintenance of records that, in reasonable detail, accurately and fairly reflect the transactions and dispositions of the assets of the company; (2) provide reasonable assurance that transactions are recorded as necessary to permit preparation of financial statements in accordance with generally accepted accounting principles, and that receipts and expenditures of the company are being made only in accordance with authorizations of management and directors of the company; and (3) provide reasonable assurance regarding prevention or timely detection of unauthorized acquisition, use, or disposition of the company's assets that could have a material effect on the financial statements.
Because of the inherent limitations of internal control over financial reporting, including the possibility of collusion or improper management override of controls, material misstatements due to error or fraud may not be prevented or detected on a timely basis. Also, projections of any evaluation of the effectiveness of the internal control over financial reporting to future periods are subject to the risk that the controls may become inadequate because of changes in conditions, or that the degree of compliance with the policies or procedures may deteriorate.
In our opinion, the Company maintained, in all material respects, effective internal control over financial reporting as of December 31, 2016, based on the criteria established in
Internal Control - Integrated Framework (2013)
issued by the Committee of Sponsoring Organizations of the Treadway Commission.
We have also audited, in accordance with the standards of the Public Company Accounting Oversight Board (United States), the consolidated financial statements and financial statement schedule as of and for the year ended December 31, 2016 of the Company and our report dated February 17, 2017 expressed an unqualified opinion on those financial statements and financial statement schedule.
/s/ DELOITTE & TOUCHE LLP
Chicago, Illinois
February 17, 2017
46
BRUNSWICK CORPORATION
REPORT OF INDEPENDENT REGISTERED PUBLIC ACCOUNTING FIRM
To the Board of Directors and Shareholders of Brunswick Corporation
Lake Forest, Illinois
We have audited the accompanying consolidated balance sheets of Brunswick Corporation and subsidiaries (the "Company") as of December 31, 2016 and 2015, and the related consolidated statements of operations, comprehensive income, shareholders' equity, and cash flows for each of the three years in the period ended December 31, 2016. Our audits also included the financial statement schedule listed in the Index at Item 15. These financial statements and financial statement schedule are the responsibility of the Company's management. Our responsibility is to express an opinion on the financial statements and financial statement schedule based on our audits.
We conducted our audits in accordance with the standards of the Public Company Accounting Oversight Board (United States). Those standards require that we plan and perform the audit to obtain reasonable assurance about whether the financial statements are free of material misstatement. An audit includes examining, on a test basis, evidence supporting the amounts and disclosures in the financial statements. An audit also includes assessing the accounting principles used and significant estimates made by management, as well as evaluating the overall financial statement presentation. We believe that our audits provide a reasonable basis for our opinion.
In our opinion, such consolidated financial statements present fairly, in all material respects, the financial position of Brunswick Corporation and subsidiaries at December 31, 2016 and 2015, and the results of their operations and their cash flows for each of the three years in the period ended December 31, 2016, in conformity with accounting principles generally accepted in the United States of America. Also, in our opinion, such financial statement schedule, when considered in relation to the basic consolidated financial statements taken as a whole, presents fairly, in all material respects, the information set forth therein.
We have also audited, in accordance with the standards of the Public Company Accounting Oversight Board (United States), the Company's internal control over financial reporting as of December 31, 2016, based on the criteria established in
Internal Control - Integrated Framework (2013)
issued by the Committee of Sponsoring Organizations of the Treadway Commission and our report dated February 17, 2017 expressed an unqualified opinion on the Company's internal control over financial reporting.
/s/ DELOITTE AND TOUCHE LLP
Chicago, Illinois
February 17, 2017
47
|
BRUNSWICK CORPORATION
|
|||||||||||
|
|
For the Years Ended December 31
|
||||||||||
|
(in millions, except per share data)
|
2016
|
2015
|
2014
|
||||||||
|
Net sales
|
$
|
4,488.5
|
|
$
|
4,105.7
|
|
$
|
3,838.7
|
|
||
|
Cost of sales
|
3,263.4
|
|
2,991.1
|
|
2,801.9
|
|
|||||
|
Selling, general and administrative expense
|
606.2
|
|
562.3
|
|
556.6
|
|
|||||
|
Research and development expense
|
139.2
|
|
125.9
|
|
119.6
|
|
|||||
|
Pension settlement charge
|
55.1
|
|
82.3
|
|
27.9
|
|
|||||
|
Restructuring, integration and impairment charges
|
15.6
|
|
12.4
|
|
4.2
|
|
|||||
|
Operating earnings
|
409.0
|
|
331.7
|
|
328.5
|
|
|||||
|
Impairment of equity method investment
|
—
|
|
—
|
|
(20.2
|
)
|
|||||
|
Equity earnings
|
4.3
|
|
3.7
|
|
1.8
|
|
|||||
|
Other income, net
|
2.1
|
|
5.4
|
|
6.5
|
|
|||||
|
Earnings before interest and income taxes
|
415.4
|
|
340.8
|
|
316.6
|
|
|||||
|
Interest expense
|
(27.5
|
)
|
(27.8
|
)
|
(29.9
|
)
|
|||||
|
Interest income
|
1.8
|
|
2.2
|
|
1.2
|
|
|||||
|
Earnings before income taxes
|
389.7
|
|
315.2
|
|
287.9
|
|
|||||
|
Income tax provision
|
115.3
|
|
87.8
|
|
93.0
|
|
|||||
|
Net earnings from continuing operations
|
274.4
|
|
|
227.4
|
|
194.9
|
|
||||
|
Discontinued operations:
|
|||||||||||
|
Earnings (loss) from discontinued operations, net of tax
|
1.6
|
|
1.2
|
|
(1.8
|
)
|
|||||
|
Gain on disposal of discontinued operations, net of tax
|
—
|
|
12.8
|
|
52.6
|
|
|||||
|
Net earnings from discontinued operations, net of tax
|
1.6
|
|
14.0
|
|
50.8
|
|
|||||
|
Net earnings
|
$
|
276.0
|
|
$
|
241.4
|
|
$
|
245.7
|
|
||
|
Earnings per common share:
|
|
|
|
|
|
|
|||||
|
Basic
|
|||||||||||
|
Earnings from continuing operations
|
$
|
3.01
|
|
$
|
2.45
|
|
$
|
2.08
|
|
||
|
Earnings from discontinued operations
|
0.02
|
|
0.15
|
|
0.55
|
|
|||||
|
Net earnings
|
$
|
3.03
|
|
$
|
2.60
|
|
$
|
2.63
|
|
||
|
Diluted
|
|||||||||||
|
Earnings from continuing operations
|
$
|
2.98
|
|
$
|
2.41
|
|
$
|
2.05
|
|
||
|
Earnings from discontinued operations
|
0.02
|
|
0.15
|
|
0.53
|
|
|||||
|
Net earnings
|
$
|
3.00
|
|
$
|
2.56
|
|
$
|
2.58
|
|
||
|
Weighted average shares used for computation of:
|
|
|
|
|
|||||||
|
Basic earnings per common share
|
91.2
|
|
93.0
|
|
93.6
|
|
|||||
|
Diluted earnings per common share
|
92.0
|
|
94.3
|
|
95.1
|
|
|||||
|
Cash dividends declared per common share
|
$
|
0.615
|
|
$
|
0.525
|
|
$
|
0.45
|
|
||
The Notes to Consolidated Financial Statements are an integral part of these consolidated statements.
48
|
BRUNSWICK CORPORATION
Consolidated Statements of Comprehensive Income
|
|||||||||||
|
|
For the Years Ended December 31
|
||||||||||
|
(in millions)
|
2016
|
2015
|
2014
|
||||||||
|
Net earnings
|
$
|
276.0
|
|
$
|
241.4
|
|
$
|
245.7
|
|
||
|
Other comprehensive income (loss), net of tax:
|
|||||||||||
|
Foreign currency translation:
|
|||||||||||
|
Foreign currency translation adjustments arising during period
(A)
|
4.5
|
|
(41.9
|
)
|
(26.2
|
)
|
|||||
|
Less: reclassification of foreign currency translation included in
Net earnings
(B)
|
—
|
|
—
|
|
0.7
|
|
|||||
|
Net foreign currency translation
|
4.5
|
|
(41.9
|
)
|
(25.5
|
)
|
|||||
|
Defined benefit plans:
|
|||||||||||
|
Net actuarial losses arising during period
(A)
|
(10.2
|
)
|
(14.1
|
)
|
(83.7
|
)
|
|||||
|
Less: amortization of prior service credits included in Net earnings
(B)
|
(0.4
|
)
|
(0.8
|
)
|
(1.3
|
)
|
|||||
|
Less: amortization of net actuarial losses included in Net earnings
(B)
|
45.3
|
|
63.6
|
|
25.7
|
|
|||||
|
Net defined benefit plans
|
34.7
|
|
48.7
|
|
(59.3
|
)
|
|||||
|
Derivatives:
|
|||||||||||
|
Net gains on derivatives arising during period
(A)
|
2.1
|
|
8.4
|
|
4.4
|
|
|||||
|
Less: reclassification adjustment included in Net earnings
(B)
|
(1.8
|
)
|
(8.8
|
)
|
1.4
|
|
|||||
|
Net unrealized gains (losses) on derivatives
|
0.3
|
|
(0.4
|
)
|
5.8
|
|
|||||
|
Other comprehensive income (loss)
|
39.5
|
|
6.4
|
|
(79.0
|
)
|
|||||
|
Comprehensive income
|
$
|
315.5
|
|
$
|
247.8
|
|
$
|
166.7
|
|
||
(A) The tax effects for the year ended
December 31, 2016
were
$(7.9) million
for foreign currency translation,
$5.4 million
for net actuarial losses arising during the period and
$(0.8) million
for derivatives. The tax effects for the year ended
December 31, 2015
were
$(10.6) million
for foreign currency translation,
$10.4 million
for net actuarial losses arising during the period and
$(3.6) million
for derivatives. The tax effects for the year ended
December 31, 2014
were
$8.9 million
for foreign currency translation,
$53.2 million
for net actuarial losses arising during the period and
$(2.1) million
for derivatives.
(B) See
Note 19 –
Comprehensive Income
for the tax effects for the years ended
December 31, 2016
,
December 31, 2015
and
December 31, 2014
.
The Notes to Consolidated Financial Statements are an integral part of these consolidated statements.
49
|
BRUNSWICK CORPORATION
|
|||||||
|
As of December 31
|
|||||||
|
(in millions)
|
2016
|
2015
|
|||||
|
Assets
|
|
|
|||||
|
Current assets
|
|
|
|||||
|
Cash and cash equivalents, at cost, which approximates fair value
|
$
|
422.4
|
|
$
|
657.3
|
|
|
|
Short-term investments in marketable securities
|
35.8
|
|
11.5
|
|
|||
|
Total cash, cash equivalents and short-term investments in marketable securities
|
458.2
|
|
668.8
|
|
|||
|
Restricted cash
|
11.2
|
|
12.7
|
|
|||
|
Accounts and notes receivable, less allowances of $12.8 and $13.8
|
417.3
|
|
398.1
|
|
|||
|
Inventories
|
|
|
|
|
|||
|
Finished goods
|
502.7
|
|
444.4
|
|
|||
|
Work-in-process
|
91.1
|
|
88.4
|
|
|||
|
Raw materials
|
168.3
|
|
152.2
|
|
|||
|
Net inventories
|
762.1
|
|
685.0
|
|
|||
|
Prepaid expenses and other
|
39.7
|
|
39.8
|
|
|||
|
Current assets
|
1,688.5
|
|
1,804.4
|
|
|||
|
Property
|
|
|
|
|
|||
|
Land
|
24.3
|
|
24.2
|
|
|||
|
Buildings and improvements
|
406.4
|
|
351.8
|
|
|||
|
Equipment
|
979.2
|
|
886.8
|
|
|||
|
Total land, buildings and improvements and equipment
|
1,409.9
|
|
1,262.8
|
|
|||
|
Accumulated depreciation
|
(892.3
|
)
|
(861.4
|
)
|
|||
|
Net land, buildings and improvements and equipment
|
517.6
|
|
401.4
|
|
|||
|
Unamortized product tooling costs
|
127.7
|
|
103.8
|
|
|||
|
Net property
|
645.3
|
|
505.2
|
|
|||
|
Other assets
|
|
|
|
|
|||
|
Goodwill
|
413.8
|
|
298.7
|
|
|||
|
Other intangibles, net
|
164.8
|
|
55.1
|
|
|||
|
Equity investments
|
20.7
|
|
21.5
|
|
|||
|
Deferred income tax asset
|
307.8
|
|
420.2
|
|
|||
|
Other long-term assets
|
43.8
|
|
47.4
|
|
|||
|
Other assets
|
950.9
|
|
842.9
|
|
|||
|
Total assets
|
$
|
3,284.7
|
|
$
|
3,152.5
|
|
|
|
The Notes to Consolidated Financial Statements are an integral part of these consolidated statements.
|
|||||||
50
|
BRUNSWICK CORPORATION
Consolidated Balance Sheets
|
|||||||
|
As of December 31
|
|||||||
|
(in millions)
|
2016
|
2015
|
|||||
|
Liabilities and shareholders’ equity
|
|
|
|||||
|
Current liabilities
|
|
|
|||||
|
Current maturities of long-term debt
|
$
|
5.9
|
|
$
|
6.0
|
|
|
|
Accounts payable
|
392.7
|
|
339.1
|
|
|||
|
Accrued expenses
|
566.3
|
|
563.0
|
|
|||
|
Current liabilities
|
964.9
|
|
908.1
|
|
|||
|
Long-term liabilities
|
|
|
|
|
|||
|
Debt
|
436.5
|
|
442.5
|
|
|||
|
Deferred income tax liability
|
2.5
|
|
12.3
|
|
|||
|
Postretirement benefits
|
276.3
|
|
347.5
|
|
|||
|
Other
|
164.4
|
|
160.8
|
|
|||
|
Long-term liabilities
|
879.7
|
|
963.1
|
|
|||
|
Shareholders’ equity
|
|
|
|
|
|||
|
Common stock; authorized: 200,000,000 shares, $0.75 par value; issued: 102,538,000 shares; outstanding: 89,317,000 and 90,813,000 shares
|
76.9
|
|
76.9
|
|
|||
|
Additional paid-in capital
|
382.0
|
|
408.0
|
|
|||
|
Retained earnings
|
1,881.0
|
|
1,660.4
|
|
|||
|
Treasury stock, at cost: 13,221,000, and 11,725,000 shares
|
(465.2
|
)
|
(389.9
|
)
|
|||
|
Accumulated other comprehensive loss, net of tax:
|
|||||||
|
Foreign currency translation
|
(51.9
|
)
|
(56.4
|
)
|
|||
|
Defined benefit plans:
|
|||||||
|
Prior service credits
|
(5.1
|
)
|
(4.7
|
)
|
|||
|
Net actuarial losses
|
(372.0
|
)
|
(407.1
|
)
|
|||
|
Unrealized losses on derivatives
|
(5.6
|
)
|
(5.9
|
)
|
|||
|
Total accumulated other comprehensive loss, net of tax
|
(434.6
|
)
|
(474.1
|
)
|
|||
|
Shareholders’ equity
|
1,440.1
|
|
1,281.3
|
|
|||
|
Total liabilities and shareholders’ equity
|
$
|
3,284.7
|
|
$
|
3,152.5
|
|
|
The Notes to Consolidated Financial Statements are an integral part of these consolidated statements.
51
|
BRUNSWICK CORPORATION
|
|||||||||||
|
|
For the Years Ended December 31
|
||||||||||
|
(in millions)
|
2016
|
2015
|
2014
|
||||||||
|
Cash flows from operating activities
|
|
|
|
|
|||||||
|
Net earnings
|
$
|
276.0
|
|
$
|
241.4
|
|
$
|
245.7
|
|
||
|
Less: earnings from discontinued operations, net of tax
|
1.6
|
|
14.0
|
|
50.8
|
|
|||||
|
Net earnings from continuing operations
|
274.4
|
|
227.4
|
|
194.9
|
|
|||||
|
Depreciation and amortization
|
103.9
|
|
88.9
|
|
81.2
|
|
|||||
|
Pension (funding), net of expense
|
(4.8
|
)
|
20.4
|
|
(31.1
|
)
|
|||||
|
Other long-lived asset impairment charges
|
1.0
|
|
13.0
|
|
0.2
|
|
|||||
|
Deferred income taxes
|
62.5
|
|
43.6
|
|
48.3
|
|
|||||
|
Income taxes
|
20.2
|
|
11.4
|
|
(0.8
|
)
|
|||||
|
Excess tax benefits from share-based compensation
|
(13.4
|
)
|
(7.0
|
)
|
(8.4
|
)
|
|||||
|
Equity in earnings of unconsolidated affiliates
|
(4.3
|
)
|
(3.7
|
)
|
(1.8
|
)
|
|||||
|
Impairment of equity method investment
|
—
|
|
—
|
|
20.2
|
|
|||||
|
Changes in certain current assets and current liabilities
|
|||||||||||
|
Change in accounts and notes receivable
|
(1.1
|
)
|
(12.3
|
)
|
(24.0
|
)
|
|||||
|
Change in inventory
|
(48.2
|
)
|
(15.2
|
)
|
(57.1
|
)
|
|||||
|
Change in prepaid expenses and other
|
0.5
|
|
(3.1
|
)
|
(4.3
|
)
|
|||||
|
Change in accounts payable
|
39.2
|
|
1.1
|
|
13.0
|
|
|||||
|
Change in accrued expenses
|
(20.8
|
)
|
(34.2
|
)
|
5.7
|
|
|||||
|
Other, net
|
16.6
|
|
8.0
|
|
10.9
|
|
|||||
|
Net cash provided by operating activities of continuing operations
|
425.7
|
|
338.3
|
|
246.9
|
|
|||||
|
Net cash provided by (used for) operating activities of discontinued operations
|
(3.8
|
)
|
(14.8
|
)
|
1.3
|
|
|||||
|
Net cash provided by operating activities
|
421.9
|
|
323.5
|
|
248.2
|
|
|||||
|
Cash flows from investing activities
|
|
|
|
|
|||||||
|
Capital expenditures
|
(193.9
|
)
|
(132.5
|
)
|
(124.8
|
)
|
|||||
|
Purchases of marketable securities
|
(35.0
|
)
|
(47.6
|
)
|
(82.4
|
)
|
|||||
|
Sales or maturities of marketable securities
|
10.7
|
|
119.3
|
|
11.9
|
|
|||||
|
Reductions in (transfers to) restricted cash
|
1.5
|
|
2.9
|
|
(9.1
|
)
|
|||||
|
Investments
|
5.1
|
|
0.9
|
|
0.2
|
|
|||||
|
Acquisition of businesses, net of cash acquired
|
(276.1
|
)
|
(29.7
|
)
|
(41.5
|
)
|
|||||
|
Proceeds from the sale of property, plant and equipment
|
1.9
|
|
2.4
|
|
5.8
|
|
|||||
|
Other, net
|
1.3
|
|
—
|
|
—
|
|
|||||
|
Net cash used for investing activities of continuing operations
|
(484.5
|
)
|
(84.3
|
)
|
(239.9
|
)
|
|||||
|
Net cash provided by investing activities of discontinued operations
|
—
|
|
44.5
|
|
260.2
|
|
|||||
|
Net cash provided by (used for) investing activities
|
(484.5
|
)
|
(39.8
|
)
|
20.3
|
|
|||||
|
Cash flows from financing activities
|
|
|
|
|
|||||||
|
Net proceeds from issuances of long-term debt
|
1.0
|
|
0.1
|
|
0.5
|
|
|||||
|
Payments of long-term debt including current maturities
|
(3.2
|
)
|
(3.4
|
)
|
(5.3
|
)
|
|||||
|
Common stock repurchases
|
(120.3
|
)
|
(120.0
|
)
|
(20.0
|
)
|
|||||
|
Cash dividends paid
|
(55.4
|
)
|
(48.3
|
)
|
(41.7
|
)
|
|||||
|
Excess tax benefits from share-based compensation
|
13.4
|
|
7.0
|
|
8.4
|
|
|||||
|
Proceeds from share-based compensation activity
|
14.9
|
|
4.5
|
|
10.7
|
|
|||||
|
Tax withholding associated with shares issued for share-based compensation
|
(20.9
|
)
|
(8.7
|
)
|
(11.0
|
)
|
|||||
|
Other, net
|
(1.9
|
)
|
—
|
|
(2.3
|
)
|
|||||
|
Net cash used for financing activities of continuing operations
|
(172.4
|
)
|
(168.8
|
)
|
(60.7
|
)
|
|||||
|
Net cash provided by financing activities of discontinued operations
|
—
|
|
5.3
|
|
—
|
|
|||||
|
Net cash used for financing activities
|
(172.4
|
)
|
(163.5
|
)
|
(60.7
|
)
|
|||||
|
Effect of exchange rate changes on cash and cash equivalents
|
0.1
|
|
(15.6
|
)
|
(11.6
|
)
|
|||||
|
Net increase (decrease) in cash and cash equivalents
|
(234.9
|
)
|
104.6
|
|
196.2
|
|
|||||
|
Cash and cash equivalents at beginning of period
|
657.3
|
|
552.7
|
|
356.5
|
|
|||||
|
Cash and cash equivalents at end of period
|
$
|
422.4
|
|
$
|
657.3
|
|
$
|
552.7
|
|
||
|
Supplemental cash flow disclosures:
|
|||||||||||
|
Interest paid
|
$
|
30.1
|
|
$
|
28.5
|
|
$
|
31.1
|
|
||
|
Income taxes paid, net
|
$
|
32.6
|
|
$
|
32.8
|
|
$
|
45.5
|
|
||
The Notes to Consolidated Financial Statements are an integral part of these consolidated statements.
52
|
BRUNSWICK CORPORATION
Consolidated Statements of Shareholders' Equity
|
|||||||||||||||||||||||
|
(in millions, except per share data)
|
Common Stock
|
Additional Paid-in Capital
|
Retained Earnings
|
Treasury Stock
|
Accumulated Other Comprehensive Income (Loss)
|
Total
|
|||||||||||||||||
|
Balance, December 31, 2013
|
$
|
76.9
|
|
$
|
393.0
|
|
$
|
1,263.3
|
|
$
|
(293.3
|
)
|
$
|
(401.5
|
)
|
$
|
1,038.4
|
|
|||||
|
Net earnings
|
—
|
|
—
|
|
245.7
|
|
—
|
|
—
|
|
245.7
|
|
|||||||||||
|
Other comprehensive loss
|
—
|
|
—
|
|
—
|
|
—
|
|
(79.0
|
)
|
(79.0
|
)
|
|||||||||||
|
Dividends ($0.45 per common share)
|
—
|
|
—
|
|
(41.7
|
)
|
—
|
|
—
|
|
(41.7
|
)
|
|||||||||||
|
Compensation plans and other
|
—
|
|
2.0
|
|
—
|
|
26.1
|
|
—
|
|
28.1
|
|
|||||||||||
|
Common stock repurchases
|
—
|
|
—
|
|
—
|
|
(20.0
|
)
|
—
|
|
(20.0
|
)
|
|||||||||||
|
Balance, December 31, 2014
|
76.9
|
|
395.0
|
|
1,467.3
|
|
(287.2
|
)
|
(480.5
|
)
|
1,171.5
|
|
|||||||||||
|
Net earnings
|
—
|
|
—
|
|
241.4
|
|
—
|
|
—
|
|
241.4
|
|
|||||||||||
|
Other comprehensive income
|
—
|
|
—
|
|
—
|
|
—
|
|
6.4
|
|
6.4
|
|
|||||||||||
|
Dividends ($0.525 per common share)
|
—
|
|
—
|
|
(48.3
|
)
|
—
|
|
—
|
|
(48.3
|
)
|
|||||||||||
|
Compensation plans and other
|
—
|
|
13.0
|
|
—
|
|
17.3
|
|
—
|
|
30.3
|
|
|||||||||||
|
Common stock repurchases
|
—
|
|
—
|
|
—
|
|
(120.0
|
)
|
—
|
|
(120.0
|
)
|
|||||||||||
|
Balance, December 31, 2015
|
76.9
|
|
408.0
|
|
1,660.4
|
|
(389.9
|
)
|
(474.1
|
)
|
1,281.3
|
|
|||||||||||
|
Net earnings
|
—
|
|
—
|
|
276.0
|
|
—
|
|
—
|
|
276.0
|
|
|||||||||||
|
Other comprehensive income
|
—
|
|
—
|
|
—
|
|
—
|
|
39.5
|
|
39.5
|
|
|||||||||||
|
Dividends ($0.615 per common share)
|
—
|
|
—
|
|
(55.4
|
)
|
—
|
|
—
|
|
(55.4
|
)
|
|||||||||||
|
Compensation plans and other
|
—
|
|
(26.0
|
)
|
—
|
|
45.0
|
|
—
|
|
19.0
|
|
|||||||||||
|
Common stock repurchases
|
—
|
|
—
|
|
—
|
|
(120.3
|
)
|
—
|
|
(120.3
|
)
|
|||||||||||
|
Balance, December 31, 2016
|
$
|
76.9
|
|
$
|
382.0
|
|
$
|
1,881.0
|
|
$
|
(465.2
|
)
|
$
|
(434.6
|
)
|
$
|
1,440.1
|
|
|||||
The Notes to Consolidated Financial Statements are an integral part of these consolidated statements.
53
Note 1 –
Significant Accounting Policies
Basis of Presentation.
Brunswick Corporation (Brunswick or the Company) has prepared its consolidated financial statements pursuant to the rules and regulations of the Securities and Exchange Commission (SEC). As stated in
Note 2 –
Discontinued Operations
, Brunswick's results as discussed in the financial statements reflect continuing operations only, unless otherwise noted.
Principles of Consolidation.
Brunswick's consolidated financial statements include the accounts of all majority owned and controlled domestic and foreign subsidiaries. Intercompany balances and transactions have been eliminated.
Use of Estimates.
The preparation of the consolidated financial statements in accordance with accounting principles generally accepted in the United States (GAAP) requires management to make certain estimates. Actual results could differ materially from those estimates. These estimates affect:
•
The reported amounts of assets and liabilities at the date of the financial statements;
|
•
|
The disclosure of contingent assets and liabilities at the date of the financial statements; and
|
•
The reported amounts of revenues and expenses during the reporting periods.
Estimates in these consolidated financial statements include, but are not limited to:
•
Allowances for doubtful accounts;
•
Inventory valuation reserves;
•
Reserves for dealer allowances;
•
Reserves related to repurchase and recourse obligations;
•
Warranty related reserves;
•
Losses on litigation and other contingencies;
•
Environmental reserves;
•
Insurance reserves;
•
Valuation of goodwill and other intangible assets;
•
Impairments of long-lived assets;
•
Reserves related to restructuring and integration activities;
•
Postretirement benefit liabilities;
•
Valuation allowances on deferred tax assets; and
•
Income tax reserves.
Cash and Cash Equivalents.
The Company considers all highly liquid investments with a maturity of three months or less when purchased to be cash equivalents. These investments include, but are not limited to, investments in money market funds, bank deposits, federal government and agency debt securities and commercial paper.
Investments in Marketable Securities.
The Company classifies investments in debt securities that are not considered to be cash equivalents as Short-term investments in marketable securities as discussed in
Note 9 –
Investments
. Short-term investments in marketable securities have a stated maturity of twelve months or less from the balance sheet date. These securities are considered as available-for-sale and are reported at fair value. Unrealized gains and losses would be recorded net of tax as a component of Accumulated other comprehensive loss in Unrealized investment losses within Shareholders' equity. Declines in market value from the original cost deemed to be "other-than-temporary" are charged to
Other income, net
, in the period in which the loss occurs. The Company considers both the duration for which a decline in value has occurred and the extent of the decline in its determination of whether a decline in value has been “other than temporary.” Realized gains and losses are calculated based on the specific identification method and are included in
Other income, net
, in the Consolidated Statements of Operations.
Restricted Cash.
The Company considers the cash deposited in a trust that is pledged as collateral against certain workers' compensation-related obligations to be restricted cash. Refer to
Note 13 –
Commitments and Contingencies
for more information.
Accounts and Notes Receivable and Allowance for Doubtful Accounts.
The Company carries its accounts and notes receivable at their face amounts less an allowance for doubtful accounts. On a regular basis, the Company records an allowance for uncollectible receivables based upon known bad debt risks and past loss history, customer payment practices and economic conditions. Actual collection experience may differ from the current estimate of net receivables. A change to the allowance for doubtful accounts
54
may be required if a future event or other change in circumstances results in a change in the estimate of the ultimate collectability of a specific account.
The Company treats the sale of receivables in which the Company retains an interest as a secured obligation. Accordingly, the short-term portion of the receivables sold that are subject to recourse is recorded in Accounts and notes receivable and Accrued expenses in the Consolidated Balance Sheets.
Inventories.
Inventories are valued at the lower of cost or market, with market based on replacement cost or net realizable value. Approximately
53 percent
and
49 percent
of the Company's inventories were determined by the first-in, first-out method (FIFO) at
December 31, 2016
and
December 31, 2015
, respectively. Remaining inventories valued at the last-in, first-out method (LIFO) were
$123.0 million
and
$123.8 million
lower than the FIFO cost of inventories at December 31,
2016
and
2015
, respectively. Inventory cost includes material, labor and manufacturing overhead. There were no liquidations of LIFO inventory layers in
2016
,
2015
or
2014
.
Property.
Property, including major improvements and product tooling costs, is recorded at cost. Product tooling costs principally comprise the cost to acquire and construct various long-lived molds, dies and other tooling the Company uses in its manufacturing processes. Design and prototype development costs associated with product tooling are expensed as incurred. Maintenance and repair costs are also expensed as incurred. Depreciation is recorded over the estimated service lives of the related assets, principally using the straight-line method. Buildings and improvements are depreciated over a useful life of
five
to
forty
years. Equipment is depreciated over a useful life of
two
to
twenty
years. Product tooling costs are amortized over the shorter of the useful life of the tooling or the anticipated life of the applicable product, for a period not to exceed
eight
years. The Company capitalizes interest on qualifying assets during the construction period and capitalized
$2.6 million
and
$0.7 million
in
2016
and
2015
, respectively. The Company presents capital expenditures on a cash basis within the Consolidated Statements of Cash Flows. There were
$35.8 million
and
$26.6 million
of unpaid capital expenditures within Accounts payable and Accrued expenses as of December 31,
2016
and
2015
, respectively. The Company includes gains and losses recognized on the sale and disposal of property in either Selling, general and administrative expenses or
Restructuring, integration and impairment charges
as appropriate. The amount of gains and losses for the years ended December 31 were as follows:
|
(in millions)
|
2016
|
2015
|
2014
|
||||||||
|
Gains on the sale of property
|
$
|
0.5
|
|
$
|
1.1
|
|
$
|
1.8
|
|
||
|
Losses on the sale and disposal of property
|
(0.6
|
)
|
(2.0
|
)
|
(0.5
|
)
|
|||||
|
Net gains (losses) on sale and disposal of property
|
$
|
(0.1
|
)
|
$
|
(0.9
|
)
|
$
|
1.3
|
|
||
As of December 31, 2016 and 2015, the Company had
$13.2 million
and
$14.2 million
, respectively, of net assets classified as held-for-sale within Net property in the Consolidated Balance Sheets.
Software Development Costs.
The Company expenses all software development and implementation costs incurred until the Company has determined that the software will result in probable future economic benefit and management has committed to funding the project. Once this is determined, external direct costs of material and services, payroll-related costs of employees working on the project and related interest costs incurred during the application development stage are capitalized. These capitalized costs are amortized over
three
to
seven
years. All other related costs, including training costs and costs to re-engineer business processes, are expensed as incurred.
Goodwill and Other Intangibles.
Goodwill and other intangible assets primarily result from business acquisitions. The Company records the excess of cost over net assets of businesses acquired as goodwill. The Company reviews goodwill for impairment at least annually and whenever events or changes in circumstances indicate that the carrying value may not be recoverable.
For
2016
and
2015
, the Company determined through qualitative assessment that the fair values of its reporting units were “more likely than not” greater than their carrying values. As a result, the Company was not required to perform the two-step impairment test. The Company did not record any goodwill impairments in
2016
,
2015
or
2014
.
The Company's primary intangible assets are customer relationships, trade names and patents and proprietary technology acquired in business combinations. The costs of amortizable intangible assets are amortized over their expected useful lives, typically between
three
and
sixteen
years, using the straight-line method. Intangible assets that are subject to amortization are evaluated for impairment using a process similar to that used to evaluate long-lived assets described below. Intangible assets not
55
subject to amortization, including trade names, are assessed for impairment at least annually and whenever events or changes in circumstances indicate that the carrying value may not be fully recoverable. The impairment test for indefinite-lived intangible assets consists of a comparison of the fair value of the intangible asset with its carrying amount. An impairment loss is recognized for the amount by which the carrying value exceeds the fair value of the asset. The fair value of trade names is measured using a relief-from-royalty approach, which assumes the value of the trade name is the discounted cash flows of the amount that would be paid to third parties had the Company not owned the trade name and instead licensed the trade name from another company. Higher royalty rates are assigned to premium brands within the marketplace based on name recognition and profitability, while other brands receive lower royalty rates. The basis for future cash flow projections is internal revenue forecasts by brand, which the Company believes represent reasonable market participant assumptions, to which the selected royalty rate is applied. These future cash flows are discounted using an applicable Discount Rate as well as any potential risk premium to reflect the inherent risk of holding a standalone intangible asset. The Company did not record any indefinite-lived intangible asset impairments during
2016
,
2015
or
2014
.
Refer to
Note 11 –
Goodwill and Other Intangibles
for more information.
Equity Investments.
For investments in which Brunswick owns or controls from
20 percent
to
50 percent
of the voting shares, the Company uses the equity method of accounting. The Company's share of net earnings or losses from equity method investments is included in the Consolidated Statements of Operations. The Company accounts for other investments, over which the Company does not have the ability to exercise significant influence, under the cost method of accounting. The Company periodically evaluates the carrying value of its investments.
Long-Lived Assets.
The Company continually evaluates whether events and circumstances have occurred that indicate the remaining estimated useful lives of its definite-lived intangible assets and other long-lived assets may warrant revision or that the remaining balance of such assets may not be recoverable. Once an impairment indicator is identified, the Company tests for recoverability of the related asset group using an estimate of undiscounted cash flows over the remaining asset group's life. If an asset group's carrying value is not recoverable, the Company records an impairment loss based on the excess of the carrying value of the asset group over the long-lived asset group's fair value. Fair value is determined using observable inputs, including the use of appraisals from independent third parties, when available, and, when observable inputs are not available, based on the Company's assumptions of the data that market participants would use in pricing the asset, based on the best information available in the circumstances. Specifically, the Company uses discounted cash flows to determine the fair value of the asset when observable inputs are unavailable. The Company tested its long-lived asset balances for impairment as indicators presented themselves during
2016
,
2015
and
2014
, resulting in impairment charges of
$2.4 million
,
$11.9 million
and
$1.5 million
, respectively, which are recognized in
Restructuring, integration and impairment charges
and
Selling, general and administrative expense
in the Consolidated Statements of Operations.
Other Long-Term Assets.
Other long-term assets are mainly long-term receivables originated by the Company and assigned to third parties, long-term derivative assets and other long-term notes receivable. As of December 31,
2016
and
2015
, amounts assigned to third parties totaled
$29.0 million
and
$23.7 million
, respectively. The assignment of these instruments does not meet sale criteria as a result of the Company's contingent obligation to repurchase the receivables in the event of customer non-payment and therefore is treated as a secured obligation. Accordingly, these amounts were recorded in the Consolidated Balance Sheets under Other long-term assets and Long-term liabilities – Other.
Revenue Recognition.
Brunswick's revenue is derived primarily from the sale of boats, marine engines, marine parts and accessories, fitness equipment and active recreation products. Revenue is recognized in accordance with the terms of the sale, primarily upon shipment to customers, once the sales price is fixed or determinable and collectability is reasonably assured. Brunswick offers discounts and sales incentives that include retail promotions and rebates that are recorded as reductions of revenues in Net sales in the Consolidated Statements of Operations. The estimated liability and reduction in revenue for sales incentives is recorded at the later of when the program has been communicated to the customer or at the time of sale. Revenues from freight are included as a part of Net sales in the Consolidated Statements of Operations, whereas shipping, freight and handling costs are included in Cost of sales.
Advertising Costs.
The Company records advertising and promotion costs in Selling, general and administrative expense in the Consolidated Statements of Operations in the period when the advertising first takes place. Advertising and promotion costs were
$27.1 million
,
$28.7 million
and
$31.2 million
for the years ended December 31,
2016
,
2015
and
2014
, respectively.
Foreign Currency.
The functional currency for the majority of Brunswick's operations is the U.S. dollar. All assets and liabilities of operations with a functional currency other than the U.S. dollar are translated at period end current rates. The resulting
56
translation adjustments are recorded in Accumulated other comprehensive loss, net of tax. Revenues and expenses of operations with a functional currency other than the U.S. dollar are translated at the average exchange rates for the period. Transaction gains and losses resulting from changes in foreign currency exchange rates are recorded in
Other income, net
in the Consolidated Statements of Operations.
Share-Based Compensation.
The Company records amounts for all share-based compensation, including grants of stock options and stock appreciation rights (SARs), non-vested stock awards, performance-based share awards and the compensatory elements of employee stock purchase plans over the vesting period in the Consolidated Statements of Operations based upon their fair values at the date of the grant. Share-based compensation costs are recognized as a component of Selling, general and administrative expense in the Consolidated Statements of Operations. See
Note 18 –
Stock Plans and Management Compensation
for a description of the Company's accounting for share-based compensation plans.
Research and Development
. Research and development costs are expensed as incurred.
Derivatives.
The Company uses derivative financial instruments to manage its risk associated with movements in foreign currency exchange rates, interest rates and commodity prices. These instruments are used in accordance with guidelines established by the Company's management and are not used for trading or speculative purposes. The Company records all derivatives on the Consolidated Balance Sheets at fair value. See
Note 14 –
Financial Instruments
for further discussion.
Recent Accounting Pronouncements
. The following recent accounting pronouncements have been adopted during
2016
or will be adopted in future periods.
Restricted Cash
: In November 2016, the
Financial Accounting Standards Board (FASB)
amended the
Accounting Standards Codification (ASC) to address diversity in practice related to the cash flow classification of restricted cash. Under the amendment, an entity should include restricted cash within cash and cash-equivalents on the Consolidated Statements of Cash Flows and provide a reconciliation to cash and cash-equivalents on the Consolidated Balance Sheets.
The amendment is to be applied retrospectively and is effective for fiscal years, and the interim periods within those years, beginning after December 15, 2017, with early adoption permitted. The Company is currently evaluating the approach it will use to apply the new standard, but does not expect it will have a material impact on the Company's Consolidated Statements of Cash Flows.
Statements of Cash Flows Classifications
: In August 2016, the
FASB
amended the
ASC
to add and/or clarify guidance on the classification of certain transactions in the statement of cash flows. The amendment is to be applied retrospectively and is effective for fiscal years, and the interim periods within those years, beginning after December 15, 2017, with early adoption permitted. The Company is currently evaluating the approach it will use to apply the new standard and the impact it will have on the Company's Consolidated Statements of Cash Flows.
Share-Based Compensation
: In March 2016, the FASB amended the ASC to simplify the accounting for employee share-based payment transactions. Amendments related to minimum statutory withholding requirements and forfeitures will be applied using a modified retrospective approach through a cumulative adjustment to equity as of the beginning of the period of adoption, and are not expected to have a material impact on the Company's consolidated financial statements. Amendments to certain classifications on the statement of cash flows may be applied either prospectively or retrospectively, and amendments
requiring the recognition of excess tax benefits and tax deficiencies in the income statement are to be applied prospectively.
These amendments are to be applied for fiscal years, and interim periods within those years, beginning after December 15, 2016, with early adoption permitted. The Company is currently evaluating the approach it will use to apply the new standard and the impact that the adoption of the new standard will have on the Company's consolidated financial statements.
Recognition of Leases
: In February 2016, the FASB amended the ASC to require lessees to recognize assets and liabilities on the balance sheet for all leases with terms greater than twelve months. Lessees will recognize expenses similar to current lease accounting. The amendment is to be applied using a modified retrospective method with certain practical expedients, and is effective for fiscal years and interim periods within those years, beginning after December 15, 2018, with early adoption permitted. The Company is currently evaluating the approach it will use to apply the new standard and the impact that the adoption of the new standard will have on the Company's consolidated financial statements.
57
Classification of Deferred Income Taxes
: In November 2015, the FASB amended the ASC to require that deferred tax assets and liabilities be classified as non-current on the Consolidated Balance Sheets for all periods presented. The Company early adopted this ASC amendment during the first quarter of 2016 which caused the Company to change its method of presentation for current deferred income taxes in the Consolidated Balance Sheets for all periods presented. Current deferred income tax assets of
$180.5 million
as of December 31, 2015 were reclassified to long-term.
Measurement of Inventory
: In July 2015, the FASB issued final guidance to simplify the subsequent measurement of inventories by replacing the lower of cost or market test with a lower of cost and net realizable value test. The guidance applies to inventories for which cost is determined by methods other than LIFO and the retail inventory method. The amendment is to be applied prospectively and is effective for fiscal years, and the interim periods within those years, beginning after December 15, 2016, with early adoption permitted. The Company is currently evaluating the impact of adopting this ASC amendment, but does not expect it will have a material impact on the Company's consolidated financial statements.
Fair Value Disclosure
: In May 2015, the FASB amended the ASC to update the presentation of certain investments measured at net asset value within the fair value hierarchy. The amendment requires these investments to be removed from the fair value hierarchy categorization and presented as a single reconciling line item between the fair value of investments reported on the Consolidated Balance Sheets and the amounts reported in the fair value hierarchy table. The Company adopted this amendment in 2016 and it did not have a material impact on the Company’s consolidated financial statements.
Debt Issuance Costs
: In April 2015, the FASB amended the ASC to change the presentation of debt issuance costs. The amendment requires debt issuance costs be presented on the balance sheet as a direct reduction from the carrying amount of the related debt liability rather than as an asset. The Company early adopted this ASC amendment during the second quarter of 2015 which caused the Company to change its method of presentation for debt issuance costs in the Consolidated Balance Sheets for all periods presented.
Consolidation
: In February 2015, the FASB amended the ASC to update certain requirements for determining whether a variable interest entity must be consolidated. The amendment is effective for fiscal years, and the interim periods thereafter, beginning after December 15, 2015, with early adoption permitted. The Company adopted this amendment in 2016 and it did not have a material impact on the Company’s consolidated financial statements.
Revenue Recognition
: In May 2014, the FASB issued a final standard on revenue recognition which outlines a single comprehensive model for entities to use in accounting for revenue arising from contracts with customers. This standard will supersede most current revenue recognition guidance. Under the new standard, entities are required to identify the contract with a customer; identify the separate performance obligations in the contract; determine the transaction price; allocate the transaction price to the separate performance obligations in the contract; and recognize the appropriate amount of revenue when (or as) the entity satisfies each performance obligation. In August 2015, the FASB amended the ASC to delay the effective date to fiscal years, and the interim periods within those years, beginning on or after January 1, 2018, from the original effective date of January 1, 2017, with early adoption permitted no earlier than January 1, 2017. Entities have the option of using either retrospective transition or a modified approach in applying the new standard.
The Company plans to use the modified retrospective approach in applying the new standard. While the Company continues to assess the impact of the adoption of the new standard on the consolidated financial statements, the most significant impacts are expected to be in the Boat and Fitness segments. In the Boat segment, certain customers are offered retail promotions that are currently recorded at the later of when the program has been communicated to the customer or at the time of sale. Under the new standard, these promotions will now be recognized at the time of sale, primarily upon shipment to customers. In the Fitness segment, certain customer contracts include product rebates recorded in cost of sales at the time of sale. Under the new standard, the Company will no longer record the rebate at the time of sale; however a portion of revenue will be deferred and not recognized until such time that the rebate is redeemed.
As a result, the Company expects a change in the timing of when certain promotions and rebates are recorded; however does not expect a change in the total amount of cumulative revenue recognized for each transaction.
Note 2 –
Discontinued Operations
On July 17, 2014, the Company entered into an agreement to sell its retail bowling business to AMF Bowling Centers, Inc. In connection with its decision to sell its bowling centers, the Company also announced its intention to divest its bowling products business. As a result of these actions, these businesses, which were previously recorded in the Company's Bowling & Billiards
58
segment were reported as discontinued operations in the Consolidated Statements of Operations for all periods presented. The Company does not have any significant continuing involvement or continuing cash flows associated with these businesses.
On September 18, 2014, the Company completed the sale of its retail bowling business to AMF Bowling Centers, Inc. and in separate transactions, completed the sale of two retail bowling centers in California. The sales resulted in net cash proceeds of
$272.1 million
and resulted in an after-tax gain of
$55.1 million
. In connection with the sale of its retail bowling business, the Company entered into a trademark licensing agreement allowing AMF Bowling Centers, Inc. to use the Company's bowling retail related trademarks and trade names over a five year period from the date of acquisition. As a result, the Company recorded deferred income of
$20.7 million
related to this agreement, which will be recognized as Other income in the Consolidated Statements of Operations over
five
years. In connection with the sale of its retail bowling business, the Company has retained certain liabilities and provided guarantees on the leases of certain bowling centers.
On May 22, 2015, the Company completed the sale of its bowling products business which resulted in net cash proceeds of
$42.2 million
and an after-tax gain of
$10.3 million
. In connection with the sale of its bowling products business, the Company has retained certain liabilities.
The following table discloses the results of operations of the businesses reported as discontinued operations for the years ended December 31,
2016
,
2015
and
2014
, respectively:
|
(in millions)
|
2016
|
2015
|
2014
|
||||||||
|
Net sales
|
$
|
—
|
|
$
|
37.5
|
|
$
|
236.0
|
|
||
|
Earnings (loss) from discontinued operations before income taxes
|
$
|
2.6
|
|
$
|
1.5
|
|
$
|
(3.8
|
)
|
||
|
Income tax provision (benefit)
|
1.0
|
|
0.3
|
|
(2.0
|
)
|
|||||
|
Earnings (loss) from discontinued operations, net of tax
|
1.6
|
|
1.2
|
|
(1.8
|
)
|
|||||
|
Gain on disposal of discontinued operations, net of tax
(A)
|
—
|
|
12.8
|
|
52.6
|
|
|||||
|
Net earnings from discontinued operations, net of tax
|
$
|
1.6
|
|
$
|
14.0
|
|
$
|
50.8
|
|
||
(A) The Gain on disposal of discontinued operations, net of tax for 2015 includes a pre-tax and after-tax gain of
$12.8 million
. The Gain on disposal of discontinued operations, net of tax for 2014 includes a pre-tax gain of
$65.6 million
and a net tax provision of
$13.0 million
.
There were no assets or liabilities related to discontinued operations recorded as held-for-sale as of
December 31, 2016
or
December 31, 2015
.
Note 3 –
Restructuring, Integration and Impairment Activities
The Company has announced and implemented a number of initiatives designed to improve the Company’s cost structure, better utilize overall capacity, improve general operating efficiencies and consolidate the operations of recently acquired businesses. These initiatives resulted in the recognition of restructuring, integration and impairment charges in the Consolidated Statements of Operations during
2016
,
2015
and
2014
.
The costs incurred under these initiatives include:
•
Restructuring Activities – These amounts relate to:
|
•
|
Employee termination and other benefits
|
|
•
|
Costs to retain and relocate employees
|
|
•
|
Consulting costs
|
|
•
|
Consolidation of manufacturing footprint
|
|
•
|
Facility shutdown costs
|
•
Integration Activities – These amounts relate to professional fees for systems integration and deal costs, employee termination and benefits and other charges associated with integrating the operations of recently acquired businesses.
•
Asset Disposition and Impairment Actions – These amounts relate to sales and impairments of assets. Impairments of assets are recognized when the carrying amount of the asset is not expected to be fully recoverable. The impairments recognized
59
were equal to the difference between the carrying amount of the asset and the estimated fair value of the asset, which was determined using observable inputs, including appraisals from independent third parties when available. When observable inputs were not available, estimated fair value was determined using the Company’s assumptions, including the data that market participants would use in pricing the asset, based on the best information available in the circumstances. Specifically, the Company used discounted cash flows to determine the fair value of the asset when observable inputs were unavailable.
The Company has reported restructuring and integration activities based on the specific driver of the cost and reflected the expense in the accounting period when the Company has committed to or incurred the cost, as appropriate. The following table is a summary of the net expense associated with the restructuring, integration and impairment activities for
2016
,
2015
and
2014
. The
2016
charges related to actions initiated in 2016 and 2015. The
2015
charges related to actions initiated in 2015. The
2014
charges related to actions initiated in 2014 and prior years.
|
(in millions)
|
2016
|
2015
|
2014
|
||||||||
|
Restructuring activities:
|
|
|
|||||||||
|
Employee termination and other benefits
|
$
|
1.0
|
|
$
|
1.4
|
|
$
|
2.9
|
|
||
|
Current asset write-downs
|
—
|
|
—
|
|
0.5
|
|
|||||
|
Transformation costs:
|
|||||||||||
|
Consolidation of manufacturing footprint
|
—
|
|
—
|
|
1.0
|
|
|||||
|
Retention and relocation costs
|
—
|
|
0.3
|
|
0.3
|
|
|||||
|
Asset disposition and impairment actions:
|
|||||||||||
|
Definite-lived and other asset impairments and (gains) on disposal
|
2.3
|
|
10.7
|
|
(0.5
|
)
|
|||||
|
Integration activities:
|
|||||||||||
|
Employee termination and other benefits
|
4.0
|
|
—
|
|
—
|
|
|||||
|
Professional fees
|
5.9
|
|
—
|
|
—
|
|
|||||
|
Other
|
2.4
|
|
—
|
|
—
|
|
|||||
|
Total restructuring, integration and impairment charges
|
$
|
15.6
|
|
$
|
12.4
|
|
$
|
4.2
|
|
||
Reductions in demand for the Company’s products, further refinement of its product portfolio, further opportunities to reduce costs or the cost of integrating future acquisitions may result in additional restructuring, integration or impairment charges in future periods.
Actions Initiated in 2016
The Company acquired Cybex International, Inc. (Cybex) and Indoor Cycling Group GmbH (ICG) in the first and third quarters of 2016, respectively, as discussed in
Note 4 –
Acquisitions
. During 2016, the Company executed certain restructuring and integration activities within the Fitness segment primarily related to these acquisitions, resulting in the recognition of restructuring and integration charges in the Consolidated Statements of Operations. In the fourth quarter of 2016, the Company recorded restructuring charges related to the realignment of certain executive positions within the Boat segment as well as an asset impairment charge recorded within the Corporate segment.
The following table is a summary of the expense associated with the restructuring and integration activities for the year ended December 31, 2016 and related actions initiated in 2016:
60
|
(in millions)
|
Fitness
|
Boat
|
Corporate
|
Total
|
|||||||||||
|
Restructuring activities:
|
|||||||||||||||
|
Employee termination and other benefits
|
$
|
0.4
|
|
$
|
0.6
|
|
$
|
—
|
|
$
|
1.0
|
|
|||
|
Asset disposition and impairment actions:
|
|||||||||||||||
|
Definite-lived and other asset impairments and (gains) on disposal
|
—
|
|
—
|
|
1.4
|
|
1.4
|
|
|||||||
|
Integration activities:
|
|||||||||||||||
|
Employee termination and other benefits
|
4.0
|
|
—
|
|
—
|
|
4.0
|
|
|||||||
|
Professional fees
|
5.9
|
|
—
|
|
—
|
|
5.9
|
|
|||||||
|
Other
|
2.4
|
|
—
|
|
—
|
|
2.4
|
|
|||||||
|
Total restructuring, integration and impairment charges
|
$
|
12.7
|
|
$
|
0.6
|
|
$
|
1.4
|
|
$
|
14.7
|
|
|||
Actions Initiated in 2015
In the fourth quarter of 2015, the Company recorded impairment charges for certain long-lived assets in Brazil as a result of unfavorable market conditions and declining currency values. The Company used estimated future cash flows, a Level 3 input, to assess the fair value of the long-lived assets. The Company also recorded impairment charges in the fourth quarters of 2016 and 2015 in connection with its decision to sell its corporate headquarters facility in Lake Forest, Illinois. The Company used an independent market appraisal report, a Level 2 input, to assess the fair value of its corporate headquarters facility. Additionally, the Company recorded charges related to the restructuring of personnel, primarily within the Boat segment product development and engineering organizations.
The following table is a summary of the expense associated with the restructuring activities and impairment charges for the year ended December 31, 2016 and 2015 and related actions initiated in 2015:
|
2016
|
2015
|
||||||||||||||||||
|
(in millions)
|
Corporate
|
Total
|
Boat
|
Corporate
|
Total
|
||||||||||||||
|
Restructuring activities:
|
|||||||||||||||||||
|
Employee termination and other benefits
|
$
|
—
|
|
$
|
—
|
|
$
|
0.8
|
|
$
|
0.6
|
|
$
|
1.4
|
|
||||
|
Transformation costs:
|
|
||||||||||||||||||
|
Retention and relocation costs
|
—
|
|
—
|
|
0.3
|
|
—
|
|
0.3
|
|
|||||||||
|
Asset disposition and impairment actions:
|
|
|
|
||||||||||||||||
|
Definite-lived and other asset impairments and (gains) on disposal
|
0.9
|
|
0.9
|
|
6.6
|
|
4.1
|
|
10.7
|
|
|||||||||
|
Total restructuring, integration and impairment charges
|
$
|
0.9
|
|
$
|
0.9
|
|
$
|
7.7
|
|
$
|
4.7
|
|
$
|
12.4
|
|
||||
During
2016
, the Company made cash payments of
$10.2 million
relating to all restructuring and integration activities, including payments related to prior period restructuring activities. As of
December 31, 2016
, accruals remaining for restructuring and integration activities totaled
$4.6 million
which are expected to be paid during 2017.
61
Note 4 –
Acquisitions
2016 Acquisitions
On November 18, 2016, the Company acquired substantially all of
the assets
of Payne's Marine Group (Payne's), a leading wholesale distributor of marine parts and accessories in Canada, which is based in Victoria, British Columbia. The addition of Payne's broadens the reach of the Company's marine parts and accessories distribution network in the Canadian market. Payne's is managed within the Marine Engine segment.
On August 31, 2016, the Company acquired
100
percent of ICG, a market leader specializing in the design of indoor cycling equipment, which is based in Nuremburg, Germany. The addition of ICG strengthens the Company's position in indoor cycling and provides a strong foundation to expand in the growing group exercise market. ICG is managed as part of the Company's Fitness segment.
The Company acquired ICG for total consideration of
$54.1 million
, including
$51.7 million
of cash paid in 2016. The preliminary recording of the fair value of the assets acquired and liabilities assumed resulted in
$20.4 million
of identifiable intangible assets, including customer relationships, trade names and patents and proprietary technology for
$11.2 million
,
$6.0 million
and
$3.2 million
, respectively, along with
$28.6 million
for goodwill which is not deductible for tax purposes. The amounts assigned to ICG's customer relationships and patents and proprietary technology will be amortized over the estimated useful life of approximately
11 years
and
5 years
, respectively. These amounts recorded are preliminary and are subject to change within the measurement period as the Company finalizes its fair value estimates.
On July 1, 2016, the Company acquired
substantially all of the assets
of privately held Thunder Jet Boats, Inc. (Thunder Jet), a designer and builder of heavy-gauge aluminum boats, which is based in Clarkston, Washington. Thunder Jet offers a lineup of 18 models ranging in length from 18-26 feet and adds breadth and depth to the Company's overall product portfolio. Thunder Jet is managed within the Company's Boat segment.
On January 20, 2016, the Company acquired
100
percent of privately held Cybex, a leading manufacturer of commercial fitness equipment. Cybex offers a full line of cardiovascular and strength products and had unaudited sales in 2015 of approximately
$169 million
. The addition of Cybex expands the Fitness segment's participation in key markets, including commercial fitness, and adds to the Company's manufacturing footprint to meet current and future demand more effectively. Cybex also increases the breadth and depth of the segment's product portfolio. Cybex is managed within the Company's Fitness segment.
62
The following table is a summary of the assets acquired, liabilities assumed and net cash consideration paid for the Cybex acquisition during
2016
:
|
(in millions)
|
Fair Value
|
Useful Life
|
|||
|
Accounts and notes receivable
|
$
|
22.0
|
|
||
|
Inventory
|
13.9
|
|
|||
|
Goodwill
(A)
|
88.4
|
|
|||
|
Trade names
|
38.6
|
|
Indefinite
|
||
|
Customer relationships
|
43.7
|
|
16 years
|
||
|
Patents and proprietary technology
|
3.1
|
|
5 years
|
||
|
Property and equipment
|
35.2
|
|
|||
|
Other assets
|
3.7
|
|
|||
|
Total assets acquired
|
248.6
|
|
|||
|
Total liabilities assumed
|
51.7
|
|
|||
|
Net cash consideration paid
(B)
|
$
|
196.9
|
|
||
(A) The goodwill recorded for the acquisition of Cybex is not deductible for tax purposes.
(B) Net cash consideration paid includes a purchase price adjustment of
$1.9 million
in 2016.
2015 Acquisitions
On November 6, 2015, the Company acquired
100
percent of privately held Garelick Mfg. Co. (Garelick), which is based in St. Paul Park, Minnesota. Garelick is a leading manufacturer of premium seating, table hardware and other marine products. The Company believes this acquisition will expand the Company's marine parts and accessories business and add depth and breadth to its product portfolio. Garelick is managed within the Marine Engine segment.
On July 8, 2015, the Company acquired
100
percent of privately held SCIFIT Systems, Inc. (SCIFIT), which is based in Tulsa, Oklahoma. SCIFIT is a provider of fitness equipment designed for active aging seniors, medical wellness and rehabilitation markets. The Company believes this acquisition will expand the Fitness segment's product portfolio and enable entry into these growing adjacent markets. SCIFIT is managed within the Fitness segment.
63
On April 27, 2015, the Company acquired
100
percent of privately held BLA, which is based in Brisbane, Australia. BLA is Australia's largest provider of marine products and has an extensive dealer network throughout Australia and New Zealand. The Company believes this acquisition will strengthen Brunswick's marine parts and accessories presence in this region. BLA is managed within the Marine Engine segment.
The following table is a summary of the net cash consideration paid and the goodwill and intangible assets acquired during the years ended
December 31, 2016
and
2015
:
|
(in millions)
|
Fair Value of Identifiable Intangible Assets Acquired
|
|||||||||||||||||||
|
Year
|
Net Cash Consideration Paid
|
Goodwill
(B)
|
Total
|
Intangible Asset
|
Useful Life
|
|||||||||||||||
|
2016
(A)
|
$
|
276.1
|
|
$
|
119.2
|
|
$
|
118.7
|
|
Trade names
|
$
|
50.9
|
|
Indefinite
|
||||||
|
Customer relationships
|
61.5
|
|
11 - 16 years
|
|||||||||||||||||
|
Patents and proprietary technology
|
6.3
|
|
5 years
|
|||||||||||||||||
|
2015
|
29.7
|
|
3.5
|
|
13.4
|
|
Trade names
|
6.5
|
|
Indefinite
|
||||||||||
|
Customer relationships
|
6.1
|
|
7 years
|
|||||||||||||||||
|
Patents and proprietary technology
|
0.8
|
|
5 years
|
|||||||||||||||||
(A) Due to the timing of certain acquisitions, these amounts are preliminary and are subject to change within the measurement period as the Company finalizes its fair value estimates.
(B) The goodwill recorded for the acquisitions of ICG, Cybex and SCIFIT is not deductible for tax purposes, but is deductible for Thunder Jet.
These acquisitions are not material to the Company's net sales, results of operations or total assets during any period presented. Accordingly, the Company's consolidated results from operations do not differ materially from historical performance as a result of these acquisitions and, therefore, pro forma results are not presented.
64
Note 5 –
Earnings per Common Share
Basic earnings per common share is calculated by dividing Net earnings by the weighted average number of common shares outstanding as well as certain vested, unissued equity awards during the period. Diluted earnings per common share is calculated similarly, except that the calculation includes the dilutive effect of stock-settled SARs, non-vested stock awards and performance awards.
Basic and diluted earnings per common share for the years ended December 31,
2016
,
2015
and
2014
were calculated as follows:
|
(in millions, except per share data)
|
2016
|
2015
|
2014
|
||||||||
|
Net earnings from continuing operations
|
$
|
274.4
|
|
$
|
227.4
|
|
$
|
194.9
|
|
||
|
Net earnings from discontinued operations, net of tax
|
1.6
|
|
14.0
|
|
50.8
|
|
|||||
|
Net earnings
|
$
|
276.0
|
|
$
|
241.4
|
|
$
|
245.7
|
|
||
|
|
|||||||||||
|
Weighted average outstanding shares-basic
|
91.2
|
|
93.0
|
|
93.6
|
|
|||||
|
Dilutive effect of common stock equivalents
|
0.8
|
|
1.3
|
|
1.5
|
|
|||||
|
Weighted average outstanding shares-diluted
|
92.0
|
|
94.3
|
|
95.1
|
|
|||||
|
|
|||||||||||
|
Basic earnings per common share:
|
|
|
|||||||||
|
Continuing operations
|
$
|
3.01
|
|
$
|
2.45
|
|
$
|
2.08
|
|
||
|
Discontinued operations
|
0.02
|
|
0.15
|
|
0.55
|
|
|||||
|
Net earnings
|
$
|
3.03
|
|
$
|
2.60
|
|
$
|
2.63
|
|
||
|
|
|||||||||||
|
Diluted earnings per common share:
|
|
||||||||||
|
Continuing operations
|
$
|
2.98
|
|
$
|
2.41
|
|
$
|
2.05
|
|
||
|
Discontinued operations
|
0.02
|
|
0.15
|
|
0.53
|
|
|||||
|
Net earnings
|
$
|
3.00
|
|
$
|
2.56
|
|
$
|
2.58
|
|
||
Shares of SARs that were not included in the computation of diluted earnings per share for the periods ended December 31, 2016, 2015 and 2014 because their inclusion was anti-dilutive were
0.0 million
,
0.0 million
and
0.2 million
, respectively.
Note 6 –
Segment Information
Brunswick is a manufacturer and marketer of leading consumer brands and has
three
operating and reportable segments: Marine Engine, Boat and Fitness. The Company’s segments are defined by management’s reporting structure and operating activities.
The Marine Engine segment manufactures and markets a full range of outboard engines, sterndrive engines, inboard engines and marine parts and accessories, which are principally sold directly to boat builders, including Brunswick's Boat segment, or through marine retail dealers and distributors worldwide. The Company's engine manufacturing plants are located mainly in the United States, China and Japan, with sales mainly to markets in the Americas, Europe and Asia-Pacific.
The Boat segment designs, manufactures and markets fiberglass pleasure boats, yachts and sport yachts, sport cruisers and sport boats, offshore fishing boats, aluminum and fiberglass fishing boats, pontoon boats, utility boats, deck boats, inflatable boats and heavy-gauge aluminum boats. The Boat segment's products are manufactured mainly in the United States, Europe, Mexico and South America and sold through a global network of dealer and distributor locations, primarily in the Americas and Europe.
The Fitness segment designs, manufactures and markets a full line of cardiovascular fitness equipment including treadmills, total body cross-trainers, stair climbers, stationary exercise bicycles and strength-training equipment. The Fitness segment also includes InMovement products and services for productive well-being and our active recreation business, including billiards tables, accessories and game room furniture. These products are manufactured mainly in the United States and Hungary or are sourced
65
from international suppliers. Fitness equipment is sold mainly in the Americas, Europe and Asia to health club, corporate, university, hospitality, military and government facilities, and to consumers through selected mass merchants, specialty retail dealers and through the Company's website. Consumer active recreation equipment is predominantly sold in the United States and distributed primarily through dealers.
The Company evaluates performance based on business segment operating earnings. Segment operating earnings do not include the expenses of corporate administration, pension costs, pension settlement charges, impairments of equity method investments, earnings from unconsolidated equity affiliates, other expenses and income of a non-operating nature, interest expense and income or provisions for income taxes.
Corporate/Other results include items such as corporate staff and administrative costs. Corporate/Other total assets consist of mainly cash, cash equivalents and investments in marketable securities, restricted cash, income tax balances and investments in unconsolidated affiliates. Marine eliminations adjust for sales between the Marine Engine and Boat segments, primarily for the sale of engines and parts and accessories to various boat brands, which are consummated at established arm’s length transfer prices as the intersegment pricing for these engines and parts and accessories are based upon and consistent with selling prices to third party customers.
Information about the operations of Brunswick's operating segments is set forth below:
Operating Segments
|
|
Net Sales
|
Operating Earnings (Loss)
|
Total Assets
|
||||||||||||||||||||||||||||
|
(in millions)
|
2016
|
2015
|
2014
|
2016
|
2015
|
2014
|
2016
|
2015
|
|||||||||||||||||||||||
|
Marine Engine
|
$
|
2,441.1
|
|
$
|
2,314.3
|
|
$
|
2,189.4
|
|
$
|
378.0
|
|
$
|
350.4
|
|
$
|
309.1
|
|
$
|
1,079.5
|
|
$
|
981.8
|
|
|||||||
|
Boat
|
1,369.9
|
|
1,274.6
|
|
1,135.8
|
|
60.8
|
|
37.6
|
|
17.2
|
|
425.2
|
|
379.7
|
|
|||||||||||||||
|
Marine eliminations
|
(302.9
|
)
|
(277.8
|
)
|
(255.8
|
)
|
—
|
|
—
|
|
—
|
|
—
|
|
—
|
|
|||||||||||||||
|
Total Marine
|
3,508.1
|
|
3,311.1
|
|
3,069.4
|
|
438.8
|
|
388.0
|
|
326.3
|
|
1,504.7
|
|
1,361.5
|
|
|||||||||||||||
|
Fitness
|
980.4
|
|
794.6
|
|
769.3
|
|
117.3
|
|
116.5
|
|
115.3
|
|
947.5
|
|
625.1
|
|
|||||||||||||||
|
Pension costs
|
—
|
|
—
|
|
—
|
|
(69.8
|
)
|
(94.0
|
)
|
(42.7
|
)
|
—
|
|
—
|
|
|||||||||||||||
|
Corporate/Other
|
—
|
|
—
|
|
—
|
|
(77.3
|
)
|
(78.8
|
)
|
(70.4
|
)
|
832.5
|
|
1,165.9
|
|
|||||||||||||||
|
Total
|
$
|
4,488.5
|
|
$
|
4,105.7
|
|
$
|
3,838.7
|
|
$
|
409.0
|
|
$
|
331.7
|
|
$
|
328.5
|
|
$
|
3,284.7
|
|
$
|
3,152.5
|
|
|||||||
|
|
Depreciation
|
Amortization
|
|||||||||||||||||||||
|
(in millions)
|
2016
|
2015
|
2014
|
2016
|
2015
|
2014
|
|||||||||||||||||
|
Marine Engine
|
$
|
48.4
|
|
$
|
47.4
|
|
$
|
44.3
|
|
$
|
1.8
|
|
$
|
2.1
|
|
$
|
2.2
|
|
|||||
|
Boat
|
29.3
|
|
26.6
|
|
24.9
|
|
0.8
|
|
0.7
|
|
0.7
|
|
|||||||||||
|
Fitness
|
15.9
|
|
9.1
|
|
6.9
|
|
4.2
|
|
0.2
|
|
—
|
|
|||||||||||
|
Corporate/Other
|
3.5
|
|
2.8
|
|
2.2
|
|
—
|
|
—
|
|
—
|
|
|||||||||||
|
Total
|
$
|
97.1
|
|
$
|
85.9
|
|
$
|
78.3
|
|
$
|
6.8
|
|
$
|
3.0
|
|
$
|
2.9
|
|
|||||
|
|
Capital Expenditures
|
Research & Development Expense
|
|||||||||||||||||||||
|
(in millions)
|
2016
|
2015
|
2014
|
2016
|
2015
|
2014
|
|||||||||||||||||
|
Marine Engine
|
$
|
112.4
|
|
$
|
77.4
|
|
$
|
57.9
|
|
$
|
85.6
|
|
$
|
78.9
|
|
$
|
72.5
|
|
|||||
|
Boat
|
44.5
|
|
37.7
|
|
46.6
|
|
20.2
|
|
22.3
|
|
23.8
|
|
|||||||||||
|
Fitness
|
35.7
|
|
16.9
|
|
19.6
|
|
33.4
|
|
24.7
|
|
23.3
|
|
|||||||||||
|
Corporate/Other
|
1.3
|
|
0.5
|
|
0.7
|
|
—
|
|
—
|
|
—
|
|
|||||||||||
|
Total
|
$
|
193.9
|
|
$
|
132.5
|
|
$
|
124.8
|
|
$
|
139.2
|
|
$
|
125.9
|
|
$
|
119.6
|
|
|||||
66
Geographic Segments
|
Net Sales
|
Long-Lived Assets
|
||||||||||||||||||
|
(in millions)
|
2016
|
2015
|
2014
|
2016
|
2015
|
||||||||||||||
|
United States
|
$
|
3,031.5
|
|
$
|
2,727.8
|
|
$
|
2,400.0
|
|
$
|
564.5
|
|
$
|
429.3
|
|
||||
|
International
|
1,457.0
|
|
1,377.9
|
|
1,438.7
|
|
66.7
|
|
62.7
|
|
|||||||||
|
Corporate/Other
|
—
|
|
—
|
|
—
|
|
14.1
|
|
13.2
|
|
|||||||||
|
Total
|
$
|
4,488.5
|
|
$
|
4,105.7
|
|
$
|
3,838.7
|
|
$
|
645.3
|
|
$
|
505.2
|
|
||||
Note 7 –
Fair Value Measurements
Fair value is defined as the exchange price that would be received for an asset or paid to transfer a liability (an exit price) in the principal or most advantageous market for the asset or liability in an orderly transaction between market participants on the measurement date. Valuation techniques used to measure fair value must maximize the use of observable inputs and minimize the use of unobservable inputs. There is a fair value hierarchy based on three levels of inputs, of which the first two are considered observable and the last unobservable.
|
•
|
Level 1 - Quoted prices in active markets for identical assets or liabilities. These are typically obtained from real-time quotes for transactions in active exchange markets involving identical assets or liabilities.
|
|
•
|
Level 2 - Inputs, other than quoted prices included within Level 1, which are observable for the asset or liability, either directly or indirectly. These are typically obtained from readily available pricing sources for comparable instruments.
|
|
•
|
Level 3 - Unobservable inputs, for which there is little or no market activity for the asset or liability. These inputs reflect the reporting entity’s own assumptions of the data that market participants would use in pricing the asset or liability, based on the best information available in the circumstances.
|
67
The following table summarizes Brunswick’s financial assets and liabilities measured at fair value on a recurring basis as of
December 31, 2016
:
|
(in millions)
|
Level 1
|
Level 2
|
Total
|
||||||||
|
Assets:
|
|
|
|
||||||||
|
Cash equivalents
|
$
|
4.6
|
|
$
|
14.3
|
|
$
|
18.9
|
|
||
|
Short-term investments in marketable securities
|
0.8
|
|
35.0
|
|
35.8
|
|
|||||
|
Restricted cash
|
11.2
|
|
—
|
|
11.2
|
|
|||||
|
Derivatives
|
—
|
|
11.2
|
|
11.2
|
|
|||||
|
Total assets
|
$
|
16.6
|
|
$
|
60.5
|
|
$
|
77.1
|
|
||
|
Liabilities:
|
|
|
|
|
|
|
|||||
|
Derivatives
|
$
|
—
|
|
$
|
4.8
|
|
$
|
4.8
|
|
||
|
Deferred compensation
|
4.2
|
|
28.1
|
|
32.3
|
|
|||||
|
Total liabilities at fair value
|
$
|
4.2
|
|
$
|
32.9
|
|
$
|
37.1
|
|
||
|
Liabilities measured at net asset value
|
11.6
|
|
|||||||||
|
Total liabilities
|
$
|
48.7
|
|
||||||||
The following table summarizes Brunswick’s financial assets and liabilities measured at fair value on a recurring basis as of
December 31, 2015
:
|
(in millions)
|
Level 1
|
Level 2
|
Total
|
||||||||
|
Assets:
|
|
|
|
||||||||
|
Cash equivalents
|
$
|
131.3
|
|
$
|
138.9
|
|
$
|
270.2
|
|
||
|
Short-term investments in marketable securities
|
0.8
|
|
10.7
|
|
11.5
|
|
|||||
|
Restricted cash
|
12.7
|
|
—
|
|
12.7
|
|
|||||
|
Derivatives
|
—
|
|
13.5
|
|
13.5
|
|
|||||
|
Total assets
|
$
|
144.8
|
|
$
|
163.1
|
|
$
|
307.9
|
|
||
|
Liabilities:
|
|
|
|
|
|
|
|||||
|
Derivatives
|
$
|
—
|
|
$
|
5.6
|
|
$
|
5.6
|
|
||
|
Deferred compensation
|
3.8
|
|
34.6
|
|
38.4
|
|
|||||
|
Total liabilities at fair value
|
$
|
3.8
|
|
$
|
40.2
|
|
$
|
44.0
|
|
||
|
Liabilities measured at net asset value
|
11.3
|
|
|||||||||
|
Total liabilities
|
$
|
55.3
|
|
||||||||
Refer to
Note 14 –
Financial Instruments
for additional information related to the fair value of derivative assets and liabilities by class. In addition to the items shown in the tables above, see
Note 17 –
Postretirement Benefits
for further discussion regarding the fair value measurements associated with the Company’s postretirement benefit plans.
68
Note 8 –
Financing Receivables
The Company has recorded financing receivables, which are defined as a contractual right to receive money, as assets on its Consolidated Balance Sheets as of December 31,
2016
and
2015
. Substantially all of the Company’s financing receivables are for commercial customers, which includes receivables sold to third-party finance companies (Third-Party Receivables) and customer notes and other (Other Receivables). Third-Party Receivables are accounts that have been sold to third-party finance companies, but do not meet the definition of a true sale, and are therefore recorded as an asset with an offsetting balance recorded as a secured obligation in Accrued expenses and Other long-term liabilities as discussed in
Note 1 –
Significant Accounting Policies
. Other Receivables are mostly comprised of notes from customers, which are originated by the Company in the normal course of business. Financing receivables are carried at their face amounts less an allowance for doubtful accounts.
The Company sells a broad range of recreational products to a worldwide customer base and extends credit to its customers based upon an ongoing credit evaluation program. The Company’s business units maintain credit organizations to manage financial exposure and perform credit risk assessments on an individual account basis. Accounts are not aggregated into categories for credit risk determinations. Due to the composition of the account portfolio, the Company does not believe that the credit risk posed by the Company’s financing receivables is significant to its operations, financial condition or cash flows. There were no significant troubled debt restructurings during the years ended December 31,
2016
,
2015
or 2014.
The following are the Company’s financing receivables, excluding trade accounts receivable contractually due within one year as of
December 31, 2016
and
December 31, 2015
:
|
(in millions)
|
December 31, 2016
|
December 31, 2015
|
|||||
|
Third-Party Receivables:
|
|
|
|
|
|||
|
Short-term
|
22.0
|
|
22.5
|
|
|||
|
Long-term
|
29.0
|
|
23.7
|
|
|||
|
Total
|
51.0
|
|
46.2
|
|
|||
|
Other Receivables:
|
|
|
|
|
|||
|
Short-term
|
6.2
|
|
8.0
|
|
|||
|
Long-term
|
0.6
|
|
1.7
|
|
|||
|
Allowance for credit loss
|
(0.1
|
)
|
(0.2
|
)
|
|||
|
Total
|
6.7
|
|
9.5
|
|
|||
|
Total Financing Receivables
|
$
|
57.7
|
|
$
|
55.7
|
|
|
The activity related to the allowance for credit loss on financing receivables during the years ended
December 31, 2016
and
December 31, 2015
was not significant.
69
Note 9 –
Investments
Investments in Marketable Securities
The Company invests a portion of its cash reserves in marketable debt securities. These investments are reported in Short-term investments in marketable securities on the Consolidated Balance Sheets.
The following is a summary of the fair values, which were equal to the amortized costs, of the Company’s available-for-sale securities, all due in one year or less, as of
December 31, 2016
and
2015
:
|
(in millions)
|
2016
|
2015
|
|||||
|
Agency Bonds
|
$
|
—
|
|
$
|
2.5
|
|
|
|
Corporate Bonds
|
—
|
|
8.2
|
|
|||
|
Commercial Paper
|
35.0
|
|
—
|
|
|||
|
U.S. Treasury Bills
|
0.8
|
|
0.8
|
|
|||
|
Total available-for-sale securities
|
$
|
35.8
|
|
$
|
11.5
|
|
|
The Company had
$10.7 million
in redemptions of available-for-sale securities during
2016
. The Company had
$109.8 million
in redemptions and
$9.5 million
in sales of available-for-sale securities during
2015
.
At each reporting date, management reviews the debt securities to determine if any loss in the value of a security below its amortized cost should be considered “other-than-temporary.” For the evaluation, management determines whether it intends to sell, or if it is more likely than not that it will be required to sell, the securities. This determination considers current and forecasted liquidity requirements, regulatory and capital requirements and the strategy for managing the Company’s securities portfolio. For all impaired debt securities for which there was no intent or expected requirement to sell, the evaluation considers all available evidence to assess whether it is likely the amortized cost value will be recovered. The Company also considers the nature of the securities, the credit rating or financial condition of the issuer, the extent and duration of the unrealized loss and market conditions. As of
December 31, 2016
and
2015
, there were no unrealized losses related to debt securities that required management evaluation.
Equity Investments
The Company has certain unconsolidated international and domestic affiliates that are accounted for using the equity method. The equity method is applied in situations in which the Company has the ability to exercise significant influence, but not control, over the investees. Management reviews equity investments for impairment whenever indicators are present suggesting that the carrying value of an investment is not recoverable. The following items are examples of impairment indicators: significant, sustained declines in an investee’s revenue, earnings, and cash flow trends; adverse market conditions of the investee’s industry or geographic area; the investee’s inability to execute its operating plan; the investee’s ability to continue operations measured by several items, including liquidity; and other factors. Once an impairment indicator is identified, management uses considerable judgment to determine if the decline in value is other than temporary, in which case the equity investment is written down to its estimated fair value, which could negatively impact reported results of operations.
In the fourth quarter of 2014, the Company determined that the fair value of its
36 percent
investment in Bella-Veneet Oy (Bella), a Finnish boat manufacturer, had declined significantly as a result of the inability of the business to achieve profitability due to weak market conditions for its products, which has led to significant declines in revenue. The Company calculates fair value using the income approach described in the Goodwill and Other Intangibles section of
Note 1 –
Significant Accounting Policies
. As a result of performing its analysis, the Company determined that the book value of its investment exceeded its fair value and concluded that this decline in value was other than temporary. The Company used estimated future cash flows, a Level 3 input, to assess the fair value of the long-lived assets. The Company recorded a
$20.2 million
charge during the fourth quarter of 2014 in order to reflect the fair value of the Company’s investment in Bella of
$1.1 million
. This charge was reported as Impairment of equity method investment in the Consolidated Statements of Operations.
The remaining equity investments are not individually material to the Consolidated Financial Statements. Refer to
Note 10 –
Financial Services
for more details on the Company’s Brunswick Acceptance Company, LLC joint venture.
Brunswick did not receive any dividends from its unconsolidated affiliates in
2016
,
2015
or
2014
.
70
Note 10 –
Financial Services
The Company, through its Brunswick Financial Services Corporation (BFS) subsidiary, owns a
49
percent interest in a joint venture, Brunswick Acceptance Company, LLC (BAC). Prior to March 1, 2016, CDF Ventures, LLC (CDFV), a subsidiary of GE Capital Corporation (GECC), owned the remaining
51
percent. On March 1, 2016, GECC completed the sale of its Commercial Distribution Finance business, including CDFV and its interest in the BAC joint venture, to Wells Fargo & Company. The transaction did not have a material effect on BAC.
In June 2016, the parties amended the joint venture agreement to adjust a financial covenant that was conformed to the maximum leverage ratio test contained in the Credit Facility; as of
December 31, 2016
, the Company was in compliance with the leverage ratio covenant under both the joint venture agreement and the Credit Facility as described in
Note 16 –
Debt
.
In July 2015, the parties extended the term of the BAC joint venture through December 31, 2019. The joint venture agreement contains provisions allowing for the renewal of the agreement or the purchase of the other party’s interest in the joint venture at the end of its term. Alternatively, either partner may terminate the agreement at the end of its term.
BAC is funded in part through a
$1.0 billion
secured borrowing facility from Wells Fargo Commercial Distribution Finance, LLC (WFCDF), which is in place through the term of the joint venture, and with equity contributions from both partners. BAC also sells a portion of its receivables to a securitization facility, the Wells Fargo Dealer Floorplan Master Note Trust, which is arranged by Wells Fargo. The sales of these receivables meet the requirements of a “true sale” and are therefore not retained on the financial statements of BAC. Neither the Company nor any of its subsidiaries guarantee the indebtedness of BAC. In addition, BAC is not responsible for any continuing servicing costs or obligations with respect to the securitized receivables. Through June 28, 2014, BFS and CDFV had an income sharing arrangement related to income generated from the receivables sold by BAC to the securitization facility. The Company recorded this income in
Other income, net
, in the Consolidated Statements of Operations. Beginning July 1, 2014, BAC began recognizing all income related to securitized receivables at the time of sale to conform with a change in the structure of the securitization facility. The income sharing arrangement remained in place through December 31, 2014 for assets securitized prior to July 1, 2014.
The Company considers BFS’s investment in BAC as an investment in a variable interest entity of which the Company is not the primary beneficiary. To be considered the primary beneficiary, the Company must have the power to direct the activities of BAC that most significantly impact BAC’s economic performance and the Company must have the obligation to absorb losses or the right to receive benefits from BAC that could be potentially significant to BAC. Based on the Company's qualitative analysis, BFS did not meet the definition of a primary beneficiary. As a result, the Company accounts for BFS’s investment in BAC under the equity method and records it as a component of Equity investments in its Consolidated Balance Sheets. The Company records BFS’s share of income or loss in BAC based on its ownership percentage in the joint venture in
Equity earnings
in its Consolidated Statements of Operations. BFS’s equity investment is adjusted monthly to maintain a
49
percent interest in accordance with the capital provisions of the joint venture agreement. The Company funds its investment in BAC through cash contributions and reinvested earnings. BFS’s total investment in BAC at
December 31, 2016
and
December 31, 2015
was
$16.9 million
and
$14.0 million
, respectively.
The Company’s maximum loss exposure relating to BAC is detailed as follows:
|
(in millions)
|
December 31,
2016 |
December 31,
2015 |
|||||
|
Investment
|
$
|
16.9
|
|
$
|
14.0
|
|
|
|
Repurchase and recourse obligations
(A)
|
36.8
|
|
36.8
|
|
|||
|
Liabilities
(B)
|
(1.2
|
)
|
(1.4
|
)
|
|||
|
Total maximum loss exposure
|
$
|
52.5
|
|
$
|
49.4
|
|
|
|
(A)
|
Repurchase and recourse obligations are off-balance sheet obligations provided by the Company for the Boat and Marine Engine segments, respectively, and are included within the Maximum Potential Obligations disclosed in
Note 13 –
Commitments and Contingencies
. Repurchase and recourse obligations include a North American repurchase agreement with WFCDF and could be reduced by repurchase activity occurring under other similar agreements with WFCDF and affiliates. The Company’s risk under these repurchase arrangements is partially mitigated by the value of the products repurchased as part of the transaction. Amounts above exclude any potential recoveries from the value of the repurchased product.
|
|
(B)
|
Represents accrued amounts for potential losses related to recourse exposure and the Company’s expected losses on obligations to repurchase products, after giving effect to proceeds anticipated to be received from the resale of these products to alternative dealers.
|
71
BFS recorded income related to the operations of BAC of
$4.8 million
,
$4.6 million
and
$6.0 million
for the years ended
December 31, 2016
,
2015
and
2014
, respectively. This income includes amounts BFS earned under the aforementioned income sharing agreement.
Note 11 –
Goodwill and Other Intangibles
Changes in the Company's goodwill during the period ended
December 31, 2016
, by segment, are summarized below:
|
(in millions)
|
2015
|
Acquisitions
|
Impairments
|
Adjustments
|
2016
|
||||||||||||||
|
Marine Engine
|
$
|
26.2
|
|
$
|
—
|
|
$
|
—
|
|
$
|
(1.1
|
)
|
$
|
25.1
|
|
||||
|
Boat
|
—
|
|
2.2
|
|
—
|
|
—
|
|
2.2
|
|
|||||||||
|
Fitness
|
272.5
|
|
117.0
|
|
—
|
|
(3.0
|
)
|
386.5
|
|
|||||||||
|
Total
|
$
|
298.7
|
|
$
|
119.2
|
|
$
|
—
|
|
$
|
(4.1
|
)
|
$
|
413.8
|
|
||||
Changes in the Company's goodwill during the period ended
December 31, 2015
, by segment, are summarized below:
|
(in millions)
|
2014
|
Acquisitions
|
Impairments
|
Adjustments
|
2015
|
||||||||||||||
|
Marine Engine
|
$
|
28.0
|
|
$
|
—
|
|
$
|
—
|
|
$
|
(1.8
|
)
|
$
|
26.2
|
|
||||
|
Fitness
|
268.9
|
|
3.5
|
|
—
|
|
0.1
|
|
272.5
|
|
|||||||||
|
Total
|
$
|
296.9
|
|
$
|
3.5
|
|
$
|
—
|
|
$
|
(1.7
|
)
|
$
|
298.7
|
|
||||
Adjustments in
2016
and
2015
relate to the effect of foreign currency translation on goodwill denominated in currencies other than the U.S. dollar. See
Note 4 –
Acquisitions
for further details on the Company's acquisitions.
As of December 31 2016 and 2015, the Company had no accumulated impairment loss.
The Company's intangible assets, included within Other intangibles, net on the Consolidated Balance Sheets as of
December 31, 2016
and
2015
, are summarized below:
|
2016
|
2015
|
||||||||||||||
|
(in millions)
|
Gross Amount
|
Accumulated Amortization
|
Gross Amount
|
Accumulated Amortization
|
|||||||||||
|
Intangible assets:
|
|||||||||||||||
|
Customer relationships
|
$
|
300.1
|
|
$
|
(231.1
|
)
|
$
|
240.4
|
|
$
|
(225.9
|
)
|
|||
|
Trade names
|
88.1
|
|
—
|
|
37.7
|
|
—
|
|
|||||||
|
Other
|
22.4
|
|
(14.7
|
)
|
16.3
|
|
(13.4
|
)
|
|||||||
|
Total
|
$
|
410.6
|
|
$
|
(245.8
|
)
|
$
|
294.4
|
|
$
|
(239.3
|
)
|
|||
Other intangible assets primarily consist of patents. See
Note 4 –
Acquisitions
for further details on intangibles acquired during
2016
and
2015
. Gross amounts and related accumulated amortization amounts include adjustments related to the impact of foreign currency translation. Aggregate amortization expense for intangibles was
$6.8 million
,
$3.0 million
and
$2.9 million
for the years ended December 31,
2016
,
2015
and
2014
, respectively. Estimated amortization expense for intangible assets is
$8.2 million
for the year ending December 31,
2017
,
$8.2 million
in
2018
,
$7.6 million
in
2019
,
$7.2 million
in
2020
, and
$6.3 million
in
2021
.
72
Note 12 –
Income Taxes
The sources of
Earnings before income taxes
were as follows:
|
(in millions)
|
2016
|
|
2015
|
|
2014
|
||||||
|
United States
|
$
|
308.0
|
|
$
|
261.0
|
|
$
|
242.9
|
|
||
|
Foreign
|
81.7
|
|
54.2
|
|
45.0
|
|
|||||
|
Earnings before income taxes
|
$
|
389.7
|
|
|
$
|
315.2
|
|
|
$
|
287.9
|
|
The
Income tax provision
consisted of the following:
|
(in millions)
|
2016
|
2015
|
2014
|
||||||||
|
Current tax expense:
|
|||||||||||
|
U.S. Federal
|
$
|
25.0
|
|
$
|
24.7
|
|
$
|
18.2
|
|
||
|
State and local
|
4.6
|
|
2.5
|
|
2.6
|
|
|||||
|
Foreign
|
23.2
|
|
17.0
|
|
23.9
|
|
|||||
|
Total current
|
52.8
|
|
44.2
|
|
44.7
|
|
|||||
|
Deferred tax expense:
|
|||||||||||
|
U.S. Federal
|
56.1
|
|
40.7
|
|
42.4
|
|
|||||
|
State and local
|
6.6
|
|
3.2
|
|
5.7
|
|
|||||
|
Foreign
|
(0.2
|
)
|
(0.3
|
)
|
0.2
|
|
|||||
|
Total deferred
|
62.5
|
|
43.6
|
|
48.3
|
|
|||||
|
Income tax provision
|
$
|
115.3
|
|
$
|
87.8
|
|
$
|
93.0
|
|
||
73
Temporary differences and carryforwards giving rise to deferred tax assets and liabilities at
December 31, 2016
and
2015
, are summarized in the table below:
|
(in millions)
|
2016
|
2015
|
|||||
|
Deferred tax assets:
|
|||||||
|
Pension
|
$
|
86.2
|
|
$
|
110.6
|
|
|
|
Loss carryforwards
|
71.7
|
|
61.5
|
|
|||
|
Tax credit carryforwards
|
47.3
|
|
57.0
|
|
|||
|
Product warranties
|
41.9
|
|
39.4
|
|
|||
|
Sales incentives and discounts
|
32.0
|
|
26.8
|
|
|||
|
Deferred revenue
|
23.2
|
|
23.1
|
|
|||
|
Equity compensation
|
23.2
|
|
26.4
|
|
|||
|
Compensation and benefits
|
22.2
|
|
24.0
|
|
|||
|
Deferred compensation
|
21.7
|
|
29.3
|
|
|||
|
Postretirement and postemployment benefits
|
20.2
|
|
21.3
|
|
|||
|
Depreciation and amortization
|
—
|
|
35.0
|
|
|||
|
Other
|
82.9
|
|
78.0
|
|
|||
|
Gross deferred tax assets
|
472.5
|
|
532.4
|
|
|||
|
Valuation allowance
|
(78.1
|
)
|
(70.6
|
)
|
|||
|
Deferred tax assets
|
$
|
394.4
|
|
$
|
461.8
|
|
|
|
Deferred tax liabilities:
|
|||||||
|
Depreciation and amortization
|
$
|
(45.5
|
)
|
$
|
—
|
|
|
|
State and Local income taxes
|
(34.9
|
)
|
(38.6
|
)
|
|||
|
Other
|
(8.7
|
)
|
(15.3
|
)
|
|||
|
Deferred tax liabilities
|
$
|
(89.1
|
)
|
$
|
(53.9
|
)
|
|
|
Total net deferred tax assets
|
$
|
305.3
|
|
$
|
407.9
|
|
|
During the third quarter of 2014, the Company completed the sale of its retail bowling business. This transaction generated capital gains for tax purposes allowing the Company to utilize all of its capital loss carryforwards. Therefore, during the third quarter of 2014, the Company recorded a
$9.5 million
reversal of its deferred tax asset valuation allowance reserves related to capital loss carryforwards, which has been reflected as a tax benefit reported in
Note 2 –
Discontinued Operations
.
At
December 31, 2016
, the Company had a total valuation allowance against its deferred tax assets of
$78.1 million
. The remaining realizable value of deferred tax assets at
December 31, 2016
was determined by evaluating the potential to recover the value of these assets through the utilization of tax loss and credit carrybacks, the reversal of existing taxable temporary differences and carryforwards, certain tax planning strategies and future taxable income exclusive of reversing temporary differences and carryforwards. At
December 31, 2016
, the Company retained valuation allowance reserves of
$58.1 million
against deferred tax assets in the U.S. primarily related to non-amortizable intangibles and various state operating loss carryforwards and state tax credits that are subject to restrictive rules for future utilization, and valuation allowances of
$20.0 million
for deferred tax assets related to foreign jurisdictions, primarily Brazil.
At
December 31, 2016
, the tax benefit of loss carryforwards totaling
$71.8 million
was available to reduce future tax liabilities. This deferred tax asset was comprised of
$4.2 million
for the tax benefit of federal net operating loss (NOL) carryforwards,
$47.3 million
for the tax benefit of state NOL carryforwards and
$20.3 million
for the tax benefit of foreign NOL carryforwards. NOL carryforwards of
$51.6 million
expire at various intervals between the years
2017
and 2036, while
$20.2 million
have an unlimited life.
At
December 31, 2016
, tax credit carryforwards totaling
$49.5 million
were available to reduce future tax liabilities. This deferred tax asset was comprised of
$11.1 million
related to general business credits and other miscellaneous federal credits, and
$38.4 million
of various state tax credits related to research and development, capital investment and job incentives. Tax credit
74
carryforwards of
$49.3 million
expire at various intervals between the years
2017
and 2036, while
$0.2 million
have an unlimited life.
The Company provides deferred taxes for the presumed ultimate repatriation to the U.S. of earnings from certain of its non-U.S. subsidiaries and unconsolidated affiliates. Through December 31, 2014 the indefinite reinvestment criteria had been applied to certain entities and allowed the Company to overcome that presumption to the extent the earnings were to be indefinitely reinvested outside the United States. As a result of the Company's internal restructuring of its foreign entities that was initiated in the second quarter of 2015, the Company determined that the indefinite reinvestment assertion should be expanded to include additional non-U.S. subsidiaries. As a result of the 2015 actions, the Company recorded a discrete net tax benefit in the second quarter of 2015 which includes the benefit of applying the indefinite reinvestment assertion to the foreign entities reorganized under a new European holding company. No deferred income taxes have been provided as of
December 31, 2016
on the applicable undistributed earnings of the non-U.S. subsidiaries where the indefinite reinvestment assertion has been applied. The Company had undistributed earnings of foreign subsidiaries of
$286.7 million
and
$214.1 million
at
December 31, 2016
and
2015
, respectively, for which deferred taxes have not been provided as such earnings are presumed to be indefinitely reinvested in the foreign subsidiaries. It is not practical to determine the amount of deferred income taxes not provided on these earnings. If at some future date these earnings cease to be indefinitely reinvested and are repatriated, the Company may be subject to additional U.S. income taxes and foreign withholding and other taxes on such amounts. The Company continues to provide deferred taxes, as required, on the undistributed net earnings of foreign subsidiaries and unconsolidated affiliates that are not deemed to be indefinitely reinvested in operations outside the United States.
As of December 31,
2016
,
2015
and
2014
the Company had
$3.5 million
,
$4.8 million
and
$5.1 million
of gross unrecognized tax benefits, including interest, respectively. Substantially all of these amounts, if recognized, would impact the Company's tax provision and the effective tax rate.
The Company recognizes interest and penalties related to unrecognized tax benefits in income tax expense. As of December 31,
2016
,
2015
and
2014
, the amounts accrued for interest and penalties were not significant.
The following is a reconciliation of the total amounts of unrecognized tax benefits excluding interest and penalties for the
2016
and
2015
annual reporting periods:
|
(in millions)
|
2016
|
2015
|
2014
|
||||||||
|
Balance at January 1
|
$
|
4.7
|
|
$
|
4.8
|
|
$
|
6.0
|
|
||
|
Gross increases - tax positions prior periods
|
0.3
|
|
0.4
|
|
0.5
|
|
|||||
|
Gross decreases - tax positions prior periods
|
(0.4
|
)
|
(0.1
|
)
|
(0.4
|
)
|
|||||
|
Gross increases - current period tax positions
|
0.5
|
|
0.5
|
|
0.7
|
|
|||||
|
Decreases - settlements with taxing authorities
|
—
|
|
(0.6
|
)
|
(0.7
|
)
|
|||||
|
Reductions - lapse of statute of limitations
|
(1.7
|
)
|
—
|
|
(1.2
|
)
|
|||||
|
Other
|
—
|
|
(0.3
|
)
|
(0.1
|
)
|
|||||
|
Balance at December 31
|
$
|
3.4
|
|
$
|
4.7
|
|
$
|
4.8
|
|
||
The Company believes it is reasonably possible that the total amount of gross unrecognized tax benefits as of
December 31, 2016
could decrease by approximately
$1.1 million
in
2017
due to settlements with taxing authorities or lapses in applicable statutes of limitation. Due to the various jurisdictions in which the Company files tax returns and the uncertainty regarding the timing of the settlement of tax audits, it is possible that there could be significant changes in the amount of unrecognized tax benefits in
2017
, but the amount cannot be estimated.
The Company is regularly audited by federal, state and foreign tax authorities. The Internal Revenue Service (IRS) has completed its field examination and has issued its Revenue Agents Report through the 2012 tax year and all open issues have been resolved. The Company is currently open to tax examinations by the IRS for the 2013 through 2015 tax years and the 2014 tax year is currently under examination. Primarily as a result of filing amended returns, which were generated by the closing of federal income tax audits, the Company is still open to state and local tax audits in major tax jurisdictions dating back to the 2011 taxable year. Following the completion in the fourth quarter of 2015 of the 2008 through 2012 Germany tax audit, the Company is no longer subject to income tax examinations by any major foreign tax jurisdiction for years prior to 2013.
The difference between the actual income tax provision (benefit) and the tax provision computed by applying the statutory Federal income tax rate to
Earnings before income taxes
is attributable to the following:
75
|
(in millions)
|
2016
|
2015
|
2014
|
||||||||
|
Income tax provision at 35 percent
|
$
|
136.4
|
|
$
|
110.3
|
|
$
|
100.7
|
|
||
|
State and local income taxes, net of Federal income tax effect
|
8.3
|
|
7.3
|
|
6.4
|
|
|||||
|
Deferred tax asset valuation allowance
|
3.4
|
|
5.3
|
|
(7.6
|
)
|
|||||
|
Income attributable to domestic production activities
|
(6.3
|
)
|
(9.2
|
)
|
(8.8
|
)
|
|||||
|
Impairment of equity method investment
|
—
|
|
—
|
|
4.0
|
|
|||||
|
Change in estimates related to prior years and prior years amended tax return filings
|
(0.2
|
)
|
(4.2
|
)
|
(1.4
|
)
|
|||||
|
Federal and state tax credits
|
(10.2
|
)
|
(8.9
|
)
|
(7.6
|
)
|
|||||
|
Taxes related to foreign income, net of credits
|
(20.6
|
)
|
(6.7
|
)
|
5.2
|
|
|||||
|
Taxes related to unremitted earnings
|
(1.1
|
)
|
(11.4
|
)
|
(5.5
|
)
|
|||||
|
Tax reserve reassessment
|
(1.4
|
)
|
0.6
|
|
(0.3
|
)
|
|||||
|
Deferred tax reassessment
|
1.5
|
|
3.0
|
|
3.5
|
|
|||||
|
Tax law changes
|
5.4
|
|
—
|
|
—
|
|
|||||
|
Other
|
0.1
|
|
1.7
|
|
4.4
|
|
|||||
|
Actual income tax provision
|
$
|
115.3
|
|
$
|
87.8
|
|
$
|
93.0
|
|
||
|
Effective tax rate
|
29.6
|
%
|
27.9
|
%
|
32.3
|
%
|
|||||
Income tax provision allocated to continuing operations and discontinued operations for the years ended December 31 was as follows:
|
(in millions)
|
2016
|
2015
|
2014
|
||||||||
|
Continuing operations
|
$
|
115.3
|
|
$
|
87.8
|
|
$
|
93.0
|
|
||
|
Discontinued operations
|
1.0
|
|
0.3
|
|
11.0
|
|
|||||
|
Total tax provision
|
$
|
116.3
|
|
$
|
88.1
|
|
$
|
104.0
|
|
||
Note 13 –
Commitments and Contingencies
Financial Commitments
The Company has entered into guarantees of indebtedness of third parties, primarily in connection with customer financing programs. Under these arrangements, the Company has guaranteed customer obligations to the financial institutions in the event of customer default, generally subject to a maximum amount that is less than the total outstanding obligations. The Company has also extended guarantees to third parties that have purchased customer receivables from Brunswick and, in certain instances, has guaranteed secured term financing of its customers. Potential payments in connection with these customer financing arrangements generally extend over several years. The single year potential cash obligations associated with these customer financing arrangements as of
December 31, 2016
and
December 31, 2015
were
$31.5 million
and
$30.7 million
, respectively. The maximum potential cash obligations associated with these customer financing arrangements as of
December 31, 2016
and
December 31, 2015
were
$39.6 million
and
$36.8 million
, respectively.
In most instances, upon repurchase of the receivable or note, the Company receives rights to the collateral securing the financing. The Company’s risk under these arrangements is partially mitigated by the value of the collateral that secures the financing. The Company had
$1.2 million
and
$1.1 million
accrued for potential losses related to recourse exposure at
December 31, 2016
and
December 31, 2015
, respectively.
The Company has accounts receivable sale arrangements with third parties which are included in the guarantee arrangements discussed above. The Company treats the sale of receivables in which the Company retains an interest as a secured obligation as the transfers of the receivables under these arrangements do not meet the requirements of a “true sale.” Accordingly, the current portion of receivables underlying these arrangements of
$22.0 million
and
$22.5 million
was recorded in Accounts and notes receivable and
Accrued expenses
as of
December 31, 2016
and
December 31, 2015
, respectively. Further, the long-term portion of these arrangements of
$29.0 million
and
$23.7 million
as of
December 31, 2016
and
December 31, 2015
, respectively, was recorded in
Other long-term assets
and Other long-term liabilities.
76
The Company has also entered into arrangements with third-party lenders in which it has agreed, in the event of a customer default, to repurchase from the third-party lender those Brunswick products repossessed from the customer. These arrangements are typically subject to a maximum repurchase amount. The single year and maximum potential cash payments the Company could be required to make to repurchase collateral as of
December 31, 2016
and
December 31, 2015
were
$59.9 million
and
$57.9 million
, respectively.
The Company’s risk under these repurchase arrangements is partially mitigated by the value of the products repurchased as part of the transaction. The Company had
$1.1 million
accrued for potential losses related to repurchase exposure at both
December 31, 2016
and
December 31, 2015
. The Company’s repurchase accrual represents the expected losses that could result from obligations to repurchase products, after giving effect to proceeds anticipated to be received from the resale of those products to alternative dealers.
The Company has recorded its estimated net liability associated with losses from these guarantee and repurchase obligations on its Consolidated Balance Sheets based on historical experience and current facts and circumstances. Historical cash requirements and losses associated with these obligations have not been significant, but could increase if dealer defaults exceed current expectations.
Financial institutions have issued standby letters of credit and surety bonds conditionally guaranteeing obligations on behalf of the Company totaling
$6.5 million
and
$12.1 million
, respectively, as of
December 31, 2016
. A large portion of these standby letters of credit and surety bonds are related to the Company’s self-insured workers’ compensation program as required by its insurance companies and various state agencies. The Company has recorded reserves to cover the anticipated liabilities associated with these programs. Under certain circumstances, such as an event of default under the Company’s revolving credit facility, or, in the case of surety bonds, a ratings downgrade, the Company could be required to post collateral to support the outstanding letters of credit and surety bonds. The Company was not required to post letters of credit as collateral against surety bonds as of
December 31, 2016
.
The Company has a collateral trust arrangement with insurance carriers and a trustee bank. The trust is owned by the Company, but the assets are pledged as collateral against workers’ compensation related obligations in lieu of other forms of collateral including letters of credit. In connection with this arrangement, the Company had
$11.2 million
and
$12.7 million
of cash in the trust at
December 31, 2016
and
December 31, 2015
, respectively, which was classified as
Restricted cash
in the Company's Consolidated Balance Sheets. In both
2016
and
2015
, insurance carriers reduced the required collateral amount, which resulted in a
$1.5 million
and
$2.9 million
, respectively, transfer out of the trust.
77
Product Warranties
The Company records a liability for product warranties at the time revenue is recognized. The liability is estimated using historical warranty experience, projected claim rates and expected costs per claim. The Company adjusts its liability for specific warranty matters when they become known and the exposure can be estimated. Product failure rates as well as material usage and labor costs incurred in correcting a product failure affect the Company's warranty liabilities. If actual costs differ from estimated costs, the Company must make a revision to the warranty liability. Changes in the Company's warranty liabilities resulting from the Company's experience and adjustments related to changes in estimates are included as Aggregate changes for preexisting warranties presented in the table below.
The following activity related to product warranty liabilities was recorded in
Accrued expenses
during the
year
s ended
December 31, 2016
and
December 31, 2015
:
|
(in millions)
|
2016
|
2015
|
|||||
|
Balance at beginning of period
|
$
|
106.3
|
|
$
|
110.6
|
|
|
|
Payments made
|
(67.3
|
)
|
(59.1
|
)
|
|||
|
Provisions/additions for contracts issued/sold
|
74.9
|
|
67.8
|
|
|||
|
Aggregate changes for preexisting warranties
|
(10.4
|
)
|
(9.6
|
)
|
|||
|
Foreign currency translation
|
(0.3
|
)
|
(3.4
|
)
|
|||
|
Acquisitions
|
7.1
|
|
—
|
|
|||
|
Other
|
2.3
|
|
—
|
|
|||
|
Balance at end of period
|
$
|
112.6
|
|
$
|
106.3
|
|
|
Additionally, end users of the Company's products may purchase a contract from the Company that extends product warranty beyond the standard period. For certain extended warranty contracts in which the Company retains the warranty or administration obligation, a deferred liability is recorded based on the aggregate sales price for contracts sold. The deferred liability is reduced and revenue is recognized on a straight-line basis over the contract period during which costs are expected to be incurred.
The following activity related to deferred revenue for extended product warranty contracts was recorded in
Accrued expenses
and Other long-term liabilities during the years ended
December 31, 2016
and
December 31, 2015
:
|
(in millions)
|
2016
|
2015
|
||||||
|
Balance at beginning of period
|
$
|
78.3
|
|
$
|
72.5
|
|
||
|
Extended warranty contracts sold
|
55.0
|
|
45.5
|
|
||||
|
Revenue recognized on existing extended warranty contracts
|
(42.0
|
)
|
(38.3
|
)
|
||||
|
Foreign currency translation
|
(0.7
|
)
|
(1.4
|
)
|
||||
|
Balance at end of period
|
$
|
90.6
|
|
$
|
78.3
|
|
||
Legal and Environmental
The Company accrues for litigation exposure when it is probable that future costs will be incurred and such costs can be reasonably estimated. Adjustments to estimates are recorded in the period they are identified. Management does not believe that there is a reasonable possibility that a material loss exceeding the amounts already recognized for the Company’s litigation claims and matters, if any, has been incurred. In light of existing reserves, the Company's litigation claims, when finally resolved, are not expected, in the opinion of management, to have a material adverse effect on the Company's consolidated financial position, results of operations and cash flows.
The Company is involved in certain legal and administrative proceedings under the Comprehensive Environmental Response, Compensation and Liability Act of 1980 and other federal and state legislation governing the generation and disposal of certain hazardous wastes. These proceedings, which involve both on- and off-site waste disposal or other contamination, in many instances seek compensation or remedial action from the Company as a waste generator under Superfund legislation, which authorizes action regardless of fault, legality of original disposition or ownership of a disposal site. The Company has established reserves based on a range of cost estimates for all known claims.
78
The environmental remediation and clean-up projects in which the Company is involved have an aggregate estimated range of exposure of approximately
$35.0 million
to
$57.3 million
as of
December 31, 2016
. At December 31,
2016
and
2015
, the Company had reserves for environmental liabilities of
$35.0 million
and
$40.0 million
, respectively, reflected in
Accrued expenses
and Other long-term liabilities in the Consolidated Balance Sheets. The Company recorded environmental provisions of
$0.7 million
,
$1.4 million
and
$1.0 million
for the years ended December 31,
2016
,
2015
and
2014
, respectively.
The Company accrues for environmental remediation-related activities for which commitments or clean-up plans have been developed and for which costs can be reasonably estimated. All accrued amounts are generally determined in consultation with third-party experts on an undiscounted basis and do not consider recoveries from third parties until such recoveries are realized. In light of existing reserves, the Company's environmental claims, when finally resolved, are not expected, in the opinion of management, to have a material adverse effect on the Company's consolidated financial position, results of operations or cash flows.
Note 14 –
Financial Instruments
The Company operates globally with manufacturing and sales facilities in various locations around the world. Due to the Company’s global operations, the Company engages in activities involving both financial and market risks. The Company utilizes normal operating and financing activities, along with derivative financial instruments, to minimize these risks.
Derivative Financial Instruments.
The Company uses derivative financial instruments to manage its risks associated with movements in foreign currency exchange rates, interest rates and commodity prices. Derivative instruments are not used for trading or speculative purposes. The Company formally documents its hedge relationships, including identification of the hedging instruments and the hedged items, as well as its risk management objectives and strategies for undertaking the hedge transaction. This process includes linking derivatives that are designated as hedges to specific forecasted transactions. The Company also assesses, both at the hedge’s inception and monthly thereafter, whether the derivatives used in hedging transactions are highly effective in offsetting the changes in the anticipated cash flows of the hedged item. If the hedging relationship ceases to be highly effective, or it becomes probable that a forecasted transaction is no longer expected to occur, the Company discontinues hedge accounting prospectively and immediately recognizes the gains and losses associated with those hedges. There were no material adjustments as a result of ineffectiveness to the results of operations for the years ended
December 31, 2016
,
2015
and
2014
. The fair value of derivative financial instruments is determined through market-based valuations and may not be representative of the actual gains or losses that will be recorded when these instruments mature due to future fluctuations in the markets in which they are traded. The effects of derivative financial instruments are not expected to be material to the Company’s financial position or results of operations when considered together with the underlying exposure being hedged. Use of derivative financial instruments exposes the Company to credit risk with its counterparties when the fair value of a derivative contract is an asset. The Company mitigates this risk by entering into derivative contracts with highly rated counterparties. The maximum amount of loss due to counterparty credit risk is limited to the asset value of derivative financial instruments.
Cash Flow Hedges.
The Company enters into certain derivative instruments that are designated and qualify as cash flow hedges. The Company executes both forward and option contracts, based on forecasted transactions, to manage foreign currency exchange exposure mainly related to inventory purchase and sales transactions. From time-to-time, the Company enters into commodity swap agreements based on anticipated purchases of copper and natural gas to manage risk related to price changes. Additionally, the Company may enter into forward-starting interest rate swaps to hedge the interest rate risk associated with the anticipated issuance of debt.
A cash flow hedge requires that as changes in the fair value of derivatives occur, the portion of the change deemed to be effective is recorded temporarily in Accumulated other comprehensive loss, an equity account, and reclassified into earnings in the same period or periods during which the hedged transaction affects earnings. As of
December 31, 2016
, the term of derivative instruments hedging forecasted transactions ranged from one to 15 months.
79
The following activity related to cash flow hedges was recorded in Accumulated other comprehensive loss as of December 31:
|
Accumulated Unrealized Derivative
|
|||||||||||||||
|
Gains (Losses)
|
|||||||||||||||
|
2016
|
2015
|
||||||||||||||
|
(in millions)
|
Pretax
|
After-tax
|
Pretax
|
After-tax
|
|||||||||||
|
Beginning balance
|
$
|
0.4
|
|
$
|
(5.9
|
)
|
$
|
1.2
|
|
$
|
(5.5
|
)
|
|||
|
Net change in value of outstanding hedges
|
2.9
|
|
2.1
|
|
12.0
|
|
8.4
|
|
|||||||
|
Net amount recognized into earnings
|
(2.2
|
)
|
(1.8
|
)
|
(12.8
|
)
|
(8.8
|
)
|
|||||||
|
Ending balance
|
$
|
1.1
|
|
$
|
(5.6
|
)
|
$
|
0.4
|
|
$
|
(5.9
|
)
|
|||
Fair Value Hedges.
The Company enters into fixed-to-floating interest rate swaps to convert a portion of the Company's long-term debt from fixed to floating rate debt. An interest rate swap is entered into with the expectation that the change in the fair value of the interest rate swap will offset the change in the fair value of the debt instrument attributable to changes in the benchmark interest rate. Each period, the change in the fair value of the interest rate swap asset or liability is recorded in debt and the difference between the fixed interest payment and floating interest receipts is recorded as a net adjustment to interest expense.
Other Hedging Activity.
The Company has entered into certain foreign currency forward contracts that have not been designated as a hedge for accounting purposes. These contracts are used to manage foreign currency exposure related to changes in the value of assets or liabilities caused by changes in foreign exchange rates. The change in the fair value of the foreign currency derivative contract and the corresponding change in the fair value of the asset or liability of the Company are both recorded through earnings, each period as incurred. From time-to-time, the Company enters into commodity swap agreements that are used to hedge purchases of aluminum. These hedges do not qualify for hedge accounting. The commodity swap agreements are based on anticipated purchases of aluminum and are used to manage risk related to price changes. The change in the fair value of the aluminum derivative contract is recorded through earnings, each period as incurred.
Foreign Currency.
The Company enters into forward and option contracts to manage foreign exchange exposure related to forecasted transactions and assets and liabilities that are subject to risk from foreign currency rate changes. These exposures include: product costs; revenues and expenses; associated receivables and payables; intercompany obligations and receivables and other related cash flows.
Forward exchange contracts outstanding at
December 31, 2016
and
December 31, 2015
had notional contract values of
$263.7 million
and
$273.5 million
, respectively. Option contracts outstanding at
December 31, 2016
and
December 31, 2015
, had notional contract values of
$30.4 million
and
$51.0 million
, respectively. The forward and options contracts outstanding at
December 31, 2016
, mature during
2017
and
2018
and mainly relate to the Euro, Japanese Yen, Australian dollar, Canadian dollar, Swedish krona, Brazilian real, British pound, Norwegian krone, Mexican peso, Hungarian forint and New Zealand dollar. As of
December 31, 2016
, the Company estimates that during the next 12 months, it will reclassify approximately
$5.4 million
of net gains (based on current rates) from Accumulated other comprehensive loss to Cost of sales.
Interest Rate.
The Company enters into fixed-to-floating interest rate swaps to convert a portion of the Company's long-term debt from fixed to floating rate debt. As of
December 31, 2016
and
December 31, 2015
, the outstanding swaps had notional contract values of
$200.0 million
, of which
$150.0 million
corresponds to the Company's
4.625
percent Senior notes due 2021 and
$50.0 million
corresponds to the Company's
7.375
percent Debentures due 2023. These instruments have been designated as fair value hedges, with the fair value recorded in long-term debt as discussed in
Note 16 –
Debt
.
The Company may also enter into forward-starting interest rate swaps to hedge the interest rate risk associated with anticipated debt issuances. There were no forward-starting interest rate swaps outstanding at
December 31, 2016
or
December 31, 2015
.
As of
December 31, 2016
and
December 31, 2015
, the Company had
$4.5 million
and
$5.1 million
, respectively, of net deferred losses associated with all settled forward-starting interest rate swaps, which were included in Accumulated other comprehensive loss. As of
December 31, 2016
, the Company estimates that during the next 12 months, it will reclassify approximately
$1.1 million
of net losses resulting from settled forward-starting interest rate swaps from Accumulated other comprehensive loss to Interest expense.
80
Commodity Price.
From time-to-time, the Company uses commodity swaps to hedge anticipated purchases of aluminum, copper and natural gas. There were no commodity swap contracts outstanding at
December 31, 2016
. As of
December 31, 2015
the notional value of commodity swap contracts outstanding was
$10.8 million
. The amount of gain or loss associated with the change in fair value of these instruments is either recorded through earnings each period as incurred or, if designated as cash flow hedges, deferred in Accumulated other comprehensive loss and recognized in Cost of sales in the same period or periods during which the hedged transaction affects earnings.
As of
December 31, 2016
and
December 31, 2015
, the fair values of the Company’s derivative instruments were:
|
(in millions)
|
|
|
||||||||||||||||||
|
|
Derivative Assets
|
Derivative Liabilities
|
||||||||||||||||||
|
Instrument
|
Balance Sheet Location
|
Fair Value
|
Balance Sheet Location
|
Fair Value
|
||||||||||||||||
|
2016
|
2015
|
2016
|
2015
|
|||||||||||||||||
|
Derivatives Designated as Cash Flow Hedges
|
||||||||||||||||||||
|
Foreign exchange contracts
|
Prepaid expenses and other
|
$
|
7.2
|
|
$
|
5.9
|
|
Accrued expenses
|
$
|
2.6
|
|
$
|
1.3
|
|
||||||
|
Commodity contracts
|
Prepaid expenses and other
|
—
|
|
—
|
|
Accrued expenses
|
—
|
|
0.5
|
|
||||||||||
|
Total
|
$
|
7.2
|
|
$
|
5.9
|
|
$
|
2.6
|
|
$
|
1.8
|
|
||||||||
|
Derivatives Designated as Fair Value Hedges
|
||||||||||||||||||||
|
Interest rate contracts
|
Prepaid expenses and other
|
$
|
2.1
|
|
$
|
2.1
|
|
Accrued expenses
|
$
|
1.7
|
|
$
|
1.4
|
|
||||||
|
Interest rate contracts
|
Other long-term assets
|
0.7
|
|
4.0
|
|
Other long-term liabilities
|
0.2
|
|
—
|
|
||||||||||
|
Total
|
$
|
2.8
|
|
$
|
6.1
|
|
$
|
1.9
|
|
$
|
1.4
|
|
||||||||
|
Other Hedging Activity
|
||||||||||||||||||||
|
Foreign exchange contracts
|
Prepaid expenses and other
|
$
|
1.2
|
|
$
|
1.5
|
|
Accrued expenses
|
$
|
0.3
|
|
$
|
0.2
|
|
||||||
|
Commodity contracts
|
Prepaid expenses and other
|
—
|
|
—
|
|
Accrued expenses
|
—
|
|
2.2
|
|
||||||||||
|
Total
|
|
$
|
1.2
|
|
$
|
1.5
|
|
|
$
|
0.3
|
|
$
|
2.4
|
|
||||||
The effect of derivative instruments on the Consolidated Statements of Operations for the
year
s ended
December 31, 2016
and
December 31, 2015
was:
|
(in millions)
|
||||||||||||||||||
|
Derivatives Designated as Cash Flow Hedging Instruments
|
Amount of Gain (Loss) on Derivatives Recognized in Accumulated Other Comprehensive Loss (Effective Portion)
|
Location of Gain (Loss) Reclassified from Accumulated Other Comprehensive Loss into Earnings (Effective Portion)
|
Amount of Gain (Loss) Reclassified from Accumulated Other Comprehensive Loss
into Earnings (Effective Portion)
|
|||||||||||||||
|
2016
|
2015
|
2016
|
2015
|
|||||||||||||||
|
Interest rate contracts
|
$
|
—
|
|
$
|
—
|
|
Interest expense
|
$
|
(0.6
|
)
|
$
|
(0.1
|
)
|
|||||
|
Foreign exchange contracts
|
2.9
|
|
12.9
|
|
Cost of sales
|
3.3
|
|
12.2
|
|
|||||||||
|
Commodity contracts
|
0.0
|
|
(0.9
|
)
|
Cost of sales
|
(0.5
|
)
|
0.9
|
|
|||||||||
|
Total
|
$
|
2.9
|
|
$
|
12.0
|
|
|
$
|
2.2
|
|
$
|
13.0
|
|
|||||
|
Derivatives Designated as Fair Value Hedging Instruments
|
Location of Gain (Loss) on Derivatives
Recognized in Earnings
|
Amount of Gain (Loss) on Derivatives Recognized in Earnings
|
||||||||
|
2016
|
2015
|
|||||||||
|
Interest rate contracts
|
Interest expense
|
$
|
2.9
|
|
$
|
4.3
|
|
|||
81
|
Other Hedging Activity
|
Location of Gain (Loss) on Derivatives
Recognized in Earnings
|
Amount of Gain (Loss) on Derivatives Recognized in Earnings
|
||||||||
|
2016
|
2015
|
|||||||||
|
Foreign exchange contracts
|
Cost of sales
|
$
|
(5.7
|
)
|
$
|
8.7
|
|
|||
|
Foreign exchange contracts
|
Other income, net
|
2.0
|
|
(0.3
|
)
|
|||||
|
Commodity contracts
|
Cost of sales
|
0.3
|
|
(5.9
|
)
|
|||||
|
Total
|
|
$
|
(3.4
|
)
|
$
|
2.5
|
|
|||
Fair Value of Other Financial Instruments.
The carrying values of the Company’s short-term financial instruments, including cash and cash equivalents, accounts and notes receivable and short-term debt approximate their fair values because of the short maturity of these instruments. At
December 31, 2016
and
December 31, 2015
, the fair value of the Company’s long-term debt was approximately
$498.5 million
and
$454.7 million
, respectively, and was determined using Level 1 and Level 2 inputs described in
Note 7 –
Fair Value Measurements
, including quoted market prices or discounted cash flows based on quoted market rates for similar types of debt. The carrying value of long-term debt, including current maturities, was
$444.6 million
and
$448.5 million
as of
December 31, 2016
and
December 31, 2015
, respectively.
Note 15 –
Accrued Expenses
Accrued Expenses at December 31,
2016
and
2015
were as follows:
|
(in millions)
|
2016
|
2015
|
|||||
|
Compensation and benefit plans
|
$
|
146.0
|
|
$
|
162.7
|
|
|
|
Product warranties
|
112.6
|
|
106.3
|
|
|||
|
Sales incentives and discounts
|
104.4
|
|
87.4
|
|
|||
|
Deferred revenue and customer deposits
|
64.2
|
|
57.2
|
|
|||
|
Insurance reserves
|
21.5
|
|
26.6
|
|
|||
|
Secured obligations, repurchase and recourse
|
24.3
|
|
24.7
|
|
|||
|
Environmental reserves
|
23.7
|
|
25.4
|
|
|||
|
Interest
|
8.4
|
|
8.4
|
|
|||
|
Real, personal and other non-income taxes
|
7.0
|
|
7.2
|
|
|||
|
Derivatives
|
4.6
|
|
5.6
|
|
|||
|
Other
|
49.6
|
|
51.5
|
|
|||
|
Total accrued expenses
|
$
|
566.3
|
|
$
|
563.0
|
|
|
82
Note 16 –
Debt
Long-term debt at
December 31, 2016
and
December 31, 2015
consisted of the following:
|
(in millions)
|
2016
|
2015
|
|||||
|
Notes, 7.125% due 2027, net of discount of $0.4 and $0.4 and debt issuance costs of $0.5 and $0.6
|
$
|
162.3
|
|
$
|
162.2
|
|
|
|
Senior notes, currently 4.625%, due 2021,
net of debt issuances costs of $1.9 and $2.3
(A)
|
147.8
|
|
149.6
|
|
|||
|
Debentures, 7.375% due 2023, net of discount of $0.2 and $0.2
and debt issuance costs of $0.2 and $0.3
(A)
|
103.4
|
|
104.7
|
|
|||
|
Loan with Fond du Lac County Economic Development Corporation, 2.0% due 2021, net of discount of $3.8 and $4.5 and debt issuance costs of $0.1 and $0.1
|
23.8
|
|
28.1
|
|
|||
|
Notes, various up to 5.892% payable through 2027, net of discount of $0.2 in 2016
|
5.1
|
|
3.9
|
|
|||
|
Total long-term debt
|
442.4
|
|
448.5
|
|
|||
|
Current maturities of long-term debt
|
(5.9
|
)
|
(6.0
|
)
|
|||
|
Long-term debt, net of current maturities
|
$
|
436.5
|
|
$
|
442.5
|
|
|
(A) Included in Senior notes, 4.625% due 2021 and Debentures, 7.375% due 2023 at
December 31, 2016
and
December 31, 2015
, are the aggregate fair values related to the fixed-to-floating interest rate swaps as discussed in
Note 14 –
Financial Instruments
.
Scheduled maturities, net:
|
(in millions)
|
|||
|
2017
|
$
|
5.9
|
|
|
2018
|
5.7
|
|
|
|
2019
|
5.7
|
|
|
|
2020
|
5.8
|
|
|
|
2021
|
152.4
|
|
|
|
Thereafter
|
266.9
|
|
|
|
Total long-term debt including current maturities
|
$
|
442.4
|
|
The Company did not repurchase debt during
2016
or
2015
.
The 2021, 2023 and 2027 notes are unsecured and do not contain subsidiary guarantees. Interest on the Company's notes is due semi-annually. The Company's 2021 and 2027 notes are subject to redemption at any time at the Company's discretion, in whole or in part, at redemption prices specified in the respective agreements, plus any accrued and unpaid interest. The Company's 2023 notes are not redeemable. The Company may be required to repurchase the 2021 notes in the event of a change of control, subject to certain circumstances, for an amount equal to 101% of the outstanding principal plus any accrued and unpaid interest at the time of the change of control.
In June 2016, the Company entered into an Amended and Restated Credit Agreement (Credit Facility). The Credit Facility amends and restates the Company's existing credit agreement, dated as of March 2011, as amended and restated as of June 2014. The Credit Facility provides for
$300 million
of borrowing capacity and is in effect through June 2021. No borrowings were outstanding as of
December 31, 2016
or during 2016, and available borrowing capacity totaled
$295.7 million
, net of
$4.3 million
of letters of credit outstanding under the Credit Facility. The Credit Facility includes provisions to add an additional
$100 million
of capacity and extend the facility for two additional one-year terms, subject to lender approval. The Company currently pays a facility fee of 20 basis points per annum. The facility fee per annum will be within a range of 12.5 to 35 basis points based on the Company's credit rating. Under the terms of the Credit Facility, the Company has two borrowing options: borrowing at a rate tied to adjusted LIBOR plus a spread of 130 basis points or a base rate plus a margin of 30.0 basis points. The rates are determined by the Company's credit ratings, with spreads ranging from 100 to 190 basis points for LIBOR rate borrowings and 0 to 90 basis points for base rate borrowings. The Company is required to maintain compliance with two financial covenants included in the Credit Facility: a minimum interest coverage ratio and a maximum leverage ratio. The minimum interest coverage ratio, as defined in the agreement, is not permitted to be less than 3.00 to 1.00. The maximum leverage ratio, as defined in the agreement, is not permitted to be more than 3.50 to 1.00. As of
December 31, 2016
, the Company was in compliance with the financial covenants in the Credit Facility.
83
As provided under the terms of its loan agreement with the Fond du Lac County Economic Development Corporation, which is secured by the Company's property located in Fond du Lac, Wisconsin, up to a maximum of
43
percent of the principal due annually can be forgiven if the Company achieves certain employment targets as outlined in the agreement. The amount of loan forgiveness is based on average employment levels at the end of the previous four quarters. Total loan forgiveness for the year ended
December 31, 2016
was
$2.1 million
or
43
percent of the principal due. Total loan forgiveness for the year ended
December 31, 2015
was
$2.0 million
or
41
percent of the principal due.
Note 17 –
Postretirement Benefits
Overview
. The Company has defined contribution plans, qualified and nonqualified defined benefit pension plans, and other postretirement benefit plans covering substantially all of its employees. The Company's contributions to its defined contribution plans include matching and annual discretionary contributions which are based on various percentages of compensation, and in some instances are based on the amount of the employees' contributions to the plans. The expense related to the defined contribution plans was
$46.3 million
,
$46.3 million
and
$38.9 million
in
2016
,
2015
and
2014
, respectively.
The Company's domestic pension and retiree health care and life insurance benefit plans, which are discussed below, provide benefits based on years of service and, for some plans, average compensation prior to retirement. Benefit accruals are frozen for all plan participants. The Company uses a December 31 measurement date for these plans. The Company's foreign postretirement benefit plans are not significant individually or in the aggregate.
Plan Developments.
During 2016, total settlement payments of
$125.2 million
were made from the Brunswick Pension Plan For Hourly Bargaining Unit Employees (Hourly Bargaining Plan) and the Brunswick Pension Plan For Salaried Employees (Salaried Plan) to purchase group annuity contracts to cover future benefit payments. The annuity contract unconditionally and irrevocably guarantees the full payment of all future annuity payments to the affected participants. The insurance company assumed all risk associated with the assets and obligations that were transferred. The Company recognized a pretax settlement loss of
$55.1 million
in the fourth quarter of 2016 relating to this action.
The Company also took actions to terminate the Brunswick Pension Plan For Hourly Employees (Hourly Plan) and the Brunswick Pension Plan For Hourly Wage Employees (Muskegon Plan) at the Muskegon, Michigan Factory, effective as of December 31, 2016. All benefits are expected to be paid during 2017, either through a lump-sum payment or annuity offerings. As a result, the unfunded liabilities for both plans are currently recorded in Accrued expenses within the Company’s Consolidated Balance Sheets.
During 2015, total settlement payments of
$191.8 million
were made from the Brunswick Pension Plan For Selected Current And Former Employees and the Salaried Plan, consisting of lump-sum pension distributions of
$61.7 million
and the purchase of group annuity contracts totaling
$130.1 million
to cover future benefit payments. The annuity contract unconditionally and irrevocably guarantees the full payment of all future annuity payments to the affected participants. The insurance company assumed all risk associated with the assets and obligations that were transferred. The Company recognized a pretax settlement loss of
$82.3 million
in the fourth quarter of 2015 related to these actions.
During 2014, the Company offered a voluntary lump-sum pension payment opportunity to certain terminated vested Salaried Plan, Hourly Bargaining Plan and Muskegon Plan participants. Total lump-sum payments of
$80.7 million
, of which
$71.9 million
were considered settlement payments, for those participants electing to receive lump sums were made in 2014 using pension plan assets. The Company recognized pretax settlement losses of
$27.9 million
in the fourth quarter of 2014 for those plans where the settlement payment exceeded the sum of the plans' service and interest costs.
84
Costs.
Pension and other postretirement benefit costs included the following components for
2016
,
2015
and
2014
:
|
|
Pension Benefits
|
Other Postretirement Benefits
|
|||||||||||||||||||||
|
(in millions)
|
2016
|
2015
|
2014
|
2016
|
2015
|
2014
|
|||||||||||||||||
|
Interest cost
|
$
|
35.8
|
|
$
|
47.9
|
|
$
|
58.6
|
|
$
|
1.4
|
|
$
|
1.8
|
|
$
|
2.0
|
|
|||||
|
Expected return on plan assets
|
(38.5
|
)
|
(55.7
|
)
|
(58.8
|
)
|
—
|
|
—
|
|
—
|
|
|||||||||||
|
Amortization of prior service credits
|
—
|
|
—
|
|
—
|
|
(0.7
|
)
|
(0.7
|
)
|
(0.9
|
)
|
|||||||||||
|
Amortization of net actuarial losses
|
17.4
|
|
19.5
|
|
15.0
|
|
—
|
|
1.3
|
|
—
|
|
|||||||||||
|
Settlement charges
|
55.1
|
|
82.3
|
|
27.9
|
|
—
|
|
—
|
|
—
|
|
|||||||||||
|
Net pension and other benefit costs
|
$
|
69.8
|
|
$
|
94.0
|
|
$
|
42.7
|
|
$
|
0.7
|
|
$
|
2.4
|
|
$
|
1.1
|
|
|||||
Portions of Net pension and other benefit costs are recorded in Selling, general and administrative expenses as well as capitalized into inventory. Costs capitalized into inventory are eventually realized through Cost of sales in the Consolidated Statements of Operations.
Pension expense in 2016 includes the impact of a change in methodology used to calculate the interest cost component of pension expense. In 2015 and prior years, the Company used a single-weighted average discount rate to calculate pension and postretirement interest costs. Beginning in 2016, the Company is utilizing a "spot rate approach" in the calculation of pension and postretirement interest costs to provide a more accurate measurement of interest costs. The spot rate approach applies separate discount rates for each projected benefit payment in the calculation of pension and postretirement interest costs. This calculation change is considered to be a change in accounting estimate and is being applied prospectively in 2016. The discount rates used to measure the
2016
interest costs are
3.58%
and
3.30%
for pensions and other postretirement benefits, respectively. The previous method would have used a discount rate for interest costs of
4.40%
for pensions and
4.23%
for other postretirement benefits, respectively. The decreased interest costs for the 12 months ended
December 31, 2016
, for pension and other postretirement benefits, was approximately
$8.2 million
and
$0.4 million
, respectively, compared with the previous method.
Additionally, pension expense in 2016 includes the impact of a decline in the assumed rate of return on plan assets to
5.25%
in 2016 compared with
6.00%
in 2015, primarily due to shifts in asset allocations toward fixed income investments. For the year ended December 31, 2016, pension expense increased by
$5.6 million
as a result of the lower assumed rate of return on plan assets.
85
Benefit Obligations and Funded Status.
A reconciliation of the changes in the benefit obligations and fair value of assets over the two-year period ending
December 31, 2016
, and a statement of the funded status at December 31 for these years for the Company's pension and other postretirement benefit plans follow:
|
Pension Benefits
|
Other Postretirement Benefits
|
||||||||||||||
|
(in millions)
|
2016
|
|
2015
|
|
2016
|
|
2015
|
||||||||
|
Reconciliation of benefit obligation:
|
|
|
|
|
|
|
|
||||||||
|
Benefit obligation at previous December 31
|
$
|
1,035.5
|
|
$
|
1,315.4
|
|
$
|
43.5
|
|
$
|
49.5
|
|
|||
|
Interest cost
|
35.8
|
|
47.9
|
|
1.4
|
|
1.8
|
|
|||||||
|
Participant contributions
|
—
|
|
—
|
|
0.5
|
|
0.7
|
|
|||||||
|
Actuarial (gains) losses
|
49.0
|
|
(56.8
|
)
|
(0.9
|
)
|
(4.1
|
)
|
|||||||
|
Benefit payments
|
(73.6
|
)
|
(79.2
|
)
|
(3.9
|
)
|
(4.4
|
)
|
|||||||
|
Settlement payments
|
(125.2
|
)
|
(191.8
|
)
|
—
|
|
—
|
|
|||||||
|
Benefit obligation at December 31
|
921.5
|
|
1,035.5
|
|
|
40.6
|
|
|
43.5
|
|
|||||
|
|
|
|
|
|
|
|
|
|
|
|
|
||||
|
Reconciliation of fair value of plan assets:
|
|
|
|
|
|
|
|
|
|
|
|
||||
|
Fair value of plan assets at previous December 31
|
736.4
|
|
965.9
|
|
—
|
|
—
|
|
|||||||
|
Actual return on plan assets
|
75.7
|
|
(32.1
|
)
|
—
|
|
—
|
|
|||||||
|
Employer contributions
|
74.6
|
|
73.6
|
|
3.4
|
|
3.7
|
|
|||||||
|
Participant contributions
|
—
|
|
—
|
|
0.5
|
|
0.7
|
|
|||||||
|
Benefit payments
|
(73.6
|
)
|
(79.2
|
)
|
(3.9
|
)
|
(4.4
|
)
|
|||||||
|
Settlement payments
|
(125.2
|
)
|
(191.8
|
)
|
—
|
|
—
|
|
|||||||
|
Fair value of plan assets at December 31
|
687.9
|
|
|
736.4
|
|
|
—
|
|
|
—
|
|
||||
|
|
|
|
|
|
|
|
|
|
|
|
|
||||
|
Funded status at December 31
|
$
|
(233.6
|
)
|
|
$
|
(299.1
|
)
|
|
$
|
(40.6
|
)
|
|
$
|
(43.5
|
)
|
|
Funded percentage
(A)
|
75
|
%
|
|
71
|
%
|
|
NA
|
|
|
NA
|
|
||||
(A) As all of the Company's plans are frozen, the projected benefit obligation and the accumulated benefit obligation are equal. As of December 31,
2016
and
2015
, the projected and accumulated benefit obligations for all of the Company's pension plans were in excess of plan assets.
The funded status of these pension plans includes the projected and accumulated benefit obligations for the Company's nonqualified pension plan of
$34.5 million
and
$36.7 million
at December 31,
2016
and
2015
, respectively. The Company's nonqualified pension plan and other postretirement benefit plans are not funded.
The amounts included in the Company's Consolidated Balance Sheets as of December 31,
2016
and
2015
, were as follows:
|
Pension Benefits
|
Other Postretirement Benefits
|
||||||||||||||
|
(in millions)
|
2016
|
2015
|
2016
|
2015
|
|||||||||||
|
Accrued expenses
|
$
|
10.5
|
|
$
|
3.8
|
|
$
|
4.1
|
|
$
|
4.4
|
|
|||
|
Postretirement benefit liabilities
|
223.1
|
|
295.3
|
|
36.5
|
|
39.1
|
|
|||||||
|
Net amount recognized
|
$
|
233.6
|
|
$
|
299.1
|
|
$
|
40.6
|
|
$
|
43.5
|
|
|||
86
Accumulated Other Comprehensive Loss.
The following pretax activity related to pensions and other postretirement benefits was recorded in Accumulated other comprehensive loss as of December 31:
|
Pension Benefits
|
Other Postretirement Benefits
|
||||||||||||||
|
(in millions)
|
2016
|
2015
|
2016
|
2015
|
|||||||||||
|
Prior service credits
|
|||||||||||||||
|
Beginning balance
|
$
|
—
|
|
$
|
—
|
|
$
|
(10.9
|
)
|
$
|
(11.6
|
)
|
|||
|
Amount recognized as component of net benefit costs
|
—
|
|
—
|
|
0.7
|
|
0.7
|
|
|||||||
|
Ending balance
|
—
|
|
—
|
|
(10.2
|
)
|
(10.9
|
)
|
|||||||
|
Net actuarial losses
|
|||||||||||||||
|
Beginning balance
|
457.8
|
|
528.6
|
|
1.9
|
|
7.3
|
|
|||||||
|
Actuarial (gains) losses arising during the period
|
11.8
|
|
31.0
|
|
(0.9
|
)
|
(4.1
|
)
|
|||||||
|
Amount recognized as component of net benefit costs
|
(72.5
|
)
|
(101.8
|
)
|
—
|
|
(1.3
|
)
|
|||||||
|
Ending balance
|
397.1
|
|
457.8
|
|
1.0
|
|
1.9
|
|
|||||||
|
Total
|
$
|
397.1
|
|
$
|
457.8
|
|
$
|
(9.2
|
)
|
$
|
(9.0
|
)
|
|||
The estimated pretax net actuarial loss in Accumulated other comprehensive loss at
December 31, 2016
, expected to be recognized as a component of net periodic benefit cost in
2017
for the Company's pension plans, is
$14.4 million
. The estimated pretax prior service credit and net actuarial loss in Accumulated other comprehensive loss at
December 31, 2016
, expected to be recognized as components of net periodic benefit cost in
2017
for the Company's other postretirement benefit plans, are
$0.7 million
and
$0.0 million
, respectively.
Prior service costs and credits associated with other postretirement benefits are being amortized on a straight-line basis over the average future working lifetime to full eligibility for active hourly plan participants and over the average remaining life expectancy for those plans' participants who are fully eligible for benefits. Actuarial gains and losses in excess of
10 percent
of the greater of the benefit obligation or the market value of assets are amortized over the remaining service period of active plan participants and over the average remaining life expectancy of inactive plan participants.
Other Postretirement Benefits
. Once participants eligible for other postretirement benefits turn 65 years old, the health care benefits become a flat dollar amount based on age and years of service. The assumed health care cost trend rate for other postretirement benefits for pre-age 65 benefits as of December 31 was as follows:
|
Pre-age 65 Benefits
|
|||||
|
2016
|
2015
|
||||
|
Health care cost trend rate for next year
|
5.7
|
%
|
5.8
|
%
|
|
|
Rate to which the cost trend rate is assumed to decline (the ultimate trend rate)
|
4.5
|
%
|
4.5
|
%
|
|
|
Year rate reaches the ultimate trend rate
|
2037
|
|
2037
|
|
|
The health care cost trend rate assumption has an effect on the amounts reported. A one percent change in the assumed health care trend rate at
December 31, 2016
would not have a material impact on the accumulated postretirement benefit obligation.
The Company monitors the cost of health care and life insurance benefit plans and reserves the right to make additional changes or terminate these benefits in the future.
87
Assumptions.
In October 2014, the Society of Actuaries (SOA) issued updated mortality tables (RP-2014) and a mortality improvement scale (MP-2014), which reflect longer life expectancies than previously projected. Since then, the SOA has issued updated mortality improvement scales, (MP-2015 and MP-2016) which include actual mortality improvement data from the Social Security Administration for years 2011 through 2014. The actual mortality data showed higher rates of mortality than anticipated, and thus updated projections show a slight decrease in life expectancies compared to the original MP-2014 projection scale. This information was considered in developing the Company's updated mortality assumptions for pension and postretirement benefit obligations recorded at December 31, 2016. The updated mortality assumptions resulted in a decrease of approximately $10.5 million and $0.3 million in the Company's pension and postretirement benefit obligations, respectively, at December 31, 2016.
Weighted average assumptions used to determine pension and other postretirement benefit obligations at December 31 were as follows:
|
Pension Benefits
|
Other Postretirement Benefits
|
||||||||||
|
2016
|
2015
|
2016
|
2015
|
||||||||
|
Discount rate
|
4.00
|
%
|
4.40
|
%
|
3.93
|
%
|
4.23
|
%
|
|||
Weighted average assumptions used to determine net pension and other postretirement benefit costs for the years ended December 31 were as follows:
|
2016
|
2015
|
2014
|
|||
|
Discount rate for pension benefits
|
3.58%
|
3.95%
|
4.85%
|
||
|
Discount rate for other postretirement benefits
|
3.30%
|
3.75%
|
4.40%
|
||
|
Long-term rate of return on plan assets
|
5.25%
|
6.00%
|
6.25%
|
||
The Company utilizes a yield curve analysis to calculate the discount rates used to determine pension and other postretirement benefit obligations. The yield curve analysis matches the cash flows of the Company's benefit obligations. The yield curve consisted of spot interest rates at half year increments for each of the next 30 years and was developed based on pricing and yield information for high quality corporate bonds rated Aa by either Moody's or Standard & Poor's, private placement bonds that are traded in reliance with Rule 144A and are at least two years from date of issuance, bonds with make-whole provisions and bonds issued by foreign corporations that are denominated in U.S. dollars, excluding callable bonds and bonds less than a minimum size and other filtering criteria. Additionally, the Company's yield curve methodology includes bonds having a yield that is greater than the regression mean yield curve as the Company believes this methodology represents an appropriate estimate of the rates at which the Company could effectively settle its pension obligations.
The Company evaluates its assumption regarding the estimated long-term rate of return on plan assets based on historical experience, future expectations of investment returns, asset allocations, investment strategies and views of investment professionals. The Company's long-term rate of return on assets assumptions of
5.25
percent for
2016
,
6.00
percent for
2015
, and
6.25
percent for
2014
, reflect expectations of projected weighted average market returns for the plans' assets. These changes in expected returns also reflected adjustments to the Company's targeted asset allocation.
Master Trust Investments.
Assets of the Company's Master Pension Trust (Trust) are invested solely in the interest of the plan participants for the purpose of providing benefits to participants and their beneficiaries. Investment decisions within the Trust are made after giving appropriate consideration to the prevailing facts and circumstances that a prudent person acting in a like capacity would use in a similar situation, and follow the guidelines and objectives established within the investment policy statement for the Trust. In general, the Trust's investment strategy is to invest in a diversified portfolio of assets that will generate returns equal to or in excess of the change in liabilities resulting from interest costs and discount rate fluctuations. The excess returns generated from this strategy will contribute to improving the funded position of the plan. In order for returns to achieve this objective, the Trust will invest in fixed income investments and equities. These asset classes have historically been reasonably correlated to changes in plan liabilities resulting from changes in the discount rate. All investments are continually monitored and reviewed, with a focus on asset allocation, investment vehicles and performance of the individual investment managers, as well as overall Trust performance. Over time, the Company has shifted a greater percentage of the Trust's assets into long-term fixed-income securities, with an objective of achieving an improved matching of asset returns with changes in liabilities. The Company will consider future changes in asset allocation based on a number of factors including improvements in the plans' funded position, performance of equity investments and changes in the discount rate used to measure plan liabilities.
88
The Trust asset allocation at December 31,
2016
and
2015
, and target allocation for
2017
are as follows:
|
2016
|
2015
|
Target
Allocation for 2017
|
|||
|
Equity securities:
|
|||||
|
United States
|
19%
|
17%
|
17%
|
||
|
International
|
3%
|
3%
|
3%
|
||
|
Fixed-income securities
|
75%
|
77%
|
80%
|
||
|
Short-term investments
|
3%
|
3%
|
—
|
||
|
Total
|
100%
|
100%
|
100%
|
||
The fair values of the Trust's pension assets at
December 31, 2016
, by asset class were as follows:
|
Fair Value Measurements at December 31, 2016
(A)
|
|||||||||||
|
(in millions)
|
Quoted Prices in Active Markets for Identical Assets
|
Significant Observable Inputs
|
|||||||||
|
Investments at fair value
|
Total
|
(Level 1)
|
(Level 2)
|
||||||||
|
Short-term investments
|
$
|
1.9
|
|
$
|
1.9
|
|
$
|
—
|
|
||
|
Fixed-income securities:
|
|||||||||||
|
Government securities
(C)
|
141.5
|
|
—
|
|
141.5
|
|
|||||
|
Corporate securities
(D)
|
382.1
|
|
—
|
|
382.1
|
|
|||||
|
Other investments
(F)
|
8.5
|
|
(0.4
|
)
|
8.9
|
|
|||||
|
Total investments at fair value
|
$
|
534.0
|
|
$
|
1.5
|
|
$
|
532.5
|
|
||
|
Investments at net asset value
|
|||||||||||
|
Short-term investments
|
46.8
|
|
|||||||||
|
Equity securities
(B)
|
|||||||||||
|
United States
|
132.8
|
|
|||||||||
|
International
|
17.6
|
|
|||||||||
|
Fixed-income securities:
|
|||||||||||
|
Commingled funds
(E)
|
15.3
|
|
|||||||||
|
Total investments at net asset value
|
212.5
|
|
|||||||||
|
Other liabilities
(G)
|
(58.6
|
)
|
|||||||||
|
Total pension plan net assets
|
$
|
687.9
|
|
||||||||
|
(A)
|
See
Note 7 –
Fair Value Measurements
for a description of levels within the fair value hierarchy. The level in the fair value hierarchy within which the fair value measurement is classified is determined based on the lowest level input that is significant to the fair value measurement in its entirety. A description of the valuation methodologies is provided following these tables. There were no transfers in and/or out of Level 1, Level 2 and Level 3 in
2016
.
|
|
(B)
|
The equity assets are invested in two indexed funds based on the Russell 3000 Index (U.S.) and the MSCI EAFE Equity Index (International). The Trust did not directly own any of the Company's common stock as of
December 31, 2016
.
|
|
(C)
|
Government securities are comprised of U.S. Treasury bonds and other government securities.
|
|
(D)
|
Corporate securities consist primarily of a diversified portfolio of investment grade bonds issued by companies.
|
|
(E)
|
This class includes commingled funds that primarily invest in investment grade corporate securities and government-related securities. This class also includes investments in non-agency collateralized mortgage obligations and mortgage-backed securities, futures and options.
|
|
(F)
|
Other investments consist primarily of interest rate swaps used to manage the average duration of the fixed income portfolio and credit default swaps to manage credit risk exposure.
|
|
(G)
|
This class includes interest receivable and receivables/payables for securities sold/purchased.
|
89
The fair values of the Trust's pension assets at
December 31, 2015
, by asset class were as follows:
|
Fair Value Measurements at December 31, 2015
(A)
|
|||||||||||
|
(in millions)
|
Quoted Prices in Active Markets for Identical Assets
|
Significant Observable Inputs
|
|||||||||
|
Investments at fair value
|
Total
|
(Level 1)
|
(Level 2)
|
||||||||
|
Short-term investments
|
$
|
0.5
|
|
$
|
0.5
|
|
$
|
—
|
|
||
|
Fixed-income securities:
|
|||||||||||
|
Government securities
(C)
|
124.8
|
|
—
|
|
124.8
|
|
|||||
|
Corporate securities
(D)
|
415.8
|
|
—
|
|
415.8
|
|
|||||
|
Other investments
(F)
|
(1.0
|
)
|
—
|
|
(1.0
|
)
|
|||||
|
Total investments at fair value
|
$
|
540.1
|
|
$
|
0.5
|
|
$
|
539.6
|
|
||
|
Investments at net asset value
|
|||||||||||
|
Short-term investments
|
26.2
|
|
|||||||||
|
Equity securities
(B)
|
|||||||||||
|
United States
|
129.1
|
|
|||||||||
|
International
|
21.0
|
|
|||||||||
|
Fixed-income securities:
|
|||||||||||
|
Commingled funds
(E)
|
37.3
|
|
|||||||||
|
Total investments at net asset value
|
213.6
|
|
|||||||||
|
Other liabilities
(G)
|
(17.3
|
)
|
|||||||||
|
Total pension plan net assets
|
$
|
736.4
|
|
||||||||
|
(A)
|
See
Note 7 –
Fair Value Measurements
for a description of levels within the fair value hierarchy. The level in the fair value hierarchy within which the fair value measurement is classified is determined based on the lowest level input that is significant to the fair value measurement in its entirety. A description of the valuation methodologies is provided following these tables. There were no transfers in and/or out of Level 1, Level 2 and Level 3 in
2015
.
|
|
(B)
|
The equity assets are invested in two indexed funds based on the Russell 3000 Index (U.S.) and the MSCI EAFE Equity Index (International). The Trust did not directly own any of the Company's common stock as of
December 31, 2015
.
|
|
(C)
|
Government securities are comprised of U.S. Treasury bonds and other government securities.
|
|
(D)
|
Corporate securities consist primarily of a diversified portfolio of investment grade bonds issued by companies.
|
|
(E)
|
This class includes commingled funds that primarily invest in investment grade corporate securities and government-related securities. This class also includes investments in non-agency collateralized mortgage obligations and mortgage-backed securities, futures and options.
|
|
(F)
|
Other investments consist primarily of interest rate swaps used to manage the average duration of the fixed income portfolio.
|
|
(G)
|
This class includes interest receivable and receivables/payables for securities sold/purchased.
|
The following is a description of the valuation methodologies used for assets and liabilities measured at fair value. See
Note 7 –
Fair Value Measurements
for further description of the procedures the Company performs with respect to its Level 2 measurements:
Equity securities:
The indexed equity funds are valued at the net asset value (NAV) provided by the investment managers. The NAV is based on the quoted market value of the underlying assets owned by the fund, minus its liabilities, divided by the number of units outstanding. The indexed equity funds are invested in portfolios of equity securities with the goal of matching returns to specific indices. Investments in United States equity securities are invested in an index fund that tracks the Russell 3000 index, which is an all cap market index. International equities are invested in an index fund that tracks the MSCI EAFE index, which is an index that tracks international equity markets of developed countries worldwide. Withdrawal from the United States equity fund is permitted with a one-day notice prior to the trade date with subsequent settlement three days after the trade date. Withdrawal from the international equity fund is permitted daily with a two-day notice prior to the trade date with subsequent settlement three days after the trade date.
Corporate debt securities:
Corporate debt securities are valued based on prices provided by third-party pricing sources, which are based on estimated prices at which a dealer would pay for or sell a security.
90
Government debt securities:
U.S. Treasury bonds are valued using quoted market prices in active markets. Other agency securities are valued based on prices provided by third-party pricing sources, which are based on estimated prices at which a dealer would pay for or sell a security.
Short-term investments, commingled funds:
Short-term investments and commingled funds are valued at the NAV provided by the investment managers. The NAV is based on the quoted market value of the underlying assets owned by the fund, minus its liabilities, divided by the number of units outstanding. Investments in fixed income commingled funds include long-duration corporate bonds and government-related securities with the goal of preserving capital and maximizing total return consistent with prudent investment management.
Other investments:
Exchange-traded derivative instruments are valued using market indices. The fair value of derivatives that are not traded on an exchange are based on valuation models using observable market data as of the measurement date.
There were no pension plan assets using significant unobservable inputs (Level 3) for the years ended
December 31, 2016
and
December 31, 2015
.
Expected Cash Flows.
The expected cash flows for the Company's pension and other postretirement benefit plans follow:
|
(in millions)
|
Pension Benefits
|
Other Postretirement Benefits
|
|||||
|
Company contributions expected to be made in 2017
(A)
|
$
|
73.8
|
|
$
|
4.1
|
|
|
|
Expected benefit payments:
|
|||||||
|
2017
(B)
|
158.7
|
|
4.1
|
|
|||
|
2018
|
56.8
|
|
3.9
|
|
|||
|
2019
|
56.9
|
|
3.7
|
|
|||
|
2020
|
56.6
|
|
3.4
|
|
|||
|
2021
|
56.0
|
|
3.1
|
|
|||
|
2022-2026
|
270.0
|
|
13.2
|
|
|||
(A) The Company anticipates contributing approximately
$70.0 million
to fund the qualified pension plans and approximately
$3.8 million
to cover benefit payments in the unfunded, nonqualified pension plan in
2017
. Company contributions are subject to change based on market conditions or Company discretion.
(B) Expected benefit payments in 2017 include payments in connection with the Hourly Plan and Muskegon Plan terminations.
Note 18 –
Stock Plans and Management Compensation
Under the Brunswick Corporation 2014 Stock Incentive Plan, the Company may grant stock options, stock appreciation rights (SARs), non-vested stock awards and performance awards to executives, other employees and non-employee directors, with
5.0 million
shares from treasury shares and from authorized, but unissued, shares of common stock initially available for grant, in addition to: (i) the forfeiture of past awards; or (ii) shares not issued upon the net settlement of SARs; (iii) shares delivered to or withheld by the Company to pay the withholding taxes related to awards. As of
December 31, 2016
,
5.5 million
shares remained available for grant.
Non-Vested Stock Awards
The Company grants both stock-settled and cash-settled non-vested stock units and awards to key employees as determined by management and the Human Resources and Compensation Committee of the Board of Directors. Non-vested stock units and awards have vesting periods of
three
or
four
years. Non-vested stock units and awards are eligible for dividends, which are reinvested, and are non-voting. All non-vested units and awards have restrictions on the sale or transfer of such awards during the vesting period.
Generally, grants of non-vested stock units and awards are forfeited if employment is terminated prior to vesting. Non-vested stock units and awards vest pro rata over one year if (i) the grantee has attained the age of
62
, or (ii) the grantee's age plus total years of service equals
70 or more
.
91
The Company recognizes the cost of non-vested stock units and awards on a straight-line basis over the requisite service period. Additionally, cash-settled non-vested stock units and awards are recorded as a liability on the balance sheet and adjusted to fair value each reporting period through stock compensation expense. During
December 31, 2016
,
2015
and
2014
, the Company charged
$10.8 million
,
$13.6 million
and
$10.5 million
, respectively, to compensation expense for non-vested stock units and awards. The related income tax benefit recognized in
2016
,
2015
and
2014
was
$4.1 million
,
$5.2 million
and
$4.0 million
, respectively. The fair value of shares vested during
2016
,
2015
and
2014
was
$13.8 million
,
$20.4 million
and
$14.1 million
, respectively.
The weighted average price per Non-vested stock award at grant date was
$40.01
,
$53.77
and
$40.41
for awards granted in 2016, 2015 and 2014, respectively. Non-vested stock award activity for the year ended
December 31, 2016
was as follows:
|
(in thousands, except grant date fair value)
|
Non-vested Stock Award Activity
|
Weighted Average Grant Date Fair Value
|
||||
|
Non-vested awards, unvested at January 1
|
322
|
|
$
|
44.46
|
|
|
|
Awarded
|
332
|
|
40.01
|
|
||
|
Forfeited
|
(22
|
)
|
42.11
|
|
||
|
Vested
|
(253
|
)
|
40.48
|
|
||
|
Non-vested awards, unvested at December 31
|
379
|
|
$
|
43.35
|
|
|
As of
December 31, 2016
, there was
$6.5 million
of total unrecognized compensation expense related to non-vested stock awards. The Company expects this expense to be recognized over a weighted average period of
1.3 years
.
Stock Options and SARs
Through 2004, the Company issued stock options, and between 2005 and 2012, the Company issued stock-settled SARs. Generally, stock options and SARs are exercisable over a period of
10 years
, or as otherwise determined by management and the Human Resources and Compensation Committee of the Board of Directors, and subject to vesting periods of generally
4 years
. However, with respect to stock options and SARs, all grants vest immediately: (i) in the event of a change in control; (ii) upon death or disability of the grantee; or (iii) with respect to awards granted prior to 2008, upon the sale or divestiture of the business unit to which the grantee is assigned.
In addition, grantees continue to vest in accordance with the vesting schedule even upon termination if (i) the grantee has attained the age of
62
, or (ii) the grantee's age plus total years of service equals
70 or more
. An additional provision applies that prorates the grant in the event of termination prior to the first anniversary of the date of grant, provided the participant had met the appropriate retirement age definition of rule of 70 or age 62.
SARs and stock option activity for all plans for the years ended
December 31, 2016
,
2015
and
2014
, was as follows:
|
2016
|
2015
|
2014
|
||||||||||||||||||||||||||||||||
|
(in thousands, except exercise price and terms)
|
SARs/Stock Options Outstanding |
Weighted
Average Exercise Price |
Weighted
Average Remaining Contractual Term |
Aggregate Intrinsic Value
|
SARs/Stock Options Outstanding |
Weighted
Average Exercise Price |
Aggregate Intrinsic Value
|
SARs/Stock Options Outstanding |
Weighted Average Exercise Price |
Aggregate Intrinsic Value
|
||||||||||||||||||||||||
|
Outstanding on January 1
|
2,234
|
|
$
|
15.78
|
|
2,705
|
|
$
|
16.91
|
|
3,825
|
|
$
|
19.09
|
|
|||||||||||||||||||
|
Exercised
|
(1,252
|
)
|
$
|
16.76
|
|
$
|
32,096
|
|
(464
|
)
|
$
|
22.15
|
|
$
|
14,615
|
|
(1,084
|
)
|
$
|
24.02
|
|
$
|
23,611
|
|
||||||||||
|
Forfeited
|
(4
|
)
|
$
|
38.42
|
|
(7
|
)
|
$
|
29.99
|
|
(36
|
)
|
$
|
35.10
|
|
|||||||||||||||||||
|
Outstanding on December 31
|
978
|
|
$
|
14.43
|
|
3.2 years
|
$
|
39,228
|
|
2,234
|
|
$
|
15.78
|
|
$
|
77,580
|
|
2,705
|
|
$
|
16.91
|
|
$
|
92,908
|
|
|||||||||
|
Exercisable on December 31
|
978
|
|
$
|
14.43
|
|
3.2 years
|
$
|
39,228
|
|
2,151
|
|
$
|
15.47
|
|
$
|
75,372
|
|
2,294
|
|
$
|
16.03
|
|
$
|
80,809
|
|
|||||||||
|
Vested and expected to vest on December 31
|
978
|
|
$
|
14.43
|
|
3.2 years
|
$
|
39,288
|
|
2,234
|
|
$
|
15.78
|
|
$
|
77,580
|
|
2,705
|
|
$
|
16.91
|
|
$
|
92,908
|
|
|||||||||
92
The following table summarizes information about SARs and stock options outstanding as of
December 31, 2016
:
|
Outstanding
|
Exercisable
|
|||||||||||||||||||
|
Range of Exercise
Price
|
Number
(in thousands)
|
Weighted
Average Remaining Years of
Contractual
Life
|
Weighted
Average
Exercise
Price
|
Number
(in thousands)
|
Weighted
Average Remaining Years of
Contractual
Life
|
Weighted
Average
Exercise
Price
|
||||||||||||||
|
$3.37 to $5.99
|
237
|
|
2.3
|
years
|
$
|
5.24
|
|
237
|
|
2.3
|
years
|
$
|
5.24
|
|
||||||
|
$6.00 to $19.90
|
379
|
|
3.1
|
years
|
$
|
12.54
|
|
379
|
|
3.1
|
years
|
$
|
12.54
|
|
||||||
|
$19.91 to $39.56
|
362
|
|
4.0
|
years
|
$
|
22.45
|
|
362
|
|
4.0
|
years
|
$
|
22.45
|
|
||||||
Total stock option and SARs expense for the year ended
December 31, 2016
was
nominal
. Total stock option and SARs expense for the years ended
December 31, 2015
and
2014
was
$0.3 million
and
$1.3 million
, respectively.
Performance Awards
In February
2016
,
2015
and
2014
, the Company granted performance shares to certain senior executives. The 2016 and 2015 share awards are based on three performance measures: a cash flow return on investment (CFROI) measure, an operating margin (OM) measure and a total shareholder return (TSR) modifier. The 2014 share awards are based on a CFROI measure and a TSR modifier. Performance shares are earned based on a three-year performance period, except for the CFROI measure for the 2014 awards which is based on a one-year performance period. Performance periods commence at the beginning of the calendar year of each grant. The performance shares are then subject to a TSR modifier based on stock returns measured against stock returns of a predefined comparator group over the three-year performance period. Additionally, in February
2016
,
2015
and
2014
, the Company granted
37,430
,
22,990
, and
24,600
performance shares, respectively, to certain officers and certain senior managers based on the respective measures and performance periods described above but excluding a TSR modifier.
The fair values of the senior executives' performance share award grants with a TSR modifier at the grant date in
2016
,
2015
and
2014
were
$38.54
,
$56.17
and
$41.38
, respectively, which were estimated using the Monte Carlo valuation model, and incorporated the following assumptions:
|
2016
|
2015
|
2014
|
||||||
|
Risk-free interest rate
|
0.8
|
%
|
1.0
|
%
|
0.6
|
%
|
||
|
Dividend yield
|
1.0
|
%
|
0.9
|
%
|
1.0
|
%
|
||
|
Volatility factor
|
40.8
|
%
|
39.2
|
%
|
43.7
|
%
|
||
|
Expected life of award
|
2.9 years
|
|
2.9 years
|
|
2.9 years
|
|
||
The fair value of certain officers' and certain senior managers' performance awards granted based solely on the CFROI and OM performance factors, as applicable, was
$37.76
,
$52.39
and
$40.44
, which was equal to the stock price on the date of grant in
2016
,
2015
and
2014
, respectively, less the present value of dividend payments over the vesting period.
The Company recorded compensation expense related to performance awards of
$6.1 million
,
$8.0 million
and
$6.5 million
in
2016
,
2015
and
2014
, respectively. The related income tax benefit recognized in
2016
,
2015
and
2014
was
$2.3 million
,
$3.0 million
and
$2.5 million
, respectively. The fair value of awards vested during
2016
,
2015
and
2014
was
$9.1 million
,
$7.5 million
and
$7.4 million
, respectively.
93
Performance award activity for the year ended
December 31, 2016
was as follows:
|
(in thousands, except grant date fair value)
|
Performance Awards
|
Weighted Average Grant Date Fair Value
|
||||
|
Performance awards, unvested at January 1
|
50
|
|
$
|
49.39
|
|
|
|
Awarded
|
217
|
|
37.99
|
|
||
|
Forfeited
|
(9
|
)
|
38.49
|
|
||
|
Vested
|
(167
|
)
|
38.15
|
|
||
|
Performance awards, unvested at December 31
|
91
|
|
$
|
43.91
|
|
|
As of
December 31, 2016
, the Company had
$2.2 million
of total unrecognized compensation expense related to performance awards. The Company expects this expense to be recognized over a weighted average period of
1.6 years
.
Excess Tax Benefits
For tax purposes, share-based compensation expense is deductible in the year of exercise or release based on the intrinsic value of the award on the date of exercise or release. For financial reporting purposes, share-based compensation expense is based upon grant-date fair value, which is amortized over the vesting period. Excess or "windfall" tax benefits represent the excess tax deduction received by the Company resulting from the difference between the share-based compensation expense deductible for tax purposes and the share-based compensation expense recognized for financial reporting purposes. Windfall tax benefits are recorded directly to Additional paid-in capital in Shareholders' equity on the Company's Consolidated Balance Sheets. Windfall tax benefits for the years ended December 31,
2016
,
2015
and
2014
were
$13.4 million
,
$7.0 million
and
$8.4 million
, respectively, and are netted out of cash from operating activities and are reflected as a cash inflow from financing activities in the Consolidated Statements of Cash Flows.
Director Awards
The Company issues stock awards to non-employee directors in accordance with the terms and conditions determined by the Nominating and Corporate Governance Committee of the Board of Directors. A portion of each director’s annual fee is paid in Brunswick common stock, the receipt of which may be deferred until a director retires from the Board of Directors. Each director may elect to have the remaining portion paid in cash, in Brunswick common stock distributed at the time of the award, or in deferred Brunswick common stock units with a
20 percent
premium.
94
Note 19 –
Comprehensive Income
The following table presents reclassification adjustments out of Accumulated other comprehensive loss during the years ended
December 31, 2016
,
2015
and
2014
:
|
(in millions)
|
Twelve Months Ended
|
|||||||||||||
|
Details about Accumulated other comprehensive loss components
|
December 31, 2016
|
December 31, 2015
|
December 31, 2014
|
Affected line item in the statement where net income is presented
|
||||||||||
|
Amount of loss reclassified into earnings on foreign currency:
|
||||||||||||||
|
Foreign currency cumulative translation adjustment
|
$
|
—
|
|
$
|
—
|
|
$
|
(1.2
|
)
|
Loss on disposal of discontinued operations, net of tax
|
||||
|
—
|
|
—
|
|
(1.2
|
)
|
Total before tax
|
||||||||
|
—
|
|
—
|
|
0.5
|
|
Tax benefit
|
||||||||
|
$
|
—
|
|
$
|
—
|
|
$
|
(0.7
|
)
|
Net of tax
|
|||||
|
Amortization of defined benefit items:
|
||||||||||||||
|
Prior service credits
|
$
|
0.7
|
|
$
|
1.3
|
|
$
|
2.2
|
|
(A)
|
||||
|
Net actuarial losses
|
(73.1
|
)
|
(103.8
|
)
|
(43.3
|
)
|
(A)
|
|||||||
|
(72.4
|
)
|
(102.5
|
)
|
(41.1
|
)
|
Total before tax
|
||||||||
|
27.5
|
|
39.7
|
|
16.7
|
|
Tax benefit
|
||||||||
|
$
|
(44.9
|
)
|
$
|
(62.8
|
)
|
$
|
(24.4
|
)
|
Net of tax
|
|||||
|
Amount of gain (loss) reclassified into earnings on derivative contracts:
|
||||||||||||||
|
Interest rate contracts
|
$
|
(0.6
|
)
|
$
|
(0.1
|
)
|
$
|
(0.1
|
)
|
Interest expense
|
||||
|
Foreign exchange contracts
|
3.3
|
|
12.2
|
|
(0.2
|
)
|
Cost of sales
|
|||||||
|
Commodity contracts
|
(0.5
|
)
|
0.7
|
|
(1.9
|
)
|
Cost of sales
|
|||||||
|
2.2
|
|
12.8
|
|
(2.2
|
)
|
Total before tax
|
||||||||
|
(0.4
|
)
|
(4.0
|
)
|
0.8
|
|
Tax (provision) benefit
|
||||||||
|
$
|
1.8
|
|
$
|
8.8
|
|
$
|
(1.4
|
)
|
Net of tax
|
|||||
(A) These Accumulated other comprehensive income (loss) components are included in the computation of net pension and other benefit costs. See
Note 17 –
Postretirement Benefits
for additional details.
Note 20 –
Treasury and Preferred Stock
The Company has executed share repurchases against authorization approved by the Board of Directors in 2014 and 2016. In 2016, the Company repurchased
$120 million
of stock under these authorizations and as of
December 31, 2016
, the remaining authorization was
$240 million
.
Treasury stock activity for the years ended
December 31, 2016
,
2015
and
2014
, was as follows:
|
(Shares in thousands)
|
2016
|
2015
|
2014
|
|||||
|
Balance at January 1
|
11,725
|
|
9,844
|
|
10,129
|
|
||
|
Compensation plans and other
|
(1,199
|
)
|
(458
|
)
|
(697
|
)
|
||
|
Share repurchases
|
2,695
|
|
2,339
|
|
412
|
|
||
|
Balance at December 31
|
13,221
|
|
11,725
|
|
9,844
|
|
||
95
Note 21 –
Leases
Operating Leases.
The Company has lease agreements for offices, branches, factories, distribution and service facilities and certain personal property. The longest of these obligations extends through 2032. Most leases contain renewal options and escalation clauses, and some contain purchase options or contingent rentals. No leases contain restrictions on the Company's activities concerning dividends or incurring additional debt.
Rent expense consisted of the following:
|
(in millions)
|
2016
|
2015
|
2014
|
||||||||
|
Basic expense
|
$
|
37.2
|
|
$
|
31.6
|
|
$
|
27.8
|
|
||
|
Contingent expense
|
2.0
|
|
2.8
|
|
1.9
|
|
|||||
|
Sublease income
|
(0.2
|
)
|
(0.3
|
)
|
(0.2
|
)
|
|||||
|
Rent expense, net
|
$
|
39.0
|
|
$
|
34.1
|
|
$
|
29.5
|
|
||
Future minimum rental payments at
December 31, 2016
, under agreements classified as operating leases with non-cancelable terms in excess of one year, were as follows:
|
(in millions)
|
|||
|
2017
|
$
|
37.6
|
|
|
2018
|
31.5
|
|
|
|
2019
|
24.5
|
|
|
|
2020
|
14.0
|
|
|
|
2021
|
10.5
|
|
|
|
Thereafter
|
33.2
|
|
|
|
Total (not reduced by minimum sublease income of $0.3)
|
$
|
151.3
|
|
96
Note 22 –
Quarterly Data (unaudited)
The Company maintains its financial records on the basis of a fiscal year ending on December 31, with the fiscal quarters spanning approximately thirteen weeks. The first quarter ends on the Saturday closest to the end of the first thirteen-week period. The second and third quarters are thirteen weeks in duration and the fourth quarter is the remainder of the year. The first three quarters of fiscal year
2016
ended on
April 2, 2016
,
July 2, 2016
, and
October 1, 2016
, and the first three quarters of fiscal year
2015
ended on
April 4, 2015
,
July 4, 2015
, and
October 3, 2015
.
|
Quarter Ended
|
|
||||||||||||||||||
|
(in millions, except per share data)
|
April 2,
2016 |
July 2,
2016 |
October 1,
2016 |
December 31,
2016 |
Year Ended December 31, 2016
|
||||||||||||||
|
Net sales
|
$
|
1,070.3
|
|
$
|
1,242.2
|
|
$
|
1,093.0
|
|
$
|
1,083.0
|
|
$
|
4,488.5
|
|
||||
|
Gross margin
(A)
|
282.1
|
|
353.3
|
|
309.7
|
|
280.0
|
|
1,225.1
|
|
|||||||||
|
Pension settlement charge
(B)
|
—
|
|
—
|
|
—
|
|
55.1
|
|
55.1
|
|
|||||||||
|
Restructuring, integration and impairment charges
(C)
|
3.8
|
|
2.6
|
|
2.4
|
|
6.8
|
|
15.6
|
|
|||||||||
|
Net earnings from continuing operations
|
63.2
|
|
108.1
|
|
85.3
|
|
17.8
|
|
274.4
|
|
|||||||||
|
Net earnings (loss) from discontinued operations, net of tax
(D)
|
1.6
|
|
(0.0
|
)
|
0.1
|
|
(0.1
|
)
|
1.6
|
|
|||||||||
|
Net earnings
|
64.8
|
|
108.1
|
|
85.4
|
|
17.7
|
|
276.0
|
|
|||||||||
|
Basic earnings (loss) per common share:
|
|||||||||||||||||||
|
Net earnings from continuing operations
|
$
|
0.69
|
|
$
|
1.18
|
|
$
|
0.94
|
|
$
|
0.20
|
|
$
|
3.01
|
|
||||
|
Net earnings (loss) from discontinued operations
(D)
|
$
|
0.02
|
|
$
|
(0.00
|
)
|
$
|
0.00
|
|
$
|
(0.00
|
)
|
$
|
0.02
|
|
||||
|
Net earnings
|
$
|
0.71
|
|
$
|
1.18
|
|
$
|
0.94
|
|
$
|
0.20
|
|
$
|
3.03
|
|
||||
|
Diluted earnings (loss) per common share:
|
|||||||||||||||||||
|
Net earnings from continuing operations
|
$
|
0.68
|
|
$
|
1.17
|
|
$
|
0.93
|
|
$
|
0.19
|
|
$
|
2.98
|
|
||||
|
Net earnings (loss) from discontinued operations
(D)
|
$
|
0.02
|
|
$
|
(0.00
|
)
|
$
|
0.00
|
|
$
|
(0.00
|
)
|
$
|
0.02
|
|
||||
|
Net earnings
|
$
|
0.70
|
|
$
|
1.17
|
|
$
|
0.93
|
|
$
|
0.19
|
|
$
|
3.00
|
|
||||
|
Dividends declared
|
$
|
0.15
|
|
$
|
0.15
|
|
$
|
0.15
|
|
$
|
0.165
|
|
$
|
0.615
|
|
||||
|
Common stock price (NYSE symbol: BC):
|
|||||||||||||||||||
|
High
|
$
|
50.31
|
|
$
|
51.59
|
|
$
|
50.96
|
|
$
|
56.30
|
|
$
|
56.30
|
|
||||
|
Low
|
$
|
36.05
|
|
$
|
41.19
|
|
$
|
44.10
|
|
$
|
42.02
|
|
$
|
36.05
|
|
||||
97
|
Quarter Ended
|
|
||||||||||||||||||
|
(in millions, except per share data)
|
April 4,
2015 |
July 4,
2015 |
October 3,
2015 |
December 31,
2015 |
Year Ended December 31, 2015
|
||||||||||||||
|
Net sales
|
$
|
985.7
|
|
$
|
1,142.0
|
|
$
|
991.9
|
|
$
|
986.1
|
|
$
|
4,105.7
|
|
||||
|
Gross margin
(A)
|
258.8
|
|
324.4
|
|
281.7
|
|
249.7
|
|
1,114.6
|
|
|||||||||
|
Pension settlement charge
(B)
|
—
|
|
—
|
|
—
|
|
82.3
|
|
82.3
|
|
|||||||||
|
Restructuring, integration and impairment charges
(C)
|
—
|
|
—
|
|
—
|
|
12.4
|
|
12.4
|
|
|||||||||
|
Net earnings (loss) from continuing operations
|
56.6
|
|
107.6
|
|
72.2
|
|
(9.0
|
)
|
227.4
|
|
|||||||||
|
Net earnings (loss) from discontinued operations, net of tax
(D)
|
0.4
|
|
10.2
|
|
3.7
|
|
(0.3
|
)
|
14.0
|
|
|||||||||
|
Net earnings (loss)
|
57.0
|
|
117.8
|
|
75.9
|
|
(9.3
|
)
|
241.4
|
|
|||||||||
|
Basic earnings (loss) per common share:
|
|||||||||||||||||||
|
Net earnings (loss) from continuing operations
|
$
|
0.60
|
|
$
|
1.15
|
|
$
|
0.78
|
|
$
|
(0.10
|
)
|
$
|
2.45
|
|
||||
|
Net earnings (loss) from discontinued operations
(D)
|
$
|
0.01
|
|
$
|
0.11
|
|
$
|
0.04
|
|
$
|
(0.00
|
)
|
$
|
0.15
|
|
||||
|
Net earnings (loss)
|
$
|
0.61
|
|
$
|
1.26
|
|
$
|
0.82
|
|
$
|
(0.10
|
)
|
$
|
2.60
|
|
||||
|
Diluted earnings (loss) per common share:
|
|||||||||||||||||||
|
Net earnings (loss) from continuing operations
|
$
|
0.59
|
|
$
|
1.14
|
|
$
|
0.77
|
|
$
|
(0.10
|
)
|
$
|
2.41
|
|
||||
|
Net earnings (loss) from discontinued operations
(D)
|
$
|
0.01
|
|
$
|
0.11
|
|
$
|
0.04
|
|
$
|
(0.00
|
)
|
$
|
0.15
|
|
||||
|
Net earnings (loss)
|
$
|
0.60
|
|
$
|
1.25
|
|
$
|
0.81
|
|
$
|
(0.10
|
)
|
$
|
2.56
|
|
||||
|
Dividends declared
|
$
|
0.125
|
|
$
|
0.125
|
|
$
|
0.125
|
|
$
|
0.15
|
|
$
|
0.525
|
|
||||
|
Common stock price (NYSE symbol: BC):
|
|||||||||||||||||||
|
High
|
$
|
56.63
|
|
$
|
56.03
|
|
$
|
55.76
|
|
$
|
55.65
|
|
$
|
56.63
|
|
||||
|
Low
|
$
|
50.03
|
|
$
|
49.79
|
|
$
|
46.08
|
|
$
|
47.51
|
|
$
|
46.08
|
|
||||
(A) Gross margin is defined as Net sales less Cost of sales as presented in the Consolidated Statements of Operations.
(B) Pension settlement charges are discussed in
Note 17 –
Postretirement Benefits
in the Notes to Consolidated Financial Statements.
(C) Restructuring, integration and impairment charges are discussed in
Note 3 –
Restructuring, Integration and Impairment Activities
in the Notes to Consolidated Financial Statements.
(D) Certain quarterly earnings and earnings per share numbers include gains on the disposal of the bowling products business in 2015. Refer to
Note 2 –
Discontinued Operations
in the Notes to Consolidated Financial Statements.
Note 23 –
Subsequent Events
On
February 16, 2017
, the Company's Board of Directors declared a quarterly dividend on its common stock of
$0.165
per share. The dividend will be payable March 15, 2017 to shareholders of record on February 28, 2017.
98
(in millions)
|
Allowances for
Losses on Receivables
|
Balance at
Beginning
of Year
|
Charges to Profit and Loss |
Write-offs
|
Recoveries
|
Acquisitions
|
Other
|
Balance at
End of Year
|
|||||||||||||||||||||
|
2016
|
$
|
13.8
|
|
$
|
(0.5
|
)
|
$
|
(2.3
|
)
|
$
|
0.3
|
|
$
|
1.4
|
|
$
|
0.1
|
|
$
|
12.8
|
|
|||||||
|
2015
|
16.3
|
|
3.8
|
|
(4.7
|
)
|
0.3
|
|
—
|
|
(1.9
|
)
|
13.8
|
|
||||||||||||||
|
2014
|
16.8
|
|
—
|
|
(4.8
|
)
|
0.3
|
|
—
|
|
4.0
|
|
16.3
|
|
||||||||||||||
|
Deferred Tax Asset
Valuation Allowance
|
Balance at
Beginning
of Year
|
Charges to
Profit and Loss
(A)
|
Write-offs
|
Recoveries
|
Other
(A)
|
Balance at
End of Year
|
||||||||||||||||||
|
2016
|
$
|
70.6
|
|
$
|
3.4
|
|
$
|
—
|
|
$
|
—
|
|
$
|
4.1
|
|
$
|
78.1
|
|
||||||
|
2015
|
69.0
|
|
5.3
|
|
—
|
|
—
|
|
(3.7
|
)
|
70.6
|
|
||||||||||||
|
2014
|
88.2
|
|
(7.6
|
)
|
—
|
|
—
|
|
(11.6
|
)
|
69.0
|
|
||||||||||||
(A) For the year ended December 31, 2016 and 2015, the deferred tax asset valuation allowance increased mainly as a result of additional tax losses in foreign jurisdictions. For the year ended December 31, 2014, the deferred tax asset valuation allowance decreased mainly as a result of tax loss carryforwards being utilized.
None.
99
SIGNATURES
Pursuant to the requirements of Section 13 or 15(d) of the Securities Exchange Act of 1934, the registrant has duly caused this report to be signed on its behalf by the undersigned, thereunto duly authorized.
|
|
BRUNSWICK CORPORATION
|
|
|
February 17, 2017
|
By:
|
/S/ DANIEL J. TANNER
|
|
|
|
Daniel J. Tanner
|
|
|
|
Vice President and Controller
|
Pursuant to the requirements of the Securities Exchange Act of 1934, this report has been signed below by the following persons on behalf of the registrant and in the capacities and on the date indicated.
|
February 17, 2017
|
By:
|
/S/ MARK D. SCHWABERO
|
|
|
|
Mark D. Schwabero
|
|
|
|
Chairman and Chief Executive Officer
|
|
(Principal Executive Officer)
|
||
|
February 17, 2017
|
By:
|
/s/ WILLIAM L. METZGER
|
|
|
|
William L. Metzger
|
|
|
|
Senior Vice President and Chief Financial Officer
|
|
(Principal Financial Officer)
|
||
|
February 17, 2017
|
By:
|
/s/ DANIEL J. TANNER
|
|
|
|
Daniel J. Tanner
|
|
|
|
Vice President and Controller
|
|
(Principal Accounting Officer)
|
||
This report has been signed by the following directors, constituting the remainder of the Board of Directors, by William L. Metzger, as Attorney-in-Fact.
|
Nolan D. Archibald
|
|
Nancy E. Cooper
|
|
David C. Everitt
|
|
Manuel A. Fernandez
|
|
Mark D. Schwabero
|
|
David V. Singer
|
|
Ralph C. Stayer
|
|
Jane L. Warner
|
|
J. Steven Whisler
|
|
Roger J. Wood
|
|
February 17, 2017
|
By:
|
/s/ WILLIAM L. METZGER
|
|
|
|
William L. Metzger
|
|
|
|
Attorney-in-Fact
|
100
EXHIBIT INDEX
|
Exhibit No.
|
Description
|
|
3.1
|
Restated Certificate of Incorporation of the Company, dated July 22, 1987, filed as Exhibit 19.2 to the Company's Quarterly Report on Form 10-Q for the quarter ended June 30, 1987, as filed with the Securities and Exchange Commission, and hereby incorporated by reference.
|
|
3.2
|
Certificate of Designation, Preferences and Rights of Series A Junior Participating Preferred Stock, filed as Exhibit 3.2 to the Company's Annual Report on Form 10-K for 1995 as filed with the Securities and Exchange Commission on March 23, 1995, and hereby incorporated by reference.
|
|
3.3
|
Amended By-Laws of the Company, filed as Exhibit 3.1 to the Company's Quarterly Report on Form 10-Q for the quarter ended April 2, 2016 as filed with the Securities and Exchange Commission on May 5, 2016, and hereby incorporated by reference.
|
|
4.1
|
Indenture dated as of March 15, 1987, between the Company and Continental Illinois National Bank and Trust Company of Chicago, filed as Exhibit 4.1 to the Company's Quarterly Report on Form 10-Q for the quarter ended March 31, 1987, and hereby incorporated by reference.
|
|
4.2
|
Officers' Certificate setting forth terms of the Company's $125,000,000 principal amount of 7 3/8% Debentures due September 1, 2023, filed as Exhibit 4.3 to the Company's Annual Report on Form 10-K for 1993 as filed with the Securities and Exchange Commission on March 29, 1994, and hereby incorporated by reference.
|
|
4.3
|
Form of the Company's $200,000,000 principal amount of 7 1/8% Notes due August 1, 2027, filed as Exhibit 4.1 to the Company's Current Report on Form 8-K as filed with the Securities and Exchange Commission on August 21, 1997, and hereby incorporated by reference.
|
|
4.4
|
The Company's agreement to furnish additional debt instruments upon request by the Securities and Exchange Commission, filed as Exhibit 4.10 to the Company's Annual Report on Form 10-K for 1980, and hereby incorporated by reference.
|
|
4.5
|
Indenture, dated as of May 13, 2013, between the Company, the subsidiary guarantors party thereto and U.S. Bank National Association, as trustee as filed as Exhibit 4.1 to the Company's Current Report on Form 8-K as filed with the Securities and Exchange Commission on May 13, 2013 and hereby incorporated by reference.
|
|
4.6
|
Form of the Company's 4.625% Senior notes due 2021, filed as Exhibit 4.2 (included in Exhibit 4.1) to the Company's Current Report on Form 8-K as filed with the Securities and Exchange Commission on May 13, 2013 and hereby incorporated by reference.
|
|
4.7
|
First Supplemental Indenture, dated May 22, 2014, to the Indenture between the Company, the subsidiary guarantors party thereto and U.S. Bank National Association, as trustee dated May 13, 2013, filed as Exhibit 4.1 to the Company's Quarterly Report on Form 10-Q for the quarter ended June 28, 2014, as filed with the Securities and Exchange Commission on July 31, 2014 and hereby incorporated by reference.
|
|
10.1
|
Amended and Restated Credit Agreement dated as of March 21, 2011, as Amended and Restated as of June 26, 2014, as further amended and restated as of June 30, 2016, among Brunswick Corporation, the subsidiary borrowers party thereto, the guarantors party thereto, the lenders party thereto and JPMorgan Chase Bank, N.A., as administrative agent, J.P. Morgan Chase Bank, N.A., Merill Lynch, Pierce, Fenner & Smith Incorporated and Wells Fargo Securities, LLC, as joint lead arrangers and joint bookrunners, Bank of America, N.A. and Wells Fargo Bank, N.A., as syndication agents, and SunTrust Bank, U.S. Bank National Association and Citizens Bank N.A., as documentation agents, filed as Exhibit 10.1 to the Company’s Quarterly Report on Form 10-Q for the quarter ended June 2, 2016, as filed with the Securities and Exchange Commission on August 3, 2016 and hereby incorporated by reference.
|
|
10.2*
|
Form of Officer Terms and Conditions of Employment, reflecting amendments through January 1, 2014.
|
|
10.3*
|
Brunswick Corporation Supplemental Pension Plan as amended and restated effective February 3, 2009, filed as Exhibit 10.8 to the Company's Annual Report on Form 10-K for 2008 as filed with the Securities and Exchange Commission on February 24, 2009, and hereby incorporated by reference.
|
|
10.4*
|
Form of Non-Employee Director Indemnification Agreement, filed as Exhibit 10.5 to the Company's Annual Report on Form 10-K for 2006 as filed with the Securities and Exchange Commission on February 23, 2007, and hereby incorporated by reference.
|
|
10.5*
|
Brunswick Corporation 2003 Stock Incentive Plan, as amended and restated, filed as Exhibit 10.2 to the Company's Quarterly Report on Form 10-Q for the quarter ended April 3, 2010, as filed with the Securities and Exchange Commission on May 7, 2010, and hereby incorporated by reference.
|
101
|
10.6*
|
1997 Stock Plan for Non-Employee Directors, filed as Exhibit 10.3 to the Company's Quarterly Report on Form 10-Q for the quarter ended September 30, 1998, as filed with the Securities and Exchange Commission on November 13, 1998, and hereby incorporated by reference.
|
|
10.7*
|
Brunswick Corporation 2005 Elective Deferred Compensation Plan as amended and restated effective January 1, 2013, filed as Exhibit 10.2 to the Company's Quarterly Report on Form 10-Q for the quarter ended June 30, 2012, as filed with the Securities and Exchange Commission on August 3, 2012, and hereby incorporated by reference.
|
|
10.8*
|
Brunswick Corporation 2005 Automatic Deferred Compensation Plan as amended and restated effective January 1, 2014, filed as Exhibit 10.8 to the Company's Annual Report on Form 10-K for 2014 as filed with the Securities and Exchange Commission on February 20, 2015 and hereby incorporated by reference.
|
|
10.9*
|
Brunswick Restoration Plan, as amended and restated effective January 1, 2013, filed as Exhibit 10.1 to the Company's Quarterly Report on Form 10-Q for the quarter ended June 30, 2012, as filed with the Securities and Exchange Commission on August 3, 2012, and hereby incorporated by reference.
|
|
10.10*
|
Brunswick Corporation Senior Management Incentive Plan, filed as Exhibit 10.9 to the Company's Quarterly Report on Form 10-Q for the quarter ended March 30, 2013, as filed with the Securities and Exchange Commission on May 1, 2013, and hereby incorporated by reference.
|
|
10.11*
|
2014 Performance Share Grant Terms and Conditions Pursuant to the Brunswick Corporation 2003 Stock Incentive Plan, filed as Exhibit 10.4 to the Company's Quarterly Report on Form 10-Q for the quarter ended March 29, 2014, as filed with the Securities and Exchange Commission on April 30, 2014, and hereby incorporated by reference.
|
|
10.12*
|
2014 Performance Share Grant Terms and Conditions Pursuant to the Brunswick Corporation 2003 Stock Incentive Plan - TSR Participants, filed as Exhibit 10.5 to the Company's Quarterly Report on Form 10-Q for the quarter ended March 29, 2014, as filed with the Securities and Exchange Commission on April 30, 2014, and hereby incorporated by reference.
|
|
10.13*
|
2014 Cash-Settled Restricted Stock Unit Grant Terms and Conditions Pursuant to the Brunswick Corporation 2003 Stock Incentive Plan, filed as Exhibit 10.7 to the Company's Quarterly Report on Form 10-Q for the quarter ended March 29, 2014, as filed with the Securities and Exchange Commission on April 30, 2014, and hereby incorporated by reference.
|
|
10.14*
|
2014 Stock-Settled Restricted Stock Unit Grant Terms and Conditions Pursuant to the Brunswick Corporation 2003 Stock Incentive Plan, filed as Exhibit 10.8 to the Company's Quarterly Report on Form 10-Q for the quarter ended March 29, 2014, as filed with the Securities and Exchange Commission on April 30, 2014, and hereby incorporated by reference.
|
|
10.15*
|
Brunswick Corporation 2014 Stock Incentive Plan, filed as Exhibit 10.1 to the Company's Quarterly Report on Form 10-Q for the quarter ended June 28, 2014, as filed with the Securities and Exchange Commission on July 31, 2014 and hereby incorporated by reference.
|
|
10.16*
|
2015 Stock-Settled Restricted Stock Unit Grant Terms and Conditions Pursuant to the Brunswick Corporation 2014 Stock Incentive Plan, filed as Exhibit 10.4 to the Company's Quarterly Report on Form 10-Q for the quarter ended April 4, 2015, as filed with the Securities and Exchange Commission on May 7, 2015, and hereby incorporated by reference.
|
|
10.17*
|
2015 Cash-Settled Restricted Stock Unit Grant Terms and Conditions Pursuant to the Brunswick Corporation 2014 Stock Incentive Plan, filed as Exhibit 10.5 to the Company's Quarterly Report on Form 10-Q for the quarter ended April 4, 2015, as filed with the Securities and Exchange Commission on May 7, 2015, and hereby incorporated by reference.
|
|
10.18*
|
2015 Performance Share Grant Terms and Conditions Pursuant to the Brunswick Corporation 2014 Stock Incentive Plan, filed as Exhibit 10.7 to the Company's Quarterly Report on Form 10-Q for the quarter ended April 4, 2015, as filed with the Securities and Exchange Commission on May 7, 2015, and hereby incorporated by reference.
|
|
10.19*
|
2015 Performance Share Grant Terms and Conditions Pursuant to the Brunswick Corporation 2014 Stock Incentive Plan - TSR Participants, filed as Exhibit 10.8 to the Company's Quarterly Report on Form 10-Q for the quarter ended April 4, 2015, as filed with the Securities and Exchange Commission on May 7, 2015, and hereby incorporated by reference.
|
|
10.20*
|
2016 Brunswick Performance Plan, filed as Exhibit 10.1 to the Company's Quarterly Report on Form 10-Q for the quarter ended April 2, 2016, as filed with the Securities and Exchange Commission on May 5, 2016, and hereby incorporated by reference.
|
|
10.21*
|
2016 Brunswick Performance Plan - Senior Management Incentive Plan Participants, filed as Exhibit 10.2 to the Company's Quarterly Report on Form 10-Q for the quarter ended April 2, 2016, as filed with the Securities and Exchange Commission on May 5, 2016, and hereby incorporated by reference.
|
102
|
10.22*
|
2016 Brunswick Performance Plan - Performance Share Plan Participants, filed as Exhibit 10.3 to the Company's Quarterly Report on Form 10-Q for the quarter ended April 2, 2016, as filed with the Securities and Exchange Commission on May 5, 2016, and hereby incorporated by reference.
|
|
10.23*
|
Terms and Conditions of Employment agreement for Mark D. Schwabero, effective February 11, 2016, filed as Exhibit 10.1 to the Company's Current Report on Form 8-K, as filed with the Securities and Exchange Commission on February 12, 2016, and hereby incorporated by reference.
|
|
10.24*
|
2016 Stock-Settled Restricted Stock Unit Grant Terms and Conditions Pursuant to the Brunswick Corporation 2014 Stock Incentive Plan, filed as Exhibit 10.4 to the Company's Quarterly Report on Form 10-Q for the quarter ended April 2, 2016, as filed with the Securities and Exchange Commission on May 5, 2016, and hereby incorporated by reference.
|
|
10.25*
|
2016 Cash-Settled Restricted Stock Unit Grant Terms and Conditions Pursuant to the Brunswick Corporation 2014 Stock Incentive Plan, filed as Exhibit 10.5 to the Company's Quarterly Report on Form 10-Q for the quarter ended April 2, 2016, as filed with the Securities and Exchange Commission on May 5, 2016, and hereby incorporated by reference.
|
|
10.26*
|
2016 Stock-Settled Stock Appreciation Right Grant Terms and Conditions Pursuant to the Brunswick Corporation 2014 Stock Incentive Plan, filed as Exhibit 10.6 to the Company's Quarterly Report of Form 10-Q for the quarter ended April 2, 2016, as filed with the Securities and Exchange Commission on May 5, 2016, and hereby incorporated by reference.
|
|
10.27*
|
2016 Performance Share Grant Terms and Conditions Pursuant to the Brunswick Corporation 2014 Stock Incentive Plan, filed as Exhibit 10.7 to the Company's Quarterly Report on Form 10-Q for the quarter ended April 2, 2016, as filed with the Securities and Exchange Commission on May 5, 2016, and hereby incorporated by reference.
|
|
10.28*
|
2016 Performance Share Grant Terms and Conditions Pursuant to the Brunswick Corporation 2014 Stock Incentive Plan - TSR Participants, filed as Exhibit 10.8 to the Company's Quarterly Report on Form 10-Q for the quarter ended April 2, 2016, as filed with the Securities and Exchange Commission on May 5, 2016, and hereby incorporated by reference.
|
|
12.1
|
Statement regarding computation of ratios.
|
|
21.1
|
Subsidiaries of the Company.
|
|
23.1
|
Consent of Independent Registered Public Accounting Firm.
|
|
24.1
|
Power of Attorney.
|
|
31.1
|
Certification of Chief Executive Officer Pursuant to Section 302 of the Sarbanes-Oxley Act of 2002.
|
|
31.2
|
Certification of Chief Financial Officer Pursuant to Section 302 of the Sarbanes-Oxley Act of 2002.
|
|
32.1
|
Certification of Chief Executive Officer Pursuant to Section 906 of the Sarbanes-Oxley Act of 2002.
|
|
32.2
|
Certification of Chief Financial Officer Pursuant to Section 906 of the Sarbanes-Oxley Act of 2002.
|
|
101.INS
|
XBRL Instance Document
|
|
101.SCH
|
XBRL Taxonomy Extension Schema Document
|
|
101.CAL
|
XBRL Taxonomy Extension Calculation Linkbase Document
|
|
101.DEF
|
XBRL Taxonomy Extension Definition Linkbase Document
|
|
101.LAB
|
XBRL Taxonomy Extension Label Linkbase Document
|
|
101.PRE
|
XBRL Taxonomy Extension Presentation Linkbase Document
|
* Management contract or compensatory plan or arrangement.
103
TABLE OF CONTENTS
Part IItem 1. BusinessItem 1A. Risk FactorsItem 1B. Unresolved Staff CommentsItem 2. PropertiesItem 3. Legal ProceedingsItem 4. Mine Safety DisclosuresPart IIItem 5. Market For Registrant's Common Equity, Related Stockholder Matters and Issuer Purchases Of Equity SecuritiesItem 6. Selected Financial DataItem 7. Management's Discussion and Analysis Of Financial Condition and Results Of OperationsItem 7A. Quantitative and Qualitative Disclosures About Market RiskItem 8. Financial Statements and Supplementary DataItem 9. Changes in and Disagreements with Accountants on Accounting and Financial DisclosureItem 9A. Controls and ProceduresItem 9B. Other InformationPart IIIItem 10. Directors, Executive Officers and Corporate GovernanceItem 11. Executive CompensationItem 12. Security Ownership Of Certain Beneficial Owners and Management and Related Stockholder MattersItem 13. Certain Relationships and Related Transactions, and Director IndependenceItem 14. Principal Accounting Fees and ServicesPart IVItem 15. Exhibits and Financial Statement SchedulesNote 1 Significant Accounting PoliciesNote 2 Discontinued OperationsNote 3 Restructuring, Integration and Impairment ActivitiesNote 4 AcquisitionsNote 5 Earnings Per Common ShareNote 6 Segment InformationNote 7 Fair Value MeasurementsNote 8 Financing ReceivablesNote 9 InvestmentsNote 10 Financial ServicesNote 11 Goodwill and Other IntangiblesNote 12 Income TaxesNote 13 Commitments and ContingenciesNote 14 Financial InstrumentsNote 15 Accrued ExpensesNote 16 DebtNote 17 Postretirement BenefitsNote 18 Stock Plans and Management CompensationNote 19 Comprehensive IncomeNote 20 Treasury and Preferred StockNote 21 LeasesNote 22 Quarterly Data (unaudited)Note 23 Subsequent EventsItem 16. Form 10-k Summary