BRUNSWICK CORP
10-Ks and 10-Qs
|
|
|
|
|
|
|
|
|
|
|
|
|
|
|
|
|
|
|
|
|
|
|
|
|
|
|
|
|
|
|
|
|
|
|
|
|
|
|
|
|
|
|
|
|
|
|
|
|
|
|
|
|
|
|
|
UNITED STATES
SECURITIES AND EXCHANGE COMMISSION
Washington, D.C. 20549
FORM 10-K
|
x
|
ANNUAL REPORT PURSUANT TO SECTION 13 OR 15(d) OF THE SECURITIES EXCHANGE ACT OF 1934
|
For the fiscal year ended
December 31, 2018
or
|
o
|
TRANSITION REPORT PURSUANT TO SECTION 13 OR 15(d) OF THE SECURITIES EXCHANGE ACT OF 1934
|
Commission file number 1-1043
____________

Brunswick Corporation
(Exact name of registrant as specified in its charter)
|
Delaware
|
|
36-0848180
|
|
(State or other jurisdiction of incorporation or organization)
|
|
(I.R.S. Employer Identification No.)
|
26125 N. Riverwoods Boulevard, Mettawa, Illinois 60045-3420
(Address of principal executive offices, including zip code)
(847) 735-4700
(Registrant’s telephone number, including area code)
Securities registered pursuant to Section 12(b) of the Act:
Title of each class
Name of each exchange on which registered
Common Stock ($0.75 par value)
New York Stock Exchange, Chicago Stock Exchange
Securities registered pursuant to Section 12(g) of the Act:
None
Indicate by check mark if the registrant is a well-known seasoned issuer, as defined in Rule 405 of the Securities Act. Yes
x
No
o
Indicate by check mark if the registrant is not required to file reports pursuant to Section 13 or Section 15(d) of the Act. Yes
o
No
x
Indicate by check mark whether the registrant (1) has filed all reports required to be filed by Section 13 or 15(d) of the Securities Exchange Act of 1934 during the preceding 12 months (or for such shorter period that the registrant was required to file such reports), and (2) has been subject to such filing requirements for the past 90 days. Yes
x
No
o
Indicate by check mark whether the registrant has submitted electronically every Interactive Data File required to be submitted pursuant to Rule 405 of Regulation S-T (§232.405 of this chapter) during the preceding 12 months (or for such shorter period that the registrant was required to submit such files). Yes
x
No
o
Indicate by check mark if disclosure of delinquent filers pursuant to Item 405 of Regulation S-K (Section 229.405) is not contained herein, and will not be contained, to the best of registrant's knowledge, in the definitive proxy or information statements incorporated by reference in Part III of this Form 10-K or any amendment to this Form 10-K.
x
Indicate by check mark whether the registrant is a large accelerated filer, an accelerated filer, a non-accelerated filer, a smaller reporting company, or an emerging growth company. See the definitions of “large accelerated filer,” “accelerated filer,” “smaller reporting company” and "emerging growth company" in Rule 12b-2 of the Exchange Act. (Check one):
If an emerging growth company, indicate by check mark if the registrant has elected not to use the extended transition period for complying with any new or revised financial accounting standards provided pursuant to Section 13(a) of the Exchange Act.
o
|
Large accelerated filer
|
x
|
Accelerated filer
|
o
|
|
Non-accelerated filer
|
o
|
Smaller reporting company
|
o
|
|
Emerging growth company
|
o
|
||
Indicate by check mark whether the registrant is a shell company (as defined in Rule 12b-2 of the Exchange Act). Yes
o
No
x
As of
June 29, 2018
, the last business day of the registrant’s most recently completed second fiscal quarter, the aggregate market value of the voting stock of the registrant held by non-affiliates was
$5,551,034,582
. Such number excludes stock beneficially owned by officers and directors. This does not constitute an admission that they are affiliates.
The number of shares of Common Stock ($0.75 par value) of the registrant outstanding as of
February 15, 2019
was
87,028,425
.
DOCUMENTS INCORPORATED BY REFERENCE
Part III of this Report on Form 10-K incorporates by reference certain information that will be set forth in the Company's definitive Proxy Statement for the Annual Meeting of Shareholders scheduled to be held on
May 8, 2019
.
BRUNSWICK CORPORATION
INDEX TO ANNUAL REPORT ON FORM 10-K
December 31, 2018
TABLE OF CONTENTS
|
PART I
|
Page
|
|
|
PART II
|
||
|
PART III
|
||
|
PART IV
|
||
PART I
Item 1. Business
Brunswick Corporation is a Delaware corporation incorporated on December 31, 1907. We are a leading global designer, manufacturer, and marketer of recreation products including marine engines, boats, fitness equipment, and active recreation products. Our engine-related products include: outboard, sterndrive, and inboard engines; trolling motors; propellers; engine control systems; electrical components and integrated systems; and marine parts and accessories. The boats we make include fiberglass sport boats, cruisers, sport fishing and center-console, offshore fishing, aluminum and fiberglass fishing, pontoon, utility, deck, inflatable, and heavy-gauge aluminum boats. Our fitness products include cardiovascular and strength training equipment for both the commercial and consumer markets. We also sell products for active aging and rehabilitation, a complete line of billiards tables, and other game room tables and accessories.
In 2018, we continued to successfully execute our growth strategy, acquiring new parts and accessories brands and investing in innovative products, productivity, and efficiency initiatives. We expect to continue our focus on growth in the combined marine business in 2019. With respect to the Fitness segment, our focus remains firmly on completing the separation of this business from the portfolio in a timely fashion, and in a manner that maximizes value to our shareholders. The spin-off process remains on plan, and we continue to evaluate other options, including a sale of the business. In 2019, our marine business will emphasize continued product leadership, targeted acquisitions, and other growth-related investments. In the longer term, our strategy remains consistent: to design, develop, and introduce high-quality products featuring innovative technology and styling; to distribute products through a model that benefits our partners - dealers and distributors; to provide world-class service to our customers; to develop and maintain low-cost manufacturing processes, and to continually improve productivity and efficiency; to manufacture and distribute products globally with local and regional styling; to continue implementing our capital strategy, which includes allocating capital to organic growth initiatives and strategic acquisition opportunities, managing debt levels and maturities, maintaining strong cash and liquidity positions, funding pension obligations, and continuing to return capital to shareholders through dividends and share repurchases; and to attract and retain skilled employees. These strategic objectives support our plans to grow by expanding our existing businesses. Our primary objective is to enhance shareholder value by achieving returns on investments that exceed our cost of capital.
Refer to
Note 7 –
Segment Information
and
Note 3 –
Discontinued Operations
in the Notes to Consolidated Financial Statements for additional information regarding our segments and discontinued operations, including net sales, operating earnings, and total assets by segment.
Marine Engine Segment
The Marine Engine segment, which had net sales of $2,993.6 million in
2018
, consists of the Mercury Marine Group (Mercury Marine). We believe our Marine Engine segment is a world leader in the manufacturing and sale of recreational marine engines and marine parts and accessories.
Mercury Marine manufactures and markets a full range of outboard, sterndrive, and inboard engine and propulsion systems under, among other brand names, Mercury, Mercury MerCruiser, Mercury Racing, and MotorGuide brands. In addition, Mercury Marine manufactures and markets parts and accessories under the Ancor, Attwood, BEP, Besto, BLA, Blue Sea Systems, CZone, FulTyme RV, Garelick, Lenco Marine, Marinco, Mastervolt, Mercury, Mercury Precision Parts, MotorGuide, Park Power, Progressive Industries, ProMariner, Quicksilver, and Seachoice brand names, including marine electronics and control integration systems, steering systems, instruments, controls, propellers, trolling motors, fuel systems, electrical systems, service parts, and lubricants, as well as specialty vehicle, mobile, and transportation aftermarket products. Mercury Marine supplies integrated propulsion systems to the worldwide recreational and commercial marine markets. To promote advanced propulsion systems with improved handling, performance, and efficiency, Mercury Marine also manufactures and markets advanced boat steering and engine control systems.
Mercury Marine's outboard, sterndrive, and inboard engines are sold to independent boat builders, local, state, and foreign governments, and to Brunswick's Boat segment. In addition, Mercury Marine sells outboard engines through a global network of more than 6,000 marine dealers and distributors, specialty marine retailers, and marine service centers. White River Marine Group, LLC and its subsidiaries (including Tracker and Ranger Boats) is Mercury Marine’s most significant external customer.
Mercury Marine manufactures four-stroke outboard engine models ranging from 2.5 to 400 horsepower. These low-emission engines are in compliance with applicable U.S. Environmental Protection Agency (EPA) requirements. Mercury Marine's four-stroke outboard engines include Verado, a collection of outboards ranging from 250 to 400 horsepower, and Mercury Marine's naturally aspirated four-stroke outboards, ranging from 2.5 to 300 horsepower. Mercury Marine and Mercury Racing manufacture
1
inboard and sterndrive engine models ranging from 115 to 1,750 horsepower. Mercury Marine also manufactures two-stroke, non-DFI engines for certain markets outside the United States. In addition, most of Mercury Marine's sterndrive and inboard engines are now available with catalyst exhaust treatment and monitoring systems, and all are compliant with applicable U.S. state and federal environmental regulations. Mercury Marine also makes engines that comply with global emissions and noise regulations.
Mercury Marine continues to develop innovative products, including its all-new V8 FourStroke outboard family of engines, winning the 2018 Most Innovative Product at the New Zealand Boat Show, and a 2018 Innovation Award from the National Marine Manufacturers Association for the 3.4L V6 FourStroke outboard engines. Mercury Marine was awarded an IBEX Innovation Award in 2018 for its tiller handle assembly for portable outboard motors. 2018 also saw Mercury Marine open a state-of-the-art NVH (Noise, Vibration, Harshness) Technical Center at its global headquarters in Fond du Lac, Wisconsin.
Mercury Marine produces its gasoline sterndrive and outboard engines domestically in Fond du Lac, Wisconsin, with outboard engines also produced internationally in China and Japan. Mercury Marine manufactures 40, 50 and 60 horsepower four-stroke outboard engines in a facility in China, and produces smaller outboard engines in Japan pursuant to a joint venture with its partner, Tohatsu Corporation. Mercury Marine sources engine components from a global supply base and manufactures additional engine component parts at its Fond du Lac facility and plants in Florida and Mexico. Mercury Marine also operates a remanufacturing business for engines and service parts in Wisconsin.
For the eighth consecutive year, the Wisconsin Sustainable Business Council awarded Mercury Marine a “Green Masters” designation, a program measuring a broad range of sustainability issues including energy and water conservation, waste management, community outreach, and education. The designation highlights Mercury Marine's commitment to sustainability as discussed in its 2018 Sustainability Report, detailing specific goals related to energy, environment, products, and people, all of which goals Mercury Marine has met or exceeded. In addition, Mercury Marine won Sustainable Product of the Year from the Wisconsin Sustainable Business Council for its Active Trim technology and was presented a Wisconsin Business Friend of the Environment Award in 2018.
Mercury Marine's Parts and Accessories Group distribution businesses include: Land 'N' Sea, Kellogg Marine Supply, Lankhorst Taselaar, BLA, Payne's Marine Group, and Del City. Parts and Accessories manufacturing businesses include Attwood, Garelick Mfg. Co.,Whale, Ancor, BEP, Blue Sea Systems, CZone, Lenco Marine, Marinco, Mastervolt, Park Power, Progressive Industries, and ProMariner. These businesses are leading manufacturers and distributors of marine parts and accessories throughout North America, Europe, and Asia-Pacific, offering same-day or next-day delivery service to a broad array of marine service facilities.
On August 9, 2018, Brunswick acquired
100 percent
of the Global Marine & Mobile business of Power Products Holdings, LLC (Power Products), including the global marine, specialty vehicle, mobile, industrial power, and transportation aftermarket products businesses of Power Products, for $910 million in cash from San Francisco-based private equity firm Genstar Capital. The acquisition added a broad, complementary product portfolio of 11 new brands to Mercury Marine's parts and accessories business.
Intercompany sales to Brunswick's Boat segment represented approximately 11 percent of Mercury Marine's sales in
2018
. Domestic demand for the Marine Engine segment's products is seasonal, with sales generally highest in the second calendar quarter of the year.
Boat Segment
The Boat segment consists of the Brunswick Boat Group (Boat Group), which manufactures and markets the following types of boats: fiberglass sport boats, cruisers, sport fishing and center-console, offshore fishing, aluminum and fiberglass fishing, pontoon, utility, deck, inflatable, and heavy-gauge aluminum. We believe that the Boat Group, which had net sales of $1,471.3 million during
2018
, is a world leader in the manufacturing and sale of pleasure motorboats.
The Boat Group manages Brunswick's boat brands; evaluates and optimizes the Boat segment's boat portfolio; promotes recreational boating services and activities to enhance the consumer experience and dealer profitability; and speeds the introduction of new technologies into boat manufacturing and design processes, including through its Business Acceleration initiatives.
The Boat Group includes the following boat brands: Sea Ray sport boats and cruisers; Bayliner sport cruisers, runabouts, and Heyday wake boats; Boston Whaler fiberglass offshore boats; Lund fiberglass fishing boats; Crestliner, Cypress Cay, Harris, Lowe, Lund, and Princecraft aluminum fishing, utility, pontoon boats, and deck boats; and Thunder Jet heavy-gauge aluminum boats. The Boat Group procures most of its outboard engines, gasoline sterndrive engines, and gasoline inboard engines from Brunswick's Marine Engine segment.
2
The Boat Group also includes Brunswick boat brands based in Europe and Asia-Pacific, which include Quicksilver, Uttern, and Rayglass (including Protector and Legend), that are typically equipped with Mercury Marine engines and often include other parts and accessories supplied by Mercury Marine.
The Boat Group operates manufacturing facilities in Florida, Indiana, Minnesota, Missouri, Washington, Canada, Mexico, New Zealand, and Portugal, and owns an inactive manufacturing facility in North Carolina. The Boat Group also utilizes two contract manufacturing facilities in Poland.
The Boat Group sells its products through a global network of nearly 1,300 dealers and distributors, with some dealers operating in more than one location and some dealers carrying more than one of our boat brands. Sales to the Boat Group's largest dealer, MarineMax, Inc., which has multiple locations and carries a number of the Boat Group's product lines, represented approximately 24 percent of Boat Group sales in
2018
. Domestic demand for pleasure boats is seasonal, with sales generally highest in the second calendar quarter of the year.
Fitness Segment
Our Fitness segment is comprised of the Fitness division (Fitness), which designs, manufactures, and distributes a broad portfolio of reliable, high-quality cardiovascular fitness equipment (including treadmills, total body cross-trainers, stair climbers, and stationary exercise bicycles) and strength-training equipment under the Life Fitness, Hammer Strength, Cybex, Indoor Cycling Group, and SCIFIT brands. The Fitness segment also includes an active recreation business, including billiards tables, accessories, and game room furniture.
We believe that our Fitness segment, which had net sales of $1,038.3 million during
2018
, is one of the world's largest manufacturers of commercial fitness equipment and a leading manufacturer of high-quality consumer fitness equipment. Fitness' commercial customers include health clubs, hospitality locations, multi-unit housing, corporations, schools and universities, military and governmental agencies, retirement and assisted living facilities, professional and collegiate sports teams, and community centers. Planet Fitness Inc. is the segment's most significant customer. Fitness makes commercial sales through its direct sales force, domestic dealers, and international distributors. Consumer products are available at specialty retailers, select mass merchants, sporting goods stores, through international distributors, and on the Life Fitness website. Further details about the Fitness business can be found in Amendment No. 1 to the Registration Statement on Form 10, File No. 001-38741, filed on February 8, 2019 by Life Fitness Holdings, Inc. However, we are not incorporating the Form 10 by reference into this Annual Report on Form 10-K.
The billiards business was established in 1845 and is Brunswick's heritage business. The billiards business designs and markets billiards tables, table tennis tables, and Air Hockey tables, as well as game room furniture and related accessories, under the Brunswick and Contender brands.
The Fitness segment's principal manufacturing facilities are located in Illinois, Kentucky, Minnesota, Oklahoma, Wisconsin, and Hungary, with principal third party contract manufacturing partners in China, Mexico, Taiwan, and Indonesia. Fitness distributes its products worldwide from regional warehouses and production facilities. Demand for Fitness products is seasonal, with sales generally highest in the fourth quarter of the year.
Discontinued Operations
In December 2017, the Board of Directors authorized the Company to exit its Sea Ray business, including the Meridian brand, as a result of, among other things, a material change in strategic direction and a review of the expected future cash flows, market conditions and business trends. The Company engaged in a thorough sales process and ultimately determined that the offers received did not reflect an appropriate value for the brand. As a result, in June 2018, the Board of Directors authorized the Company to end the sale process for its Sea Ray business. As part of this action, the Company decided to restructure the businesses, including discontinuing Sea Ray Sport Yacht and Yacht models and winding down yacht production, while reinventing Sea Ray Sport Boat and Sport Cruiser operations. The winding down of Sea Ray Sport Yacht and Yacht operations was largely completed in 2018. The assets and liabilities of the Sea Ray business, which were reported as held for sale in the 2017 Form 10-K, have been reclassified to assets and liabilities in the Consolidated Balance Sheets for all periods presented. Additionally, the results of these businesses are no longer presented as discontinued operations in the Consolidated Statements of Cash Flows, the Consolidated Statements of Operations and the Notes to Consolidated Financial Statements in any period presented.
In the fourth quarter of 2018, the Company made adjustments to certain liabilities that were retained as part of the sale of the retail bowling business in 2014 and the bowling products business in 2015. The Company does not have continuing involvement or cash flows associated with these businesses, which were previously reported as discontinued operations in the Consolidated
3
Statements of Operations for the years ended December 31, 2016, 2015 and 2014. As a result of these adjustments, the Company recognized $2.2 million of after-tax earnings as discontinued operations in the Consolidated Statements of Operations for the year ended December 31, 2018.
Refer to
Note 3 –
Discontinued Operations
in the Notes to Consolidated Financial Statements for additional information regarding discontinued operations.
Boating Services Network and Business Acceleration
Boating Services Network is our leading dealer finance and operations service that includes floor planning from Brunswick Acceptance Corporation (USA) and Brunswick Commercial Finance (Canada), retail finance from Blue Water Finance and Mercury Repower Finance, retail extended product protection from Passport and Passport Premier, private label limited warranties for leading boat and engine manufacturers, retail insurance from Boater's Choice Insurance, and close to 50 name brand marine dealer service providers from Brunswick Dealer Advantage.
In 2018, Boating Services Network launched OnBoard Boating Cluband Rentals, a state-of-the-art, turnkey business platform empowering marine dealers and marinas to expand their operations and serve the emerging and rapidly growing boat club and rental consumer market segments. The suite of boats, tools, and services available through OnBoard enables club and rental operators to provide club members and rental customers an exceptional boating experience with a diverse fleet of newer boats, an easy-to-use online reservation system, incentives for members to become boat owners as they become captivated by the boating lifestyle, and many more benefits over time. We also launched NAUTIC-ON, a smart technology and service system that helps boaters stay connected with their boats remotely, monitoring engine status, battery and bilge pump, and providing other advanced features, in 2018.
We provide financial services through Brunswick Product Protection Corporation, which provides marine dealers the opportunity to offer extended product warranties to retail customers, and through Blue Water Dealer Services, Inc., which provides retail financial services to marine dealers. Each company allows us to offer a more complete line of financial services to our boat and marine engine dealers and their customers.
Financing Joint Venture
Through our Brunswick Financial Services Corporation subsidiary, we own a 49 percent interest in a joint venture, Brunswick Acceptance Company, LLC (BAC). Under the terms of the joint venture agreement, BAC provides secured wholesale inventory floorplan financing to our boat and engine dealers. A subsidiary of Wells Fargo & Company owns the remaining 51 percent.
In February 2018, the parties entered into an amended and restated joint venture agreement (JV Agreement) to extend the term of their financial services through December 31, 2022. The JV Agreement contains a financial covenant that conforms to the maximum leverage ratio test in the Credit Facility described in
Note 17 –
Debt
in the Notes to Consolidated Financial Statements.
The joint venture agreement contains provisions allowing for the renewal of the agreement or the purchase of the other party’s interest in the joint venture at the end of its term. Alternatively, either partner may terminate the agreement at the end of its term.
Refer to
Note 11 –
Financing Joint Venture
in the Notes to Consolidated Financial Statements for more information about our financial services.
Distribution
We utilize independent distributors, dealers, and retailers (Dealers) for the majority of our boat sales and significant portions of our sales of marine engine, fitness, and billiards products. We have over 16,000 Dealers serving our business segments worldwide. Our marine Dealers typically carry one or more of the following product categories: boats, engines, and related parts and accessories.
We own Land 'N' Sea, Kellogg Marine Supply, Payne's Marine Group, and Del City, which comprise the primary parts and accessories distribution platforms for our Marine Engine segment in North America. We believe that these businesses, collectively, are the leading distributors of marine parts and accessories throughout North America, with 21 distribution warehouses located throughout the United States and Canada offering same-day or next-day delivery service to a broad array of marine service facilities and Dealers. We also believe we are a leading parts and accessories distributor in the Asia-Pacific region.
Our Dealers are independent companies or proprietors that range in size from small, family-owned businesses to a large, publicly-traded corporation with substantial revenues and multiple locations. Some Dealers sell our products exclusively, while a majority also carry competitor and complementary products. We partner with our boat dealer network to improve quality, service,
4
distribution, and delivery of parts and accessories to enhance the boating customer's experience.
Demand for a significant portion of our products is seasonal, and a number of our Dealers are relatively small and/or highly-leveraged. As a result, many Dealers secure floor plan financing from BAC or other third party finance companies, enabling them to provide stable channels for our products. In addition to the financing BAC offers, we may also provide our Dealers with incentive programs, loan guarantees, inventory repurchase commitments, and financing receivable arrangements, under which we are obligated to repurchase inventory or receivables from a finance company in the event of a Dealer's default. We believe that these arrangements are in our best interest; however, these arrangements expose us to credit and business risk. Our business units, along with BAC, maintain active credit operations to manage this financial exposure, and we continually seek opportunities to sustain and improve the financial health of our various distribution channel partners. Refer to
Note 9 –
Financing Receivables
and
Note 14 –
Commitments and Contingencies
in the Notes to Consolidated Financial Statements for further discussion of these arrangements.
Technology and Innovation
Upon the completion of the separation of our Fitness business, Brunswick will transition into a company concentrated on leading the global marine industry with a sharpened focus and clear vision, consistently innovating the future of recreational boating. To support this goal, we have established a strong foundation of cross functional and cross business investments and initiatives to further improve customer interaction with our products, including NAUTIC-ON and OnBoard Boating Club and Rentals. We continue to partner with TechNexus Holdings, LLC to identify and incubate innovative start-up ventures with strategic marine applications to help drive long-term growth.
For its part, Fitness continues to develop digital solutions focused on providing innovative solutions to meet the needs of fitness facilities and exercisers. In addition, Fitness is collaborating with a number of technology companies to accelerate the development of its technology portfolio to satisfy growing demand for digital fitness and connectivity solutions. For further details about Fitness, see Amendment No. 1 to the Registration Statement on Form 10, File No. 001-38741, filed on February 8, 2019 by Life Fitness Holdings, Inc.
International Operations
Non-U.S. sales are set forth in
Note 7 –
Segment Information
and
Note 2 –
Revenue Recognition
in the Notes to Consolidated Financial Statements and are also included in the table below, which details our non-U.S. sales by region:
|
(in millions)
|
2018
|
2017
|
2016
|
||||||||
|
Europe
|
$
|
696.2
|
|
$
|
610.1
|
|
$
|
569.2
|
|
||
|
Asia-Pacific
|
437.0
|
|
407.9
|
|
363.1
|
|
|||||
|
Canada
|
317.3
|
|
320.3
|
|
284.6
|
|
|||||
|
Rest-of-World
|
256.8
|
|
265.8
|
|
240.1
|
|
|||||
|
Total
|
$
|
1,707.3
|
|
$
|
1,604.1
|
|
$
|
1,457.0
|
|
||
|
Total International Sales as a Percentage of Net Sales
|
33
|
%
|
33
|
%
|
35
|
%
|
|||||
We transact a portion of our sales in non-U.S. markets in local currencies, while a meaningful portion of our product costs are denominated in U.S. dollars as a result of our U.S. manufacturing operations. As a result, the strengthening or weakening of the U.S. dollar affects the financial results of our non-U.S. operations.
Marine Engine segment non-U.S. sales represented approximately 50
percent of our non-U.S. sales in
2018
. The segment's principal non-U.S. operations include the following:
|
•
|
Distribution, sales, service, engineering, or representative offices in Australia, Belgium, Brazil, Canada, China, Dubai, Finland, France, Italy, Japan, the Netherlands, New Zealand, Norway, Russia, Singapore, Sweden, and Switzerland;
|
|
•
|
Component, parts and accessories manufacturing, and light assembly facilities in Mexico, the Netherlands, New Zealand, and Northern Ireland;
|
|
•
|
An outboard engine assembly plant in Suzhou, China; and
|
|
•
|
An outboard engine assembly plant operated by a joint venture in Japan.
|
Boat segment non-U.S. sales comprised approximately 21 percent of our non-U.S. sales in
2018
. The Boat Group manufactures or assembles a portion of its products in Canada, Mexico, New Zealand, and Portugal, as well as in boat plants owned and operated
5
by third parties in Poland that perform contract manufacturing for us, which are sold mostly in international markets through Dealers. The Boat Group has sales or import offices in Belgium, Canada, France, Italy, the Netherlands, New Zealand, Norway, Poland, and Sweden. Of our boat sales in Canada and Europe, approximately 38 percent and 91 percent, respectively, were produced in the region.
Fitness segment non-U.S. sales comprised approximately 29
percent of our non-U.S. sales in
2018
. Fitness sells its products worldwide and has sales and distribution centers in Brazil, Germany, Hong Kong, Japan, the Netherlands, Spain, and the United Kingdom. The Fitness segment manufactures strength-training equipment and select lines of cardiovascular equipment in Hungary for its international markets, and has relationships with third-party contract manufacturing partners in Taiwan, China, Mexico, and Indonesia.
Raw Materials and Supplies
We purchase a wide variety of raw materials from our supplier base, including commodities such as aluminum, resins, oil, and steel, as well as product parts and components, such as engine blocks and boat windshields. The prices for these raw materials, parts, and components fluctuate depending on market conditions. Significant increases in the cost of such materials would raise our production costs, which could reduce profitability if we did not recoup the increased costs through higher product prices.
As our manufacturing operations continued to raise production levels in
2018
, our need for raw materials and supplies also increased. During
2018
, we experienced some shortages or delayed delivery of certain materials, parts, and supplies essential to our manufacturing operations, although such shortages did not materially impact operations. We have addressed and will continue to address this issue by identifying alternative suppliers, working to secure adequate inventories of critical supplies, and continually monitoring the capabilities of our supplier base. In
2019
, we anticipate our suppliers will need to increase their manufacturing capacity and investments to meet the rising demand for their products and, in many cases, may need to hire additional workers in order to fulfill the orders placed by us and other customers.
Our global procurement operations continue to better leverage purchasing power across our divisions and to improve supply chain and cost efficiencies. We mitigate commodity price risk on certain raw material purchases by entering into fixed priced contracts or derivatives to mitigate exposure related to changes in commodity prices.
Intellectual Property
We have, and continue to obtain, patent rights covering certain features of our products and processes. By law, our patent rights, which consist of patents and patent licenses, have limited lives and expire periodically. We believe that our patent rights are important to our competitive position in all of our business segments. Our trademark rights have indefinite lives, and many are well known to the public and are considered to be valuable assets. Most of our intellectual property is owned by U.S. entities.
In the Marine Engine segment, patent rights principally relate to features of outboard engines and inboard-outboard drives, hybrid drives, and pod drives, including: die-cast powerheads; cooling and exhaust systems; drivetrain, clutch, and gearshift mechanisms; boat/engine mountings; shock-absorbing tilt mechanisms; ignition systems; propellers; marine vessel control systems; fuel and oil injection systems; supercharged engines; outboard mid-section structures; segmented cowls; hydraulic trim, tilt and steering; screw compressor charge air cooling systems; a range of proprietary metal alloys; and airflow silencers.
In the Boat segment, patent rights principally relate to processes for manufacturing fiberglass hulls, decks, and components for boat products, as well as patent rights related to boat features and components.
In the Fitness segment, patent rights principally relate to fitness equipment designs and components, including patents covering internal processes, programming functions, displays, design features and styling, as well as billiards table designs and components.
The following are our principal trademarks:
Marine Engine Segment:
Ancor, Attwood, Axius, BEP, Blue Sea Systems, CZone, Del City, FulTyme RV, Garelick, Kellogg Marine Supply, Land 'N' Sea, Lenco Marine, Marinco, Mariner, Mastervolt, MerCruiser, Mercury, Mercury Marine, Mercury Precision Parts, Mercury Propellers, Mercury Racing, MotorGuide, OptiMax, Park Power, Progressive Industries, ProMariner,
Q
uicksilver, Seachoice, SeaPro, SmartCraft, Sport-Jet, Swivl-Eze, Talamex, Valiant, Verado, Whale, and Zeus.
Boat Segment:
Bayliner, Boston Whaler, Crestliner, Cypress Cay, Harris, Heyday, Lowe, Lund, Master Dealer, Meridian, Princecraft, Protector, Quicksilver, Rayglass, Sea Ray, Thunder Jet, and Uttern.
6
Fitness Segment:
Air Hockey, Brunswick, Contender, Cybex, Flex Deck, Gold Crown, Hammer Strength, Indoor Cycling Group, Lifecycle, Life Fitness, and SCIFIT.
Competitive Conditions and Position
We believe that we have a reputation for quality in each of our highly competitive lines of business. We compete in various markets by: utilizing efficient production techniques; developing and strengthening our leading brands; developing and promoting innovative technological advancements; undertaking effective marketing, advertising, and sales efforts; providing high-quality, innovative products at competitive prices; and offering extensive aftermarket products.
Strong competition exists in each of our product groups, but no single enterprise competes with us in all product groups. In each product area, competitors range in size from large, highly-diversified companies to small, single-product businesses. We also indirectly compete with businesses that offer alternative leisure products or activities.
The following summarizes our competitive position in each segment:
Marine Engine Segment:
We believe the Marine Engine segment is a world leader in the manufacture and sale of recreational and commercial marine engines and marine parts and accessories. The marine engine market is highly competitive among several major international companies that comprise the majority of the market, including Japanese-based outboard engine manufacturers, as well as several smaller companies including Chinese manufacturers. Competitive advantage in this segment is a function of product features, technological leadership, quality, service, pricing, performance, manufacturing capabilities, depth of product portfolio, intuitive product controls, and durability, along with effective promotion and distribution.
Boat Segment:
We believe that the Boat segment is a world leader in the manufacture and sale of pleasure motorboats. There are several major manufacturers of pleasure and offshore fishing boats, along with hundreds of smaller manufacturers. However, few major manufacturers compete in the breadth of categories or geographies in which our Boat segment competes. Consequently, this business is highly competitive by category but also highly fragmented. In all of our boat operations, we compete on the basis of product features, technology, quality, brand strength, dealer service, pricing, performance, value, durability and styling, along with effective promotion and distribution.
Fitness Segment:
We believe we are the world's largest manufacturer of commercial fitness equipment and a leading manufacturer of high-quality consumer fitness equipment and billiards tables. The fitness equipment industry is highly competitive among several major international companies that comprise the majority of the market, as well as many smaller manufacturers, which creates a highly fragmented, competitive landscape. Many of our fitness equipment offerings include industry-leading product features, and we place significant emphasis on introducing innovative fitness equipment to the market. Competitive focus is also placed on product quality, technology, service, pricing, state-of-the-art biomechanics, connectivity and customer solutions, and effective promotional activities. The billiards industry continues to experience competitive pressure from low-cost billiards manufacturers outside the United States.
Research and Development
We strive to improve our competitive position in all of our segments by continuously investing in research and development to drive innovation in our products and manufacturing technologies. Our research and development investments support the introduction of new products and enhancements to existing products. Research and development expenses were
2.9 percent
,
3.0 percent
and
3.1 percent
of net sales in
2018
,
2017
and
2016
, respectively. Research and development expenses by segment are discussed in
Note 7 –
Segment Information
in the Notes to Consolidated Financial Statements.
7
Number of Employees
The number of employees worldwide is shown below by segment:
|
December 31, 2018
|
December 31, 2017
|
||||||||||
|
Total
|
Union (domestic)
|
Total
|
Union (domestic)
|
||||||||
|
Marine Engine
|
7,719
|
|
2,402
|
|
6,541
|
|
2,078
|
|
|||
|
Boat
|
4,996
|
|
—
|
|
5,365
|
|
—
|
|
|||
|
Fitness
|
2,956
|
|
170
|
|
2,854
|
|
166
|
|
|||
|
Corporate
(A)
|
367
|
|
—
|
|
356
|
|
—
|
|
|||
|
Total
(B)
|
16,038
|
|
2,572
|
|
15,116
|
|
2,244
|
|
|||
(A) Corporate numbers include certain information technology employees and shared service employees.
(B) All employee numbers exclude temporary employees.
We believe that the relationships between our employees, applicable labor unions, and the Company remain stable. Mercury Marine and its largest union, the International Association of Machinists and Aerospace Workers (IAM) Lodge 1947, agreed to a new collective bargaining agreement in February 2018 which will remain in place through August 26, 2023.
Environmental Requirements
Refer to
Note 14 –
Commitments and Contingencies
in the Notes to Consolidated Financial Statements for a description of certain environmental proceedings.
Available Information
Brunswick maintains an Internet website at http://www.brunswick.com that includes links to our Annual Report on Form 10-K, Quarterly Reports on Form 10-Q, Current Reports on Form 8-K and any amendments to those reports, and Proxy Statements (SEC Filings). The SEC Filings are available without charge as soon as reasonably practicable following the time that they are filed with, or furnished to, the SEC. Shareholders and other interested parties may request email notification of the posting of these documents through the Investors section of our website. Brunswick’s SEC Filings are also available on the SEC’s website at http://www.sec.gov.
8
Item 1A. Risk Factors
The Company's operations and financial results are subject to certain risks and uncertainties, including those described below, which could adversely affect our business, financial condition, results of operations, cash flows, and the trading price of our common stock.
Worldwide economic conditions significantly affect our industries and businesses, and economic decline can materially impact our financial results.
In times of economic uncertainty and contraction, consumers tend to have less discretionary income and to defer expenditures for discretionary items, which adversely affects our financial performance, especially in the marine businesses. Although we have expanded the portions of our portfolio that are dependent or substantially weighted toward the usage and maintenance of boats and engines versus the sale of new product and therefore less susceptible to economic cycles, a portion of the business remains cyclical and sensitive to personal spending levels.
Deterioration in general economic conditions that in turn diminishes consumer confidence or discretionary income may reduce our sales, or we may decide to lower pricing for our products, thus adversely affecting our financial results, including increasing the potential for future impairment charges. Further, most of our products are used for recreation, and consumers’ limited discretionary income in times of economic hardship may be diverted to other activities that occupy their time, such as other forms of recreation, religious, cultural, or community activities. We cannot predict the timing or continued strength of global economies, either worldwide or in the specific markets in which we compete.
Failure to successfully implement our strategic plan and growth initiatives could have a material adverse effect on our business and financial condition.
Our ability to continue generating strong cash flow and profits depends partly on the sustained successful execution of our strategic plan and growth initiatives, including optimizing our business portfolio, making acquisitions, and expanding into new adjacent markets and customers. To address risks associated with our plan and growth initiatives, we have established processes to regularly review, manage, and modify our plans, and we believe we have appropriate oversight to monitor initiatives and their impact. Our strategic plan and growth initiatives may require significant capital investment and management attention, however, which could result in the diversion of these resources from the core business and other business issues and opportunities. Additionally, any new initiative is subject to certain risks, including customer acceptance, competition, the ability to manufacture products on schedule and to specification, the ability to create the necessary supply chain, and/or the ability to attract and retain qualified management and other personnel. There is no assurance that we will be able to develop and successfully implement our strategic plan and growth initiatives in a manner that fully achieves our strategic objectives.
The inability to successfully integrate new acquisitions, including the Global Marine Business of Power Products, could negatively impact financial results.
On August 9, 2018, Brunswick acquired the Global Marine & Mobile business of Power Products, which includes the global marine, specialty vehicle, mobile, industrial power, and transportation aftermarket products businesses. Acquisitions pose risks, such as our ability to project and evaluate market demand; maximize potential synergies and cost savings; make accurate accounting estimates; and achieve anticipated business objectives. The Power Products acquisition and other, future acquisitions, present these and other integration risks, including:
|
•
|
disruptions in core, adjacent, or acquired businesses that could make it more difficult to maintain business and operational relationships, including customer and supplier relationships;
|
|
•
|
the possibility that the expected synergies and value creation will not be realized or will not be realized within the expected time period;
|
|
•
|
the risk that unexpected costs will be incurred;
|
|
•
|
diversion of management attention; and
|
|
•
|
difficulties retaining employees.
|
If we fail to timely and successfully integrate new businesses, including Power Products, into existing operations, we may see higher production costs, lost sales, or otherwise diminished earnings and financial results.
9
The anticipated Fitness business separation could be disruptive to the business and our operations, and there can be no assurance that it will provide business benefits or that it will be consummated within the anticipated time period or at all.
The Fitness business separation, whether ultimately a spin-off or a sale, like any business separation, involves risks, including difficulties associated with the separation of operations, services, and personnel, disruption in our operations or businesses, the potential loss of key employees, and adverse effects on relationships with business partners. In addition, we will incur significant expense in connection with the separation, and completion of the proposed transaction will require significant amounts of management time and effort, which may divert management’s attention from other aspects of our business operations. If we do not successfully manage these risks, our business, financial condition, and results of operations could be adversely affected.
The proposed separation may not achieve the intended results, or results may take longer to realize than expected. Unanticipated developments could delay, prevent, or otherwise adversely affect the separation, including disruptions in general market conditions or other developments. The anticipated benefits of the separation are based on a number of assumptions, some of which may prove incorrect, and we cannot predict the prices at which our common stock, or the common stock of the Fitness stand-alone entity, may trade after the proposed separation. In addition, we cannot assure that we will be able to complete the business separation within the announced timeline, or at all. Delays or failure to consummate the separation could negatively affect our business and financial results.
In addition to these risks, we face other risks specific to a spin-off of the Fitness business, as opposed to a sale, including the risk that a spin-off could result in significant tax liability to the Company or our shareholders, despite the steps we have taken to avoid this result. Completion of the spin-off is conditioned on our receipt of a written legal opinion to the effect that the distribution of Life Fitness common stock will qualify for non-recognition of gain and loss for U.S. Federal income tax purposes.
The legal opinion will not address any U.S. state or local or foreign tax consequences of the spin-off, and will rely on the continuing effectiveness and validity of the favorable private letter ruling (the “IRS Ruling”) from the U.S. Internal Revenue Service (the “IRS”) regarding such U.S. Federal income tax consequences of the spin-off. The Company has received the IRS Ruling, which relies on certain facts, assumptions, representations, and undertakings from Fitness business and from Brunswick. If any of these facts, assumptions, representations, or undertakings is incorrect or not otherwise satisfied, we may not be able to rely on the IRS Ruling. In addition, the IRS ruling is not a comprehensive ruling from the IRS regarding all aspects of the U.S. Federal income tax consequences of the transactions. Accordingly, notwithstanding the legal opinion and the IRS Ruling, there can be no assurance that the IRS will not assert, or that a court would not sustain, a contrary position.
Further, the legal opinion will be based on certain representations as to factual matters from the Company and the Fitness business. The opinion cannot be relied on if any of the assumptions, representations, or covenants is incorrect, incomplete, or inaccurate, or is violated in any material respect. If the distribution of Life Fitness common stock were determined not to qualify for non-recognition of gain and loss for U.S. Federal income tax purposes, U.S. holders could be subject to significant tax consequences.
The final determination to proceed with a spin-off or sale is a decision of our Board of Directors, and this determination could have an adverse impact on the Company's financial results. There are many factors that could impact the structure or timing of, the anticipated benefits from, or determination to ultimately proceed with, the separation, including global economic conditions, tax considerations, market conditions, and changes in the regulatory or legal environment, any of which could adversely impact the value of the separation transaction to our shareholders. Additionally, the completion of the separation will be complex, costly, and time-consuming, and an inability to realize the full extent of the anticipated benefits, as well as delays encountered in the process, could have an adverse effect upon the revenues, costs, and operating results of the Company.
An impairment in the carrying value of goodwill, trade names, and other long-lived assets could negatively affect our consolidated results of operations and net worth.
Goodwill and indefinite-lived intangible assets, such as our trade names, are recorded at fair value at the time of acquisition and are not amortized, but are reviewed for impairment at least annually or more frequently if impairment indicators arise. In evaluating the potential for impairment of goodwill and trade names, we make assumptions regarding future operating performance, business trends, and market and economic conditions. Such analyses further require us to make certain assumptions about sales, operating margins, growth rates, and discount rates. Uncertainties are inherent in evaluating and applying these factors to the assessment of goodwill and trade name recoverability. We could be required to evaluate the recoverability of goodwill or trade names prior to the annual assessment if we experience business disruptions, unexpected significant declines in operating results, a divestiture of a significant component of our business, or declines in market capitalization.
As of the Company’s annual goodwill impairment testing date on October 1, 2018, the estimated fair value of the Fitness reporting unit was approximately 19 percent in excess of its carrying value, which included goodwill of $390.8 million. In making
10
this determination, management made several significant assumptions that impact the estimated fair value of the Fitness reporting unit, including projected results, such as improvement of operating performance, particularly expanded gross margins, which are predicated upon the successful execution of cost reduction initiatives along with increased sales, in future years when compared with 2018 and the discount rate. While we believe current gross margin and sales projections are reasonable, the Fitness segment’s ability to expand gross margins or grow sales in line with projections could be negatively affected by its ability to execute the planned actions underlying the forecasted improvement in its performance as well as market conditions. Fair value determinations require considerable judgment and are sensitive to changes in underlying assumptions and factors. As a result, there can be no assurance that the estimates and assumptions made for purposes of the impairment test will prove to be an accurate prediction of the future. To the extent future operating results differ from those in our current forecast, or if the assumptions underlying the discount rate change, it is possible that an impairment charge could be recorded.
We also continually evaluate whether events or circumstances have occurred that indicate the remaining estimated useful lives of our definite-lived intangible assets and other long-lived assets may warrant revision or whether the remaining balance of such assets may not be recoverable. We use an estimate of the related undiscounted cash flow over the remaining life of the asset in measuring whether the asset is recoverable.
As of
December 31, 2018
, goodwill was approximately 13 percent of total assets and included $391 million of goodwill related to the Fitness segment, $32 million of goodwill related to the Marine Engine segment, and $2 million of goodwill related to the Boat segment. If the future operating performance of the Company's reporting units is not sufficient, we could be required to record non-cash impairment charges. Impairment charges could substantially affect our reported earnings in the periods such charges are recorded. In addition, impairment charges could indicate a reduction in business value which could limit our ability to obtain adequate financing in the future.
Changes to U.S. trade policy, tariffs, and import/export regulations may have a material adverse effect on our business, financial condition, and results of operations.
Changes in laws and policies governing foreign trade could adversely affect our business. As a result of recent policy changes, there may be greater restrictions and economic disincentives on international trade. The new tariffs and other changes in U.S. trade policy could trigger retaliatory actions by affected countries, and certain foreign governments have instituted or are considering imposing trade sanctions on certain U.S. goods, such as aluminum and steel. Although we were recently granted exclusion from Section 301 tariffs for Mercury Marine 40, 50, and 60 horsepower engines, these exclusions are only in effect through the end of 2019, we continue to be subject to meaningful other tariffs, and there is no assurance that we will be granted similar exclusions for these or other products in the future, or that we will not be subject to additional tariffs. Like many other multinational corporations, we do a significant amount of business that would be affected by changes to the trade policies of the U.S. and foreign countries (including governmental action related to tariffs and international trade agreements). Such changes have the potential to adversely impact the U.S. economy, our industry, and global demand for our products and, as a result, could have a material adverse effect on our business, financial condition and results of operations.
An inability to identify and complete targeted acquisitions could negatively impact financial results.
Our growth initiatives include making strategic acquisitions, which depend on the availability of suitable targets at acceptable terms and our ability to complete the transactions. In managing our acquisition strategy, we conduct rigorous due diligence, involve various functions, and continually review target acquisitions, all of which we believe mitigates some of our acquisition risks. However, we cannot assure that suitable acquisitions will be identified or consummated or that, if consummated, they will be successful. Acquisitions include a number of risks, including our ability to project and evaluate market demand, potential synergies, and cost savings, and our ability to make accurate accounting estimates, as well as diversion of management attention. Uncertainties exist in assessing the value, risks, profitability, and liabilities associated with certain businesses or assets, negotiating acceptable terms, obtaining financing on acceptable terms, and receiving any necessary regulatory approvals. As we continue to grow, in part, through acquisitions, our success depends on our ability to anticipate and effectively manage these risks. Any failure to do so could have a material adverse effect on our financial condition and results of operations.
There can be no assurance that strategic divestitures will provide business benefits.
As part of our strategy, we continuously evaluate our portfolio of businesses. Recent results of this evaluation include the planned separation of the Fitness business, the discontinuation of Sea Ray Sport Yacht and Yacht models, and winding down yacht production. We have previously and may in the future make other changes to our portfolio as well, which may be material. Divestitures involve risks, including difficulties in the separation of operations, services, products and personnel, disruption in our operations or businesses, finding a suitable purchaser, the diversion of management's attention from our other businesses, the potential loss of key employees, adverse effects on relationships with our dealer or supplier partners or their businesses, the erosion
11
of employee morale or customer confidence, and the retention of contingent liabilities related to the divested business. If we do not successfully manage the risks associated with divestitures, our business, financial condition, and results of operations could be adversely affected as the potential strategic benefits may not be realized or may take longer to realize than expected.
Changes in currency exchange rates can adversely affect our results.
Some of our sales are denominated in a currency other than the U.S. dollar. Consequently, a strong U.S. dollar may adversely affect reported revenues and our profitability. We have hedging programs in place to reduce our risk to currency fluctuations; however, we cannot hedge against all currency risks, especially over the long term. We maintain a portion of our cost structure in currencies other than the U.S. dollar, which partially mitigates the impact of a strengthening U.S. dollar. This includes manufacturing operations for boats in Europe and Canada, fitness equipment in Europe, and smaller outboard engines manufactured and purchased from our joint venture in Japan. We also continue to evaluate the supply chain and cost structure for opportunities to further mitigate foreign currency risks.
We sell products manufactured in the U.S. into certain international markets in U.S. dollars, including to Canada, Europe, and Latin America. Demand for our products in these markets may be diminished by a strengthening U.S. dollar, or we may need to lower prices to remain competitive. Some of our competitors with cost positions based outside the U.S., including Asian-based outboard engine and fitness equipment manufacturers, European-based large fiberglass boat manufacturers, and a European-based fitness equipment manufacturer, may have an improved cost position due to a strengthening U.S. dollar, which could result in pricing pressures on our products. Although these factors have existed for several years, we do not believe they have had a material adverse effect on our competitive position.
Fiscal concerns may negatively impact worldwide credit conditions and adversely affect our industries, businesses, and financial condition.
Fiscal policy could have a material adverse impact on worldwide economic conditions, the financial markets, and availability of credit and, consequently, may negatively affect our industries, businesses, and overall financial condition. Customers often finance purchases of our products, particularly boats, and as interest rates rise, the cost of financing the purchase also increases. Credit market conditions, while improved, are still less favorable overall than those in existence prior to the global recession in 2008. While credit availability is adequate to support demand and interest rates remain relatively low, they have recently increased, and there are fewer lenders, tighter underwriting and loan approval criteria, as well as greater down payment requirements. If credit conditions worsen, and adversely affect the ability of customers to finance potential purchases at acceptable terms and interest rates, it could result in a decrease in sales or delay improvement in sales.
Dealer or distributor inability to secure adequate access to capital could adversely affect our sales.
Our dealers require adequate liquidity to finance their operations, including purchasing our products. Dealers are subject to numerous risks and uncertainties that could unfavorably affect their liquidity positions, including, among other things, continued access to adequate financing sources on a timely basis on reasonable terms. These financing sources are vital to our ability to sell products through our distribution network, particularly to boat and engine dealers. Entities affiliated with Wells Fargo & Company, including BAC, the Company’s 49 percent owned joint venture, finance a significant portion of our boat and engine sales to dealers through floorplan financing to marine dealers.
Many factors continue to influence the availability and terms of financing that our dealer floorplan financing providers offer, including:
|
•
|
their ability to access certain capital markets, such as the securitization and the commercial paper markets, and to fund their operations in a cost effective manner;
|
|
•
|
the performance of their overall credit portfolios;
|
|
•
|
their willingness to accept the risks associated with lending to marine dealers;
|
|
•
|
the overall creditworthiness of those dealers; and
|
|
•
|
the overall aging and level of pipeline inventories.
|
Our sales could be adversely affected if financing terms change unfavorably or if BAC were to be terminated. This could require dealers to find alternative sources of financing, including our direct financing to dealers, which could require additional capital to fund the associated receivables.
12
Our financial results could be adversely affected if we are unable to maintain effective distribution.
We rely on third-party dealers and distributors to sell most of our products, particularly in the marine businesses. Maintaining a reliable network of dealers is essential to our success. We face competition from other manufacturers in attracting and retaining distributors and independent boat dealers. For example, in 2017, Bass Pro Shops acquired Cabela's, a meaningful channel for the Lowe boat brand, and Cabela's subsequent transition away from Lowe boats required Lowe enhance its sales and distribution network by identifying alternative dealers. However, a significant deterioration in the number or effectiveness of our dealers and distributors could have a material adverse effect on our financial results.
Although at present we believe dealer health to be generally favorable, weakening demand for marine products could hurt our dealers’ financial performance. In particular, reduced cash flow from decreases in sales and tightening credit markets may impair dealers' ability to fund operations. Inability to fund operations can force dealers to cease business, and we may be unable to obtain alternate distribution in the vacated market. An inability to obtain alternate distribution could unfavorably affect our net sales through reduced market presence. If economic conditions deteriorate, we anticipate that dealer failures or voluntary market exits would increase, especially if overall retail demand materially declines.
Adverse economic, credit, and capital market conditions could have a negative impact on our financial results.
We may rely on short-term capital markets to meet our working capital requirements, fund capital expenditures, pay dividends, or fund employee benefit programs and we maintain short-term borrowing facilities that can be used to meet these capital requirements. In addition, over the long term, we may determine that it is necessary to access the capital markets to refinance existing long-term indebtedness or for other initiatives.
Adverse global economic conditions, market volatility, and regulatory uncertainty could lead to volatility and disruptions in the capital and credit markets. This could adversely affect our ability to access capital and credit markets or increase the cost to do so, which could have a negative impact on our business, financial results and competitive position.
In addition, our variable rate indebtedness may use LIBOR as a benchmark for establishing the rate. As announced in July 2017, LIBOR is expected to be phased out by the end of 2021. Uncertainty as to the nature of alternative reference rates and as to potential changes or other reforms to LIBOR may adversely impact the availability and cost of borrowings.
Loss of key customers could harm our business.
In each segment, we have important relationships with key customers and, from time to time, contracts with these customers come up for renewal. We cannot be certain we will renew such contracts, or renew them on favorable terms. For example, in 2018, we were involved in a competitive request for proposal and contract negotiations with Planet Fitness, a significant customer of our Fitness business. The resulting new contract with Planet Fitness is not exclusive to Fitness, and allows Planet Fitness to purchase from Fitness or two of our competitors. If we lose a key customer, or a significant portion of its business, we could be adversely affected. In addition, certain customers could try to negotiate more favorable pricing of our products, which could depress earnings. In an effort to mitigate the risk associated with reliance on key customer accounts, we continually monitor such relationships and maintain a complete and competitive product lineup.
Our business and operations are dependent on the expertise of our key contributors, our successful implementation of succession plans, and our ability to attract and retain management employees and skilled labor.
The talents and efforts of our employees, particularly key managers, are vital to our success. Our management team has significant industry experience and would be difficult to replace. We may be unable to retain them or to attract other highly qualified employees. Failure to hire, develop, and retain highly qualified and diverse employee talent and to develop and implement an adequate succession plan for the management team could disrupt our operations and adversely affect our business and our future success. Although we cannot ensure that all transitions will be implemented successfully, we perform an annual review of management succession plans with the Board of Directors, including reviewing executive officer and other important positions to substantially mitigate the risk associated with key contributor transitions.
In October, 2018 we announced that our Chief Executive Officer, Mark Schwabero, would be retiring effective December 31, 2018, and his successor would be David Foulkes, our current CEO. In a separate action, we named a new President of the Fitness division. Our ability to continue to execute our growth strategy could potentially be adversely affected by uncertainty associated with these transitions or other, currently unanticipated, executive changes that may be disruptive to, or cause uncertainty in, our business and future strategic direction. Any such disruption or uncertainty could have a material adverse impact on our business, results of operations, and financial condition.
13
Much of our future success depends on, among other factors, our ability to attract and retain skilled labor. If we are not successful in these efforts, we may be unable to meet our operating goals and plans, which may impact our financial results. We continually invest in automation and improve our efficiency, but with unemployment rates at low levels in many of the geographic areas in which we manufacture or distribute goods, availability of skilled hourly workers remains critical to our operations. In order to manage this risk, we regularly monitor and make improvements to wages and benefit programs, as well as develop and improve recruiting and training programs to attract and retain an experienced and skilled workforce.
Inventory reductions by major dealers, retailers, and independent boat builders could adversely affect our financial results.
The Company and our dealers, retailers, and other distributors could decide to reduce the number of units they hold, particularly if demand trails forecasted levels or if new product introductions are expected to replace existing products. Such efforts tend to result in wholesale sales reductions in excess of retail sales reductions and would likely result in lower production levels of certain of our products, potentially causing lower rates of absorption of fixed costs in our manufacturing facilities and lower margins. While we have processes in place to help manage dealer inventories at appropriate levels, potential inventory reductions remain a risk to our future sales and results of operations.
We may be required to repurchase inventory or accounts of certain dealers.
We have agreements with certain third-party finance companies to provide financing to our customers, enabling them to purchase our products. In connection with these agreements, we may either have obligations to repurchase our products from the finance company, or may have recourse obligations to the finance company on the dealer’s receivables. These obligations may be triggered if our dealers default on their payment or other obligations to the finance companies.
Our maximum contingent obligation to repurchase inventory and our maximum contingent recourse obligations on customer receivables are less than the total balances of dealer financings outstanding under these programs, because our obligations under certain of these arrangements are subject to caps, or are limited based on the age of product. Our risk related to these arrangements is mitigated by the proceeds we receive on the resale of repurchased product to other dealers, or by recoveries on receivables purchased under the recourse obligations.
Our inventory repurchase obligations relate primarily to the inventory floorplan credit facilities of our boat and engine dealers. Our actual historical repurchase experience related to these arrangements has been substantially less than our maximum contractual obligations. If dealers default on their obligations, file for bankruptcy, or cease operations, however, we could incur losses associated with the repurchase of our products. As a result, our net sales and earnings may be unfavorably affected due to reduced market coverage and an associated decline in sales.
Declines in marine industry demand could cause an increase in future repurchase activity, or could require us to incur losses in excess of established reserves. In addition, our cash flow and loss experience could be adversely affected if repurchased inventory is not successfully distributed to other dealers in a timely manner, or if the recovery rate on the resale of the product declines. The finance companies could require changes in repurchase or recourse terms that would result in an increase in our contractual contingent obligations.
Our financial results may be adversely affected by our third party suppliers' increased costs or inability to meet required production levels due to tariff impacts or defects or disruption of supply of raw materials, parts, and product components.
We rely on third parties to supply raw materials used in the manufacturing process, including oil, aluminum, copper, steel, and resins, as well as product parts and components. The prices for these raw materials, parts, and components fluctuate depending on market conditions and, in some instances, commodity prices or trade policies. Substantial increases in the prices of raw materials, parts, and components would increase our operating costs, and could reduce our profitability if we are unable to recoup the increased costs through higher product prices. Similarly, if a critical supplier were to close its operations, cease manufacturing, or otherwise fail to deliver an essential component necessary to our manufacturing operations, that could detrimentally affect our ability to manufacture and sell our products, resulting in an interruption in business operations and/or a loss of sales.
In addition, some components used in our manufacturing processes, including certain engine components, furniture, upholstery, and boat windshields, are available from a sole supplier or a limited number of suppliers. Operational and financial difficulties that these or other suppliers may face in the future could adversely affect their ability to supply us with the parts and components we need, which could significantly disrupt our operations. It may be difficult to find a replacement supplier for a limited or sole source raw material, part, or component without significant delay or on commercially reasonable terms. In addition, an uncorrected defect or supplier's variation in a raw material, part, or component, either unknown to us or incompatible with our manufacturing process, could jeopardize our ability to manufacture products.
14
Some additional supply risks that could disrupt our operations, impair our ability to deliver products to customers, and negatively affect our financial results include:
|
•
|
financial pressures on our suppliers due to a weakening economy or unfavorable conditions in other end markets;
|
|
•
|
a deterioration of our relationships with suppliers;
|
|
•
|
events such as natural disasters, power outages or labor strikes;
|
|
•
|
supplier manufacturing constraints and investment requirements; or
|
|
•
|
labor disruption at major global ports and shipping hubs.
|
These risks are exacerbated in the case of single-source suppliers, and the exclusive supplier of a key component potentially could exert significant bargaining power over price, quality, warranty claims, or other terms.
We continue to increase production; consequently, our need for raw materials and supplies continues to increase. Our suppliers must be prepared to ramp up operations and, in many cases, hire additional workers and/or expand capacity in order to fulfill our orders and those of other customers. Cost increases, defects, or sustained interruptions in the supply of raw materials, parts, or components due to delayed start-up periods our suppliers experience as they increase production efforts create risks to our operations and financial results. The Company experienced periodic supply shortages and increases in costs to certain materials, such as aluminum, in
2018
. We continue to address these issues by identifying alternative suppliers for key materials and components, working to secure adequate inventories of critical supplies, and continually monitoring the capabilities of our supplier base. In the future, however, we may experience shortages, delayed delivery, and/or increased prices for key materials, parts, and supplies that are essential to our manufacturing operations.
Higher energy and fuel costs can affect our results.
Higher energy and fuel costs increase operating expenses at our manufacturing facilities and the cost of shipping products to customers. In addition, increases in energy costs can adversely affect the pricing and availability of petroleum-based raw materials such as resins and foam that are used in many of our marine products. Higher fuel prices may also have an adverse effect on demand for our marine parts and accessories businesses, as they increase the cost of boat ownership and possibly affect product use.
Our success depends upon the continued strength of our brands.
We believe that our brands, particularly including Mercury Marine, Sea Ray, Boston Whaler, Lund, and Life Fitness, significantly contribute to our success, and that maintaining and enhancing these brands is important to expanding our customer base. A failure to adequately promote and protect our brands could adversely affect our business and results of operations. Further, in connection with the divestiture of the bowling businesses, we licensed certain trademarks and servicemarks, including use of the name “Brunswick,” to the acquiring companies. Our reputation may be adversely affected by the purchasers' inappropriate use of the marks or of the name Brunswick, including potential negative publicity, loss of confidence, or other damage to our image due to this licensed use.
Either inadequate intellectual property protection that could allow others to use our technologies and impair our ability to compete, or failure to successfully defend against patent infringement claims could have a material adverse effect on our financial condition and results of operations.
We regard much of the technology underlying our products as proprietary. We rely on a combination of patents, trademark, copyright, and trade secret laws; employee and third-party non-disclosure agreements; and other contracts to establish and protect our technology and other intellectual property rights. However, we remain subject to risks, including:
|
•
|
the steps we take to protect our proprietary technology may be inadequate to prevent misappropriation of our technology;
|
|
•
|
third parties may independently develop similar technology;
|
|
•
|
agreements containing protections may be breached or terminated;
|
|
•
|
we may not have adequate remedies for breaches;
|
|
•
|
existing patent, trademark, copyright, and trade secret laws may afford limited protection;
|
|
•
|
a third party could copy or otherwise obtain and use our products or technology without authorization; or
|
|
•
|
we may be required to litigate to enforce our intellectual property rights, and we may not be successful.
|
Policing unauthorized use of our intellectual property is difficult, particularly outside the U.S., and litigating intellectual property claims may result in substantial cost and divert management’s attention.
15
In addition, we may be required to defend our products against patent or other intellectual property infringement claims or litigation. In addition to defense expenses and costs, we may not prevail in such cases, forcing us to seek licenses or royalty arrangements from third parties, which we may not be able to obtain on reasonable terms, or subjecting us to an order or requirement to stop manufacturing, using, selling, or distributing products that included challenged intellectual property, which could harm our business and financial results.
We have a fixed cost base that can affect our profitability in a declining sales environment.
The fixed cost levels of operating production facilities can put pressure on profit margins when sales and production decline. We have maintained discipline over our fixed cost base during the economic recovery, and improvements in gross margin can help mitigate the risks related to a fixed cost base. However, our profitability is dependent, in part, on our ability to absorb fixed costs over an increasing number of products sold and shipped. Decreased demand or the need to reduce inventories can lower our production levels and impact our ability to absorb fixed costs, consequently materially impacting our results.
Successfully managing our manufacturing footprint is critical to our operating and financial results.
Over the past several years, we have made strategic capital investments in capacity expansion activities to successfully capture growth opportunities and enhance product offerings, including expansions at Boston Whaler in Edgewater, Florida and Mercury Marine in Fond du Lac, Wisconsin. We may also make decisions to reduce our manufacturing footprint in accordance with our business strategy. We must carefully manage these capital improvement projects, expansions, and any manufacturing consolidation efforts to ensure they meet cost targets, comply with applicable environmental, safety, and other regulations, and uphold high-quality workmanship.
Moving production to a different plant, expanding capacity at an existing facility, or ceasing production at a facility involves risks, including difficulties initiating production within the cost and timeframe estimated, supplying product to customers when expected, integrating new products, and attracting sufficient skilled workers to handle additional production demands. If we fail to meet these objectives, it could adversely affect our ability to meet customer demand for products and increase the cost of production versus projections, both of which could result in a significant adverse impact on operating and financial results. Additionally, plant consolidation or expansion can result in manufacturing inefficiencies, additional expenses, including higher wages or severance costs, and cost inefficiencies, which could exceed projections and negatively impact financial results.
Our business operations could be negatively impacted by an outage or breach of our information technology systems or a cybersecurity event.
We manage our global business operations through a variety of information technology (IT) systems which we continually enhance to increase efficiency and security. We depend on these systems for commercial transactions, customer interactions, manufacturing, branding, employee tracking, and other applications. Some of the systems are based on legacy technology and operate with a minimal level of available support, and recent acquisitions using other systems have added to the complexity of our IT infrastructure. In addition, the Fitness business separation will require separation of business and IT systems, and new systems implementations across the enterprise also pose risks of outages or disruptions, which could affect our suppliers, commercial operations, and customers. We are working to upgrade, streamline, and integrate these systems and have invested in strategies to prevent a failure or breach but, like those of other companies, our systems are susceptible to outages due to natural disasters, power loss, computer viruses, security breaches, hardware or software vulnerabilities, disruptions, and similar events. If a legacy system or another of the Company's key systems were to fail or if our IT systems were unable to communicate effectively, this could result in missed or delayed sales or lost opportunities for cost reduction or efficient cash management.
We exchange information with hundreds of trading partners across all aspects of our commercial operations through our IT systems. A breakdown, outage, malicious intrusion, breach, random attack, or other disruption of communications could result in erroneous or fraudulent transactions, disclosure of confidential information, loss of reputation and confidence, and may also result in legal claims or proceedings, penalties and remediation costs. We have numerous e-commerce and e-marketing portals and our systems may contain personal information of customers or employees; therefore, we must continue to be diligent in protecting against malicious cyber attacks. We have been the target of attempted cyber-attacks and other security threats and we may be subject to breaches of our IT systems. We have programs in place that are intended to detect, contain, and respond to data security incidents and that provide employee awareness training regarding phishing, malware and other cyber risks. However, because the techniques used to obtain unauthorized access, disable or degrade service, or sabotage systems change frequently and may be difficult to detect, we may be unable to anticipate these techniques or implement adequate preventive measures. If our security measures are breached or fail, unauthorized persons may be able to obtain access to or acquire personal data. Depending on the nature of the information compromised, we may also have obligations to notify consumers and/or employees about the incident, and we may need to provide some form of remedy, such as a subscription to a credit monitoring service, for the individuals
16
affected by the incident. This could negatively affect our relationships with customers or trading partners, lead to potential claims against the Company, and damage our image and reputation.
Our pension funding requirements and expenses are affected by certain factors outside our control.
Our funding obligations and pension expense for our two U.S. qualified pension plans are largely driven by the performance of assets set aside in trusts for these plans, the discount rate used to value the plans’ liabilities, actuarial data and experience, and legal and regulatory funding requirements. Changes in these factors could have an adverse impact on our results of operations, liquidity, or shareholders’ equity. The level of the Company's funding of our qualified pension plan liabilities was approximately 102 percent as of
December 31, 2018
. We continue to minimize our risks through pension de-risking actions, including investing in almost entirely fixed income investments and recently initiating the termination of both remaining U.S. qualified pension plans in 2018, which will be completed in 2019. However, our future pension expense and funding requirements could increase due to the effect of adverse changes in the discount rate and asset levels along with a decline in the estimated return on plan assets. Changes to legal regulations could require us to make increased contributions to the pension plans in 2019. In addition, the settlement will require us to recognize a substantial part of our unamortized actuarial losses as well as certain income tax consequences.
The timing and amount of our share repurchases are subject to a number of uncertainties.
The Board of Directors has authorized the Company’s discretionary repurchase of outstanding common stock, to be systematically completed in the open market or through privately negotiated transactions. In 2018, we repurchased $75 million of shares, and we plan to revisit additional share repurchases in 2019 after the planned Fitness business separation is completed. The amount and timing of share repurchases are based on a variety of factors. Important considerations that could cause us to limit, suspend, or delay future stock repurchases include:
|
•
|
unfavorable market and economic conditions;
|
|
•
|
the trading price of our common stock;
|
|
•
|
the nature of other investment opportunities available to us from time to time; and
|
|
•
|
the availability of cash.
|
Delaying, limiting, or suspending our stock repurchase program may negatively affect our stock price and performance versus earnings per share targets.
Our profitability may suffer as a result of competitive pricing and other pressures.
The introduction of lower-priced alternative products or services by other companies can hurt our competitive position in all of our businesses. We are constantly subject to competitive pressures in which predominantly international manufacturers may pursue a strategy of aggressive pricing, particularly during periods when their local currency weakens versus the U.S. dollar. Such pricing pressure may limit our ability to increase prices for our products in response to raw material and other cost increases and negatively affect our profit margins.
In addition, our independent boat builder customers may react negatively to potential competition for their products from Brunswick’s own boat brands, which can lead them to purchase marine engines and marine engine supplies from competing marine engine manufacturers and may negatively affect demand for our products.
Our ability to remain competitive depends on successfully introducing new products and services that meet customer expectations.
We believe that our customers look for and expect quality, innovation, and advanced features when evaluating and making purchasing decisions about products and services in the marketplace. Our ability to remain competitive and meet our growth objectives may be adversely affected by difficulties or delays in product development, such as an inability to develop viable new products or customer solutions, gain market acceptance of new products, generate sufficient capital to fund new product development, or obtain adequate intellectual property protection for new products. To meet ever-changing consumer demands, both timing of market entry and pricing of new products are critical. As a result, we may not be able to introduce new products that are necessary to remain competitive in all markets that we serve. Furthermore, we must continue to meet or exceed customers' expectations regarding product quality and after-sales service.
We manufacture and sell products that create exposure to potential claims and litigation.
Our manufacturing operations and the products we produce could result in product quality, warranty, personal injury, property damage, and other issues, thereby increasing the risk of litigation and potential liability, as well as regulatory fines. To manage
17
this risk, we have established a global, enterprise-wide program charged with the responsibility for addressing, reviewing, and reporting on product integrity issues. Historically, the resolution of such claims has not had a materially adverse effect on our business, and we maintain what we believe to be adequate insurance coverage to mitigate a portion of these risks. However, we may experience material losses in the future, incur significant costs to defend claims or issue product recalls, experience claims in excess of our insurance coverage or that are not covered by insurance, or be subjected to fines or penalties. For example, in the last two years we have reported certain Cybex products designed prior to the Cybex acquisition as well as a Life Fitness PowerMill product to the Consumer Product Safety Commission ("CPSC") and those matters remain open. Our reputation may be adversely affected by such claims, whether or not successful, including potential negative publicity about our products. We record accruals for known potential liabilities, but there is the possibility that actual losses may exceed these accruals and therefore negatively impact earnings.
Compliance with environmental, zoning, data protection, and other laws and regulations may increase costs and reduce demand for our products.
We are subject to federal, state, local, and foreign laws and regulations, including product safety, environmental, health and safety, privacy, and other regulations. While we believe that we maintain the requisite licenses and permits and that we are in material compliance with applicable laws and regulations, a failure to satisfy these and other regulatory requirements could result in fines or penalties, and compliance could increase the cost of operations. The adoption of additional laws, rules, and regulations, including stricter emissions standards, could increase our manufacturing costs, increase consumer pricing, and reduce consumer demand for our products.
Environmental restrictions, boat plant emission restrictions, and permitting and zoning requirements can limit production capacity, access to water for boating and marinas, and storage space. While future licensing requirements, including any licenses imposed on recreational boating, are not expected to be unduly restrictive, they may deter potential customers, thereby reducing our sales. Furthermore, regulations allowing the sale of fuel containing higher levels of ethanol for automobiles, which is not appropriate or intended for use in marine engines, may nonetheless result in increased warranty, service costs, customer dissatisfaction with products, and other claims against the Company if boaters mistakenly use this fuel in marine engines, causing damage to and the degradation of components in their marine engines.
Our manufacturing processes involve the use, handling, storage and contracting for recycling or disposal of hazardous or toxic substances or wastes. Accordingly, we are subject to regulations regarding these substances, and the misuse or mishandling of such substances could expose us to liabilities, including claims for property, personal injury, or natural resources damages, or fines. We are also subject to laws requiring the cleanup of contaminated property, including cleanup efforts currently underway. If a release of hazardous substances occurs at or from one of our current or former properties or another location where we have disposed of hazardous materials, we may be held liable for the contamination, regardless of knowledge or whether we were at fault, and the amount of such liability could be material.
We are subject to various data protection and privacy laws and regulations in the foreign countries where we operate because we collect, store, process, and use personal information, and we rely on third parties that are not directly under our control to do so as well. The General Data Protection Regulation (GDPR) in the European Union (EU) went into effect in May 2018 and, although we have implemented plans to comply with the law, it could impose an even greater compliance burden and risk with respect to privacy and data security than prior laws. The EU (through the GDPR) and a growing number of legislative and regulatory bodies elsewhere in the world have adopted consumer notification requirements in the event of unauthorized access to or acquisition of certain types of personal data. These breach notification laws continue to evolve and may be inconsistent from one jurisdiction to another. Complying with these obligations could cause us to incur substantial costs and could increase negative publicity surrounding any incident that compromises personal data.
Additionally, we are subject to laws governing our relationships with employees, including, but not limited to, employment obligations as a federal contractor and employee wage, hour, and benefits issues, such as pension funding and health care benefits. Compliance with these rules and regulations, and compliance with any changes to current regulations, could increase the cost of our operations.
Changes in income tax laws or enforcement could have a material adverse impact on our financial results.
Although domestic tax reform legislation in the form of the Tax Cuts and Jobs Act (TCJA), signed into law on December 22, 2017, has had an overall positive impact on our financial statements, the impact of the legislation could change as we analyze and apply additional regulations or guidance issued by the government. In addition, other changes in international and domestic tax laws, including the reaction by states to the corporate tax changes in the TCJA, and changes in tax law enforcement, could negatively impact our tax provision, cash flow, and/or tax related balance sheet amounts, including our deferred tax asset values. Changes in U.S. tax law will likely have broader implications, including impacts to the economy, currency markets, inflation environment,
18
consumer behavior, and/or competitive dynamics, which are difficult to predict, and may positively or negatively impact the Company and our results.
Certain activist shareholder actions could cause us to incur expense and hinder execution of our strategy.
We actively engage in discussions with our shareholders regarding further strengthening our Company and creating long-term shareholder value. This ongoing dialogue can include certain divisive activist tactics, which can take many forms. Some shareholder activism, including potential proxy contests, could result in substantial costs, such as legal fees and expenses, and divert management’s and our Board’s attention and resources from our businesses and strategic plans. Additionally, public shareholder activism could give rise to perceived uncertainties as to our future, adversely affect our relationships with dealers, distributors, or customers, make it more difficult to attract and retain qualified personnel, and cause our stock price to fluctuate based on temporary or speculative market perceptions or other factors that do not necessarily reflect the underlying fundamentals and prospects of our business. These risks could adversely affect our business and operating results.
Some of our operations are conducted by joint ventures that are not operated solely for our benefit.
We share ownership and management responsibilities with jointly owned companies such as BAC and Tohatsu Marine Corporation. These joint ventures may not have the same goals, strategies, priorities, or resources as the Company because they are intended to be operated for the benefit of all co-owners, rather than for our exclusive benefit. If such a conflict occurred, it could negatively impact our sales or financial results.
A significant portion of our revenue is derived from international sources, which creates additional uncertainty.
We intend to continue to expand our international operations and customer base as part of our growth strategy. Sales outside the United States, especially in emerging markets, are subject to various risks, including government embargoes or foreign trade restrictions, foreign currency effects, tariffs, customs duties, inflation, difficulties in enforcing agreements and collecting receivables through foreign legal systems, compliance with international laws, treaties, and regulations, and unexpected changes in regulatory environments, disruptions in distribution, and dependence on foreign personnel and unions, as well as economic and social instability. In addition, there may be tax inefficiencies in repatriating cash from non-U.S. subsidiaries, or tax laws that affect this process may change.
Instability, including, but not limited to, political events, civil unrest, and an increase in criminal activity, in locations where we maintain a significant presence could adversely impact our manufacturing and business operations. Decreased stability poses a risk of business interruption and delays in shipments of materials, components, and finished goods, as well as a risk of decreased local retail demand for our products.
In addition, global political and economic uncertainty and shifts, such as the ongoing negotiations to determine the future terms of the U.K.’s relationship with the EU (Brexit), pose risks of volatility in global markets, which could affect our operations and financial results. Changes in U.S. policy regarding foreign trade or manufacturing may create negative sentiment about the U.S. among non-U.S. customers, employees, or prospective employees, which could adversely affect our business, sales, hiring, and employee retention. If we continue to expand our business globally, our success will depend, in part, on our ability to anticipate and effectively manage these and other risks, which could materially impact international operations or the business as a whole.
Adverse weather conditions and climate events can have a negative effect on marine revenues.
Changes in seasonal weather conditions can have a significant effect on our operating and financial results, especially in the marine businesses. Sales of our marine products are typically stronger just before and during spring and summer, and favorable weather during these months generally has had a positive effect on consumer demand. Conversely, unseasonably cool weather, excessive rainfall, or drought conditions during these periods can reduce or change the timing of demand. Additionally, climate changes, regardless of the cause, resulting in environmental changes including, but not limited to, severe weather, changing sea levels, poor water conditions, or reduced access to water, could disrupt or negatively affect our business.
Catastrophic events, including natural and environmental disasters, could have a negative effect on our operations and financial results.
Hurricanes, floods, earthquakes, storms, and catastrophic natural or environmental disasters could disrupt our distribution channel, operations, or supply chain and decrease consumer demand. If a catastrophic event takes place in one of our major sales markets, our sales could be diminished. Additionally, if such an event occurs near our business locations, manufacturing facilities or key suppliers' facilities, business operations and/or operating systems could be interrupted. We could be uniquely affected by a catastrophic event due to the location of certain of our boat facilities in coastal Florida and the size of the manufacturing operation in Fond du Lac, Wisconsin.
19
Item 1B. Unresolved Staff Comments
None.
Item 2. Properties
Our headquarters are in Mettawa, Illinois. We have numerous manufacturing plants, distribution warehouses, sales offices, and product test sites around the world. Research and development facilities are primarily located at manufacturing sites.
We believe our facilities are suitable and adequate for our current needs and are well maintained and in good operating condition. Most plants and warehouses are of modern, single-story construction, providing efficient manufacturing and distribution operations. We believe our manufacturing facilities have the capacity, or we are investing to increase capacity, to meet current and anticipated demand. We own most of our principal plants.
The principal facilities used in our operations are in the following locations:
Marine Engine Segment
Leased facilities include: Fresno, California; Old Lyme, Connecticut; Largo, Miramar, and Pompano Beach, Florida; Lowell, Michigan; St. Paul Park, Minnesota; Brisbane and Melbourne, Australia; Toronto, Ontario, Canada; Auckland, New Zealand; Bangor, Northern Ireland; Amsterdam and Heerenveen, Netherlands; and Singapore.
Owned facilities include: Panama City and St. Cloud, Florida; Atlanta, Georgia; Brookfield, Fond du Lac, and Oshkosh, Wisconsin; Petit Rechain, Belgium; Victoria and Burnaby, British Columbia, Canada; Milton and Oakville, Ontario, Canada; Suzhou, China; and Juarez, Mexico.
Boat Segment
Leased facilities include: Greeneville, Tennessee and Auckland, New Zealand.
Owned facilities include: Edgewater and Merritt Island (Sykes Creek), Florida; Fort Wayne, Indiana; New York Mills, Minnesota; Lebanon, Missouri; Vonore, Tennessee; Clarkston, Washington; Petit Rechain, Belgium; Princeville, Quebec, Canada; Reynosa, Mexico; and Vila Nova de Cerveira, Portugal.
Fitness Segment
Leased facilities include: Rosemont, Illinois; a portion of the Franklin Park, Illinois facility; Tulsa, Oklahoma; Nuremberg, Germany.
Owned facilities include: a portion of the Franklin Park, Illinois facility; Falmouth, Kentucky; Owatonna and Ramsey, Minnesota; Bristol and Delavan, Wisconsin; and Kiskoros, Hungary.
Item 3. Legal Proceedings
Refer to
Note 14 –
Commitments and Contingencies
in the Notes to Consolidated Financial Statements for information about the Company's legal proceedings.
Item 4. Mine Safety Disclosures
Not applicable.
20
Executive Officers of the Registrant
Brunswick's Executive Officers are listed in the following table:
|
Officer
|
Present Position
|
Age
|
||
|
David M. Foulkes
|
Chief Executive Officer
|
57
|
||
|
William L. Metzger
|
Senior Vice President and Chief Financial Officer
|
57
|
||
|
Huw S. Bower
|
Vice President and President - Brunswick Boat Group
|
44
|
||
|
Christopher F. Dekker
|
Vice President, General Counsel and Secretary
|
50
|
||
|
John C. Pfeifer
|
Senior Vice President and President - Mercury Marine
|
53
|
||
|
Brenna Preisser
|
Vice President and Chief Human Resources Officer and President, Business Acceleration
|
41
|
||
|
Daniel J. Tanner
|
Vice President and Controller
|
61
|
||
David M. Foulkes
was named Chief Executive Officer of Brunswick in January 2019. He served as Chief Technology Officer and President, Brunswick Marine Consumer Solutions, from May 2018 to 2019, as Vice President and Brunswick Chief Technology Officer from 2014 to 2018, as Vice President of Product Development and Engineering, Mercury Marine, from 2010 to 2018 and as President of Mercury Racing from 2012 to 2018. Previously, Mr. Foulkes was Vice President for Research & Development at Mercury Marine from the start of his employment in 2007.
William L. Metzger
was named Senior Vice President and Chief Financial Officer of Brunswick in March 2013. Previously, he served as Vice President and Treasurer of Brunswick from 2001 to 2013 and in a number of positions of increasing responsibility since his employment with Brunswick began in 1987.
Huw S. Bower
was named Vice President and President - Brunswick Boat Group in April 2016. Previously, he served as President - Boston Whaler Group from 2013 to 2016, as President - Lowe Boats from 2010 to 2013, and in positions of increasing responsibility since he started with Brunswick in 2006.
Christopher F. Dekker
was named Vice President, General Counsel and Secretary of Brunswick in October 2014. Prior to his appointment, Mr. Dekker served as Brunswick's Associate General Counsel, with responsibilities for litigation, employment, and compliance matters, from 2010 to 2014.
John C. Pfeifer
was named Senior Vice President and President - Mercury Marine in October 2018. Prior to his appointment, he was Vice President and President - Mercury Marine from 2014 to 2018 and Vice President - Global Operations for Mercury Marine from 2012 to 2014. He had previously been President of Brunswick Marine in EMEA (Europe, Middle East and Africa) from 2008 to 2014 after joining Brunswick in 2006 as President of the Brunswick Asia Pacific Group.
Brenna Preisser
was named Vice President and Chief Human Resources Officer and President, Business Acceleration in December 2018. Prior to this appointment, Ms. Preisser served as Vice President and Chief Human Resources Officer of Brunswick from 2016 to 2018. Ms. Preisser previously served as Senior Director – Human Resources for Brunswick from 2015 to 2016 and as Vice President – Human Resources for Life Fitness from 2013 to 2015. Ms. Preisser held a number of positions of increasing responsibility since she began her employment with Brunswick in 2004.
Daniel J. Tanner
was named Vice President and Controller of Brunswick in February 2016. Previously, he served as Assistant Vice President - Finance from 2015 to 2016, as Group Financial Officer for Life Fitness from 2003 to 2015, and as Director – Financial Planning and Analysis for Brunswick from 2001 to 2003.
21
PART II
Item 5. Market for Registrant's Common Equity, Related Stockholder Matters and Issuer Purchases of Equity Securities
Brunswick's common stock is traded on the New York and Chicago Stock Exchanges under the symbol "BC". As of
February 15, 2019
, there were
7,789
shareholders of record of the Company's common stock.
In the first, second, third and fourth quarters of
2018
, Brunswick paid quarterly dividends on its common stock of
$0.19
,
$0.19
,
$0.19
and
$0.21
per share, respectively. In the first, second, third and fourth quarters of
2017
, Brunswick paid quarterly dividends on its common stock of
$0.165
,
$0.165
,
$0.165
and
$0.19
per share, respectively. Brunswick expects to continue to pay quarterly dividends at the discretion of the Board of Directors, subject to continued capital availability and a determination that cash dividends continue to be in the best interest of the Company's shareholders.
Brunswick's dividend and share repurchase policies may be affected by, among other things, the Company's views on future liquidity, potential future capital requirements and restrictions contained in certain credit agreements.
Performance Graph
Comparison of Five-Year Cumulative Total Shareholder Return among Brunswick, S&P 500 Index and S&P 500 Global Industry Classification Standard (GICS) Consumer Discretionary Index
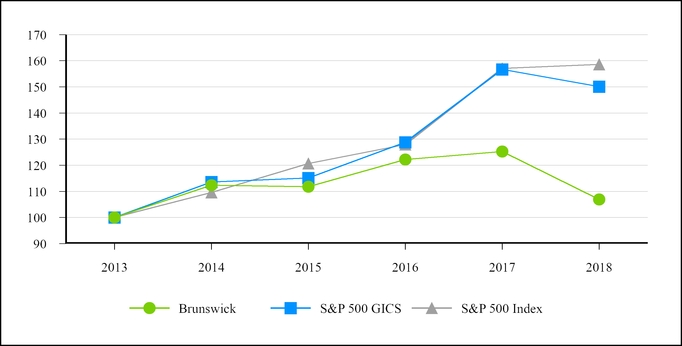
|
2013
|
2014
|
2015
|
2016
|
2017
|
2018
|
|||||||
|
Brunswick
|
100.00
|
|
112.32
|
|
111.82
|
|
122.15
|
|
125.22
|
|
106.95
|
|
|
S&P 500 GICS Consumer Discretionary Index
|
100.00
|
|
113.56
|
|
115.16
|
|
128.78
|
|
156.69
|
|
150.08
|
|
|
S&P 500 Index
|
100.00
|
|
109.61
|
|
120.70
|
|
127.90
|
|
157.11
|
|
158.62
|
|
The basis of comparison is a $100 investment at December 31,
2013
in each of: (i) Brunswick, (ii) the S&P 500 GICS Consumer Discretionary Index and (iii) the S&P 500 Index. All dividends are assumed to be reinvested. The S&P 500 GICS Consumer Discretionary Index encompasses industries including automotive, household durable goods, textiles and apparel and leisure equipment. Brunswick believes the companies included in this index provide the most representative sample of enterprises that are in primary lines of business that are similar to Brunswick's.
22
Issuer Purchases of Equity Securities
The Company has executed share repurchases against authorizations approved by the Board of Directors in 2014 and 2016. In
2018
, the Company repurchased
$75.0 million
of stock under these authorizations and as of
December 31, 2018
, the remaining authorization was
$34.8 million
.
The Company did not repurchase any shares of its common stock during the three months ended
December 31, 2018
.
23
Item 6. Selected Financial Data
The selected historical financial data presented below as of and for the years ended December 31,
2018
,
2017
and
2016
has been derived from, and should be read in conjunction with, the historical consolidated financial statements of the Company, including the notes thereto, and Item 7 of this report, including the
Matters Affecting Comparability
section. The selected historical financial data presented below as of and for the years ended December 31,
2015
and
2014
has been derived from the consolidated financial statements of the Company for those years and are not included in this Annual Report Form 10-K.
|
(in millions, except per share data)
|
2018
(A) (B)
|
2017
(A)
|
2016
|
2015
|
2014
(C)
|
||||||||||||||
|
Results of operations data
|
|||||||||||||||||||
|
Net sales
|
$
|
5,159.2
|
|
$
|
4,835.9
|
|
$
|
4,488.5
|
|
$
|
4,105.7
|
|
$
|
3,838.7
|
|
||||
|
Restructuring, exit, integration and impairment charges
|
80.9
|
|
81.3
|
|
15.6
|
|
12.4
|
|
4.2
|
|
|||||||||
|
Operating earnings
|
367.0
|
|
398.3
|
|
479.5
|
|
414.0
|
|
356.4
|
|
|||||||||
|
Pension settlement charge
|
—
|
|
96.6
|
|
55.1
|
|
82.3
|
|
27.9
|
|
|||||||||
|
Earnings before interest and income taxes
|
370.4
|
|
305.0
|
|
415.4
|
|
340.8
|
|
316.6
|
|
|||||||||
|
Earnings before income taxes
|
322.2
|
|
281.2
|
|
389.7
|
|
315.2
|
|
287.9
|
|
|||||||||
|
Net earnings from continuing operations
|
263.1
|
|
146.4
|
|
274.4
|
|
227.4
|
|
194.9
|
|
|||||||||
|
Net earnings from discontinued operations, net of tax
|
2.2
|
|
—
|
|
1.6
|
|
14.0
|
|
50.8
|
|
|||||||||
|
Net earnings
|
$
|
265.3
|
|
$
|
146.4
|
|
$
|
276.0
|
|
$
|
241.4
|
|
$
|
245.7
|
|
||||
|
Basic earnings per common share
|
|||||||||||||||||||
|
Earnings from continuing operations
|
$
|
3.00
|
|
$
|
1.64
|
|
$
|
3.01
|
|
$
|
2.45
|
|
$
|
2.08
|
|
||||
|
Net earnings from discontinued operations, net of tax
|
0.03
|
|
—
|
|
0.02
|
|
0.15
|
|
0.55
|
|
|||||||||
|
Net earnings
|
$
|
3.03
|
|
$
|
1.64
|
|
$
|
3.03
|
|
$
|
2.60
|
|
$
|
2.63
|
|
||||
|
Average shares used for computation of basic earnings per share
|
87.6
|
|
89.4
|
|
91.2
|
|
93.0
|
|
93.6
|
|
|||||||||
|
Diluted earnings per common share
|
|||||||||||||||||||
|
Earnings from continuing operations
|
$
|
2.98
|
|
$
|
1.62
|
|
$
|
2.98
|
|
$
|
2.41
|
|
$
|
2.05
|
|
||||
|
Net earnings from discontinued operations, net of tax
|
0.03
|
|
—
|
|
0.02
|
|
0.15
|
|
0.53
|
|
|||||||||
|
Net earnings
|
$
|
3.01
|
|
$
|
1.62
|
|
$
|
3.00
|
|
$
|
2.56
|
|
$
|
2.58
|
|
||||
|
Average shares used for computation of diluted earnings per share
|
88.2
|
|
90.1
|
|
92.0
|
|
94.3
|
|
95.1
|
|
|||||||||
|
(A)
|
Refer to
Note 23 –
Quarterly Data (unaudited)
, for further details on certain unusual items which impacted 2018 and 2017 results.
|
|
(B)
|
2018 Earnings before income taxes includes transaction financing charges of
$5.1 million
.
|
|
(C)
|
2014 Earnings before interest and income taxes includes a $20.2 million impairment charge related to an equity investment.
|
24
|
(in millions, except per share and other data)
|
2018
|
2017
|
2016
|
2015
|
2014
|
||||||||||||||
|
Balance sheet data
|
|||||||||||||||||||
|
Total assets of continuing operations
|
$
|
4,285.7
|
|
$
|
3,358.2
|
|
$
|
3,284.7
|
|
$
|
3,152.5
|
|
$
|
3,087.9
|
|
||||
|
Debt
|
|||||||||||||||||||
|
Short-term
|
$
|
41.3
|
|
$
|
5.6
|
|
$
|
5.9
|
|
$
|
6.0
|
|
$
|
5.5
|
|
||||
|
Long-term
|
1,179.5
|
|
431.8
|
|
436.5
|
|
442.5
|
|
446.3
|
|
|||||||||
|
Total debt
|
1,220.8
|
|
437.4
|
|
442.4
|
|
448.5
|
|
451.8
|
|
|||||||||
|
Common shareholders' equity
|
1,582.6
|
|
1,482.9
|
|
1,440.1
|
|
1,281.3
|
|
1,171.5
|
|
|||||||||
|
Total capitalization
|
$
|
2,803.4
|
|
$
|
1,920.3
|
|
$
|
1,882.5
|
|
$
|
1,729.8
|
|
$
|
1,623.3
|
|
||||
|
Cash flow data
|
|||||||||||||||||||
|
Net cash provided by operating activities of continuing operations
|
$
|
337.0
|
|
$
|
401.6
|
|
$
|
439.1
|
|
$
|
345.3
|
|
$
|
255.3
|
|
||||
|
Depreciation and amortization
|
149.6
|
|
110.8
|
|
103.9
|
|
88.9
|
|
81.2
|
|
|||||||||
|
Capital expenditures
|
193.4
|
|
203.2
|
|
193.9
|
|
132.5
|
|
124.8
|
|
|||||||||
|
Investments
|
(10.8
|
)
|
(3.2
|
)
|
5.1
|
|
0.9
|
|
0.2
|
|
|||||||||
|
Cash dividends paid
|
67.8
|
|
60.6
|
|
55.4
|
|
48.3
|
|
41.7
|
|
|||||||||
|
Other data
|
|||||||||||||||||||
|
Dividends declared per share
|
$
|
0.78
|
|
$
|
0.685
|
|
$
|
0.615
|
|
$
|
0.525
|
|
$
|
0.45
|
|
||||
|
Book value per share
|
18.23
|
|
16.95
|
|
15.77
|
|
14.11
|
|
12.64
|
|
|||||||||
|
Return on beginning shareholders' equity
|
17.9
|
%
|
10.2
|
%
|
21.5
|
%
|
20.6
|
%
|
23.7
|
%
|
|||||||||
|
Effective tax rate from continuing operations
|
18.3
|
%
|
47.9
|
%
|
29.6
|
%
|
27.9
|
%
|
32.3
|
%
|
|||||||||
|
Debt-to-capitalization rate
|
43.5
|
%
|
22.8
|
%
|
23.5
|
%
|
25.9
|
%
|
27.8
|
%
|
|||||||||
|
Number of employees
|
16,038
|
|
15,116
|
|
14,415
|
|
12,745
|
|
12,165
|
|
|||||||||
|
Number of shareholders of record
|
7,823
|
|
8,247
|
|
8,683
|
|
9,009
|
|
9,488
|
|
|||||||||
|
Common stock price (NYSE)
|
|||||||||||||||||||
|
High
|
$
|
69.82
|
|
$
|
63.82
|
|
$
|
56.30
|
|
$
|
56.63
|
|
$
|
51.94
|
|
||||
|
Low
|
41.92
|
|
48.04
|
|
36.05
|
|
46.08
|
|
38.95
|
|
|||||||||
|
Close (last trading day)
|
46.45
|
|
55.22
|
|
54.54
|
|
50.51
|
|
51.26
|
|
|||||||||
The Notes to Consolidated Financial Statements should be read in conjunction with the above summary.
25
Item 7. Management's Discussion and Analysis of Financial Condition and Results of Operations
Certain statements in Management’s Discussion and Analysis are based on non-GAAP financial measures. GAAP refers to generally accepted accounting principles in the United States. For example, the discussion of the Company’s cash flows includes an analysis of free cash flows and total liquidity; the discussion of the Company's net sales includes a discussion of net sales on a constant currency basis and excluding acquisitions and Sport Yacht and Yacht operations; the discussion of the Company's earnings includes a presentation of operating earnings and operating margin excluding restructuring, exit, integration and impairment charges, Sport Yacht and Yacht operations, purchase accounting amortization, costs related to the planned Fitness business separation, acquisition-related costs and certain non-recurring charges in the Fitness segment; gross margin excluding Sport Yacht and Yacht operations, purchase accounting amortization and certain non-recurring charges in the Fitness segment; and diluted earnings per common share, as adjusted. A “non-GAAP financial measure” is a numerical measure of a registrant’s historical or future financial performance, financial position or cash flows that excludes amounts, or is subject to adjustments that have the effect of excluding amounts, that are included in the most directly comparable measure calculated and presented in accordance with GAAP in the consolidated statements of operations, balance sheets or statements of cash flows of the issuer; or includes amounts, or is subject to adjustments that have the effect of including amounts, that are excluded from the most directly comparable measure so calculated and presented. Non-GAAP financial measures do not include operating and statistical measures.
The Company includes non-GAAP financial measures in Management’s Discussion and Analysis and elsewhere in this Annual Report on Form 10-K, as Brunswick’s management believes that these measures and the information they provide are useful to investors because they permit investors to view Brunswick’s performance using the same tools that management uses and to better evaluate the Company’s ongoing business performance. In order to better align Brunswick's reported results with the internal metrics used by the Company's management to evaluate business performance as well as to provide better comparisons to prior periods and peer data, non-GAAP measures exclude the impact of purchase accounting amortization related to the Power Products acquisition.
Certain statements in Management’s Discussion and Analysis are forward-looking as defined in the Private Securities Litigation Reform Act of 1995. Forward-looking statements are based on current expectations, estimates, and projections about Brunswick’s business and by their nature address matters that are, to different degrees, uncertain. Words such as “may,” “could,” “expect,” “anticipate,” “intend,” “target,” “plan,” “seek,” “estimate,” “believe,” “predict,” “project,” “outlook,” “goal,” and similar expressions are intended to identify forward-looking statements. Forward-looking statements are not guarantees of future performance and involve certain risks and uncertainties that may cause actual results to differ materially from expectations as of the date of this Annual Report on Form 10-K. These risks include, but are not limited to, those set forth under Item 1A of this Annual Report on Form 10-K. Forward-looking statements speak only as of the date on which they are made and Brunswick does not undertake any obligation to update them to reflect events or circumstances after the date of this Annual Report.
Brunswick does not provide forward-looking guidance for certain financial measures on a GAAP basis because it is unable to predict certain items contained in the GAAP measures without unreasonable efforts. These items may include pension settlement charges, restructuring, exit, integration and impairment costs, special tax items, costs related to the planned Fitness business separation, acquisition-related costs, and certain other unusual adjustments.
Overview and Outlook
Presentation of Sea Ray Results
In December 2017, the Board of Directors authorized the Company to exit its Sea Ray business, including the Meridian brand, and as a result, reclassified the assets and liabilities as held for sale on the Consolidated Balance Sheets and presented the results of the business as discontinued operations on the Consolidated Statements of Operations in the 2017 Form 10-K. In June 2018, the Board of Directors authorized the Company to end the sale process for its Sea Ray business and once again report the results of the business within continuing operations beginning in the second quarter of 2018. Refer to the Form 8-K dated July 19, 2018 and
Note 3 –
Discontinued Operations
in the Notes to Consolidated Financial Statements for further information.
Acquisition of Power Products
On August 9, 2018, the Company completed its acquisition of the Global Marine Business of Power Products Holdings, LLC (Power Products) for $909.6 million in cash, on a cash-free, debt-free basis. The net sales and operating earnings of Power Products included within Brunswick's financial statements since the date of acquisition were $82.8 million and $1.9 million, respectively, for the year ended December 31, 2018. Operating earnings included $21.2 million of purchase accounting amortization. For further discussion regarding the acquisition, refer to
Note 5 –
Acquisitions
in the Notes to Consolidated Financial Statements for further details.
26
Discontinued Operations
In the fourth quarter of 2018, the Company made adjustments to certain liabilities that were retained as part of the sale of the retail bowling business in 2014 and the bowling products business in 2015. Refer to
Note 3 –
Discontinued Operations
in the Notes to Consolidated Financial Statements for further information.
Overview
The Company's
2018
results represent the ninth consecutive year of growth, resulting from strong operating performance from our marine businesses. The Company looked to achieve the following financial objectives in
2018
:
|
•
|
Deliver revenue growth;
|
|
•
|
Increase earnings before income taxes, as well as deliver improvements in both gross margin and operating margin percentages; and
|
|
•
|
Continue to generate strong free cash flow and execute against the Company's capital strategy.
|
Achievements against the Company's financial objectives in
2018
were as follows:
Deliver revenue growth:
|
•
|
Ended the year with a 7 percent increase in net sales when compared with
2017
on a GAAP basis as well as on a constant currency basis excluding the impact of acquisitions along with Sea Ray Sport Yacht and Yacht operations, due to the following:
|
|
•
|
The Company's combined Marine segments reported strong growth in the Marine Engine segment and solid growth in the Boat segment;
|
|
▪
|
Marine Engine segment sales benefited from significant growth in propulsion, primarily as a result of organic growth in the outboard engine business, as well as steady growth in the marine parts and accessories businesses;
|
|
▪
|
Boat segment sales decreased slightly as a result of the winding down of Sport Yacht and Yacht operations during 2018. Excluding the impact of Sport Yacht and Yacht operations, sales increased across all three primary boat categories, with strong growth in the saltwater fishing category, primarily driven by Boston Whaler, and solid growth in the recreational fiberglass and aluminum fishing categories;
|
|
•
|
The U.S. marine market, which comprised 71 percent of the Company's marine sales, performed in line with expectations in 2018, with industry unit volume growing 3 percent. Outboard boats and engines drove industry growth, with increases in aluminum fishing boats and pontoons outpacing overall industry performance;
|
|
•
|
Fitness segment net sales were flat in 2018 compared with 2017 as growth in international markets was offset by declines in domestic sales, particularly of Cybex branded cardio product; and
|
|
•
|
International sales for the Company increased 6 percent in
2018
when compared with
2017
on a GAAP basis and increased 4 percent on a constant currency basis, excluding the impact of acquisitions and Sport Yacht and Yacht operations; the increase was driven by Asia-Pacific, Europe and Canada, while Rest-of-World regions declined slightly.
|
27
Increase earnings before income taxes, as well as deliver improvements in both gross margin and operating margin percentages:
|
•
|
Reported earnings before income taxes of
$322.2 million
in
2018
compared with earnings before income taxes of
$281.2 million
in
2017
; adjusted earnings before income taxes were $530.4 million in
2018
versus $504.5 million in
2017
;
|
|
•
|
Gross margin declined 50 basis points when compared with
2017
, resulting from the wind-down of Sport Yacht and Yacht operations as well as purchase accounting amortization associated with the Power Products acquisition. Additionally, several unfavorable factors in the Fitness segment contributed to gross margin declines. Partially offsetting these factors were volume benefits and a favorable impact from changes in sales mix, including benefits from new products in the marine businesses. Gross margin, as adjusted, also declined 50 basis points from the prior year; and
|
|
•
|
Operating margin declined by 110 basis points when compared with the prior year due to the factors affecting gross margin percentage discussed above, as well as costs associated with the planned Fitness business separation and acquisition-related costs. Operating margin, as adjusted, was flat versus 2017.
|
Continue to generate strong free cash flow and execute against the Company's capital strategy:
|
•
|
Generated free cash flow of $208.8 million in
2018
, enabling the Company to continue executing its capital strategy as follows:
|
|
•
|
Funded investments in growth:
|
|
•
|
Through the acquisition of Power Products for $909.6 million during
2018
; and
|
|
•
|
Organically through capital expenditures, which included investments in new products as well as capacity expansions, primarily within the Marine Engine segment.
|
|
•
|
Contributed $163.8 million to the Company's qualified and nonqualified defined benefit pension plans; and
|
|
•
|
Enhanced shareholder returns in
2018
by repurchasing $75.0 million of common stock under the Company’s share repurchase program and increased cash dividends paid to shareholders to $67.8 million.
|
|
•
|
Ended the year with $304.2 million of cash and marketable securities.
|
Net earnings from continuing operations increased to $263.1 million in
2018
from $146.4 million in
2017
. The
2018
results include an income tax provision of
$59.1 million
, which was based on a U.S. federal statutory rate of 21 percent and included a net benefit of $4.1 million primarily related to 2017 U.S. tax reform updates. The
2017
results reflect an income tax provision of $134.8 million, which was based on a U.S. federal statutory rate of 35 percent and included net charges of $69.7 million mostly relating to the impact of U.S. tax reform, including the impact on deferred tax balances from the reduction in the statutory rate from 35 percent to 21 percent, along with an estimate of taxes payable on deemed unrepatriated foreign earnings.
Outlook for
2019
The Company is projecting
2019
to be another year of strong revenue and earnings growth with excellent free cash flow generation in excess of $320 million, with approximately $20 million attributable to the Company's Fitness segment. The Company is targeting growth in the combined marine segments in the range of 9 percent to 11 percent, including an approximate 4 percent benefit from completed acquisitions, and mid single-digit percent declines in the Fitness segment.
The marine segments are expected to benefit from a steady global marine market, ongoing benefits from customer migration to higher horsepower engines and boats with increased technology and content, and market share gains due in part to the continued strong demand and acceptance of new outboard products. The Company anticipates the Marine Engine segment will increase net sales at a rate of low-to-mid-teens percent including the Power Products acquisition as well as continued growth in market share in outboard engines, especially in the greater than 150 horsepower categories. Boat segment net sales are expected to grow low-to-mid-single digit percent including benefits from growth in premium brands in the U.S. The Company expects Fitness segment net sales to decline, reflecting lower sales to value-oriented health clubs and stable market demand.
The Company is planning to deliver higher earnings before income taxes in
2019
resulting from increased revenue and improvements in both gross margin and operating margin levels. Margin gains reflect strong improvement in the marine segments,
28
partially offset by margins in the Fitness segment. The Company projects operating expenses to increase in
2019
as it continues to fund incremental investments to support growth and incur costs in connection with the Fitness business separation.
Gross margins for the Company's marine segments in 2019 are anticipated to benefit from new products, volume leverage and cost reduction activities; additionally, the Marine Engine segment will benefit from the Power Products acquisition. Partially offsetting these positive factors are the estimated impacts of tariffs and unfavorable movements in foreign exchange rates, which are expected to have an incremental negative impact on gross margins versus 2018. Operating expenses for both marine segments are estimated to decline slightly versus 2018 on a percentage of sales basis. Fitness segment gross margins in 2019 are anticipated to remain consistent with 2018 levels, including benefits from cost reduction initiatives. Operating margins are expected to decline due to planned investments in new products and modernizing information technology platforms which are intended to position the Fitness business to succeed as an independent entity.
The Company is planning for its effective tax rate in
2019
to be approximately 23 percent to 24 percent based on existing tax law.
Matters Affecting Comparability
Certain events occurred during
2018
,
2017
and
2016
that the Company believes affect the comparability of the results of operations. The tables below summarize the impact of changes in currency exchange rates, the impact of recent acquisitions and the impact of Sport Yacht and Yacht operations on the Company's net sales:
|
Net Sales
|
2018 vs. 2017
|
||||||||||||||
|
(in millions)
|
2018
|
2017
|
GAAP
|
Currency
Impact
|
Acquisition Impact
|
Impact of Sport Yacht and Yacht
|
|||||||||
|
Marine Engine
|
$
|
2,993.6
|
|
$
|
2,631.8
|
|
13.7%
|
0.1%
|
4.0%
|
—
|
|||||
|
Boat
|
1,471.3
|
|
1,490.6
|
|
(1.3)%
|
0.5%
|
—
|
(7.5)%
|
|||||||
|
Marine eliminations
|
(344.0
|
)
|
(320.2
|
)
|
|||||||||||
|
Total Marine
|
4,120.9
|
|
3,802.2
|
|
8.4%
|
0.3%
|
2.8%
|
(3.1)%
|
|||||||
|
Fitness
|
1,038.3
|
|
1,033.7
|
|
0.4%
|
0.3%
|
—
|
—
|
|||||||
|
Total
|
$
|
5,159.2
|
|
$
|
4,835.9
|
|
6.7%
|
0.3%
|
2.2%
|
(2.3)%
|
|||||
|
Net Sales
|
2017 vs. 2016
|
||||||||||||||
|
(in millions)
|
2017
|
2016
|
GAAP
|
Currency
Impact
|
Acquisition Impact
|
Impact of Sport Yacht and Yacht
|
|||||||||
|
Marine Engine
|
$
|
2,631.8
|
|
$
|
2,441.1
|
|
7.8%
|
0.2%
|
1.0%
|
—
|
|||||
|
Boat
|
1,490.6
|
|
1,369.9
|
|
8.8%
|
0.2%
|
0.7%
|
(5.0)%
|
|||||||
|
Marine eliminations
|
(320.2
|
)
|
(302.9
|
)
|
|||||||||||
|
Total Marine
|
3,802.2
|
|
3,508.1
|
|
8.4%
|
0.2%
|
1.0%
|
(1.7)%
|
|||||||
|
Fitness
|
1,033.7
|
|
980.4
|
|
5.4%
|
(0.0)%
|
3.1%
|
—
|
|||||||
|
Total
|
$
|
4,835.9
|
|
$
|
4,488.5
|
|
7.7%
|
0.2%
|
1.4%
|
(1.3)%
|
|||||
Retention of the Sea Ray business and wind down of Sport Yacht and Yacht operations.
As a result of the decision to retain and restructure the Sea Ray business and wind down Sport Yacht and Yacht operations as discussed in
Note 3 –
Discontinued Operations
in the Notes to Consolidated Financial Statements, starting in the second quarter of 2018, the results of the Sea Ray business are reported in continuing operations. The results of Sport Yacht and Yacht operations are summarized in the table below.
29
|
Year Ended
|
|||||||||||
|
(in millions)
|
2018
|
2017
|
2016
|
||||||||
|
Net sales
(A)
|
$
|
49.4
|
|
$
|
151.6
|
|
$
|
194.4
|
|
||
|
Gross margin
(A)
|
(39.7
|
)
|
(12.4
|
)
|
12.6
|
|
|||||
|
Restructuring, exit, integration and impairment charges
|
49.4
|
|
23.3
|
|
—
|
|
|||||
|
Operating loss
(A)
|
(107.8
|
)
|
(55.2
|
)
|
(9.5
|
)
|
|||||
(A) During 2018, Sport Yacht and Yacht results include $16.0 million of charges within Net sales related to estimated retail sales promotions to support the sale of sport yachts and yachts in the dealer pipeline. There were no comparable charges in 2017 or 2016.
Acquisitions.
The Company completed acquisitions during
2018
,
2017
and
2016
that affect the comparability of net sales. The impacts on consolidated and segment sales comparisons are reflected above. Refer to
Note 5 –
Acquisitions
in the Notes to Consolidated Financial Statements for further information.
Changes in foreign currency rates.
Percentage changes in net sales expressed in constant currency reflect the impact that changes in currency exchange rates had on comparisons of net sales. To determine this information, net sales transacted in currencies other than U.S. dollars have been translated to U.S. dollars using the average exchange rates that were in effect during the comparative period. The percentage change in net sales expressed on a constant currency basis better reflects the changes in the underlying business trends, excluding the impact of translation arising from foreign currency exchange rate fluctuations. Approximately 21 percent of the Company's annual net sales are transacted in a currency other than the U.S. dollar. The Company's most material exposures include sales in Euros, Canadian dollars, Australian dollars, Brazilian reais and British pounds.
Additionally, operating earnings comparisons were negatively affected by foreign exchange rates by approximately $2 million in 2018 when compared with 2017, and were positively affected by foreign exchange rates by approximately $1 million in 2017 when compared with 2016. These estimates include the impact of translation on all sales and costs transacted in a currency other than the U.S. dollar, the impact of hedging activities and pricing actions in certain international markets in response to the changes in the exchange rate between the local currency and the U.S. dollar.
Restructuring, exit, integration and impairment charges
. The Company recorded restructuring, exit, integration and impairment charges during
2018
,
2017
and
2016
. The following table summarizes these charges by cash charges and non-cash charges.
|
(in millions)
|
2018
|
2017
|
2016
|
||||||||
|
Cash charges:
|
|||||||||||
|
Boat
(A)
|
$
|
27.5
|
|
$
|
5.4
|
|
$
|
0.6
|
|
||
|
Fitness
(B)
|
3.5
|
|
13.7
|
|
12.7
|
|
|||||
|
Corporate
|
1.5
|
|
1.6
|
|
—
|
|
|||||
|
Total cash charges
|
32.5
|
|
20.7
|
|
13.3
|
|
|||||
|
Non-cash charges:
|
|||||||||||
|
Boat
(A)
|
26.6
|
|
43.2
|
|
—
|
|
|||||
|
Fitness
(B)
|
21.8
|
|
16.6
|
|
—
|
|
|||||
|
Corporate
|
—
|
|
0.8
|
|
2.3
|
|
|||||
|
Total non-cash charges
|
48.4
|
|
60.6
|
|
2.3
|
|
|||||
|
Total restructuring, exit, integration and impairment charges
|
$
|
80.9
|
|
$
|
81.3
|
|
$
|
15.6
|
|
||
_______________
(A) Restructuring, exit, integration and impairment activities within the Boat segment primarily related to the wind-down of Sport Yacht and Yacht operations. As the wind-down was largely completed during 2018, the operating losses and cash flows in excess of restructuring activities will no longer be incurred.
(B)
As a result of Restructuring, exit, integration and impairment activities, the Company anticipates future cost savings of approximately $5 million in the Fitness segment, with the full impact realized in 2019. Future cost savings will primarily be reflected within Selling, general and administrative expense.
See
Note 4 –
Restructuring, Exit, Integration and Impairment Activities
in the Notes to Consolidated Financial Statements for further details on charges and initiatives.
Purchase accounting amortization.
As part of purchase accounting for the Power Products acquisition, the Company recognized definite-lived intangible assets as well as a fair value adjustment to inventory, both of which will be amortized over
30
their useful lives. During 2018, the Company recorded $12.0 million and $9.2 million of purchase accounting amortization within Selling, general and administrative expense and Cost of sales, respectively. There was no purchase accounting amortization for Power Products during 2017 or 2016.
Fitness business separation charges.
On March 1, 2018, the Company's Board of Directors authorized proceeding with separating its Fitness business from the Company portfolio. In connection with this action, the Company incurred $19.3 million of charges within Selling, general and administrative expense during 2018. There were no comparable charges in 2017 or 2016.
Acquisition-related costs.
In connection with the Power Products acquisition, the Company recorded $13.8 million of costs within Selling, general and administrative expense during 2018. As part of the financing of the acquisition, the Company recorded $5.1 million of Transaction financing charges in 2018 to secure the 364-Day Senior Unsecured Bridge Facility as described in
Note 17 –
Debt
in the Notes to Consolidated Financial Statements. There were no comparable charges in 2017 or 2016.
Other non-recurring charges in the Fitness segment.
The Company's Fitness segment recorded $11.8 million and $13.5 million of non-recurring charges in 2018 and 2017, respectively. The charges in 2018 consisted of $3.6 million within Selling, general and administrative expense related to a contract dispute, $3.1 million within Cost of sales related to the settlement of supplier obligations, $2.8 million within Selling, general and administrative expense associated with the delayed submission of import duty filings in a foreign jurisdiction and $2.3 million within Cost of sales for a product field campaign. For 2017, non-recurring charges consisted of
$8.4 million
and
$5.1 million
within Cost of sales and Selling, general and administrative expense, respectively, related to field campaigns pertaining to certain Cybex products designed prior to the acquisition. Refer to
Note 14 –
Commitments and Contingencies
for further details.
Pension settlement charges.
There were no pension settlement charges in 2018. In the fourth quarters of
2017
and
2016
, the Company recognized $96.6 million and $55.1 million of charges, respectively, related to actions taken to settle a portion of its pension obligations. These actions included transferring certain plan obligations to a third party by purchasing annuities on behalf of plan participants and making lump-sum payments directly to certain plan participants, as applicable. These costs are reflected in
Pension settlement charge
on the Consolidated Statements of Operations. See
Note 18 –
Postretirement Benefits
in the Notes to Consolidated Financial Statements for further details.
Adoption of new revenue standard.
On January 1, 2018, the Company adopted ASU 2014-09, Revenue from Contracts with Customers, (new revenue standard) using the modified retrospective method. As a result of applying the new revenue standard, the Company reported higher Net sales of
$15.6 million
and higher Operating earnings of
$10.1 million
during the year ended December 31, 2018 when compared with previous GAAP. Refer to
Note 1 –
Significant Accounting Policies
in the Notes to Consolidated Financial Statements for further information on the impact of the new revenue standard on the Company's consolidated financial statements. Refer to
Note 2 –
Revenue Recognition
in the Notes to Consolidated Financial Statements for further discussion of the Company's revenue recognition policies and a presentation of disaggregated revenue.
Tax items.
As a result of U.S. tax reform, the Company's U.S. federal statutory rate decreased to 21 percent in 2018 versus 35 percent in 2017 and 2016. In addition, the 2018 income tax provision of
$59.1 million
included a net benefit of $4.1 million primarily related to 2017 U.S. tax reform updates. The
2017
results reflected an income tax provision of $134.8 million, which included net charges of $69.7 million mostly relating to the impact of U.S. tax reform, including the impact on deferred tax balances from the reduction in the statutory rate from 35 percent to 21 percent, along with an estimate of taxes payable on deemed unrepatriated foreign earnings. The 2016 results include an income tax provision of $115.3 million, which included a net tax charge of $1.1 million, primarily associated with the impact of changes in tax laws partially offset by the reassessment of tax reserves and favorable valuation allowance adjustments.
See
Note 13 –
Income Taxes
in the Notes to Consolidated Financial Statements for further details.
31
Results of Operations
Consolidated
The following table sets forth certain amounts, ratios and relationships calculated from the Consolidated Statements of Operations for
2018
,
2017
and
2016
:
|
2018 vs. 2017
|
2017 vs. 2016
|
||||||||||||||||||||||||
|
(in millions, except per share data)
|
2018
|
2017
|
2016
|
$
|
%
|
$
|
%
|
||||||||||||||||||
|
Net sales
|
$
|
5,159.2
|
|
$
|
4,835.9
|
|
$
|
4,488.5
|
|
$
|
323.3
|
|
6.7
|
%
|
$
|
347.4
|
|
7.7
|
%
|
||||||
|
Gross margin
(A) (B)
|
1,321.0
|
|
1,262.1
|
|
1,232.4
|
|
58.9
|
|
4.7
|
%
|
29.7
|
|
2.4
|
%
|
|||||||||||
|
Restructuring, exit, integration and impairment charges
|
80.9
|
|
81.3
|
|
15.6
|
|
(0.4
|
)
|
(0.5
|
)%
|
65.7
|
|
NM
|
|
|||||||||||
|
Operating earnings
(B)
|
367.0
|
|
398.3
|
|
479.5
|
|
(31.3
|
)
|
(7.9
|
)%
|
(81.2
|
)
|
(16.9
|
)%
|
|||||||||||
|
Pension settlement charge
|
—
|
|
96.6
|
|
55.1
|
|
(96.6
|
)
|
(100.0
|
)%
|
41.5
|
|
75.3
|
%
|
|||||||||||
|
Transaction financing charges
|
5.1
|
|
—
|
|
—
|
|
5.1
|
|
NM
|
|
—
|
|
NM
|
|
|||||||||||
|
Net earnings from continuing operations
(B)
|
263.1
|
|
146.4
|
|
274.4
|
|
116.7
|
|
79.7
|
%
|
(128.0
|
)
|
(46.6
|
)%
|
|||||||||||
|
Diluted earnings per share from continuing operations
|
$
|
2.98
|
|
$
|
1.62
|
|
$
|
2.98
|
|
$
|
1.36
|
|
84.0
|
%
|
$
|
(1.36
|
)
|
(45.6
|
)%
|
||||||
|
Expressed as a percentage of Net sales:
|
|
|
|
|
|
|
|
|
|
|
|||||||||||||||
|
Gross margin
|
25.6
|
%
|
26.1
|
%
|
27.5
|
%
|
|
|
(50) bpts
|
|
(140) bpts
|
|
|||||||||||||
|
Selling, general and administrative expense
|
14.0
|
%
|
13.2
|
%
|
13.3
|
%
|
|
|
80 bpts
|
|
(10) bpts
|
|
|||||||||||||
|
Research and development expense
|
2.9
|
%
|
3.0
|
%
|
3.1
|
%
|
|
|
(10) bpts
|
|
(10) bpts
|
|
|||||||||||||
|
Operating margin
|
7.1
|
%
|
8.2
|
%
|
10.7
|
%
|
|
|
(110) bpts
|
|
(250) bpts
|
|
|||||||||||||
NM = not meaningful
bpts = basis points
|
(A)
|
Gross margin is defined as Net sales less Cost of sales as presented in the Consolidated Statements of Operations.
|
|
(B)
|
Refer to
Note 23 –
Quarterly Data (unaudited)
, for further details on certain unusual items which impacted 2018 and 2017 results.
|
2018
vs.
2017
Net sales increased during
2018
when compared with
2017
driven by strong growth in the Marine Engine segment. Marine Engine segment sales benefited from significant growth in propulsion, primarily as a result of organic growth in the outboard engine business driven by high demand for new outboard products, as well as the marine parts and accessories businesses, which included contributions from the Power Products acquisition.
Boat segment sales decreased slightly as a result of the winding down of Sport Yacht and Yacht operations during 2018. Excluding the impact of Sport Yacht and Yacht operations, sales increased across all three primary boat categories, with strong growth in the saltwater fishing category, primarily driven by Boston Whaler, and solid growth in the recreational fiberglass and aluminum fishing categories.
Fitness segment net sales were flat in 2018 compared with 2017 as growth in international markets was offset by declines in domestic sales, particularly of Cybex branded cardio product. International net sales for the Company increased 6 percent in
2018
on a GAAP basis; on a constant currency basis and excluding the impact of acquisitions and Sport Yacht and Yacht operations, international sales increased 4 percent, driven by increases in Asia-Pacific, Europe and Canada, partially offset by declines in Rest-of-World.
Gross margin percent decreased in
2018
when compared with 2017, reflecting the wind-down of the Sport Yacht and Yacht operations as well as purchase accounting amortization. Additionally, several unfavorable factors drove lower gross margins in the Fitness segment including inventory cost adjustments primarily related to product transitions, higher freight costs, an unfavorable impact from changes in sales mix and cost inflation and inefficiencies. Partially offsetting these factors were favorable items in the marine businesses including volume benefits and a favorable impact from changes in sales mix, including benefits from new products.
Selling, general and administrative expense and Research and development expense increased during 2018 when compared with 2017. Selling, general and administrative expense in 2018 included purchase accounting amortization associated with the Power Products acquisition, costs associated with the planned Fitness business separation and acquisition-related costs. Both expenses reflected planned spending increases to support new product promotion and development, primarily in the Marine Engine segment.
32
During
2018
, the Company recorded restructuring, exit, integration and impairment charges of
$80.9 million
compared with
$81.3 million
in
2017
. See
Note 4 –
Restructuring, Exit, Integration and Impairment Activities
in the Notes to Consolidated Financial Statements for further details.
The Company recognized equity earnings of
$7.7 million
and
$6.1 million
in
2018
and
2017
, respectively, which were mainly related to the Company's marine joint ventures. Equity earnings in 2018 included a $2.3 million gain on the sale of an equity investment as discussed in
Note 10 –
Investments
in
the Notes to Consolidated Financial Statements.
In
2017
, the Company recorded
$96.6 million
, respectively, of charges related to pension settlement actions as discussed in
Note 18 –
Postretirement Benefits
in the Notes to Consolidated Financial Statements. There were no pension settlement actions in 2018.
The Company recognized
$4.3 million
and
$2.8 million
in
2018
and
2017
, respectively, in
Other expense, net
.
Other expense, net
primarily includes pension and other postretirement benefit costs, the amortization of deferred income related to a trademark licensing agreement with AMF Bowling Centers, Inc. as discussed in
Note 1 –
Significant Accounting Policies
in
the Notes to Consolidated Financial Statements, as well as remeasurement gains and losses resulting from changes in foreign currency rates.
Net interest expense increased $19.3 million in
2018
compared with
2017
primarily due to recent debt issuances as discussed in
Note 17 –
Debt
in the Notes to Consolidated Financial Statements.
Interest expense also included the mark-to-market impact of the Company's fixed-to-floating rate interest rate swaps.
Transaction financing charges of $5.1 million in 2018 related to the 364-Day Senior Unsecured Bridge Facility which was secured in connection with the Power Products acquisition as discussed in
Note 17 –
Debt
in the Notes to Consolidated Financial Statements.
As a result of U.S. tax reform, the Company's U.S. federal statutory rate decreased to 21 percent in 2018 versus 35 percent in 2017. In addition, the 2018 income tax provision of
$59.1 million
included a net benefit of $4.1 million primarily related to 2017 U.S. tax reform updates. The
2017
results reflected an income tax provision of $134.8 million, which included net charges of $69.7 million mostly relating to the impact of U.S. tax reform, including the impact on deferred tax balances from the reduction in the statutory rate from 35 percent to 21 percent, along with an estimate of taxes payable on deemed unrepatriated foreign earnings.
The effective tax rate for 2018 and 2017 was
18.3
percent and
47.9
percent, respectively.
The Company's effective tax rate also reflects the benefit of having earnings from foreign entities that are in jurisdictions that have lower statutory tax rates than the U.S. This includes entities in Hungary, China and Poland which have applicable statutory tax rates of
9 percent
,
15 percent
and
19 percent
, respectively.
See
Note 13 –
Income Taxes
in the Notes to Consolidated Financial Statements for further details on the impacts of the TCJA as well as a reconciliation of the Company's effective tax rate and statutory Federal income tax rate.
Operating earnings decreased, while Net earnings from continuing operations and Diluted earnings per common share from continuing operations increased in
2018
when compared with
2017
, primarily due to the factors discussed in the preceding paragraphs. The increase in Diluted earnings per common share from continuing operations also included benefits from common stock repurchases.
Diluted earnings per common share, as adjusted, increased by $0.76 per share, or 19 percent, to $4.77 per share for 2018 when compared with 2017, and excluded the following items in 2018: restructuring, exit, integration and impairment charges of $0.71 per share, losses related to Sport Yacht and Yacht operations of $0.51 per share, costs associated with the planned Fitness business separation of $0.19 per share, purchase accounting amortization of $0.18 per share, acquisition-related costs of $0.17 per share, other non-recurring charges in the Fitness segment of $0.10 per share, a net benefit from special tax items of $0.05 per share and a gain on the sale of an equity investment of $0.02 per share. In 2017, Diluted earnings per common share, as adjusted excluded $0.62 per share of restructuring, exit, integration and impairment charges, a net charge from special tax items of $0.76 per share, a pension settlement charge of $0.69 per share, losses related to Sport Yacht and Yacht operations of $0.22 per share and $0.10 per share of other non-recurring charges in the Fitness segment.
2017
vs.
2016
Net sales increased during 2017 when compared with 2016 due to increases across all segments. Marine Engine segment net sales increased due to strong growth in both outboard engines as well as the marine parts and accessories businesses. Outboard engines benefited from a favorable market environment, particularly for higher horsepower engines, and continued benefits from
33
new product launches and market share gains. The marine parts and accessories businesses benefited from several factors, including the successful execution of the Company's international growth strategy, recent acquisitions and new product launches. Boat segment net sales reflected strong growth in the saltwater fishing and aluminum freshwater categories, partially offset by slight declines in the recreational fiberglass category as a result of sales weakness in Sport Yacht and Yacht operations. Fitness segment net sales increased modestly reflecting growth in international markets while domestic demand was flat. International net sales for the Company increased 10 percent in 2017 on a GAAP basis; on a constant currency basis and excluding acquisitions and Sport Yacht and Yacht operations, international net sales increased 7 percent, driven by strong increases in Asia-Pacific as well as solid increases in other international markets.
Gross margin percent decreased in 2017 when compared with 2016, primarily driven by declines in the Fitness segment as a result of several factors, including higher costs, particularly costs for product field campaigns for certain Cybex products designed prior to the acquisition as well as higher freight costs, particularly in the fourth quarter, challenging pricing dynamics in certain international markets and unfavorable changes in sales mix. Gross margin declines also reflected increased warranty costs and manufacturing inefficiencies for Sport Yacht and Yacht operations.
Selling, general and administrative expense and Research and development expense line items increased during 2017 when compared with 2016, but decreased as a percentage of net sales. Both line items reflected increased funding to support investments in new products and growth initiatives, partially offset by cost reduction efforts.
During 2017, the Company recorded restructuring, integration and impairment charges of
$81.3 million
compared with
$15.6 million
in 2016. See
Note 4 –
Restructuring, Exit, Integration and Impairment Activities
in the Notes to Consolidated Financial Statements for further details.
The Company recognized equity earnings of
$6.1 million
and
$4.3 million
in 2017 and 2016, respectively, which were mainly related to the Company's marine joint ventures.
In 2017 and 2016, the Company recorded $96.6 million and $55.1 million, respectively, of charges related to pension settlement payments as discussed in
Note 18 –
Postretirement Benefits
in the Notes to Consolidated Financial Statements.
The Company recognized $(2.8) million and $(13.3) million in 2017 and 2016, respectively, in
Other expense, net
. The reduction of expense in 2017 primarily related to decreased pension expense as discussed in
Note 18 –
Postretirement Benefits
in the Notes to Consolidated Financial Statements.
Net interest expense decreased slightly in 2017 compared with 2016.
The Company recognized an income tax provision of $134.8 million in 2017, which included net charges of $69.7 million mostly relating to the impact of U.S. tax reform, including the impact on deferred tax balances from the reduction in the statutory rate from 35 percent to 21 percent, along with an estimate of taxes payable on deemed unrepatriated foreign earnings. The 2016 results include an income tax provision of $115.3 million, which included a net tax charge of $1.1 million, primarily associated with the impact of changes in tax laws partially offset by the reassessment of tax reserves and favorable valuation allowance adjustments. The effective tax rate for 2017 and 2016 was
47.9
percent and
29.6
percent, respectively. See
Note 13 –
Income Taxes
in the Notes to Consolidated Financial Statements for further details.
Operating earnings, Net earnings from continuing operations and Diluted earnings per common share from continuing operations decreased in 2017 when compared with 2016, primarily due to the factors discussed in the preceding paragraphs. The decrease in Diluted earnings per common share from continuing operations was partially offset by benefits from common stock repurchases.
Diluted earnings per common share, as adjusted, increased by $0.43 per share, or 12 percent, to $4.01 per share for 2017 when compared with 2016, and excluded the following items in 2017: $0.62 per share of restructuring, exit, integration and impairment charges, a net charge from special tax items of $0.76 per share, a pension settlement charge of $0.69 per share, losses related to Sport Yacht and Yacht operations of $0.22 per share and $0.10 per share of other non-recurring charges in the Fitness segment. In 2016, Diluted earnings per common share, as adjusted excluded a pension settlement charge of $0.38 per share, Restructuring, integration and impairment charges of $0.11 per share, losses related to Sport Yacht and Yacht operations of $0.10 per share and special tax items were a net charge of $0.01 per share.
34
Segments
The Company operates in three operating and reportable segments: Marine Engine, Boat and Fitness. Refer to
Note 7 –
Segment Information
in the Notes to Consolidated Financial Statements for details on the segment operations.
Marine Engine Segment
The following table sets forth Marine Engine segment results for the years ended December 31,
2018
,
2017
and
2016
:
|
2018 vs. 2017
|
2017 vs. 2016
|
||||||||||||||||||||||||
|
(in millions)
|
2018
|
2017
|
2016
|
$
|
%
|
$
|
%
|
||||||||||||||||||
|
Net sales
|
$
|
2,993.6
|
|
$
|
2,631.8
|
|
$
|
2,441.1
|
|
$
|
361.8
|
|
13.7
|
%
|
$
|
190.7
|
|
7.8
|
%
|
||||||
|
Operating earnings
(A)
|
454.4
|
|
411.3
|
|
378.4
|
|
43.1
|
|
10.5
|
%
|
32.9
|
|
8.7
|
%
|
|||||||||||
|
Operating margin
(A)
|
15.2
|
%
|
15.6
|
%
|
15.5
|
%
|
|
|
(40) bpts
|
|
10 bpts
|
|
|||||||||||||
bpts = basis points
(A) Includes $21.2 million of purchase accounting amortization and $13.8 million of acquisition-related costs in 2018.
2018
vs.
2017
Marine Engine segment net sales benefited from significant growth in both the propulsion and marine parts and accessories businesses. Propulsion benefited from organic growth as a result of robust demand for new, higher horsepower outboard products.
The marine parts and accessories business benefited from contributions from Power Products as well as steady organic growth in both the products and distribution businesses.
Acquisitions completed in 2018 and 2017 accounted for approximately 4 percentage points of the Marine Engine segment's overall revenue growth rate in 2018. International net sales were 30 percent of the segment's net sales in 2018, and increased 13 percent from the prior year on a GAAP basis. On a constant currency basis and excluding acquisitions, international net sales increased 6 percent in 2018, which included gains in all international regions.
The Marine Engine segment reported increased operating earnings in 2018 when compared with the prior year as a result of strong operating performance including higher net sales, favorable impacts from changes in sales mix and contributions from the acquisition of Power Products. Partially offsetting these factors were the impacts of purchase accounting amortization and acquisition-related costs. Additionally, the first half of the year included unfavorable impacts of plant efficiencies associated with production ramp-up for new products and the integration of new warehouse management systems as well as planned spending increases for product promotion and development.
2017
vs.
2016
Marine Engine segment net sales increased in 2017 versus 2016 due to strong growth in both outboard engines and the marine parts and accessories businesses.
Outboard engines benefited from a favorable market environment, particularly for higher horsepower engines, and continued benefits from market share gains, including benefits from newly launched products. The marine parts and accessories businesses benefited from the successful execution of the Company's international growth strategy, acquisitions and new product launches
. Partially offsetting these factors was a decrease in sterndrive engine net sales due to the continuing shift to outboards which is contributing to unfavorable global retail demand trends. Acquisitions completed in 2017 and 2016 accounted for 1 percentage point of the Marine Engine segment's overall revenue growth rate in 2017. International net sales were 30 percent of the segment's net sales in 2017, and increased 10 percent from the prior year on a GAAP basis. On a constant currency basis, international net sales increased 9 percent in 2017, which included gains in all international markets, with the strongest increases in Canada, Europe and Asia-Pacific.
Marine Engine segment operating earnings increased in 2017 as a result of higher net sales and favorable changes in product mix, partially offset by planned increases in growth investments in advance of new product introductions and the resolution of litigation in the fourth quarter of 2017.
35
Boat Segment
The following table sets forth Boat segment results for the years ended December 31,
2018
,
2017
and
2016
:
|
2018 vs. 2017
|
2017 vs. 2016
|
||||||||||||||||||||||||
|
(in millions)
|
2018
|
2017
|
2016
|
$
|
%
|
$
|
%
|
||||||||||||||||||
|
Boat segment:
|
|||||||||||||||||||||||||
|
Net sales
|
$
|
1,471.3
|
|
$
|
1,490.6
|
|
$
|
1,369.9
|
|
$
|
(19.3
|
)
|
(1.3
|
)%
|
$
|
120.7
|
|
8.8
|
%
|
||||||
|
Restructuring, exit, integration and impairment charges
(A)
|
54.1
|
|
48.6
|
|
0.6
|
|
5.5
|
|
11.3
|
%
|
48.0
|
|
NM
|
|
|||||||||||
|
Operating earnings (loss)
|
(12.5
|
)
|
5.3
|
|
60.8
|
|
(17.8
|
)
|
NM
|
|
(55.5
|
)
|
(91.3
|
)%
|
|||||||||||
|
Operating margin
|
(0.8
|
)%
|
0.4
|
%
|
4.4
|
%
|
|
|
(120) bpts
|
|
(400) bpts
|
|
|||||||||||||
|
Sport Yacht and Yacht operations:
|
|||||||||||||||||||||||||
|
Net sales
|
49.4
|
|
151.6
|
|
194.4
|
|
(102.2
|
)
|
(67.4
|
)%
|
(42.8
|
)
|
(22.0
|
)%
|
|||||||||||
|
Restructuring, exit, integration and impairment charges
(A)
|
49.4
|
|
23.3
|
|
—
|
|
26.1
|
|
NM
|
|
23.3
|
|
NM
|
|
|||||||||||
|
Operating loss
|
(107.8
|
)
|
(55.2
|
)
|
(9.5
|
)
|
(52.6
|
)
|
(95.3
|
)%
|
(45.7
|
)
|
NM
|
|
|||||||||||
|
Operating margin
|
NM
|
|
(36.4
|
)%
|
(4.9
|
)%
|
NM
|
|
NM
|
|
|||||||||||||||
NM = not meaningful
bpts = basis points
|
(A)
|
Restructuring charges in 2018 and 2017 primarily relate to the wind-down of Sport Yacht and Yacht operations. See
Note 4 –
Restructuring, Exit, Integration and Impairment Activities
in the Notes to Consolidated Financial Statements for further details.
|
2018
vs.
2017
Boat segment net sales decreased slightly in 2018 compared with the same prior year period, primarily as a result of the winding down of Sport Yacht and Yacht operations during 2018. Sport Yacht and Yacht sales negatively affected sales comparisons by
7
percent. Net sales for the segment benefited from strong growth in the saltwater fishing category, due in part to the impact of new products and of hurricane activity on 2017 results. Net sales growth excluding Sport Yacht and Yacht operations was solid for the recreational fiberglass category, led by continued sales growth for Sea Ray Sport Boats and Cruisers. Aluminum freshwater reported solid growth as strong sales increases in pontoon boats were partially offset by continued weakness at Lowe due to the transition of distribution away from Cabela's and lower sales into Canada due to the impact of retaliatory tariffs on wholesale shipments. Global wholesale boat shipments were down, but sales increases were aided by higher average selling prices as customers continued to migrate to boats with more content and higher horsepower engines, as well as growth in premium brands, which outpaced the performance of value product lines. In addition, price increases were implemented in response to cost inflation, particularly in aluminum fishing boats and pontoons. International net sales were 24 percent of the segment's net sales in 2018, a decrease of 6 percent from the prior year on a GAAP basis. On a constant currency basis and excluding Sport Yacht and Yacht operations, international net sales decreased 3 percent when compared with the same prior year period, mainly due to declines in Rest-of-World regions.
Boat segment operating earnings decreased in 2018 when compared with the prior year, including positive timing benefits from the adoption and implementation of the new revenue standard. The decrease was the result of losses from Sport Yacht and Yacht operations which included wind-down activities and higher restructuring, exit, integration and impairment charges. The other businesses posted an overall increase in earnings, benefitting from increased sales and a favorable impact from changes in product mix.
36
2017
vs.
2016
Boat segment net sales increased in 2017 versus 2016. The increase included the impact of Sport Yacht and Yacht operations, which negatively impacted sales comparisons by
5
percent. Excluding Sport Yacht and Yacht operations, Boat segment sales benefited from strong growth in all three primary boat categories and reflected growth in both domestic and international markets. Net sales benefited from increased global wholesale unit shipments as well as higher average selling prices, as customers continued to migrate to boats with more content and higher horsepower engines. An acquisition completed in 2016 accounted for 1 percentage point of the Boat segment's overall revenue growth rate in 2017. International net sales were 25 percent of the segment's net sales in 2017, an increase of 10 percent from the prior year on a GAAP basis. On a constant currency basis and excluding acquisitions and Sport Yacht and Yacht operations, international net sales increased 11 percent when compared with the same prior year period, mainly due to net sales increases in Canada and Europe.
Boat segment operating earnings decreased in 2017 when compared with 2016. The decrease was the result of losses from Sport Yacht and Yacht operations, reflecting higher restructuring, exit, integration and impairment charges and weaker operating performance. These factors more than offset earnings improvements from the rest of the businesses, which benefited from higher sales and margin gains, partially stemming from improved operating efficiencies.
Fitness Segment
The following table sets forth Fitness segment results for the years ended December 31,
2018
,
2017
and
2016
:
|
2018 vs. 2017
|
2017 vs. 2016
|
||||||||||||||||||||||||
|
(in millions)
|
2018
|
2017
|
2016
|
$
|
%
|
$
|
%
|
||||||||||||||||||
|
Net sales
|
$
|
1,038.3
|
|
$
|
1,033.7
|
|
$
|
980.4
|
|
$
|
4.6
|
|
0.4
|
%
|
$
|
53.3
|
|
5.4
|
%
|
||||||
|
Restructuring, exit, integration and impairment charges
(A)
|
25.3
|
|
30.3
|
|
12.7
|
|
(5.0
|
)
|
(16.5
|
)%
|
17.6
|
|
NM
|
|
|||||||||||
|
Operating earnings
(B)
|
22.4
|
|
64.1
|
|
117.3
|
|
(41.7
|
)
|
(65.1
|
)%
|
(53.2
|
)
|
(45.4
|
)%
|
|||||||||||
|
Operating margin
(B)
|
2.2
|
%
|
6.2
|
%
|
12.0
|
%
|
|
|
(400) bpts
|
|
(580) bpts
|
|
|||||||||||||
NM = not meaningful
bpts = basis points
|
(A)
|
Includes $22.1 million and $13.9 million in 2018 and 2017, respectively, related to Cybex trade name impairments. See
Note 4 –
Restructuring, Exit, Integration and Impairment Activities
in the Notes to Consolidated Financial Statements for further details.
|
(B) In 2018 and 2017, the Company's Fitness segment recorded $14.0 million and $13.5 million of non-recurring charges, respectively. The 2018 charges consisted of $3.6 million related to a contract dispute, $3.1 million related to the settlement of supplier obligations, $2.8 million associated with the delayed submission of foreign import duty filings, $2.3 million for a product field campaign and $2.2 million of charges related to the business separation. In 2017, the Fitness segment recorded a $13.5 million charge related to product field campaigns.
2018
vs.
2017
Fitness segment net sales were flat in 2018 compared with 2017 as growth in international markets was offset by declines in domestic sales, particularly of Cybex branded cardio product, and lower sales to value-oriented franchise clubs. This performance also included strong sales in the global commercial strength category due to increased demand resulting from a well-positioned product offering and evolving exerciser preferences. International net sales were 49 percent of the segment's net sales in 2018, and increased 6 percent from the prior year on a GAAP basis. On a constant currency basis, international net sales increased 5 percent, primarily driven by increases in Asia-Pacific and Europe, partially offset by slight declines in Canada.
Fitness segment operating earnings decreased in 2018 as a result of several factors affecting gross margins including inventory cost adjustments primarily related to product transitions, higher freight costs, an unfavorable impact from changes in sales mix and cost inflation and inefficiencies. These factors were partially offset by lower restructuring, exit, integration and impairment charges and higher sales, which included timing benefits from the adoption and implementation of the new revenue standard.
2017
vs.
2016
Fitness segment net sales increased in 2017 when compared with 2016 due primarily to growth in international markets including benefits from the ICG acquisition. Growth in sales to value-oriented franchise clubs continues to be offset by declines in sales to traditional clubs and certain vertical markets. Acquisitions completed in 2016 accounted for 3 percentage points of growth in 2017. International net sales were 46 percent of the segment's net sales in 2017 and increased 9 percent compared with
37
the prior year on both a GAAP basis and on a constant currency basis due to strength across most international markets, especially Asia-Pacific and Europe, partially offset by slight declines in Canada.
Fitness segment operating earnings decreased in 2017 when compared with the prior year resulting from lower margins, reflecting several factors, including higher restructuring, exit, integration and impairment charges, costs associated with product field campaigns for certain Cybex products, higher costs including freight, particularly in the fourth quarter, the impact of planned costs associated with capacity expansions and new products, more challenging competitive dynamics in certain international markets and unfavorable changes in sales mix, partially offset by higher sales and cost reduction initiatives.
Corporate/Other
The following table sets forth Corporate/Other results for the years ended December 31,
2018
,
2017
and
2016
:
|
2018 vs. 2017
|
2017 vs. 2016
|
||||||||||||||||||||||||
|
(in millions)
|
2018
|
2017
|
2016
|
$
|
%
|
$
|
%
|
||||||||||||||||||
|
Restructuring, exit, integration and impairment charges
(A)
|
$
|
1.5
|
|
$
|
2.4
|
|
$
|
2.3
|
|
$
|
(0.9
|
)
|
(37.5
|
)%
|
$
|
0.1
|
|
4.3
|
%
|
||||||
|
Operating loss
(B)
|
(97.3
|
)
|
(82.4
|
)
|
(77.0
|
)
|
(14.9
|
)
|
(18.1
|
)%
|
(5.4
|
)
|
(7.0
|
)%
|
|||||||||||
|
(A)
|
See
Note 4 –
Restructuring, Exit, Integration and Impairment Activities
in the Notes to Consolidated Financial Statements for further details.
|
|
(B)
|
Includes $17.1 million of costs related to the planned Fitness business separation.
|
Corporate operating expenses increased in 2018 compared with 2017 primarily due to costs related to the planned Fitness business separation. Comparisons also reflect lower restructuring, exit, integration and impairment charges. Corporate expenses increased in 2017 compared with 2016 primarily due to project and other growth initiative related spending, including investments in technology solutions and IT enhancements.
Cash Flow, Liquidity and Capital Resources
The following table sets forth an analysis of free cash flow for the
year
s ended December 31,
2018
,
2017
and
2016
:
|
(in millions)
|
2018
|
2017
|
2016
|
||||||||
|
Net cash provided by operating activities of continuing operations
|
$
|
337.0
|
|
$
|
401.6
|
|
$
|
439.1
|
|
||
|
Net cash provided by (used for):
|
|
|
|
|
|
|
|||||
|
Plus: Capital expenditures
|
(193.4
|
)
|
(203.2
|
)
|
(193.9
|
)
|
|||||
|
Plus: Proceeds from the sale of property, plant and equipment
|
6.7
|
|
8.5
|
|
1.9
|
|
|||||
|
Plus: Effect of exchange rate changes on cash and cash equivalents
|
(5.0
|
)
|
6.9
|
|
0.1
|
|
|||||
|
Less: Cash paid for Fitness business separation costs, net of tax
|
(9.8
|
)
|
—
|
|
—
|
|
|||||
|
Less: Cash impact of Sport Yacht and Yacht operations, net of tax
|
(53.7
|
)
|
(10.9
|
)
|
(20.6
|
)
|
|||||
|
Total free cash flow from continuing operations
(A)
|
$
|
208.8
|
|
$
|
224.7
|
|
$
|
267.8
|
|
||
(A) The Company defines “Free cash flow” as cash flow from operating and investing activities of continuing operations (excluding cash provided by or used for acquisitions, investments, purchases or sales/maturities of marketable securities and other investing activities, as well as cash paid for Fitness business separation costs, net of tax, and the cash impact of Sport Yacht and Yacht operations, net of tax) and the effect of exchange rate changes on cash and cash equivalents. Free cash flow is not intended as an alternative measure of cash flow from operations, as determined in accordance with GAAP in the United States. The Company uses this financial measure both in presenting its results to shareholders and the investment community and in its internal evaluation and management of its businesses. Management believes that this financial measure and the information it provides are useful to investors because it permits investors to view Brunswick’s performance using the same tool that management uses to gauge progress in achieving its goals. Management believes that the non-GAAP financial measure “Free cash flow” is also useful to investors because it is an indication of cash flow that may be available to fund investments in future growth initiatives.
Brunswick’s major sources of funds for capital investments, acquisitions, share repurchase programs and dividend payments are cash generated from operating activities, available cash and marketable securities balances and potential borrowings. The Company evaluates potential acquisitions, divestitures and joint ventures in the ordinary course of business.
38
2018
Cash Flow
In
2018
, net cash provided by operating activities of continuing operations totaled $337.0 million. The primary driver of the cash provided by operating activities was net earnings from continuing operations net of non-cash expense items. Additionally, the Company made discretionary pension contributions of $163.8 million to its qualified and nonqualified defined benefit plans. An increase in working capital had a negative effect on net cash provided by operating activities. Working capital is defined as Accounts and notes receivable, Inventories and Prepaid expenses and other, net of Accounts payable and Accrued expenses as presented in the Consolidated Balance Sheets excluding the impact of acquisitions. Net inventories increased by $84.2 million, primarily driven by increases in the Marine Engine segment due to increased production associated with new outboard products. Accounts receivable increased by $27.3 million as a result of strong year-over-year sales increases in the fourth quarter in the Company's Marine Engine segment. Partially offsetting these items were increases in Accounts payable of $49.3 million, mostly related to higher expenditures in the Marine Engine segment to support higher production, and Accrued expenses of $13.7 primarily due to customer rebates attributable to increased sales volume.
Net cash used for investing activities of continuing operations during
2018
totaled
$1,107.3 million
, which included cash paid for the acquisition of Power Products, net of cash acquired, of $909.6 million. See
Note 5 –
Acquisitions
in the Notes to Consolidated Financial Statements for further details on the Power Products acquisition. In addition, capital expenditures totaled
$193.4 million
. The Company's capital spending focused on investments in new products as well as capacity expansion initiatives, mostly in the marine segments. Net cash used for investing activities also included $10.8 million of investments which primarily related to the Company's marine joint ventures.
Net cash provided by financing activities was $620.5 million during 2018. The cash inflow was mainly due to $793.5 million of net proceeds from debt activity in connection with the Power Products acquisition, partially offset by common stock repurchase activity and cash dividends paid to common shareholders. Refer to
Note 17 –
Debt
in the Notes to Consolidated Financial Statements for further details on the Company's debt activity.
2017
Cash Flow
In
2017
, net cash provided by operating activities of continuing operations totaled
$401.6 million
. The primary driver of the cash provided by operating activities was net earnings from continuing operations net of non-cash expense items. An increase in working capital had a negative effect on net cash provided by operating activities. Net inventories increased by $69.7 million to support higher sales volumes and Accounts receivable increased by $57.2 million as a result of strong year-over-year sales increases in the fourth quarter. Partially offsetting these items were increases in Accrued expenses of $47.1 million and Accounts payable of $31.0 due to higher expenditure levels and timing of payments.
Net cash used for investing activities of continuing operations during 2017 totaled $178.9 million, which included capital expenditures of $203.2 million. The Company's capital spending was focused on new product introductions, capacity expansion and other profit enhancing projects in all segments. Cash paid for the acquisition of Lankhorst Taselaar, net of cash acquired, was $15.5 million. Net cash used for investing activities also included $35.0 million of maturities of marketable securities and Proceeds from the sale of Property, plant and equipment of $8.5 million.
Cash flows used for financing activities of continuing operations were $203.7 million during 2017 and included common stock repurchases and cash dividends paid to common stock shareholders.
2016
Cash Flow
In
2016
, net cash provided by operating activities of continuing operations totaled
$439.1 million
. The primary driver of the cash provided by operating activities was net earnings from continuing operations net of non-cash expense items. An increase in working capital had a negative effect on net cash provided by operating activities. Net inventories increased by $48.2 million due to increases in production to support higher sales volumes. Accrued expenses decreased $20.8 million which included the impact of the payments of deferred compensation in connection with executive management transitions. Partially offsetting these items was an increase in Accounts payable of $39.2 million, which was partially due to the timing of payments.
Net cash used for investing activities of continuing operations during 2016 totaled $486.0 million, which included capital expenditures of $193.9 million. The Company's capital spending was focused on new product introductions, capacity expansion projects in all segments and other high priority, profit-enhancing projects. Cash paid for acquisitions, net of cash acquired, totaled $276.1 million. Additionally, the Company had net purchases of marketable securities of $24.3 million during the year.
39
Cash flows used for financing activities of continuing operations were $185.8 million during 2016 and included common stock repurchases and cash dividends paid to common stock shareholders.
Liquidity and Capital Resources
The Company views its highly liquid assets as of
December 31, 2018
and
2017
as:
|
(in millions)
|
2018
|
2017
|
|||||
|
Cash and cash equivalents
|
$
|
294.4
|
|
$
|
448.8
|
|
|
|
Short-term investments in marketable securities
|
0.8
|
|
0.8
|
|
|||
|
Total cash, cash equivalents and marketable securities
|
$
|
295.2
|
|
$
|
449.6
|
|
|
The following table sets forth an analysis of Total liquidity as of
December 31, 2018
and
2017
:
|
(in millions)
|
2018
|
2017
|
|||||
|
Cash, cash equivalents and marketable securities
|
$
|
295.2
|
|
$
|
449.6
|
|
|
|
Amounts available under lending facilities
(A)
|
396.1
|
|
295.7
|
|
|||
|
Total liquidity
(B)
|
$
|
691.3
|
|
$
|
745.3
|
|
|
(A) See
Note 17 –
Debt
in the Notes to Consolidated Financial Statements for further details on the Company's lending facility.
(B) The Company defines Total liquidity as Cash and cash equivalents and Short-term investments in marketable securities as presented in the Condensed Consolidated Balance Sheets, plus amounts available for borrowing under its lending facilities. Total liquidity is not intended as an alternative measure to Cash and cash equivalents and Short-term investments in marketable securities as determined in accordance with GAAP in the United States. The Company uses this financial measure both in presenting its results to shareholders and the investment community and in its internal evaluation and management of its businesses. Management believes that this financial measure and the information it provides are useful to investors because it permits investors to view the Company’s performance using the same metric that management uses to gauge progress in achieving its goals. Management believes that the non-GAAP financial measure “Total liquidity” is also useful to investors because it is an indication of the Company’s available highly liquid assets and immediate sources of financing.
Cash, cash equivalents and marketable securities totaled
$295.2 million
as of
December 31, 2018
, a decrease of $154.4 million from
$449.6 million
as of
December 31, 2017
. Total debt as of
December 31, 2018
and
December 31, 2017
was $1,220.8 million and $437.4 million, respectively. The Company's debt-to-capitalization ratio increased to
43.5
percent as of
December 31, 2018
, from
22.8
percent as of
December 31, 2017
.
The Company secured short-term and long-term financing during 2018 in connection with the Power Products acquisition. Additionally, the Company amended and restated its existing credit agreement, increasing the borrowing capacity by $100 million and extending the credit agreement through September 2023. Management believes that the Company has adequate sources of liquidity to meet the Company's short-term and long-term needs. Refer to
Note 17 –
Debt
in the Notes to Consolidated Financial Statements for further details on the Company's borrowing activity in 2018.
The Company has executed share repurchases against authorizations approved by the Board of Directors in 2014 and 2016. In
2018
, the Company repurchased
$75.0 million
of stock under these authorizations and as of
December 31, 2018
, the remaining authorization was
$34.8 million
.
The Company contributed $160.0 million and $70.0 million to its qualified defined benefit pension plans in 2018 and 2017, respectively. The Company also contributed $3.8 million and $3.7 million to fund benefit payments from its nonqualified defined benefit pension plan in 2018 and 2017, respectively.
The aggregate funded status of the Company's qualified defined benefit pension plans, measured as a percentage of the projected benefit obligation, was approximately 103 percent at December 31, 2018 compared with approximately 80 percent at December 31, 2017. As of December 31, 2018, the Company's qualified defined benefit pension plans were over-funded on an aggregate projected benefit obligation basis by $18.4 million which represented a $156.0 million improvement from 2017. This improvement was mostly due to contributions of $160.0 million in 2018. As of December 31, 2018, the Company was left with a residual pre-tax funding requirement estimated to be between $15 million and $25 million to fully exit the plans. The Company plans to fully exit its defined benefit pension plans in 2019 and will incur charges in connection with this action, including the recognition of actuarial losses as well as certain income tax consequences.
See
Note 18 –
Postretirement Benefits
in the Notes to Consolidated Financial Statements for more details.
40
Capital Plan
The Company is projecting an increase in net earnings in 2019 when compared with 2018. Net activity in working capital is projected to reflect a usage of cash in 2019 in the range of $10 million to $30 million. Additionally, the Company is planning for capital expenditures of approximately $240 million to $260 million, including investments in capacity and new products, as well as certain cash payments in 2019 that relate to 2018 activities. Including these and other factors, the Company plans to generate free cash flow in 2018 in excess of $320 million, with approximately $20 million attributable to the Company's Fitness segment.
The Company plans on reducing debt by at least $150 million to $200 million primarily in the second half of 2019, with estimated interest expense in the range of $65 million to $70 million. Upon completion of the Fitness business separation, the Company will re-assess its debt retirement objectives and share repurchase activities. The 2019 capital plan does not incorporate the utilization of any net proceeds the Company may receive in connection with the Fitness business separation.
Including the previously described planned debt actions in 2019, the Company plans to substantially reduce all of its near-term maturity debt (maturities 2023 and prior) by the end of 2021. The reduction will be funded primarily through free cash flow, potentially augmented by proceeds from the Fitness business separation.
Quarterly dividend payments in the 2019 plan are anticipated to be $0.21 per share, consistent with current levels. However, the Company may adjust these levels as it evaluates opportunities to grow dividends.
The Company plans to fully exit its qualified defined benefit pension plans in 2019, which will require a residual pre-tax contribution of approximately $15 million to $25 million.
The Company expects its cash tax rate to be in the high-single digit percentage range in 2019.
Financial Services
Refer to
Note 11 –
Financing Joint Venture
in the Notes to Consolidated Financial Statements for more information about the Company's financial services.
Off-Balance Sheet Arrangements
Guarantees.
The Company has reserves to cover potential losses associated with guarantees and repurchase obligations based on historical experience and current facts and circumstances. Historical cash requirements and losses associated with these obligations have not been significant. See
Note 14 –
Commitments and Contingencies
in the Notes to Consolidated Financial Statements for a description of these arrangements.
Contractual Obligations
The following table sets forth a summary of the Company's contractual cash obligations as of
December 31, 2018
:
|
Payments due by period
|
|||||||||||||||||||
|
(in millions)
|
Total
|
Less than 1 year
|
1-3 years
|
3-5 years
|
More than 5 years
|
||||||||||||||
|
Contractual Obligations
|
|||||||||||||||||||
|
Debt
(A)
|
$
|
1,240.5
|
|
$
|
41.3
|
|
$
|
383.4
|
|
$
|
340.5
|
|
$
|
475.3
|
|
||||
|
Interest payments on long-term debt
|
163.5
|
|
26.2
|
|
52.3
|
|
38.5
|
|
46.5
|
|
|||||||||
|
Operating leases
(B)
|
153.4
|
|
40.3
|
|
58.8
|
|
31.4
|
|
22.9
|
|
|||||||||
|
Purchase obligations
(C)
|
211.6
|
|
209.1
|
|
2.4
|
|
0.1
|
|
—
|
|
|||||||||
|
Deferred management compensation
(D)
|
37.2
|
|
9.7
|
|
8.0
|
|
6.0
|
|
13.5
|
|
|||||||||
|
Other long-term liabilities
(E)
|
154.9
|
|
15.7
|
|
85.3
|
|
32.7
|
|
21.2
|
|
|||||||||
|
Total contractual obligations
|
$
|
1,961.1
|
|
$
|
342.3
|
|
$
|
590.2
|
|
$
|
449.2
|
|
$
|
579.4
|
|
||||
|
(A)
|
See
Note 17 –
Debt
in the Notes to Consolidated Financial Statements for additional information on the Company's debt. “Debt” refers to future cash principal payments. Debt also includes the Company's capital leases as discussed in
Note 22 –
Leases
in the Notes to Consolidated Financial Statements.
|
|
(B)
|
See
Note 22 –
Leases
in the Notes to Consolidated Financial Statements for additional information.
|
|
(C)
|
Purchase obligations represent agreements with suppliers and vendors as part of the normal course of business.
|
|
(D)
|
Amounts primarily represent long-term deferred compensation plans for Company management.
|
41
|
(E)
|
Other long-term liabilities primarily includes deferred revenue and future projected payments related to the Company's nonqualified pension plans. The Company is not required to make contributions to the qualified pension plan in 2019.
|
Legal Proceedings
See
Note 14 –
Commitments and Contingencies
in the Notes to Consolidated Financial Statements for disclosure related to certain legal and environmental proceedings.
Environmental Regulation
In its Marine Engine segment, Brunswick continues to develop engine technologies to reduce engine emissions to comply with current and future emissions requirements. The Boat segment continues to pursue fiberglass boat manufacturing technologies and techniques to reduce air emissions at its boat manufacturing facilities. The costs associated with these activities may have an adverse effect on segment operating margins and may affect short-term operating results. Environmental regulatory bodies in the United States and other countries may impose more stringent emissions standards and/or other environmental regulatory requirements than are currently in effect. Using its environmental management system processes, the Company complies with current regulations and expects to comply fully with any new regulations; compliance will most likely increase the cost of these products for the Company and the industry, but is not expected to have a material adverse effect on Brunswick's competitive position.
Critical Accounting Policies
The preparation of the consolidated financial statements in accordance with accounting principles generally accepted in the United States requires management to make certain estimates and assumptions that affect the amount of reported assets and liabilities and disclosure of contingent assets and liabilities at the date of the consolidated financial statements and revenues and expenses during the periods reported. Actual results may differ from those estimates. If current estimates for the cost of resolving any specific matters are later determined to be inadequate, results of operations could be adversely affected in the period in which additional provisions are required. The Company has discussed the development and selection of the critical accounting policies with the Audit Committee of the Board of Directors and believes the following are the most critical accounting policies that could have an effect on Brunswick's reported results.
Revenue Recognition and Sales Incentives.
Revenue is recognized as performance obligations under the terms of contracts with customers are satisfied; this occurs when control of promised goods (engines, engine parts and accessories, boats, and fitness equipment) is transferred to the customer. The Company recognizes revenue related to the sale of extended warranty contracts that extend the coverage period beyond the standard warranty period over the life of the extended warranty period.
Revenue is measured as the amount of consideration expected to be entitled in exchange for transferring goods or providing services. The Company has excluded sales, value add, and other taxes collected concurrent with revenue-producing activities from the determination of the transaction price for all contracts. The Company has elected to account for shipping and handling activities that occur after the customer has obtained control of a good as a fulfillment activity. For all contracts with customers, the Company has not adjusted the promised amount of consideration for the effects of a significant financing component as the period between the transfer of the promised goods and the customer's payment is expected to be one year or less.
See
Note 2 –
Revenue Recognition
in the Notes to Consolidated Financial Statements for more information.
Warranty Reserves.
The Company records an estimated liability for product warranties at the time revenue is recognized. The liability is estimated using historical warranty experience, projected claim rates and expected costs per claim. The Company adjusts its liability for specific warranty matters when they become known and the exposure can be estimated. The Company's warranty liabilities are affected by product failure rates as well as material usage and labor costs incurred in correcting a product failure. If actual costs differ from estimated costs, the Company must make a revision to the warranty liability.
Goodwill.
Goodwill results from the excess of purchase price over the net assets of businesses acquired. All three of the Company's reporting units, which are also the Company's reportable segments, have a goodwill balance.
The Company reviews goodwill for impairment annually and whenever events or changes in circumstances indicate that the fair value of a reporting unit may be below its carrying value. As part of the annual test, the Company may perform a qualitative, rather than quantitative, assessment to determine whether the fair values of its reporting units are “more likely than not” to be greater than their carrying values. In performing this qualitative analysis, the Company considers various factors, including the effect of market or industry changes and the reporting units' actual results compared to projected results.
42
If the fair value of a reporting unit does not meet the "more likely than not" criteria discussed above, the impairment test for goodwill is a quantitative, two-step process. The first step compares the fair value of the reporting unit with its carrying value. If the fair value exceeds the carrying value, goodwill is not considered impaired. If the carrying amount exceeds the fair value, the second step is performed to measure the amount of the impairment loss, if any. In this second step, the implied fair value goodwill is compared with the carrying amount of the goodwill. If the carrying amount of the goodwill exceeds the implied fair value of that goodwill, an impairment loss is recognized in an amount equal to that excess, not to exceed the carrying amount of the goodwill.
The Company calculates the fair value of its reporting units considering both the income approach and the guideline public company method. The income approach calculates the fair value of the reporting unit using a discounted cash flow approach utilizing a Gordon Growth model. Internally forecasted future cash flows, which the Company believes reasonably approximate market participant assumptions, are discounted using a weighted average cost of capital (Discount Rate) developed for each reporting unit. The Discount Rate is developed using market observable inputs, as well as considering whether or not there is a measure of risk related to the specific reporting unit’s forecasted performance. Fair value under the guideline public company method is determined for each unit by applying market multiples for comparable public companies to the unit’s financial results.
For 2018 and 2017, the goodwill impairment test for the Fitness reporting unit was a two-step process. As of the Company’s annual goodwill impairment testing date on October 1, 2018, the estimated fair value of the Fitness reporting unit was approximately 19 percent in excess of its carrying value, which included goodwill of $390.8 million. The fair value determination includes several inputs which require significant management assumptions. The most significant management assumptions that impact the estimated fair value of the reporting unit are the projected results and the Discount Rate assumption. The projected results include improvements in operating performance versus 2018, particularly expanded gross margins which are predicated upon several factors, including the successful execution of cost reduction initiatives, along with increased sales. A 100 basis point increase in the Discount Rate assumption would lower the excess spread over fair value by approximately 8.0 percent. While the Company believes the current projections and the discount rate assumption are reasonable, the Fitness business' ability to expand gross margins or grow sales in line with projections could be negatively affected by its ability to execute the planned actions underlying the forecasted improvement in its performance as well as market conditions. Fair value determinations require considerable judgment and are sensitive to changes in underlying assumptions and factors. As a result, there can be no assurance that the estimates and assumptions made for purposes of the impairment test will prove to be an accurate prediction of the future. To the extent future operating results differ from those in our current forecast, or if the assumptions underlying the Discount Rate change, it is possible that an impairment charge could be recorded.
In addition, Brunswick is currently working to separate the Fitness business, which could involve either a spin-off or a sale transaction. It is possible that the public markets or potential buyers may value the standalone business differently upon a spin-off or in the event of a sale. It is not possible to predict what the valuation outcome will be and how the facts and circumstances at the time will influence the Brunswick Board of Directors’ final decision on the method of separation.
As of December 31, 2018, the goodwill balance for the Fitness reporting unit was $389.8 million, and represents the maximum potential goodwill impairment.
For 2018, 2017 and 2016, with the exception of the Fitness reporting unit in the two periods discussed above, the Company's reporting units met the "more likely than not" criteria; as a result, the Company was not required to perform the quantitative impairment test.
The Company did not record any goodwill impairments in
2018
,
2017
or
2016
.
Other intangible assets.
The Company's primary intangible assets are customer relationships and trade names acquired in business combinations. Intangible assets are initially valued using a methodology commensurate with the intended use of the asset. The customer relationships including those acquired in the Power Products acquisition, which constitute the majority of the Company's customer relationships, were valued using the an income approach, specifically the multi-period excess earnings method (MPEEM). The fair value of trade names, including the Power Products trade names, is measured using a relief-from-royalty (RFR) approach, which assumes the value of the trade name is the discounted cash flows of the amount that would be paid to third parties had the Company not owned the trade name and instead licensed the trade name from another company. Higher royalty rates are assigned to premium brands within the marketplace based on name recognition and profitability, while other brands receive lower royalty rates. The basis for future sales projections for both the RFR and MPEEM are based on internal revenue forecasts by brand, which the Company believes represent reasonable market participant assumptions. The future cash flows are discounted using an applicable Discount Rate as well as any potential risk premium to reflect the inherent risk of holding a standalone intangible asset.
43
The key uncertainties in the RFR and MPEEM calculations, as applicable, are: assumptions used in developing internal revenue growth and customer expense forecasts, assumed customer attrition rates, the selection of an appropriate royalty rate, as well as the perceived risk associated with those forecasts in determining the Discount Rate.
The costs of amortizable intangible assets are recognized over their expected useful lives, typically between
three
and
sixteen
years, using the straight-line method. Intangible assets that are subject to amortization are evaluated for impairment using a process similar to that used to evaluate long-lived assets described below. Intangible assets not subject to amortization are assessed for impairment at least annually and whenever events or changes in circumstances indicate that it is more likely than not that an asset may be impaired. The impairment test for indefinite-lived intangible assets consists of a comparison of the fair value of the intangible asset with its carrying amount. An impairment loss is recognized for the amount by which the carrying value exceeds the fair value of the asset.
For the years ended December 31, 2018 and 2017, the Company recorded
$22.1 million
and
$13.9 million
, respectively, of indefinite-lived intangible asset impairments related to the Cybex trade name. As a result of changes in operating strategy in 2018, the Cybex trade name was deemed to be a definite-lived intangible asset, with
$2.6 million
remaining within
Other intangibles, net
to be fully amortized by December 31, 2020. Refer to
Note 4 –
Restructuring, Exit, Integration and Impairment Activities
for further details. The Company did not record impairments for indefinite-lived intangible assets in 2016.
Refer to
Note 5 –
Acquisitions
and
Note 12 –
Goodwill and Other Intangibles
in the Notes to Consolidated Financial Statements for more information.
Long-Lived Assets.
The Company continually evaluates whether events and circumstances have occurred that indicate the remaining estimated useful lives of its definite-lived intangible assets--excluding goodwill and indefinite-lived trade names--and other long-lived assets may warrant revision or that the remaining balance of such assets may not be recoverable. Once an impairment indicator is identified, the Company tests for recoverability of the related asset group using an estimate of undiscounted cash flows over the remaining asset group's life. If an asset group's carrying value is not recoverable, the Company records an impairment loss based on the excess of the carrying value of the asset group over the long-lived asset group's fair value. Fair value is determined using observable inputs, including the use of appraisals from independent third parties, when available, and, when observable inputs are not available, fair value is based on the Company's assumptions of the data that market participants would use in pricing the asset or liability, based on the best information available in the circumstances. Specifically, the Company uses discounted cash flows to determine the fair value of the asset when observable inputs are unavailable. The Company tested its long-lived asset balances for impairment as indicators arose during
2018
,
2017
or
2016
, resulting in impairment charges of
$13.1 million
,
$31.0 million
and
$2.4 million
, respectively, which are recognized in either Restructuring, integration and impairment charges or Selling, general and administrative expense in the Consolidated Statements of Operations.
Income Taxes.
Deferred taxes are recognized for the future tax effects of temporary differences between financial and income tax reporting using tax rates in effect for the years in which the differences are expected to reverse. The Company evaluates the realizability of net deferred tax assets and, as necessary, records valuation allowances against them. The Company estimates its tax obligations based on historical experience and current tax laws and litigation. The judgments made at any point in time may change based on the outcome of tax audits and settlements of tax litigation, as well as changes due to new tax laws and regulations and the Company's application of those laws and regulations. These factors may cause the Company's tax rate and deferred tax balances to increase or decrease. See
Note 13 –
Income Taxes
in Notes to Consolidated Financial Statements for further details.
Recent Accounting Pronouncements
See
Note 1 –
Significant Accounting Policies
in the Notes to Consolidated Financial Statements for the recent accounting pronouncements that have been adopted during the year ended
December 31, 2018
, or will be adopted in future periods.
Item 7A. Quantitative and Qualitative Disclosures About Market Risk
The Company is exposed to market risk from changes in foreign currency exchange rates, commodity prices and interest rates. The Company enters into various hedging transactions to mitigate certain of these risks in accordance with guidelines established by the Company's management. The Company does not use financial instruments for trading or speculative purposes.
The Company uses foreign currency forward and option contracts to manage foreign exchange rate exposure related to anticipated transactions, and assets and liabilities that are subject to risk from foreign currency rate changes. The Company's principal currency exposures mainly relate to the Euro, Japanese Yen, Canadian dollar, Australian dollar, Brazilian Real, and the British Pound. The Company hedges certain anticipated transactions with financial instruments whose maturity date, along with the realized gain or loss, occurs on or near the execution of the anticipated transaction. The Company manages foreign currency
44
exposure of certain assets or liabilities through the use of derivative financial instruments such that the gain or loss on the derivative financial instrument offsets the loss or gain recognized on the underlying asset or liability, respectively.
The Company uses fixed-to-floating interest rate swaps to convert a portion of the Company's long-term debt from fixed-to-floating rate debt. An interest rate swap is entered into with the expectation that the change in the fair value of the interest rate swap will offset the change in the fair value of the debt instrument attributable to changes in the benchmark interest rate. Each period, the change in the fair value of the interest rate swap asset or liability is recorded as a change in the fair value of the corresponding debt instrument.
The following analyses provide quantitative information regarding the Company's exposure to foreign currency exchange rate risk and interest rate risk as it relates to its derivative financial instruments. The Company uses a model to evaluate the sensitivity of the fair value of financial instruments with exposure to market risk that assumes instantaneous, parallel shifts in exchange rates. For options and instruments with nonlinear returns, models appropriate to the instrument are utilized to determine the impact of market shifts. There are certain shortcomings inherent in the sensitivity analyses presented, primarily due to the assumption that exchange rates change in a parallel fashion.
The amounts shown below represent the estimated reduction in fair market value that the Company would incur on its derivative financial instruments from a 10 percent adverse change in quoted foreign currency rates and interest rates.
|
(in millions)
|
2018
|
2017
|
|||||
|
Risk Category
|
|||||||
|
Foreign exchange
|
$
|
46.9
|
|
$
|
47.8
|
|
|
|
Interest rates
|
1.5
|
|
1.5
|
|
|||
Item 8. Financial Statements and Supplementary Data
|
See Index to Financial Statements and Financial Statement Schedule on page
52
.
|
Item 9. Changes in and Disagreements with Accountants on Accounting and Financial Disclosure
None.
Item 9A. Controls and Procedures
Conclusion Regarding the Effectiveness of Disclosure Controls and Procedures
Under the supervision and with the participation of the Company's management, including the Chief Executive Officer and the Chief Financial Officer of the Company (its principal executive officer and principal financial officer, respectively), the Company has evaluated its disclosure controls and procedures (as defined in Securities Exchange Act Rules 13a -15(e) and 15d -15(e)) as of the end of the period covered by this Annual Report on Form 10-K. Based upon that evaluation, the Chief Executive Officer and Chief Financial Officer have concluded that the Company's disclosure controls and procedures are effective.
Management's Report on Internal Control Over Financial Reporting
Pursuant to Section 404 of the Sarbanes-Oxley Act of 2002, the Company included a report of management's assessment of the effectiveness of its internal control over financial reporting as part of this Annual Report on Form 10-K for the fiscal year ended
December 31, 2018
. Management's report is included in the Company's
2018
Financial Statements under the captions entitled “Report of Management on Internal Control Over Financial Reporting” and is incorporated herein by reference.
Changes in Internal Control Over Financial Reporting
The Company implemented internal controls to ensure adequate evaluation of contracts and proper assessment of the impact of the new accounting standard related to revenue recognition (ASC 606) on the financial statements to facilitate the adoption and implementation on January 1, 2018. There were no material changes to the Company's internal control over financial reporting due to the adoption of the new standard. On August 9, 2018, the Company completed the acquisition of Power Products. Our management is in the process of reviewing the operations of Power Products, and implementing our internal control structure over the operations of the recently acquired entity; however, we will elect to exclude Power Products when conducting our annual evaluation of the effectiveness of internal controls over financial reporting, as permitted by applicable regulations. Except for the
45
preceding changes, there have been no changes in the Company's internal control over financial reporting during the quarter ended
December 31, 2018
, that have materially affected, or are reasonably likely to materially affect, the Company's internal control over financial reporting.
Item 9B. Other Information
None.
46
PART III
Item 10. Directors, Executive Officers and Corporate Governance
Information pursuant to this Item with respect to our Directors, the Company's Audit Committee, and the Company's code of ethics is incorporated by reference from the discussion under the headings Proposal No. 1: Election of Directors and Corporate Governance in the Company's Proxy Statement for the Annual Meeting of Shareholders to be held on
May 8, 2019
(Proxy Statement). Information pursuant to this Item with respect to compliance with Section 16(a) of the Securities Exchange Act of 1934 is incorporated by reference from the discussion under the heading Section 16(a) Beneficial Ownership Reporting Compliance in the Proxy Statement.
The information required by Item 401 of Regulation S-K regarding executive officers is included under “Executive Officers of the Registrant” following Item 4 in Part I of this Annual Report.
Item 11. Executive Compensation
Information pursuant to this Item with respect to compensation paid to our Directors is incorporated by reference from the discussion under the heading Director Compensation in the Proxy Statement. Information pursuant to this Item with respect to executive compensation is incorporated by reference from the discussion under the heading Executive Compensation in the Proxy Statement.
Item 12. Security Ownership of Certain Beneficial Owners and Management and Related Stockholder Matters
Information pursuant to this Item with respect to the securities of the Company owned by the Directors and certain officers of the Company, by the Directors and officers of the Company as a group, and by the persons known to the Company to own beneficially more than 5 percent of the outstanding voting securities of the Company is incorporated by reference from the discussion under the heading Stock Held by Directors, Executive Officers, and Principal Shareholders in the Proxy Statement. Information pursuant to this Item with respect to securities authorized for issuance under the Company's equity compensation plans is hereby incorporated by reference from the discussion under the heading Equity Compensation Plan Information in the Proxy Statement.
Item 13. Certain Relationships and Related Transactions, and Director Independence
Information pursuant to this Item with respect to certain relationships and related transactions is incorporated from the discussion under the headings Proposal No. 1: Election of Directors and Corporate Governance in the Proxy Statement.
Item 14. Principal Accounting Fees and Services
Information pursuant to this Item with respect to fees for professional services rendered by the Company's independent registered public accounting firm and the Audit Committee's policy on pre-approval of audit and permissible non-audit services of the Company's independent registered public accounting firm is incorporated by reference from the discussion in the Proxy Statement under the heading Proposal No. 3: Ratification of the Appointment of Independent Registered Public Accounting Firm.
47
PART IV
Item 15. Exhibits and Financial Statement Schedules
|
The financial statements and schedule filed as part of this Annual Report on Form 10-K are listed in the accompanying Index to Financial Statements and Financial Statement Schedule on page
52
. The exhibits filed as a part of this Annual Report are listed in the Exhibit Index below.
|
|
Exhibit No.
|
Description
|
|
2.1
|
|
|
3.1
|
Restated Certificate of Incorporation of the Company, dated July 22, 1987, filed as Exhibit 19.2 to the Company's Quarterly Report on Form 10-Q for the quarter ended June 30, 1987, as filed with the Securities and Exchange Commission, and hereby incorporated by reference.
|
|
3.2
|
|
|
3.3
|
Certificate of Designation, Preferences and Rights of Series A Junior Participating Preferred Stock, filed as Exhibit 3.2 to the Company's Annual Report on Form 10-K for 1995 as filed with the Securities and Exchange Commission on March 23, 1995, and hereby incorporated by reference.
|
|
3.4
|
|
|
4.1
|
|
|
4.2
|
|
|
4.3
|
|
|
4.4
|
|
|
4.5
|
|
|
4.6
|
Indenture, dated as of March 15, 1987, between the Company and Continental Illinois National Bank and Trust Company of Chicago, filed as Exhibit 4.1 to the Company's Quarterly Report on Form 10-Q for the quarter ended March 31, 1987, and hereby incorporated by reference.
|
|
4.7
|
Officers' Certificate setting forth terms of the Company's $125,000,000 principal amount of 7 3/8% Debentures due September 1, 2023, filed as Exhibit 4.3 to the Company's Annual Report on Form 10-K for 1993 as filed with the Securities and Exchange Commission on March 29, 1994, and hereby incorporated by reference.
|
|
4.8
|
Form of the Company's $200,000,000 principal amount of 7 1/8% Notes due August 1, 2027, filed as Exhibit 4.1 to the Company's Current Report on Form 8-K as filed with the Securities and Exchange Commission on August 21, 1997, and hereby incorporated by reference.
|
|
4.9
|
The Company's agreement to furnish additional debt instruments upon request by the Securities and Exchange Commission, filed as Exhibit 4.10 to the Company's Annual Report on Form 10-K for 1980, and hereby incorporated by reference.
|
|
4.10
|
|
48
|
4.11
|
|
|
4.12
|
|
|
10.1
|
|
|
10.2
|
|
|
10.3
|
|
|
10.4*
|
|
|
10.5*
|
|
|
10.6*
|
|
|
10.7*
|
|
|
10.8*
|
|
|
10.9*
|
|
|
10.10*
|
1997 Stock Plan for Non-Employee Directors, filed as Exhibit 10.3 to the Company's Quarterly Report on Form 10-Q for the quarter ended September 30, 1998, as filed with the Securities and Exchange Commission on November 13, 1998, and hereby incorporated by reference.
|
|
10.11*
|
|
|
10.12*
|
|
|
10.13*
|
|
|
10.14*
|
|
49
|
10.15*
|
|
|
10.16*
|
|
|
10.17*
|
|
|
10.18*
|
|
|
10.19*
|
|
|
10.20*
|
|
|
10.21*
|
|
|
10.22*
|
|
|
10.23*
|
|
|
10.24*
|
|
|
10.25*
|
|
|
10.26*
|
|
|
10.27*
|
|
|
10.28*
|
|
|
10.29*
|
|
|
10.30*
|
|
50
|
10.31*
|
|
|
10.32*
|
|
|
10.33*
|
|
|
21.1
|
|
|
23.1
|
|
|
24.1
|
|
|
31.1
|
|
|
31.2
|
|
|
32.1
|
|
|
32.2
|
|
|
101.INS
|
XBRL Instance Document
|
|
101.SCH
|
XBRL Taxonomy Extension Schema Document
|
|
101.CAL
|
XBRL Taxonomy Extension Calculation Linkbase Document
|
|
101.DEF
|
XBRL Taxonomy Extension Definition Linkbase Document
|
|
101.LAB
|
XBRL Taxonomy Extension Label Linkbase Document
|
|
101.PRE
|
XBRL Taxonomy Extension Presentation Linkbase Document
|
* Management contract or compensatory plan or arrangement.
51
Index to Financial Statements and Financial Statement Schedule
Brunswick Corporation
|
Page
|
|
|
Financial Statements:
|
|
|
Financial Statement Schedule:
|
|
52
BRUNSWICK CORPORATION
REPORT OF MANAGEMENT ON INTERNAL CONTROL OVER FINANCIAL REPORTING
The Company's management is responsible for the preparation, integrity, and objectivity of the financial statements and other financial information presented in this Annual Report. The financial statements have been prepared in conformity with accounting principles generally accepted in the United States and reflect the effects of certain estimates and judgments made by management.
The Company's management is also responsible for establishing and maintaining adequate internal control over financial reporting, as defined in Securities Exchange Act Rule 13a-15(f). Under the supervision and with the participation of the Company's management, including the Chief Executive Officer and the Chief Financial Officer, the Company conducted an evaluation of the effectiveness of its internal control over financial reporting based on the framework in Internal Control - Integrated Framework issued by the Committee of Sponsoring Organizations of the Treadway Commission (2013 framework).
Based on the Company's evaluation under the framework in Internal Control - Integrated Framework, management concluded that internal control over financial reporting was effective as of
December 31, 2018
. As permitted by SEC guidance, management excluded Power Products, which was acquired on August 9, 2018, from its evaluation. Power Products represented 23 percent of consolidated total assets and 2 percent of consolidated net sales as of and for the year ending
December 31, 2018
.
The effectiveness of internal control over financial reporting as of
December 31, 2018
has been audited by Deloitte & Touche LLP, an independent registered public accounting firm, as stated in its attestation report, which is included herein.
Brunswick Corporation
Mettawa, Illinois
February 19, 2019
53
BRUNSWICK CORPORATION
REPORT OF INDEPENDENT REGISTERED PUBLIC ACCOUNTING FIRM
To the Board of Directors and Shareholders of Brunswick Corporation
Mettawa, Illinois
Opinion on Internal Control over Financial Reporting
We have audited the internal control over financial reporting of Brunswick Corporation and subsidiaries (the “Company”) as of December 31, 2018, based on criteria established in
Internal Control - Integrated Framework (2013)
issued by the Committee of Sponsoring Organizations of the Treadway Commission (COSO). In our opinion, the Company maintained, in all material respects, effective internal control over financial reporting as of December 31, 2018, based on criteria established in
Internal Control - Integrated Framework (2013)
issued by COSO.
We have also audited, in accordance with the standards of the Public Company Accounting Oversight Board (United States) (PCAOB), the consolidated financial statements as of and for the year ended December 31, 2018, of the Company and our report dated February 19, 2019, expressed an unqualified opinion on those financial statements.
As described in the Report of Management on Internal Control Over Financial Reporting, management has excluded from its assessment the internal control over financial reporting at Power Products, which was acquired on August 9, 2018 and whose financial statements constitute 23 percent of consolidated total assets and 2 percent of consolidated net sales as of and for the year ended December 31, 2018. Accordingly, our audit did not include the internal control over financial reporting at Power Products.
Basis for Opinion
The Company’s management is responsible for maintaining effective internal control over financial reporting and for its assessment of the effectiveness of internal control over financial reporting, included in the accompanying Report of Management on Internal Control over Financial Reporting. Our responsibility is to express an opinion on the Company’s internal control over financial reporting based on our audit. We are a public accounting firm registered with the PCAOB and are required to be independent with respect to the Company in accordance with the U.S. federal securities laws and the applicable rules and regulations of the Securities and Exchange Commission and the PCAOB.
We conducted our audit in accordance with the standards of the PCAOB. Those standards require that we plan and perform the audit to obtain reasonable assurance about whether effective internal control over financial reporting was maintained in all material respects. Our audit included obtaining an understanding of internal control over financial reporting, assessing the risk that a material weakness exists, testing and evaluating the design and operating effectiveness of internal control based on the assessed risk, and performing such other procedures as we considered necessary in the circumstances. We believe that our audit provides a reasonable basis for our opinion.
Definition and Limitations of Internal Control over Financial Reporting
A company’s internal control over financial reporting is a process designed to provide reasonable assurance regarding the reliability of financial reporting and the preparation of financial statements for external purposes in accordance with generally accepted accounting principles. A company’s internal control over financial reporting includes those policies and procedures that (1) pertain to the maintenance of records that, in reasonable detail, accurately and fairly reflect the transactions and dispositions of the assets of the company; (2) provide reasonable assurance that transactions are recorded as necessary to permit preparation of financial statements in accordance with generally accepted accounting principles, and that receipts and expenditures of the company are being made only in accordance with authorizations of management and directors of the company; and (3) provide reasonable assurance regarding prevention or timely detection of unauthorized acquisition, use, or disposition of the company’s assets that could have a material effect on the financial statements.
Because of its inherent limitations, internal control over financial reporting may not prevent or detect misstatements. Also, projections of any evaluation of effectiveness to future periods are subject to the risk that controls may become inadequate because of changes in conditions, or that the degree of compliance with the policies or procedures may deteriorate.
/s/ DELOITTE & TOUCHE LLP
Chicago, Illinois
February 19, 2019
54
BRUNSWICK CORPORATION
REPORT OF INDEPENDENT REGISTERED PUBLIC ACCOUNTING FIRM
To the Board of Directors and Shareholders of Brunswick Corporation
Mettawa, Illinois
Opinion on the Financial Statements
We have audited the accompanying consolidated balance sheets of Brunswick Corporation and subsidiaries (the "Company") as of December 31, 2018 and 2017, the related consolidated statements of operations, comprehensive income, shareholders' equity, and cash flows, for each of the three years in the period ended December 31, 2018, and the related notes and the schedule listed in the Index at Item 15 (collectively referred to as the "financial statements"). In our opinion, the financial statements present fairly, in all material respects, the financial position of the Company as of December 31, 2018 and 2017, and the results of its operations and its cash flows for each of the three years in the period ended December 31, 2018, in conformity with accounting principles generally accepted in the United States of America.
We have also audited, in accordance with the standards of the Public Company Accounting Oversight Board (United States) (PCAOB), the Company's internal control over financial reporting as of December 31, 2018, based on criteria established in
Internal Control - Integrated Framework (2013)
issued by the Committee of Sponsoring Organizations of the Treadway Commission and our report dated February 19, 2019, expressed an unqualified opinion on the Company's internal control over financial reporting.
Basis for Opinion
These financial statements are the responsibility of the Company's management. Our responsibility is to express an opinion on the Company's financial statements based on our audits. We are a public accounting firm registered with the PCAOB and are required to be independent with respect to the Company in accordance with the U.S. federal securities laws and the applicable rules and regulations of the Securities and Exchange Commission and the PCAOB.
We conducted our audits in accordance with the standards of the PCAOB. Those standards require that we plan and perform the audit to obtain reasonable assurance about whether the financial statements are free of material misstatement, whether due to error or fraud. Our audits included performing procedures to assess the risks of material misstatement of the financial statements, whether due to error or fraud, and performing procedures that respond to those risks. Such procedures included examining, on a test basis, evidence regarding the amounts and disclosures in the financial statements. Our audits also included evaluating the accounting principles used and significant estimates made by management, as well as evaluating the overall presentation of the financial statements. We believe that our audits provide a reasonable basis for our opinion.
/s/ DELOITTE & TOUCHE LLP
Chicago, Illinois
February 19, 2019
We have served as the Company's auditor since 2014.
55
|
BRUNSWICK CORPORATION
Consolidated Statements of Operations
|
|||||||||||
|
|
For the Years Ended December 31
|
||||||||||
|
(in millions, except per share data)
|
2018
|
2017
|
2016
|
||||||||
|
Net sales
|
$
|
5,159.2
|
|
$
|
4,835.9
|
|
$
|
4,488.5
|
|
||
|
Cost of sales
|
3,838.2
|
|
3,573.8
|
|
3,256.1
|
|
|||||
|
Selling, general and administrative expense
|
724.3
|
|
636.1
|
|
598.1
|
|
|||||
|
Research and development expense
|
148.8
|
|
146.4
|
|
139.2
|
|
|||||
|
Restructuring, exit, integration and impairment charges
|
80.9
|
|
81.3
|
|
15.6
|
|
|||||
|
Operating earnings
|
367.0
|
|
398.3
|
|
479.5
|
|
|||||
|
Equity earnings
|
7.7
|
|
6.1
|
|
4.3
|
|
|||||
|
Pension settlement charge
|
—
|
|
(96.6
|
)
|
(55.1
|
)
|
|||||
|
Other expense, net
|
(4.3
|
)
|
(2.8
|
)
|
(13.3
|
)
|
|||||
|
Earnings before interest and income taxes
|
370.4
|
|
305.0
|
|
415.4
|
|
|||||
|
Interest expense
|
(46.0
|
)
|
(26.4
|
)
|
(27.5
|
)
|
|||||
|
Interest income
|
2.9
|
|
2.6
|
|
1.8
|
|
|||||
|
Transaction financing charges
|
(5.1
|
)
|
—
|
|
—
|
|
|||||
|
Earnings before income taxes
|
322.2
|
|
281.2
|
|
389.7
|
|
|||||
|
Income tax provision
|
59.1
|
|
134.8
|
|
115.3
|
|
|||||
|
Net earnings from continuing operations
|
263.1
|
|
|
146.4
|
|
274.4
|
|
||||
|
Net earnings from discontinued operations, net of tax
|
2.2
|
|
—
|
|
1.6
|
|
|||||
|
Net earnings
|
$
|
265.3
|
|
$
|
146.4
|
|
$
|
276.0
|
|
||
|
Earnings per common share:
|
|
|
|
|
|
|
|||||
|
Basic
|
|||||||||||
|
Earnings from continuing operations
|
$
|
3.00
|
|
$
|
1.64
|
|
$
|
3.01
|
|
||
|
Earnings from discontinued operations
|
0.03
|
|
—
|
|
0.02
|
|
|||||
|
Net earnings
|
$
|
3.03
|
|
$
|
1.64
|
|
$
|
3.03
|
|
||
|
Diluted
|
|||||||||||
|
Earnings from continuing operations
|
$
|
2.98
|
|
$
|
1.62
|
|
$
|
2.98
|
|
||
|
Earnings from discontinued operations
|
0.03
|
|
—
|
|
0.02
|
|
|||||
|
Net earnings
|
$
|
3.01
|
|
$
|
1.62
|
|
$
|
3.00
|
|
||
|
Weighted average shares used for computation of:
|
|
|
|
|
|||||||
|
Basic earnings per common share
|
87.6
|
|
89.4
|
|
91.2
|
|
|||||
|
Diluted earnings per common share
|
88.2
|
|
90.1
|
|
92.0
|
|
|||||
|
Cash dividends declared per common share
|
$
|
0.78
|
|
$
|
0.685
|
|
$
|
0.615
|
|
||
The Notes to Consolidated Financial Statements are an integral part of these consolidated statements.
56
|
BRUNSWICK CORPORATION
Consolidated Statements of Comprehensive Income
|
|||||||||||
|
|
For the Years Ended December 31
|
||||||||||
|
(in millions)
|
2018
|
2017
|
2016
|
||||||||
|
Net earnings
|
$
|
265.3
|
|
$
|
146.4
|
|
$
|
276.0
|
|
||
|
Other comprehensive income (loss), net of tax:
|
|||||||||||
|
Foreign currency translation:
|
|||||||||||
|
Foreign currency translation adjustments
(A)
|
(17.3
|
)
|
20.3
|
|
4.5
|
|
|||||
|
Net foreign currency translation
|
(17.3
|
)
|
20.3
|
|
4.5
|
|
|||||
|
Defined benefit plans:
|
|||||||||||
|
Net actuarial losses
(A)
|
(3.3
|
)
|
(8.1
|
)
|
(10.2
|
)
|
|||||
|
Amortization of prior service credits
(B)
|
(0.5
|
)
|
(0.5
|
)
|
(0.4
|
)
|
|||||
|
Amortization of net actuarial losses
(B)
|
7.9
|
|
69.3
|
|
45.3
|
|
|||||
|
Net defined benefit plans
|
4.1
|
|
60.7
|
|
34.7
|
|
|||||
|
Derivatives:
|
|||||||||||
|
Net deferred gains (losses) on derivatives
(A)
|
7.3
|
|
(7.5
|
)
|
2.1
|
|
|||||
|
Net (gains) losses reclassified into earnings
(B)
|
2.6
|
|
1.3
|
|
(1.8
|
)
|
|||||
|
Net deferred gains (losses) on derivatives
|
9.9
|
|
(6.2
|
)
|
0.3
|
|
|||||
|
Other comprehensive income (loss)
|
(3.3
|
)
|
74.8
|
|
39.5
|
|
|||||
|
Comprehensive income
|
$
|
262.0
|
|
$
|
221.2
|
|
$
|
315.5
|
|
||
(A) The tax effects for the year ended
December 31, 2018
were
$1.5 million
for foreign currency translation,
$1.2 million
for net actuarial losses arising during the period and
$(3.3) million
for derivatives. The tax effects for the year ended
December 31, 2017
were
$(4.1) million
for foreign currency translation,
$5.4 million
for net actuarial losses arising during the period and
$3.4 million
for derivatives. The tax effects for the year ended
December 31, 2016
were
$(7.9) million
for foreign currency translation,
$5.4 million
for net actuarial losses arising during the period and
$(0.8) million
for derivatives.
(B) See
Note 20 –
Comprehensive Income (Loss)
for the tax effects for the years ended
December 31, 2018
,
December 31, 2017
and
December 31, 2016
.
The Notes to Consolidated Financial Statements are an integral part of these consolidated statements.
57
|
BRUNSWICK CORPORATION
Consolidated Balance Sheets
|
|||||||
|
As of December 31
|
|||||||
|
(in millions)
|
2018
|
2017
|
|||||
|
Assets
|
|
|
|||||
|
Current assets
|
|
|
|||||
|
Cash and cash equivalents, at cost, which approximates fair value
|
$
|
294.4
|
|
$
|
448.8
|
|
|
|
Restricted cash
|
9.0
|
|
9.4
|
|
|||
|
Short-term investments in marketable securities
|
0.8
|
|
0.8
|
|
|||
|
Total cash and short-term investments in marketable securities
|
304.2
|
|
459.0
|
|
|||
|
Accounts and notes receivable, less allowances of $11.3 and $9.2
|
550.7
|
|
485.3
|
|
|||
|
Inventories
|
|
|
|
|
|||
|
Finished goods
|
614.2
|
|
521.3
|
|
|||
|
Work-in-process
|
106.1
|
|
119.3
|
|
|||
|
Raw materials
|
223.4
|
|
187.1
|
|
|||
|
Net inventories
|
943.7
|
|
827.7
|
|
|||
|
Prepaid expenses and other
|
81.6
|
|
74.7
|
|
|||
|
Current assets
|
1,880.2
|
|
1,846.7
|
|
|||
|
Property
|
|
|
|
|
|||
|
Land
|
24.0
|
|
25.1
|
|
|||
|
Buildings and improvements
|
469.7
|
|
412.8
|
|
|||
|
Equipment
|
1,128.9
|
|
1,027.7
|
|
|||
|
Total land, buildings and improvements and equipment
|
1,622.6
|
|
1,465.6
|
|
|||
|
Accumulated depreciation
|
(952.4
|
)
|
(895.8
|
)
|
|||
|
Net land, buildings and improvements and equipment
|
670.2
|
|
569.8
|
|
|||
|
Unamortized product tooling costs
|
135.1
|
|
136.2
|
|
|||
|
Net property
|
805.3
|
|
706.0
|
|
|||
|
Other assets
|
|
|
|
|
|||
|
Goodwill
|
767.1
|
|
425.3
|
|
|||
|
Other intangibles, net
|
646.4
|
|
149.1
|
|
|||
|
Equity investments
|
34.6
|
|
25.1
|
|
|||
|
Deferred income tax asset
|
96.1
|
|
165.6
|
|
|||
|
Other long-term assets
|
56.0
|
|
40.4
|
|
|||
|
Other assets
|
1,600.2
|
|
805.5
|
|
|||
|
Total assets
|
$
|
4,285.7
|
|
$
|
3,358.2
|
|
|
58
|
BRUNSWICK CORPORATION
Consolidated Balance Sheets
|
|||||||
|
As of December 31
|
|||||||
|
(in millions)
|
2018
|
2017
|
|||||
|
Liabilities and shareholders’ equity
|
|
|
|||||
|
Current liabilities
|
|
|
|||||
|
Short-term debt and current maturities of long-term debt
|
$
|
41.3
|
|
$
|
5.6
|
|
|
|
Accounts payable
|
527.8
|
|
420.5
|
|
|||
|
Accrued expenses
|
687.4
|
|
609.0
|
|
|||
|
Current liabilities
|
1,256.5
|
|
1,035.1
|
|
|||
|
Long-term liabilities
|
|
|
|
|
|||
|
Debt
|
1,179.5
|
|
431.8
|
|
|||
|
Postretirement benefits
|
71.6
|
|
220.8
|
|
|||
|
Other
|
195.5
|
|
187.6
|
|
|||
|
Long-term liabilities
|
1,446.6
|
|
840.2
|
|
|||
|
Shareholders’ equity
|
|
|
|
|
|||
|
Common stock; authorized: 200,000,000 shares, $0.75 par value; issued: 102,538,000 shares; outstanding: 86,757,000 and 87,537,000 shares
|
76.9
|
|
76.9
|
|
|||
|
Additional paid-in capital
|
371.1
|
|
374.4
|
|
|||
|
Retained earnings
|
2,135.7
|
|
1,966.8
|
|
|||
|
Treasury stock, at cost: 15,781,000 and 15,001,000 shares
|
(638.0
|
)
|
(575.4
|
)
|
|||
|
Accumulated other comprehensive loss, net of tax:
|
|||||||
|
Foreign currency translation
|
(48.9
|
)
|
(31.6
|
)
|
|||
|
Defined benefit plans:
|
|||||||
|
Prior service credits
|
(6.1
|
)
|
(5.6
|
)
|
|||
|
Net actuarial losses
|
(306.2
|
)
|
(310.8
|
)
|
|||
|
Unrealized losses on derivatives
|
(1.9
|
)
|
(11.8
|
)
|
|||
|
Accumulated other comprehensive loss, net of tax
|
(363.1
|
)
|
(359.8
|
)
|
|||
|
Shareholders’ equity
|
1,582.6
|
|
1,482.9
|
|
|||
|
Total liabilities and shareholders’ equity
|
$
|
4,285.7
|
|
$
|
3,358.2
|
|
|
The Notes to Consolidated Financial Statements are an integral part of these consolidated statements.
59
|
BRUNSWICK CORPORATION
Consolidated Statements of Cash Flows
|
|||||||||||
|
|
For the Years Ended December 31
|
||||||||||
|
(in millions)
|
2018
|
2017
|
2016
|
||||||||
|
Cash flows from operating activities
|
|
|
|
|
|||||||
|
Net earnings
|
$
|
265.3
|
|
$
|
146.4
|
|
$
|
276.0
|
|
||
|
Less: net earnings from discontinued operations, net of tax
|
2.2
|
|
—
|
|
1.6
|
|
|||||
|
Net earnings from continuing operations
|
263.1
|
|
146.4
|
|
274.4
|
|
|||||
|
Depreciation and amortization
|
149.6
|
|
110.8
|
|
103.9
|
|
|||||
|
Stock compensation expense
|
19.2
|
|
18.3
|
|
16.1
|
|
|||||
|
Pension expense including settlement charges, net of (funding)
|
(156.1
|
)
|
32.2
|
|
(4.8
|
)
|
|||||
|
Asset impairment charges
|
59.1
|
|
54.7
|
|
2.4
|
|
|||||
|
Deferred income taxes
|
25.1
|
|
104.2
|
|
62.5
|
|
|||||
|
Changes in certain current assets and current liabilities
|
|||||||||||
|
Change in accounts and notes receivable
|
(27.3
|
)
|
(57.2
|
)
|
(1.1
|
)
|
|||||
|
Change in inventory
|
(84.2
|
)
|
(69.7
|
)
|
(48.2
|
)
|
|||||
|
Change in prepaid expenses and other, excluding income taxes
|
(8.6
|
)
|
4.4
|
|
0.5
|
|
|||||
|
Change in accounts payable
|
49.3
|
|
31.0
|
|
39.2
|
|
|||||
|
Change in accrued expenses
|
13.7
|
|
47.1
|
|
(20.8
|
)
|
|||||
|
Long-term extended warranty contracts and other deferred revenue
|
15.1
|
|
17.1
|
|
10.3
|
|
|||||
|
Fitness business separation costs
|
19.3
|
|
—
|
|
—
|
|
|||||
|
Cash paid for Fitness business separation costs
|
(12.7
|
)
|
—
|
|
—
|
|
|||||
|
Income taxes
|
12.3
|
|
(43.1
|
)
|
20.2
|
|
|||||
|
Other, net
|
0.1
|
|
5.4
|
|
(15.5
|
)
|
|||||
|
Net cash provided by operating activities of continuing operations
|
337.0
|
|
401.6
|
|
439.1
|
|
|||||
|
Net cash used for operating activities of discontinued operations
|
—
|
|
(1.3
|
)
|
(3.8
|
)
|
|||||
|
Net cash provided by operating activities
|
337.0
|
|
400.3
|
|
435.3
|
|
|||||
|
Cash flows from investing activities
|
|
|
|
|
|||||||
|
Capital expenditures
|
(193.4
|
)
|
(203.2
|
)
|
(193.9
|
)
|
|||||
|
Purchases of marketable securities
|
—
|
|
—
|
|
(35.0
|
)
|
|||||
|
Sales or maturities of marketable securities
|
—
|
|
35.0
|
|
10.7
|
|
|||||
|
Investments
|
(10.8
|
)
|
(3.2
|
)
|
5.1
|
|
|||||
|
Acquisition of businesses, net of cash acquired
|
(909.6
|
)
|
(15.5
|
)
|
(276.1
|
)
|
|||||
|
Proceeds from the sale of property, plant and equipment
|
6.7
|
|
8.5
|
|
1.9
|
|
|||||
|
Other, net
|
(0.2
|
)
|
(0.5
|
)
|
1.3
|
|
|||||
|
Net cash used for investing activities
|
(1,107.3
|
)
|
(178.9
|
)
|
(486.0
|
)
|
|||||
|
Cash flows from financing activities
|
|
|
|
|
|||||||
|
Net proceeds from issuances of short-term debt
|
298.9
|
|
—
|
|
—
|
|
|||||
|
Repayment of short-term debt
|
(300.0
|
)
|
—
|
|
—
|
|
|||||
|
Net proceeds from issuances of long-term debt
|
794.6
|
|
—
|
|
1.0
|
|
|||||
|
Payments of long-term debt including current maturities
|
(12.6
|
)
|
(4.5
|
)
|
(3.2
|
)
|
|||||
|
Common stock repurchases
|
(75.0
|
)
|
(130.0
|
)
|
(120.3
|
)
|
|||||
|
Cash dividends paid
|
(67.8
|
)
|
(60.6
|
)
|
(55.4
|
)
|
|||||
|
Proceeds from share-based compensation activity
|
1.4
|
|
6.2
|
|
14.9
|
|
|||||
|
Tax withholding associated with shares issued for share-based compensation
|
(12.5
|
)
|
(14.8
|
)
|
(20.9
|
)
|
|||||
|
Other, net
|
(6.5
|
)
|
—
|
|
(1.9
|
)
|
|||||
|
Net cash provided by (used for) financing activities
|
620.5
|
|
(203.7
|
)
|
(185.8
|
)
|
|||||
|
Effect of exchange rate changes
|
(5.0
|
)
|
6.9
|
|
0.1
|
|
|||||
|
Net increase (decrease) in Cash and cash equivalents and Restricted cash
|
(154.8
|
)
|
24.6
|
|
(236.4
|
)
|
|||||
|
Cash and cash equivalents and Restricted cash at beginning of period
|
458.2
|
|
433.6
|
|
670.0
|
|
|||||
|
Cash and cash equivalents and Restricted cash at end of period
|
303.4
|
|
458.2
|
|
433.6
|
|
|||||
|
Less: Restricted cash
|
9.0
|
|
9.4
|
|
11.2
|
|
|||||
|
Cash and cash equivalents at end of period
|
$
|
294.4
|
|
$
|
448.8
|
|
$
|
422.4
|
|
||
|
Supplemental cash flow disclosures:
|
|||||||||||
|
Interest paid
|
$
|
46.8
|
|
$
|
33.0
|
|
$
|
30.1
|
|
||
|
Income taxes paid, net
|
$
|
21.7
|
|
$
|
73.5
|
|
$
|
32.6
|
|
||
The Notes to Consolidated Financial Statements are an integral part of these consolidated statements.
60
|
BRUNSWICK CORPORATION
Consolidated Statements of Shareholders' Equity
|
|||||||||||||||||||||||
|
(in millions, except per share data)
|
Common Stock
|
Additional Paid-in Capital
|
Retained Earnings
|
Treasury Stock
|
Accumulated Other Comprehensive Income (Loss)
|
Total
|
|||||||||||||||||
|
Balance, December 31, 2015
|
$
|
76.9
|
|
$
|
408.0
|
|
$
|
1,660.4
|
|
$
|
(389.9
|
)
|
$
|
(474.1
|
)
|
$
|
1,281.3
|
|
|||||
|
Net earnings
|
—
|
|
—
|
|
276.0
|
|
—
|
|
—
|
|
276.0
|
|
|||||||||||
|
Other comprehensive income
|
—
|
|
—
|
|
—
|
|
—
|
|
39.5
|
|
39.5
|
|
|||||||||||
|
Dividends ($0.615 per common share)
|
—
|
|
—
|
|
(55.4
|
)
|
—
|
|
—
|
|
(55.4
|
)
|
|||||||||||
|
Compensation plans and other
|
—
|
|
(26.0
|
)
|
—
|
|
45.0
|
|
—
|
|
19.0
|
|
|||||||||||
|
Common stock repurchases
|
—
|
|
—
|
|
—
|
|
(120.3
|
)
|
—
|
|
(120.3
|
)
|
|||||||||||
|
Balance, December 31, 2016
|
76.9
|
|
382.0
|
|
1,881.0
|
|
(465.2
|
)
|
(434.6
|
)
|
1,440.1
|
|
|||||||||||
|
Net earnings
|
—
|
|
—
|
|
146.4
|
|
—
|
|
—
|
|
146.4
|
|
|||||||||||
|
Other comprehensive income
|
—
|
|
—
|
|
—
|
|
—
|
|
74.8
|
|
74.8
|
|
|||||||||||
|
Dividends ($0.685 per common share)
|
—
|
|
—
|
|
(60.6
|
)
|
—
|
|
—
|
|
(60.6
|
)
|
|||||||||||
|
Compensation plans and other
|
—
|
|
(7.6
|
)
|
—
|
|
19.8
|
|
—
|
|
12.2
|
|
|||||||||||
|
Common stock repurchases
|
—
|
|
—
|
|
—
|
|
(130.0
|
)
|
—
|
|
(130.0
|
)
|
|||||||||||
|
Balance, December 31, 2017
|
76.9
|
|
374.4
|
|
1,966.8
|
|
(575.4
|
)
|
(359.8
|
)
|
1,482.9
|
|
|||||||||||
|
ASU No. 2014-09 adoption
|
—
|
|
—
|
|
(28.6
|
)
|
—
|
|
—
|
|
(28.6
|
)
|
|||||||||||
|
Net earnings
|
—
|
|
—
|
|
265.3
|
|
—
|
|
—
|
|
265.3
|
|
|||||||||||
|
Other comprehensive loss
|
—
|
|
—
|
|
—
|
|
—
|
|
(3.3
|
)
|
(3.3
|
)
|
|||||||||||
|
Dividends ($0.78 per common share)
|
—
|
|
—
|
|
(67.8
|
)
|
—
|
|
—
|
|
(67.8
|
)
|
|||||||||||
|
Compensation plans and other
|
—
|
|
(3.3
|
)
|
—
|
|
12.4
|
|
—
|
|
9.1
|
|
|||||||||||
|
Common stock repurchases
|
—
|
|
—
|
|
—
|
|
(75.0
|
)
|
—
|
|
(75.0
|
)
|
|||||||||||
|
Balance, December 31, 2018
|
$
|
76.9
|
|
$
|
371.1
|
|
$
|
2,135.7
|
|
$
|
(638.0
|
)
|
$
|
(363.1
|
)
|
$
|
1,582.6
|
|
|||||
The Notes to Consolidated Financial Statements are an integral part of these consolidated statements.
61
Note 1 –
Significant Accounting Policies
Basis of Presentation.
Brunswick Corporation (Brunswick or the Company) has prepared its consolidated financial statements pursuant to the rules and regulations of the Securities and Exchange Commission (SEC). Certain previously reported amounts have been reclassified to conform with current period presentation. As stated in
Note 3 –
Discontinued Operations
,
Brunswick's results as discussed in the financial statements reflect continuing operations only, unless otherwise noted.
Principles of Consolidation.
Brunswick's consolidated financial statements include the accounts of all majority owned and controlled domestic and foreign subsidiaries. Intercompany balances and transactions have been eliminated.
Use of Estimates.
The preparation of the consolidated financial statements in accordance with accounting principles generally accepted in the United States (GAAP) requires management to make certain estimates. Actual results could differ materially from those estimates. These estimates affect:
•
The reported amounts of assets and liabilities at the date of the financial statements;
|
•
|
The disclosure of contingent assets and liabilities at the date of the financial statements; and
|
•
The reported amounts of revenues and expenses during the reporting periods.
Estimates in these consolidated financial statements include, but are not limited to:
•
Allowances for doubtful accounts;
•
Inventory valuation reserves;
•
Variable consideration related to recorded revenue;
•
Reserves related to repurchase and recourse obligations;
•
Warranty related reserves;
•
Losses on litigation and other contingencies;
•
Environmental reserves;
•
Insurance reserves;
•
Valuation of goodwill and other intangible assets;
•
Impairments of long-lived assets;
•
Reserves related to restructuring, exit and integration activities;
•
Postretirement benefit liabilities;
•
Valuation allowances on deferred tax assets; and
•
Income tax reserves.
Cash and Cash Equivalents.
The Company considers all highly liquid investments with a maturity of three months or less when purchased to be cash equivalents. These investments include, but are not limited to, investments in money market funds, bank deposits, federal government and agency debt securities and commercial paper.
Investments in Marketable Securities.
The Company classifies investments in debt securities that are not considered to be cash equivalents as Short-term investments in marketable securities as discussed in
Note 10 –
Investments
. Short-term investments in marketable securities have a stated maturity of twelve months or less from the balance sheet date. These securities are considered as available-for-sale and are reported at fair value. Unrealized gains and losses on these debt securities are recorded net of tax as a component of Accumulated other comprehensive loss in Unrealized investment losses within Shareholders' equity. Declines in market value from the original cost deemed to be "other-than-temporary" are charged to
Other expense, net
in the period in which the loss occurs. The Company considers both the duration for which a decline in value has occurred and the extent of the decline in its determination of whether a decline in value has been “other than temporary.” Realized gains and losses are calculated based on the specific identification method and are included in
Other expense, net
in the Consolidated Statements of Operations.
Restricted Cash.
The Company considers the cash deposited in a trust that is pledged as collateral against certain workers' compensation-related obligations to be restricted cash. Refer to
Note 14 –
Commitments and Contingencies
for more information.
Accounts and Notes Receivable and Allowance for Doubtful Accounts.
The Company carries its accounts and notes receivable at their face amounts less an allowance for doubtful accounts. On a regular basis, the Company records an allowance for uncollectible receivables based upon known bad debt risks and past loss history, customer payment practices and economic conditions. Actual collection experience may differ from the current estimate of net receivables. A change to the allowance for doubtful accounts
62
may be required if a future event or other change in circumstances results in a change in the estimate of the ultimate collectability of a specific account.
The Company treats the sale of receivables in which the Company retains an interest as a secured obligation. Accordingly, the short-term portion of the receivables sold that are subject to recourse is recorded in Accounts and notes receivable and Accrued expenses in the Consolidated Balance Sheets.
Inventories.
Inventories are valued at the lower of cost or net realizable value, with net realizable value equal to the estimated selling price less the estimated costs to transact. Approximately
57 percent
of the Company's inventories were determined by the first-in, first-out method (FIFO) at both
December 31, 2018
and
December 31, 2017
. Remaining inventories valued at the last-in, first-out method (LIFO) were
$135.5 million
and
$124.9 million
lower than the FIFO cost of inventories at December 31,
2018
and
2017
, respectively. Inventory cost includes material, labor and manufacturing overhead. There were no liquidations of LIFO inventory layers in
2018
,
2017
or
2016
.
Property.
Property, including major improvements and product tooling costs, is recorded at cost. Product tooling costs principally comprise the cost to acquire and construct various long-lived molds, dies and other tooling the Company uses in its manufacturing processes. Design and prototype development costs associated with product tooling are expensed as incurred. Maintenance and repair costs are also expensed as incurred. Depreciation is recorded over the estimated service lives of the related assets, principally using the straight-line method. Buildings and improvements are depreciated over a useful life of
five
to
forty
years. Equipment is depreciated over a useful life of
two
to
twenty
years. Product tooling costs are amortized over the shorter of the useful life of the tooling or the anticipated life of the applicable product, for a period up to
eight
years. The Company capitalizes interest on qualifying assets during the construction period and capitalized
$2.2 million
and
$4.6 million
in the periods ending December 31,
2018
and
2017
, respectively. The Company presents capital expenditures on a cash basis within the Consolidated Statements of Cash Flows. There were
$65.5 million
and
$31.0 million
of unpaid capital expenditures within Accounts payable as of December 31,
2018
and
2017
, respectively. The Company includes gains and losses recognized on the sale and disposal of property in either Selling, general and administrative expenses or
Restructuring, exit, integration and impairment charges
as appropriate. The amount of gains and losses for the years ended December 31 were as follows:
|
(in millions)
|
2018
|
2017
|
2016
|
||||||||
|
Gains on the sale of property
|
$
|
0.4
|
|
$
|
0.9
|
|
$
|
0.4
|
|
||
|
Losses on the sale and disposal of property
|
(1.0
|
)
|
(2.3
|
)
|
(0.5
|
)
|
|||||
|
Net losses on sale and disposal of property
|
$
|
(0.6
|
)
|
$
|
(1.4
|
)
|
$
|
(0.1
|
)
|
||
As of December 31,
2018
and
2017
, the Company had
$8.9 million
and
$12.7 million
, respectively, of net assets classified as held-for-sale within Net property in the Consolidated Balance Sheets.
Software Development Costs.
The Company expenses all software development and implementation costs incurred until the Company has determined that the software will result in probable future economic benefit and management has committed to funding the project. Once this is determined, external direct costs of material and services, payroll-related costs of employees working on the project and related interest costs incurred during the application development stage are capitalized. These capitalized costs are amortized over
three
to
seven
years. All other related costs, including training costs and costs to re-engineer business processes, are expensed as incurred.
Goodwill.
Goodwill results from the excess of purchase price over the net assets of businesses acquired. All three of the Company's reporting units, which are also the Company's reportable segments, have a goodwill balance.
The Company reviews goodwill for impairment annually and whenever events or changes in circumstances indicate that the fair value of a reporting unit may be below its carrying value. As part of the annual test, the Company may perform a qualitative, rather than quantitative, assessment to determine whether the fair values of its reporting units are “more likely than not” to be greater than their carrying values. In performing this qualitative analysis, the Company considers various factors, including the effect of market or industry changes and the reporting units' actual results compared to projected results.
If the fair value of a reporting unit does not meet the "more likely than not" criteria discussed above, the impairment test for goodwill is a quantitative, two-step process. The first step compares the fair value of the reporting unit with its carrying value. If the fair value exceeds the carrying value, goodwill is not considered impaired. If the carrying amount exceeds the fair value, the second step is performed to measure the amount of the impairment loss, if any. In this second step, the implied fair value goodwill
63
is compared with the carrying amount of the goodwill. If the carrying amount of the goodwill exceeds the implied fair value of that goodwill, an impairment loss is recognized in an amount equal to that excess, not to exceed the carrying amount of the goodwill.
The Company calculates the fair value of its reporting units considering both the income approach and the guideline public company method. The income approach calculates the fair value of the reporting unit using a discounted cash flow approach utilizing a Gordon Growth model. Internally forecasted future cash flows, which the Company believes reasonably approximate market participant assumptions, are discounted using a weighted average cost of capital (Discount Rate) developed for each reporting unit. The Discount Rate is developed using market observable inputs, as well as considering whether or not there is a measure of risk related to the specific reporting unit’s forecasted performance. Fair value under the guideline public company method is determined for each unit by applying market multiples for comparable public companies to the unit’s financial results. The key uncertainties in these calculations are the assumptions used in determining the reporting unit’s forecasted future performance, including revenue growth and operating margins, as well as the perceived risk associated with those forecasts in determining the Discount Rate, along with selecting representative market multiples.
For
2018
and
2017
, the Company performed a quantitative test for the Fitness reporting unit. For
2018
,
2017
and
2016
, with the exception of the Fitness reporting unit in
2018
and
2017
, the Company's reporting units met the "more likely than not" criteria; as a result, the Company was not required to perform the quantitative test.
The Company did not record any goodwill impairments in
2018
,
2017
or
2016
.
Other intangible assets.
The Company's primary intangible assets are customer relationships and trade names acquired in business combinations. Intangible assets are initially valued using a methodology commensurate with the intended use of the asset. The customer relationships including those acquired in the Power Products acquisition, which constitute the majority of the Company's customer relationships, were valued using the an income approach, specifically the multi-period excess earnings method (MPEEM). The fair value of trade names, including the Power Products trade names, is measured using a relief-from-royalty (RFR) approach, which assumes the value of the trade name is the discounted cash flows of the amount that would be paid to third parties had the Company not owned the trade name and instead licensed the trade name from another company. Higher royalty rates are assigned to premium brands within the marketplace based on name recognition and profitability, while other brands receive lower royalty rates. The basis for future sales projections for both the RFR and MPEEM are based on internal revenue forecasts by brand, which the Company believes represent reasonable market participant assumptions. The future cash flows are discounted using an applicable Discount Rate as well as any potential risk premium to reflect the inherent risk of holding a standalone intangible asset.
The key uncertainties in the RFR and MPEEM calculations, as applicable, are: assumptions used in developing internal revenue growth and customer expense forecasts, assumed customer attrition rates, the selection of an appropriate royalty rate, as well as the perceived risk associated with those forecasts in determining the Discount Rate.
The costs of amortizable intangible assets are recognized over their expected useful lives, typically between
three
and
sixteen
years, using the straight-line method. Intangible assets that are subject to amortization are evaluated for impairment using a process similar to that used to evaluate long-lived assets described below. Intangible assets not subject to amortization are assessed for impairment at least annually and whenever events or changes in circumstances indicate that it is more likely than not that an asset may be impaired. The impairment test for indefinite-lived intangible assets consists of a comparison of the fair value of the intangible asset with its carrying amount. An impairment loss is recognized for the amount by which the carrying value exceeds the fair value of the asset.
For the years ended December 31,
2018
and
2017
, the Company recorded
$22.1 million
and
$13.9 million
, respectively, of indefinite-lived intangible asset impairments related to the Cybex trade name. As of December 31,
2018
, as a result of changes in operating strategy, the Cybex trade name is deemed to be a definite-lived intangible asset, with
$2.6 million
remaining within
Other intangibles, net
to be fully amortized by December 31, 2020. Refer to
Note 4 –
Restructuring, Exit, Integration and Impairment Activities
for further details. The Company did not record impairments for indefinite-lived intangible assets in 2016.
Refer to
Note 5 –
Acquisitions
and
Note 12 –
Goodwill and Other Intangibles
in the Notes to Consolidated Financial Statements for more information.
Equity Investments.
For investments in which the Company owns or controls from
20 percent
to
50 percent
of the voting shares, the Company uses the equity method of accounting. The Company's share of net earnings or losses from equity method investments is included in the Consolidated Statements of Operations. The Company carries other investments, for which the
64
Company does not have the ability to exercise significant influence, at fair value, with changes in fair value recognized in net income. For equity investments that do not have a readily determinable fair value, the Company measures the investment at cost less impairment, plus or minus observable price changes. The Company periodically evaluates the carrying value of its investments. See
Note 10 –
Investments
for further details about the Company's evaluation of the fair value of its investments.
Long-Lived Assets.
The Company continually evaluates whether events and circumstances have occurred that indicate the remaining estimated useful lives of its definite-lived intangible assets and other long-lived assets may warrant revision or that the remaining balance of such assets may not be recoverable. Once an impairment indicator is identified, the Company tests for recoverability of the related asset group using an estimate of undiscounted cash flows over the asset group's remaining life. If an asset group's carrying value is not recoverable, the Company records an impairment loss based on the excess of the carrying value of the asset group over the long-lived asset group's fair value. Fair value is determined using observable inputs, including the use of appraisals from independent third parties, when available, and, when observable inputs are not available, based on the Company's assumptions of the data that market participants would use in pricing the asset, based on the best information available in the circumstances. Specifically, the Company uses discounted cash flows to determine the fair value of the asset when observable inputs are unavailable. The Company tested its long-lived asset balances for impairment as indicators arose during
2018
,
2017
and
2016
, resulting in impairment charges of
$13.1 million
,
$31.0 million
and
$2.4 million
, respectively, which are recognized either in
Restructuring, exit, integration and impairment charges
or
Selling, general and administrative expense
in the Consolidated Statements of Operations.
Other Long-Term Assets.
Other long-term assets consists mainly of long-term receivables originated by the Company and assigned to third parties, long-term pension assets and other long-term receivables and deposits. As of December 31,
2018
and
2017
, amounts assigned to third parties totaled
$41.1 million
and
$30.2 million
, respectively. The assignment of these instruments does not meet sale criteria as a result of the Company's contingent obligation to repurchase the receivables in the event of customer non-payment and therefore is treated as a secured obligation. Accordingly, these amounts were recorded in the Consolidated Balance Sheets under
Other long-term assets
and Long-term liabilities – Other.
Revenue Recognition.
Revenue is recognized as performance obligations under the terms of contracts with customers are satisfied; this occurs when control of promised goods (engines, engine parts and accessories, boats, and fitness equipment) is transferred to the customer. The Company recognizes revenue related to the sale of extended warranty contracts that extend the coverage period beyond the standard warranty period over the life of the extended warranty period.
Revenue is measured as the amount of consideration expected to be entitled in exchange for transferring goods or providing services. The Company has excluded sales, value add, and other taxes collected concurrent with revenue-producing activities from the determination of the transaction price for all contracts. The Company has elected to account for shipping and handling activities that occur after the customer has obtained control of a good as a fulfillment activity. For all contracts with customers, the Company has not adjusted the promised amount of consideration for the effects of a significant financing component as the period between the transfer of the promised goods and the customer's payment is expected to be one year or less.
See
Note 2 –
Revenue Recognition
for more information.
Advertising Costs.
The Company records advertising and promotion costs in Selling, general and administrative expense in the Consolidated Statements of Operations in the period when the advertising first takes place. Advertising and promotion costs were
$35.2 million
,
$30.5 million
and
$27.1 million
for the years ended December 31,
2018
,
2017
and
2016
, respectively.
Foreign Currency.
The functional currency for the majority of Brunswick's operations is the U.S. dollar. All assets and liabilities of operations with a functional currency other than the U.S. dollar are translated at period end current rates. The resulting translation adjustments are recorded in Accumulated other comprehensive loss, net of tax. Revenues and expenses of operations with a functional currency other than the U.S. dollar are translated at the average exchange rates for the period. Transaction gains and losses resulting from changes in foreign currency exchange rates are recorded in either Cost of sales or
Other expense, net
in the Consolidated Statements of Operations.
Trademark Licensing Agreement.
On September 18, 2014, the Company completed the sale of its retail bowling business to AMF Bowling Centers, Inc. (AMF) and entered into a trademark licensing agreement, allowing AMF to use the Company's retail trademarks and trade names over a five year period from the date of sale. As a result, the Company recorded deferred income of
$20.7 million
related to this agreement, which will be recognized as
Other expense, net
in the Consolidated Statements of Operations over five years.
65
Share-Based Compensation.
The Company records amounts for all share-based compensation, including grants of stock appreciation rights (SARs), non-vested stock awards and performance-based share awards over the vesting period in the Consolidated Statements of Operations based upon their fair values at the date of the grant. Share-based compensation costs are included in Selling, general and administrative expense in the Consolidated Statements of Operations. See
Note 19 –
Stock Plans and Management Compensation
for a description of the Company's accounting for share-based compensation plans.
Research and Development
. Research and development costs are expensed as incurred.
Derivatives.
The Company uses derivative financial instruments to manage its risk associated with movements in foreign currency exchange rates and interest rates. These instruments are used in accordance with guidelines established by the Company's management and are not used for trading or speculative purposes. The Company records all derivatives on the Consolidated Balance Sheets at fair value. See
Note 15 –
Financial Instruments
for further discussion.
Recently Adopted Accounting Standards
Presentation of Benefit Costs
: In March 2017, the Financial Accounting Standards Board (FASB) issued Accounting Standards Update (ASU) 2017-07,
Improving the Presentation of Net Periodic Pension Cost and Net Periodic Postretirement Benefit Cost
, which amended the Accounting Standards Codification (ASC) related to the income statement presentation of the components of net periodic benefit cost for an entity’s sponsored defined benefit pension and other postretirement plans. The amendment requires entities to present the current-service-cost component with other current compensation costs in the income statement within income from operations and present the other components outside of income from operations. The Company adopted this amendment retrospectively during the first quarter of 2018. The Company reclassified
$4.3 million
and
$5.5 million
from Cost of sales and Selling, general and administrative expense, respectively, to
Other expense, net
for the year ended December 31, 2017. The Company reclassified
$7.3 million
and
$8.1 million
from Cost of sales and Selling, general and administrative expense, respectively, to
Other expense, net
for the year ended December 31, 2016. Additionally, Pension settlement charge is excluded as a component of operating earnings for all periods presented. The Company elected to apply the practical expedient that permits the use of previously disclosed service cost and other costs from the prior year postretirement benefits footnote in the comparative periods as appropriate estimates when retrospectively changing the presentation of these costs.
Revenue Recognition
: In May 2014, the FASB issued ASU 2014-09,
Revenue from Contracts with Customers
(new revenue standard), which outlines a single comprehensive model for entities to use in accounting for revenue arising from contracts with customers. On January 1, 2018, the Company adopted the new revenue standard and all related amendments for all contracts using the modified retrospective method. The Company did not elect to separately evaluate contract modifications occurring before the adoption date. The Company recognized the cumulative effect of initially applying the new revenue standard as an adjustment to the January 1, 2018 balance of retained earnings. Prior period information has not been restated and continues to be reported under the accounting standards in effect for those periods.
The Company recognizes revenue in accordance with the terms of sale, primarily upon shipment to customers. Under the new revenue standard, estimated costs associated with retail sales promotions anticipated to be offered to customers within the Company's Boat segment are recognized at the time of sale, whereas under previous guidance, these promotions were recorded at the later of when the program was communicated to the customer or the time of sale. In addition, certain Fitness segment customer contracts offer incentives in the form of rebates settled with free product. These rebates are deemed to be separate performance obligations under the new revenue standard, and the revenue associated with the product rebates is deferred and recognized upon customer redemption. Under previous guidance, these product rebates were recorded in Cost of sales at the time of product sale. These impacts result in a change in the timing of when certain promotions and rebates are recorded, however, the total amount of cumulative revenue recognized over the life of the contract remains unchanged.
The cumulative effect of the changes made to the Company's Consolidated Balance Sheets as of January 1, 2018 for the adoption of the new revenue standard was as follows:
66
|
(in millions)
|
Balance as of December 31, 2017
|
Adjustments Due to ASC 606
|
Balance as of January 1, 2018
|
||||||||
|
Assets
|
|
|
|||||||||
|
Accounts and notes receivable
|
$
|
485.3
|
|
$
|
1.2
|
|
$
|
486.5
|
|
||
|
Deferred income tax asset
|
165.6
|
|
9.3
|
|
174.9
|
|
|||||
|
Liabilities
|
|||||||||||
|
Accrued expenses
|
609.0
|
|
39.1
|
|
648.1
|
|
|||||
|
Shareholders' equity
|
|||||||||||
|
Retained earnings
|
$
|
1,966.8
|
|
$
|
(28.6
|
)
|
$
|
1,938.2
|
|
||
The impact to the Company's Consolidated Statements of Operations and Consolidated Balance Sheets as of and for the year ended December 31, 2018 as a result of applying the new revenue standard was as follows:
|
Year Ended December 31, 2018
|
|||||||||||
|
(in millions)
|
As Reported
|
Effect of Change
|
Balances without adoption of ASC 606
|
||||||||
|
Net sales
|
$
|
5,159.2
|
|
$
|
(15.6
|
)
|
$
|
5,143.6
|
|
||
|
Cost of sales
|
3,838.2
|
|
(5.5
|
)
|
3,832.7
|
|
|||||
|
Earnings before income taxes
|
322.2
|
|
(10.1
|
)
|
312.1
|
|
|||||
|
Income tax provision
|
59.1
|
|
(2.0
|
)
|
57.1
|
|
|||||
|
Net earnings from continuing operations
|
$
|
263.1
|
|
$
|
(8.1
|
)
|
$
|
255.0
|
|
||
|
As of December 31, 2018
|
|||||||||||
|
As Reported
|
Effect of Change
|
Balances without adoption of ASC 606
|
|||||||||
|
Assets
|
|
|
|||||||||
|
Accounts and notes receivable
|
$
|
550.7
|
|
$
|
(1.2
|
)
|
$
|
549.5
|
|
||
|
Deferred income tax asset
|
96.1
|
|
(6.8
|
)
|
89.3
|
|
|||||
|
Liabilities
|
|||||||||||
|
Accrued expenses
|
687.4
|
|
(29.3
|
)
|
658.1
|
|
|||||
|
Shareholders' equity
|
|||||||||||
|
Retained earnings
|
$
|
2,135.7
|
|
$
|
21.3
|
|
$
|
2,157.0
|
|
||
Recently Issued Accounting Standards
Defined Benefit Plan Disclosures
: In August 2018, the FASB issued ASU 2018-14,
Disclosure Framework - Changes to the Disclosure Requirements for Defined Benefit Plans,
which modifies the disclosure requirements for employers that sponsor defined benefit pension or other postretirement plans. The amendment is effective for interim and annual periods ending after December 15, 2020, with early adoption permitted.
The Company is currently evaluating the impact of adopting this ASC amendment, but does not expect it will have a material impact on its consolidated financial statements.
67
Cloud Computing Arrangements
: In August 2018, the FASB issued ASU 2018-15,
Customer's Accounting for Implementation Costs Incurred in a Cloud Computing Arrangement that is a Service Contract,
which aligns the requirements for capitalizing implementation costs incurred in a hosting arrangement that is a service contract with the requirements for capitalizing implementation costs incurred to develop or obtain internal-use software. The amendment is effective for interim and annual periods beginning after December 15, 2019, with early adoption permitted.
The Company is currently evaluating the impact of adopting this ASC amendment, but does not expect it will have a material impact on its consolidated financial statements.
Tax Effects in Other Comprehensive Income
: In February 2018, the FASB issued ASU 2018-02,
Reclassification of Certain Tax Effects from Accumulated Other Comprehensive Income
(AOCI)
,
which permits companies to reclassify the disproportionate income tax effects of the Tax Cuts and Jobs Act of 2017 on items within AOCI to retained earnings. The ASU also requires certain new disclosures. The amendment is effective for interim and annual periods beginning after December 15, 2018, with early adoption permitted.
The Company is currently evaluating the impact of adopting this ASC amendment, but does not expect it will have a material impact on its consolidated financial statements.
Hedge Accounting
: In August 2017, the FASB issued ASU 2017-12,
Targeted Improvements to Accounting for Hedging Activities,
to simplify the application of hedge accounting and to better align an entity's risk management activities with the financial reporting of hedging relationships. The amendment is effective for interim and annual periods beginning after December 15, 2018, with early adoption permitted. The Company is currently evaluating the impact of adopting this ASC amendment, but does not expect it will have a material impact on its consolidated financial statements.
Recognition of Leases
: In February 2016, the FASB issued ASU 2016-02,
Leases,
(new leasing standard), which amended the ASC to require lessees to recognize assets and liabilities on the balance sheet for all leases with terms greater than twelve months. Lessees will recognize expenses similar to current lease accounting. The amendment is to be applied using a modified retrospective method with certain practical expedients, and is effective for fiscal years and interim periods within those years, beginning after December 15, 2018, with early adoption permitted. The Company plans to elect the practical expedients upon transition that will retain the lease classification and initial direct costs for any leases that exist prior to adoption. The Company will also not reassess whether any contracts entered into prior to adoption are leases.
In July, 2018, the FASB issued ASU 2018-11,
Leases - Targeted Improvements
, which amended the ASC to provide relief from implementing certain aspects of the new leasing standard. The amendment provides an additional (and optional) transition method to adopt the new leasing standard where an entity initially applies the new leasing standard at the adoption date and recognizes a cumulative-effect adjustment to the opening balance of retained earnings in the period of adoption. The Company plans to elect this option and as a result, will not restate its consolidated financial statements on the date of initial application. The Company anticipates the adoption of the standard will result in the recognition of approximately
$100 million
in right-of-use assets and associated lease obligations on the consolidated balance sheets and will not materially impact results on the consolidated statements of operations.
Note 2 –
Revenue Recognition
The following tables present the Company's revenue for the year ended December 31,
2018
into categories that depict how the nature, amount, timing and uncertainty of revenue and cash flows are affected by economic factors.
68
|
Year Ended December 31, 2018
|
|||||||||||||||
|
Marine Engine
|
Boat
|
Fitness
|
Total
|
||||||||||||
|
Geographic Markets
|
|||||||||||||||
|
United States
|
$
|
2,106.6
|
|
$
|
1,119.9
|
|
$
|
533.9
|
|
$
|
3,760.4
|
|
|||
|
Europe
|
373.7
|
|
132.9
|
|
201.9
|
|
708.5
|
|
|||||||
|
Asia-Pacific
|
228.8
|
|
35.7
|
|
175.0
|
|
439.5
|
|
|||||||
|
Canada
|
150.5
|
|
157.5
|
|
30.0
|
|
338.0
|
|
|||||||
|
Rest-of-World
|
134.0
|
|
25.3
|
|
97.5
|
|
256.8
|
|
|||||||
|
Marine eliminations
|
(344.0
|
)
|
—
|
|
—
|
|
(344.0
|
)
|
|||||||
|
Total
|
$
|
2,649.6
|
|
$
|
1,471.3
|
|
$
|
1,038.3
|
|
$
|
5,159.2
|
|
|||
|
Major Product Lines
|
|||||||||||||||
|
Propulsion
|
$
|
1,551.6
|
|
$
|
—
|
|
$
|
—
|
|
$
|
1,551.6
|
|
|||
|
Parts & Accessories
|
1,442.0
|
|
—
|
|
—
|
|
1,442.0
|
|
|||||||
|
Aluminum Freshwater Boats
|
—
|
|
619.0
|
|
—
|
|
619.0
|
|
|||||||
|
Recreational Fiberglass Boats
|
—
|
|
485.9
|
|
—
|
|
485.9
|
|
|||||||
|
Saltwater Fishing Boats
|
—
|
|
362.1
|
|
—
|
|
362.1
|
|
|||||||
|
Commercial Cardio Fitness Equipment
|
—
|
|
—
|
|
579.4
|
|
579.4
|
|
|||||||
|
Commercial Strength Fitness Equipment
|
—
|
|
—
|
|
379.4
|
|
379.4
|
|
|||||||
|
Consumer Fitness Equipment
|
—
|
|
—
|
|
79.5
|
|
79.5
|
|
|||||||
|
Other
|
—
|
|
4.3
|
|
—
|
|
4.3
|
|
|||||||
|
Marine eliminations
|
(344.0
|
)
|
—
|
|
—
|
|
(344.0
|
)
|
|||||||
|
Total
|
$
|
2,649.6
|
|
$
|
1,471.3
|
|
$
|
1,038.3
|
|
$
|
5,159.2
|
|
|||
For product sales, the Company transfers control and recognizes revenue at the time the product ships from a manufacturing or distribution facility ("free on board shipping point"), or at the time the product arrives at the customer's facility ("free on board destination"). When the shipping terms are "free on board shipping point", the customer obtains control and is able to direct the use of, and obtain substantially all of the benefits from, the products at the time the products are shipped. For shipments provided under “free on board destination”, control transfers to the customer upon delivery. Payment terms vary but are generally due within 30 days of transferring control. For the Company's Boat and Marine Engine segments, most product sales are wholesale financed by customers through the Company's joint venture, Brunswick Acceptance Company, LLC (BAC), or other lending institutions, and payment is typically due in the month of shipment. For further information on the BAC joint venture, refer to
Note 11 –
Financing Joint Venture
. In addition, periodically the Company may require the customer to provide up front cash deposits in advance of performance.
The Company also sells separately priced extended warranty contracts that extend the coverage period beyond the standard warranty period included with the product sale. When determining an appropriate allocation of the transaction price to the extended warranty performance obligation, the Company uses an observable price to determine the stand-alone selling price. Extended warranties typically range from an additional 1 year to 3 years. The Company receives payment at the inception of the contract and recognizes revenue over the extended warranty coverage period. This time-elapsed method is used to measure progress because the Company, on average, satisfies its performance obligation evenly over the warranty period.
For certain customers within the Fitness segment, the Company provides rebate incentives settled in free product. These rebates provide the customer with a material right which would not have been received without entering into the contract and, therefore, represent a separate performance obligation to which revenue is allocated based on the products' stand-alone selling price. This revenue is deferred and recognized at a point in time upon rebate redemption, with a commensurate charge to Cost of sales for related product costs. The Company also provides product installation services to certain customers for which the Company recognizes revenue at the time of installation, using an observable price to determine the stand-alone selling price.
As of January 1,
2018
,
$170.8 million
of contract liabilities associated with extended warranties, customer deposits, and product rebates were reported in Accrued expenses and Other Long-term liabilities with
$76.8 million
of this amount recognized as revenue during year ended December 31,
2018
. As of December 31,
2018
, total contract liabilities were
$178.7 million
. The total amount of the transaction price allocated to unsatisfied performance obligations as of December 31,
2018
is
$159.5 million
for contracts greater than one year, which includes both extended warranties and product rebates. The Company expects to recognize
69
approximately
$56.7 million
of this amount in
2019
and
$102.8 million
thereafter. Contract assets as of January 1,
2018
and December 31,
2018
were not material. In addition, costs to obtain and fulfill contracts during the period were not material.
The amount of consideration received can vary, primarily because of customer incentive or rebate arrangements. In addition, the Company provides customers the right to return eligible products under certain circumstances. The Company estimates variable consideration based on the expected value of total consideration to which customers are likely to be entitled based on historical experience and projected market expectations. Included in the estimate is an assessment as to whether any variable consideration is constrained. Revenue estimates are adjusted at the earlier of a change in the expected value of consideration or when the consideration becomes fixed. As a result, the Company recognized a decrease to revenue of
$13.5 million
related to sales recognized in
2017
.
Note 3 –
Discontinued Operations
In December 2017, the Board of Directors authorized the Company to exit its Sea Ray business, including the Meridian brand, as a result of, among other things, a material change in strategic direction and a review of the expected future cash flows, market conditions and business trends. The Company engaged in a thorough sales process and ultimately determined that the offers received did not reflect an appropriate value for the brand. As a result, in June 2018, the Board of Directors authorized the Company to end the sale process for its Sea Ray business. As part of this action, the Company decided to restructure the businesses, including discontinuing Sea Ray Sport Yacht and Yacht models and winding down yacht production, while reinventing Sea Ray Sport Boat and Sport Cruiser operations. The winding down of Sea Ray Sport Yacht and Yacht operations was largely completed in 2018. The assets and liabilities of the Sea Ray business, which were reported as held for sale in the 2017 Form 10-K, have been reclassified to assets and liabilities in the Consolidated Balance Sheets for all periods presented. Additionally, the results of these businesses are no longer presented as discontinued operations in the Consolidated Statements of Cash Flows, the Consolidated Statements of Operations and the Notes to Consolidated Financial Statements in any period presented.
In the fourth quarter of 2018, the Company made adjustments to certain liabilities that were retained as part of the sale of the retail bowling business in 2014 and the bowling products business in 2015. The Company does not have continuing involvement or cash flows associated with these businesses, which were previously reported as discontinued operations in the Consolidated Statements of Operations for the years ended December 31, 2016, 2015 and 2014. As a result of these adjustments, the Company recognized
$2.2 million
of after-tax earnings as discontinued operations in the Consolidated Statements of Operations for the year ended December 31, 2018.
Note 4 –
Restructuring, Exit, Integration and Impairment Activities
The Company has announced and implemented a number of initiatives designed to improve its cost structure, better utilize overall capacity, improve general operating efficiencies and integrate the operations of recently acquired businesses. These initiatives resulted in the recognition of restructuring, exit, integration and impairment charges in the Consolidated Statements of Operations during
2018
,
2017
and
2016
.
The costs incurred under these initiatives include:
•
Restructuring and Exit Activities – These amounts relate to:
|
•
|
Employee termination and other benefits
|
|
•
|
Inventory adjustments to lower of cost or net realizable value
|
|
•
|
Costs to retain and relocate employees
|
|
•
|
Consulting costs
|
|
•
|
Consolidation of manufacturing footprint
|
|
•
|
Facility shutdown costs
|
|
•
|
Costs associated with the wind-down of Sport Yacht and Yacht operations
|
•
Asset Disposition and Impairment Actions – These amounts relate to impairments of assets and gains on the sale of assets previously impaired as part of a restructuring or exit activity. The impairments recognized were equal to the difference between the carrying amount of the asset and the estimated fair value of the asset, which was determined using observable inputs, including appraisals from independent third parties when available. When observable inputs were not available, estimated fair value was determined using the Company’s assumptions, including the data that market participants would use in pricing the asset, based
70
on the best information available in the circumstances. Specifically, the Company used discounted cash flows to determine the fair value of the asset when observable inputs were unavailable.
•
Integration Activities – These amounts relate to professional fees for systems integration and deal costs, employee termination and benefits and other charges associated with integrating the operations of recently acquired businesses.
•
Intangible Asset Impairments – These amounts relate to impairments of intangible assets recognized as a result of the Company's periodic impairment testing. In the fourth quarter of 2017, the Company recorded an impairment charge for the Cybex trade name as a result of declining sales and operating performance. In the third and fourth quarters of 2018, the Company recorded additional impairment charges for the Cybex trade name as a result of further declines in operating performance and projected declines in sales due to changes in operating strategy. The company used a relief-from-royalty analysis, using Level 3 inputs, to assess the fair value of the Cybex trade name. The impairment charges were recorded within the Fitness segment. Refer to
Note 1 –
Significant Accounting Policies
for further details about the Company's impairment testing procedures.
The Company has reported restructuring, exit, integration and impairment activities based on the specific driver of the cost and reflected the expense in the accounting period when the Company has committed to or incurred the cost, as appropriate. The following table is a summary of the net expense associated with the restructuring, exit, integration and impairment activities.
|
(in millions)
|
2018
|
2017
|
2016
|
||||||||
|
Restructuring and exit activities:
|
|||||||||||
|
Employee termination and other benefits
|
$
|
13.0
|
|
$
|
9.4
|
|
$
|
1.0
|
|
||
|
Current asset write-downs
|
18.2
|
|
9.9
|
|
—
|
|
|||||
|
Professional fees
|
8.0
|
|
1.1
|
|
—
|
|
|||||
|
Other
(A)
|
10.7
|
|
1.5
|
|
—
|
|
|||||
|
Asset disposition and impairment actions:
|
|||||||||||
|
Trade name impairment
|
22.1
|
|
13.9
|
|
—
|
|
|||||
|
Definite-lived and other asset impairments
|
13.1
|
|
31.0
|
|
2.3
|
|
|||||
|
Valuation allowance (reversal) on disposal group
|
(5.0
|
)
|
5.0
|
|
—
|
|
|||||
|
Integration activities:
|
|||||||||||
|
Employee termination and other benefits
|
0.0
|
|
2.5
|
|
4.0
|
|
|||||
|
Professional fees
|
0.7
|
|
5.2
|
|
5.9
|
|
|||||
|
Other
|
0.1
|
|
1.8
|
|
2.4
|
|
|||||
|
Total restructuring, exit, integration and impairment charges
|
$
|
80.9
|
|
$
|
81.3
|
|
$
|
15.6
|
|
||
(A) The charges in 2018 relate to warranty adjustments in connection with the wind-down of Sport Yacht and Yacht operations.
The following tables summarize the change in accrued restructuring, exit, integration and impairment charges within Accrued expenses in the Consolidated Balance Sheets for the years ended December 31, 2018, 2017 and 2016:
|
Dec 31, 2017
|
2018 Activity
|
Dec 31, 2018
|
|||||||||||||||||
|
(in millions)
|
Accrued Charges
|
Total Charges
|
Non-Cash Charges
|
Payments
(A)
|
Accrued Charges
(B)
|
||||||||||||||
|
Fitness
|
$
|
5.0
|
|
$
|
25.3
|
|
$
|
(21.8
|
)
|
$
|
(5.0
|
)
|
$
|
3.5
|
|
||||
|
Boat
|
3.7
|
|
54.1
|
|
(26.6
|
)
|
(15.8
|
)
|
15.4
|
|
|||||||||
|
Corporate
|
0.5
|
|
1.5
|
|
—
|
|
(1.0
|
)
|
1.0
|
|
|||||||||
|
Accrued balance
|
$
|
9.2
|
|
$
|
80.9
|
|
$
|
(48.4
|
)
|
$
|
(21.8
|
)
|
$
|
19.9
|
|
||||
71
|
Dec 31, 2016
|
2017 Activity
|
Dec 31, 2017
|
|||||||||||||||||
|
(in millions)
|
Accrued Charges
|
Total Charges
|
Non-Cash Charges
|
Payments
(A)
|
Accrued Charges
|
||||||||||||||
|
Fitness
|
$
|
3.9
|
|
$
|
30.3
|
|
$
|
(16.6
|
)
|
$
|
(12.6
|
)
|
$
|
5.0
|
|
||||
|
Boat
|
0.7
|
|
48.6
|
|
(43.2
|
)
|
(2.4
|
)
|
3.7
|
|
|||||||||
|
Corporate
|
—
|
|
2.4
|
|
(0.8
|
)
|
(1.1
|
)
|
0.5
|
|
|||||||||
|
Accrued balance
|
$
|
4.6
|
|
$
|
81.3
|
|
$
|
(60.6
|
)
|
$
|
(16.1
|
)
|
$
|
9.2
|
|
||||
|
Dec 31, 2015
|
2016 Activity
|
Dec 31, 2016
|
|||||||||||||||||
|
(in millions)
|
Accrued Charges
|
Total Charges
|
Non-Cash Charges
|
Payments
(A)
|
Accrued Charges
|
||||||||||||||
|
Fitness
|
$
|
—
|
|
$
|
12.7
|
|
$
|
—
|
|
$
|
(8.8
|
)
|
$
|
3.9
|
|
||||
|
Boat
|
1.0
|
|
0.6
|
|
—
|
|
(0.9
|
)
|
0.7
|
|
|||||||||
|
Corporate
|
0.5
|
|
2.3
|
|
(2.3
|
)
|
(0.5
|
)
|
—
|
|
|||||||||
|
Accrued balance
|
$
|
1.5
|
|
$
|
15.6
|
|
$
|
(2.3
|
)
|
$
|
(10.2
|
)
|
$
|
4.6
|
|
||||
(A) Cash payments may include payments related to prior period charges.
(B) The accrued charges as of December 31, 2018 are expected to be paid during 2019.
Reductions in demand for the Company’s products, further refinement of its product portfolio, further opportunities to reduce costs or the cost of integrating future acquisitions may result in additional restructuring, exit, integration and impairment charges in future periods.
Actions Initiated in 2018
In the second quarter of 2018, the Company ended the sale process of its Sea Ray business and as a result, recorded an additional impairment of long-lived assets. During the second, third and fourth quarters of 2018, the Company recorded additional charges in connection with the wind down of Sport Yacht and Yacht production, mainly relating to inventory write-downs, increased warranty liabilities and employee severance and retention bonuses. These costs were partially offset by the reversal of the valuation allowance in the second quarter of 2018 for estimated transaction costs which was recorded when the assets and liabilities of Sea Ray were initially classified as held for sale.
In 2018, the Company executed headcount reductions in the Fitness and Boat segments aimed at improving general operating efficiencies.
In 2018, the Company also recorded charges within Corporate related to the transition of certain corporate officers.
The following table is a summary of the expenses associated with the restructuring, exit, integration and impairment activities for the year ended December 31, 2018, related to actions initiated in 2018:
|
(in millions)
|
Fitness
|
Boat
|
Corporate
|
Total
|
|||||||||||
|
Restructuring and exit activities:
|
|||||||||||||||
|
Employee termination and other benefits
|
$
|
2.7
|
|
$
|
4.7
|
|
$
|
1.5
|
|
$
|
8.9
|
|
|||
|
Current asset write-downs
|
—
|
|
18.9
|
|
—
|
|
18.9
|
|
|||||||
|
Professional fees
|
—
|
|
3.9
|
|
—
|
|
3.9
|
|
|||||||
|
Other
|
—
|
|
10.7
|
|
—
|
|
10.7
|
|
|||||||
|
Asset disposition and impairment actions:
|
|||||||||||||||
|
Trade name impairment
|
22.1
|
|
—
|
|
—
|
|
22.1
|
|
|||||||
|
Definite-lived and other asset impairments
|
0.4
|
|
12.7
|
|
—
|
|
13.1
|
|
|||||||
|
Total restructuring, exit, integration and impairment charges
|
$
|
25.2
|
|
$
|
50.9
|
|
$
|
1.5
|
|
$
|
77.6
|
|
|||
72
Actions Initiated in 2017
In the fourth quarter of 2017, the Board of Directors authorized the Company to exit its Sea Ray business, including the Meridian brand. In conjunction with this decision, the Company evaluated the disposal group's fair value, less costs to sell, and compared that to its carrying value at the time. As a result, the Company recorded an impairment of long-lived assets as well as a valuation allowance for estimated transaction costs. Refer to
Note 3 –
Discontinued Operations
for further information.
In the third quarter of 2017, the Company recorded restructuring charges within the Fitness segment for the write-down of inventory and tooling related to the exit of the InMovement product line. In 2018, a portion of these restructuring charges was reversed after certain inventory was subsequently sold above its recorded value.
In the second, third and fourth quarters of 2017, the Company implemented headcount reductions in the Fitness and Boat segments aimed at improving general operating efficiencies.
In the first quarter of 2017, the Company announced the closure of its boat manufacturing facility in Joinville, Santa Catarina, Brazil, as a result of continued market weakness due partially to unfavorable foreign currency impacts in the region. As a result, the Company recorded restructuring, exit and impairment charges including the write-down of inventory. The facility manufactured certain Bayliner and Sea Ray boat models for the Latin American market. The long-lived assets at this facility were previously fully impaired.
In the first quarter of 2017, the Company also recorded restructuring charges within Corporate related to the transition of certain corporate officers.
The following table is a summary of the expense associated with the restructuring, exit, integration and impairment activities for the years ended December 31, 2018 and 2017, related to actions initiated in 2017:
|
2018
|
2017
|
||||||||||||||||||||||||||
|
(in millions)
|
Fitness
|
Boat
|
Total
|
Fitness
|
Boat
|
Corporate
|
Total
|
||||||||||||||||||||
|
Restructuring and exit activities:
|
|||||||||||||||||||||||||||
|
Employee termination and other benefits
|
$
|
—
|
|
$
|
4.1
|
|
$
|
4.1
|
|
$
|
3.8
|
|
$
|
3.2
|
|
$
|
2.4
|
|
$
|
9.4
|
|
||||||
|
Current asset write-downs (reversals)
|
(0.7
|
)
|
—
|
|
(0.7
|
)
|
2.7
|
|
7.2
|
|
—
|
|
9.9
|
|
|||||||||||||
|
Professional fees
|
—
|
|
4.1
|
|
4.1
|
|
—
|
|
1.1
|
|
—
|
|
1.1
|
|
|||||||||||||
|
Other
|
—
|
|
—
|
|
—
|
|
0.4
|
|
1.1
|
|
—
|
|
1.5
|
|
|||||||||||||
|
Asset disposition and impairment actions:
|
|||||||||||||||||||||||||||
|
Trade name impairment
|
—
|
|
—
|
|
—
|
|
13.9
|
|
—
|
|
—
|
|
13.9
|
|
|||||||||||||
|
Definite-lived and other asset impairments
|
—
|
|
—
|
|
—
|
|
—
|
|
31.0
|
|
—
|
|
31.0
|
|
|||||||||||||
|
Valuation allowance (reversal) on disposal
|
—
|
|
(5.0
|
)
|
(5.0
|
)
|
—
|
|
5.0
|
|
—
|
|
5.0
|
|
|||||||||||||
|
Total restructuring, exit, integration and impairment charges
|
$
|
(0.7
|
)
|
$
|
3.2
|
|
$
|
2.5
|
|
$
|
20.8
|
|
|
$
|
48.6
|
|
|
$
|
2.4
|
|
$
|
71.8
|
|
||||
Actions Initiated in 2016
The Company acquired Cybex International, Inc. (Cybex) and Indoor Cycling Group GmbH (ICG) in the first and third quarters of 2016, respectively. During 2016, the Company executed certain restructuring and integration activities within the Fitness segment primarily related to these acquisitions.
In the fourth quarter of 2016, the Company recorded restructuring charges related to the realignment of certain executive positions within the Boat segment as well as an impairment charge recorded within the Corporate segment.
73
The following table is a summary of the expense associated with the restructuring, exit, integration and impairment activities for the years ended December 31, 2018, 2017 and 2016, related to actions initiated in 2016:
|
2018
|
2017
|
2016
|
|||||||||||||||||||||||||||||
|
(in millions)
|
Fitness
|
Total
|
Fitness
|
Total
|
Fitness
|
Boat
|
Corporate
|
Total
|
|||||||||||||||||||||||
|
Restructuring and exit activities:
|
|||||||||||||||||||||||||||||||
|
Employee termination and other benefits
|
$
|
—
|
|
$
|
—
|
|
$
|
—
|
|
$
|
—
|
|
$
|
0.4
|
|
$
|
0.6
|
|
$
|
—
|
|
$
|
1.0
|
|
|||||||
|
Asset disposition and impairment actions:
|
|||||||||||||||||||||||||||||||
|
Definite-lived and other asset impairments
|
—
|
|
—
|
|
—
|
|
—
|
|
—
|
|
—
|
|
1.4
|
|
1.4
|
|
|||||||||||||||
|
Integration activities:
|
|||||||||||||||||||||||||||||||
|
Employee termination and other benefits
|
0.0
|
|
0.0
|
|
2.5
|
|
2.5
|
|
4.0
|
|
—
|
|
—
|
|
4.0
|
|
|||||||||||||||
|
Professional fees
|
0.7
|
|
0.7
|
|
5.2
|
|
5.2
|
|
5.9
|
|
—
|
|
—
|
|
5.9
|
|
|||||||||||||||
|
Other
|
0.1
|
|
0.1
|
|
1.8
|
|
1.8
|
|
2.4
|
|
—
|
|
—
|
|
2.4
|
|
|||||||||||||||
|
Total restructuring, exit, integration and impairment charges
|
$
|
0.8
|
|
$
|
0.8
|
|
$
|
9.5
|
|
$
|
9.5
|
|
$
|
12.7
|
|
$
|
0.6
|
|
$
|
1.4
|
|
$
|
14.7
|
|
|||||||
Note 5 –
Acquisitions
2018 Acquisitions
On August 9, 2018, the Company completed its acquisition of the Global Marine & Mobile business of Power Products Holdings, LLC (Power Products) for
$909.6 million
in cash, on a cash-free, debt-free basis. Brunswick used proceeds from a combination of 364-day, three-year and five-year term loans (Term Loans) totaling
$800.0 million
as described in
Note 17 –
Debt
along with cash on hand to fund this acquisition.
Power Products is a leading provider of electrical products to marine and other recreational and specialty vehicle markets. The acquisition advances Brunswick’s leadership by adding integrated electrical systems solutions to the marine market and an array of other mobile, specialty vehicle and industrial applications. Power Products is managed as part of the Marine Engine segment.
The Company accounted for the acquisition using the acquisition method of accounting in accordance with ASC 805, Business Combinations, with Brunswick being the acquiring entity, and reflecting estimates and assumptions deemed appropriate by Company management. Transaction costs related to the acquisition were expensed as incurred within Selling, general and administrative expense and totaled
$13.8 million
for the year ended December 31, 2018. The net sales and operating earnings of Power Products included in Brunswick's consolidated financial statements since the date of acquisition were
$82.8 million
and
$1.9 million
, respectively, for the year ended December 31, 2018. Operating earnings included
$21.2 million
of purchase accounting amortization.
The purchase price allocation for the assets acquired and liabilities assumed is preliminary and subject to change within the allowed measurement period as the Company finalizes its fair value estimates. The following table is a summary of the assets acquired, liabilities assumed and net cash consideration paid for the Power Products acquisition during 2018:
74
|
(in millions)
|
Fair Value
|
Useful Life
|
|||
|
Accounts and notes receivable
|
$
|
38.3
|
|
||
|
Inventory
|
64.3
|
|
|||
|
Goodwill
(A)
|
344.2
|
|
|||
|
Trade names
|
111.0
|
|
Indefinite
|
||
|
Customer relationships
|
430.0
|
|
15 years
|
||
|
Property and equipment
|
10.6
|
|
|||
|
Other assets
|
5.6
|
|
|||
|
Total assets acquired
|
1,004.0
|
|
|||
|
Accounts payable
|
23.5
|
|
|||
|
Accrued expenses
|
16.2
|
|
|||
|
Deferred tax liabilities
|
54.7
|
|
|||
|
Total liabilities assumed
|
94.4
|
|
|||
|
Net cash consideration paid
(B)
|
$
|
909.6
|
|
||
(A) The goodwill recorded for the acquisition of Power Products is partially deductible for tax purposes.
(B) Net cash consideration paid includes a purchase price adjustment of
$0.4 million
.
Pro Forma Financial Information (Unaudited)
Prior to the acquisition, Power Products utilized a fiscal year ending August 31, and Brunswick’s fiscal year ends on December 31 of each year. As the Brunswick and Power Products fiscal years differ by more than 93 days, pursuant to Rule 11-02(c)(3) of Regulation S-X, Power Products’ historical unaudited financial information was adjusted for the purpose of presenting the Unaudited Pro Forma Net sales and Net earnings for the year ended December 31, 2017. The Unaudited Pro Forma Net sales and Net earnings for the year ended December 31, 2017 was prepared using Power Products’ historical unaudited Net sales and Net earnings for the year ended February 28, 2018.
The pro forma information has been prepared as if the Power Products acquisition and the related debt financing had occurred on January 1, 2017. These pro forma results are based on estimates and assumptions which the Company believes to be reasonable. They are not the results that would have been realized had the acquisition actually occurred on January 1, 2017 and are not necessarily indicative of Brunswick's consolidated results of net earnings in future periods. The pro forma results include adjustments primarily related to interest expense on the Term Loans and amortization of intangible assets. Additionally, the pro forma adjustments include the following non-recurring amounts:
(A) Transaction costs of
$13.8 million
and;
(B) Expense related to the estimated fair value adjustment to inventory of
$9.2 million
recognized as part of the application of purchase accounting.
|
Years Ended December 31
|
|||||||
|
(in millions)
|
2018
|
2017
|
|||||
|
Pro forma Net sales
|
$
|
5,309.4
|
|
$
|
5,048.9
|
|
|
|
Pro forma Operating earnings
|
409.5
|
|
296.9
|
|
|||
|
Pro forma Net earnings
|
283.8
|
|
125.7
|
|
|||
The effective income tax rate included in the pro forma results reflects
17.3 percent
and
47.3 percent
for the periods ended 2018 and 2017, respectively.
75
2017 Acquisitions
On September 1, 2017, the Company acquired
100 percent
of Lankhorst Taselaar B.V. (Lankhorst Taselaar), a leading marine parts and accessories distribution company based in the Netherlands and Germany. The acquisition augments the marine parts and accessories businesses through a broader product line and an expanded distribution network. Lankhorst Taselaar is managed as part of the Company's Marine Engine segment.
The net cash consideration the Company paid to acquire Lankhorst Taselaar was
$15.5 million
. The preliminary opening balance sheet included
$4.6 million
of identifiable intangible assets, including customer relationships and trade names for
$3.2 million
and
$1.4 million
, respectively, along with
$5.5 million
for goodwill which is not deductible for tax purposes. The amount assigned to Lankhorst Taselaar's customer relationships will be amortized over its estimated useful life of approximately
15 years
.
The following table is a summary of the net cash consideration paid and the goodwill and intangible assets acquired during the years ended
December 31, 2018
and
2017
:
|
(in millions)
|
Fair Value of Identifiable Intangible Assets Acquired
|
|||||||||||||||||||
|
Year
|
Net Cash Consideration Paid
|
Goodwill
|
Total
|
Intangible Asset
|
Useful Life
|
|||||||||||||||
|
2018
|
$
|
909.6
|
|
$
|
344.2
|
|
$
|
541.0
|
|
Trade names
|
$
|
111.0
|
|
Indefinite
|
||||||
|
Customer relationships
|
430.0
|
|
15 years
|
|||||||||||||||||
|
2017
|
15.5
|
|
5.5
|
|
4.6
|
|
Trade names
|
1.4
|
|
Indefinite
|
||||||||||
|
Customer relationships
|
3.2
|
|
15 years
|
|||||||||||||||||
The 2017 Lankhorst Taselaar acquisition is not material to the Company's net sales, results of operations or total assets during any period presented. Accordingly, the Company's consolidated results from operations do not differ materially from historical performance as a result of this acquisition and, therefore, pro forma results are not presented.
Note 6 –
Earnings per Common Share
Basic earnings per common share is calculated by dividing Net earnings by the weighted average outstanding shares which includes vested, unissued equity awards during the period. Diluted earnings per common share is calculated similarly, except that the calculation includes the dilutive effect of stock-settled SARs, non-vested stock awards and performance awards.
Share awards that were not included in the computation of diluted earnings per share because their inclusion was anti-dilutive were immaterial for all periods presented.
Refer to the Consolidated Statements of Operations for both Basic and Diluted earnings per common share for the years ended December 31,
2018
,
2017
and
2016
.
Note 7 –
Segment Information
Brunswick is a manufacturer and marketer of leading consumer brands and has
three
reportable segments: Marine Engine, Boat and Fitness. The Company’s segments are defined by management’s reporting structure and operating activities.
The Marine Engine segment manufactures and markets a full range of outboard engines, sterndrive engines, inboard engines and marine parts and accessories, which are principally sold directly to boat builders, including Brunswick's Boat segment, or through marine retail dealers and distributors worldwide. The Company's engine manufacturing plants are located mainly in the United States, China and Japan, with sales mainly to markets in the Americas, Europe and Asia-Pacific.
The Boat segment designs, manufactures and markets the following types of boats: fiberglass pleasure, sport cruiser, sport fishing and center-console, offshore fishing, aluminum and fiberglass fishing, pontoon, utility, deck, inflatable, and heavy-gauge aluminum. The Boat segment's products are manufactured mainly in the United States, Europe and Mexico and sold through a global network of dealer and distributor locations, primarily in North America and Europe.
The Fitness segment designs, manufactures and markets a full line of commercial-grade fitness equipment (including treadmills, total body cross-trainers, stair climbers, and stationary exercise bicycles and strength-training equipment) under the Life Fitness,
76
Hammer Strength, Cybex, ICG, and SCIFIT brands. The Fitness segment also includes our active recreation product categories including billiards, table tennis and air hockey tables, as well as game room furniture and related accessories under the Brunswick and Contender brands. The segment's products are manufactured mainly in the United States and Hungary or are sourced from international suppliers. Fitness equipment is sold mainly in the Americas, Europe and Asia to health clubs, corporate, university, hospitality, military and government facilities, and to consumers through selected mass merchants, specialty retail dealers and through the Company's website. Consumer active recreation equipment is predominantly sold in the United States and distributed primarily through dealers.
The Company evaluates performance based on business segment operating earnings. Segment operating earnings do not include the expenses of corporate administration, pension costs, pension settlement charges, impairments or gains on the sale of equity investments, earnings from unconsolidated equity affiliates, other expenses and income of a non-operating nature, transaction financing charges, interest expense and income or provisions or benefits for income taxes.
Corporate/Other results include items such as corporate staff and administrative costs, investments in technology solutions, business development and other growth-related expenses, including IT enhancements. Corporate/Other total assets consist of mainly cash, cash equivalents and investments in marketable securities, restricted cash, income tax balances and investments in unconsolidated affiliates. Marine eliminations adjust for sales between the Marine Engine and Boat segments, primarily for the sale of engines and parts and accessories to various boat brands, which are consummated at established arm’s length transfer prices as the intersegment pricing for these engines and parts and accessories are based upon and consistent with selling prices to third party customers.
Information about the operations of Brunswick's reportable segments is set forth below:
Operating Segments
|
|
Net Sales
|
Operating Earnings (Loss)
|
Total Assets
|
||||||||||||||||||||||||||||
|
(in millions)
|
2018
|
2017
|
2016
|
2018
|
2017
|
2016
|
2018
|
2017
|
|||||||||||||||||||||||
|
Marine Engine
|
$
|
2,993.6
|
|
$
|
2,631.8
|
|
$
|
2,441.1
|
|
$
|
454.4
|
|
$
|
411.3
|
|
$
|
378.4
|
|
$
|
2,380.9
|
|
$
|
1,205.0
|
|
|||||||
|
Boat
|
1,471.3
|
|
1,490.6
|
|
1,369.9
|
|
(12.5
|
)
|
5.3
|
|
60.8
|
|
423.2
|
|
411.6
|
|
|||||||||||||||
|
Marine eliminations
|
(344.0
|
)
|
(320.2
|
)
|
(302.9
|
)
|
—
|
|
—
|
|
—
|
|
—
|
|
—
|
|
|||||||||||||||
|
Total Marine
|
4,120.9
|
|
3,802.2
|
|
3,508.1
|
|
441.9
|
|
416.6
|
|
439.2
|
|
2,804.1
|
|
1,616.6
|
|
|||||||||||||||
|
Fitness
|
1,038.3
|
|
1,033.7
|
|
980.4
|
|
22.4
|
|
64.1
|
|
117.3
|
|
972.7
|
|
1,012.8
|
|
|||||||||||||||
|
Corporate/Other
|
—
|
|
—
|
|
—
|
|
(97.3
|
)
|
(82.4
|
)
|
(77.0
|
)
|
508.9
|
|
728.8
|
|
|||||||||||||||
|
Total
|
$
|
5,159.2
|
|
$
|
4,835.9
|
|
$
|
4,488.5
|
|
$
|
367.0
|
|
$
|
398.3
|
|
$
|
479.5
|
|
$
|
4,285.7
|
|
$
|
3,358.2
|
|
|||||||
|
|
Depreciation
|
Amortization
|
|||||||||||||||||||||
|
(in millions)
|
2018
|
2017
|
2016
|
2018
|
2017
|
2016
|
|||||||||||||||||
|
Marine Engine
|
$
|
69.3
|
|
$
|
48.8
|
|
$
|
48.4
|
|
$
|
23.0
|
|
$
|
1.7
|
|
$
|
1.8
|
|
|||||
|
Boat
|
26.7
|
|
31.8
|
|
29.3
|
|
1.0
|
|
1.0
|
|
0.8
|
|
|||||||||||
|
Fitness
|
20.0
|
|
18.0
|
|
15.9
|
|
5.7
|
|
5.7
|
|
4.2
|
|
|||||||||||
|
Corporate/Other
|
3.9
|
|
3.8
|
|
3.5
|
|
—
|
|
—
|
|
—
|
|
|||||||||||
|
Total
|
$
|
119.9
|
|
$
|
102.4
|
|
$
|
97.1
|
|
$
|
29.7
|
|
$
|
8.4
|
|
$
|
6.8
|
|
|||||
|
|
Capital Expenditures
|
Research & Development Expense
|
|||||||||||||||||||||
|
(in millions)
|
2018
|
2017
|
2016
|
2018
|
2017
|
2016
|
|||||||||||||||||
|
Marine Engine
|
$
|
126.3
|
|
$
|
111.1
|
|
$
|
112.4
|
|
$
|
98.5
|
|
$
|
90.5
|
|
$
|
85.6
|
|
|||||
|
Boat
|
48.5
|
|
55.4
|
|
44.5
|
|
22.9
|
|
21.1
|
|
20.2
|
|
|||||||||||
|
Fitness
|
13.2
|
|
24.3
|
|
35.7
|
|
27.4
|
|
34.8
|
|
33.4
|
|
|||||||||||
|
Corporate/Other
|
5.4
|
|
12.4
|
|
1.3
|
|
—
|
|
—
|
|
—
|
|
|||||||||||
|
Total
|
$
|
193.4
|
|
$
|
203.2
|
|
$
|
193.9
|
|
$
|
148.8
|
|
$
|
146.4
|
|
$
|
139.2
|
|
|||||
77
Geographic Segments
|
Net Sales
|
Net property
|
||||||||||||||||||
|
(in millions)
|
2018
|
2017
|
2016
|
2018
|
2017
|
||||||||||||||
|
United States
|
$
|
3,451.9
|
|
$
|
3,231.8
|
|
$
|
3,031.5
|
|
$
|
713.3
|
|
$
|
615.0
|
|
||||
|
International
|
1,707.3
|
|
1,604.1
|
|
1,457.0
|
|
75.5
|
|
75.8
|
|
|||||||||
|
Corporate/Other
|
—
|
|
—
|
|
—
|
|
16.5
|
|
15.2
|
|
|||||||||
|
Total
|
$
|
5,159.2
|
|
$
|
4,835.9
|
|
$
|
4,488.5
|
|
$
|
805.3
|
|
$
|
706.0
|
|
||||
Note 8 –
Fair Value Measurements
Fair value is defined as the exchange price that would be received for an asset or paid to transfer a liability (an exit price) in the principal or most advantageous market for the asset or liability in an orderly transaction between market participants on the measurement date. Valuation techniques used to measure fair value must maximize the use of observable inputs and minimize the use of unobservable inputs. There is a fair value hierarchy based on three levels of inputs, of which the first two are considered observable and the last unobservable.
|
•
|
Level 1 - Quoted prices in active markets for identical assets or liabilities. These are typically obtained from real-time quotes for transactions in active exchange markets involving identical assets or liabilities.
|
|
•
|
Level 2 - Inputs, other than quoted prices included within Level 1, which are observable for the asset or liability, either directly or indirectly. These are typically obtained from readily available pricing sources for comparable instruments.
|
|
•
|
Level 3 - Unobservable inputs, for which there is little or no market activity for the asset or liability. These inputs reflect the reporting entity’s own assumptions of the data that market participants would use in pricing the asset or liability, based on the best information available in the circumstances.
|
The following table summarizes Brunswick’s financial assets and liabilities measured at fair value on a recurring basis as of
December 31, 2018
:
|
(in millions)
|
Level 1
|
Level 2
|
Total
|
||||||||
|
Assets:
|
|
|
|
||||||||
|
Short-term investments in marketable securities
|
$
|
0.8
|
|
$
|
—
|
|
$
|
0.8
|
|
||
|
Restricted cash
|
9.0
|
|
—
|
|
9.0
|
|
|||||
|
Derivatives
|
—
|
|
9.1
|
|
9.1
|
|
|||||
|
Total assets
|
$
|
9.8
|
|
$
|
9.1
|
|
$
|
18.9
|
|
||
|
Liabilities:
|
|
|
|
|
|
|
|||||
|
Derivatives
|
$
|
—
|
|
$
|
3.1
|
|
$
|
3.1
|
|
||
|
Deferred compensation
|
3.5
|
|
22.9
|
|
26.4
|
|
|||||
|
Total liabilities at fair value
|
$
|
3.5
|
|
$
|
26.0
|
|
$
|
29.5
|
|
||
|
Liabilities measured at net asset value
|
10.2
|
|
|||||||||
|
Total liabilities
|
$
|
39.7
|
|
||||||||
78
The following table summarizes Brunswick’s financial assets and liabilities measured at fair value on a recurring basis as of
December 31, 2017
:
|
(in millions)
|
Level 1
|
Level 2
|
Total
|
||||||||
|
Assets:
|
|
|
|
||||||||
|
Cash equivalents
|
$
|
34.4
|
|
$
|
—
|
|
$
|
34.4
|
|
||
|
Short-term investments in marketable securities
|
0.8
|
|
—
|
|
0.8
|
|
|||||
|
Restricted cash
|
9.4
|
|
—
|
|
9.4
|
|
|||||
|
Derivatives
|
—
|
|
6.0
|
|
6.0
|
|
|||||
|
Total assets
|
$
|
44.6
|
|
$
|
6.0
|
|
$
|
50.6
|
|
||
|
Liabilities:
|
|
|
|
|
|
|
|||||
|
Derivatives
|
$
|
—
|
|
$
|
7.7
|
|
$
|
7.7
|
|
||
|
Deferred compensation
|
4.0
|
|
30.1
|
|
34.1
|
|
|||||
|
Total liabilities at fair value
|
$
|
4.0
|
|
$
|
37.8
|
|
$
|
41.8
|
|
||
|
Liabilities measured at net asset value
|
11.8
|
|
|||||||||
|
Total liabilities
|
$
|
53.6
|
|
||||||||
Refer to
Note 15 –
Financial Instruments
for additional information related to the fair value of derivative assets and liabilities by class. In addition to the items shown in the tables above, see
Note 18 –
Postretirement Benefits
for further discussion regarding the fair value measurements associated with the Company’s postretirement benefit plans.
Note 9 –
Financing Receivables
The Company has recorded financing receivables, which are defined as a contractual right to receive money, as assets on its Consolidated Balance Sheets as of
December 31, 2018
and
2017
. Substantially all of the Company’s financing receivables are for commercial customers, which includes receivables sold to third-party finance companies (Third-Party Receivables) and customer notes and other (Other Receivables). Third-Party Receivables are accounts that have been sold to third-party finance companies, but do not meet the definition of a true sale, and are therefore recorded as an asset with an offsetting balance recorded as a secured obligation in Accrued expenses and Other long-term liabilities as discussed in
Note 1 –
Significant Accounting Policies
. Other Receivables are mostly comprised of notes from customers, which are originated by the Company in the normal course of business. Financing receivables are carried at their face amounts less an allowance for credit losses.
The Company sells a broad range of recreational products to a worldwide customer base and extends credit to its customers based upon an ongoing credit evaluation program. The Company’s business units maintain credit organizations to manage financial exposure and perform credit risk assessments on an individual account basis. Accounts are not aggregated into categories for credit risk determinations. Due to the composition of the account portfolio, the Company does not believe that the credit risk posed by the Company’s financing receivables is significant to its operations, financial condition or cash flows. There were no significant troubled debt restructurings during the years ended
December 31, 2018
,
2017
or
2016
.
79
The following are the Company’s financing receivables, excluding trade accounts receivable contractually due within one year as of
December 31, 2018
and
December 31, 2017
:
|
(in millions)
|
December 31, 2018
|
December 31, 2017
|
|||||
|
Third-Party Receivables:
|
|
|
|
|
|||
|
Short-term
|
$
|
26.9
|
|
$
|
23.7
|
|
|
|
Long-term
|
41.1
|
|
30.2
|
|
|||
|
Total
|
68.0
|
|
53.9
|
|
|||
|
Other Receivables:
|
|
|
|
|
|||
|
Short-term
|
7.8
|
|
11.7
|
|
|||
|
Long-term
|
2.3
|
|
1.1
|
|
|||
|
Allowance for credit loss
|
(0.2
|
)
|
(0.2
|
)
|
|||
|
Total
|
9.9
|
|
12.6
|
|
|||
|
Total Financing Receivables
|
$
|
77.9
|
|
$
|
66.5
|
|
|
The activity related to the allowance for credit loss on financing receivables during the years ended
December 31, 2018
and
December 31, 2017
was not material.
Note 10 –
Investments
Investments in Marketable Securities
The Company may invest a portion of its cash reserves in marketable debt securities. These investments are reported in Short-term investments in marketable securities on the Consolidated Balance Sheets.
As of December 31, 2018 and 2017, the fair values of the Company's available-for-sale securities, which were equal to the amortized costs, were
$0.8 million
. The Company had no maturities of available-for-sale securities in 2018 and had
$35.0 million
and
$10.7 million
of maturities of available-for-sale securities during 2017 and
2016
, respectively.
Equity Investments
The Company has certain unconsolidated international and domestic affiliates that are accounted for using the equity method. The equity method is applied in situations in which the Company has the ability to exercise significant influence, but not control, over the investees. Management reviews equity investments for impairment whenever indicators are present suggesting that the carrying value of an investment is not recoverable. The following items are examples of impairment indicators: significant, sustained declines in an investee’s revenue, earnings, and cash flow trends; adverse market conditions of the investee’s industry or geographic area; the investee’s inability to execute its operating plan; the investee’s ability to continue operations measured by several items, including liquidity; and other factors. Once an impairment indicator is identified, management uses considerable judgment to determine if the decline in value is other than temporary, in which case the equity investment is written down to its estimated fair value, which could negatively impact reported results of operations.
In the fourth quarter of 2018, the Company sold its
36 percent
equity investment in Bella-Veneet Oy (Bella), a Finnish boat manufacturer, which had previously been fully impaired due to significant declines in profitability that were deemed other than temporary. As a result, the Company recorded a gain of
$2.3 million
within Equity earnings on the Consolidated Statements of Operations, which was equal to the proceeds from the sale.
Refer to
Note 11 –
Financing Joint Venture
for more details on the Company’s Brunswick Acceptance Company, LLC joint venture.
Brunswick did not receive any dividends from its unconsolidated affiliates in
2018
or 2016. Brunswick received
$0.4 million
in dividends from its unconsolidated affiliates in
2017
.
80
Note 11 –
Financing Joint Venture
The Company, through its Brunswick Financial Services Corporation (BFS) subsidiary, owns a
49 percent
interest in a joint venture, Brunswick Acceptance Company, LLC (BAC). CDF Joint Ventures, LLC (CDFJV), a subsidiary of Wells Fargo and Company, owns the remaining
51 percent
.
In February 2018, the parties entered into an amended and restated joint venture agreement (JV Agreement) to extend the term of their financial services through December 31, 2022. The JV Agreement contains a financial covenant that conforms to the maximum leverage ratio test in the Credit Facility described in
Note 17 –
Debt
.
The joint venture agreement contains provisions allowing for the renewal of the agreement or the purchase of the other party’s interest in the joint venture at the end of its term. Alternatively, either partner may terminate the agreement at the end of its term.
BAC is funded in part through a
$1.0 billion
secured borrowing facility from Wells Fargo Commercial Distribution Finance, LLC (WFCDF), which is in place through the term of the joint venture, and with equity contributions from both partners. BAC also sells a portion of its receivables to a securitization facility, the Wells Fargo Dealer Floorplan Master Note Trust, which is arranged by Wells Fargo. The sales of these receivables meet the requirements of a “true sale” and are therefore not retained on the financial statements of BAC. Neither the Company nor any of its subsidiaries guarantee the indebtedness of BAC. In addition, BAC is not responsible for any continuing servicing costs or obligations with respect to the securitized receivables.
The Company considers BFS’s investment in BAC as an investment in a variable interest entity of which the Company is not the primary beneficiary. To be considered the primary beneficiary, the Company must have the power to direct the activities of BAC that most significantly impact BAC’s economic performance and the Company must have the obligation to absorb losses or the right to receive benefits from BAC that could be potentially significant to BAC. Based on the Company's qualitative analysis, BFS did not meet the definition of a primary beneficiary. As a result, the Company accounts for BFS’s investment in BAC under the equity method and records it as a component of Equity investments in its Consolidated Balance Sheets. The Company records BFS’s share of income or loss in BAC based on its ownership percentage in the joint venture in
Equity earnings
in its Consolidated Statements of Operations. BFS’s equity investment is adjusted monthly to maintain a
49 percent
interest in accordance with the capital provisions of the joint venture agreement. The Company funds its investment in BAC through cash contributions and reinvested earnings. BFS’s total investment in BAC at
December 31, 2018
and
December 31, 2017
was
$21.7 million
and
$17.8 million
, respectively.
The Company’s maximum loss exposure relating to BAC is detailed as follows:
|
(in millions)
|
December 31,
2018 |
December 31,
2017 |
|||||
|
Investment
|
$
|
21.7
|
|
$
|
17.8
|
|
|
|
Repurchase and recourse obligations
(A)
|
41.6
|
|
39.9
|
|
|||
|
Liabilities
(B)
|
(1.3
|
)
|
(1.2
|
)
|
|||
|
Total maximum loss exposure
|
$
|
62.0
|
|
$
|
56.5
|
|
|
|
(A)
|
Repurchase and recourse obligations are off-balance sheet obligations provided by the Company for the Boat and Marine Engine segments, respectively, and are included within the Maximum Potential Obligations disclosed in
Note 14 –
Commitments and Contingencies
. Repurchase and recourse obligations include a North American repurchase agreement with WFCDF and could be reduced by repurchase activity occurring under other similar agreements with WFCDF and affiliates. The Company’s risk under these repurchase arrangements is partially mitigated by the value of the products repurchased as part of the transaction. Amounts above exclude any potential recoveries from the value of the repurchased product.
|
|
(B)
|
Represents accrued amounts for potential losses related to recourse exposure and the Company’s expected losses on obligations to repurchase products, after giving effect to proceeds anticipated to be received from the resale of these products to alternative dealers.
|
BFS recorded income related to the operations of BAC of
$6.4 million
,
$6.0 million
and
$4.8 million
for the years ended
December 31, 2018
,
2017
and
2016
, respectively.
Note 12 –
Goodwill and Other Intangibles
Changes in the Company's goodwill during the period ended
December 31, 2018
, by segment, are summarized below:
81
|
(in millions)
|
2017
|
Acquisitions
|
Impairments
|
Adjustments
|
2018
|
||||||||||||||
|
Marine Engine
|
$
|
31.7
|
|
$
|
344.2
|
|
$
|
—
|
|
$
|
(0.8
|
)
|
$
|
375.1
|
|
||||
|
Boat
|
2.2
|
|
—
|
|
—
|
|
—
|
|
2.2
|
|
|||||||||
|
Fitness
|
391.4
|
|
—
|
|
—
|
|
(1.6
|
)
|
389.8
|
|
|||||||||
|
Total
|
$
|
425.3
|
|
$
|
344.2
|
|
$
|
—
|
|
$
|
(2.4
|
)
|
$
|
767.1
|
|
||||
Changes in the Company's goodwill during the period ended
December 31, 2017
, by segment, are summarized below:
|
(in millions)
|
2016
|
Acquisitions
|
Impairments
|
Adjustments
|
2017
|
||||||||||||||
|
Marine Engine
|
$
|
25.1
|
|
$
|
5.5
|
|
$
|
—
|
|
$
|
1.1
|
|
$
|
31.7
|
|
||||
|
Boat
|
2.2
|
|
—
|
|
—
|
|
—
|
|
2.2
|
|
|||||||||
|
Fitness
|
386.5
|
|
—
|
|
—
|
|
4.9
|
|
391.4
|
|
|||||||||
|
Total
|
$
|
413.8
|
|
$
|
5.5
|
|
$
|
—
|
|
$
|
6.0
|
|
$
|
425.3
|
|
||||
Adjustments in
2018
and
2017
relate to the effect of foreign currency translation on goodwill denominated in currencies other than the U.S. dollar. See
Note 5 –
Acquisitions
for further details on the Company's acquisitions.
As of December 31 2018 and 2017, the Company had no accumulated impairment loss on Goodwill.
The Company's intangible assets, included within Other intangibles, net on the Consolidated Balance Sheets as of
December 31, 2018
and
2017
, are summarized by intangible asset type below:
|
2018
|
2017
|
||||||||||||||
|
(in millions)
|
Gross Amount
|
Accumulated Amortization
|
Gross Amount
|
Accumulated Amortization
|
|||||||||||
|
Intangible assets:
|
|||||||||||||||
|
Customer relationships
|
$
|
734.4
|
|
$
|
(256.5
|
)
|
$
|
305.4
|
|
$
|
(238.1
|
)
|
|||
|
Trade names
|
164.4
|
|
—
|
|
75.9
|
|
—
|
|
|||||||
|
Other
|
22.3
|
|
(18.2
|
)
|
22.5
|
|
(16.6
|
)
|
|||||||
|
Total
|
$
|
921.1
|
|
$
|
(274.7
|
)
|
$
|
403.8
|
|
$
|
(254.7
|
)
|
|||
The Company's intangible assets, included within Other intangibles, net on the Consolidated Balance Sheets as of
December 31, 2018
and
2017
, are summarized by segment below:
|
2018
|
2017
|
||||||||||||||
|
(in millions)
|
Gross Amount
|
Accumulated Amortization
|
Gross Amount
|
Accumulated Amortization
|
|||||||||||
|
Intangible assets:
|
|||||||||||||||
|
Marine Engine
|
$
|
618.3
|
|
$
|
(52.0
|
)
|
$
|
78.3
|
|
$
|
(38.5
|
)
|
|||
|
Boat
|
223.4
|
|
(203.9
|
)
|
223.3
|
|
(202.8
|
)
|
|||||||
|
Fitness
|
79.4
|
|
(18.8
|
)
|
102.2
|
|
(13.4
|
)
|
|||||||
|
Total
|
$
|
921.1
|
|
$
|
(274.7
|
)
|
$
|
403.8
|
|
$
|
(254.7
|
)
|
|||
In
2018
and
2017
, the Company recorded an impairment charge relating to the Cybex trade name. Refer to
Note 4 –
Restructuring, Exit, Integration and Impairment Activities
for further details.
Other intangible assets primarily consist of patents. See
Note 5 –
Acquisitions
for further details on intangibles acquired during
2018
and
2017
. Aggregate amortization expense for intangibles was
$20.5 million
,
$8.4 million
and
$6.8 million
for the years ended December 31,
2018
,
2017
and
2016
, respectively. Estimated amortization expense for intangible assets is
$36.3 million
for the year ending December 31,
2019
,
$35.9 million
in
2020
,
$35.0 million
in
2021
,
$34.1 million
in
2022
, and
$33.4 million
in
2023
.
82
Note 13 –
Income Taxes
On December 22, 2017, the Tax Cuts and Jobs Act (TCJA) was signed into law. The TCJA made significant changes to the U.S. tax code effective for 2018, although certain provisions affected the Company’s 2017 financial results. The changes impacting 2017 included, but are not limited to, the write-down of net deferred tax assets resulting from the reduction in the U.S. federal corporate income tax rate from 35 percent to 21 percent, imposing a one-time deemed repatriation tax on certain unremitted earnings of foreign subsidiaries, and bonus depreciation that will allow for immediate full expensing of qualified property acquired and placed in service after September 27, 2017. The TCJA also established new corporate tax laws that are effective in 2018 but did not impact the Company’s 2017 financial results. These changes include, but are not limited to, lowering the U.S. federal corporate income tax rate from 35 percent to 21 percent, a general elimination of U.S. federal income taxes on income and dividends from foreign subsidiaries, a new tax on global intangible low-taxed income (GILTI) net of allowable foreign tax credits, a new deduction for foreign derived intangible income (FDII), the repeal of the domestic production activity deduction, new limitations on the deductibility of certain executive compensation and interest expense, and limitations on the use of foreign tax credits to reduce the U.S. federal income tax liability.
Due to the complexities involved in accounting for the enactment of the TCJA, the SEC staff issued Staff Accounting Bulletin (SAB) 118 which provided guidance on accounting for the income tax effects of the TCJA. SAB 118 provided a measurement period that should not extend beyond one year from the TCJA enactment date to complete the accounting for the impact of the TCJA. SAB 118 allowed the Company to provide provisional estimates of the impact of the TCJA in our financial statements for the year ended December 31, 2017. Accordingly, based on information and IRS guidance available as of December 31, 2017, we recorded a discrete net tax expense of
$71.8 million
for the year ended December 31, 2017. This expense consisted primarily of a net expense of
$56.5 million
for the write down of our net deferred tax balances due to the U.S. corporate income tax rate reduction and a net expense of
$15.3 million
for the one-time deemed repatriation tax. The Company has now completed its accounting for the income tax effects of the TCJA and based on additional guidance from the IRS and updates to our calculations, for the year ended December 31, 2018, the Company recorded a tax benefit of
$5.1
million. This benefit consists primarily of an additional
$7.0
million tax expense related to the one-time deemed repatriation tax and a tax benefit of
$12.1
million primarily related to additional tax benefits for pension contributions.
The TCJA created a new requirement that certain income (i.e. GILTI) earned by controlled foreign corporations (CFC’s) must be included in the gross income of the CFC’s U.S. shareholder. Under U.S. GAAP, we are allowed to make an accounting policy choice of either (1) treating taxes due on future U.S. inclusions in taxable income related to GILTI as a current period expense when incurred (the “period cost method”) or (2) factoring such amounts into the Company’s measurement of its deferred taxes (the “deferred method”). The Company has elected to use the period cost method and has reflected the impact of the GILTI tax in its financial statements for the period ended December 31, 2018 using such method.
The sources of Earnings before income taxes were as follows:
|
(in millions)
|
2018
|
|
2017
|
|
2016
|
||||||
|
United States
|
$
|
227.5
|
|
$
|
208.8
|
|
$
|
308.0
|
|
||
|
Foreign
|
94.7
|
|
72.4
|
|
81.7
|
|
|||||
|
Earnings before income taxes
|
$
|
322.2
|
|
|
$
|
281.2
|
|
|
$
|
389.7
|
|
83
The
Income tax provision
consisted of the following:
|
(in millions)
|
2018
|
2017
|
2016
|
||||||||
|
Current tax expense:
|
|||||||||||
|
U.S. Federal
|
$
|
(0.6
|
)
|
$
|
3.8
|
|
$
|
25.0
|
|
||
|
State and local
|
5.5
|
|
5.5
|
|
4.6
|
|
|||||
|
Foreign
|
29.1
|
|
21.3
|
|
23.2
|
|
|||||
|
Total current
|
34.0
|
|
30.6
|
|
52.8
|
|
|||||
|
Deferred tax expense:
|
|||||||||||
|
U.S. Federal
|
24.3
|
|
107.0
|
|
56.1
|
|
|||||
|
State and local
|
1.6
|
|
(0.6
|
)
|
6.6
|
|
|||||
|
Foreign
|
(0.8
|
)
|
(2.2
|
)
|
(0.2
|
)
|
|||||
|
Total deferred
|
25.1
|
|
104.2
|
|
62.5
|
|
|||||
|
Income tax provision
|
$
|
59.1
|
|
$
|
134.8
|
|
$
|
115.3
|
|
||
Temporary differences and carryforwards giving rise to deferred tax assets and liabilities at December 31,
2018
and
2017
are summarized in the table below:
|
(in millions)
|
2018
|
2017
|
|||||
|
Deferred tax assets:
|
|||||||
|
Pension
|
$
|
0.5
|
|
$
|
25.0
|
|
|
|
Loss carryforwards
|
78.4
|
|
75.9
|
|
|||
|
Tax credit carryforwards
|
55.9
|
|
43.8
|
|
|||
|
Product warranties
|
34.4
|
|
31.3
|
|
|||
|
Sales incentives and discounts
|
29.2
|
|
25.0
|
|
|||
|
Deferred revenue
|
22.4
|
|
19.2
|
|
|||
|
Long term contracts
|
12.6
|
|
6.3
|
|
|||
|
Equity compensation
|
14.7
|
|
15.1
|
|
|||
|
Compensation and benefits
|
17.5
|
|
4.0
|
|
|||
|
Deferred compensation
|
13.6
|
|
15.4
|
|
|||
|
Postretirement and postemployment benefits
|
12.0
|
|
12.6
|
|
|||
|
Sale of business
|
2.4
|
|
14.4
|
|
|||
|
Other
|
43.9
|
|
41.8
|
|
|||
|
Gross deferred tax assets
|
337.5
|
|
329.8
|
|
|||
|
Valuation allowance
|
(83.4
|
)
|
(81.4
|
)
|
|||
|
Deferred tax assets
|
$
|
254.1
|
|
$
|
248.4
|
|
|
|
Deferred tax liabilities:
|
|||||||
|
Depreciation and amortization
|
$
|
(139.0
|
)
|
$
|
(57.8
|
)
|
|
|
State and local income taxes
|
(18.2
|
)
|
(21.1
|
)
|
|||
|
Other
|
(6.9
|
)
|
(8.7
|
)
|
|||
|
Deferred tax liabilities
|
$
|
(164.1
|
)
|
$
|
(87.6
|
)
|
|
|
Total net deferred tax assets
|
$
|
90.0
|
|
$
|
160.8
|
|
|
The Company's total net deferred tax asset as of December 31, 2018 and 2017 reflects the impact of the U.S. federal corporate tax rate at 21 percent that was part of the TCJA. The Company was required to value its net deferred tax balance at the new lower tax rate.
84
At December 31,
2018
, the Company had a total valuation allowance against its deferred tax assets of
$83.4 million
. The remaining realizable value of deferred tax assets at December 31,
2018
was determined by evaluating the potential to recover the value of these assets through the utilization of tax loss and credit carrybacks, the reversal of existing taxable temporary differences and carryforwards, certain tax planning strategies and future taxable income exclusive of reversing temporary differences and carryforwards. At December 31,
2018
, the Company retained valuation allowance reserves of
$52.3 million
against deferred tax assets in the U.S. primarily related to non-amortizable intangibles and various state operating loss carryforwards and state tax credits that are subject to restrictive rules for future utilization, and valuation allowances of
$31.1 million
for deferred tax assets related to foreign jurisdictions, primarily Brazil and Luxembourg.
At December 31,
2018
, the tax benefit of loss carryforwards totaling
$78.7 million
was available to reduce future tax liabilities. This deferred tax asset was comprised of
$2.0 million
for the tax benefit of federal net operating loss (NOL) carryforwards,
$44.9 million
for the tax benefit of state NOL carryforwards and
$31.8 million
for the tax benefit of foreign NOL carryforwards. NOL carryforwards of
$47.8 million
expire at various intervals between the years
2019
and 2038, while
$30.9 million
have an unlimited life.
At December 31,
2018
, tax credit carryforwards totaling
$57.8 million
were available to reduce future tax liabilities. This deferred tax asset was comprised of
$15.4 million
related to general business credits and other miscellaneous federal credits, and
$42.4 million
of various state tax credits related to research and development, capital investment and job incentives. Tax credit carryforwards of
$57.6 million
expire at various intervals between the years
2019
and 2038, while
$0.2 million
have an unlimited life.
No deferred income taxes have been provided as of December 31,
2018
or
2017
, on the applicable undistributed earnings of the non-U.S. subsidiaries where the indefinite reinvestment assertion has been applied. If at some future date these earnings cease to be indefinitely reinvested and are repatriated, the Company may be subject to additional U.S. income taxes and foreign withholding and other taxes on such amounts. Pursuant to changes made by the TCJA, remittances from foreign subsidiaries made in 2018 and future years are generally not subject to U.S. income taxation. These remittances are either excluded from U.S. taxable income as earnings that have already been subjected to taxation, or in the alternative are subject to a 100 percent foreign dividends received deduction. The Company continues to provide deferred taxes, primarily related to foreign withholding taxes, on the undistributed net earnings of foreign subsidiaries and unconsolidated affiliates that are not deemed to be indefinitely reinvested in operations outside the United States, although such amounts were immaterial as of December 31, 2018 and 2017.
As of December 31,
2018
,
2017
and
2016
the Company had
$2.3 million
,
$2.3 million
and
$3.5 million
of gross unrecognized tax benefits, including interest, respectively. Substantially all of these amounts, if recognized, would not impact the Company's tax provision and the effective tax rate.
The Company recognizes interest and penalties related to unrecognized tax benefits in income tax expense. As of December 31,
2018
,
2017
and
2016
, the amounts accrued for interest and penalties were not material.
The following is a reconciliation of the total amounts of unrecognized tax benefits excluding interest and penalties for the
2018
,
2017
and 2016 annual reporting periods:
|
(in millions)
|
2018
|
2017
|
2016
|
||||||||
|
Balance at January 1
|
$
|
2.1
|
|
$
|
3.4
|
|
$
|
4.7
|
|
||
|
Gross increases - tax positions prior periods
|
0.6
|
|
0.1
|
|
0.3
|
|
|||||
|
Gross decreases - tax positions prior periods
|
(0.7
|
)
|
(0.2
|
)
|
(0.4
|
)
|
|||||
|
Gross increases - current period tax positions
|
0.4
|
|
0.4
|
|
0.5
|
|
|||||
|
Decreases - settlements with taxing authorities
|
(0.1
|
)
|
(0.5
|
)
|
—
|
|
|||||
|
Reductions - lapse of statute of limitations
|
—
|
|
(1.1
|
)
|
(1.7
|
)
|
|||||
|
Balance at December 31
|
$
|
2.3
|
|
$
|
2.1
|
|
$
|
3.4
|
|
||
The Company believes it is reasonably possible that the total amount of gross unrecognized tax benefits as of December 31,
2018
could decrease by approximately
$1.0 million
in
2019
due to settlements with taxing authorities or lapses in applicable statutes of limitation. Due to the various jurisdictions in which the Company files tax returns and the uncertainty regarding the timing of the settlement of tax audits, it is possible that there could be significant changes in the amount of unrecognized tax benefits in
2019
, but the amount cannot be estimated at this time.
85
The Company is regularly audited by federal, state and foreign tax authorities. The Internal Revenue Service (IRS) has completed its field examination and has issued its Revenue Agents Report through the 2014 tax year and all open issues have been resolved. The Company is currently open to tax examinations by the IRS for the 2014 through 2017 tax years. Primarily as a result of filing amended returns, which were generated by the closing of federal income tax audits, the Company is still open to state and local tax audits in major tax jurisdictions dating back to the 2012 taxable year. The Company is no longer subject to income tax examinations by any major foreign tax jurisdiction for years prior to 2013.
The difference between the actual income tax provision (benefit) and the tax provision computed by applying the statutory Federal income tax rate to Earnings before income taxes is attributable to the following:
|
(in millions)
|
2018
|
2017
|
2016
|
||||||||
|
Income tax provision at 21 percent, 35 percent and 35 percent
|
$
|
67.7
|
|
$
|
98.4
|
|
$
|
136.4
|
|
||
|
State and local income taxes, net of Federal income tax effect
|
9.0
|
|
5.5
|
|
8.3
|
|
|||||
|
Deferred tax asset valuation allowance
|
4.8
|
|
7.2
|
|
3.4
|
|
|||||
|
Income attributable to domestic production activities
|
—
|
|
(7.7
|
)
|
(6.3
|
)
|
|||||
|
Equity compensation
|
(3.1
|
)
|
(7.9
|
)
|
—
|
|
|||||
|
Change in estimates related to prior years and prior years amended tax return filings
|
1.6
|
|
1.4
|
|
(0.2
|
)
|
|||||
|
Federal and state tax credits
|
(13.1
|
)
|
(11.4
|
)
|
(10.2
|
)
|
|||||
|
Taxes related to foreign income, net of credits
|
(14.6
|
)
|
(25.0
|
)
|
(20.6
|
)
|
|||||
|
Taxes related to unremitted earnings
|
0.1
|
|
—
|
|
(1.1
|
)
|
|||||
|
Tax reserve reassessment
|
0.2
|
|
(1.1
|
)
|
(1.4
|
)
|
|||||
|
Deferred tax reassessment
|
3.3
|
|
2.1
|
|
1.5
|
|
|||||
|
Tax law changes
|
(5.2
|
)
|
71.8
|
|
5.4
|
|
|||||
|
GILTI income inclusion
|
8.8
|
|
—
|
|
—
|
|
|||||
|
FDII deduction
|
(5.4
|
)
|
—
|
|
—
|
|
|||||
|
Other
|
5.0
|
|
1.5
|
|
0.1
|
|
|||||
|
Actual income tax provision
|
$
|
59.1
|
|
$
|
134.8
|
|
$
|
115.3
|
|
||
|
Effective tax rate
|
18.3
|
%
|
47.9
|
%
|
29.6
|
%
|
|||||
The Company's effective tax rate also reflects the benefit of having earnings from foreign entities that are in jurisdictions that have lower statutory tax rates than the U.S. with the most significant impact related to Hungary, China and Poland, which have applicable statutory tax rates of
9 percent
,
15 percent
and
19 percent
, respectively.
In addition, the Company's effective tax rate for 2017 and 2016 includes the utilization of excess foreign tax credits in connection with the repatriation of foreign earnings.
Income tax provision allocated to continuing operations and discontinued operations for the years ended December 31 was as follows:
|
(in millions)
|
2018
|
2017
|
2016
|
||||||||
|
Continuing operations
|
$
|
59.1
|
|
$
|
134.8
|
|
$
|
115.3
|
|
||
|
Discontinued operations
|
0.8
|
|
—
|
|
1.1
|
|
|||||
|
Total tax provision
|
$
|
59.9
|
|
$
|
134.8
|
|
$
|
116.4
|
|
||
86
Note 14 –
Commitments and Contingencies
Financial Commitments
The Company has entered into guarantees of indebtedness of third parties, primarily in connection with customer financing programs. Under these arrangements, the Company has guaranteed customer obligations to the financial institutions in the event of customer default, generally subject to a maximum amount that is less than the total outstanding obligations. The Company has also extended guarantees to third parties that have purchased customer receivables from Brunswick and, in certain instances, has guaranteed secured term financing of its customers. Potential payments in connection with these customer financing arrangements generally extend over several years. The single year potential cash obligations associated with these customer financing arrangements as of
December 31, 2018
and
December 31, 2017
were
$50.4 million
and
$41.4 million
, respectively. The maximum potential cash obligations associated with these customer financing arrangements as of
December 31, 2018
and
December 31, 2017
were
$61.7 million
and
$49.2 million
, respectively.
In most instances, upon repurchase of the receivable or note, the Company receives rights to the collateral securing the financing. The Company’s risk under these arrangements is partially mitigated by the value of the collateral that secures the financing. The Company had
$1.0 million
and
$1.1 million
accrued for potential losses related to recourse exposure at
December 31, 2018
and
December 31, 2017
, respectively.
The Company has accounts receivable sale arrangements with third parties which are included in the guarantee arrangements discussed above. The Company treats the sale of receivables in which the Company retains an interest as a secured obligation as the transfers of the receivables under these arrangements do not meet the requirements of a “true sale.” Accordingly, the current portion of receivables underlying these arrangements of
$26.9 million
and
$23.7 million
was recorded in Accounts and notes receivable and
Accrued expenses
as of
December 31, 2018
and
December 31, 2017
, respectively. Further, the long-term portion of these arrangements of
$41.1 million
and
$30.2 million
as of
December 31, 2018
and
December 31, 2017
, respectively, was recorded in
Other long-term assets
and Other long-term liabilities.
The Company has also entered into arrangements with third-party lenders in which it has agreed, in the event of a customer default, to repurchase from the third-party lender those Brunswick products repossessed from the customer. These arrangements are typically subject to a maximum repurchase amount. The single year and maximum potential cash payments the Company could be required to make to repurchase collateral as of
December 31, 2018
and
December 31, 2017
were
$50.6 million
and
$53.6 million
, respectively.
The Company’s risk under these repurchase arrangements is partially mitigated by the value of the products repurchased as part of the transaction. The Company had
$1.3 million
and
$1.1 million
accrued for potential losses related to repurchase exposure as of
December 31, 2018
and
December 31, 2017
, respectively. The Company’s repurchase accrual represents the expected losses that could result from obligations to repurchase products, after giving effect to proceeds anticipated to be received from the resale of those products to alternative dealers.
The Company has recorded its estimated net liability associated with losses from these guarantee and repurchase obligations on its Consolidated Balance Sheets based on historical experience and current facts and circumstances. Historical cash requirements and losses associated with these obligations have not been significant, but could increase if dealer defaults exceed current expectations.
Financial institutions have issued standby letters of credit and surety bonds conditionally guaranteeing obligations on behalf of the Company totaling
$4.8 million
and
$22.2 million
, respectively, as of
December 31, 2018
. A large portion of these standby letters of credit and surety bonds are related to the Company’s self-insured workers’ compensation program as required by its insurance companies and various state agencies. The Company has recorded reserves to cover the anticipated liabilities associated with these programs. Under certain circumstances, such as an event of default under the Company’s revolving credit facility, or, in the case of surety bonds, a ratings downgrade, the Company could be required to post collateral to support the outstanding letters of credit and surety bonds. The Company was not required to post letters of credit as collateral against surety bonds as of
December 31, 2018
.
The Company has a collateral trust arrangement with insurance carriers and a trustee bank. The trust is owned by the Company, but the assets are pledged as collateral against workers’ compensation related obligations in lieu of other forms of collateral including letters of credit. In connection with this arrangement, the Company had
$9.0 million
and
$9.4 million
of cash in the trust at
December 31, 2018
and
December 31, 2017
, respectively, which was classified as
Restricted cash
in the Company's Consolidated
87
Balance Sheets. In both
2018
and
2017
, insurance carriers reduced the required collateral amount, which resulted in
$0.4 million
and
$1.8 million
, respectively, transferred out of the trust.
Product Warranties
The Company records a liability for product warranties at the time of the related product sale. The liability is estimated using historical warranty experience, projected claim rates and expected costs per claim. The Company adjusts its liability for specific warranty matters when they become known and the exposure can be estimated. Product failure rates as well as material usage and labor costs incurred in correcting a product failure affect the Company's warranty liabilities. If actual costs differ from estimated costs, the Company must make a revision to the warranty liability. Changes in the Company's warranty liabilities resulting from the Company's experience and adjustments related to changes in estimates are included as Aggregate changes for preexisting warranties presented in the table below.
The following activity related to product warranty liabilities was recorded in
Accrued expenses
during the
year
s ended
December 31, 2018
and
December 31, 2017
:
|
(in millions)
|
2018
|
2017
|
|||||
|
Balance at beginning of period
|
$
|
127.2
|
|
$
|
112.6
|
|
|
|
Payments made
|
(83.7
|
)
|
(72.1
|
)
|
|||
|
Provisions/additions for contracts issued/sold
|
79.0
|
|
71.8
|
|
|||
|
Aggregate changes for preexisting warranties
(A)
|
15.4
|
|
14.3
|
|
|||
|
Foreign currency translation
|
(1.4
|
)
|
1.8
|
|
|||
|
Acquisitions
|
2.8
|
|
—
|
|
|||
|
Other
|
2.6
|
|
(1.2
|
)
|
|||
|
Balance at end of period
|
$
|
141.9
|
|
$
|
127.2
|
|
|
(A) Includes
$10.7 million
of warranty adjustments related to the wind-down of Sport Yacht and Yacht operations in 2018, and includes
$8.4 million
in 2017 related to field campaigns for certain Cybex products designed prior to the acquisition.
Extended Product Warranties
End users of the Company's products may purchase a contract from the Company that extends product warranty beyond the standard period. For certain extended warranty contracts in which the Company retains the warranty or administration obligation, a deferred revenue liability is recorded based on the aggregate sales price for contracts sold. The liability is reduced and revenue is recognized on a straight-line basis over the contract period during which corresponding costs are expected to be incurred.
The following activity related to deferred revenue for extended product warranty contracts was recorded in
Accrued expenses
and Other long-term liabilities during the years ended
December 31, 2018
and
December 31, 2017
:
|
(in millions)
|
2018
|
2017
|
||||||
|
Balance at beginning of period
|
$
|
112.1
|
|
$
|
90.6
|
|
||
|
Extended warranty contracts sold
|
56.9
|
|
51.9
|
|
||||
|
Revenue recognized on existing extended warranty contracts
|
(35.1
|
)
|
(31.2
|
)
|
||||
|
Foreign currency translation
|
(0.8
|
)
|
0.8
|
|
||||
|
Balance at end of period
|
$
|
133.1
|
|
$
|
112.1
|
|
||
Legal
The Company accrues for litigation exposure when it is probable that future costs will be incurred and such costs can be reasonably estimated. Adjustments to estimates are recorded in the period they are identified. Management does not believe that there is a reasonable possibility that a material loss exceeding the amounts already recognized for the Company’s litigation claims and matters, if any, has been incurred. In light of existing accruals, the Company's litigation claims, when finally resolved, are not expected, in the opinion of management, to have a material adverse effect on the Company's consolidated financial position, results of operations or cash flows.
88
In the fourth quarter of 2017, the Company recorded a
$13.5 million
charge for costs related to field campaigns pertaining to certain Cybex products designed prior to the acquisition. The charge consisted of
$8.4 million
and
$5.1 million
within Cost of sales and Selling, general and administrative expense, respectively. The Company has made indemnification claims against the seller for recovery that includes these amounts, but has not yet recorded an offsetting receivable in the financial statements.
Upon the Company’s acquisition of the Cybex business on January 20, 2016, Cybex was subject to an ongoing investigation by the Consumer Product Safety Commission (CPSC) regarding the timeliness of a recall of the
Cybex arm curl product. The purchase agreement contained specific language providing that the seller will fully indemnify and hold harmless the Company for all losses related to the CPSC’s investigation of the arm curl product. In the third quarter of 2017, the CPSC concluded its investigation and issued a letter to Cybex offering to settle the arm curl investigation for a civil penalty in the amount of
$6.3 million
. The Company accrued this amount and fully offset it with an indemnification receivable from the seller and continues to negotiate a final settlement amount with the CPSC.
On January 21, 2015, Cobalt Boats, LLC (Cobalt) filed a patent infringement lawsuit against the Company alleging that certain of the Company’s Sea Ray branded boats include a feature that infringes a Cobalt patent relating to a submersible swim step. On October 31, 2017, the U.S. District Court in the Eastern District of Virginia entered an amended judgment on the jury verdict awarding total damages, including enhanced damages, in the amount of
$5.4 million
plus attorneys' fees of
$2.5 million
and applicable interest. The Company has not recorded a liability for indemnity as it believes it has meritorious defenses and is pursuing an appeal.
Environmental
The Company is involved in certain legal and administrative proceedings under the Comprehensive Environmental Response, Compensation, and Liability Act of 1980 and other federal and state legislation governing the generation and disposal of certain hazardous wastes. These proceedings, which involve both on- and off-site waste disposal or other contamination, in many instances seek compensation or remedial action from the Company as a waste generator under Superfund legislation, which authorizes action regardless of fault, legality of original disposition or ownership of a disposal site. The Company has established accruals based on a range of cost estimates for all known claims.
The environmental remediation and clean-up projects in which the Company is involved have an aggregate estimated range of exposure of approximately
$17.0 million
to
$46.8 million
as of
December 31, 2018
. At December 31,
2018
and
2017
, the Company had accruals for environmental liabilities of
$17.0 million
and
$23.8 million
, respectively, which were recorded within
Accrued expenses
and Other long-term liabilities in the Consolidated Balance Sheets. The Company recorded environmental provisions of
$0.7 million
,
$1.1 million
and
$0.7 million
for the years ended December 31,
2018
,
2017
and
2016
, respectively.
The Company accrues for environmental remediation-related activities for which commitments or clean-up plans have been developed and for which costs can be reasonably estimated. All accrued amounts are generally determined in consultation with third-party experts on an undiscounted basis and do not consider recoveries from third parties until such recoveries are realized. In light of existing accruals, the Company's environmental claims, when finally resolved, are not expected, in the opinion of management, to have a material adverse effect on the Company's consolidated financial position, results of operations or cash flows.
Note 15 –
Financial Instruments
The Company operates globally with manufacturing and sales facilities around the world. Due to the Company’s global operations, the Company engages in activities involving both financial and market risks. The Company utilizes normal operating and financing activities, along with derivative financial instruments, to minimize these risks.
Derivative Financial Instruments.
The Company uses derivative financial instruments to manage its risks associated with movements in foreign currency exchange rates and interest rates. Derivative instruments are not used for trading or speculative purposes. The Company formally documents its hedge relationships, including identification of the hedging instruments and the hedged items, as well as its risk management objectives and strategies for undertaking the hedge transaction. This process includes linking derivatives that are designated as hedges to specific forecasted transactions. The Company also assesses, both at the hedge’s inception and monthly thereafter, whether the derivatives used in hedging transactions are highly effective in offsetting the changes in the anticipated cash flows of the hedged item. If the hedging relationship ceases to be highly effective, or it becomes probable that a forecasted transaction is no longer expected to occur, the Company discontinues hedge accounting prospectively and
89
immediately recognizes the gains and losses associated with those hedges. There were no material adjustments as a result of ineffectiveness to the results of operations for the years ended
December 31, 2018
,
2017
and
2016
. The fair value of derivative financial instruments is determined through market-based valuations and may not be representative of the actual gains or losses that will be recorded when these instruments mature due to future fluctuations in the markets in which they are traded. The effects of derivative financial instruments are not expected to be material to the Company’s financial position or results of operations when considered together with the underlying exposure being hedged. Use of derivative financial instruments exposes the Company to credit risk with its counterparties when the fair value of a derivative contract is an asset. The Company mitigates this risk by entering into derivative contracts with highly rated counterparties. The maximum amount of loss due to counterparty credit risk is limited to the asset value of derivative financial instruments.
Cash Flow Hedges.
The Company enters into certain derivative instruments that are designated and qualify as cash flow hedges. The Company executes both forward and option contracts, based on forecasted transactions, to manage foreign currency exchange exposure mainly related to inventory purchase and sales transactions.
A cash flow hedge requires that as changes in the fair value of derivatives occur, the portion of the change deemed to be effective is recorded temporarily in Accumulated other comprehensive loss and reclassified into earnings in the same period or periods during which the hedged transaction affects earnings. As of
December 31, 2018
, the term of derivative instruments hedging forecasted transactions ranged up to18 months.
The following activity related to cash flow hedges was recorded in Accumulated other comprehensive loss as of December 31:
|
Accumulated Unrealized Derivative
|
|||||||||||||||
|
Gains (Losses)
|
|||||||||||||||
|
2018
|
2017
|
||||||||||||||
|
(in millions)
|
Pretax
|
After-tax
|
Pretax
|
After-tax
|
|||||||||||
|
Beginning balance
|
$
|
(7.8
|
)
|
$
|
(11.8
|
)
|
$
|
1.1
|
|
$
|
(5.6
|
)
|
|||
|
Net change in value of outstanding hedges
|
10.6
|
|
7.3
|
|
(10.9
|
)
|
(7.5
|
)
|
|||||||
|
Net amount recognized into earnings
|
3.4
|
|
2.6
|
|
2.0
|
|
1.3
|
|
|||||||
|
Ending balance
|
$
|
6.2
|
|
$
|
(1.9
|
)
|
$
|
(7.8
|
)
|
$
|
(11.8
|
)
|
|||
Fair Value Hedges.
The Company enters into fixed-to-floating interest rate swaps to convert a portion of the Company's long-term debt from fixed to floating rate debt. An interest rate swap is entered into with the expectation that the change in the fair value of the interest rate swap will offset the change in the fair value of the debt instrument attributable to changes in the benchmark interest rate. Each period, the change in the fair value of the interest rate swap asset or liability is recorded in debt and the difference between the fixed interest payments and floating interest receipts is recorded as a net adjustment to interest expense.
Other Hedging Activity.
The Company has entered into certain foreign currency forward contracts that have not been designated as a hedge for accounting purposes. These contracts are used to manage foreign currency exposure related to changes in the value of assets or liabilities caused by changes in foreign exchange rates. The change in the fair value of the foreign currency derivative contract and the corresponding change in the fair value of the asset or liability of the Company are both recorded through earnings, each period as incurred.
Foreign Currency Derivatives.
The Company enters into forward and option contracts to manage foreign exchange exposure related to forecasted transactions and assets and liabilities that are subject to risk from foreign currency rate changes. These exposures include: product costs; revenues and expenses; associated receivables and payables; intercompany obligations and receivables and other related cash flows.
Forward exchange contracts outstanding at
December 31, 2018
and
December 31, 2017
had notional contract values of
$424.1 million
and
$312.6 million
, respectively. Option contracts outstanding at
December 31, 2018
and
December 31, 2017
, had notional contract values of
$27.2 million
and
$18.0 million
, respectively. The forward and options contracts outstanding at
December 31, 2018
, mature during
2019
and
2020
and mainly relate to the Euro, Japanese yen, Canadian dollar and Australian dollar. As of
December 31, 2018
, the Company estimates that during the next 12 months, it will reclassify approximately
$7.6 million
of net gains (based on rates as of
December 31, 2018
) from Accumulated other comprehensive loss to Cost of sales.
90
Interest Rate Derivatives.
The Company enters into fixed-to-floating interest rate swaps to convert a portion of the Company's long-term debt from fixed to floating rate debt. As of
December 31, 2018
and
December 31, 2017
, the outstanding swaps had notional contract values of
$200.0 million
, of which
$150.0 million
corresponds to the Company's
4.625 percent
Senior notes due 2021 and
$50.0 million
corresponds to the Company's
7.375 percent
Debentures due 2023. These instruments have been designated as fair value hedges, with the fair value recorded in long-term debt as discussed in
Note 17 –
Debt
.
The Company may also enter into forward-starting interest rate swaps to hedge the interest rate risk associated with anticipated debt issuances. There were no forward-starting interest rate swaps outstanding at
December 31, 2018
or
December 31, 2017
, however the Company had
$2.5 million
and
$3.4 million
, respectively, of net deferred losses associated with previously settled forward-starting interest rate swaps which were included in Accumulated other comprehensive loss. As of
December 31, 2018
, the Company will reclassify approximately
$0.6 million
of net losses resulting from settled forward-starting interest rate swaps from Accumulated other comprehensive loss to Interest expense during the next 12 months.
As of
December 31, 2018
and
December 31, 2017
, the fair values of the Company’s derivative instruments were:
|
(in millions)
|
|
|
||||||||||||||||||
|
|
Derivative Assets
|
Derivative Liabilities
|
||||||||||||||||||
|
Instrument
|
Balance Sheet Location
|
Fair Value
|
Balance Sheet Location
|
Fair Value
|
||||||||||||||||
|
2018
|
2017
|
2018
|
2017
|
|||||||||||||||||
|
Derivatives Designated as Cash Flow Hedges
|
||||||||||||||||||||
|
Foreign exchange contracts
|
Prepaid expenses and other
|
$
|
8.1
|
|
$
|
2.5
|
|
Accrued expenses
|
$
|
1.1
|
|
$
|
5.5
|
|
||||||
|
Derivatives Designated as Fair Value Hedges
|
||||||||||||||||||||
|
Interest rate contracts
|
Prepaid expenses and other
|
$
|
0.0
|
|
$
|
2.1
|
|
Accrued expenses
|
$
|
0.1
|
|
$
|
1.8
|
|
||||||
|
Interest rate contracts
|
Other long-term assets
|
—
|
|
0.7
|
|
Other long-term liabilities
|
1.8
|
|
0.3
|
|
||||||||||
|
Total
|
$
|
0.0
|
|
$
|
2.8
|
|
$
|
1.9
|
|
$
|
2.1
|
|
||||||||
|
Other Hedging Activity
|
||||||||||||||||||||
|
Foreign exchange contracts
|
Prepaid expenses and other
|
$
|
1.0
|
|
$
|
0.7
|
|
Accrued expenses
|
$
|
0.1
|
|
$
|
0.1
|
|
||||||
The effect of derivative instruments on the Consolidated Statements of Operations for the
year
s ended
December 31, 2018
and
December 31, 2017
was:
|
(in millions)
|
||||||||||||||||||
|
Derivatives Designated as Cash Flow Hedging Instruments
|
Amount of Gain (Loss) on Derivatives Recognized in Accumulated Other Comprehensive Loss (Effective Portion)
|
Location of Gain (Loss) Reclassified from Accumulated Other Comprehensive Loss into Earnings (Effective Portion)
|
Amount of Loss Reclassified from Accumulated Other Comprehensive Loss
into Earnings (Effective Portion)
|
|||||||||||||||
|
2018
|
2017
|
2018
|
2017
|
|||||||||||||||
|
Interest rate contracts
|
$
|
—
|
|
$
|
—
|
|
Interest expense
|
$
|
(0.9
|
)
|
$
|
(1.1
|
)
|
|||||
|
Foreign exchange contracts
|
10.6
|
|
(10.9
|
)
|
Cost of sales
|
(2.5
|
)
|
(0.9
|
)
|
|||||||||
|
Total
|
$
|
10.6
|
|
$
|
(10.9
|
)
|
|
$
|
(3.4
|
)
|
$
|
(2.0
|
)
|
|||||
|
Derivatives Designated as Fair Value Hedging Instruments
|
Location of Gain (Loss) on Derivatives
Recognized in Earnings
|
Amount of Gain (Loss) on Derivatives Recognized in Earnings
|
||||||||
|
2018
|
2017
|
|||||||||
|
Interest rate contracts
|
Interest expense
|
$
|
(0.0
|
)
|
$
|
2.0
|
|
|||
91
|
Other Hedging Activity
|
Location of Gain (Loss) on Derivatives
Recognized in Earnings
|
Amount of Gain (Loss) on Derivatives Recognized in Earnings
|
||||||||
|
2018
|
2017
|
|||||||||
|
Foreign exchange contracts
|
Cost of sales
|
$
|
10.7
|
|
$
|
(11.1
|
)
|
|||
|
Foreign exchange contracts
|
Other expense, net
|
1.5
|
|
(1.8
|
)
|
|||||
|
Total
|
|
$
|
12.2
|
|
$
|
(12.9
|
)
|
|||
Fair Value of Other Financial Instruments.
The carrying values of the Company’s short-term financial instruments, including cash and cash equivalents and accounts and notes receivable approximate their fair values because of the short maturity of these instruments. At
December 31, 2018
and
December 31, 2017
, the fair value of the Company’s long-term debt was approximately
$1,292.9 million
and
$492.1 million
, respectively, and was determined using Level 1 and Level 2 inputs described in
Note 8 –
Fair Value Measurements
, including quoted market prices or discounted cash flows based on quoted market rates for similar types of debt. The carrying value of long-term debt, including current maturities, was
$1,226.4 million
and
$439.1 million
as of
December 31, 2018
and
December 31, 2017
, respectively.
Note 16 –
Accrued Expenses
Accrued Expenses at December 31,
2018
and
2017
were as follows:
|
(in millions)
|
2018
|
2017
|
|||||
|
Compensation and benefit plans
|
$
|
168.5
|
|
$
|
141.9
|
|
|
|
Product warranties
|
141.9
|
|
127.2
|
|
|||
|
Sales incentives and discounts
|
134.0
|
|
120.3
|
|
|||
|
Deferred revenue and customer deposits
|
84.3
|
|
66.0
|
|
|||
|
Secured obligations, repurchase and recourse
|
29.2
|
|
25.9
|
|
|||
|
Legal reserves and contingencies
|
20.5
|
|
14.8
|
|
|||
|
Self insurance reserves
|
19.6
|
|
22.0
|
|
|||
|
Freight
|
16.1
|
|
17.5
|
|
|||
|
Interest
|
15.0
|
|
8.4
|
|
|||
|
Environmental reserves
|
7.6
|
|
14.3
|
|
|||
|
Real, personal and other non-income taxes
|
5.8
|
|
6.7
|
|
|||
|
Derivatives
|
1.3
|
|
7.4
|
|
|||
|
Other
|
43.6
|
|
36.6
|
|
|||
|
Total accrued expenses
|
$
|
687.4
|
|
$
|
609.0
|
|
|
92
Note 17 –
Debt
Long-term debt at
December 31, 2018
and
December 31, 2017
consisted of the following:
|
(in millions)
|
2018
|
2017
|
|||||
|
Term loan, floating rate due 2023, net of debt issuance costs of $1.6 in 2018
(A) (C)
|
$
|
339.7
|
|
$
|
—
|
|
|
|
Senior Notes, 6.500% due 2048, net of debt issuance costs of $8.5 in 2018
|
176.5
|
|
—
|
|
|||
|
Notes, 7.125% due 2027, net of discount of $0.3 and $0.4 and debt issuance costs of $0.4 and $0.4
|
162.5
|
|
162.4
|
|
|||
|
Term loan, floating rate due 2021, net of debt issuance costs of $0.5 in 2018
(D)
|
149.5
|
|
—
|
|
|||
|
Senior notes, currently 4.625%, due 2021, net of debt issuances costs of $1.0 and $1.5
(B)
|
147.3
|
|
148.2
|
|
|||
|
Senior notes, currently 6.625%, due 2049, net of debt issuances costs of $4.5 in 2018
|
120.5
|
|
—
|
|
|||
|
Debentures, 7.375% due 2023, net of discount of $0.1 and $0.2 and debt issuance costs of $0.2 and $0.2
(B)
|
102.6
|
|
103.4
|
|
|||
|
Loan with Fond du Lac County Economic Development Corporation, 2.0% due 2021, net of discount of $2.3 and $3.0 and debt issuance costs of $0.1 and $0.1
|
15.3
|
|
19.6
|
|
|||
|
Notes, various up to 5.8% payable through 2028, net of discount of $0.2 and $0.2
|
6.9
|
|
3.8
|
|
|||
|
Total long-term debt
|
1,220.8
|
|
437.4
|
|
|||
|
Current maturities of long-term debt
|
(41.3
|
)
|
(5.6
|
)
|
|||
|
Long-term debt, net of current maturities
|
$
|
1,179.5
|
|
$
|
431.8
|
|
|
(A) Beginning in December 2018, scheduled repayment of the 5-year term loan occurs each March, June, September and December equal to 2.50% of the aggregate principal amount of
$350.0 million
. The remaining principal amount is due August 2023.
(B) Included in Senior notes, 4.625 percent due 2021 and Debentures, 7.375 percent due 2023 at
December 31, 2018
and
December 31, 2017
, are the aggregate fair values related to the fixed-to-floating interest rate swaps as discussed in
Note 15 –
Financial Instruments
.
(C) As of December 31, 2018, the interest rate was
4.10%
.
(D) As of December 31, 2018, the interest rate was
3.85%
.
Scheduled maturities, net:
|
(in millions)
|
|||
|
2019
|
$
|
41.3
|
|
|
2020
|
41.4
|
|
|
|
2021
|
338.1
|
|
|
|
2022
|
35.8
|
|
|
|
2023
|
302.8
|
|
|
|
Thereafter
|
461.4
|
|
|
|
Total long-term debt including current maturities
|
$
|
1,220.8
|
|
In June 2018, in connection with the acquisition of Power Products the Company entered into an agreement with Morgan Stanley Senior Funding, Inc. to obtain a
$1.1 billion
, 364-Day Senior Unsecured Bridge Facility (Bridge Facility). Refer to
Note 4 –
Acquisitions
for further details regarding the acquisition. In July 2018, the Company executed the First Amendment to its Credit Facility to remove certain restrictions on the Company to incur unsecured debt with a maturity date before the Credit facility termination date. Simultaneously,
$300.0 million
of commitments related to the Bridge Facility were terminated resulting in
$800.0 million
remaining under this facility. In August 2018, the commitments with respect to the Bridge Facility were reduced to zero and replaced with a term loan credit agreement (Credit Agreement) to obtain term loans (Term Loans) in an aggregate principal amount of
$800.0 million
. The Term Loan debt issued in August 2018 consisted of a
$300.0 million
364-day tranche loan, a
$150.0 million
3-year tranche loan and a
$350.0 million
5-year tranche loan. The Company is required to maintain compliance with two financial covenants: a minimum interest coverage ration and a maximum leverage ratio. The minimum interest coverage, as defined in the Credit Agreement, is not permitted to be less than 3.00 to 1.00. The maximum leverage ratio, as defined in the Credit Agreement, is not permitted to be more than 3.50 to 1.00. As of
December 31, 2018
, the Company was in compliance with the financial covenants in the Credit Agreement.
93
In October 2018, the Company issued an aggregate principal amount of
$185.0 million
of its 6.500% Senior Notes due October 2048 (2048 Notes) in a public offering, which resulted in aggregate net proceeds to the Company of
$176.5 million
. Net proceeds from the offering of the 2048 Notes were used, together with cash on hand, to prepay
$185.0 million
of the
$300.0 million
364-day tranche loan. The Company may, at its option, redeem the 2048 Notes on or after (but not prior to) October 15, 2023.
In December 2018, the Company issued an aggregate principal amount of
$125.0 million
of its 6.625% Senior Notes due January 2049 (2049 Notes) in a public offering, which resulted in aggregate net proceeds to the Company of
$120.5 million
. Net proceeds from the offering of the 2049 Notes were used, together with cash on hand, to prepay the remaining
$115.0 million
of the
$300.0 million
364-day tranche loan. The Company may, at its option, redeem the 2049 Notes on or after (but not prior to) January 15, 2024.
Pursuant to the indenture governing both the 2048 Notes and the 2049 Notes, the Company and its restricted subsidiaries are subject to restrictions on the incurrence of debt secured by liens on principal property (as defined in the indenture) or shares of capital stock of such restricted subsidiaries, entering into sale and leaseback transactions in respect of principal property and mergers or consolidations with another entity or sales, transfers or leases of the Company's properties and assets substantially as an entirety to another person.
Interest on the Company's 2021, 2023 and 2017 notes is due semi-annually. Interest on the Company's 2048 Notes, 2049 Notes and Term Loans is due quarterly.
Unless otherwise noted, the Company's debt is unsecured and does not contain subsidiary guarantees.
The Company may be required to repurchase some or all of the 2048 Notes, the 2049 Notes and the 2021 notes in the event of a change of control, subject to certain circumstances, for an amount equal to 101 percent of the outstanding principal plus any accrued and unpaid interest.
The Company's 2021 and 2027 notes may be redeemed at any time at the Company's discretion, in whole or in part, at redemption prices specified in the respective agreements, plus any accrued and unpaid interest. The remainder of the Company's notes may be redeemed at any time at the Company's discretion, either in whole or in part, at a redemption price equal to 100 percent of the principal amount plus any accrued and unpaid interest.
On September 26, 2018, the Company entered into an Amended and Restated Credit Agreement (Credit Facility). The Credit Facility amended and restated the Company's existing credit agreement. The Credit Facility provides for
$400.0 million
of borrowing capacity and is in effect through September 2023. The Credit Facility includes provisions to add up to
$100.0 million
of additional borrowing capacity and extend the facility for two additional one-year terms, subject to lender approval. The Company currently pays a facility fee of 15 basis points per annum. The facility fee per annum will be within a range of 12.5 to 35 basis points based on the Company's credit rating. Under the terms of the Credit Facility, the Company has two borrowing options: borrowing at a rate tied to adjusted LIBOR plus a spread of 110 basis points or a base rate plus a margin of 10.0 basis points. The rates are determined by the Company's credit ratings, with spreads ranging from 100 to 190 basis points for LIBOR rate borrowings and 0 to 90 basis points for base rate borrowings. The Company is required to maintain compliance with two financial covenants included in the Credit Facility: a minimum interest coverage ratio and a maximum leverage ratio. The minimum interest coverage ratio, as defined in the agreement, is not permitted to be less than 3.00 to 1.00. The maximum leverage ratio, as defined in the agreement, is not permitted to be more than 3.50 to 1.00. No borrowings were outstanding as of
December 31, 2018
or during
2018
or
2017
, and available borrowing capacity totaled
$396.1 million
, net of
$3.9 million
of letters of credit outstanding under the Credit Facility. As of
December 31, 2018
, the Company was in compliance with the financial covenants in the Credit Facility.
As provided under the terms of its loan agreement with the Fond du Lac County Economic Development Corporation, which is secured by the Company's property located in Fond du Lac, Wisconsin, up to a maximum
43 percent
of the principal due annually can be forgiven if the Company achieves certain employment targets as outlined in the agreement. The amount of loan forgiveness is based on average employment levels at the end of the previous four quarters. Total loan forgiveness for
2018
,
2017
and
2016
was $2.1 million or 43 percent of the principal due.
94
Note 18 –
Postretirement Benefits
Overview
. The Company has defined contribution plans and makes contributions including matching and annual discretionary contributions which are based on various percentages of compensation, and in some instances are based on the amount of the employees' contributions to the plans. The expense related to the defined contribution plans was
$54.3 million
in
2018
,
$52.1 million
in
2017
and
$46.3
million in
2016
.
The Company's domestic pension and retiree health care and life insurance benefit plans, which are discussed below, provide benefits based on years of service and, for some plans, average compensation prior to retirement. Benefit accruals are frozen for all plan participants. The Company uses a December 31 measurement date for these plans. The Company's foreign postretirement benefit plans are not significant individually or in the aggregate.
Plan Developments.
The Company historically maintained four qualified defined benefit plans: the Brunswick Pension Plan for Salaried Employees (Salaried Plan), the Brunswick Pension Plan for Hourly Bargaining Unit Employees (Bargaining Plan), the Brunswick Pension Plan For Hourly Employees (Hourly Plan) and the Brunswick Pension Plan For Hourly Wage Employees (Muskegon Plan). During the third quarter of 2018, the Company initiated actions to terminate the two remaining plans, the Salaried Plan and the Bargaining Plan, effective October 31, 2018. All benefits are expected to be settled during 2019, either through a lump-sum payment to participants or the purchase of an annuity offering on behalf of the participants. As a result of the planned terminations, the over-funded positions for both plans are currently recorded within Prepaid expenses and other in the Consolidated Balance Sheets. The Company has previously completed actions to terminate the Hourly Plan and the Muskegon Plan, effective as of December 31, 2016, and all benefits were paid during 2017 as described below.
During 2017, total settlement payments of
$132.7 million
were made from the Bargaining Plan and Salaried Plan to purchase group annuity contracts on behalf of participants to cover future benefit payments. In addition, settlement payments totaling
$101.7 million
were made from the Hourly Plan and the Muskegon Plan in connection with plan terminations. The settlement payments included group annuity contracts to cover future benefit payments as well as lump-sum benefit payments to certain participants.
The annuity contracts provide for the full payment of all future annuity payments to the participants. The insurance company assumed all investment risk associated with the assets and obligations that were transferred. The Company recognized a pretax settlement loss of
$96.6 million
at December 31, 2017 related to these actions.
During 2016, total settlement payments of
$125.2 million
were made from the Bargaining Plan and the Salaried Plan to purchase group annuity contracts to cover future benefit payments. The annuity contract provides for the full payment of all future annuity payments to the affected participants. The insurance company assumed all risk associated with the assets and obligations that were transferred. The Company recognized a pretax settlement loss of
$55.1 million
in the fourth quarter of 2016 relating to this action.
Costs.
Pension and other postretirement benefit costs included the following components for
2018
,
2017
and
2016
:
|
|
Pension Benefits
|
Other Postretirement Benefits
|
|||||||||||||||||||||
|
(in millions)
|
2018
|
2017
|
2016
|
2018
|
2017
|
2016
|
|||||||||||||||||
|
Interest cost
|
$
|
22.6
|
|
$
|
28.4
|
|
$
|
35.8
|
|
$
|
1.1
|
|
$
|
1.2
|
|
$
|
1.4
|
|
|||||
|
Expected return on plan assets
|
(24.8
|
)
|
(33.5
|
)
|
(38.5
|
)
|
—
|
|
—
|
|
—
|
|
|||||||||||
|
Amortization of prior service credits
|
—
|
|
—
|
|
—
|
|
(0.7
|
)
|
(0.7
|
)
|
(0.7
|
)
|
|||||||||||
|
Amortization of net actuarial losses
|
9.9
|
|
14.4
|
|
17.4
|
|
—
|
|
—
|
|
—
|
|
|||||||||||
|
Settlement charges
|
—
|
|
96.6
|
|
55.1
|
|
—
|
|
—
|
|
—
|
|
|||||||||||
|
Net pension and other benefit costs
|
$
|
7.7
|
|
$
|
105.9
|
|
$
|
69.8
|
|
$
|
0.4
|
|
$
|
0.5
|
|
$
|
0.7
|
|
|||||
Net pension and other benefit costs are recorded in Other expense, net in the Consolidated Statements of Operations.
95
Benefit Obligations and Funded Status.
A reconciliation of the changes in the benefit obligations and fair value of assets over the two-year period ending
December 31, 2018
, and a statement of the funded status at December 31 for these years for the Company's pension and other postretirement benefit plans follow:
|
Pension Benefits
|
Other Postretirement Benefits
|
||||||||||||||
|
(in millions)
|
2018
|
|
2017
|
|
2018
|
|
2017
|
||||||||
|
Reconciliation of benefit obligation:
|
|
|
|
|
|
|
|
||||||||
|
Benefit obligation at previous December 31
|
$
|
716.9
|
|
$
|
921.5
|
|
$
|
38.7
|
|
$
|
40.6
|
|
|||
|
Interest cost
|
22.6
|
|
28.4
|
|
1.1
|
|
1.2
|
|
|||||||
|
Participant contributions
|
—
|
|
—
|
|
0.2
|
|
0.5
|
|
|||||||
|
Actuarial (gains) losses
|
(42.9
|
)
|
58.0
|
|
(2.5
|
)
|
—
|
|
|||||||
|
Benefit payments
|
(43.8
|
)
|
(56.6
|
)
|
(3.2
|
)
|
(3.6
|
)
|
|||||||
|
Settlement payments
|
—
|
|
(234.4
|
)
|
—
|
|
—
|
|
|||||||
|
Benefit obligation at December 31
|
652.8
|
|
716.9
|
|
|
34.3
|
|
|
38.7
|
|
|||||
|
|
|
|
|
|
|
|
|
|
|
|
|
||||
|
Reconciliation of fair value of plan assets:
|
|
|
|
|
|
|
|
|
|
|
|
||||
|
Fair value of plan assets at previous December 31
|
546.1
|
|
687.9
|
|
—
|
|
—
|
|
|||||||
|
Actual return on plan assets
|
(24.1
|
)
|
75.5
|
|
—
|
|
—
|
|
|||||||
|
Employer contributions
|
163.8
|
|
73.7
|
|
3.0
|
|
3.1
|
|
|||||||
|
Participant contributions
|
—
|
|
—
|
|
0.2
|
|
0.5
|
|
|||||||
|
Benefit payments
|
(43.8
|
)
|
(56.6
|
)
|
(3.2
|
)
|
(3.6
|
)
|
|||||||
|
Settlement payments
|
—
|
|
(234.4
|
)
|
—
|
|
—
|
|
|||||||
|
Fair value of plan assets at December 31
|
642.0
|
|
|
546.1
|
|
|
—
|
|
|
—
|
|
||||
|
|
|
|
|
|
|
|
|
|
|
|
|
||||
|
Funded status at December 31
|
$
|
(10.8
|
)
|
|
$
|
(170.8
|
)
|
|
$
|
(34.3
|
)
|
|
$
|
(38.7
|
)
|
|
Funded percentage
(A)
|
98
|
%
|
|
76
|
%
|
|
NA
|
|
|
NA
|
|
||||
(A) As all of the Company's plans are frozen, the projected benefit obligation and the accumulated benefit obligation are equal. As of December 31,
2018
and
2017
, the plan assets for the Company's Salaried and Bargaining plans were in excess of the projected and accumulated benefit obligations.
The funded status of these pension plans includes the projected and accumulated benefit obligations for the Company's nonqualified pension plan of
$29.2 million
and
$33.2 million
at December 31,
2018
and
2017
, respectively. The Company's nonqualified pension plan and other postretirement benefit plans are not funded.
The amounts included in the Company's Consolidated Balance Sheets as of December 31,
2018
and
2017
, were as follows:
|
Pension Benefits
|
Other Postretirement Benefits
|
||||||||||||||
|
(in millions)
|
2018
|
2017
|
2018
|
2017
|
|||||||||||
|
Prepaid expenses and other
|
$
|
14.8
|
|
$
|
—
|
|
$
|
—
|
|
$
|
—
|
|
|||
|
Accounts and notes receivable
|
3.6
|
|
3.5
|
|
—
|
|
—
|
|
|||||||
|
Assets recognized
|
$
|
18.4
|
|
$
|
3.5
|
|
$
|
—
|
|
$
|
—
|
|
|||
|
Accrued expenses
|
$
|
3.7
|
|
$
|
3.8
|
|
$
|
3.6
|
|
$
|
3.7
|
|
|||
|
Postretirement benefit liabilities
|
25.5
|
|
170.5
|
|
30.7
|
|
35.0
|
|
|||||||
|
Liabilities recognized
|
$
|
29.2
|
|
$
|
174.3
|
|
$
|
34.3
|
|
$
|
38.7
|
|
|||
96
Accumulated Other Comprehensive Loss.
The following pretax activity related to pensions and other postretirement benefits was recorded in Accumulated other comprehensive loss as of December 31:
|
Pension Benefits
|
Other Postretirement Benefits
|
||||||||||||||
|
(in millions)
|
2018
|
2017
|
2018
|
2017
|
|||||||||||
|
Prior service credits
|
|||||||||||||||
|
Beginning balance
|
$
|
—
|
|
$
|
—
|
|
$
|
(9.5
|
)
|
$
|
(10.2
|
)
|
|||
|
Amount recognized as component of net benefit costs
|
—
|
|
—
|
|
0.7
|
|
0.7
|
|
|||||||
|
Ending balance
|
—
|
|
—
|
|
(8.8
|
)
|
(9.5
|
)
|
|||||||
|
Net actuarial losses
|
|||||||||||||||
|
Beginning balance
|
302.1
|
|
397.1
|
|
1.0
|
|
1.0
|
|
|||||||
|
Actuarial (gains) losses arising during the period
|
6.1
|
|
16.0
|
|
(2.5
|
)
|
—
|
|
|||||||
|
Amount recognized as component of net benefit costs
|
(9.9
|
)
|
(111.0
|
)
|
—
|
|
—
|
|
|||||||
|
Ending balance
|
298.3
|
|
302.1
|
|
(1.5
|
)
|
1.0
|
|
|||||||
|
Total
|
$
|
298.3
|
|
$
|
302.1
|
|
$
|
(10.3
|
)
|
$
|
(8.5
|
)
|
|||
The estimated pretax net actuarial loss in Accumulated other comprehensive loss at
December 31, 2018
, expected to be recognized as a component of net periodic benefit cost in
2019
for the Company's pension plans, is
$5.1 million
. The estimated pretax prior service credit and net actuarial loss in Accumulated other comprehensive loss at
December 31, 2018
, expected to be recognized as components of net periodic benefit cost in
2019
for the Company's other postretirement benefit plans, are
$0.7 million
and
$0.0 million
, respectively.
Prior service costs and credits associated with other postretirement benefits are being amortized on a straight-line basis over the average future working lifetime to full eligibility for active hourly plan participants and over the average remaining life expectancy for those plans' participants who are fully eligible for benefits. Actuarial gains and losses in excess of
10 percent
of the greater of the benefit obligation or the market value of assets are amortized over the remaining service period of active plan participants and over the average remaining life expectancy of inactive plan participants.
Other Postretirement Benefits
. Once participants eligible for other postretirement benefits turn 65 years old, the health care benefits become a flat dollar amount based on age and years of service. The assumed health care cost trend rate for other postretirement benefits for pre-age 65 benefits as of December 31 was as follows:
|
Pre-age 65 Benefits
|
|||||
|
2018
|
2017
|
||||
|
Health care cost trend rate for next year
|
5.5
|
%
|
5.6
|
%
|
|
|
Rate to which the cost trend rate is assumed to decline (the ultimate trend rate)
|
4.5
|
%
|
4.5
|
%
|
|
|
Year rate reaches the ultimate trend rate
|
2037
|
|
2037
|
|
|
A one percent change in the assumed health care trend rate at
December 31, 2018
would not have a material impact on the accumulated postretirement benefit obligation.
The Company monitors the cost of health care and life insurance benefit plans and reserves the right to make additional changes or terminate these benefits in the future.
97
Assumptions.
Weighted average assumptions used to determine pension and other postretirement benefit obligations at December 31 were as follows:
|
Pension Benefits
|
Other Postretirement Benefits
|
||||||||||
|
2018
|
2017
|
2018
|
2017
|
||||||||
|
Discount rate
|
4.13
|
%
|
3.63
|
%
|
4.20
|
%
|
3.51
|
%
|
|||
Weighted average assumptions used to determine net pension and other postretirement benefit costs for the years ended December 31 were as follows:
|
2018
|
2017
|
2016
|
|||
|
Discount rate for pension benefits
(A) (B)
|
3.27%
|
3.40%
|
3.58%
|
||
|
Discount rate for other postretirement benefits
(A) (B)
|
3.08%
|
3.17%
|
3.30%
|
||
|
Long-term rate of return on plan assets
(C)
|
4.25%
|
4.75%
|
5.25%
|
||
(A) The Company utilizes a yield curve analysis to calculate the discount rates used to determine pension and other postretirement benefit obligations. The yield curve analysis matches the cash flows of the Company's benefit obligations. The yield curve consisted of spot interest rates at half year increments for each of the next 30 years and was developed based on pricing and yield information for high quality corporate bonds rated Aa by either Moody's or Standard & Poor's, private placement bonds that are traded in reliance with Rule 144A and are at least two years from date of issuance, bonds with make-whole provisions and bonds issued by foreign corporations that are denominated in U.S. dollars, excluding callable bonds and bonds less than a minimum size and other filtering criteria. Additionally, the Company's yield curve methodology includes bonds having a yield that is greater than the regression mean yield curve as the Company believes this methodology represents an appropriate estimate of the rates at which the Company could effectively settle its pension obligations. For the Company's Salaried and Bargaining plans which were terminated during 2018, the discount rate was a blend of the December 31, 2018 yield curve rate associated with those participants electing annuity contracts to cover future benefit payments, and a lump-sum segment rate for those participants electing lump-sum benefit payments.
(B) The Company uses a "spot rate approach" in the calculation of pension and postretirement interest costs to provide a more accurate measurement of interest costs. The spot rate approach applies separate discount rates for each projected benefit payment in the calculation of pension and postretirement interest costs.
(C) The Company evaluates its assumption regarding the estimated long-term rate of return on plan assets based on historical experience, future expectations of investment returns, asset allocations, investment strategies and views of investment professionals.
Master Trust Investments.
Assets of the Company's Master Pension Trust (Trust) are invested solely in the interest of the plan participants for the purpose of providing benefits to participants and their beneficiaries. Investment decisions within the Trust are made after giving appropriate consideration to the prevailing facts and circumstances that a prudent person acting in a like capacity would use in a similar situation, and follow the guidelines and objectives established within the investment policy statement for the Trust. In general, the Trust's investment strategy is to invest in a diversified portfolio of assets that will generate returns equal to or in excess of the change in liabilities resulting from interest costs and discount rate fluctuations. The excess returns generated from this strategy will contribute to improving the funded position of the plan. In order for returns to achieve this objective, the Trust will invest in fixed income investments and equities. These asset classes have historically been reasonably correlated to changes in plan liabilities resulting from changes in the discount rate. All investments are continually monitored and reviewed, with a focus on asset allocation, investment vehicles and performance of the individual investment managers, as well as overall Trust performance. Over time, the Company has shifted a greater percentage of the Trust's assets into long-term fixed-income securities, with an objective of achieving an improved matching of asset returns with changes in liabilities.
The Trust asset allocation at December 31,
2018
and
2017
, and target allocation for
2019
are as follows:
|
2018
|
2017
|
Target
Allocation for 2019
|
|||
|
Equity securities:
|
|||||
|
United States
|
—%
|
4%
|
—%
|
||
|
International
|
—%
|
1%
|
—%
|
||
|
Fixed-income securities
|
84%
|
89%
|
85%
|
||
|
Short-term investments
|
16%
|
6%
|
15%
|
||
|
Total
|
100%
|
100%
|
100%
|
||
98
The fair values of the Trust's pension assets at
December 31, 2018
, by asset class were as follows:
|
Fair Value Measurements at December 31, 2018
(A)
|
|||||||||||
|
(in millions)
|
Quoted Prices in Active Markets for Identical Assets
|
Significant Observable Inputs
|
|||||||||
|
Investments at fair value
|
(Level 1)
|
(Level 2)
|
Total
|
||||||||
|
Cash and cash equivalents
|
$
|
6.1
|
|
$
|
—
|
|
$
|
6.1
|
|
||
|
Fixed-income securities:
|
|||||||||||
|
Government securities
(C)
|
—
|
|
126.2
|
|
126.2
|
|
|||||
|
Corporate securities
(D)
|
—
|
|
356.2
|
|
356.2
|
|
|||||
|
Other investments
(F)
|
—
|
|
7.2
|
|
7.2
|
|
|||||
|
Total investments at fair value
|
$
|
6.1
|
|
$
|
489.6
|
|
$
|
495.7
|
|
||
|
Investments at net asset value
|
|||||||||||
|
Short-term investments
|
102.3
|
|
|||||||||
|
Equity securities:
(B)
|
|||||||||||
|
United States
|
2.0
|
|
|||||||||
|
Fixed-income securities:
|
|||||||||||
|
Commingled funds
(E)
|
63.3
|
|
|||||||||
|
Total investments at net asset value
|
167.6
|
|
|||||||||
|
Other liabilities
(G)
|
(21.3
|
)
|
|||||||||
|
Total pension plan net assets
|
$
|
642.0
|
|
||||||||
|
(A)
|
See
Note 8 –
Fair Value Measurements
for a description of levels within the fair value hierarchy. The level in the fair value hierarchy within which the fair value measurement is classified is determined based on the lowest level input that is significant to the fair value measurement in its entirety. A description of the valuation methodologies is provided following these tables. There were no transfers in and/or out of Level 1 and Level 2 in
2018
.
|
|
(B)
|
The equity assets are invested in two indexed funds based on the Russell 3000 Index (U.S.) and the MSCI EAFE Equity Index (International). The Trust did not directly own any of the Company's common stock as of
December 31, 2018
.
|
|
(C)
|
Government securities are comprised of U.S. Treasury bonds and other government securities.
|
|
(D)
|
Corporate securities consist primarily of a diversified portfolio of investment grade bonds issued by companies.
|
|
(E)
|
This class includes commingled funds that primarily invest in investment grade corporate securities and government-related securities. This class also includes investments in non-agency collateralized mortgage obligations and mortgage-backed securities, futures and options.
|
|
(F)
|
Other investments consist primarily of interest rate swaps used to manage the average duration of the fixed income portfolio and credit default swaps to manage credit risk exposure.
|
|
(G)
|
This class includes interest receivable and receivables/payables for securities sold/purchased.
|
99
The fair values of the Trust's pension assets at
December 31, 2017
, by asset class were as follows:
|
Fair Value Measurements at December 31, 2017
(A)
|
|||||||||||
|
(in millions)
|
Quoted Prices in Active Markets for Identical Assets
|
Significant Observable Inputs
|
|||||||||
|
Investments at fair value
|
(Level 1)
|
(Level 2)
|
Total
|
||||||||
|
Short-term investments
|
$
|
15.2
|
|
$
|
—
|
|
$
|
15.2
|
|
||
|
Fixed-income securities:
|
|||||||||||
|
Government securities
(C)
|
—
|
|
114.1
|
|
114.1
|
|
|||||
|
Corporate securities
(D)
|
—
|
|
324.0
|
|
324.0
|
|
|||||
|
Other investments
(F)
|
—
|
|
9.2
|
|
9.2
|
|
|||||
|
Total investments at fair value
|
$
|
15.2
|
|
$
|
447.3
|
|
$
|
462.5
|
|
||
|
Investments at net asset value
|
|||||||||||
|
Short-term investments
|
25.0
|
|
|||||||||
|
Equity securities:
(B)
|
|||||||||||
|
United States
|
23.9
|
|
|||||||||
|
International
|
5.6
|
|
|||||||||
|
Fixed-income securities:
|
|||||||||||
|
Commingled funds
(E)
|
65.2
|
|
|||||||||
|
Total investments at net asset value
|
119.7
|
|
|||||||||
|
Other liabilities
(G)
|
(36.1
|
)
|
|||||||||
|
Total pension plan net assets
|
$
|
546.1
|
|
||||||||
|
(A)
|
See
Note 8 –
Fair Value Measurements
for a description of levels within the fair value hierarchy. The level in the fair value hierarchy within which the fair value measurement is classified is determined based on the lowest level input that is significant to the fair value measurement in its entirety. A description of the valuation methodologies is provided following these tables. There were no transfers in and/or out of Level 1 and Level 2 in
2017
.
|
|
(B)
|
The equity assets are invested in two indexed funds based on the Russell 3000 Index (U.S.) and the MSCI EAFE Equity Index (International). The Trust did not directly own any of the Company's common stock as of
December 31, 2017
.
|
|
(C)
|
Government securities are comprised of U.S. Treasury bonds and other government securities.
|
|
(D)
|
Corporate securities consist primarily of a diversified portfolio of investment grade bonds issued by companies.
|
|
(E)
|
This class includes commingled funds that primarily invest in investment grade corporate securities and government-related securities. This class also includes investments in non-agency collateralized mortgage obligations and mortgage-backed securities, futures and options.
|
|
(F)
|
Other investments consist primarily of interest rate swaps used to manage the average duration of the fixed income portfolio and credit default swaps to manage credit risk exposure.
|
|
(G)
|
This class includes interest receivable and receivables/payables for securities sold/purchased.
|
The following is a description of the valuation methodologies used for assets and liabilities measured at fair value. See
Note 8 –
Fair Value Measurements
for further description of the procedures the Company performs with respect to its Level 2 measurements:
Equity securities:
The indexed equity funds are valued at the net asset value (NAV) provided by the investment managers. The NAV is based on the quoted market value of the underlying assets owned by the fund, minus its liabilities, divided by the number of units outstanding. The indexed equity funds are invested in portfolios of equity securities with the goal of matching returns to specific indices. Investments in United States equity securities are invested in an index fund that tracks the Russell 3000 index, which is an all cap market index. International equities are invested in an index fund that tracks the MSCI EAFE index, which is an index that tracks international equity markets of developed countries worldwide. Withdrawal from the United States equity fund is permitted with a one-day notice prior to the trade date with subsequent settlement three days after the trade date. Withdrawal from the international equity fund is permitted daily with a two-day notice prior to the trade date with subsequent settlement three days after the trade date.
Corporate debt securities:
Corporate debt securities are valued based on prices provided by third-party pricing sources, which are based on estimated prices at which a dealer would pay for or sell a security.
100
Government debt securities:
U.S. Treasury bonds are valued using quoted market prices in active markets. Other agency securities are valued based on prices provided by third-party pricing sources, which are based on estimated prices at which a dealer would pay for or sell a security.
Short-term investments, commingled funds:
Short-term investments and commingled funds are valued at the NAV provided by the investment managers. The NAV is based on the quoted market value of the underlying assets owned by the fund, minus its liabilities, divided by the number of units outstanding. Investments in fixed income commingled funds include long-duration corporate bonds, asset-backed securities and other short-term, fixed-income securities with the goal of preserving capital and maximizing total return consistent with prudent investment management.
Other investments:
Exchange-traded derivative instruments are valued using market indices. The fair value of derivatives that are not traded on an exchange are based on valuation models using observable market data as of the measurement date.
There were no pension plan assets measured using significant unobservable inputs (Level 3) for the years ended
December 31, 2018
and
December 31, 2017
.
Expected Cash Flows.
The expected cash flows for the Company's pension and other postretirement benefit plans follow:
|
(in millions)
|
Pension Benefits
|
Other Postretirement Benefits
|
|||||
|
Company contributions expected to be made in 2019
|
$
|
3.7
|
|
$
|
3.6
|
|
|
|
Expected benefit payments:
|
|||||||
|
2019
(A)
|
639.3
|
|
3.6
|
|
|||
|
2020
|
3.5
|
|
3.4
|
|
|||
|
2021
|
3.1
|
|
3.2
|
|
|||
|
2022
|
2.9
|
|
2.9
|
|
|||
|
2023
|
2.8
|
|
2.8
|
|
|||
|
2024-2028
|
10.7
|
|
12.1
|
|
|||
(A) Expected benefit payments in 2019 include payments in connection with the Salaried Plan and Bargaining Plan terminations.
Note 19 –
Stock Plans and Management Compensation
Under the Brunswick Corporation 2014 Stock Incentive Plan, the Company may grant stock appreciation rights (SARs), non-vested stock awards, and performance awards to executives, other employees and non-employee directors, with shares from treasury shares and from authorized, but unissued, shares of common stock initially available for grant, in addition to: (i) the forfeiture of past awards; (ii) shares not issued upon the net settlement of SARs; or (iii) shares delivered to or withheld by the Company to pay the withholding taxes related to awards. As of December 31,
2018
,
5.2 million
shares remained available for grant.
Non-Vested Stock Awards
The Company grants both stock-settled and cash-settled non-vested stock units and awards to key employees as determined by management and the Human Resources and Compensation Committee of the Board of Directors. Non-vested stock units and awards have vesting periods of
three
years. Non-vested stock units and awards are eligible for dividends, which are reinvested, and are non-voting. All non-vested units and awards have restrictions on the sale or transfer of such awards during the vesting period.
Generally, grants of non-vested stock units and awards are forfeited if employment is terminated prior to vesting. Non-vested stock units and awards vest pro rata over one year if (i) the grantee has attained the age of
62
, or (ii) the grantee's age plus total years of service equals
70 or more
.
The Company recognizes the cost of non-vested stock units and awards on a straight-line basis over the requisite service period. Additionally, cash-settled non-vested stock units and awards are recorded as a liability on the balance sheet and adjusted to fair value each reporting period through stock compensation expense. During the years ended December 31,
2018
,
2017
and
2016
, the Company charged
$13.2 million
,
$11.6 million
and
$10.8 million
, respectively, to compensation expense for non-vested
101
stock units and awards. The related income tax benefit recognized in
2018
,
2017
and
2016
was
$3.3 million
,
$4.4 million
and
$4.1 million
, respectively. The fair value of shares vested during
2018
,
2017
and
2016
was
$4.4 million
,
$12.1 million
and
$13.8 million
respectively.
The weighted average price per Non-vested stock award at grant date was
$59.05
,
$60.30
and
$40.01
for awards granted in
2018
,
2017
and
2016
, respectively. Non-vested stock award activity for the year ended December 31, 2018 was as follows:
|
(in thousands, except grant date fair value)
|
Non-vested Stock Award Activity
|
Weighted Average Grant Date Fair Value ($)
|
|||
|
Non-vested awards, unvested at January 1
|
376
|
|
51.69
|
|
|
|
Awarded
|
357
|
|
59.05
|
|
|
|
Forfeited
|
(64
|
)
|
55.30
|
|
|
|
Vested
|
(95
|
)
|
57.99
|
|
|
|
Non-vested awards, unvested at December 31
|
574
|
|
54.82
|
|
|
As of December 31, 2018, there was
$11.7 million
of total unrecognized compensation expense related to non-vested stock awards. The Company expects this expense to be recognized over a weighted average period of
1.4 years
.
SARs
Between 2005 and 2012, the Company issued stock-settled SARs. Generally, SARs are exercisable over a period of
10 years
, or as otherwise determined by management and the Human Resources and Compensation Committee of the Board of Directors, and subject to vesting periods of generally
4 years
. However, with respect to SARs, all grants vest immediately: (i) in the event of a change in control; (ii) upon death or disability of the grantee; or (iii) with respect to awards granted prior to 2008, upon the sale or divestiture of the business unit to which the grantee is assigned.
In addition, grantees continue to vest in accordance with the vesting schedule even upon termination if (i) the grantee has attained the age of
62
, or (ii) the grantee's age plus total years of service equals
70 or more
. An additional provision applies that prorates the grant in the event of termination prior to the first anniversary of the date of grant, provided the participant had met the appropriate retirement age definition of rule of 70 or age 62.
SARs activity for all plans for the years ended December 31, 2018,
2017
and
2016
, was as follows:
|
2018
|
2017
|
2016
|
||||||||||||||||||||||||||||||||
|
(in thousands, except exercise price and terms)
|
SARs Outstanding |
Weighted
Average Exercise Price |
Weighted
Average Remaining Contractual Term |
Aggregate Intrinsic Value
|
SARs Outstanding |
Weighted
Average Exercise Price |
Aggregate Intrinsic Value
|
SARs Outstanding |
Weighted Average Exercise Price |
Aggregate Intrinsic Value
|
||||||||||||||||||||||||
|
Outstanding on January 1
|
594
|
|
$
|
14.40
|
|
978
|
|
$
|
14.43
|
|
2,234
|
|
$
|
15.78
|
|
|||||||||||||||||||
|
Exercised
|
(248
|
)
|
$
|
12.10
|
|
$
|
12,636
|
|
(352
|
)
|
$
|
14.37
|
|
$
|
16,071
|
|
(1,252
|
)
|
$
|
16.76
|
|
$
|
32,096
|
|
||||||||||
|
Forfeited
|
(3
|
)
|
$
|
17.06
|
|
(32
|
)
|
$
|
15.76
|
|
(4
|
)
|
$
|
38.42
|
|
|||||||||||||||||||
|
Outstanding on December 31
|
343
|
|
$
|
16.04
|
|
1.7 years
|
$
|
10,439
|
|
594
|
|
$
|
14.40
|
|
$
|
24,261
|
|
978
|
|
$
|
14.43
|
|
$
|
39,228
|
|
|||||||||
|
Exercisable on December 31
|
343
|
|
$
|
16.04
|
|
1.7 years
|
$
|
10,439
|
|
594
|
|
$
|
14.40
|
|
$
|
24,261
|
|
978
|
|
$
|
14.43
|
|
$
|
39,228
|
|
|||||||||
|
Vested and expected to vest on December 31
|
343
|
|
$
|
16.04
|
|
1.7 years
|
$
|
10,439
|
|
594
|
|
$
|
14.40
|
|
$
|
24,261
|
|
978
|
|
$
|
14.43
|
|
$
|
39,228
|
|
|||||||||
102
The following table summarizes information about SARs outstanding as of December 31, 2018:
|
Outstanding and Exercisable
|
||||||||||
|
Range of Exercise
Price
|
Number
(in thousands)
|
Weighted
Average Remaining Years of
Contractual
Life
|
Weighted
Average
Exercise
Price
|
|||||||
|
$5.86
|
27
|
|
0.4 years
|
|
$
|
5.86
|
|
|||
|
$5.87 to $14.68
|
154
|
|
1.2
|
years
|
$
|
11.32
|
|
|||
|
Greater than $14.68
|
162
|
|
2.4
|
years
|
$
|
22.27
|
|
|||
SARs expense was immaterial for all periods presented.
Performance Awards
In February
2018
,
2017
and
2016
, the Company granted performance shares to certain senior executives. Performance share awards are based on three performance measures: a cash flow return on investment (CFROI) measure, an operating margin (OM) measure and a total shareholder return (TSR) modifier. Performance shares are earned based on a three-year performance period commencing at the beginning of the calendar year of each grant. The performance shares earned are then subject to a TSR modifier based on stock returns measured against stock returns of a predefined comparator group over a three-year performance period. Additionally, in February
2018
,
2017
and
2016
, the Company granted
24,490
,
26,300
and
37,430
performance shares, respectively, to certain officers and certain senior managers based on the respective measures and performance periods described above but excluding a TSR modifier.
The fair values of the senior executives' performance share award grants with a TSR modifier at the grant date in
2018
,
2017
and
2016
were
$61.59
,
$64.82
and
$38.54
, respectively, which were estimated using the Monte Carlo valuation model, and incorporated the following assumptions:
|
2018
|
2017
|
2016
|
||||||
|
Risk-free interest rate
|
2.4
|
%
|
1.5
|
%
|
0.8
|
%
|
||
|
Dividend yield
|
1.3
|
%
|
1.1
|
%
|
1.0
|
%
|
||
|
Volatility factor
|
38.9
|
%
|
38.3
|
%
|
40.8
|
%
|
||
|
Expected life of award
|
2.9 years
|
|
2.9 years
|
|
2.9 years
|
|
||
The fair value of certain officers' and certain senior managers' performance awards granted based solely on the CFROI and OM performance factors was
$57.19
,
$58.77
and
$37.76
, which was equal to the stock price on the date of grant in
2018
,
2017
and
2016
, respectively, less the present value of dividend payments over the vesting period.
The Company recorded compensation expense related to performance awards of
$5.9 million
,
$6.7 million
and
$6.1 million
in
2018
,
2017
and
2016
, respectively. The related income tax benefit recognized in
2018
,
2017
and
2016
was
$1.5 million
,
$2.6 million
and
$2.3 million
, respectively. The fair value of awards vested during
2018
,
2017
and
2016
was
$7.8 million
,
$5.5 million
and
$9.1 million
, respectively.
103
Performance award activity for the year ended December 31, 2018 was as follows:
|
(in thousands, except grant date fair value)
|
Performance Awards
|
Weighted Average Grant Date Fair Value ($)
|
|||
|
Performance awards, unvested at January 1
|
102
|
|
50.69
|
|
|
|
Awarded
|
176
|
|
59.11
|
|
|
|
Forfeited
|
(20
|
)
|
59.07
|
|
|
|
Vested and earned
|
(167
|
)
|
52.79
|
|
|
|
Performance awards, unvested at December 31
|
91
|
|
61.32
|
|
|
As of December 31, 2018, the Company had
$2.8 million
of total unrecognized compensation expense related to performance awards. The Company expects this expense to be recognized over a weighted average period of
1.5 years
.
Excess Tax Benefits/Shortfalls
For tax purposes, share-based compensation expense is deductible in the year of exercise or release based on the intrinsic value of the award on the date of exercise or release. For financial reporting purposes, share-based compensation expense is based upon grant-date fair value, which is amortized over the vesting period. Excess or "windfall" tax benefits represent the excess tax deduction received by the Company resulting from the difference between the share-based compensation expense deductible for tax purposes and the share-based compensation expense recognized for financial reporting purposes. Conversely, the Company may recognize a tax "shortfall" in circumstances when share-based expense recognized for reporting purposes exceeds the expense deductible for tax purposes. Windfall tax benefits and shortfalls are recorded directly to Income tax provision on the Company's Consolidated Statement of Operations. Windfall tax benefits for the years ended December 31,
2018
,
2017
and
2016
were
$3.2 million
,
$8.0 million
and
$13.4 million
, respectively.
Director Awards
The Company issues stock awards to non-employee directors in accordance with the terms and conditions determined by the Nominating and Corporate Governance Committee of the Board of Directors. A portion of each director’s annual fee is paid in Brunswick common stock, the receipt of which may be deferred until a director retires from the Board of Directors. Each director may elect to have the remaining portion paid in cash, in Brunswick common stock distributed at the time of the award, or in deferred Brunswick common stock units with a
20 percent
premium.
104
Note 20 –
Comprehensive Income (Loss)
The following table presents reclassification adjustments out of Accumulated other comprehensive loss during the years ended
December 31, 2018
,
2017
and
2016
:
|
(in millions)
|
Twelve Months Ended
|
|||||||||||||
|
Details about Accumulated other comprehensive loss components
|
December 31, 2018
|
December 31, 2017
|
December 31, 2016
|
Affected line item in the statement where net income is presented
|
||||||||||
|
Amortization of defined benefit items:
|
||||||||||||||
|
Prior service credits
|
$
|
0.7
|
|
$
|
0.7
|
|
$
|
0.7
|
|
(A)
|
||||
|
Net actuarial losses
|
(10.3
|
)
|
(111.8
|
)
|
(73.1
|
)
|
(A)
|
|||||||
|
(9.6
|
)
|
(111.1
|
)
|
(72.4
|
)
|
Earnings before income taxes
|
||||||||
|
2.2
|
|
42.3
|
|
27.5
|
|
Income tax provision
|
||||||||
|
$
|
(7.4
|
)
|
$
|
(68.8
|
)
|
$
|
(44.9
|
)
|
Net earnings from continuing operations
|
|||||
|
Amount of gain (loss) reclassified into earnings on derivative contracts:
|
||||||||||||||
|
Interest rate contracts
|
$
|
(0.9
|
)
|
$
|
(1.1
|
)
|
$
|
(0.6
|
)
|
Interest expense
|
||||
|
Foreign exchange contracts
|
(2.5
|
)
|
(0.9
|
)
|
3.3
|
|
Cost of sales
|
|||||||
|
Commodity contracts
|
—
|
|
(0.0
|
)
|
(0.5
|
)
|
Cost of sales
|
|||||||
|
(3.4
|
)
|
(2.0
|
)
|
2.2
|
|
Earnings before income taxes
|
||||||||
|
0.8
|
|
0.7
|
|
(0.4
|
)
|
Income tax provision
|
||||||||
|
$
|
(2.6
|
)
|
$
|
(1.3
|
)
|
$
|
1.8
|
|
Net earnings from continuing operations
|
|||||
(A) These Accumulated other comprehensive income (loss) components are included in the computation of net pension and other benefit costs. See
Note 18 –
Postretirement Benefits
for additional details.
Note 21 –
Treasury Stock
The Company has executed share repurchases against authorizations approved by the Board of Directors in 2014 and 2016. In
2018
, the Company repurchased
$75.0 million
of stock under these authorizations and as of
December 31, 2018
, the remaining authorization was
$34.8 million
.
Treasury stock activity for the years ended
December 31, 2018
,
2017
and
2016
, was as follows:
|
(Shares in thousands)
|
2018
|
2017
|
2016
|
|||||
|
Balance at January 1
|
15,001
|
|
13,221
|
|
11,725
|
|
||
|
Compensation plans and other
|
(460
|
)
|
(547
|
)
|
(1,199
|
)
|
||
|
Share repurchases
|
1,240
|
|
2,327
|
|
2,695
|
|
||
|
Balance at December 31
|
15,781
|
|
15,001
|
|
13,221
|
|
||
Note 22 –
Leases
Operating Leases.
The Company has lease agreements for offices, branches, factories, distribution and service facilities and certain personal property. The longest of these obligations extends through 2033. Most leases contain renewal options and escalation clauses, and some contain purchase options or contingent rentals. No leases contain restrictions on the Company's activities concerning dividends or incurring additional debt.
105
Rent expense consisted of the following:
|
(in millions)
|
2018
|
2017
|
2016
|
||||||||
|
Basic expense
|
$
|
44.4
|
|
$
|
41.5
|
|
$
|
37.2
|
|
||
|
Contingent expense
|
1.9
|
|
3.2
|
|
2.0
|
|
|||||
|
Sublease income
|
(0.1
|
)
|
(0.1
|
)
|
(0.2
|
)
|
|||||
|
Rent expense, net
|
$
|
46.2
|
|
$
|
44.6
|
|
$
|
39.0
|
|
||
Future minimum rental payments at
December 31, 2018
, under agreements classified as operating leases with non-cancelable terms in excess of one year, were as follows:
|
(in millions)
|
|||
|
2019
|
$
|
40.3
|
|
|
2020
|
32.3
|
|
|
|
2021
|
26.5
|
|
|
|
2022
|
17.7
|
|
|
|
2023
|
13.7
|
|
|
|
Thereafter
|
22.9
|
|
|
|
Total (not reduced by minimum sublease income of $0.1)
|
$
|
153.4
|
|
106
Note 23 –
Quarterly Data (unaudited)
The Company maintains its financial records on the basis of a fiscal year ending on December 31, with the fiscal quarters spanning approximately thirteen weeks. The first quarter ends on the Saturday closest to the end of the first thirteen-week period. The second and third quarters are thirteen weeks in duration and the fourth quarter is the remainder of the year. The first three quarters of fiscal year
2018
ended on
March 31, 2018
,
June 30, 2018
, and
September 29, 2018
, and the first three quarters of fiscal year
2017
ended on
April 1, 2017
,
July 1, 2017
, and
September 30, 2017
.
|
Quarter Ended
|
|
||||||||||||||||||
|
(in millions, except per share data)
|
March 31,
2018 |
June 30,
2018 |
September 29,
2018 |
December 31,
2018 |
Year Ended December 31, 2018
|
||||||||||||||
|
Net sales
(A)
|
$
|
1,211.4
|
|
$
|
1,400.9
|
|
$
|
1,298.0
|
|
$
|
1,248.9
|
|
$
|
5,159.2
|
|
||||
|
Gross margin
(A) (B) (C) (D)
|
310.0
|
|
349.7
|
|
344.9
|
|
316.4
|
|
1,321.0
|
|
|||||||||
|
Restructuring, exit, integration and impairment charges
(E)
|
3.8
|
|
34.8
|
|
17.7
|
|
24.6
|
|
80.9
|
|
|||||||||
|
Transaction financing charges
(C)
|
—
|
|
—
|
|
5.1
|
|
—
|
|
5.1
|
|
|||||||||
|
Net earnings from continuing operations
(A) (C) (D) (E) (F) (G) (H)
|
72.9
|
|
79.0
|
|
70.0
|
|
41.2
|
|
263.1
|
|
|||||||||
|
Net earnings from discontinued operations, net of tax
|
—
|
|
—
|
|
—
|
|
2.2
|
|
2.2
|
|
|||||||||
|
Net earnings
|
72.9
|
|
79.0
|
|
70.0
|
|
43.4
|
|
265.3
|
|
|||||||||
|
Basic earnings per common share:
|
|||||||||||||||||||
|
Net earnings from continuing operations
|
$
|
0.83
|
|
$
|
0.90
|
|
$
|
0.80
|
|
$
|
0.47
|
|
$
|
3.00
|
|
||||
|
Net earnings from discontinued operations
|
—
|
|
—
|
|
—
|
|
0.02
|
|
0.03
|
|
|||||||||
|
Net earnings
|
$
|
0.83
|
|
$
|
0.90
|
|
$
|
0.80
|
|
$
|
0.49
|
|
$
|
3.03
|
|
||||
|
Diluted earnings per common share:
|
|||||||||||||||||||
|
Net earnings from continuing operations
|
$
|
0.82
|
|
$
|
0.90
|
|
$
|
0.80
|
|
$
|
0.47
|
|
$
|
2.98
|
|
||||
|
Net earnings from discontinued operations
|
—
|
|
—
|
|
—
|
|
0.03
|
|
0.03
|
|
|||||||||
|
Net earnings
|
$
|
0.82
|
|
$
|
0.90
|
|
$
|
0.80
|
|
$
|
0.50
|
|
$
|
3.01
|
|
||||
|
Dividends declared
|
$
|
0.19
|
|
$
|
0.19
|
|
$
|
0.19
|
|
$
|
0.21
|
|
$
|
0.78
|
|
||||
|
Common stock price (NYSE symbol: BC):
|
|||||||||||||||||||
|
High
|
$
|
64.45
|
|
$
|
69.27
|
|
$
|
69.82
|
|
$
|
67.92
|
|
$
|
69.82
|
|
||||
|
Low
|
$
|
55.35
|
|
$
|
56.41
|
|
$
|
61.78
|
|
$
|
41.92
|
|
$
|
41.92
|
|
||||
107
|
Quarter Ended
|
|
||||||||||||||||||
|
(in millions, except per share data)
|
April 1,
2017 |
July 1,
2017 |
September 30,
2017 |
December 31,
2017 |
December 31, 2017
|
||||||||||||||
|
Net sales
(A)
|
$
|
1,160.3
|
|
$
|
1,352.0
|
|
$
|
1,141.5
|
|
$
|
1,182.1
|
|
$
|
4,835.9
|
|
||||
|
Gross margin
(A) (B) (D)
|
301.2
|
|
369.9
|
|
314.4
|
|
276.6
|
|
1,262.1
|
|
|||||||||
|
Restructuring, exit, integration and impairment charges
(E)
|
15.2
|
|
5.7
|
|
6.8
|
|
53.6
|
|
81.3
|
|
|||||||||
|
Pension settlement charge
(I)
|
—
|
|
—
|
|
—
|
|
96.6
|
|
96.6
|
|
|||||||||
|
Net earnings (loss)
(A) (D) (E) (H) (I)
|
64.9
|
|
119.4
|
|
79.0
|
|
(116.9
|
)
|
146.4
|
|
|||||||||
|
Basic earnings (loss) per common share
|
$
|
0.72
|
|
$
|
1.33
|
|
$
|
0.89
|
|
$
|
(1.32
|
)
|
$
|
1.64
|
|
||||
|
Diluted earnings (loss) per common share
|
$
|
0.71
|
|
$
|
1.32
|
|
$
|
0.88
|
|
$
|
(1.32
|
)
|
$
|
1.62
|
|
||||
|
Dividends declared
|
$
|
0.165
|
|
$
|
0.165
|
|
$
|
0.165
|
|
$
|
0.19
|
|
$
|
0.685
|
|
||||
|
Common stock price (NYSE symbol: BC):
|
|||||||||||||||||||
|
High
|
$
|
61.74
|
|
$
|
63.82
|
|
$
|
63.79
|
|
$
|
60.25
|
|
$
|
63.82
|
|
||||
|
Low
|
$
|
53.95
|
|
$
|
54.16
|
|
$
|
48.72
|
|
$
|
48.04
|
|
$
|
48.04
|
|
||||
(A) In the second quarter of 2018, the Company announced its intention to wind down Sport Yacht & Yacht operations. During the first, second, third and fourth quarters and the full-year of 2018, Sport Yacht & Yacht operations had operating losses of
$8.1 million
,
$27.4 million
,
$11.9 million
,
$11.0 million
and
$58.4 million
, respectively, consisting of
$15.1 million
,
$19.9 million
,
$9.0 million
,
$5.4 million
and
$49.4 million
, respectively, of Net sales;
$18.7 million
,
$43.1 million
,
$17.3 million
,
$10.0 million
,
$89.1 million
of Cost of sales (COS); and
$4.5 million
,
$4.2 million
,
$3.6 million
,
$6.4 million
and
$18.7 million
, respectively, of Selling, general and administrative expense (SG&A). During the first, second, third and fourth quarters and the full-year of 2017, Sport Yacht & Yacht operations had operating losses of
$8.0 million
,
$3.4 million
,
$9.8 million
,
$10.7 million
and
$31.9 million
, respectively, consisting of
$38.9 million
,
$53.1 million
,
$21.3 million
,
$38.3 million
and
$151.6 million
, respectively, of Net sales;
$41.0 million
,
$52.5 million
,
$26.3 million
,
$44.2 million
,
$164.0 million
of Cost of sales (COS); and
$5.9 million
,
$4.0 million
,
$4.8 million
,
$4.8 million
and
$19.5 million
, respectively, of Selling, general and administrative expense (SG&A).
(B) Gross margin is defined as Net sales less COS as presented in the Consolidated Statements of Operations.
(C) In the third quarter of 2018, the Company acquired Power Products – Global Marine & Mobile. During the second, third and fourth quarters and full-year of 2018, the Company recorded acquisition-related costs from transaction costs of
$2.5 million
,
$10.5 million
,
$0.8 million
and
$13.8 million
, respectively, within SG&A;
$5.1 million
of Transaction financing charges during the third quarter and full-year of 2018, respectively, and
$9.4 million
,
$11.8 million
and
$21.2 million
of purchase accounting amortization during the third and fourth quarters and full-year of 2018, respectively; During the third and fourth quarters and full-year of 2018, the purchase accounting amortization reflected
$4.8 million
,
$7.2 million
and
$12.0 million
within SG&A, respectively, and
$4.6 million
,
$4.6 million
and
$9.2 million
within COS, respectively. Refer to
Note 5 –
Acquisitions
for further details.
(D) During the second, third and fourth quarters and the full-year of 2018, the Company's Fitness segment recorded
$1.6 million
,
$3.8 million
,
$6.4 million
and
$11.8 million
of unusual charges. The charges in the second quarter consisted of
$1.6 million
within COS for a product field campaign. The charges in the third quarter consisted of
$3.8 million
within SG&A related to a contract dispute. The charges in the fourth quarter consisted of
$3.1 million
within COS related to the settlement of supplier obligations,
$2.8 million
within SG&A associated with the delayed submission of foreign import duty filings,
$0.7 million
within COS for a product field campaign and
$(0.2) million
within SG&A related to the contract dispute. In the fourth quarter of 2017, the Company's Fitness segment recorded
$8.4 million
and
$5.1 million
within COS and SG&A, respectively, related to field campaigns pertaining to certain Cybex products designed prior to the acquisition. Refer to
Note 14 –
Commitments and Contingencies
for further details.
(E) Restructuring, exit, integration and impairment charges are discussed in
Note 4 –
Restructuring, Exit, Integration and Impairment Activities
.
(F) During the first, second, third and fourth quarters and the full-year of 2018, the Company recorded
$1.7 million
,
$2.5 million
,
$8.7 million
,
$6.4 million
and
$19.3 million
of charges within SG&A related to the planned Fitness business separation.
(G) In the fourth quarter of 2018, the Company sold its non-controlling interest in a marine joint venture and recorded a gain of
$2.3 million
within Equity earnings.
(H) Net earnings (loss) includes the tax impacts of the items discussed in the aforementioned footnotes, as well as special tax items. During the first, second, third and fourth quarters and the full-year of 2018, special tax items were a net charge (benefit) of
$6.7 million
,
$(1.0) million
,
$(10.4) million
,
$0.6 million
and
$(4.1) million
, respectively. During the first, second, third and fourth quarters and the full-year of 2017, special tax items were a net charge (benefit) of
$(0.5) million
,
$(0.2) million
,
$(0.7) million
,
$71.1 million
and
$69.7 million
, respectively.
(I) Pension settlement charges are discussed in
Note 18 –
Postretirement Benefits
.
Note 24 –
Subsequent Events
On February 14, 2019, the Company's Board of Directors declared a quarterly dividend on its common stock of
$0.21
per share. The dividend will be payable March 15, 2019 to shareholders of record on February 26, 2019.
108
(in millions)
|
Allowances for
Losses on Receivables
|
Balance at
Beginning
of Year
|
Charges to Profit and Loss |
Write-offs
|
Recoveries
|
Acquisitions
|
Other
|
Balance at
End of Year
|
|||||||||||||||||||||
|
2018
|
$
|
9.2
|
|
$
|
1.9
|
|
$
|
(1.1
|
)
|
$
|
0.1
|
|
$
|
1.1
|
|
$
|
0.1
|
|
$
|
11.3
|
|
|||||||
|
2017
|
12.8
|
|
1.6
|
|
(5.8
|
)
|
0.1
|
|
—
|
|
0.5
|
|
9.2
|
|
||||||||||||||
|
2016
|
13.8
|
|
(0.5
|
)
|
(2.3
|
)
|
0.3
|
|
1.4
|
|
0.1
|
|
12.8
|
|
||||||||||||||
|
Deferred Tax Asset
Valuation Allowance
|
Balance at
Beginning
of Year
|
Charges to
Profit and Loss
(A)
|
Write-offs
|
Recoveries
|
Other
(B)
|
Balance at
End of Year
|
||||||||||||||||||
|
2018
|
$
|
81.4
|
|
$
|
4.8
|
|
$
|
—
|
|
$
|
—
|
|
$
|
(2.8
|
)
|
$
|
83.4
|
|
||||||
|
2017
|
78.1
|
|
7.2
|
|
—
|
|
—
|
|
(3.9
|
)
|
81.4
|
|
||||||||||||
|
2016
|
70.6
|
|
3.4
|
|
—
|
|
—
|
|
4.1
|
|
78.1
|
|
||||||||||||
(A) For the years ended December 31, 2018, 2017 and 2016, the deferred tax asset valuation provision activity primarily relates to tax losses in foreign jurisdictions.
(B) For the years ended December 31, 2018, 2017 and 2016, activity primarily relates to Federal tax law changes and foreign currency translation.
Item 16. Form 10-K Summary
None.
109
SIGNATURES
Pursuant to the requirements of Section 13 or 15(d) of the Securities Exchange Act of 1934, the registrant has duly caused this report to be signed on its behalf by the undersigned, thereunto duly authorized.
|
|
BRUNSWICK CORPORATION
|
|
|
February 19, 2019
|
By:
|
/S/ DANIEL J. TANNER
|
|
|
|
Daniel J. Tanner
|
|
|
|
Vice President and Controller
|
Pursuant to the requirements of the Securities Exchange Act of 1934, this report has been signed below by the following persons on behalf of the registrant and in the capacities and on the date indicated.
|
February 19, 2019
|
By:
|
/S/ DAVID M. FOULKES
|
|
|
|
David M. Foulkes
|
|
|
|
Chief Executive Officer
|
|
(Principal Executive Officer)
|
||
|
February 19, 2019
|
By:
|
/S/ WILLIAM L. METZGER
|
|
|
|
William L. Metzger
|
|
|
|
Senior Vice President and Chief Financial Officer
|
|
(Principal Financial Officer)
|
||
|
February 19, 2019
|
By:
|
/S/ DANIEL J. TANNER
|
|
|
|
Daniel J. Tanner
|
|
|
|
Vice President and Controller
|
|
(Principal Accounting Officer)
|
||
This report has been signed by the following directors, constituting the remainder of the Board of Directors, by William L. Metzger, as Attorney-in-Fact.
|
Nolan D. Archibald
|
|
Nancy E. Cooper
|
|
David C. Everitt
|
|
Manuel A. Fernandez
|
|
Lauren Patricia Flaherty
|
|
David M. Foulkes
|
|
Joseph W. McClanathan
|
|
David V. Singer
|
|
Ralph C. Stayer
|
|
Jane L. Warner
|
|
J. Steven Whisler
|
|
Roger J. Wood
|
|
February 19, 2019
|
By:
|
/S/ WILLIAM L. METZGER
|
|
|
|
William L. Metzger
|
|
|
|
Attorney-in-Fact
|
110
TABLE OF CONTENTS
Part IItem 1. BusinessItem 1A. Risk FactorsItem 1B. Unresolved Staff CommentsItem 2. PropertiesItem 3. Legal ProceedingsItem 4. Mine Safety DisclosuresPart IIItem 5. Market For Registrant's Common Equity, Related Stockholder Matters and Issuer Purchases Of Equity SecuritiesItem 6. Selected Financial DataItem 7. Management's Discussion and Analysis Of Financial Condition and Results Of OperationsItem 7A. Quantitative and Qualitative Disclosures About Market RiskItem 8. Financial Statements and Supplementary DataItem 9. Changes in and Disagreements with Accountants on Accounting and Financial DisclosureItem 9A. Controls and ProceduresItem 9B. Other InformationPart IIIItem 10. Directors, Executive Officers and Corporate GovernanceItem 11. Executive CompensationItem 12. Security Ownership Of Certain Beneficial Owners and Management and Related Stockholder MattersItem 13. Certain Relationships and Related Transactions, and Director IndependenceItem 14. Principal Accounting Fees and ServicesPart IVItem 15. Exhibits and Financial Statement SchedulesNote 1 Significant Accounting PoliciesNote 2 Revenue RecognitionNote 3 Discontinued OperationsNote 4 Restructuring, Exit, Integration and Impairment ActivitiesNote 5 AcquisitionsNote 6 Earnings Per Common ShareNote 7 Segment InformationNote 8 Fair Value MeasurementsNote 9 Financing ReceivablesNote 10 InvestmentsNote 11 Financing Joint VentureNote 12 Goodwill and Other IntangiblesNote 13 Income TaxesNote 14 Commitments and ContingenciesNote 15 Financial InstrumentsNote 16 Accrued ExpensesNote 17 DebtNote 18 Postretirement BenefitsNote 19 Stock Plans and Management CompensationNote 20 Comprehensive Income (loss)Note 21 Treasury StockNote 22 LeasesNote 23 Quarterly Data (unaudited)Note 24 Subsequent EventsItem 16. Form 10-k Summary