Table of Contents
As filed with the Securities and Exchange Commission on April 25, 2014
UNITED STATES
SECURITIES AND EXCHANGE COMMISSION
Washington, D.C. 20549
FORM 20-F
ANNUAL REPORT PURSUANT TO SECTION 13 OR 15(d)
OF THE SECURITIES EXCHANGE ACT OF 1934
For the fiscal year ended December 31, 2013
Commission file number 001-15266
BANCO DE CHILE
(Exact name of Registrant as specified in its charter)
BANK OF CHILE
(Translation of Registrant’s name into English)
REPUBLIC OF CHILE
(Jurisdiction of incorporation or organization)
Banco de Chile
Paseo Ahumada 251
Santiago, Chile
(562) 2637-1111
(Address of principal executive offices)
Pedro Samhan E.
Banco de Chile
Paseo Ahumada 251
Santiago, Chile
Telephone: (562) 653-5150
Facsimile: (562) 653-5156
(Name, telephone, e-mail and/or facsimile number and address of company contact person)
Securities registered or to be registered pursuant to Section 12(b) of the Act:
|
Title of each class |
Name of each exchange on which registered |
|
| American Depositary Shares, each representing 600 shares of common stock, without nominal (par) value (“ADSs”) | New York Stock Exchange | |
| Shares of common stock, without nominal (par) value |
New York Stock Exchange (for listing purposes only) |
|
Securities registered or to be registered pursuant to Section 12(g) of the Act:
None
(Title of Class)
Securities for which there is a reporting obligation pursuant to Section 15(d) of the Act:
None
(Title of Class)
Indicate the number of outstanding shares of each of the issuer’s classes of capital or common stock as of the close of the period covered by the annual report:
Shares of common stock : 93,175,043,991
Indicate by check mark if the registrant is a well-known seasoned issuer , as defined in Rule 405 of the Securities Act. Yes x No ¨
If this report is an annual or transition report, indicate by check mark if the registrant is not required to file reports pursuant to Section 13 or 15(d) of the Securities Exchange Act of 1934. Yes ¨ No x
Indicate by check mark whether the registrant (1) has filed all reports required to be filed by Section 13 or 15(d) of the Securities Exchange Act of 1934 during the preceding 12 months (or for such shorter period that the registrant was required to file such reports), and (2) has been subject to such filing requirements for the past 90 days. Yes x No ¨
Indicate by check mark whether the registrant has submitted electronically and posted on its corporate Web site, if any, every Interactive Data File required to be submitted and posted pursuant to Rule 405 of Regulation S-T during the preceding 12 months (or for such shorter period that the registrant was required to submit and post such files). Yes ¨ No ¨
Indicate by check mark whether the registrant is a large accelerated filer, an accelerated filer, or a non-accelerated filer. See definition of “accelerated filer and large accelerated filer” in Rule 12b-2 of the Exchange Act. (Check one):
Large accelerated filer x Accelerated filer ¨ Non-accelerated filer ¨
Indicate by check mark which basis of accounting the registrant has used to prepare the financial statements included in this filing:
|
U.S. GAAP ¨ |
IFRS x | Other ¨ |
If “Other” has been checked in response to the previous question, indicate by check mark which financial statement item the registrant has elected to follow. ¨ Item 17 ¨ Item 18
If this is an annual report, indicate by check mark whether the registrant is a shell company (as defined in Rule 12b-2 of the Exchange Act). Yes ¨ No x
Table of Contents
| 1 | ||||||
|
Item 1 |
1 | |||||
|
Item 2 |
1 | |||||
|
Item 3 |
1 | |||||
|
Item 4 |
14 | |||||
|
Item 5 |
94 | |||||
|
Item 6 |
133 | |||||
|
Item 7 |
149 | |||||
|
Item 8 |
156 | |||||
|
Item 9 |
160 | |||||
|
Item 10 |
163 | |||||
|
Item 11 |
181 | |||||
|
Item 12 |
181 | |||||
|
Item 12A |
181 | |||||
|
Item 12B |
181 | |||||
|
Item 12C |
181 | |||||
|
Item 12D |
181 | |||||
| 183 | ||||||
|
Item 13 |
183 | |||||
|
Item 14 |
Material Modifications to the Rights of Security Holders and Use of Proceeds |
183 | ||||
|
Item 15 |
183 | |||||
|
Item 16A |
184 | |||||
|
Item 16B |
184 | |||||
|
Item 16C |
184 | |||||
|
Item 16D |
185 | |||||
i
Table of Contents
|
Item 16E |
Purchases of Equity Securities by the Issuer and Affiliated Purchasers |
185 | ||||
|
Item 16F |
185 | |||||
|
Item 16G |
185 | |||||
| 188 | ||||||
|
Item 17 |
188 | |||||
|
Item 18 |
188 | |||||
|
Item 19 |
188 | |||||
ii
Table of Contents
FORWARD-LOOKING STATEMENTS
This annual report on Form 20-F contains “forward-looking statements” within the meaning of Section 27A of the Securities Act of 1933, as amended (the “Securities Act”), Section 21E of the Securities Exchange Act of 1934, as amended (the “Exchange Act”), and the safe harbor provisions of the Private Securities Litigation Reform Act of 1995. Although we have based these forward-looking statements on our expectations and projections about future events, it is possible that actual results may differ materially from our expectations. In many cases, we include a discussion of the factors that are most likely to cause forward-looking statements to differ from actual results together with the forward-looking statements themselves. These statements appear throughout this annual report, including, without limitation, under “Item 4. Information on the Company” and “Item 5. Operating and Financial Review and Prospects.” Examples of such forward-looking statements include:
| • |
projections of operating revenues, net income (loss), net income (loss) per share, capital expenditures, dividends, capital structure or other financial items or ratios; |
| • |
statements of our plans, objectives or goals, including those related to anticipated trends, competition and regulation; |
| • |
statements about market risks, including interest rate risk and foreign exchange risk; |
| • |
statements about our future economic performance or that of Chile or other countries in which we operate; and |
| • |
statements of assumptions underlying such statements. |
Words such as “believe,” “anticipate,” “plan,” “aims,” “seeks,” “expect,” “intend,” “target,” “objective,” “estimate,” “project,” “potential,” “predict,” “forecast,” “guideline,” “could,” “may,” “will,” “should” and similar expressions are intended to identify forward-looking statements but are not the exclusive means of identifying such statements. These statements may relate to (i) our asset growth and financing plans, (ii) trends affecting our financial condition or results of operations and (iii) the impact of competition and regulations, but are not limited to such topics. Forward-looking statements are not guarantees of future performance and involve risks and uncertainties, and actual results may differ materially from those described in such forward-looking statements included in this annual report as a result of various factors (including, without limitation, the actions of competitors, future global economic conditions, market conditions, foreign exchange rates and operating and financial risks), many of which are beyond our control. The occurrence of any such factors not currently expected by us could significantly alter the results set forth in these statements.
Factors that could cause actual results to differ materially and adversely include, but are not limited to:
| • |
changes in general economic, business, political or other conditions in Chile, or changes in general economic or business conditions in Latin America, the United States, Europe or Asia; |
| • |
changes in capital markets in general that may affect policies or attitudes towards lending to Chile or Chilean companies; |
| • |
increased costs; |
| • |
increased competition and changes in competition or pricing environments, including the effect of new technological developments; |
| • |
unanticipated increases in financing and other costs or the inability to obtain additional debt or equity financing on attractive terms; |
| • |
natural disasters; |
| • |
the effect of tax laws on our business; and |
| • |
the factors discussed under “—Risk Factors.” |
You should not place undue reliance on forward-looking statements, which speak only as of the date that they were made. This cautionary statement should be considered in connection with any written or oral forward-looking statements that we may issue in the future. We do not undertake any obligation to publicly release any revisions to such forward-looking statements after the filing of this annual report to reflect later events or circumstances or to reflect the occurrence of unanticipated events.
iii
Table of Contents
THE MERGER
On January 1, 2008, Banco de Chile (the “Bank”) merged with Citibank Chile in a transaction in which Banco de Chile was the surviving corporate entity. As used in this annual report, unless the context otherwise requires, references to “Banco de Chile” relating to any date or period prior to January 1, 2008 (the effective date of the merger) are to Banco de Chile as it existed prior to the consummation of the merger, and such references relating to any date or period on or after January 1, 2008 are to Banco de Chile after the consummation of the merger.
PRESENTATION OF FINANCIAL INFORMATION
We prepare our audited consolidated financial statements in Chilean pesos and in accordance with International Financial Reporting Standards in effect from time to time as issued by the International Accounting Standards Board (“IFRS”). Unless otherwise specified, all financial information herein is in IFRS.
Until and including our consolidated financial statements included in our annual report on Form 20-F for the year ended December 31, 2008, we prepared our audited consolidated financial statements in accordance with generally accepted accounting principles in Chile as supplemented by the applicable rules of the Superintendencia de Bancos e Instituciones Financieras de Chile (the “SBIF”) (“Chilean GAAP”), with reconciliations to generally accepted accounting principles in the United States (“U.S. GAAP”). As required by IFRS 1— First Time Adoption of International Financial Reporting Standards , our financial position as of December 31, 2008 and our results of operations for the year ended December 31, 2008 were restated in accordance with IFRS 1 for comparative purposes. Reconciliations and a description of the transition to IFRS, and the effects on our assets, liabilities, equity, net income and cash flows are presented in Note 5 to our audited consolidated financial statements included in our annual report on Form 20-F for the year ended December 31, 2009 filed with the Securities and Exchange Commission (the “SEC”) on June 29, 2010. Unless otherwise indicated, the financial information included in this annual report with respect to 2009, 2010, 2011, 2012 and 2013 has been derived from financial statements that have been prepared in accordance with IFRS. See Note 2(a) to our audited consolidated financial statements as of and for the year ended December 31, 2013 appearing elsewhere in this annual report. IFRS differs in certain significant respects from Chilean GAAP. As a result, our financial information presented under IFRS is not directly comparable to any of our financial information presented under Chilean GAAP. Accordingly, readers should avoid such comparison.
Since adopting IFRS, we are no longer required to reconcile our financial statements to U.S. GAAP.
For comparison purposes and as a result of changes in certain accounting policies, some line items in our consolidated statement of income and balance sheet have been reclassified for the years ended December 31, 2011 and 2012. For more information, see “Item 5. Operating and Financial Review and Prospects—Critical Accounting Policies—New Standards Adopted in 2013”, as well as Notes 2(aj), 3 and 4 to our audited consolidated financial statements as of and for the year ended December 31, 2013 appearing elsewhere in this annual report.
In this annual report, references to “$,” “U.S.$,” “U.S. dollars” and “dollars” are to United States dollars, references to “pesos” or “Ch$” are to Chilean pesos (see Note 2(u) to our audited consolidated financial statements as of and for the year ended December 31, 2013 appearing elsewhere in this annual report), and references to “UF” are to “Unidades de Fomento.” The UF is an inflation indexed Chilean monetary unit of account with a value in Chilean pesos that is linked to and adjusted daily to reflect changes in the Consumer Price Index (“CPI”) of the Instituto Nacional de Estadísticas (the “Chilean National Statistics Institute”). As of December 31, 2013, one UF equaled Ch$23,309.56.
This annual report contains translations of certain Chilean peso amounts into U.S. dollars at specified rates solely for your convenience. These translations should not be construed as representations that the Chilean peso amounts actually represent such U.S. dollar amounts, were converted from U.S. dollars at the rate indicated in our audited consolidated financial statements as of and for the year ended December 31, 2013 or could be converted into U.S. dollars at the rate indicated. Until November 30, 2011, Banco de Chile applied the observed exchange rate reported by the Banco Central de Chile (the “Central Bank”) in order to translate its financial statements from Chilean pesos to U.S. dollars. However, beginning December 1, 2011, Banco de Chile adopted the exchange rate of accounting representation, or spot exchange rate, for such matters. This is also described in “Item 3. Key Information—Selected Financial Data—Exchange Rates.” Thus, unless otherwise indicated, the U.S. dollar amounts have been translated from Chilean pesos based on the exchange rate of accounting representation as of December 31, 2013 as determined by our Treasury and Money Market Operations segment, on a daily basis, based on the average of the daily closing bid and offer rates reported by Bloomberg for the Santiago Stock Exchange. The exchange rate of accounting representation on April 15, 2014 was Ch$549.66 = U.S. $1.00. As of the same date, the observed exchange rate was Ch$549.04 = U.S.$ 1.00.
iv
Table of Contents
The Federal Reserve Bank of New York does not report a noon buying rate for Chilean pesos.
Unless otherwise specified, all references in this annual report to total loans are to loans to customers before deducting allowances for loan losses, and they do not include loans to banks or contingent loans. In addition, all market share data and financial indicators for the Chilean banking system as compared to Banco de Chile’s financial information presented in this annual report are based on information published periodically by the SBIF which is published under Chilean GAAP and prepared on a consolidated basis.
In this annual report, “total past-due loans” are the loan installments that are 90 or more days overdue and the remaining outstanding balance of such loan (principal and interests) overdue. See “Item 4. Information on the Company—Selected Statistical Information—Classification of Loan Portfolio Based on the Borrower’s Payment Performance.”
According to Chilean regulations and for the purposes of this annual report, regulatory capital (“Regulatory Capital”) consists of:
| • |
basic capital, which is composed of our paid-in capital, reserves and retained earnings, excluding capital attributable to subsidiaries and foreign branches (“Basic Capital”); and |
| • |
supplementary capital, which is composed of the following: (i) our subordinated bonds, considered at issue price (reduced by 20% for each year during the period commencing six years prior to maturity), but not exceeding 50% of our Basic Capital; plus (ii) our voluntary allowances for loan losses (up to 1.25% of risk-weighted assets to the extent voluntary allowances exceed those that banks are required to maintain by law or regulation); minus (iii) our goodwill and unconsolidated investments in companies (“Supplementary Capital”). |
Certain figures included in this annual report and in our audited consolidated financial statements as of and for the year ended December 31, 2013 have been rounded for ease of presentation. Percentage figures included in this annual report have not in all cases been calculated on the basis of such rounded figures but on the basis of such amounts prior to rounding. For this reason, percentage amounts in this annual report may vary slightly from those obtained by performing the same calculations using the figures in our audited consolidated financial statements as of and for the year ended December 31, 2013. Certain other amounts that appear in this annual report may similarly not sum due to rounding.
Inflation figures are those reported by the Chilean National Statistics Institute, unless otherwise stated herein or required by the context.
MACRO-ECONOMIC AND MARKET DATA
In this annual report, all macro-economic data relating to the Chilean economy is based on information published by the Central Bank. All market share data, financial indicators and other data relating to the Chilean financial system are based on information published periodically by the SBIF, which is published under Chilean GAAP and prepared on a consolidated basis.
v
Table of Contents
| Item 1 | Identity of Directors, Senior Management and Advisors |
Not Applicable.
| Item 2 | Offer Statistics and Expected Timetable |
Not Applicable.
| Item 3 | Key Information |
SELECTED FINANCIAL DATA
The following tables present historical financial information about us as of the dates and for each of the periods indicated. The following tables should be read in conjunction with, and are qualified in their entirety by reference to, our audited consolidated financial statements as of and for the year ended December 31, 2013 appearing elsewhere in this annual report. The financial information for the years ended December 31, 2009, 2010, 2011, 2012 and 2013 is presented under IFRS.
Our audited consolidated financial statements have been prepared in accordance with IFRS for the years ended December 31, 2009, 2010, 2011, 2012 and 2013.
| For the Year Ended December 31, | ||||||||||||||||||||||||
| 2009 | 2010 | 2011 | 2012 | 2013 | 2013 | |||||||||||||||||||
| (in millions of Ch$, except share and per share data) |
(in thousands of
U.S.$) (1) |
|||||||||||||||||||||||
|
IFRS: |
||||||||||||||||||||||||
|
CONSOLIDATED STATEMENT OF INCOME DATA |
||||||||||||||||||||||||
|
Interest revenue |
Ch$ | 900,407 | Ch$ | 1,092,003 | Ch$ | 1,501,684 | Ch$ | 1,672,766 | Ch$ | 1,765,942 | U.S$ | 3,359,092 | ||||||||||||
|
Interest expense |
(222,883 | ) | (324,377 | ) | (624,209 | ) | (708,629 | ) | (704,371 | ) | (1,339,822 | ) | ||||||||||||
|
|
|
|
|
|
|
|
|
|
|
|
|
|||||||||||||
|
Net interest income |
677,524 | 767,626 | 877,475 | 964,137 | 1,061,571 | 2,019,270 | ||||||||||||||||||
|
Net fees and commissions income |
246,053 | 277,566 | 290,108 | 287,272 | 287,093 | 546,095 | ||||||||||||||||||
|
Net financial operating income |
(138,179 | ) | 17,163 | 58,101 | 16,199 | 32,672 | 62,147 | |||||||||||||||||
|
Foreign exchange transactions, net |
220,999 | 63,762 | (7,973 | ) | 35,136 | 71,457 | 135,922 | |||||||||||||||||
|
Other operating income |
22,190 | 23,584 | 24,735 | 20,887 | 25,884 | 49,235 | ||||||||||||||||||
|
Provisions for loan losses |
(241,345 | ) | (157,651 | ) | (146,925 | ) | (166,420 | ) | (221,653 | ) | (421,618 | ) | ||||||||||||
|
Total operating expenses |
(485,947 | ) | (529,969 | ) | (595,000 | ) | (612,934 | ) | (619,530 | ) | (1,178,440 | ) | ||||||||||||
|
Income attributable to associates |
840 | 1,609 | 3,054 | (468 | ) | 1,780 | 3,386 | |||||||||||||||||
|
|
|
|
|
|
|
|
|
|
|
|
|
|||||||||||||
|
Income before income taxes |
302,135 | 463,690 | 503,575 | 543,809 | 639,274 | 1,215,997 | ||||||||||||||||||
|
Income taxes |
(40,389 | ) | (46,425 | ) | (65,431 | ) | (63,928 | ) | (89,085 | ) | (169,453 | ) | ||||||||||||
|
|
|
|
|
|
|
|
|
|
|
|
|
|||||||||||||
|
Net income from continued operations, net of taxes |
261,746 | 417,265 | 438,144 | 479,881 | 550,189 | 1,046,544 | ||||||||||||||||||
|
Net income from discontinued operations, net of taxes |
||||||||||||||||||||||||
|
|
|
|
|
|
|
|
|
|
|
|
|
|||||||||||||
|
Net income for the year |
Ch$ | 261,746 | Ch$ | 417,265 | Ch$ | 438,144 | Ch$ | 479,881 | Ch$ | 550,189 | U.S.$ | 1,046,544 | ||||||||||||
|
Attributable to: |
||||||||||||||||||||||||
|
Equity holders of the parent |
261,744 | 417,264 | 438,143 | 479,880 | 550,188 | 1,046,542 | ||||||||||||||||||
|
Non-controlling interest |
2 | 1 | 1 | 1 | 1 | 2 | ||||||||||||||||||
|
Earnings per share (2) |
3.06 | 4.86 | 4.91 | 5.37 | 5.92 | 0.011 | ||||||||||||||||||
|
Earnings per ADS |
1,837.16 | 2,916.22 | 2,944.35 | 3,222.57 | 3,549.93 | 6.75 | ||||||||||||||||||
|
Dividends per share (3) |
2.72 | 3.50 | 3.38 | 3.41 | 3.90 | 0.007 | ||||||||||||||||||
|
Weighted average number of shares (in millions) |
85,484.08 | 85,850.51 | 89,285.13 | 89,347.56 | 92,991.45 | |||||||||||||||||||
(See footnotes below)
1
Table of Contents
| As of December 31, | ||||||||||||||||||||||||
| 2009 | 2010 | 2011 | 2012 | 2013 | 2013 | |||||||||||||||||||
| (in millions of Ch$, except share and per share data) |
(in thousands of
U.S.$) (1) |
|||||||||||||||||||||||
|
IFRS: |
||||||||||||||||||||||||
|
CONSOLIDATED STATEMENT OF FINANCIAL POSITION DATA |
||||||||||||||||||||||||
|
Cash and due from banks |
Ch$ | 727,553 | Ch$ | 772,329 | Ch$ | 881,146 | Ch$ | 684,925 | Ch$ | 873,308 | U.S.$ | 1,661,166 | ||||||||||||
|
Transactions in the course of collection |
526,051 | 429,756 | 373,639 | 310,077 | 300,026 | 570,695 | ||||||||||||||||||
|
Financial assets held-for-trading |
351,590 | 279,765 | 269,861 | 159,682 | 326,921 | 621,854 | ||||||||||||||||||
|
Cash collateral on securities borrowed and reverse repurchase agreements |
79,401 | 82,787 | 47,981 | 35,100 | 82,422 | 156,779 | ||||||||||||||||||
|
Derivative instruments |
565,986 | 488,354 | 381,055 | 326,083 | 374,687 | 712,712 | ||||||||||||||||||
|
Loans and advances to banks |
448,981 | 349,588 | 648,425 | 1,343,322 | 1,062,056 | 2,020,193 | ||||||||||||||||||
|
Loans to customers, net |
12,879,155 | 14,029,968 | 17,023,756 | 18,383,958 | 20,441,472 | 38,882,812 | ||||||||||||||||||
|
Financial assets available-for-sale |
1,267,774 | 1,157,105 | 1,471,120 | 1,272,316 | 1,681,883 | 3,199,199 | ||||||||||||||||||
|
Investments in other companies |
10,494 | 11,072 | 13,196 | 11,674 | 14,407 | 27,404 | ||||||||||||||||||
|
Intangible assets |
88,182 | 88,463 | 81,026 | 75,610 | 72,223 | 137,379 | ||||||||||||||||||
|
Property and equipment |
205,847 | 204,352 | 207,888 | 205,189 | 197,578 | 375,824 | ||||||||||||||||||
|
Investment properties |
17,840 | 17,459 | 17,079 | 16,698 | 16,317 | 31,037 | ||||||||||||||||||
|
Current tax assets |
— | 3,363 | — | — | — | — | ||||||||||||||||||
|
Deferred tax assets, net |
49,733 | 57,678 | 60,025 | 55,801 | 56,421 | 107,321 | ||||||||||||||||||
|
Other assets |
282,872 | 304,425 | 279,804 | 317,765 | 373,987 | 711,381 | ||||||||||||||||||
|
|
|
|
|
|
|
|
|
|
|
|
|
|||||||||||||
|
Total assets |
Ch$ | 17,501,459 | Ch$ | 18,276,464 | Ch$ | 21,756,001 | Ch$ | 23,198,200 | Ch$ | 25,873,708 | U.S.$ | 49,215,756 | ||||||||||||
|
|
|
|
|
|
|
|
|
|
|
|
|
|||||||||||||
|
Current accounts and other demand deposits |
3,718,076 | 4,446,181 | 4,895,426 | 5,470,971 | 5,984,332 | 11,383,116 | ||||||||||||||||||
|
Transactions in the course of payment |
325,056 | 208,750 | 155,424 | 72,684 | 51,898 | 98,718 | ||||||||||||||||||
|
Cash collateral on securities lent and repurchase agreements |
308,028 | 81,755 | 223,202 | 226,396 | 256,766 | 488,408 | ||||||||||||||||||
|
Saving accounts and time deposits |
7,427,481 | 7,697,968 | 9,282,324 | 9,612,950 | 10,402,725 | 19,787,577 | ||||||||||||||||||
|
Derivative instruments |
538,240 | 528,445 | 429,913 | 380,322 | 426,110 | 810,527 | ||||||||||||||||||
|
Borrowings from financial institutions |
1,368,226 | 1,281,372 | 1,690,939 | 1,108,681 | 989,465 | 1,882,114 | ||||||||||||||||||
|
Debt issued |
1,587,998 | 1,764,165 | 2,388,341 | 3,273,933 | 4,366,960 | 8,306,627 | ||||||||||||||||||
|
Other financial obligations |
176,150 | 179,160 | 184,785 | 162,123 | 210,926 | 401,214 | ||||||||||||||||||
|
Currents tax liabilities |
39,018 | — | 3,095 | 23,189 | 7,131 | 13,564 | ||||||||||||||||||
|
Deferred tax liabilities, net |
— | — | — | — | — | — | ||||||||||||||||||
|
Provisions |
88,607 | 114,685 | 131,344 | 141,839 | 154,650 | 294,168 | ||||||||||||||||||
|
Employee benefits |
43,202 | 55,433 | 60,634 | 64,545 | 67,944 | 129,240 | ||||||||||||||||||
|
Other liabilities |
280,392 | 224,225 | 269,905 | 305,105 | 275,762 | 524,539 | ||||||||||||||||||
|
|
|
|
|
|
|
|
|
|
|
|
|
|||||||||||||
|
Total liabilities |
Ch$ | 15,900,474 | Ch$ | 16,582,139 | Ch$ | 19,715,332 | Ch$ | 20,842,738 | Ch$ | 23,194,669 | U.S.$ | 44,119,812 | ||||||||||||
|
|
|
|
|
|
|
|
|
|
|
|
|
|||||||||||||
|
Total equity |
1,600,985 | 1,694,325 | 2,040,669 | 2,355,462 | 2,679,039 | 5,095,944 | ||||||||||||||||||
|
|
|
|
|
|
|
|
|
|
|
|
|
|||||||||||||
|
Total liabilities and equity |
Ch$ | 17,501,459 | Ch$ | 18,276,464 | Ch$ | 21,756,001 | Ch$ | 23,198,200 | Ch$ | 25,873,708 | U.S.$ | 49,215,756 | ||||||||||||
|
|
|
|
|
|
|
|
|
|
|
|
|
|||||||||||||
(See footnotes below)
2
Table of Contents
| As of December 31, | ||||||||||||||||||||
| 2009 | 2010 | 2011 | 2012 | 2013 | ||||||||||||||||
|
IFRS: |
||||||||||||||||||||
|
CONSOLIDATED RATIOS |
||||||||||||||||||||
|
Profitability and Performance |
||||||||||||||||||||
|
Net interest margin (4) |
4.48 | % | 4.87 | % | 4.80 | % | 4.68 | % | 4.67 | % | ||||||||||
|
Return on average total assets (5) |
1.51 | 2.37 | 2.16 | 2.14 | 2.25 | |||||||||||||||
|
Return on average equity (6) |
16.85 | 24.98 | 22.61 | 21.71 | 20.67 | |||||||||||||||
|
Capital |
||||||||||||||||||||
|
Average equity as a percentage of average total assets |
8.99 | 9.50 | 9.53 | 9.85 | 10.90 | |||||||||||||||
|
Bank regulatory capital as a percentage of minimum regulatory capital |
234.93 | 232.92 | 245.53 | 269.50 | 274.26 | |||||||||||||||
|
Ratio of liabilities to regulatory capital (7) |
11.87 | 12.98 | 12.30 | 11.11 | 10.90 | |||||||||||||||
|
Credit Quality |
||||||||||||||||||||
|
Substandard loans as a percentage of total loans (8) |
5.81 | 5.46 | 2.87 | 3.31 | 3.48 | |||||||||||||||
|
Allowances for loan losses as a percentage of substandard loans (8) |
40.71 | 44.33 | 72.58 | 62.42 | 60.52 | |||||||||||||||
|
Provision for loan losses as a percentage of average loans |
1.89 | 1.16 | 0.92 | 0.92 | 1.12 | |||||||||||||||
|
Allowances for loan losses as a percentage of total loans |
2.37 | 2.42 | 2.09 | 2.07 | 2.10 | |||||||||||||||
|
Operating Ratios |
||||||||||||||||||||
|
Operating expenses/operating revenue |
47.24 | 46.10 | 47.89 | 46.31 | 41.90 | |||||||||||||||
|
Operating expenses/average total assets |
2.81 | % | 3.01 | % | 2.93 | % | 2.73 | % | 2.54 | % | ||||||||||
| (1) | Translations of Chilean peso amounts into U.S. dollars are based on the exchange rate of accounting representation, or the spot exchange rate, which is determined on a daily basis by our Treasury, based on the average of the daily closing bid and offer rates reported by Bloomberg for the Santiago Stock Exchange. Thus, amounts stated in U.S. dollars as of and for the fiscal year ended December 31, 2013 have been translated from Chilean pesos based on the spot exchange rate of Ch$525.72 to U.S.$1.00 as of December 31, 2013. |
| (2) | Earnings per share data have been calculated by dividing net income by the weighted average number of shares outstanding during the year. |
| (3) | Dividends per share data are calculated by dividing the amount of the dividend paid during each year by the previous year’s number of shares outstanding. |
| (4) | Annualized net interest income divided by average interest earning assets. The average balances for interest earning assets, including interest and readjustments, have been calculated on the basis of our daily balances and on the basis of monthly balances for our subsidiaries. Net interest margin does not include the interest earned on trading securities, which is accounted for under Other Income (Loss), Net. |
| (5) | Annualized net income (loss) divided by average total assets. The average balances for total assets have been calculated on the basis of our daily balances and on the basis of monthly balances for our subsidiaries. |
| (6) | Annualized net income (loss) divided by average equity. The average balances for equity have been calculated on the basis of our daily balances. |
| (7) | Total liabilities divided by bank regulatory capital. |
| (8) | See “Item 4. Information on the Company—Selected Statistical Information—Analysis of Substandard Loans and Total Past Due.” |
3
Table of Contents
Exchange Rates
As a general matter, prior to 1989, Chilean law permitted the purchase and sale of foreign currency only in those cases explicitly authorized by the Central Bank. The Ley Orgánica Constitucional del Banco Central de Chile 18,840 (the “Central Bank Act”) liberalized the rules governing the purchase and sale of foreign currency. The Central Bank Act empowers the Central Bank to determine that certain purchases and sales of foreign currency specified by law must be carried out in the Mercado Cambiario Formal (the “Formal Exchange Market”). The Formal Exchange Market is composed of banks and other entities so authorized by the Central Bank. The observed exchange rate for any given day equals the average exchange rate of the transactions conducted in the Formal Exchange Market on the immediately preceding banking day, as certified by the Central Bank. Even though the Central Bank is authorized to carry out its transactions at the rates it sets, it generally uses the spot rate for its transactions. Authorized transactions by other banks are generally carried out at the spot rate.
Purchases and sales of foreign exchange are not required to be conducted in the Formal Exchange Market and therefore may be carried out in the Mercado Cambiario Informal (the “Informal Exchange Market”). There are no price limits imposed on transactions executed in the Informal Exchange Market. On December 30, 2013 (the last trading date of the year), the average exchange rate in the Informal Exchange Market was Ch$526.20 per U.S.$1.00, or 0.5% higher than the observed exchange rate of Ch$523.76 per U.S.$1.00 reported by the Central Bank on the same date.
The following table sets forth the annual low, high, average and period-end observed exchange rate for U.S. dollars for each year beginning in 2009, and the last six complete months, as reported by the Central Bank:
| Daily Observed Exchange Rate Ch$ per U.S.$(1) | ||||||||||||||||
|
Year |
Low (2) | High (2) | Average (3) | Period End (4) | ||||||||||||
| (in Ch$) | ||||||||||||||||
|
2009 |
491.09 | 643.87 | 559.61 | 506.43 | ||||||||||||
|
2010 |
468.37 | 549.17 | 510.25 | 468.37 | ||||||||||||
|
2011 |
455.91 | 533.74 | 483.67 | 521.46 | ||||||||||||
|
2012 |
469.65 | 519.69 | 486.49 | 478.60 | ||||||||||||
|
2013 |
466.50 | 533.95 | 495.35 | 523.76 | ||||||||||||
|
October 2013 |
493.36 | 508.58 | 500.81 | 508.58 | ||||||||||||
|
November 2013 |
507.64 | 528.19 | 519.25 | 528.19 | ||||||||||||
|
December 2013 |
523.76 | 533.95 | 529.45 | 523.76 | ||||||||||||
|
2014 (through April 15) |
524.61 | 573.24 | 551.48 | 549.04 | ||||||||||||
|
January 2014 |
524.61 | 550.53 | 537.03 | 547.22 | ||||||||||||
|
February 2014 |
546.94 | 563.32 | 554.41 | 563.32 | ||||||||||||
|
March 2014 |
550.53 | 573.24 | 563.84 | 550.53 | ||||||||||||
|
April 2014 (through April 15) |
544.96 | 555.97 | 550.65 | 549.04 | ||||||||||||
Source: Central Bank.
| (1) | Figures are expressed in nominal terms. |
| (2) | Exchange rates are the actual low and high, on a day-by-day basis for each period. |
| (3) | For full years, the average of monthly average rates during the year. For full months, the daily average during the month. |
| (4) | As reported by the Central Bank on the first business day of the following period. |
The observed exchange rate on April 15, 2014 was Ch$549.04 = U.S.$1.00. The Federal Reserve Bank of New York does not report a noon buying rate for Chilean pesos.
Until November 30, 2011, Banco de Chile applied the observed exchange rate as reported by the Central Bank in order to translate its financial statements from Chilean pesos to U.S. dollars. However, beginning December 1, 2011, Banco de Chile adopted the exchange rate of accounting representation, or spot exchange rate, for such matters. The exchange rate of accounting representation is determined on a daily basis by our Treasury based on the average of the daily closing bid and offer rates reported by Bloomberg for the Santiago Stock Exchange.
4
Table of Contents
RISK FACTORS
The risks and uncertainties described below are not the only ones that we face. Additional risks and uncertainties that we do not know about or that we currently think are immaterial may also impair our business operations. Any of the following risks, if they actually occur, could materially and adversely affect our business, results of operations, prospects and financial condition.
We are also subject to market risks that are presented both in this subsection and in Note 42 to our audited consolidated financial statements as of and for the year ended December 31, 2013 appearing elsewhere in this annual report.
Risks Relating to our Operations and the Chilean Banking Industry
The growth of our loan portfolio may expose us to increased loan losses.
During the last five years, our total loan portfolio has grown at a compounded average growth rate of 8.8%. The expansion in our loan portfolio has been primarily fostered by the expansion in residential mortgage and consumer loans, and, to a lesser extent, due to the growth posted in commercial loans. The enlargement of our loan portfolio is in line with our strategic priorities, although we recognize our focus on the retail banking segment may expose us to higher levels of loan losses and may require us to establish higher levels of allowances for loan losses. For the year ended December 31, 2013, our loan portfolio amounted to Ch$20,880,770 million, which represents an 11.2% annual increase as compared to the Ch$18,771,761 million that we recorded as of December 31, 2012. Similarly, our allowances for loans losses increased 13.3% from Ch$387,803 million in 2012 to Ch$439,298 million in 2013. As a result, our ratio of allowances for loan losses to total loans slightly increased over that period, from 2.07% in 2012 to 2.10% in 2013.
Our loan portfolio may not continue to grow at the same or similar rate.
We cannot assure you that our loan portfolio will continue to grow at the same rates as it has in the past. The Chilean financial industry’s aggregate loan portfolio has grown significantly over the last five years, which has been fostered by a general effort of its participants to broaden their value offerings and increase banking penetration of lower and middle income segments, as well as small and medium-sized companies. These efforts have been also supported by the robustness and growth of the Chilean economy over the last decade. However, a slowdown or negative GDP growth rates, as well as a change in the behavior of banking customers, could adversely affect the growth rate of our loan portfolio and our credit quality indicators and, accordingly, lead us to increase our requirements of allowances for loan losses. For more information, see “Item 4. Information on the Company—Regulation and Supervision” and “Item 4. Information on the Company—Selected Statistical Information.”
Restrictions imposed by banking regulations may restrict our operations and thereby adversely affect our financial condition and results of operations.
We are subject to regulation by the SBIF. In addition, we are subject to regulation by the Central Bank with respect to certain matters, including interest rates and foreign exchange transactions. See “Item 4. Information on the Company—Regulation and Supervision.”
Pursuant to the Ley General de Bancos (the “General Banking Law”) all Chilean banks may, subject to the approval of the SBIF, engage in certain non-banking businesses approved by the law. The SBIF’s approval will depend on the risk of the activity and the strength of the bank. Further, the General Banking Law applies to the Chilean banking system a modified version of the capital adequacy guidelines issued by the Basel Committee on Banking Regulation and Supervisory Practices (the “Basel Committee”) and limits the discretion of the SBIF to deny new banking licenses.
In addition, in recent years the Chilean government has focused on consumer protection matters. Accordingly, between 2010 and 2013, a number of legal and administrative regulations have been enacted, amended and revoked in order to reinforce consumer protection in all relevant aspects of the financial relationship between consumers and financial institutions. We cannot assure that there will not be new regulations and restrictions on this matter. See “Item 4. Information on the Company—Regulation and Supervision.”
5
Table of Contents
There can be no assurance that regulators will not impose more restrictive limitations in the future on the activities of banks, including us, than those that are currently in effect. Any such change could have a material adverse effect on our results of operations or financial condition in a fashion that we cannot determine in advance.
Regarding Basel III, it is important to note that the SBIF has suggested that these guidelines may be implemented in Chile in the future, which could impose new requirements for all Chilean banks, including us. Similarly, the Chilean Central Bank has announced that it is working on developing new liquidity standards for local banks. Since neither the SBIF nor the Central Bank has provided any indication as to when and how these guidelines will be implemented or even presented to the market, we do not expect they will affect our profitability or results of operations in 2014. Nevertheless, we cannot assure you that these guidelines will not affect our financial performance in the future, if adopted.
As for credit risk provisioning matters, on December 18, 2013 the SBIF published for comments a set of amendments to the regulations on allowances for loan losses and credit risk matters. These amendments propose a standard model for calculating allowances for loan losses associated with residential mortgage loans only, although the SBIF announced that an approach will be proposed for consumer and commercial loans in the future. As for residential mortgage loans, the amendments are intended to introduce a standard model for determining allowances for loan losses that includes past-due behavior and loan-to-value ratios. Similarly, the proposed amendments establish specific guidelines regarding the treatment of collateral when calculating provisions for loan losses and provisioning factoring loans. In addition, on February 13, 2014 the SBIF published for comments a new regulation that aims to establish minimum requirements to be met by any bank in order to use internal models for calculating allowances for loan losses. These requirements have to do with both banks (capital adequacy, management qualification, and satisfactory evaluation by the SBIF) and their credit risk management system (ad hoc organizational structure, quality assurance, etc.). Even though this proposal is at an initial stage of analysis, we cannot assure you that it will not materially affect our results of operations or financial condition in the future, if adopted.
Increased competition and industry consolidation may adversely affect our operations.
The Chilean market for financial services is highly competitive. We compete with other Chilean and foreign banks, with Banco del Estado de Chile, which is government-owned, and with large department stores that grant consumer loans to a large portion of the Chilean population, especially in the low and middle-income segments. In addition, the retail market (which encompasses individuals and small and medium-sized companies) has become the target market of several banks. Accordingly, competition within this market is increasing as banks are continuously incorporating new and tailored products, while they strive to improve service quality. As a result, net interest margins (after provisions for loan losses) in these sub-segments are likely to decline over time.
We also face competition from non-bank competitors in some of our credit products, especially credit cards and consumer loans. In these markets, competition from non-banking companies like large department stores, private compensation funds, and saving and credit cooperatives has become increasingly significant. In addition, we face competition from other types of competitors, such as leasing, factoring and automobile financing companies (especially in credit products), as well as mutual funds, pension funds and insurance companies within the market for savings products and mortgage loans. Currently, banks continue to be the main suppliers of leasing, factoring and mutual funds, and the insurance sales business is experiencing fast growth. However, we cannot assure you that this trend will continue in the future. See “Item 4. Information on the Company—Business Overview—Competition.”
In the past, increasing competition within the Chilean banking industry has been accompanied by a consolidation wave. We expect that both of these trends will continue and result in the creation of larger and stronger financial groups offering a wide range of products and services and targeting most of the segments in the Chilean banking market. These trends may adversely affect us because they may increase the interest rates we pay to attract depositors and decrease the interest rates we charge our customers for loans, resulting in a decrease of the net interest margins we are able to generate.
6
Table of Contents
Our exposure to certain segments of the retail market could lead to higher levels of total past-due loans and subsequent charge-offs.
Although we historically focused on banking for the wholesale market and high-income individuals, an increasing portion of our retail banking segment consists of small and medium-sized companies (approximately 7.7% of our total loan book as of December 31, 2013, including companies with annual sales of up to Ch$1,600 million) and, to a lesser extent, of lower-income individuals (approximately 3.8% of our total loan book as of December 31, 2013, including individuals with monthly incomes ranging from Ch$170,000 to Ch$500,000). Our strategy aims to increase lending and banking penetration by providing multiple value propositions to attract additional retail customers. These customers are likely to be more severely affected by adverse developments in the Chilean economy than large corporations and high-income individuals. Consequently, in the future we may be exposed to higher levels of total past-due loans and subsequent write-offs, which could result in materially higher allowances for loan losses and adversely affect our results of operations.
As of December 31, 2013 our total past-due loans (loans overdue 90 days or more) reached Ch$236,730 million, which represented a 30.2% annual increase as compared to the figure recorded in 2012. Also, as of December 31, 2013 our total past-due loans were composed of 79.1% of retail banking past-due loans (consumer and residential mortgage loans to individuals, as well as commercial loans to small and medium sized companies) and 20.9% of wholesale banking past-due loans (commercial loans to large companies and corporations). During the prior fiscal year, our past-due portfolio encompassed 77.3% of retail banking past-due loans and 22.7% wholesale banking past-due credits.
The annual increase in the amount of past-due loans had mainly to do with greater balances of past-due loans associated with SMEs and, to a lesser extent individual banking. This trend of higher delinquency was in line with an economic cycle that showed some signs of slowdown in 2013, after three years of sustained growth, with annual GPD expansion rates above 5.0%. Even though we have tightened the whole credit process, from assessment to collection, we cannot assure you this trend will not continue if global or local economic conditions deteriorate in the future.
For more information, see “Item 4. Information on the Company—Business Overview—Principal Business Activities.”
One of our affiliates may be obligated to sell shares of our stock in the public market if we do not pay sufficient dividends.
As of December 31, 2013, Sociedad Administradora de la Obligación Subordinada S.A . (“SAOS”), our affiliate, held 30.69% of our shares as a consequence of our 1996 reorganization. This reorganization was due in part to the 1989 repurchase by the Central Bank of certain non-performing loans that we had previously sold to the Central Bank and later exchanged for subordinated debt without a fixed term. For more information, see “Item 4. Information on the Company—History and Development of the Bank—History—The 1982-1983 Economic Crisis and the Central Bank Subordinated Debt.”
In exchange for assuming the Central Bank debt, SAOS received from SM-Chile S.A. (“SM-Chile”), the holding company that controls us and SAOS, a stake of 63.6% of our shares as collateral for this debt. Dividends received from us are the sole source of SAOS’s revenues, which—in turn—must be used to repay this debt. To the extent distributed dividends are not sufficient to pay the amount due on this debt, SAOS is permitted to maintain a cumulative deficit balance with the Central Bank that SAOS commits to pay with future dividends. If this cumulative deficit balance exceeds 20% of our paid-in capital and reserves, the Central Bank may require SAOS to sell a sufficient number of our shares to pay the entire amount of the accumulated deficit. As of March 31, 2014, SAOS maintained a surplus with the Central Bank of Ch$373,556 million, equivalent to a 16.9% of our paid-in capital and reserves as of the same date.
7
Table of Contents
Furthermore, if our shareholders decide to retain and capitalize all or part of our annual net income in order to finance our future growth and to distribute stock dividends, the Central Bank may require us to pay in cash to SAOS the portion of net income corresponding to its stake in our shares. If we distribute stock dividends and the Central Bank does not require us to pay that portion in cash, the shares received by SAOS must be sold by SAOS within the following 12 months. SM-Chile shareholders will have a right of first refusal with respect to that sale.
If SAOS is required to sell shares of our stock for any of the aforementioned circumstances in the public market, that sale could adversely affect the prevailing market price of our stock.
The results of our operations are affected by inflation and interest rate volatility.
The results of our operations depend to a great extent on our net interest income, which represented 71.8% of our total operating revenues in 2013. Changes in inflation and nominal interest rates could affect the interest rates earned on our interest-earning assets differently from the interest rates paid on our interest-bearing liabilities, resulting in a reduction in our net income. Inflation and interest rates are highly sensitive to several factors beyond our control, including the Central Bank’s monetary policy, deregulation of the Chilean financial sector, domestic and international economic and political conditions, among other factors. Any volatility in interest rates could have a material adverse effect on our financial condition and results of operations.
The average annual short-term nominal interest rate in Chile for 90 to 360 day deposits received by Chilean financial institutions was 5.61% in 2011, 5.90% in 2012 and 5.20% in 2013. The average long-term nominal interest rate based on the interest rate of the Central Bank’s five-year bonds was 5.67% in 2011, 5.26% in 2012 and 5.14% in 2013.
Inflation in Chile has been moderate in recent years, especially in comparison with periods of high inflation in the 1980s and 1990s. High levels of inflation in Chile could adversely affect the Chilean economy, the consumers’ purchase power and, indirectly, our results of operations. The annual rate of inflation (as measured by annual changes in the CPI and as reported by the Chilean National Institute of Statistics) during the last five years and the first three months of 2014 was:
|
Year |
Inflation
(CPI Variation) |
|||
|
2008 |
7.1 | % | ||
|
2009 |
(1.4 | ) | ||
|
2010 |
3.0 | |||
|
2011 |
4.4 | |||
|
2012 |
1.5 | |||
|
2013 |
3.0 | |||
|
2014 (through March 31) |
1.5 | % | ||
Source: Chilean National Institute of Statistics
Although we benefit from a higher than expected inflation rate in Chile due to the structure of our assets and liabilities (we have a significant net asset position indexed to the inflation rate), significant changes in inflation with respect to current levels could adversely affect our results of operations and, therefore, the value of both our shares and ADSs.
For more information, see “Item 5. Operating and Financial Review and Prospects—Operating Results—Overview—Inflation” and “Item 5. Operating and Financial Review and Prospects—Operating Results—Overview—Interest Rates.”
Operational problems or errors can have a material adverse impact on our business, financial condition and results of operations.
As all large financial institutions, we are exposed to many operational risks, including the risk of fraud by employees and outsiders, failure to obtain proper internal authorizations, failure to properly document transactions, equipment failures, errors made by employees and natural disasters, such as earthquakes or tsunamis. Although we maintain a system of operational controls composed of world-class human and technological resources, as well as comprehensive contingency plans, there can be no assurance that operational problems or errors will not occur and that their occurrence will not have a material adverse impact on us.
8
Table of Contents
Cybersecurity events could negatively affect our reputation or results of operations and may result in litigation.
We have access to large amounts of confidential financial information and control substantial financial assets belonging to our customers as well as to us. In addition, we provide our customers with continuous remote access to their accounts and the possibility of transferring substantial financial assets by electronic means. Accordingly, cybersecurity is a material risk for us.
We depend on a variety of internet-based data processing, communication, and information exchange platforms and networks. Thus, we cannot assure you that all of our systems are entirely free from vulnerability. Additionally, we enter into contracts with several third-parties to provide the business, data and communication services we offer to our customers. If information security is breached, or if one of our employees breaches compliance procedures, information could be lost or misappropriated, which may affect our results of operations, damage others or result in potential litigation. Cybersecurity incidents, such as computer break-ins, phishing, identity theft and other disruptions could negatively affect the security of information stored in and transmitted through our computer systems and network infrastructure, which may result in significant liability to us in excess of insurance coverage, and may cause existing and potential customers to refrain from doing business with us. Although we, with the help of service providers, intend to continuously implement security technology devices and establish operational procedures to prevent such damage, we cannot assure you that these security measures will be successful.
Exposure to European sovereign debt or related instruments and future turmoil and destabilization related thereto could negatively affect our business.
Although emerging markets were less impacted by the global financial crisis of 2008 and showed a quick recovery, concerns about the possibility of a recession in developed countries cannot be ruled out yet, especially due to the fiscal condition of certain European economies (such as Greece, Italy, Ireland, Portugal and Spain, also called PIIGS economies). Debt levels and fiscal unreliability of these countries have resulted in uncertainty regarding the outlook for the global economy and a potential contagion to other economies linked to these countries. Although developed countries are gradually overcoming the troubles associated with the financial turmoil of 2008 and the subsequent instability of PIIGS countries, we cannot dismiss concerns regarding future volatility.
Likewise, we are unable to determine and predict the effects that this situation could have on the GDP growth of Chile’s main commercial partners and the entire world. Also, these factors could translate into a slowdown in the local economy that could affect the decision making processes of individuals and companies regarding consumption and investment. All of these factors could adversely affect the demand for credits in the Chilean Banking industry. We cannot assure you that these developments will not occur or that they will not affect our results of operations or financial condition.
As of December 31, 2013 we had a total exposure to PIIGS economies of Ch$18,751 million (U.S.$35.7 million), which represents 0.07% of our total assets as of the same date. This exposure was concentrated in only two economies, Italy and Spain, and it was related to contingent credits, such as standby letter of credits in favor of us as well as third parties. As of the same date, we had no additional exposure to PIIGS countries, in any type of instrument, such as financial assets available-for-sale, assets held for trading, derivatives, commercial loans, credit lines, confirming export letters of credits, etc.
9
Table of Contents
Risks Relating to our ADSs
Our principal shareholders may have interests that differ from those of our other shareholders and their significant share ownership may have an adverse effect on the future market price of our ADSs and shares.
As of April 15, 2014, LQ Inversiones Financieras S.A. (“LQIF”), a holding company beneficially owned by Quiñenco S.A. and Citigroup Chile S.A., holds directly and indirectly approximately 51.22% of the voting rights of our shares. These principal shareholders are in a position to elect a majority of the members of our board of directors, direct our management and control all matters decided by a shareholder vote, including the approval of fundamental corporate transactions.
Actions by our principal shareholders with respect to the disposition of the shares or ADSs they beneficially own, or the perception that such actions may occur, may adversely affect the trading price of our shares on the various stock exchanges on which they are listed and, consequently, the market price of the ADSs.
There may be a lack of liquidity and a limited market for our shares and ADSs.
While our ADSs have been listed on the New York Stock Exchange (the “NYSE”) since the first quarter of 2002, there can be no assurance that an active trading market for our ADSs will be sustained. During 2013, a daily average of 16,121 of our American Depositary Receipts (“ADRs”) were traded on the NYSE, according to data provided by Bloomberg. Although our shares are traded on the Santiago Stock Exchange, the Valparaiso Stock Exchange and the Chilean Electronic Stock Exchange, the market for our shares in Chile is small and somewhat illiquid. As of April 15, 2014 approximately 24.80% of our outstanding shares were held by shareholders other than our principal shareholders, including LQIF, SM-Chile, SAOS and Ergas Group.
If an ADS holder withdraws the underlying shares from the ADR facility, the small size of the market, its limited liquidity, as well as our concentrated ownership, may impair the ability of the ADS holder to sell the shares in the Chilean market in the amount and at the price and time such holder desires, and could increase the volatility of the price of our ADSs.
You may be unable to exercise preemptive rights.
The Ley Sobre Sociedades Anónimas No. 18,046 (the “Chilean Corporations Law”) and the Reglamento de Sociedades Anónimas (the “Chilean Corporations Regulations”) require that whenever we issue new common stock for cash, we grant preemptive rights to all of our shareholders (including holders of ADSs) to purchase a sufficient number of shares to maintain their existing ownership percentage. Such an offering would not be possible unless a registration statement under the Securities Act were effective with respect to such rights and common stock or an exemption from the registration requirements thereunder were available.
We may elect not to make a registration statement available with respect to the preemptive rights and the common stock, in which case you may not be able to exercise your preemptive rights. If a registration statement is not filed, the depositary will sell such holders’ preemptive rights and distribute the proceeds thereof if a premium can be recognized over the cost of any such sale.
Developments in international financial markets may adversely affect the market price of the ADSs and shares.
The market price of our ADSs and shares may be adversely affected by volatility in international financial markets and adverse global economic conditions. The market for Chilean securities and the Chilean economy as a whole are, to diverse extents, influenced by economic and market conditions in the United States, Europe and certain emerging market countries, especially Asian countries, and also economic as well as political developments in Latin American countries. Although economic conditions are different in each country, investors’ reactions to specific issues in one country can affect the financial markets in others, including Chile. Therefore, unfavorable developments in other countries—especially in developed economies and Chile’s main commercial partners—may adversely affect the market price of our ADSs and shares.
10
Table of Contents
In particular, since August 2007, there has been significant volatility in worldwide financial markets due to consequences from the announcement, by several U.S. banks and financial institutions, of significant write-downs related to their exposure to mortgage-backed securities and other financial instruments. This situation, also known as the subprime crisis, translated into several and significant government bail-outs for important banks worldwide, bankruptcy for some others and an active M&A market in the financial industry intended to maintain the confidence of investors and customers, as well as avoiding bank runs. Although the Chilean economy was not directly exposed to the U.S. housing credit market and —historically— we have not directly held any assets related to such financial instruments, the subprime crisis impacted the Chilean economy by the end of 2008, including banking activity. Currently, the U.S. economy seems to be overcoming the effects of the subprime crisis, as evidenced by recovering mid-term growth rates, employment and consumption, while the Federal Reserve is tapering the expansionary monetary policy it has used for the past several years. However, we cannot assure you that these past developments will not repeat in the future or that any future developments in international markets could not affect us, including our results of operations and consequently the market price of our ADSs and shares.
Financial deterioration in certain European countries was another indirect effect of the subprime crisis that occurred in the United States. Although our exposure to European sovereign debt is not significant, we cannot assure you that volatility in global financial markets due to the uncertainty regarding the Eurozone fiscal condition will not continue and affect the Chilean economy and consequently our financial condition and results of operations. Accordingly, the price of our ADS could be adversely affected by a new financial turmoil in the Eurozone, political issues, a slower than expected recovery, or a deterioration in healthier economies, such as Germany, that could translate into increasing volatility and uncertainty all over the world.
In the past, Chile has imposed controls on foreign investment and repatriation of investments that affected investments in, and earnings from, our ADSs.
Equity investments held in Chile by non-Chilean residents have historically been subject to various exchange control regulations that restrict the repatriation of investments and earnings therefrom. In April 2001, the Central Bank eliminated most of the regulations affecting foreign investors, although they still have to provide the Central Bank with information related to equity investments and must conduct such operations within the Formal Exchange Market. Additional Chilean restrictions applicable to holders of our ADSs, the disposition of the shares underlying them, the repatriation of the proceeds from such disposition or the payment of dividends may be imposed in the future, and we can neither determine in advance nor advise you as to when or how those restrictions could impact you, if imposed.
If for any reason, including changes in Chilean law, the depositary for our ADSs were unable to convert Chilean pesos to U.S. dollars, investors would receive dividends and other distributions, if any, in Chilean pesos.
We are required to withhold 35% from any dividends we pay to you.
ADS holders are entitled to receive dividends on the underlying shares to the same extent as the holders of shares. Dividends received by ADS holders will be paid net of foreign currency exchange fees and expenses of the depositary and will be subject to Chilean withholding tax of 35% of the dividend, which we will withhold and pay to the Chilean tax authorities. Any dividend distributions made in property (other than common stock) will be subject to the same Chilean tax rules as cash dividends. For more information, see “Item 10. Additional Information—Taxation—Chilean Tax Considerations.”
Risks Relating to Chile
Our growth and profitability depend on the level of economic activity in Chile.
Our core business and transactions are with customers doing business in Chile. Accordingly, our ability to grow our business volumes and results of operations, as well as enhance our financial condition, in general, depends on the dynamism of the Chilean economy and specific macroeconomic variables such as inflation, unemployment, consumption and investment. The global financial crisis of 2008 that dramatically affected the economic growth in developed countries also affected the Chilean economy by the end of 2008 and during the first three quarters of 2009. This translated into a subsequent slowdown in the local banking industry due to
11
Table of Contents
lower levels of consumption and deteriorated credit quality in loan portfolios prompted by increasing unemployment and financial stress experienced by certain economic sectors. Conversely, between 2010 and 2012 the local economy and the banking industry evidenced a significant upturn, fostered by real GDP growth that averaged 5.7% per year, mainly as a result of the recovery in consumption and investment, as well as higher fiscal spending associated with the reconstruction process after a significant earthquake. In 2013, the Chilean economy entered into a moderate slowdown by recording a 4.1% GDP expansion. The lower dynamism was caused by an important slowdown in investment which posted a slight 0.4% annual growth, principally owing to postponed projects in the mining and energy sectors, as well as companies waiting for better economic signals. On the other hand, consumption remained strong by growing 5.4% in 2013. In line with the economic cycle, banking activity decreased as compared to 2012 in spite of maintaining attractive figures in loan growth and profitability. Although Chilean economic growth continues to be above the average of comparable countries and the world, we cannot assure you that the local economy will continue expanding in the future or developments in, or affecting, the Chilean economy and the local banking industry will not materially and adversely affect us, our business, financial condition or results of operations. For more information, see “Item 5. Operating and Financial Review and Prospects—Operating Results—Overview”.
Currency fluctuations could adversely affect the value of our ADSs and any distributions on the ADSs.
The Chilean Government’s economic policies and any future changes in the value of the Chilean peso with respect to the U.S. dollar could affect the dollar value of our common stock and our ADSs. Given the floating exchange rate regime that exists in Chile, the Chilean peso has been subject to large fluctuations in the past and could continue this trend in the future. According to information published by the Chilean Central Bank, between December 31, 2012 and December 31, 2013, the value of the U.S. dollar relative to the Chilean peso increased by approximately 9.4%, as compared to the decrease of 8.2% recorded in the period from December 31, 2011 to December 31, 2012. See “Item 3. Key Information—Exchange rates.”
Chilean trading in the shares underlying our ADSs is conducted in Chilean pesos. Cash dividends associated with our shares of common stock are received in Chilean pesos by the depositary, which then converts such amounts to U.S. dollars at the then-prevailing exchange rate for making payments in respect of our ADSs. If the value of the U.S. dollar increases relative to the Chilean peso, the dollar value of our ADSs and any distributions to be received from the depositary will decrease. In addition, the depositary will incur customary currency conversion costs (to be borne by the holders of our ADSs) in connection with the conversion and subsequent distribution of dividends or other payments. For more information, see “Item 10. Additional Information—Exchange Controls.”
Our results of operations may be affected by fluctuations in the exchange rates between the Chilean peso and the U.S. dollar despite our policy and Chilean regulations related to the general avoidance of material exchange rate mismatches. In order to reduce the effect of exchange rate mismatches we enter into foreign exchange derivative transactions that hedge our exposure. As of December 31, 2013, our foreign currency-denominated assets and Chilean peso-denominated assets, which contain repayment terms linked to changes in foreign currency exchange rates, were exceeded by our foreign currency-denominated liabilities and Chilean peso-denominated liabilities, which contain repayment terms linked to changes in foreign currency exchange rates, by an amount of Ch$781 million, or 0.04% of our paid-in capital and reserves.
We may decide to change our policy regarding exchange rate mismatches. Regulations that limit such mismatches may also be amended or eliminated by regulatory institutions. Higher exchange rate mismatches will increase our exposure to the devaluation of the Chilean peso, and any such devaluation may impair our capacity to service foreign-currency obligations and may, therefore, materially and adversely affect us, our financial condition and results of operations. Additionally, the economic policies of the Chilean Government and any future fluctuations of the Chilean peso with respect to the U.S. dollar could adversely affect our financial condition and results of operations.
12
Table of Contents
Chile has corporate disclosure standards different from those you may be familiar with in the United States.
Chilean disclosure requirements for publicly listed companies differ from those in the United States in some significant aspects. In addition, although Chilean law imposes restrictions on insider trading and price manipulation, the Chilean securities markets are not as highly regulated and closely supervised as the U.S. securities markets. Accordingly, the information about us available to you will not be the same as the information available to shareholders of a U.S. company. For more information, see “Item 16G. Corporate Governance.”
Chilean law provides shareholders with fewer and less well-defined rights.
Our corporate affairs are governed by our estatutos (bylaws) and the laws of Chile. Under such laws, our shareholders may have fewer or less well-defined rights than they might have as shareholders of a corporation incorporated in a U.S. jurisdiction. For example, our shareholders would not be entitled to appraisal rights in the event of a merger or other business combination undertaken by us.
A Potential Tax Reform in Chile may Increase our Tax Burden
A new administration assumed control of the Chilean government in March 2014. The new president has recently announced and sent to the Chilean congress a tax reform bill intended to finance improvements to the Chilean educational system, among other matters. The bill contemplates a gradual increase in the statutory corporate income tax rate, from the current 20.0% to a maximum of 25.0%, over a four-year period. In addition, the proposed bill includes changes in personal taxation for dividends-related taxes affecting both local and foreign investors, from a basis on cash dividends to a basis on accrued earnings of companies held as an investment. Similarly, the bill proposes a reduction in the tax rate for the upper income bracket, in the case of individuals, from 40.0% to 35.0%. As a result, the announced tax reform could adversely affect our results of operations, costs and profitability in the future. However, since the reform has not been yet passed in the congress, we cannot yet accurately estimate its potential effects on our operations. For more information, see “Item 10. Additional Information—Taxation—Chilean Tax Considerations—Tax Reform Proposal, by Presidential message N°24-362 (April 1 , 2014).”
13
Table of Contents
| Item 4 | Information on the Company |
History and Development of the Bank
Overview
We were founded in 1893, and we have been, for much of our history, among the largest and most profitable Chilean banks in terms of return on assets and equity in Chile. Our core business is commercial banking in Chile, providing traditional banking products and specialized financial services to our diversified customer base of individuals and companies.
Our legal name is Banco de Chile and we are organized as a banking corporation under the laws of Chile and were licensed by the SBIF to operate as a commercial bank on September 17, 1996. Our main executive offices are located at Paseo Ahumada 251, Santiago, Chile, our telephone number is +56 (2) 2637-1111 and our website is www.bancochile.cl . Our representative in the United States is Puglisi & Associates, with offices at 850 Library Avenue, Suite 204, Newark, Delaware 19711.
We are a full-service financial institution that provides, directly and indirectly through our subsidiaries and affiliates, a wide variety of lending and non-lending products and services to all segments of the Chilean financial market, providing powerful and differentiated value offerings to our customers. Our business is not materially affected by seasonality.
We organize our operations and deliver our services to our customers through the following four principal business segments:
| (i) | retail banking; |
| (ii) | wholesale banking; |
| (iii) | treasury and money markets; and |
| (iv) | subsidiaries. |
We provide our retail customers with credit cards, residential mortgage loans and consumer loans, as well as traditional deposit services, such as current accounts, demand deposits, savings accounts and time deposits. Our retail customers are composed of micro, small and medium sized companies that we serve by providing them with short and long term loans, as well as diverse deposit solution, in order to satisfy their needs. Our banking services for wholesale customers include commercial loans (which include factoring and leasing), foreign trade, capital markets services, cash management and non-lending services, such as payroll and payment services, as well as a wide range of treasury, financial advisory and risk management products.
In 2008, we supplemented our products and services and enhanced our value offerings by entering into a strategic partnership with Citigroup Inc., as a result of our merger with Citibank Chile.
As of December 31, 2013, we also offered international banking services through our Trade Services subsidiary in Hong Kong, our representative office in Beijing, and a worldwide network of correspondent banks.
In addition to our traditional banking operations, our subsidiaries and affiliates permit us to offer a variety of non-banking but specialized financial services including securities brokerage, mutual funds management, investment banking, insurance brokerage, securitization, collection and credit pre-evaluation services.
According to the SBIF, as of December 31, 2013 and excluding the operations of subsidiaries abroad, we were the second largest bank in Chile in terms of total loans with a market share of 19.1%, the largest provider of commercial loans with a market share of 19.5%, the second largest provider of consumer loans with a market share of 20.9% and the second largest privately owned bank in terms of residential mortgage loans with a market share of
14
Table of Contents
17.4%. Also, as published by the SBIF, we were the largest bank in terms of net income with a market share of 26.8% and the first bank in terms of current account balances held by individuals with a market share of 30.2%, both as of December 31, 2013. Lastly, according to the Chilean Association of Mutual Funds, as of December 31, 2013 we were the largest provider of mutual funds management with a market share of 21.3%.
As of December 31, 2013 we had:
| • |
total assets of Ch$25,873,708 million (approximately U.S.$49,216 million); |
| • |
total loans of Ch$20,880,770 million (approximately U.S.$39,718 million), before deducting allowances for loan losses; |
| • |
total deposits of Ch$16,387,057 million (approximately U.S.$ 31,171 million), of which Ch$5,984,332 million (approximately U.S.$ 11,383 million) correspond to current account and demand deposits; |
| • |
equity (including net income, non-controlling interest and provisions for minimum dividends) of Ch$2,679,039 million (approximately U.S.$ 5,096 million); |
| • |
net income of Ch$550,189 million (approximately U.S.$ 1,047 million); and |
| • |
market capitalization of Ch$7,109,256 million (approximately U.S.$ 13,523 million). |
As of December 31, 2013, we had 14,723 employees and delivered financial products and services through a nationwide distribution network of 430 branches, and 1,804 ATMs that are part of a larger ATM network operated by Redbanc S.A. (a company owned by us and 11 other privately owned banks) that comprises 6,397 ATMs.
History
We were founded in 1893 as a result of the merger of Banco Nacional de Chile, Banco Agrícola and Banco de Valparaíso, which created the largest privately held bank in Chile. We have played an important role in the economic history of Chile. Before the creation of the Central Bank in 1926 and prior to the enactment of the General Banking Law, we were the main stabilization agent of the Chilean banking system, a role that is now performed by the Chilean Central Bank. Beginning in the early 1970s, the Chilean Government assumed control of a majority of Chilean banks, and all but one of the foreign banks that were operating at that time closed their branches and offices within the country. Throughout this era, we remained as a privately-owned bank, with the exception of a portion of our shares owned by the Chilean Government that were sold to private investors in 1975. Throughout our history we have developed a well-recognized brand name in Chile and expanded our operations in foreign markets, where we developed an extensive network of correspondent banks. In the early twentieth century, we established a representative office in London, which we maintained until 1985, when our operations in Europe were moved to Frankfurt. The office in Frankfurt was closed in 2000, when our foreign operations were centralized at the New York branch. In 1987 and 1988, we established four subsidiaries to provide a full range of specialized financial products and services as permitted by the General Banking Law. In 1999, we widened our scope of specialized financial services by creating our insurance brokerage and factoring subsidiaries. According to our estimates, we remained the largest private bank in Chile until 1996. During the early 2000s, the Chilean banking industry witnessed intense merger and acquisition activity. In 2002, we merged with Banco de A. Edwards, which allowed us to expand our business to new customer segments. In 2008, we sold our U.S. branches to Citigroup in connection with our merger with Citibank Chile that was carried out during the same year. As a result of these consolidations, we currently operate a distribution network that is composed of three brand names, namely, “Banco de Chile” (which operates throughout Chile), “Banco Edwards-Citi” (which is primarily oriented to higher income segments) and “Banco CrediChile” (which is focused on consumer loans and sight accounts for lower and middle income segments). In 2012, we became the market leader in net income and the most profitable bank (the highest return on average equity and average capital and reserves) within the Chilean banking industry, according to information released by the SBIF. Similarly, among our peers we were the bank with the best credit quality indicators in terms of past-due loans, provisions for loan losses over average loans and past-due loans coverage. Also, during 2012 we
15
Table of Contents
maintained our leadership in mutual funds and current accounts for individuals, while our investment banking subsidiary maintained the market leading position in corporate bond placements within the local market, according to information available at the Chilean Association of Mutual Funds, the SBIF and the Superintendency of Securities and Insurance, respectively. In terms of funding diversification, we improved our access to foreign debt markets by placing senior bonds in Hong Kong and Peru for a total aggregate amount of approximately U.S.$193 million. Similarly, we established a commercial paper program in the U.S. market of U.S.$1,000 million.
In 2013 we continued to enhance our competitive advantages. As a result, we completed a very successful year by ranking first in operating revenues—for the first time in our recent history—and net income, according to information released by the SBIF. These achievements enabled us to remain the most profitable bank in Chile in terms of return on average equity and average assets. Our leading position in net income was also a consequence of our market-leading performance in expenses, which allowed us to reach the lowest efficiency ratio in the local industry, according to information published by the SBIF. Also, in order to maintain a convenient and well diversified liability structure, we have continued to seek alternative financing opportunities, especially overseas. In this regard, during 2013 we carried out four placements in Switzerland for a total amount of approximately US$785 million. Also, we established a US$2 billion medium term notes program (the “MTN Program”) in Luxemburg. Under this program we issued medium term notes in Hong Kong and Japan of approximately US$168 million and US$167 million, respectively.
Merger with Banco de A. Edwards
On December 6, 2001, our shareholders approved our merger with Banco de A. Edwards, which became effective on January 1, 2002. Banco de A. Edwards had been listed on the NYSE since 1995, and in January 2002, we were listed on the NYSE under the symbol BCH. Since 2002, our shares have also been traded on the Latin American Stock Exchange of the Madrid Stock Exchange (“Latibex”) and the London Stock Exchange (“LSE”). We concluded the merger process with the consolidation of a new corporate structure and the integration of our technological platforms. As for Latibex, on October 18, 2013, we voluntarily delisted our trading units from that market,
Merger with Citibank Chile
On December 27, 2007, our shareholders approved our merger with Citibank Chile, which became effective on January 1, 2008. During 2008, we integrated Citibank Chile’s technological platforms with ours and established a new organizational structure in order to satisfy the needs of our customers and to achieve important synergies. We concluded the merger process with the integration of Corporación Financiera Atlas S.A. (Citibank Chile’s consumer division) into our consumer division (CrediChile), which allowed us to nearly double our customer base and market share in consumer finance.
Our partnership with Citigroup Inc., an internationally well-known brand name, enabled us to broaden the scope of financial services that we offer to our customers through the addition of global financial services and other benefits. As a result of this partnership, we entered into a global connectivity agreement (the “Global Connectivity Agreement”), which has supported the creation of (i) an international personal banking unit, responsible for optimizing access to financial services outside Chile to our local retail customers, (ii) a global transactional services unit, responsible for executing local and international cash management services, as well as custody and foreign trade assistance, to our wholesale customers, and (iii) an enhanced investment banking unit, responsible for providing financial advisory services and access to global capital markets to our Chilean corporate customers.
16
Table of Contents
Technological Projects
In 2011, our technological projects aimed to support the development of new products and services, improve the efficiency and productivity of our internal systems and processes, reinforce our technological infrastructure and minimize our operational risks. Thus, the main projects developed throughout 2011 were: (i) the implementation of new websites and a phone-based sales platform, in addition to the launch of “Banca Móvil” (mobile solutions for tablets and smartphones) for our retail banking segment; (ii) the development of operational and technological processes required to release the “Banco de Chile | Entel” credit card; (iii) the release of a new platform for options trading; (iv) a new system of financial evaluation for companies that supports the tasks carried out by our Corporate Risk Management Division; and (v) the setup of a new data center.
Throughout 2012, our IT priorities were focused on improving operating efficiency through diverse projects intended to enhance internal processes in quality and timing, as well as reinforcing security in transactional services. Our main IT projects in 2012 included: (i) the automation of product application forms for small and medium sized companies, (ii) implementation of a new online platform for current accounts, (iii) approval of individuals’ and SMEs’ operations through scanned documentation, (iv) time-improving procedures for foreign exchange operations, (v) new systems for managing and trading derivatives, and (vi) the implementation of a new platform for financial planning. For security matters, we implemented world-class security software that is intended to avoid fraud in electronic money transfers. Similarly, we implemented improved ATMs shield procedures.
During 2013, we focused on ensuring the stability of our IT systems and implementing improvements to key processes in order to provide our customers with better service quality. Accordingly, the main IT projects undertaken in 2013 had to do with: (i) upgrading our internet-based array of services, in order to significantly improve the availability of our internet platforms for personal and corporate banking, (ii) setting up a security device (chip) in credit cards that should enable us to reduce the rate of fraud in this business and maintain our industry-leading position in these matters, (iii) improving the uptime of ATMs, (iv) enhancing product-related platforms for factoring, insurance, time and demand deposits, and (v) strengthening credit-assessment and granting by implementing the final stages of a new system of financial evaluation for companies and optimizing required documentation for lending.
Therefore, we maintain our commitment of anticipating and minimizing cybersecurity risks, as mentioned in “Item 3. Risk Factors—Risks Relating to our Operations and the Chilean Banking Industry” and “Item 3. Risk Factors—Cybersecurity events could negatively affect our reputation or results of operations and may result in litigation.”
The 1982-1983 Economic Crisis and the Central Bank Subordinated Debt
During the 1982-1983 economic crisis, the Chilean banking system experienced significant instability that required the Central Bank and the Chilean Government to provide assistance to most Chilean private sector banks, including us. During this period, we experienced significant financial difficulties. In 1985 and 1986, we increased our capital and sold shares representing 88% of our capital to more than 30,000 new shareholders. As a result, no single shareholder held a controlling stake in the Bank. In 1987, the SBIF returned complete control and administration of the Bank to our shareholders and our Board of Directors by ending our provisional administration based on our successful capital increases as required by Law 18,401.
Subsequent to the crisis, like most major Chilean banks, we sold certain of our non-performing loans to the Central Bank at face value on terms that included a repurchase obligation. The repurchase obligation was later exchanged for subordinated debt of each participating bank issued in favor of the Central Bank. In 1989, pursuant to Law No. 18,818, banks were permitted to repurchase the portfolio of non-performing loans for a price equal to the economic value of such loans, provided that the bank assume a subordinated obligation equal to the difference between the face and economic value of such loans. In November 1989, we repurchased our portfolio of non-performing loans from the Central Bank and assumed the Central Bank’s subordinated debt related to our non-performing loans.
17
Table of Contents
The original repayment terms of our Central Bank subordinated debt, which at December 31, 1989 equaled approximately Ch$1,448,654 million (in real terms as of December 31, 2013), required that a certain percentage of our income before provisions for the subordinated debt be applied to repay this obligation. The Central Bank subordinated debt did not have a fixed maturity, and payments were made only to the extent that we earned income before provisions for the subordinated debt. In 1993 we applied 72.9% of our income before provisions to repay the Central Bank subordinated debt. In 1994 we applied 67.6%, and in 1995 we applied 65.8% of our income before provisions to repay the Central Bank subordinated debt.
In November 1996, pursuant to Law No. 19,396, our shareholders approved a reorganization by which we were converted into a holding company named SM-Chile. In turn, SM-Chile organized a new wholly-owned banking subsidiary named Banco de Chile, to which the former contributed all of its assets and liabilities, other than the Central Bank subordinated debt, to the latter. In addition, SM-Chile created SAOS, a second wholly-owned subsidiary that, pursuant to a prior agreement with the Central Bank, assumed a new repayment obligation in favor of the Central Bank that replaced the Central Bank subordinated debt in its entirety.
This Central Bank debt, for which SAOS is solely responsible and for which there is no recourse to us or SM-Chile, was equal to the unpaid principal of the Central Bank subordinated debt that it replaced but had terms that differed in some aspects, such as the rescheduling of the debt for a term of 40 years providing for equal annual installments and a pledge of our shares as collateral for such debt. The Central Bank debt bears interest at a rate of 5.0% per year and is UF-denominated.
In exchange for assuming the Central Bank debt, SAOS received from SM-Chile 63.6% of our shares as collateral. Although shares held by SAOS as collateral have economic rights that belong to the Chilean Central Bank, their voting rights are exercised by SM-Chile’s shareholders. As a result of our merger with Banco de A. Edwards, the percentage of our shares held by SAOS decreased to 42.0%. Subsequently, as of December 31, 2013 the percentage of our shares held by SAOS was 30.7%, as a result of: (i) capital increases agreed to at Extraordinary Shareholders’ Meetings held in May 2007, January 2011 and October 2012, (ii) stock dividends paid in May 2006, May 2007, June 2009, April 2011, June 2012 and May 2013, and (iii) our merger with Citibank Chile in January 2008.
Dividends received from us are the sole source of SAOS’s revenues, to be applied by legal mandate to repay its debt to the Central Bank of Chile. SAOS does not have any other material debt, as it is a special purpose legal entity created by Law 19,396 whose only business is to own Banco de Chile shares and repay the obligation to the Central Bank of Chile. To the extent distributed dividends are not sufficient to pay the amount due on its debt; SAOS is permitted to maintain a cumulative deficit balance with the Central Bank that SAOS commits to pay with future dividends. If the cumulative deficit balance exceeds an amount equal to 20% of our paid-in capital and reserves, the Central Bank may require SAOS to sell a sufficient number of shares of our stock to pay the entire accumulated deficit amount. As of March 31, 2014, SAOS maintained a surplus with the Central Bank of Ch$373,556 million, equivalent to 16.9% of our paid-in capital and reserves as of the same date. See “Item 3. Key Information—Risk Factors—Risks Relating to our Operations and the Banking Industry—Our affiliate may be obligated to sell shares of our stock in the public market if we do not pay sufficient dividends”.
As of December 31, 2013, the outstanding subordinated debt balance held by SAOS amounted to Ch$649,521 million (including accrued interest). SAOS paid to the Central Bank a total of Ch$131,530 million during 2011, Ch$124,342 million in 2012 and Ch$151,560 million in 2013, exceeding in each of those years the required minimum annual payment.
As of December 31, 2013, the major shareholder of SM-Chile was LQ Inversiones Financieras S.A. (a subsidiary of Quiñenco S.A.), which owned, directly and indirectly, 58.2% of SM-Chile’s total shares. As of the same date, our major shareholders were LQ Inversiones Financieras S.A., SAOS and SM-Chile, each having a direct participation of 32.6%, 30.7% and 13.0% in our total common stock, respectively. It is important to mention that on January 31, 2014 LQ Inversiones Financieras S.A. (our major shareholder) closed the sale of 6,700,000,000 shares of Banco de Chile through a public secondary offering (dutch auction), which resulted in a 7.20% decrease of the ownership interest in Banco de Chile. Accordingly, as of April 15, 2014, LQ Inversiones Financieras S.A. owned, directly and indirectly, 51.2% of our shares, with a direct stake of 25.4%. See “Item 5. Operating and Financial Review and Pospectus—Recent Developments.”
18
Table of Contents
If from time to time in the future our shareholders decide to retain and capitalize all or part of our annual net income in order to finance our future growth and to distribute stock dividends, the Central Bank may require us to pay the portion of the net income corresponding to shares owned by SAOS in cash to SAOS. If we distribute stock dividends and the Central Bank does not require us to pay that portion in cash, the shares received by SAOS must be sold by SAOS within the following 12 months. The shareholders of SM-Chile will have a right of first refusal with respect to that sale.
Capital Expenditures
The following table sets forth our capital expenditures in each of the three years ended December 31, 2011, 2012 and 2013:
| For the Year Ended December 31, | ||||||||||||
| 2011 | 2012 | 2013 | ||||||||||
| (in millions of Ch$) | ||||||||||||
|
BANK’S INTERNAL REPORTING POLICIES: |
||||||||||||
|
Computer equipment |
Ch$ | 8,797 | Ch$ | 7,750 | Ch$ | 7,509 | ||||||
|
Furniture, machinery and installations |
9,425 | 8,949 | 4,303 | |||||||||
|
Real estate |
3,481 | 337 | 62 | |||||||||
|
Vehicles |
370 | 945 | 375 | |||||||||
|
|
|
|
|
|
|
|||||||
|
Subtotal |
22,073 | 17,981 | 12,249 | |||||||||
|
Software |
9,597 | 9,116 | 5,511 | |||||||||
|
|
|
|
|
|
|
|||||||
|
Total |
Ch$ | 31,670 | Ch$ | 27,097 | Ch$ | 17,760 | ||||||
|
|
|
|
|
|
|
|||||||
Our budget for capital expenditures for 2014 is Ch$59,184 million, 62.9% of which is related to information technology expenditures and 37.1% of which is associated with infrastructure projects. The budget for capital expenditures is in line with our strategic priorities of improving our efficiency and reinforcing our proximity to our customers, particularly in our retail banking segment, through physical as well as non-physical contact channels. These capital expenditures are principally financed by our capital and long-term debt financing.
Among the budgeted expenditures for information technology, 45.1% corresponds to new and ongoing IT projects intended to provide us with business solutions as well as productivity improvements, 34.9% is related to critical projects involved in our mid-term IT plan, while the remaining 20.1% consists of investment in technological equipment and improvements or renewal of our ATMs nationwide network.
Our 2014 budget for infrastructure expenditures includes disbursements associated with new branches, as well as the renovation and relocation of some of our existing commercial branches, and general maintenance and renewal investments.
19
Table of Contents
BUSINESS OVERVIEW
Our Competitive Strengths
Building on our knowledge of the Chilean financial market, we have historically been able to develop significant competitive advantages based on our strong brand recognition, our widespread branch network, the diversity and relative size of our customer base, our highly competitive funding structure, the superior asset quality of our loan portfolio as compared to our peers in Chile, an attractive risk-return relationship and our market leadership in a diverse range of financial products and services.
Our main competitive strengths are:
Brand Recognition and Strong Corporate Image
We have operated in the Chilean financial industry for 120 years under the “Banco de Chile” brand name. In order to provide our customers with specialized value offerings and a wider range of financial products and services, we have also developed the “Banco Edwards|Citi”, “Banco CrediChile” and “Banchile” brand names. We believe our long-standing history in the Chilean market is recognized by our customers and the general public, who associate us with quality, reliability and social responsibility within the Chilean financial industry, as demonstrated in various polls conducted by well-known market research companies. According to market research conducted by Adimark GFK (part of the GFK Group), during 2013 we remained the most recognized brand among financial institutions operating in Chile. Also, in 2013, Merco (a corporate reputation monitor headquartered in Spain) ranked Banco de Chile as the market leader in corporate reputation for all companies operating in Chile. In addition, research conducted by Millward Brown Optimor (a marketing consultancy focused on brands, media and communications that is part of Kantar Group) ranked Banco de Chile as the second most valuable brand in Chile and the most valuable in the Chilean banking industry. We believe that our long history in the Chilean banking industry is a key element that differentiates us from our competitors.
Additionally, we believe that our merger with Citibank Chile reinforced our corporate image as a leading financial institution within Chile and allowed us to gain recognition among customers and investors all over the world.
We also believe that our strong corporate image is further strengthened by our commitment to social responsibility, which includes supporting the Teleton Foundation (a non-governmental organization dedicated to assisting and treating Chilean children), our partnership with institutions dedicated to improving the quality of Chilean education, our participation in campaigns intended to improve the quality of life of needy people, our commitment to the development of sports in Chile by supporting the national soccer team and tennis players and our environmental pledge that has led us to implement policies to conserve energy and forestry resources, as well as other initiatives intended to strengthen our role in, and contribution to Chilean society.
Business Scale and Leading Market Position
We are one of the largest financial institutions in Chile and a market leader in a broad range of financial products and services within the Chilean financial system, as listed in the following table:
| As of December 31, 2013 | ||||||||
| Market Share | Market Position | |||||||
|
Commercial Loans (1) |
19.5 | % | 1 st | |||||
|
Average Balances of Total Demand Deposits and Current Account (1) |
23.2 | % | 1 st | |||||
|
Current Accounts Balances held by Individuals |
30.2 | % | 1 st | |||||
|
Mutual Funds (Assets Under Management) |
21.3 | % | 1 st | |||||
|
Net Fees and Commissions Income |
22.2 | % | 1 st | |||||
|
Net Income for the Period |
26.8 | % | 1 st | |||||
Source: SBIF and Chilean Association of Mutual Funds.
| (1) | Excluding operations of subsidiaries abroad. |
20
Table of Contents
We have traditionally had a strong presence in the wholesale segment with long-term relationships with major local and multinational companies that operate in Chile. We have been able to maintain this leading position by continuously improving our products and services and supplementing them with comprehensive and tailored service models that allow us to successfully serve our customers’ needs. We have also added value to our service offerings by including treasury products for hedging purposes, together with investment banking, insurance brokerage and other specialized financial services through our subsidiaries.
In addition, in recent years we have been focused on further penetrating the retail banking business through diverse value offerings intended to cover all of the populations and enterprises we target. Therefore, in recent years we have prioritized growing our residential mortgage portfolio and expanding our presence in transactional services such as credit cards, current accounts and sight accounts, as we believe they are effective means to build long-term relationships and customer loyalty and to increase cross-selling opportunities. As a result, through our Commercial Division (Individual and SME Banking), we lead the market in services offered to high-income individuals for whom we have developed an attractive and complete portfolio of financial services, including a full range of wealth management services through one of our subsidiaries. Also, our Consumer Finance Division (Banco CrediChile) has become one of the largest providers of consumer loans among the Chilean banks’ consumer divisions, based on comprehensive service offerings for low- and middle-income individuals. This has been recently supplemented by the implementation of business solutions for low-scale entrepreneurs and individual customers in periphery districts. This broad variety of services has also enabled us to lead the Chilean market in terms of income from fees and commissions.
We believe our financial strength, prestige and brand recognition among Chilean customers have allowed us to become the market leader in terms of current account balances within the Chilean financial system, especially among individuals, who have demonstrated their preference for our services. Our position was further consolidated in the financial downturn in 2009, when we benefited from a “flight-to-quality” effect as investors were seeking a reliable institution to keep their funds.
Robust Customer Base and Nationwide Distribution Network
We believe that we have one of the largest customer bases among financial institutions in Chile. We have prioritized expanding this customer base by implementing attractive and tailored value offerings, based on continuously improving segmentation. As a result, over the last three years (2010 to 2013), our customer base has expanded at a compound average growth rate (“CAGR”) of 5.5%. In line with our strategic priorities and the characteristics of the markets we target, our retail banking customer base (individuals and SMEs) has expanded at a CAGR of 5.6% over the last three years and our wholesale banking customer base has grown at a CAGR of 4.4% over the last three years. As of December 31, 2013, we had approximately 1,882,000 customers, including approximately 1,154,000 borrowers, approximately 696,000 current accounts holders, approximately 129,000 time deposit holders, approximately 380,000 saving account holders and approximately 1,463,000 credit card holders.
We believe that our robust customer base is both an essential driver of our business and a valuable asset that enables us to cross-sell our products and services.
In order to better serve our customers, we are present in all regions of Chile and strive to be accessible to every Chilean customer through our broad branch network as well as non-physical contact channels. As of December 31, 2013, we had a nationwide branch network of 430 branches, the second largest in Chile among non-governmental banks, according to information published by the SBIF. This network is composed of 244 branches under our “Banco de Chile” brand name, 41 branches under our “Banco Edwards|Citi” brand name and 145 branches under our “Banco CrediChile” brand name. We believe that our broad branch network enables us to develop close relationships with our customers and therefore we are constantly assessing new branch locations throughout Chile.
21
Table of Contents
In addition, to improve our customer service, we are constantly reviewing the appearance and layout of our branches. We aim to turn each of our branches into a business generating unit. As a result, we have revised and redesigned our service models in most of our credit-lending units in order to maximize branch profitability and enable our on-site account executives to focus on serving customers and developing new businesses rather than focusing on administrative tasks, which have been mostly transferred to centralized back-office staff.
We have also enhanced our branch network with non-physical remote channels, such as ATMs and internet-based online platforms. As of December 31, 2013, we had 1,804 ATMs throughout Chile.
Diversified Value Offering of Financial Products and Services
In response to the diverse needs of our customers, we have become a full-service financial group that operates under a multi-brand approach, offering a wide range of traditional banking products and services to our customers that are supplemented by specialized financial services provided by our subsidiaries, including:
| • |
securities brokerage, |
| • |
mutual funds management, |
| • |
securitization, |
| • |
financial advisory, |
| • |
insurance brokerage, |
| • |
collection services, and |
| • |
credit-assessment services. |
In addition, our strategic alliance with Citigroup Inc. and our Global Connectivity Agreement have allowed us to broaden our service offerings by adding a comprehensive portfolio of international financial services that previously we could only partially provide.
All of the above is supplemented by tailored service models based on the needs of consumers across all of our markets.
Competitive Funding Structure
We believe that we have a cost-effective and highly competitive funding structure based on our leading market position in current accounts and demand deposits, especially among individuals. According to the SBIF, as of December 31, 2013, we held 30.2% of individuals’ current account balances, which was the market-leading position among Chilean banks. As of that same date and according to information published by the SBIF, the total balance of our non-interest bearing current accounts and demand deposits represented 23.1% of our total funding structure, as compared to the 17.8% reported by the Chilean financial system as a whole, excluding Banco de Chile.
We believe that our funding structure provides us with a cost advantage over our competitors (which use a higher proportion of interest bearing liabilities), as current accounts and demand deposits are the cheapest funding source available in Chile, since they are non-interest bearing liabilities. Also, due to our high international credit rating we have one of the lowest costs of funding from liabilities associated with interest-bearing deposits.
Furthermore, we are constantly striving to diversify our funding in order to maintain a competitive cost of funding and improve our liquidity. In those efforts, during 2013 we completed four long-term debt placements in Switzerland for a total amount of CHF775 million (approximately US$785 million) and established a US$2 billion medium term notes program (the “MTN Program”). Under the MTN Program, we have recently issued medium term notes for HKD 1,399 million (approximately US$168 million) in Hong Kong, and two series of medium terms notes for a total amount of JP¥ 16,900 million (approximately US$167 million) in Japan. In addition, we issued long-term bonds in the local market for a total amount of Ch$505,000 million (approximately US$ 960 million).”
22
Table of Contents
Superior Asset Quality
We are one of the Chilean financial institutions with the highest credit quality and the healthiest loan portfolio in Chile. We believe this asset quality is the result of our well-known prudent risk management approach and accurate credit risk models that are continuously being updated and have enabled us to maintain relatively low levels of total past-due loans and high coverage indicators over the last few years. According to the SBIF, as of December 31, 2013, we had a delinquency ratio (total past-due loans as a percentage of total loans) of 1.1%, which is well below the delinquency ratio of 2.4% reported by the Chilean financial system, excluding Banco de Chile, as of the same date. Additionally, we maintain the highest coverage ratio (the ratio of allowances for loan losses to total past-due loans) in the Chilean financial system, which as of December 31, 2013 was equal to 2.0 times, as compared to 1.0 times for the Chilean financial system as a whole, excluding Banco de Chile, as of the same date .
Our Business Strategy
Purpose
‘We are a company that contributes to the economic development of the country by offering attractive financial solutions to individuals and enterprises.’
Mission
‘We are a leading and globally-connected corporation with a prestigious business tradition. We provide excellent financial services to each type of customer by offering creative, fast and effective solutions for each segment, and ensuring that we add value for our customers, shareholders, employees and community as a whole . ’
To accomplish this mission, we believe it is essential to attain industry leadership in all businesses and financial areas in which we operate, namely, profitability, efficiency, business scale, customer base, human resources development and corporate social responsibility.
This mission also requires initiatives to achieve comprehensive excellence in management, with customer satisfaction as our major goal. We use high industry standards in information technology, business models and quality, all of which is summarized by the value creation cycle below:

Vision
‘We aspire to be, in all things we do, the best bank for our customers, the best place to work and the best investment for our shareholders. In order to accomplish this vision, we are committed to the development of our employees and the community as a whole.’
23
Table of Contents
Throughout our history, we have aspired to be the leading bank in the Chilean financial system. This vision involves and commits us to all of the diverse stakeholders related to our business, namely, customers, employees, investors and the community. Our vision is shared and internalized by all areas across the corporation, senior management and the board of directors and constitutes the basis for our strategic objectives.
Among the main stakeholders that we strive to satisfy are:
| • |
Our Customers |
| • |
Our aim is to gain substantial knowledge of our customers in order to align our value offerings to their needs, requirements and aspirations in order to build long-term relationships. |
| • |
In addition, our brand recognition, corporate reputation and market leadership within the local financial industry represent important competitive advantages that we must capitalize on, preserve and improve by providing all of our customers with innovative and tailored value offerings. |
| • |
Our Employees |
| • |
Our human resources are one of our core competitive advantages, given our team’s commitment, dedication and distinctive identity within the local financial system. |
| • |
We also believe that promoting a better work environment is key for providing exceptional customer service. For this reason, we focus on creating effective communication channels and developing a meritocratic culture by rewarding our employees’ talents and achievements. |
| • |
Our Community |
| • |
We believe that our business actions and financial performance depend on our community involvement. As a result, we strive to continuously reinforce our commitment to the community by carrying out diverse social impact initiatives and providing contributions and solutions in challenging circumstances. |
| • |
We are committed to entrepreneurship, the integration of disabled people, high-quality education, overcoming poverty, the integration of elderly people, transparency and relationship-building strategies with our suppliers, as well as environmental protection. |
| • |
Our Shareholders |
| • |
We maintain our shareholders’ trust by engaging in projects and businesses intended to maximize the company’s long-term value, while being prudent with regards to business-related risks. |
| • |
Also, through commercial strategies that combine enhanced service quality and higher returns, we have been able to add significant value to our shareholders. This approach—which we expect to maintain—distinguishes us within the Chilean financial system. |
24
Table of Contents
Strategic Priorities
Our long-term strategy is to maintain profitable growth enhancing our position as a leading financial institution in Chile by providing a broad range of financial products and services to corporations and individuals nationwide. As part of this strategy, we have developed a multi-brand approach to target different market segments. We intend to leverage our strongly positioned brand names “Banco de Chile”, “Banco Edwards|Citi” and “Banco CrediChile” in traditional banking, which are supplemented by specialized financial services (such as securities brokerage services, mutual funds management, securitization services, financial advisory services and insurance brokerage services) provided by our subsidiaries that operate under the “Banchile” brand name.
Since the performance of our business depends on many factors, we cannot assure you that we will be able to implement our strategies successfully or that we will be able to reach our strategic goals. For a discussion of certain risks applicable to our operations, industry and country we operate in, see “Risk Factors”.
Our business model is focused on those lines of business that add significant economic value to our shareholders, have appropriate levels of risk and allow us to strengthen long-term relationships with our customers. We seek sustained growth, particularly in higher-margin segments and business areas that show strong growth potential. Accordingly, in recent years we have reoriented our business focus towards the retail, large companies and treasury segments, in which we aim to achieve the same prominent position that we have obtained in the corporate segment. Thus, we strive to:
| • |
Lead the Retail Banking Business |
In our retail banking segment, our aim is to lead the market by creating differentiated and comprehensive value offerings based on a deep and continuously improving segmentation that permits us to engage in profitable and high-growth potential business opportunities. Thus, we expect to expand our business and customer base by developing tailored service models, enlarging our branch network, enhancing our presence in the small and medium companies market and reinforcing certain lending products that should enable us to consolidate long-term relationships with our upper and middle-income individual customers, especially through payment channels usage (such as credit cards), installment loans and residential mortgage loans. Similarly, we aspire to target lower-income individuals and microenterprises by promoting payroll-deduction lending and attracting customers previously unattached to any bank through a basic array of services, as well as providing commercial credit.
Throughout 2013 we prioritized growth in middle and upper income segments in personal banking as we recognized potential risk for lower income individuals by taking into consideration the slowdown observed in the local economy. For this reason, we have achieved an accurate segmentation in personal banking, which has enabled us to developed tailored offers to middle and higher income individuals. Thus, among less risky individuals we promoted growth in transactional services, especially credit cards, which enabled us to increase loan-related balances by 17.0% on an annual basis. Similarly, installment loans increased by 9.5% for middle and upper income individuals while mortgage loans recorded an overall 12.8% increase among these customers.
Notwithstanding the above, we continued to expand the range of financial services that we provide to lower-income individuals and microenterprises, segments that have not been fully penetrated by banks. In this regard, ‘Caja Chile’ network—which provides lower income customers with a suite of basic financial services through a transactional platform located in local convenience stores—completed 2013 with more than 2,000 convenience stores participating in the network. Similarly, our unit of ‘Microenterprises Banking’ strengthened during 2013 and ended the year with approximately 17,200 customers.
These initiatives are intended to take advantage of the retail banking segment’s growth potential. Even though Chile’s per capita GDP has tripled over the last 20 years, banking penetration in the Chilean economy is still below comparable countries, particularly within the low- and middle-income population segments and with respect to certain banking products such as residential mortgage loans. We believe we can grow further in this segment since, according to the SBIF, as of December 31, 2013, we had a 17.4% market share in residential mortgage loans and a 20.9% market share in consumer loans, both below the market stake held by the market leader. As for residential mortgage loans, due to our effective commercial strategies, we have been able to narrow the gap between us and the market leader from 4.4% as of December 31, 2012 to 3.3% as of December 31, 2013. With respect to consumer
25
Table of Contents
loans, however, the gap between us and the market leader increased from 2.2% as of December 31, 2012 to 3.7% as of December 31, 2013. This increase may be understood in the context of a riskier environment that led us to tighten the entire credit process in this product, from assessment to collection, which also led us to limit lending in consumer loans in order to maintain our commitment to a balanced risk-return equation.
Despite our efforts to increase market penetration of Retail Banking, especially in lending products, we believe that the fierce competition in the banking industry compels us to innovate in terms of new products and services to diversify our revenue sources. Accordingly, we have strived to build comprehensive value offerings for our retail segment, prioritizing fee-based income. As a result, our consolidated income from fees and other services has become an important source of revenue for us, reaching Ch$287,272 million (or 21.7% of our total operating revenues) in 2012 and Ch287,093 million (or 19.4% of our total operating revenues) in 2013. We aim to generate increasing amounts of fees and commission revenue by developing innovative products and services and reinforcing cross-selling, within a complex regulatory environment.
| • |
Lead the Wholesale Banking Business |
In our wholesale banking segment (which targets companies with annual sales over Ch$1,600 million), we aim to maintain our leading market position in terms of loans, as well as achieve higher profitability in a market that is characterized by low margins. We intend to accomplish these goals by increasing our cross-selling of non-lending products and services through various initiatives. We are focused on improving our offering of cash management services, enhancing our internet-based services, increasing the penetration of products designed by our treasury and money market operations segment, enhancing our presence in certain lending products such as leasing and factoring and promoting international businesses by taking advantage of the commercial synergies related to both our merger with Citibank Chile (such as the Global Connectivity Agreement with Citigroup) and the specialized financial services offered by our subsidiaries, such as securities brokerage, mutual funds management and financial advisory in order to appropriately meet the needs of certain niches within this business segment.
In addition to our traditional lending activities, we have developed supplemental financial services in order to achieve profitable growth by diversifying our revenue sources. Thus, we have increasingly added and developed fee-based and non-lending products and services such as financial advisory, cash management services and foreign exchange derivative transactions. All of these specialized financial services permit us to cross-sell our large customer base and obtain important gains in profitability for a segment that is well-recognized by low margins. As a result, according to our management information system, we increased our cross-selling indicator of non-lending revenues to lending revenues from a multiple of 1.34 in 2009 to a multiple of 1.78 as of December 31, 2013. We expect to continue enhancing our cross-sell indicators in order to optimize the profitability of the wholesale banking segment. This achievement joined to the higher penetration that we have attained in our Large Companies and Real Estate Division (annual turnover between Ch$1,600 and Ch$70,000 million) that increased from 25.6% in 2012 to 27.5% in 2013. This has been the result of an aggressive plan intended to enhance the closeness with the customer through a dual model of service that includes several on-site visits.
We also promote diverse services such as leasing, factoring and cash management in this segment. As of December 31, 2013, we ranked first in factoring loans within the Chilean banking industry by holding a 21.6% market share and ranked second in leasing contracts in Chile with a 20.2% market share, including operations of subsidiaries abroad. Regarding cash management services, during 2013 we increased volumes related to payment and collection agreements by approximately 28.9% and 29.1%, respectively.
Also, in our effort to offer tailor-made solutions and recognize the needs of different customer segments, during 2013 we defined a new group of customers called “Family Office”. This group includes companies that manage investments and trusts for a single family that we aim to target through a joint model of service that includes the interaction between our Wholesale Banking Segment and our subsidiary Banchile Inversiones.
26
Table of Contents
In our treasury and money market operations segment, we intend to take advantage of our specialized knowledge to increase the penetration of popular products in our current customer base while offering innovative products to potential clients. Also, we continuously seek newer and more convenient funding choices, locally and internationally, in order to support our long-term business strategy by promoting an adequate diversification of our funding structure.
| • |
Improve Service Quality |
We are convinced that in a highly competitive industry such as the Chilean banking system, a customer-centric focus is critical to generating loyalty and creating long-term, profitable relationships. We believe that our high service quality is a competitive strength that differentiates us from competitors and supports our long term strategy by responding to the preferences of our current and potential customers. We strive to continuously improve our relationships with customers by developing commercial strategies aligned with their needs, as well as improving our response time and customer satisfaction indicators.
Consistent with this view, our strategic priorities are focused on achieving high service quality standards within the industry, which has translated into diverse initiatives that seek to improve the satisfaction of our customers directly or indirectly. The most important initiative in this regard is the implementation of a customer-centered service quality model intended to improve the customer experience. We have a dedicated team responsible for assessing and improving the quality of our services. This team of employees from different areas of the Bank has set new policies and lead projects to achieve the highest service quality standards within the Chilean banking industry. Recently our attention has been focused on (i) ensuring the operational performance and availability of contact channels, services and systems, (ii) automating operational procedures with a focus on minimizing errors and manual tasks, (iii) redesigning critical processes that have an impact on customer satisfaction by improving availability, training, homogeneity and response time for each segment or contact channel, (iv) redesigning the requirement and complaint attention process by applying a customer-oriented vision (timing and quality), (v) expediting our credit–approval processes and (vi) developing specialized solutions and enhancing the use of remote access platforms for wholesale banking customers.
We also expect to continue benchmarking our competitors’ service performance and incorporate best practices from other markets, industries and countries.
| • |
Promote Operating Efficiency |
We believe that operating efficiency is a key competitive advantage. Accordingly, our strategy for efficiency intends to achieve the highest productivity and the tightest cost control. We believe that cost control will be increasingly important in our efforts to maintain high profitability ratios in a changing business environment. To accomplish these goals, we have invested in information technology and the development of simpler, more manageable, secure and modern business processes and platforms to attain faster response times and higher productivity. We also continue to enhance our strategic development capabilities, increase our business scale (generating economies of scale), develop economies of scope by incorporating new financially related businesses, reinforce the productivity of our branch network, enhance our remote transactional channels, improve our credit processes, develop a higher level of automation in our internal processes and consolidate our cost control policy and monitoring procedures.
In 2011, 2012 and 2013, we invested a total of approximately Ch$48,300 million (approximately Ch$18,400 million, Ch$16,900 million and Ch$13,000 million in 2011, 2012 and 2013, respectively) in information technology, mainly software and hardware, as we believe this is one of the best ways to improve our service quality and operating efficiency. Similarly, we are developing internal processes intended to reduce and keep our expenses under control.
We continue to focus on improving operating efficiency through diverse projects intended to improve the quality and responsiveness of internal operating processes, such as increased automation of back-office matters and the implementation of new IT platforms for financial planning and commercial tasks. We also seek to improve security in transactional services to reduce operational risks, using anti-fraud security software for electronic transfers and other security measures to avoid attacks on our network of ATMs.
27
Table of Contents
As a result of these initiatives, our efficiency ratio, which is the percentage of our consolidated operating expenses to our consolidated operating revenues, has maintained suitable levels over the last three years. During 2011, 2012 and 2013, our efficiency ratio was 47.9%, 46.3% and 41.9%, respectively. Based on information published by the SBIF, under Chilean GAAP, as of December 31, 2013 we had the lowest efficiency ratio in the local banking industry.
| • |
Enhance our Social Reputation |
We believe that improving our social reputation is crucial to meet our strategic goals in the midst of societal changes in Chile and worldwide, so we aim to create improved mechanisms in order to build positive connections with our communities. Therefore, we have undertaken a wide range of initiatives intended to encourage active participation in different areas of society. This view is shared by the Bank and its employees, who support the development of Chile through diverse methods such as promoting social progress, contributing to environmental protection, decreasing extreme poverty, providing high-quality education to needy people, assisting disabled young people, fostering cultural development and embracing campaigns intended to overcome the effects of specific adverse events such as natural disasters. We aim to develop a comprehensive model to consistently manage and control our social reputation to enhance our connections with our communities and soften any adverse reputational effects from banking activities.
In line with this view, during 2013 we continued to support different social endeavors by collaborating with “Desafío Levantemos Chile”, which is an initiative intended to promote entrepreneurship throughout Chile and especially within lower income segments. Thus, in 2013 we supported the creation of a School of Entrepreneurs in Valdivia (southern Chile), which along with other school in Santiago, have permitted to train more than 500 micro-entrepreneurs. In addition, we have maintained our commitment to disabled people by supporting Teleton Foundation assisting disabled children, as well as disable athletes and artists. Similarly, we continued to support needy people by contributing to improve quality of education across lower income segments through Astoreca Foundation. Finally, we are also committed to environmental protection. As a matter of fact, during 2013 we implemented diverse initiatives and promoted an ecological culture across the corporation in order to lower the impact of our operations on the environment.
| • |
Alignment of Human Resources and Culture |
We believe human resources are a key element of our long-term goals. In order to consolidate profitable growth, achieve high standards of service quality, attain operating efficiency and build an excellent corporate reputation over the long run, we must have a motivated and highly qualified workforce that is committed to our corporate values, including ethical conduct, responsibility, integrity, prudence, justice, loyalty and respect.
Accordingly, we strive to develop a distinctive culture among our employees by promoting: (i) a clear focus on the customer, (ii) confidence and responsibility, (iii) leadership and empowerment, (iv) collaboration and teamwork and (v) innovation and continuous improvement.
We also seek to remain one of the most respected employers in Chile. For this reason, we have recently undertaken diverse projects and initiatives intended to emphasize our commitment to recruiting and retaining excellent employees, including a new platform that manages the internal mobility of our employees. Also, we have improved our competence evaluation methodology to identify remarkable employees and enhance their career development. As for training activities, we have continued to focus on generating leadership capabilities through diverse programs. We believe these initiatives are aligned with our strategy and the professional development that our team aspires to achieve.
During 2013 we rethought our business strategy and its connection with our employees in order to align corporate values and goals with carreer development and personal desires of our collaborators. In this vein, our Human Resources Division developed a project intended to define the identity and purpose of each business and back office division within the Bank. This exercise allowed us to enhance values and the alignment of each team with the corporate mission and objectives. Also, training activities continued to be a main focus for us. During 2013 more than 10,300 employees participated in at least one training course.
28
Table of Contents
In addition, quality of life is a keystone for us, as we understand that employees need to develop their life, not only professionally but also in personal terms. Thus, in 2013 we undertook specific projects related to health and wellness for our staff by improving the Comprehensive Insurance policy that benefits them, maintaining a preventive medical assessment program and enhancing our special program of entertainment activities.
All of these achievements translated into a positive response from our staff in the annual survey of employee satisfaction.
Ownership Structure (1)
The following diagram shows our ownership structure as of April 15, 2014:
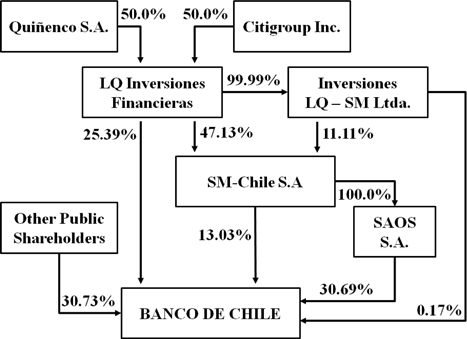
| (1) | The ownership structure diagram reflects share ownership and not voting rights. See “Item 7. Major Shareholders and Related Party Transactions—Major Shareholders.” |
29
Table of Contents
Principal Business Activities
We are a full-service financial institution that provides, directly and indirectly through our subsidiaries and affiliates, a wide variety of lending and non-lending products and services to all segments of the Chilean financial market. Accordingly, for management purposes we organize our operations in the following four business segments:
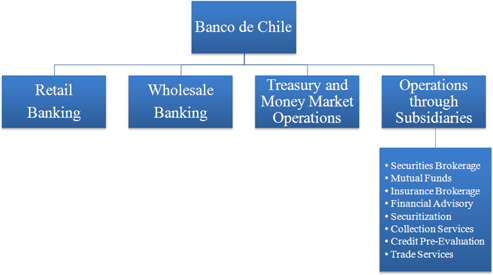
The information related to our business segments presented in this section has been prepared in accordance with our internal reporting policies. See “Item 5. Operating and Financial Review and Prospects—Results of Operations for the Years Ended December 31, 2011, 2012 and 2013—Business Segments” and “Item 5. Operating and Financial Review and Prospects—Results of Operations for the Years Ended December 31, 2011, 2012 and 2013—Summary of Differences between Internal Reporting Policies and IFRS” for a description of the most significant differences between our internal reporting policies and IFRS.
The following table sets forth information on the composition of our loan portfolio and our consolidated income before income tax in accordance with our internal reporting policies for the year ended December 31, 2013, allocated among our principal business segments:
| Total Loans |
Income before
Income Tax (1) |
|||||||||||
| For the Year Ended December 31, 2013 | ||||||||||||
| BANK’S INTERNAL REPORTING POLICIES: | (in millions of Ch$, except percentages) | |||||||||||
|
Retail market |
Ch$ | 10,516,812 | 50.4 | % | Ch$ | 303,235 | ||||||
|
Wholesale market |
10,345,428 | 49.6 | 247,406 | |||||||||
|
Treasury and money market operations |
— | — | 10,096 | |||||||||
|
Operations through subsidiaries |
7,271 | 0.0 | 32,802 | |||||||||
|
Other (Adjustments and Eliminations) |
— | — | — | |||||||||
|
|
|
|
|
|
|
|||||||
|
Total |
Ch$ | 20,869,511 | 100.0 | % | Ch$ | 593,539 | ||||||
|
|
|
|
|
|
|
|||||||
| (1) | This net income breakdown is used for internal reporting and planning purposes and it is based on, among other things, our estimated funding cost and direct and indirect cost allocations. This breakdown may differ in some extents from breakdowns of our operating income for financial reporting and regulatory purposes. Separate information on the operations, assets and income of our financial services subsidiaries and affiliates is provided below under “—Operations through Subsidiaries.” |
30
Table of Contents
The following table sets forth our consolidated operating revenues in accordance with our internal reporting policies, allocated among our principal business segments, for the years indicated:
| For the Year Ended December 31, | ||||||||||||
| 2011 | 2012 | 2013 | ||||||||||
| BANK’S INTERNAL REPORTING POLICIES: | (in millions of Ch$) | |||||||||||
|
Retail market |
Ch$ | 760,542 | Ch$ | 842,088 | Ch$ | 923,222 | ||||||
|
Wholesale market |
289,193 | 338,406 | 403,063 | |||||||||
|
Treasury and money market operations |
31,517 | 32,735 | 16,307 | |||||||||
|
Operations through subsidiaries |
135,727 | 122,698 | 126,576 | |||||||||
|
Other (adjustments and eliminations) |
(11,862 | ) | (13,873 | ) | (13,143 | ) | ||||||
|
|
|
|
|
|
|
|||||||
|
Total Operating Revenues |
Ch$ | 1,205,117 | Ch$ | 1,322,054 | Ch$ | 1,456,025 | ||||||
|
|
|
|
|
|
|
|||||||
The following table sets forth a geographic market breakdown of our operating revenues in accordance with our internal reporting policies for the years indicated:
| For the Year Ended December 31, | ||||||||||||
| 2011 | 2012 | 2013 | ||||||||||
| BANK’S INTERNAL REPORTING POLICIES: | (in millions of Ch$) | |||||||||||
|
Chile |
Ch$ | 1,216,887 | Ch$ | 1,335,862 | Ch$ | 1,469,110 | ||||||
|
Banking operations |
1,081,252 | 1,213,229 | 1,342,592 | |||||||||
|
Operations through subsidiaries |
135,635 | 122,633 | 126,518 | |||||||||
|
Foreign operations |
92 | 65 | 58 | |||||||||
|
Operations through subsidiaries |
92 | 65 | 58 | |||||||||
|
Other (adjustments and eliminations) |
(11,862 | ) | (13,873 | ) | (13,143 | ) | ||||||
|
|
|
|
|
|
|
|||||||
|
Total Operating Revenues |
Ch$ | 1,205,117 | Ch$ | 1,322,054 | Ch$ | 1,456,025 | ||||||
|
|
|
|
|
|
|
|||||||
Retail Banking Segment
Our retail banking segment serves the financial needs of individuals and small and medium-sized companies through our branch network. As of December 30, 2013, we had 285 branches that operate under our “Banco de Chile” and “Banco Edwards|Citi” brand names and 145 branches that operate within the “Banco CrediChile” network. As of December 31, 2013, loans granted to our retail banking segment amounted to Ch$10,516,812 million and represented 50.4% of our total loans as of the same date.
In terms of composition, as set forth in the following table, as of December 31, 2013 our retail segment’s loan portfolio was principally focused on residential mortgage loans, which represented 44.9% of the segment’s loan book. The remaining loans were distributed between consumer (29.0%) and commercial loans (26.1%).
| As of December 31, 2013 | ||||||||
|
(in millions of Ch$, except percentages) |
||||||||
| BANK’S INTERNAL REPORTING POLICIES: | ||||||||
|
Commercial loans |
Ch$ | 2,744,128 | 26.1 | % | ||||
|
Residential mortgage loans |
4,724,263 | 44.9 | ||||||
|
Consumer loans |
3,048,421 | 29.0 | ||||||
|
|
|
|
|
|||||
|
Total |
Ch$ | 10,516,812 | 100.0 | % | ||||
|
|
|
|
|
|||||
We serve the retail market through two different and specialized divisions: (i) the Commercial Division (Individual and SME Banking) and (ii) the Consumer Finance Division (or Banco CrediChile).
31
Table of Contents
Commercial Division (Individual and SME Banking)
The Commercial Division (Individual and SME Banking) is responsible for offering financial services to individuals with monthly incomes over Ch$500,000 (or Ch$6.0 million per year) and to small and medium-sized companies with annual sales of up to approximately Ch$1,600 million. This division manages the portion of our branch network that operates under the brand names “Banco de Chile” and “Banco Edwards Citi” and had 285 branches as of December 31, 2013.
The strategy followed by the Commercial Division (Individual and SME Banking) is mainly focused on sub-segmentation, multi-brand positioning, cross-sell of lending and non-lending products and service quality based on customized service models for specific customer needs. Loyalty programs have been increasingly incorporated into our commercial targets for each sub-segment and they have enabled us to increase the use of our credit cards and our commission–based income. In addition, the division’s operations count on the support of specialized call centers and internet banking services, along with a wide range of management tools that allow us to measure returns, the performance of cross-sold products and the effectiveness of marketing campaigns.
During 2013 we strived to maintain a market-leading position in all of the businesses that we compete in, with a focus on transactional services (credit and debit cards), residential mortgage loans and commercial loans to SMEs. Beyond financial results and market position, we also put significant effort into developing and implementing world-class technological devices intended to improve our service quality standards. In this regard, during 2013 we became the first bank in Chile that issued credit cards with a “security chip”. This device was inserted in order to reduce the rate of fraud in credit cards by securing identity and confidentiality in cash withdrawals and payments.
As of December 31, 2013, the Commercial Division (Individual and SME Banking) served 881,868 individual customers (hereafter “customer” should be understood as the sum of individuals or companies that hold at least a current account, a credit card or a sight account) and 75,237 small and medium-sized Chilean companies. This customer base resulted jointly in total loans granted to 712,550 borrowers, which includes 99,420 residential mortgage loans debtors, 88,742 commercial loan debtors, 369,789 utilized lines of credit, 325,529 installment loans and 1,139,007 credit card accounts. As of the same date, the division held 695,386 current accounts, 146,836 savings accounts and 170,252 time deposits.
As of December 31, 2013, loans granted by our Commercial Division (Individual and SME Banking) accounted for Ch$9,723,637 million represented 46.6% of our total loans and 92.5% of loans granted by our retail market segment. The following table sets forth the composition of the division’s loan portfolio in accordance with our internal reporting policies, as of December 31, 2013:
| As of December 31, 2013 | ||||||||
| BANK’S INTERNAL REPORTING POLICIES: |
(in millions of Ch$, except percentages) |
|||||||
|
Commercial loans |
||||||||
|
Commercial credits |
Ch$ | 2,247,044 | 23.1 | % | ||||
|
Leasing contracts |
286,128 | 2.9 | ||||||
|
Other loans |
192,333 | 2.0 | ||||||
|
Total Commercial Loans |
2,725,505 | 28.0 | ||||||
|
Residential Mortgage Loans |
4,655,994 | 47.9 | ||||||
|
Consumer Loans |
||||||||
|
Installment loans |
1,399,983 | 14.4 | ||||||
|
Credit cards |
702,679 | 7.2 | ||||||
|
Lines of credit and other loans |
239,476 | 2.5 | ||||||
|
Total Consumer Loans |
2,342,138 | 24.1 | ||||||
|
|
|
|
|
|||||
|
Total |
Ch$ | 9,723,637 | 100.0 | % | ||||
|
|
|
|
|
|||||
32
Table of Contents
We offer a variety of financial services to individuals and small and medium-sized companies, directly through the division or indirectly through our subsidiaries, such as current accounts, automatic bill payment, debit cards, credit cards, revolving credit lines, residential mortgage loans, consumer loans, commercial loans, mortgage loans for general purposes, leasing agreements, factoring services, mutual funds management and stock brokerage, support in foreign trade transactions, payments and collections, insurance brokerage (which includes life and casualty insurance), savings instruments and foreign currency services.
Installment Loans
Our consumer installment loans are generally incurred, up to a customer’s approved credit limit, to afford the goods or services purchases, such as cars, travels and household furnishings. Consumer loans may be denominated in both pesos and UF, bear fixed or variable interest rates and are generally repayable in installments over a period of up to 36 months.
As of December 31, 2013, we had Ch$1,399,983 million in installment loans granted by our Commercial Division (Individual and SME Banking), which accounted for 45.9 % of the retail market business segment’s consumer loans. Most of these installment loans are denominated in Chilean pesos and are payable monthly.
Residential Mortgage Loans
As of December 31, 2013, we had outstanding residential mortgage loans of Ch$4,732,307 million, which represented 22.7% of our total loans. According to information published by the SBIF, as of December 31, 2013, we were Chile’s second largest privately owned bank in terms of mortgage loans, accounting for approximately 21.7 % of mortgage loans granted by Chilean privately owned banks, excluding loans granted by Banco del Estado, a government-owned bank, and operations of banks’ subsidiaries that operate abroad.
Our residential mortgage loans are generally denominated in UF and have maturities that range between five and thirty years. As of December 31, 2013, the average residual maturity of our residential mortgage loan portfolio was 17.2 years. Originally, we funded our residential mortgage loans through the issuance of mortgage finance bonds, which are recourse obligations only to us with payment terms that are matched to the residential loans. Also, the mortgage finance bonds bear real market interest rates plus a fixed spread over the variable rate of the UF, which permits us to reduce our exposure to interest rate fluctuations and inflation. Chilean banking regulations allow us to finance up to 100% of a residential mortgage loan with mortgage finance bonds, based on the purchase price of the property securing the loan or the appraised value of such property. In addition, we generally require that the monthly payments on a residential mortgage loan not exceed 25% of the borrower’s household after-tax monthly income, when the customer belongs to the low-income population segment. However, that limit may be adjusted for the middle and high-income population segments.
Over the last decade, we have also promoted the expansion of Mutuos Hipotecarios , a mortgage-lending product, which is not financed by mortgage finance bonds, but instead through our general funds. Mutuos Hipotecarios allow customers to finance up to 100% of the purchase price or the appraised value of the property, whichever is lower, instead of the 75% that a standard mortgage would allow. As of December 31, 2013, our residential mortgage loan portfolio was principally composed of Mutuos Hipotecarios , as customers have preferred them due to their flexibility and simplicity (for instance the interest rate is known in advance by the customer), as they permit financing of up to 100% of the properties purchase price and are easier to prepay.
33
Table of Contents
The following table sets forth the composition of our residential mortgage loan portfolio by product type:
| As of December 31, 2013 | ||||||||
| BANK’S INTERNAL REPORTING POLICIES: |
(in millions of Ch$, except percentages) |
|||||||
|
Secured Residential Mortgage Loans (1) |
||||||||
|
Loans financed with Mortgage Bonds |
Ch$ | 87,354 | 1.8 | % | ||||
|
Mutuos Hipotecarios |
4,644,953 | 98.2 | ||||||
|
|
|
|
|
|||||
|
Total Secured Residential Mortgage Loans |
Ch$ | 4,732,307 | 100.0 | % | ||||
|
|
|
|
|
|||||
| (1) | Correspond to the Bank’s total secured residential mortgage loans and not only those associated with the Commercial Division (Individual and SME Banking). |
As shown above, as of December 31, 2013 residential mortgage loans related to Mutuos Hipotecarios represented 98.2% of our total residential mortgage loan portfolio, while the remaining 1.8% corresponded to mortgage loans financed with Mortgage Bonds. As of the same date, the Mutuos Hipotecarios portfolio had an average origination period of 3.9 years (the period from the date when the loans were granted to the specified date) and just 1.0% of these loans were granted by CrediChile. Conversely, as of December 31, 2013 loans financed with Mortgage Bonds had an average origination period of 13.1 years (the period from the date when the loans were granted) and 25.2% of these loans were granted by CrediChile. In terms of credit risk, in 2013, loans related to Mutuos Hipotecarios, as well as those financed with Mortgage Bonds, had low gross (before recoveries) credit risk ratios of 0.13% and 0.20%, respectively. The difference between both ratios is explained by the previously mentioned factors and also by the Bank’s stricter requirements to grant Mutuos Hipotecarios that may finance up to 100% of the property’s purchase price. It is important to mention that the residential mortgage loan portfolio financed with Mortgage Bonds is annually decreasing in amount and as a proportion of the total residential mortgage loan portfolio, since currently customers prefer Mutuos Hipotecarios . Accordingly, the portfolio of residential mortgage loans financed with Mortgage Bonds is expected to have increasing gross credit risk ratios over time until its expiration, because the proportion of non-performing loans becomes higher as long as responsible borrowers terminate their liability with the bank.
Regarding Mortgage Bonds that finance residential mortgage loans, the Bank is solely responsible for the payment of the Mortgage Bond obligation to the mortgage bond holders, regardless of the payment behavior of the residential mortgage borrower. Accordingly, in the ordinary course of business, none of our residential mortgage loans serves as a guarantee or collateral for our mortgage bonds.
For those loans that finance a higher portion of the property appraised value, we demand that customers comply with stricter requirements, which are verified during the credit assessment stage. These requirements are related to: (i) the history of the relationship between the Bank and the customer (new or current client), (ii) credit risk scores, (iii) monthly income, (iv) type of job (employed or self-employed), and (v) years employed. In order to illustrate the above mentioned, the table below sets forth an example of requirements for residential mortgage loans that finance up to 90% and more than 90% of the property value, with a common term and granted to employed as well as self-employed new customers.
|
Credit–granting Requirements (in millions of Ch$, except percentages) |
||||
|
New Clients |
Requirements
(in millions of Ch$, except percentages) |
|||
|
Loan / Property value |
£ 90% | > 90% | ||
|
Employed |
||||
|
• Years employed |
> 1 year | > 1 year | ||
|
• Monthly Income |
> Ch$0.5 | > Ch$1.3 | ||
|
Self-Employed |
||||
|
• Years Employed (1) |
> 2 years | > 2 years | ||
|
• Monthly Income |
> Ch$0.5 | > Ch$1.3 | ||
| (1) | In case of self-employed clients, years employed refers to the minimum period of time in which the customer has been filing annual tax declarations with the Chilean Internal Revenue Service. |
34
Table of Contents
During 2013, 33.4% of the residential mortgage loans granted to our customers financed between 90% and 100% of the property value. Similarly, during 2013, loans financing between 75% and 90% of the property appraised value represented 30.7% of these loans, loans financing between 50% and 75% of the property value represented 18.7% of these loans, and loans financing less than 50% of the property value represented 17.2% of these loans. It is important to mention that during 2013 we tightened our credit-granting policy for residential mortgage loans, principally by restricting loan financing to up to 100% of the property’s value. This explains the decrease in the share of residential mortgage loans that financed between 90% and 100% of the property value from 46.8% in 2012 to 33.4% in 2013.
An additional feature of our mortgage loans is that mortgaged property typically secures all of the mortgagor’s credit with us, including installment loans and due balances associated with credit cards and credit lines. Our total amount of loans secured by real estate guarantees, their loan-to-value (LTV) ratio and their relative share in our total loan portfolio, as of December 31, 2013, are depicted in the table below:
| As of December 31, 2013 | ||||||||||||
|
Outstanding
Balance |
LTV (2)(3 ) |
% of Bank’s
Total Loans |
||||||||||
| BANK’S INTERNAL REPORTING POLICIES: | (in millions of Ch$, except percentages) | |||||||||||
|
Secured Loans (1) |
||||||||||||
|
Residential Mortgage Loans |
Ch$ | 4,732,307 | 70.1 | % | 22.7 | % | ||||||
|
Other than mortgage loans |
563,575 | 27.9 | 2.7 | |||||||||
|
|
|
|
|
|
|
|||||||
|
Total Secured Loans |
Ch$ | 5,295,882 | 78.4 | % | 25.4 | % | ||||||
|
|
|
|
|
|
|
|||||||
| (1) | Correspond to Bank’s total secured loans and not only those associated with the Commercial Division (Individual and SME Banking). |
| (2) | Unless otherwise indicated, LTV ratio is computed as the amount of secured loans divided by the value of their associated collateral. |
| (3) | For other-than-mortgage loans, the LTV ratio is computed as the amount of the excess guarantee (after deductions) of the balance of the associated residential mortgage loans, as those guarantees are initially established in order to secure the residential mortgage loan. |
The LTV ratios provided above are based on estimated property values that we update monthly with the collateral valuation models managed by our Corporate Risk Division. These models determine a rate of depreciation that provides an updated collateral value, based on variables such as geographic location, last appraisal date, type of property and type of customer. Accordingly, the LTV ratios set forth above take into account the most recent available data regarding collateral values.
In addition, the following table sets forth the composition of the other-than-mortgage loans secured by real estate guarantees:
| As of December 31, 2013 | ||||||||
| BANK’S INTERNAL REPORTING POLICIES: |
(in millions of Ch$, except percentages) |
|||||||
|
Secured Other-than-Mortgage Loans (1) |
||||||||
|
Consumer Loans |
Ch$ | 372,677 | 66.1 | % | ||||
|
Credit Lines |
48,743 | 8.7 | ||||||
|
Credit Cards |
142,155 | 25.2 | ||||||
|
|
|
|
|
|||||
|
Total Secured Other-than-Mortgage Loans |
Ch$ | 563,575 | 100.0 | % | ||||
|
|
|
|
|
|||||
| (1) | Correspond to Bank’s total secured Other-than-Mortgage Loans and not only those associated with the Commercial Division (Individual and SME Banking). |
Unlike in other countries, in addition to the specific legal rights afforded by the mortgage loan (including foreclosure rights), the Bank may collect the pending balance of the mortgage loan over other assets of the mortgage debtor based on certain legal liens provided by law ( derecho de prenda general ). Regarding the foreclosure processes, as permitted by Chilean regulations we may write-off secured loans (such as residential mortgage loans) the earlier of 48 months from the date the loans become overdue and once we have made all efforts for recovering the past due loan without success. This applies to residential mortgage loans financed with mortgage finance bonds as well as for Mutuos Hipotecarios . Our foreclosure processes comply with the procedures specified by Chilean regulation. However, as we strive to continuously improve our collection processes, we have achieved average terms of 30 months for foreclosures associated with residential mortgage loans.
35
Table of Contents
As for our historical loss rates, we periodically review our collateral pricing models by adjusting the parameters that support them, such as appreciation and depreciation rates, as well as updated recovery and loss rates, based on historical and empirical data. Thus, we normally revise our collateral pricing models by incorporating updated information from re-appraised assets or foreclosure processes that have been completed by the Bank in the past.
In addition, the valuation of guarantees is based on a prudent approach, which aims to anticipate and cover unexpected reductions in their market price as a result of changes in market variables, such as an unforeseen slowdown in the global or local economy, lack of liquidity of real estate assets or decrease in real salaries. Accordingly, our collateral pricing models depreciate the value of the guarantee regarding the market value determined by an independent appraiser. This approach has allowed us to minimize the loss rates, as the value obtained from auctions (if foreclosure applies) generally exceeds the value assigned to the asset as guarantee.
Credit Cards
As of December 31, 2013, we issued both individual and corporate Visa, MasterCard and Diners credit cards. In addition to traditional credit cards, our portfolio also includes co-branded cards (e.g., “Travel Club,” “Global Pass,” and “Advantage,” among others), and 63 affinity card groups, most of which were associated with our co-branded programs.
Two of our affiliates, Transbank S.A. and Nexus S.A., provide us with merchant acquisition and credit card processing services. As of December 31, 2013, Transbank S.A. had twelve shareholders and Nexus S.A. had seven shareholders, all of which were banks. As of the same date, our equity ownership in Transbank S.A. was 26.2% and our equity ownership in Nexus S.A. was 25.8 %
As of December 31, 2013, the Commercial Division had 1,139,007 valid credit card accounts, with 1,304,090 credit cards issued to individuals and small and medium-sized companies. Total charges on our credit cards during 2013 amounted to Ch$2,475,256 million, with Ch$2,031,034 million corresponding to purchases and service payments in Chile and abroad and Ch$444,222 million corresponding to cash advances both within Chile and abroad. These amounts of purchases and withdrawals (which do not include charges associated with credit cards issued by CrediChile) accounted for 25.9% of the total charge volume of banks’ credit cards issued in Chile in 2013, according to statistics provided by Transbank S.A.
As of December 31, 2013, our credit card loans to individuals and small and medium-sized companies amounted to Ch$702,679 million and represented 23.1% of our retail market business segment’s consumer loans.
We believe that the Chilean market for credit cards has a high growth potential, especially among lower- and middle-income customer segments, as the average merchant fees should continue to decline due to increasing competition from other banks that operate in Chile, as well as large department stores and other non-banking competitors that are involved in the issuance of credit cards. As a result, in 2010 we created a new Credit and Debit Card Area, which is responsible for developing commercial strategies to reinforce this payment channel by supporting the activities carried out by our Commercial Division (Individual and SME Banking). Based on this strategy, the mentioned business unit issued roughly 100,864 new credit cards in 2013 and consolidated the strategic alliance settled in 2011 with a mobile phone provider that resulted in the new “Banco de Chile | Entel” credit card.
Commercial Credits
Commercial loans granted by our Commercial Division (Individual and SME Banking) mainly consist of project financing and working capital loans granted to small and medium-sized companies, which are denominated in Chilean pesos, UF and U.S. dollars and may bear fixed or variable rates of interest and generally mature between one and three months. As of December 31, 2013, our Commercial Division (Individual and SME Banking) had outstanding commercial loans of Ch$2,247,044 million, representing 21.4% of the retail market business segment’s total loans and 10.8% of our total loans as of the same date.
36
Table of Contents
Leasing Contracts
Leasing contracts are financial leases for capital equipment and property. Leasing contracts may bear fixed or variable interest rates and they generally have terms that range from one to five years for equipment and from five to twenty years for properties. Most of these contracts are denominated in UF. As of December 31, 2013, our Commercial Division (Individual and SME Banking) had outstanding leasing contracts of Ch$286,128 million, representing 2.7% of the retail market business segment’s total loans and 1.4% of our total loans as of the same date.
Non-Residential Mortgage Loans
Non-residential mortgage loans granted to individuals and small- and medium-sized companies are loans intended to finance the acquisition of offices, land, facilities and other real estate assets. Non-residential mortgage loans are denominated in UF and generally have maturities between eight and twelve years. As of December 31, 2013, our Commercial Division (Individual and SME Banking) had non-residential mortgage loans of approximately Ch$43,827 million, representing 0.4% of the retail market business segment’s total loans and 0.2% of our total loans as of the same date.
Debit Cards
We offer different types of debit cards to our customers. Depending on their specifications, these cards can be used for banking transactions at ATMs that operate on the local network, such as Redbanc, the Visa International PLUS network, the local network of merchants participating in the local Redcompra debit program or the international network of merchants associated with the Electron program. We have given different names to these debit cards depending on the card’s specific functions and the link between the brand and target market which they serve. During 2013, we offered the following cards: Chilecard Electron, Chilecard Plus, Chilecard Normal, Banjoven, Multiedwards and Citicard . As of December 31, 2013, according to monthly statistics provided by Transbank S.A., the division had a 16.5% market share of debit card purchase transactions (not including debit cards issued by Banco CrediChile, as those are reported under our Consumer Finance Division), which corresponds to approximately 66.7 million transactions throughout the year.
Lines of Credit
The Commercial Division had approximately 596,857 approved lines of credit to individual customers and small and medium-sized companies as of December 31, 2013, and outstanding advances to 369,789 individual customers and small and medium-sized companies that totaled Ch$239,489 million, or 2.3% of the retail market business segment’s total loans and 1.1% of our total loans.
Our lines of credit for individual customers are generally available on a revolving basis, up to an approved credit limit, and may be used for any purpose. Advances under lines of credit are denominated in Chilean pesos and bear an interest rate that is set monthly.
Deposit Products
We strategically offer deposit products to increase our deposit-taking activities as a means of diversifying our sources of funding. We believe that the deposits of our individual customers provide us with a relatively low-cost, stable source of funding, as well as an opportunity to cross-market our other products and services. In this regard, we offer current accounts, time deposits and savings accounts to our individual customers. Current accounts are Chilean peso-denominated and the majority bear no interest (approximately 0.1% of our total current accounts are interest-bearing), and savings accounts are denominated in UF and bear a fixed-interest rate. Time deposits may be denominated in Chilean pesos, UF and U.S. dollars and most bear interest at a fixed rate with terms that range between thirty to 360 days.
While historically demand has been mainly for UF-denominated deposits during periods of high inflation, demand for Chilean peso-denominated deposits has increased in recent years as a consequence of lower and more stable inflation rates in Chile. This trend was also observed during the financial crisis of 2008 and 2009, when we benefited from a flight-to-quality effect. Due to the high volatility observed in the financial markets and low interest rates (in line with monetary stimulus prompted by central banks worldwide) customers and non-customers increasingly deposited their funds in our current accounts, particularly those denominated in Chilean pesos, as inflation was negative.
37
Table of Contents
Consumer Finance Division (Banco CrediChile)
The Consumer Finance Division provides loans and other financial services to low and middle-income segments (individuals whose monthly incomes range from Ch$170,000 to Ch$ 500,000), which historically have only been partially served by financial institutions. Also, our Consumer Finance Division serves micro-businesses. Banco CrediChile represents an alternative delivery channel for our products and services to these segments, maintaining a separate brand supported by a network of 145 Banco CrediChile branches as of December 31, 2013. Banco CrediChile was established in 2004 from what was formerly our consumer banking division. During 2008, Banco CrediChile was merged with the consumer division of Citibank Chile (Corporación Financiera Atlas S.A.) as a consequence of our merger with Citibank Chile.
Banco CrediChile offers its customers a variety of banking products, such as consumer loans, credit cards, residential mortgage loans and a special demand deposit account (see “—CrediChile Sight Accounts”) targeted at low-income customers. As of December 31, 2013, Banco CrediChile had 900,882 customers and total loans outstanding that amounted to Ch$793,175 million, representing 3.8% of our total loans outstanding as of the same date.
The following table sets forth the composition of Banco CrediChile’s loan portfolio in accordance with our internal reporting policies, as of December 31, 2013:
| As of December 31, 2013 | ||||||||
| BANK’S INTERNAL REPORTING POLICIES: |
(in millions of Ch$, except percentages) |
|||||||
|
Consumer loans |
||||||||
|
Installment loans |
Ch$ | 626,786 | 79.0 | % | ||||
|
Credit cards |
79,137 | 10.0 | ||||||
|
Lines of credit |
360 | 0.0 | ||||||
|
|
|
|
|
|||||
|
Total consumer loans |
706,283 | 89.0 | ||||||
|
Residential mortgage loans |
68,269 | 8.6 | ||||||
|
Commercial loans |
18,623 | 2.4 | ||||||
|
|
|
|
|
|||||
|
Total |
Ch$ | 793,175 | 100.0 | % | ||||
|
|
|
|
|
|||||
Our Consumer Finance Division focuses on developing and marketing innovative and customized products targeted to satisfy the needs of its customers while introducing them to the banking system. Banco CrediChile complements the services offered by our other business segments, especially our wholesale market segment, by offering services to employers, such as direct deposit capabilities, that stimulate the use of our services by employees.
In order to improve its value offering, during 2012 CrediChile launched two new services, namely, ‘Caja Chile’ and ‘Microenterprises Banking’. The former consists of a limited range of basic financial services (e.g. deposits, withdrawals and bill payments) offered to customers and non-customers through remote IT platforms located in small convenience stores within socially and/or geographically isolated areas of Chile. On the other hand, the ‘Microenterprises Banking’ is a specialized portfolio of financial services designed for Microenterprises (generally personal businesses) that includes financial advisory, lending and non-lending products and general financial solutions for a segment that has been traditionally uncovered by the banking services. During 2013, Banco CrediChile continued to enhance these service models as we believe they are a suitable means to penetrate those segments by offering tailor-made solutions. As of December 31, 2013 Banco CrediChile had implemented the ‘Caja Chile’ solution in more than 2,000 convenience stores, within 255 communities throughout Chile. As of the same date, approximately 17,200 microenterprises customers were part of the division’s customer base. In addition, during 2013 Banco CrediChile started an internal process intended to design and define new segments within the Consumer Finance business, in order to better serve the needs of diverse segments and offer a more complete array of services.
The SBIF requires higher allowances for loan losses for those banks with low credit classifications. This is the case for Banco CrediChile, which employs a specific credit scoring system, developed by our corporate risk division, as well as other criteria to evaluate and monitor credit risk. Thus, in order to ensure the quality of its loan portfolio, Banco CrediChile adheres to our general loan origination procedures, particularly with regard to the use of our credit scoring system and credit management policies, including the use of credit bureaus and the services of the SBIF. In addition, Banco CrediChile carries out rigorous procedures for collection of past-due loans through Socofin S.A., our specialized collection subsidiary. We believe that we have suitable procedures and infrastructure in place to manage the risk exposure of Banco CrediChile. These procedures allow us to take advantage of the attractive
38
Table of Contents
growth and earnings potential of this market segment while helping to manage exposure to higher risk. See “Item 3. Key Information—Risk Factors—Risks Relating to our Operations and the Chilean Banking Industry—The growth of our loan portfolio may expose us to increased loan losses” and “Item 3. Key Information—Risk Factors—Risks Relating to our Operations and the Chilean Banking Industry— Our loan portfolio may not continue to grow at the same or similar rate.”
Consumer Lending
Banco CrediChile provides short to medium-term consumer loans and credit card services. As of December 31, 2013, Banco CrediChile had approximately 340,625 consumer loan debtors related to credits with outstanding balances of Ch$626,786 million. As of the same date, Banco CrediChile customers had 323,494 valid credit card accounts, with total outstanding balances of Ch$79,137 million.
CrediChile Sight Accounts
Banco CrediChile offers its customers CrediChile Sight Accounts, a basic deposit product that is flexible and easy to use. This product allows us to tap into a section of the consumer market that previously was not participating in the banking system. The CrediChile Sight Account is a non-interest bearing demand deposit account without checking privileges targeted at customers who want a secure and comfortable means of managing and accessing their money. Customers may use an ATM card linked to their Sight Account (which may include a revolving line of credit) to make deposits or automatic payments to other Banco CrediChile accounts through a network of 6,397 ATMs available through the Redbanc network as of December 31, 2013.
As of December 31, 2013, Banco CrediChile had approximately 844,587 sight accounts. Holders of these sight accounts pay an annual fee, a fee related to the number of withdrawals on the sight account line of credit and interest on any outstanding balance under the line of credit. All fees and interest due on a CrediChile Sight Account are withdrawn automatically on a monthly basis from funds available in the account. CrediChile Sight Account allows us to offer our wholesale customers the ability to pay their employees by direct deposit of funds into the individual employee’s account at Banco CrediChile. We believe this product can lead to stronger long-term relationships with our wholesale customers and their employees.
Wholesale Banking Segment
Our wholesale market business segment serves the needs of corporate customers. In 2013, this business segment recorded annual operating revenues of approximately Ch$ 403,063 million, which represented 27.7% of our total operating revenues, and annual income before income tax of Ch$247,406 million, which represented 41.7% of our consolidated income before income tax. As of December 31, 2013, loans granted by this business segment amounted to Ch$ 10,345,428 million and represented 49.6% of our total loan portfolio.
The following table sets forth the composition of our portfolio of loans to the wholesale market in accordance with our internal reporting policies, as of December 31, 2013:
| As of December 31, 2013 | ||||||||
| BANK’S INTERNAL REPORTING POLICIES: |
(in millions of Ch$, except percentages) |
|||||||
|
Commercial credits |
Ch$ | 7,615,956 | 73.6 | % | ||||
|
Foreign trade loans |
1,116,157 | 10.8 | ||||||
|
Leasing loans |
923,585 | 8.9 | ||||||
|
Factoring loans |
471,562 | 4.6 | ||||||
|
Other loans |
218,168 | 2.1 | ||||||
|
|
|
|
|
|||||
|
Total |
Ch$ | 10,345,428 | 100.0 | % | ||||
|
|
|
|
|
|||||
39
Table of Contents
As of December 31, 2013, we had 10,064 debtors out of a total of 23,798 wholesale customers. Our wholesale customers are engaged in a wide range of economic sectors. As of December 31, 2013, this business segment’s loans were mainly related to:
| • |
financial services (approximately 26.7% of all loans granted by this business segment); |
| • |
commerce and trade (approximately 17.7% of all loans granted by this business segment); |
| • |
manufacturing (approximately 13.1% of all loans granted by this business segment); |
| • |
communication and transportation (approximately 12.5% of all loans granted by this business segment); |
| • |
construction (approximately 12.1% of all loans granted by this business segment); |
| • |
agriculture, forestry and fishing (approximately 3.8% of all loans granted by this business segment); |
| • |
community, social and personal services (approximately 3.8% of all loans granted by this business segment); and |
| • |
mining (approximately 0.9% of all loans granted by this business segment). |
In line with our strategy of identifying and differentiating market segments in order to provide improved value propositions for a diversified customer base, we have defined two divisions within the wholesale market segment based on annual sales: (i) the Corporate Division and (ii) the Large Companies and Real Estate Division.
Corporate Division
The Corporate Division provides services to corporations whose annual sales exceed approximately Ch$70,000 million. This division’s customers consist of a large proportion of Chile’s publicly-traded companies, subsidiaries of multinational companies and conglomerates (including those operating in the financial, commercial, manufacturing, industrial and infrastructure sectors), and projects and concessions.
As of December 31, 2013, we had 810 corporations as debtors out of a total of 5,281 customers in our Corporate Division with total outstanding loans of Ch$3,942,250 million, which represented 18.9% of our total loan book as of the same date.
The following table sets forth the composition of our Corporate Division’s loan portfolio in accordance with our internal reporting policies, as of December 31, 2013:
| As of December 31, 2013 | ||||||||
| BANK’S INTERNAL REPORTING POLICIES: |
(in millions of Ch$, except percentages) |
|||||||
|
Commercial credits |
Ch$ | 3,233,929 | 82.0 | % | ||||
|
Foreign trade loans |
365,095 | 9.3 | ||||||
|
Factoring loans |
137,816 | 3.5 | ||||||
|
Leasing loans |
63,262 | 1.6 | ||||||
|
Other loans |
142,148 | 3.6 | ||||||
|
|
|
|
|
|||||
|
Total |
Ch$ | 3,942,250 | 100.0 | % | ||||
|
|
|
|
|
|||||
We offer a wide range of products to large corporations that include short- and long-term financing, working capital loans, mortgage loans, leasing, long-term syndicated loans and factoring, as well as investment banking services offered by our subsidiary Banchile Asesoría Financiera S.A. We also offer payment services (payrolls, suppliers, pensions, dividends, etc.), collection services and connections to international funds transfer networks, as well as traditional deposit products, in particular current accounts.
As of December 31, 2013, we were party to approximately 1,188 payment service contracts and approximately 207 collection service agreements with corporations. We believe that cash management and payment service contracts provide us with a source of low-cost deposits and the opportunity to cross-sell our products and fees to payees, many of whom maintain accounts with us. Under our collection contracts, we act as a collection agent for our corporate customers, providing centralized collection services for their accounts receivable and other similar payments. For the year ended December 31, 2013, volumes associated with payment and collection agreements increased by approximately 28.9% and 29.1%, respectively.
40
Table of Contents
In order to provide highly competitive and differentiated services, our Corporate Division has the direct support of our Treasury and Money Market Operations segment, which directly fulfills our corporate customers’ liquidity, short-term loans and hedging needs. We have also improved our technology to facilitate connections with customers and enhance their self-service practices. Similarly, we offer derivative products, which we believe have become increasingly important, especially those associated with Chilean peso-U.S. dollar and UF-U.S. dollar forward contracts and interest rate swaps.
In recent years, the market for loans to corporations in Chile has been characterized by reduced margins that have been associated with increasing competition. This fierce competition has involved not only local banking players but also, increasingly, overseas lenders who are eager to lend to Chilean businesses. Consequently, we have focused on optimizing the profitability in this segment through enhancing our cross-sell fee generating services, such as payroll processing, dividend payments and billing services, as well as computer banking services. This strategy has enabled us to maintain profitable relationships with our corporate customers while preserving the ability to extend credit when appropriate business opportunities arise.
During 2013, the division continued to enrich its value propositions for satisfying customers’ needs. Thus, the Corporate Division, in association with our Financial Advisory subsidiary, focused on assisting some of its customers in international debt issuances. Similarly, the division has strived to build tailored solutions for its customers, including bridge financing, sindicated and cross-border loans. These initiatives allowed the division to increase the segment penetration by approximately 40 basis points in 2013 as compared to 2012. Finally, it is also worth noting that this division was in charge of managing the Global Depositary Notes program subscribed by the Bank. Banco de Chile became the first local bank in implementing this kind of service for overseas investors. In all of these matters, the synergies that arise from the Global Connectivity Agreement with Citigroup have been crucial when assisting our corporate customers with off-shore transactions.
Large Companies and Real Estate Division
Our Large Companies and Real Estate Division provides a broad range of financial products and services (such as electronic banking, leasing, foreign trade and financial consultancy) to companies with annual sales that range from approximately Ch$1,600 million to approximately Ch$70,000 million. Customers served by this division are those related to the commercial, manufacturing, agricultural, forestry, fishing, infrastructure and real estate sectors.
As of December 31, 2013, we had 9,254 large companies and real estate debtors out of a total of 18,517 customers in this Division. Loans granted by the Large Companies and Real Estate Division amounted to Ch$6,403,178 million as of the same date, which represented 30.7% of our total loans.
The following table sets forth the composition of the Large Companies and Real Estate Division’s loan portfolio in accordance with our internal reporting policies, as of December 31, 2013:
| As of December 31, 2013 | ||||||||
| BANK’S INTERNAL REPORTING POLICIES: |
(in millions of Ch$, except percentages) |
|||||||
|
Commercial credits |
Ch$ | 4,382,027 | 68.4 | % | ||||
|
Leasing loans |
860,323 | 13.5 | ||||||
|
Foreign trade loans |
751,062 | 11.7 | ||||||
|
Factoring loans |
333,746 | 5.2 | ||||||
|
Other loans |
76,020 | 1.2 | ||||||
|
|
|
|
|
|||||
|
Total |
Ch$ | 6,403,178 | 100.0 | % | ||||
|
|
|
|
|
|||||
The products and services offered by this division are mainly related to commercial loans, lines of credit, foreign trade and foreign currency transactions, factoring services, leasing, mortgage loans, syndicated loans, mergers and acquisitions, debt restructuring assistance, payments and collections services, current accounts and related services, corporate credit cards, cash and investment management, forward contracts to hedge against currency fluctuations and insurance brokerage.
41
Table of Contents
This division’s aim is to deliver exceptional service to its customers based on proactive financial support that enhances long-term relationships with customers. Over time, the division has developed service models intended to take advantage of synergies arising from the interaction of account and specialized support executives responsible for ensuring comprehensive customer service. These models have enabled the division to strengthen customer relationships and product offerings.
In 2013 the division continued strengthening its presence in commercial credits, with a 34.6% annual increase in loan balances. This significant loan growth includes part of a loan portfolio acquisition from a local competitor in a total amount of approximately Ch$500,000 million. Nevertheless, adjusted by this purchase, the division would have also recorded a double-digit growth rate in commercial loans. In addition, the division was focused on promoting alternative funding sources for its customers. As a result, loans associated with leasing contracts recorded a 9.0% annual rise in outstanding balances.
Our leasing segment is part of the Large Companies and Real Estate Division. Similarly, our factoring business is mainly associated with loan activity related to the Large Companies and Real Estate Division. Finally, in our aim to continuously improve our knowledge of customers’ needs, during 2013 the division improved the level of segmentation for its customer base by recognizing a new segment called “family offices.” This segment involves companies that manage investments and trusts for a single family with total assets above a specific amount of money. Through this initiative, we aim to provide these customers with specific and tailor-made solutions without affecting the relationship between the bank and the companies owned by these families, which are already served by other bank’s divisions.
Treasury and Money Markets Operations
Our Treasury and Money Market Operations business segment provides a wide range of financial services to our customers, including currency intermediation, forward contracts, interest rate swaps, transactions under repurchase agreements and investment products based on bonds, mortgage finance bonds and deposits.
In addition, our Treasury and Money Market Operations business segment is focused on managing our currency, interest rate and maturity gaps, ensuring adequate liquidity levels, managing our investment portfolio and performing the intermediation of fixed-income instruments, currencies and derivatives. Interest rate gap management is aimed at generating an adequate funding structure, prioritizing our capitalization and asset and liability cost structure and funding source diversification.
The Treasury and Money Market Operations business segment is also responsible for (i) the issuance of short- and long-term senior bonds, as well as long-term subordinated bonds, in Chile or abroad, (ii) monitoring compliance with regulatory deposit limits, technical reserves and maturity and rate matches/mismatches, (iii) monitoring our adherence to the security margins defined by regulatory limits, and risk limits for interest rate, currency and investment gaps. This segment continually monitors the Bank’s cost of funding by benchmarking with the rest of the local financial system and financing alternatives in Chile or abroad.
Regarding funding functions carried out by our Treasury, during 2013, we continued to develop a funding diversification strategy by conducting important transactions. These transactions have been intended to not only take advantage of attractive interest rate opportunities but also to improve our liquidity standards by issuing debt of longer maturities, as well as diversify our liability structure in terms of markets. Accordingly, during 2013 we carried out important international bond issuances in markets like Japan (U.S.$167 million) and Hong Kong (U.S.$168 million) under a MTN program. Similarly, we undertook four bond placements in Switzerland (U.S.$785 million). Also, we issued new short-term bonds under the U.S.$1,000 million Commercial Paper program that we maintain in the U.S. As of December 31, 2013 we had a year-end balance of commercial paper that amounted to approximately U.S.$400 million. Lastly, worth noting is that as required by our Board of Directors, an international bond issuance is carried out if and only if its cost (including costs of interest rate swaps) is below the cost of raising funds locally and the currency or interest rate exposure is fully hedged via cross-currency swaps.
42
Table of Contents
The funding functions carried out by our Treasury division are complemented by our international area, namely International Financial Institutions (“IFI”), which manages relations with correspondent banks worldwide, facilitating international payments and obtaining foreign currency financing for us. As of December 31, 2013, we have established a network of approximately 600 foreign banks, among which we maintained credit relationships with approximately 180 correspondent banks, from which we maintained 37 account relationships. IFI played an important role in structuring international transactions aimed at diversifying our funding.
Regarding the management of our securities portfolio, as of December 31, 2013 it amounted to Ch$ 2,008,804 million and was composed of available-for-sale securities that totaled Ch$1,681,883 million and securities held for trading that amounted to Ch$326,921 million. As for the type of instruments included in our securities portfolio, as of December 31, 2013, 54.8% consisted of securities issued by local financial institutions, 32.4% consisted of securities issued by the Central Bank and the Chilean Government, 9.0% consisted of securities issued by non-financial Chilean corporate issuers and other securities and 3.8% consisted of securities from foreign issuers. Our investment strategy is designed to supplement our expected profitability, risks and economic variable projections while adhering to the regulatory guidelines and internal limits defined by our finance committee. In this regard, neither proprietary trading nor speculation on equity holdings are goals for us and, therefore, equity instruments only represented 0.4% of our investment portfolio as of December 31, 2013.
Operations through Subsidiaries
We have made several strategic long-term investments in financial services companies that are engaged in activities complementary to our commercial banking activities. In making these investments our goal is to develop a comprehensive financial group capable of meeting the diverse financial needs of our current and potential clients by offering traditional banking products and specialized financial services through our different subsidiaries.
On June 19, 2013, Banco de Chile acquired all of the shares of Banchile Factoring S.A. owned by Banchile Asesoría Financiera. As a result of this transaction, Banco de Chile fully acquired the assets and liabilities of Banchile Factoring S.A. and on June 30, 2013 this subsidiary was dissolved. See “Item 5. Operating and Financial Review and Prospects—Results of Operations for the Years Ended December 31, 2011, 2012 and 2013—Business Segments”.
The following table sets forth information with respect to our financial services subsidiaries in accordance with our internal reporting policies as of December 31, 2013:
| BANK’S INTERNAL REPORTING POLICIES: | Assets | Equity | Net Income | |||||||||
| (in millions of Ch$) | ||||||||||||
|
Banchile Trade Services Limited (Hong Kong) |
Ch$ | 864 | Ch$ | 848 | Ch$ | 36 | ||||||
|
Banchile Administradora General de Fondos S.A . |
59,749 | 53,030 | 11,641 | |||||||||
|
Banchile Asesoría Financiera S.A. |
4,558 | 3,754 | 2,012 | |||||||||
|
Banchile Corredores de Seguros Ltda |
10,558 | 8,673 | 3,907 | |||||||||
|
Banchile Corredores de Bolsa S.A |
547,929 | 83,355 | 9,327 | |||||||||
|
Banchile Securitizadora S.A. |
410 | 311 | (111 | ) | ||||||||
|
Socofin S.A |
8,382 | 955 | 253 | |||||||||
|
Promarket S.A |
2,016 | 914 | 79 | |||||||||
|
|
|
|
|
|
|
|||||||
|
Total |
Ch$ | 634,466 | Ch$ | 151,840 | Ch$ | 27,144 | ||||||
|
|
|
|
|
|
|
|||||||
43
Table of Contents
The following table sets forth information with respect to our ownership interest in our financial services subsidiaries as of December 31, 2013:
| Ownership Interest | ||||||||||||
| Direct (%) | Indirect (%) | Total (%) | ||||||||||
|
Banchile Trade Services Limited (Hong Kong) |
100.00 | — | 100.00 | |||||||||
|
Banchile Administradora General de Fondos S.A . |
99.98 | 0.02 | 100.00 | |||||||||
|
Banchile Asesoría Financiera S.A. |
99.96 | — | 99.96 | |||||||||
|
Banchile Corredores de Seguros Ltda. |
99.83 | 0.17 | 100.00 | |||||||||
|
Banchile Corredores de Bolsa S.A . |
99.70 | 0.30 | 100.00 | |||||||||
|
Banchile Securitizadora S.A . |
99.00 | 1.00 | 100.00 | |||||||||
|
Socofin S.A. |
99.00 | 1.00 | 100.00 | |||||||||
|
Promarket S.A. |
99.00 | 1.00 | 100.00 | |||||||||
Each of these subsidiaries is incorporated in Chile, except for Banchile Trade Services Limited, which is incorporated in Hong Kong.
Securities Brokerage Services
We provide securities brokerage services through Banchile Corredores de Bolsa S.A. Banchile Corredores de Bolsa S.A. is registered as a securities broker with the Superintendencia de Valores y Seguros de Chile (the “Chilean Superintendency of Securities and Insurance”), the regulator of Chilean publicly listed companies, and is a member of the Santiago Stock Exchange and the Chilean Electronic Stock Exchange. Since it was founded in 1989, Banchile Corredores de Bolsa S.A. has provided stock brokerage services, fixed-income investments and foreign exchange products to individuals and companies through our branch network. During the year ended December 31, 2013, Banchile Corredores de Bolsa S.A. recorded an aggregate stock trading turnover on the Santiago Stock Exchange, the Chilean Electronic Stock Exchange and the Valparaíso Stock Exchange that amounted to approximately Ch$5,189,264 million. As of December 31, 2013, Banchile Corredores de Bolsa S.A. had equity of Ch$83,355 million and, for the year ended December 31, 2013, recorded net income of Ch$9,327 million, which represented 1.7% of our consolidated net income for that period.
In early 2009, Citibank Agencia de Valores S.A. merged with and into Banchile Corredores de Bolsa S.A.
Mutual and Investment Fund Management
Since 1980, we have provided mutual fund management services through Banchile Administradora General de Fondos S.A. (formerly Banchile Administradora de Fondos Mutuos S.A.). As of December 31, 2013, according to data prepared by the Chilean Superintendency of Securities and Insurance, Banchile Administradora General de Fondos S.A. was the largest mutual fund manager in Chile, managing approximately 21.3% of all Chilean mutual funds assets. As of December 31, 2013, Banchile Administradora General de Fondos S.A. operated 86 mutual funds and had Ch$4,515,954 million in assets under management owned by approximately 379,193 corporate and individual investors. Also, as of December 31, 2013, Banchile Administradora General de Fondos S.A. operated eight public investment funds (Chile Small Cap, Banchile Inmobiliario IV, Banchile Inmobiliario V, Banchile Inmobiliario VI, Latam Small Mid-Cap, Plusvalia Eficiente, Rentas Inmobiliarias I, and Chile Blend) and two private investment funds (J. Verne II and Minero), managing a total amount of Ch$188,738 million in net assets on behalf, of 228 participants.
44
Table of Contents
The following table sets forth information regarding the various mutual funds managed by Banchile Administradora General de Fondos S.A. as of December 31, 2013:
|
Name of Fund |
Type of Fund |
Net Asset Value
As of December 31, 2013 |
||||
| (in millions of Ch$) | ||||||
|
2nd Best Chile EE.UU. |
Fixed income (medium/long term) | Ch$ | 2,072 | |||
|
Ahorro |
Fixed income (medium/long term) | 160,964 | ||||
|
Alianza |
Fixed income (medium/long term) | 159,117 | ||||
|
Andes Acciones |
Equity | 726 | ||||
|
Asia Fund |
Debt/Equity | 5,146 | ||||
|
Asiatico Accionario |
Equity | 15,895 | ||||
|
Balance I |
Debt/Equity | 14,486 | ||||
|
Banchile-Acciones |
Equity | 36,906 | ||||
|
Bonos Soberanos |
Fixed income (medium/long term) | 13,603 | ||||
|
Booster Balanced |
Fixed income (medium/long term) | 1,013 | ||||
|
Booster China Stocks |
Fixed income (medium/long term) | 3,570 | ||||
|
Booster Europa |
Fixed income (medium/long term) | 4,861 | ||||
|
Booster Real Estate |
Fixed income (medium/long term) | 4,359 | ||||
|
Bric Accionario |
Equity | 378 | ||||
|
Capital Efectivo |
Fixed income (short term) | 117,654 | ||||
|
Capital Empresarial |
Fixed income (short term) | 57,685 | ||||
|
Capital Financiero |
Fixed income (short term) | 247,516 | ||||
|
Capitalisa-Acc. |
Equity | 2,940 | ||||
|
Cash |
Fixed income (short term) | 445,552 | ||||
|
Chile Bursatil Garantizado |
Fixed income (medium/long term) | 4,660 | ||||
|
Chile 18 Q |
Equity | 9,337 | ||||
|
Chile Accionario |
Equity | 18,672 | ||||
|
Corporate Dollar |
Fixed income (short term) | 406,211 | ||||
|
Corporativo |
Fixed income (short term) | 214,224 | ||||
|
Crecimiento |
Fixed income (short/medium term) | 138,685 | ||||
|
Depósito Plus G |
Fixed income (medium/long term) | 12,956 | ||||
|
Depósito XXI |
Fixed income (medium/long term) | 216,164 | ||||
|
Deuda Dolar |
Fixed income (medium/long term) | 7,266 | ||||
|
Deuda Estatal |
Fixed income (medium/long term) | 30,910 | ||||
|
Deuda Nacional |
Fixed income (medium/long term) | 6,978 | ||||
|
Deuda Pesos 1-5 Años |
Fixed income (medium/long term) | 49,152 | ||||
|
Disponible |
Fixed income (shor term) | 40,005 | ||||
|
Dollar Investment G. |
Fixed income (medium/long term) | 10,821 | ||||
|
Emerging Fund |
Debt/Equity | 14,671 | ||||
|
Emerging Market |
Debt/Equity | 12,617 | ||||
|
Estrategia Agresiva |
Debt/Equity | 1,287 | ||||
|
Estrategia Conservadora |
Debt/Equity | 17,314 | ||||
|
Estrategico |
Fixed income (medium/long term) | 257,055 | ||||
|
Euro Money Market |
Fixed income (short term) | 12,091 | ||||
|
Europa Accionario Garantizado |
Fixed income (medium/long term) | 2,268 | ||||
|
Europa Desarrollada |
Debt/Equity | 16,238 | ||||
|
Europe Equity Tax Advantage |
Debt/Equity | 5,463 | ||||
|
Flexible |
Fixed income (short term) | 46,444 | ||||
|
Fondo Mutuo Deposito Plus IV Garantizado |
Fixed income (medium/long term) | 13,547 | ||||
|
Global Dollar |
Debt/Equity | 4,572 | ||||
|
Global Mid Cap |
Debt/Equity | 18,456 | ||||
|
Global Stock Garantizado |
Fixed income (medium/long term) | 3,075 | ||||
|
Horizonte |
Fixed income (medium/long term) | 107,894 | ||||
|
Inversion Brasil |
Debt/Equity | 3,638 | ||||
|
Inversion China |
Debt/Equity | 5,611 | ||||
|
Inversion Dollar 30 |
Debt/Equity | 1,381 | ||||
|
Inversion USA |
Debt/Equity | 23,895 | ||||
|
Inversionista I |
Equity | 12,196 | ||||
|
Latam Mid Cap |
Equity | 2,390 | ||||
|
Latin America Fund |
Debt/Equity | 17,197 | ||||
|
Latina Accionario |
Debt/Equity | 5,941 | ||||
|
Liquidez 2000 |
Fixed income (short term) | 388,351 | ||||
|
Liquidez Full |
Fixed income (short term) | 336,673 | ||||
|
Mid Cap |
Equity | 20,965 | ||||
|
Mix Moderado |
Debt/Equity | 765 | ||||
|
Oportunidades Sectoriales |
Debt/Equity | 5,432 | ||||
|
Patrimonial |
Fixed income (short term) | 165,451 | ||||
45
Table of Contents
|
Name of Fund |
Type of Fund |
Net Asset Value
As of December 31, 2013 |
||||
| (in millions of Ch$) | ||||||
|
Performance |
Fixed income (short/medium term) | 9,977 | ||||
|
Depósito Plus II Garantizado |
Fixed income (medium/long term) | 9,061 | ||||
|
Depósito Plus III Garantizado |
Fixed income (medium/long term) | 11,157 | ||||
|
Quant Global |
Debt/Equity | 84 | ||||
|
Renta Futura |
Fixed income (medium/long term) | 216,859 | ||||
|
Retorno Accionario |
Equity | 89 | ||||
|
Retorno Dolar |
Fixed income (medium/long term) | 19,221 | ||||
|
Retorno L.P. UF |
Fixed income (medium/long term) | 24,982 | ||||
|
Sb Europa China |
Fixed income (medium/long term) | 1,713 | ||||
|
Small Cap USA Garantizado |
Fixed income (medium/long term) | 5,393 | ||||
|
Twin Win Europa 103 Garantizado |
Fixed income (medium/long term) | 3,772 | ||||
|
Twin Win Europe Equity |
Fixed income (medium/long term) | 6,376 | ||||
|
Twin Win USA Pesos |
Fixed income (medium/long term) | 10,310 | ||||
|
U.S Dollar Fund |
Debt/Equity | 9,136 | ||||
|
U.S Mid Cap |
Debt/Equity | 41,272 | ||||
|
USA Equity Tax Advantage |
Equity | 7,864 | ||||
|
Utilidades |
Fixed income (short/medium term) | 110,319 | ||||
|
Viejo Continente ACC |
Debt/Equity | 6,499 | ||||
|
Vision Dinamica A |
Debt/Equity | 10,894 | ||||
|
Vision Dinamica ACC |
Debt/Equity | 4,114 | ||||
|
Vision Dinamica B |
Debt/Equity | 4,506 | ||||
|
Vision Dinamica C |
Debt/Equity | 8,113 | ||||
|
Vision Dinamica D |
Debt/Equity | 2,845 | ||||
|
Vision Dinamica E |
Debt/Equity | 8,036 | ||||
|
|
|
|||||
|
Total |
Ch$ | 4,515,954 | ||||
|
|
|
|||||
As of December 31, 2013, Banchile Administradora General de Fondos S.A. recorded equity of Ch$53,030 million and, for the year ended December 31, 2013, net income of Ch$11,641 million, which represented 2.1% of our 2013 consolidated net income.
Financial Advisory Services
We provide financial advisory and other investment banking services to our customers through Banchile Asesoría Financiera S.A. The services offered by Banchile Asesoría Financiera S.A. are primarily targeted to our corporate customers and include advisory services concerning mergers and acquisitions, restructuring, project finance and strategic alliances. As of December 31, 2013, Banchile Asesoría Financiera S.A. had equity of Ch$3,754 million and, for the year ended December 31, 2013, net income of Ch$2,012 million, which represented 0.4% of our 2013 consolidated net income.
Insurance Brokerage
We provide insurance brokerage services to our customers through Banchile Corredores de Seguros Limitada. In 2000, we began to offer life insurance policies associated with consumer loans and non-credit related insurance to our individual customers and the general public. As of December 31, 2013, Banchile Corredores de Seguros Limitada had equity of Ch$8,673 million and, for the year ended December 31, 2013 net income of Ch$3,907 million, which represented 0.7% of our 2013 consolidated net income. According to the Chilean Insurance Companies Association, as of December 31, 2012 (the latest year for which information is available), Banchile Corredores de Seguros Limitada had a 4.5% market share in the total amount of life and casualty insurance policies (in Chilean pesos) sold by insurance brokerage companies in Chile, excluding life annuities.
Securitization Services
We offer investment products to meet the needs of institutional investors, such as private pension funds and insurance companies, through Banchile Securitizadora S.A. This subsidiary securitizes financial assets, and issues debt instruments with credit ratings that can be traded in the Chilean marketplace, backed by a bundle of revenue-producing assets of the client company. As of December 31, 2013, Banchile Securitizadora S.A. had equity of Ch$311 million and, for the year ended December 31, 2013, it reported a net loss of Ch$111 million. Also as of December 31, 2013, Banchile Securitizadora S.A. had a 20.0% market share in the total volume of assets securitized in Chile. This market share refers to the percentage of existing stock of securitized assets as of the mentioned date.
46
Table of Contents
Credits pre-evaluation services
Promarket S.A. provides credit pre-evaluation services to the Bank and its subsidiaries, including researching potential customers. As of December 31, 2013, Promarket S.A. had equity of Ch$914 million and, for the year ended December 31, 2013, net income of Ch$79 million.
Collection Services
Socofin S.A. provides judicial and extra-judicial loan collection services to the Bank. As of December 31, 2013, Socofin S.A. had equity of Ch$955 million and, for the year ended December 31, 2013, net income of Ch$253 million.
Trade Services
In November 2004, we began offering direct trade services to our customers through Banchile Trade Services Limited, which acts as our trade finance entity in markets such as China, Hong Kong, Taiwan and South Korea. As of December 31, 2013, Banchile Trade Services Limited had equity of Ch$848 million and, for the year ended December 31, 2013, net income of Ch$36 million.
Distribution Channels and Electronic Banking
Our distribution network provides integrated financial services and products to our customers through a wide range of channels. The network includes ATMs, branches, on-line banking and phone-banking devices. As of December 31, 2013, we had 1,804 ATMs (that form part of Redbanc’s 6,397 ATMs system) which allowed our customers to conduct self-service banking transactions during banking and non-banking hours.
As of December 31, 2013, we had a network of 430 retail branches throughout Chile. Our branch system serves as a distribution network for all of the products and services offered to our customers. Our full-service branches accept deposits, cash withdrawals, offer the full range of our retail banking products, such as consumer loans, credit cards, mortgage loans and current accounts, and provide information to current and potential customers.
We offer electronic banking services to our customers 24 hours a day through our internet website, www.bancochile.cl , which has tailored homepages for the different markets we serve. Our corporate homepage offers a broad range of services, including the payment of bills, electronic fund transfers, non-charge orders, as well as a wide variety of account inquiries. These services include our office banking service, Banconexion Web , which enables our corporate customers to perform all of their banking transactions from their offices. Our homepage also offers products with exclusive benefits provided by our customer loyalty marketing programs, which enhance our relationships with customers. We also have a homepage designed for our investor customers, through which they can trade stocks, take deposits and open savings accounts. Our foreign trade customers can rely on our international business homepage, www.bancochile.com , which enables them to inquire about the status of their foreign trade transactions and perform transactions, such as opening letters of credit, recording import collection and hedging on instructions and letters of credit. On an average monthly basis, during 2013 approximately 607,000 individual and corporate customers performed nearly 30.2 million transactions per month on our website, of which approximately 6.0 million were monetary transactions.
In addition, we provide our customers with access to a 24-hour phone-banking call center through which they can access account information, transfer funds and make certain payments. This service, through which we receive approximately 442,100 calls per month on average, has enabled us to develop customer loyalty campaigns, sell financial products and services, answer specialized inquiries about our remote services and receive and resolve complaints by customers and non-customers.
47
Table of Contents
Involvement with the Transantiago Plan
Since June 2005, we have been a shareholder in Administrador Financiero del Transantiago (“AFT”), the company responsible for the financial management of the overhaul of Santiago’s public transit system (the “Transantiago Plan”). Other majority shareholders of the company include three other major Chilean banks, a financial services company and a technology services company. We own 20% of AFT’s capital stock, which represented an original capitalization of approximately U.S.$13.4 million as of June 8, 2005.
The Transantiago Plan has faced operational deficits that are being funded by means of permanent and temporary fiscal subsidies in accordance with the provisions of Law 20,378, enacted in September 2009.
In 2007, as shareholders of AFT, we made extraordinary contributions for a total amount of U.S.$4.1 million with the purpose of financing AFT’s expenses, which were capitalized as of December 31, 2007. Between January and April 2008, we made additional funds available to AFT in the amount of U.S.$358,000 to pay AFT’s expenses arising from the Transantiago Plan. We have made no additional funds available after April 2008 and we estimate that, as shareholders, it will not be necessary to make extraordinary contributions for financing AFT’s operations.
On December 2012, AFT and the Chilean Ministry of Transports and Telecommunications entered into a new agreement that limits the services to be provided by AFT to the financial management of the Transantiago System’s resources. This new agreement significantly reduces the AFT’s incomes and operational expenses, while materially reducing the AFT’s risk.
Competition
Overview
The Chilean market for banking and other financial services is highly and increasingly competitive and consists of a number of different market sectors. The most important sector is commercial banking that—as of December 31, 2013—consisted of 23 banks, 22 of them privately-owned and one government-owned bank, namely, Banco del Estado. As of December 31, 2013, the four largest Chilean banks accounted for 65.1% of all outstanding loans granted by Chilean financial institutions (excluding subsidiaries abroad): Banco Santander—Chile (19.2%), Banco de Chile (19.1%), Banco del Estado (13.6%) and Banco de Crédito e Inversiones (13.2%).
We face significant and increasing competition in all market segments in which we operate. As a commercial bank that offers a wide range of services to all types of businesses and individual customers, we face a variety of competitors, ranging from other large, privately-owned commercial banks to more specialized entities, such as “niche” banks. We also increasingly face competition, from non-banking companies like large department stores, private compensation funds, and saving and credit cooperatives with respect to some of our credit products, such as credit cards and consumer loans. Furthermore, in recent years and given the outstanding credit rating held by the country, as well as the liquidity observed in overseas markets, middle market companies and corporations have increasingly taken advantage of these facts by issuing long-term debt and replacing loans rendered by local banks. In addition, we face competition from other types of competitors, such as leasing, factoring and automobile financing companies (especially in credit products), as well as mutual funds, pension funds and insurance companies, within the market for savings products and mortgage loans. Nevertheless, banks continue to be the main suppliers of leasing, factoring and mutual funds, and the insurance sales business is experiencing fast growth, but we cannot assure you that this trend will continue in the future
Within the local banking industry, our primary competitors are the principal commercial banks in Chile, namely, Banco Santander—Chile, Banco de Crédito e Inversiones, Banco Bilbao Vizcaya Argentaria Chile (BBVA), and Corpbanca. Nevertheless, we also face competition from Banco del Estado, a government-owned bank, which has a larger customer base than we do. Banco del Estado, which operates under the same regulatory regime as Chilean privately-owned banks, was the third largest bank in Chile as of December 31, 2013, with outstanding total loans of Ch$14,786,254 million, representing a 13.6% market share (excluding operations of subsidiaries abroad), according to data published by the SBIF.
48
Table of Contents
In the retail market, we compete with other privately-owned Chilean banks, as well as with Banco del Estado, which has a large customer base of individuals. Among privately-owned banks, we believe our strongest competitors in this market are Banco Santander—Chile and Banco de Crédito e Inversiones, as these banks have developed diversified business strategies focused on both small and medium-sized companies and lower to middle income segments of the Chilean population. In addition, we believe our strongest competitors in the high-income individual segment are Banco Santander—Chile and Banco Itaú Chile, as these banks rely on specialized business units that provide wealth management and traditional banking services, as we do. We also compete with companies that offer non-banking specialized financial services in the high-income individuals segment such as Larrain Vial and BTG Pactual, whose core businesses are stock brokerage, financial advisory and wealth management services.
In the wholesale market, we believe our strongest competitors are also Banco Santander—Chile, Banco de Crédito e Inversiones, Corpbanca and Banco Bilbao Vizcaya Argentaria Chile (BBVA). Similarly, we believe these banks are our most significant competitors in the small and medium-sized companies’ business segment.
Historically, commercial banks in Chile have competed in the retail market against each other, and finance companies and department stores, with the latter two having traditionally been focused on consumer loans to low and middle-income segments. However, finance companies gradually disappeared between the 1990s and 2000s, as most of them merged into the largest commercial banks that dominate the Chilean banking industry today. Also, by the end of 1990s, the Chilean financial industry witnessed the rise of non-traditional banking competitors: large department stores. During the 2000s, these players gained increasing significance in the consumer-lending sector, as they were permitted to issue financial products such as credit cards. Currently, there are three consumer-oriented banks affiliated with Chile’s largest department stores: Banco Falabella, Banco Ripley and Banco Paris. Although these banks had a combined market share (excluding operations of subsidiaries abroad) of only 1.9% as of December 31, 2013, according to the SBIF, the presence of these banks is likely to make consumer banking more competitive over the next few years, especially within the lower income segment.
The Chilean banking industry has experienced increased levels of competition in recent years from domestic as well as foreign banks, which has triggered a consolidation wave within the industry. Consequently, banks’ strategies have been increasingly focused on reducing costs and improving efficiency standards in order to compete effectively with the larger banks. Although we are making our best efforts in order to operate within this competitive environment, we acknowledge that our income may decrease as a result of increasing competition.
Regarding mergers and acquisitions events in the local banking industry, most of these transactions have involved international players seeking to participate in the local market. Thus, in mid-1996, Banco Santander of Spain took control of Banco Osorno and merged it into its Chilean operations, changing its name to Banco Santander-Chile. In January 1997, Banco O’ Higgins and Banco de Santiago merged, forming Banco Santiago and in 1999 Banco Santander of Spain acquired Banco Santiago. During 2001, Banco de Chile merged with Banco de A. Edwards, which was effective on January 1, 2002. In August 2002, Banco Santiago and Banco Santander–Chile, then the second and fourth largest banks in Chile, respectively, merged and became Chile’s largest bank under the Banco Santander-Chile brand name. In 2003, Banco del Desarrollo merged with Banco Sudamericano, and in 2004, Dresdner Banque Nationale de Paris merged with Banco Security. In 2005, Banco de Crédito e Inversiones merged with Banco Conosur. In 2007, Banco Itaú acquired Bank Boston unit in Chile, while Rabobank acquired HNS Bank and Scotiabank acquired Banco del Desarrollo. In the first quarter of 2008, we merged with Citibank Chile, and afterwards the Superintendency of Banks authorized the opening of a branch of the Norwegian bank DnB NOR and the acquisition of ABN Amro Bank by The Royal Bank of Scotland. In early 2009, the merger agreement between Scotiabank Sudamericano and Banco del Desarrollo was completed, through which the former became Scotiabank Chile and the latter ceased to exist. In addition, during 2009, Banco Monex was acquired by Consorcio Group, which absorbed the operations of the former and its subsidiaries, becoming Banco Consorcio.
49
Table of Contents
In addition, consolidation and overseas expansion has emerged as a means of inorganic growth for local banks. Actually, during 2012 Corpbanca, fourth-ranked among Chilean privately-owned banks in terms of total loans as of December 31, 2011, acquired a former Santander Group’s subsidiary in Colombia and consolidated its balance sheet and results of operations beginning May 31, 2012. In addition, by the end of 2012, Corpbanca made a bid for acquiring Helm Bank in Colombia. Based on the publicly available information, the bid process was completed and fully authorized in July 2013 and Corpbanca started to consolidate the balance sheet of this new subsidiary beginning August 31, 2013. As of December 31, 2013 loans associated with Corpbanca’s operations in Colombia amounted to Ch$5,177,052 million and represented 4.5% of the industry’ total loans.
Similarly, by the end of May 2013, Banco de Crédito e Inversiones (BCI)—the third largest privately-owned bank in Chile in terms of total loans as of December 31, 2013 with a 13.2% market share (excluding operations of subsidiaries abroad)—announced the acquisition of the City National Bank, headquartered in Florida, U.S. According to public information published by the SBIF as of February 28, 2014 (the latest available date), based, BCI had not consolidated the operations of City National Bank.
Lastly, by the end of 2013 Corpbanca’s controlling shareholders announced its intention to sell part of its stake to a local or international player. On January 29, 2014, Corpgroup (controlling shareholder) accepted the bid of Brazil’s Itau Unibanco, through which Itau merges its own Chilean and Colombian subsidiaries with Corpbanca. The merged bank, on a pro forma basis, would have had a 12.2% market share as of December 31, 2013, excluding operations of subsidiaries abroad.
We expect these trends of increasing competition and consolidation to continue, particularly in connection with the formation of new large financial groups and the creation of new niche banks. Although we believe that we are currently large enough to compete effectively in all of our target markets, any further consolidation in the Chilean financial services industry may adversely affect our competitive position. We are working on developing and enhancing our competitive strengths to ensure our sustainability.
Below there is a set of tables and figures for the years ended December 31, 2011, 2012 and 2013 that shows our position within the Chilean financial industry. The market information is set forth under Chilean GAAP as published by the SBIF and—unless otherwise indicated—excludes data related to operations of subsidiaries abroad.
The following table sets forth certain statistical information on the Chilean financial system as of December 31, 2013, according to information published by the SBIF under Chilean GAAP:
| As of December 31, 2013 | ||||||||||||||||||||||||||||||||
| (in millions of Ch$, except percentages) | ||||||||||||||||||||||||||||||||
| Assets | Loans (1)(2) | Deposits (2) | Equity (3) | |||||||||||||||||||||||||||||
| CHILEAN GAAP: | Amount | Share | Amount | Share | Amount | Share | Amount | Share | ||||||||||||||||||||||||
|
Private sector banks |
Ch$ | 133,190,340 | 83.9 | % | Ch$ | 94,233,350 | 86.4 | % | Ch$ | 73,752,200 | 80.1 | % | Ch$ | 11,819,382 | 91.6 | % | ||||||||||||||||
|
Banco del Estado |
25,560,282 | 16.1 | 14,786,254 | 13.6 | 18,369,535 | 19.9 | 1,082,294 | 8.4 | ||||||||||||||||||||||||
|
|
|
|
|
|
|
|
|
|
|
|
|
|
|
|
|
|||||||||||||||||
|
Total banking system |
Ch$ | 158,750,622 | 100.0 | % | Ch$ | 109,019,604 | 100.0 | % | Ch$ | 92,121,735 | 100.0 | % | Ch$ | 12,901,676 | 100.0 | % | ||||||||||||||||
|
|
|
|
|
|
|
|
|
|
|
|
|
|
|
|
|
|||||||||||||||||
Source: SBIF
| (1) | Loans to customers, net of interbank loans. |
| (2) | Excludes operations of subsidiaries abroad. |
| (3) | For purposes of this table, equity includes capital and reserves, net income for the period and provisions for minimum dividends. |
Loans
We had total loans of Ch$20,869,511 million as of December 31, 2013, according to information published by the SBIF under Chilean GAAP. The following table sets forth our market share and the market share of our principal privately-owned competitors in terms of total loans, as of the dates indicated, according to information published by the SBIF under Chilean GAAP:
50
Table of Contents
| Total Loans (1)(2) | ||||||||||||
| CHILEAN GAAP: | As of December 31, | |||||||||||
| 2011 | 2012 | 2013 | ||||||||||
|
Banco Santander—Chile |
19.7 | % | 19.1 | % | 19.2 | % | ||||||
|
Banco de Chile |
19.8 | 19.0 | 19.1 | |||||||||
|
Banco de Crédito e Inversiones |
12.9 | 13.2 | 13.2 | |||||||||
|
Banco Corpbanca |
7.7 | 8.4 | 7.3 | |||||||||
|
BBVA Bilbao Vizcaya |
7.0 | 7.1 | 6.9 | |||||||||
|
|
|
|
|
|
|
|||||||
|
Accumulated market share |
67.1 | % | 66.8 | % | 65.7 | % | ||||||
|
|
|
|
|
|
|
|||||||
Source: SBIF
| (1) | Provisions for loan losses not deducted. |
| (2) | Excludes operations of subsidiaries abroad. |
Credit Quality
The following table sets forth the ratio of allowances to total loans of the largest private banks in Chile and that of the Chilean financial system as a whole (including such banks) as of December 31, 2011, 2012 and 2013, according to information published by the SBIF under Chilean GAAP:
| Allowances to Total Loans (1) | ||||||||||||
| CHILEAN GAAP: | As of December 31, | |||||||||||
| 2011 | 2012 | 2013 | ||||||||||
|
Banco Santander—Chile |
3.02 | % | 2.91 | % | 2.91 | % | ||||||
|
Banco de Crédito e Inversiones |
2.44 | 2.29 | 2.32 | |||||||||
|
Banco de Chile |
2.21 | 2.28 | 2.30 | |||||||||
|
BBVA Bilbao Vizcaya |
2.02 | 1.80 | 1.72 | |||||||||
|
Banco Corpbanca |
1.54 | 1.27 | 1.55 | |||||||||
|
|
|
|
|
|
|
|||||||
|
Financial system |
2.36 | % | 2.27 | % | 2.36 | % | ||||||
|
|
|
|
|
|
|
|||||||
Source: SBIF
| (1) | Excludes operations of subsidiaries abroad. |
The following table sets forth the ratio of total past-due loans to total loans for the largest private banks in Chile as of December 31, 2011, 2012 and 2013 on an individual basis, according to information published by the SBIF under Chilean GAAP:
| Total Past-Due Loans to Total Loans (1) | ||||||||||||
| CHILEAN GAAP: | As of December 31, | |||||||||||
| 2011 | 2012 | 2013 | ||||||||||
|
Banco de Chile |
1.03 | % | 0.97 | % | 1.13 | % | ||||||
|
Banco Corpbanca |
1.62 | 1.30 | 1.21 | |||||||||
|
BBVA Bilbao Vizcaya |
1.92 | 1.22 | 1.50 | |||||||||
|
Banco de Crédito e Inversiones |
2.34 | 2.07 | 2.39 | |||||||||
|
Banco Santander—Chile |
2.95 | 3.17 | 2.93 | |||||||||
|
|
|
|
|
|
|
|||||||
|
Financial system |
2.62 | % | 2.22 | % | 2.15 | % | ||||||
|
|
|
|
|
|
|
|||||||
Source: Chilean SBIF
| (1) | The Superintendency of Banks only releases past-due information on an individual basis for Chilean banks. |
51
Table of Contents
Deposits
We had total deposits (including demand deposits and time deposits) of Ch$16,387,057 million as of December 31, 2013, according to information published by the SBIF under Chilean GAAP. The following table sets forth the market shares in terms of total deposits for private banks as of December 31, 2011, 2012 and 2013 on a consolidated basis, according to information published by the SBIF under Chilean GAAP:
| Total Deposits (1) | ||||||||||||
| CHILEAN GAAP: | As of December 31, | |||||||||||
| 2011 | 2012 | 2013 | ||||||||||
|
Banco de Chile |
18.5 | % | 17.8 | % | 17.8 | % | ||||||
|
Banco Santander—Chile |
17.4 | 16.6 | 16.6 | |||||||||
|
Banco de Crédito e Inversiones |
13.0 | 12.8 | 12.6 | |||||||||
|
BBVA Bilbao Vizcaya |
6.5 | 6.3 | 6.4 | |||||||||
|
Banco Corpbanca |
7.2 | 8.2 | 6.3 | |||||||||
|
|
|
|
|
|
|
|||||||
|
Total market share |
62.6 | % | 61.7 | % | 59.7 | % | ||||||
|
|
|
|
|
|
|
|||||||
Source: SBIF
| (1) | Excludes operations of subsidiaries abroad. |
Capital and Reserves
The following table sets forth the level of capital and reserves for the largest private banks in Chile as of December 31, 2011, 2012 and 2013 according to information published by the SBIF under Chilean GAAP:
| Capital and Reserves | ||||||||||||
| CHILEAN GAAP: | As of December 31, | |||||||||||
| 2011 | 2012 | 2013 | ||||||||||
|
Banco de Chile |
Ch$ | 1,569,871 | Ch$ | 1,841,968 | Ch$ | 2,095,296 | ||||||
|
Banco Santander—Chile |
1,730,464 | 1,898,348 | 2,044,834 | |||||||||
|
Banco Corpbanca |
643,218 | 936,275 | 1,639,493 | |||||||||
|
Banco de Crédito e Inversiones |
1,039,161 | 1,230,078 | 1,371,894 | |||||||||
|
BBVA Bilbao Vizcaya |
Ch$ | 490,608 | Ch$ | 592,336 | Ch$ | 631,434 | ||||||
Source: SBIF
Return on Capital and Reserves
The following table sets forth our return on capital and reserves and the returns on capital and reserves of our principal privately owned competitors and the Chilean banking industry as a whole, in each case as of December 31, 2011, 2012 and 2013, according to information published by the SBIF under Chilean GAAP:
| Return on Capital and Reserves (1)(2) | ||||||||||||
| CHILEAN GAAP: | Year Ended December 31, | |||||||||||
| 2011 | 2012 | 2013 | ||||||||||
|
Banco de Chile |
27.3 | % | 25.3 | % | 24.5 | % | ||||||
|
Banco de Crédito e Inversiones |
25.1 | 22.1 | 21.9 | |||||||||
|
Banco Santander—Chile |
25.1 | 20.4 | 21.6 | |||||||||
|
BBVA Bilbao Vizcaya |
15.2 | 11.0 | 8.0 | |||||||||
|
Banco Corpbanca |
19.1 | 12.8 | 9.5 | |||||||||
|
|
|
|
|
|
|
|||||||
|
Financial System average |
19.3 | % | 15.6 | % | 15.9 | % | ||||||
|
|
|
|
|
|
|
|||||||
Source: SBIF
| (1) | Corresponds to net income attributable to equity holders divided by the year end balance of Capital and Reserves. |
| (2) | Includes operations of subsidiaries abroad. |
52
Table of Contents
Efficiency
The following table sets forth the efficiency ratios of the largest private Chilean banks as of December 31, 2011, 2012 and 2013, according to information published by the SBIF under Chilean GAAP:
| Efficiency Ratio (1)(2) | ||||||||||||
| CHILEAN GAAP: | As of December 31, | |||||||||||
| 2011 | 2012 | 2013 | ||||||||||
|
Banco de Chile |
50.2 | % | 47.2 | % | 42.8 | % | ||||||
|
Banco Santander—Chile |
41.4 | 42.8 | 43.0 | |||||||||
|
Banco de Crédito e Inversiones |
47.2 | 49.6 | 48.2 | |||||||||
|
Banco Corpbanca |
44.6 | 56.7 | 52.9 | |||||||||
|
BBVA Bilbao Vizcaya |
55.7 | 59.5 | 58.4 | |||||||||
|
|
|
|
|
|
|
|||||||
|
Financial System average |
50.0 | % | 51.2 | % | 49.9 | % | ||||||
|
|
|
|
|
|
|
|||||||
Source: SBIF
| (1) | Calculated by dividing operating expense by operating revenue. |
| (2) | Includes operations of subsidiaries abroad. |
53
Table of Contents
REGULATION AND SUPERVISION
General
In Chile, only banks may maintain current accounts for their customers conduct foreign trade operations and, together with non-banking financial institutions, accept time deposits. The principal authorities that regulate financial institutions in Chile are the SBIF and the Central Bank. Chilean banks are primarily subject to the General Banking Law and secondarily, to the extent not inconsistent with that law, the provisions of the Chilean Corporations Law governing public corporations, except for certain provisions that are expressly excluded.
The Chilean banking system dates back to 1925 and has been characterized by periods of substantial regulation and government intervention, as well as periods of deregulation. The most recent period of deregulation commenced in 1975 and culminated in the adoption of a series of amendments to the General Banking Law. In 2004, amendments to the General Banking Law granted additional powers to banks, including general underwriting powers for new issuances of certain debt and equity securities and the power to create subsidiaries to engage in activities related to banking, such as brokerage, investment advisory, mutual fund services, investment fund management, factoring, securitization products and financial leasing services. Prior to 2006, banks had the option of distributing less than 30% of their earnings as dividends in any given year, subject to approval of the holders of at least two-thirds of the bank’s common stock. In 2006, however, the General Banking Law was amended to eliminate this alternative.
Following the Chilean banking crisis of 1982 and 1983, the SBIF assumed control of banks representing approximately 51% of the total loans in the banking system. As part of the assistance that the Chilean Government provided to Chilean banks, the Central Bank permitted banks to sell to it a certain portion of their non-performing loan portfolios at book value. Each bank then repurchased such loans at their economic value (which, in most cases, was substantially lower than the book value at which the Central Bank had acquired them), with the difference to be repaid to the Central Bank out of future income. Pursuant to Law No. 18,818, which was passed in 1989, this difference was converted into subordinated debt.
The Central Bank
The Central Bank is an autonomous legal entity created under the framework of the Chilean Constitution. It is subject to its Ley Orgánica Constitucional (the “Organic Constitutional Law”) and the Chilean Constitution. To the extent not inconsistent with its Organic Constitutional Law or the Chilean Constitution, the Central Bank is also subject to general laws applicable to the private sector, but is not subject to the laws applicable to the public sector. The Central Bank is directed and administered by a board of directors composed of five members designated by the President of Chile, subject to Senate approval.
The legal purpose of the Central Bank is to maintain the stability of the Chilean peso and the orderly functioning of Chile’s internal and external payment systems. The Central Bank’s powers include setting reserve requirements, regulating the amount of money and credit in circulation, and establishing regulations and guidelines regarding financial companies, foreign exchange (including the Formal Exchange Market) and bank deposit-taking activities.
The Superintendency of Banks
Banks are supervised and controlled by the SBIF, a Chilean governmental agency. The SBIF authorizes the creation of new banks and has broad powers to interpret and enforce legal and regulatory requirements applicable to banks and financial institutions. Furthermore, in cases of noncompliance with its legal and regulatory requirements, the SBIF has the ability to impose sanctions. In extreme cases, it can appoint, with the prior approval of the board of directors of the Central Bank, a provisional administrator to manage a bank. It also has the mandate to approve any amendment to a bank’s bylaws or any increase in its capital.
In addition, our subsidiaries Banchile Corredores de Bolsa S.A., Banchile Administradora General de Fondos S.A., Banchile Securitizadora S.A. and Banchile Corredores de Seguros Ltda. are supervised by the SVS.
54
Table of Contents
The SBIF examines all banks from time to time, usually at least once a year. Banks are required to submit unconsolidated unaudited financial statements to the SBIF on a monthly basis and to publish their unaudited financial statements at least four times a year in a newspaper of national circulation. A bank’s financial statements as of December 31 of each year must be audited and submitted to the SBIF together with the opinion of its independent auditors. In addition, banks are required to provide extensive information regarding their operations at various periodic intervals to the SBIF.
Any person wishing to acquire, directly or indirectly, 10% or more of the share capital of a bank must obtain prior approval from the SBIF. Without such approval, the holder will not have the right to vote such shares. The SBIF may only refuse to grant its approval based on specific grounds set forth in the General Banking Law.
According to Article 35 bis of the General Banking Law, the prior authorization of the SBIF is required for each of the following:
| • |
the merger of two or more banks; |
| • |
the acquisition of all or a substantial portion of a bank’s assets and liabilities by another bank; |
| • |
the control by the same person, or controlling group, of two or more banks; or |
| • |
a substantial increase in the share ownership of a bank by a controlling shareholder of that bank. |
Such prior authorization is required only when the acquiring bank or the resulting group of banks would own a market share in loans determined by the SBIF to be more than 15% of the Chilean banking system loans. The intended purchase, merger or expansion may be denied by the SBIF, or, if the acquiring bank or resulting group would own a market share in loans determined to be more than 20% of the Chilean banking system loans, the purchase, merger, or expansion may be conditioned on one or more of the following:
| • |
that the bank or banks maintain Regulatory Capital above 8% and up to 14% of their risk-weighted assets; |
| • |
that the technical reserve established in article 65 of the General Banking Law be applicable when deposits exceed 1.5 times the resulting bank’s paid-in capital and reserves; or |
| • |
that the amount of interbanking loans be reduced to 20% of the resulting bank’s Regulatory Capital. |
If the acquiring bank or resulting group would own a market share in loans determined by the SBIF to be more than 15% but less than 20%, the authorization will be conditioned on the bank or banks maintaining Regulatory Capital not below 10% of their risk-weighted assets for a period set by the SBIF, which may not be less than one year. The calculation of risk-weighted assets is based on a five-category risk classification system applied to a bank’s assets that is based on the Basel Committee recommendations.
Pursuant to the regulations of the SBIF, the following ownership disclosures are required:
| • |
banks must disclose to the SBIF the identity of any person owning, directly or indirectly, 5% or more of its shares; |
| • |
holders of ADSs must disclose to the depositary the identity of beneficial owners of ADSs registered under such holders’ names; |
| • |
the depositary must disclose to the bank the identity of beneficial owners of ADSs which the depositary has registered, and the bank, in turn, must disclose to the SBIF the identity of the beneficial owners of the ADSs representing 5% or more of such bank’s shares; and |
| • |
bank shareholders who individually hold 10% or more of a bank’s capital stock and who are controlling shareholders must periodically inform the SBIF of their financial condition. |
55
Table of Contents
Limitations on Types of Activities
Chilean banks can only conduct those activities allowed by the General Banking Law, including loan placements, factoring and leasing activities, accepting deposits and, subject to certain limitations, making investments and performing financial services. Investments are restricted to real estate for the bank’s own use, gold, foreign exchange and debt securities. Through subsidiaries, banks may also engage in other specific financial service activities such as securities brokerage services, mutual fund management, investment fund management, foreign capital fund management, financial advisory, securitization and factoring activities. Subject to specific limitations and the prior approval of the SBIF and the Central Bank, Chilean banks may own majority or non-controlling interests in foreign banks.
In March 2002, the Central Bank authorized banks to pay interest on current accounts and the SBIF published guidelines permitting banks to offer and charge fees for the use of a current account product that pays interest. Under these guidelines, these accounts may be subject to a minimum balance and different interest rates depending on average balances held in the account. The Central Bank has imposed additional caps on the interest rate that can be charged by banks with a solvency score of less than A.
In June 2007, the Chilean Government passed Law No. 20,190, which amended various aspects of Chile’s capital markets regulatory framework, such as the General Banking Law, Securities, Insurance, Venture Capital and Tax law. Law No. 20,190 is aimed at improving the access to financing for start-up companies and small businesses in order to strengthen confidence in the stock market and to stimulate the development of the financial market in general. The General Banking Law was amended to achieve these goals by, among other things, revising regulations concerning demand deposits, increasing certain credit limits, and redefining the calculations to determine the proper amount for a bank’s reserves. In addition, the General Banking Law was amended to allow local banks to engage in derivatives such as options, swaps and forward contracts, thereby eliminating prior existing legal impediments to those practices.
As a consequence of Chile’s accession to the Organization for Economic Co-operation and Development, the Chilean Congress introduced new corporate governance regulations in 2009. The Chilean Corporations Law and the Chilean Securities Markets Law were amended such that public companies with capital above 1,500,000 UF that have at least 12.5% of their voting shares owned by shareholders representing less than 10% of the voting shares are required to have at least one independent director in their board of directors. In order to assure the independence of this director, certain requirements were established to protect minority shareholders’ decisions. In addition, regulation was passed to expand the disclosure requirements of publicly-held companies and to hold members of boards of directors liable for not complying with such disclosure obligations.
Deposit Insurance
According to the General Banking Law, local or foreign currency denominated deposits at banks or financial companies are insured as described below.
The Chilean Government guarantees up to 100% of the principal amount of the following deposits:
| • |
deposits in current accounts; |
| • |
deposits in savings accounts of demand deposits; |
| • |
other demand deposits; and |
| • |
deposits in savings accounts with unlimited withdrawals. |
56
Table of Contents
In addition, the Chilean Government guarantees up to 90% of the principal amount of time deposits held by individuals in the Chilean banking system. This guarantee covers obligations with a maximum value of UF108 per person (Ch$2,517,432 or U.S.$4,788,54 as of December 31, 2013).
Reserve Requirements
Deposits are subject to a reserve requirement of 9% for demand deposits and 3.6% for time deposits (with terms of less than one year). The Central Bank has statutory authority to increase these percentages to as much as 40% for demand deposits and as much as 20% for time deposits, to implement monetary policy.
In addition, Chilean banks must hold a certain amount of assets in cash or highly liquid instruments. This reserve requirement is equal to the amount by which the daily balance of deposits payable on demand, net of clearing, exceeds 2.5 times the amount of the bank’s Regulatory Capital. Deposits payable on demand include the following:
| • |
deposits in current accounts; |
| • |
other demand deposits or obligations payable on demand and incurred in the ordinary course of business; |
| • |
saving deposits that allow unconditional withdrawals that bear a stated maturity; and |
| • |
other deposits unconditionally payable immediately. |
Chilean regulations also require that (i) gaps between assets and liabilities maturing within less than 30 days do not exceed a bank’s Basic Capital and (ii) gaps between assets and liabilities maturing within less than 90 days do not exceed twice a bank’s Basic Capital. Behavioral assumptions of assets and liabilities maturities are accepted if approved by the SBIF.
As of December 31, 2013 Banco de Chile fully complied these reserve requirements.
Minimum Capital
Under the General Banking Law, a bank must have a minimum paid in capital and reserves of UF 800,000 (Ch$18,648 million or U.S.$35.5 million as of December 31, 2013). However, a bank may begin its operations with 50% of such amount, provided that it has a Regulatory Capital ratio (defined as Regulatory Capital as a percentage of risk weighted assets) of not less than 12%. When such a bank’s paid in capital reaches UF600,000 (Ch$13,986 million or U.S.$26.6 million as of December 31, 2013), the Regulatory Capital ratio requirement is reduced to 10%.
As of December 31, 2013 Banco de Chile fully complied minimum capital requirements.
Capital Adequacy Requirements
According to the General Banking Law, each bank should have Regulatory Capital of at least 8% of its risk-weighted assets, net of required allowances. This percentage may be increased by the regulators according to what has been stated above.
Banks should also have a Basic Capital of at least 3% of their total assets, net of required allowances.
The terms Regulatory Capital and Basic Capital are defined under “Presentation of Financial Information” at the beginning of this annual report.
As of December 31, 2013 Banco de Chile fully complied all of capital adequacy requirements.
57
Table of Contents
Market Risk Regulations
In September 2005, the SBIF introduced new regulations for measuring market risks (e.g., price and liquidity risks). This entity introduced standardized methodologies based on Basel Market Risk Measurement models for measuring and reporting price risks. These methodologies allow local banks to determine interest rate, foreign exchange (“FX”) and options risks (for FX and interest rate transactions) taken in both their trading and accrual books. Additionally, this entity provided funding liquidity risk measurements standards which included the alternative to model the maturity tenor of some balance sheet items following behavioral assumptions.
The trading book is composed of portfolios of debt and equity instruments that have a liquid secondary market and therefore their valuation at market prices and the corresponding profit and losses impact is representative of market conditions. In addition, all derivative transactions and the FX mismatches are also part of the trading book. The accrual book comprises all of the asset and liability balance sheet items that are not part of the trading book.
The regulation provides that 8% of the sum of the risk-weighted assets and 12.5 times the price risk of the trading book may not be higher than Regulatory Capital. In light of our merger with the operations of Citibank Chile in 2008, the SBIF has raised the applicable percentage for us from 8% to 10%. As of December 31, 2013, the price risk of our trading book totaled Ch$40,864 million.
The following table shows our regulatory risk availability, computed as the difference between the risk and our Regulatory Capital, as of December 31, 2013:
| As of December 31, 2013 | ||||
|
(in millions of Ch$, except percentage) |
||||
|
(a) 10% risk-weighted assets |
2,298,110 | |||
|
(b) Trading price risk |
52,574 | |||
|
(c = a + b) Total risk |
2,350,684 | |||
|
(d) Regulatory Capital |
2,999,061 | |||
|
(e = d – c) Risk Availability |
648,377 | |||
|
(f = c/d) Risk used as a Percentage of Regulatory Capital |
78.4 | % | ||
Interest rate risk generated by the accrual book is measured against a self-imposed limit equal to the lesser of 12-month rolling net revenues and our Basic Capital.
The guidelines for measuring liquidity risk are mainly focused on constructing an expected cash flow analysis for the following 30 and 90 days, broken down by currency. Net outflows may not exceed the amount of our Basic Capital for the following 30 days or two times that amount for the following 90 days. Subject to approval of the SBIF, the cash flow analysis may include behavioral run-off assumptions for some specific liability balance sheets items (demand deposits, time deposits, etc.) and behavioral roll-over assumptions for some asset items of the consolidated statement of financial position data (loans, etc.).
In June 2006, the SBIF introduced new regulations relating to (i) the valuation process of debt instruments and (ii) the measurement and reporting of credit risk generated by derivative transactions.
Prior to June 2006, the SBIF allowed banks to classify debt instruments for accounting and business purposes as either “Trading” or “Held-to-Maturity” only. Starting in June 2006, a new alternative classification was added (“Available-for-Sale”). No changes to the classification system have occurred since June 2006.
Credit risk for derivative transactions, for regulatory purposes, must be measured and reported as:
Derivatives Credit risk = Current Mark-to-Market (if positive) + Credit Risk Factor (%) * Notional Amount
The Current Mark-to-Market (“CMTM”) of the transaction, if positive, reflects the amount of money owed by the counterparty today, e.g. corresponding to the amount the counterparty would pay us if the transaction were unwound today. As we are interested in measuring the maximum amount of money that the customer would owe us within the life of the transaction, the maximum potential future value of the transaction is added to the
58
Table of Contents
CMTM. This potential value is measured as the Credit Risk Factor multiplied by the Notional Amount. Hence, the Credit Risk Factor reflects the potential value that the transaction may take in favor of the bank (under some confidence level) within its remaining tenor. The regulator determines the Credit Risk Factor by considering market factors (three categories: interest rates, FX rates or equity prices) involved in the respective transactions and the remaining tenor. In addition, banks usually develop their own Credit Risk Factors models to assess credit risk not only under regulatory guidelines. Netting and credit mitigation schemes, such as recouponing, early termination, margins, etc. have been allowed by regulators so that banks can better manage their credit risk.
Lending Limits
Under the General Banking Law, Chilean banks are subject to certain lending limits, including the following material limits:
| • |
A bank may not extend to any entity or individual, directly or indirectly, unsecured credit in an amount that exceeds 10% of the bank’s Regulatory Capital, or in an amount that exceeds 30% of its Regulatory Capital if the excess over 10% is secured by certain assets with a value equal to or higher than such excess. |
| • |
In the case of financing infrastructure projects built through the concession mechanism, the 10% ceiling for unsecured credits is raised to 15% if secured by a pledge over the concession, or if granted by two or more banks or financial companies which have executed a credit agreement with the builder or holder of the concession. |
| • |
A bank may not extend loans to another financial institution subject to the General Banking Law in an aggregate amount exceeding 30% of its Regulatory Capital. |
| • |
A bank may not extend to any individual or entity that is, directly or indirectly, related to the ownership or management of the bank, credit under more favorable terms with respect to repayment conditions, interest rates or collateral than those granted to third parties in similar transactions. The aggregate amount of such credits granted to related persons may not exceed 5% of the bank’s Regulatory Capital. The 5% unsecured ceiling is raised to 25% of the bank’s Regulatory Capital if the excess over 5% is secured by certain assets with a value equal to or higher than such excess. In any case, the aggregate amount of these credits granted by the bank may not exceed the bank’s Regulatory Capital. |
| • |
A bank may not directly or indirectly grant a loan, the purpose of which is to allow an individual or entity to acquire shares of the lender bank. |
| • |
A bank may not lend, directly or indirectly, to a director or any other person who has the power to act on behalf of the bank. |
| • |
A bank may not grant loans to related parties (including holders of more than 1% of its shares) on more favorable terms than those generally offered to non-related parties. Loans granted to related parties are subject to the limitations described in the first bullet point above. The aggregate amount of loans to related parties may not exceed a bank’s Regulatory Capital. |
In addition, the General Banking Law limits the aggregate amount of loans that a bank may grant to its employees to 1.5% of its Regulatory Capital and provides that no individual employee may receive loans in excess of 10% of this 1.5% limit. Notwithstanding these limitations, a bank may grant to each of its employees a single residential mortgage loan for personal use during such employee’s term of employment.
As of December 31, 2013 Banco de Chile fully complied the lending limits established by the General Banking Law.
Classification of Banks
The SBIF regularly examines and evaluates each bank’s solvency and credit management process, including its compliance with loan classification guidelines. On the basis of this evaluation, it classifies banks into various categories.
59
Table of Contents
Solvency and Management
In accordance with amended regulations of the SBIF effective as of January 1, 2004, banks are classified into categories “I” through “V” based upon their solvency and management ratings. This classification is confidential.
| Category I: | This category is reserved for financial institutions that have been rated level A in terms of solvency and management. | |
|
Category II: |
This category is reserved for financial institutions that have been rated (i) level A in terms of solvency and level B in terms of management, (ii) level B in terms of solvency and level A in terms of management, or (iii) level B in terms of solvency and level B in terms of management. | |
|
Category III: |
This category is reserved for financial institutions that have been rated (i) level B in terms of solvency and level B in terms of management for two or more consecutive review periods, (ii) level A in terms of solvency and level C in terms of management, or (iii) level B in terms of solvency and level C in terms of management. | |
|
Category IV: |
This category is reserved for financial institutions that are rated level A or B in terms of solvency and have been rated level C in terms of management for two or more consecutive review periods. | |
|
Category V: |
This category is reserved for financial institutions that have been rated level C in terms of solvency, irrespective of their rating level of management. | |
A bank’s solvency rating is determined by its Regulatory Capital (after deducting accumulated losses during the financial year) to risk-weighted assets ratio. This ratio is equal to or greater than 10% for level A banks, equal to or greater than 8% and less than 10% for level B banks and less than 8% for level C banks.
With respect to a bank’s management rating, level A banks are those that are not rated as level B or C. Level B banks display some weakness in internal controls, information systems, response to risk, private risk rating or ability to manage contingency scenarios. Level C banks display significant deficiencies in internal controls, information systems, response to risk, private risk rating or ability to manage contingency scenarios.
Obligations Denominated in Foreign Currencies
Foreign currency-denominated obligations of Chilean banks are subject to two requirements:
| • |
a reserve requirement of 9% for demand deposits and 3.6% for time deposits. See “—Reserve Requirements”; and |
| • |
net foreign currency outflows may not exceed the amount of the Basic Capital for the following 30 days or two times that amount for the following 90 days. |
Capital Markets
Under the General Banking Law, banks in Chile may purchase, sell, place, underwrite and act as paying agents with respect to certain debt securities. Likewise, banks in Chile may place and underwrite certain equity securities. Bank subsidiaries may also engage in debt placement and dealing, equity issuance advice and securities brokerage, as well as mutual fund and investment fund administration, factoring, investment advisory services and merger and acquisition services. The SBIF generally regulates these subsidiaries. However, the Chilean Superintendency of Securities and Insurance regulates some of these subsidiaries. The Chilean Superintendency of Securities and Insurance is the regulator of the Chilean securities market and publicly-held corporations.
60
Table of Contents
Legal Provisions Regarding Banking Institutions with Economic Difficulties
The General Banking Law provides that if specified adverse circumstances exist at any bank, its board of directors must correct the situation within 30 days from the date of receipt of the relevant financial statements. If the board of directors is unable to do so, it must call an extraordinary shareholders’ meeting to increase the capital of the bank by the amount necessary to return the bank to financial stability. If the shareholders reject the capital increase, or if it is not effected within the 30-day period and in the manner agreed to at the meeting, or if the SBIF does not approve the board of directors’ proposal, the bank will be barred from increasing its loan portfolio beyond that stated in the financial statements presented to the board of directors and from making any further investments in any instrument other than instruments issued by the Central Bank. In such a case, or in the event that a bank is unable to make timely payment in respect of its obligations, or if a bank is under provisional administration of the SBIF, the General Banking Law provides that the bank may receive a two-year term loan from another bank. The terms and conditions of such a loan must be approved by the board of directors of both banks, as well as by the SBIF, but need not be submitted to the borrowing bank’s shareholders for their approval. A creditor bank may not grant such interbank loans to an insolvent bank in an amount exceeding 25% of the creditor bank’s Regulatory Capital. The board of directors of a bank that is unable to make timely payment of its obligations must present a reorganization plan to its creditors in order to capitalize the credits, extend their respective terms, forgive debts or take other measures for the payment of the debts. If the board of directors of a bank submits a reorganization plan to its creditors and such arrangement is approved, all subordinated debt issued by the bank, whether or not matured, will be converted by operation of law into common stock in the amount required for the ratio of Regulatory Capital to risk-weighted assets to be no lower than 12%. If a bank fails to pay an obligation, it must notify the SBIF, which shall determine if the bank is solvent.
Dissolution and Liquidation of Banks
The SBIF may establish that a bank should be liquidated for the benefit of its depositors or other creditors when the bank does not have the necessary solvency to continue its operations. In which case, the SBIF must revoke the bank’s authorization to exist and order its mandatory liquidation, subject to the agreement of the Central Bank. The SBIF must also revoke the bank’s authorization if the reorganization plan of the bank has been rejected twice. The resolution by the SBIF must state the reason for ordering the liquidation and must name a liquidator, unless the SBIF assumes this responsibility. When a liquidation is declared, all current accounts, other demand deposits received in the ordinary course of business, other deposits unconditionally payable immediately or that have a maturity of no more than 30 days, and any other deposits and receipts payable within 10 days of its maturity date, are required to be paid by using the bank’s existing funds, its deposits with the Central Bank, or its investments in instruments that represent its reserves. If these funds are insufficient to pay these obligations, the liquidator may seize the bank’s remaining assets, as needed. If necessary, and in specified circumstances, the Central Bank will lend the bank the funds necessary to pay these obligations. Any such loans are preferential to any claims of other creditors of the liquidated bank.
Investments in Foreign Securities
Under current Chilean banking regulations, banks in Chile may grant loans to foreign individuals and entities and invest in certain foreign currency securities. Chilean banks may only invest in equity securities of foreign banks and certain other foreign companies which may be affiliates of the bank or which would support the bank’s business if such companies were incorporated in Chile. Banks in Chile may also invest in debt securities traded in formal secondary markets. Such debt securities shall qualify as (i) securities issued or guaranteed by foreign sovereign states or their central banks or other foreign or international financial entities, and (ii) bonds issued by foreign companies. Such foreign currency securities must have a minimum rating as indicated in the table below and, if the investments in these securities and the loans referred to above exceed 70% of the Regulatory Capital of the bank, an allowance for 100% of the excess shall be established:
|
Rating Agency |
Short Term | Long Term | ||
|
Moody’s |
P2 | Baa3 | ||
|
Standard and Poor’s |
A2 | BBB– | ||
|
Fitch IBCA |
F2 | BBB– |
61
Table of Contents
A Chilean bank may invest in securities having a minimum rating as follows, provided that if the total amount of these investments and the loans referred to above exceed 20% (or 30% in certain cases) of the Regulatory Capital of the bank, an allowance of 100% of the excess shall be established by the bank:
|
Rating Agency |
Short Term | Long Term | ||
|
Moody’s |
P2 | Ba3 | ||
|
Standard and Poor’s |
A2 | BB– | ||
|
Fitch IBCA |
F2 | BB– |
However, a Chilean bank may invest in securities up to an additional amount of 70% of the bank’s Regulatory Capital without having to establish an additional allowance, if such securities have a minimum rating of:
|
Rating Agency |
Short Term | Long Term | ||
|
Moody’s |
P1 | Aa3 | ||
|
Standard and Poor’s |
A–1+ | AA– | ||
|
Fitch IBCA |
F1+ | AA– |
Subject to specific conditions, a bank may grant loans in U.S. dollars to subsidiaries or branches of Chilean companies located abroad, to companies listed on foreign stock exchanges located in countries with an international risk rating no less than BB- or its equivalent and, in general, to individuals and entities residing or domiciled abroad.
Procedures for the Management of Information of Interest to the Market
In order to ensure compliance with the provisions of the Chilean Securities Market Law and regulations, issued by the Chilean Superintendency of Securities and Insurance and the SBIF, our board of directors approved, on January 29, 2010, the Manual for the Management of Information of Interest to the Market (the “Manual”).
The Manual’s main objective is to provide timely disclosure of our policies and internal regulations in connection with the disclosure of information to the public and the systems that have been implemented by us.
In addition, these policies and internal regulations establish codes of conduct that our employees and other persons with access to certain information must comply with in order to protect information related to us.
The Manual is available to the general public on our web page at www.bancochile.cl .
Prevention of Money Laundering and the Financing of Terrorism
On December, 18, 2003 Law 19.913 created the Financial Analysis Unit and enacted new rules regarding money laundering. On March 6, 2006, the SBIF issued regulations governing the requirements applicable to banks with respect to prevention of money laundering and terrorism financing. The regulations, as amended, are aimed at incorporating international anti-money laundering (“AML”) and terrorism financing laws to the Chilean banking industry. Pursuant to these regulations, the SBIF requires that banks implement an Anti-Money Laundering and Terrorism Financing system based mainly on the “know your customer” concept. Moreover, these policies and procedures must be approved by the board of directors of each bank and must take into account the volume and complexity of its operations and other related parties.
62
Table of Contents
Based on these requirements, a Customer Identification Program (as part of the Anti-Money Laundering and Terrorism Financing system) is needed to enable a bank to reestablish the reasonable belief that it knows the true identity of its customers. In general, the program includes:
| • |
properly identifying customers, including their background, source and amount of funds, country of origin and other risk factors; |
| • |
identifying what the SBIF has defined as “persons politically exposed” (“PEPs”) both within Chile and abroad; and |
| • |
establishing procedures to open accounts and products, with different documentation requirements needed for different types of accounts and products. |
The Anti-Money Laundering and Terrorism Financing system required by local regulations must also include the following components:
| • |
AML policies and procedures aimed at preventing a bank from being used as an intermediary to carry out money laundering operations; |
| • |
appointment of a compliance officer on a senior management level who is responsible for coordinating and monitoring day-to-day AML compliance; |
| • |
establishment of an AML Committee for the purposes of planning and coordinating compliance with AML policies and procedures; |
| • |
use of software tools to detect, monitor and report unusual operations related to transactions made by customers on different products; |
| • |
implementation of personnel selection policies and a training program, in order to prevent money laundering; |
| • |
establishment of a Code of Conduct in order to, among other things, guide employee behavior and prevent possible conflicts of interest; and |
| • |
independent testing by the compliance department, which must be conducted by a bank’s internal audit department. |
Consumer-Oriented Regulation
On December 5, 2011, Law 20.555 was published in the Diario Oficial, amending the Chilean Consumer Protection Law. The most significant changes enacted by Law 20.555 were:
| • |
new agreements entered into by banks and consumer must fully disclose the costs that the consumer assumes, as well as the periodicity, and the mechanisms to modify them. In addition, new agreements must fully disclose all terms, events of default, events of early termination, and automatic payments; |
| • |
banks must inform consumers periodically as to the complete, detailed cost of the banking product, as well as of the cost of the services rendered. The information must include the cost that the consumer will assume if he terminates the agreement before the end of its term; |
| • |
before rendering a service or delivering a product, banks must give the consumer a quote, which must include costs, rates, and conditions; |
| • |
if the consumer so wishes banks must terminate the rendering of a service; |
| • |
banks must inform guarantors as to their rights and obligations before they assume the role of guarantor; |
| • |
irrevocable mandates and mandates in blank are prohibited by the law; |
63
Table of Contents
| • |
when consumers execute standard form contracts, banks must explain, in writing, the main provisions of the agreement; and |
| • |
banks may only modify fees and costs of services and banking products if the mechanisms to modify them are based on objective and verifiable factors previously agreed to in the agreement. In addition, the cost of banking services and products may not be modified without the consent of the consumer. |
This amendment became effective on March 5, 2012; however, with regards to banking product agreements entered into before such date, the amendment does not affect the substantive rights acquired by the parties in those agreements. This amendment created a new legal framework “Sernac Financiero”, whose purpose is to monitor and oversee the relationship between customers and financial institutions, with a particular focus on lending activities and contracts.
In July 2012, the government enacted the regulations that implement Law 20,555, which address mortgage loans, consumer loans, credit cards, the “Sernac Seal” (Sello Sernac), and other financial products and services. The new regulations govern, among other matters, the form and content of communications that financial institutions must periodically provide to their customers. Likewise, the new regulations implement the so-called “Summary Sheet” (Hoja Resumen), which must precede the contracts that consumers enter into with financial institutions. The Summary Sheet is intended to provide a clear and understandable summary of the terms and conditions that govern financial products and services.
The Sernac Seal is a new concept introduced by Law 20,555 and consists of a non-mandatory certification granted by the Chilean government agency in charge of consumer protection ( Servicio Nacional del Consumidor, “Sernac”), by which that agency confirms that the contracts used by a financial institution when providing products and services comply with the Consumer Protection Act. In this regard, the new regulation establishes the specific requirements for financial institutions to obtain such certification as well as the events that may lead to its termination. Among the requirements to obtain the certification, financial institutions must provide a consumer service and adopt a dispute resolution procedure as defined by Law 20,555 and its regulation.
All of these regulations are already implemented by Banco de Chile, except Sernac Seal, which is not mandatory.
On April 30, 2013, the SBIF revoked several regulations that governed in general terms the collection of fees and expenses, the possibility of collecting them in certain cases, changing the fees to be charged to customers, and their exclusion from the calculation of the effective interest rate. The SBIF said that this revocation occurred because, based on the amendments incorporated by law No 20,555, it lacks authority to continue regulating these matters.
On December 19, 2013, the Ministry of Economy published a regulation for the manner and conditions under which consumers validly express their consent to financial contracts. Additionally, this regulation established the effects of a customer’s rejection or non-acceptance of an amendment proposed by the bank or other supplier. However, this regulation was revoked on March 26, 2014.
New Insurance Brokerage Regulations
On December 17, 2011, effective as of July 1, 2012, a new law regulating insurance commissions related to mortgage loans was enacted. This law imposed restrictions and obligations on lenders such as a mandatory bid process for insurance related to mortgage loans and a general prohibition on commissions benefiting the lender. Although this law became effective on July 1, 2012, it did not have any impact on our business activity in 2012 due to the characteristics of the insurance contracts associated with residential mortgage loans, which consist of collective insurance policies that are renewed every January 1st. The implementation of this law did not have a material impact on our operations in 2013, and we do not expect material effects from its application onwards.
64
Table of Contents
In addition, on December 1, 2013, a new regulation affecting all insurance brokerage businesses in Chile became effective. This regulation is a result of Law No. 20,667 that was enacted on May 9, 2013 and Circular No. 2114 issued by the SVS on July 26, 2013. The new regulation establishes that, in the case of early termination of an insurance policy paid for in advance (for example, because of the early repayment of the related loan), all unearned premiums must be refunded to the customer by the company that issued the policy. This refund obligation includes both the unearned premiums and commissions relating to the remaining policy period, such as brokerage fees (e.g., the fees of our subsidiary Banchile Corredores de Seguros Limitada) and any other commissions. The premiums and commissions subject to refund will be calculated in proportion to the unelapsed period. This refund obligation applies with respect to insurance policies issued after this new regulation became effective. Prior to this new regulation, unearned premiums were refunded only if the early termination took place within the later of forty-five days after the issuance of the insurance policy, or one-tenth of the total term of the insurance policy (from the date of issuance). We do not expect these new refund obligations to have a material effect on our results of operations.
New Maximum Legal Interest Rates
On December 13, 2013, a new law—Law 20,715—regulating maximum interest rates became effective upon publication in the Chilean Official Gazette. This legislation affects all Chilean businesses that charge interests (including all banks, department stores and any other commerce or financial provider) on loans up to UF 200 (approximately U.S.$ 8,900), including installment loans, credit cards and credit lines related loans, as well as overdue loans. This regulation establishes among other things, a new methodology for calculating the maximum legal interest rate for loans—not indexed to inflation—longer than a 90-day term, which results in a reduction of the maximum legal interest rate applicable to such debtors. We do not expect this law will have a material effect on our results of operations.
Bankruptcy Law
On January 9, 2014, a new Bankruptcy Law was published in the Chilean Official Gazette and will become effective nine months following such publication (October 10, 2014). This new law aims to promote agreements and avoid liquidations. Among the main changes introduced by this law is Article 57, which is intended to protect debtors and provides that, during a 30-day term beginning on the date of the appointment of observers:
| (i) | the creditors of a debtor may not request its liquidation; |
| (ii) | no proceeding seeking the issuance of a warrant of attachment, execution or similar process may be initiated against a debtor; |
| (iii) | no proceeding seeking the restitution of leased assets may be initiated against a debtor; |
| (iv) | all proceedings referred to in (ii) and (iii) directly above will be suspended, as well as the term of the statute of limitations; |
| (v) | all the agreements entered into by a debtor will remain valid and effective and its payments terms and conditions will remain in force. Consequently, these agreements may not be early terminated without the consent of the debtor nor be enforced, even if the commencement of a reorganization proceeding under the Bankruptcy Law constitutes an event of default under such agreement. Thus, any guarantees granted to secure the obligations of the debtor may not be enforced; and |
| (vi) | if a debtor forms part of a public registry as a contractor or service provider, and it is in compliance with its obligations with the relevant principal, it cannot be excluded from such public registry and may not be prohibited from participating in any relevant bidding process. |
65
Table of Contents
ORGANIZATIONAL STRUCTURE
The following diagram presents our current corporate structure, including our subsidiaries and their respective direct ownership interests, as of April 15, 2014:
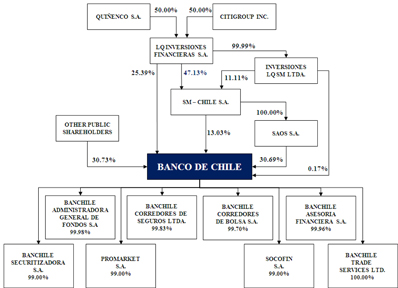
With the exception of Banchile Trade Services Limited, which was incorporated in Hong Kong, all of the subsidiaries presented above have their jurisdiction of incorporation in the Republic of Chile. See “—Business Overview—Principal Business Activities—Operations through Subsidiaries” for more information on our subsidiaries.
PROPERTY, PLANT AND EQUIPMENT
We are domiciled in Chile and own the building located at Paseo Ahumada 251, Santiago, Chile, that is approximately 77,500 square meters and serves as the headquarters for the Bank and its subsidiaries. In addition, we own three buildings located at Huerfanos 740, Agustinas 733 and Andrés Bello 2687, Santiago, Chile where the remainder of our executive offices are located. The total area we own in these buildings is equivalent to approximately 46,300 square meters.
As of December 31, 2013, we owned the properties on which 176 of our full-service branches and other points of sale are located (approximately 112,350 square meters of office space). Also, as of December 31, 2013, we had leased office space for 249 of our full-service branches with office space of approximately 72,041 square meters, while our remaining 5 branches and other points of sale were managed through special partnership agreements between the property’s owner and us. We also own properties throughout Chile for back office and administrative operations, as well as for storage of documents and other purposes. We believe that our facilities are adequate for our present needs and suitable for their intended purposes.
As of December 31, 2013, we also owned approximately 133,500 square meters in mainly recreational physical facilities in Chile, which we use to assist our employees in maintaining a healthy work and life balance and which we use for incentive and integration activities.
66
Table of Contents
SELECTED STATISTICAL INFORMATION
The following information is included for analytical purposes and should be read in conjunction with our audited consolidated financial statements as of and for the year ended December 31, 2013 appearing elsewhere in this annual report and “Item 5. Operating and Financial Review and Prospects.”
Average Balance Sheets, Interest Earned on Interest Earning Assets and Interest Paid on Interest Bearing Liabilities
The average balances for interest-earning assets and interest-bearing liabilities, including interest and readjustments received and paid, were calculated on the basis of our daily balances and on the basis of monthly balances for our subsidiaries. These average balances are presented in Chilean pesos (Ch$), in UF and in foreign currencies (principally the U.S. dollar). The UF is an inflation-indexed Chilean monetary unit of account with a value in Chilean pesos which is linked to, and which is adjusted daily to reflect changes in, the CPI of the Chilean National Institute of Statistics.
The nominal interest rate has been calculated by dividing the amount of interest and principal readjustment gain or loss during the period by the related average balance, both amounts expressed in constant pesos.
Foreign exchange gains or losses on foreign currency-denominated assets and liabilities have not been included in interest revenue or expense. Interest received on past due loans includes interest on such loans from the original maturity date. For our impaired portfolio and high risk loans, we apply a conservative approach of discontinuing accrual-basis recognition of interest revenue in the income statement and they are only recorded once received.
Included in cash and due from banks are current accounts maintained in the Central Bank and overseas banks. Such assets have a distorting effect on the average interest rate earned on total interest earning assets because of balances maintained in:
| • |
the Central Bank, only the portion that is legally required to be held for liquidity purposes earns interest; and |
| • |
overseas banks earn interest on certain accounts in certain countries. |
Consequently, the average interest earned on such assets is comparatively low. These deposits are maintained by us in these accounts to comply with statutory requirements and to facilitate international business, rather than to earn income.
67
Table of Contents
The following tables set forth, by currency of denomination, average balances and, where applicable, interest amounts and nominal rate for our assets and liabilities under IFRS for the years ended December 31, 2011, 2012 and 2013:
| For the Year Ended December 31, | ||||||||||||||||||||||||||||||||||||
| 2011 | 2012 | 2013 | ||||||||||||||||||||||||||||||||||
| IFRS: |
Average
balance |
Interest
earned (1) |
Average
nominal rate |
Average
balance |
Interest
earned (1) |
Average
nominal rate |
Average
balance |
Interest
earned (1) |
Average
nominal rate |
|||||||||||||||||||||||||||
| (in millions of Ch$, except percentages) | ||||||||||||||||||||||||||||||||||||
|
Assets |
||||||||||||||||||||||||||||||||||||
|
Interest earning assets |
||||||||||||||||||||||||||||||||||||
|
Deposits in Central Bank |
||||||||||||||||||||||||||||||||||||
|
Ch$ |
Ch$ | 226,531 | Ch$ | 2,472 | 1.09 | % | Ch$ | 279,627 | Ch$ | 1,569 | 0.56 | Ch$ | 294,427 | Ch$ | 1,386 | 0.47 | % | |||||||||||||||||||
|
UF |
— | — | — | — | — | — | — | — | — | |||||||||||||||||||||||||||
|
Foreign currency |
108,460 | 189 | 0.17 | 90,671 | 143 | 0.16 | 101,845 | 265 | 0.26 | |||||||||||||||||||||||||||
|
|
|
|
|
|
|
|
|
|
|
|
|
|
|
|
|
|
|
|||||||||||||||||||
|
Total |
334,991 | 2,661 | 0.79 | 370,298 | 1,712 | 0.46 | 396,272 | 1,651 | 0.42 | % | ||||||||||||||||||||||||||
|
|
|
|
|
|
|
|
|
|
|
|
|
|
|
|
|
|
|
|||||||||||||||||||
|
Financial investments |
||||||||||||||||||||||||||||||||||||
|
Ch$ |
630,882 | 32,721 | 5.19 | 703,721 | 51,727 | 7.35 | 797,743 | 26,424 | 3.31 | % | ||||||||||||||||||||||||||
|
UF |
669,778 | 41,375 | 6.18 | 788,630 | 38,889 | 4.93 | 930,818 | 50,314 | 5.41 | % | ||||||||||||||||||||||||||
|
Foreign currency |
261,591 | 7,673 | 2.93 | 255,998 | 3,229 | 1.26 | 218,414 | 4,723 | 2.16 | % | ||||||||||||||||||||||||||
|
|
|
|
|
|
|
|
|
|
|
|
|
|
|
|
|
|
|
|||||||||||||||||||
|
Total |
1,562,251 | 81,769 | 5.23 | 1,748,349 | 93,845 | 5.37 | 1,946,975 | 81,461 | 4.18 | % | ||||||||||||||||||||||||||
|
|
|
|
|
|
|
|
|
|
|
|
|
|
|
|
|
|
|
|||||||||||||||||||
|
Loans in advance to banks |
||||||||||||||||||||||||||||||||||||
|
Ch$ |
393,579 | 10,322 | 2.62 | 381,578 | 12,993 | 3.41 | 496,870 | 15,728 | 3.17 | % | ||||||||||||||||||||||||||
|
UF |
— | — | — | — | — | — | — | — | — | |||||||||||||||||||||||||||
|
Foreign currency |
— | — | — | — | — | — | — | — | — | |||||||||||||||||||||||||||
|
|
|
|
|
|
|
|
|
|
|
|
|
|
|
|
|
|
|
|||||||||||||||||||
|
Total |
393,579 | 10,322 | 2.62 | 381,578 | 12,993 | 3.41 | 496,870 | 15,728 | 3.17 | % | ||||||||||||||||||||||||||
|
|
|
|
|
|
|
|
|
|
|
|
|
|
|
|
|
|
|
|||||||||||||||||||
|
Commercial loans |
||||||||||||||||||||||||||||||||||||
|
Ch$ |
4,556,598 | 356,534 | 7.82 | 5,440,874 | 441,789 | 8.12 | 5,906,716 | 467,912 | 7.92 | % | ||||||||||||||||||||||||||
|
UF |
3,723,781 | 307,310 | 8.25 | 3,983,001 | 285,516 | 7.17 | 4,464,635 | 308,227 | 6.90 | % | ||||||||||||||||||||||||||
|
Foreign currency |
2,051,804 | 51,564 | 2.51 | 2,053,071 | 63,391 | 3.09 | 2,106,159 | 57,023 | 2.71 | % | ||||||||||||||||||||||||||
|
|
|
|
|
|
|
|
|
|
|
|
|
|
|
|
|
|
|
|||||||||||||||||||
|
Total |
10,332,183 | 715,408 | 6.92 | 11,476,946 | 790,696 | 6.89 | 12,477,510 | 833,162 | 6.68 | % | ||||||||||||||||||||||||||
|
|
|
|
|
|
|
|
|
|
|
|
|
|
|
|
|
|
|
|||||||||||||||||||
|
Consumer loans |
||||||||||||||||||||||||||||||||||||
|
Ch$ |
2,282,824 | 431,475 | 18.90 | 2,597,069 | 518,787 | 19.98 | 2,834,958 | 562,721 | 19.85 | % | ||||||||||||||||||||||||||
|
UF |
52,090 | 4,503 | 8.64 | 44,836 | 4,120 | 9.19 | 59,135 | 5,260 | 8.89 | % | ||||||||||||||||||||||||||
|
Foreign currency |
— | — | — | 12,329 | — | — | 15,739 | 6 | 0.04 | % | ||||||||||||||||||||||||||
|
|
|
|
|
|
|
|
|
|
|
|
|
|
|
|
|
|
|
|||||||||||||||||||
|
Total |
2,334,914 | 435,978 | 18.67 | 2,654,234 | 522,907 | 19.70 | 2,909,832 | 567,987 | 19.52 | % | ||||||||||||||||||||||||||
|
|
|
|
|
|
|
|
|
|
|
|
|
|
|
|
|
|
|
|||||||||||||||||||
|
Residential mortgage loans |
||||||||||||||||||||||||||||||||||||
|
Ch$ |
— | — | — | — | — | — | — | — | — | |||||||||||||||||||||||||||
|
UF |
3,233,830 | 266,914 | 8.25 | 3,924,080 | 266,625 | 6.79 | 4,455,850 | 288,888 | 6.48 | % | ||||||||||||||||||||||||||
|
Foreign currency |
— | — | — | — | — | — | — | — | — | |||||||||||||||||||||||||||
|
|
|
|
|
|
|
|
|
|
|
|
|
|
|
|
|
|
|
|||||||||||||||||||
|
Total |
3,233,830 | 266,914 | 8.25 | 3,924,080 | 266,625 | 6.79 | 4,455,850 | 288,888 | 6.48 | % | ||||||||||||||||||||||||||
|
|
|
|
|
|
|
|
|
|
|
|
|
|
|
|
|
|
|
|||||||||||||||||||
|
Repurchase agreement |
||||||||||||||||||||||||||||||||||||
|
Ch$ |
85,087 | 5,234 | 6.15 | 42,109 | 2,786 | 6.62 | 27,382 | 1,649 | 6.02 | % | ||||||||||||||||||||||||||
|
UF |
— | — | — | — | — | — | — | — | — | |||||||||||||||||||||||||||
|
Foreign currency |
— | — | — | — | — | — | — | — | — | |||||||||||||||||||||||||||
|
|
|
|
|
|
|
|
|
|
|
|
|
|
|
|
|
|
|
|||||||||||||||||||
|
Total |
85,087 | 5,234 | 6.15 | 42,109 | 2,786 | 6.62 | 27,382 | 1,649 | 6.02 | % | ||||||||||||||||||||||||||
|
|
|
|
|
|
|
|
|
|
|
|
|
|
|
|
|
|
|
|||||||||||||||||||
|
Total interest earnings assets |
||||||||||||||||||||||||||||||||||||
|
Ch$ |
8,175,501 | 838,758 | 10.26 | 9,444,978 | 1,029,651 | 10.90 | 10,358,096 | 1,075,820 | 10.39 | % | ||||||||||||||||||||||||||
|
UF |
7,679,479 | 620,102 | 8.07 | 8,740,547 | 595,150 | 6.81 | 9,910,438 | 652,689 | 6.59 | % | ||||||||||||||||||||||||||
|
Foreign currency |
2,421,855 | 59,426 | 2.45 | 2,412,069 | 66,763 | 2.77 | 2,442,157 | 62,017 | 2.54 | % | ||||||||||||||||||||||||||
|
|
|
|
|
|
|
|
|
|
|
|
|
|
|
|
|
|
|
|||||||||||||||||||
|
Total |
Ch$ | 18,276,835 | Ch$ | 1,518,286 | 8.31 | % | Ch$ | 20,597,594 | Ch$ | 1,691,564 | 8.21 | % | Ch$ | 22,710,691 | Ch$ | 1,790,526 | 7.88 | % | ||||||||||||||||||
|
|
|
|
|
|
|
|
|
|
|
|
|
|
|
|
|
|
|
|||||||||||||||||||
| (1) | Interest earned includes interest accrued on trading securities. |
68
Table of Contents
| For the Year Ended December 31, | ||||||||||||||||||||||||||||||||||||
| 2011 | 2012 | 2013 | ||||||||||||||||||||||||||||||||||
| IFRS: |
Average
balance |
Interest
earned (1) |
Average
nominal rate |
Average
balance |
Interest
earned (1) |
Average
nominal rate |
Average
balance |
Interest
earned (1) |
Average
nominal rate |
|||||||||||||||||||||||||||
| (in millions of Ch$, except percentages) | ||||||||||||||||||||||||||||||||||||
|
Assets |
||||||||||||||||||||||||||||||||||||
|
Non-interest earning assets |
||||||||||||||||||||||||||||||||||||
|
Cash and due from banks |
||||||||||||||||||||||||||||||||||||
|
Ch$ |
Ch$ | 445,938 | Ch$ | — | — | Ch$ | 392,220 | Ch$ | — | — | Ch$ | 434,620 | Ch$ | — | — | % | ||||||||||||||||||||
|
UF |
— | — | — | — | — | — | — | — | — | |||||||||||||||||||||||||||
|
Foreign currency |
247,685 | — | — | 238,241 | — | — | 301,156 | — | — | |||||||||||||||||||||||||||
|
|
|
|
|
|
|
|
|
|
|
|||||||||||||||||||||||||||
|
Total |
693,623 | — | — | 630,461 | — | — | 735,776 | — | — | |||||||||||||||||||||||||||
|
Transaction in the course of collection |
||||||||||||||||||||||||||||||||||||
|
Ch$ |
305,521 | — | — | 266,559 | 225,309 | — | — | |||||||||||||||||||||||||||||
|
UF |
— | — | — | — | — | — | — | — | — | |||||||||||||||||||||||||||
|
Foreign currency |
227,171 | — | — | 184,865 | — | — | 178,101 | — | — | |||||||||||||||||||||||||||
|
|
|
|
|
|
|
|
|
|
|
|
|
|
|
|
|
|
|
|||||||||||||||||||
|
Total |
532,692 | — | — | 451,424 | — | — | 403,410 | — | — | |||||||||||||||||||||||||||
|
|
|
|
|
|
|
|
|
|
|
|
|
|
|
|
|
|
|
|||||||||||||||||||
|
Allowances for loan losses |
||||||||||||||||||||||||||||||||||||
|
Ch$ |
(389,578 | ) | — | — | (352,064 | ) | (409,921 | ) | — | — | ||||||||||||||||||||||||||
|
UF |
— | — | — | — | — | — | — | — | — | |||||||||||||||||||||||||||
|
Foreign currency |
— | — | — | — | — | (6 | ) | — | — | |||||||||||||||||||||||||||
|
|
|
|
|
|
|
|
|
|
|
|
|
|
|
|
|
|
|
|||||||||||||||||||
|
Total |
(389,578 | ) | — | — | (352,064 | ) | — | — | (409,927 | ) | — | — | ||||||||||||||||||||||||
|
|
|
|
|
|
|
|
|
|
|
|
|
|
|
|
|
|
|
|||||||||||||||||||
|
Derivatives |
||||||||||||||||||||||||||||||||||||
|
Ch$ |
414,682 | — | — | 329,513 | — | — | 295,460 | — | — | |||||||||||||||||||||||||||
|
UF |
— | — | — | — | — | — | — | — | — | |||||||||||||||||||||||||||
|
Foreign currency |
41,616 | — | — | 50,698 | — | — | 52,395 | — | — | |||||||||||||||||||||||||||
|
|
|
|
|
|
|
|
|
|
|
|
|
|
|
|
|
|
|
|||||||||||||||||||
|
Total |
456,298 | — | — | 380,211 | — | — | 347,855 | — | — | |||||||||||||||||||||||||||
|
|
|
|
|
|
|
|
|
|
|
|
|
|
|
|
|
|
|
|||||||||||||||||||
|
Investment in other companies |
||||||||||||||||||||||||||||||||||||
|
Ch$ |
14,074 | — | — | 15,686 | — | — | 15,525 | — | — | |||||||||||||||||||||||||||
|
UF |
— | — | — | — | — | — | — | — | — | |||||||||||||||||||||||||||
|
Foreign currency |
65 | — | — | 15 | — | — | 41 | — | — | |||||||||||||||||||||||||||
|
|
|
|
|
|
|
|
|
|
|
|
|
|
|
|
|
|
|
|||||||||||||||||||
|
Total |
14,139 | — | — | 15,701 | — | — | 15,566 | — | — | |||||||||||||||||||||||||||
|
|
|
|
|
|
|
|
|
|
|
|
|
|
|
|
|
|
|
|||||||||||||||||||
|
Intangible assets |
||||||||||||||||||||||||||||||||||||
|
Ch$ |
81,524 | — | — | 70,335 | — | — | 74,709 | — | — | |||||||||||||||||||||||||||
|
UF |
— | — | — | — | — | — | — | — | — | |||||||||||||||||||||||||||
|
Foreign currency |
— | — | — | — | — | — | — | — | — | |||||||||||||||||||||||||||
|
|
|
|
|
|
|
|
|
|
|
|
|
|
|
|
|
|
|
|||||||||||||||||||
|
Total |
81,524 | — | — | 70,335 | — | — | 74,709 | — | — | |||||||||||||||||||||||||||
|
|
|
|
|
|
|
|
|
|
|
|
|
|
|
|
|
|
|
|||||||||||||||||||
|
Fixed assets |
||||||||||||||||||||||||||||||||||||
|
Ch$ |
207,132 | — | — | 208,650 | — | — | 201,991 | — | — | |||||||||||||||||||||||||||
|
UF |
— | — | — | — | — | — | — | — | — | |||||||||||||||||||||||||||
|
Foreign currency |
— | — | — | — | — | — | — | — | — | |||||||||||||||||||||||||||
|
|
|
|
|
|
|
|
|
|
|
|
|
|
|
|
|
|
|
|||||||||||||||||||
|
Total |
207,132 | — | — | 208,650 | — | — | 201,991 | — | — | |||||||||||||||||||||||||||
|
|
|
|
|
|
|
|
|
|
|
|
|
|
|
|
|
|
|
|||||||||||||||||||
|
Current tax assets |
||||||||||||||||||||||||||||||||||||
|
Ch$ |
6,173 | — | — | 1,922 | — | — | — | — | — | |||||||||||||||||||||||||||
|
UF |
— | — | — | — | — | — | — | — | — | |||||||||||||||||||||||||||
|
Foreign currency |
— | — | — | — | — | — | — | — | — | |||||||||||||||||||||||||||
|
|
|
|
|
|
|
|
|
|
|
|
|
|
|
|
|
|
|
|||||||||||||||||||
|
Total |
6,173 | — | — | 1,922 | — | — | — | — | — | |||||||||||||||||||||||||||
|
|
|
|
|
|
|
|
|
|
|
|
|
|
|
|
|
|
|
|||||||||||||||||||
|
Deferred tax assets |
||||||||||||||||||||||||||||||||||||
|
Ch$ |
91,397 | — | — | 116,737 | — | — | 44,785 | — | — | |||||||||||||||||||||||||||
|
UF |
— | — | — | — | — | — | — | — | — | |||||||||||||||||||||||||||
|
Foreign currency |
— | — | — | — | — | — | — | — | — | |||||||||||||||||||||||||||
|
|
|
|
|
|
|
|
|
|
|
|
|
|
|
|
|
|
|
|||||||||||||||||||
|
Total |
91,397 | — | — | 116,737 | — | — | 44,785 | — | — | |||||||||||||||||||||||||||
|
|
|
|
|
|
|
|
|
|
|
|
|
|
|
|
|
|
|
|||||||||||||||||||
|
Other assets |
||||||||||||||||||||||||||||||||||||
|
Ch$ |
276,392 | — | — | 224,076 | — | — | 205,980 | — | — | |||||||||||||||||||||||||||
|
UF |
66,255 | — | — | 55,582 | — | — | 61,560 | — | — | |||||||||||||||||||||||||||
|
Foreign currency |
12,048 | — | — | 37,359 | — | — | 30,868 | — | — | |||||||||||||||||||||||||||
|
|
|
|
|
|
|
|
|
|
|
|
|
|
|
|
|
|
|
|||||||||||||||||||
|
Total |
354,695 | — | — | 317,017 | — | — | 298,408 | — | — | |||||||||||||||||||||||||||
|
|
|
|
|
|
|
|
|
|
|
|
|
|
|
|
|
|
|
|||||||||||||||||||
|
Total non-interest earning assets |
||||||||||||||||||||||||||||||||||||
|
Ch$ |
1,007,317 | — | — | 1,273,634 | — | — | 1,088,458 | — | — | |||||||||||||||||||||||||||
|
UF |
66,255 | — | — | 55,582 | — | — | 61,560 | — | — | |||||||||||||||||||||||||||
|
Foreign currency |
280,900 | — | — | 511,177 | — | — | 562,555 | — | — | |||||||||||||||||||||||||||
|
|
|
|
|
|
|
|
|
|
|
|
|
|
|
|
|
|
|
|||||||||||||||||||
|
Total |
1,354,472 | — | — | 1,840,393 | — | — | 1,712,573 | — | — | |||||||||||||||||||||||||||
|
|
|
|
|
|
|
|
|
|
|
|
|
|
|
|
|
|
|
|||||||||||||||||||
|
Total assets |
||||||||||||||||||||||||||||||||||||
|
Ch$ |
9,628,756 | 838,758 | — | 10,718,612 | 1,029,651 | — | 11,446,554 | 1,075,820 | — | |||||||||||||||||||||||||||
|
UF |
7,745,734 | 620,102 | — | 8,796,129 | 595,150 | — | 9,971,998 | 652,689 | — | |||||||||||||||||||||||||||
|
Foreign currency |
2,950,440 | 59,426 | — | 2,923,246 | 66,763 | — | 3,004,712 | 62,017 | — | |||||||||||||||||||||||||||
|
|
|
|
|
|
|
|
|
|
|
|
|
|
|
|
|
|
|
|||||||||||||||||||
|
Total |
Ch$ | 20,324,930 | Ch$ | 1,518,286 | — | Ch$ | 22,437,987 | Ch$ | 1,691,564 | — | Ch$ | 24,423,264 | Ch$ | 1,790,526 | — | % | ||||||||||||||||||||
|
|
|
|
|
|
|
|
|
|
|
|
|
|
|
|
|
|
|
|||||||||||||||||||
| (1) | Interest earned includes interest accrued on trading securities. |
69
Table of Contents
| For the Year Ended December 31, | ||||||||||||||||||||||||||||||||||||
| 2011 | 2012 | 2013 | ||||||||||||||||||||||||||||||||||
| IFRS: |
Average
balance |
Interest
paid |
Average
nominal rate |
Average
balance |
Interest
paid |
Average
nominal rate |
Average
balance |
Interest
paid |
Average
nominal rate |
|||||||||||||||||||||||||||
| (in millions of Ch$, except percentages) | ||||||||||||||||||||||||||||||||||||
|
Liabilities |
||||||||||||||||||||||||||||||||||||
|
Interest bearing liabilities |
||||||||||||||||||||||||||||||||||||
|
Savings accounts |
||||||||||||||||||||||||||||||||||||
|
Ch$ |
Ch$ | 5,339,224 | Ch$ | 282,511 | 5.29 | % | Ch | 6,212,712 | Ch$ | 356,191 | 5.73 | % | Ch$ | 6,836,894 | Ch$ | 354,636 | 5.19 | % | ||||||||||||||||||
|
UF |
2,246,187 | 140,879 | 6.27 | 2,349,836 | 134,947 | 5.74 | 2,248,767 | 117,241 | 5.21 | |||||||||||||||||||||||||||
|
Foreign currency |
864,820 | 8,512 | 0.98 | 817,575 | 6,790 | 0.83 | 756,822 | 3,312 | 0.44 | |||||||||||||||||||||||||||
|
|
|
|
|
|
|
|
|
|
|
|
|
|
|
|
|
|
|
|||||||||||||||||||
|
Total |
8,450,231 | 431,902 | 5.10 | 9,380,123 | 497,928 | 5.31 | 9,842,483 | 475,189 | 4.83 | |||||||||||||||||||||||||||
|
|
|
|
|
|
|
|
|
|
|
|
|
|
|
|
|
|
|
|||||||||||||||||||
|
Repurchase agreements |
||||||||||||||||||||||||||||||||||||
|
Ch$ |
216,102 | 10,846 | 5.02 | 278,456 | 14,975 | 5.38 | 285,107 | 13,148 | 4.61 | |||||||||||||||||||||||||||
|
UF |
16 | — | — | 3,036 | 10 | 0.33 | 128 | — | 0.00 | |||||||||||||||||||||||||||
|
Foreign currency |
2,729 | 3 | 0.11 | 5,452 | 1 | 0.02 | 3,872 | — | 0.00 | |||||||||||||||||||||||||||
|
|
|
|
|
|
|
|
|
|
|
|
|
|
|
|
|
|
|
|||||||||||||||||||
|
Total |
218,847 | 10,849 | 4.96 | 286,944 | 14,986 | 5.22 | 289,107 | 13,148 | 4.55 | % | ||||||||||||||||||||||||||
|
|
|
|
|
|
|
|
|
|
|
|
|
|
|
|
|
|
|
|||||||||||||||||||
|
Borrowings from financial institutions |
||||||||||||||||||||||||||||||||||||
|
Ch$ |
200,026 | 6,072 | 3.04 | 35,705 | 3,050 | 8.54 | 140,055 | 3,307 | 2.36 | |||||||||||||||||||||||||||
|
UF |
15,485 | (1 | ) | — | 36 | — | — | 13 | — | 0.00 | ||||||||||||||||||||||||||
|
Foreign currency |
1,499,906 | 17,709 | 1.18 | 1,399,621 | 19,258 | 1.38 | 1,061,798 | 10,484 | 0.99 | |||||||||||||||||||||||||||
|
|
|
|
|
|
|
|
|
|
|
|
|
|
|
|
|
|
|
|||||||||||||||||||
|
Total |
1,715,417 | 23,780 | 1.39 | 1,435,362 | 22,308 | 1.55 | 1,201,866 | 13,791 | 1.15 | % | ||||||||||||||||||||||||||
|
|
|
|
|
|
|
|
|
|
|
|
|
|
|
|
|
|
|
|||||||||||||||||||
|
Debt issued |
||||||||||||||||||||||||||||||||||||
|
Ch$ |
54,019 | 1,612 | 2.98 | 36,866 | 1,048 | 2.84 | 22,731 | 1,132 | 4.98 | |||||||||||||||||||||||||||
|
UF |
1,827,406 | 148,090 | 8.10 | 2,516,157 | 160,071 | 6.36 | 3,075,889 | 182,824 | 5.94 | |||||||||||||||||||||||||||
|
Foreign currency |
113,254 | 4,194 | 3.70 | 285,147 | 9,103 | 3.19 | 672,589 | 15,374 | 2.29 | |||||||||||||||||||||||||||
|
|
|
|
|
|
|
|
|
|
|
|
|
|
|
|
|
|
|
|||||||||||||||||||
|
Total |
1,994,679 | 153,896 | 7.72 | 2,838,170 | 170,222 | 6.00 | 3,771,209 | 199,330 | 5.29 | % | ||||||||||||||||||||||||||
|
|
|
|
|
|
|
|
|
|
|
|
|
|
|
|
|
|
|
|||||||||||||||||||
|
Other financial obligations |
||||||||||||||||||||||||||||||||||||
|
Ch$ |
82,470 | 1,325 | 1.61 | 95,187 | 1,525 | 1.60 | 101,782 | 1,473 | 1.45 | |||||||||||||||||||||||||||
|
UF |
29,411 | 2,217 | 7.54 | 26,078 | 1,501 | 5.76 | 21,757 | 1,398 | 6.43 | |||||||||||||||||||||||||||
|
Foreign currency |
56,977 | 240 | 0.42 | 49,712 | 159 | 0.32 | 50,329 | 42 | 0.08 | |||||||||||||||||||||||||||
|
|
|
|
|
|
|
|
|
|
|
|
|
|
|
|
|
|
|
|||||||||||||||||||
|
Total |
168,858 | 3,782 | 2.24 | 170,977 | 3,185 | 1.86 | 173,868 | 2,913 | 1.68 | |||||||||||||||||||||||||||
|
|
|
|
|
|
|
|
|
|
|
|
|
|
|
|
|
|
|
|||||||||||||||||||
|
Total interest bearing liabilities |
||||||||||||||||||||||||||||||||||||
|
Ch$ |
5,891,841 | 302,366 | 5.31 | 6,658,926 | 376,789 | 5.66 | 7,386,569 | 373,696 | 5.06 | % | ||||||||||||||||||||||||||
|
UF |
4,118,505 | 291,185 | 7.07 | 4,895,143 | 296,529 | 6.06 | 5,346,554 | 301,463 | 5.64 | % | ||||||||||||||||||||||||||
|
Foreign currency |
2,537,686 | 30,658 | 1.21 | 2,557,507 | 35,311 | 1.38 | 2,545,410 | 29,212 | 1.15 | % | ||||||||||||||||||||||||||
|
|
|
|
|
|
|
|
|
|
|
|
|
|
|
|
|
|
|
|||||||||||||||||||
|
Total |
Ch$ | 12,548,032 | Ch$ | 624,209 | 4.97 | % | Ch$ | 14,111,576 | Ch$ | 708,629 | 5.02 | % | Ch$ | 15,278,533 | Ch$ | 704,371 | 4.61 | % | ||||||||||||||||||
|
|
|
|
|
|
|
|
|
|
|
|
|
|
|
|
|
|
|
|||||||||||||||||||
70
Table of Contents
| Year Ended December 31, | ||||||||||||||||||||||||||||||||||||
| 2011 | 2012 | 2013 | ||||||||||||||||||||||||||||||||||
| IFRS: |
Average
balance |
Interest
paid |
Average
nominal rate |
Average
balance |
Interest
paid |
Average
nominal rate |
Average
balance |
Interest
paid |
Average
nominal rate |
|||||||||||||||||||||||||||
| (in millions of Ch$, except percentages) | ||||||||||||||||||||||||||||||||||||
|
Liabilities |
||||||||||||||||||||||||||||||||||||
|
Non–interest bearing liabilities |
||||||||||||||||||||||||||||||||||||
|
Current account and demand deposit |
||||||||||||||||||||||||||||||||||||
|
Ch$ |
Ch$ | 3,751,441 | Ch$ | — | — | Ch$ | 4,093,133 | Ch$ | — | — | Ch$ | 4,576,645 | Ch$ | — | — | % | ||||||||||||||||||||
|
UF |
167,004 | — | — | 159,501 | — | — | 164,012 | — | — | |||||||||||||||||||||||||||
|
Foreign currency |
621,890 | — | — | 673,841 | — | — | 714,685 | — | — | |||||||||||||||||||||||||||
|
|
|
|
|
|
|
|
|
|
|
|
|
|
|
|
|
|
|
|||||||||||||||||||
|
Total |
4,540,335 | — | — | 4,926,475 | — | — | 5,455,342 | — | — | |||||||||||||||||||||||||||
|
|
|
|
|
|
|
|
|
|
|
|
|
|
|
|
|
|
|
|||||||||||||||||||
|
Transaction in the course of payment |
||||||||||||||||||||||||||||||||||||
|
Ch$ |
141,285 | — | — | 127,303 | — | — | 84,307 | — | — | |||||||||||||||||||||||||||
|
UF |
— | — | — | — | — | — | — | — | — | |||||||||||||||||||||||||||
|
Foreign currency |
240,505 | — | — | 175,972 | — | — | 148,098 | — | — | |||||||||||||||||||||||||||
|
|
|
|
|
|
|
|
|
|
|
|
|
|
|
|
|
|
|
|||||||||||||||||||
|
Total |
381,790 | — | — | 303,275 | — | — | 232,405 | — | — | |||||||||||||||||||||||||||
|
|
|
|
|
|
|
|
|
|
|
|
|
|
|
|
|
|
|
|||||||||||||||||||
|
Derivatives |
||||||||||||||||||||||||||||||||||||
|
Ch$ |
401,759 | — | — | 338,598 | — | — | 313,315 | — | — | |||||||||||||||||||||||||||
|
UF |
80 | — | — | — | — | — | — | — | — | |||||||||||||||||||||||||||
|
Foreign currency |
77,111 | — | — | 92,303 | — | — | 78,467 | — | — | |||||||||||||||||||||||||||
|
|
|
|
|
|
|
|
|
|
|
|
|
|
|
|
|
|
|
|||||||||||||||||||
|
Total |
478,950 | — | — | 430,901 | — | — | 391,782 | — | — | |||||||||||||||||||||||||||
|
|
|
|
|
|
|
|
|
|
|
|
|
|
|
|
|
|
|
|||||||||||||||||||
|
Current liabilities |
||||||||||||||||||||||||||||||||||||
|
Ch$ |
3,851 | — | — | 12,470 | — | — | 5,401 | — | — | |||||||||||||||||||||||||||
|
UF |
— | — | — | — | — | — | — | — | — | |||||||||||||||||||||||||||
|
Foreign currency |
— | — | — | — | — | — | — | — | — | |||||||||||||||||||||||||||
|
|
|
|
|
|
|
|
|
|
|
|
|
|
|
|
|
|
|
|||||||||||||||||||
|
Total |
3,851 | — | — | 12,470 | — | — | 5,401 | — | — | |||||||||||||||||||||||||||
|
|
|
|
|
|
|
|
|
|
|
|
|
|
|
|
|
|
|
|||||||||||||||||||
|
Deferred tax liabilities |
||||||||||||||||||||||||||||||||||||
|
Ch$ |
32,262 | — | — | 56,830 | — | — | — | — | — | |||||||||||||||||||||||||||
|
UF |
— | — | — | — | — | — | — | — | — | |||||||||||||||||||||||||||
|
Foreign currency |
— | — | — | — | — | — | — | — | — | |||||||||||||||||||||||||||
|
|
|
|
|
|
|
|
|
|
|
|
|
|
|
|
|
|
|
|||||||||||||||||||
|
Total |
32,262 | — | — | 56,830 | — | — | — | — | — | |||||||||||||||||||||||||||
|
|
|
|
|
|
|
|
|
|
|
|
|
|
|
|
|
|
|
|||||||||||||||||||
|
Provisions |
||||||||||||||||||||||||||||||||||||
|
Ch$ |
91,622 | — | — | 98,794 | — | — | 110,187 | — | — | |||||||||||||||||||||||||||
|
UF |
— | — | — | — | — | — | — | — | — | |||||||||||||||||||||||||||
|
Foreign currency |
— | — | — | — | — | — | — | — | — | |||||||||||||||||||||||||||
|
|
|
|
|
|
|
|
|
|
|
|
|
|
|
|
|
|
|
|||||||||||||||||||
|
Total |
91,622 | — | — | 98,794 | — | — | 110,187 | — | — | |||||||||||||||||||||||||||
|
|
|
|
|
|
|
|
|
|
|
|
|
|
|
|
|
|
|
|||||||||||||||||||
|
Other liabilities |
||||||||||||||||||||||||||||||||||||
|
Ch$ |
280,892 | — | — | 237,218 | — | — | 243,424 | — | — | |||||||||||||||||||||||||||
|
UF |
12,916 | — | — | 15,891 | — | — | 17,266 | — | — | |||||||||||||||||||||||||||
|
Foreign currency |
16,320 | — | — | 33,788 | — | — | 27,758 | — | — | |||||||||||||||||||||||||||
|
|
|
|
|
|
|
|
|
|
|
|
|
|
|
|
|
|
|
|||||||||||||||||||
|
Total |
310,128 | — | — | 286,897 | — | — | 288,448 | — | — | |||||||||||||||||||||||||||
|
|
|
|
|
|
|
|
|
|
|
|
|
|
|
|
|
|
|
|||||||||||||||||||
|
Equity |
||||||||||||||||||||||||||||||||||||
|
Ch$ |
1,937,960 | — | — | 2,210,769 | — | — | 2,661,166 | — | — | |||||||||||||||||||||||||||
|
UF |
— | — | — | — | — | — | — | — | — | |||||||||||||||||||||||||||
|
Foreign currency |
— | — | — | — | — | — | — | — | — | |||||||||||||||||||||||||||
|
|
|
|
|
|
|
|
|
|
|
|
|
|
|
|
|
|
|
|||||||||||||||||||
|
Total |
1,937,960 | — | — | 2,210,769 | — | — | 2,661,166 | — | — | |||||||||||||||||||||||||||
|
|
|
|
|
|
|
|
|
|
|
|
|
|
|
|
|
|
|
|||||||||||||||||||
|
Total non-interest bearing liabilities and equity |
||||||||||||||||||||||||||||||||||||
|
Ch$ |
6,641,072 | — | — | 7,175,115 | — | — | 7,994,445 | — | — | |||||||||||||||||||||||||||
|
UF |
180,000 | — | — | 175,392 | — | — | 181,278 | — | — | |||||||||||||||||||||||||||
|
Foreign currency |
955,826 | — | — | 975,904 | — | — | 969,008 | — | — | |||||||||||||||||||||||||||
|
|
|
|
|
|
|
|
|
|
|
|
|
|
|
|
|
|
|
|||||||||||||||||||
|
Total |
7,776,898 | — | — | 8,326,411 | — | — | 9,144,731 | — | — | |||||||||||||||||||||||||||
|
|
|
|
|
|
|
|
|
|
|
|
|
|
|
|
|
|
|
|||||||||||||||||||
|
Total liabilities and equity |
||||||||||||||||||||||||||||||||||||
|
Ch$ |
12,532,913 | 302,366 | — | 13,834,041 | 376,774 | — | 15,381,014 | 373,696 | — | |||||||||||||||||||||||||||
|
UF |
4,298,505 | 291,185 | — | 5,070,535 | 296,437 | — | 5,527,832 | 301,463 | — | |||||||||||||||||||||||||||
|
Foreign currency |
3,493,512 | 30,658 | — | 3,533,411 | 42,260 | — | 3,514,418 | 29,212 | — | |||||||||||||||||||||||||||
|
|
|
|
|
|
|
|
|
|
|
|
|
|
|
|
|
|
|
|||||||||||||||||||
|
Total |
Ch$ | 20,324,930 | Ch$ | 624,209 | — | Ch$ | 22,437,987 | Ch$ | 715,471 | — | Ch$ | 24,423,264 | Ch$ | 704,371 | — | % | ||||||||||||||||||||
|
|
|
|
|
|
|
|
|
|
|
|
|
|
|
|
|
|
|
|||||||||||||||||||
71
Table of Contents
Interest Earning Assets and Net Interest Margin
The following table sets forth, by currency of denomination, the levels of our average interest earning assets and net interest, and illustrates the comparative margins obtained, for the years ended December 31, 2011, 2012 and 2013:
| For the Year Ended December 31, | ||||||||||||
| 2011 | 2012 | 2013 | ||||||||||
| IFRS: | (in millions of Ch$, except percentages) | |||||||||||
|
Total average interest earning assets |
||||||||||||
|
Ch$ |
Ch$ | 8,175,501 | Ch$ | 9,444,978 | Ch$ | 10,358,096 | ||||||
|
UF |
7,679,479 | 8,740,547 | 9,910,438 | |||||||||
|
Foreign currency |
2,421,855 | 2,412,069 | 2,442,157 | |||||||||
|
|
|
|
|
|
|
|||||||
|
Total |
18,276,835 | 20,597,594 | 22,710,691 | |||||||||
|
|
|
|
|
|
|
|||||||
|
Net interest earned (including interest earned on trading securities) (1) |
||||||||||||
|
Ch$ |
536,392 | 652,862 | 702,124 | |||||||||
|
UF |
328,917 | 298,621 | 351,226 | |||||||||
|
Foreign currency |
28,768 | 31,452 | 32,805 | |||||||||
|
|
|
|
|
|
|
|||||||
|
Total |
Ch$ | 894,077 | Ch$ | 982,935 | 1,086,155 | |||||||
|
|
|
|
|
|
|
|||||||
|
Net interest margin, nominal basis (2) |
||||||||||||
|
Ch$ |
6.56 | % | 6.91 | % | 6.78 | % | ||||||
|
UF |
4.28 | 3.42 | 3.54 | |||||||||
|
Foreign currency |
1.19 | 1.30 | 1.34 | |||||||||
|
|
|
|
|
|
|
|||||||
|
Total |
4.89 | % | 4.77 | % | 4.78 | % | ||||||
|
|
|
|
|
|
|
|||||||
| (1) | Net interest earned is defined as interest revenue earned less interest expense incurred. |
| (2) | Net interest margin, nominal basis is defined as net interest earned divided by average interest earning assets. |
72
Table of Contents
Changes in Net Interest Income—Volume and Rate Analysis
The following tables compare, by currency of denomination, changes in our net interest revenue between 2011 and 2012, as well as 2012 and 2013, caused by (i) changes in the average volume of interest earning assets and interest bearing liabilities and (ii) changes in their respective nominal interest rates. Volume and rate variances were calculated based on movements in average balances over the period and changes in nominal interest rate, average interest earning assets and average interest bearing liabilities. The net change attributable to changes in both volume and rate has been allocated proportionately to the change in volume and the change in rate.
|
Increase (Decrease) from
2011 to 2012 due to changes in |
Net change
from 2011 to 2012 |
Increase (Decrease) from
2012 to 2013 due to changes in |
Net change
from 2012 to 2013 |
|||||||||||||||||||||
| IFRS: | Volume | Rate | Volume | Rate | ||||||||||||||||||||
| (in millions of Ch$) | ||||||||||||||||||||||||
|
Assets |
||||||||||||||||||||||||
|
Interest earning assets |
||||||||||||||||||||||||
|
Deposits in Central Bank |
||||||||||||||||||||||||
|
Ch$ |
Ch$ | 488 | Ch$ | (1,391 | ) | Ch$ | (903 | ) | Ch$ | 80 | Ch$ | (263 | ) | Ch$ | (183 | ) | ||||||||
|
UF |
— | — | — | — | — | — | ||||||||||||||||||
|
Foreign currency |
(29 | ) | (17 | ) | (46 | ) | 19 | 103 | 122 | |||||||||||||||
|
|
|
|
|
|
|
|
|
|
|
|
|
|||||||||||||
|
Total |
459 | (1,408 | ) | (949 | ) | 99 | (160 | ) | (61 | ) | ||||||||||||||
|
|
|
|
|
|
|
|
|
|
|
|
|
|||||||||||||
|
Financial investments |
||||||||||||||||||||||||
|
Ch$ |
4,119 | 14,887 | 19,006 | 6,168 | (31,471 | ) | (25,303 | ) | ||||||||||||||||
|
UF |
6,649 | (9,135 | ) | (2,486 | ) | 7,451 | 3,974 | 11,425 | ||||||||||||||||
|
Foreign currency |
(160 | ) | (4,284 | ) | (4,444 | ) | (532 | ) | 2,026 | 1,494 | ||||||||||||||
|
|
|
|
|
|
|
|
|
|
|
|
|
|||||||||||||
|
Total |
10,608 | 1,468 | 12,076 | 13,087 | (25,471 | ) | (12,384 | ) | ||||||||||||||||
|
|
|
|
|
|
|
|
|
|
|
|
|
|||||||||||||
|
Loans in advance to banks |
||||||||||||||||||||||||
|
Ch$ |
(323 | ) | 2,994 | 2,671 | 3,702 | (967 | ) | 2,735 | ||||||||||||||||
|
UF |
— | — | — | — | — | — | ||||||||||||||||||
|
Foreign currency |
— | — | — | — | — | — | ||||||||||||||||||
|
|
|
|
|
|
|
|
|
|
|
|
|
|||||||||||||
|
Total |
(323 | ) | 2,994 | 2,671 | 3,702 | (967 | ) | 2,735 | ||||||||||||||||
|
|
|
|
|
|
|
|
|
|
|
|
|
|||||||||||||
|
Commercial loans |
||||||||||||||||||||||||
|
Ch$ |
71,377 | 13,878 | 85,255 | 37,107 | (10,984 | ) | 26,123 | |||||||||||||||||
|
UF |
20,413 | (42,207 | ) | (21,794 | ) | 33,549 | (10,838 | ) | 22,711 | |||||||||||||||
|
Foreign currency |
32 | 11,795 | 11,827 | 1,604 | (7,972 | ) | (6,368 | ) | ||||||||||||||||
|
|
|
|
|
|
|
|
|
|
|
|
|
|||||||||||||
|
Total |
91,822 | (16,534 | ) | 75,288 | 72,260 | (29,794 | ) | 42,466 | ||||||||||||||||
|
|
|
|
|
|
|
|
|
|
|
|
|
|||||||||||||
|
Consumer loans |
||||||||||||||||||||||||
|
Ch$ |
61,786 | 25,526 | 87,312 | 47,239 | (3,305 | ) | 43,934 | |||||||||||||||||
|
UF |
(654 | ) | 271 | (383 | ) | 1,276 | (136 | ) | 1,140 | |||||||||||||||
|
Foreign currency |
— | — | — | — | 6 | 6 | ||||||||||||||||||
|
|
|
|
|
|
|
|
|
|
|
|
|
|||||||||||||
|
Total |
61,132 | 25,797 | 86,929 | 48,515 | (3,435 | ) | 45,080 | |||||||||||||||||
|
|
|
|
|
|
|
|
|
|
|
|
|
|||||||||||||
|
Residential mortgage loans |
||||||||||||||||||||||||
|
Ch$ |
— | — | — | — | — | — | ||||||||||||||||||
|
UF |
51,463 | (51,752 | ) | (289 | ) | 34,895 | (12,632 | ) | 22,263 | |||||||||||||||
|
Foreign currency |
— | — | — | — | — | — | ||||||||||||||||||
|
|
|
|
|
|
|
|
|
|
|
|
|
|||||||||||||
|
Total |
51,463 | (51,752 | ) | (289 | ) | 34,895 | (12,632 | ) | 22,263 | |||||||||||||||
|
|
|
|
|
|
|
|
|
|
|
|
|
|||||||||||||
|
Repurchase agreement |
||||||||||||||||||||||||
|
Ch$ |
(2,817 | ) | 369 | (2,448 | ) | (905 | ) | (232 | ) | (1,137 | ) | |||||||||||||
|
UF |
— | — | — | — | — | — | ||||||||||||||||||
|
Foreign currency |
— | — | — | — | — | — | ||||||||||||||||||
|
|
|
|
|
|
|
|
|
|
|
|
|
|||||||||||||
|
Total |
(2,817 | ) | 369 | (2,448 | ) | (905 | ) | (232 | ) | (1,137 | ) | |||||||||||||
|
|
|
|
|
|
|
|
|
|
|
|
|
|||||||||||||
|
Total interest earning assets |
||||||||||||||||||||||||
|
Ch$ |
134,630 | 56,263 | 190,893 | 93,391 | (47,222 | ) | 46,169 | |||||||||||||||||
|
UF |
77,871 | (102,823 | ) | (24,952 | ) | 77,171 | (19,632 | ) | 57,539 | |||||||||||||||
|
Foreign currency |
(157 | ) | 7,494 | 7,337 | 1,091 | (5,837 | ) | (4,746 | ) | |||||||||||||||
|
|
|
|
|
|
|
|
|
|
|
|
|
|||||||||||||
|
Total |
Ch$ | 212,344 | Ch$ | (39,066 | ) | Ch$ | 173,278 | Ch$ | 171,653 | Ch$ | (72,691 | ) | Ch$ | 98,962 | ||||||||||
|
|
|
|
|
|
|
|
|
|
|
|
|
|||||||||||||
73
Table of Contents
|
Increase (Decrease) from
2011 to 2012 due to changes in |
Net change
from 2011 to 2012 |
Increase (Decrease) from
2012 to 2013 due to changes in |
Net change
from 2012 to 2013 |
|||||||||||||||||||||
| IFRS: | Volume | Rate | Volume | Rate | ||||||||||||||||||||
| (in millions of Ch$) | ||||||||||||||||||||||||
|
Liabilities |
||||||||||||||||||||||||
|
Interest bearing liabilities |
||||||||||||||||||||||||
|
Savings accounts and time deposits |
||||||||||||||||||||||||
|
Ch$ |
Ch$ | 48,774 | Ch$ | 24,906 | Ch$ | 73,680 | Ch$ | 34,036 | Ch$ | (35,591 | ) | Ch$ | (1,555 | ) | ||||||||||
|
UF |
6,305 | (12,237 | ) | (5,932 | ) | (5,634 | ) | (12,072 | ) | (17,706 | ) | |||||||||||||
|
Foreign currency |
(446 | ) | (1,276 | ) | (1,722 | ) | (472 | ) | (3,006 | ) | (3,478 | ) | ||||||||||||
|
|
|
|
|
|
|
|
|
|
|
|
|
|||||||||||||
|
Total |
54,633 | 11,393 | 66,026 | 27,930 | (50,669 | ) | (22,739 | ) | ||||||||||||||||
|
|
|
|
|
|
|
|
|
|
|
|
|
|||||||||||||
|
Repurchase agreements |
||||||||||||||||||||||||
|
Ch$ |
3,309 | 820 | 4,129 | 350 | (2,177 | ) | (1,827 | ) | ||||||||||||||||
|
UF |
— | 10 | 10 | (5 | ) | (5 | ) | (10 | ) | |||||||||||||||
|
Foreign currency |
2 | (4 | ) | (2 | ) | — | (1 | ) | (1 | ) | ||||||||||||||
|
|
|
|
|
|
|
|
|
|
|
|
|
|||||||||||||
|
Total |
3,311 | 826 | 4,137 | 345 | (2,183 | ) | (1,838 | ) | ||||||||||||||||
|
|
|
|
|
|
|
|
|
|
|
|
|
|||||||||||||
|
Borrowing from financial institutions |
||||||||||||||||||||||||
|
Ch$ |
(7,809 | ) | 4,787 | (3,022 | ) | 3,744 | (3,487 | ) | 257 | |||||||||||||||
|
UF |
— | 1 | 1 | — | — | — | ||||||||||||||||||
|
Foreign currency |
(1,240 | ) | 2,789 | 1,549 | (4,043 | ) | (4,731 | ) | (8,774 | ) | ||||||||||||||
|
|
|
|
|
|
|
|
|
|
|
|
|
|||||||||||||
|
Total |
(9,049 | ) | 7,577 | (1,472 | ) | (299 | ) | (8,218 | ) | (8,517 | ) | |||||||||||||
|
|
|
|
|
|
|
|
|
|
|
|
|
|||||||||||||
|
Debt issued |
||||||||||||||||||||||||
|
Ch$ |
(491 | ) | (73 | ) | (564 | ) | (504 | ) | 588 | 84 | ||||||||||||||
|
UF |
48,160 | (36,179 | ) | 11,981 | 33,803 | (11,050 | ) | 22,753 | ||||||||||||||||
|
Foreign currency |
5,561 | (652 | ) | 4,909 | 9,463 | (3,192 | ) | 6,271 | ||||||||||||||||
|
|
|
|
|
|
|
|
|
|
|
|
|
|||||||||||||
|
Total |
53,230 | (36,904 | ) | 16,326 | 42,762 | (13,654 | ) | 29,108 | ||||||||||||||||
|
|
|
|
|
|
|
|
|
|
|
|
|
|||||||||||||
|
Other financial obligation |
||||||||||||||||||||||||
|
Ch$ |
204 | (4 | ) | 200 | 101 | (153 | ) | (52 | ) | |||||||||||||||
|
UF |
(16 | ) | (700 | ) | (716 | ) | (266 | ) | 163 | (103 | ) | |||||||||||||
|
Foreign currency |
(28 | ) | (53 | ) | (81 | ) | 2 | (119 | ) | (117 | ) | |||||||||||||
|
|
|
|
|
|
|
|
|
|
|
|
|
|||||||||||||
|
Total |
160 | (757 | ) | (597 | ) | (163 | ) | (109 | ) | (272 | ) | |||||||||||||
|
|
|
|
|
|
|
|
|
|
|
|
|
|||||||||||||
|
Total interest bearing liabilities |
||||||||||||||||||||||||
|
Ch$ |
43,987 | 30,436 | 74,423 | 37,727 | (40,820 | ) | (3,093 | ) | ||||||||||||||||
|
UF |
54,449 | (49,105 | ) | 5,344 | 27,898 | (22,964 | ) | 4,934 | ||||||||||||||||
|
Foreign currency |
3,849 | 804 | 4,653 | 4,950 | (11,049 | ) | (6,099 | ) | ||||||||||||||||
|
|
|
|
|
|
|
|
|
|
|
|
|
|||||||||||||
|
Total |
Ch$ | 102,285 | Ch$ | (17,865 | ) | Ch$ | 84,420 | Ch$ | 70,575 | Ch$ | (74,833 | ) | Ch$ | (4,258 | ) | |||||||||
|
|
|
|
|
|
|
|
|
|
|
|
|
|||||||||||||
74
Table of Contents
Financial Investments
Financial assets held-for-trading:
The following table sets forth a breakdown of instruments classified as financial assets held-for-trading, included in our investment portfolio:
| As of December 31, |
Weighted
Average Nominal Rate as of December 31, |
|||||||||||||||
| IFRS: | 2011 | 2012 | 2013 | 2013 | ||||||||||||
| (in millions of Ch$) | % | |||||||||||||||
|
Instruments issued by the Chilean Government and the Central Bank: |
||||||||||||||||
|
Central Bank bonds |
Ch$ | 66,243 | Ch$ | 25,585 | Ch$ | 34,407 | 2.32 | % | ||||||||
|
Central Bank promissory notes |
4,657 | 3,068 | 2,995 | 3.84 | ||||||||||||
|
Other instruments issued by the Chilean Government and the Central Bank |
6,942 | 43,726 | 27,535 | 2.26 | ||||||||||||
|
Other instruments issued in Chile: |
||||||||||||||||
|
Mortgage bonds from domestic banks |
61 | 22 | 14 | 3.88 | ||||||||||||
|
Bonds from domestic banks |
585 | — | 1,926 | 4.00 | ||||||||||||
|
Deposits in domestic banks |
191,003 | 87,093 | 255,582 | 4.50 | ||||||||||||
|
Bonds from other Chilean companies |
— | — | 3,427 | 10.94 | ||||||||||||
|
Other instruments issued in Chile |
370 | 188 | 1,035 | — | ||||||||||||
|
Instruments issued by foreign institutions: |
||||||||||||||||
|
Instruments from foreign governments or central banks |
— | — | — | — | ||||||||||||
|
Other instruments issued abroad |
— | — | — | — | ||||||||||||
|
|
|
|
|
|
|
|
|
|||||||||
|
Total |
Ch$ | 269,861 | Ch$ | 159,682 | Ch$ | 326,921 | 4.14 | % | ||||||||
|
|
|
|
|
|
|
|
|
|||||||||
Instruments issued by the Chilean Government and the Central Bank include instruments sold under agreements to repurchase to customers and financial institutions, amounting to Ch$29,811 million as of December 31, 2011 and no balance either as of December 31, 2012 or as of December 31, 2013. Under “Other instruments issued in Chile” are included instruments sold under agreements to repurchase to customers and financial instruments, amounting to Ch$152,431 million as of December 31, 2011, Ch$86,863 million as of December 31, 2012 and Ch$227,453 million as of December 31, 2013.
75
Table of Contents
Investment Portfolio:
The detail of instruments classified as financial assets available-for-sale and as financial assets held-to-maturity is as follows:
Financial assets available-for-sale
| As of December 31, |
Weighted
average nominal rate as of December 31, |
|||||||||||||||
| IFRS: | 2011 | 2012 | 2013 | 2013 | ||||||||||||
| (in millions of Ch$) | % | |||||||||||||||
|
Instruments issued by the Chilean Government and the Central Bank: |
||||||||||||||||
|
Bonds issued by the Chilean Government and the Central Bank |
Ch$ | 158,865 | Ch$ | 110,569 | Ch$ | 333,035 | 2.55 | % | ||||||||
|
Promissory notes issued by the Chilean Government and the Central Bank |
58,564 | 969 | 50,415 | 3.84 | ||||||||||||
|
Other instruments |
194,965 | 140,246 | 202,958 | 3.52 | ||||||||||||
|
Other instruments issued in Chile: |
||||||||||||||||
|
Equity instruments valued at cost |
2,222 | 613 | 352 | — | ||||||||||||
|
Equity instruments valued at fair value |
— | 7,263 | 7,827 | — | ||||||||||||
|
Mortgage bonds from domestic banks |
87,966 | 85,688 | 96,933 | 4.00 | ||||||||||||
|
Bonds from domestic banks |
124,203 | 116,100 | 128,500 | 3.68 | ||||||||||||
|
Deposits from domestic banks |
521,881 | 560,390 | 617,816 | 3.57 | ||||||||||||
|
Bonds from other Chilean companies |
54,449 | 32,281 | 13,558 | 5.67 | ||||||||||||
|
Other instruments |
139,602 | 129,693 | 154,267 | 6.16 | ||||||||||||
|
Instruments issued by Foreign Institutions: |
||||||||||||||||
|
Instruments from foreign governments or central banks |
— | — | — | — | ||||||||||||
|
Other instruments issued abroad |
128,403 | 88,504 | 76,222 | 5.27 | ||||||||||||
|
|
|
|
|
|
|
|
|
|||||||||
|
Total |
Ch$ | 1,471,120 | Ch$ | 1,272,316 | Ch$ | 1,681,883 | 3.74 | % | ||||||||
|
|
|
|
|
|
|
|
|
|||||||||
The portfolio of financial assets available for sale included net unrealized gains of Ch$696 million, Ch$24,829 million and Ch$36,443 million as of December 31, 2011, 2012, and 2013, respectively, in each case recorded in other comprehensive income within equity.
Financial assets held-to-maturity
There are no securities reported under this category as of December 31, 2011, 2012 and 2013.
Maturity of Financial Investments:
The maturities of financial assets held-for-trading and financial assets available-for-sale, as of December 31, 2011, 2012 and 2013 were as follows:
| As of December 31, 2011 | ||||||||||||||||||||
|
Due within
1 year |
Due after 1 year
but within 3 years |
Due after 3 years
but within 5 years |
Due after 5 years | Total | ||||||||||||||||
| IFRS: | (in millions of Ch$) | |||||||||||||||||||
|
Financial assets held-for-trading |
269,861 | — | — | — | 269,861 | |||||||||||||||
|
Financial assets available-for-sale |
635,951 | 118,722 | 222,782 | 493,665 | 1,471,120 | |||||||||||||||
|
|
|
|
|
|
|
|
|
|
|
|||||||||||
|
Total |
905,812 | 118,722 | 222,782 | 493,665 | 1,740,981 | |||||||||||||||
|
|
|
|
|
|
|
|
|
|
|
|||||||||||
76
Table of Contents
| As of December 31, 2012 | ||||||||||||||||||||
|
Due within
1 year |
Due after 1 year
but within 3 years |
Due after 3 years
but within 5 years |
Due after 5 years | Total | ||||||||||||||||
| IFRS: | (in millions of Ch$) | |||||||||||||||||||
|
Financial assets held-for-trading |
159,682 | — | — | — | 159,682 | |||||||||||||||
|
Financial assets available-for-sale |
787,053 | 152,075 | 132,382 | 200,806 | 1,272,316 | |||||||||||||||
|
|
|
|
|
|
|
|
|
|
|
|||||||||||
|
Total |
946,735 | 152,075 | 132,382 | 200,806 | 1,431,998 | |||||||||||||||
|
|
|
|
|
|
|
|
|
|
|
|||||||||||
| As of December 31, 2013 | ||||||||||||||||||||
|
Due within
1 year |
Due after 1 year
but within 3 years |
Due after 3 years
but within 5 years |
Due after 5 years | Total | ||||||||||||||||
| IFRS: | (in millions of Ch$) | |||||||||||||||||||
|
Financial assets held-for-trading |
326,921 | — | — | — | 326,921 | |||||||||||||||
|
Financial assets available-for-sale |
365,178 | 442,170 | 466,247 | 408,288 | 1,681,883 | |||||||||||||||
|
|
|
|
|
|
|
|
|
|
|
|||||||||||
|
Total |
692,099 | 442,170 | 466,247 | 408,288 | 2,008,804 | |||||||||||||||
|
|
|
|
|
|
|
|
|
|
|
|||||||||||
Loan Portfolio
The following table sets forth our loans by type of loan and risk classification. All loan amounts stated below are before deduction of allowances for loan losses.
| As of December 31, | ||||||||||||
| 2011 | 2012 | 2013 | ||||||||||
| IFRS: | (in millions of Ch$) | |||||||||||
|
Commercial loans: |
||||||||||||
|
Commercial loans |
7,872,546 | 8,544,960 | 9,891,258 | |||||||||
|
Foreign trade loans |
1,509,147 | 1,240,955 | 1,154,681 | |||||||||
|
Current account debtors |
214,479 | 189,399 | 259,289 | |||||||||
|
Factoring transactions |
589,098 | 606,137 | 524,059 | |||||||||
|
Commercial lease transactions |
996,566 | 1,113,272 | 1,209,747 | |||||||||
|
Other loans and accounts receivable |
31,607 | 40,647 | 39,939 | |||||||||
|
|
|
|
|
|
|
|||||||
|
Subtotal |
11,213,443 | 11,735,370 | 13,078,973 | |||||||||
|
|
|
|
|
|
|
|||||||
|
Mortgage loans: |
||||||||||||
|
Mortgage bonds |
134,377 | 109,215 | 87,354 | |||||||||
|
Endorsable mortgage loans |
175,258 | 151,206 | 122,905 | |||||||||
|
Other residential real estate mortgage loans |
3,297,331 | 3,937,766 | 4,516,822 | |||||||||
|
Residential lease transactions |
— | 27 | 24 | |||||||||
|
Other loans and accounts receivable |
468 | 453 | 5,202 | |||||||||
|
|
|
|
|
|
|
|||||||
|
Subtotal |
3,607,434 | 4,198,667 | 4,732,307 | |||||||||
|
|
|
|
|
|
|
|||||||
|
Consumer loans: |
||||||||||||
|
Consumer loans in installments |
1,763,101 | 1,912,483 | 2,043,955 | |||||||||
|
Current account debtors |
232,972 | 245,066 | 240,952 | |||||||||
|
Credit card debtors |
569,290 | 679,986 | 783,782 | |||||||||
|
Consumer lease transactions |
— | — | — | |||||||||
|
Other loans and accounts receivable |
257 | 189 | 801 | |||||||||
|
|
|
|
|
|
|
|||||||
|
Subtotal |
2,565,620 | 2,837,724 | 3,069,490 | |||||||||
|
|
|
|
|
|
|
|||||||
|
Total loans |
17,386,497 | 18,771,761 | 20,880,770 | |||||||||
|
|
|
|
|
|
|
|||||||
The loan categories are as follows:
| • |
“Commercial Loans” are loans and accounts receivable from clients not included within the mortgage or consumer loans categories. |
| • |
“Mortgage Loans” include mortgage loans granted to individuals to acquire, expand, repair or build a home, issued as mortgage bonds, endorsable mortgage loans or by other methods. It also includes supplementary loans for the same purposes and bridge loans granted before the mortgage loan has been settled. This subcategory also includes residential real estate lease transactions and other accounts receivable. |
| • |
“Consumer Loans” are all loans granted to individuals to be used for purchasing goods or services. These include different types of loans (either installments or revolving), as well as balances from credit card transactions or overdrafts on current accounts belonging to individuals. Consumer loans also include consumer lease transactions and other accounts receivable. Consumer loans do not include loans granted to finance business activities that the debtor is developing or that it may develop. |
77
Table of Contents
Maturity and Interest Rate Sensitivity of Loans as of December 31, 2013
The following table sets forth an analysis by type and time remaining to maturity of our loans as of December 31, 2013:
|
Balance as of
December 31, 2013 |
Due within 1
month |
Due after 1
month but within 6 months |
Due after
6 months but within 12 months |
Due after 1 year
but within 3 years |
Due after 3
years but within 5 years |
Due after
5 years |
||||||||||||||||||||||
| (in millions of Ch$) | ||||||||||||||||||||||||||||
|
IFRS: |
||||||||||||||||||||||||||||
|
Commercial loans: |
||||||||||||||||||||||||||||
|
Commercial loans |
Ch$ | 9,891,258 | 934,633 | 2,488,283 | 1,156,301 | 2,526,986 | 1,303,026 | 1,482,029 | ||||||||||||||||||||
|
Foreign trade loans |
1,154,681 | 278,380 | 675,980 | 80,217 | 108,445 | 9,451 | 2,208 | |||||||||||||||||||||
|
Current account debtors |
259,289 | 259,289 | — | — | — | — | — | |||||||||||||||||||||
|
Factoring loans |
524,059 | 269,435 | 210,568 | 13,764 | 25,192 | 4,693 | 407 | |||||||||||||||||||||
|
Leasing loans |
1,209,747 | 42,134 | 164,657 | 181,395 | 448,245 | 170,610 | 202,706 | |||||||||||||||||||||
|
Other loans |
39,939 | 36,586 | 1,128 | 1,087 | 966 | 158 | 14 | |||||||||||||||||||||
|
|
|
|
|
|
|
|
|
|
|
|
|
|
|
|||||||||||||||
|
Subtotal |
13,078,973 | 1,820,457 | 3,540,616 | 1,432,764 | 3,109,834 | 1,487,938 | 1,687,364 | |||||||||||||||||||||
|
|
|
|
|
|
|
|
|
|
|
|
|
|
|
|||||||||||||||
|
Mortgage Loans: |
||||||||||||||||||||||||||||
|
Mortgage bonds |
87,354 | 2,211 | 6,519 | 8,012 | 26,055 | 18,484 | 26,073 | |||||||||||||||||||||
|
Endorsable mortgage loans |
122,905 | 1,982 | 6,371 | 7,452 | 27,663 | 23,886 | 55,551 | |||||||||||||||||||||
|
Residential mortgage loans |
4,516,822 | 37,176 | 93,662 | 114,039 | 468,909 | 483,422 | 3,319,614 | |||||||||||||||||||||
|
Leasing loans |
24 | 24 | — | — | — | — | — | |||||||||||||||||||||
|
Other loans |
5,202 | 2,288 | 2,268 | 646 | — | — | — | |||||||||||||||||||||
|
|
|
|
|
|
|
|
|
|
|
|
|
|
|
|||||||||||||||
|
Subtotal |
4,732,307 | 43,681 | 108,820 | 130,149 | 522,627 | 525,792 | 3,401,238 | |||||||||||||||||||||
|
|
|
|
|
|
|
|
|
|
|
|
|
|
|
|||||||||||||||
|
Consumer loans: |
||||||||||||||||||||||||||||
|
Consumer loans |
2,043,955 | 128,952 | 378,967 | 366,953 | 911,048 | 238,903 | 19,132 | |||||||||||||||||||||
|
Current account debtors |
240,952 | 240,952 | — | — | — | — | — | |||||||||||||||||||||
|
Credit card |
783,782 | 739,187 | 44,595 | — | — | — | — | |||||||||||||||||||||
|
Other loans |
801 | 801 | — | — | — | — | — | |||||||||||||||||||||
|
|
|
|
|
|
|
|
|
|
|
|
|
|
|
|||||||||||||||
|
Subtotal |
3,069,490 | 1,109,892 | 423,562 | 366,953 | 911,048 | 238,903 | 19,132 | |||||||||||||||||||||
|
|
|
|
|
|
|
|
|
|
|
|
|
|
|
|||||||||||||||
|
Total loans |
Ch$ | 20,880,770 | 2,974,030 | 4,072,998 | 1,929,866 | 4,543,509 | 2,252,633 | 5,107,734 | ||||||||||||||||||||
|
|
|
|
|
|
|
|
|
|
|
|
|
|
|
|||||||||||||||
The following table sets forth the interest rate sensitivity of our outstanding loans due after one year as of December 31, 2013:
|
As of
December 31, 2013 |
||||
|
(in millions of
Ch$) |
||||
|
IFRS: |
||||
|
Variable rate |
||||
|
Ch$ |
Ch$ | 832,019 | ||
|
UF |
775,967 | |||
|
Foreign currency |
521,139 | |||
|
|
|
|||
|
Total |
2,129,125 | |||
|
|
|
|||
|
Fixed rate |
||||
|
Ch$ |
2,471,579 | |||
|
UF |
7,067,841 | |||
|
Foreign currency |
235,331 | |||
|
|
|
|||
|
Total |
9,774,751 | |||
|
|
|
|||
|
Total |
Ch$ | 11,903,876 | ||
|
|
|
|||
78
Table of Contents
Loans by Economic Activity
The following table sets forth under IFRS, at the dates indicated, an analysis of our loan portfolio based on the borrower’s principal economic activity. Loans to individuals for business purposes are allocated to their respective economic activity.
| As of December 31, | ||||||||||||||||||||||||
| 2011 | 2012 | 2013 | ||||||||||||||||||||||
| IFRS: |
Loan
Portfolio |
% of Loan
Portfolio |
Loan
Portfolio |
% of Loan
Portfolio |
Loan
Portfolio |
% of Loan
Portfolio |
||||||||||||||||||
| (in millions of Ch$, except percentages) | ||||||||||||||||||||||||
|
Agriculture, Livestock, Forestry, Agribusiness, Fishing: |
||||||||||||||||||||||||
|
Agriculture and livestock |
Ch$ | 482,392 | 2.77 | % | Ch$ | 380,239 | 2.43 | % | Ch$ | 425,905 | 2.04 | % | ||||||||||||
|
Fruit |
329,728 | 1.90 | 318,241 | 1.70 | 365,930 | 1.75 | ||||||||||||||||||
|
Forestry and wood extraction |
100,799 | 0.58 | 125,236 | 0.67 | 122,270 | 0.59 | ||||||||||||||||||
|
Fishing |
271,901 | 1.56 | 311,477 | 1.25 | 219,173 | 1.05 | ||||||||||||||||||
|
|
|
|
|
|
|
|
|
|
|
|
|
|||||||||||||
|
Subtotal |
1,184,820 | 6.81 | 1,135,193 | 6.05 | 1,133,278 | 5.43 | ||||||||||||||||||
|
|
|
|
|
|
|
|
|
|
|
|
|
|||||||||||||
|
Mining and Petroleum: |
||||||||||||||||||||||||
|
Mining and quarries |
399,752 | 2.30 | 372,437 | 1.98 | 340,045 | 1.63 | ||||||||||||||||||
|
Natural gas and crude oil extraction |
— | — | — | — | — | — | ||||||||||||||||||
|
|
|
|
|
|
|
|
|
|
|
|
|
|||||||||||||
|
Subtotal |
399,752 | 2.30 | 372,437 | 1.98 | 340,045 | 1.63 | ||||||||||||||||||
|
|
|
|
|
|
|
|
|
|
|
|
|
|||||||||||||
|
Manufacturing: |
||||||||||||||||||||||||
|
Tobacco, food and beverages |
509,613 | 2.93 | 499,700 | 2.66 | 516,540 | 2.47 | ||||||||||||||||||
|
Textiles, clothing and leather goods |
51,416 | 0.30 | 167,500 | 0.89 | 51,379 | 0.25 | ||||||||||||||||||
|
Wood and wood products |
28,582 | 0.16 | 31,055 | 0.17 | 26,142 | 0.13 | ||||||||||||||||||
|
Paper, printing and publishing |
68,534 | 0.39 | 60,355 | 0.32 | 64,281 | 0.31 | ||||||||||||||||||
|
Oil refining, carbon and rubber |
93,080 | 0.54 | 64,708 | 0.34 | 249,481 | 1.19 | ||||||||||||||||||
|
Production of basic metal, non-mineral, machine and equipment |
375,500 | 2.16 | 356,290 | 1.90 | 251,842 | 1.21 | ||||||||||||||||||
|
Other manufacturing industries |
362,094 | 2.08 | 201,386 | 1.08 | 205,896 | 0.98 | ||||||||||||||||||
|
|
|
|
|
|
|
|
|
|
|
|
|
|||||||||||||
|
Subtotal |
1,488,819 | 8.56 | 1,380,994 | 7.36 | 1,365,562 | 6.54 | ||||||||||||||||||
|
|
|
|
|
|
|
|
|
|
|
|
|
|||||||||||||
|
Electricity, Gas and Water: |
||||||||||||||||||||||||
|
Electricity, gas and water |
315,338 | 1.81 | 328,763 | 1.75 | 531,973 | 2.55 | ||||||||||||||||||
|
|
|
|
|
|
|
|
|
|
|
|
|
|||||||||||||
|
Subtotal |
315,338 | 1.81 | 328,763 | 1.75 | 531,973 | 2.55 | ||||||||||||||||||
|
|
|
|
|
|
|
|
|
|
|
|
|
|||||||||||||
|
Construction: |
||||||||||||||||||||||||
|
Residential buildings |
793,842 | 4.57 | 1,074,856 | 5.73 | 1,306,852 | 6.26 | ||||||||||||||||||
|
Other constructions |
151,000 | 0.86 | 177,690 | 0.94 | 151,229 | 0.72 | ||||||||||||||||||
|
|
|
|
|
|
|
|
|
|
|
|
|
|||||||||||||
|
Subtotal |
944,842 | 5.43 | 1,252,546 | 6.67 | 1,458,081 | 6.98 | ||||||||||||||||||
|
|
|
|
|
|
|
|
|
|
|
|
|
|||||||||||||
|
Commerce: |
||||||||||||||||||||||||
|
Wholesale |
1,020,572 | 5.87 | 921,459 | 4.91 | 1,087,933 | 5.21 | ||||||||||||||||||
|
Retail, restaurants and hotels |
1,266,716 | 7.29 | 1,403,210 | 7.47 | 1,465,032 | 7.02 | ||||||||||||||||||
|
|
|
|
|
|
|
|
|
|
|
|
|
|||||||||||||
|
Subtotal |
2,287,288 | 13.16 | 2,324,669 | 12.38 | 2,552,965 | 12.23 | ||||||||||||||||||
|
|
|
|
|
|
|
|
|
|
|
|
|
|||||||||||||
|
Transport, Storage and Communications: |
||||||||||||||||||||||||
|
Transport and storage |
1,244,499 | 7.16 | 1,397,741 | 7.45 | 1,493,043 | 7.15 | ||||||||||||||||||
|
Communications |
162,859 | 0.93 | 72,617 | 0.38 | 109,305 | 0.52 | ||||||||||||||||||
|
|
|
|
|
|
|
|
|
|
|
|
|
|||||||||||||
|
Subtotal |
1,407,358 | 8.09 | 1,470,358 | 7.83 | 1,602,348 | 7.67 | ||||||||||||||||||
|
|
|
|
|
|
|
|
|
|
|
|
|
|||||||||||||
|
Financial Services: |
||||||||||||||||||||||||
|
Financial and insurance companies |
1,937,788 | 11.15 | 1,796,921 | 9.57 | 516,544 | 2.47 | ||||||||||||||||||
|
Real estate and other financial services |
83,723 | 0.48 | 57,650 | 0.31 | 1,533,711 | 7.35 | ||||||||||||||||||
|
|
|
|
|
|
|
|
|
|
|
|
|
|||||||||||||
|
Subtotal |
2,021,511 | 11.63 | 1,854,571 | 9.88 | 2,050,255 | 9.82 | ||||||||||||||||||
|
|
|
|
|
|
|
|
|
|
|
|
|
|||||||||||||
|
Community, Social and Personal Services: |
||||||||||||||||||||||||
|
Community, social and personal services |
1,084,380 | 6.24 | 1,310,573 | 6.98 | 1,631,412 | 7.81 | ||||||||||||||||||
|
|
|
|
|
|
|
|
|
|
|
|
|
|||||||||||||
|
Subtotal |
1,084,380 | 6.24 | 1,310,573 | 6.98 | 1,631,412 | 7.81 | ||||||||||||||||||
|
|
|
|
|
|
|
|
|
|
|
|
|
|||||||||||||
|
Others |
79,335 | 0.46 | 311,476 | 1.67 | 421,848 | 2.02 | ||||||||||||||||||
|
Consumer Loans |
2,565,620 | 14.76 | 2,831,514 | 15.08 | 3,060,696 | 14.66 | ||||||||||||||||||
|
Residential Mortgage Loans |
3,607,434 | 20.75 | 4,198,667 | 22.37 | 4,732,307 | 22.66 | ||||||||||||||||||
|
|
|
|
|
|
|
|
|
|
|
|
|
|||||||||||||
|
Total |
Ch$ | 17,386,497 | 100.00 | % | Ch$ | 18,771,761 | 100.00 | % | Ch$ | 20,880,770 | 100.00 | % | ||||||||||||
|
|
|
|
|
|
|
|
|
|
|
|
|
|||||||||||||
79
Table of Contents
Foreign Country Outstanding Loans
Our cross-border outstanding loans are principally trade-related. These loans include loans granted to foreign financial institutions and foreign corporations, some of which are guaranteed by their Chilean parent company. The table below lists under IFRS the total amounts outstanding to borrowers in certain foreign countries as of the dates indicated, and thus does not include foreign trade-related loans to domestic borrowers.
| As of December 31, | ||||||||||||
| 2011 | 2012 | 2013 | ||||||||||
| IFRS: | (in millions of Ch$) | |||||||||||
|
Argentina |
Ch$ | 4,559 | Ch$ | 4,559 | Ch$ | 5,301 | ||||||
|
Australia |
12,710 | 11,553 | 350 | |||||||||
|
Austria |
180 | 212 | — | |||||||||
|
Belgium |
6,254 | 269 | — | |||||||||
|
Bolivia |
82 | 168 | — | |||||||||
|
Brazil |
204,477 | 200,016 | 270,479 | |||||||||
|
Canada |
1,891 | 618 | — | |||||||||
|
China |
281,294 | 223,515 | 65,057 | |||||||||
|
Colombia |
29,299 | 7,019 | 15,854 | |||||||||
|
Denmark |
132 | 31,457 | — | |||||||||
|
Finland |
400 | 69 | — | |||||||||
|
France |
191 | 627 | — | |||||||||
|
Germany |
1,643 | 33,475 | — | |||||||||
|
Holland |
15,562 | 16,148 | 15,666 | |||||||||
|
Hong Kong |
1,405 | 91 | 618 | |||||||||
|
India |
116,130 | 76,788 | 31,607 | |||||||||
|
Israel |
506 | 1,112 | — | |||||||||
|
Italy |
433 | 157 | 49 | |||||||||
|
Japan |
53 | 4,228 | — | |||||||||
|
Mexico |
87,154 | 94,814 | — | |||||||||
|
Panama |
— | — | 1,054 | |||||||||
|
Paraguay |
— | — | — | |||||||||
|
Peru |
12,384 | 18,148 | 26,414 | |||||||||
|
Singapore |
9,238 | 10,089 | — | |||||||||
|
South Korea |
64,041 | 56,789 | 15,220 | |||||||||
|
Spain |
1,243 | 425 | — | |||||||||
|
Sweden |
3,546 | 6,446 | — | |||||||||
|
Switzerland |
46 | 11,605 | — | |||||||||
|
Taiwan |
383 | — | — | |||||||||
|
Turkey |
— | 975 | — | |||||||||
|
United Kingdom |
24,490 | 38,332 | — | |||||||||
|
United States |
15,138 | 36,474 | 54,278 | |||||||||
|
Vietnam |
— | — | 21 | |||||||||
|
|
|
|
|
|
|
|||||||
|
Total |
Ch$ | 894,864 | Ch$ | 886,178 | Ch$ | 501,968 | ||||||
|
|
|
|
|
|
|
|||||||
As a result of the economic and financial uncertainty observed in the Euro zone, the Bank is constantly monitoring the credit risk condition of certain European countries. In this line, as of December 31, 2013, the Bank maintains exposures of contingent credits (standby letters of credits and performance bonds) with certain European countries as follows:
|
As of
December 31, 2013 |
||||
|
(in millions
of Ch$) |
||||
|
Italy |
5,351 | |||
|
Spain |
13,400 | |||
|
|
|
|||
|
Total |
18,751 | |||
|
|
|
|||
As of December 31, 2013, the Bank does not have any exposure relating to any other product such as: financial assets available-for-sale, financial assets held-for-trading, derivatives instruments, working capital, lines of credit, etc. with the countries mentioned in the table above.
80
Table of Contents
Deposits in Foreign Countries
We also maintain deposits abroad, as needed to conduct our foreign trade transactions and manage liquidity. The table below lists the largest amounts of foreign deposits by country under IFRS as of the dates indicated:
| As of December 31, | ||||||||||||
| IFRS: | 2011 | 2012 | 2013 | |||||||||
| (in millions of Ch$) | ||||||||||||
|
Australia |
Ch$ | 736 | Ch$ | 502 | Ch$ | 453 | ||||||
|
Austria |
— | — | — | |||||||||
|
Belgium |
90 | — | — | |||||||||
|
Brazil |
— | 9 | — | |||||||||
|
Canada |
1,697 | 743 | 1,464 | |||||||||
|
China |
128 | 766 | 20 | |||||||||
|
Denmark |
74 | 99 | 173 | |||||||||
|
Finland |
99 | 74 | 81 | |||||||||
|
France |
676 | 339 | 102 | |||||||||
|
Germany |
3,745 | 9,199 | 12,565 | |||||||||
|
Holland |
301 | 1,018 | 1,200 | |||||||||
|
Italy |
109 | — | 22 | |||||||||
|
Japan |
5,259 | 4,325 | 1,614 | |||||||||
|
Mexico |
694 | 484 | 582 | |||||||||
|
Norway |
116 | 114 | 81 | |||||||||
|
Peru |
9 | 29 | — | |||||||||
|
Singapore |
— | — | 13,270 | |||||||||
|
Spain |
69 | — | — | |||||||||
|
Sweden |
199 | — | 354 | |||||||||
|
Switzerland |
2,092 | 343 | — | |||||||||
|
United Kingdom |
36,147 | 13,229 | 2,802 | |||||||||
|
United States |
236,753 | 170,275 | 256,504 | |||||||||
|
|
|
|
|
|
|
|||||||
|
Total |
Ch$ | 288,993 | Ch$ | 201,548 | Ch$ | 291,287 | ||||||
|
|
|
|
|
|
|
|||||||
Credit Review Process
Credit risk is the risk that we will incur a loss because our customers or counterparties do not comply with their contractual obligations.
This risk is managed using a global, unified and forward-looking strategy, which recognizes the current and projected economic environment of the markets and segments in which our different businesses are developing and grants appropriate credit treatment to each such market or segment by using risk limits that we are willing to accept from counterparties.
Managing credit risk is, therefore, inherent to our business and must be incorporated into each segment in which we do business. In this way, we may achieve an optimum balance between assumed risks and attained returns and properly allocate capital to each business line while complying with regulations and criteria defined by our board of directors in order to ensure that we have an appropriate capital base for potential losses that may arise from our credit exposure.
Counterparty limits are established by analyzing financial information, risk ratings, the nature of the exposure, documentation, guarantees, market conditions and the pertinent industry sector, among other factors. The process of monitoring credit quality also includes identifying in advance any possible changes in a counterparty’s payment capacity, which enables us to evaluate the potential loss from these risks and take corrective actions.
81
Table of Contents
Approval Process
Loan analysis and approval is conducted using a differentiated approach for each market segment, using three separate credit-risk models:
Automated Model : This model focuses on individuals from the mass-market segment (i.e., not business-related) and is based on the integral automation of processes, which consist of admission, approval, follow-up and recovery, using scoring and behavior-based approval systems.
We have also developed a broad level of knowledge regarding selection of customers, with a significant capacity to discriminate between customers of different credit bases. Using this model, we have developed separate segmented models for retail banking and Banco CrediChile. In the case of our Consumer Finance Division (Banco CrediChile), there are further distinctions for employed customers, which are separated into the following five sub-segments: retired persons, employees in the public sector, employees in the private sector over 40 years of age, employees in the private sector under 40 years of age and self-employed.
In retail banking there are also sub-segments divided by activity and length of the customer’s relationship with us.
Parametric Model : This model is applied to individuals and small- and medium-sized companies in business. To analyze these segments, we use certain levels of automation and parameterization. Automation currently provides a fundamental pillar for the pre-approval process for small companies and support for potential evaluations of medium-sized companies.
Case-by-Case Model : This model is used for the wholesale business segment. It is based on individual expert evaluation on risk level, operation amount and business complexity, among other variables.
Transactions in which the total customer credit risk is more than Ch$16,721 million require approval from a credit committee, composed of three directors and our Chief Executive Officer. Transactions in which the total customer credit risk is equal to or less than Ch$16,721 million may be approved by other executives, depending on the amount involved, as follows:
|
Approved by |
Limit in MCh$ |
|
|
Credit committee, including members of the board of directors |
up to legal limits | |
|
Chief executive officer, chairman and senior credit risk officer |
up to MCh$16,721 | |
|
Chief executive officer, chairman or senior credit risk officer (any two of the three) |
up to MCh$11,147 | |
|
Chief executive officer and executive credit risk officers |
up to MCh$7,803 | |
|
Senior credit risk officers and executive vice president of corporate banking |
up to MCh$7,803 | |
|
Executive credit risk officers and Executive vice president of corporate banking |
up to MCh$3,121 | |
|
Other credit risk officers |
up to MCh$1,115 | |
|
Executive vice president of corporate banking |
up to MCh$1,115 | |
|
Other department heads |
up to MCh$446 | |
|
Other officers |
up to MCh$223 |
In addition to reviewing the credit limit, the business segment extending the credit must review the terms of the loan, the interest rate and any security to be obtained.
Control and Follow-up
The ongoing control and follow-up of credit risk is the basis for proactive portfolio management and enables risk to be recognized opportunely, thus identifying business opportunities and detecting potential impairment before it occurs.
In the wholesale business segment, control and follow-up are realized through a combination of reviews. The most relevant are the following:
| • |
High-level structured portfolio reviews with respect to the impact of specific macroeconomic fluctuations on relevant sectors of activity, defining case-by-case action plans. |
82
Table of Contents
| • |
Constant monitoring system in order to detect early those customers that show potential risks, agreeing on specific action plans for these customers with the corresponding client servicing team. |
| • |
Payment arrears management, backed by predictive indicators of risk level, with follow-up and action plans in the case of our most important customers, plus management of differentiated strategies for early recovery. |
| • |
Follow-up on the conditions, restrictions and covenants imposed by the credit committee to all operations requiring it due to their importance or complexity. |
| • |
Control of the exposure as well as the sufficiency of guarantees granted in the form of shares, monitoring fluctuations and preparing action plans in the event of insufficient coverage. |
| • |
Follow-up schemes of credit behavior variables and borrowers’ financial condition. |
| • |
Risk segmentation strategies for collection processes and policies to better integrate loan approval and monitoring processes based on a single set of credit fundamentals. |
Analysis of Our Loan Classification
The following tables provide statistical data under IFRS regarding the classification of our loans as of the dates indicated. As discussed above, our risk analysis system requires that loans to all customers be classified.
| IFRS: | As of December 31, 2011(*) | |||||||||||||||||||
|
Commercial
Loans |
Residential
Mortgage Loans |
Consumer
Loans |
Total Loans |
Percentage
Loans of Classified |
||||||||||||||||
| Bank’s Credit Rating: | (in millions of Ch$, except percentages) | |||||||||||||||||||
|
A1 |
Ch$ | 50,449 | Ch$ | — | Ch$ | — | Ch$ | 50,449 | 0.52 | % | ||||||||||
|
A2 |
2,393,915 | — | — | 2,393,915 | 24.85 | |||||||||||||||
|
A3 |
3,173,274 | — | — | 3,173,274 | 32.94 | |||||||||||||||
|
A4 |
1,889,504 | — | — | 1,889,504 | 19.62 | |||||||||||||||
|
A5 |
1,299,391 | — | — | 1,299,391 | 13.49 | |||||||||||||||
|
A6 |
610,606 | — | — | 610,606 | 6.34 | |||||||||||||||
|
|
|
|
|
|
|
|
|
|
|
|||||||||||
|
Normal Portfolio |
9,417,139 | — | — | 9,417,139 | 97.76 | |||||||||||||||
| — | — | |||||||||||||||||||
|
B1 |
37,316 | — | — | 37,316 | 0.39 | |||||||||||||||
|
B2 |
8,664 | — | — | 8,664 | 0.09 | |||||||||||||||
|
B3 |
6,542 | — | — | 6,542 | 0.07 | |||||||||||||||
|
B4 |
1,517 | — | — | 1,517 | 0.02 | |||||||||||||||
|
|
|
|
|
|
|
|
|
|
|
|||||||||||
|
Substandard Portfolio |
54,039 | — | — | 54,039 | 0.57 | |||||||||||||||
|
|
|
|
|
|
|
|
|
|
|
|||||||||||
| — | — | |||||||||||||||||||
|
C1 |
19,083 | — | — | 19,083 | 0.20 | |||||||||||||||
|
C2 |
11,405 | — | — | 11,405 | 0.12 | |||||||||||||||
|
C3 |
35,413 | — | — | 35,413 | 0.37 | |||||||||||||||
|
C4 |
15,886 | — | — | 15,886 | 0.16 | |||||||||||||||
|
C5 |
55,893 | — | — | 55,893 | 0.58 | |||||||||||||||
|
C6 |
23,565 | — | — | 23,565 | 0.24 | |||||||||||||||
|
|
|
|
|
|
|
|
|
|
|
|||||||||||
|
Non-complying Portfolio |
161,245 | — | — | 161,245 | 1.67 | |||||||||||||||
|
|
|
|
|
|
|
|
|
|
|
|||||||||||
|
Total Individual
|
Ch$ | 9,632,423 | Ch$ | — | Ch$ | — | Ch$ | 9,632,423 | 100.00 | % | ||||||||||
|
|
|
|
|
|
|
|
|
|
|
|||||||||||
|
Normal Portfolio |
1,443,208 | 3,543,520 | 2,439,495 | 7,426,223 | ||||||||||||||||
|
Non-complying Portfolio |
137,812 | 63,914 | 126,125 | 327,851 | ||||||||||||||||
|
|
|
|
|
|
|
|
|
|||||||||||||
|
Total Group Classified Loans |
Ch$ | 1,581,020 | Ch$ | 3,607,434 | Ch$ | 2,565,620 | Ch$ | 7,754,074 | ||||||||||||
|
|
|
|
|
|
|
|
|
|||||||||||||
|
Total loans |
Ch$ | 11,213,443 | Ch$ | 3,607,434 | Ch$ | 2,565,620 | Ch$ | 17,386,497 | ||||||||||||
|
|
|
|
|
|
|
|
|
|||||||||||||
|
Percentage Classified |
85.90 | % | — | % | — | % | 55.40 | % | ||||||||||||
| (*) | On January 1, 2011, the credit ratings for debtors with individual assessment changed, separating the portfolio into Normal (categories A1-A6), substandard (B1—B4) and Non-complying (C1-C6), as shown in the above table (see note 42.2(f) to our Financial Statements). |
83
Table of Contents
| IFRS: | As of December 31, 2012(*) | |||||||||||||||||||
|
Commercial
Loans |
Residential
Mortgage Loans |
Consumer
Loans |
Total Loans |
Percentage
Loans of Classified |
||||||||||||||||
| Bank’s Credit Rating: | (in millions of Ch$, except percentages) | |||||||||||||||||||
|
A1 |
Ch$ | 40 | Ch$ | — | Ch$ | — | Ch$ | 40 | 0.00 | % | ||||||||||
|
A2 |
2,024,110 | — | — | 2,024,110 | 20.90 | |||||||||||||||
|
A3 |
2,642,389 | — | — | 2,642,389 | 27.28 | |||||||||||||||
|
A4 |
1,998,263 | — | — | 1,998,263 | 20.63 | |||||||||||||||
|
A5 |
1,875,478 | — | — | 1,875,478 | 19.37 | |||||||||||||||
|
A6 |
791,133 | — | — | 791,133 | 8.15 | |||||||||||||||
|
|
|
|
|
|
|
|
|
|
|
|||||||||||
|
Normal Portfolio |
9,331,413 | — | — | 9,331,413 | 96.33 | |||||||||||||||
|
B1 |
134,201 | — | — | 134,201 | 1.39 | |||||||||||||||
|
B2 |
21,709 | — | — | 21,709 | 0.22 | |||||||||||||||
|
B3 |
41,155 | — | — | 41,155 | 0.42 | |||||||||||||||
|
B4 |
7,306 | — | — | 7,306 | 0.08 | |||||||||||||||
|
|
|
|
|
|
|
|
|
|
|
|||||||||||
|
Substandard Portfolio |
204,371 | — | — | 204,371 | 2.11 | |||||||||||||||
|
|
|
|
|
|
|
|
|
|
|
|||||||||||
|
C1 |
22,521 | — | — | 22,521 | 0.23 | |||||||||||||||
|
C2 |
13,753 | — | — | 13,753 | 0.14 | |||||||||||||||
|
C3 |
5,636 | — | — | 5,636 | 0.06 | |||||||||||||||
|
C4 |
52,562 | — | — | 52,562 | 0.54 | |||||||||||||||
|
C5 |
17,895 | — | — | 17,895 | 0.18 | |||||||||||||||
|
C6 |
36,431 | — | — | 36,431 | 0.41 | |||||||||||||||
|
|
|
|
|
|
|
|
|
|
|
|||||||||||
|
Non-complying Portfolio |
148,798 | — | — | 148,798 | 1.56 | |||||||||||||||
|
|
|
|
|
|
|
|
|
|
|
|||||||||||
|
Total Individual Classified Loans |
Ch$ | 9,684,582 | — | — | Ch$ | 9,684,582 | 100.00 | % | ||||||||||||
|
|
|
|
|
|
|
|
|
|
|
|||||||||||
|
Normal Portfolio |
1,864,800 | 4,149,264 | 2,651,351 | 8,665,415 | ||||||||||||||||
|
Non-complying Portfolio |
185,988 | 49,403 | 186,373 | 421,764 | ||||||||||||||||
|
|
|
|
|
|
|
|
|
|||||||||||||
|
Total Group Classified Loans |
Ch$ | 2,050,788 | Ch$ | 4,198,667 | Ch$ | 2,837,724 | Ch$ | 9,087,179 | ||||||||||||
|
|
|
|
|
|
|
|
|
|||||||||||||
|
Total loans |
Ch$ | 11,735,370 | Ch$ | 4,198,667 | Ch$ | 2,837,724 | Ch$ | 18,771,761 | ||||||||||||
|
|
|
|
|
|
|
|
|
|||||||||||||
|
Percentage Classified |
82.52 | % | — | % | — | % | 51.59 | % | ||||||||||||
84
Table of Contents
| IFRS: | As of December 31, 2013 | |||||||||||||||||||
|
Commercial
Loans |
Residential
Mortgage Loans |
Consumer
Loans |
Total Loans |
Percentage
Loans of Classified |
||||||||||||||||
| Bank’s Credit Rating: | (in millions of Ch$, except percentages) | |||||||||||||||||||
|
A1 |
Ch$ | 15,640 | Ch$ | — | Ch$ | — | Ch$ | 15,640 | 0.14 | % | ||||||||||
|
A2 |
1,926,720 | — | — | 1,926,720 | 17.74 | |||||||||||||||
|
A3 |
3,086,438 | — | — | 3,086,438 | 28.41 | |||||||||||||||
|
A4 |
2,273,914 | — | — | 2,273,914 | 20.93 | |||||||||||||||
|
A5 |
2,347,825 | — | — | 2,347,825 | 21.61 | |||||||||||||||
|
A6 |
832,340 | — | — | 832,340 | 7.66 | |||||||||||||||
|
|
|
|
|
|
|
|
|
|
|
|||||||||||
|
Normal Portfolio |
10,482,877 | — | — | 10,482,877 | 96.49 | |||||||||||||||
|
B1 |
123,803 | — | — | 123,803 | 1.14 | |||||||||||||||
|
B2 |
17,687 | — | — | 17,687 | 0.16 | |||||||||||||||
|
B3 |
12,979 | — | — | 12,979 | 0.12 | |||||||||||||||
|
B4 |
69,978 | — | — | 69,978 | 0.64 | |||||||||||||||
|
|
|
|
|
|
|
|
|
|
|
|||||||||||
|
Substandard Portfolio |
224,447 | — | — | 224,447 | 2.06 | |||||||||||||||
|
|
|
|
|
|
|
|
|
|
|
|||||||||||
|
C1 |
26,250 | — | — | 26,250 | 0.24 | |||||||||||||||
|
C2 |
38,634 | — | — | 38,634 | 0.36 | |||||||||||||||
|
C3 |
5,586 | — | — | 5,586 | 0.05 | |||||||||||||||
|
C4 |
21,551 | — | — | 21,551 | 0.20 | |||||||||||||||
|
C5 |
34,115 | — | — | 34,115 | 0.31 | |||||||||||||||
|
C6 |
29,188 | — | — | 29,188 | 0.29 | |||||||||||||||
|
|
|
|
|
|
|
|
|
|
|
|||||||||||
|
Non-complying Portfolio |
155,324 | — | — | 155,324 | 1.45 | |||||||||||||||
|
|
|
|
|
|
|
|
|
|
|
|||||||||||
|
Total Individual Classified Loans |
Ch$ | 10,862,648 | — | — | Ch$ | 10,862,648 | 100.00 | % | ||||||||||||
|
|
|
|
|
|
|
|
|
|
|
|||||||||||
|
Normal Portfolio |
2,011,162 | 4,662,977 | 2,856,365 | 9,530,504 | ||||||||||||||||
|
Non-complying Portfolio |
205,163 | 69,330 | 213,125 | 487,618 | ||||||||||||||||
|
|
|
|
|
|
|
|
|
|
|
|||||||||||
|
Total Group Classified Loans |
Ch$ | 2,216,325 | Ch$ | 4,732,307 | Ch$ | 3,069,490 | Ch$ | 10,018,122 | ||||||||||||
|
|
|
|
|
|
|
|
|
|
|
|||||||||||
|
Total loans |
Ch$ | 13,078,973 | Ch$ | 4,732,307 | Ch$ | 3,069,490 | Ch$ | 20,880,770 | ||||||||||||
|
|
|
|
|
|
|
|
|
|
|
|||||||||||
|
Percentage Classified |
83.05 | % | — | % | — | % | 52.02 | % | ||||||||||||
Classification of Loan Portfolio
Individual Classified Loans
An individual analysis of debtors is applied to individuals and companies that are of such significance with respect to size, complexity or level of exposure to the Bank, that they must be analyzed in detail. For purposes of establishing the appropriate allowances, the Bank classifies the debtors and their operations related to loans into one of three categories of loans portfolio: Normal, Substandard and Non-Complying Loans.
Normal Loans
Normal loans correspond to borrowers who are up to date on their payment obligations and show no sign of deterioration in their credit quality.
Substandard Loans
Substandard loans include all borrowers with insufficient payment capacity or significant deterioration of payment capacity that may be reasonably expected not to comply with all principal and interest payments obligations set forth in the credit agreement. This category also includes all loans that have been non-performing for more than 30 days.
85
Table of Contents
Non-Complying Loans
The non-complying loans correspond to borrowers whose payment capacity is seriously at risk and who have a high likelihood of filing for bankruptcy or are renegotiating credit terms to avoid bankruptcy. This category comprises all loans outstanding from debtors that have at least one installment payment of interest or principal overdue for 90 days or more.
Group Classified Loans
The group analysis is used to analyze a large number of loans whose individual amounts are not significant. For this analysis, the Bank uses models based on attributes of the debtors and their loans, and on the behavior of a group of loans.
Classification of Loan Portfolio Based on the Borrower’s Payment Performance
The following tables set forth under IFRS as of the dates indicated the amounts that are current as to payments of principal and interest and the amounts that are overdue:
| Domestic Loans (1) | ||||||||||||
| As of December 31, | ||||||||||||
| 2011 | 2012 | 2013 | ||||||||||
| IFRS: | (in millions of Ch$) | |||||||||||
|
Current |
Ch$ | 15,593,412 | Ch$ | 16,618,815 | Ch$ | 19,109,962 | ||||||
|
Total Overdue 1-29 days |
1,165,108 | 949,285 | 906,719 | |||||||||
|
Total Overdue 30-89 days |
298,729 | 135,618 | 125,391 | |||||||||
|
Total Past Due 90 days or more |
178,905 | 181,865 | 236,730 | |||||||||
|
|
|
|
|
|
|
|||||||
|
Total loans |
Ch$ | 17,236,154 | Ch$ | 17,885,583 | Ch$ | 20,378,802 | ||||||
|
|
|
|
|
|
|
|||||||
| Foreign Loans (1) | ||||||||||||
| As of December 31, | ||||||||||||
| 2011 | 2012 | 2013 | ||||||||||
| IFRS: | (in millions of Ch$) | |||||||||||
|
Current |
Ch$ | 150,343 | Ch$ | 886,178 | Ch$ | 501,968 | ||||||
|
Total Overdue 1-29 days |
— | — | — | |||||||||
|
Total Overdue 30-89 days |
— | — | — | |||||||||
|
Total Past Due 90 days or more |
— | — | — | |||||||||
|
|
|
|
|
|
|
|||||||
|
Total loans |
Ch$ | 150,343 | Ch$ | 886,178 | Ch$ | 501,968 | ||||||
|
|
|
|
|
|
|
|||||||
| Total Loans (1) | ||||||||||||
| As of December 31, | ||||||||||||
| 2011 | 2012 | 2013 | ||||||||||
| IFRS: | (in millions of Ch, except percentages) | |||||||||||
|
Current |
Ch$ | 15,743,755 | Ch$ | 17,504,993 | Ch$ | 19,611,930 | ||||||
|
Total Overdue 1-29 days |
1,165,108 | 949,285 | 906,719 | |||||||||
|
Total Overdue 30-89 days |
298,729 | 135,618 | 125,391 | |||||||||
|
Total Past Due 90 days or more |
178,905 | 181,865 | 236,730 | |||||||||
|
|
|
|
|
|
|
|||||||
|
Total loans |
Ch$ | 17,386,497 | Ch$ | 18,771,761 | Ch$ | 20,880,770 | ||||||
|
|
|
|
|
|
|
|||||||
|
Total Overdue loans expressed as a percentage of total loans |
9.45 | % | 6.75 | % | 6.08 | % | ||||||
|
Total Past-due loans as a percentage of total loans |
1.03 | % | 0.97 | % | 1.13 | % | ||||||
| (1) | Total past-due and total overdue loans refer to installments that are past-due or overdue and the remaining outstanding balance of such loans (principal and interest). |
86
Table of Contents
Loans included in the previous table, which have been restructured and bear no interest, are as follows:
| As of December 31, | ||||||||||||
| 2011 | 2012 | 2013 | ||||||||||
| IFRS: | (in millions of Ch$) | |||||||||||
|
Ch$ |
2,547 | 4,605 | 4,608 | |||||||||
|
UF |
128 | 128 | 128 | |||||||||
|
|
|
|
|
|
|
|||||||
|
Total |
2,675 | 4,733 | 4,736 | |||||||||
|
|
|
|
|
|
|
|||||||
The amount of interest we would have recorded on these loans for the year ended December 31, 2013 had these loans been earning a market interest rate was Ch$161 million.
In addition, other loans that were restructured, mainly through the extension of their maturities, and that bear interest, are as follows:
| As of December 31, | ||||||||||||
| 2011 | 2012 | 2013 | ||||||||||
| IFRS: | (in millions of Ch$) | |||||||||||
|
Total other restructured loans |
338,725 | 392,906 | 496,601 | |||||||||
|
|
|
|
|
|
|
|||||||
During the year ended December 31, 2013, interest recorded in income on these loans amounted to Ch$41,390 million.
Analysis of Substandard Loans and Total Past Due
The following table analyzes our substandard loans, total past-due loans and allowances for loan losses existing at the dates indicated under IFRS.
| Year ended December 31, | ||||||||||||
| 2011 | 2012 | 2013 | ||||||||||
| IFRS: | (in millions of Ch$, except percentages) | |||||||||||
|
Total loans |
Ch$ | 17,386,497 | Ch$ | 18,771,761 | Ch$ | 20,880,770 | ||||||
|
Impaired loans (1) |
499,768 | 621,268 | 725,899 | |||||||||
|
Impaired loans as a percentage of total loans |
2.87 | % | 3.31 | % | 3.48 | % | ||||||
|
Total past due |
||||||||||||
|
To the extent secured (2) |
17,388 | 19,658 | 22,804 | |||||||||
|
To the extent unsecured |
161,517 | 162,207 | 213,926 | |||||||||
|
|
|
|
|
|
|
|||||||
|
Total past due |
178,905 | 181,865 | 236,730 | |||||||||
|
|
|
|
|
|
|
|||||||
|
Total past due as a percentage of total loans |
1.03 | % | 0.96 | % | 1.13 | % | ||||||
|
To the extent secured |
0.10 | 0.10 | 0.11 | |||||||||
|
To the extent unsecured |
0.93 | 0.86 | 1.02 | |||||||||
|
Allowances for loans losses as a percentage of: |
||||||||||||
|
Total loans |
2.09 | 2.07 | 2.10 | |||||||||
|
|
|
|
|
|
|
|||||||
|
Total past due |
202.76 | 213.24 | 185.57 | |||||||||
|
|
|
|
|
|
|
|||||||
|
Total past due—unsecured |
224.58 | % | 239.08 | % | 205.35 | % | ||||||
|
|
|
|
|
|
|
|||||||
| (1) | Security generally consists of mortgages on real estate, pledges of marketable securities, letters of credit or cash. |
87
Table of Contents
Analysis of Allowances for Loan Losses
The following table analyzes our allowances for loan losses and changes in the allowances attributable to charge-offs, allowances established and allowances released:
| As of December 31, | ||||||||||||
| 2011 | 2012 | 2013 | ||||||||||
| IFRS: | (in millions of Ch$, except percentages) | |||||||||||
|
Allowances for loan losses at beginning of period |
Ch$ | 348,027 | Ch$ | 362,741 | Ch$ | 387,803 | ||||||
|
Charge-offs |
(177,960 | ) | (182,733 | ) | (196,535 | ) | ||||||
|
Debt Exchange |
— | — | (12,556 | ) | ||||||||
|
Allowances established |
207,189 | 225,678 | 262,713 | |||||||||
|
Allowances released (1) |
(14,515 | ) | (17,883 | ) | (2,127 | ) | ||||||
|
|
|
|
|
|
|
|||||||
|
Allowances for loan losses at end of period |
Ch$ | 362,741 | Ch$ | 387,803 | Ch$ | 439,298 | ||||||
|
|
|
|
|
|
|
|||||||
|
Allowances for loan losses at end of period as a percentage of total loans |
2.09 | % | 2.07 | % | 2.10 | % | ||||||
|
Ratio of charge-offs to average loans |
1.12 | % | 1.01 | % | 0.99 | % | ||||||
| (1) | Represents the aggregate amount of allowances for loan losses released during the year as a result of charge-offs, recoveries or a determination by management that the level of risk existing in the loan portfolio has been reduced. |
The year ended December 31, 2011 was positive for the local economy. GDP recorded 6.0% annual growth, which resulted in improved economic figures, such as a four-year low unemployment rate (7.1%) and an increase in real salaries. These macroeconomic indicators boosted consumption and the commercial activity of companies, all of which resulted in improved risk profiles of both individuals and companies. However, due to a volume effect associated with the significant 21.2% expansion of our loan book, our allowances for loan losses recorded a 4.2% increase, from Ch$348,027 million in 2010 to Ch$362,741 million in 2011.
In 2012, the industry experienced at least two forces affecting allowances for loans losses. On the one hand, the positive economic cycle resulted in lower unemployment and increasing real salaries, which positively impacted customers’ payment capacity. However, in the first half of the year, social and regulatory issues effectively offset the positive economic drivers and caused a moderate deterioration in credit quality, especially associated with consumer loans, with past-due loan indicators peaking in the second quarter of 2012. This phenomenon was observed across the industry and led other banks and us to be more conservative in provisioning loans and focus on collections. Although, credit quality conditions and customers’ payment behavior normalized by the end of the year, the growth in total loans and our higher penetration of the retail banking segment translated into a 6.9% annual increase in allowances for loan losses, from Ch$362,741 million in 2011 to Ch$387,803 million in 2012.
During 2013 the Chilean economy slowed down moderately by recording a 4.1% GDP growth. The lower dynamism in the local economic activity led other banks and us to recognize the risk associated with a potential deterioration in credit quality of both companies and individuals. Also, to a great extent, loan growth contributed to higher provisions for loan losses. Similar to our entire industry, we also increased our allowances for loan losses, from Ch$387,803 million in 2012 to Ch$439,298 million in 2013, which represents a 13.3% increase. As mentioned, this is in line with the annual growth posted by our loan book, as well as other additional topics that translated into higher provisions for loan losses, such as: (i) the effect of a sharp increase in the Ch$/US$ exchange rate on provisions for loan losses indexed to US$ and (ii) specific credit quality deteriorations in the wholesale segment.
For allowances for loan losses associated with impaired loans and with non-impaired loans, see Note 11(c) to our audited consolidated financial statements as of and for the year ended December 31, 2013 appearing elsewhere in this annual report.
88
Table of Contents
Loans are written-off when the collection efforts have been exhausted but not later than the maximum periods as follows:
|
Type of Loan |
Term |
|
| Consumer loans with or without collateral | 6 months | |
| Other transactions without collateral | 24 months | |
| Commercial loans with collateral | 36 months | |
| Residential mortgage loans | 48 months | |
| Consumer leases | 6 months | |
| Other non-real estate lease transactions | 12 months | |
| Real estate leases (commercial or residential) | 36 months |
The following table presents detailed information on write-offs and shows the charge-offs breakdown by loan category:
| Year ended December 31, | ||||||||||||
| 2011 | 2012 | 2013 | ||||||||||
| IFRS: | (in millions of Ch$) | |||||||||||
|
Commercial loans |
Ch$ | 82,086 | Ch$ | 43,164 | Ch$ | 36,029 | ||||||
|
Mortgage loans |
2,923 | 4,253 | 3,242 | |||||||||
|
Consumer loans |
92,951 | 135,316 | 157,264 | |||||||||
|
|
|
|
|
|
|
|||||||
|
Total |
Ch$ | 177,960 | Ch$ | 182,733 | Ch$ | 196,535 | ||||||
|
|
|
|
|
|
|
|||||||
Loan recoveries by type of loan are shown in the table below:
| Year ended December 31, | ||||||||||||
| 2011 | 2012 | 2013 | ||||||||||
| IFRS: | (in millions of Ch$) | |||||||||||
|
Commercial loans |
Ch$ | 16,014 | Ch$ | 14,892 | Ch$ | 13,330 | ||||||
|
Mortgage loans |
1,106 | 1,971 | 1,927 | |||||||||
|
Consumer loans |
28,445 | 24,099 | 27,698 | |||||||||
|
|
|
|
|
|
|
|||||||
|
Subtotal |
45,565 | 40,962 | 42,955 | |||||||||
|
Recoveries and sales of loans reacquired from the Central Bank |
90 | — | — | |||||||||
|
|
|
|
|
|
|
|||||||
|
Total |
Ch$ | 45,655 | Ch$ | 40,962 | Ch$ | 42,955 | ||||||
|
|
|
|
|
|
|
|||||||
The following tables classify our loan portfolio based on the borrower’s payment performance for each of the last three years:
| Year ended December 31, 2011 | ||||||||||||||||
|
Commercial
Loans |
Consumer
Loans |
Mortgage
Loans |
Total | |||||||||||||
| IFRS: | (in millions of Ch$) | |||||||||||||||
|
Total Past due after 90 days but less than 6 months |
Ch$ | 41,729 | Ch$ | 38,825 | Ch$ | 15,367 | Ch$ | 95,921 | ||||||||
|
Total Past due after 6 months within 12 months |
22,837 | — | 8,588 | 31,425 | ||||||||||||
|
Total Past due 12 months within 24 months |
30,982 | — | 6,487 | 37,469 | ||||||||||||
|
Total Past due 24 months within 36 months |
6,847 | — | 4,079 | 10,926 | ||||||||||||
|
Total Past due 36 months within 48 months |
— | — | 3,164 | 3,164 | ||||||||||||
|
|
|
|
|
|
|
|
|
|||||||||
|
Total Past Due |
Ch$ | 102,395 | Ch$ | 38,825 | Ch$ | 37,685 | Ch$ | 178,905 | ||||||||
|
|
|
|
|
|
|
|
|
|||||||||
| Year ended December 31, 2012 | ||||||||||||||||
|
Commercial
Loans |
Consumer
Loans |
Mortgage
Loans |
Total | |||||||||||||
| IFRS: | (in millions of Ch$) | |||||||||||||||
|
Total Past due after 90 days but less than 6 months |
Ch$ | 34,410 | Ch$ | 44,093 | Ch$ | 11,934 | Ch$ | 90,439 | ||||||||
|
Total Past due after 6 months within 12 months |
31,497 | 14 | 6,017 | 37,528 | ||||||||||||
|
Total Past due 12 months within 24 months |
35,547 | 2 | 6,729 | 42,278 | ||||||||||||
|
Total Past due 24 months within 36 months |
5,936 | — | 3,783 | 9,719 | ||||||||||||
|
Total Past due 36 months within 48 months |
— | — | 1,901 | 1,901 | ||||||||||||
|
|
|
|
|
|
|
|
|
|||||||||
|
Total Past Due |
Ch$ | 107,390 | Ch$ | 44,109 | Ch$ | 30,364 | Ch$ | 181,865 | ||||||||
|
|
|
|
|
|
|
|
|
|||||||||
89
Table of Contents
| Year ended December 31, 2013 | ||||||||||||||||
|
Commercial
Loans |
Consumer
Loans |
Mortgage
Loans |
Total | |||||||||||||
| IFRS: | (in millions of Ch$) | |||||||||||||||
|
Total Past due after 90 days but less than 6 months |
54,232 | 51,510 | 18,352 | 124,094 | ||||||||||||
|
Total Past due after 6 months within 12 months |
36,520 | 2 | 6,786 | 43,308 | ||||||||||||
|
Total Past due 12 months within 24 months |
47,790 | 2 | 6,730 | 54,522 | ||||||||||||
|
Total Past due 24 months within 36 months |
9,755 | — | 2,751 | 12,506 | ||||||||||||
|
Total Past due 36 months within 48 months |
16 | — | 2,284 | 2,300 | ||||||||||||
|
|
|
|
|
|
|
|
|
|||||||||
|
Total Past Due |
148,313 | 51,514 | 36,903 | 236,730 | ||||||||||||
|
|
|
|
|
|
|
|
|
|||||||||
Allocation of Allowances for Loan Losses
The following tables set forth the proportions of our required allowances for loan losses attributable to our commercial, consumer and residential mortgage loans under IFRS as of the dates indicated.
| As of December 31, 2011 | ||||||||||||||||
|
Allowance
amount |
Allowance
amount as a percentage of loans in category |
Allowance
amount as a percentage of total loans |
Loans in
category as percentage of total loans (1) |
|||||||||||||
| IFRS: | (in millions of Ch$, except percentages) | |||||||||||||||
|
Commercial loans |
Ch$ | 208,249 | 1.86 | % | 1.20 | % | 64.50 | % | ||||||||
|
Consumer loans |
138,588 | 5.40 | 0.80 | 14.76 | ||||||||||||
|
Residential mortgage loans |
15,904 | 0.44 | 0.09 | 20.74 | ||||||||||||
|
|
|
|
|
|
|
|
|
|||||||||
|
Total allocated allowances |
Ch$ | 362,741 | 2.09 | % | 2.09 | % | 100.00 | % | ||||||||
|
|
|
|
|
|
|
|
|
|||||||||
| As of December 31, 2012 | ||||||||||||||||
|
Allowance
amount |
Allowance
amount as a percentage of loans in category |
Allowance
amount as a percentage of total loans |
Loans in
category as percentage of total loans (1) |
|||||||||||||
| (in millions of Ch$, except percentages) | ||||||||||||||||
|
IFRS: |
||||||||||||||||
|
Commercial loans |
Ch$ | 207,676 | 1.77 | % | 1.11 | % | 62.52 | % | ||||||||
|
Consumer loans |
164,047 | 5.78 | 0.87 | 15.12 | ||||||||||||
|
Residential mortgage loans |
16,080 | 0.38 | 0.09 | 22.36 | ||||||||||||
|
|
|
|
|
|
|
|
|
|||||||||
|
Total allocated allowances |
Ch$ | 387,803 | 2.07 | % | 2.07 | % | 100.00 | % | ||||||||
|
|
|
|
|
|
|
|
|
|||||||||
| As of December 31, 2013 | ||||||||||||||||
|
Allowance
amount |
Allowance
amount as a percentage of loans in category |
Allowance
amount as a percentage of total loans |
Loans in
category as percentage of total loans (1) |
|||||||||||||
| IFRS: | (in millions of Ch$, except percentages) | |||||||||||||||
|
Commercial loans |
Ch$ | 241,442 | 1.85 | % | 1.16 | % | 62.64 | % | ||||||||
|
Consumer loans |
179,354 | 5.84 | 0.86 | 14.70 | ||||||||||||
|
Residential mortgage loans |
18,502 | 0.39 | 0.09 | 22.66 | ||||||||||||
|
|
|
|
|
|
|
|
|
|||||||||
|
Total allocated allowances |
Ch$ | 439,298 | 2.10 | % | 2.10 | % | 100.00 | % | ||||||||
|
|
|
|
|
|
|
|
|
|||||||||
| (1) | Based on our loan classification. |
90
Table of Contents
The following table sets forth our charge-offs for 2011, 2012 and 2013 by major economic sector and provides further detail of charge-offs that have already been described in the previous discussion of allowances for loan losses:
| Year Ended December 31, | ||||||||||||
| 2011 | 2012 | 2013 | ||||||||||
| IFRS: | (in millions of Ch$) | |||||||||||
|
Commercial: |
||||||||||||
|
Agriculture |
Ch$ | 5,208 | Ch$ | 2 ,986 | Ch$ | 5 ,615 | ||||||
|
Mining |
606 | 812 | 1,605 | |||||||||
|
Manufacturing |
3,807 | 5,143 | 2,430 | |||||||||
|
Construction |
3,330 | 3,161 | 4,516 | |||||||||
|
Commerce |
52,057 | 9,228 | 8,825 | |||||||||
|
Transport |
2,132 | 2,287 | 3,309 | |||||||||
|
Financial services |
9,799 | 5,637 | 4,774 | |||||||||
|
Community |
5,147 | 13,910 | 4,955 | |||||||||
|
|
|
|
|
|
|
|||||||
|
Subtotal: |
Ch$ | 82,086 | Ch$ | 43,164 | Ch$ | 36,029 | ||||||
|
Consumer loans |
92,951 | 135,316 | 157,264 | |||||||||
|
Mortgage loans |
2,923 | 4,253 | 3,242 | |||||||||
|
|
|
|
|
|
|
|||||||
|
Total |
Ch$ | 177,960 | Ch$ | 182,733 | Ch$ | 196,535 | ||||||
|
|
|
|
|
|
|
|||||||
Composition of Deposits and Other Commitments
The following table sets forth under IFRS the composition of our deposits and similar commitments as of the dates indicated. See “—Average Balance Sheets, Interest Earned on Interest Earning Assets and Interest Paid on Interest Bearing Liabilities” for the average rate paid on each of the following deposit categories.
| As of December 31, | ||||||||||||
| 2011 | 2012 | 2013 | ||||||||||
| IFRS: | (in millions of Ch$) | |||||||||||
|
Current accounts |
Ch$ | 3,968,504 | Ch$ | 4,495,135 | 5,018,155 | |||||||
|
Other demand deposits |
926,922 | 975,836 | 966,177 | |||||||||
|
Savings accounts |
177,900 | 179,464 | 178,011 | |||||||||
|
Time deposits |
9,081,336 | 9,370,063 | 10,151,612 | |||||||||
|
Other term balance payables |
23,088 | 63,423 | 73,102 | |||||||||
|
|
|
|
|
|
|
|||||||
|
Total |
Ch$ | 14,177,750 | Ch$ | 15,083,921 | Ch$ | 16,387,057 | ||||||
|
|
|
|
|
|
|
|||||||
Maturity of Deposits
The following table sets forth under IFRS information regarding the currency and maturity of our deposits at December 31, 2013, expressed in percentages. UF-denominated deposits are similar to Chilean peso-denominated deposits in all aspects, except that the principal is readjusted periodically based on the value of the UF.
| As of December 31, 2013 | ||||||||||||||||
| Ch$ | UF |
Foreign
Currency |
Total | |||||||||||||
| (in millions of Ch$) | ||||||||||||||||
|
IFRS: |
||||||||||||||||
|
Demand deposits |
5,281,924 | 28,032 | 674,376 | 5,984,332 | ||||||||||||
|
Savings accounts |
— | 178,011 | — | 178,011 | ||||||||||||
|
Time deposits: |
||||||||||||||||
|
Maturing within three months |
5,596,849 | 879,087 | 593,064 | 7,069,000 | ||||||||||||
|
Maturing after three but within six months |
937,607 | 349,278 | 81,210 | 1,368,095 | ||||||||||||
|
Maturing after six but within 12 months |
982,327 | 551,667 | 46,112 | 1,580,106 | ||||||||||||
|
Maturing after 12 months |
82,184 | 81,903 | 43,426 | 207,513 | ||||||||||||
|
|
|
|
|
|
|
|
|
|||||||||
|
Total time deposits |
7,598,967 | 1,861,935 | 763,812 | 10,224,714 | ||||||||||||
|
|
|
|
|
|
|
|
|
|||||||||
|
Total deposits |
12,880,891 | 2,067,978 | 1,438,188 | 16,387,057 | ||||||||||||
|
|
|
|
|
|
|
|
|
|||||||||
91
Table of Contents
The following table sets forth information under IFRS regarding the currency and maturity of deposits in excess of U.S.$100,000 as of December 31, 2013.
| As of December 31, 2013 | ||||||||||||||||
| Ch$ | UF |
Foreign
Currency |
Total | |||||||||||||
| (in millions of Ch$) | ||||||||||||||||
|
IFRS: |
||||||||||||||||
|
Demand deposits |
41.01 | % | 1.36 | % | 46.89 | % | 36.52 | % | ||||||||
|
Savings accounts |
— | 8.61 | — | 1.09 | ||||||||||||
|
Time deposits: |
||||||||||||||||
|
Maturing within three months |
43.45 | 42.51 | 41.24 | 43.14 | ||||||||||||
|
Maturing after three but within six months |
7.28 | 16.89 | 5.65 | 8.35 | ||||||||||||
|
Maturing after six but within 12 months |
7.63 | 26.68 | 3.21 | 9.64 | ||||||||||||
|
Maturing after 12 months |
0.63 | 3.95 | 3.01 | 1.26 | ||||||||||||
|
|
|
|
|
|
|
|
|
|||||||||
|
Total time deposits |
58.99 | 90.03 | 53.11 | 62.39 | ||||||||||||
|
|
|
|
|
|
|
|
|
|||||||||
|
Total deposits |
100.00 | % | 100.00 | % | 100.00 | % | 100.00 | % | ||||||||
|
|
|
|
|
|
|
|
|
|||||||||
Minimum Capital Requirements
Pursuant to the general Banking Law, local banks must comply with minimum capital requirements in relation to both total assets and risk-weighted assets. Basic Capital should be at least equal to 3.0% of their total assets, while banks’ Total Regulatory Capital, should be at least 8.0% of their risk weighted assets. Nevertheless, based on Banco de Chile’s systemic relevance the SBIF requires us to maintain a ratio of Regulatory Capital to Credit Risk-Weighted Assets above 10.0%. For more information see “Item 3. Key Information—Presentation of Financial Information” and “Item 4. Information on the Company—Regulation and Supervision—Capital Adequacy Requirements”.
The following table sets forth our minimum capital requirements (and availability) with respect to total assets, as set by the SBIF:
| As of December 31, | ||||||||||||
| 2011 | 2012 | 2013 | ||||||||||
| CHILEAN GAAP: | (in millions of Ch$) | |||||||||||
|
Banco de Chile’s basic capital |
1,739,173 | 2,007,057 | 2,284,314 | |||||||||
|
Basic capital required (with respect to total assets) |
(761,362 | ) | (821,418 | ) | (905,644 | ) | ||||||
|
|
|
|
|
|
|
|||||||
|
Excess over minimum basic capital required |
977,811 | 1,185,639 | 1,378,670 | |||||||||
|
|
|
|
|
|
|
|||||||
Similarly, the following table sets forth our minimum capital requirements (and availability) with respect to risk-weighted assets, as set by the SBIF:
| As of December 31, | ||||||||||||
| 2011 | 2012 | 2013 | ||||||||||
| CHILEAN GAAP: | (in millions of Ch$) | |||||||||||
|
Banco de Chile’s Total Regulatory Capital |
2,529,135 | 2,738,829 | 2,999,061 | |||||||||
|
Total Regulatory Capital required (with respect to risk-weighted assets) |
(1,958,487 | ) | (2,070,952 | ) | (2,298,110 | ) | ||||||
|
|
|
|
|
|
|
|||||||
|
Excess over minimum Total Regulatory Capital required |
570,648 | 667,877 | 700,951 | |||||||||
|
|
|
|
|
|
|
|||||||
92
Table of Contents
Short-Term Borrowings
The principal categories of our short-term borrowings are amounts borrowed under foreign trade lines of credit, domestic inter-bank loans and repurchase agreements. The table below presents under IFRS the amounts outstanding and the weighted average nominal interest rate for each period indicated by type of short-term borrowing.
| For the year ended December 31, | ||||||||||||||||||||||||
| 2011 | 2012 | 2013 | ||||||||||||||||||||||
| IFRS: |
Year-End
Balance |
Weighted
Average Nominal Interest Rate |
Year-End
Balance |
Weighted
Average Nominal Interest Rate |
Year-End
Balance |
Weighted
Average Nominal Interest Rate |
||||||||||||||||||
| (in millions of Ch$, except rate data) | ||||||||||||||||||||||||
|
Payables from repurchase agreements and security lending |
223,202 | 4.86 | % | 226,396 | 6.62 | % | 256,766 | 5.12 | % | |||||||||||||||
|
Borrowings from domestic financial institutions |
— | — | — | — | — | — | ||||||||||||||||||
|
Foreign borrowings |
1,668,084 | 1.29 | 1,108,662 | 1.90 | 989,455 | 1.25 | ||||||||||||||||||
|
Other obligations |
123,051 | — | 106,538 | — | 160,612 | — | ||||||||||||||||||
|
|
|
|
|
|
|
|
|
|
|
|
|
|||||||||||||
|
Total short-term borrowings |
2,014,337 | 1.61 | % | 1,441,596 | 2.50 | % | 1,406,833 | 1.81 | % | |||||||||||||||
|
|
|
|
|
|
|
|
|
|
|
|
|
|||||||||||||
The following table shows the average balance and the weighted average nominal rate for each short-term borrowing category during the periods indicated:
| For the year ended December 31, | ||||||||||||||||||||||||
| 2011 | 2012 | 2013 | ||||||||||||||||||||||
| IFRS: |
Average
Balance |
Weighted
Average Nominal Interest Rate |
Average
Balance |
Weighted
Average Nominal Interest Rate |
Average
Balance |
Weighted
Average Nominal Interest Rate |
||||||||||||||||||
| (in millions of Ch$, except rate data) | ||||||||||||||||||||||||
|
Payables from repurchase agreements and security lending |
218,847 | 4.96 | % | 286,944 | 5.22 | % | 289,107 | 4.55 | % | |||||||||||||||
|
Central Bank borrowings |
69 | — | 36 | — | 13 | — | ||||||||||||||||||
|
Borrowings from domestic financial institutions |
73,590 | 3.06 | 34,702 | 3.52 | 35,928 | 3.94 | ||||||||||||||||||
|
|
|
|
|
|
|
|
|
|
|
|
|
|||||||||||||
|
Sub-total |
292,506 | 4.48 | 321,682 | 5.04 | 325,048 | 4.48 | ||||||||||||||||||
|
Foreign borrowings |
1,600,479 | 1.35 | 1,388,253 | 1.52 | 925,685 | 1.34 | ||||||||||||||||||
|
|
|
|
|
|
|
|
|
|
|
|
|
|||||||||||||
|
Total short-term borrowings |
1,892,985 | 1.83 | % | 1,709,935 | 2.18 | % | 1,250,733 | 2.15 | % | |||||||||||||||
|
|
|
|
|
|
|
|
|
|
|
|
|
|||||||||||||
The following table presents the maximum month-end balances of our principal sources of short-term borrowings during the periods indicated:
|
Maximum 2011
month-end balance |
Maximum 2012
month-end balance |
Maximum 2013
month-end balance |
||||||||||
| IFRS: | (in millions of Ch$) | |||||||||||
|
Investments sold under agreements to repurchase |
321,956 | 310,616 | 330,407 | |||||||||
|
Central Bank borrowings |
98,865 | 60 | 17 | |||||||||
|
Borrowings from domestic financial institutions |
126,055 | 5,000 | 210,058 | |||||||||
|
Foreign borrowings |
1,914,290 | 1,735,573 | 1,180,252 | |||||||||
| Item 4B | Unresolved Staff Comments |
None.
93
Table of Contents
| Item 5 | Operating and Financial Review and Prospects |
OPERATING RESULTS
Introduction
The following discussion should be read in conjunction with, and is entirely qualified by reference to, our audited consolidated financial statements as of and for the year ended December 31, 2013 appearing elsewhere in this annual report and “Item 4. Information on the Company—Selected Statistical Information.” Certain amounts (including percentage amounts) that appear in this annual report may not total due to rounding.
We prepare our audited consolidated financial statements in accordance with IFRS as issued by the IASB.
Until and including our consolidated financial statements included in our annual report on Form 20-F for the year ended December 31, 2008, we prepared our audited consolidated financial statements in accordance with Chilean GAAP, with reconciliations to U.S. GAAP. As required by IFRS 1— First Time Adoption of International Financial Reporting Standards , our financial position as of December 31, 2008 and our results of operations for the year ended December 31, 2008 were restated in accordance with IFRS 1 for comparative purposes. Reconciliations and description of the transition to IFRS, and the effects on assets, liabilities, equity, net income and cash flows are presented in Note 5 to our audited consolidated financial statements included in our annual report on Form 20-F for the year ended December 31, 2009 filed with the SEC on June 29, 2010. Unless otherwise indicated, the financial information included in this annual report for the years 2009, 2010, 2011, 2012 and 2013 has been derived from financial statements that were prepared in accordance with IFRS. See Note 2(a) to our audited consolidated financial statements as of and for the year ended December 31, 2013 appearing elsewhere in this annual report. IFRS differs in certain significant respects from Chilean GAAP. As a result, our financial information presented under IFRS is not directly comparable to any of our financial information presented under Chilean GAAP. Accordingly, readers should avoid such comparison.
Overview
We are a leading bank within the Chilean financial system, providing a broad range of financial products and services to individual and corporate customers who are primarily located in Chile. Accordingly, our financial condition, results of operations and our ability to achieve our strategic business goals could be adversely affected by changes in Chile’s economic conditions and the resulting effects on macroeconomic indicators (such as interest rates, inflation and GDP growth, among others), modifications of non-economic policies implemented by the Chilean government that can affect private sector activities, or other political and economic developments in Chile, as well as regulatory changes or administrative practices of Chilean authorities over which we have no control. See “Item 3. Key Information—Risk Factors—Risks Relating to Chile—Inflation could adversely affect the value of our ADSs and financial condition and results of operations” and “Item 3. Key Information—Risk Factors—Risks Relating to Chile—Our growth and profitability depend on the level of economic activity in Chile.”
According to information published by the SBIF, as of December 31, 2013, excluding operations of subsidiaries abroad, we were the second largest bank in Chile in terms of total loans with a market share of 19.1%, the largest provider of commercial loans with a market share of 19.5%, the largest bank in Chile in terms of average balances of current accounts and demand deposits with a 23.2% market share, the second-largest provider of consumer loans in Chile with a market share of 20.9% and the second largest non-governmental bank in Chile in terms of residential mortgage loans with a market share of 17.4%. Also according to the SBIF, as of December 31, 2013, we were the largest bank in Chile in terms of net income with a market share of 26.8% and the largest bank in Chile in terms of current account balances held by individuals with a market share of 30.2%. According to the Chilean Association of Mutual Funds, as of December 31, 2013, we were the largest provider of mutual funds management services in Chile with a market share of 21.3%.
94
Table of Contents
As for the economy, after a period of accelerated growth between 1985 and 1997, when Chile’s gross domestic product grew at an average annual rate of 7.0%, Chile’s economic growth slowed to an average rate of 4.7% between 2000 and 2008. Since 2008 the Chilean economy has faced difficult and volatile circumstances, ranging from a global economic slowdown caused by the subprime mortgage crisis in United States to the worst earthquake reported in over 50 years in Chile. However, the country has been able to cope with this challenging environment and maintain sustained growth, with annual GDP expansion rates of 5.8% for 2010, 5.8% for 2011 and 5.4% for 2012. These expansions in GDP were supported by Chile’s stable financial condition that, in turn, relied on an independently managed Central Bank, a floating exchange rate regime, a state’s policy intended to accumulate international reserves and maintain low external debt levels, a well-diversified international trade and a fiscal policy internationally recognized for its responsibility and long-term vision.
During 2013 and in line with the trend followed by most of the developing countries, Chilean economic activity started to show some signs of slowdown by recording a 4.1% GDP expansion. Although this figure was 1.3% below the expansion posted in 2012, local economic growth continued to be above the average recorded by Latin-American countries and the world.
The slower economic pace was largely explained by decreased investment activity, which was the result of postponed investment in the mining and energy sectors due to environmental issues. This also had some impact on the activity of other sectors such as manufacturing and industrial services. Also, even though demand for housing continues to be strong, there has been a deceleration in the construction sector amid tighter credit-granting policies set by banks, while real estate companies have constrained their expansion plans waiting for inventory liquidation. Lastly, increasing energy prices also contributed to a deceleration in economic activity. All in all, investment showed a significant slowdown in 2013 by posting a slight 0.4% annual growth as compared to the expansion of 12.2% posted in 2012.
Conversely, private consumption continued to be the main driver for economic growth, although it reduced its pace. Consumption represents more than 60% of Chilean GDP and it has become the main engine for GDP growth over the last years. GDP growth has been based on a low unemployment rate, which averaged 5.9% in 2013, together with real wages that grew at a rate of 2.4% in annual terms. Also, credit conditions have remained fairly stable within the local market, which has promoted indebtedness and consumption. However, retail sales slid moderately in 2013. This trend indicates a gradual slowdown and is aligned with lower consumer expectations regarding the economy’s outlook. All in all, consumption posted real growth of 5.4% in 2013 as compared to a 5.6% increase in 2012.
As for inflation, local prices have decoupled from trends in local aggregate demand. In spite of the moderate slowdown in private consumption, the CPI index recorded a 3.0% annual increase in 2013 as compared to a 1.5% annual increase in 2012. The annual increase in the CPI was mainly caused by increasing prices for food, energy and transportation. Although this annual change was above market expectations and the Central Bank’s estimates, inflation remained within the long-run targeted range set by that institution. In 2013 inflation was concentrated in the fourth quarter of 2013. This was mainly the result of sharp Chilean-peso devaluation (9.6% during the whole year) with respect to the U.S. dollar, which has been in line with a global trend in currencies and an accomodative monetary policy by the Central Bank. All of these factors resulted in higher prices of tradable goods, in which Chile is a net importer.
As mentioned above, given controlled inflation and the signs of slowdown evidenced in the local economy, during the fourth quarter of 2013, the Central Bank began an easing stage of its monetary policy by cutting the marginal standing facility rate twice, in October and November 2013, by 25 basis points (50 bp total). As a consequence, the monetary policy rate declined from 5.0%—where it had remained for almost two years—to 4.5% by December 2013. By early 2014, the Central Bank carried out two additional cuts in the policy rate of 25 basis points each one. These actions have been intended to promote higher consumption and investment, as GDP growth forecasts have been revised downward by the Central Bank and market analysts. As of April 15, 2014 the marginal standing facility rate was 4.0%.
95
Table of Contents
Regarding the stock market, during 2013 the IPSA index (composed of the 40 most- traded Chilean stocks) reflected both a bearish trend among local investors who were looking for a haven in fixed-income amid volatile global conditions and a less positive outlook for the local economy that could affect the earnings of highly traded companies. As a result, the IPSA index was at 3,699.19 points as of December 31, 2013, which represented a 14.0% decline as compared to the 4,301.38 points recorded as of December 31, 2012. In addition, the easing policy undertaken by the Central Bank towards the end of 2013 and signs of recovery observed for developed economies also contributed to a decline in the IPSA index, as bets on exchange rates became a new investment alternative, particularly in the short term. By early 2014, the IPSA index has begun a path to recovery, based on the revised expectations of analysts. According to data provided by Bloomberg, as of April 15, 2014 the IPSA index was at 3,877.49 points, which represented a 4.8% year-to-date increase.
Inflation
In the past, Chile experienced high levels of inflation that affected the financial condition and results of operations of most industries. Nevertheless, since the 1990s, inflation has been maintained under control through responsible monetary policy carried out by an independent Central Bank. Over the last three years, inflation has been conditioned on local economic dynamics. In fact, due to the slowdown in the global and local economy, during 2009 inflation turned negative and closed the year with a deflation of 1.4%. Conversely, throughout 2010, inflation returned to more normal levels and was within the long-term range of 2.0% to 4.0% per year targeted by the Central Bank, ending the year at 3.0%. After that, stimulative economic activity—led by private consumption—and high international prices for oil and food fostered inflation of 4.4% in 2011. During 2012, inflation was 1.5%. This figure was below initial expectations and was mainly explained by a decrease in international oil prices that translated into lower local prices for transportation and utilities. Decreasing prices in these sectors more than offset higher food prices. Nevertheless, in 2013 inflation returned to the long-run range set by the Central Bank by posting a CPI increase of 3.0%. This figure was influenced by higher food, transportation and energy prices, which in turn were prompted by a sharp increase in the Ch$/US$ exchange rate that translated into a higher cost of imported tradable goods.
An increase in inflation rates could adversely affect the Chilean economy and have an adverse effect on our business, financial condition and results of operations. Our results of operations reflect the effect of inflation in the following ways:
| • |
a substantial portion of our assets and liabilities are denominated in UFs, a unit that is indexed daily to reflect inflation recorded in the previous month, with the net gain or loss resulting from such indexation reflected in income; and |
| • |
the interest rates earned and paid on peso-denominated assets and liabilities to some degree reflect inflation and expectations regarding inflation. |
UF-Denominated Assets and Liabilities . The UF is revalued in monthly cycles. On each day in the period beginning the tenth day of the current month through the ninth day of the next month, the nominal peso value of the UF is indexed up (or down in the event of deflation) in order to reflect each day a pro rata amount of the prior calendar month’s change in the CPI as published by the Chilean National Statistics Institute. One UF was equal to Ch$22,840.75 as of December 31, 2012 and Ch$23,309.56 as of December 31, 2013. The effect of any changes in the nominal peso value of our UF-denominated assets and liabilities is reflected in our results of operations as an increase (or decrease, in the event of deflation) in interest revenue and expense. Our net interest income will be positively affected by inflation (and negatively affected by deflation) to the extent that our average UF-denominated assets exceed our average UF-denominated liabilities, while our net interest income will be negatively affected by inflation (and positively affected by deflation) when average UF-denominated liabilities exceed our average UF-denominated assets. Our average UF-denominated assets exceeded our average UF-denominated liabilities by Ch$3,900,986 million (U.S.$8,136.04 million) as of December 31, 2012 and Ch$4,625,444 million (U.S.$ 8,798.30 million) as of December 31, 2013. These figures exclude derivatives. See “Item 4. Information on the Company—Selected Statistical Information.”
96
Table of Contents
Peso-Denominated Assets and Liabilities . Interest rates in Chile tend to reflect the rate of inflation during the relevant period and expectations regarding future inflation. The sensitivity of our peso-denominated interest earning assets and interest bearing liabilities to the inflation rate varies. See “—Interest Rates.” We maintain a substantial amount of non-interest bearing, peso-denominated current accounts and other demand deposits. The ratio of such deposits to average interest bearing peso-denominated liabilities was 62% during the year ended December 31, 2012 and 62% during the year ended December 31, 2013. Since a large part of such deposits are not indexed to inflation, even a slight decline in the rate of inflation may adversely affect our net interest margin on assets funded with such deposits and even a slight increase in the rate of inflation may increase the net interest margin on such assets. See “Item 4. Information on the Company—Selected Statistical Information—Interest Earning Assets and Net Interest Margin.”
Interest Rates
Interest rates earned and paid on our assets and liabilities reflect in part, inflation and expectations regarding future inflation, shifts in short-term interest rates related to the Central Bank’s monetary policies and movements in long-term real rates. The Central Bank manages short-term interest rates based on its objectives of balancing low inflation and economic growth. As a consequence of strong recovery signs for economic activity and the more normalized inflationary environment, the Central Bank began to withdraw the monetary stimulus in June 2010 by increasing the monetary policy annual interest rate to 1.00% from the 0.5% maintained during the first half of that year. Since June 2010, the Central Bank repeatedly raised the marginal standing facility rate, ending 2011 at 5.25%, above the level of 3.25% recorded in December 2010. Nevertheless, as a consequence of the tempered global slowdown during the last quarter of 2011 and the uncertainty regarding the fiscal condition of some developed countries, the Central Bank decided to lower the reference interest rate by 0.25% on January 12, 2012.
After that, the Central Bank maintained the marginal standing facility rate at 5.0% during 22 months, until October 2013. This neutral bias was supported by the growth of the local economy over the last two years, prompting a virtuous cycle that resulted in increasing real wages, low unemployment and growing private consumption. These trends were also accompanied by low inflationary pressures. Conversely and as mentioned earlier, by the end of 2013 the Central Bank commenced an easing monetary policy. By early 2014, the Central Bank maintained this expansionary bias by applying two additional cuts of 25 basis points each to the marginal standing facility rate. As of April 15, 2014 the monetary policy interest rate was 4.0%.
Since our liabilities generally re-price faster than our assets, changes in the rate of inflation or short-term interest rates are reflected in the nominal interest rates we pay on our liabilities before they are reflected in the nominal interest rates we earn on our assets. Accordingly, our net interest margin on assets and liabilities is usually adversely affected in the short-term by increases in short-term nominal interest rates and benefits in the short-term from decreases in short-term nominal interest rates, although the existence of non-interest bearing peso-denominated demand deposits tends to mitigate both effects. See “—Inflation—Peso-Denominated Assets and Liabilities.” In addition, because our peso-denominated liabilities have relatively short re-pricing periods, those liabilities generally are more sensitive to changes in inflation or short-term interest rates than our UF-denominated liabilities. As a result, during periods when current inflation exceeds the previous month’s inflation, customers often switch funds from peso-denominated deposits to more expensive UF-denominated deposits, thereby adversely affecting our net interest margin.
According to information published by the Central Bank, the average annual short-term nominal interest rate, based on the rate paid by Chilean financial institutions for 90 to 360-day Chilean peso-denominated deposits, was 5.61% in 2011, 5.90% in 2012 and 5.20% in 2013. The average annual long-term nominal interest rate, based on the interest rate of the Central Bank’s five-year Chilean peso-denominated bonds, was 5.67% in 2011, 5.26% in 2012 and 5.14% in 2013.
97
Table of Contents
Foreign Currency Exchange Rates
A portion of our assets and liabilities are denominated in foreign currencies, principally U.S. dollars. In the past, we have maintained and may continue to maintain gaps between the balances of such assets and liabilities. This gap includes assets and liabilities denominated in foreign currencies and assets and liabilities denominated in Chilean pesos that contain repayment terms linked to changes in foreign currency exchange rates. However, we generally offset this gap by taking hedging derivative positions. Because foreign currency denominated assets and liabilities, as well as interest earned or paid on such assets and liabilities and gains (losses) realized upon the sale of such assets, are translated into pesos in preparing our audited consolidated financial statements, our reported income is affected by changes in the value of the peso with respect to foreign currencies, primarily the U.S. dollar. Adjustments to U.S. dollar-indexed assets are reflected as adjustments in net interest earnings and offset results in our foreign exchange position. See “Item 3. Key Information—Exchange Rates and Item 3. Key Information Risk Factors—Currency fluctuations could adversely affect the value of our ADSs and any distributions on the ADSs.”
Critical Accounting Policies
We prepare our audited consolidated financial statements in accordance with IFRS as issued by the IASB. The notes to our audited consolidated financial statements as of and for the year ended December 31, 2013, which are included in this annual report, contain a summary of our significant accounting policies.
The preparation of financial statements under IFRS requires management to make certain estimates and assumptions, as some of the amounts reported in the financial statements are related to matters that are inherently uncertain. These estimates could change from period to period, which may have a material impact on our financial condition or results of operations. Actual results may differ if conditions or underlying circumstances were to change.
The following discussion describes those areas that require considerable management judgment or involve a higher degree of complexity in the application of the accounting policies that currently affect our financial situation and results of operations.
Allowances for Loan Losses
Determining accounting estimates and judgments related to the impairment of loans and provision for off-balance sheet positions is a critical process for us because the underlying assumptions used for both the individually and collectively assessed impairment can change from period to period and may significantly affect our results of operations.
As part of this process, we first assess whether objective evidence of impairment exists for loans that are individually significant. The decision as to whether loans are individually significant or not is based on fixed criteria specified by management. The determination of these criteria involves management’s judgment and is regularly reviewed for adequacy. After this assessment, we assess collectively for loans that are not individually significant and loans which are significant but for which there is no objective evidence of impairment under the individual assessment.
The determination of the impairment allowance required for loans that are deemed to be individually significant often requires the use of considerable judgment by management on economic conditions, the financial performance of the customer and the value of collateral, for which there may not be a readily accessible market. To allow management to determine if a loss event has occurred on an individual basis, all significant counterparty relationships are reviewed periodically. This evaluation considers current information and events related to the counterparty, such as if the counterparty is experiencing significant financial difficulty or a breach of contract, for example, default or delinquency in interest or principal payments.
From the information gathered in the process described above, we estimate the future cash flows expected to flow to the entity considering the losses already incurred. The actual amount and timing of future cash flows may differ from the estimates used by management and consequently may cause actual losses to differ from the reported allowances. We utilize back testing techniques in order to optimize our models and minimize such adjustments.
98
Table of Contents
The collective impairment allowance is calculated on a portfolio basis using statistical models which incorporate various estimates and judgments. In order to constantly monitor and increase the quality of such estimations of future cash flows, we regularly review our statistical models and the underlying data and assumptions. Among other factors, the probability of defaults and loss recovery rates are taken into account during this review.
The collective impairment allowance has two components.
The first component is an allowance amount representing the incurred losses on the portfolio of smaller balance homogeneous loans, which are loans to individuals and small business customers of the retail business segment. The loans are grouped according to similar credit risk characteristics and the allowance for each group is determined using statistical models based on historical experience.
The second component represents an estimate of incurred losses inherent in the group of loans that have not yet been individually identified as impaired or measured as part of the smaller-balance homogeneous loans. We use historical loss experience for these estimates. This historical loss experience is adjusted on the basis of actual observable data to reflect the effects of current conditions that did not affect the period on which the historical loss experience is based and to remove the effects of conditions in the historical period that do not exist currently. Estimates of changes in future cash flows reflect, and are directionally consistent with, changes in related observable data from period to period (e.g., changes in unemployment rates, property prices, payment status or other factors that are indicative of incurred losses in the group and their magnitude).
For a further description of our policy regarding allowances for loan losses, see note 2(h) to our audited consolidated financial statements as of and for the year ended December 31, 2013 appearing elsewhere in this annual report.
Impairment of Other Financial Instruments
Equity method investments and financial assets classified as available for sale are evaluated for impairment throughout the year and at each reporting date in order to assess whether events or changes in circumstances indicate that these assets are impaired. If there is objective evidence of an impairment of an asset, an impairment test is performed by comparing the investments’ recoverable amount, which is the higher of its value in use and fair value less costs to sell, with its carrying amount.
In the case of equity investments classified as available for sale, objective evidence of impairment would include a significant or prolonged decline in fair value of the investment below cost. It could also include specific conditions in an industry or geographical area or specific information regarding the financial condition of the company, such as a credit rating downgrade. In the case of debt securities classified as available for sale, impairment is assessed based on the same criteria as for loans.
If information becomes available after we make our evaluation, we may be required to recognize impairment in the future. Because the estimate for impairment could change from period to period based upon future events that may or may not occur, we consider this to be a critical accounting estimate.
Fair Value Estimates for Financial Assets and Liabilities
International Financial Reporting Standard (“IFRS”) 13 defines “fair value” as the price that would be received to sell an asset or paid to transfer a liability in an orderly transaction between market participants at the measurement date. IFRS 13 seeks to increase consistency and comparability in fair value measurements and related disclosures through a ‘fair value hierarchy’. The hierarchy categorises the inputs used in valuation techniques into three levels. The hierarchy gives the highest priority to (unadjusted) quoted prices in active markets for identical assets or liabilities and the lowest priority to unobservable inputs.
The Bank uses valuation techniques appropriate in the circumstances and for which sufficient data are available to measure fair value, maximizing the use of relevant observable inputs and minimizing the use of unobservable inputs.
99
Table of Contents
The objective of using a valuation technique is to estimate the price at which an orderly transaction to sell the asset or to transfer the liability would take place between market participants and the measurement date under current market conditions. Three widely used valuation techniques are:
| • |
Market approach—uses prices and other relevant information generated by market transactions involving identical or comparable (similar) assets, liabilities, or a group of assets and liabilities (e.g. a business) |
| • |
Cost approach—reflects the amount that would be required currently to replace the service capacity of an asset (current replacement cost) |
| • |
Income approach—converts future amounts (cash flows or income and expenses) to a single current (discounted) amount, reflecting current market expectations about those future amounts. |
In some cases, a single valuation technique will be appropriate, whereas in others multiple valuation techniques will be appropriate. The objective of a fair value measurement is to estimate the price at which an orderly transaction to sell the asset or to transfer the liability would take place between market participants at the measurement date under current market conditions. A fair value measurement requires an entity to determine all of the following:
| • |
the particular asset or liability that is the subject of the measurement (consistently with its unit of account) |
| • |
the principal (or most advantageous) market for the asset or liability |
| • |
the valuation technique(s) appropriate for the measurement, considering the availability of data with which to develop inputs that represent the assumptions that market participants would use when pricing the asset or liability and the level of the fair value hierarchy within which the inputs are categorized. For a further description of our internal fair value classification, see note 40 to our audited consolidated financial statements as of and for the year ended December 31, 2013 appearing elsewhere in this annual report. |
Revenue Recognition
Interest revenue and expenses are recognized in the income statement using the effective interest rate method set forth in IAS 39. To calculate the effective interest rate, we estimate future cash flows by taking into account all contractual conditions of the financial instrument, excluding future credit losses. The estimation of such future cash flows requires management judgment to some degree. In addition, the analysis of contractual conditions and other components (such as transaction costs) for purposes of determining the effective interest rate involves making estimates of possibly incurred but not recognized credit losses. See “—Allowances for loan losses.”
Income and expenses from fees and commissions are recognized in consolidated income using different criteria based on the nature of the income or expense in accordance with IAS 18 and IAS 39. Fees earned from transactions or services provided over a longer period of time are recognized over the life of the transactions or services. The revenue recognition of fees from such transactions requires management judgment to some degree. Due to the nature of business from which we derive fees and commissions (e.g., asset management, custody of assets), the required degree of estimation is small.
Deferred Tax Assets
Deferred tax is recognized, using the liability method, on temporary differences arising between the tax bases of assets and liabilities and their carrying amount in the financial statements. Deferred income tax assets are recognized to the extent that it is probable that future taxable profits will be available against which the temporary differences can be recognized. This assessment requires significant management judgments and assumptions. In order to estimate the recoverability of deferred tax assets, we consider historical tax capacity and profitability information, as well as forecasted operating results and other relevant considerations.
100
Table of Contents
Legal and Regulatory Contingencies and Tax Risks
Legal claims, regulatory proceedings and income tax provisions for uncertain tax positions may occur. The use of estimates is important in determining provisions for potential losses that may arise from such events. We estimate and provide for potential losses that may arise from litigation, regulatory proceedings and uncertain income tax positions to the extent that such losses are possible and can be estimated, in accordance with IAS 37 (“Provisions, Contingent Liabilities and Contingent Assets”) and IAS 12 (“Income Taxes”). Significant judgment is required in making these estimates and our actual liabilities may ultimately be materially different. Contingencies in respect of legal matters are subject to many uncertainties and the outcome of individual matters is not predictable with assurance.
Our total liability with respect to litigation, arbitration and regulatory proceedings is determined on a case-by-case basis and represents an estimate of probable losses after considering, among other factors, the progress of each case, our experience and the experience of others in similar cases, and the opinions and views of legal counsel. Predicting the outcome of our litigation matters is inherently difficult, particularly in cases in which claimants seek substantial or indeterminate damages.
New Standards Adopted in 2013
The Bank currently applies, for the first time, certain standards and amendments such as IFRS 10—Consolidated Financial Statements, IFRS 11—Joint Arrangements, IFRS 12—Disclosure of Interest in Other Entities, IAS 19—Employee Benefits and IFRS 13- Fair Value Measurement, IAS 1—Presentation of Financial Statements and IFRS 7—Financial Instruments: Disclosure. The nature and effect of these changes are disclosed below.
IAS 1 Presentation of Items of Other Comprehensive Income. This rule introduces a new grouping of items to be presented in other comprehensive income (OCI). Items that could be reclassified (or recycled) to profit or loss at a future point in time now have to be presented separately from items that will never be reclassified. The amendment affected presentation only and had no impact on the Bank’s financial position or performance.
IFRS 7 Financial Instruments: Disclosures Offsetting Financial Assets and Financial Liabilities. The amendment requires an entity to disclose information about rights to set-off financial instruments and related arrangements (e.g., cash collateral agreements). The disclosures would provide users with information that is useful in evaluating the effect of netting arrangements on an entity’s financial position. The Bank has disclosed the impact of master netting agreements. None of these netting arrangements qualify for netting under the requirements of IAS 32; therefore, financial instruments subject to netting arrangements are presented on a gross basis in the balance sheet.
IFRS 10 Consolidated Financial Statements. IFRS 10 establishes a single control model that applies to all entities including special purposes entities. IFRS 10 replaces the parts of previously existing IAS 27—Consolidated and Separate Financial Statements that dealt with consolidated financial statements and SIC—12 Consolidation—Special Purposes Entities. IFRS 10 changes the definition of control such that an investor controls an investee when it is exposed, or has rights, to variable returns from its involvement with the investee and has the ability to affect those returns through its power over the investee.
The Bank and its subsidiaries performed an analysis on all entities to which they are exposed or have rights to variable returns in order to determine if entities, other than wholly owned entities, need to be consolidated as result of controlling them under the new control definition. Although there is no impact as to entities that need to be consolidated, new disclosures are required by IFRS 12.
IFRS 11 Joint Arrangements. IFRS 11 removes the option to account for jointly controlled entities using proportionate consolidation. Instead, the entity that meets the definition of a joint venture under IFRS 11 must be accounted for using the equity method.
101
Table of Contents
Based on the above, the Bank has performed a review of its investment in Servipag Ltda. and Artikos Chile S.A. and has determined that these qualify as joint ventures. These entities were previously recorded under the equity method; therefore, there is no accounting impact. As result of the adoption of IFRS 12, some new disclosures are required for joint ventures.
IFRS 12 Disclosure of Interest in Other Entities. IFRS 12 sets out the requirements for disclosures relating to an entity’s interests in subsidiaries, joint arrangements, associates and structured entities. As mentioned above, the Bank has expanded and included new disclosures required by IFRS 12 for associates, joint arrangements and structured entities on this interim period, as none of these disclosure requirements are applicable for interim condensed consolidated financial statements, unless required by significant events or transactions in the interim period.
IFRS 13 Fair Value Measurement. IFRS 13 establishes a single source of guidance under IFRS for all fair value measurements. IFRS 13 does not change when an entity is required to use fair value, but rather provides guidance on how to measure fair value under IFRS when fair value is required or permitted. The application of IFRS 13 has impacted fair value measurements related to derivatives by including the Bank’s own credit risk (commonly referred as to “Debit Value Adjustment”).
IAS 19 Employee Benefits. IAS 19 includes a number of amendments to the accounting for defined benefit plans, including actuarial gains and losses that are now recognized in Other Comprehensive Income (OCI) and permanently excluded from profit and loss; expected returns on plan assets that are no longer recognized in profit or loss, instead, there is a requirement to recognize interest on the net defined benefit liability (asset) in profit or loss, calculated using the discount rate used to measure the defined benefit obligation; and, unvested past service costs are now recognized in profit or loss at the earlier of when the related restructuring or termination costs are recognized.
Results of Operations for the Years Ended December 31, 2011, 2012 and 2013
The consolidated financial information presented in this section for the years ended December 31, 2011, 2012 and 2013 has been audited and prepared in accordance with IFRS. In addition, to the extent that it is available and because we believe it is useful in analyzing our results, we have included information classified by the business segments that we use for internal reporting purposes. As mentioned earlier, information about our business segments is reported under our internal reporting policies, which differ in significant respects from IFRS.
Net Income
The following table sets forth the principal components of our net income, as detailed in our audited consolidated financial statements for the years ended December 31, 2011, 2012 and 2013:
| For the Year Ended December 31, | % Increase (Decrease) | |||||||||||||||||||
| IFRS: | 2011 | 2012 | 2013 | 2011/2012 | 2012/2013 | |||||||||||||||
| (in millions of Ch$, except percentages) | ||||||||||||||||||||
|
Net interest income |
877,475 | 964,137 | 1,061,571 | 9.9 | % | 10.1 | % | |||||||||||||
|
Net fees and commissions income |
290,108 | 287,272 | 287,093 | (1.0 | ) | (0.1 | ) | |||||||||||||
|
Other income (loss), net |
74,863 | 72,222 | 130,013 | (3.5 | ) | 80.0 | ||||||||||||||
|
Provisions for loan losses |
(146,925 | ) | (166,420 | ) | (221,653 | ) | 13.3 | 33.2 | ||||||||||||
|
Operating expenses |
(595,000 | ) | (612,934 | ) | (619,530 | ) | 3.0 | 1.1 | ||||||||||||
|
Income attributable to associates |
3,054 | (468 | ) | 1,780 | — | — | ||||||||||||||
|
|
|
|
|
|
|
|
|
|
|
|||||||||||
|
Income before income taxes |
503,575 | 543,809 | 639,274 | 8.0 | 17.6 | |||||||||||||||
|
Income taxes |
(65,431 | ) | (63,928 | ) | (89,085 | ) | (2.3 | ) | 39.4 | |||||||||||
|
|
|
|
|
|
|
|
|
|
|
|||||||||||
|
Net income |
438,144 | 479,881 | 550,189 | 9.5 | % | 14.7 | % | |||||||||||||
|
|
|
|
|
|
|
|
|
|
|
|||||||||||
102
Table of Contents
2012 and 2013 . During 2013 our net income was Ch$550,189 million, increasing by 14.7% as compared to the Ch$479,881 million recorded in 2012. The annual increase in net income was primarily the result of:
| • |
Sustained loan growth and stable lending spreads in all of our targeted segments. During 2013 we selectively expanded our loan book by prioritizing those segments with a favorable risk-return relationship. On the whole, our average balances of total loans increased by 9.9% in 2013. This annual advance was primarily focused on a 12.2% annual increase in average loans managed by our Retail Banking segment while average loans handled by our Wholesale Banking segment recorded a 5.5% annual increase in 2013. These expansions are in line with our strategic priorities but also with market conditions, such as strong competition within the corporate segment. Together with these trends in loans and given our selective growth, we were also able to slightly increase our average lending spreads. |
| • |
Higher contribution from non-interest bearing liabilities as a result of increasing balances and despite recent cuts in the Central Bank’s marginal standing facility rate, which affected market rates as well. As for the former, our average balances of current accounts and demand deposits increased by 10.7% in 2013 as compared to 2012. This annual growth in non-interest bearing liabilities increased the profitability of interest earning assets and also more than offset the interest rate reductions set by the Central Bank in the marginal standing facility rate (a decrease of 50 bp in 2013). |
| • |
Higher revenues from our UF net asset position. Despite inflation (measured as UF variation) was lower in 2013 than 2012, we benefited from our UF net asset position through increasing our exposure to inflation, and, to a lesser extent, due to a positive repricing effect on interest bearing peso-denominated liabilities as a result of two consecutive cuts in the monetary policy by the end of 2013. |
| • |
Higher revenues from the management of our Treasury. Given favorable shifts in market factors, especially by the end of 2013, our Treasury was able to make profits from term gapping, liabilities repricing and the management of our investment portfolio. |
The factors mentioned above were partly offset by a 33.2% annual increase in provisions for loan losses that was prompted by: (i) the previously mentioned loan growth, (ii) the devaluation of the Chilean peso that negatively impacted our U.S.$-denominated provisions for loan losses (although this effect was mostly offset by a hedging asset position whose revenues are recognized under other income (loss) net), and (iii) credit deterioration linked to specific wholesale customers and—to a lesser extent—the SME business. The increase in provisions for loan losses went along with an annual increase of 39.4% in income taxes, owing to both the 17.6% annual increase in income before income tax in 2013 as compared to 2012 and also to a low basis for comparison, since in 2012 we recognized non-recurring tax benefits associated with our deferred taxes as a result of an increase in the statutory corporate tax rate.
2011 and 2012 . Our net income was Ch$479,881 million in 2012, which represents a 9.5% increase as compared to the figure recorded a year earlier. Our net income for 2012 is especially notable in light of the low inflationary environment observed in 2012 and its effect on our net asset position indexed to inflation. The main drivers that influenced the net income increase were:
| • |
Strong annual growth in our loan book, especially in the more profitable segments, such as individual (personal) and SME banking. Overall, the average balance of total loans increased 13.5% in 2012, which was composed of 17.1% and 10.5% increases in the average balances of total loans in our retail (individuals and SMEs) and wholesale (large companies and corporations) banking segments, respectively. The annual expansion in the average balance of total loans was also accompanied by a slight increase in lending spreads. |
| • |
Our leading market position in non-interest bearing current accounts and demand deposits, reflected in a 8.5% annual increase in average balances, was supplemented by nominal interest rates that were slightly above 2011 figures due to a monetary policy interest rate that averaged 5.0% in 2012 as compared to an average of 4.7% in 2011. Income attributable to this funding source increased in 2012 when compared to 2011. |
103
Table of Contents
| • |
A decrease in income taxes due to the tax benefits associated with deferred taxes that were caused by the tax reform passed in 2012. This reform increased the Chilean corporate tax rate that was originally set at 18.5% for 2012 (and 17.0% from 2013) to 20.0% for 2012 and thereafter. This issue resulted in a one-time positive effect of approximately Ch$9,029 million in deferred taxes. |
| • |
Higher revenues from trading in fixed-income and derivative securities, which allowed as to offset lower income from the management of our available-for-sale portfolio. |
The drivers behind the increase in net income also effectively offset some of the negative forces that affected our business operations in 2012, including: (i) inflation that remained below market expectations and also below the variation observed in the CPI during 2011, which negatively impacted the contribution to our UF net asset position, (ii) a flattened yield curve that reduced the possibilities of term spread arbitrage (term gapping), (iii) a 13.3% increase in provisions for loan losses due to the loan book expansion, particularly in the retail banking segment, and a moderate deterioration in credit quality across the industry, especially during the first half of 2012, and (iv) a 1.0% drop in fees and commissions.
Net Interest Income
The tables included under the headings “—Interest Revenue” and “—Interest Expense” set forth information regarding our consolidated interest revenue and expenses, average interest earning assets and average interest bearing liabilities for the years ended December 31, 2011, 2012 and 2013. This information is derived from tables included elsewhere in this annual report under “Item 4. Information on the Company—Selected Statistical Information” and is qualified in its entirety by reference to such information.
| For the Year Ended December 31, | % Increase (Decrease) | |||||||||||||||||||
| IFRS: | 2011 | 2012 | 2013 | 2011/2012 | 2012/2013 | |||||||||||||||
| (in millions of Ch$, except percentages) | % | |||||||||||||||||||
|
Interest revenue |
Ch$ | 1,501,684 | Ch$ | 1,672,766 | Ch$ | 1,765,942 | 11.4 | % | 5.6 | % | ||||||||||
|
Interest expense |
(624,209 | ) | (708,629 | ) | (704,371 | ) | 13.5 | (0.6 | ) | |||||||||||
|
|
|
|
|
|
|
|
|
|
|
|||||||||||
|
Net interest income |
877,475 | 964,137 | 1,061,571 | 9.9 | % | 10.1 | % | |||||||||||||
|
|
|
|
|
|
|
|
|
|
|
|||||||||||
|
Net interest margin (1)(2) |
4.80 | % | 4.68 | % | 4.67 | % | — | — | ||||||||||||
| (1) | Net interest income divided by average interest-earning assets. The average balances for interest-earning assets, including interest readjustments, were calculated on the basis of our daily balances and on the basis of monthly balances for our subsidiaries. |
| (2) | Net interest margin does not include the interest earned on trading securities, which is accounted for under Other Income (Loss) Net. |
2012 and 2013. Our net interest income amounted to Ch$1,061,571 million in 2013, which outperformed by 10.1% the Ch$964,137 million recorded a year earlier. This annual increase was principally the result of:
| • |
The previously mentioned expansion in our loan book. Our average balances of total loans increased by 9.9% in 2013 as compared to 2012. This expansion was focused on those segments where we still have room to grow and —more importantly— in which the risk-return equation is favorable. Accordingly, our loan growth was largely fostered by a 12.2% growth in average loans of our Retail Banking segment, especially linked to a 13.1% annual expansion in middle and upper income personal banking, in conjunction with a 12.6% annual increase in SMEs. In the Wholesale Banking segment, the overall growth of 5.5% in average loans was principally prompted by a 14.2% rise in average loans associated with our Large Companies and Real Estate Division (Middle Market). These drivers enabled us to more than offset an annual slight decrease in loans granted to Corporations and a slowdown in average loans to our lower income individual segment. Altogether, we increased our revenues from loans by approximately Ch$59,700 million in 2013 as compared to 2012. |
104
Table of Contents
| • |
Higher contribution from our non-interest bearing liabilities. Based on a 10.7% annual increase in average balances of current accounts and demand deposits, we were able to completely offset the effect of lower nominal interest rates following two consecutive cuts of 25 basis points in the marginal standing facility rate by the end of 2013. Accordingly, greater balances of these liabilities resulted in higher profitability for our balance sheet, which translated into higher benefits by approximately Ch$23,400 million in 2013 as compared to 2012. |
| • |
A more favorable scenario for our UF net asset position. Despite the UF increase of 2.05% in 2013 as compared to an increase of 2.45% in 2012, we benefited from an enlarged exposure to UF and more convenient funding for the portion of these assets funded with Ch$-denominated liabilities given the decrease in nominal interest rates towards the end of 2013. Higher revenues from our UF net asset position amounted to approximately Ch$17,600 million in 2013 as compared to 2012. |
As mentioned, an important part of the increase in net interest income was fostered by more accessible funding based on: (i) our leading market position in non-interest bearing liabilities, (ii) our high credit ratings that translated into low risk premiums for our international debt placements and (iii) a positive repricing effect given the decrease in short-term interest rates towards the end of 2013. This allowed us to more than offset lower revenues from our time deposits and saving accounts by approximately Ch$1,100 million and a yield curve that remained almost flat in 2013, despite the steepening observed towards the end of 2013.
On the whole, despite the 10.1% annual increase in net interest income, our net interest margin experienced a slight annual decrease of one basis point, from 4.68% in 2012 to 4.67% in 2013. This was principally the result of a proportionally higher increase in interest earning assets (10.3% on an annual basis), especially average balances of total loans that grew by 9.9% in 2013 as compared to 2012, and average balances of financial investments (including Available-for-Sale and Held-for-Trading securities) that increased by 11.4% on a yearly basis. As for the latter, it is important to mention that interest accrued on trading securities is not recognized as interest revenue.
2011 and 2012 . In 2012 our net interest income was Ch$964,137 million, which represented a 9.9% increase from the Ch$877,475 million in 2011. This annual increase was primarily caused by:
| • |
An average balance of total loans that increased by 13.5%. This increase was primarily caused by average balances of retail banking segment loans that recorded a 17.1% annual expansion and, to a lesser extent, loans granted to our wholesale banking segment whose average balances increased by 10.5%. This greater business scale, together with slightly higher lending spreads, translated into an increase in revenues from loans of approximately Ch$78,360 million in 2012 as compared to 2011. |
| • |
Current accounts and demand deposits that continue to be an important and attractive funding source for our operations, based on average balances that increased 8.5% in 2012 and a monetary policy interest rate that remained at 5.0% in 2012 as compared to an average of 4.7% in 2011. These factors resulted in higher revenues from current accounts and demand deposits of approximately Ch$31,650 million in 2012 as compared to 2011. |
The above-mentioned factors were strongly linked to our core business activities and allowed us to effectively offset the negative impact of lower inflation on the UF net asset position. In 2012, the contribution of our UF net asset position decreased Ch$34,960 million as compared to 2011, due to a combination of: (i) inflation that (measured as UF variation) increased 2.5% in comparison with 3.9% a year earlier, (ii) higher nominal interest rates in 2012 that translated into an increased funding cost for the portion of such assets that is financed with Chilean peso liabilities, and (iii) a positive effect associated with a reinforced capital base caused by both higher net income and the capital increase we undertook by the end of the year. In addition, flattened yield curves also contributed to a lower net interest income by reducing term gapping possibilities.
The 9.9% annual increase in net interest income, together with a proportionally higher annual increase of 12.7% in average interest earning assets, resulted in a slight annual decrease in our net interest margin (on average interest earning assets) from 4.80% in 2011 to 4.68% in 2012.
105
Table of Contents
Interest Revenue
The following table sets forth information regarding our interest revenue and average interest earning assets for the years ended December 31, 2011, 2012 and 2013:
| For the Year Ended December 31, | % Increase (Decrease) | |||||||||||||||||||
| 2011 | 2012 | 2013 | 2011/2012 | 2012/2013 | ||||||||||||||||
| IFRS: | (in millions of Ch$, except percentages) | % | ||||||||||||||||||
|
Interest revenue |
Ch$ | 1,501,684 | Ch$ | 1,672,766 | Ch$ | 1,765,942 | 11.4 | % | 5.6 | % | ||||||||||
|
Average interest earning assets: |
||||||||||||||||||||
|
Commercial loans |
10,332,183 | 11,476,946 | 12,477,510 | 11.1 | 8.7 | |||||||||||||||
|
Residential mortgage loans |
3,233,830 | 3,924,080 | 4,455,850 | 21.3 | 13.6 | |||||||||||||||
|
Consumer loans |
2,334,914 | 2,654,234 | 2,909,832 | 13.7 | 9.6 | |||||||||||||||
|
|
|
|
|
|
|
|
|
|
|
|||||||||||
|
Total loans |
15,900,927 | 18,055,260 | 19,843,192 | 13.5 | 9.9 | |||||||||||||||
|
|
|
|
|
|
|
|
|
|
|
|||||||||||
|
Deposits in Central Bank |
334,991 | 370,298 | 396,272 | 10.5 | 7.0 | |||||||||||||||
|
Repurchase agreements |
85,087 | 42,109 | 27,382 | (50.5 | ) | (35.0 | ) | |||||||||||||
|
Financial investments |
1,562,251 | 1,748,349 | 1,946,975 | 11.9 | 11.4 | |||||||||||||||
|
Loans and advance to banks |
393,579 | 381,578 | 496,870 | (3.0 | ) | 30.2 | ||||||||||||||
|
|
|
|
|
|
|
|
|
|
|
|||||||||||
|
Total |
Ch$ | 18,276,835 | Ch$ | 20,597,594 | Ch$ | 22,710,691 | 12.7 | % | 10.3 | % | ||||||||||
|
|
|
|
|
|
|
|
|
|
|
|||||||||||
|
Average rates earned on total interest earning assets (1)(2) : |
||||||||||||||||||||
|
Average nominal rates |
8.22 | % | 8.12 | % | 7.78 | % | — | — | ||||||||||||
| (1) | See “Item 4. Information on the Company—Selected Statistical Information—Average Balance Sheets, Interest Earned on Interest Earning Assets and Interest Paid on Interest Bearing Liabilities.” |
| (2) | Average rates earned on interest earning assets do not include the interest earned on trading securities, which is accounted for under Other Income (Loss) Net. |
2012 and 2013 . Our interest revenues recorded a 5.6% annual increase in 2013 as compared to 2012. This annual increase was primarily due to loan expansion (9.9% in average balances), especially focused on middle and upper income personal banking, SMEs and Middle Market Companies, with average loans to these segments increasing 13.1%, 12.6% and 14.2%, respectively. Despite the positive effect associated with loan growth, we recorded a decrease in the average yield of our interest earning assets, from 8.12% in 2012 to 7.78% in 2013. This annual decrease was mainly associated with: (i) lower UF variation (2.05% in 2013 as compared to 2.45% in 2012) that negatively impacted the interest earned on UF-denominated assets and (ii) reduced mid and long-term nominal interest rates, which impacted the interest earned on Ch$-denominated assets. Lastly, increasing balances of assets Available-for-Sale and Held-for-Trading also contributed to a lower yield, as interest accrued on trading securities is not fully allocated in this line item.
2011 and 2012 . The 11.4% annual increase in our interest revenue was mainly fostered by a 12.7% annual increase in average interest earning assets that, in turn, was primarily prompted by a 13.5% annual growth in the average balance of total loans, especially those associated with our retail banking segment (e.g., residential mortgage and consumer loans granted to individuals, as well as commercial loans granted to SMEs). These positive factors allowed us to effectively offset the negative effect of a 1.4% drop in the UF (from 3.9% in 2011 to 2.5% in 2012) that negatively impacted the interest earned on UF-denominated assets. This effect was amplified by a decrease in mid and long-term nominal interest rates that affected the interest earned on Ch$-denominated assets. On the whole, the yield of our average interest earning assets decreased 10 bp, from 8.22% in 2011 to 8.12% in 2012.
106
Table of Contents
Interest Expense
The following table sets forth information regarding our interest expense and average interest bearing liabilities for the years ended December 31, 2011, 2012 and 2013:
| For the Year Ended December 31, | % Increase (Decrease) | |||||||||||||||||||
| 2011 | 2012 | 2013 | 2011/2012 | 2012/2013 | ||||||||||||||||
| IFRS: | (in millions of Ch$, except percentages) | % | ||||||||||||||||||
|
Interest expense |
Ch$ | 624,209 | Ch$ | 708,629 | Ch$ | 704,371 | 13.5 | % | (0.6 | )% | ||||||||||
|
|
|
|
|
|
|
|
|
|
|
|||||||||||
|
Average interest-bearing liabilities: |
||||||||||||||||||||
|
Saving accounts and time deposits (1) |
8,450,231 | 9,380,123 | 9,842,483 | 11.0 | 4.9 | |||||||||||||||
|
Securities under agreements to repurchase |
218,847 | 286,944 | 289,107 | 31.1 | 0.8 | |||||||||||||||
|
Borrowings from financial institutions |
1,715,417 | 1,435,362 | 1,201,866 | (16.3 | ) | (16.3 | ) | |||||||||||||
|
Debt issued |
1,994,679 | 2,838,170 | 3,771,209 | 42.3 | 32.9 | |||||||||||||||
|
Other financial obligations |
168,858 | 170,977 | 173,868 | 1.3 | 1.7 | |||||||||||||||
|
|
|
|
|
|
|
|
|
|
|
|||||||||||
|
Total |
Ch$ | 12,548,032 | Ch$ | 14,111,576 | Ch$ | 15,278,533 | 12.5 | % | 8.3 | % | ||||||||||
|
|
|
|
|
|
|
|
|
|
|
|||||||||||
|
Average rates paid on total interest bearing liabilities (2) : |
||||||||||||||||||||
|
Average nominal rates |
4.97 | % | 5.02 | % | 4.61 | % | — | — | ||||||||||||
|
Average (Chilean peso-denominated) non-interest bearing current account and demand deposits |
4,540,335 | 4,926,475 | 5,455,342 | 8.5 | % | 10.7 | % | |||||||||||||
| (1) | Includes interest-earning demand deposits. |
| (2) | See “Item 4. Information on the Company—Selected Statistical Information—Average Balance Sheets, Interest Earned on Interest Earning Assets and Interest Paid on Interest Bearing Liabilities.” |
2012 and 2013 . Our interest expense decreased by 0.6% on an annual basis, from Ch$708,629 million in 2012 to Ch$704,371 million in 2013. This annual decrease was driven by effective management of our funding structure, brand recognition and also favorable shifts in market factors. As for the former, since 2011 we have promoted an increasing diversification of our liability structure by issuing debt internationally in various markets. Under this strategy, our overseas debt placements amounted to approximately U.S.$1,120 million in 2013 and bore low risk premiums given our high credit rating. In addition, based on our brand recognition and reliability among customers and non-customers, we recorded a 10.7% annual increase in average balances of current accounts and demand deposits, which provides us with a convenient source of funding. In this regard, an enlarged capital base in 2013 also contributed to reduce the cost of funding for our interest earning assets. Lastly, the lower interest expense was also the result of a positive repricing effect on our short-term interest bearing peso-denominated liabilities due to the drop in short-term interest rates towards the end of 2013. All of these factors collectively resulted in a decrease in the average nominal interest rate paid on our interest bearing liabilities from 5.02% in 2012 to 4.61% in 2013.
2011 and 2012 . Our net interest expense recorded a 13.5% annual increase, from Ch$624,209 million in 2011 to Ch$708,629 million in 2012, which was higher than the increase experienced by our interest revenue. The increase in interest expense was primarily caused by: (i) higher nominal interest rates paid by banks on short-term deposits in 2012 as compared to 2011 that were supplemented by an 11.0% annual increase in the average balances of savings accounts and time deposits, and (ii) a funding structure that has increasingly incorporated long-term funding sources, especially funds associated with international and local debt placements. As for the latter, our balance of debt issued went up 42.3% in 2012 as compared to 2011. All of these factors collectively resulted in a 5 bp increase in cost of funding from interest bearing liabilities, from 4.97% in 2011 to 5.02% in 2012.
107
Table of Contents
Net Fees and Commissions Income
The following table sets forth certain components of our fees and commissions income (net of fees paid to third parties that provide support for those services) for the years ended December 31, 2011, 2012 and 2013:
| Year Ended December 31, | % Increase (Decrease) | |||||||||||||||||||
| IFRS: | 2011 | 2012 | 2013 | 2011/2012 | 2012/2013 | |||||||||||||||
| (in millions of Ch$, except percentages) | ||||||||||||||||||||
|
Mutual funds |
Ch$ | 63,809 | Ch$ | 56,043 | Ch$ | 54,833 | (12.2 | )% | (2.2 | )% | ||||||||||
|
Insurance |
59,171 | 60,481 | 62,378 | 2.2 | 3.1 | |||||||||||||||
|
Current accounts, overdrafts, credit lines and credit cards |
57,456 | 61,442 | 55,824 | 6.9 | (9.1 | ) | ||||||||||||||
|
Sight accounts and ATMs |
26,028 | 28,521 | 28,896 | 9.6 | 1.3 | |||||||||||||||
|
Stock brokerage |
21,246 | 10,236 | 10,067 | (51.8 | ) | (1.7 | ) | |||||||||||||
|
Collection of over-due loans |
18,144 | 20,670 | 22,998 | 13.9 | 11.3 | |||||||||||||||
|
Cash management services |
13,746 | 14,443 | 14,570 | 5.1 | 0.9 | |||||||||||||||
|
Letters of credit, guarantees, collateral and other contingent loans |
11,885 | 13,038 | 15,703 | 9.7 | 20.4 | |||||||||||||||
|
Custody and trust services |
5,695 | 6,671 | 7,070 | 17.1 | 6.0 | |||||||||||||||
|
Foreign trade and currency exchange |
5,387 | 6,005 | 7,234 | 11.5 | 20.5 | |||||||||||||||
|
Financial advisory services |
3,186 | 3,955 | 4,054 | 24.1 | 2.5 | |||||||||||||||
|
Credits and factoring |
4,476 | 4,562 | 2,203 | 1.9 | (51.7 | ) | ||||||||||||||
|
Collection services |
1,227 | 1,155 | 779 | (5.9 | ) | (32.6 | ) | |||||||||||||
|
Teller services expenses |
(1,020 | ) | 143 | 731 | (114.0 | ) | 411.2 | |||||||||||||
|
Credit pre-evaluation services |
(2,613 | ) | (2,223 | ) | (2,251 | ) | (14.9 | ) | 1.3 | |||||||||||
|
Other |
2,285 | 2,130 | 2,004 | (6.8 | ) | (5.9 | ) | |||||||||||||
|
|
|
|
|
|
|
|
|
|
|
|||||||||||
|
Total |
Ch$ | 290,108 | Ch$ | 287,272 | Ch$ | 287,093 | (1.0 | )% | (0.1 | )% | ||||||||||
|
|
|
|
|
|
|
|
|
|
|
|||||||||||
2012 and 2013 . Our net fees and commissions income remained almost flat on a yearly basis, amounting to Ch$287,093 million in 2013 as compared to Ch$287,272 million in 2012, which represents a slight 0.1% annual decrease. The slight annual decrease in net fees and commissions was primarily the consequence of:
| • |
A decrease in net fees and commissions related to traditional lending activities. In this regard, we recognized mixed forces affecting the business. On the positive side, we experienced an annual increase of 20.4% (or Ch$2,665 million) in net fees and commissions income from contingent loans (letters of credit, guarantees, collateral and other contingent loans), an increase of 11.3% (or Ch$2,328 million) in income from the collection of overdue loans and an increase of 20.5% (or Ch$1,229 million) in net fees from foreign trade and currency exchange. All of these positive trends were the result of our significant growth in Large Companies & Real Estate (annual turnover between Ch$1,600 and Ch$70,000 million), as well as SMEs, since significant portion of these companies are engaged in foreign trade transactions and working capital borrowings that normally involve letters of credit and guarantees. As for collection services, during 2013 we witnessed some signs of economic slowdown that led us to tighten the whole credit process (from assessment to collection), especially in those segments that are more exposed to macroeconomic fluctuations. |
| • |
On the negative side, we experienced annual decreases of 9.1% (or Ch$5,618 million) in fees and commissions from transactional services (current accounts, overdrafts, credit lines and credit cards) and 51.7% (or Ch$2,359 million) in fees from credits and factoring. In this regard, lower fees and commissions from transactional services are mainly explained by a negative exchange rate effect on net fees from credit cards (as expenses of customer loyalty programs are denominated in U.S.$) due to the Chilean-peso devaluation of 9.6% in 2013 and the appreciation of 7.8% in 2012. As for fees and commissions from credits and factoring, the decrease is explained by a similar trend in year-end balances for factoring loans due to strong competition from other banking players. As a result of the regulation introduced towards the end of 2013, fees associated with transactional services (including current accounts, credit lines, credit cards, etc.) remained almost flat in 2013. See “Item 4. Information on the Company—Regulation and Supervision—Consumer-oriented Regulation”. |
108
Table of Contents
| • |
Fees and commissions associated with specialized financial services were also affected by mixed forces. Firstly, we experienced a 3.1% (or Ch$1,897 million) annual increase in fees and commissions from insurance brokerage. This was mainly attributable to an annual increase of 4.0% in written premiums and improved value offerings intended to offset the recent regulatory changes affecting the margin of the business. Conversely, net fees and commissions from our mutual funds business decreased by 2.2% (or Ch$1,210 million) on an annual basis. This was principally the result of unfavorable customer preferences, given the local and global macro scenario, rather than growth in assets under management (“AUM”). In fact, we continued to lead the market in terms of AUM by posting a 3.8% annual advance in balances and reaching a market share of 21.3% as of Dec. 31, 2013. However, since 2010 we have seen market trends associated with volatile stock markets that have encouraged investors to look for havens in fixed-income securities, which bear lower commissions than mutual funds invested in stocks. |
2011 and 2012 . Our net fees and commissions experienced a slight 1.0% annual decrease, from Ch$290,108 million in 2011 to Ch$287,272 million in 2012. The slight annual decrease in net fees and commissions is explained by:
| • |
A decrease in fees and commissions from activities related to specialized financial services, such as securities brokerage and mutual funds, caused by investors that sought havens in fixed-income securities amid still uncertain stock markets and reduced opportunities for profiting in the short-term. Accordingly, stock brokerage fees suffered a 51.8% (or Ch$11,010 million) annual decrease due to a 40.8% annual reduction in stock trading turnover for transactions handled by our securities brokerage subsidiary. Similarly, fees and commissions from mutual funds management decreased 12.2% (or Ch$7,766 million), mainly due to portfolios that were rebalanced towards fixed-income securities by their holders. These trends were partly offset by a 2.2% (or Ch$1,310 million) annual increase in fees and commissions coming from our insurance brokerage business, as well as an annual increase of 24.1% (or Ch$769 million) associated with fee-based income from financial advisory. |
| • |
The decrease in fee income from specialized financial services was partly counterbalanced by higher fees and commissions income associated with the traditional banking business. In this regard, we experienced a 9.6% (or Ch$2,493) increase in fee income from sight accounts and ATMs in 2012 as compared to 2011. This is consistent with a higher volume of transactions based on an economic cycle that was characterized by low unemployment, rising real salaries and higher household spending, as well as our higher penetration of our banking services in the lower and middle income segments. Also our expansion in transactional services and loans resulted in fees and commissions income from collection of overdue loans that increased 13.9% (or Ch$2,526 million) on an annual basis. Also, following the positive economic cycle and our focus on Middle Market companies, we recorded higher fee-based income from contingent loans (letters of credit, guarantees, collateral and other contingent loans) that increased by 9.7% (or Ch$1,153 million) on an annual basis, which went along with an increase of 11.5% (or Ch$618 million) in fees and commissions from foreign trade and currency exchange. Last but not least, we recorded an increase of 17.1% (or Ch$976 million) in fees and commissions from custody and trust services, together with a rise of 5.1% (or Ch$697 million) in cash management services. Both of these services were also strongly linked to our higher penetration of Middle Market companies. |
Other Income (Loss), Net
Other income (loss), net, consists of net gains and losses from financial operating income, net gains and losses from foreign exchange transactions and other operating income. Financial operating income results include gains and losses realized on the sale of securities, gains and losses from marking to market of securities and interest rate and currency derivatives at the end of the period. Net gains and losses from foreign exchange transactions include gains and losses realized upon the sale of foreign currency and foreign exchange derivatives and gains and losses arising from the period-end translation of foreign currency denominated assets and liabilities into pesos. Foreign exchange results also include net adjustments on U.S. dollar-indexed domestic currency transactions and existing interest rate differences in currency derivatives.
109
Table of Contents
The following table sets forth certain components of our other income (loss), net, for the years ended December 31, 2011, 2012 and 2013:
| For the Year Ended December 31, | % Increase (Decrease) | |||||||||||||||||||
| IFRS: | 2011 | 2012 | 2013 | 2011/2012 | 2012/2013 | |||||||||||||||
| (in millions of Ch$, except percentages) | % | |||||||||||||||||||
|
Net financial operating income |
||||||||||||||||||||
|
Interest accrued on trading securities |
Ch$ | 10,366 | Ch$ | 10,683 | Ch$ | 17,668 | 3.1 | % | 65.4 | % | ||||||||||
|
Gains on sales and mark to market |
6,353 | 8,497 | 21,843 | 33.7 | 157.1 | |||||||||||||||
|
Gains (losses) on derivatives contracts |
40,024 | (3,001 | ) | (7,126 | ) | — | 137.5 | |||||||||||||
|
Gains (losses) from sales of loans |
1,358 | 20 | 287 | (98.5 | ) | 1,335.0 | ||||||||||||||
|
|
|
|
|
|
|
|
|
|
|
|||||||||||
|
Total net financial operating (loss) income |
58,101 | 16,199 | 32,672 | (72.1 | ) | 101.7 | ||||||||||||||
|
Foreign exchange transactions, net |
(7,973 | ) | 35,136 | 71,457 | — | 103.4 | ||||||||||||||
|
Other operating income |
24,735 | 20,887 | 25,884 | (15.6 | ) | 23.9 | ||||||||||||||
|
|
|
|
|
|
|
|
|
|
|
|||||||||||
|
Total |
Ch$ | 74,863 | Ch$ | 72,222 | Ch$ | 130,013 | (3.5 | )% | 80.0 | % | ||||||||||
|
|
|
|
|
|
|
|
|
|
|
|||||||||||
2012 and 2013. In 2013, our other income (loss), net amounted to Ch$130,013 million, which was 80.0% above the Ch$72,222 million recorded in 2012. This annual increase was principally associated with:
| • |
Higher revenues from the management of our investment portfolio that rose from Ch$19,200 million in 2012 (including interest earned on trading securities of Ch$10,683 million, gains on sales and marking-to-market of Ch$8,497 million and gains from sales of loans of Ch$20 million) to Ch$39,798 million in 2013 (including interest earned on trading securities of Ch$17,668 million, gains on sales and marking-to-market of Ch$21,843 million and gains from sales of loans of Ch$287 million). In this regard, our Treasury was very proactive in exploiting favorable shifts in market factors, especially those associated with lower international interest rates due to reduced risk premiums worldwide. Also, we benefited from the sale of Master Card shares by approximately Ch$4,850 million. |
| • |
Higher income from derivative contracts, net of foreign exchange transactions, which rose from Ch$32,135 million (including losses on derivatives contracts of Ch$3,001 million and gains in foreign exchange transactions of Ch$35,136 million) in 2012 to Ch$64,331 million (including losses on derivatives contracts of Ch$7,126 million that were more than offset by gains in foreign exchange transactions of Ch$71,457 million) in 2013. This increase in these kinds of revenues had mainly to do with higher income associated with the asset position that hedges our exposure to provisions for loan losses and general expenses denominated in US$. In fact, this hedging position benefited from a 9.6% increase in the Ch$/US$ exchange rate in 2013 as compared to a decrease of 7.8% in 2012, which translated into a favorable increase variance of approximately Ch$17,600 million. |
2011 and 2012. Our other income (loss), net recorded a 3.5% annual decrease, from Ch$74,863 million in 2011 to Ch$72,222 million in 2012. This decrease was mainly caused by:
| • |
Results from the management of our investment portfolio that recorded a 6.2% annual increase, from Ch$18,077 in 2011 (including interest earned on trading securities of Ch$10,366 million, gains on sales and marking-to-market of Ch$6,353 million and gains from sales of loans of Ch$1,358 million) to Ch$19,200 million in 2012 (including interest earned on trading securities of Ch$10,683 million, gains on sales and marking-to-market of Ch$8,497 million and gains from sales of loans of Ch$20 million). The increase in results from the management of the investment portfolio was primarily due to the efforts of our Treasury exploit trading opportunities in fixed income, which enabled us to effectively offset lower revenues from our available-for-sale portfolio as a result of reduced sales and the negative impact of low inflation on interest earned. |
110
Table of Contents
| • |
Income from derivative contracts, net of foreign exchange transactions, that recorded a slight 0.3% annual increase from Ch$32,051 million in 2011 (including gains on derivatives contracts of Ch$40,024 million and losses in foreign exchange transactions of Ch$7,973 million) to Ch$32,135 million (including losses on derivatives contracts of Ch$3,001 million and gains in foreign exchange transactions of Ch$35,136 million), mainly due to favorable market conditions at the close of certain positions that enabled us to efficiently offset a negative exchange rate effect on the hedge of our provisions for loan losses and general expenses denominated in U.S.$, due to a 7.8% appreciation of the Chilean peso in relation to the U.S. dollar in 2012 as compared to a 11.0% depreciation of the Chilean peso in 2011. |
| • |
A 15.6% annual decrease in other operating income, due to a decrease in other general revenues. |
Provisions for Loan Losses
We recognize allowances to cover possible credit losses in accordance with IFRS as issued by the IASB. For statistical information with respect to our substandard loans and allowances for loan losses, see “Item 4. Information on the Company—Selected Statistical Information” and Note 11(b) to our audited consolidated financial statements as of and for the year ended December 31, 2013. According to regulations applicable to such periods, the amount of provisions charged to income in any period consists of net provisions for possible loan losses.
The following table sets forth information with respect to our provisions and allowances for loan losses and charge-offs for each of the years ended December 31, 2011, 2012 and 2013:
| For the Year Ended December 31, | % Increase (Decrease) | |||||||||||||||||||
| IFRS: | 2011 | 2012 | 2013 | 2011/2012 | 2012/2013 | |||||||||||||||
| (in millions of Ch$, except percentages) | % | |||||||||||||||||||
|
Provisions: |
||||||||||||||||||||
|
Gross provisions for loan losses |
192,580 | 207,382 | 264,608 | 7.7 | % | 27.6 | % | |||||||||||||
|
Total loan loss recoveries |
45,655 | 40,962 | 42,955 | (10.3 | ) | 4.9 | ||||||||||||||
|
Net provisions for loan losses |
Ch$ | 146,925 | Ch$ | 166,420 | Ch$ | 221,653 | 13.3 | 33.2 | ||||||||||||
|
Charge-offs: |
||||||||||||||||||||
|
Total charge-offs |
177,960 | 182,733 | 196,535 | 2.7 | 7.6 | |||||||||||||||
|
Net charge-offs |
132,305 | 141,771 | 153,580 | 7.2 | 8.3 | |||||||||||||||
|
Other asset quality data: |
||||||||||||||||||||
|
Total loans |
Ch$ | 17,386,497 | Ch$ | 18,771,761 | Ch$ | 20,880,770 | 8.0 | 11.2 | ||||||||||||
|
Allowances for loan losses |
362,741 | 387,803 | 439,298 | 6.9 | % | 13.3 | % | |||||||||||||
|
Allowances for loan losses as a percentage of total loans |
2.09 | % | 2.07 | % | 2.10 | % | — | — | ||||||||||||
|
Provisions for loan losses as a percentage of average loans |
0.92 | % | 0.92 | % | 1.12 | % | — | — | ||||||||||||
2012 and 2013 . Our provisions for loan losses recorded a 33.2% annual increase, from Ch$166,420 million in 2012 to Ch$221,653 million in 2013. Although this annual increase was almost three times our loan growth, it can be largely explained by business drivers and changes in market variables rather than credit deterioration. The main factors explaining the annual increase in provisions for loan losses were:
| • |
Loan book expansion focused on Retail Banking, which produced an important volume effect. Our average balances of total loans grew by 9.9% in 2013 as compared to 2012. This increase was mainly supported by a 12.2% annual increase in average loans managed by our Retail Banking and—to a lesser extent—average loans handled by our Wholesale Banking segment that grew by 5.5% on an annual basis. This loan growth resulted in a volume effect on provisions for loan losses of approximately Ch$22,500 million. It is worth mentioning that this volume effect encompasses a mix effect of approximately Ch$6,000 million due to a proportionally higher expansion in retail rather than wholesale banking loans. |
111
Table of Contents
| • |
A negative exchange rate effect on provisions for loan losses linked to US$-denominated loans that are mainly focused on middle market companies. On an annual basis, the negative impact was caused by both a decrease of 7.8% in the Ch$/US$ exchange rate in 2012 as compared to a 9.6% increase in the Ch$/US$ exchange rate in 2013. Exchange rate shifts explained approximately Ch$12,800 million of the higher provisions for loan losses. |
| • |
Approximately Ch$10,400 million associated with greater provisions for loan losses that we set aside in order to recognize the deteriorated financial condition of one specific corporate customer in 2013, and—to a lesser extent—a gradual deterioration in the credit condition of the SME segment that we witnessed in 2013, in line with an economic cycle that slowed down moderately. |
Based on the above, our credit quality ratios recorded a slight deterioration in 2013 as compared to 2012. In fact, our ratio of provisions for loans losses as a percentage of average loans rose by 20 bp on an annual basis, from 0.92% in 2012 to 1.12% in 2013. By adjusting the other than loan related factors, the indicator would have slightly increased on an annual basis.
Nevertheless, it is important to mention that in 2013 we witnessed a 30.2% annual increase in the level of past-due loans, which reached a total of Ch$236,730 million as of December 31, 2013. This annual increase was principally fostered by higher delinquency in our retail banking segment, in connection with greater balances of past-due loans associated with SMEs and, to a lesser extent, individual banking. This trend was the result of an economic cycle that showed certain signs of slowdown in 2013, especially in investment rates, after three years of sustained growth, with annual GPD expansion rates above 5.0%. However, given our focus on maintaining a healthy asset quality, we have tightened the whole credit process, from assessment to collection, in order to control the overall level of delinquency in our total loan book. All in all, our delinquency ratio (past-due loans over total loans) increased from 0.97% in 2012 to 1.13% in 2013. Nevertheless, our delinquency continued to compare very favorably with that of our peers. See “Item 4. Information on the Company—Selected Statistical Information—Classification of Loan Portfolio Based on the Borrower’s Payment Performance”.
2011 and 2012 . Our provisions for loan losses recorded a 13.3% annual increase, from Ch$146,925 million in 2011 to Ch$166,420 million in 2012. On the one hand, this increase was consistent with the expansion of our loan book and our strategic priorities intended to focus on the retail banking segment. On the other hand, the rise in provisions for loan losses was also explained by specific credit quality factors that loomed in the first half of 2012. Therefore, the main forces influencing our increase in provisions for loan losses were:
| • |
A volume effect associated with a 13.5% annual increase in the average balance of total loans that was primarily focused on expanding our presence in the retail banking segment and, to a lesser extent, maintaining our leading position in the wholesale banking segment, all of which is in line with our strategic priorities. |
| • |
A portfolio-mix effect, caused by a 17.1% annual increase in the average balance of retail banking loans compared to a 10.5% annual increase in average balances of wholesale banking loans, which—on average—should result in a moderately higher credit risk for our loan book. |
| • |
Moderate credit quality deterioration during the first half of 2012 that was caused by social and regulatory issues rather than economic forces and had industry-wide effects. This deterioration particularly affected loans granted by our retail banking segment, and as a result, we were even more cautious in managing our growth by tightening our credit–assessment procedures and enhancing our collection duties. This enabled us to temper the effects of the credit quality deterioration and return to mid-term past-due indicators as from the second quarter of 2012. |
The above-mentioned factors were partially offset by a positive exchange rate effect on our provisions for loan losses linked to U.S. dollar-denominated credits, as a result of the 7.8% annual appreciation of the Chilean peso in relation to the U.S. dollar in 2012 as compared to the 11.0% depreciation of the Chilean peso in 2011.
As for our credit quality indicators, in 2012 our ratio of provisions for loans losses as a percentage of average loans remained unchanged in 0.92%, which demonstrates that the growth in credit risk charges was consistent with the expansion of our loan book and remained under control.
112
Table of Contents
Operating Expenses
The following table sets forth information regarding our operating expenses for the years ended December 31, 2011, 2012 and 2013:
| For the Year Ended December 31, | % Increase (Decrease) | |||||||||||||||||||
| 2011 | 2012 | 2013 | 2011/2012 | 2012/2013 | ||||||||||||||||
| IFRS: | (in millions of Ch$, except percentages) | % | ||||||||||||||||||
|
Personnel expenses |
317,045 | 309,865 | 323,236 | (2.3 | )% | 4.3 | % | |||||||||||||
|
Administrative expenses: |
||||||||||||||||||||
|
Advertising |
26,515 | 30,572 | 29,053 | 15.3 | (5.0 | ) | ||||||||||||||
|
Building maintenance |
28,486 | 29,332 | 28,067 | 3.0 | (4.3 | ) | ||||||||||||||
|
Rentals and insurance |
20,595 | 22,486 | 23,297 | 9.2 | 3.6 | |||||||||||||||
|
Office supplies |
6,556 | 6,346 | 8,375 | (3.2 | ) | 32.0 | ||||||||||||||
|
Other expenses |
147,767 | 158,723 | 163,710 | 7.4 | 3.1 | |||||||||||||||
|
|
|
|
|
|
|
|
|
|
|
|||||||||||
|
Total administrative expenses |
229,919 | 247,459 | 252,502 | 7.6 | 2.0 | |||||||||||||||
|
Depreciation and amortization |
35,131 | 35,146 | 27,677 | — | (21.3 | ) | ||||||||||||||
|
Impairments |
631 | 899 | 2,247 | 42.5 | 149.9 | |||||||||||||||
|
Other operating expenses |
12,274 | 19,565 | 13,868 | 59.4 | (29.1 | ) | ||||||||||||||
|
|
|
|
|
|
|
|
|
|
|
|||||||||||
|
Total |
595,000 | 612,934 | 619,530 | 3.0 | % | 1.1 | % | |||||||||||||
|
|
|
|
|
|
|
|
|
|
|
|||||||||||
2012 and 2013 . In 2013 our total operating expenses amounted to Ch$619,530 million, which represented a tempered 1.1% annual rise as compared to the Ch$612,934 million reported in 2012. This moderate increase was principally caused by:
| • |
An annual increase of 4.3% (or Ch$13,371 million) in personnel expenses, which was mainly related to the recognition of inflation in salaries and the expansion of 1.0% in headcount. Furthermore, we recorded higher other personnel expenses associated with training activities and general benefits to our staff. |
| • |
Administrative expenses that increased by 2.0% (or Ch$5,043 million) on an annual basis, principally as a consequence of: (i) office supplies expenses that increased by 32.0% (or Ch$2,026 million) on a yearly basis, mainly related to the purchase of password-generating devices for electronic money transfers carried out by customers, (ii) IT expenses that rose by 3.7% (or Ch$1,795 million) due to higher expenses in on going projects and internal developments, and (iii) rentals and insurance expenses that increased by 3.6% (or Ch$811 million) on an annual basis, mainly due to market trends in real estate across the country. |
| • |
The above factors were only partly offset by a decrease of 29.1% (or Ch$5,697 million) in other operating expenses, mainly explained by higher operational write-offs recognized in 2012. |
2011 and 2012 . Our operating expenses were Ch$612,934 million in 2012, which was 3.0% above the Ch$595,000 million recorded in 2011. In line with our efforts to improve operating efficiency, our operating expenses remained stable during 2012 and were aligned with our business growth by increasing slightly more than inflation. The primary factors that caused this increase include:
| • |
Administrative expenses that increased 7.6% from Ch$229,919 million in 2011 to Ch$247,459 million in 2012. The main reasons for this increase were: (i) approximately Ch$6,022 million in additional IT expenses associated with several developments undertaken in 2012 (improvements to our datacenters and new online services), (ii) roughly Ch$4,057 million in additional marketing expenses for enhancing brand recognition and supporting product-launch campaigns, and (iii) about Ch$3,045 million in additional expenses associated with our distribution network (rentals, maintenance, etc.). |
| • |
Other operating expenses of Ch$19,565 million in 2012 as compared to Ch$12,274 million in 2011, which represents an increase of 59.4%. This increase was principally caused by higher operational write-offs associated with the implementation of a new online current account platform and other general expenses incurred in 2012. |
113
Table of Contents
| • |
The above factors were partly counterbalanced by personnel expenses that decreased 2.3% from Ch$317,045 million in 2011 to Ch$309,865 million in 2012. The decrease in personnel expenses reflects recurring and extraordinary effects. The recurring effects include the increase in salaries following the 2011 collective bargaining process and the expansion of our workforce, especially for collection duties. Regarding extraordinary effects, in 2011 we distributed a special bonus of Ch$28,100 million to our staff following the completion of the 2011 collective bargaining process. This bonus represents a high basis for comparison with respect to the extraordinary bonuses of Ch$3,970 million and Ch$2,127 million granted in 2012 in order to recognize our outstanding performance during the year and the completion of collective bargaining agreements carried out by two of our subsidiaries, respectively. As a result, our recurring personnel cost base, once adjusted by extraordinary effects, increased 5.1% from approximately Ch$288,945 million in 2011 to Ch$303,768 million in 2012. |
Income Tax
Under Law No. 19,396 we are permitted to deduct dividend payments made to SAOS from our taxable income. Consequently, our effective tax rate is lower than the statutory corporate income tax rate because of the deduction of these dividend payments from our taxable income. Additionally, but to a lesser extent, differences in the tax treatment for monetary correction, as well as provisions on individual loans and for charge-offs related to past-due loans have an impact on our effective tax rate through deferred taxes. Finally, all real estate taxes paid on properties that are leased to customers are deductible from our taxable income.
On April 1st, 2014 the recently assembled government sent to the Chilean congress a tax reform bill. Among other matters, the bill contemplates a gradual increase in the statutory corporate income tax rate, from the current 20.0% to a maximum of 25.0%, over four years. The bill also includes changes in personal taxation for dividends-related taxes affecting both local and foreign investors, from a basis on cash dividends to a basis on accrued earnings of companies held as an investment. For more information, see “Item 10. Additional Information—Taxation—Chilean Tax Considerations—Tax Reform Proposal, by Presidential message N°24-362 (April 1st, 2014).”
On July 31, 2010, the Chilean Congress enacted Law No. 20,455 in response to the February 27, 2010 earthquake, which temporarily increased the statutory corporate income tax rates from 17.0% to 20.0% for the year ending December 31, 2011 and 18.5% for the year ending December 31, 2012, returning to 17.0% for the year ended December 31, 2013. Nevertheless, in 2012 the government submitted a tax reform bill to the Congress, which was finally passed on September 27, 2012 (Law No. 20,633), establishing a new statutory corporate income tax rate of 20.0% from 2012 onwards.
2012 and 2013 . Our income tax expense recorded an annual increase of 39.4%, from Ch$63,928 million in 2012 to Ch$89,085 million in 2013. This annual increase resulted in a higher effective tax rate amounting to 13.9% in 2013 as compared to 11.8% in 2012. This was primarily the result of a low basis for comparison in 2012, since we obtained non-recurring tax benefits associated with our deferred taxes due to the increase in the statutory corporate tax rate as enacted in 2012, as explained below.
2011 and 2012 . Our income tax expense decreased 2.3% to Ch$63,928 million in 2012. This annual decrease, in combination with an annual increase of 8.0% in our income before income tax, caused a decrease in the effective tax rate from 13.0% in 2011 to 11.8% in 2012.
The decrease in the effective tax rate in 2012 as compared to 2011 is mostly the consequence of a change in the statutory corporate tax rate from 2012 onwards by the previously mentioned Law No. 20,630, enacted on September 27, 2012. This modification prompted tax benefits for us associated with our deferred tax asset position, as a result of an increase in the tax rate from 18.5% in 2012 and 17.0% as from 2013 (as formerly established by Law No 20,455) to 20.0% from 2012 onwards (as determined by Law No 20,630 later).
114
Table of Contents
Business Segments
To the extent that it is available and because we believe it is useful in analyzing our results, we have included information on a consolidated basis by business segments, disclosed under our Internal Reporting Policies. A summary of differences between IFRS and our Internal Reporting Policies is presented under “—Summary of Differences between Internal Reporting Policies and IFRS.”
For management purposes, we have organized our operations and commercial strategies into four business segments, which are defined according to the type of products and services offered to target customers. These business segments are:
Retail Banking : This segment is focused on individuals and small and medium-sized companies whose annual sales do not exceed Ch$1,600 million. The segment’s value proposition is primarily focused on consumer loans, commercial loans, current accounts, credit cards, credit lines and mortgage loans.
Wholesale Banking : This segment is focused on corporate clients and large companies whose annual sales exceed Ch$1,600 million. This segment offers products and services focused on commercial loans, current accounts, cash management services, debt instruments, foreign trade, derivative contracts and leases, as well as corporate finance transactions.
Treasury and Money Market : The revenue generated by this segment relates to the management of our liquidity and net positions subject to market risks. This segment also includes the results of our securities portfolio, our derivatives positions and currency trading.
Operations through subsidiaries : This segment includes all companies controlled by us whose results are obtained individually by the respective company. As of December 31, 2013, this business segment consisted of:
| • |
Banchile Trade Services Limited; |
| • |
Banchile Administradora General de Fondos S.A.; |
| • |
Banchile Asesoría Financiera S.A.; |
| • |
Banchile Corredores de Seguros Ltda.; |
| • |
Banchile Corredores de Bolsa S.A.; |
| • |
Banchile Securitizadora S.A.; |
| • |
Socofin S.A.; and |
| • |
Promarket S.A. |
On June 30, 2013, Banco de Chile absorbed its former subsidiary Banchile Factoring S.A., which was previously presented under the Operations through Subsidiaries Segment. As a result of being absorbed by the Bank, the operations of our Factoring Business are now presented under the Retail and Wholesale Banking segments. Accordingly, for comparison purposes the information of our business segments has been restated for previous years. See Note 4 to our audited consolidated financial statements as of and for the year ended December 31, 2013 appearing elsewhere in this annual report
The accounting policies described in the summary of accounting principles in “—Critical Accounting Policies” apply to all business segments. Matters such as the evaluation of segment performance and decision-making processes regarding goals and allocation of resources for each segment are based on a cost-benefit analysis and are aligned with our overall strategic goals.
115
Table of Contents
In order to measure each segment’s financial performance, we use a business segment-based profitability system, which allows us to obtain information for each business segment relative to income, balances, revenues and expenses, among other indicators. This system has been internally developed in order to serve our specific requirements and we continuously work to improve it. In addition, business segment information is subject to general internal auditing procedures to ensure its integrity and usefulness for management decision-making.
The financial information used to measure the performance of our business segments is not necessarily comparable with similar information from other financial institutions because it is based on our internal reporting policies. The accounting policies used to prepare our operating segment information are similar to those described in Note 2(ag) to our audited consolidated financial statements as of and for the year ended December 31, 2013 appearing elsewhere in this annual report, except as noted below:
| • |
The net interest margin of loans and deposits is measured on an individual transaction and individual client basis, due to the difference between the effective individual transaction rate and our related fund transfer price in terms of maturity, re-pricing and currency. |
| • |
The results associated with gap management (interest rate and currency mismatches) are allocated to the business segments in proportion to the loans and demand deposits managed by each segment. |
| • |
For purposes of allocating the effect of funding through capital and reserves, the internal performance profitability system considers capital allocation in each segment in accordance with Basel guidelines. |
| • |
In addition to direct costs (consisting mainly of labor and administrative expenses of the business segments), we allocate all of our direct and indirect operating costs of back office and support units to each business segment by utilizing the most relevant business driver to assign such costs to a specific segment. |
| • |
We apply Chilean GAAP, as required by the SBIF, when measuring and recording allowances for loan losses, assets received in lieu of payments, minimum dividend allowances and other minor items for internal reporting purposes. These accounting principles differ in certain respects from IFRS. A description of these differences is presented below under “—Summary of Differences between Internal Reporting Policies and IFRS.” |
Net Income by Business Segment
The following table sets forth income before income tax by business segment in accordance with our internal reporting policies for each of the years ended December 31, 2011, 2012 and 2013:
| For the Year Ended December 31, | % Increase (Decrease) | |||||||||||||||||||
| BANK’S INTERNAL REPORTING POLICIES: | 2011 | 2012 | 2013 | 2011/2012 | 2012/2013 | |||||||||||||||
| (in millions of Ch$, except percentages) | % | |||||||||||||||||||
|
Retail banking |
265,027 | 250,283 | 303,235 | (5.6 | )% | 21.2 | % | |||||||||||||
|
Wholesale banking |
148,859 | 214,151 | 247,406 | 43.9 | % | 15.5 | % | |||||||||||||
|
Treasury and Money Market |
20,350 | 22,819 | 10,096 | 12.1 | % | (55.8 | )% | |||||||||||||
|
Subsidiaries |
54,157 | 34,748 | 32,802 | (35.8 | )% | (5.6 | )% | |||||||||||||
|
Other |
— | — | — | — | — | |||||||||||||||
|
|
|
|
|
|
|
|
|
|
|
|||||||||||
|
Income before Income tax |
488,393 | 522,001 | 593,539 | 6.9 | % | 13.7 | % | |||||||||||||
|
|
|
|
|
|
|
|
|
|
|
|||||||||||
Retail Banking
2012 and 2013 . The income before income tax of our Retail Banking segment amounted to Ch$303,235 million in 2013, which was 21.2% above the Ch$250,283 million recorded in 2012. The annual performance of this segment took place amid new regulations that put pressure on the individual banking business by cutting interest rate ceilings, reducing margins in insurance brokerage and empowering banking customers. Nevertheless, we believe that our Retail Banking segment could overcome these trends by improving segmentation, enhancing transactional services and—more importantly—growing selectively. The main reason behind the increase in the segment’s income before income tax was the 9.6% annual rise in operating revenues, principally fostered by:
116
Table of Contents
| • |
A loan book that maintained a growth trend by advancing 10.9% in year-end balances and 12.2% in average loans, both on an annual basis. These volume trends went along with lending spreads that slightly dropped in 2013 as compared to 2012. The segment’s loan growth was mainly associated with the expansion in the middle and upper income segments of Individual Banking (annual increase of 13.1% in average loans) and SMEs (annual increase of 12.6% in average loans). Conversely, based on our less positive outlook for the consumer finance business, we tightened that credit process, causing a slowdown in loans managed by our Consumer Division (annual increase of 3.9% in average loans). |
| • |
A sustained upward trend in non-interest bearing liabilities. In this regard, the average balances of current accounts and demand deposits handled by this segment recorded a 12.2% annual increase, which had a positive impact on the profitability of interest earning assets funded with these kinds of deposits. The expansion in volumes compensated for the cuts in the monetary policy interest rate. |
| • |
Higher contribution from the UF net asset position allocated to the segment, due to a greater exposure to UF-indexed assets and more convenient funding associated with Ch$-denominated liabilities, rather than higher UF variation. |
| • |
These factors more than offset a 2.1% decrease in fees and commissions that was largely explained by lower fee income from insurance brokerage and a negative exchange rate effect in expenses related to the customer loyalty program for credit cards due to an increase in the Ch$/US$ exchange rate. |
The increase in operating revenues enabled us to more than offset a 12.8% annual increase in provisions for loan losses. The increase in credit risk charges was largely explained by the increase of 12.2% in average loans managed by the segment, in conjunction with greater countercyclical provisions that were partly allocated to this segment in 2013 as compared to 2012.
2011 and 2012 . Our retail banking segment recorded a 5.6% annual decrease in income before income tax, from Ch$265,027 million in 2011 to Ch$250,283 million in 2012. This decrease occurred in spite of the strong growth shown by the segment in its main business drivers during 2012. In fact, the annual decrease in income before income tax was principally caused by higher provisions for loan losses that were mostly established in the first half of 2012. Therefore, the performance of our retail banking segment during 2012 was mostly affected by:
| • |
A 61.3% annual increase in provisions for loans losses largely due to: |
| • |
A low basis for comparison. In 2011 the banking industry overall recorded historically low levels of credit risk, mainly influenced by the positive economic cycle that enhanced customer payment capacity, especially in personal banking. Similarly, we recorded loan loss provisions below our historical levels, as a percentage of average total loans. |
| • |
A moderate deterioration in credit quality across the industry that peaked in the second quarter of 2012 but returned to historical average figures by the end of the year. This deterioration was mainly associated with social and regulatory forces rather than economic factors and primarily affected consumer loans. As corrective measures, we were more conservative in establishing our provision for loan losses, made our credit-assessment processes tighter and enhanced our collection duties. As a result, by the end of 2012 our credit quality indicators had returned to average levels. |
| • |
Our increasing penetration of the consumer lending market, especially in credit cards (annual expansion of 19.6% in related loans) and installment loans (7.9% annual growth in balances). |
| • |
A 6.5% increase in the segment’s operating expenses in 2012 that was mainly caused by higher personnel expenses due to both a rise in headcount and a salary increase as a result of the collective bargaining agreement reached in 2011. |
The previous factors were partially offset by an 10.7% increase in operating revenues, as a consequence of: (i) 17.1% annual growth in the average balance of total loans for the segment, (ii) 10.8% annual increase in the average balances of current accounts and demand deposits that was supplemented by slightly higher nominal interest rates, and (iii) an increase of 8.0% in other operating revenues in 2012 as compared to 2011. These positive factors enabled the segment to effectively offset the negative impact of lower inflation on the segment’s UF net asset position.
117
Table of Contents
Wholesale Banking
2012 and 2013 . Our Wholesale Banking segment recorded income before income tax of Ch$247,406 million in 2013, an annual increase of 15.5% as compared to the figure of Ch$214,151 million recorded a year earlier. In 2013 this segment faced intense competition from local banking players, but also from international debt markets where Chilean companies increasingly raised funds by taking advantage of low international interest rates and the country’s credit rating. Despite this competitive environment, our Wholesale Banking segment was able to achieve this significant increase in income before income tax by prioritizing growth in those businesses with favorable fair risk-return relationship and in which we had room to increase penetration.
The significant increase in the segment’s income before income tax was mainly attributable to an annual rise of 19.1% in operating revenues, primarily caused by:
| • |
Loans that expanded 11.6% in year-end balances and 5.5% in average balances, both on an annual basis. As mentioned earlier, loan growth was largely fostered by higher penetration of Large Companies and Real Estate, for which average loans increased by 14.2% on a yearly basis, somewhat due to short-term financing loans granted in the fourth quarter of 2013. Conversely, average loans managed by our Corporate Banking (annual turnover above Ch$70,000 million) decreased 4.0% on an annual basis. It is important to mention that loan growth in our Wholesale Banking segment encompassed the acquisition of a portfolio of commercial loans amounting to Ch$500,000 million. |
| • |
A positive impact on revenues from the funding with non-interest bearing liabilities. Similar to the Retail Banking segment, average balances of current account and demand deposits went up, on an annual basis, by a 7.4%. Once again, this increase in volumes enabled us to more than offset the negative effect of a monetary policy interest rate that was cut twice (by 25 bp each time) in 2013, which affected the contribution of these liabilities as sources of funding. |
| • |
A higher contribution from our UF net asset position. This was prompted by an enlarged UF asset exposure and better funding conditions with Ch$-denominated interest bearing liabilities, rather than an increase in inflation in 2013 as compared to 2012 (UF variation was 2.45% in 2012 and 2.05% in 2013). |
The aforesaid enabled the Wholesale Banking segment to completely overcome an annual increase of approximately Ch$30,400 million in provisions for loan losses. This increase was composed of: (i) a negative exchange rate effect of approximately Ch$13,400 million, due by a decrease of 7.8% in the exchange rate (Ch$/US$) in 2012 and an increase of 9.6% in 2013, (ii) nearly Ch$12,700 million related to the deteriorated credit condition of a specific corporate customer in 2013 and (iii) the allocation of higher countercyclical allowances set in 2013.
For the year ended December 31, 2013 we had no material effects associated with sales of loan portfolios.
2011 and 2012 . Our wholesale banking segment recorded a 43.9% increase in income before income tax from Ch$148,859 million in 2011 to Ch$214,151 million in 2012. This annual increase occurred despite the negative effect of lower inflation on the segment’s UF net asset position and can be explained by the following recurrent and extraordinary factors:
| • |
Operating revenues that grew 17.0% annually, from Ch$289,193 million in 2011 to Ch$338,406 million in 2012. This increase of approximately Ch$49,213 million was mainly due to: |
| • |
the recognition of a realized loss of Ch$42,462 million in 2011 due to the sale of a non-performing loan portfolio (with a similar positive impact on the segment’s provisions for loan losses), |
| • |
a 10.5% and 10.2% increase in the average balances of both total loans and demand deposits (including current accounts), respectively, |
| • |
a 29.1% increase in net fees and commissions income, primarily due to higher fee income from credit restructuring, and |
| • |
a negative effect of lower inflation that was effectively offset by the previously mentioned factors. |
118
Table of Contents
| • |
A 36.4% decrease in provisions for loan losses, including the following extraordinary effects: (i) the release of Ch$43,950 million in allowances in 2011 related to the aforementioned sale of a non-performing loan portfolio and (ii) countercyclical allowances established in 2011 that translated into approximately Ch$17,564 million for the segment in that period. Once these extraordinary effects are isolated, the segment’s provisions for loan losses for 2012 decreased approximately Ch$30,738 million as compared to 2011, of which roughly 30% is explained by the deterioration of a specific customer’s risk profile in 2011. |
| • |
An annual decrease of approximately 9.8% in the segment’s operating expenses, which was mainly attributable to lower personnel expenses due to the special bonus granted to our staff in 2011 once we completed the collective bargaining process, as well as lower overhead expenses in 2012 when compared to 2011. |
For the year ended December 31, 2012 there were no material effects related to loan portfolio sales.
Treasury and Money Market
2012 and 2013 . In 2013, the income before income tax of our Treasury amounted to Ch$10,096 million, which represented a 55.8% annual decrease as compared to the Ch$22,819 earned a year earlier. The main reason for a reduced income before income tax was a similar annual decline of 50.2% in operating revenues, principally due to:
| • |
A decrease in other operating revenues by approximately Ch$20,400 million in 2013 as compared to 2012. This was principally the consequence of the previously mentioned one-off effect associated with the first time adoption of the credit value adjustment on derivatives. |
| • |
Revenues from positions in assets held for trading that decreased by approximately Ch$5,900 million on a yearly basis. This lower performance had mainly to do with downward shifts in the CLP/CLF yield curve that affected our net positions in derivatives. Furthermore, upward changes in the CLP/USD yield curve contributed to lower results from our net on-shore/off-shore positions. |
| • |
The above factors were partly offset by higher revenues from the management of our Available-for-Sale portfolio, as a result of net revenues from sales that amounted to approximately Ch$8,100 million in 2012 as compared to Ch$14,900 in 2013. |
2011 and 2012 . In 2012 our Treasury recorded income before income tax of Ch$22,819 million that represented a 12.1% increase as compared to the Ch$20,350 million recorded a year earlier. This variation was mainly caused by a 3.9% increase in the segment’s operating revenues that can be explained by:
| • |
Improved results from trading of fixed-income and derivative securities as a result of our Treasury’s proactive management of our investment portfolio, as well as taking advantage of specific market opportunities to make profits. |
| • |
The higher results from trading activities were partly offset by lower income generated by the management of our available-for-sale portfolio due to the negative impact of lower inflation on the interests accrued by fixed-income securities, most of them denominated in UF, and lower amount of sales as compared to 2011. |
Operations through Subsidiaries
2012 and 2013 . Our subsidiaries reported income before income tax of Ch$32,802 million in 2013 as compared to the Ch$34,748 million recorded in 2012. This represented an annual decrease of 5.6%, which was principally the consequence of:
| • |
An annual decline of 11.4% (or Ch$1,841 million) in income before income tax from our Mutual Funds subsidiary. This decline was explained by unfavorable customer preferences rather than growth in assets under management (AUM). In fact, this company continued to lead the market in terms of AUM in 2013 by attaining a 21.3% market share as of December 31, 2013. This market position was supported by a 3.8% annual increase in average balances of AUM. However, the company was not been able to completely overcome the evolution of market trends, especially those associated with higher volatility in stock markets that encouraged investors to seek havens in fixed-income, which bear lower commissions than mutual funds invested in stocks. Also, organizational restructuring contributed to a temporary increase in the company’s cost base. |
119
Table of Contents
| • |
A 9.9% (or Ch$1,211 million) annual decrease in earnings before income tax recorded by our Stock Brokerage subsidiary. In 2013, this company recorded an annual increase in stock trading turnover of approximately 5.3%, which enabled it to rank second in the local market with a 10.0% market share. This promoted higher revenues from stock and fixed-income trading in 2013. However, performance in these businesses was not high enough to offset lower results from currency trading and other line items. |
The factors mentioned above were partly offset by better performance of our Insurance Brokerage subsidiary, which recorded a 37.0% (or Ch$1,313 million) annual rise in income before income tax. These higher results were associated with a 4.0% annual increase in written premiums, based on positive market trends in consumption, demand for credits and traveling.
2011 and 2012 . Our subsidiaries recorded a 35.8% decrease in income before income tax from Ch$54,157 million in 2011 to Ch$34,748 million in 2012. This decline was primarily explained by a 9.4% annual drop in the segment’s operating revenues, as well as a 7.7% increase in operating expenses. Our subsidiaries’ annual performance was primarily explained by:
| • |
A 10.7% decrease in net fees and commissions income in 2012 as compared to 2011, mainly as a result of reduced commercial activity in securities brokerage and mutual funds management caused by investors that withdrew their savings from stock markets and invested in fixed-income securities. As a consequence, in 2012, our fees from securities brokerage and commissions from mutual funds decreased by Ch$11,010 million and Ch$7,766 million, respectively. As for securities brokerage, lower fees and commissions were caused by a 40.8% annual decrease in stock trading turnover handled by the subsidiary. Regarding mutual funds, lower fee income was a consequence of portfolios managed by our mutual funds subsidiary that were rebalanced by their holders towards fixed-income. These effects were partially offset by higher commissions from insurance brokerage services, financial advisory services and collection services (approximately Ch$4,533 million in additional income, collectively). |
| • |
On the other hand, the annual increase of 7.5% in the segment’s operating expenses was due to collective bargaining processes carried out by two of our subsidiaries and a headcount increase intended to reinforce our collection activities. |
Summary of Differences between Internal Reporting Policies and IFRS
We prepare our business segments’ financial information in accordance with our internal reporting policies, which differ in certain significant aspects from IFRS. The following table sets forth net income and equity for the years ended December 31, 2011, 2012 and 2013 in accordance with our internal reporting policies and under IFRS:
| Year Ended December 31, | ||||||||||||
| 2011 | 2012 | 2013 | ||||||||||
| (in millions of Ch$) | ||||||||||||
|
Income before income tax (Internal Reporting Policies) |
488,393 | 522,001 | 593,539 | |||||||||
|
Reconciliation to IFRS |
15,182 | 21,808 | 45,735 | |||||||||
|
|
|
|
|
|
|
|||||||
|
Income before income tax (IFRS) |
503,575 | 543,809 | 639,274 | |||||||||
|
Net income (Internal Reporting Policies) |
428,805 | 467,611 | 513,603 | |||||||||
|
Reconciliation to IFRS |
9,339 | 12,270 | 36,586 | |||||||||
|
|
|
|
|
|
|
|||||||
|
Net income (IFRS) |
438,144 | 479,881 | 550,189 | |||||||||
|
Equity (Internal Reporting Policies) |
1,739,173 | 2,007,059 | 2,284,316 | |||||||||
|
Reconciliation to IFRS |
301,496 | 348,403 | 394,723 | |||||||||
|
|
|
|
|
|
|
|||||||
|
Equity (IFRS) |
2,040,669 | 2,355,462 | 2,679,039 | |||||||||
|
|
|
|
|
|
|
|||||||
Some differences exist between our net income and equity as determined in accordance with our internal reporting policies, which are used for management reporting purposes, as presented in the segment information, and our net income and equity as determined under IFRS, as presented in our consolidated financial statements.
120
Table of Contents
The most significant differences are as follows:
Under internal reporting policies, our merger with Citibank Chile was accounted for under the pooling-of-interest method, while under IFRS, and for external financial reporting purposes, the merger of the two banks was accounted for as a business combination in which we were the acquirer as required by IFRS 3 “Business Combinations.” Under IFRS 3, we recognized all acquired net assets at fair value as determined at the acquisition date, as well as the goodwill resulting from the purchase price consideration in excess of net assets recognized. As a result of these accounting policy differences, the impact on our net income under IFRS is Ch$7,438 million, Ch$3,848 million and Ch$1,828 million lower than our internally reported net income in 2011, 2012 and 2013, respectively. The equity impact was Ch$45,509 million, Ch$40,699 million and Ch$38,414 million in 2011, 2012 and 2013
For internal reporting purposes, allowances for loan losses are calculated based on specific guidelines set by the SBIF based on an expected losses approach. Under IFRS, IAS 39 “Financial instruments: Recognition and Measurement,” allowances for loan losses should be adequate to cover losses in the loan portfolio at the respective balance sheet dates based on an analysis of estimated future cash flows. According to internal reporting policies, we record additional allowances related to expected losses not yet incurred, whereas under IFRS these expected losses may not be recognized. As a result of these accounting policy differences, the impact on our net income under IFRS is Ch$21,754 million, Ch$21,081 million and Ch$19,882 million higher than our net income internally reported in 2011, 2012 and 2013, respectively. The equity impact was Ch$151,855 million, Ch$169,209 million and Ch$193,626 million in 2011, 2012 and 2013.
For internal reporting purposes, assets received in lieu of payments are measured at historical cost or fair value, less cost to sell, if lower, on a portfolio basis and written-off if not sold after a certain period in accordance with specific guidelines set by the SBIF. Under IFRS, these assets are deemed non-current assets held-for-sale and their accounting treatment is set by IFRS 5 “Non-Current Assets Held for Sale and Discontinued Operations.” In accordance with IFRS 5 these assets are measured at historical cost or fair value, less cost to sell, if lower. Accordingly, under IFRS these assets are not written off unless impaired. As a result of this accounting policy difference, the impact on our net income under IFRS is Ch$3,872 million, Ch$2,889 million and Ch$2,185 million higher than our net income internally reported in 2011, 2012, and 2013, respectively. The equity impact was Ch$10,946 million, Ch$13,835 million and Ch$16,020 million in 2011, 2012 and 2013.
IFRS 13 establishes a single source of guidance under IFRS for all fair value measurements. IFRS 13 does not change when an entity is required to use fair value, but rather provides guidance on how to measure fair value under IFRS when fair value is required or permitted.
The application of IFRS 13 has impacted fair value measurements related to derivatives by including the Bank’s own credit risk (commonly referred as to “Debit Value Adjustment”). During this period this impact was Ch$22,647 million, and is the extent to which our net income under IFRS is higher than our net income internally reported. Nevertheless, the final impact on equity due to this recognition was Ch$19,089 million in 2013, since Ch$3,588 million had already been recorded in previous periods.
The differences described above had an impact on deferred taxes of Ch$5,854 million, Ch$9,538 million and Ch$9,626 million in 2011, 2012 and 2013, respectively, each lower than our net income internally reported. The equity impact was Ch$33,044 million, Ch$42,582 million and Ch$52,207 million in 2011, 2012 and 2013, respectively.
Chilean banks are required to distribute at least 30% of their net income to shareholders unless the shareholders unanimously approve the retention of profits. A bank may, however, be prohibited from distributing to shareholders even this 30% of its net income if such distribution would cause the bank to violate certain statutory capital requirements. In accordance with internal reporting policies, we record a minimum dividend allowance based on our distribution policy, which requires distribution of at least 70% of the period’s net income, as permitted by the SBIF. During 2011, 2012, and 2013, the Bank recorded allowances of Ch$259,501 million, Ch$300,759 million and Ch$324,582 million, respectively. Under IFRS, only the portion of dividends that is required to be distributed by Chilean Law must be recorded, i.e., 30% as required by Chilean Corporations Law. This accounting difference does not lead to differences in net income.
121
Table of Contents
LIQUIDITY AND CAPITAL RESOURCES
Overview
A sound liquidity strategy must be focused on ensuring that funds are available to honor our financial commitments when they are due and also to take advantage of attractive business opportunities. To accomplish this, we monitor funding liquidity (i.e., the ability to raise funds when they are needed without incurring abnormal costs) and trading liquidity (i.e., the ability to easily decrease debt instruments held in our portfolios and/or offset price risk positions generated by derivative transactions).
Liquidity risk can be technically broken down into two types of risks: trading liquidity risk and funding liquidity risk. Trading liquidity risk deals with the inability to decrease cash positions (bonds, loans, etc.) and/or offset price risks generated by derivatives transactions and funding liquidity risk is related to the our inability to raise funds. Both risks can lead to potentially adverse scenarios that might make the bank unable to meet its payment obligations and/or potential payment obligations when they become due.
These two risks are jointly managed but by utilizing different tools, as detailed below.
Trading Liquidity Risk Management
Holding a stake of debt instruments with deep secondary markets ensures trading liquidity. Central Bank and government instruments and short-term banks’ time deposits show these characteristics. These kinds of instruments are held in our trading portfolio and comprise some portion of the Available-for-Sale (“AFS”) portfolio. In addition, mortgage bonds issued by banks resident in Chile and corporate bonds are also part of the FAS portfolio.
Even though mortgage and corporate bonds show much less trading liquidity than Central Bank and government instruments, the former may be sold to the Central Bank under repurchase agreements. Government instruments and short-term banks’ time deposits can also be sold to the Central Bank under repurchase agreements.
Funding Liquidity Risk Management
Diversifying funding sources and avoiding a concentration of large fund providers or funding maturity dates are means to ensure funding liquidity. We diversify through the establishment of triggers that monitor concentrations of funding sources, maturities, currencies, etc. The aggregation of significant fund providers by currency is monitored as a percentage of our current liabilities.
In particular, our funding strategy aims to satisfy our customers’ needs and to enhance our product base offering while maintaining a prudent product diversification profile, currencies and maturities. We are focused on broadening the current core and diversified funding obtained through the retail banking business. In addition, we are continuously issuing either senior or subordinated bonds in order to match both the liquidity and the interest rate risk generated by our long-term loans.
In addition to our own metrics in place to monitor liquidity, the Central Bank and the SBIF have established regulations regarding liquidity, which include: minimum reserve requirements for deposits, minimum “technical” reserve requirements and maximum expected outflows for the following 30 and 90 days.
The Central Bank has established a minimum reserve of 9.0% for demand deposits and 3.6% for time deposits. The reserve requirement must be complied with separately by currency (Chilean Peso and foreign currencies).
In addition, we are subject to a “technical” reserve requirement applicable to all banks that operate in Chile. The daily balance of deposits and obligations payable on demand, except for obligations with other banks, may not exceed 2.5 times the amount of the bank’s Regulatory Capital. Deposits and obligations payable on demand include:
122
Table of Contents
| • |
deposits in current accounts; |
| • |
other demand deposits or obligations payable on demand and incurred in the ordinary course of business; |
| • |
savings deposits that allow unconditional withdrawals that bear a stated maturity; and |
| • |
other deposits unconditionally payable immediately. |
Chilean banks are not required, however, to maintain the minimum reserves referred to above for deposits and obligations subject to this “technical” reserve.
Chilean regulations also require that the expected outflows within the following 30 days not exceed the amount of a bank’s Basic Capital and the expected outflows within the following 90 days not exceed twice the amount of a bank’s Basic Capital. Expected outflows may include behavioral assumptions. Measurements must be made separately, by currency.
Mandatory metrics requested by the SBIF and other metrics developed by us utilizing internal models are prepared daily by independent units within the Corporate/Market Risk Management. These reports are submitted daily to the corresponding Treasury areas, which are in charge of overseeing and managing our liquidity. The Country Asset Liability Committee also monitors these metrics on a monthly basis.
Given our internal metrics and policies, we believe that our working capital is sufficient to meet our present needs.
Cash Flows
The tables below set forth our principal sources of cash. Our subsidiaries are not an important source of cash for us and therefore do not significantly affect our ability to meet our cash obligations. No legal, contractual or economic restrictions exist on the ability of our subsidiaries to transfer funds to us in the form of loans or cash dividends as long as they abide by the regulations in the Chilean Corporations Law regarding loans to related parties and minimum dividend payments.
| For the Year Ended December 31, | ||||||||||||
| 2011 | 2012 | 2013 | ||||||||||
| (in millions of Ch$) | ||||||||||||
|
IFRS: |
||||||||||||
|
Net cash provided by (used in) operating activities |
Ch$ | (454,886 | ) | Ch$ | (415,987 | ) | Ch$ | (139,809 | ) | |||
2012 and 2013 . Net cash used in operating activities decreased by Ch$276,178 million in 2013 as compared to 2012. This net decrease was mainly caused by a net increase of Ch$306,939 million in the inflow from higher balances of saving accounts and time deposits and a net decrease of Ch$297,091 million in the outflow associated with loans granted by the Bank, to customers but especially to financial institutions. These factors were partly offset by (i) an annual net increase of Ch$275,365 million in the outflow associated with higher investment in assets held-for-trading, (ii) an annual higher net outflow of Ch$113,488 million associated with other operating assets and liabilities, (iii) lower inflow linked to a decrease of Ch$89,904 million in net income (adjusted by items that do not represent cash flows) and (iv) an annual decrease of Ch$63,426 million related to lower inflows coming from balances of current accounts and demand deposits.
2011 and 2012 . Net cash used in operating activities decreased by Ch$38,899 million in 2012 as compared to 2011. This decrease was mainly caused by: (i) a net decrease of Ch$1,087,055 million in the outflow associated with loans granted to customers and financial institutions and (ii) a net annual increase of Ch$128,311 million in 2012 as compared to 2011 in the inflow that comes from increasing balances of current accounts and other demand deposits. These factors were partly offset by a net annual decrease of Ch$1,212,543 million in the inflow that comes from taking saving accounts and time deposits.
123
Table of Contents
| For the Year Ended December 31, | ||||||||||||
| 2011 | 2012 | 2013 | ||||||||||
| (in millions of Ch$) | ||||||||||||
|
IFRS: |
||||||||||||
|
Net cash provided by (used in) investing activities |
Ch$ | (334,776 | ) | Ch$ | 192,351 | Ch$ | (409,235 | ) | ||||
2012 and 2013 . The net cash used in investing activities changed from a net inflow of 192,351 million in 2012 to a net outflow of Ch$409,235 million in 2013. The annual change of Ch$601,586 million was primarily caused by an annual net increase in the balance of financial assets available for sale that resulted in a net outflow of Ch$387,578 million in 2013 as compared to the inflow of Ch$219,403 million in 2012, due to sales that exceeded purchases in that year.
2011 and 2012 . The net cash used in investing activities changed from a net outflow of Ch$334,776 million in 2011 to a net inflow of Ch$192,351 million in 2012. The annual change of Ch$527,127 million was primarily caused by an annual net decrease in the balance of financial assets available for sale that resulted in a net inflow of Ch$219,403 million in 2012 as compared to the outflow of Ch$316,083 million in 2011, due to higher sales in 2012 as compared to 2011.
| For the Year Ended December 31, | ||||||||||||
| 2011 | 2012 | 2013 | ||||||||||
| (in millions of Ch$) | ||||||||||||
|
IFRS: |
||||||||||||
|
Net cash provided by financing activities |
Ch$ | 911,975 | Ch$ | 48,087 | Ch$ | 770,865 | ||||||
2012 and 2013 . The net cash provided by financing activities increased from Ch$48,087 million in 2012 to Ch$770,865 million in 2013. The annual increase of Ch$722,778 million was mainly due to: (i) a net annual increase of Ch$893,869 million related to higher inflows coming from new long-term foreign borrowings and lower payments for the same kinds of obligations and (ii) a net higher inflow of Ch$379,788 million related to an increase in proceeds from bond issuances. These factors were partly offset by a net outflow associated with borrowings from financial institutions that decreased by Ch$465,628 million in 2013 as compared to 2012.
2011 and 2012 . The net cash provided by our financing activities decreased from Ch$911,975 million in 2011 to Ch$48,087 million in 2012. The annual decrease of Ch$863,888 million was mainly due to: (i) a net annual decrease of Ch$1,047,810 million associated with higher payments and lower inflows from foreign borrowings, and (ii) an outflow of Ch$279,258 million related to an increase in the redemption of bond issuances. These factors were partly offset by a higher inflow of approximately Ch$484,399 million related to proceeds from new bond issuances.
124
Table of Contents
Borrowings
Borrowings are described as short-term when they have original maturities of less than one year or are due on demand. All other borrowings are described as long-term, including the short-term portion of any long-term borrowings.
| As of December 31, 2011 | As of December 31, 2012 | As of December 31, 2013 | ||||||||||||||||||||||||||||||||||
| IFRS: | Long-term | Short-term | Total | Long-term | Short-term | Total | Long-term | Short-term | Total | |||||||||||||||||||||||||||
| (in millions of Ch$) | ||||||||||||||||||||||||||||||||||||
|
Borrowings from financial institutions: |
||||||||||||||||||||||||||||||||||||
|
Central Bank credit lines for renegotiation of loans |
Ch$ | 63 | Ch$ | — | Ch$ | 63 | Ch$ | 18 | — | Ch$ | 18 | Ch$ | 10 | — | Ch$ | 10 | ||||||||||||||||||||
|
Other borrowings from the Central Bank |
22,792 | — | 22,792 | — | — | — | — | — | — | |||||||||||||||||||||||||||
|
Borrowings from domestic financial institutions |
— | — | — | — | — | — | — | — | — | |||||||||||||||||||||||||||
|
Borrowings from foreign institutions |
194,886 | 1,473,198 | 1,668,084 | 168,450 | 940,213 | 1,108,663 | 131,649 | 857,806 | 989,455 | |||||||||||||||||||||||||||
|
Debt issued: |
||||||||||||||||||||||||||||||||||||
|
Bonds |
1,488,369 | — | 1,488,369 | 2,214,893 | — | 2,214,893 | 3,323,413 | — | 3,323,413 | |||||||||||||||||||||||||||
|
Commercial papers (short-term bonds) |
— | — | — | — | 197,340 | 197,340 | — | 210,049 | 210,049 | |||||||||||||||||||||||||||
|
Subordinated bonds |
747,874 | — | 747,874 | 746,504 | — | 746,504 | 747,007 | — | 747,007 | |||||||||||||||||||||||||||
|
Mortgage finance bonds |
152,098 | — | 152,098 | 115,196 | — | 115,196 | 86,491 | — | 86,491 | |||||||||||||||||||||||||||
|
Other financial obligations |
61,734 | 123,051 | 184,785 | 55,585 | 106,538 | 162,123 | 50,314 | 160,612 | 210,926 | |||||||||||||||||||||||||||
|
|
|
|
|
|
|
|
|
|
|
|
|
|
|
|
|
|
|
|||||||||||||||||||
|
Total other interest bearing liabilities |
Ch$ | 2,667,816 | Ch$ | 1,596,249 | Ch$ | 4,264,065 | Ch$ | 3,300,646 | Ch$ | 1,244,091 | Ch$ | 4,544,737 | Ch$ | 4,338,884 | Ch$ | 1,228,467 | Ch$ | 5,567,351 | ||||||||||||||||||
|
|
|
|
|
|
|
|
|
|
|
|
|
|
|
|
|
|
|
|||||||||||||||||||
The Bank was in material compliance with all of its debt instruments during the years 2011, 2012 and 2013.
125
Table of Contents
Central Bank Borrowings
Central Bank borrowings include credit lines for the renegotiation of loans and other borrowings. The Central Bank provided credit lines for the renegotiation of mortgage loans due to the need to refinance debts as a result of the economic recession and crisis of the Chilean banking system from 1982 to 1985. These credit lines are linked to the UF index and carry an average real annual interest rate of 0.61% as of December 31, 2013. As of the same date, the maturities of the outstanding balances were, as follows:
| As of December 31, 2013 | ||||
| (in millions of Ch$) | ||||
|
IFRS: |
||||
|
Due within 1 year |
10 | |||
|
Due after 1 year but within 2 years |
— | |||
|
Due after 2 years but within 3 years |
— | |||
|
Due after 3 years but within 4 years |
— | |||
|
Due after 4 years but within 5 years |
— | |||
|
Due after 5 years |
— | |||
|
|
|
|||
|
Total long-term (Credit lines for renegotiation of loans) |
10 | |||
|
Total short-term (Other Central Bank borrowings) |
— | |||
|
|
|
|||
|
Total Central Bank borrowings |
10 | |||
|
|
|
|||
Borrowings from Domestic Financial Institutions
Borrowings from domestic financial institutions are generally used to fund our general operations. As of December 31, 2013 we did not have any outstanding borrowings from domestic financial institutions.
Borrowings from Foreign Financial Institutions
We have short- and long-term borrowings from foreign banks. These loans are denominated in foreign currency and are used to fund our foreign trade loans and carried an average nominal interest rate of 0.84% in the year ended December 31, 2013. The outstanding maturities of these borrowings as of December 31, 2013 were, as follows:
| As of December 31, 2013 | ||||
| (in millions of Ch$) | ||||
|
IFRS: |
||||
|
Due within 1 year |
105,341 | |||
|
Due after 1 year but within 2 years |
26,308 | |||
|
Due after 2 years but within 3 years |
— | |||
|
Due after 3 years but within 4 years |
— | |||
|
Due after 4 years but within 5 years |
— | |||
|
Due after 5 years |
— | |||
|
|
|
|||
|
Total long-term |
131,649 | |||
|
Total short-term(1) |
857,806 | |||
|
|
|
|||
|
Total foreign borrowings |
989,455 | |||
|
|
|
|||
| (1) | Includes borrowings with maturities that were originally more than one year but which as of December 31, 2013 had remaining maturities of less than one year. |
126
Table of Contents
Bonds
Our bonds are linked to the UF index and carried an average real annual interest rate of 3.01% as of December 31, 2013 with interest and principal payments due semi-annually. The bonds were intended to finance loans that had a maturity of more than one year.
The maturities of bonds as of December 31, 2013 were:
| As of December 31, 2013 | ||||
| (in millions of Ch$) | ||||
|
IFRS: |
||||
|
Due within 1 year |
317,366 | |||
|
Due after 1 year but within 2 years |
303,007 | |||
|
Due after 2 years but within 3 years |
301,185 | |||
|
Due after 3 years but within 4 years |
378,395 | |||
|
Due after 4 years but within 5 years |
419,700 | |||
|
Due after 5 years |
1,813,809 | |||
|
|
|
|||
|
Total bonds |
3,533,462 | |||
|
|
|
|||
During 2013 we issued bonds in an amount of Ch$1,603,669 million, of which Ch$509,920 million corresponded to commercial paper.
Subordinated Bonds
Our outstanding subordinated bonds are linked to the UF index with interest and principal payments due semi-annually. The discount on the issuance of the outstanding subordinated bonds is amortized over the life of the bond. As of December 31, 2013, the effective real interest rate was 4.67% taking into consideration the discount on issuance.
The bonds are intended to finance loans having a maturity of more than one year. As of December 31, 2013, the maturities of subordinated bonds, which are considered long-term, were:
| As of December 31, 2013 | ||||
| (in millions of Ch$) | ||||
|
IFRS: |
||||
|
Due within 1 year |
38,953 | |||
|
Due after 1 year but within 2 years |
25,255 | |||
|
Due after 2 years but within 3 years |
136,094 | |||
|
Due after 3 years but within 4 years |
24,118 | |||
|
Due after 4 years but within 5 years |
23,837 | |||
|
Due after 5 years |
498,750 | |||
|
|
|
|||
|
Total subordinated bonds |
747,007 | |||
|
|
|
|||
During 2013 we issued bonds in an amount of Ch$3,596 million, with a maturity of 25 years and an interest rate of 3.75%.
Mortgage Finance Bonds
Mortgage finance bonds are used to finance the granting of mortgage loans. The outstanding principal amounts of the bonds are amortized on a quarterly basis. The range of maturities of these bonds is between five and thirty years. The bonds are linked to the UF index and carried a weighted average annual interest rate of 3.91% as of December 31, 2013.
127
Table of Contents
The maturities of mortgage finance bonds as of December 31, 2013 were:
| As of December 31, 2013 | ||||
| (in millions of Ch$) | ||||
|
IFRS: |
||||
|
Due within 1 year |
23,053 | |||
|
Due after 1 year but within 2 years |
16,310 | |||
|
Due after 2 years but within 3 years |
11,517 | |||
|
Due after 3 years but within 4 years |
8,951 | |||
|
Due after 4 years but within 5 years |
7,144 | |||
|
Due after 5 years |
19,516 | |||
|
|
|
|||
|
Total mortgage finance bonds |
86,491 | |||
|
|
|
|||
Other Financial Obligations
The maturities of other financial obligations as of December 31, 2011, 2012 and 2013 were as follows:
| As of December 31, | ||||||||||||
| 2011 | 2012 | 2013 | ||||||||||
| (in millions of Ch$) | ||||||||||||
|
IFRS: |
||||||||||||
|
Other long-term obligations: |
||||||||||||
|
Obligations with Chilean Government |
Ch$ | 61,734 | Ch$ | 55,585 | Ch$ | 50,314 | ||||||
|
|
|
|
|
|
|
|||||||
|
Total other long-term obligations |
61,734 | 55,585 | 50,314 | |||||||||
|
Other short-term obligations |
123,051 | 106,538 | 160,612 | |||||||||
|
|
|
|
|
|
|
|||||||
|
Total other obligations |
Ch$ | 184,785 | Ch$ | 162,123 | Ch$ | 210,926 | ||||||
|
|
|
|
|
|
|
|||||||
As of December 31, 2013, other financial obligations had the following maturities:
| As of December 31, 2013 | ||||
| (in millions of Ch$) | ||||
|
IFRS: |
||||
|
Due within 1 year |
6,291 | |||
|
Due after 1 year but within 2 years |
4,747 | |||
|
Due after 2 years but within 3 years |
3,989 | |||
|
Due after 3 years but within 4 years |
3,651 | |||
|
Due after 4 years but within 5 years |
9,852 | |||
|
Due after 5 years |
21,784 | |||
|
|
|
|||
|
Total long-term |
50,314 | |||
|
Total short-term(1) |
160,612 | |||
|
|
|
|||
|
Total other obligations |
210,926 | |||
|
|
|
|||
| (1) | Includes borrowings with maturities that were originally more than one year but which as of December 31, 2013 had remaining maturities of less than one year |
Asset and Liability Management
Our asset and liability management policy is to maximize net interest income, return on assets and average equity in light of interest rate, liquidity and foreign exchange risks, within the limits of Chilean banking regulations and our internal risk management policies. Subject to these constraints, we may from time to time take mismatched positions as to interest rates or, in certain limited circumstances, foreign currencies when justified, in our view, by market conditions and prospects, and subject to our asset and liability management policies. Our board of directors determines our asset and liability policies. See Note 42 to our audited consolidated financial statements as of and for the year ended December 31, 2013 appearing elsewhere in this annual report.
128
Table of Contents
Funding
The following table sets forth our average daily balance of liabilities for the years ended December 31, 2011, 2012 and 2013, in each case together with the related average nominal interest rates paid thereon:
| Year Ended December 31, | ||||||||||||||||||||||||||||||||||||
| 2011 | 2012 | 2013 | ||||||||||||||||||||||||||||||||||
| IFRS: |
Average
Balance |
% of Total
Liabilities |
Average
Nominal Rate |
Average
Balance |
% of Total
Liabilities |
Average
Nominal Rate |
Average
Balance |
% of Total
Liabilities |
Average
Nominal Rate |
|||||||||||||||||||||||||||
| (in millions of Ch$, except percentages) | ||||||||||||||||||||||||||||||||||||
|
Current accounts and demand deposits |
Ch$ | 4,540,335 | 24.7 | % | — | % | Ch$ | 4,926,475 | 24.4 | % | — | % | Ch$ | 5,455,342 | 25.1 | % | — | % | ||||||||||||||||||
|
Savings accounts and time deposits |
8,450,231 | 46.0 | 5.11 | 9,380,123 | 46.4 | 5.31 | 9,842,483 | 45.2 | 4.83 | |||||||||||||||||||||||||||
|
Borrowings from financial institutions |
1,715,417 | 9.3 | 1.39 | 1,435,362 | 7.1 | 1.55 | 1,201,866 | 5.5 | 1.15 | |||||||||||||||||||||||||||
|
Debt issued |
1,994,679 | 10.8 | 7.72 | 2,838,170 | 14.0 | 6.00 | 3,771,209 | 17.3 | 5.29 | |||||||||||||||||||||||||||
|
Other financial obligations |
168,858 | 0.9 | 2.26 | 170,977 | 0.8 | 1.86 | 173,868 | 0.8 | 1.68 | |||||||||||||||||||||||||||
|
Other interest bearing liabilities |
218,847 | 1.2 | 4.96 | 286,944 | 1.4 | 5.22 | 289,107 | 1.3 | 4.55 | |||||||||||||||||||||||||||
|
Other non-interest bearing liabilities |
1,298,603 | 7.1 | — | 1,189,167 | 5.9 | — | 1,028,223 | 4.8 | — | |||||||||||||||||||||||||||
|
|
|
|
|
|
|
|
|
|
|
|
|
|
|
|
|
|
|
|||||||||||||||||||
|
Total liabilities |
Ch$ | 18,386,970 | 100.0 | % | — | Ch$ | 20,227,220 | 100.0 | % | — | Ch$ | 21,762,098 | 100.0 | % | — | |||||||||||||||||||||
|
|
|
|
|
|
|
|
|
|
|
|
|
|
|
|
|
|
|
|||||||||||||||||||
Our most important source of funding are customer deposits, which consist primarily of peso-denominated, non-interest bearing current accounts and demand deposits and Chilean peso and UF-denominated interest bearing time deposits and savings accounts. Current accounts and demand deposits represented 25.5% of our average total liabilities in 2013, and are our cheapest source of funding. Savings accounts, time deposit and debt issued represented 56.8%, 60.4% and 63.8% of our average liabilities in 2011, 2012 and 2013, respectively.
129
Table of Contents
Capital Expenditures
For information on our capital expenditures, see Item 4. Information on the Company—History and Development of the Bank—Capital Expenditures.”
RECENT DEVELOPMENTS
Public Secondary Offering by LQIF
On January 31, 2014, LQIF, our major shareholder, closed the sale of 6,700,000,000 of our common shares. The shares were sold by LQIF through a book auction on the Santiago Stock Exchange. The shares were sold in Chile through Chilean placement agents and sold outside of Chile through international underwriters in the form of American Depositary Shares traded on the New York Stock Exchange. As a result of this offering, LQIF’s direct and indirect ownership stake in our common shares decreased from 58.4% as of December 31, 2013 to 51.2% as of April 15, 2014.
TREND INFORMATION
We believe we have developed strong competitive advantages that will allow us to remain a relevant player within the Chilean banking industry. We are continuously seeking additional improvements in matters such as operating efficiency, productivity, profitability and service quality by developing new customer oriented service models, launching new financial products and services and implementing high quality information technologies. Our business environment is increasingly competitive and an active market for mergers and acquisitions tends to encourage large financial groups. In addition, competition from non-banking companies, mainly those involved in the retail industry, has encouraged us to develop improved value propositions to satisfy our customers’ needs.
The following trends may also have an impact on the Chilean economy and the economic growth of its trade partners, and could therefore affect our business, operating results or financial condition:
| • |
The fragile recovery of the global economy. Unforeseeable financial events, such as the current uncertainty about the financial condition of some European countries and the slowdown observed in the Chinese economy, affect financial markets. |
| • |
The impact on worldwide consumption and foreign trade caused by the elimination of monetary and fiscal stimulus in both developed and developing economies. |
We believe that Chile and its financial industry have proved to be successful in facing worldwide financial contingencies because of its strict fiscal policy, forward-looking and independent monetary policy, as well as strong regulation and supervision related to the financial industry.
In addition, the recent international trend of improved protection of consumers’ financial rights has become increasingly significant in Chile. If this trend leads to changes by Chilean financial regulators, these changes could affect our future operating results.
For more information regarding potential economic or regulatory factors that could affect our result of operations or financial condition, see Item 3. Key Information—Risk Factors.”
OFF-BALANCE SHEET ARRANGEMENTS
In the normal course of business, we are party to a number of off-balance sheet arrangements that present credit, market and operational risks that are not reflected in our consolidated financial statements. These activities include commitments to extend credit not otherwise accounted for as contingent loans, such as overdrafts and credit card lines of credit, and long-term contractual obligations under operating leases or service contracts.
We provide customers with off-balance sheet credit support through loan commitments. Such commitments are agreements to lend to a customer at a future date, subject to compliance with contractual terms. Since substantial portions of these commitments are expected to expire without us having to make any loans, total commitment amounts do not necessarily represent our actual future cash requirements. The amounts of these loan commitments were Ch$5,481,235 million as of December 31, 2012 and Ch$5,436,938 million as of December 31, 2013. See Note 27 to our audited consolidated financial statements as of and for the year ended December 31, 2013 appearing elsewhere in this annual report. The amounts of subscribed leasing contracts were Ch$246,296 million as of December 31, 2012 and Ch$238,082 million as of December 31, 2013
130
Table of Contents
Interest rate and cross-currency swaps, which are entered into in order to hedge our foreign investment portfolio, are recorded at their estimated fair market values. See Note 9 to our audited consolidated financial statements as of and for the year ended December 31, 2013 appearing elsewhere in this annual report.
The credit risk of both on and off-balance sheet financial instruments varies based on many factors, including the value of collateral held and other security arrangements. To mitigate credit risk, we generally determine the need for specific covenant, guarantee and collateral requirements on a case-by-case basis, depending on the nature of the financial instrument and the customer’s creditworthiness. The amount and type of collateral held to reduce credit risk varies, but may include real estate, machinery, equipment, inventory and accounts receivable, as well as cash on deposit, stocks, bonds and other marketable securities that are generally held in our possession or at another appropriate custodian or depository. This collateral is valued and inspected on a regular basis to ensure both its existence and adequacy. Additional collateral is requested when appropriate. For further information, see Note 27 to our audited consolidated financial statements as of and for the year ended December 31, 2013 appearing elsewhere in this annual report.
Financial Guarantees
The following is a summary of the nominal value of instruments that are considered financial guarantees and which are accounted for in off-balance sheet accounts:
| As of December 31, 2013 | ||||
| (in millions of Ch$) | ||||
|
Performance bonds |
1,402,399 | |||
|
Foreign office guarantees and standby letters of credit |
491,465 | |||
|
|
|
|||
|
Total |
1,893,864 | |||
|
|
|
|||
Guarantees in the form of performance bonds, standby letters of credit and foreign office guarantees are issued in connection with agreements made by customers to counterparties. If the customer fails to comply with the agreement, the counterparty may enforce the performance bonds, standby letters of credit or foreign office guarantees as a remedy. Credit risk arises from the possibility that the customer may not be able to repay us for these guarantees.
The expiration of guarantees per period is as follows:
|
Due within 1
year |
Due after 1 year
but within 3 Years |
Due after 3 years
but within 5 years |
Due after 5
years |
Total | ||||||||||||||||
| (in millions of Ch$) | ||||||||||||||||||||
|
Performance bonds |
1,008,922 | 273,125 | 108,517 | 11,835 | 1,402,399 | |||||||||||||||
|
Foreign office guarantees and standby letters of credit |
320,385 | 161,003 | 8,207 | 1,870 | 491,465 | |||||||||||||||
|
|
|
|
|
|
|
|
|
|
|
|||||||||||
|
Total |
1,329,307 | 434,128 | 116,724 | 13,705 | 1,893,864 | |||||||||||||||
|
|
|
|
|
|
|
|
|
|
|
|||||||||||
As of December 31, 2013, the Bank did not have significant concentrations by country.
131
Table of Contents
TABULAR DISCLOSURE OF CONTRACTUAL OBLIGATIONS
The following tables set forth our contractual obligations and commercial commitments by time remaining to maturity. As of December 31, 2013, the scheduled maturities of our contractual obligations, including accrued interest, were as follows:
| IFRS: | Due within 1 year |
Due after
1 year but within 3 years |
Due after
3 years but within 5 years |
Due after 5 years |
Total |
Estimated
Interest Payment |
||||||||||||||||||
| (in millions of constant Ch$ as of December 31, 2013) | ||||||||||||||||||||||||
|
Contractual Obligations |
||||||||||||||||||||||||
|
Currents accounts and other demand deposits |
5,984,332 | — | — | — | 5,984,332 | — | ||||||||||||||||||
|
Transaction in the course of payment |
51,898 | — | — | — | 51,898 | — | ||||||||||||||||||
|
Saving accounts and time deposits |
10,195,212 | 207,347 | 135 | 31 | 10,402,725 | — | ||||||||||||||||||
|
Bonds issued |
||||||||||||||||||||||||
|
Mortgage finance bonds |
23,053 | 27,827 | 16,095 | 19,516 | 86,491 | 23,568 | ||||||||||||||||||
|
Bonds |
107,317 | 604,192 | 798,095 | 1,813,809 | 3,323,413 | 641,715 | ||||||||||||||||||
|
Commercial Bonds |
210,049 | — | — | — | 210,049 | 40,558 | ||||||||||||||||||
|
Subordinated Bonds |
38,953 | 161,349 | 47,955 | 498,750 | 747,007 | 432,074 | ||||||||||||||||||
|
Hedged Instrument |
— | — | — | — | — | — | ||||||||||||||||||
|
Inflows |
||||||||||||||||||||||||
|
Corporate Bond MXN |
(63,100 | ) | — | — | — | (63,100 | ) | — | ||||||||||||||||
|
Corporate Bond HKD |
(7,011 | ) | (14,022 | ) | (14,009 | ) | (240,224 | ) | (275,266 | ) | — | |||||||||||||
|
Corporate Bond PEN |
(578 | ) | (1,154 | ) | (14,690 | ) | — | (16,422 | ) | — | ||||||||||||||
|
Corporate Bond CHF |
(4,936 | ) | (143,070 | ) | (229,701 | ) | (105,325 | ) | (483,032 | ) | — | |||||||||||||
|
Obligation USD |
(1,419 | ) | (135,478 | ) | — | — | (136,897 | ) | — | |||||||||||||||
|
Corporate Bond JPY |
(636 | ) | (56,964 | ) | (598 | ) | (29,173 | ) | (87,371 | ) | — | |||||||||||||
|
Outflows |
||||||||||||||||||||||||
|
Cross currency swap MXN |
63,100 | — | — | — | 63,100 | — | ||||||||||||||||||
|
Cross currency swap HKD |
7,011 | 14,022 | 14,009 | 240,224 | 275,266 | — | ||||||||||||||||||
|
Cross currency swap PEN |
578 | 1,154 | 14,690 | — | 16,422 | — | ||||||||||||||||||
|
Corporate Bond CHF |
4,936 | 143,070 | 229,701 | 105,325 | 483,032 | — | ||||||||||||||||||
|
Obligation USD |
1,419 | 135,478 | — | — | 136,897 | — | ||||||||||||||||||
|
Corporate Bond JPY |
636 | 56,964 | 598 | 29,173 | 87,371 | — | ||||||||||||||||||
|
Borrowings from financial institutions |
963,157 | 26,308 | — | — | 989,465 | — | ||||||||||||||||||
|
Other obligations |
166,903 | 8,736 | 13,503 | 21,784 | 210,926 | — | ||||||||||||||||||
|
Lease contracts |
26,786 | 37,497 | 26,517 | 48,815 | 139,615 | — | ||||||||||||||||||
|
Services contracts |
5,223 | 2,286 | — | — | 7,509 | — | ||||||||||||||||||
|
Investments sold under agreements to repurchase |
256,766 | — | — | — | 256,766 | — | ||||||||||||||||||
|
|
|
|
|
|
|
|
|
|
|
|
|
|||||||||||||
|
Total |
18,029,649 | 1,075,542 | 902,300 | 2,402,705 | 22,410,196 | 1,137,915 | ||||||||||||||||||
|
|
|
|
|
|
|
|
|
|
|
|
|
|||||||||||||
| (*) | See note 9(c) of the Consolidated Financial Statements |
132
Table of Contents
| Item 6 | Directors, Senior Management and Employees |
DIRECTORS AND SENIOR MANAGEMENT
Directors
Our administration is conducted by our board of directors, which, in accordance with our estatutos (bylaws), consists of eleven directors and two alternate directors. The entire board of directors is elected every three years. Our current board of directors was elected in March 2011 and its term expires in March 2014.
Cumulative voting is permitted for the election of directors. Our chairman and our chief executive officer are appointed by our board of directors and hold their offices at its discretion. Scheduled meetings of our board of directors are held at least twice a month. Extraordinary board of directors meetings may be called by the chairman, when requested by a majority of the directors, or, in limited circumstances, when requested by a single director.
Our current directors are as follows:
|
Director |
Position |
Committee Memberships |
Age | |||
|
Pablo Granifo L. |
Chairman | 8 | 55 | |||
|
Andrónico Luksic C. |
Vice Chairman | 1 | 60 | |||
|
Francisco A. Aristeguieta |
Vice Chairman | 2 | 48 | |||
|
Jorge Awad M. |
Director | 3 | 68 | |||
|
Jorge Ergas H. |
Director | 2 | 45 | |||
|
Jean Paul Luksic F. |
Director | 1 | 49 | |||
|
Juan Bruchou |
Director | 1 | 56 | |||
|
Gonzalo Menendez D. |
Director | 5 | 65 | |||
|
Juan Enrique Pino V. |
Director | 4 | 52 | |||
|
Francisco Perez M. |
Director | 3 | 56 | |||
|
Jaime Estévez V. |
Director | 4 | 67 | |||
|
Rodrigo Manubens M. |
Alternate Director | 1 | 55 | |||
|
Thomas Fürst F. |
Alternate Director | 1 | 83 |
Pablo Granifo L . was re-elected as the chairman of our board of directors in 2011, a position which he has held since 2007. He was our chief executive officer from 2001 to 2007, chief executive officer of Banco de A. Edwards from 2000 to 2001, commercial manager at Banco Santiago from 1995 to 1999 and corporate manager at Banco Santiago from 1999 to 2000. Mr. Granifo is also chairman of the board of directors of Banchile Asesoría Financiera S.A., Socofin S.A., Banchile Securitizadora S.A., Banchile Administradora General de Fondos S.A. and a member of the executive committee of Banchile Corredores de Seguros Limitada. He is also chairman of Viña San PedroTarapacá S.A., vice chairman of Transbank S.A., and a member of the board of directors of Compañía Cervecerías Unidas S.A., Redbanc S.A., Servipag Limitada and Empresa Nacional de Energía Enex S.A.. He holds a degree in business administration from the Pontificia Universidad Católica de Chile.
Andrónico Luksic C. has been a director and the vice chairman of our board of directors since 2002. Mr. Luksic is also chairman of LQIF, Quiñenco S.A. and Compañía Cervecerías Unidas S.A., vice chairman of Compañía Sud Americana de Vapores S.A. and a member of the board of directors of Madeco S.A. and Sociedad de Fomento Fabril (SOFOFA). Mr. Luksic is a member of the APEC Business Advisory Council (ABAC) and vice chairman of the International Business Leaders’ Advisory Council for the Mayor of Shanghai. He is also a member of the International Advisory Board of Barrick Gold, the International Advisory Council of the Brookings Institution, the Advisory Board of the Panama Canal Authority, and the Chairman’s International Council of the Council of the Americas. In addition, Mr. Luksic is a Trustee Emeritus at Babson College, and a member the Harvard Global Advisory Council, the International Advisory Board of the Blavatnik School of Government at Oxford University, the International Advisory Boards of both the Tsinghua University School of Economics and Management and the Fudan University School of Management, the Harvard Business School Latin America Advisory Board, the Dean’s Council at the Harvard Kennedy School, the Advisory Committee of the David Rockefeller Center at Harvard University, and the Latin American Executive Board of the MIT Sloan School of Management. Andrónico Luksic and Jean Paul Luksic are brothers.
Francisco A. Aristeguieta has been a member and vice chairman of our board of directors since April 2012. Mr. Aristeguieta is the CEO of Citigroup Latin America. Before this role he served as Citi Transaction Services (CTS) Head for Latin America & Mexico, member of the Banco Nacional de Mexico (Banamex) Executive Committee, member of the CTS Global Executive Committee, CEO for the Andean Region Cluster of countries and Colombia, CEO for Citigroup Venezuela and Ecuador.
133
Table of Contents
Mr. Aristeguieta is a member of the Citigroup Global Executive Committee, the Board of Citigroup Foundation, the Association of American Chambers of Commerce of Latin America, The Americas Society and Council of the Americas. He has been a member of The Young Presidents Organization (YPO) since 2003. In addition, he served on the Board of Directors of Junior Achievement Americas and several other Boards among them: Banking Association of Ecuador, Colombia and Venezuela; and American Chambers of Commerce of Ecuador, Colombia and Venezuela, and the Consejo de Empresas Americanas of Colombia. He was also Chairman of the Board of Colfondos in Colombia. Mr. Aristeguieta holds an MBA from Brunel University in London, a graduate degree in Banking and Finance and an undergraduate degree in Business Administration with a major in Management both from the Universidad Metropolitana in Caracas, Venezuela.
Jorge Awad M. has been a member of our board of directors since 1996. From 1989 to 1996 he was a member of the board of directors of Banco de Santiago. Mr. Awad is president of the Association of Banks of Chile since 2011. He is also a member of the board of the University of Talca and the Catholic University of Valparaíso TV. Previously, Mr. Awad was president of LAN Airlines S. A. for 18 years until September 2012. He has also been a Director of Codelco Chile, National Television of Chile, Chile Laboratory, ICARE, and other Chilean companies. He is also a professor of Management and Entrepreneurship at the School of Economics at the University of Chile. Mr. Awad has a degree in Business Administration from the University of Chile.
Jorge Ergas H. was appointed member of our board of directors on March 2011 after having served as an advisor to the board of directors since 2007 and from 2002 to 2005. From 2005 to 2007, Mr. Ergas was an alternate director. Mr. Ergas is currently the Vice-Chairman of Banchile Compañía de Seguros de Vida S.A., vice chairman of Orion Seguros Generales S.A., President of Movicenter and a director of Inersa S.A., Nido de Águilas Educational Foundation, and Ever I BAE. Mr. Ergas was previously a director of the Plaza San Francisco Hotel, CasaPiedra Convention Center, HNS Bank and Inmobiliaria Paidahue.
Jean Paul Luksic F. was appointed member of our board of directors on April 2013. Mr. Luksic is vice chairman of Quiñenco S.A. and Sociedad Matriz SAAM S.A. Mr. Luksic has been chairman of the board of directors of Antofagasta plc since 2004, after having served as director for the company since 1990 and Deputy Chairman since 2000. Mr. Luksic was the Chief Executive Officer of Antofagasta Minerals until his appointment as Chairman of Antofagasta plc. He is also chairman of the board of Antofagasta Minerals, Ferrocarril de Antofagasta a Bolivia, and Aguas Antofagasta, as well as chairman of the Mining Council. Mr. Luksic holds a B.Sc. degree in management and science from the London School of Economics.
Juan Bruchou was appointed member of our board of directors on March 2014. He is the CEO for Latam South Cluster (Argentina, Peru, Paraguay, Uruguay, Venezuela, Ecuador and Chile ). Mr. Bruchou joined Citibank in Buenos Aires in 1986 as a Senior Legal Officer. In 1991 he was promoted to Corporate Legal Head for the Global Finance group. Mr. Bruchou was named Head of Financial Institutions for Citibank Argentina in 1996. Subsequently, he was appointed Country Corporate Officer for Citibank Venezuela in 1997 and for Citibank in Malaysia in 1999. He was named CCO for Citibank in Argentina in September 2002. Prior to joining Citibank, Mr. Bruchou worked with Arnold Porter in Washington D.C. Mr. Bruchou received a Bachelor’s degree in law from the Universidad Católica in Argentina, and a Master’s Degree in International Law from Harvard Law School.
Gonzalo Menendez D. has been a member of our board of directors since 2001. He is also the chairman of Inversiones Vita S.A., and a member of the board of directors of several other companies, including Banchile Asesoría Financiera S.A., Banchile Seguros de Vida S.A., Quiñenco S.A., Compañía Sudamericana de Vapores S.A., Sudamericana Agencias Aéreas y Marítimas S.A., Sociedad Matriz SAAM S.A., Antofagasta PLC, Mining Group Antofagasta Minerals S.A., Antofagasta Railway, Aguas de Antofagasta S.A., Andsberg Investment Ltd., Andsberg Limited and Inmobiliaria e Inversiones Río Claro S.A.. He is also vice chairman of Fundación Andrónico Luksic A. and Fundación Pascual Baburizza. Previously, Mr. Menéndez served as chief executive officer of the Antofagasta Railway to Bolivia, Banco O’Higgins and Empresas Lucchetti. Since 1990, he has been a director and is now the chairman of the board of directors of Banco Latinoamericano de Comercio Exterior S.A., Bladex. Mr. Menéndez was a member of the board of directors and the executive committee at Banco Santiago and a member of the board of directors at Banco de A. Edwards. He was a professor of finance, economics and business policy at Universidad de Chile. He holds a degree in business administration and accounting from Universidad de Chile.
Juan Enrique Pino V. has been a member of our Board of Directors since August 2013. Currently, Mr. Pino is the Chief Risk Officer for Citigroup Latin America, a role that he has since January 2010, based in Mexico. He is a member of the Global Risk Management Executive Committee of Citigroup, and of the Executive Committees of both Mexico and Latin America. Juan Enrique first joined Citi in 1985, performing since then several business and risk management roles. He was General Manager for Citigroup Chile and Citi Accival Corredores de Bolsa in 2008 and part of 2009, and also Director of several companies where Citigroup was a shareholder. Mr. Pino is a Commercial Engineer and graduated from Universidad Adolfo Ibañez (Chile) in 1983 with a degree in Business Administration.
134
Table of Contents
Francisco Perez M. has been a member of our board of directors since 2001. Since 1998, Mr. Perez has also served as the chief executive officer of Quiñenco S.A. Mr. Pérez is also chairman of the board of directors of Compañía Sud Americana de Vapores S.A., Empresa Nacional de Energía Enex S.A., Indalum S.A. and Madeco Mills S.A.. Mr. Perez is vice chairman of Invexans S.A. and Madeco S.A.. He was formerly the chief executive officer of Compañía Cervecerías Unidas S.A., of which he is still a director. Mr. Perez is a member of the board of directors of Banchile Corredores de Seguros S.A., LQ Inversiones Financieras S.A., Embotelladoras Chilenas Unidas S.A., Foods Cía. Alimentos CCU S.A., Cía. Cervecerías Unidas Argentina S.A., Cía. Pisquera de Chile S.A., Cervecera CCU Chile Ltda., Inversiones y Rentas S.A., Nexans, Sociedad Matriz SAAM S.A. y de Sudamericana, Agencias Aéreas y Marítimas S.A.He is also an advisor of the board of directors of Viña San Pedro Tarapacá S.A.Prior to 1991, Mr. Perez was chief executive officer of Citicorp Chile and also was vice president of Bankers Trust in Chile. Mr. Perez holds a degree in business administration from the Pontificia Universidad Católica de Chile and a master’s degree in business administration from the University of Chicago.
Jaime Estévez V. has been a member of our board of directors since 2007 and is currently a member of the board of directors of Cruzados SADP. Previously, Mr. Estévez was chairman of the board of directors of Banco Estado, a Chilean government-owned bank. Additionally, he has served as a director AFP Provida and AFP Protección, two Chilean private investment pension funds, and as director of Endesa Chile S.A. Mr. Estévez was Minister of Public Works from January 2005 to March 2006, and simultaneously, as Minister of Transportation and Telecommunications. He was also a congressman from March 1990 to March 1998 and president of the Lower Chamber of Congress from March 1995 to November 1996. Mr. Estévez holds a degree in economics from the Universidad de Chile.
Rodrigo Manubens M. has been a member of our board of directors since 2001. He is the chairman of Banchile Compañía de Seguros de Vida S.A. director and chairman of the Director Committee of Aguas Andinas S.A. and a director of the Bolsa de Comercio de Santiago (the Santiago Stock Exchange). Mr. Manubens was a member of the board of directors of Banco de A. Edwards from 1999 until 2001. From 1985 to 1999, Mr. Manubens was a member of the board of directors of Banco O’Higgins and retained such position following the merger between Banco O’Higgings and Banco Santiago. From 1995 to 1999, he was chairman of Banco Tornquist in Argentina and a member of the board of directors of Banco Sur in Peru and Banco Asunción in Paraguay. Mr. Manubens also served as a director and chairman of the board of directors of Endesa Chile S.A for ten years. Mr. Manubens holds a degree in business administration from Universidad Adolfo Ibañez and a master’s degree from the London School of Economics and Political Science.
Thomas G. Fürst has been a member of our board of directors since 2004. Previously, Mr. Fürst was the vice chairman of the board of directors of Compañía Cervecerías Unidas S.A. and a member of the board of directors of several other companies, including Embotelladoras Chilenas Unidas S.A., Viña Dassault-San Pedro S.A, Southern Breweries Establishment, CCU Argentina S.A. and Compañía Industrial Cerveceria S.A. (CICSA). Mr. Fürst was a founder and member of the board of directors of Parque Arauco. In addition, he is a partner and member of the board of directors of Plaza S.A. and Nuevos Desarrollos S.A. Mr. Fürst holds a degree in civil construction from Pontificia Universidad Católica de Chile.
Former director
On March 27, 2013 Mr. Guillermo Luksic, a distinguished member of our board of directors since 2001 and a member of the controlling group of our bank, passed away.
135
Table of Contents
Senior Management
Our current executive officers are as follows:
|
Executive Officers |
Position |
Age | ||
|
Arturo Tagle Quiroz |
Chief Executive Officer | 55 | ||
|
Pedro Samhan E |
Chief Financial Officer | 63 | ||
|
Nelson Rojas P. |
General Legal Counsel | 60 | ||
|
Mauricio Baeza L. |
Manager—Corporate Risk Division | 51 | ||
|
Jorge Tagle O. |
Manager—Commercial Division (Individual and SME Banking) | 44 | ||
|
Ignacio Vera A. |
Manager—Operations and Technology Division | 55 | ||
|
Cristián Lagos C. |
Manager—Human Resources Division | 48 | ||
|
Eduardo Ebensperger O. |
Manager—Wholesale, Large Corporations and Real Estate Division | 48 | ||
|
Juan Cooper A. |
Manager—Consumer Finance Division | 52 | ||
|
Felipe Echaiz B. |
Manager—Global Compliance Division | 47 | ||
|
Alain Rochette G. |
Manager—Corporate and Investment Banking Division | 53 | ||
|
Oscar Mehech C. |
Manager—Risk Control Division | 49 |
Arturo Tagle Q. was appointed our Chief Executive Officer in May 2010. From November 2009 to April 2010, he was the Managing Director of our Institutional and Investors Relations Division, and from 2008 to November 2009 he was the Managing Director of our Strategic Development Division. From 2002 to 2007, Mr. Tagle was our Chief Financial Officer and from 1998 to 2001 he was head of our Internal Audit and Control Division. He is also a member of the board of directors of Banchile Asesoría Financiera S.A., Socofin S.A., Banchile Securitizadora S.A., and Banchile Administradora General de Fondos S.A., and a member of the executive committee of Banchile Corredores de Seguros Limitada. Mr. Tagle joined us in 1995. From 1990 to 1994, he was General Manager of the Chilean Bankers Association, and from 1984 to 1989 Director of Research at the SBIF. Mr. Tagle is also the Chief Executive Officer of Sociedad Matriz del Banco de Chile S.A. and SAOS since 1996. He holds a degree in Business Administration from the Pontificia Universidad Católica de Chile and a master’s degree in Business Administration from the University of Chicago.
Pedro Samhan E. was appointed our chief financial officer in January 2008. In August 2008, he was appointed as director of Banchile Trade Services Limited. Prior to his current position, Mr. Samhan was the chief financial officer of Citigroup Chile for several years. He served as a member of the board of directors of Cruz Blanca Seguros de Vida from 1994 to 1997, AFP Habitat from 1996 to 2006 and Compañía Minera Las Luces from 1994 to 1996. Mr. Samhan was chief financial officer of Citicorp for Caribbean and Central America from 1990 to 1993 and investment banking head of Citicorp Chile from 1988 to 1990. Mr. Samhan holds a degree in civil industrial engineering from Universidad de Chile.
Nelson Rojas P. has been our general counsel and secretary of our board of directors since 2004. In 2002, he joined us as deputy general counsel. Mr. Rojas joined Banco de A. Edwards in 1987 and was the general counsel and secretary of the board of directors of Banco de A. Edwards from 1997 to 2002. He is also vice president of the legal affairs committee of the Chilean Bank Association. Mr. Rojas holds a degree in law from the Universidad de Chile.
Mauricio Baeza L. has been the manager of our Corporate Risk Division since December 2005. Mr. Baeza joined us in 1997 and was manager of the risk division of Banco de A. Edwards during 2001. He was risk manager at Banco Santiago from 1993 to 1997. He is the secretary of our director’s loan committee, SOCOFIN S.A. Committee Advisor, Finance, International and Financial Risk Committee Advisor, and participates of the Portfolio Risk Committee and the Operational Risk Committee. Currently he is Chairman of the Risk Committee of the Chilean Banking Association. Mr. Baeza is also a member of the Investment committee of Banchile Fondo Inmobiliario and he is a director of the Foundation Villa Padre Hurtado a charity organization. Mr. Baeza holds a degree in civil engineering from the Pontificia Universidad Católica de Chile.
Jorge Tagle O. leads our Commercial Division (Individual and SME Banking), including Marketing, Individual and Small and Medium-Sized Companies and Branches since September 2012, and before that he was our Vice-Chief Executive Officer since October 2011. Previously, Mr. Tagle served in different executive positions mainly within the Luksic Group. From September 2008 to August 2011, he was Executive Vice-President of Nexans S.A.. Between 2005 and 2008, he was Corporate General Manager of Alusa S.A. From 2002 to 2005, he was Chief Financial Officer of industrial conglomerate Madeco S.A. From 1999 to 2002, he was the Manager for New Projects at Quiñenco S.A. the holding company of the Luksic Group. Mr. Tagle holds a degree in civil industrial engineering from the Pontificia Universidad Católica de Chile and a master’s degree in Business Administration from Wharton School, University of Pennsylvania.
136
Table of Contents
Cristián Lagos C. joined us as manager of our Human Resources Division in May 2012. From 2008 to March 2012 he was the Corporate Human Resources and Reputational Manager of Compañía General de Electricidad S.A. Before that, he was the Manager of the Planification and Human Resources Division of Banco Sudaméricano, and after the merger between this Bank and Scotiabank, he occupied the same position in the latter. Additionally, he was the Human Resources manager of Chilesat S.A., and Corporate Manager of Telmex S.A after the merger of Chilesat S.A. with said company. Mr. Lagos is a psychologist of the Diego Portales University, and he participated in the PDD Program of ESE.
Ignacio Vera A. was appointed head of our Operations and Technology Division on February 2014. Previously, Mr. Vera was from 2009 to 2013 the Head of Internet, Mobile and Offshore Technology Centers for Barclays Bank. From 2007 to 2009 he was the Chief Technology Service Officer of HSBC Mexico. Prior to this position he worked for HSBC in the Canada Development Centre and was in charge of the corporate and trade internet solution (HSBCnet). Mr. Vera was also CIO of HSBC Group in Argentina and from 1982 to 1991 he worked at the Stock Exchange Argentina Bank where he held various IT positions. Mr. Vera has a Bachelor in Computer Science degree from the University of Buenos Aires and has taken courses at Wharton School University of Pennsylvania (USA), INSEAD Business School in Fontainebleau (France), and the University of Chicago Booth School of Business (USA).
Eduardo Ebensperger O. has been the manager of the Large Companies and Real Estate Division since January 2008; before he was manager of the Middle Market Companies Division from 2005 to 2007, and was previously the Chief Executive Officer of Banchile Factoring S.A. from 2002 to 2005. He joined Banco de A. Edwards in 1989. Mr. Ebensperger was manager of the Medium Size Companies Division and Manager of the regional branches of Banco de A. Edwards from 1997 to 2001. Presently, Mr. Ebensperger is the chairman of the board of directors of Artikos S.A. He is also currently a member of the board of Banchile Citi Global Markets (Banchile Asesoría Financiera S.A.), Banchile Factoring S.A. and Banchile Securitizadora S.A. Mr. Ebensperger holds a degree in Business and Economic Science from the Universidad de Chile.
Juan Cooper A. has been the manager of our Consumer Finance Division Banco CrediChile since 2003. He was the chief executive officer of Altavida Santander Compañía de Seguros de Vida S.A. from 2001 to 2002 and the manager of Santiago Express, the consumer division of Banco Santiago, from 1997 to 2000. He is also currently a member of the board of directors of Socofin S.A., and a member of the executive committee of Banchile Corredores Seguros Limitada. Mr. Cooper has a degree in business administration from the Universidad de Chile and a master’s degree in business administration from the Pontificia Universidad Católica de Chile.
Felipe Echaiz B. has been the manager of our Global Compliance Division since January 2008. He joined us as a result of our merger with Citibank Chile. Mr. Echaiz worked at Citibank for ten years and was Citigroup Chile country compliance officer from 2006 to 2007. In 2003, he was the deputy director to the Anti-Money Laundering and Organized Crime Unit at the Public Prosecutor’s Office. Mr. Echaiz is a member of the executive committee for Anti-Money Laundering of the Chilean Banks Association and holds a degree in law from the Pontificia Universidad Católica de Chile and a master’s degree in finance and economics from the Universidad de Chile.
Alain Rochette G. has been the manager of our Corporate and Investment Banking Division Manager since 2013. Prior to that, he was advisor to the CEO for the Corporate and Investment Banking Division and General Coordinator for the Treasury, Investment and Corporate Divisions. Previously, he held diverse positions in Citibank including Executive Director of Markets and Treasury for Latin America based in the U.S., CFO of Citibank Chile and 15 years in diverse regional positions in Japan and the United States. Mr. Rochette holds a degree in industrial engineering from Universidad de Chile.
Oscar Mehech C. was appointed head of our Risk Control Division in July 2008 after holding various positions with us, which include being head of our Regulatory Policies Division, head of our Global Compliance Division and deputy general counsel. Prior to joining us in 2002, he was deputy general counsel at Banco de A. Edwards. Mr. Mehech is the chairman of the internal audit committee of the Chilean Banking Association and the vice chairman of the surveillance committee of Depósito Central de Valores S.A. He holds a law degree from Universidad de Chile and a master’s degree in business administration from the Pontificia Universidad Católica de Chile.
137
Table of Contents
COMPENSATION
The table below presents the amount of compensation, as established by our shareholders, to the members of our board of directors for the year ended December 31, 2013. These amounts include remuneration for services, fees for attendance at meetings of our board of directors, meetings of committees of our board of directors and meetings of board of directors of our subsidiaries, consulting services and travel expenses.
|
Name of Director |
Remuneration |
Fees for
Attending Meetings of our Board of Directors |
Fees for Attending Meetings
of Committees of our Board of Directors and Meetings of the Board of Directors of our Subsidiaries |
Total | ||||||||||||
| (in millions of Ch$) | ||||||||||||||||
|
Pablo Granifo Lavín |
Ch$ | 363 | Ch$ | 48 | Ch$ | 321 | Ch$ | 732 | ||||||||
|
Andrónico Luksic Craig |
149 | 13 | — | 162 | ||||||||||||
|
Jorge Awad Mehech |
50 | 24 | 113 | 187 | ||||||||||||
|
Jorge Ergas Heymann |
50 | 19 | 46 | 115 | ||||||||||||
|
Jaime Estévez Valencia |
50 | 23 | 97 | 170 | ||||||||||||
|
Guillermo Luksic Craig |
12 | — | — | 12 | ||||||||||||
|
Jean-Paul Luksic Fontbona |
34 | 10 | 2 | 46 | ||||||||||||
|
Rodrigo Manubens Moltedo |
50 | 23 | 52 | 125 | ||||||||||||
|
Gonzalo Menéndez Duque |
50 | 20 | 110 | 180 | ||||||||||||
|
Francisco Pérez Mackenna |
50 | 21 | 60 | 131 | ||||||||||||
|
Thomas Fürst Freiwirth |
50 | 20 | 39 | 109 | ||||||||||||
|
Jacob Ergas Ergas |
— | — | 8 | 8 | ||||||||||||
|
Other subsidiary directors |
— | — | 149 | 149 | ||||||||||||
|
|
|
|
|
|
|
|
|
|||||||||
|
Total |
Ch$ | 908 | Ch$ | 221 | Ch$ | 997 | Ch$ | 2,126 | ||||||||
|
|
|
|
|
|
|
|
|
|||||||||
Consistent with Chilean law, we do not disclose to our shareholders, or otherwise make public, information regarding the compensation of our executive officers. For the year ended December 31, 2013, the aggregate amount of compensation paid to our executive officers, including the executive officers of our subsidiaries, was Ch$6,883 million. Pursuant to the Chilean Corporations Law, our directors/audit committee must approve compensation plans, but we are not required to have a compensation committee. For the year ended December 31, 2013, no amounts were set aside or accrued by us to provide pension, retirement or similar benefits for our directors and officers. None of our directors is a party to any agreement with us or any of our subsidiaries that provides for benefits upon termination of his appointment as a director.
BOARD PRACTICES
Governance Practices
The board of directors delegates certain functions and activities to our committees to research, evaluate and report to the board of directors regarding specific matters which may affect our businesses.
The Directors/Audit Committee
Prior to March 24, 2005, our directors committee and audit committee were separate committees performing independent functions for the board of directors. On March 24, 2005, the board of directors approved the merger of our directors committee with our audit committee, forming the directors/audit committee. The directors/audit committee’s primary objectives are to seek the efficiency, maintenance, application and functioning of our internal control systems and compliance with applicable rules and procedures governing our business; to identify our business risks; to supervise the activities of both the Risk Control Division and the Global Compliance Division, ensuring their independence from management; to serve as an mediator and coordinator of tasks between the internal audit work and our independent auditors; and to act as a communication channel between our internal audit team, our independent auditors and our board of directors.
138
Table of Contents
Our directors/audit committee is composed of three members appointed by the board of directors. The directors/audit committee is currently composed of the following individuals:
| • |
Jorge Awad M. (chairman and financial expert); |
| • |
Jaime Estevez V.; and |
| • |
Juan Enrique Pino V. |
Mr. Awad and Mr. Estevez were appointed as members of the directors/audit committee by our board of directors at the meeting held on April 12, 2007. Mr. Pino was appointed to the directors/audit committee by our board of directors at the meeting held on August 25, 2013.
Messrs. Awad and Estevez satisfy the independence requirements of both Chilean law and Rule 10A-3 under the Exchange Act and are full voting members of our directors/audit committee.
Mr. Juan Enrique Pino is exempt from the independence requirements of Rule 10A-3 of the Exchange Act pursuant to the exemption under Rule 10A-3(b)(1)(iv)(D). Pursuant to that exemption, Mr. Pino is a non-voting member of our directors/audit committee with respect to all matters required to be addressed by our directors/audit committee under U.S. federal securities laws.
The directors/audit committee met 18 times during 2013. The budget of the directors/audit committee is approved annually at the ordinary annual shareholders’ meeting. The directors/audit committee satisfies the applicable requirements of the SBIF and operates pursuant to a charter document. The SBIF recommends that at least one of the members of the directors/audit committee be experienced with respect to the accounting procedures and financial aspects of banking operations. The directors/audit committee submits a report regarding its activities to our board of directors after each directors/audit committee meeting and presents an annual report at our ordinary annual shareholder’s meeting. As established in the directors/audit committee’s charter, the chief executive officer, the general counsel and the manager of our Risk Control Division, or their respective deputies, shall also attend the directors/audit committee meetings. The directors/audit committee may also invite other persons to attend meetings.
The directors/audit committee may appoint independent personnel to carry out specific duties. The directors/audit committee’s specific objectives include:
| • |
Seeking efficiency, maintenance, application and functioning of our internal control systems, and compliance with rules and procedures; |
| • |
Supervising compliance with rules and procedures governing the banking business and identifying the business risks of our and our subsidiaries’ activities; |
| • |
Supervising the activities of our Risk Control Division and ensuring its independence from management; |
| • |
Supervising the activities of the Global Compliance Division, serving as an intermediator and coordinator of tasks between our internal audit work and our independent auditors, and acting as a communication channel between these teams and our board of directors; |
| • |
Examining the fees budget for our independent auditors and the credit rating agencies; |
| • |
Analyzing the reports, content, procedures and scope of the revisions by our independent auditors and credit rating agencies; |
| • |
Analyzing and generating information in the annual internal audit program and the results of internal audits and revisions; |
| • |
Analyzing the interim and annual financial statements; |
| • |
Analyzing our financial statements included in the Form 20-F, for presentation to the SEC; |
139
Table of Contents
| • |
Gathering information on accounting changes occurring during the year and their effects; |
| • |
Reviewing issues affecting the internal control systems; |
| • |
Analyzing the remuneration systems and compensation plans for managers and executive officers; |
| • |
Analyzing the 2013 annual performance self-evaluation process; |
| • |
Analyzing related party transactions pursuant to Title XVI of the Chilean Corporations Law; |
| • |
Analyzing policies relating to operational risk and progress in the risk-management process and SOX self-evaluation; |
| • |
Analyzing and informing on matters related to the Global Compliance Division, principally regarding the revision of policies for detecting and sanctioning money laundering transactions; and |
| • |
Reviewing customer claims filed with the SBIF and the Customer defense Division of the Chilean Association of Banks and Financial Institutions. |
Portfolio Risk Committee
The main function of the portfolio risk committee is to inform our board of directors of changes in the composition and risk of our loan portfolio, and our corresponding global exposure, sector-specific exposure or business-specific exposure. The portfolio risk committee closely reviews the performance of our principal debtors, overdue loan ratios, past-due loan indicators, write-offs and allowances for loan losses.
The portfolio risk committee prepares proposals for discussion with, and approval by, our board of directors with respect to credit policies, portfolio evaluation methods and the calculation of allowances for expected loan losses. The portfolio risk committee also performs analysis of the adequacy of allowances, authorizes extraordinary charge-offs of loans once recovery attempts have been exhausted and controls the liquidation of assets acquired in lieu of payment.
The portfolio risk committee meets on a monthly basis and is composed of the chairman of our board of directors, our chief executive officer, two additional members or advisors of our board of directors, the manager of our Corporate Risk Division, and the deputy manager of Intelligence and Information Risk Area.
Credit Committees
Our governance structure relating to the evaluation process of commercial loans is based on the segments and risks involved. Each credit decision should be made with the participation of committee members with sufficient authority over a particular type of loan.
A member of the Corporate Risk Division is required to approve most credit decisions exceeding UF 6,000. Such decisions are made by different loan committees, the highest of which, in terms of hierarchy, is the board loan committee, composed of our chief executive officer, the manager of our Corporate Risk Division and at least three members of our board of directors, all of whom review all transactions exceeding UF 750,000 on a weekly basis. Any member of the board of directors may participate in the board loan committee.
The Corporate Risk Division participates independently and autonomously in each committee from our business areas.
For retail banking, we have loan committees that in exceptional cases review individual customers when they do not meet our customer profile policies, payment behavior requirements or maximum financing amounts.
140
Table of Contents
Finance, International and Market Risk Committee
The main function of the finance, international and market risk committee is to analyze the evolution of our financial positions and the market risks (price and liquidity) that these financial positions generated, particularly the control of risks related to internal and regulatory limits and/or warnings. This committee also analyzes international financial exposure and major credit exposures generated by derivative transactions.
The finance, international and market risk committee meets monthly and is composed of the chairman of our board of directors, four other members or advisors of our board of directors, our chief executive officer, the manager of our Corporate and Investment Banking Division, our corporate treasurer and the manager of our financial risk area. Committee members conduct analyses and make presentations to the committee regarding certain matters, including:
| • |
Knowledge of current market risks, which allows forecasting of potential future losses; |
| • |
Review of estimated results of certain financial positions generated in isolation in order to measure the risk-return ratio of the treasury businesses, as well as changes in and forecasts of the use of capital based on best estimates of future credit and market risks; |
| • |
Analysis of the liabilities of international financial exposure and major credit exposures generated by derivative transactions; and |
| • |
The design of policies and procedures for setting, controlling and reporting financial position limits and warnings. |
Asset Laundering and Financing of Terrorism Prevention Committee
The asset laundering and financing of terrorism prevention committee was set up in April 2006 with the purpose of defining the policies and procedures that would comprise the asset laundering and financing of terrorism prevention system, as well as evaluating compliance and deciding on all matters related to these subjects.
This committee includes the chairman of our board of directors, our chief executive officer, our general counsel, the manager of our Operations and Technology Division and the chief executive officer of Banchile Administradora General de Fondos S.A. The manager of our Risk Control Division, the manager of our Global Compliance Division and the manager of our asset laundering prevention area may also attend and participate in the meetings.
The asset laundering and financing of terrorism prevention committee meets monthly and has the following functions:
| • |
To approve the policies and procedures concerning the gathering of information on customers and their activities and the acceptance and monitoring of their accounts, products and operations; |
| • |
To approve policies and procedures concerning unusual transaction detection systems; formal channels of information to senior management; and monitoring, analysis and reporting mechanisms; |
| • |
To approve policies and procedures concerning surveillance methods and relations with correspondent banks; |
| • |
To approve policies and procedures concerning staff selection, training programs and codes of conduct; |
| • |
To approve the policies and procedures concerning asset laundering and terrorism financing prevention; |
| • |
To appoint persons to perform specific functions in accordance with current regulations on the prevention of asset laundering and terrorism financing; |
| • |
To analyze the results of the reviews conducted to verify compliance with current policies and procedures; |
| • |
To consider the transactions analyzed and decisions made by the transactions analysis committee; |
| • |
To consider activities developed to train staff in asset laundering and terrorism financing prevention; |
141
Table of Contents
| • |
To consider and approve modifications to procedures proposed by our Global Compliance Division that improve existing controls for the prevention of asset laundering and terrorism financing; and |
| • |
To inform our board of directors of regulatory changes related to the prevention of asset laundering and financing of terrorism. |
Upper Operational Risk Committee
Created in April 2014, the Upper Operational Risk Committee is responsible for (i) identifying the Bank and its subsidiaries’ exposure to operational risk at both an entity and business level; (ii) evaluating our corporate strategy for managing operational risk, information security management system, business continuity and reputational risk; (iii) approving strategies as defined by the Operational Risk Executive Committee in accordance with the Bank´s operational risk policy; (iv) encouraging the establishment of guidelines and directing efforts to properly manage and mitigate operational risk; (v) reporting to the board on the management model and the level of operational risk exposure of the Bank and its subsidiaries and additional mitigation and/or prevention efforts adopted by the Bank; (vi) ensuring compliance with the current regulatory framework and optimizing capital use; (vii) ensuring compliance with the Bank´s operational risk policy; and (viii) ensuring that our strategy and defined plans ensure the solvency of the Bank and its subsidiaries in the long run by avoiding risk contingencies that could jeopardize the continuity of the Bank.
This committee is chaired by our Chairman and is composed of one member of the board appointed by the Board, our chief executive officer, the manager of our Corporate Risk Division, the manager of our Operations and Technology Division, and the manager of our Operational Risk Area.
Leasing Committee
The main function of the Leasing Committee is to review the monthly evolution and results of our Leasing Area by means of a report that consolidates the management of the business divisions of the Bank.
This committee includes the chairman of our board of directors, one member or advisor of our board of directors, our chief executive officer, the manager of our Wholesale, Large Corporations and Real Estate Division, the manager of our Commercial Division, the manager of branches of our Commercial Division, the manager of Products for Corporations and the manager of the Leasing Area.
Factoring Committee
The Factoring Committee was set up in 2013, after the merger of Banchile Factoring S.A. with us. Its purpose is to analyze the evolution and results of our Factoring Area in terms of volume, prices, margins, provisions and expenses and analyze the factoring product for each business area of the Bank.
This committee is chaired by the chairman of our board of directors, one member or advisor of our board of directors, our chief executive officer, the manager of our Wholesale, Large Corporations and Real Estate Division and the manager of the marketing area of the Commercial Division.
Consumer Finance Division Committee
The main purpose of the Consumer Finance Division Committee is to analyze on a monthly basis the evolution and results of our Consumer Finance Division, its growth, and its strategies to gain new customer segments and maximize the results of the division.
This committee includes the chairman of our board of directors, three members of our board of directors, our chief executive officer, the manager of our Commercial Division and the manager of our Consumer Finance Division.
Committees composed of Banco de Chile’s senior management
The main committes composed of Banco de Chile’s senior management executivies are:
Disclosure Committee
In May 2003, we established the disclosure committee to ensure accurate market disclosure of our and our subsidiaries’ consolidated financial information. The members of the disclosure committee include our chief accountant, our senior lawyer for international matters and the manager of our research and planning area, together with the manager of our Institutional and Investor Relations Division, our chief financial officer and the manager of our Risk Control Division.
The members of the disclosure committee are involved in reviewing quarterly reports and in general all financial information disclosed by us prior to each disclosure.
Ethics Committee
The ethics committee was established in 2005 to define, promote and regulate behavior of professional and personal excellence consistent with our philosophy and values to be followed by all our staff in order to meet the expectations of our customers.
To meet these goals and promote a culture of ethical behavior, the ethics committee sets policies on ethics and ensures their compliance, develops training plans related to ethics in our business, and reinforces positive behavior among our staff. The ethics committee also acts as a forum to address, discuss and resolve any conduct by our staff that is inconsistent with our values. This committee is chaired by the manager of our Human Resources Division and includes our general counsel, the manager of our Risk Control Division, the manager of our Global Compliance Division, the manager of our Commercial Division (Individual and SME Banking), the manager of our Operations and Technology Division, and the manager of our Wholesale, Large Corporations and Real Estate Division.
142
Table of Contents
Management Committee
The management committee, the highest coordinating body of our management, is chaired by our chief executive officer, and its principal function is to discuss main strategic guidelines and to analyze the market and the banking industry.
This committee resolves issues relating to our internal policies and analyzes our performance. In this committee, numerous divisions exchange their points of view as to our business and prioritize joint initiatives. Each year, this committee outlines the foundations for our annual plan. After the individual annual plan for each business area is agreed upon by our chief executive officer and each division manager, under the coordination of our chief financial officer, the overall plan is submitted to our board of directors for approval. This committee also reviews progress and budgets for approved plans on a monthly basis.
Operational Risk Executive Committee
Created in 2009, the operational risk executive committee is responsible for identifying, prioritizing and establishing strategies to mitigate key operational risk events relating to internal and external fraud; risks associated with customer, product and business practices; damage to tangible assets; and disturbance of normal activity resulting from system malfunctions or failures in executing, delivering and processing products/services. This committee is also responsible for defining and evaluating our corporate strategy for managing operational risk, establishing guidelines and directing efforts to create controls and improve internal processes in order to reduce operational losses.
To comply with these objectives and foster an awareness of operational risk, this committee promotes a series of training activities and communicates to our staff important information relating to operating risks.
This committee is chaired by our chief executive officer and includes our chief financial officer, the head of the security and risk prevention area, the manager of our Risk Control Division, the manager of our Operations and Technology Division and the manager of our operational risk area.
Quality Committe e
This main objective of this committee is to generate strategic guidelines for decision-making on issues related to the attention of customers, through all channels available at the bank, by means of the analysis of customer perception and relevant competition. In addition, this committee supervises projects and initiatives aimed at increasing the permanence and referrals of our clients.
This committee is chaired by our chief executive officer, the manager of our Commercial Division, the manager of our Wholesale, Large Corporations and Real Estate Division, the manager of our Consumer Finance Division, the manager of our Operations and Technology Division, the manager of the marketing Area of the Commercial Division, the manager of the marketing Area of the Wholesale and Corporate Business, the manager of clients of the Commercial Division and the manager of the Quality Area of the Commercial Division.
143
Table of Contents
Internal Communications Committee
The internal communications committee defines policies and designs our action plan to ensure that appropriate information reaches all of our employees. This committee ensures that information sent to our employees is adequate to allow them to correctly perform their functions, communicates the organization’s fundamental strategies and policies and its performance, promotes collaboration and team work, fosters personal development, encourages first-rate performance and cultivates a pleasant work environment. The internal communications committee is led by the manager of our Human Resources Division, and includes managers from the following divisions:
| • |
Chief Financial Officer; |
| • |
Operations and Technology Division; |
| • |
Institutional and Investor Relations Division; |
| • |
Commercial Division (Individual and SME Banking); |
| • |
Corporate and Investment Banking Division; |
| • |
Wholesale, Large Corporation and Real Estate Division; |
| • |
Consumer Finance Division; and |
| • |
Development and Quality Manager. |
Citigroup and Banco de Chile Cooperation Agreements Committees
In order to control and review the evolution of the joint initiatives resulting from our strategic association with Citigroup Inc., additionally to the Global Connectivity Agreement Steering Committee, the following operating committees have been set up: (i) Global Transaction Services Committee; (ii) International Personal Banking Committee; (iii) Investment Banking Committee; (iv) Retail Initiatives Committee; and (v) Financial Control Committee of the Cooperation Agreement. The committees mentioned above are composed of the chairman of our board of directors, our chief executive officer and two members of our board of directors that have been appointed by Citigroup Inc. Also taking part in these meetings, except in the Global Connectivity Agreement Steering Committee, are division managers for each particular business line and the managers of the areas directly responsible for the respective business.
The main purpose of the Global Connectivity Agreement Steering Committee is to act as a communication link between Banco de Chile and Citigroup in connection with the agreements entered into between them. The purposes of the other committees are:
(i) Global Transaction Services Committee (GTS)
The global transaction services committee was set up with the purpose of monitoring the overall performance of the transactional services areas in accordance with the Global Connectivity and Cooperation Agreements and, in particular, the functions of local and international cash management and custody for foreign investors.
(ii) International Personal Banking Committee (IPB)
The main goal of the international personal banking committee is to monitor the performance of the IPB unit in Banco de Chile in relation to the services provided by us to Citibank with respect to certain financial products and services offered abroad to residents of Chile. This committee seeks to strengthen Citibank’s commercial activities with individuals that are not residents of the United States.
144
Table of Contents
(iii) Investment Banking Committee
The objective of the investment banking committee is to foster the development of cross-border merger and acquisition transactions, debt issuances and acquisitions, and capital markets for our customers and customers of Citigroup Inc. doing business in Chile. This committee is responsible for monitoring the execution of transactions performed under the Global Connectivity Agreement and collaborating in investment banking business opportunities.
(iv) Retail Initiatives Committee
The main purpose of this committee is to share best practices and business opportunities between both institutions.
(v) Financial Control Committee of the Cooperation Agreement
The most important purpose of the financial control committee of the Cooperation Agreement is to monitor in detail the operative and financial performance of the Global Connectivity and Cooperation Agreements.
Approval of Policies and Procedures under the Merger Agreement
The Merger Agreement between us and Citibank Chile provided that as a general rule our board of directors would approve and implement certain policies relating to the operation of the joint entity. At the time of filing of this annual report, policies regarding the following issues were approved and implemented:
145
Table of Contents
| • |
Administration of Subsidiaries; |
| • |
Fraud Management; |
| • |
Anti-Boycott; |
| • |
Issue Tracking, Management and Escalation Process; |
| • |
Operational Risk; |
| • |
Credit Risk; |
| • |
Vendor Selection and Management Process; |
| • |
Web Site Standards; |
| • |
Capital Expenditure Policy; |
| • |
Expense Management Policy; |
| • |
Accounting Policies and Procedures; |
| • |
New Products and Services Policy; |
| • |
Tax Standards for Tax Sensitive Transactions; |
| • |
Tax Policy and Procedures; and |
| • |
Fiduciary Policy. |
In addition to the policies mentioned above, we are in the process of supplementing other policies currently in force that are material to our business, such as prevention of asset-laundering, credit risk and market risk.
146
Table of Contents
EMPLOYEES
The following table shows a breakdown of our full-time, permanent employees at the dates indicated:
| As of December 31, | ||||||||||||
| 2011 | 2012 | 2013 | ||||||||||
|
Banco de Chile |
10,482 | 10,737 | 11,023 | |||||||||
|
Subsidiaries |
3,647 | 3,844 | 3,700 | |||||||||
|
|
|
|
|
|
|
|||||||
|
Total |
14,129 | 14,581 | 14,723 | |||||||||
|
|
|
|
|
|
|
|||||||
As of December 31, 2013, we had 14,723 employees (on a consolidated basis). Also, 5,904 of our employees were unionized, which represented a 40.1% of our total staff. As of the same date, all management positions were held by non-unionized employees.
In 2011 we renegotiated three out of the four existing collective agreements that were due to expire in 2012 and signed four-year agreements with all of them. Also, we renegotiated the collective bargaining arrangement related to an agreement that expired in 2011 with “Citibank union” that, as of that date, comprised 1,016 employees, representing 15.0% of our total unionized workforce in 2011. Despite our efforts to offer high-quality standards this union—as did other unions—decided to undertake a 15-day strike, as permitted by the Chilean labour law. After the strike, we reached a three-year agreement with this union.
Similarly, during 2012 we renegotiated the existing collective agreements of two of our subsidiaries, Socofin and Promarket, which jointly represented 17.3% of our total workforce as of December 31, 2012. Both of these agreements were due to expire in 2012. For one of the agreements we reached a two-year agreement, whereas for the other collective agreement we signed a four-year agreement, which are due to expire in 2014 and 2016, respectively.
These collective bargaining processes have allowed us to equalize benefits among all of our employees, since we formerly had differentiated agreements due to our successive merger transactions. We believe these new agreements will improve relations with our employees, which we believe are satisfactory, and simplify the compensation system to employees across the corporation.
We have comprehensive personnel training and development programs that include internal courses on operational, technical and commercial matters, as well as participation in external seminars and conferences. In 2013, the total cost of training programs was approximately 0.9% of the Bank’s consolidated personnel salaries and expenses. These expenses were associated with 564 training courses that were attended by 10,303 people. According to our management information systems, every trained person attended—on average—approximately three training courses during 2013.
We do not maintain any pension or retirement programs for the vast majority of our employees. We do, however, pay certain long-serving key employees a severance payment upon retirement. Although we have provided productivity bonuses to individual employees on a discretionary basis, we do not maintain a formal profit-sharing plan.
147
Table of Contents
SHARE OWNERSHIP
Mr. Andronico Luksic and Mr. Jean Paul Luksic, members of our board of directors since March 2002 and April 2013, respectively, together with members of their family, control Quiñenco S.A. As of April 15, 2014, Quiñenco directly and indirectly owns 50% of LQIF, which in turns owns directly 25.39% of our outstanding shares and 0.17% through Inversiones LQ-SM Ltda. Additionally, Quiñenco S.A. holds 51.22% of the voting rights in Banco de Chile (directly and indirectly through shares of SM-Chile S.A. that are owned by LQIF and Inversiones LQ-SM Ltda. (“LQ-SM”). See Item 7—Major Shareholders, footnote (3)).
LQIF and LQ-SM are vehicles incorporated under Chilean law through which Quiñenco S.A. and Citigroup hold their ownership interests in Banco de Chile. As part of the strategic partnership between Citigroup and Quiñenco, they entered into a framework agreement which was included in our 6-K filed on July 20, 2007. Pursuant to this agreement and following the merger of Citibank Chile into Banco de Chile, Quiñenco S.A. and Citigroup became the shareholders of LQIF, the parent corporation of Sociedad Matriz del Banco de Chile S.A. (“SM-Chile”) and Banco de Chile, among other companies. LQ-SM is an investment vehicle whose major shareholder LQIF owns 99.99% of its shares.
As of April 15, 2014, Citigroup is the owner of 50% of LQIF and Quiñenco, directly and indirectly, owns 50% of LQIF. Regardless of any increase in participation by Citigroup, however, the agreement provides that Quiñenco will remain in control of LQIF and the corporations that are directly or indirectly controlled by LQIF. Accordingly, Quiñenco will maintain the power to elect the majority of the directors of LQIF, SM-Chile and Banco de Chile.
Mr. Jacob Ergas controls Ever I Bae S.p.A., Ever Chile S.p.A. and Inversiones Aspen Limitada. As of April 15, 2014, these holding companies own 2.20%, 2.20% and 1.52% of our outstanding shares, respectively. Mr. Ergas holds 5.93% of the voting rights in Banco de Chile through these holding companies. Mr. Jacob Ergas has not been a member of the board since March 2011, when Mr. Jorge Ergas was appointed to the board of directors. Mr. Jacob Ergas and Mr. Jorge Ergas are father and son.
None of our directors or senior management (other than Mr. Andronico Luksic and Mr. Jean Paul Luksic) owns 1% or more of our outstanding common stock. Further, none of our directors (including Mr. Andronico Luksic and Mr. Jean Paul Luksic) or senior management have different or preferential voting rights with respect to the shares they own.
We do not have any arrangements for involving employees in our capital, including any arrangements that involve the issue or grant of options of our shares or securities.
148
Table of Contents
| Item 7 | Major Shareholders and Related Party Transactions |
MAJOR SHAREHOLDERS
Ownership Structure
As described in “Item 4. Information on the Company—History and Development of the Bank—History—The 1982–1983 Economic Crisis and the Central Bank Subordinated Debt,” the Chilean banking system, including us, experienced significant instability during that time that required the Central Bank and the Chilean Government to provide financial assistance to most Chilean private sector banks which resulted, pursuant to Law No. 18,818 enacted in 1989, in the repurchase by us of our portfolio of non-performing loans from the Central Bank and the assumption of the Central Bank’s subordinated debt relating to our non-performing loans.
In November 1996, pursuant to Law No. 19,396, our shareholders approved a reorganization by which we were converted into a holding company named SM-CHILE S.A. In turn, SM-CHILE organized a new wholly owned banking subsidiary named Banco de Chile, to which it contributed all of its assets and liabilities other than the Central Bank subordinated debt. In addition, SM-CHILE incorporated SAOS S.A. (“SAOS”), a special purpose legal vehicle created by Law 19,396, whose only business purpose is to repay the Central Bank indebtedness. In exchange for assuming the Central Bank indebtedness, SAOS received from SM-CHILE a certain portion of our shares pledged as collateral in favor of the Central Bank of Chile to secure payment to the Central Bank. Pursuant to applicable laws and the bylaws of both SAOS and SM-CHILE, the economic rights of our shares held by SAOS belong to the Chilean Central Bank; however, their voting rights are exercised by the shareholders of SM-CHILE at Banco de Chile’s shareholders’ meetings.
Currently, our major shareholder LQIF holds 51.22% (together with LQ-SM, as further explained below) of the voting rights of our shares. LQIF and Inversiones LQ-SM Ltda. are vehicles incorporated under Chilean law through which Quiñenco S.A. and Citigroup hold their ownership interests in Banco de Chile. The voting rights of LQIF and LQ-SM is the result of the right of LQIF and LQ-SM, pursuant to applicable law and bylaws, to vote (i) our shares owned by LQIF and LQ-SM; (ii) our shares owned by SM-CHILE, based on the ownership percentage of LQIF and LQ-SM in SM-CHILE; and, (iii) our shares owned by SAOS, as a shareholder of SM-CHILE, based on the ownership percentage of LQIF and LQ-SM in SM-CHILE, at our shareholders’ meetings. According to the bylaws of SM-CHILE, the voting rights of SM-CHILE, shares (Series A, B and D) which in turn possess voting rights over Banco de Chile shares, are exercised in accordance with the following rule: each share of SM-CHILE, exercises the voting rights of one of our shares plus 2.38337827 of our shares owned by SAOS. The latter factor is the result of dividing the number of our shares owned by SAOS (28,593,701,789) by the number of total outstanding shares of SM-CHILE, Series A, B and D (11,997,131,195). Consequently, each SM-CHILE share (Series A, B and D) with voting rights over our shares may vote 3.38337827 shares of Banco de Chile. SM-CHILE’s Series E exercises voting rights of Banco de Chile shares in a one-to-one ratio.
Major Shareholders
The following table sets forth certain information regarding the ownership of outstanding shares as of April 15, 2014 for the following:
| • |
each person or entity who is known by us to own beneficially more than 5% of our outstanding shares capital or voting rights; and SAOS, LQIF and SM-Chile. |
| • |
our directors and members of our executive management group, as a group. |
Ownership in Banco de Chile (1)
(As of April 15, 2014)
|
Name |
Amount Owned | Percentage | ||||||
|
SAOS (2) |
28,593,701,789 | 30.69 | % | |||||
|
SM-CHILE |
12,138,543,602 | 13.03 | % | |||||
|
LQIF and LQ-SM (3) |
23,807,364,293 | 25.55 | % | |||||
|
Jacob Ergas (4) |
5,523,510,258 | 5.93 | % | |||||
|
Directors and executive officers as a group |
20,057,213 | 0.02 | % | |||||
149
Table of Contents
Voting Rights in Banco de Chile
(As of April 15, 2014)
|
Name |
Amount Owned | Percentage | ||||||
|
LQIF and LQ-SM |
47,725,305,836 | 51.22 | % | |||||
|
Jacob Ergas |
5,523,510,258 | 5.93 | % | |||||
|
Directors and executive officers as a group |
41,498,002 | 0.04 | % | |||||
| (1) | Percentages are based on 93.175.043.991 shares outstanding as of April 15, 2014. Each share has one vote and all shares have identical voting rights. We have no shares outstanding with special voting rights. |
| (2) | SM-CHILE beneficially owns 100% of SAOS. Our shares owned by SAOS, (which are all pledged as collateral in favor of the Chilean Central Bank to secure repayment of the Central Bank indebtedness) possess economic rights that belong to the Chilean Central Bank, although the voting rights, pursuant to the by-laws of both SAOS and SM-CHILE, are exercised by the shareholders of SM-CHILE, at the Bank’s shareholders’ meetings. In terms of economic rights, all classes of shares of SM-Chile have the right to receive dividends, with the exception of class A shares, which do not have this right (classes B, D and E are entitled to dividends from the income generated by SM-Chile when we decide to distribute dividends). |
| (3) | LQIF and LQ-SM hold 47.13% and 11.11%, respectively, of SM-Chile’s total shares. The total percentage ownership of LQIF and LQ-SM in SM-CHILE, was calculated by adding the total number of shares of LQIF and LQ-SM, as shareholders of record, divided by the total number of shares issued by SM-Chile. LQIF and LQ-SM do not beneficially own all of our shares owned by SM-CHILE because SM-CHILE has, as of April 15, 2014, a total of 17,628 shareholders. LQ-SM is an investment vehicle whose major shareholder LQIF owns 99.99% of its shares. As of its incorporation date (August 26, 2002), we were informed that LQ-SM’s total capital was CLP$73,175,029,140. In connection with the framework agreement executed between Citigroup, Inc. and Quiñenco S.A. in July 2007 and following the merger of Citibank Chile into Banco de Chile, Citigroup became a shareholder of LQIF. As of April 15, 2014, Citigroup is the owner of 50% of LQIF, and Quiñenco directly and indirectly owns 50% of LQIF. Regardless of any increase in participation by Citigroup, however, the agreement provides that Quiñenco will remain in control of LQIF and the corporations that are directly or indirectly controlled by LQIF. Accordingly, Quiñenco will maintain the right to elect the majority of the directors of LQIF, SM-CHILE and Banco de Chile. As of April 15, 2014, members of the Luksic family or their affiliates beneficially owned 81.4% of the common shares of Quiñenco S.A. Mr. Andrónico Luksic and Mr. Jean Paul Luksic are members of our board of directors. |
| (4) | Mr. Jacob Ergas holds his shares through Ever 1 Bae S.p.A., Ever Chile S.p.A. and Inversiones Aspen Ltda., which are holding companies under his control. Mr. Jacob Ergas has not been a member of the board since March 2011 when Mr. Jorge Ergas was appointed director of the board. Mr. Jacob Ergas and Mr. Jorge Ergas are father and son. |
The following charts provide additional information on the voting rights held by LQIF and LQ-SM as of April 15, 2014:
Voting rights of LQIF in Banco de Chile
|
Ownership |
Shares owned by
LQIF |
Voting Ratio |
LQIF Voting Shares
as a result of the application of Voting Ratio in BCH |
Voting Rights
of LQIF (as % ) in BCH |
||||||||||||
|
Direct ownership in BCH |
23,653,093,809 | 1.00000000 | 23,653,093,809 | 25.39 | % | |||||||||||
|
Shares SM-A |
— | 3.38337827 | — | — | ||||||||||||
|
Shares SM-B |
5,497,274,771 | 3.38337827 | 18,599,360,004 | 19.96 | ||||||||||||
|
Shares SM-D |
223,364,308 | 3.38337827 | 755,725,945 | 0.81 | ||||||||||||
|
Shares SM-E |
— | 1.00000000 | — | — | ||||||||||||
|
|
|
|
|
|
|
|
|
|||||||||
|
Total LQ-SM in BCH |
29,373,732,888 | 43,008,179,758 | 46.16 | % | ||||||||||||
|
|
|
|
|
|
|
|
|
|||||||||
Voting rights of LQ-SM in Banco de Chile
|
Ownership |
Shares owned by
LQ-SM |
Voting Ratio as set
in SM-CHILE By -laws |
LQ-SM Voting
Shares as a result of the application of Voting Ratio in BCH |
Voting Rights
of LQ-SM (as % ) in BCH |
||||||||||||
|
Direct ownership in BCH |
154,270,484 | 1.00000000 | 154,270,484 | 0.16 | % | |||||||||||
|
Shares SM-A |
377,528,973 | 3.38337827 | 1,277,323,323 | 1.37 | ||||||||||||
|
Shares SM-B |
971,080,384 | 3.38337827 | 3,285,532,269 | 3.53 | ||||||||||||
|
Shares SM-D |
— | 3.38337827 | — | — | ||||||||||||
|
Shares SM-E |
— | 1.00000000 | — | — | ||||||||||||
|
|
|
|
|
|
|
|||||||||||
|
Total LQ-SM in BCH |
1,502,879,841 | 4,717,126,076 | 5.06 | % | ||||||||||||
|
|
|
|
|
|
|
|||||||||||
150
Table of Contents
RELATED PARTY TRANSACTIONS
In the ordinary course of our business, we engage in a variety of transactions with certain of our affiliates and related parties. Financial information concerning these transactions is set forth in Note 39 to our audited consolidated financial statements as of and for the year ended December 31, 2013, appearing elsewhere in this annual report. The Chilean Corporations Law was amended in October 2009 by Law No. 20,382, which also introduced changes to several others laws to improve Chilean corporate governance. As part of these changes, the concept of related party transactions in the Chilean Corporations Law was amended. The new regulation established different treatment for closely held corporations and for publicly held corporations.
In accordance with the Chilean Corporations Law, related party transactions in publicly held corporations are defined as every negotiation, act, contract or operation in which the corporation deals with any of the following persons: (i) one or more persons related to the corporation, in accordance with the Chilean Securities Law No. 18,045; (ii) a director, manager, administrator, main executive or liquidator of the corporation, acting on its own behalf or on behalf of third parties, or their respective husband or wife or any other person to which such director, manager, administrator, main executive or liquidator, or their husband or wife has a second degree relationship with (either by consanguinity or affinity); (iii) companies or corporations in which the persons mentioned in the previous item are owners, directly or through other juridical or natural persons, of 10% or more of its capital, directors, managers, administrators or main executives; (iv) those established in the bylaws of the corporation or those reasonably agreed by the board of directors; or (v) persons who acted as a director, manager, administrator, main executive or liquidator of the corporation within eighteen months of the relevant transaction.
We may only enter into transactions with related parties if (i) the purpose of the transaction is in our best interest, (ii) the transaction reflects prevailing market prices, terms, and conditions and (iii) the transaction complies with the requirements and procedures specified in the Chilean Corporations Law, which requires our board of directors to approve the relevant transaction based upon the criteria mentioned in items (i) and (ii) of this paragraph. In order for our board of directors to approve any such transactions, the related party involved in or negotiating the transaction must give prior notice to our board of directors.
A violation of these provisions shall not affect the transaction’s validity, but shall grant us, our shareholders or third parties an indemnification right to claim damages for the benefit of the company. The amount of damages claimed shall be equal to the sum of the benefits improperly obtained by the related party as a result of the relevant transaction. All board resolutions approving such related party transactions must be reported to our shareholders at the following ordinary annual shareholders’ meeting. Violations of this provision may result in administrative or criminal sanctions and civil liability to shareholders or third parties who suffer losses as a result of such violation.
The following transactions with related parties may be executed without complying with the requirements previously mentioned, subject to the prior approval of our board of directors: (i) transactions that are not considered material (for this purpose, an act or contract is deemed material if (1) it exceeds 1% of our paid-in capital and reserves and it also exceeds UF 2,000 or (2) it exceeds UF 20,000; and there is a presumption that all contracts celebrated within a period of 12 months constitute one single transaction, irrespective of whether they are executed in one or more separate transactions during such period of time); (ii) transactions that, according to a general policy of customary transactions adopted by the board of directors of the corporation, are considered customary in connection with our corporate purpose; and (iii) transactions among corporations in which we own, directly or indirectly, at least 95% of the stake of the counterparty.
In connection with number (ii) above, on December 29, 2009, our board of directors established the following general policy which permits us to carry out certain transactions with related parties without the requirements and procedures set forth in the Chilean Corporations Law. The general policy adopted by our board of directors permits, among other things, transactions in the ordinary course of our business, such as opening current accounts, making deposits, extending loans or credit lines with or without collateral, factoring transactions, the sale and transfer of commercial paper, collections, payments and funds transfers, foreign exchange transactions and issuing letters of credit. This general policy has also been extended to our affiliates.
We believe that we have complied with the applicable requirements of the Chilean Corporations Law in all transactions with related parties and affirm that we will continue to comply with such requirements. See Note 39 to our audited consolidated financial statements as of and for the year ended December 31, 2013, appearing elsewhere in this annual report for a more detailed accounting of our transactions with related parties.
On July 19, 2007, Quiñenco S.A., Citigroup Inc. and Citibank Overseas Investment Corporation entered into a Master Joint Venture Agreement (the “Framework Agreement”) that set forth the parameters of a partnership between Quiñenco S.A. and Citigroup Inc., including the eventual merger of Citibank Chile into us. The Framework Agreement provided that Citigroup Inc.
151
Table of Contents
would initially acquire a 32.96% equity interest in LQIF, our controlling shareholder, and would be entitled to increase its stake in LQIF to either 41.4778% or 50% through the exercise of several options. Citigroup Inc. could also be required to increase its stake in LQIF to 50% if Quiñenco S.A. exercised a put option under the Framework Agreement. The acquisition by Citigroup Inc. of its initial interest in LQIF occurred, with effect on January 1, 2008, under the terms of the Framework Agreement and the corresponding Merger Agreement between us and Citibank Chile. For purposes of the Merger Agreement, the operations and businesses of Citibank Chile that were effectively contributed to us were deemed to represent 10.497% of the post-merger entity and, together with other assets and businesses contributed by Citigroup Inc. to LQIF, were the basis for the issuance by LQIF of the 32.96% equity interest in LQIF transferred to Citigroup Inc. As consideration for the merger, we issued and conveyed to LQIF (and indirectly, the holders of Citibank Chile shares) 8,443,861,140 no-par value “Banco de Chile-S” series shares (which, as of the date hereof, were converted into ordinary shares, by means of the amendment of the Bank’s Bylaws).
Under the Framework Agreement, Quiñenco S.A. remains as the controlling shareholder of LQIF and therefore of us, while Citigroup Inc. is granted certain governance and other shareholder rights in LQIF. With respect to the governance rights in us, Citigroup Inc. has the right to name two directors to our 11-member board of directors, while Quiñenco would maintain the right to appoint a majority of our board of directors. Citigroup Inc. also has the power to propose the appointment of certain of our executive officers (including our chief financial officer) and at least one representative on our directors/audit committees. Under this agreement, Citigroup Inc. was also granted certain veto rights over certain “fundamental strategic decisions” (as defined in the Framework Agreement), such as the delisting of our ADSs from the New York Stock Exchange or the delisting of our shares from the Santiago Stock Exchange, the Bolsa Electrónica de Chile and the Valparaiso Stock Exchange, entry into new lines of business or large acquisitions, approval of related party transactions and changes to our bylaws or organizational documents. Furthermore, Citigroup Inc. agreed to purchase substantially all of the assets of our North American (i.e., Miami and New York) branches for U.S.$130 million. Because Citigroup beneficially owns 50% of LQIF, it may name up to five of the 11 members of our board of directors (such number to be reduced by the number of directors appointed by minority shareholders, provided that Citigroup Inc. always shall have the right to appoint at least one director), including the vice chairman, pursuant to the terms of the Framework Agreement. However, even in this circumstance, Quiñenco S.A. would still be entitled to appoint a majority of our board of directors. The Framework Agreement also sets forth a series of ancillary agreements proposed to be entered into by the parties to the Framework Agreement and some of their affiliates.
On December 19, 2008, Quiñenco S.A., Citigroup Inc. and Citibank Overseas Investment Corporation amended the Framework Agreement (the “Amendment”), and through it the Shareholders’ Agreement mentioned below. The Amendment provided that if Citigroup Inc. did not acquire 8.52% of LQIF’s shares (to hold at least a 41.4778% ownership interest in LQIF) as a consequence of the actions and decisions of any relevant authority in the United States, Quiñenco S.A. shall have the right to compensation as provided in the Amendment, and Citigroup Inc. shall have the option of acquiring either a 41.4778% or a 50% interest in LQIF. Furthermore, the Amendment provided that if for any reason Citigroup Inc. did not exercise any of the call options mentioned in the previous sentence, Quiñenco S.A. or its affiliates, as applicable, shall be entitled to require Citigroup Inc. to sell to them an amount of shares of LQIF such that, after such sale, Quiñenco S.A. shall directly or through its affiliates own an 80.1% ownership interest in LQIF. If this had occurred, Citigroup Inc.’s governance and other shareholder rights mentioned in the preceding paragraph should have been those provided in Clause Six of the Shareholders’ Agreement referred to below. Notwithstanding these provisions, on January 29, 2010, Citigroup Inc. exercised a call option to acquire 8.52% of LQIF’s shares and, on March 15, 2010, Citigroup Inc. exercised another call option to acquire an additional 8.52% of LQIF’s shares. Consequently, since April 30, 2010 Citigroup Inc. and Citigroup Overseas Investment Corporation indirectly owns 50% of LQIF. As a result, since April 30, 2010, Citigroup Inc. has been granted certain corporate governance rights over us, as described above.
Effective January 9, 2014, Quiñenco S.A., Citigroup Inc. and Citibank Overseas Investment Corporation entered into an amendment to the “Framework Agreement, and additionally Quiñenco S.A., Citigroup Chile S.A. and other shareholders of LQIF entered into an amendment to the Shareholders’ Agreement (as defined below) (collectively, the “2014 Amendments”), to, among other things, reduce LQ Inversiones Financieras S.A.’s minimum shareholding in Banco de Chile (direct and indirect) from 58.33% to 51%. Prior to the 2014 Amendments, Citigroup had the right to appoint five of the permanent members of our board of directors, provided that the number of directors Citigroup had the right to appoint was reduced by the number of directors appointed by minority shareholders (subject to a minimum of one permanent director appointed by Citigroup). Pursuant to the 2014 Amendments, Citigroup maintains its right to appoint five of the permanent members of our board of directors, except that in the event our minority shareholders appoint five permanent directors and thus no person proposed by Citigroup can be appointed as a permanent director, then Citigroup shall have the right to appoint two alternate directors.
152
Table of Contents
On December 27, 2007, Quiñenco S.A., Citigroup Chile S.A. and the minority shareholders of LQIF entered into a shareholders’ agreement (the “Shareholders’ Agreement”) that formalized the rights of Citigroup Inc. with respect to the governance rights in us as set forth in the Framework Agreement (and as discussed in the preceding paragraph). The Shareholders Agreement became effective on January 1, 2008.
On December 27, 2007, we entered into a Global Connectivity Agreement with Citigroup Inc. The purpose of this agreement is to enable us and our clients to become part of Citigroup’s Global Network and to provide a framework for us and Citigroup Inc. to direct new business to the partnership in order to generate wealth creation for both companies. The agreement sets forth the terms upon which we, Citigroup Inc. and our and its respective affiliates will develop a relationship with respect to cross-border business and certain services being rendered (such as corporate and investment banking services, international personal banking services and global transactions services, among others). The parties agreed on the following principles with respect to implementing the terms of the agreement: (i) the promotion of global connectivity products among Chilean customers, (ii) the setup of a technology platform, (iii) the training of employees and officers, and (iv) the construction of international support networks to carry out the transactions contemplated by the agreement. On February 27, 2009, we and Citigroup amended the Global Connectivity Agreement. The purpose of the amendment was to clarify and supplement the terms of the original agreement with respect to the banking services to be provided in Chile and abroad.
On December 27, 2007, we also entered into a Trademark License Agreement with Citigroup Inc. (the “Trademark License Agreement”) in which Citigroup Inc. granted us a non-exclusive paid-up and royalty-free license to use certain of Citigroup Inc.’s trademarks in Chilean territory. In addition, Citigroup Inc. granted us a license to use its domain name solely in connection with marketing and promoting authorized services in Chilean territory. On February 27, 2009, we and Citigroup Inc. amended the Trademark License Agreement. The amendment requires us to deliver a certificate at least once a year confirming that we are in compliance with the standards set forth in the Trademark License Agreement. In addition, we must comply with certain additional quality control standards approved periodically by Citigroup Inc. relating to certain products, and Citigroup Inc. has the right to review and inspect all materials relating to the offer and sale of certain products.
On December 27, 2007, we entered into a Cooperation Agreement with Citigroup Inc. (the “Cooperation Agreement”) with the purpose of providing a framework for the integration of Citibank Chile with us following the merger and ensuring a successful relationship between us and Citigroup Inc. In particular, the Cooperation Agreement establishes a communication mechanism between us and Citigroup Inc. to enhance the exchange of ideas and information related to the integration of our business with that of Citibank Chile and provides for certain specific areas of collaboration going forward (such as with respect to our hedging and derivatives strategies). On February 27, 2009, we and Citigroup Inc. amended the Cooperation Agreement to require each company to establish specific formal processes for sharing information about regulatory changes in the United States and Chile that may have an impact on us. This Cooperation Agreement together with the Operating Agreements (for this purposes the Global Connectivity Agreement and the Licensing Agreement) are valid for six (6) years from January 1, 2008 through January 1, 2014. Those agreements provide that we and Citigroup may agree on an extension for another six years from January 1, 2014 through January 1, 2020, which extension must be agreed to in writing by January 1, 2013; otherwise, the effective agreements will be extended—once—for two (2) years, from January 1, 2014 through January 1, 2016, when they will expire without any further proceeding. Since the parties did not reach an agreement before January 1, 2013 in order to extend the term of such agreements for an additional 6-year period, the agreements were automatically extended until January 1, 2016. During this extension the parties may agree on an additional extension of the agreements.
On December 31, 2007, we entered into an Asset Purchase Agreement with Citibank, N.A. (the “Asset Purchase Agreement”), whereby we sold substantially all of the assets and operations of our banking businesses in Miami and New York to Citibank, N.A. and Citibank, N.A. agreed to offer employment to substantially all of the employees in those branches and to assume substantially all of the liabilities related to such assets and operations. In consideration for this sale, we were paid an aggregate purchase price of U.S.$130 million, in addition to the assumption of liabilities. Following the completion of the sale, the Miami and New York branches were placed in voluntary liquidation in January 2008. In March 2008, the banking licenses for both branches were surrendered to the appropriate banking regulator.
On September 25, 2009, we entered into a Master Services Agreement with Citigroup Inc. This agreement regulates and supplements certain reciprocal services that, before the merger between us and Citibank Chile, had been provided pursuant to the terms of certain service agreements then in effect between Citigroup Inc. (and certain of its affiliates) and Citibank Chile, which were assumed, after the merger, by us as legal successor to Citibank Chile. Furthermore, this Agreement seeks to foster global connectivity with respect to the banking and financial services referred to in the Global Connectivity Agreement and in the other agreements executed with Citigroup Inc. mentioned above. This agreement has the same term of validity as the Cooperation Agreement aforementioned.
153
Table of Contents
On December 19, 2012, by means of a public deed signed before the Public Notary of Mr. René Benavente Cash, Banco de Chile together with its affiliate Banchile Corredores de Seguros Limitada entered into an agreement with Banchile Seguros de Vida S.A. called Collective Debtor’s Life Insurance Agreement (“ Contrato de Seguro Colectivo de Desgravamen ”) for loan mortgages. Said agreement was entered pursuant to article 40 of DFL N° 251 of 1931, General Regulation N° 330 of the Superintendency of Securities and Insurance and Circular N° 3,530 of the SBIF and Financial Institutions, both dated March 21, 2012, upon which the public bid for the collective policy for life insurance covering loan mortgages was adjudicated to Banchile Seguros de Vida S.A., who offered the lowest rate of 0.0119800% monthly, including a 14.00% commission fee for the insurance broker Banchile Corredores de Seguros Limitada, who will act as intermediary of the policy.
Additionally, on December 28, 2012, we and our affiliated companies Banchile Corredores de Seguros Limitada, and Banchile Seguros de Vida S.A., extended until December 31, 2015, the following existent insurance agreements, excluding those insurance agreements related to loan mortgages that are subject to a public bid in accordance with article 40 of DFL N° 251 of 193 mentioned above:
| 1. | Brokerage Agreement entered into by the affiliate Banchile Corredores de Seguros Limitada and the related company Banchile Seguros de Vida S.A. |
| 2. | Agreements entered into by Banco de Chile and Banchile Seguros de Vida S.A.: |
| a) | Collection and Data Administration Agreement. |
| b) | Use Agreement for Distribution Channels. |
| c) | Banchile’s Trademark License Agreement. |
| d) | Credit Life Insurance Agreement |
| 3. | Framework agreement for Insurance Banking, entered into by Banco de Chile, Banchile Corredores de Seguros Limitada and Banchile Seguros de Vida S.A. |
On June 19, 2013, by means of a public deed signed before the Public Notary Mr. Raúl Perry Pefaur, Banco de Chile acquired all of the shares of Banchile Factoring S.A. (a Bank’s subsidiary) held by our subsidiary Banchile Asesoría Financiera S.A. Pursuant to the Ley de Sociedades Anónimas (Chilean Corporation Law) article 103 N° 2, after a period of ten days starting from the date of acquisition, Banchile Factoring S.A. was dissolved and Banco de Chile became its legal successor on June 30, 2013.
On December 9, 2013, by means of a public deed signed before the Public Notary Mr. René Benavente Cash, we and our affiliate Banchile Corredores de Seguros Limitada entered into an agreement with Banchile Seguros de Vida S.A., namely the “Collective Debtor’s Life Insurance Agreement” (“ Contrato de Seguro Colectivo de Desgravamen ”) and the “Collective Debtor’s Life, Total and Permanent Disability 2/3 Insurance Agreement (“ Contrato de Seguro Colectivo de Desgravamen e Invalidez Total y Permanente 2/3 ”) (portfolio in pesos and housing subsidies D.S. N°1 de 2011), both for loan mortgages. The aforementioned agreements were entered pursuant article 40 of DFL N° 251 of 1931, General Regulation N° 330 of the Superintendency of Securities and Insurance and Circular N° 3,530 of the SBIF and Financial Institutions, both dated March 21, 2012, upon which the public bid for the Debtor’s Life Insurance and Debtor’s Life and Total and Permanent Disability 2/3 Insurance agreements (portfolio in pesos and housing subsidies D.S. N°1 de 2011) the agreements were awarded to Banchile Seguros de Vida S.A. who offered in both cases the lowest rates of 0.0103% monthly and of 0.0109% monthly, respectively, including a 14.00% fee for the insurance broker Banchile Corredores de Seguros Limitada.
154
Table of Contents
On December 26, 2013, we and Banchile Seguros de Vida S.A. entered into an amendment to the Use of Distribution Channels Agreement (“Convenio Uso de Canales de Distribución”), dated December 28th, 2012, adjusting the percentage of the fee associated to certain insurances and the base calculation formula of the fee agreed in the mentioned Agreement. This amendment is effective from December 1st, 2013, to December 31st, 2015.
All the terms and conditions contained in the agreement mentioned above were previously reviewed and approved by our board of directors.
Loans to Related Parties
As disclosed in Note 39(c) to our audited consolidated financial statements as of and for the year ended December 31, 2013 appearing elsewhere in this annual report, we incurred an aggregate of Ch$295,846 million in expenses and Ch$213,818 million in income from transactions with related parties in 2013, other than loans. As authorized by the General Banking Law, and within the regulatory limits, we hold several outstanding loans owed to us by affiliated corporations. All such loans:
| (i) | were made in the ordinary course of business; |
| (ii) | were made on terms, including interest rates and collateral, substantially the same as those prevailing at the time for comparable transactions with other persons; and |
| (iii) | did not involve more than the normal risk of collectability or present other unfavorable features. |
We held an aggregate of Ch$378,271 million in net loans (provisions for loan losses not deducted) to related parties, including Ch$61,832 million in collateral pledged by related parties, as of December 31, 2013. See Note 39(c) to our audited consolidated financial statements as of and for the year ended December 31, 2013 appearing elsewhere in this annual report for details concerning these transactions.
155
Table of Contents
| Item 8 | Financial Information |
CONSOLIDATED STATEMENTS AND OTHER FINANCIAL INFORMATION
Audited Consolidated Financial Statements
Please refer to “Item 18. Financial Statements.”
Legal Proceedings
We and our subsidiaries are subject to claims and are parties to legal proceedings in the normal course of business.
Request from Spanish Court to Chilean Judicial Authorities
On April 29, 2010, the Supreme Court of Chile denied the requests contained in a rogatory letter issued on October 26, 2009, by the Central Court of Instruction Number 5 of the National Court of Spain ( Juzgado Central de Instrucción No. 5 de la Audiencia Nacional de Madrid ) in Madrid, Spain (the “Spanish Court”) to have certain actions taken (as described below) with respect to a lawsuit before the Spanish Court. The Supreme Court of Chile established that the subject matter of the investigation by the Spanish Court was currently pending before a Chilean tribunal that has jurisdiction and competency over these matters.
The rogatory letter referred to above notified the Chilean judicial authorities that a lawsuit pending before the Spanish Court had been amended to add causes of action concerning concealment of assets and money laundering against Mr. Pablo Granifo Lavin (the chairman of our board of directors) and Mr. Hernán Donoso Lira (former manager of our New York branch) and against us, Banchile Corredores de Bolsa S.A. and Banchile Administradora General de Fondos S.A., the latter three of which face only subsidiary civil liability. The rogatory letter, among other items, requested a joint guarantee ( fianza solidaria ) from the defendants in the amount of U.S.$77,348,374 and, if the aforementioned parties were not to grant such a joint guarantee, requested the attachment of assets of up to U.S.$103,131,165.
On April 30, 2012, the Spanish Court decided the provisional dismissal ( sobreseimiento provisional) of the aforementioned lawsuit on the grounds that the Chilean judicial authorities have investigated and prosecuted the same facts as those pending before the courts in Spain, and there is an existing legal proceeding underway in Chile, which should have priority. The complainant filed an appeal and a reform of resources ( recursos de apelación y reforma ), which were dismissed on July 27, 2012 and June 19, 2012 by the Spanish judicial authorities. Against the dismissal of the appeal ( recurso de apelación) , the complainant filed a nulity motion and a cassation recourse before the Supreme Court, and the first was dismissed and the second was declared inadmissible. Finally the complainant filed a recurso de queja before the Supreme Court against the National Court of Spain for its refusal to admit the cassation recourse. On November 30, 2012, the Supreme Court dismissed the recurso de queja .
In Chile, a judicial investigation is currently underway and at the time of filing of this annual report no indictments for criminal participation of persons affiliated with us have been issued; however on January 7, 2014 the court decided the provisional dismissal ( sobreseimiento temporal) on the part of the investigation related to our Bank.
Erroneous Electronic Forwarding of Bank Statements Claim
On August, 2012 Corporación Nacional de Consumidores y Usuarios de Chile (a Chilean consumer association) filed a class action against Banco de Chile pursuant to Law N ° 19,496, whereby the plaintiff demanded that we compensate 52,770 of our current account holders who were affected by erroneous electronic forwarding of bank statements that occurred in July 2012. The plaintiff seeks total compensation of CLP$ 80,000 (approx. US$ 170) for each account holder as well as the reimbursement of maintenance fees charged on current accounts. The demand and allegations are currently under judicial review.
It is not possible to predict the outcome of this proceeding; however, in any case it will not have a material impact on us.
156
Table of Contents
Charges brought under Securities Market Law
On January 30th, 2014 the Superintendency of Securities and Insurance (“SVS”) (“ Superintendencia de Valores y Seguros ”) brought charges against Banchile Corredores de Bolsa S.A. (“Banchile Corredores”) for the alleged infringement of Article 53 second paragraph of Law 18,045 (“Ley de Mercado de Valores”), for certain specific transactions performed during the years 2009, 2010 and 2011 related to Sociedad Química y Minera de Chile S.A.’s shares (SQM-B y SQM-A). In this regard, Article 53 second paragraph of Law 18,045 provides that “ no person may engage in transactions or induce or attempt to induce the purchase or sale of securities, whether or not governed by this Act, by means of any misleading or deceptive act, practice, mechanism or artifice .” Banchile Corredores has denied the charges and requested their dismissal. The process is currently ongoing. The process is an administrative proceeding and Banchile Corredores may appeal any decision by the SVS in the courts.
Consumer Protection Claim
On February 21, 2014, Banco de Chile was notified of a complaint filed by the National Consumer Service ( Servicio Nacional del Consumidor , or “SERNAC”) in the Twelfth Civil Court of Santiago as a collective action pursuant to Law No. 19,496. The legal action challenges certain clauses that exists in the Person Products Unified Agreement (“ Contrato Unificado de Productos de Personas ”) regarding fees on lines of credit for overdrafts and the validity of tacit consent to changes in fees, charges and other conditions in consumer contracts. The Bank has answered the complaint and asked the court to dismiss all charges.At this stage the effects of any potential judgment cannot be quantified.
Dividends
General
We currently have a single series of common shares and the dividends on our shares are proposed by our board of directors and are approved by our shareholders at the ordinary annual shareholders’ meeting following the year with respect to which the dividends are proposed. Our ordinary annual shareholders’ meeting is required to be held in the first three months of each year. Following shareholder approval, the dividends are declared and paid. Dividends are paid to shareholders of record on the fifth business day preceding the date set for payment of the dividend. The applicable record dates for the payment of dividends to holders of our ADSs are, to the extent practicable, the same. Under the Chilean Corporations Law and regulations issued thereunder, Chilean public corporations are generally required to distribute at least 30% of their consolidated annual earnings as dividends, except to the extent they have accumulated losses. Under the General Banking Law, a Chilean bank may pay dividends upon approval of its shareholders from (i) net earnings of previous fiscal years (i.e., interim dividends are not permitted), (ii) the reserve kept for that purpose or (iii) other funds permitted under Chilean law.
Our dividend policy is affected to some extent by the rights of SAOS, our affiliate, pursuant to its assumption of the Central Bank indebtedness discussed in “Item 4. Information on the Company—History and Development of the Bank—History—The 1982–1983 Economic Crisis and the Central Bank Subordinated Debt.”
Cash Dividends
In March 2011, our shareholders at the ordinary annual shareholders’ meeting agreed to the distribution and payment of dividend No. 199 in the amount of Ch$2.937587 per ordinary share, with a corresponding charge to our 2010 net distributable income.
In March 2012, our shareholders at the ordinary annual shareholders’ meeting agreed the distribution and payment of dividend No. 200, in the amount of Ch$2.984740 per ordinary share, with a corresponding charge to our 2011 net distributable income.
In March 2013, our shareholders at the ordinary annual shareholders meeting agreed the distribution and payment of dividend No. 201 in the amount of Ch$3.41625263165 per ordinary share, with a corresponding charge to our 2012 net distributable income. As mentioned in our previous 20-F report, “Banco de Chile-T series” shares did not have right to receive dividends and fully paid-in shares in respect of our net distributable earnings for fiscal year 2012. Once such dividends and fully paid-in shares were distributed, the Banco de Chile-T shares were automatically converted into Banco de Chile shares.
In March 2014, our shareholders at the ordinary annual shareholders meeting agreed to the distribution and payment of dividend N° 202 in the amount of Ch$3.48356970828 per ordinary share, with a corresponding charge to our 2013 net distributable income.
157
Table of Contents
The following table sets forth the cash dividends declared per common share during the years ended December 2011, 2012 and 2013:
| As of and for the Year Ended December 31, | ||||||||||||||||
| 2011 | 2012 | 2013 | ||||||||||||||
| (in Ch$, except percentages) | (in U.S.$) | |||||||||||||||
|
Chile GAAP: |
||||||||||||||||
|
Dividend payout ratio (1)(3) |
73.76 | % | 69.22 | % | 73.45 | % | — | |||||||||
|
Dividend per Common Share (2) —for shares not pledged to the Central Bank |
2.94 | 2.98 | 3.42 | 0.007 | ||||||||||||
|
Dividend per Common Share
(2)
—for shares pledged to the Central
|
4.20 | 4.26 | 4.88 | 0.009 | ||||||||||||
|
|
|
|
|
|
|
|
|
|||||||||
|
Average Dividend per Common Share |
3.38 | 3.41 | 3.90 | 0.007 | ||||||||||||
|
|
|
|
|
|
|
|
|
|||||||||
| (1) | Dividend payout ratio is calculated by dividing the amount of dividends paid by the earnings per share of the prior year. |
| (2) | Dividends per share are calculated by dividing the amount of the dividend paid during each year by the previous year’s number of shares outstanding. |
| (3) | Includes additional payments to the Central Bank by amounts of Ch$36,713 million in 2011, Ch$37,301 million in 2012 and Ch$42,696 million in 2013, pursuant to Law No. 19,396. |
Whether future dividends will be paid will depend upon our earnings, financial condition, capital requirements, governmental regulations and policies and other factors. Accordingly, there can be no assurance that dividends in future years will be paid at a rate similar to dividends paid in past years.
Stock Dividends
At the extraordinary shareholders’ meeting held on March 22, 2012, our shareholders agreed to a stock dividend in connection with the capitalization of 30% of our distributable net income obtained during the fiscal year 2011 by means of the issuance of fully paid-in shares, without par value, with a value of Ch$67.48 per share, which was distributed among the shareholders in the proportion of 0.018956 fully paid-in shares for each share held, subject to the exercise of the options established in article 31 of Law 19,396.
At the extraordinary shareholders’ meeting held on March 21, 2013, our shareholders agreed to a stock dividend in connection with the capitalization of 30% of our distributable net income obtained during the fiscal year 2012, through the issuance of fully paid-in shares, of no par value, with a value of Ch$71.97 per share, which will be distributed to the shareholders at the fixed rate of 0.02034331347 fully paid-in shares per share currently held, subject to the exercise of the options established in article 31 of Law 19,396. As mentioned in our previous 20-F report, “Banco de Chile-T series” shares did not have rights to receive dividends and fully paid-in shares in respect of our net distributable earnings for fiscal year 2012. Once such dividends and fully paid-in shares were distributed on May 30, 2013 the Banco de Chile-T shares were automatically converted into Banco de Chile shares.
At the extraordinary shareholders’ meeting held on March 27, 2014, our shareholders agreed to a stock dividend in connection with the capitalization of 30% of our distributable net income obtained during the fiscal year 2013, through the issuance of fully paid-in shares, of no par value, with a value of Ch$64.56 per share, which will be distributed to the shareholders at the fixed rate of 0.02312513083 fully paid-in shares per share currently held, subject to the exercise of the options established in article 31 of Law 19,396. This capitalization is currently subject to the SBIF’s approval.
Capital Increases
At the Extraordinary Shareholders Meeting held on October 17, 2012 our shareholders agreed to increase our capital in the amount of CLP$250,000,000,000 (approximately U.S.$521 million) by means of the issuance of 3,939,489,442 cash shares “Banco de Chile-T series”. All these shares are fully paid. These shares had the same rights as all of Banco de Chile’s shares, except that the holders of Banco de Chile T-series shares did not have rights to receive dividends or fully paid-in shares in respect to our net distributable earnings for fiscal year 2012. Once such dividends and fully paid-in shares were distributed in May 30 2013, the Banco de Chile-T shares were automatically converted into Banco de Chile shares.
158
Table of Contents
As mentioned under “Stock Dividends”, at the extraordinary shareholders’ meeting held on March 21, 2013, our shareholders agreed to a stock dividend in connection with the capitalization of 30% of our distributable net income obtained during the fiscal year 2012, through the issuance of fully paid-in shares, of no par value, with a value of Ch$71.97 per share, which was distributed to the shareholders at the fixed rate of 0.02034331347 fully paid-in shares per share, subject to the exercise of the options established in article 31 of Law 19,396.
As mentioned under “Stock Dividends”, at the extraordinary shareholders’ meeting held on March 27, 2014, our shareholders agreed to a stock dividend in connection with the capitalization of 30% of our distributable net income obtained during the fiscal year 2013, through the issuance of fully paid-in shares, of no par value, with a value of Ch$64.56 per share, which will be distributed to the shareholders at the fixed rate of 0.02312513083 fully paid-in shares per share currently held, subject to the exercise of the options established in article 31 of Law 19,396. As a result, the Bank’s capital after this capitalization is Ch$1,944,920,279,413. As mentioned before, this capitalization is currently subject to the SBIF’s approval.
ADR Holders
Dividends payable to holders of our ADSs are net of conversion expenses of the depositary and are subject to Chilean withholding tax currently at the rate of 35%, subject to certain credits. Owners of our ADSs are not charged any fees with respect to cash or stock dividends.
Pursuant to current Chilean foreign exchange regulations, a shareholder who is not a resident of Chile does not need to be authorized as a foreign investor in order to receive dividends, sale proceeds or other amounts with respect to its shares remitted outside Chile, but the investor must inform the Central Bank about any such transactions and must remit foreign currency through the Formal Exchange Market. See “Item 10. Additional Information—Exchange Controls” for additional information on how ADS holders may remit currency outside Chile.
SIGNIFICANT CHANGES
No significant changes in our financial condition have occurred since the date of the most recent audited consolidated financial statements included in this annual report.
159
Table of Contents
| Item 9 | The Offer and Listing |
Nature of Trading Market
Shares of our common stock are traded on all Chilean stock exchanges. Our shares have been listed on the Santiago Stock Exchange and the Valparaiso Stock Exchange since 1894 and on the Electronic Stock Exchange since 1989. The Santiago Stock Exchange is the main trading market for our shares.
The Chilean securities markets are substantially smaller, less liquid and more volatile than major securities markets in the United States. The Santiago Stock Exchange, which is Chile’s main exchange, had a market capitalization of approximately U.S.$265 billion as of December 31, 2013 and an average monthly trading volume of approximately U.S.$3,582 million during 2013. The Santiago Stock Exchange was established in 1893 and is a private company whose equity consists of 48 shares owned by 44 shareholders. As of December 31, 2013, 251 series of shares were listed on the Santiago Stock Exchange.
According to information published by the SVS, during 2013, the Santiago Stock Exchange accounted for approximately 88.4% of the equity trading in Chile. Also, as of December 31, 2013, approximately 10.7% of equity trading in Chile was conducted on the Chilean Electronic Stock Exchange. The remaining 0.9% of equities was traded on the Valparaiso Stock Exchange.
In addition, as reported by the Santiago Stock Exchange, the ten largest companies in terms of market capitalization represented, as of December 31, 2013, approximately 45.7% of the Santiago Stock Exchange’s aggregate market capitalization and accounted for approximately 43.7% of its equity trading. During 2013 approximately 29.5% of the companies listed on the Santiago Stock Exchange had their shares traded on an average of 70% or more of the exchange’s trading days.
Our ADSs, each representing 600 shares of common stock, without nominal (par) value, have been listed on the NYSE since January 2, 2002 under the symbol “BCH.” JPMorgan Chase Bank is our depositary for purposes of the ADSs. As of December 31, 2013, a maximum of 1,484,098 ADSs were outstanding (equivalent to 890,458,800 shares of common stock or 1.0% of the total number of issued shares of common stock as of the same date). Since certain of our ADSs are held by brokers or other nominees, the number of record holders in the United States may not be fully indicative of the number of direct beneficial owners in the United States or of where the beneficial owners of such shares are resident.
In January of 2014, 1,809,000,000 ADSs were offered and sold by LQIF in the United States and elsewhere outside Chile.
We listed our shares of common stock on Latibex, and trading of these shares started on October 8, 2002 under the code “XBCH,” grouped in trading units of 600 shares. Effective October 18, 2013, we voluntarily delisted our trading units from the Latibex.
In addition, since December 20, 2002, our trading units are listed on the LSE.
160
Table of Contents
The table below shows, for the periods indicated, the annual, quarterly and monthly high and low closing prices (in nominal Chilean pesos) of the traded shares of our securities, labeled “Chile” series, on the Santiago Stock Exchange, the Electronic Stock Exchange and the Valparaiso Stock Exchange:
| Santiago Stock Exchange | Electronic Stock Exchange | Valparaiso Stock Exchange | ||||||||||||||||||||||
|
Period |
High | Low | High | Low | High | Low | ||||||||||||||||||
| (Ch$ per share of our common stock) (1) | ||||||||||||||||||||||||
|
Annual Price History |
||||||||||||||||||||||||
|
2009 |
45.0 | 33.4 | 44.8 | 33.5 | 72.8 | 33.4 | ||||||||||||||||||
|
2010 |
72.6 | 45.1 | 73.2 | 44.7 | 72.7 | 44.7 | ||||||||||||||||||
|
2011 |
74.0 | 57.2 | 74.7 | 57.0 | 74.4 | 58.4 | ||||||||||||||||||
|
2012 |
79.5 | 64.5 | 79.5 | 64.1 | 77.7 | 64.5 | ||||||||||||||||||
|
2013 |
80.3 | 69.0 | 80.3 | 68.3 | 80.0 | 68.5 | ||||||||||||||||||
|
2014 (through April 15 th ) |
75.2 | 66.3 | 75.8 | 66.3 | 70.6 | 70.4 | ||||||||||||||||||
|
Quarterly Price History |
||||||||||||||||||||||||
|
2009 |
||||||||||||||||||||||||
|
1 st Quarter 2009 |
37.4 | 34.0 | 37.5 | 33.5 | 37.5 | 34.0 | ||||||||||||||||||
|
2 nd Quarter 2009 |
39.0 | 33.4 | 39.0 | 33.5 | 38.9 | 33.4 | ||||||||||||||||||
|
3 rd Quarter 2009 |
43.7 | 37.0 | 43.6 | 37.0 | 42.5 | 37.2 | ||||||||||||||||||
|
4 th Quarter 2009 |
45.0 | 40.8 | 44.8 | 39.5 | 72.8 | 41.5 | ||||||||||||||||||
|
2010 |
||||||||||||||||||||||||
|
1 st Quarter 2010 |
55.9 | 45.1 | 56.4 | 44.7 | 55.5 | 44.7 | ||||||||||||||||||
|
2 nd Quarter 2010 |
57.8 | 51.3 | 57.8 | 51.2 | 57.0 | 51.4 | ||||||||||||||||||
|
3 rd Quarter 2010 |
72.6 | 54.9 | 73.2 | 54.9 | 72.7 | 54.9 | ||||||||||||||||||
|
4 th Quarter 2010 |
72.6 | 68.6 | 72.8 | 68.0 | 72.6 | 68.5 | ||||||||||||||||||
|
2011 |
||||||||||||||||||||||||
|
1 st Quarter 2011 |
74.0 | 63.0 | 74.7 | 62.1 | 74.4 | 63.1 | ||||||||||||||||||
|
2 nd Quarter 2011 |
69.7 | 65.1 | 69.9 | 62.0 | 69.0 | 65.7 | ||||||||||||||||||
|
3 rd Quarter 2011 |
69.3 | 57.2 | 70.0 | 57.0 | 68.5 | 58.4 | ||||||||||||||||||
|
4 th Quarter 2011 |
73.2 | 59.0 | 73.6 | 58.4 | 73.2 | 59.0 | ||||||||||||||||||
|
2012 |
||||||||||||||||||||||||
|
1 st Quarter 2012 |
79.5 | 71.0 | 79.5 | 70.5 | 77.7 | 71.1 | ||||||||||||||||||
|
2 nd Quarter 2012 |
76.6 | 68.7 | 78.5 | 68.8 | 75.6 | 68.8 | ||||||||||||||||||
|
3 rd Quarter 2012 |
70.9 | 64.5 | 70.9 | 64.1 | 69.6 | 64.5 | ||||||||||||||||||
|
4 th Quarter 2012 |
77.4 | 66.0 | 76.9 | 65.7 | 76.9 | 66.0 | ||||||||||||||||||
|
2013 |
||||||||||||||||||||||||
|
1 st Quarter 2013 |
80.3 | 72.2 | 80.3 | 71.8 | 80.0 | 73.6 | ||||||||||||||||||
|
2 nd Quarter 2013 |
74.7 | 69.0 | 74.9 | 68.3 | 74.5 | 68.5 | ||||||||||||||||||
|
3 rd Quarter 2013 |
79.8 | 69.1 | 79.9 | 69.1 | 78.2 | 70.0 | ||||||||||||||||||
|
4 th Quarter 2013 |
78.4 | 73.4 | 78.5 | 73.3 | — | — | ||||||||||||||||||
|
2014 |
||||||||||||||||||||||||
|
1 st Quarter 2014 |
75.2 | 66.3 | 75.8 | 66.3 | 70.6 | 70.4 | ||||||||||||||||||
|
Monthly Price History |
||||||||||||||||||||||||
|
November 2013 |
78.4 | 73.4 | 78.5 | 73.3 | — | — | ||||||||||||||||||
|
December 2013 |
77.3 | 74.5 | 77.4 | 74.4 | — | — | ||||||||||||||||||
|
January 2014 |
75.2 | 67.1 | 75.8 | 67.0 | 70.4 | 70.4 | ||||||||||||||||||
|
February 2014 |
71.2 | 66.3 | 71.5 | 66.3 | — | — | ||||||||||||||||||
|
March 2014 |
71.9 | 67.7 | 72.4 | 67.7 | 70.6 | 70.6 | ||||||||||||||||||
|
April 2014 (through April 15 th ) |
70.8 | 69.8 | 70.8 | 69.5 | — | — | ||||||||||||||||||
Sources: Santiago Stock Exchange, Electronic Stock Exchange and Valparaiso Stock Exchange—Official Quotation Bulletins and Bloomberg.
| (1) | Pesos per share reflect nominal price at trade date. |
161
Table of Contents
The table below shows the annual, quarterly and monthly high and low closing prices, as reported by the NYSE and Latibex:
| New York Stock Exchange | Latibex | |||||||||||||||
| Period | High | Low | High | Low | ||||||||||||
| (U.S.$ per ADS) (1) | (Euros per Trading Unit) (2) | |||||||||||||||
|
Annual Price History |
||||||||||||||||
|
2009 |
53.90 | 31.85 | 37.45 | 22.81 | ||||||||||||
|
2010 |
92.50 | 53.72 | 68.65 | 37.33 | ||||||||||||
|
2011 |
90.35 | 66.63 | 72.60 | 52.80 | ||||||||||||
|
2012 |
99.11 | 80.33 | 72.60 | 58.20 | ||||||||||||
|
2013 |
102.00 | 81.00 | 85.80 | 56.40 | ||||||||||||
|
2014 (through April 15 th ) |
84.91 | 70.43 | — | — | ||||||||||||
|
Quarterly Price History |
||||||||||||||||
|
2009 |
||||||||||||||||
|
1 st Quarter 2009 |
38.05 | 31.85 | 29.98 | 22.81 | ||||||||||||
|
2 nd Quarter 2009 |
43.50 | 34.13 | 30.38 | 26.05 | ||||||||||||
|
3 rd Quarter 2009 |
48.39 | 40.51 | 32.93 | 28.90 | ||||||||||||
|
4 th Quarter 2009 |
53.90 | 46.07 | 37.45 | 31.32 | ||||||||||||
|
2010 |
||||||||||||||||
|
1 st Quarter 2010 |
64.41 | 53.72 | 46.93 | 37.33 | ||||||||||||
|
2 nd Quarter 2010 |
65.63 | 56.25 | 51.60 | 42.50 | ||||||||||||
|
3 rd Quarter 2010 |
90.20 | 61.00 | 66.30 | 48.29 | ||||||||||||
|
4 th Quarter 2010 |
92.50 | 85.16 | 68.65 | 61.00 | ||||||||||||
|
2011 |
||||||||||||||||
|
1 st Quarter 2011 |
90.35 | 78.37 | 68.90 | 55.85 | ||||||||||||
|
2 nd Quarter 2011 |
89.81 | 83.00 | 61.30 | 54.00 | ||||||||||||
|
3 rd Quarter 2011 |
90.23 | 69.85 | 62.40 | 53.40 | ||||||||||||
|
4 th Quarter 2011 |
85.84 | 66.63 | 72.60 | 52.80 | ||||||||||||
|
2012 |
||||||||||||||||
|
1 st Quarter 2012 |
99.11 | 83.98 | 72.00 | 59.40 | ||||||||||||
|
2 nd Quarter 2012 |
95.27 | 81.07 | 71.40 | 60.00 | ||||||||||||
|
3 rd Quarter 2012 |
86.55 | 80.33 | 72.60 | 59.40 | ||||||||||||
|
4 th Quarter 2012 |
97.32 | 83.50 | 69.60 | 58.20 | ||||||||||||
|
2013 |
||||||||||||||||
|
1 st Quarter 2013 |
102.00 | 92.94 | 85.80 | 64.80 | ||||||||||||
|
2 nd Quarter 2013 |
95.27 | 81.00 | 84.00 | 56.40 | ||||||||||||
|
3 rd Quarter 2013 |
95.20 | 82.56 | 68.40 | 57.60 | ||||||||||||
|
4 th Quarter 2013 |
94.00 | 84.44 | 69.00 | 65.40 | ||||||||||||
|
2014 |
||||||||||||||||
|
1 st Quarter 2014 |
84.91 | 70.43 | — | — | ||||||||||||
|
Monthly Price History |
||||||||||||||||
|
November 2013 |
91.99 | 84.44 | — | — | ||||||||||||
|
December 2013 |
88.72 | 84.55 | — | — | ||||||||||||
|
January 2014 |
84.91 | 72.45 | — | — | ||||||||||||
|
February 2014 |
77.25 | 70.43 | — | — | ||||||||||||
|
March 2014 |
78.41 | 73.02 | — | — | ||||||||||||
|
April 2014 (through April 15 th ) |
77.33 | 75.51 | — | — | ||||||||||||
Source: Bloomberg.
| (1) | One ADS represents 600 shares of common stock. |
| (2) | One Trading Unit represents 600 shares of common stock. |
As mentioned earlier, on October 18, 2013 we voluntarily delisted our trading units from the Latibex.
162
Table of Contents
| Item 10 | Additional Information |
MEMORANDUM AND ARTICLES OF ASSOCIATION
Set forth below is a brief summary of the significant provisions of our estatutos (bylaws) and Chilean law. This description contains all material information concerning our shares, but does not purport to be complete and is qualified in its entirety by reference to our estatutos (a copy of which is filed as Exhibit 1.1 to this annual report), the General Banking Law, the Chilean Corporations Law and the Securities Market Law.
We are an open stock (public) corporation and are registered with the Chilean Public Registry of Commerce of Santiago under Page 23,859 Number 18,638 of the year 1996, and authorized to operate as a bank by the Superintendency of Bank and Financial Institutions. The Chilean Corporations Laws, the Securities Market Law and the General Banking Law set forth the rules and requirements for establishing, and operating banks in Chile, as well as shareholder rights in a Chilean bank. Additionally, the operation and the shareholder’s rights are also governed by the bank’s estatutos , which effectively serve as both the articles of incorporation and the bylaws of a company incorporated in the United States. Legal provisions in Chile take precedence over any contrary provision set forth in a corporation estatutos. Both the Chilean Corporations Law and our estatutos provide that legal actions by shareholders against us (or our officers or directors) to enforce their rights as shareholders or by one shareholder against another in their capacity as such are to be brought in Chile in arbitration proceedings.
The Chilean securities markets are principally regulated by the Chilean Superintendency of Securities and Insurance under the Securities Market Law and the Chilean Corporations Law. In the case of banks, compliance with these laws is supervised by the SBIF. These two laws provide for disclosure requirements, restrictions on insider trading and price manipulation and protection of minority investors. The Securities Market Law sets forth requirements relating to public offerings, stock exchanges and brokers, and outlines disclosure requirements for companies that issue publicly offered securities.
Purpose
Our corporate purpose is to undertake all acts, contracts, business and transactions as the General Banking Law allows banking institutions to undertake, without prejudice to expanding or restricting our scope of action consistent with current legal precepts or such as may be established in the future.
Capitalization
As of April 15, 2014, there are 93,175,043,991 Banco de Chile shares outstanding of our capital stock. All of such shares are fully paid.
Our shares are no par value and full voting rights. There are no legal restrictions on the payment of dividends from our net income, except that we may only pay a single dividend per year (i.e., interim dividends are not permitted). Under the Chilean Corporations Law and regulations issued thereunder, Chilean public corporations are generally required to distribute at least 30% of their consolidated annual earnings as dividends, except to the extent they have accumulated losses. Previously, a bank was permitted to distribute less than such minimum amount in any given year with approval of the holders of at least two-thirds of the bank’s outstanding stock. In 2006, however, this possibility was eliminated by law. Under the General Banking Law, a Chilean bank may pay dividends upon approval of its shareholders from (i) net earnings of previous fiscal years (i.e., interim dividends are not permitted), (ii) the reserve kept for that purpose or (iii) other funds permitted under Chilean law.
Under Chilean law, the shareholders of a company, acting at an extraordinary shareholders’ meeting, have the power to authorize an increase in the company’s capital. When an investor subscribes for issued shares, the shares are registered in such investor’s name, even if not paid for, and the investor is treated as a shareholder for all purposes, except with regard to receipt of dividends and the return of capital. The investor becomes eligible to receive dividends or the return of capital once it has paid for the shares; if it has paid for only a portion of such shares, it is entitled to reserve a corresponding pro rata portion of the dividends declared with respect to such shares unless the company’s bylaws provide otherwise. If an investor does not pay for shares for which it has subscribed on or prior to the date agreed upon for payment, the company is entitled under Chilean law to auction the shares on a
163
Table of Contents
stock exchange and collect the difference, if any, between the subscription price and the auction proceeds. However, until such shares are sold, the subscriber continues to exercise all the rights of a shareholder (except the right to receive dividends or the return of capital). In the case of banks, authorized shares and issued shares that have not been paid for within the period fixed for their payment by the SBIF are cancelled and are no longer available for issuance by the company.
The Chilean Corporations Law provides that the purchaser of shares of a company implicitly accepts its bylaws and any agreements adopted at shareholders’ meetings.
Directors
For a description of the provisions of our estatutos relating to our board of directors and our directors/audit committee, see “Item 6. Directors, Senior Management and Employees.”
Ownership Restrictions
Under the Securities Market Law and the regulations of the SBIF, shareholders of open stock corporations are required to report the following to the Chilean Superintendency of Securities and Insurance and the Chilean stock exchanges:
| • |
any direct or indirect acquisition or sale of shares that results in the holder’s acquiring or disposing of, directly or indirectly, 10% or more of an open stock corporation’s share capital; and |
| • |
any direct or indirect acquisition or sale of shares or options to buy or sell shares, in any amount, if made by a holder of 10% or more of an open stock corporation’s capital or if made by a director, liquidator, main officer, general manager or manager of such corporation. |
The foregoing requirements also apply to the acquisition or sale of securities or agreements which price or return depends or is conditioned (all or in a significant part) upon changes or movements in the price of such shares. The report shall be made the day following the execution of the transaction.
In addition, any person who acquires 10% or more of our shares must include in the report whether the purpose of the acquisition is to acquire control of the company or if the acquisition is just a financial investment. A beneficial owner of ADSs representing 10% or more of our share capital will be subject to these reporting requirements under Chilean law.
According to the regulations of the SBIF, Chilean banks that issue ADSs are required to inform the SBIF if any person, directly or beneficially, acquires ADSs representing 5% or more of the total amount of shares of capital stock issued by such bank.
Under the Securities Market Law and the regulations of the Chilean Superintendency of Securities and Insurance, persons or entities intending to acquire control, directly or indirectly, of an open stock corporation, regardless of the acquisition vehicle or procedure, and including acquisitions made through direct subscriptions or private transactions, are also required to inform the public of such intention at least 10 business days before the date on which the transaction is to be completed, but, in any case, as soon as negotiations regarding the change of control begin or as soon as confidential information and documents concerning the target are delivered to the potential acquirer such delivery can occur through a filing with the Chilean Superintendency of Securities and Insurance, the stock exchanges where its securities are traded, companies controlled by and that control the target and through a notice published in two Chilean newspapers, which notice must disclose, among other information, the person or entity purchasing or selling, the price and the material conditions of any negotiations.
Prior to such publication, a written communication to such effect must be sent to the target corporation, to the controlling corporation, to the corporations controlled by the target corporation, to the Chilean Superintendency of Securities and Insurance and to the Chilean stock exchanges. Title XV of the Securities Market Law provides the definition of a controlling power, direct holding and related party.
In addition to the foregoing, Article 54A of the Chilean Securities Market Law requires that within two business days of the completion of the transactions pursuant to which a person has acquired control of a publicly traded company, a notice shall be published in the same newspapers in which the notice referred to above was published and notices shall be sent to the same persons mentioned in the preceding paragraphs, as well as posted on their websites, if any.
The provisions of the aforementioned articles do not apply when the acquisition is being made through a tender or exchange offer.
164
Table of Contents
Title XXV of the Chilean Securities Market Law on tender offers and the regulations of the Chilean Superintendency of Securities and Insurance provide that the following transactions must be carried out through a tender offer:
| • |
an offer which allows a person to take control of a publicly traded company, unless (i) the shares are being sold by a controlling shareholder of such company at a price in cash which is not substantially higher than the market price and the shares of such company are actively traded on a stock exchange and (ii) those shares are acquired (a) through a capital increase, (b) as a consequence of a merger, (c) by inheritance or (d) through a forced sale; |
| • |
an offer for a controlling percentage of the shares of a listed company if such person intends to take control of the parent company (whether listed or not) of such listed company, to the extent that the listed company represents 75% or more of the consolidated net worth of the parent company; and |
| • |
whenever a controlling shareholder acquires two-thirds of the voting shares of a listed company, such controlling shareholder must offer to purchase the remaining shares from the minority shareholders in a tender offer, unless (i) the controlling shareholder has reached two thirds of the voting shares through a tender offer for all of the shares of the company, or (ii) it reaches such percentage as a result of a reduction of the capital of the company by operation of law. |
Article 200 of the Chilean Securities Market Law prohibits any shareholder that has taken control of a publicly traded company from acquiring, for a period of 12 months from the date of the transaction in which it gained control of the publicly traded company, a number of shares equal to or greater than 3% of the outstanding issued shares of the target without making a tender offer at a price per share not lower than the price paid at the time of taking control. Should the acquisition from the other shareholders of the company be made on a stock exchange and on a pro rata basis, the controlling shareholder may purchase a higher percentage of shares, if so permitted by the regulations of the stock exchange.
Title XV of the Chilean Securities Market Law sets forth the basis to determine what constitutes a controlling power, a direct holding and a related party. The Chilean Securities Market Law defines control as the power of a person or group of persons acting (either directly or through other entities or persons) pursuant to a joint action agreement to direct the majority of the votes at the shareholders’ meetings of the corporation and to elect the majority of members of its board of directors, or to influence the management of the corporation significantly. Significant influence is deemed to exist in respect of the person or group of persons with an agreement to act jointly that holds, directly or indirectly, at least 25% of the voting share capital, unless:
| • |
another person or group of persons acting pursuant to joint action agreement, directly or indirectly, controls a stake equal to or greater than the percentage controlled by such person; |
| • |
the person or group does not control, directly or indirectly, more than 40.0% of the voting share capital and the percentage controlled is lower than the sum of the shares held by other shareholders holding more than 5% of the share capital (either directly or pursuant to a joint action agreement); or |
| • |
in cases where the Chilean Superintendency of Securities and Insurance has ruled otherwise, based on the distribution or atomization of the overall shareholding. |
According to the Chilean Securities Market Law, a joint action agreement is an agreement among two or more parties which, directly or indirectly, own shares in a corporation at the same time and whereby they agree to participate with the same interest in the management of the corporation or in taking control of the same. The law presumes that such an agreement exists between:
| • |
a principal and its agents; |
| • |
spouses and relatives within certain degrees of kinship; |
| • |
entities within the same business group; and |
| • |
an entity and its controller or any of the members of the controller. |
Likewise, the Chilean Superintendency of Securities and Insurance may determine that a joint action agreement exists between two or more entities considering, among other things, the number of companies in which they participate and the frequency with which they vote identically in the election of directors, appointment of managers and other resolutions passed at extraordinary shareholders’ meetings.
165
Table of Contents
According to Article 96 of the Chilean Securities Market Law, a business group is a group of entities with such ties in their ownership, management or credit liabilities that it may be assumed that the economic and financial action of such members is directed by, or subordinated to, the joint interests of the group, or that there are common credit risks in the credits granted to, or in the acquisition of securities issued by, them. According to the Chilean Securities Market Law, the following entities are part of the same business group:
| • |
a company and its controller; |
| • |
all the companies with a common controller together with that controller; and |
| • |
all the entities that the Chilean Superintendency of Securities and Insurance declares to be part of the business group due to one or more of the following reasons: |
| • |
a substantial part of the assets of the company is involved in the business group, whether as investments in securities, equity rights, loans or guaranties; |
| • |
the company has a significant level of indebtedness and the business group has a material participation as a lender or guarantor of such indebtedness; |
| • |
the company is a member of a controlling group of any company of those mentioned in the first two bullets above and there are reasons grounded in ties in the ownership, management or credit liabilities to include it in the business group; or |
| • |
the company is controlled by a member of the controller of any of the entities of the business group if the latter is formed by more than one entity and if there is more than one group of controlling entities and there are reasons grounded in ties in the ownership, management or credit liabilities to include it in the business group. |
The General Banking Law provides that, as a matter of public policy, no person or company may acquire, directly or indirectly, more than 10% of the shares of a bank without the prior authorization of the SBIF, which may not be unreasonably withheld. The prohibition also applies to beneficial owners of ADSs. In the absence of such authorization, any person or group of persons acting in concert would not be permitted to exercise voting rights with respect to the shares or ADSs acquired. In determining whether or not to issue such an authorization, the SBIF considers a number of factors enumerated in the General Banking Law, including the financial stability of the purchasing party.
The General Banking Law also requires the prior authorization of the SBIF for the following transactions:
| • |
the merger of two or more banks; |
| • |
the acquisition of all or a substantial portion of a bank’s assets and liabilities by another bank; |
| • |
the control by the same person or controlling group of two or more banks; or |
| • |
a substantial increase in the share ownership by a controlling shareholder of a bank. |
This prior authorization is only required when the acquiring bank or the resulting group of banks would own a significant market share in loans, defined by the SBIF to be more than 15% of all loans in the Chilean banking system. The intended purchase, merger or expansion may be denied by the SBIF; or, if the acquiring bank or resulting group would own a market share in loans determined to be more than 20% of all loans in the Chilean banking system, the purchase, merger or expansion may be conditioned on one or more of the following:
| • |
the bank or banks maintaining regulatory capital higher than 8% and up to 14% of risk-weighted assets; |
| • |
the technical reserve established in Article 65 of the General Banking Law being applicable when deposits exceed one and a half times the resulting bank’s paid-in capital and reserves; or |
| • |
the margin for interbank loans being reduced to 20% of the resulting bank’s regulatory capital. |
166
Table of Contents
If the acquiring bank or resulting group would own a market share in loans determined by the SBIF to be more than 15% but less than 20%, the authorization will be conditioned on the bank or banks maintaining a regulatory capital not lower than 10% of their risk-weighted assets for the period specified by the SBIF, which may not be less than one year. The calculation of the risk-weighted assets is based on a five category risk classification system applied to a bank’s assets that is based on the Basel Committee recommendations.
According to the General Banking Law, a bank may not grant loans to related parties on terms more favorable than those generally offered to non-related parties. Article 84 No. 2 of the General Banking Law and the regulations issued by the SBIF creates the presumption that natural persons who are holders of shares and who beneficially own more than 1% of the shares are related to the bank and imposes certain restrictions on the amounts and terms of loans made by banks to related parties. This presumption would also apply to beneficial owners of ADSs representing more than 1% of the shares.
Article 16bis of the General Banking Law provides that the individuals or legal entities that, individually or with other people, directly control a bank and who individually own more than 10% of its shares must send to the SBIF reliable information on their financial situation in the form and in the opportunity set forth in Resolution No. 3,156 of the SBIF.
There are no limitations for non-resident or foreign shareholders to hold or exercise voting rights on the securities of a bank.
Preemptive Rights and Increases of Share Capital
The Chilean Corporations Law provides that whenever a Chilean company issues new shares for cash, it must offer its existing shareholders the right to purchase a number of shares sufficient to maintain their existing ownership percentages in the company. Pursuant to this requirement, preemptive rights in connection with any future issue of shares will be offered by us to the depositary as the registered owner of the shares underlying the ADSs. However, the depositary will not be able to make such preemptive rights available to holders of ADSs unless a registration statement under the Securities Act is effective with respect to the underlying shares or an exemption from the registration requirements thereunder is available.
We intend to evaluate, at the time of any preemptive rights offering, the practicality under Chilean law and Central Bank regulations in effect at the time of making such rights available to our ADS holders, as well as the costs and potential liabilities associated with registration of such rights and the related shares of common stock under the Securities Act, and the indirect benefits to us of thereby enabling the exercise by all or certain holders of ADSs of their preemptive rights and any other factors we consider appropriate at the time, and then to make a decision as to whether to file such registration statement. There can be no assurance that any registration statement would be filed. If we do not file a registration statement and no exemption from the registration requirements under the Securities Act is available, the depositary will sell such holders’ preemptive rights and distribute the proceeds thereof if a premium can be recognized over the cost of such sale. In the event that the depositary is not able, or determines that it is not feasible, to sell such rights at a premium over the cost of any such sale, all or certain holders of ADSs may receive no value for such rights. Non-U.S. holders of ADSs may be able to exercise their preemptive rights regardless of whether a registration statement is filed. The inability of all or certain holders of ADSs to exercise preemptive rights in respect of shares of common stock underlying such ADSs could result in such holders not maintaining their percentage ownership of the common stock following such preemptive rights offering unless such holder made additional market purchases of ADSs or shares of common stock.
Under Chilean law, preemptive rights are exercisable or freely transferable by shareholders during a period that cannot be less than 30 days following the grant of such rights. During such period, and for an additional 30-day period thereafter, a Chilean corporation is not permitted to offer any unsubscribed shares for sale to third parties on terms which are more favorable than those offered to its shareholders. At the end of such additional 30-day period, a Chilean open stock corporation is authorized to sell unsubscribed shares to third parties on any terms, provided they are sold on a Chilean stock exchange. Unsubscribed shares that are not sold on a Chilean stock exchange can be sold to third parties only on terms no more favorable for the purchaser than those offered to shareholders.
Shareholders’ Meetings and Voting Rights
An ordinary annual shareholders’ meeting is held within the first four months of each year. The ordinary annual shareholders’ meeting is the corporate body that approves the annual financial statements, approves all dividends in accordance with the dividend policy determined by our board of directors, elects the members of our board of directors and approves any other matter that does not require an extraordinary shareholders’ meeting. Extraordinary meetings may be called by our board of directors when deemed appropriate, and ordinary or extraordinary meetings must be called by our board of directors when requested by shareholders representing at least 10% of the issued voting shares or by the SBIF.
167
Table of Contents
Notice to convene the ordinary annual meeting or an extraordinary meeting is given by means of three notices which must be published in a newspaper of our corporate domicile (currently Santiago, Chile) previously determined by our shareholders at the ordinary annual meeting or, in the event an agreement is not reached in the previous ordinary annual meeting or the newspaper ceases to exist or has its distribution suspended for whatever reason, in the Official Gazette in a prescribed manner, and the first notice must be published not less than 15 calendar days nor more than 20 calendar days in advance of the scheduled meeting. Notice must also be given to the SBIF, the Santiago Stock Exchange, the Valparaiso Stock Exchange and the Chilean Electronic Stock Exchange. Currently, we publish our official notices in the El Mercurio newspaper of Santiago.
In the case of an ordinary annual shareholders’ meeting, shareholders holding a prescribed minimum ownership interest in us must be sent an annual report of our activities that includes audited consolidated financial statements. Shareholders who do not fall into this category but who request it must also be sent a copy of our annual report. In addition to these requirements, we regularly provide, and management currently intends to continue to provide, together with the notice of ordinary annual shareholders’ meeting, a proposal for the final annual dividend.
The quorum for a shareholders’ meeting is established by the presence, in person or by proxy, of shareholders representing at least an absolute majority of the issued shares. If a quorum is not present at the first meeting on first call, the meeting can be reconvened (in accordance with the procedures described in the previous paragraphs) and, upon the meeting being reconvened, shareholders present at the reconvened meeting are deemed to constitute a quorum regardless of the percentage of the shares represented.
The shareholders’ meetings pass resolutions by the affirmative vote of an absolute majority of those voting shares present or represented at the meeting. Approval by a two-thirds majority of the issued shares, however, is required at any shareholders’ meeting to approve any of the following actions:
| • |
a change in corporate form, merger or spin-off; |
| • |
an amendment to our term of existence, if any, or our early dissolution; |
| • |
a change in corporate domicile; |
| • |
a decrease of corporate capital previously approved by the SBIF, provided it is not reduced below the minimum legal capital; |
| • |
the approval of capital contributions and appraisal of properties other than cash, in those cases where it is permitted by the General Banking Act; |
| • |
a modification of the powers of shareholders or limitations on the powers of our board of directors; |
| • |
a reduction in the number of members of our board of directors; |
| • |
the transfer of 50% or more of the corporate assets or the implementation or amendment of any business plan that contemplates the transfer of more than 50% of our corporate assets or the transfer of 50% or more of the assets of a subsidiary if such subsidiary represents at least 20% of our total corporate assets, as well as transfer of shares of such subsidiary which would make it lose such status; |
| • |
any non-cash distribution in respect of the shares; |
| • |
a change in the manner of distribution of profits established in our bylaws; |
| • |
the granting of guarantees to secure third-party obligations in excess of 50% of our corporate assets, unless granted to a subsidiary; |
168
Table of Contents
| • |
the repurchase of our shares under the conditions set forth in Articles 27A and 27B of the Chilean Corporations Law; |
| • |
the correction of nullity caused by formal defects of any amendments to our bylaws; |
| • |
approval or confirmation of transactions with related parties, as set forth in Articles 44 and 147 of the Chilean Corporations Law; or |
| • |
certain other matters set forth in our bylaws. |
Shareholders may accumulate their votes for the election of directors and cast all of their votes in favor of one person.
In general, Chilean law does not require a Chilean open stock corporation to provide the level and type of information that U.S. securities laws require a reporting company to provide to its shareholders in connection with a solicitation of proxies. However, shareholders are entitled to examine the books of a company and its subsidiaries within the 15-day period before any ordinary annual shareholders’ meeting.
The Chilean Corporations Law provides that a Chilean company’s annual report must include, in addition to the materials provided by the board of directors to shareholders, the comments and proposals made by the directors’ committee, and, whenever shareholders representing 10% or more of the issued voting shares so request, such shareholders’ comments and proposals in relation to the company’s affairs. Similarly, the Chilean Corporations Law provides that whenever the board of directors of an open stock corporation convenes an ordinary annual shareholders’ meeting and solicits proxies for that meeting, or distributes information supporting its decisions or other similar material, it is obligated to include as an annex to its annual report any pertinent comments and proposals that may have been made by the directors’ committee and shareholders owning 10% or more of the company’s voting shares who have requested that such comments and proposals be so included.
Only shareholders registered as such with us on the fifth business day prior to the date of a meeting are entitled to attend and vote their shares. A shareholder may appoint another individual (who need not be a shareholder) as his proxy to attend and vote on his behalf. Every shareholder entitled to attend and vote at a shareholders’ meeting has one vote for every share subscribed, as we do not have special classes of shares with different voting rights.
Our shareholders’ meetings held in 2012 are:
| • |
At the ordinary annual shareholders’ meeting held on March 22, 2012 our shareholders’ agreed to the distribution and payment of dividend N° 200, in the amount of CLP$2.984740 per Banco de Chile common share, with a charge to 2011 net distributable income of Banco de Chile. |
| • |
At the extraordinary shareholders’ meeting held on March 22, 2012, our shareholders agreed to issue a stock dividend in connection with the capitalization of 30% of our distributable net income obtained during the fiscal year 2011 by means of the issuance of fully paid-in shares, without par value, with a value of Ch$67.48 per share, which was distributed among the shareholders in the proportion of 0.018956 fully paid-in shares for each share held, subject to the exercise of the options established in article 31 of Law 19,396. |
| • |
At the Extraordinary Shareholders Meeting held on October 17, 2012 our shareholders agreed to increase our capital in the amount of CLP$250,000,000,000 (approximately U.S.$521 million) by means of the issuance of 3,939,489,442 cash shares “Banco de Chile-T series”. These shares had the same rights as all of Banco de Chile’s shares, except that the holders of Banco de Chile T-series shares did not have right to receive dividends or fully paid-in shares in respect of our net distributable earnings for fiscal year 2012. Once such dividends and/or fully paid-in shares were distributed in 2013, the Banco de Chile-T shares were automatically converted to Banco de Chile shares.. |
Our shareholders’ meetings held in 2013 are:
| • |
At the ordinary annual shareholders’ meeting held on March 21, 2013 our shareholders’ agreed to the distribution and payment of dividend N° 201, in the amount of CLP$3.41625263165 per Banco de Chile common share, with a charge to 2012 net distributable income of Banco de Chile. As mentioned in our previous 20-F report, “Banco de Chile-T series” shares did not have right to receive dividends and fully paid-in shares in respect of our net distributable earnings for fiscal year 2012. Once such dividends and fully paid-in shares were distributed, the Banco de Chile-T shares were automatically converted to Banco de Chile shares. |
169
Table of Contents
| • |
At the extraordinary shareholders’ meeting held on March 21, 2013, our shareholders agreed to issue a stock dividend in connection with the capitalization of 30% of our distributable net income obtained during the fiscal year 2012 by means of the issuance of fully paid-in shares, without par value, with a value of Ch$71.97 per share, which was distributed among the shareholders in the proportion of 0.02034331347 fully paid-in shares for each share held, subject to the exercise of the options established in article 31 of Law 19,396. As mentioned in our previous 20-F report, “Banco de Chile-T series” shares did not have right to receive dividends and fully paid-in shares in respect of our net distributable earnings for fiscal year 2012. Once such dividends and fully paid-in shares were distributed, the Banco de Chile-T shares were automatically converted to Banco de Chile shares. |
Our shareholders’ meetings held in 2014 are:
| • |
At the ordinary annual shareholders’ meeting held on March 27, 2014 our shareholders’ agreed to the distribution and payment of dividend N° 202, in the amount of Ch$3.48356970828 per Banco de Chile common share, with a charge to 2013 net distributable income of Banco de Chile. |
| • |
At the extraordinary shareholders’ meeting held on March 27, 2014, our shareholders agreed to issue a stock dividend in connection with the capitalization of 30% of our distributable net income obtained during the fiscal year 2013 by means of the issuance of fully paid-in shares, without par value, with a value of Ch$64.56 per share, which was distributed among the shareholders in the proportion of 0.02312513083 fully paid-in shares for each share held, subject to the exercise of the options established in article 31 of Law 19,396. This capitalization is currently subject to the SBIF’s approval. |
Dividend, Liquidation and Appraisal Rights
For a description of the provisions of our estatutos related to our dividends, see “Item 8. Financial Information—Consolidated Statements and Other Financial Information—Dividends.”
Under the Chilean Corporations Law, Chilean companies are generally required to distribute at least 30% of their earnings as dividends. Previously, the General Banking Law stated that banks were permitted to distribute less than such minimum amount in any given year with the approval of holders of at least two-thirds of the bank’s common stock. In 2006, however, this possibility was eliminated by law. In the event of any loss of capital, no dividends can be distributed so long as such loss is not recovered. Also, a bank cannot distribute dividends above the legal minimum if doing so would result in the bank exceeding its ratio of risk-weighted assets to regulatory capital or total assets. See “Item 8. Financial Information—Consolidated Statements and Other Financial Information—Dividends.”
Dividends that are declared but not paid by the date set for payment at the time of declaration are adjusted from the date set for payment to the date such dividends are actually paid, and interest is accrued thereon. The right to receive a dividend lapses if it is not claimed within five years from the date the dividend is payable and the funds may be claimed by the Chilean treasury.
We may declare a dividend in cash or in shares. When a share dividend is declared above the legal minimum (which minimum must be paid in cash), our shareholders must be given the option to elect to receive cash. A holder of our ADSs may, in the absence of an effective registration statement under the Securities Act or an available exemption from the registration requirement thereunder, effectively be required to receive a dividend in cash. See “—Preemptive Rights and Increases of Share Capital.”
In the event of our liquidation, the holders of our fully paid shares would participate equally and ratably, in proportion to the number of paid-in shares held by them, in our assets available after payment of all our creditors. The holders of fully paid shares would not be required to contribute additional capital to us in the event of our liquidation.
In accordance with the General Banking Law, our shareholders do not have appraisal rights in the event of a business combination or otherwise.
Approval of Financial Statements
Our board of directors is required to submit our audited consolidated financial statements to the shareholders annually for their approval. The approval or rejection of the financial statements is entirely within our shareholders’ discretion. If our shareholders reject our consolidated financial statements, our board of directors must submit new consolidated financial statements not later than 60 calendar days from the date of the rejection. If our shareholders reject our new consolidated financial statements, our entire board of directors is deemed removed from office and a new board of directors shall be elected at the same meeting. Directors who individually approved our consolidated financial statements are disqualified from running for re-election for the ensuing period.
170
Table of Contents
Registrations and Transfers
We act as our own registrar and transfer agent, as is customary among Chilean companies. In the case of jointly owned shares, an attorney-in-fact must be appointed to represent the joint owners in dealings with us
MATERIAL CONTRACTS
See “Item 7. Major Shareholders and Related Party Transactions—Related Party Transactions.”
EXCHANGE CONTROLS
The Central Bank is responsible for maintaining the stability of the Chilean peso and the normal functioning of internal and external payments. The authority of the Central Bank for these purposes includes regulation of the amount of currency and credit in circulation, the performance of credit transactions and foreign exchange operations and the issuance of regulatory provisions regarding monetary, credit, financing and foreign exchange matters.
Under the Basic Constitutional Act of the Central Bank, Law 18,840, foreign exchange operations can be carried out in Chile by any person, subject to the limitations and restrictions established by the Central Bank. Foreign exchange transactions include buying and selling foreign currency and, in general, any act or agreement that may have the effect of creating, amending, or extinguishing an obligation payable in such currency, even if no transfer of funds or drafts to or from Chile is actually involved. Foreign exchange transactions also include transfers of or transactions with respect to gold or instruments representing gold.
The Central Bank can impose the following limitations on foreign exchange transactions:
| • |
The Central Bank can require that the transaction of specified foreign exchange operations, such as foreign investments and foreign credits, be reported to it; and |
| • |
The Central Bank can require that the execution of certain foreign exchange operations, such as money transfers to and from Chile, be made only in the Formal Exchange Market. The Formal Exchange Market consists of banks and other entities authorized by the Central Bank. |
Also, the Central Bank has the authority to establish certain restrictions on foreign exchange transactions with respect to the Formal Exchange Market. These restrictions may include the following: the obligation to return to Chile in Chilean pesos the value obtained in the export of goods, services, and other payments to foreign persons or entities that have a right of residency in Chile; that a reserve be maintained for credits, deposits and investments in foreign currency from or to a foreign country; and the obligation to obtain approval for payment or remittance of foreign exchange transactions, among others.
These restrictions may only be imposed by resolution adopted by the majority of board members of the Central Bank if required for the stability of the currency or the financing of the balance of payments of the country. Additionally, these restrictions may only be imposed for a predetermined period, which, at the most, may extend to a year. The resolution may be subject to veto by the Minister of Finance, in which case the restriction may only be adopted pursuant to a favorable vote of all the board members. The restriction, once the predetermined period has expired, may be renewed subject to the preceding rules.
On April 16, 2001, the Central Bank eliminated the prior foreign exchange restrictions, replaced the former Compendium of Foreign Exchange Regulations (“Compendium”) by a new one, and eliminated Chapter XXVI of the old Compendium, which regulated the establishment of an ADR facility by a Chilean company. Notwithstanding such replacement, the special regime of Chapter XXVI continued in force for Banco de Chile’s ADS program until March 7, 2011, when the Central Bank of Chile, JPMorgan Chase Bank N.A., as depositary bank, and Banco de Chile executed an agreement that terminated the Exchange Convention (“ Convención Cambiaria ”). As a consequence of such termination, the special exchange regime established in the Exchange Convention is no longer applicable. Thus, the Deposit Agreement, as amended, and Banco de Chile’s ADS program are subject to the exchange regulations of general applicability of Chapter XIV of the Compendium or such new regulations that may be issued in the future. A copy of the amendment to the deposit agreement, dated February 1, 2011, can be found as an Exhibit to this annual report.
171
Table of Contents
The ADS facility is governed by Chapter XIV of the Compendium on “Regulations applicable to Credits, Deposits, Investments and Capital Contributions from Abroad”. According to Chapter XIV, the establishment of an ADS facility is regarded as an ordinary foreign investment, subject to the above mentioned limitations, and it is not necessary to seek the Central Bank’s prior approval in order to establish an ADS facility. The establishment of an ADS facility only requires that the Central Bank be informed of the transaction, and that the transaction be conducted through the Formal Exchange Market.
In Chile, foreign investments can also be made through the Foreign Investment Committee under Decree Law No. 600 , Foreign Investment Statute, which is an optional mechanism to invest capital in Chile that requires, among other items, a foreign investment contract with the State of Chile.
Investment in Our Shares and ADSs
Investments made in shares of our common stock are subject to the following requirements:
| • |
any foreign investor acquiring shares of our common stock who brought funds into Chile for that purpose must bring those funds through an entity participating in the Formal Exchange Market; |
| • |
any foreign investor acquiring shares of our common stock to be converted into ADSs or deposited into an ADR facility who brought funds into Chile for that purpose must bring those funds through an entity participating in the Formal Exchange Market; |
| • |
in both cases, the entity of the Formal Exchange Market through which the funds are brought into Chile must report such investment to the Central Bank; |
| • |
all remittances of funds from Chile to the foreign investor upon the sale of the acquired shares of our common stock or from dividends or other distributions made in connection therewith must be made through the Formal Exchange Market; |
| • |
all remittances of funds from Chile to the foreign investor upon the sale of shares underlying ADSs or from dividends or other distributions made in connection therewith must be made through the Formal Exchange Market; and |
| • |
all remittances of funds made to the foreign investor must be reported to the Central Bank by the intervening entity of the Formal Exchange Market. |
When funds are brought into Chile for a purpose other than to acquire shares to convert them into ADSs or deposit them into an ADR facility and subsequently such funds are used to acquire shares to be converted into ADSs or deposited into an ADR facility, such investment must be reported to the Central Bank by the custodian within ten days following the end of each month within which the custodian is obligated to deliver periodic reports to the Central Bank.
When funds to acquire shares of our common stock or to acquire shares to convert them into ADSs or deposit them into an ADR facility are received by us abroad (i.e., outside of Chile), such investment must be reported to the Central Bank directly by the foreign investor or by an entity participating in the Formal Exchange Market within ten days following the end of the month in which the investment was made.
All payments in foreign currency in connection with our shares of common stock or ADSs made from Chile through the Formal Exchange Market must be reported to the Central Bank by the entity participating in the transaction. In the event there are payments made outside of Chile, the foreign investor must provide the relevant information to the Central Bank directly or through an entity of the Formal Exchange Market within the first ten calendar days of the month following the date on which the payment was made.
There can be no assurance that additional Chilean restrictions applicable to the holders of ADSs, the disposition of shares of our common shares underlying ADSs or the conversion or repatriation of the proceeds from such disposition will not be imposed in the future, nor can we assess the duration or impact of such restrictions if imposed.
This summary does not purport to be complete and is qualified by reference to Chapter XIV of the Central Bank Foreign Exchange Regulations, a copy of which is available in Spanish and English versions at the Central Bank’s website at www.bcentral.cl .
172
Table of Contents
TAXATION
Chilean Tax Considerations
The following discussion is based on certain Chilean income tax laws presently in force, including Ruling No. 324 of January 29, 1990, of the Servicio de Impuestos Internos , or the Chilean Internal Revenue Service, and other applicable regulations and rulings. The discussion summarizes the principal Chilean income tax consequences of an investment in ADSs or shares of common stock by an individual who is not domiciled in, or a resident of, Chile or a legal entity that is not organized under the laws of Chile and does not have a permanent establishment located in Chile, which we refer to as a foreign holder. For purposes of Chilean tax law, an individual holder is a resident of Chile if he or she has resided in Chile for more than six months in one calendar year or for a total of more than six months in two consecutive tax years. The Chilean Internal Revenue Service has interpreted that the six months period must be uninterrupted. An individual holder is domiciled in Chile if he or she resides in Chile with the purpose of staying in Chile. Also, according to the Chilean Internal Revenue Service, an individual that has no residence in Chile may be nonetheless considered as domiciled in Chile if he or she intends to stay in Chile commencing on the day of entry into the country and such intention is evidenced by circumstances such as the acceptance of employment within Chile or the relocation of his or her family to Chile. This discussion is not intended as tax advice to any particular investor, which can be rendered only in light of that investor’s particular tax situation.
Under Chilean law, provisions contained in statutes such as tax rates applicable to foreign holders, the computation of taxable income for Chilean purposes and the manner in which Chilean taxes are imposed and collected may be amended only by another statute. In addition, the Chilean tax authorities issue rulings and regulations of either general or specific application and interpret the provisions of Chilean tax law. Chilean taxes may not be assessed retroactively against taxpayers who act in good faith relying on such rulings and regulations, but Chilean tax authorities may change rulings and regulations prospectively. Chile and the United States have executed an income and capital tax treaty for the avoidance of double taxation and the prevention of fiscal evasion, but this treaty is not in effect, and its effectiveness is contingent upon ratification in the United States Senate and by the Chilean Congress. At this time it is not clear when the United States Senate and the Chilean Congress will consider ratification, and therefore the effective date of the treaty is uncertain.
Cash Dividends and Other Distributions
Cash dividends paid by us with respect to ADSs or shares of common stock held by a foreign holder are subject to a 35.0% Chilean withholding tax, which is withheld and paid over by us, which we refer to as the Chilean withholding tax (see potential new effects of Tax Reform below). A credit against the Chilean withholding tax is available based on the corporate income tax, or the first category tax, actually paid on the taxable income to which the dividend is imputed; however, this credit does not reduce the Chilean withholding tax on a one-for-one basis because it also increases the base on which the Chilean withholding tax is imposed. Distribution of book income in excess of retained taxable income is subject to the Chilean withholding tax, but such distribution is not eligible for the credit since said income is not subject to the first category tax at the corporate level. Finally, the distribution of non-taxable incomes or incomes subject to the first category tax applied as a sole tax are both not subject to Chilean withholding tax. Under Chilean income tax law, for purposes of determining the level of the first category tax paid, dividends generally are assumed to have been paid out of oldest retained taxable profits. The effective rate of withholding tax to be imposed on dividends paid by us will vary depending upon the amount of the first category tax paid by us on the earnings to which the dividends are attributed. In case such provisional credit is determined to be totally or partially not applicable at the end of the year, due to the fact that retained taxable or exempted profits were not enough to cover the distribution made, Foreign Holders shall reimburse the Company for the provisional credit that was totally or partially granted over non-taxable or exempted profits. In our case, the amount paid as the first category tax is lower than it would be based on our income because the dividends paid to SAOS are considered tax deductible. For reconstruction purposes arising from the earthquake of February 2010, the first category tax rate was increased to 20% for year 2011 and to 18.5% for year 2012, returning on 2013 to its normal tax-rate of 17%. However, for educational improvement purposes, the law 20,630 permanently increased the first category tax rate to 20% since 2012. Independently of the first category tax rate applicable at the corporate level, the effective overall combined rate of Chilean taxes imposed with respect to our distributed profits is 35.0%.
The foregoing tax consequences apply to cash dividends paid and dividend distributions made in property, other than shares of common stock. Share dividends are not subject to Chilean taxation.
173
Table of Contents
Capital Gains
Gain realized on the sale, exchange or other disposition by a foreign holder of ADSs (or ADRs evidencing ADSs) will not be subject to Chilean taxation, provided that such disposition occurs outside Chile or that it is performed under the rules of Title XXIV of the Chilean Securities Market Law. The deposit and withdrawal of shares of common stock in exchange for ADRs will not be subject to any Chilean taxes.
Gain recognized on the sale or exchange of shares of common stock (as distinguished from sales or exchanges of ADSs representing such shares of common stock) by a foreign holder will be subject to both the first category tax and the Chilean withholding tax (the first category tax being creditable against the latter) if:
(1) the foreign holder has held such shares of common stock for less than one year from the exchange of ADSs for the shares of common stock,
(2) the foreign holder acquired and disposed of the shares of common stock in the ordinary course of its business or as a regular trader of stock or
(3) the sale is made to a company in which the foreign holder holds an interest (10.0% or more of the shares in the case of open stock corporations).
In this case, as was mentioned, if the gain recognized is subject to general taxation, that is, both the first category tax and the Chilean withholding tax (the first category tax being creditable against the latter) and a 5.0% withholding tax on the total amount to be remitted abroad, without any deductions, as a provisional payment. If the profit subject to taxation cannot be determined, a 35% provisional withholding tax for the disposition of shares of common stock, would be imposed on the total amount less the first category tax rate as a credit (over the sale price without any deduction). In both cases, the foreign holder would be entitled to request a tax refund for any amounts withheld in excess of the taxes actually due, in April of the following year upon filing of its corresponding tax return.
In the case of transactions that occurred before January 1, 2013 the withholding tax rule was 20% as a provisional tax on the total amount (sale price without any deduction). This rule was changed in the Law 20630.
If the transaction does not meet the 3 conditions mentioned above, the tax to be applied would be equal to the corporate tax rate on the profit as a sole tax and, according to the tax law; a provisional withholding tax equal to the first category tax rate would be applied. If the profit subject to taxation cannot be determined, the disposition of shares of common stock will be subject to 5.0% withholding tax on the total amount to be remitted abroad, without any deductions, as a provisional payment of the total tax due.
The acquisition value of the shares of common stock received in exchange for ADSs will represent the tax basis of such shares. The acquisition value is determined by the parties in the relevant deposit agreement, and generally corresponds to the highest price at which they are traded on the Santiago Stock Exchange on the date exchange takes place. Consequently, the conversion of ADSs into shares of common stock and sale of such shares of common stock for the value established under the deposit agreement will not generate a capital gain subject to taxation in Chile.
However, as the exchange is generally registered two days after the transaction is made, in case the price of the shares goes down, a gain would arise. To remedy this situation, on October 1, 1999, the Chilean Internal Revenue Service issued Ruling No. 3,708, allowing Chilean issuers of ADSs to amend the deposit agreements to which they are parties in order to include a clause that states that, in the case that the exchanged shares are sold by the ADSs’ holders in a Chilean stock exchange, either on the same day in which the exchange is recorded in the shareholders’ registry of the issuer or within the two prior business days to such date, the acquisition price of said exchanged shares shall be the price registered in the invoice issued by the stock broker that participated in the sale. Consequently, if this clause were included in the deposit agreement, the capital gain that may be generated if the exchange date is different from the date in which the shares received in exchange for ADSs were sold, it will not be subject to taxation.
The distribution and exercise of preemptive rights relating to the shares of common stock will not be subject to Chilean taxation. Amounts received in exchange for the shares or assignment of preemptive rights relating to the shares will be subject to both the first category tax and the Chilean withholding tax (the former being creditable against the latter to the extent described above).
Law 20.712 was recently published, also known as “Funds Unified Law”, regulating the Administration of third-party funds and individual portfolio management. This law eliminates and unified the previous legislation contained in Law 18.657 (Foreign Investment Capital Funds Law), Law 18.815 (Investment Funds Law), and Decree Law 1.328 (Mutual Funds Administration) and modifies other regulatory bodies. This Law will become effective on May 1, 2014.
174
Table of Contents
It also modifies important aspects of the taxation for foreign investors when investing in the Chilean capital markets.
The main aspects affecting foreign investment are the following:
Mutual Funds and Investment Funds.
| • |
Investors that are non-domiciled or resident in Chile will be exempt from Capital Gains Tax (CGT) and WHT on dividends and interests provided that more than 80% of the portfolio of the fund is invested abroad. |
| • |
In all other cases, with exception of entities with participation equal or above 5%, the CGT and WHT on dividends shall be 10% and the WHT on interests shall be 4%. |
Fixed Income
| • |
The WHT of 4% shall be withheld by the local custodian that is acting as a Tax Agent of the foreign investor |
| • |
The effective placement rate (“Tasa Fiscal”) shall be used as the tax cost in the calculation of the CGT. |
| • |
The Governmental Bonds will be suitable for a CGT exemption, regardless of its trading system |
| • |
The Corporate Bonds shall be effective for a CGT exemption provided that |
| • |
Are traded in a continuous auction system; or |
| • |
Are held for at least a year or the shorter term defined in the complementary Regulation |
Foreign Institutional Investors
| • |
Art 106 was eliminated by law 20.712 |
| • |
Provisory régime: The CGT exemption shall be applicable for assets purchased before the full force of Law 20.712, (May 1) provided that the seller complies with the requirements listed in the repealed article 106. |
Capital gains obtained by foreign institutional investors from the sale of shares of publicly traded corporations, which are actively traded in a stock exchange, carried out through a Chilean stock exchange authorized by the Chilean Superintendency of Securities and Insurance or in a tender offer are exempt of income tax in Chile.
Also, according to article 107 of the Chilean Income Law, gains derived from the sale or transfer of shares of publicly-traded companies organized in Chile that are actively traded in a stock exchange, as defined in the relevant regulation, 1 are exempt of taxes in Chile, provided that the following requirements are met:
| • |
The seller must have acquired the shares: (i) in a Chilean stock exchange authorized by the Chilean Superintendency of Securities and Insurance; (ii) pursuant to a regulated tender offer carried out according to Title XXV of the Chilean Securities Market Law; (iii) at the time of incorporation of the corporation or pursuant to a capital increase, (iv) pursuant to the exchange of public traded securities convertible in shares (in this case the acquisition cost of the shares corresponds to the exchange price), or (v) in a redemption of securities from mutual funds; |
| • |
The shares must be sold: (i) in a stock exchange authorized by the Chilean Superintendency of Securities and Insurance; (ii) pursuant to a regulated tender offer; or (iii) in a contribution of securities on mutual funds. |
175
Table of Contents
| • |
The exemption under analysis also applies if the sale or transfer of shares is executed within 90 days following the day on which they were no longer considered as actively traded. In such case, the profit exempted from Chilean taxes will be up to the average price of shares within the last 90 days on which they were actively traded. Any profit above the average price will be subject to the general tax regime applicable to the transfer of shares. |
Other Chilean Taxes
There are no Chilean inheritance, gift or succession taxes applicable to the transfer or disposition of the ADSs by a foreign holder, however according to the Chilean Internal Revenue Services’ criteria; such taxes generally will apply to the transfer at death or by a gift of shares of common stock by a foreign holder. No Chilean stamp, issue, registration or similar taxes or duties apply to foreign holders of ADSs or shares of common stock.
Tax reform proposal, by presidential message N° 24-362 (April 1 , 2014)
Main tax changes:
| • |
Gradual increase of the Statutory Corporate Tax Rate, from 20.0% to 25.0% (21.0% in 2014, 22.5% in 2015 and 24.0% in 2016, 25.0% in 2017). |
| • |
The increase in the Statutory Corporate Tax Rate will have an impact on the Deferred Taxes outstanding. |
| • |
Change in the tax system, from Cash to Accrual basis: Individual (Local and Foreign) Investors will have to pay taxes over the whole Profit generated by Companies, notwithstanding the amount of profits that is effectively distributed as cash dividends. This measure will be implemented four years after the Tax Reform becomes effecive (approximately in 2017). |
| • |
Up to now, earnings that are not distributed by companies as cash dividends are retained under the Fund of Taxable Retained Earnings (“FUT”). As a result, retained earnings are only taxed at the statutory corporate tax rate, while they are not subject to complementaty or additional personal taxes (cash basis system). Under the tax reform, this mechanism will remain until 2016, so retained earnings will continue to increase the FUT. From 2017 on, if companies distribute cash dividends exceeding their annual net income, the amount in excees will be charged to the FUT. |
| • |
Instant Depreciation: Small and medium sized companies will be permitted to depreciate fixed-assets in one year. Thils will also aply for large companies but only over the 12-month period after the tax reform becomes effective). |
| • |
Decrease in personal taxes, from 40% to 35% for the upper income bracket, from 2017 onwards. |
| • |
Companies will have to retain 10% of profits to be accrued by the owners (this new rule will have a direct impact on ADS holders). |
| • |
Increase the Stamp Tax from 0.4% to 0.8% (this tax mainly affects loans and financing). |
| • |
Other proposals |
| • |
Eliminate DL600 (“Foreign Investment Statute”). |
| • |
Change Taxation for Private Investment Funds (to be the same as other companies). |
United States Federal Income Tax Considerations
The following discussion is a summary of certain U.S. federal income tax considerations that may be relevant to the acquisition, ownership and disposition of shares of our common stock, as well as the ownership and disposition of ADSs received pursuant to a deposit into the ADR facility of shares of our common stock, by a beneficial owner that is: (i) an individual who is a citizen or resident of the United States; (ii) a corporation (or other entity treated as a corporation for U.S. federal income tax purposes) created or organized under the laws of the United States, any state thereof or the District of Columbia; (iii) an estate the income of which is subject to U.S. federal income tax regardless of its source; or (iv) a trust if a court within the United States is able to exercise primary supervision over its administration and one or more U.S. persons have the authority to control all substantial decisions of the trust (or otherwise if the trust has a valid election in effect under current U.S. Treasury regulations to be treated as a U.S. person). For purposes of this discussion, we refer to these owners of ADSs or shares of our common stock as “U.S. Holders.” If a partnership holds ADSs or shares of our common stock, the tax treatment of a partner generally will depend upon the status of the partner and upon the activities of the partnership. A prospective investor that is a partnership or a partner in a partnership holding ADSs or shares of our common stock should consult its own tax advisors.
176
Table of Contents
This summary is not a comprehensive discussion of all of the tax considerations that may be relevant to a U.S. Holder’s decision to acquire ADSs or shares of our common stock. In particular, this discussion is directed only to U.S. Holders that will hold ADSs or shares of our common stock as capital assets (generally, property held for investment) and it does not address the Medicare tax on net investment income or any special U.S. federal income tax consequences that may be applicable to U.S. Holders that are subject to special treatment under the Internal Revenue Code of 1986, as amended (“U.S. Code”), such as banks, brokers or dealers in securities or currencies, traders in securities electing the mark-to-market method of accounting, financial institutions, insurance companies, tax-exempt entities, regulated investment companies, real estate investment trusts, partnerships, holders that own or are treated as owning 10% or more of our voting shares of our common stock, persons holding ADSs or shares of our common stock as part of a hedging, conversion or other integrated transaction or a straddle, persons subject to the alternative minimum tax or U.S. Holders whose functional currency is not the U.S. dollar. Prospective investors are advised to satisfy themselves as to the overall U.S. federal, state and local tax consequences of their ownership of ADSs or shares of our common stock by consulting their own tax advisors.
Except where specifically described below, this discussion assumes that we are not a passive foreign investment company (“PFIC”), for U.S. federal income tax purposes. Please see the discussion under “—Passive Foreign Investment Companies” below.
The statements of U.S. federal income tax laws set out below are based on the laws in force as of the date hereof and may be subject to changes in U.S. federal income tax law occurring after that date, including changes that may have retroactive effect.
ADRs
A U.S. Holder who deposits shares of our common stock into the ADR facility, receiving ADSs in return, will be treated for U.S. federal income tax purposes as the beneficial owner of the underlying shares of our common stock represented by those ADSs and evidenced by ADRs. Deposits and withdrawals of shares of our common stock by U.S. Holders in exchange for ADSs will not result in the realization of gain or loss for U.S. federal income tax purposes.
Taxation of Dividends
Subject to the discussion below under “—Passive Foreign Investment Companies,” distributions of cash or property (other than shares of our common stock, if any, distributed pro rata to all of our shareholders, including holders of ADSs) paid out of our current or accumulated earnings and profits (as determined for U.S. federal income tax purposes) with respect to ADSs or shares of our common stock, including the net amount of the Chilean income tax withheld on the distribution (after taking into account the credit for the first category tax), will be includible in gross income as ordinary income on the date on which the U.S. Holder receives the dividends, in the case of shares of our common stock, or the date the depositary receives the dividends, in the case of ADSs. To the extent that the amount of any distribution exceeds our current and accumulated earnings and profits as determined for U.S. federal income tax purposes, such excess amounts will be treated first as a non-taxable return of capital to the extent of such U.S. Holder’s tax basis in the shares of our common stock and, thereafter, as capital gain. As used below, the term “dividend” means a distribution that constitutes a dividend for U.S. federal income tax purposes. Dividends paid in Chilean pesos generally will be includible in gross income in a U.S. dollar amount calculated by reference to the spot market exchange rate in effect on the date the U.S. Holder receives the dividends, in the case of shares of our common stock, or the date the depositary receives the dividends, in the case of ADSs, regardless of whether the payment is in fact converted into U.S. dollars. U.S. Holders should consult their own tax advisors regarding the treatment of foreign currency gain or loss, if any, on any Chilean pesos received which are converted into U.S. dollars after they are received.
Dividends paid to corporate U.S. Holders with respect to ADSs or shares of our common stock will not be eligible for the dividends received deduction allowed to corporations under the U.S. Code. Under current law, dividends received by certain non-corporate U.S. Holders with respect to ADSs will be subject to U.S. federal income tax at preferential rates if the dividends constitute “qualified dividend income” for U.S. federal income tax purposes. Dividends paid on the ADSs will be treated as qualified dividend income if:
| • |
the ADSs are readily tradable on an established securities market in the United States; and |
177
Table of Contents
| • |
we were not, in the year prior to the year in which the dividend was paid, and are not, in the year in which the dividend is paid, a PFIC. |
The ADSs are listed on the NYSE, and will qualify as readily tradable on an established securities market in the United States so long as they are so listed. Moreover, as discussed below under “—Passive Foreign Investment Companies,” we believe that we will not be treated as a PFIC for U.S. federal income tax purposes with respect to our 2013 and current taxable year, and based on our current expectations regarding the value and nature of our assets, the sources and nature of our income, relevant market and shareholder data and our current business plans, we do not anticipate becoming a PFIC in the future. However, there can be no assurance in this regard because the PFIC determination is made annually and is based on the portion of our assets (including goodwill) and income that is characterized as passive under the PFIC rules and our continued qualification for an exception to the PFIC rules for certain foreign banks.
Based on existing guidance, we do not expect that dividends paid on shares of our common stock will be qualified as dividends because shares of our common stock are not readily tradable on an established securities market in the United States and, although a comprehensive income tax treaty between Chile and the United States has been signed, such treaty is not currently in force.
Subject to generally applicable limitations and conditions under the U.S. Code (including a minimum holding period requirement), Chilean income tax withheld from dividends (after taking into account the credit for the first category tax, when it is available) may be treated as a foreign income tax eligible for credit against a U.S. Holder’s U.S. federal income tax liability. If the amount of Chilean income tax initially withheld from a dividend is determined to be in excess of a U.S. Holder’s Chilean tax liability, thereby permitting a U.S. Holder to obtain a refund in respect of such excess tax, such excess tax may not be creditable. Dividends paid on the ADSs or shares of our common stock generally will constitute foreign source income, and for purposes of calculating the foreign tax credit, as “passive category income,” for most U.S. Holders. U.S. Holders are not allowed foreign tax credits for income taxes withheld in respect of certain short-term or hedged positions in securities and may not be allowed foreign tax credits in respect of arrangements in which their expected economic profit is insubstantial. Alternatively, a U.S. Holder may be able to deduct Chilean income taxes paid with respect to dividends on our shares of common stock against its taxable income, assuming such U.S. Holder does not take a credit for any foreign income taxes paid or accrued during the taxable year and certain other conditions are met. U.S. Holders should consult their own advisors concerning the implications of these rules in light of their particular circumstances.
Taxation of Capital Gains or Losses
Subject to the discussion below under “—Passive Foreign Investment Companies,” gain or loss realized by a U.S. Holder on the sale, exchange or other taxable disposition of ADSs or shares of our common stock generally will be capital gain or loss and generally will be long-term capital gain or loss if the shares of our common stock have been held for more than one year. The amount of gain or loss realized will be the difference between (i) the amount realized on the sale, exchange or other taxable disposition of ADSs or shares of our common stock over (ii) the U.S. Holder’s adjusted tax basis in such ADSs or shares of our common stock. Long-term capital gain realized by certain U.S. Holders (including individuals) generally is eligible for favorable rates of U.S. federal income tax. The deductibility of capital losses is subject to significant limitations under the U.S. Code.
The initial tax basis of shares of our common stock purchased by a U.S. Holder generally will be the U.S. dollar value of the Chilean pesos denominated purchase price determined on the date of purchase. If shares of our common stock are treated as being traded on an “established securities market,” a cash basis U.S. Holder, or, if it elects, an accrual basis U.S. Holder, will determine the U.S. dollar value of the cost of such shares by translating the amount paid at the spot rate of exchange on the settlement date of the purchase. Such an election by an accrual basis U.S. Holder must be applied consistently from year to year and cannot be revoked without the consent of the U.S. Internal Revenue Service (the “U.S. IRS”). If a U.S. Holder converts U.S. dollars to Chilean pesos and immediately uses the currency to purchase shares of our common stock, such conversion generally will not result in taxable gain or loss to the U.S. Holder.
With respect to the sale, exchange or other taxable disposition of shares of our common stock, the amount realized by a U.S. Holder generally will be the U.S. dollar value of the payment received determined on (1) the date of receipt of payment in the case of a cash basis U.S. Holder or (2) the date of disposition in the case of an accrual basis U.S. Holder. If shares of our common stock are treated as being traded on an “established securities market,” a cash basis U.S. Holder, or, if it elects, an accrual basis U.S. Holder, will determine the U.S. dollar value of the amount realized by translating the amount received at the spot rate of exchange on the settlement date of the sale.
178
Table of Contents
Any gain or loss realized by a U.S. Holder on such a sale, exchange or other taxable disposition of shares of our common stock generally will be treated as U.S. source income or loss for U.S. foreign tax credit purposes. If Chilean income tax is withheld on such sale, exchange or other taxable disposition (see “Taxation—Chilean Tax Considerations—Capital Gains”), a U.S. Holder generally would not be able to utilize foreign tax credits in respect of such Chilean income tax unless the U.S. Holder has other income from foreign sources, for purposes of the foreign tax credit limitation rules. Alternatively, a U.S. Holder may be able to deduct Chilean income taxes paid with respect to a disposition of shares of our common stock against its taxable income, assuming such U.S. Holder does not take a credit for any foreign income taxes paid or accrued during the taxable year and certain other conditions are met. U.S. Holders should consult their own tax advisors regarding the application of the foreign tax credit limitation rules to their investment in, and disposition of, the shares of our common stock.
Passive Foreign Investment Companies
Special U.S. federal income tax rules apply to U.S. persons owning ADSs or common shares of a PFIC. A foreign corporation generally will be classified as a PFIC for U.S. federal income tax purposes in any taxable year in which, after applying relevant look through rules with respect to the income and assets of subsidiaries, either:
| • |
at least 75% of its gross income is “passive income”; or |
| • |
on average at least 50% of the gross value of its assets is attributable to assets that produce passive income or are held for the production of passive income. |
For this purpose, passive income generally includes, among other things, dividends, interest, rents, royalties, gains from the disposition of passive assets and gains from commodities and securities transactions. In determining whether a foreign corporation is a PFIC, a pro rata portion of the income and assets of each corporation in which it owns, directly or indirectly, at least 25% interest (by value) is taken into account.
Banks generally derive a substantial part of their income from assets that are interest bearing or that otherwise could be considered passive under the PFIC rules. An exception, however, is provided for income derived in the active conduct of a banking business (the “Active Bank Exception”). The application of the Active Bank Exception to banks is unclear under present U.S. federal income tax law. The U.S. IRS has issued a notice and has proposed U.S. Treasury regulations which have different requirements for qualifying as a foreign bank and for determining the banking income that may be excluded from passive income under the Active Bank Exception. Based on our current estimates of our gross income and gross assets, the nature of our business and our interpretation of the proposed U.S. Treasury regulations and notice relating to the Active Bank Exception, we do not expect to be classified as a PFIC for our current taxable year (although the determination cannot be made until the end of such taxable year), and we intend to continue our operations in such a manner that we do not expect to be classified as a PFIC in the foreseeable future. There can be no assurances in this regard, however, because the application of the relevant rules is complex and involves some uncertainty. The PFIC determination is made annually and is based on the portion of our assets (including goodwill) and income that is characterized as passive under the PFIC rules. In addition, the relevant U.S. Treasury regulations addressing the Active Bank Exception may not be finalized in their current form, and our PFIC status may be impacted if and when these U.S. Treasury regulations are finalized. Moreover, our business plans may change, which may affect the PFIC determination in future years.
If we are treated as a PFIC for any year, U.S. Holders may be subject to adverse tax consequences upon a sale, exchange or other disposition of ADSs or shares of our common stock, or upon the receipt of certain “excess distributions” (generally distributions in excess of 125% of the average distribution over the shorter of a three-year period or the U.S. Holder’s holding period for shares of our common stock) from us. In this event, unless a U.S. Holder elects to be taxed annually on a mark-to-market basis with respect to ADSs or shares of our common stock, as described below, any gain realized on a sale or other taxable disposition of ADSs or shares of our common stock or excess distributions would be treated as realized ratably over the U.S. Holder’s holding period for such ADSs or shares of our common stock, and amounts allocated to prior years during which we were a PFIC would be taxed at the highest tax rate in effect for each such year. An additional interest charge may apply to the portion of the U.S. federal income tax liability on such gain or distribution treated under the PFIC rules as having been deferred by the U.S. Holder. Amounts allocated to the taxable year in which the sale or excess distribution occurs and to any year before we became a PFIC would be taxed as ordinary income in the taxable year in which the sale or excess distribution occurs. If we were a PFIC, certain subsidiaries and other entities in which we have a direct or indirect interest may also be PFICs (“Lower-tier PFICs”). Under attribution rules, U.S. Holders would be deemed to own their proportionate shares of Lower-tier PFICs and would be subject to U.S. federal income tax according to the rules described above on (i) certain distributions by a Lower-tier PFIC and (ii) a disposition of shares of a Lower-tier PFIC, in each case as if the U.S. Holder held such shares directly, even though such U.S. Holder had not received the proceeds of those distributions or dispositions.
179
Table of Contents
If we are treated as a PFIC, the rules described in the foregoing paragraph can be avoided by a U.S. Holder that makes a “mark-to-market” election. A U.S. Holder may make a mark-to-market election for ADSs or shares of our common stock (but not for the shares of any Lower-tier PFIC) if such ADSs or shares of our common stock constitute “marketable stock” as defined in the U.S. Treasury regulations. ADSs and shares of our common stock will be marketable stock if they are regularly traded on a “qualified exchange or other market” within the meaning of the U.S. Treasury regulations. The ADSs are listed on the NYSE, and will qualify as regularly traded on an established securities market so long as they are so listed. No assurance can be given, however, that our common stock will be considered regularly traded on an established securities market. In particular, it is unclear whether the Santiago Stock Exchange, the Bolsa Electrónica de Chile and the Valparaiso Stock Exchange would meet the requirements for a “qualified exchange or other market.” A U.S. Holder electing the mark-to-market regime generally would compute gain or loss at the end of each taxable year as if the ADSs or shares of our common stock had been sold at fair market value. Any gain recognized by the U.S. Holder under mark-to-market treatment, or on an actual sale, would be treated as ordinary income, and the U.S. Holder would be allowed an ordinary deduction for any decrease in the value of its ADSs or shares of our common stock as of the end of any taxable year, and for any loss recognized on an actual sale, but only to the extent, in each case, of previously included mark-to-market income not offset by previously deducted decreases in value. Any loss on an actual sale of ADSs or shares of our common stock would be a capital loss to the extent in excess of previously included mark-to-market income not offset by previously deducted decreases in value. A U.S. Holder’s adjusted tax basis in its ADSs or shares of our common stock will be increased by the amount of income inclusion and decreased by the amount of deductions under the mark-to-market rules. U.S. Holders should be aware, however, that if we are determined to be a PFIC, the interest charge regime described above could be applied to indirect distributions or gains deemed to be attributable to U.S. Holders in respect of any of our Lower-tier PFICs, and the mark-to-market election generally would not be effective for such Lower-tier PFICs.
The rules described in the second preceding paragraph can also be avoided by a U.S. Holder that elects to treat us as a “qualified electing fund.” However, this option generally will not be available to U.S. Holders because we do not intend to provide the information necessary for U.S. Holders to make such election.
A U.S. Holder that owns ADSs or shares of our common stock during any taxable year that we are treated as a PFIC generally would be required to file U.S. IRS Form 8621. U.S. Holders should consult their own tax advisors regarding the application of the PFIC rules to ADSs or shares of our common stock, the availability and advisability of making an election to avoid the adverse tax consequences of the PFIC rules should we be considered a PFIC for any taxable year and the application of the reporting requirements on U.S. IRS Form 8621 to their particular situation.
Backup Withholding and Information Reporting
Dividends paid on, and proceeds from the sale or other disposition of, ADSs or shares of our common stock to a U.S. Holder generally will be subject to the information reporting requirements of the U.S. Code and may be subject to backup withholding unless the U.S. Holder provides an accurate taxpayer identification number and makes any other required certification or otherwise establishes an exemption. Backup withholding is not an additional tax. The amount of any backup withholding from a payment to a U.S. Holder will be allowed as a credit against the U.S. Holder’s U.S. federal income tax liability and may entitle the U.S. Holder to a refund, provided that certain required information is timely furnished to the U.S. IRS.
In addition, U.S. Holders may be required to comply with certain reporting requirements, including filing a U.S. IRS Form 8938, Statement of Foreign Financial Assets, with respect to the holding of certain foreign financial assets, including stock of foreign issuers, either directly or through certain foreign financial institutions, if the aggregate value of all such assets exceeds U.S.$50,000. U.S. Holders should consult their own tax advisors regarding the application of the information reporting rules to ADSs or shares of our common stock and the application of these reporting requirements to their particular situations.
HOLDERS OF ADSs OR SHARES OF OUR COMMON STOCK SHOULD CONSULT THEIR OWN TAX ADVISORS AS TO THE CHILEAN, U.S. FEDERAL INCOME AND OTHER TAX CONSEQUENCES OF THE ACQUISITION, OWNERSHIP AND DISPOSITION OF ADSs OR SHARES OF OUR COMMON STOCK, INCLUDING, IN PARTICULAR, THE EFFECT OF ANY NON-U.S., STATE OR LOCAL TAX LAWS.
180
Table of Contents
WHERE TO FIND ADDITIONAL INFORMATION
The materials included in this annual report on Form 20-F, and exhibits thereto, may be inspected and copied at the SEC’s public reference room in Washington, D.C. Please call the SEC at 1-800-SEC-0330 for further information on the public reference rooms. The SEC also maintains a website at http://www.sec.gov that contains the same reports and information about us. The reports and information about us can be downloaded from the SEC’s website.
| Item 11 | Quantitative and Qualitative Disclosures About Market Risk |
For quantitative and qualitative information related to market risk, see Note 42 to our audited consolidated financial statements as of and for the year ended December 31, 2013 appearing elsewhere in this annual report.
| Item 12 | Description of Securities Other Than Equity Securities |
| Item 12A |
|
Not Applicable.
| Item 12B | Warrants and Rights |
Not Applicable.
| Item 12C | Other Securities |
Not Applicable.
| Item 12D | American Depositary Shares |
JPMorgan Chase Bank, N.A. (the “Depositary”) serves as the depositary for our ADSs. ADS holders are required to pay various fees to the Depositary, and the Depositary may refuse to provide any service for which a fee is assessed until the applicable fee has been paid.
ADS holders are required to pay the Depositary amounts in respect of expenses incurred by the Depositary or its agents on behalf of ADS holders, including expenses arising from compliance with applicable law, taxes or other governmental charges, facsimile transmission or conversion of foreign currency into U.S. dollars.
ADS holders are also required to pay additional fees for certain services provided by the Depositary, as set forth in the table below.
|
Depositary service |
Fee payable by ADS holders |
|
| (a) Issuance and delivery of ADRs against deposits of shares, including deposits in respect of share distributions, rights and other distributions | Up to U.S.$5.00 per 100 ADSs (or portion thereof) | |
| (b) Distribution of dividends | U.S.$0.02 or less per ADS | |
| (c) Withdrawal of shares underlying ADSs | Up to U.S.$5.00 per 100 ADSs (or portion thereof) | |
| (d) Transfer, combination and split-up of ADRs | U.S.$1.50 per ADS |
181
Table of Contents
The Depositary may sell (by public or private sale) sufficient securities and property received in respect of share distributions, rights and other distributions prior to the deposit of shares to pay the charges described in (a) and (c) of the table above. In addition, the Depositary may deduct from any distributions on or in respect of deposited securities, or may sell by public or private sale for the account of a holder, any part or all of such deposited securities (after attempting by reasonable means to notify the holder prior to such sale), and may apply such deduction or the proceeds of any such sale in payment of any tax or other governmental charge that may become payable by or on behalf of a custodian or the Depositary with respect to any ADR, any deposited securities represented by ADSs or any distribution thereon.
Payments by the Depositary
The Depositary has agreed to reimburse us for certain reasonable expenses related to the ADS program, subject to a cap agreed between the Depositary and us. These reimbursable expenses currently include, but are not limited to, legal fees, NYSE listing fees, investor relations servicing, investor related presentations, ADR-related advertising and public relations in those jurisdictions in which the ADRs may be listed or otherwise quoted for trading, and accountants’ fees in relation to our regulatory filings. During the year ended December 31, 2013, such reimbursements totaled U.S$14,841.32.
182
Table of Contents
| Item 13 | Defaults, Dividend Arrearages and Delinquencies |
None.
| Item 14 | Material Modifications to the Rights of Security Holders and Use of Proceeds |
None.
| Item 15 | Controls and Procedures |
(a) Disclosure Controls and Procedures
We have evaluated, with the participation of our chief executive officer and chief financial officer, the effectiveness of our disclosure controls and procedures as of December 31, 2013.
There are inherent limitations to the effectiveness of any system of disclosure controls and procedures, including the possibility of human error and the circumvention or overriding of the controls and procedures. Accordingly, even effective disclosure controls and procedures can only provide reasonable assurance of achieving their control objectives. Based upon our evaluation, our chief executive officer and chief financial officer concluded that our disclosure controls and procedures were effective to provide reasonable assurance that information required to be disclosed by us in the reports that we file or submit under the Exchange Act is recorded, processed, summarized and reported, within the time periods specified in the applicable rules and forms, and that it is accumulated and communicated to our management, including our chief executive officer and chief financial officer, as appropriate to allow timely decisions regarding required disclosure.
(b) Management’s Annual Report on Internal Control Over Financial Reporting
Our management is responsible for establishing and maintaining adequate internal control over financial reporting as defined in Rules 13a-15(f) and 15d-15(f) under the Exchange Act. The company’s internal control over financial reporting is designed to provide reasonable assurance regarding the reliability of financial reporting and the preparation of financial statements for external purposes in accordance with generally accepted accounting principles. The company’s internal control over financial reporting includes those policies and procedures that:
(i) pertain to the maintenance of records that, in reasonable detail, accurately and fairly reflect the transactions and dispositions of the assets of the company;
(ii) provide reasonable assurance that transactions are recorded as necessary to permit preparation of financial statements in accordance with generally accepted accounting principles, and that receipts and expenditures of the company are being made only in accordance with authorizations of management and directors of the company; and
(iii) provide reasonable assurance regarding prevention or timely detection of unauthorized acquisition, use or disposition of the company’s assets that could have a material effect on the financial statements.
Because of its inherent limitations, internal control over financial reporting may not prevent or detect misstatements. Also, projections of any evaluation of effectiveness to future periods are subject to the risk that controls may become inadequate because of changes in conditions, or that the degree of compliance with the policies or procedures may deteriorate.
Management assessed the effectiveness of the company’s internal control over financial reporting as of December 31, 2013. In making this assessment, management used the criteria set forth by the Committee of Sponsoring Organizations of the Treadway Commission (COSO – 1992 framework) in Internal Control-Integrated Framework.
Based on our assessment and those criteria, management believes that the company maintained effective internal control over financial reporting as of December 31, 2013.
183
Table of Contents
(c) Report of Independent Registered Public Accounting Firm on Internal Controls
Ernst & Young Limitada, the independent registered public accounting firm that has audited our financial statements, has issued an attestation report on our internal control over financial reporting as of December 31, 2012. This attestation report appears on page F-3 of our audited consolidated financial statements as of and for the year ended December 31, 2013.
(d) Changes in Internal Control over Financial Reporting
There has been no change in our internal control over financial reporting during 2013 that has materially affected, or is reasonably likely to materially affect, our internal control over financial reporting.
| Item 16A | Audit Committee Financial Expert |
Our board of directors has determined that Mr. Jorge Awad M., a member of our directors/audit committee who satisfies the independence requirements of both Chilean law and Rule 10A-3 under the Exchange Act, qualifies as an “audit committee financial expert” pursuant to the Instruction to paragraph (a) of Item 16A. Mr. Awad possesses the relevant financial experience because of his oversight of the preparation of financial statements of various companies through his experience detailed in “Item 6. Directors, Senior Management and Employees—Jorge Awad M.”, in particular with LATAM Airlines Group S.A. (an SEC registrant) as a former member of their board of director’s committee, where his main duties included the examination of reports of external auditors, balance sheets and other financial statements required by applicable regulations, and also as chairman of the Chilean Bankers Association and his academic background.
| Item 16B | Code of Ethics |
In 2008, we adopted a new Code of Ethics, as defined in Item 16B of Form 20-F under the Exchange Act. The Code of Ethics applies to our chief executive officer, chief financial officer, principal accounting officer and persons performing similar functions, and to all other employees without exception. Since 2011, the Code of Ethics additionally applies to our Directors and Consultants of our Board. A current copy of the Code of Ethics is filed as Exhibit 11.1 to this annual report.
| Item 16C | Principal Accountant Fees and Services |
Audit and Non-Audit Fees
The following table sets forth the fees billed to us by our independent auditors, Ernst & Young Limitada, during the fiscal years ended December 31, 2011, 2012 and 2013:
| Year ended December 31, | ||||||||||||
| 2011 | 2012 | 2013 | ||||||||||
| (in millions of Ch$) | ||||||||||||
|
Audit fees |
Ch$ | 554 | Ch$ | 616 | Ch$ | 603 | ||||||
|
Audit-related fees |
181 | 224 | 200 | |||||||||
|
Tax fees |
— | — | 3 | |||||||||
|
Other fees |
— | — | — | |||||||||
|
|
|
|
|
|
|
|||||||
|
Total fees |
Ch$ | 735 | Ch$ | 840 | Ch$ | 806 | ||||||
|
|
|
|
|
|
|
|||||||
“Audit fees” in the above table are the aggregate fees billed by Ernst & Young Limitada in connection with the audit of our annual financial statements. This line item includes: (i) the statutory audit required by local regulations, (ii) annual reviews related to filings with the SEC, and (iii) the audit of the consolidated financial statements required by Item 18 of Form 20-F.
184
Table of Contents
“Audit-related fees” in the above table are fees billed by Ernst & Young Limitada mainly for limited reviews engagements, issuance of comfort letters in connection to foreign debt issuances and other audit related services.
“Tax fees” in the above table are fees billed by Ernst & Young Limitada for permitted tax advisory services.
“Other fees”. No other fees have been billed during 2011, 2012 and 2013.
Directors/Audit Committee Pre-Approval Policies and Procedures
Auditors are pre-approved by our directors/audit committee, whose main duties are disclosed in “Item 6. Directors, Senior Management and Employees—Board Practices.” Furthermore, the selection of external auditors is subject to approval by our shareholders at the ordinary annual shareholders’ meeting. All proposed services carried out by our external auditors as well as corresponding fees related to audit and non-audit services, have been presented to our directors/audit committee, which has determined they are reasonable and consistent with our policies.
| Item 16D | Exemptions from the Listing Standards for Audit Committees |
Mr. Pino serves on our directors/audit committee in reliance upon the exemption from the independence requirements contained in Rule 10A-3(b)(1)(iv)(D). We do not believe that such reliance would materially adversely affect the ability of the directors/audit committee to act independently and to satisfy the other requirements of Rule 10A-3.
| Item 16E | Purchases of Equity Securities by the Issuer and Affiliated Purchasers |
We did not make any purchases of our previously issued shares during the fiscal year ended December 31, 2013.
| Item 16F | Change in Registrant’s Certifying Accountant |
Not Applicable.
| Item 16G | Corporate Governance |
Pursuant to Section 303A.11 of the Listed Company Manual of the NYSE, we are required to provide a summary of the significant ways in which our corporate governance practices differ from those required for U.S. companies under the NYSE listing standards. We are a Chilean bank with shares listed on the Santiago Stock Exchange, the Valparaiso Stock Exchange, the Chilean Electronic Stock Exchange, the LSE and the Latibex and ADSs listed on the New York Stock Exchange. Our corporate governance practices are governed by our bylaws, the General Banking Law, the Chilean Corporations Law, the Ley de Mercado de Valores No. 18,045 (the Securities Market Law), and the regulations issued by the SBIF. Therefore, you may not have the same protections afforded to shareholders of U.S. companies under the NYSE listing standards.
185
Table of Contents
The table below discloses the significant differences between our corporate governance practices and the NYSE standards.
|
NYSE Standards |
Our Corporate Governance Practice |
|
| Director Independence . Majority of board of directors must be independent. “Controlled companies,” which would include our company if it were a U.S. issuer, are exempt from this requirement. §303A.01 | Pursuant to the General Banking Law, we are not required to make a determination as to the independence of our directors. However, pursuant to the Chilean Corporations Law, under certain circumstances provided in Article 50bis of such law, we are required to appoint at least one independent director. | |
| The definition of independence applicable to us pursuant to the Chilean Corporations Law differs in certain aspects from the definition applicable to U.S. issuers under the NYSE rules. | ||
| Under the Chilean Corporations Law, as recently amended, there are several factors that must be observed in order to determine whether a director is deemed to be independent. These factors are included in Article 50bis of the Chilean Corporations Law. In addition, under the regulations of the SBIF, members of the directors/audit committee must satisfy international independence criteria set forth by our board of directors. | ||
| Executive Sessions . Non-management directors must meet regularly in executive sessions without management. Independent directors should meet alone in an executive session at least once a year. §303A.03 | There is no similar requirement under our bylaws or under applicable Chilean law. | |
| Audit committee . Audit committee must satisfy the independence and other requirements of Rule 10A-3 under the Exchange Act, and the more stringent requirements under the NYSE standards is required. §§303A.06, 303A.07. | We are in compliance with Rule 10A-3. The members of our directors/audit committee are not required to satisfy the NYSE independence and other audit committee standards that are not prescribed by Rule 10A-3. | |
| Nominating/corporate governance committee . Nominating/corporate governance committee of independent directors is required. The committee must have a charter specifying the purpose, duties and evaluation procedures of the committee. “Controlled companies,” which would include our company if it were a U.S. issuer, are exempt from these requirements. §303A.04 | We are not required to have, and do not have, a nominating/corporate governance committee. | |
186
Table of Contents
|
NYSE Standards |
Our Corporate Governance Practice |
|
| Compensation committee . Compensation committee of independent directors is required, which must approve executive officer compensation. The committee must have a charter specifying the purpose, duties and evaluation procedures of the committee. “Controlled companies,” which would include our company if it were a U.S. issuer, are exempt from this requirement. §303A.05 | We are not required to have a compensation committee. Pursuant to the Chilean Corporations Law, our directors/audit committee must approve compensation plans. | |
| Equity compensation plans . Equity compensation plans require shareholder approval, subject to limited exemptions. | Equity compensation plans require shareholder approval, subject to limited exemptions. | |
| Code of Ethics . Corporate governance guidelines and a code of business conduct and ethics is required, with disclosure of any waiver for directors or executive officers. §303A.10 | We have adopted a code of ethics applicable to all of our executive officers, employees, directors and advisors to our board of directors, a version of which is filed as an exhibit to this Form 20-F. We are required by Item 16B of Form 20-F to disclose any waivers granted to our chief executive officer, chief financial officer, principal accounting officer and persons performing similar functions. Our Code of Ethics sets forth the principles and values that govern personnel conduct as well as other issues such as conflicts of interests, usage of privileged information, internal controls for fraud prevention and labor responsibility. | |
187
Table of Contents
| Item 17 | Financial Statements |
Not applicable.
| Item 18 | Financial Statements |
Our audited consolidated financial statements are included in this annual report beginning at page F-1. Our financial statements have been prepared in accordance with International Financial Reporting Standards as issued by the International Accounting Standards Board.
| Item 19 | Exhibits |
LIST OF EXHIBITS
|
Exhibit
No. |
Exhibit |
|
| 1.1 | Estatutos of Banco de Chile, which serve as our articles of incorporation and bylaws (English translation).* | |
| 2.1 | Form of Deposit agreement among Banco de Chile, JPMorgan Chase Bank as depositary, and the holders from time to time of ADSs (incorporated by reference to our registration statement on Form F-4 (File No. 333-14020) filed on October 18, 2001). | |
| 2.2 | Amendment No. 1, dated February 1, 2011, to the Deposit Agreement among Banco de Chile, JPMorgan Chase Bank, N.A. as depositary and holders from time to time of ADSs (incorporated by reference to our registration statement on Form F-6 (Registration No. 333-171999) filed on February 1, 2011). | |
| 3.1 | Master Joint Venture Agreement between Quiñenco S.A., Citigroup, Inc. and Citibank Overseas Investment Corporation, dated July 19, 2007 (English translation) (filed as an exhibit to our annual report on Form 20-F (File No. 001-15266) for the year ended December 31, 2007, and incorporated herein by reference). | |
| 3.2 | Shareholders Agreement between Quiñenco, S.A., Citigroup Chile S.A. and the minority shareholders of LQIF, dated December 27, 2007 (English translation) (filed as an exhibit to our annual report on Form 20-F (File No. 001-15266) for the year ended December 31, 2007, and incorporated herein by reference). | |
188
Table of Contents
|
Exhibit
No. |
Exhibit |
|
| 3.3 | Amendment to the Master Joint Venture Agreement between Quiñenco S.A., Citigroup, Inc. and Citibank Overseas Investment Corporation, dated December 19, 2008 (English translation) (filed as an exhibit to our annual report on Form 20-F (File No. 001-15266) for the year ended December 31, 2008, and incorporated herein by reference). | |
| 3.4 | Amendment to the Master Joint Venture Agreement between Quiñenco S.A., Citigroup, Inc. and Citibank Overseas Investment Corporation, dated December 19, 2008 (English translation) (filed as an exhibit to our annual report on Form 20-F (File No. 001-15266) for the year ended December 31, 2008, and incorporated herein by reference). | |
| 3.5 | Amendment to the Shareholders Agreement between Quiñenco S.A., Citigroup Chile S.A. and the minority shareholders of LQIF, dated January 9, 2014 (English translation) (filed as an exhibit to our current report on Form 6-K dated January 14, 2014, and incorporated herein by reference). | |
| 3.6 | Amendment to the Master Joint Venture Agreement between Quiñenco S.A., Citigroup Inc. and Citibank Overseas Investment Corporation, dated January 9, 2014 (English translation) (filed as an exhibit to our current report on Form 6-K dated January 14, 2014, and incorporated herein by reference). | |
| 4.1 | Merger Agreement between Banco de Chile and Citibank Chile, dated December 26, 2007 (English translation) (filed as an exhibit to our annual report on Form 20-F (File No. 001-15266) for the year ended December 31, 2007, and incorporated herein by reference). | |
| 4.2 | Cooperation Agreement between Banco de Chile and Citigroup Inc., dated December 27, 2007 (English translation) (filed as an exhibit to our annual report on Form 20-F (File No. 001-15266) for the year ended December 31, 2007, and incorporated herein by reference). | |
| 4.3 | Global Connectivity Agreement between Banco de Chile and Citigroup Inc., dated December 27, 2007 (English translation) (filed as an exhibit to our annual report on Form 20-F (File No. 001-15266) for the year ended December 31, 2007, and incorporated herein by reference). | |
| 4.4 | Asset Purchase Agreement between Banco de Chile and Citibank, N.A., dated December 31, 2007 (English translation) (filed as an exhibit to our annual report on Form 20-F (File No. 001-15266) for the year ended December 31, 2007, and incorporated herein by reference). | |
189
Table of Contents
|
Exhibit
No. |
Exhibit |
|
| 4.5 | Trademark License Agreement between Banco de Chile and Citigroup Inc., dated December 27, 2007 (English translation) (filed as an exhibit to our annual report on Form 20-F (File No. 001-15266) for the year ended December 31, 2007, and incorporated herein by reference). | |
| 4.6 | First Supplementary Agreement to the Cooperation Agreement between Banco de Chile and Citigroup Inc., dated February 27, 2009 (English translation) (filed as an exhibit to our annual report on Form 20-F (File No. 001-15266) for the year ended December 31, 2008, and incorporated herein by reference). | |
| 4.7 | First Supplementary Agreement to the Global Connectivity Agreement between Banco de Chile and Citigroup Inc., dated February 27, 2009 (English translation) (filed as an exhibit to our annual report on Form 20-F (File No. 001-15266) for the year ended December 31, 2008, and incorporated herein by reference). | |
| 4.8 | Amendment to the Trademark License Agreement between Banco de Chile and Citigroup Inc., dated February 27, 2009 (English translation) (filed as an exhibit to our annual report on Form 20-F (File No. 001-15266) for the year ended December 31, 2008, and incorporated herein by reference). | |
| 4.9 | Master Services Agreement between Banco de Chile and Citigroup, Inc., dated September 25, 2009. (filed as an exhibit to our annual report on Form 20-F (File No. 001-15266) for the year ended December 31, 2009, and incorporated herein by reference). | |
| 5.1 | List of subsidiaries.* | |
| 6.1 | Code of Professional Ethics (English translation) (filed as an exhibit to our annual report on Form 20-F (File No. 001-15266 for the year ended December 21, 2010, and incorporated herein by reference). | |
| 12.1 | Certification under Section 302 of the Sarbanes-Oxley Act of 2002.* | |
190
Table of Contents
|
Exhibit
No. |
Exhibit |
|
| 12.2 | Certification under Section 302 of the Sarbanes-Oxley Act of 2002.* | |
| 13.1 | Certification under Section 906 of the Sarbanes-Oxley Act of 2002.* | |
| * | Filed herewith. |
Omitted from the exhibits filed with this annual report are certain instruments and agreements with respect to our long-term debt, none of which authorizes securities in a total amount that exceeds 10% of our total assets. We hereby agree to furnish to the SEC copies of any such omitted instruments or agreements as the SEC requests.
191
Table of Contents
Consolidated Financial Statements
BANCO DE CHILE AND SUBSIDIARIES
December 31, 2012 and 2013
| Ch$ or CLP | = | Chilean pesos | ||
| MCh$ | = | Millions of Chilean pesos | ||
| US$ or USD | = | U.S. dollars | ||
| ThUS$ | = | Thousands of U.S. dollars | ||
| JPY | = | Japanese yen | ||
| EUR | = | Euro | ||
| MXN | = | Mexican pesos | ||
| HKD | = | Hong Kong dollars | ||
| PEN | = | Peruvian nuevo sol | ||
| CHF | = | Swiss franc | ||
| UF or CLF | = | Unidad de fomento | ||
| (The unidad de fomento is an inflation-indexed, Chilean peso denominated monetary unit set daily in advance on the basis of the previous month’s inflation rate). |
Table of Contents
| F-3 | ||||
|
Report of Independent Registered Public Accounting Firm on Internal Control over Financial Reporting |
F-4 | |||
| F-5 | ||||
| F-6 | ||||
| F-8 | ||||
| F-9 | ||||
| F-10 |
Table of Contents
|
|
EY Chile Avda. Presidente Riesco 5435, piso 4, Santiago |
Tel: +56 (2) 2676 1000 www.eychile.cl |
Report of Independent Registered Public Accounting Firm
To the Board of Directors and Shareholders of Banco de Chile:
We have audited the accompanying consolidated financial statements of Banco de Chile and subsidiaries (the “Bank”), which comprise the consolidated statements of financial position as of December 31, 2013 and 2012, and the related consolidated statements of comprehensive income, shareholders’ equity and cash flows for each of the three years in the period ended December 31, 2013. These consolidated financial statements are the responsibility of the Bank’s management. Our responsibility is to express an opinion on these financial statements based on our audits.
We conducted our audits in accordance with the standards of the Public Company Accounting Oversight Board (United States). Those standards require that we plan and perform the audit to obtain reasonable assurance about whether the financial statements are free of material misstatement. An audit includes examining, on a test basis, evidence supporting the amounts and disclosures in the financial statements. An audit also includes assessing the accounting principles used and significant estimates made by management, as well as evaluating the overall financial statement presentation. We believe that our audits provide a reasonable basis for our opinion.
In our opinion, the consolidated financial statements referred to above present fairly, in all material respects, the consolidated financial position of Banco de Chile and subsidiaries as of December 31, 2013 and 2012, and the consolidated results of their operations and their cash flows for each of the three years in the period ended December 31, 2013, in conformity with International Financial Reporting Standards as issued by the International Accounting Standards Board.
We also have audited, in accordance with the standards of the Public Company Accounting Oversight Board (United States), the Bank’s internal control over financial reporting as of December 31, 2013, based on criteria established in Internal Control-Integrated Framework issued by the Committee of Sponsoring Organizations of the Treadway Commission (1992 framework) and our report dated April 24, 2014, expressed an unqualified opinion thereon.
ERNST & YOUNG LIMITADA
Santiago, Chile
April 24, 2014
A member firm of Ernst & Young Global Limited
F-3
Table of Contents

|
EY Chile Avda. Presidente Riesco 5435, piso 4, Santiago |
Tel: +56 (2) 2676 1000 www.eychile.cl |
Report of Independent Registered Public Accounting Firm on Internal Control over Financial Reporting
To the Board of Directors and Shareholders of Banco de Chile:
We have audited Banco de Chile and subsidiaries’ internal control over financial reporting as of December 31, 2013, based on criteria established in Internal Control—Integrated Framework issued by the Committee of Sponsoring Organizations of the Treadway Commission (1992 framework) (the “COSO criteria”). Banco de Chile and subsidiaries’ management is responsible for maintaining effective internal control over financial reporting, and for its assessment of the effectiveness of internal control over financial reporting included in the accompanying Management’s Annual Report on Internal Control Over Financial Reporting. Our responsibility is to express an opinion on the company’s internal control over financial reporting based on our audit.
We conducted our audit in accordance with the standards of the Public Company Accounting Oversight Board (United States). Those standards require that we plan and perform the audit to obtain reasonable assurance about whether effective internal control over financial reporting was maintained in all material respects. Our audit included obtaining an understanding of internal control over financial reporting, assessing the risk that a material weakness exists, testing and evaluating the design and operating effectiveness of internal control based on the assessed risk, and performing such other procedures as we considered necessary in the circumstances. We believe that our audit provides a reasonable basis for our opinion.
A company’s internal control over financial reporting is a process designed to provide reasonable assurance regarding the reliability of financial reporting and the preparation of financial statements for external purposes in accordance with generally accepted accounting principles. A company’s internal control over financial reporting includes those policies and procedures that (1) pertain to the maintenance of records that, in reasonable detail, accurately and fairly reflect the transactions and dispositions of the assets of the company; (2) provide reasonable assurance that transactions are recorded as necessary to permit preparation of financial statements in accordance with generally accepted accounting principles, and that receipts and expenditures of the company are being made only in accordance with authorizations of management and directors of the company; and (3) provide reasonable assurance regarding prevention or timely detection of unauthorized acquisition, use, or disposition of the company’s assets that could have a material effect on the financial statements.
Because of its inherent limitations, internal control over financial reporting may not prevent or detect misstatements. Also, projections of any evaluation of effectiveness to future periods are subject to the risk that controls may become inadequate because of changes in conditions, or that the degree of compliance with the policies or procedures may deteriorate.
In our opinion, Banco de Chile and subsidiaries maintained, in all material respects, effective internal control over financial reporting as of December 31, 2013, based on the COSO criteria.
We also have audited, in accordance with the standards of the Public Company Accounting Oversight Board (United States), the 2013 consolidated financial statements of Banco de Chile and subsidiaries which comprise the consolidated statements of financial position as of December 31, 2013 and 2012, and the related consolidated statements of comprehensive income, shareholders’ equity and cash flows for each of the three years in the period ended December 31, 2013, and our report dated April 24, 2014, expressed an unqualified opinion thereon.
ERNST & YOUNG LIMITADA
Santiago, Chile
April 24, 2014
A member firm of Ernst & Young Global Limited
F-4
Table of Contents
BANCO DE CHILE AND SUBSIDIARIES
CONSOLIDATED STATEMENT OF FINANCIAL POSITION
As of December 31, 2012 and 2013
(Expressed in millions of Chilean pesos unless otherwise specified)
| Notes |
2012
MCh$ |
2013
MCh$ |
2013
ThUS$ |
|||||||||||
|
ASSETS |
||||||||||||||
|
Cash and due from banks |
6 | 684,925 | 873,308 | 1,661,166 | ||||||||||
|
Transactions in the course of collection |
6 | 310,077 | 300,026 | 570,695 | ||||||||||
|
Financial assets held-for-trading |
7 | 159,682 | 326,921 | 621,854 | ||||||||||
|
Cash collateral on securities borrowed and reverse repurchase agreements |
8 | 35,100 | 82,422 | 156,779 | ||||||||||
|
Derivative instruments |
9 | 326,083 | 374,687 | 712,712 | ||||||||||
|
Loans and advance to banks |
10 | 1,343,322 | 1,062,056 | 2,020,193 | ||||||||||
|
Loans to customers, net |
11 | 18,383,958 | 20,441,472 | 38,882,812 | ||||||||||
|
Financial assets available-for-sale |
12 | 1,272,316 | 1,681,883 | 3,199,199 | ||||||||||
|
Investments in other companies |
13 | 11,674 | 14,407 | 27,404 | ||||||||||
|
Intangible assets |
14 | 75,610 | 72,223 | 137,379 | ||||||||||
|
Property and equipment |
15 | 205,189 | 197,578 | 375,824 | ||||||||||
|
Investments properties |
16 | 16,698 | 16,317 | 31,037 | ||||||||||
|
Current tax assets |
17 | — | — | — | ||||||||||
|
Deferred tax assets, net |
17 | 55,801 | 56,421 | 107,321 | ||||||||||
|
Other assets |
18 | 317,765 | 373,987 | 711,381 | ||||||||||
|
|
|
|
|
|
|
|||||||||
|
TOTAL ASSETS |
23,198,200 | 25,873,708 | 49,215,756 | |||||||||||
|
|
|
|
|
|
|
|||||||||
|
LIABILITIES |
||||||||||||||
|
Current accounts and other demand deposits |
19 | 5,470,971 | 5,984,332 | 11,383,116 | ||||||||||
|
Transactions in the course of payments |
6 | 72,684 | 51,898 | 98,718 | ||||||||||
|
Cash collateral on securities lent and repurchase agreements |
8 | 226,396 | 256,766 | 488,408 | ||||||||||
|
Saving accounts and time deposits |
20 | 9,612,950 | 10,402,725 | 19,787,577 | ||||||||||
|
Derivative instruments |
9 | 380,322 | 426,110 | 810,527 | ||||||||||
|
Borrowings from financial institutions |
21 | 1,108,681 | 989,465 | 1,882,114 | ||||||||||
|
Debt issued |
22 | 3,273,933 | 4,366,960 | 8,306,627 | ||||||||||
|
Other financial obligations |
23 | 162,123 | 210,926 | 401,214 | ||||||||||
|
Current tax liabilities |
17 | 23,189 | 7,131 | 13,564 | ||||||||||
|
Provisions |
24 | 141,839 | 154,650 | 294,168 | ||||||||||
|
Employee benefits |
25 | 64,545 | 67,944 | 129,240 | ||||||||||
|
Other liabilities |
26 | 305,105 | 275,762 | 524,539 | ||||||||||
|
|
|
|
|
|
|
|||||||||
|
TOTAL LIABILITIES |
20,842,738 | 23,194,669 | 44,119,812 | |||||||||||
|
|
|
|
|
|
|
|||||||||
|
EQUITY |
||||||||||||||
|
Attributable to equity holders of the parent: |
||||||||||||||
|
Capital |
1,629,078 | 1,849,351 | 3,517,749 | |||||||||||
|
Reserves |
295,177 | 345,269 | 656,755 | |||||||||||
|
Other Comprehensive income |
25,769 | 22,999 | 43,748 | |||||||||||
|
Retained earnings: |
||||||||||||||
|
Retained earnings from previous periods |
65,311 | 65,311 | 124,232 | |||||||||||
|
Income for the year |
479,880 | 550,188 | 1,046,542 | |||||||||||
|
Less: |
||||||||||||||
|
Provisions for minimum dividend |
(139,755 | ) | (154,081 | ) | (293,086 | ) | ||||||||
|
Non-controlling interest |
2 | 2 | 4 | |||||||||||
|
|
|
|
|
|
|
|||||||||
|
TOTAL EQUITY |
28 | 2,355,462 | 2,679,039 | 5,095,944 | ||||||||||
|
|
|
|
|
|
|
|||||||||
|
TOTAL LIABILITIES AND EQUITY |
23,198,200 | 25,873,708 | 49,215,756 | |||||||||||
|
|
|
|
|
|
|
|||||||||
The accompanying notes 1 to 45 are an
integral part of these consolidated financial statements
F-5
Table of Contents
BANCO DE CHILE AND SUBSIDIARIES
As of December 31, 2011, 2012 and 2013
(Expressed in millions of Chilean pesos unless otherwise specified)
| Notes |
2011
MCh$ |
2012
MCh$ |
2013
MCh$ |
2013
ThUS$ |
||||||||||||||
|
A. STATEMENT OF INCOME |
||||||||||||||||||
|
Interest revenue |
29 | 1,501,684 | 1,672,766 | 1,765,942 | 3,359,092 | |||||||||||||
|
Interest expense |
29 | (624,209 | ) | (708,629 | ) | (704,371 | ) | (1,339,822 | ) | |||||||||
|
|
|
|
|
|
|
|
|
|||||||||||
|
Net interest income |
877,475 | 964,137 | 1,061,571 | 2,019,270 | ||||||||||||||
|
|
|
|
|
|
|
|
|
|||||||||||
|
Income from fees and commissions |
30 | 367,966 | 372,767 | 386,732 | 735,624 | |||||||||||||
|
Expense from fees and commissions |
30 | (77,858 | ) | (85,495 | ) | (99,639 | ) | (189,529 | ) | |||||||||
|
|
|
|
|
|
|
|
|
|||||||||||
|
Net fees and commissions income |
290,108 | 287,272 | 287,093 | 546,095 | ||||||||||||||
|
|
|
|
|
|
|
|
|
|||||||||||
|
Net financial operating income |
31 | 58,101 | 16,199 | 32,672 | 62,147 | |||||||||||||
|
Foreign exchange transactions, net |
32 | (7,973 | ) | 35,136 | 71,457 | 135,922 | ||||||||||||
|
Other operating income |
37 | 24,735 | 20,887 | 25,884 | 49,235 | |||||||||||||
|
|
|
|
|
|
|
|
|
|||||||||||
|
Total operating revenues |
1,242,446 | 1,323,631 | 1,478,677 | 2,812,669 | ||||||||||||||
|
Provision for loan losses |
33 | (146,925 | ) | (166,420 | ) | (221,653 | ) | (421,618 | ) | |||||||||
|
|
|
|
|
|
|
|
|
|||||||||||
|
OPERATING REVENUES, NET OF PROVISIONS FOR LOAN LOSSES |
1,095,521 | 1,157,211 | 1,257,024 | 2,391,051 | ||||||||||||||
|
Personnel expenses |
34 | (317,045 | ) | (309,865 | ) | (323,236 | ) | (614,844 | ) | |||||||||
|
Administrative expenses |
35 | (229,919 | ) | (247,459 | ) | (252,502 | ) | (480,297 | ) | |||||||||
|
Depreciation and amortization |
36 | (35,131 | ) | (35,146 | ) | (27,677 | ) | (52,646 | ) | |||||||||
|
Impairments |
36 | (631 | ) | (899 | ) | (2,247 | ) | (4,274 | ) | |||||||||
|
Other operating expenses |
38 | (12,274 | ) | (19,565 | ) | (13,868 | ) | (26,379 | ) | |||||||||
|
|
|
|
|
|
|
|
|
|||||||||||
|
TOTAL OPERATING EXPENSES |
(595,000 | ) | (612,934 | ) | (619,530 | ) | (1,178,440 | ) | ||||||||||
|
|
|
|
|
|
|
|
|
|||||||||||
|
NET OPERATING INCOME |
500,521 | 544,277 | 637,494 | 1,212,611 | ||||||||||||||
|
Income attributable to associates |
13 | 3,054 | (468 | ) | 1,780 | 3,386 | ||||||||||||
|
|
|
|
|
|
|
|
|
|||||||||||
|
Income before income taxes |
503,575 | 543,809 | 639,274 | 1,215,997 | ||||||||||||||
|
Income taxes |
17 | (65,431 | ) | (63,928 | ) | (89,085 | ) | (169,453 | ) | |||||||||
|
|
|
|
|
|
|
|
|
|||||||||||
|
NET INCOME FOR THE YEAR |
438,144 | 479,881 | 550,189 | 1,046,544 | ||||||||||||||
|
|
|
|
|
|
|
|
|
|||||||||||
|
Attributable to: |
||||||||||||||||||
|
Equity holders of the parent |
28 | 438,143 | 479,880 | 550,188 | 1,046,542 | |||||||||||||
|
Non-controlling interest |
1 | 1 | 1 | 2 | ||||||||||||||
|
Net income per share from continued operations attributable to equity holders of the parent: |
28 | $ | $ | $ | US$ | |||||||||||||
|
Basic net income per share |
4.91 | 5.37 | 5.92 | 0.011 | ||||||||||||||
|
Diluted net income per share |
4.91 | 5.37 | 5.92 | 0.011 | ||||||||||||||
The accompanying notes 1 to 45 are an
integral part of these consolidated financial statements
F-6
Table of Contents
BANCO DE CHILE AND SUBSIDIARIES
CONSOLIDATED STATEMENT OF COMPREHENSIVE INCOME
As of December 31, 2011, 2012 and 2013
(Expressed in millions of Chilean pesos unless otherwise specified)
| Notes | 2011 | 2012 | 2013 | 2013 | ||||||||||||||
| MCh$ | MCh$ | MCh$ | ThUS$ | |||||||||||||||
|
B. CONSOLIDATED STATEMENT OF COMPREHENSIVE INCOME |
||||||||||||||||||
|
NET INCOME FOR THE YEAR |
438,144 | 479,881 | 550,189 | 1,046,544 | ||||||||||||||
|
Other comprehensive income that will be reclassified subsequently to profit or loss |
||||||||||||||||||
|
Net unrealized gains (losses): |
||||||||||||||||||
|
Net change in unrealized gains (losses) on available for sale instruments |
12 | (9,484 | ) | 30,127 | 14,518 | 27,615 | ||||||||||||
|
Gains and losses on derivatives held as cash flow hedges |
9 | (485 | ) | 1,777 | (18,069 | ) | (34,370 | ) | ||||||||||
|
Cumulative translation adjustment |
68 | (58 | ) | 71 | 135 | |||||||||||||
|
|
|
|
|
|
|
|
|
|||||||||||
|
Subtotal Other comprehensive income before income taxes |
(9,901 | ) | 31,846 | (3,480 | ) | (6,620 | ) | |||||||||||
|
Income tax |
17 | 1,956 | (6,343 | ) | 710 | 1,351 | ||||||||||||
|
|
|
|
|
|
|
|
|
|||||||||||
|
Total other comprehensive income items that will be reclassified subsequently to profit or loss |
(7,945 | ) | 25,503 | (2,770 | ) | (5,269 | ) | |||||||||||
|
|
|
|
|
|
|
|
|
|||||||||||
|
Other comprehensive income that will not be reclassified subsequently to profit or loss |
||||||||||||||||||
|
Loss in defined benefit plans |
54 | (2,200 | ) | (166 | ) | (316 | ) | |||||||||||
|
|
|
|
|
|
|
|
|
|||||||||||
|
Subtotal other comprehensive income before income taxes |
54 | (2,200 | ) | (166 | ) | (316 | ) | |||||||||||
|
Income taxes |
(11 | ) | 440 | 33 | 63 | |||||||||||||
|
|
|
|
|
|
|
|
|
|||||||||||
|
Total other comprehensive income items that will not be reclassified subsequently to profit or loss |
43 | (1,760 | ) | (133 | ) | (253 | ) | |||||||||||
|
|
|
|
|
|
|
|
|
|||||||||||
|
TOTAL CONSOLIDATED COMPREHENSIVE INCOME |
430,242 | 503,624 | 547,286 | 1,041,022 | ||||||||||||||
|
|
|
|
|
|
|
|
|
|||||||||||
|
Attributable to: |
||||||||||||||||||
|
Equity holders of the parent |
430,241 | 503,623 | 547,285 | 1,041,020 | ||||||||||||||
|
Non-controlling interest |
1 | 1 | 1 | 2 | ||||||||||||||
|
Comprehensive net income per share from continued operations attributable to equity holders of the parent: |
$ | $ | $ | US$ | ||||||||||||||
|
Basic net income per share |
4.82 | 5.64 | 5.89 | 0.01 | ||||||||||||||
|
Diluted net income per share |
4.82 | 5.64 | 5.89 | 0.01 | ||||||||||||||
The accompanying notes 1 to 45 are an
integral part of these consolidated financial statements
F-7
Table of Contents
BANCO DE CHILE AND SUBSIDIARIES
CONSOLIDATED STATEMENT OF CHANGES IN EQUITY
for the years ended December 31, 2011, 2012 and 2013
(Expressed in millions of Chilean pesos unless otherwise specified)
| Reserves | Other comprehensive income(*) | Retained earnings | ||||||||||||||||||||||||||||||||||||||||||||||||
|
Paid-in
capital |
Other
reserves |
Reserves
from earnings |
Unrealized
(losses) on
|
Cumulative
translation adjustment |
Cash flow
hedge adjustment |
Retained
earnings from previous periods |
Income
for the year |
Provision
for minimum dividends |
Attributable
to equity holders of the parent |
Non-
controlling
|
Total
equity |
|||||||||||||||||||||||||||||||||||||||
| Notes | MCh$ | MCh$ | MCh$ | MCh$ | MCh$ | MCh$ | MCh$ | MCh$ | MCh$ | MCh$ | MCh$ | MCh$ | ||||||||||||||||||||||||||||||||||||||
|
Balances as of January 1, 2011 |
1,158,752 | 99,293 | 58,989 | 8,314 | (104 | ) | — | 65,023 | 417,615 | (113,559 | ) | 1,694,323 | 2 | 1,694,325 | ||||||||||||||||||||||||||||||||||||
|
Capitalization of retained earnings |
28 | 67,217 | — | — | — | — | — | — | (67,217 | ) | — | — | — | — | ||||||||||||||||||||||||||||||||||||
|
Retention (release) earnings |
— | — | 71,182 | — | — | — | — | (71,182 | ) | — | — | — | — | |||||||||||||||||||||||||||||||||||||
|
Defined benefit plans adjustment |
— | 43 | — | — | — | — | — | — | — | 43 | — | 43 | ||||||||||||||||||||||||||||||||||||||
|
Dividends distributions and paid |
— | — | — | — | — | — | — | (279,216 | ) | 113,559 | (165,657 | ) | (1 | ) | (165,658 | ) | ||||||||||||||||||||||||||||||||||
|
Capital increase |
28 | 210,114 | — | — | — | — | — | — | — | — | 210,114 | — | 210,114 | |||||||||||||||||||||||||||||||||||||
|
Cumulative translation adjustment |
— | — | — | — | 68 | — | — | — | — | 68 | — | 68 | ||||||||||||||||||||||||||||||||||||||
|
Valuation adjustment on available-for-sale instruments (net) |
— | — | — | (7,618 | ) | — | — | — | — | — | (7,618 | ) | — | (7,618 | ) | |||||||||||||||||||||||||||||||||||
|
Cash flow hedge adjustment, net |
— | — | — | — | — | (395 | ) | — | — | — | (395 | ) | — | (395 | ) | |||||||||||||||||||||||||||||||||||
|
Equity adjustment in subsidiary |
— | — | — | — | — | — | 288 | — | — | 288 | — | 288 | ||||||||||||||||||||||||||||||||||||||
|
Income for the year |
— | — | — | — | — | — | — | 438,143 | — | 438,143 | 1 | 438,144 | ||||||||||||||||||||||||||||||||||||||
|
Provision for minimum dividends |
— | — | — | — | — | — | — | — | (128,642 | ) | (128,642 | ) | — | (128,642 | ) | |||||||||||||||||||||||||||||||||||
|
|
|
|
|
|
|
|
|
|
|
|
|
|
|
|
|
|
|
|
|
|
|
|
|
|||||||||||||||||||||||||||
|
Balances as of December 31, 2011 |
1,436,083 | 99,336 | 130,171 | 696 | (36 | ) | (395 | ) | 65,311 | 438,143 | (128,642 | ) | 2,040,667 | 2 | 2,040,669 | |||||||||||||||||||||||||||||||||||
|
|
|
|
|
|
|
|
|
|
|
|
|
|
|
|
|
|
|
|
|
|
|
|
|
|||||||||||||||||||||||||||
|
Balances as of January 1, 2012 |
1,436,083 | 99,336 | 130,171 | 696 | (36 | ) | (395 | ) | 65,311 | 438,143 | (128,642 | ) | 2,040,667 | 2 | 2,040,669 | |||||||||||||||||||||||||||||||||||
|
Capitalization of retained earnings |
28 | 73,911 | — | — | — | — | — | — | (73,911 | ) | — | — | — | — | ||||||||||||||||||||||||||||||||||||
|
Retention (release) earnings |
— | — | 67,473 | — | — | — | — | (67,473 | ) | — | — | — | — | |||||||||||||||||||||||||||||||||||||
|
Income distribution |
— | (43 | ) | — | — | — | — | — | 43 | — | — | — | — | |||||||||||||||||||||||||||||||||||||
|
Defined benefit plans adjustment |
— | (1,760 | ) | — | — | — | — | — | — | — | (1,760 | ) | — | (1,760 | ) | |||||||||||||||||||||||||||||||||||
|
Dividends distributions and paid |
— | — | — | — | — | — | — | (296,802 | ) | 128,642 | (168,160 | ) | (1 | ) | (168,161 | ) | ||||||||||||||||||||||||||||||||||
|
Cumulative translation adjustment |
— | — | — | — | (58 | ) | — | — | — | — | (58 | ) | — | (58 | ) | |||||||||||||||||||||||||||||||||||
|
Valuation adjustment on available-for-sale instruments (net) |
— | — | — | 24,133 | — | — | — | — | — | 24,133 | — | 24,133 | ||||||||||||||||||||||||||||||||||||||
|
Cash flow hedge adjustment, net |
— | — | — | — | — | 1,429 | — | — | — | 1,429 | — | 1,429 | ||||||||||||||||||||||||||||||||||||||
|
Subscription and payment of shares |
28 | 119,084 | — | — | — | — | — | — | — | — | 119,084 | — | 119,084 | |||||||||||||||||||||||||||||||||||||
|
Income for the year |
— | — | — | — | — | — | — | 479,880 | — | 479,880 | 1 | 479,881 | ||||||||||||||||||||||||||||||||||||||
|
Provision for minimum dividends |
— | — | — | — | — | — | — | — | (139,755 | ) | (139,755 | ) | — | (139,755 | ) | |||||||||||||||||||||||||||||||||||
|
|
|
|
|
|
|
|
|
|
|
|
|
|
|
|
|
|
|
|
|
|
|
|
|
|||||||||||||||||||||||||||
|
Balances as of December 31, 2012 |
1,629,078 | 97,533 | 197,644 | 24,829 | (94 | ) | 1,034 | 65,311 | 479,880 | (139,755 | ) | 2,355,460 | 2 | 2,355,462 | ||||||||||||||||||||||||||||||||||||
|
|
|
|
|
|
|
|
|
|
|
|
|
|
|
|
|
|
|
|
|
|
|
|
|
|||||||||||||||||||||||||||
|
Balances as of January 1, 2013 |
1,629,078 | 97,533 | 197,644 | 24,829 | (94 | ) | 1,034 | 65,311 | 479,880 | (139,755 | ) | 2,355,460 | 2 | 2,355,462 | ||||||||||||||||||||||||||||||||||||
|
Capitalization of retained earnings |
28 | 86,202 | — | — | — | — | — | — | (86,202 | ) | — | — | — | — | ||||||||||||||||||||||||||||||||||||
|
Income distribution |
— | 1,760 | — | — | — | — | — | (1,760 | ) | — | — | — | — | |||||||||||||||||||||||||||||||||||||
|
Retention (release) earnings |
— | — | 48,463 | — | — | — | — | (48,463 | ) | — | — | — | — | |||||||||||||||||||||||||||||||||||||
|
Defined benefit plans adjustment |
— | (133 | ) | — | — | — | — | — | — | — | (133 | ) | — | (133 | ) | |||||||||||||||||||||||||||||||||||
|
Equity adjustment investment in other companies |
— | 2 | — | — | — | — | — | — | — | 2 | — | 2 | ||||||||||||||||||||||||||||||||||||||
|
Dividends distributions and paid |
— | — | — | — | — | — | — | (343,455 | ) | 139,755 | (203,700 | ) | (1 | ) | (203,701 | ) | ||||||||||||||||||||||||||||||||||
|
Cumulative translation adjustment |
— | — | — | — | 71 | — | — | — | — | 71 | — | 71 | ||||||||||||||||||||||||||||||||||||||
|
Valuation adjustment on available-for-sale instruments (net) |
— | — | — | 11,614 | — | — | — | — | — | 11,614 | — | 11,614 | ||||||||||||||||||||||||||||||||||||||
|
Cash flow hedge adjustment, net |
— | — | — | — | — | (14,455 | ) | — | — | — | (14,455 | ) | — | (14,455 | ) | |||||||||||||||||||||||||||||||||||
|
Subscription and payment of shares |
28 | 134,071 | — | — | — | — | — | — | — | — | 134,071 | — | 134,071 | |||||||||||||||||||||||||||||||||||||
|
Income for the year |
— | — | — | — | — | — | — | 550,188 | — | 550,188 | 1 | 550,189 | ||||||||||||||||||||||||||||||||||||||
|
Provision for minimum dividends |
— | — | — | — | — | — | — | — | (154,081 | ) | (154,081 | ) | — | (154,081 | ) | |||||||||||||||||||||||||||||||||||
|
|
|
|
|
|
|
|
|
|
|
|
|
|
|
|
|
|
|
|
|
|
|
|
|
|||||||||||||||||||||||||||
|
Balances as of December 31, 2013 |
1,849,351 | 99,162 | 246,107 | 36,443 | (23 | ) | (13,421 | ) | 65,311 | 550,188 | (154,081 | ) | 2,679,037 | 2 | 2,679,039 | |||||||||||||||||||||||||||||||||||
|
|
|
|
|
|
|
|
|
|
|
|
|
|
|
|
|
|
|
|
|
|
|
|
|
|||||||||||||||||||||||||||
| * | As of December 31, 2011, 2012 and 2013 total other comprehensive income is MCh$265, MCh$25,769 and MCh$22,999, respectively. |
The accompanying notes 1 to 45 are an
integral part of these consolidated financial statements
F-8
Table of Contents
BANCO DE CHILE AND SUBSIDIARIES
for the years ended December 31, 2011, 2012 and 2013
(Expressed in millions of Chilean pesos unless otherwise specified)
| 2011 | 2012 | 2013 | 2013 | |||||||||||||||
| Notes | MCh$ | MCh$ | MCh$ | ThUS$ | ||||||||||||||
|
CASH FLOWS FROM OPERATING ACTIVITIES: |
||||||||||||||||||
|
Net income for the year |
438,143 | 479,880 | 550,188 | 1,046,542 | ||||||||||||||
|
Items that do not represent cash flows: |
||||||||||||||||||
|
Depreciation and amortization |
36 | 35,131 | 35,146 | 27,677 | 52,646 | |||||||||||||
|
Impairment property and equipment |
36 | 631 | 899 | 2,247 | 4,274 | |||||||||||||
|
Provision for loan losses |
33 | 193,070 | 207,748 | 260,919 | 496,308 | |||||||||||||
|
Provision financial guarantees |
33 | (490 | ) | (366 | ) | (3,689 | ) | (7,017 | ) | |||||||||
|
Fair value adjustment of financial assets held-for-trading |
(1,242 | ) | 931 | (1,612 | ) | (3,066 | ) | |||||||||||
|
Income attributable to associates |
13 | (3,054 | ) | 468 | (1,780 | ) | (3,386 | ) | ||||||||||
|
Net gain on sales of assets received in lieu of payment |
37 | (5,918 | ) | (5,674 | ) | (6,126 | ) | (11,653 | ) | |||||||||
|
Net gain loss on sales of property and equipment |
(1,311 | ) | (318 | ) | (219 | ) | (417 | ) | ||||||||||
|
Other charges (credits) to income that do not represent cash flows |
(43,858 | ) | 1,721 | (2,670 | ) | (5,079 | ) | |||||||||||
|
(Gain) loss from foreign exchange transactions of other assets and other liabilities |
17,296 | 37,133 | (148,118 | ) | (281,743 | ) | ||||||||||||
|
Net changes in interest and fee accruals |
(60,546 | ) | 38,477 | 29,324 | 55,779 | |||||||||||||
|
Changes in assets and liabilities that affect operating cash flows: |
||||||||||||||||||
|
(Increase) decrease in loans and advances to banks, net |
(298,023 | ) | (695,376 | ) | 281,524 | 535,502 | ||||||||||||
|
(Increase) decrease in loans to customers, net |
(3,013,422 | ) | (1,529,011 | ) | (2,198,972 | ) | (4,182,782 | ) | ||||||||||
|
(Increase) decrease in financial assets held-for-trading, net |
12,027 | 109,720 | (165,645 | ) | (315,082 | ) | ||||||||||||
|
Increase in deferred taxes, net |
17 | (2,347 | ) | 4,224 | (620 | ) | (1,179 | ) | ||||||||||
|
Increase in current accounts and other demand deposits |
447,990 | 576,301 | 512,875 | 975,567 | ||||||||||||||
|
Increase (decrease) in payables from repurchase agreements and security lending |
196,821 | (15,277 | ) | 33,016 | 62,801 | |||||||||||||
|
Increase (decrease) in saving accounts and time deposits |
1,540,523 | 327,980 | 797,009 | 1,516,033 | ||||||||||||||
|
(Increase) decrease in other operating assets and liabilities |
83,472 | (103 | ) | (113,591 | ) | (216,067 | ) | |||||||||||
|
Proceeds from sale of assets received in lieu of payment |
10,221 | 9,510 | 8,454 | 16,081 | ||||||||||||||
|
|
|
|
|
|
|
|
|
|||||||||||
|
Total cash flows from operating activities |
(454,886 | ) | (415,987 | ) | (139,809 | ) | (265,938 | ) | ||||||||||
|
|
|
|
|
|
|
|
|
|||||||||||
|
CASH FLOWS FROM INVESTING ACTIVITIES: |
||||||||||||||||||
|
(Increase) decrease in financial assets available-for-sale |
(316,083 | ) | 219,403 | (387,578 | ) | (737,233 | ) | |||||||||||
|
Purchases of property and equipment |
15 | (22,073 | ) | (17,981 | ) | (12,249 | ) | (23,299 | ) | |||||||||
|
Proceeds from sales of property and equipment |
1,711 | 400 | 505 | 961 | ||||||||||||||
|
Purchases of intangible assets |
(9,597 | ) | (9,116 | ) | (5,511 | ) | (10,483 | ) | ||||||||||
|
Investments in other companies |
— | (71 | ) | (1,436 | ) | (2,731 | ) | |||||||||||
|
(Increase) decrease in other assets and liabilities |
10,505 | (1,227 | ) | (3,922 | ) | (7,460 | ) | |||||||||||
|
Dividends received from investments in other companies |
13 | 761 | 943 | 956 | 1,818 | |||||||||||||
|
|
|
|
|
|
|
|
|
|||||||||||
|
Total cash flows from investing activities |
(334,776 | ) | 192,351 | (409,235 | ) | (778,427 | ) | |||||||||||
|
|
|
|
|
|
|
|
|
|||||||||||
|
CASH FLOWS FROM FINANCING ACTIVITIES: |
||||||||||||||||||
|
Increase (decrease) in borrowings from financial institutions |
(7,916 | ) | 142,573 | (323,055 | ) | (614,500 | ) | |||||||||||
|
Increase (decrease) in other financial obligations |
11,491 | (16,512 | ) | 54,074 | 102,857 | |||||||||||||
|
Increase (decrease) in borrowings from Central Bank |
22,759 | (22,793 | ) | — | — | |||||||||||||
|
Borrowings with Central Bank of Chile (long-term) |
91 | 20 | — | — | ||||||||||||||
|
Payment of borrowings from Central Bank (long-term) |
(106 | ) | (56 | ) | (7 | ) | (13 | ) | ||||||||||
|
Long-term foreign borrowings |
805,594 | 325,247 | 844,776 | 1,606,893 | ||||||||||||||
|
Payment of long-term foreign borrowings |
(446,448 | ) | (1,013,911 | ) | (639,571 | ) | (1,216,562 | ) | ||||||||||
|
Other long-term borrowings |
3,894 | 1,526 | 609 | 1,158 | ||||||||||||||
|
Payment of other long-term borrowings |
(9,811 | ) | (7,363 | ) | (6,285 | ) | (11,955 | ) | ||||||||||
|
Repayment of mortgage finance bonds |
(38,433 | ) | (27,529 | ) | (20,734 | ) | (39,439 | ) | ||||||||||
|
Proceeds from bond issuances |
22 | 749,586 | 717,557 | 1,097,345 | 2,087,318 | |||||||||||||
|
Proceeds from commercial papers (short-term bonds) |
22 | — | 516,428 | 509,920 | 969,946 | |||||||||||||
|
Redemption from bond issuances |
(109,624 | ) | (389,382 | ) | (536,823 | ) | (1,021,120 | ) | ||||||||||
|
Subscription and payment of shares |
28 | 210,114 | 119,084 | 134,071 | 255,024 | |||||||||||||
|
Dividends paid |
28 | (279,216 | ) | (296,802 | ) | (343,455 | ) | (653,304 | ) | |||||||||
|
|
|
|
|
|
|
|
|
|||||||||||
|
Total cash flows from financing activities |
911,975 | 48,087 | 770,865 | 1,466,303 | ||||||||||||||
|
|
|
|
|
|
|
|
|
|||||||||||
|
TOTAL NET POSITIVE (NEGATIVE) CASH FLOWS FOR THE YEAR |
122,313 | (175,549 | ) | 221,821 | 421,938 | |||||||||||||
|
Net effect of exchange rate changes on cash and cash equivalents |
7,412 | (31,720 | ) | 60,437 | 114,960 | |||||||||||||
|
Cash and cash equivalents at beginning of year |
1,042,024 | 1,171,749 | 964,480 | 1,834,589 | ||||||||||||||
|
|
|
|
|
|
|
|
|
|||||||||||
|
Cash and cash equivalents at end of year |
6 | 1,171,749 | 964,480 | 1,246,738 | 2,371,487 | |||||||||||||
|
|
|
|
|
|
|
|
|
|||||||||||
|
Supplemental disclosure of cash flow information: |
||||||||||||||||||
|
Cash paid during the year for: |
||||||||||||||||||
|
Income taxes paid |
68,672 | 53,949 | 19,525 | 37,140 | ||||||||||||||
|
Interest received |
1,356,265 | 1,614,122 | 1,669,559 | 3,175,757 | ||||||||||||||
|
Interest paid |
(545,534 | ) | (657,235 | ) | (581,066 | ) | (1,105,277 | ) | ||||||||||
The accompanying notes 1 to 45 are an
integral part of these consolidated financial statements
F-9
Table of Contents
NOTES TO THE CONSOLIDATED FINANCIAL STATEMENTS
| 1. | Company Information: |
Banco de Chile, resulting from the merger of Banco Nacional de Chile, Banco Agrícola and Banco de Valparaíso, was formed on October 28, 1893 in the city of Santiago, in the presence of the Notary Eduardo Reyes Lavalle.
Banco de Chile (“Banco de Chile” or the “Bank”) is a Corporation organized under the laws of the Republic of Chile, regulated by the Superintendency of Banks and Financial Institutions (“SBIF”). Since 2001 – when the Bank was first listed on the New York Stock Exchange (“NYSE”), its American Depository Receipt (ADR) program, Banco de Chile has also complied with the regulations published by the United States Securities and Exchange Commission (“SEC”).
Banco de Chile offers a broad range of banking services to its customers, ranging from individuals to large corporations. The services are managed in large corporate banking, middle and small corporate banking, personal banking services and retail groups. Additionally, the Bank offers international as well as treasury banking services. The Bank’s subsidiaries provide other services including securities brokerage, mutual fund management, factoring, insurance brokerage, financial advisory and securitization.
Banco de Chile’s legal address is Paseo Ahumada 251, Santiago, Chile and its website is www.bancochile.cl.
The consolidated financial statements of the Bank for the year ended December 31, 2013 were authorized for issuance in accordance with the directors’ resolution on April 24, 2014.
| 2. | Summary of Significant Accounting Principles: |
| (a) | Basis of preparation: |
The Bank’s consolidated financial statements for the years 2011, 2012 and 2013 have been prepared in accordance with International Financial Reporting Standards (“IFRS”) as issued by the IASB.
The bank presents its statement of financial position broadly in order of liquidity. An analysis regarding recovery or settlement within 12 months after the statement of financial position date (current) and more than 12 months after the statement of financial position date (non–current) is presented in note 40.
The consolidated financial statements comprise the consolidated statement of comprehensive income and the consolidated statements of financial position, changes in equity and cash flows and the related notes. The consolidated financial statements have been prepared under the historical cost convention, except for available-for-sale financial assets, financial assets and financial liabilities designated at fair value through profit or loss and derivative contracts, which have been measured at fair value.
Banco de Chile and subsidiaries classify its expenses according to the nature of expense method.
F-10
Table of Contents
NOTES TO THE CONSOLIDATED FINANCIAL STATEMENTS, Continued
| 2. | Summary of Significant Accounting Principles, continued: |
| (a) | Basis of preparation, continued: |
The consolidated statement of cash flows shows the changes in cash and cash equivalents arising from operating activities, investing activities and financing activities during the period.
| (b) | Basis of consolidation: |
The financial statements of Banco de Chile as of and for the years ended December 31, 2012 and 2013 have been consolidated with those of its subsidiaries. The financial statements of the bank’s subsidiaries are prepared for the same reporting year as for Banco de Chile, using consistent accounting policies.
| (i) | Subsidiaries |
Subsidiaries are entities controlled by the Bank, which is the parent of the group. The Bank controls entities:
| 1) | power over the investee, i.e. the investor has existing rights that give it the ability to direct the relevant activities; |
| 2) | exposure, or rights, to variable returns from its involvement with the investee; and |
| 3) | the ability to use its power over the investee to affect the amount of the investor’s returns. |
When the Bank has less than a majority of the voting rights of an investee, but these voting rights are sufficient to direct the relevant activities unilaterally, then we conclude that the Bank has control. The Bank considers all factors and relevant circumstances to evaluate if their voting rights are enough to obtain the control, which it includes:
| • |
The amount of voting rights that the Bank has, related to the amount of voting rights of the others stakeholders. |
| • |
Potential voting rights maintained by the Bank, other holders of voting rights or other parties. |
| • |
Rights emanating from other contractual arrangements. |
| • |
Any additional circumstance that indicate that the Bank does have or does have not the ability to manage the relevant activities when that decisions need to be taken, including behavior patterns of votes in previous shareholders meetings. |
The financial statements of the subsidiaries are included in the consolidated financial statements from the date control is obtained until the loss of control. The financial statements have been prepared using uniform accounting policies for similar transactions and other events under equivalent circumstances.
F-11
Table of Contents
NOTES TO THE CONSOLIDATED FINANCIAL STATEMENTS, Continued
| 2. | Summary of Significant Accounting Principles, continued: |
| (b) | Basis of consolidation, continued: |
| (i) | Subsidiaries. continued |
The following table details the entities in which the Bank, directly or indirectly – owns a controlling interest and that are therefore consolidated in these financial statements:
|
Rut |
Subsidiaries |
Country |
Functional
Currency |
Interest Owned | ||||||||||||||||||||||||||
| Direct | Indirect | Total | ||||||||||||||||||||||||||||
| 2012 | 2013 | 2012 | 2013 | 2012 | 2013 | |||||||||||||||||||||||||
| % | % | % | % | % | % | |||||||||||||||||||||||||
|
44,000,213-7 |
Banchile Trade Services Limited |
Hong Kong | US$ | 100.00 | 100.00 | — | — | 100.00 | 100.00 | |||||||||||||||||||||
|
96,767,630-6 |
Banchile Administradora General de Fondos S.A. |
Chile | Ch$ | 99.98 | 99.98 | 0.02 | 0.02 | 100.00 | 100.00 | |||||||||||||||||||||
|
96,543,250-7 |
Banchile Asesoría Financiera S.A. |
Chile | Ch$ | 99.96 | 99.96 | — | — | 99.96 | 99.96 | |||||||||||||||||||||
|
77,191,070-K |
Banchile Corredores de Seguros Ltda. |
Chile | Ch$ | 99.83 | 99.83 | 0.17 | 0.17 | 100.00 | 100.00 | |||||||||||||||||||||
|
96,894,740-0 |
Banchile Factoring S.A.(*) |
Chile | Ch$ | 99.75 | — | 0.25 | — | 100.00 | — | |||||||||||||||||||||
|
96,571,220-8 |
Banchile Corredores de Bolsa S.A. |
Chile | Ch$ | 99.70 | 99.70 | 0.30 | 0.30 | 100.00 | 100.00 | |||||||||||||||||||||
|
96,932,010-K |
Banchile Securitizadora S.A. |
Chile | Ch$ | 99.00 | 99.00 | 1.00 | 1.00 | 100.00 | 100.00 | |||||||||||||||||||||
|
96,645,790-2 |
Socofin S.A. |
Chile | Ch$ | 99.00 | 99.00 | 1.00 | 1.00 | 100.00 | 100.00 | |||||||||||||||||||||
|
96,510,950-1 |
Promarket S.A. |
Chile | Ch$ | 99.00 | 99.00 | 1.00 | 1.00 | 100.00 | 100.00 | |||||||||||||||||||||
| (*) | See note No. 5 of Segments |
Significant intercompany transactions and balances between the Bank and its subsidiaries and among its subsidiaries have been eliminated for consolidation purposes. Any non-controlling interest is recognized as a separate item within the Bank’s consolidated equity.
| (ii) | Investment in Associates and Joint Ventures |
Associates
An associate is an entity for which the Bank has significant influence over its operating and financial management policy decisions, but the Bank does not hold a controlling interest. Significant influence is generally presumed when the Bank holds between 20% and 50% of the voting rights. The existence of potential voting rights that are currently exercisable or convertible are considered when assessing whether the Bank has significant influence. Investments in associates are accounted for using the equity method. Other factors considered when determining whether the Bank has significant influence over another entity are the representation on the board of directors and the existence of material intercompany transactions. The existence of these factors could require the application of the equity method for a particular investment even though the Bank holds less than 20% of the voting stock.
According to the equity method, the Bank’s investments in associates are initially recorded at cost, and subsequently increased (or decreased) to reflect both the Bank’s pro rata share of the post-acquisition net income (or loss) of the associate and other movements directly recognized in the associate’s equity. Goodwill arising on the acquisition of an associate is included in the carrying value of the investment (net of any accumulated impairment loss). Since goodwill is not reported separately associates are not tested individually for impairment. Rather, the entire investment is tested for impairment as follows.
After the application of the equity method, the Bank determines whether it is necessary to recognize an additional impairment loss on the Bank’s investment in its associates. The Bank determines at each reporting date whether there is objective evidence that the investment in the associate is impaired. If this is the case, the Bank calculates the amount of impairment as the difference between the recoverable amount of the associate and its carrying value and recognizes the amount in its income statement.
F-12
Table of Contents
NOTES TO THE CONSOLIDATED FINANCIAL STATEMENTS, Continued
| 2. | Summary of Significant Accounting Principles, continued: |
| (b) | Basis of consolidation, continued: |
| (ii) | Investment in Associates and Joint Ventures, continued |
Joint Ventures
Joint Ventures are joint arrangements whereby the parties that have joint control of the arrangement have rights to the net assets of the arrangement. Joint control exists only when decisions about the relevant activities require the unanimous consent of the parties sharing control.
According IFRS 11, an entity determine type of joint arrangement: “Joint Operation” or “Joint Venture”.
For investments defined as a “Joint Operation”, their assets, liabilities, income and expenses are recognized by their participation in joint operation.
For investments defined as “Joint Venture”, they will be registered according to the equity method.
Investments that, for their characteristics, are defined as a “Joint Ventures” are the following:
| • |
Artikos S.A. |
| • |
Servipag Ltda. |
| (iii) | Structured entities |
Special purpose entities (“SPEs”) are generally created to comply with a specific and well-defined objective, such as securitizing specific assets or carrying out a specific loan transaction. A SPE is consolidated if, based on an assessment of its relationship with the Bank and the risks and benefits of the SPE, the Bank concludes that it has control of the SPE. As of December 31, 2012 and 2013, the Bank does not control any SPEs.
| (iv) | Asset management sevices investments and mutual funds |
The Bank, through its subsidiary Banchile Administradora General de Fondos, manages assets through investment and mutual funds and other investment products on behalf of investors.
According to IFRS 10, for consolidation purposes are necessary to evaluate the role of the Bank and its subsidiaries in the funds that manage, determining its role of Agent or Principal. When assessing whether an investor controls an investee an investor with decision-making rights determines whether it acts as Principal or as an Agent of other parties. A number of factors are considered in making this assessment.
This assessment should consider the following:
| • |
Scope to make decision over the investee |
| • |
Rights held by other parties |
| • |
Remuneration according to compensation arrangements |
| • |
Exposition, of the decision maker, to the variability of returns from other interests that keep the investee |
The Bank and its subsidiaries managed on behalf and for the benefit of investors, acting in that relationship only as Agent. Under this category, and as provided in the aforementioned rule, this bank do not have control when exercising authority to make decisions and therefore, at December 31, 2012 and 2013 the Bank acts as agent, and therefore do not consolidate any fund under management.
F-13
Table of Contents
NOTES TO THE CONSOLIDATED FINANCIAL STATEMENTS, Continued
| 2. | Summary of Significant Accounting Principles, continued: |
| (c) | Non-controlling interest: |
Non-controlling interest represents the share of losses, income and net assets that the Bank does not control, either directly or indirectly. It is presented as a separate item in the Consolidated Statement of Comprehensive Income and the Consolidated Statement of Financial Position.
| (d) | Going concern: |
The Bank’s management has made an assessment of its ability to continue as a going concern and is satisfied that it has the resources to continue in business for the foreseeable future. Furthermore, management is not aware of any material uncertainties that may cast significant doubt upon the Bank’s ability to continue as a going concern. Therefore, the financial statements continue to be prepared on the going concern basis.
| (e) | Use of estimates and judgment: |
Preparing financial statements requires management to make judgments, estimations and assumptions that affect the application of accounting policies and the valuation of assets, liabilities, income and expenses presented. Real results could differ from these estimated amounts.
Relevant estimates and assumptions are reviewed regularly by senior management in order to quantify certain assets, liabilities, income, expenses and uncertainties. Revisions to accounting estimates are recognized in the year in which the estimate is revised and in any future period that is affected.
Some accounting matters particularly involve uncertainties and therefore require a considerable degree of estimation and critical judgment when applying accounting policies. Details on the use of estimates and judgment and their effect on the amounts recognized in the financial statements are included in the following notes:
| • |
Impairment of loans (Note 10, 11 and 33) |
| • |
Impairment of other financial assets (Note 12) |
| • |
Useful lives of intangible assets and property and equipment (Notes 14 and 15) |
| • |
Goodwill valuation (Note 14) |
| • |
Deferred taxes and income taxes (Note 17) |
| • |
Provisions (Note 24) |
| • |
Employee benefits (Note 25) |
| • |
Commitments and contingencies (Note 27) |
| • |
Fair value of financial assets and liabilities (Note 40) |
F-14
Table of Contents
NOTES TO THE CONSOLIDATED FINANCIAL STATEMENTS, Continued
| 2. | Summary of Significant Accounting Principles, continued: |
| (f) | Financial asset and liability valuation criteria: |
Measurement is the process of determining the monetary amounts at which the elements of the financial statements are to be recognized and carried in the Statement of Financial Position and the Comprehensive Income. This involves selecting the particular basis or method of measurement.
These bases or methods include the following:
| (i) | Recognition |
Initially, the Bank and its subsidiaries recognize loans to customers, trading and investment securities, deposits, debt issued and subordinated liabilities on the date they originated. Purchases and sales of financial assets performed on a regular basis are recognized as of the trade date on which the Bank committed to purchase or sell the asset. All other assets and liabilities (including assets and liabilities at fair value through profit and loss) are initially recognized as of the trade date on which the Bank becomes a party to the contractual provisions of the instrument.
Financial assets or liabilities are initially recognized at fair value plus transaction costs directly attributable to their purchase or issuance, except in the case of financial assets and financial liabilities recorded at fair value through profit or loss.
F-15
Table of Contents
NOTES TO THE CONSOLIDATED FINANCIAL STATEMENTS, Continued
| 2. | Summary of Significant Accounting Principles, continued: |
| (f) | Financial asset and liability valuation criteria, continued: |
| (ii) | Derecognition of financial assets and liabilities |
The Bank and its subsidiaries derecognize a financial asset (or where applicable, part of a financial asset) from its Statement of Financial Position when the contractual rights to the cash flows of the financial asset have expired or when the contractual rights to receive the cash flows of the financial asset are transferred during a transaction in which all ownership risks and rewards of the financial asset are transferred. Any portion of transferred financial assets that is created or retained by the Bank is recognized as a separate asset or liability.
When the Bank transfers a financial asset, it assesses to what extent it has retained the risks and rewards of ownership. In this case:
| (a) | If substantially all risks and rewards of ownership of the financial asset have been transferred, it is derecognized and any rights or obligations created or retained upon transfer are recognized separately as assets or liabilities. |
| (b) | If substantially all risks and rewards of ownership of the financial asset have been retained, the Bank continues to recognize it. |
| (c) | If substantially all risks and rewards of ownership of the financial asset are neither transferred nor retained, the Bank will determine if it has retained control of the financial asset. In this case: |
| (i) | If it has not retained control, the financial asset will be derecognized and any rights or obligations created or retained upon transfer will be recognized separately as assets or liabilities. |
| (ii) | If the entity has retained control, it will continue to recognize the financial asset to the extent of its continuing involvement in the financial asset. |
A financial liability is derecognized when the obligation under the liability is discharged or cancelled or expires.
If an existing financial liability is replaced by another from the same lender on substantially different terms, or the terms of the existing liability are substantially modified, such an exchange or modification is treated as a derecognition of the original liability and the recognition of a new liability, and the difference in the respective carrying amounts is recognized in the income statement.
F-16
Table of Contents
NOTES TO THE CONSOLIDATED FINANCIAL STATEMENTS, Continued
| 2. | Summary of Significant Accounting Principles, continued: |
| (f) | Financial asset and liability valuation criteria, continued: |
| (iii) | Offsetting |
Financial assets and liabilities are offset and the net amount is reported in the Statement of Financial Position if, and only if, the Bank has the legally enforceable right to set off the recognized amounts and there is an intention to settle on a net basis or to realize an asset and settle the liability simultaneously.
Income and expenses are shown net only if accounting standards allow such treatment, or in the case of gains and losses arising from a group of similar transactions, such as the Bank’s trading activities.
| (iv) | Valuation at amortized cost |
Amortized cost is the amount at which a financial asset or liability is measured at initial recognition minus principal repayments, plus or minus the cumulative amortization (calculated using the effective interest rate method) of any difference between that initial amount and the maturity amount and minus any reduction for impairment.
| (v) | Fair value measurements |
Fair value is as the price that would be received to sell an asset or paid to transfer a liability in an orderly transaction between market participants at the measurement date.
When available, the Bank estimates the fair value of an instrument using quoted prices in an active market for that instrument. A market is considered active if quoted prices are readily and regularly available and represent actual and regularly occurring market transactions on an arm’s length basis.
If a market for a financial instrument is not active, the Bank establishes fair value using a valuation technique. These valuation techniques include the use of recent market transactions between knowledgeable, willing parties in an arm’s length transaction, if available, as well as references to the fair value of other instruments that are substantially the same, discounted cash flows and options pricing models.
The chosen valuation technique makes maximum use of observable market data, relies as little as possible on estimates performed by the Bank, incorporates factors that market participants would consider in setting a price and is consistent with accepted economic methodologies for pricing financial instruments. Inputs into valuation technique reasonably represent market expectations and include risk and return factors that are inherent in the financial instrument. Periodically, the Bank calibrates the valuation technique and tests it for validity using prices from observable current market transactions in the same instrument or based on any available observable market data.
The objective of using a valuation technique is to estimate the price at which an orderly transaction to sell the asset or to transfer the liability would take place between market participants and the measurement date under current market conditions. Three widely used valuation techniques are:
| • |
Market approach – uses prices and other relevant information generated by market transactions involving identical or comparable (similar) assets, liabilities, or a group of assets and liabilities (e.g. a business) |
F-17
Table of Contents
NOTES TO THE CONSOLIDATED FINANCIAL STATEMENTS, Continued
| 2. | Summary of Significant Accounting Principles, continued: |
| (f) | Financial asset and liability valuation criteria, continued: |
| (v) | Fair value measurements, continued |
| • |
Cost approach – reflects the amount that would be required currently to replace the service capacity of an asset (current replacement cost) |
| • |
Income approach – converts future amounts (cash flows or income and expenses) to a single current (discounted) amount, reflecting current market expectations about those future amounts. |
To increase consistency and comparability in fair value measurements and related disclosures, the IFRS establishes a fair value hierarchy that categorises into three levels the inputs to valuation techniques used to measure fair value. The fair value hierarchy gives the highest priority to quoted prices (unadjusted) in active markets for identical assets or liabilities (Level 1 inputs) and the lowest priority to unobservable inputs (Level 3 inputs).
Level 1 inputs are quoted prices (unadjusted) in active markets for identical assets or liabilities that the entity can access at the measurement date. Level 2 inputs are inputs other than quoted prices included within Level 1 that are observable for the asset or liability, either directly or indirectly. Level 3 inputs are unobservable inputs for the asset or liability.
The best evidence of the fair value of a financial instrument at initial recognition is the transaction price (i.e. the fair value of the consideration given or received) unless the fair value of that instrument is evidenced by comparison with other observable current market transactions in the same instrument (i.e. without modification or repackaging) or based on a valuation technique whose variables include only data from observable markets.
When transaction price provides the best evidence of fair value at initial recognition, the financial instrument is initially measured at the transaction price and any difference between this price and the value initially obtained from a valuation model is subsequently recognized in income depending on the individual facts and circumstances of the transaction but not later than the valuation is supported wholly by observable market data or the transaction is closed out.
Generally, the Bank has assets and liabilities that offset each other’s market risks which are derivatives and available-for-sale. Assets and long positions are measured at a bid price; liabilities and short positions are measured at an asking price. Where the Bank has positions with offsetting risks, mid-market prices are used to measure the offsetting risk positions and a bid or asking price adjustment is applied only to the net open position as appropriate. Fair values reflect the credit risk of the instrument and include adjustments to account for the credit risk of the issuer, as appropriate.
Fair value estimates obtained from models are adjusted for any other factors, such as liquidity risk or model uncertainties; to the extent that the Bank believes that a third-party market participant would take them into account in pricing a transaction.
F-18
Table of Contents
NOTES TO THE CONSOLIDATED FINANCIAL STATEMENTS, Continued
| 2. | Summary of Significant Accounting Principles, continued: |
| (f) | Financial asset and liability valuation criteria, continued: |
| (v) | Fair value measurements, continued |
When the transaction price is different to the fair value from other observable current market transactions in the same instrument or based on a valuation technique whose variables include only data from observable markets, the Bank immediately recognizes the difference between the transaction price and fair value (a “Day 1” profit or loss) in “Net financial operating income”. In cases where fair value is determined using data which is not observable, the difference between the transaction price and model value is only recognized in the income statement when the inputs become observable, or when the instrument is derecognized.
The Bank’s fair value disclosures are included in Note 40.
| (g) | Loans and advances to banks: |
Loans and advances to customers include non–derivative financial assets with fixed or determinable payments, such as domestic banks and foreign banks included the Chilean Central Bank.
After initial measurement, amounts Loans and advances to customers are subsequently measured at amortized cost using the EIR (effective interest rate), less allowance for impairment. Amortized cost is calculated by taking into account any discount or premium on acquisition and fees and costs that are an integral part of the EIR. The amortization is included in Interest Revenue in the income statement. The losses arising from impairment are recognized in the income statement in Interest Expense.
| (h) | Loans to customers: |
| (i) | Loan classification |
Loans to customers include originated and purchased non-derivative financial assets with fixed or determinable payments that are not quoted on an active market and which the Bank does not intend to sell immediately or in the short-term.
Individual classified loans
An individual analysis of debtors is applied to individuals and companies that are of such significance with respect to size, complexity or level of exposure to the Bank that they must be analyzed in detail.
For purposes of establishing the appropriate allowances, the Bank classifies the debtors and their operations related to loans into one of three categories of loans portfolio: Normal, Substandard and Non-complying Loans.
| (i.1) | Normal Loans: |
Normal loans correspond to borrowers who are up to date on their payment obligations and show no sign of deterioration in their credit quality.
F-19
Table of Contents
NOTES TO THE CONSOLIDATED FINANCIAL STATEMENTS, Continued
| 2. | Summary of Significant Accounting Principles, continued: |
| (h) | Loans to customers, continued: |
| (i.2) | Substandard Loans: |
Substandard loans include all borrowers with insufficient payment capacity or significant deterioration of payment capacity that may be reasonably expected not to comply with all principal and interest payments obligations set forth in the credit agreement.
This category also includes all loans that have been non-performing for more than 30 days.
| (i.3) | Non-complying Loans: |
The non-complying loans correspond to borrowers whose payment capacity is seriously at risk and who have a high likelihood of filing for bankruptcy or are renegotiating credit terms to avoid bankruptcy. This category comprises all loans outstanding from debtors that have at least one installment payment of interest or principal overdue for 90 days or more.
Group classified loans
The group analysis is used to analyze a large number of loans whose individual amounts are not significant. For this analysis, the Bank uses models based on attributes of the debtors and their loans, and on the behavior of a group of loans.
Loans to customers include originated and purchased non-derivative financial assets with fixed or determinable payments that are not quoted on an active market and which the Bank does not intend to sell immediately or in the short-term.
| (ii) | Valuation method |
Loans are initially measured at cost plus incremental transaction costs, and subsequently measured at amortized cost using the effective interest rate method, except that when the Bank has defined certain loans as hedged items, which are measured at fair value, changes are recorded in the Consolidated Statement of Income.
| (iii) | Lease contracts |
Accounts receivable relating to leasing contracts, included under the caption “Loans to customers”, correspond to periodic rent installments of contracts which meet the definition to be classified as financial leases and are presented at their nominal value net of unearned interest as of each year-end.
| (iv) | Factoring transactions |
The Bank and its subsidiary Banchile Factoring S.A. carry out factoring transactions, where they receive invoices and other commercial instruments representative of credit, with or without recourse, and they advance to the assignor a percentage of the total amounts to be collected from the original debtor.
As of December 31, 2012 and 2013, the caption “Loans to customers” includes MCh$606,137 and MCh$524,059 respectively, corresponding to the amount advanced to the assignor plus accrued interest net of payments received.
F-20
Table of Contents
NOTES TO THE CONSOLIDATED FINANCIAL STATEMENTS, Continued
| 2. | Summary of Significant Accounting Principles, continued: |
| (h) | Loans to customers, continued: |
| (v) | Impairment of loans |
At each year ended date, Banco de Chile and subsidiaries assess whether there is objective evidence that a loan asset or a group of loans is impaired. A loan asset or a group of loans is considered impaired and impairment losses are incurred if:
| (a) | there is objective evidence of impairment as a result of a loss event that occurred after the initial recognition of the asset and up to the balance sheet date (“a loss event”); |
| (b) | the loss event had an impact on the estimated future cash flows of the financial asset or the group of financial assets and; |
| (c) | a reliable estimate of the loss amount can be made. |
Banco de Chile and subsidiaries first assess whether objective evidence of impairment exists for loans that are individually significant. It then assesses collectively for loans that are not individually significant and loans which are significant but for which no objective evidence of impairment was observed as a result of the individual assessment.
| (i) | Allowances for individual evaluations: |
An individual analysis of debtors is applied to individuals and companies that are of such significance with respect to size, complexity or level of exposure to the Bank, that they must be analyzed in detail. All corporate customers are evaluated individually and for commercial customers the cut-off amount for the individual evaluation is MCh$456,815.
To allow management to determine whether a loss event has occurred on an individual basis, all significant counterparty relationships are reviewed periodically. This evaluation considers current information and events related to the counterparty, such as whether the counterparty is experiencing significant financial difficulty or in breach of contract as, for example, default or delinquency in interest or principal payments.
The individual evaluation requires assigning a risk category to each debtor and its respective loans. This risk category should consider the following factors: industry or sector, group considerations and management, financial situation, payment behavior and payment capacity.
F-21
Table of Contents
NOTES TO THE CONSOLIDATED FINANCIAL STATEMENTS, Continued
| 2. | Summary of Significant Accounting Principles, continued: |
| (h) | Loans to customers, continued: |
| (v) | Impairment of Loans, continued: |
| (i) | Allowances for individual evaluations, continued: |
If there is evidence of impairment leading to an impairment loss for an individual counterparty relationship, then the amount of the loss is determined as the difference between the carrying amount of the loan(s), including accrued interest, and the present value of expected future cash flows discounted at the loan’s original effective interest rate or the effective interest rate established upon reclassification to loans, including cash flows that may result from foreclosure less costs for obtaining and selling the collateral. The carrying amount of the loans is reduced by the use of an allowance account and the amount of the loss is recognized in the income statement as a component of the provision for credit losses.
| (ii) | Allowances for group evaluations: |
The collective assessment of impairment is principally to establish an allowance amount relating to loans that are either individually significant but for which there is no objective evidence of impairment, or are not individually significant but for which there is, on a portfolio basis, a loss amount that is probable of having occurred and is reasonably estimable. The loss amount has two components.
The first component is an allowance amount representing the incurred losses on the portfolio of smaller balance homogeneous loans, which are loans to individuals and small business customers of the private and retail business. The loans are grouped according to similar credit risk characteristics and the allowance for each group is determined using statistical models based on historical experience. The second component represents an estimate of incurred losses inherent in the group of loans that have not yet been individually identified or measured as part of the smaller-balance homogeneous loans. Loans that were found not to be impaired when evaluated on an individual basis are included in the scope of this component of the allowance.
Once a loan is identified as impaired, although the accrual of interest in accordance with the contractual terms of the loan is discontinued, the accretion of the net present value of the written down amount of the loan due to the passage of time is recognized as interest income based on the original effective interest rate of the loan.
At each balance sheet date, all impaired loans are reviewed for changes to the present value of expected future cash flows discounted at the loan’s original effective interest rate. Any change to the previously recognized impairment loss is recognized as a change to the allowance account and recorded in the income statement as a component of the provision for credit losses.
F-22
Table of Contents
NOTES TO THE CONSOLIDATED FINANCIAL STATEMENTS, Continued
| 2. | Summary of Significant Accounting Principles, continued: |
| (h) | Loans to customers, continued: |
| (v) | Impairment of Loans, continued: |
Loans are written-off when collection efforts have been exhausted, but not later than the following maximum periods:
| Type of Loan | Term | |
| Consumer loans – secured and unsecured | 6 months | |
| Other transactions – unsecured | 24 months | |
| Commercial loans – secured | 36 months | |
| Residential mortgage loans | 48 months | |
| Consumer leases | 6 months | |
| Other non-real estate lease transactions | 12 months | |
| Real estate leases (commercial or residential) | 36 months |
The term represents the time elapsed since the date on which payment of all or part of the obligation in default became due.
Cash recoveries on written-off loans are recorded directly in income, through the provision for credit losses in the Consolidated Statement of Comprehensive Income.
If in a subsequent period the amount of a previously recognized impairment loss decreases and the decrease is due to an event occurring after the impairment was recognized, the impairment loss is reversed by reducing the allowance account accordingly. Such reversal is recognized in profit or loss.
| (vi) | Renegotiated loans: |
The bank attempts to restructure loans rather than to take possession of collateral. This may involve extending the payment arrangements and the agreement of new loan conditions. After having renegotiated the terms, any impairment is measured using the original effective interest rate as calculated before the modification of terms and the loan is no longer considered past due. Renegotiated loans are continuously reviewed by management to ensure that all criteria are met and that future payments are likely to occur. The loans continue to be subject to an individual or collective impairment assessment, calculated using the loan’s original effective interest rate.
| (vii) | Collateral valuation: |
The bank seeks to use collateral, where possible, to mitigate its risks on financial assets. The collateral comes in various forms such as mortgages, pledges, securities, other non-financial assets and credit enhancements. The fair value of collateral is generally assessed, at a minimum, at inception through a certified appraiser. Later, a model updates the collateral value considering factors such as location, collateral type, and observable market value, among others. However, some collateral, for example, securities, is valued daily. To the extent possible, the bank uses active market data for valuing financial assets held as collateral. (See note 42 for further analysis of collateral).
F-23
Table of Contents
NOTES TO THE CONSOLIDATED FINANCIAL STATEMENTS, Continued
| 2. | Summary of Significant Accounting Principles, continued: |
| (i) | Financial guarantees: |
In its ordinary course of business the Bank gives financial guarantees consisting of letters of credit, guarantees and acceptances. Financial guarantees are initially recognized in the financial statements at fair value being the premium received. Subsequent to initial recognition, the Bank’s liability is measured at the higher of the amount originally recognized less, when appropriate, cumulative amortization recognized in the income statement and the best estimate of expenditure required settling the financial obligation arising as the result of the guarantee. The premium received is recognized in the income statement in “Income from Fees and Commissions” on a straight line basis over the guarantee period.
With respect to the provision for financial guarantees, the process to determine the provision is similar to the methodology used for loans. Any loss amounts are recognized as an allowance in the consolidated balance sheet within other liabilities and charged to the consolidated statement of income as a component of the provision for credit losses. For a further description of the allowances for loan losses, see Note 2 (h) to the Consolidated Financial Statements.
| (j) | Finance and operating leases: |
The determination of whether an arrangement is a lease, or it contains a lease, is based on the substance of the arrangement and requires an assessment of whether the fulfillment of the arrangement is dependent on the use of a specific asset or assets and the arrangement conveys a right to use the asset.
The Bank acting as lessor
Assets leased to customers under agreements which transfer substantially all the risks and rewards of ownership, with or without ultimate legal title, are classified as finance leases. When assets held are subject to a finance lease, the leased assets are derecognized and a receivable is recognized which is equal to the present value of the minimum lease payments, discounted at the interest rate implicit in the lease. Initial direct costs incurred in negotiating and arranging a finance lease are incorporated into the receivable through the discount rate applied to the lease. Finance lease income is recognized over the lease term based on a pattern reflecting a constant periodic rate of return on the net investment in the finance lease.
Assets leased to customers under agreements which do not transfer substantially all the risks and rewards of ownership are classified as operating leases. The leased assets are included within premises and equipment on the Group’s balance sheet and depreciation is provided on the depreciable amount of these assets on a systematic basis over their estimated useful economic lives. Rental income is recognized on a straight-line basis over the period of the lease. Initial direct costs incurred in negotiating and arranging an operating lease are added to the carrying amount of the leased asset and recognized as an expense on a straight-line basis over the lease term.
F-24
Table of Contents
NOTES TO THE CONSOLIDATED FINANCIAL STATEMENTS, Continued
| 2. | Summary of Significant Accounting Principles, continued: |
| (k) | Lease transactions: |
The Bank acting as lessee
Assets held under finance leases are initially recognized on the balance sheet at an amount equal to the fair value of the leased property or, if lower, the present value of the minimum lease payments. The corresponding liability to the lessor is included in the balance sheet as a finance lease obligation. The discount rate used in calculating the present value of the minimum lease payments is either the interest rate implicit in the lease, if it is practicable to determine, or the incremental borrowing rate. Contingent rentals are recognized as expense in the periods in which they are incurred. As of December 31, 2012 and 2013, the Bank and its subsidiaries have not signed contracts of this nature.
Operating lease rentals payable are recognized as an expense on a straight-line basis over the lease term, which commences when the lessee controls the physical use of the property. Lease incentives are treated as a reduction of rental expense and are also recognized over the lease term on a straight-line basis. Contingent rentals arising under operating leases are recognized as an expense in the period in which they are incurred.
| (l) | Interest revenue and expense: |
Interest revenue and expenses are recognized in the income statement using the effective interest rate method. The effective interest rate is the rate which exactly discounts estimated future cash payments or receipts through the expected life of the financial instrument or a shorter period, where appropriate, to the net carrying amount of the financial asset or financial liability. To calculate the effective interest rate, the Bank determines cash flows by taking into account all contractual conditions of the financial instrument, excluding future credit losses.
The effective interest rate calculation includes all fees and other amounts paid or received that form part of the effective interest rate. Transaction costs include incremental costs that are directly attributable to the purchase or issuance of a financial asset or liability.
| (m) | Fees and commissions: |
Income and expenses from fees and commissions are recognized in income using different criteria based on the nature of the income or expense. The most significant criteria include:
| (i) | Fees earned from an individual act are recognized once the act has taken place. |
| (ii) | Fees earned from transactions or services provided over a longer period of time are recognized over the life of the transactions or services. These fees include commissions and asset management, custody or other management and advisory fees. |
Loan commitment fees for loans that are likely to be drawn down and other credit related fees are deferred (together with incremental costs) and recognized as an adjustment to the effective interest rate of the loan. When it is unlikely that a loan is drawn down the fees are recognized over the commitment period on a straight-line basis.
F-25
Table of Contents
NOTES TO THE CONSOLIDATED FINANCIAL STATEMENTS, Continued
| 2. | Summary of Significant Accounting Principles, continued: |
| (n) | Cash and cash equivalents: |
Cash and short-term deposits in the statement of financial position comprise cash at banks and on hand and short-term deposits with original maturity of three months or less, highly liquid investments that are readily convertible to a known amount of cash, and that are subject to an insignificant risk of changes in value.
The Bank has included as cash and cash equivalents to the account “Cash and due from banks”, plus (minus) the net balance of transactions in the course of collection that are shown in the Consolidated Statement Financial Position, plus short-term repurchase agreements. It also includes investments in fixed-income mutual funds that are presented in “Other Assets” in the Consolidated Statement of Financial Position.
| (o) | Property and equipment: |
Property and equipment is stated at cost excluding servicing cost, less accumulated depreciation and accumulated impairment. Changes in the expected useful life are accounted for by changing the depreciation period or method, as appropriate, and treated as changes in accounting estimates.
This cost includes expenses that have been directly attributed to the asset’s acquisition.
Depreciation is recognized in income on a straight-line basis over the estimated useful lives of each part of an item of property and equipment.
Estimated useful lives for 2012 and 2013 are as follows:
| Buildings | 50 years | |
| Installations (in general) | 10 years | |
| Equipments | 3 years | |
| Office furniture | 5 years |
Property and equipment is derecognized on disposal or when no future economic benefits are expected from its use. Any gain or loss arising on derecognition of the asset (calculated as the difference between the net disposal proceeds and the carrying amount of the asset) is recognized in “Impairments” in the income statement in the year the asset is derecognized.
| (p) | Intangible assets: |
Intangible assets are identified as non-monetary assets (separated from other assets) without physical substance that arise as the result of a legal transaction or that are developed internally by the consolidated entities. They are assets whose cost can be reliably estimated and for which the consolidated entities consider that it is probable that future economic benefits will be recognized.
F-26
Table of Contents
NOTES TO THE CONSOLIDATED FINANCIAL STATEMENTS, Continued
| 2. | Summary of Significant Accounting Principles, continued: |
| (p) | Intangible assets, continued: |
| (i) | Goodwill |
Goodwill arises on the acquisition of subsidiaries and associates representing the excess of the fair value of the purchase consideration over the net fair value of the Bank’s share of the identifiable assets acquired and the liabilities and contingent liabilities assumed on the date of the acquisition.
For the purpose of calculating goodwill, fair values of acquired assets, liabilities and contingent liabilities are determined by reference to market values or by discounting expected future cash flows to present value. This discounting is either performed using market rates or by using risk-free rates and risk-adjusted expected future cash flows.
Goodwill originating from the acquisition of subsidiaries is capitalized and reviewed for impairment annually or more frequently if there are indications that impairment may have occurred. Impairment is determined by comparing the present value of expected future cash flows from each cash generating unit with the carrying value of its net assets, including attributable goodwill. Goodwill is allocated to cash generating units for the purpose of impairment testing considering the business level at which goodwill is monitored for internal management purposes.
Impairment losses on goodwill are not reversed. Gains and losses on the disposal of an entity include the carrying amount of goodwill relating to the entity sold.
| (ii) | Software and computer programs |
Computer software purchased by the Bank and its subsidiaries is accounted for at cost less accumulated amortization and impairment losses.
The subsequent expense in software assets is capitalized only when it increases the future economic benefit for the specific asset. All other expenses are capitalized as an expense as incurred.
Amortization is recorded in income using the straight-line amortization method based on the estimated useful life of the software, from the date on which it is available for use. The estimated useful life of software is a maximum of 6 years.
Expense for internally developed software is recorded in income for each year.
| (iii) | Other identifiable intangible assets |
This item applies to identifiable intangible assets for which the cost can be reliably measured and which are likely to generate future economic benefits for the Bank. The estimated useful life of other intangible assets is a maximum of 7 years.
F-27
Table of Contents
NOTES TO THE CONSOLIDATED FINANCIAL STATEMENTS, Continued
| 2. | Summary of Significant Accounting Principles, continued: |
| (q) | Collateral repossessed (assets received in lieu of payment): |
Assets received in lieu of payment are classified under “Other Assets” and they are recorded at the lower of carrying amount and fair value, less cost to sell. Assets that are determined better to be sold are immediately transferred to assets held for sale at their fair value at the repossession date in line with the Bank’s policy.
| (r) | Investment Properties: |
Investment properties are real estate assets held to earn rental income or for capital appreciation or both, but are not held-for-sale in the ordinary course of business or used for administrative purposes. Investment properties are initially measured at cost, including transaction costs. Subsequent to initial recognition, they are carried at cost less accumulated depreciation and impairments using the same accounting policies as property and equipment.
| (s) | Deferred taxes and income taxes: |
The income tax provision of the Bank and its subsidiaries has been determined in conformity with current legal provisions.
The Bank and its subsidiaries recognize, when appropriate, deferred tax assets and liabilities for future estimates of tax effects attributable to temporary differences between the book and tax values of assets and liabilities. Deferred tax assets and liabilities are measured based on the tax rate expected to be applied, in accordance with current tax law, in the year that deferred tax assets are realized or liabilities are settled. The effects of future changes in tax legislation or tax rates are recognized in deferred taxes starting on the date of publication of the law approving such changes.
Deferred tax assets and liabilities are recorded at their book value as of the date the deferred taxes are measured. Deferred tax assets are recognized only when it is likely that future tax profits will be sufficient to recover deductions for temporary differences.
| (t) | Presentation and functional currency: |
The items included in the financial statements of each of the entities of Banco de Chile and its subsidiaries are valued using the currency of the primary economic environment in which it operates (functional currency). The functional currency of Banco de Chile is the Chilean peso, which is also the currency used to present the entity’s consolidated financial statements.
| (u) | Transactions in foreign currency: |
Transactions and balances
Transactions in currencies other than the functional currency are considered to be in foreign currency and are initially recorded at the exchange rate of the functional currency on the transaction date. Monetary assets and liabilities denominated in foreign currencies are converted using the exchange rate of the functional currency as of the date of the Statement of Financial Position. All differences are recorded as a charge or credit to income.
Assets and liabilities in foreign currencies are shown at their equivalent value in Chilean pesos, calculated using the following exchange rates as of December 31, 2012 and 2013: Ch$479.47 and Ch$525.72 to US$1, Ch$5.57 and Ch$5.00 per JPY1, Ch$634.05 and Ch$726.12 per EUR1.
The gain of MCh$71,457 (loss of MCh$36,136 in 2012) for net foreign exchange income shown in the Consolidated Statement of Comprehensive Income includes recognition of the effects of exchange rates variations on assets and liabilities in foreign currency or indexed to exchange rates, and the result of foreign exchange transactions conducted by the Bank and its subsidiaries.
F-28
Table of Contents
NOTES TO THE CONSOLIDATED FINANCIAL STATEMENTS, Continued
| 2. | Summary of Significant Accounting Principles, continued: |
| (v) | Derivative instruments: |
Derivative instruments, which include foreign currency and U.F. forwards, interest rate forwards, currency and interest rate swaps, currency and interest rate options and other financial derivative instruments, are recorded in the Statement of Financial Position at fair value regardless of whether they are held-for-trading or for non-trading purposes.
The fair value is obtained from market quotes, discounted cash flows models and options valuation models, as and where applicable. Derivative contracts are reported as an asset when their fair value is positive and as a liability when negative under the item “Derivative Instruments”.
Certain embedded derivatives in other financial instruments are treated as separate derivatives when their risk and characteristics are not closely related to those of the main contract and if the contract in its entirety is not recorded at its fair value with its unrealized gains and losses included in income.
At inception, a derivative contract must be designated by the Bank as a derivative instrument for trading or hedging purposes.
Changes in the fair value of derivative contracts maintained for trading purposes are included in “Net financial operating income”, in the Consolidated Statement of Comprehensive Income.
If a derivative instrument is classified as a hedging instrument, it can be:
| (1) | A hedge of the fair value of existing assets or liabilities or firm commitments, or |
| (2) | A hedge of cash flows related to existing assets or liabilities or forecasted transactions. |
A hedge relationship for hedge accounting purposes must comply with all of the following conditions:
| (a) | at its inception, the hedge relationship has been formally documented; |
| (b) | it is expected that the hedge will be highly effective; |
| (c) | the effectiveness of the hedge can be measured in a reasonable manner; and |
| (d) | the hedge is highly effective with respect to the hedged risk on an ongoing basis and throughout the entire hedge relationship. |
Certain derivatives transactions that do not qualify for hedge accounting are treated and reported as derivatives for trading purposes even though they provide an effective hedge on the risk of net positions.
F-29
Table of Contents
NOTES TO THE CONSOLIDATED FINANCIAL STATEMENTS, Continued
| 2. | Summary of Significant Accounting Principles, continued: |
| (v) | Derivative instruments, continued: |
Fair Value Hedges
When a derivative instrument hedges the risk of changes in the fair value of an existing asset or liability, the asset or liability is recorded at its fair value with respect to the specific hedged risk. Gains or losses from fair value adjustments, both the hedged item and the derivative instrument, are recognized in income.
Should the hedged item in a fair value hedge be a firm commitment, changes in the fair value of the commitment with respect to the hedged risk are recorded as an asset or liability against net income for the year. Gains or losses from fair value adjustments of the hedging derivative are recorded in income. When an asset or liability is acquired as a result of the commitment, the initial recognition of the asset or liability acquired is adjusted to incorporate the accumulated effect of the valuation at fair value of the firm commitment, which was previously recorded in the Statement of Financial Position.
Cash Flow Hedges
When a derivative hedges the risk of changes in the cash flows of existing assets or liabilities or forecasted transactions, the effective portion of changes in the fair value related to the hedged risk is recorded in equity net on income taxes. Any ineffective portion is directly recorded in income. The accumulated amounts recorded in equity are transferred to income at the moment that the hedged item affects income.
| (w) | Financial assets held-for-trading: |
Financial assets held-for-trading are securities acquired in order to generate profits from short-term price fluctuations or as a result of brokerage activities, or which are part of a portfolio on which a short-term profit-generating pattern exists. In this item are included mainly Central Bank bonds and deposits from domestic banks.
Financial assets held-for-trading are stated at their fair market value as of the Statement of Financial Position date. Gains or losses from their fair market value adjustments, as well as gains or losses from trading activities, are included in “Net financial operating income” in the Consolidated Statement of Comprehensive Income. Dividends, interest and indexations are reported as “Net financial operating income”.
All purchases and sales of financial assets held-for-trading that must be executed within the period established by market regulations or conventions are recorded using the trade date, which is the date on which the purchase or sale of the asset is committed. Any other purchase or sale is treated as a derivative (forward) until settlement occurs.
F-30
Table of Contents
NOTES TO THE CONSOLIDATED FINANCIAL STATEMENTS, Continued
| 2. | Summary of Significant Accounting Principles, continued: |
| (x) | Financial assets held to maturity and available-for-sale: |
Financial assets held-to-maturity includes only those securities for which the Bank has the ability and intention of keeping until maturity. The remaining investments are considered as financial assets available-for-sale. The Bank reassesses on an ongoing basis whether the ability and intention to sell available-for-sale instruments remains to be given.
A financial asset classified as available-for-sale is initially recognized at its fair value plus transaction costs that are directly attributable to the acquisition of the financial asset.
Financial assets available-for-sale are subsequently measured at their fair value based on market prices or valuation models. Unrealized gains or losses as result of fair value adjustments are recorded in other comprehensive income within equity. When these investments are sold, the cumulative fair value adjustments existing within equity will be recorded directly in income under “Net financial operating income”.
Financial assets held-to-maturity are recorded at their cost plus accrued interest and indexations, less impairment provisions made when the carrying amount exceeds the estimated recoverable amount.
Interest and indexations of financial assets held to maturity and available-for-sale are included in the line item “Interest revenue”. Dividends earned whilst holding available–for–sale financial investments are recognized in the income statement as “Other operating income” when the right to receive the payment has been established.
Investment securities, which are subject to hedge accounting, are adjusted according to the rules for hedge accounting.
Purchases and sales of investment securities that must be delivered within a period established by market regulations or conventions are recorded using the trade date that is the date on which the purchase or sale of the asset is committed. Any other purchase or sale is treated as a derivative (forward) until liquidation occurs.
As of December 31, 2012 and 2013, the Bank does not hold held to maturity instruments.
F-31
Table of Contents
NOTES TO THE CONSOLIDATED FINANCIAL STATEMENTS, Continued
| 2. | Summary of Significant Accounting Principles, continued: |
| (y) | Debt issued and other financial liabilities: |
Financial instruments issued by the Bank, which are not designated at fair value through profit and loss, are classified under “Debt issued”, where the substance of the contractual arrangement results in the Bank having an obligation either to deliver cash or another financial asset to the holder, or to satisfy the obligation other than by the exchange of a fixed amount of cash or another financial asset for a fixed number of equity shares.
After initial measurement, debt issued is subsequently measured at amortized cost using the effective interest rate. Amortized cost is calculated by taking into account any discount or premium on the issue and costs that are an integral part of the effective interest rate.
The Bank applies the same accounting policies for its other financial liabilities.
| (z) | Securities lending and borrowed: |
The Bank engages in transactions with repurchase agreements as a form of investment. The securities purchased under these agreements are not recognized on the Bank’s Statement of Financial Position. The consideration paid is recognized under “Receivables from Repurchase Agreements and Security Lending” reflecting the transaction’s economic substance as a loan granted by the Bank. The difference between the purchase and resale price is recorded in “Net Interest Income” and is accrued over the duration of the agreement using its effective interest rate. This treatment reflects the economic substance as a loan to the Bank.
The Bank also enters into security repurchase agreements as a form of financing. The securities sold under agreement to repurchase at a specific date in the future are not derecognized from the Statement of Financial Position as the Bank retains all the risks and rewards of ownership. The corresponding cash received is recognized in the balance sheet as an asset with a corresponding obligation to return it, including accrued interest, as a liability within “Payables from Repurchase Agreements and Security Lending”. The difference between the sale and repurchase price is treated as “Interest Expense” and is accrued over the duration of the agreement using the effective interest rate.
The treatment of security lending and borrowing transactions follows the principles laid out above. Securities borrowed are not recorded on and, securities lent are not derecognized from the Statement of Financial Position.
F-32
Table of Contents
NOTES TO THE CONSOLIDATED FINANCIAL STATEMENTS, Continued
| 2. | Summary of Significant Accounting Principles, continued: |
| (aa) | Customer loyalty programs: |
The Bank maintains a customer loyalty program as an incentive to its clients. The scheme grants its customers certain points depending on the value of credit card purchases they make. The collected points can be used to obtain services from a third party. In accordance with IFRIC 13 the costs which the Bank incurs provide this incentive are recognized at fair value when the corresponding revenue is recognized, considering the probabilities of use by the customers to obtain the third party’s service. The points collected cannot be used to obtain services directly from the Bank.
| (ab) | Provisions and contingent liabilities: |
Provisions are liabilities involving uncertainty about their amount or maturity. They are recorded in the Statement of Financial Position when the following requirements are jointly met:
| (i) | a present obligation has arisen from a past event and, |
| (ii) | as of the date of the financial statements it is likely that the Bank or its subsidiaries have to disburse resources to settle the obligation and, |
| (iii) | the amount can be reliably measured. |
A contingent asset or liability is any right or obligation arising from past events whose existence will be confirmed by one or more uncertain future events which are not within the control of the Bank. Contingent assets and liabilities are not recognized in the Statement of Financial Position.
F-33
Table of Contents
NOTES TO THE CONSOLIDATED FINANCIAL STATEMENTS, Continued
| 2. | Summary of Significant Accounting Principles, continued: |
| (ac) | Provision for minimum dividends: |
The Bank records within liabilities the portion of net income for the year that should be distributed to comply with the Corporations Law. For these purposes, the Bank establishes a provision in a complementary equity account within retained earnings.
| (ad) | Employee benefits: |
| (i) | Staff vacations |
The annual costs of vacations and staff benefits are recognized on an accrual basis.
| (ii) | Short-term benefits |
The Bank has a yearly bonus plan for its employees based on their ability to meet objectives and their individual contribution to the Bank’s results, consisting of a given number or portion of monthly salaries. It is provisioned for based on the estimated amount to be distributed.
| (iii) | Staff severance indemnities |
Banco de Chile has recorded a liability for long-term severance indemnities in accordance with employment contracts it has with certain employees. The liability, which results from payments to specified retiring employees with more than 30 years of service, is recorded at the present value of the accrued benefits. It is calculated by applying an equivalent discount rate to the accrued benefits. These benefits accrue over the estimated average remaining service period.
Obligations for this defined benefit plan are valued according to the projected unit credit actuarial valuation method, using inputs such as staff turnover rates, expected growth in wages and the probability that this benefit will be used, discounted at current long-term rates (5.50% as of December 31, 2012 and 5.19% as of December 31, 2013). The discount rate used corresponds to the return on bonds of the Central Bank with maturity in 10 years.
Actuarial gains and losses are recognized as income or expense at the end of each reporting period. There is no past service costs that would have to be recognized by the Bank.
F-34
Table of Contents
NOTES TO THE CONSOLIDATED FINANCIAL STATEMENTS, Continued
| 2. | Summary of Significant Accounting Principles, continued: |
| (ae) | Equity reserves: |
The equity reserves recorded in the Bank’s Statement of Financial Position include:
Reserves from Earnings :
This item includes all the reserves that were originated from earnings and that by legal or statutory dispositions, or agreements of the shareholders’ meeting, will not be distributed in the form of future dividends.
Other reserves :
This item includes all the reserves that do not come from earnings and that do not correspond to those indicated in previous items.
Unrealized gains (losses) on available-for-sale instruments :
This item comprises changes in the fair value of these instruments.
Cumulative translation adjustment :
This item is used to record exchange differences arising from the translation of the net investment in foreign operations.
| (af) | Earnings per share: |
Basic earnings per share is determined by dividing net income for the year attributable to the Bank by the average weighted number of shares in circulation during that year.
Diluted earnings per share is determined in a similar manner as basic earnings per share, but the average weighted number of shares in circulation is adjusted to account for the dilutive effect of stock options, warrants and convertible debt. As of December 31, 2012 and 2013, the Bank does not have any instruments or contracts that could cause dilutions. Therefore, no adjustments have been made.
| (ag) | Segment reporting: |
The Bank’s operating segments are defined based on its different business units, considering the following factors:
| (i) | That it develops business activities from which income is obtained and expenses are incurred (including income and expenses relating to transactions with other components of the same entity). |
| (ii) | That its operating results are reviewed regularly by the entity’s highest decision-making authority for operating decisions, to decide about resource allocation for the segment and evaluate its performance; and |
| (iii) | That separate financial information is available. |
F-35
Table of Contents
NOTES TO THE CONSOLIDATED FINANCIAL STATEMENTS, Continued
| 2. | Summary of Significant Accounting Principles, continued: |
| (ah) | Identifying and measuring impairment: |
Financial assets (other than loans)
Financial assets are reviewed throughout each year, and especially at each reporting date, to determine whether there is objective evidence of impairment as a result of a loss event that occurred after the initial recognition of the asset and the loss event had an impact on the estimated future cash flows of the financial asset that can be reliably calculated.
A financial asset or group of financial assets is impaired and impairment losses are incurred if:
| • |
there is objective evidence of impairment as a result of a loss event that occurred after the initial recognition of the asset and up to the balance sheet date (“a loss event”); |
| • |
the loss event had an impact on the estimated future cash flows of the financial asset or the group of financial assets and; |
| • |
a reliable estimate of the loss amount can be made. |
An impairment loss for financial assets recorded at amortized cost is calculated as the difference between the asset’s carrying amount and the present value of the estimated future cash flows, discounted using the effective interest rate.
An impairment loss for available-for-sale financial assets is calculated using its fair value considering fair value changes already recognized in other comprehensive income.
In the case of equity investments classified as available-for-sale financial assets, objective evidence includes a significant or prolonged decline in the fair value of the investment below cost. The bank considers ‘significant’ generally as 20% and ‘prolonged’ generally as more than 6 months. In the case of debt securities classified as available-for-sale financial assets, the Bank assesses whether there exists objective evidence for impairment based on the same criteria as for loans.
F-36
Table of Contents
NOTES TO THE CONSOLIDATED FINANCIAL STATEMENTS, Continued
| 2. | Summary of Significant Accounting Principles, continued: |
| (ah) | Identifying and measuring impairment, continued: |
Financial assets (other than loans), continued:
If there is evidence of impairment, any amounts previously recognized in equity, in net gains (losses) not recognized in the income statement, is removed from equity and recognized in the income statement for the period, reported in net gains (losses) on financial assets available for sale. This amount is determined as the difference between the acquisition cost (net of any principal repayments and amortization) and current fair value of the asset less any impairment loss on that investment previously recognized in the income statement.
When the fair value of the available-for-sale debt security recovers to at least amortized cost it is no longer considered impaired and subsequent changes in fair value are reported in equity.
Individually significant financial assets are individually examined to determine impairment. Remaining financial assets are collectively evaluated in groups that share similar credit risk characteristics. Both criteria are similar as those described in Note 2(h) Loans to customer to determine impairment individually and group.
All impairment losses are recognized in the income statement. Any cumulative loss related to available-for-sale financial assets recognized previously in equity is transferred to the income statement.
An impairment loss is reversed if, in a subsequent period, the fair value of the debt instrument classified as available for sale increases and the increase can be objectively related to an event occurring after the impairment loss was recognized in profit or loss. The amount of the reversal is recognized in profit or loss up to the amount previously recognized as impairment. Impairment losses recognized in profit or loss for an investment in an equity instrument classified as available for sale are not reversed through profit or loss.
F-37
Table of Contents
NOTES TO THE CONSOLIDATED FINANCIAL STATEMENTS, Continued
| 2. | Summary of Significant Accounting Principles, continued: |
| (ah) | Identifying and measuring impairment, continued: |
Non-financial assets
The Bank assesses at each reporting date and on an ongoing basis whether there is an indication that an asset may be impaired. If any indication exists, or if annual impairment testing for an asset is required, the Bank estimates the asset’s recoverable amount. An asset’s recoverable amount is the higher of an asset’s or cash-generating unit’s (“CGU”) fair value less costs to sell and its value in use. Where the carrying amount of an asset or CGU exceeds its recoverable amount, the asset is considered impaired and is written down to its recoverable amount. In assessing value in use, the estimated cash flows are discounted to their present value using a pre-tax discount rate that reflects the current market assessments of the time value of money and risks specific to the asset. In determining fair value less costs to sell, an appropriate valuation model is used. These calculations are corroborated by valuation multiples, share prices and other available fair value indicators.
For assets, excluding goodwill, impairment losses recognized in prior years are assessed at each reporting date in case there are any indications that the loss has decreased or disappeared. A previously recognized impairment is reversed only if there has been a change in the assumptions used to determine the asset’s recoverable amount since the last impairment was recognized. An impairment loss is reversed only to the extent that the book value of the asset does not exceed the carrying amount that would have been determined, net of depreciation or amortization, if no impairment loss had been recognized. Such reversal is recognized in the income statement.
Impairment losses relating to goodwill cannot be reversed in future periods.
| (ai) | Fiduciary activities: |
The Bank provides trust and other fiduciary services that result in the holding or investing of assets on behalf of the clients. Assets held in a fiduciary capacity are not reported in the financial statements, as they are not the assets of the Bank.
| (aj) | Reclassifications |
During this period, expenses that are directly related to credit cards loyalty programs were reclassified from “Other operational expenses” to “Expenses from fees and commissions”. Accordingly, for comparison purposes, similar reclassifications were made for previous years. We made this decision in order to better associate expenses with revenues from this transactional product.
F-38
Table of Contents
NOTES TO THE CONSOLIDATED FINANCIAL STATEMENTS, Continued
| 3. | New and amended standards and interpretations: |
The accounting policies adopted are consistent with those of the previous financial year. Amendments resulting from Improvements to IFRSs to the following standards did not have any impact on the accounting policies, financial position or performance of the Bank:
| • |
IAS 1 Presentation of Items of Other Comprehensive Income – Introduces a grouping of items that could be reclassified to profit or loss at a future point in time |
| • |
IFRS 7 Financial Instruments: Disclosures Offseting Financial Assets and Financial Liabilities – Amendment requires and entity to disclose information about rights to set-off financial instruments and related arrangements |
| • |
IFRS 10 Consolidated Financial Statements – Establishes a single control model that applies to all entities including special purposes entities |
| • |
IFRS 11 Joint Arragements – Removes the option to account for jointly controlled entities using proportionate consolidation. |
| • |
IFRS 12 Disclosure of Interest in Other Entities – Sets out the requirements for disclosures relating to and entity’s interests in subsidiaries, joint arrangements, associates and structured entities. |
| • |
IFRS 13 Fair Value Measurement – Establishes a single source of guidance under IFRS for all fair value measurements |
| • |
IAS 19 Employee Benefits – Includes a number of amendments to the accounting for defined benefit plans |
F-39
Table of Contents
NOTES TO THE CONSOLIDATED FINANCIAL STATEMENTS, Continued
| 4. | Changes in Accounting policies and Disclosures |
Since 2013, IAS 19 “Employee Benefits”, changed the accounting treatment of the measurements of liability, specifically defined benefit plans and termination benefits. The main effect on the financial statements is related to accounting for gains and losses, originated by changes in actuarial variables, which must to be recorded as a charge or credit to “Other Comprehensive Income” since current year. Until before this change, these effects affected profit or loss directly.
Reclassifications were made in the Balance and Income Statement for the year 2011 and 2012 for an amount of MCh$43 and MCh$1,760, respectively, for the purpose of presenting comparative financial statements.
During the year ended December 31, 2013, there were no other accounting changes that affect the presentation of these consolidated financial statements.
F-40
Table of Contents
NOTES TO THE CONSOLIDATED FINANCIAL STATEMENTS, Continued
| 5. | Segment Reporting: |
For management purposes, we have organized our operations and commercial strategies into four business segments, which are defined in accordance with the type of products and services offered to target customers. These business segments are currently defined as follows:
|
Retail: |
This segment focuses on individuals and small and medium-sized companies with annual sales up to UF 70,000, where the product offering focuses primarily on consumer loans, commercial loans, checking accounts, credit cards, credit lines and mortgage loans. | |
|
Wholesale: |
This segment focuses on corporate clients and large companies whose annual revenue exceeds UF 70,000, where the product offering focuses primarily on commercial loans, checking accounts and liquidity management services, debt instruments, foreign trade, derivative contracts and leases. | |
|
Treasury and money market operations: |
||
| This segment focuses on managing the Bank’s balance sheet (including currencies, maturities and interest rates) and liquidity, including financial instrument and currency trading on account of the Bank itself. | ||
| Transactions on behalf of customers carried out by the Treasury are reflected in the respective aforementioned segments. These products are highly transaction-focused such as foreign exchange transactions, derivatives and financial instruments in general. | ||
|
Subsidiaries: |
Corresponds to companies controlled by the Bank, whose operations and financial results are managed individually by the respective subsidiary. The companies that comprise this segment are: | |
|
• Banchile Trade Services Limited
• Banchile Administradora General de Fondos S.A.
• Banchile Asesoría Financiera S.A.
• Banchile Corredores de Seguros Ltda.
• Banchile Factoring S.A. (*)
• Banchile Corredores de Bolsa S.A.
• Banchile Securitizadora S.A.
• Socofin S.A.
• Promarket S.A. |
||
| (*) | On July 1, 2013, Banco de Chile has absorbed its subsidiary Banchile Factoring S.A. (On June 19, 2013 Banco de Chile bought shares of Banchile Factoring S.A. to Banchile Asesoría Financiera S.A.). This subsidiary was previously presented under the subsidiaries operating segment. As result of being absorbed by the Bank, its operations are now presented under the retail and wholesale operating segment. Previous periods operating segment information have been restated for comparative purposes. |
F-41
Table of Contents
NOTES TO THE CONSOLIDATED FINANCIAL STATEMENTS, Continued
| 5. | Segment Reporting, continued: |
The financial information used to measure the performance of the Bank’s business segments is not necessarily comparable with similar information from other financial institutions because it is based on internal reporting policies. The accounting policies used to prepare the Bank’s operating segment information are similar to those described in Note 2, “Summary of Significant Accounting Principles”, except as noted below:
| • |
The net interest margin of loans and deposits is measured on an individual transaction and individual client basis, stemming from the difference between the effective customer rate and the related Bank’s fund transfer price in terms of maturity, re-pricing and currency. |
| • |
The results associated with gap management (interest rate and currency mismatches) are allocated to the business segments by considering the amount of loans and demand deposits managed by each segment. |
| • |
For purposes of allocation the effect of funding through capital and reserves, the internal performance profitability system considers capital allocation in each segments in accordance with Basel Guidelines. |
| • |
In addition to direct costs (consisting mainly of labor and administrative expenses), the Bank allocates all of its indirect operating costs to each business segment by utilizing different cost drivers to allocate such costs to the specific segment. |
| • |
The Bank applies local banking regulator accounting principles when measuring and recording its allowance for loan losses, assets received in lieu of payments, minimum dividend allowances and some other minor items for internal reporting purposes. These accounting policies differ in some significant aspects from IFRS. |
The Bank obtains the majority of its income from interest, indexations and fees, less the associated credit costs and expenses. Management primarily bases its evaluation of segment performance and decision-making regarding goals and the allocation of resources for each unit on these concepts. Even though the results of the segments reconcile with those of the Bank at the consolidated level, differences may exist in each segments’ results due to the different measurement concepts indicated above.
The Bank did not enter into transactions with any particular customer or third party that collectively generated more than 10% of the Bank’s total income in 2012 and 2013.
The Bank carries out its business operations in Chile.
Transfer pricing between operating segments is conducted on an arm’s length basis in a manner similar to transactions with unaffiliated third parties.
Taxes are managed at the consolidated level and are not allocated to business segments.
F-42
Table of Contents
NOTES TO THE CONSOLIDATED FINANCIAL STATEMENTS, Continued
| 5. | Segment Reporting, continued: |
| As of December 31, 2011 | ||||||||||||||||||||||||||||||
|
Retail
MCh$ |
Wholesale
MCh$ |
Treasury
MCh$ |
Subsidiaries
MCh$ |
Subtotal
MCh$ |
Reclassifications
and adjustments to conform IFRS MCh$ |
Note | Total MCh$ | |||||||||||||||||||||||
|
Net interest income |
592,763 | 255,218 | 20,460 | (7,531 | ) | 860,910 | 16,565 | 877,475 | ||||||||||||||||||||||
|
Net fees and commissions income |
152,257 | 32,703 | (451 | ) | 115,883 | 300,392 | (10,284 | ) | 290,108 | |||||||||||||||||||||
|
Other operating income |
15,522 | 1,272 | 11,508 | 27,375 | 55,677 | 19,186 | 74,863 | |||||||||||||||||||||||
|
|
|
|
|
|
|
|
|
|
|
|
|
|
|
|||||||||||||||||
|
Total operating revenue |
760,542 | 289,193 | 31,517 | 135,727 | 1,216,979 | 25,467 | (1) | 1,242,446 | ||||||||||||||||||||||
|
Provisions for loan losses |
(111,930 | ) | (11,975 | ) | (963 | ) | 28 | (124,840 | ) | (22,085 | ) | (2) | (146,925 | ) | ||||||||||||||||
|
Depreciation and amortization |
(21,189 | ) | (6,329 | ) | (1,718 | ) | (1,476 | ) | (30,712 | ) | (4,419 | ) | (3) | (35,131 | ) | |||||||||||||||
|
Other operating expenses |
(364,649 | ) | (122,740 | ) | (8,486 | ) | (80,460 | ) | (576,335 | ) | 16,466 | (4) | (559,869 | ) | ||||||||||||||||
|
Income attributable to associates |
2,253 | 710 | — | 338 | 3,301 | (247 | ) | 3,054 | ||||||||||||||||||||||
|
|
|
|
|
|
|
|
|
|
|
|
|
|
|
|||||||||||||||||
|
Income before income taxes |
265,027 | 148,859 | 20,350 | 54,157 | 488,393 | 15,182 | 503,575 | |||||||||||||||||||||||
|
Income taxes |
(59,588 | ) | (5,843 | ) | (5) | (65,431 | ) | |||||||||||||||||||||||
|
|
|
|||||||||||||||||||||||||||||
|
Income after income taxes |
438,144 | |||||||||||||||||||||||||||||
|
|
|
|||||||||||||||||||||||||||||
|
Assets |
8,543,124 | 9,531,192 | 3,415,922 | 662,079 | 22,152,317 | (456,341 | ) | 21,695,976 | ||||||||||||||||||||||
|
Current and deferred taxes |
89,974 | (29,949 | ) | 60,025 | ||||||||||||||||||||||||||
|
|
|
|
|
|
|
|||||||||||||||||||||||||
|
Total assets |
22,242,291 | (486,290 | ) | (6) | 21,756,001 | |||||||||||||||||||||||||
|
|
|
|
|
|
|
|||||||||||||||||||||||||
|
Liabilities |
6,579,397 | 9,215,352 | 4,214,432 | 493,934 | 20,503,115 | (787,783 | ) | 19,715,332 | ||||||||||||||||||||||
|
Current and deferred taxes |
— | — | — | |||||||||||||||||||||||||||
|
|
|
|
|
|
|
|||||||||||||||||||||||||
|
Total liabilities |
20,503,115 | (787,783 | ) | (7) | 19,715,332 | |||||||||||||||||||||||||
|
|
|
|
|
|
|
|||||||||||||||||||||||||
F-43
Table of Contents
NOTES TO THE CONSOLIDATED FINANCIAL STATEMENTS, Continued
| 5. | Segment Reporting, continued: |
Reclassifications and adjustments to conform IFRS
| (1) | The total effect due to the elimination adjustments to conform to total operating revenue is MCh$32,087. The total effect of IFRS adjustments is MCh$(6,620), which mainly stems from the reclassification of allowances for loan losses and amortization of fair value loans from Citibank Chile. |
| (2) | The total effect relates to IFRS adjustments of MCh$(22,085), which mainly stem from differing allowances for loan losses. |
| (3) | The total effect relates to IFRS adjustments of MCh$(4,419), which stem from the amortization of intangibles and depreciation of property and equipment from Citibank Chile. |
| (4) | The total effect due to the elimination adjustments to conform to other operating expenses is MCh$11,863. The total effect of IFRS adjustments is MCh$4,603, which represents the reversal of write-offs of assets received in lieu of payments. |
| (5) | The total effect relates to IFRS adjustments of MCh$(5,843), which stem from deferred taxes. |
| (6) | The total effect due to the elimination adjustments to conform to the consolidated financial position data in assets is MCh$(529,059). The total effect of IFRS adjustments in assets is MCh$42,769, which mainly stems from deviating allowances for loan losses, the acquisition of Citibank Chile and deferred taxes effects. |
| (7) | The total effect due to the elimination adjustments to conform to the consolidated financial position data in liabilities is MCh$(529,059). The total effect of IFRS adjustments in liabilities is MCh$(258,724), which mainly stems from providing for minimum dividends and differing allowances for loan losses. |
F-44
Table of Contents
NOTES TO THE CONSOLIDATED FINANCIAL STATEMENTS, Continued
| 5. | Segment Reporting, continued: |
| As of December 31, 2012 | ||||||||||||||||||||||||||||||
|
Retail
MCh$ |
Wholesale
MCh$ |
Treasury
MCh$ |
Subsidiaries
MCh$ |
Subtotal
MCh$ |
Reclassifications
and adjustments to conform IFRS MCh$ |
Note |
Total
MCh$ |
|||||||||||||||||||||||
|
Net interest income |
671,971 | 263,108 | 18,356 | (12,296 | ) | 941,139 | 22,998 | 964,137 | ||||||||||||||||||||||
|
Net fees and commissions income |
153,358 | 42,229 | (367 | ) | 103,472 | 298,692 | (11,420 | ) | 287,272 | |||||||||||||||||||||
|
Other operating income |
16,759 | 33,069 | 14,746 | 31,522 | 96,096 | (23,874 | ) | 72,222 | ||||||||||||||||||||||
|
|
|
|
|
|
|
|
|
|
|
|
|
|
|
|||||||||||||||||
|
Total operating revenue |
842,088 | 338,406 | 32,735 | 122,698 | 1,335,927 | (12,296 | ) | (1) | 1,323,631 | |||||||||||||||||||||
|
Provisions for loan losses |
(180,559 | ) | (7,622 | ) | (22 | ) | 13 | (188,190 | ) | 21,770 | (2) | (166,420 | ) | |||||||||||||||||
|
Depreciation and amortization |
(20,903 | ) | (7,300 | ) | (1,204 | ) | (1,550 | ) | (30,957 | ) | (4,189 | ) | (3) | (35,146 | ) | |||||||||||||||
|
Other operating expenses |
(390,055 | ) | (109,105 | ) | (8,672 | ) | (86,718 | ) | (594,550 | ) | 16,762 | (4) | (577,788 | ) | ||||||||||||||||
|
Income attributable to associates |
(288 | ) | (228 | ) | (18 | ) | 305 | (229 | ) | (239 | ) | (468 | ) | |||||||||||||||||
|
|
|
|
|
|
|
|
|
|
|
|
|
|
|
|||||||||||||||||
|
Income before income taxes |
250,283 | 214,151 | 22,819 | 34,748 | 522,001 | 21,808 | 543,809 | |||||||||||||||||||||||
|
Income taxes |
(54,390 | ) | (9,538 | ) | (5) | (63,928 | ) | |||||||||||||||||||||||
|
|
|
|||||||||||||||||||||||||||||
|
Income after income taxes |
479,881 | |||||||||||||||||||||||||||||
|
|
|
|||||||||||||||||||||||||||||
|
Assets |
9,852,430 | 9,614,329 | 3,746,908 | 635,225 | 23,848,892 | (706,493 | ) | 23,142,399 | ||||||||||||||||||||||
|
Current and deferred taxes |
99,506 | (43,705 | ) | 55,801 | ||||||||||||||||||||||||||
|
|
|
|
|
|
|
|||||||||||||||||||||||||
|
Total assets |
23,948,398 | (750,198 | ) | (6) | 23,198,200 | |||||||||||||||||||||||||
|
|
|
|
|
|
|
|||||||||||||||||||||||||
|
Liabilities |
7,706,834 | 9,225,881 | 4,495,605 | 489,830 | 21,918,150 | (1,098,601 | ) | 20,819,549 | ||||||||||||||||||||||
|
Current and deferred taxes |
23,189 | — | 23,189 | |||||||||||||||||||||||||||
|
|
|
|
|
|
|
|||||||||||||||||||||||||
|
Total liabilities |
21,941,339 | (1,098,601 | ) | (7) | 20,842,738 | |||||||||||||||||||||||||
|
|
|
|
|
|
|
|||||||||||||||||||||||||
F-45
Table of Contents
NOTES TO THE CONSOLIDATED FINANCIAL STATEMENTS, Continued
| 5. | Segment Reporting, continued: |
Reclassifications and adjustments to conform IFRS
| (1) | The total effect due to the elimination adjustments to conform to the total operating revenue is MCh$(13,873). The total effect of IFRS adjustments is MCh$1,577, which mainly stems from the reclassification of allowances for loan losses, amortization of fair value loans from Citibank Chile and embedded derivatives. |
| (2) | The total effect relates to IFRS adjustments of MCh$21,770, which mainly stem from differing allowances for loan losses. |
| (3) | The total effect relates to IFRS adjustments of MCh$(4,189), which stem from the amortization of intangibles and depreciation of property and equipment from Citibank Chile. |
| (4) | The total effect due to the elimination adjustments to conform to other operating expenses is MCh$13,873. The total effect of IFRS adjustments is MCh$2,889, which represents reversal of write-offs of assets received in lieu of payments. |
| (5) | The total effect relates to IFRS adjustments of MCh$(9,538), which stem from deferred taxes. |
| (6) | The total effect due to the elimination adjustments to conform to the consolidated financial position data in assets is MCh$(717,653). The total effect of IFRS adjustments in assets is MCh$(32,545), which mainly stems from deviating allowances for loan losses, the acquisition of Citibank Chile and deferred taxes effects. |
| (7) | The total effect due to the elimination adjustments to conform to the consolidated financial position data in liabilities is MCh$(717,653). The total effect of IFRS adjustments in liabilities is MCh$(380,948), which mainly stems from providing for minimum dividends and differing allowances for loan losses. |
F-46
Table of Contents
NOTES TO THE CONSOLIDATED FINANCIAL STATEMENTS, Continued
| 5. | Segment Reporting, continued: |
| As of December 31, 2013 | ||||||||||||||||||||||||||||||
|
Retail
MCh$ |
Wholesale
MCh$ |
Treasury
MCh$ |
Subsidiaries
MCh$ |
Subtotal
MCh$ |
Reclassifications
and adjustments to conform IFRS MCh$ |
Note (*) |
Total
MCh$ |
|||||||||||||||||||||||
|
Net interest income |
737,476 | 303,128 | 23,269 | (12,143 | ) | 1,051,730 | 9,841 | 1,061,571 | ||||||||||||||||||||||
|
Net fees and commissions income |
150,195 | 42,615 | (1,355 | ) | 106,280 | 297,735 | (10,642 | ) | 287,093 | |||||||||||||||||||||
|
Other operating income |
35,551 | 57,320 | (5,607 | ) | 32,439 | 119,703 | 10,310 | 130,013 | ||||||||||||||||||||||
|
|
|
|
|
|
|
|
|
|
|
|
|
|
|
|||||||||||||||||
|
Total operating revenue |
923,222 | 403,063 | 16,307 | 126,576 | 1,469,168 | 9,509 | (1) | 1,478,677 | ||||||||||||||||||||||
|
Provisions for loan losses |
(203,586 | ) | (38,031 | ) | 47 | (43 | ) | (241,613 | ) | 19,960 | (2) | (221,653 | ) | |||||||||||||||||
|
Depreciation and amortization |
(20,068 | ) | (5,912 | ) | (1,182 | ) | (1,747 | ) | (28,909 | ) | 1,232 | (3) | (27,677 | ) | ||||||||||||||||
|
Other operating expenses |
(397,456 | ) | (112,528 | ) | (5,171 | ) | (92,023 | ) | (607,178 | ) | 15,325 | (4) | (591,853 | ) | ||||||||||||||||
|
Income attributable to associates |
1,123 | 814 | 95 | 39 | 2,071 | (291 | ) | 1,780 | ||||||||||||||||||||||
|
|
|
|
|
|
|
|
|
|
|
|
|
|
|
|||||||||||||||||
|
Income before income taxes |
303,235 | 247,406 | 10,096 | 32,802 | 593,539 | 45,735 | 639,274 | |||||||||||||||||||||||
|
Income taxes |
(79,936 | ) | (9,149 | ) | (5) | (89,085 | ) | |||||||||||||||||||||||
|
|
|
|||||||||||||||||||||||||||||
|
Income after income taxes |
550,189 | |||||||||||||||||||||||||||||
|
|
|
|||||||||||||||||||||||||||||
|
Assets |
10,635,940 | 10,385,698 | 4,319,777 | 634,466 | 25,975,881 | (158,594 | ) | 25,817,287 | ||||||||||||||||||||||
|
Current and deferred taxes |
109,335 | (52,914 | ) | 56,421 | ||||||||||||||||||||||||||
|
|
|
|
|
|
|
|||||||||||||||||||||||||
|
Total assets |
26,085,216 | (211,508 | ) | (6) | 25,873,708 | |||||||||||||||||||||||||
|
|
|
|
|
|
|
|||||||||||||||||||||||||
|
Liabilities |
8,299,048 | 9,633,395 | 5,378,699 | 482,627 | 23,793,769 | (606,231 | ) | 23,187,538 | ||||||||||||||||||||||
|
Current and deferred taxes |
7,131 | — | 7,131 | |||||||||||||||||||||||||||
|
|
|
|
|
|
|
|||||||||||||||||||||||||
|
Total liabilities |
23,800,900 | (606,231 | ) | (7) | 23,194,669 | |||||||||||||||||||||||||
|
|
|
|
|
|
|
|||||||||||||||||||||||||
F-47
Table of Contents
NOTES TO THE CONSOLIDATED FINANCIAL STATEMENTS, Continued
| 5. | Segment Reporting, continued: |
Reclassifications and adjustments to conform IFRS
| (1) | The total effect due to the elimination adjustments to conform to the total operating revenue is MCh$(13,143). The total effect of IFRS adjustments is MCh$22,652, which mainly stems from the reclassification of allowances for loan losses, amortization of fair value loans from Citibank Chile and embedded derivatives. |
| (2) | The total effect relates to IFRS adjustments of MCh$19,960, which mainly stem from differing allowances for loan losses. |
| (3) | The total effect relates to IFRS adjustments of MCh$1,232, which stem from the amortization of intangibles and depreciation of property and equipment from Citibank Chile. |
| (4) | The total effect due to the elimination adjustments to conform to other operating expenses is MCh$13,143. The total effect of IFRS adjustments is MCh$2,182, which represents reversal of write-offs of assets received in lieu of payments. |
| (5) | The total effect relates to IFRS adjustments of MCh$(9,149), which stem from deferred taxes. |
| (6) | The total effect due to the elimination adjustments to conform to the consolidated financial position data in assets is MCh$(191,117). The total effect of IFRS adjustments in assets is MCh$(20,391), which mainly stems from deviating allowances for loan losses, the acquisition of Citibank Chile and deferred taxes effects. |
| (7) | The total effect due to the elimination adjustments to conform the consolidated financial position data in liabilities is MCh$(191,117). The total effect of IFRS adjustments in liabilities is MCh$(415,114), which mainly stems from providing for minimum dividends and differing allowances for loan losses. |
F-48
Table of Contents
NOTES TO THE CONSOLIDATED FINANCIAL STATEMENTS, Continued
| 6. | Cash and Cash Equivalents: |
| (a) | Details of cash and cash equivalents and its reconciliation to the statement of cash flows at each period are as follows: |
|
2012
MCh$ |
2013
MCh$ |
|||||||
|
Cash and due from banks: |
||||||||
|
Cash |
400,249 | 485,537 | ||||||
|
Current account with the Central Bank |
67,833 | 71,787 | ||||||
|
Deposits in other domestic banks |
15,295 | 15,588 | ||||||
|
Deposits abroad |
201,548 | 300,396 | ||||||
|
|
|
|
|
|||||
|
Subtotal – Cash and due from banks |
684,925 | 873,308 | ||||||
|
Transactions in the course of collection |
237,393 | 248,128 | ||||||
|
Highly liquid financial instruments (shown in other assets) |
33,042 | 66,213 | ||||||
|
Repurchase agreements |
9,120 | 59,089 | ||||||
|
|
|
|
|
|||||
|
Total cash and cash equivalents |
964,480 | 1,246,738 | ||||||
|
|
|
|
|
|||||
Amounts in cash and Central Bank deposits are regulatory reserve deposits for which the Bank must maintain a certain monthly average.
| (b) | Transactions in the course of collection |
Transactions in the course of collection are transactions for which the only remaining step is settlement, which will increase or decrease the funds in the Central Bank or in foreign banks, normally occurring within 24 to 48 business hours and are detailed as follows:
|
2012
MCh$ |
2013
MCh$ |
|||||||
|
Assets |
||||||||
|
Documents drawn on other banks (clearing) |
249,019 | 232,698 | ||||||
|
Funds receivable |
61,058 | 67,328 | ||||||
|
|
|
|
|
|||||
|
Total transactions in the course of collection |
310,077 | 300,026 | ||||||
|
|
|
|
|
|||||
|
Liabilities |
||||||||
|
Funds payable |
(72,684 | ) | (51,898 | ) | ||||
|
|
|
|
|
|||||
|
Total transactions in the course of payment |
(72,684 | ) | (51,898 | ) | ||||
|
|
|
|
|
|||||
F-49
Table of Contents
NOTES TO THE CONSOLIDATED FINANCIAL STATEMENTS, Continued
| 7. | Financial Assets Held-for-Trading: |
The details of financial instruments classified as held-for-trading are as follows:
|
2012
MCh$ |
2013
MCh$ |
|||||||
|
Instruments issued by the Chilean Government and Central Bank: |
||||||||
|
Central Bank bonds |
25,585 | 34,407 | ||||||
|
Central Bank promissory notes |
3,068 | 2,995 | ||||||
|
Other instruments issued by the Chilean Government and Central Bank |
43,726 | 27,535 | ||||||
|
Other instruments issued in Chile |
||||||||
|
Mortgage bonds from domestic banks |
22 | 14 | ||||||
|
Bonds from domestic banks |
— | 1,926 | ||||||
|
Deposits in domestic banks |
87,093 | 255,582 | ||||||
|
Bonds issued by chilean companies |
— | 3,427 | ||||||
|
Other instruments issued in Chile |
188 | 1,035 | ||||||
|
Instruments issued by foreign institutions |
||||||||
|
Other instruments issued abroad |
— | — | ||||||
|
|
|
|
|
|||||
|
Total |
159,682 | 326,921 | ||||||
|
|
|
|
|
|||||
Instruments issued by the Chilean Government and Central Bank include instruments sold under agreements to repurchase to customers and financial institutions, for the period 2013 there was no balance for this concept (not balance in 2012).
“Other instruments issued in Chile” include instruments sold under repurchase agreements with customers and financial instruments amounting to MCh$227,453 as of December 31, 2013 (MCh$86,863 in 2012).
Repurchase agreements have an average expiration of 14 days as of December 31, 2013 (11 days in 2012).
Additionally, the Bank holds financial investments in mortgage finance bonds issued by itself in the amount of MCh$41,313 as of December 31, 2013 (MCh$51,154 in 2012), which are presented as a reduction of the liability line item “Debt issued.”
F-50
Table of Contents
NOTES TO THE CONSOLIDATED FINANCIAL STATEMENTS, Continued
| 8. | Cash collateral on securities and reverse repurchase agreements: |
| (a) | The Bank provides financing to its customers through “Receivables from Repurchase Agreements and Security Borrowing”, in which the financial instrument serves as collateral. As of December 31, 2012 and 2013, the Bank has the following receivables resulting from such transactions: |
| Up to 1 month |
Over 1 month and
up to 3 month |
Over 3 months and
up to 12 months |
Over 1 year and
up to 3 years |
Over 3 years and
up to 5 years |
Over 5 years | Total | ||||||||||||||||||||||||||||||||||||||||||||||||||
|
2012
MCh$ |
2013
MCh$ |
2012
MCh$ |
2013
MCh$ |
2012
MCh$ |
2013
MCh$ |
2012
MCh$ |
2013
MCh$ |
2012
MCh$ |
2013
MCh$ |
2012
MCh$ |
2013
MCh$ |
2012
MCh$ |
2013
MCh$ |
|||||||||||||||||||||||||||||||||||||||||||
|
Instruments issued by the Chilean Governments and Central Bank |
||||||||||||||||||||||||||||||||||||||||||||||||||||||||
|
Central Bank bonds |
— | — | — | — | — | — | — | — | — | — | — | — | — | — | ||||||||||||||||||||||||||||||||||||||||||
|
Other instruments issued by the Chilean Government and Central Bank |
582 | — | — | — | — | — | — | — | — | — | — | — | 582 | — | ||||||||||||||||||||||||||||||||||||||||||
|
Other Instruments Issued in Chile |
||||||||||||||||||||||||||||||||||||||||||||||||||||||||
|
Bonds from domestic banks |
— | 8,443 | — | — | — | — | — | — | — | — | — | — | — | 8,443 | ||||||||||||||||||||||||||||||||||||||||||
|
Deposits in domestic banks |
— | 46,084 | — | — | — | — | — | — | — | — | — | — | — | 46,084 | ||||||||||||||||||||||||||||||||||||||||||
|
Other instruments issued in Chile |
7,756 | 3,902 | 855 | 12,250 | 25,907 | 11,743 | — | — | — | — | — | — | 34,518 | 27,895 | ||||||||||||||||||||||||||||||||||||||||||
|
|
|
|
|
|
|
|
|
|
|
|
|
|
|
|
|
|
|
|
|
|
|
|
|
|
|
|
|
|||||||||||||||||||||||||||||
|
Total |
8,338 | 58,429 | 855 | 12,250 | 25,907 | 11,743 | — | — | — | — | — | — | 35,100 | 82,422 | ||||||||||||||||||||||||||||||||||||||||||
|
|
|
|
|
|
|
|
|
|
|
|
|
|
|
|
|
|
|
|
|
|
|
|
|
|
|
|
|
|||||||||||||||||||||||||||||
F-51
Table of Contents
NOTES TO THE CONSOLIDATED FINANCIAL STATEMENTS, Continued
| 8. | Cash collateral on securities and reverse repurchase agreements, continued: |
| (b) | The Bank obtains financing by selling financial instruments and committing to repurchase them at future dates, plus interest at a prefixed rate. As of December 31, 2012 and 2013, the Bank has the following payables resulting from such transactions: |
| Up to 1 month |
Over 1 month and up
to 3 month |
Over 3 months
and
up to 12 months |
Over 1 year and
up
to 3 years |
Over 3 years and up
to 5 years |
Over 5 years | Total | ||||||||||||||||||||||||||||||||||||||||||||||||||
|
2012
MCh$ |
2013
MCh$ |
2012
MCh$ |
2013
MCh$ |
2012
MCh$ |
2013
MCh$ |
2012
MCh$ |
2013
MCh$ |
2012
MCh$ |
2013
MCh$ |
2012
MCh$ |
2013
MCh$ |
2012
MCh$ |
2013
MCh$ |
|||||||||||||||||||||||||||||||||||||||||||
|
Instruments issued by the Chilean Governments and Central Bank |
||||||||||||||||||||||||||||||||||||||||||||||||||||||||
|
Central Bank bonds |
— | 16,831 | — | — | — | — | — | — | — | — | — | — | — | 16,831 | ||||||||||||||||||||||||||||||||||||||||||
|
Central Bank promissory notes |
— | — | — | — | — | — | — | — | — | — | — | — | — | — | ||||||||||||||||||||||||||||||||||||||||||
|
Other instruments issued by the Chilean Government and Central Bank |
— | — | — | — | — | — | — | — | — | — | — | — | — | — | ||||||||||||||||||||||||||||||||||||||||||
|
Other Instruments Issued in Chile |
||||||||||||||||||||||||||||||||||||||||||||||||||||||||
|
Deposit promissory notes from domestic banks |
219,526 | 232,512 | 1,603 | 7,217 | — | — | — | — | — | — | — | — | 221,129 | 239,729 | ||||||||||||||||||||||||||||||||||||||||||
|
Bonds from other Chilean companies |
5,267 | 206 | — | — | — | — | — | — | — | — | — | — | 5,267 | 206 | ||||||||||||||||||||||||||||||||||||||||||
|
|
|
|
|
|
|
|
|
|
|
|
|
|
|
|
|
|
|
|
|
|
|
|
|
|
|
|
|
|||||||||||||||||||||||||||||
|
Total |
224,793 | 249,549 | 1,603 | 7,217 | — | — | — | — | — | — | — | — | 226,396 | 256,766 | ||||||||||||||||||||||||||||||||||||||||||
|
|
|
|
|
|
|
|
|
|
|
|
|
|
|
|
|
|
|
|
|
|
|
|
|
|
|
|
|
|||||||||||||||||||||||||||||
| (c) | Securities given (sales): |
The carrying amount of securities lent and of “Payables from Repurchase Agreements and Security Lending” at December 31, 2013 is Ch$255,302 million (Ch$266,395 million in 2012). The counterparty is allowed to sell or repledge those securities in the absence of default by the Bank.
| (d) | Securities received (purchases): |
As part of reverse repurchase and securities borrowing agreements the Bank has received securities that it is allowed to sell or repledge in the absence of default by the owner. At December 31, 2013 the Bank held securities with a fair value of Ch$81,830 million (Ch$34,865 million in 2012) on such terms. The Bank has an obligation to return the securities to its counterparties.
F-52
Table of Contents
NOTES TO THE CONSOLIDATED FINANCIAL STATEMENTS, Continued
| 9. | Derivative Instruments and Accounting Hedges: |
| (a) | As of December 31, 2012 and 2013, the Bank’s portfolio of derivative instruments is detailed as follows: |
| As of December 31, 2012 | ||||||||||||
|
Notional
amount
contract MCh$ |
Fair value | |||||||||||
|
Asset
MCh$ |
Liability
MCh$ |
|||||||||||
|
Derivatives held for hedging of fair value |
||||||||||||
|
Cross currency swap |
147,572 | — | 10,332 | |||||||||
|
Interest rate swap |
161,747 | — | 21,311 | |||||||||
|
|
|
|
|
|
|
|||||||
|
Total derivatives held for hedging purposes |
309,319 | — | 31,643 | |||||||||
|
Derivatives held as cash flow hedges |
||||||||||||
|
Interest rate swap and cross currency swap |
300,239 | 22 | 2,055 | |||||||||
|
|
|
|
|
|
|
|||||||
|
Total Derivatives held as cash flow hedges |
300,239 | 22 | 2,055 | |||||||||
|
Derivatives held-for-trading purposes |
||||||||||||
|
Currency forward |
10,211,593 | 66,752 | 81,790 | |||||||||
|
Cross currency swap |
4,769,597 | 177,403 | 166,182 | |||||||||
|
Interest rate swap |
11,253,780 | 81,093 | 97,870 | |||||||||
|
Call currency options |
102,725 | 472 | 395 | |||||||||
|
Put currency options |
67,277 | 341 | 387 | |||||||||
|
Others |
— | — | — | |||||||||
|
|
|
|
|
|
|
|||||||
|
Total derivatives held-for-trading purposes |
26,404,972 | 326,061 | 346,624 | |||||||||
|
|
|
|
|
|
|
|||||||
|
Total |
27,014,530 | 326,083 | 380,322 | |||||||||
|
|
|
|
|
|
|
|||||||
| As of December 31, 2013 | ||||||||||||
|
Notional
amount
contract MCh$ |
Fair value | |||||||||||
|
Asset
MCh$ |
Liability
MCh$ |
|||||||||||
|
Derivatives held for hedging of fair value |
||||||||||||
|
Cross currency swap |
128,934 | — | 14,012 | |||||||||
|
Interest rate swap |
164,526 | 714 | 11,312 | |||||||||
|
|
|
|
|
|
|
|||||||
|
Total derivatives held for hedging purposes |
293,460 | 714 | 25,324 | |||||||||
|
Derivatives held as cash flow hedges |
||||||||||||
|
Interest rate swap and cross currency swap |
882,844 | 37,971 | 6,681 | |||||||||
|
|
|
|
|
|
|
|||||||
|
Total Derivatives held as cash flow hedges |
882,844 | 37,971 | 6,681 | |||||||||
|
Derivatives held-for-trading purposes |
||||||||||||
|
Currency forward |
9,199,390 | 41,672 | 46,374 | |||||||||
|
Cross currency swap |
5,682,018 | 193,455 | 243,979 | |||||||||
|
Interest rate swap |
16,397,220 | 97,974 | 99,488 | |||||||||
|
Call currency options |
196,981 | 2,301 | 3,559 | |||||||||
|
Put currency options |
113,491 | 600 | 705 | |||||||||
|
Others |
— | — | — | |||||||||
|
|
|
|
|
|
|
|||||||
|
Total derivatives held-for-trading purposes |
31,589,100 | 336,002 | 394,105 | |||||||||
|
|
|
|
|
|
|
|||||||
|
Total |
32,765,404 | 374,687 | 426,110 | |||||||||
|
|
|
|
|
|
|
|||||||
F-53
Table of Contents
NOTES TO THE CONSOLIDATED FINANCIAL STATEMENTS, Continued
| 9. | Derivative Instruments and Accounting Hedges, continued: |
According to the adoption of IFRS 13, the Bank has made a modification to the derivatives valuation model in order to include of the Bank’s own credit risk, commonly referred as “Debit Value Adjustment” (DVA) in the valuation of derivatives. As result of this valuation model change, the Bank has recorded a gain of MCh$19,089, during the period ended December 31, 2013. As required by IFRS 13, this change was applied prospectively since January 1, 2013.
| (b) | Fair Value Hedges (notional): |
The Bank uses cross-currency swaps and interest rate swaps to hedge its exposure to changes in the fair value of the hedged elements attributable to interest rates. The aforementioned hedge instruments change the effective cost of long-term issuances from a fixed interest rate to a variable interest rate, decreasing the duration and modifying the sensitivity to the shortest segments of the curve.
Below is a detail of the hedged elements and hedge instruments under fair value hedges as of December 31, 2012 and 2013:
| As of December 31, | ||||||||
|
2012
MCh$ |
2013
MCh$ |
|||||||
|
Notional Amounts |
||||||||
|
Hedged element |
||||||||
|
Commercial loans |
147,572 | 128,934 | ||||||
|
Corporate bonds |
161,747 | 164,526 | ||||||
|
Hedge instrument |
||||||||
|
Cross currency swap |
147,572 | 128,934 | ||||||
|
Interest rate swap |
161,747 | 164,526 | ||||||
Losses for hedge ineffectiveness are recognized in income statement in an amount of MCh$89 (see note 31) in the item “Net financial operating income”.
F-54
Table of Contents
NOTES TO THE CONSOLIDATED FINANCIAL STATEMENTS, Continued
| 9. | Derivative Instruments and Accounting Hedges, continued: |
| (c) | Cash flow Hedges: |
| (c.1) | The Bank uses cross currency swaps to hedge the risk from variability of cash flows attributable to changes in the interest rates of bonds and foreign exchange of bonds issued abroad in Mexican pesos, Hong Kong dollars, Peruvian nuevo sol, Swiss franc, Japanese yen to fix rate and foreign banks obligations. The cash flows of the cross currency swaps equal the cash flows of the hedged items, which modify uncertain cash flows to known cash flows derived from a fixed interest rate. |
Additionally, these cross currency swap contracts used to hedge the risk from variability of the Unidad de Fomento (CLF) in assets flows denominated in CLF until a nominal amount equal to the portion notional of the hedging instrument CLF, whose readjustment daily impact the item “interest revenue” of the financial statements.
| (c.2) | Below are the cash flows of bonds issued abroad, the objects of these hedges and the cash flows of the asset part of the derivative: |
| 2012 | ||||||||||||||||||||||||||||
|
Up to
1
month MCh$ |
Over
1
month and up to 3 months MCh$ |
Over
3 months and up to 12 months MCh$ |
Over 1 year
and up to 3 years MCh$ |
Over 3 years
and up to 5 years MCh$ |
Over 5
years
MCh$ |
Total
MCh$ |
||||||||||||||||||||||
|
Hedge item |
||||||||||||||||||||||||||||
|
Outflows : |
||||||||||||||||||||||||||||
|
Corporate Bond MXN |
(235 | ) | (470 | ) | (2,348 | ) | (58,199 | ) | — | — | (61,252 | ) | ||||||||||||||||
|
Corporate Bond HKD |
— | — | (3,149 | ) | (6,309 | ) | (6,332 | ) | (110,408 | ) | (126,198 | ) | ||||||||||||||||
|
Corporate Bond PEN |
— | — | (1,138 | ) | (2,276 | ) | (16,358 | ) | — | (19,772 | ) | |||||||||||||||||
|
Hedge instruments |
||||||||||||||||||||||||||||
|
Inflows : |
||||||||||||||||||||||||||||
|
Cross Currency Swap MXN |
235 | 470 | 2,348 | 58,199 | — | — | 61,252 | |||||||||||||||||||||
|
Cross Currency Swap HKD |
— | — | 3,149 | 6,309 | 6,332 | 110,408 | 126,198 | |||||||||||||||||||||
|
Cross Currency Swap PEN |
— | — | 1,138 | 2,276 | 16,358 | — | 19,772 | |||||||||||||||||||||
|
|
|
|
|
|
|
|
|
|
|
|
|
|
|
|||||||||||||||
|
Net cash flow |
— | — | — | — | — | — | — | |||||||||||||||||||||
|
|
|
|
|
|
|
|
|
|
|
|
|
|
|
|||||||||||||||
F-55
Table of Contents
NOTES TO THE CONSOLIDATED FINANCIAL STATEMENTS, Continued
| 9. | Derivative Instruments and Accounting Hedges, continued: |
| (c) | Cash flow Hedges, continued: |
| 2013 | ||||||||||||||||||||||||||||
|
Up to 1
month
MCh$ |
Over 1 month
and up to 3 months MCh$ |
Over 3 months
and up to 12 months MCh$ |
Over 1 year
and up to 3 years MCh$ |
Over 3 years
and up to 5 years MCh$ |
Over 5
years
MCh$ |
Total
MCh$ |
||||||||||||||||||||||
|
Hedge item |
||||||||||||||||||||||||||||
|
Outflows : |
||||||||||||||||||||||||||||
|
Corporate Bond MXN |
(206 | ) | (619 | ) | (62,275 | ) | — | — | — | (63,100 | ) | |||||||||||||||||
|
Corporate Bond HKD |
— | — | (7,011 | ) | (14,022 | ) | (14,009 | ) | (240,224 | ) | (275,266 | ) | ||||||||||||||||
|
Corporate Bond PEN |
— | — | (578 | ) | (1,154 | ) | (14,690 | ) | — | (16,422 | ) | |||||||||||||||||
|
Corporate Bond CHF |
(216 | ) | — | (4,720 | ) | (143,070 | ) | (229,701 | ) | (105,325 | ) | (483,032 | ) | |||||||||||||||
|
Obligation USD |
(273 | ) | (82 | ) | (1,064 | ) | (135,478 | ) | — | — | (136,897 | ) | ||||||||||||||||
|
Corporate Bond JPY |
— | (76 | ) | (560 | ) | (56,964 | ) | (598 | ) | (29,173 | ) | (87,371 | ) | |||||||||||||||
|
Hedge instruments |
||||||||||||||||||||||||||||
|
Inflows : |
||||||||||||||||||||||||||||
|
Cross Currency Swap MXN |
206 | 619 | 62,275 | — | — | — | 63,100 | |||||||||||||||||||||
|
Cross Currency Swap HKD |
— | — | 7,011 | 14,022 | 14,009 | 240,224 | 275,266 | |||||||||||||||||||||
|
Cross Currency Swap PEN |
— | — | 578 | 1,154 | 14,690 | — | 16,422 | |||||||||||||||||||||
|
Cross Currency Swap CHF |
216 | — | 4,720 | 143,070 | 229,701 | 105,325 | 483,032 | |||||||||||||||||||||
|
Cross Currency Swap USD |
273 | 82 | 1,064 | 135,478 | — | — | 136,897 | |||||||||||||||||||||
|
Cross Currency Swap JPY |
— | 76 | 560 | 56,964 | 598 | 29,173 | 87,371 | |||||||||||||||||||||
|
|
|
|
|
|
|
|
|
|
|
|
|
|
|
|||||||||||||||
|
Net cash flow |
— | — | — | — | — | — | — | |||||||||||||||||||||
|
|
|
|
|
|
|
|
|
|
|
|
|
|
|
|||||||||||||||
F-56
Table of Contents
NOTES TO THE CONSOLIDATED FINANCIAL STATEMENTS, Continued
| 9. | Derivative Instruments and Accounting Hedges, continued: |
| (c) | Cash flow Hedges, continued: |
| (c.2) | Below are the cash flows of the underlying assets portfolio and the cash flow of the liability part of the derivatives: |
| 2012 | ||||||||||||||||||||||||||||
|
Up to
1
month MCh$ |
Over
1
month and up to 3 months MCh$ |
Over
3 months and up to 12 months MCh$ |
Over 1 year
and up to 3 years MCh$ |
Over 3 years
and up to 5 years MCh$ |
Over 5
years
MCh$ |
Total
MCh$ |
||||||||||||||||||||||
|
Hedge ítem |
||||||||||||||||||||||||||||
|
Inflows : |
||||||||||||||||||||||||||||
|
Cash flow in CLF |
— | — | 4,496 | 66,537 | 20,317 | 106,869 | 198,219 | |||||||||||||||||||||
|
Instrumento de cobertura |
||||||||||||||||||||||||||||
|
Outflows : |
||||||||||||||||||||||||||||
|
Cross Currency Swap CLF |
— | — | (1,644 | ) | (60,173 | ) | — | — | (61,817 | ) | ||||||||||||||||||
|
Cross Currency Swap CLF |
— | — | (2,411 | ) | (5,482 | ) | (5,498 | ) | (106,869 | ) | (120,260 | ) | ||||||||||||||||
|
Cross Currency Swap CLF |
— | — | (441 | ) | (882 | ) | (14,819 | ) | — | (16,142 | ) | |||||||||||||||||
|
|
|
|
|
|
|
|
|
|
|
|
|
|
|
|||||||||||||||
|
Net cash flow |
— | — | — | — | — | — | — | |||||||||||||||||||||
|
|
|
|
|
|
|
|
|
|
|
|
|
|
|
|||||||||||||||
F-57
Table of Contents
NOTES TO THE CONSOLIDATED FINANCIAL STATEMENTS, Continued
| 9. | Derivative Instruments and Accounting Hedges, continued: |
| (c) | Cash flow Hedges, continued: |
| 2013 | ||||||||||||||||||||||||||||
|
Up to 1
month MCh$ |
Over 1 month and
up to 3 months MCh$ |
Over 3 months and
up to 12 months MCh$ |
Over 1 year and
up to 3 years MCh$ |
Over 3 years and
up to 5 years MCh$ |
Over 5
years MCh$ |
Total
MCh$ |
||||||||||||||||||||||
|
Hedge ítem |
||||||||||||||||||||||||||||
|
Inflows : |
||||||||||||||||||||||||||||
|
Cash flow in CLF |
2,751 | 233 | 82,888 | 359,407 | 237,627 | 351,724 | 1,034,630 | |||||||||||||||||||||
|
Hedge instruments |
||||||||||||||||||||||||||||
|
Outflows : |
||||||||||||||||||||||||||||
|
Cross Currency Swap MXN |
— | — | (61,400 | ) | — | — | — | (61,400 | ) | |||||||||||||||||||
|
Cross Currency Swap HKD |
— | — | (5,791 | ) | (11,617 | ) | (11,562 | ) | (217,999 | ) | (246,969 | ) | ||||||||||||||||
|
Cross Currency Swap PEN |
— | — | (450 | ) | (898 | ) | (14,673 | ) | — | (16,021 | ) | |||||||||||||||||
|
Cross Currency Swap JPY |
— | (233 | ) | (2,099 | ) | (63,679 | ) | (1,846 | ) | (30,920 | ) | (98,777 | ) | |||||||||||||||
|
Cross Currency Swap USD |
— | — | (3,314 | ) | (133,094 | ) | — | — | (136,408 | ) | ||||||||||||||||||
|
Cross Currency Swap CHF |
(2,751 | ) | — | (9,834 | ) | (150,119 | ) | (209,546 | ) | (102,805 | ) | (475,055 | ) | |||||||||||||||
|
|
|
|
|
|
|
|
|
|
|
|
|
|
|
|||||||||||||||
|
Net cash flow |
— | — | — | — | — | — | — | |||||||||||||||||||||
|
|
|
|
|
|
|
|
|
|
|
|
|
|
|
|||||||||||||||
F-58
Table of Contents
NOTES TO THE CONSOLIDATED FINANCIAL STATEMENTS, Continued
| 9. | Derivative Instruments and Accounting Hedges, continued: |
With respect to CLF assets hedged, these are revalued monthly according to the variation of the UF, which is equivalent to monthly reinvestment of the assets until maturity of the relationship hedging.
| (c.3) | The accumulated amount of unrealized gain was an charge to equity for an amount of Ch$18,069 million (credit to equity for Ch$1,777 million in 2012) generated from hedging instruments, which has been recorded in equity. The net effect of deferred tax was a charge to equity for Ch$14,455 millions in 2013 (credit to equity for Ch$1,429 millions in 2012) |
The accumulated balance for this concept net of deferred tax as of December 31, 2013 corresponds to a credit of equity amounted Ch$13,421 million (credit to equity amounted Ch$1,034 million in 2012)
| (c.4) | The net effect in income of derivatives cash flow hedges amount to Ch$51,795 million in 2013 (charge to income for Ch$2,318 millions en 2012). |
| (c.5) | As of December 31, 2013 and 2012, it not exist inefficiency in cash flow hedge, because both, hedge item and hedge instruments are mirror one of other, it means that all variation of value attributable to rate and revaluation components are netted almost totally. |
| (c.6) | As of December 31, 2013 and 2012, the Bank has not hedges of net investments in foreign business |
F-59
Table of Contents
NOTES TO THE CONSOLIDATED FINANCIAL STATEMENTS, Continued
| 10. | Loans and Advance to Banks, net: |
| (a) | As of December 31, 2012 and 2013, these amounts are detailed as follows: |
|
2012
MCh$ |
2013
MCh$ |
|||||||
|
Domestic Banks |
||||||||
|
Interbank loans |
14,309 | 100,012 | ||||||
|
Other credits with domestic banks |
— | — | ||||||
|
Provisions for loans to domestic banks |
(5 | ) | (36 | ) | ||||
|
|
|
|
|
|||||
|
Subtotal |
14,304 | 99,976 | ||||||
|
|
|
|
|
|||||
|
Foreign Banks |
||||||||
|
Loans to foreign banks |
146,980 | 252,697 | ||||||
|
Credits with third countries |
14,509 | 97,194 | ||||||
|
Chilean export trade banks |
67,787 | 12,864 | ||||||
|
Provisions for loans to foreign banks |
(954 | ) | (1,256 | ) | ||||
|
|
|
|
|
|||||
|
Subtotal |
228,322 | 361,499 | ||||||
|
|
|
|
|
|||||
|
Central Bank of Chile |
||||||||
|
Unavailable Central Bank deposits |
1,100,000 | 600,000 | ||||||
|
Other Central Bank credits |
696 | 581 | ||||||
|
|
|
|
|
|||||
|
Subtotal |
1,100,696 | 600,581 | ||||||
|
|
|
|
|
|||||
|
Total |
1,343,322 | 1,062,056 | ||||||
|
|
|
|
|
|||||
| (b) | Provisions for loans to banks are detailed below: |
| Bank’s Location | ||||||||||||
| Detail |
Chile
MCh$ |
Abroad
MCh$ |
Total
MCh$ |
|||||||||
|
Balance as of January 1, 2011 |
— | 610 | 610 | |||||||||
|
Charge-offs |
5 | 391 | 396 | |||||||||
|
Provisions established |
— | — | — | |||||||||
|
Provisions released |
— | — | — | |||||||||
|
|
|
|
|
|
|
|||||||
|
Balance as of December 31, 2011 |
5 | 1,001 | 1,006 | |||||||||
|
|
|
|
|
|
|
|||||||
|
Charge-offs |
— | — | — | |||||||||
|
Provisions established |
— | — | — | |||||||||
|
Provisions released |
— | (47 | ) | (47 | ) | |||||||
|
Impairment |
— | — | — | |||||||||
|
|
|
|
|
|
|
|||||||
|
Balance as of December 31, 2012 |
5 | 954 | 959 | |||||||||
|
|
|
|
|
|
|
|||||||
|
Charge-offs |
||||||||||||
|
Provisions established |
— | — | — | |||||||||
|
Provisions released |
31 | 302 | 333 | |||||||||
|
|
|
|
|
|
|
|||||||
|
Balance as of December 31, 2013 |
36 | 1,256 | 1,292 | |||||||||
|
|
|
|
|
|
|
|||||||
F-60
Table of Contents
NOTES TO THE CONSOLIDATED FINANCIAL STATEMENTS, Continued
| 11. | Loans to Customers, net: |
| (a) | Loans to Customers: |
As of December 31, 2011, 2012 and 2013, the composition of our portfolio of loans is the following:
| As of December 31, 2011 | ||||||||||||||||||||||||||||||||
| Assets before Allowances | Allowances established | |||||||||||||||||||||||||||||||
|
Normal Portfolio
MCh$ |
Substandard
Portfolio MCh$ |
Non-Complying
Portfolio MCh$ |
Total
MCh$ |
Individual
Provision MCh$ |
Group Provision
MCh$ |
MCh$ |
Net assets
MCh$ |
|||||||||||||||||||||||||
|
Commercial loans |
||||||||||||||||||||||||||||||||
|
Commercial loans |
7,631,863 | 35,934 | 204,749 | 7,872,546 | (63,846 | ) | (57,420 | ) | (121,266 | ) | 7,751,280 | |||||||||||||||||||||
|
Foreign trade loans |
1,435,038 | 7,379 | 66,730 | 1,509,147 | (58,458 | ) | (504 | ) | (58,962 | ) | 1,450,185 | |||||||||||||||||||||
|
Current account debtors |
211,276 | 1,451 | 1,752 | 214,479 | (2,178 | ) | (2,074 | ) | (4,252 | ) | 210,227 | |||||||||||||||||||||
|
Factoring transactions |
588,958 | — | 140 | 589,098 | (4,499 | ) | (613 | ) | (5,112 | ) | 583,986 | |||||||||||||||||||||
|
Commercial lease transactions (1) |
965,845 | 9,209 | 21,512 | 996,566 | (9,275 | ) | (7,105 | ) | (16,380 | ) | 980,186 | |||||||||||||||||||||
|
Other loans and accounts receivable |
27,367 | 66 | 4,174 | 31,607 | (372 | ) | (1,905 | ) | (2,277 | ) | 29,330 | |||||||||||||||||||||
|
|
|
|
|
|
|
|
|
|
|
|
|
|
|
|
|
|||||||||||||||||
|
Subtotal |
10,860,347 | 54,039 | 299,057 | 11,213,443 | (138,628 | ) | (69,621 | ) | (208,249 | ) | 11,005,194 | |||||||||||||||||||||
|
|
|
|
|
|
|
|
|
|
|
|
|
|
|
|
|
|||||||||||||||||
|
Mortgage loans |
||||||||||||||||||||||||||||||||
|
Mortgage bonds (2) |
123,797 | — | 10,580 | 134,377 | — | (871 | ) | (871 | ) | 133,506 | ||||||||||||||||||||||
|
Transferable mortgage loans |
169,424 | — | 5,834 | 175,258 | — | (881 | ) | (881 | ) | 174,377 | ||||||||||||||||||||||
|
Other residential real estate mortgage loans |
3,250,235 | — | 47,096 | 3,297,331 | — | (14,151 | ) | (14,151 | ) | 3,283,180 | ||||||||||||||||||||||
|
Credits from ANAP |
— | — | — | — | — | — | — | — | ||||||||||||||||||||||||
|
Other loans and accounts receivable |
64 | — | 404 | 468 | — | (1 | ) | (1 | ) | 467 | ||||||||||||||||||||||
|
|
|
|
|
|
|
|
|
|
|
|
|
|
|
|
|
|||||||||||||||||
|
Subtotal |
3,543,520 | — | 63,914 | 3,607,434 | — | (15,904 | ) | (15,904 | ) | 3,591,530 | ||||||||||||||||||||||
|
|
|
|
|
|
|
|
|
|
|
|
|
|
|
|
|
|||||||||||||||||
|
Consumer loans |
||||||||||||||||||||||||||||||||
|
Consumer loans in installments |
1,661,799 | — | 101,302 | 1,763,101 | — | (110,190 | ) | (110,190 | ) | 1,652,911 | ||||||||||||||||||||||
|
Current account debtors |
223,871 | — | 9,101 | 232,972 | — | (5,806 | ) | (5,806 | ) | 227,166 | ||||||||||||||||||||||
|
Credit card debtors |
553,574 | — | 15,716 | 569,290 | — | (22,570 | ) | (22,570 | ) | 546,720 | ||||||||||||||||||||||
|
Other loans and accounts receivable |
251 | — | 6 | 257 | — | (22 | ) | (22 | ) | 235 | ||||||||||||||||||||||
|
|
|
|
|
|
|
|
|
|
|
|
|
|
|
|
|
|||||||||||||||||
|
Subtotal |
2,439,495 | — | 126,125 | 2,565,620 | — | (138,588 | ) | (138,588 | ) | 2,427,032 | ||||||||||||||||||||||
|
|
|
|
|
|
|
|
|
|
|
|
|
|
|
|
|
|||||||||||||||||
|
Total |
16,843,362 | 54,039 | 489,096 | 17,386,497 | (138,628 | ) | (224,113 | ) | (362,741 | ) | 17,023,756 | |||||||||||||||||||||
|
|
|
|
|
|
|
|
|
|
|
|
|
|
|
|
|
|||||||||||||||||
| (1) | In this item, the Bank finances its customers’ purchases of assets, including real estate and other personal property, through finance lease agreements. As of December 31, 2011, MCh$395,600 corresponds to finance leases for real estate and MCh$600,966 corresponds to finance leases for other assets. |
| (2) | For mortgage bonds that finance residential mortgage loans, the Bank is solely responsible for the payment of that obligation to the mortgage bond holders, regardless of the payment behavior of the residential mortgage borrower. Accordingly, none of our residential mortgage loans serves as a guarantee or collateral for our mortgage bonds. |
F-61
Table of Contents
NOTES TO THE CONSOLIDATED FINANCIAL STATEMENTS, Continued
| 11. | Loans to Customers, net, continued: |
| (a) | Loans to Customers, continued: |
| As of December 31, 2012 | ||||||||||||||||||||||||||||||||
| Assets before Allowances | Allowances established | |||||||||||||||||||||||||||||||
|
Normal
Portfolio MCh$ |
Substandard
Portfolio MCh$ |
Non-Complying
Portfolio MCh$ |
Total
MCh$ |
Individual
Provision MCh$ |
Group
Provision MCh$ |
MCh$ |
Net assets
MCh$ |
|||||||||||||||||||||||||
|
Commercial loans |
||||||||||||||||||||||||||||||||
|
Commercial loans |
8,185,070 | 112,509 | 247,381 | 8,544,960 | (53,952 | ) | (67,746 | ) | (121,698 | ) | 8,423,262 | |||||||||||||||||||||
|
Foreign trade loans |
1,134,137 | 58,728 | 48,090 | 1,240,955 | (55,216 | ) | (491 | ) | (55,707 | ) | 1,185,248 | |||||||||||||||||||||
|
Current account debtors |
181,709 | 5,266 | 2,424 | 189,399 | (2,418 | ) | (2,504 | ) | (4,922 | ) | 184,477 | |||||||||||||||||||||
|
Factoring transactions |
596,916 | 1,291 | 7,930 | 606,137 | (9,535 | ) | (556 | ) | (10,091 | ) | 596,046 | |||||||||||||||||||||
|
Commercial lease transactions (1) |
1,061,740 | 26,317 | 25,215 | 1,113,272 | (3,528 | ) | (9,136 | ) | (12,664 | ) | 1,100,608 | |||||||||||||||||||||
|
Other loans and accounts receivable |
36,641 | 260 | 3,746 | 40,647 | (620 | ) | (1,974 | ) | (2,594 | ) | 38,053 | |||||||||||||||||||||
|
|
|
|
|
|
|
|
|
|
|
|
|
|
|
|
|
|||||||||||||||||
|
Subtotal |
11,196,213 | 204,371 | 334,786 | 11,735,370 | (125,269 | ) | (82,407 | ) | (207,676 | ) | 11,527,694 | |||||||||||||||||||||
|
|
|
|
|
|
|
|
|
|
|
|
|
|
|
|
|
|||||||||||||||||
|
Mortgage loans |
||||||||||||||||||||||||||||||||
|
Mortgage bonds (2) |
103,169 | — | 6,046 | 109,215 | — | (724 | ) | (724 | ) | 108,491 | ||||||||||||||||||||||
|
Transferable mortgage loans |
148,216 | — | 2,990 | 151,206 | — | (527 | ) | (527 | ) | 150,679 | ||||||||||||||||||||||
|
Other residential real estate mortgage loans |
3,897,399 | — | 40,367 | 3,937,766 | — | (14,829 | ) | (14,829 | ) | 3,922,937 | ||||||||||||||||||||||
|
Credits from ANAP |
27 | — | — | 27 | — | — | — | 27 | ||||||||||||||||||||||||
|
Other loans and accounts receivable |
453 | — | — | 453 | — | — | — | 453 | ||||||||||||||||||||||||
|
|
|
|
|
|
|
|
|
|
|
|
|
|
|
|
|
|||||||||||||||||
|
Subtotal |
4,149,264 | — | 49,403 | 4,198,667 | — | (16,080 | ) | (16,080 | ) | 4,182,587 | ||||||||||||||||||||||
|
|
|
|
|
|
|
|
|
|
|
|
|
|
|
|
|
|||||||||||||||||
|
Consumer loans |
||||||||||||||||||||||||||||||||
|
Consumer loans in installments |
1,761,070 | — | 151,413 | 1,912,483 | — | (124,886 | ) | (124,886 | ) | 1,787,597 | ||||||||||||||||||||||
|
Current account debtors |
235,122 | — | 9,944 | 245,066 | — | (6,950 | ) | (6,950 | ) | 238,116 | ||||||||||||||||||||||
|
Credit card debtors |
654,976 | — | 25,010 | 679,986 | — | (31,996 | ) | (31,996 | ) | 647,990 | ||||||||||||||||||||||
|
Other loans and accounts receivable |
183 | — | 6 | 189 | — | (215 | ) | (215 | ) | (26 | ) | |||||||||||||||||||||
|
|
|
|
|
|
|
|
|
|
|
|
|
|
|
|
|
|||||||||||||||||
|
Subtotal |
2,651,351 | — | 186,373 | 2,837,724 | — | (164,047 | ) | (164,047 | ) | 2,673,677 | ||||||||||||||||||||||
|
|
|
|
|
|
|
|
|
|
|
|
|
|
|
|
|
|||||||||||||||||
|
Total |
17,996,828 | 204,371 | 570,562 | 18,771,761 | (125,269 | ) | (262,534 | ) | (387,803 | ) | 18,383,958 | |||||||||||||||||||||
|
|
|
|
|
|
|
|
|
|
|
|
|
|
|
|
|
|||||||||||||||||
| (1) | In this item, the Bank finances its customers purchases of assets, including real estate and other personal property, through finance lease agreements. As of December 31, 2012, MCh$451,647 corresponds to finance leases for real estate and MCh$661,625 corresponds to finance leases for other assets. |
| (2) | For mortgage bonds that finance residential mortgage loans, the Bank is solely responsible for the payment of that obligation to the mortgage bond holders, regardless of the payment behavior of the residential mortgage borrower. Accordingly, none of our residential mortgage loans serves as a guarantee or collateral for our mortgage bonds. |
F-62
Table of Contents
NOTES TO THE CONSOLIDATED FINANCIAL STATEMENTS, Continued
| 11. | Loans to Customers, net, continued: |
| (a) | Loans to Customers, continued: |
| As of December 31, 2013 | ||||||||||||||||||||||||||||||||
|
Assets before
Allowances |
Allowances
established |
|||||||||||||||||||||||||||||||
|
Normal
Portfolio MCh$ |
Substandard
Portfolio MCh$ |
Non-Complying
Portfolio MCh$ |
Total
MCh$ |
Individual
Provision MCh$ |
Group
Provision MCh$ |
MCh$ |
Net assets
MCh$ |
|||||||||||||||||||||||||
|
Commercial loans |
||||||||||||||||||||||||||||||||
|
Commercial loans |
9,501,587 | 117,958 | 271,713 | 9,891,258 | (49,706 | ) | (86,529 | ) | (136,235 | ) | 9,755,023 | |||||||||||||||||||||
|
Foreign trade loans |
1,027,507 | 73,090 | 54,084 | 1,154,681 | (68,272 | ) | (642 | ) | (68,914 | ) | 1,085,767 | |||||||||||||||||||||
|
Current account debtors |
253,198 | 3,160 | 2,931 | 259,289 | (3,031 | ) | (3,332 | ) | (6,363 | ) | 252,926 | |||||||||||||||||||||
|
Factoring transactions |
520,776 | 2,538 | 745 | 524,059 | (9,570 | ) | (822 | ) | (10,392 | ) | 513,667 | |||||||||||||||||||||
|
Commercial lease transactions (1) |
1,156,350 | 27,394 | 26,003 | 1,209,747 | (5,265 | ) | (10,224 | ) | (15,489 | ) | 1,194,258 | |||||||||||||||||||||
|
Other loans and accounts receivable |
34,621 | 307 | 5,011 | 39,939 | (762 | ) | (3,287 | ) | (4,049 | ) | 35,890 | |||||||||||||||||||||
|
|
|
|
|
|
|
|
|
|
|
|
|
|
|
|
|
|||||||||||||||||
|
Subtotal |
12,494,039 | 224,447 | 360,487 | 13,078,973 | (136,606 | ) | (104,836 | ) | (241,442 | ) | 12,837,531 | |||||||||||||||||||||
|
|
|
|
|
|
|
|
|
|
|
|
|
|
|
|
|
|||||||||||||||||
|
Mortgage loans |
||||||||||||||||||||||||||||||||
|
Mortgage bonds (2) |
81,704 | — | 5,650 | 87,354 | — | (220 | ) | (220 | ) | 87,134 | ||||||||||||||||||||||
|
Transferable mortgage loans |
120,584 | — | 2,321 | 122,905 | — | (285 | ) | (285 | ) | 122,620 | ||||||||||||||||||||||
|
Other residential real estate mortgage loans |
4,455,510 | — | 61,312 | 4,516,822 | — | (17,997 | ) | (17,997 | ) | 4,498,825 | ||||||||||||||||||||||
|
Credits from ANAP |
24 | — | — | 24 | — | — | — | 24 | ||||||||||||||||||||||||
|
Other loans and accounts receivable |
5,155 | — | 47 | 5,202 | — | — | — | 5,202 | ||||||||||||||||||||||||
|
|
|
|
|
|
|
|
|
|
|
|
|
|
|
|
|
|||||||||||||||||
|
Subtotal |
4,662,977 | — | 69,330 | 4,732,307 | — | (18,502 | ) | (18,502 | ) | 4,713,805 | ||||||||||||||||||||||
|
|
|
|
|
|
|
|
|
|
|
|
|
|
|
|
|
|||||||||||||||||
|
Consumer loans |
||||||||||||||||||||||||||||||||
|
Consumer loans in installments |
1,865,945 | — | 178,010 | 2,043,955 | — | (139,536 | ) | (139,536 | ) | 1,904,419 | ||||||||||||||||||||||
|
Current account debtors |
231,493 | — | 9,459 | 240,952 | — | (7,844 | ) | (7,844 | ) | 233,108 | ||||||||||||||||||||||
|
Credit card debtors |
758,742 | — | 25,040 | 783,782 | — | (31,666 | ) | (31,666 | ) | 752,116 | ||||||||||||||||||||||
|
Other loans and accounts receivable |
185 | — | 616 | 801 | — | (308 | ) | (308 | ) | 493 | ||||||||||||||||||||||
|
|
|
|
|
|
|
|
|
|
|
|
|
|
|
|
|
|||||||||||||||||
|
Subtotal |
2,856,365 | — | 213,125 | 3,069,490 | — | (179,354 | ) | (179,354 | ) | 2,890,136 | ||||||||||||||||||||||
|
|
|
|
|
|
|
|
|
|
|
|
|
|
|
|
|
|||||||||||||||||
|
Total |
20,013,381 | 224,447 | 642,942 | 20,880,770 | (136,606 | ) | (302,692 | ) | (439,298 | ) | 20,441,472 | |||||||||||||||||||||
|
|
|
|
|
|
|
|
|
|
|
|
|
|
|
|
|
|||||||||||||||||
| (1) | In this item, the Bank finances its customers purchases of assets, including real estate and other personal property, through finance lease agreements. As of December 31, 2013, MCh$503,972 corresponds to finance leases for real estate and MCh$705,775 corresponds to finance leases for other assets. |
| (2) | For mortgage bonds that finance residential mortgage loans, the Bank is solely responsible for the payment of that obligation to the mortgage bond holders, regardless of the payment behavior of the residential mortgage borrower. Accordingly, none of our residential mortgage loans serves as a guarantee or collateral for our mortgage bonds. |
F-63
Table of Contents
NOTES TO THE CONSOLIDATED FINANCIAL STATEMENTS, Continued
| 11. | Loans to Customers, net, continued: |
| (b) | Allowances for loan losses |
Movements in allowances for loan losses during 2011, 2012 and 2013 are as follows:
| Allowances | ||||||||||||
|
Individual
MCh$ |
Group
MCh$ |
Total
MCh$ |
||||||||||
|
Balance as of January 1, 2011 |
153,481 | 194,546 | 348,027 | |||||||||
|
Charge-offs: |
||||||||||||
|
Commercial loans |
(51,498 | ) | (30,588 | ) | (82,086 | ) | ||||||
|
Mortgage loans |
— | (2,923 | ) | (2,923 | ) | |||||||
|
Consumer loans |
— | (92,951 | ) | (92,951 | ) | |||||||
|
|
|
|
|
|
|
|||||||
|
Total charge-offs |
(51,498 | ) | (126,462 | ) | (177,960 | ) | ||||||
|
Allowances established |
51,160 | 156,029 | 207,189 | |||||||||
|
Allowances released |
(14,515 | ) | — | (14,515 | ) | |||||||
|
|
|
|
|
|
|
|||||||
|
Balance as of December 31, 2011 |
138,628 | 224,113 | 362,741 | |||||||||
|
|
|
|
|
|
|
|||||||
|
Balance as of January 1, 2012 |
138,628 | 224,113 | 362,741 | |||||||||
|
Charge-offs: |
||||||||||||
|
Commercial loans |
(9,144 | ) | (34,020 | ) | (43,164 | ) | ||||||
|
Mortgage loans |
— | (4,253 | ) | (4,253 | ) | |||||||
|
Consumer loans |
— | (135,316 | ) | (135,316 | ) | |||||||
|
|
|
|
|
|
|
|||||||
|
Total charge-offs |
(9,144 | ) | (173,589 | ) | (182,733 | ) | ||||||
|
Allowances established |
13,668 | 212,010 | 225,678 | |||||||||
|
Allowances released |
(17,883 | ) | — | (17,883 | ) | |||||||
|
|
|
|
|
|
|
|||||||
|
Balance as of December 31, 2012 |
125,269 | 262,534 | 387,803 | |||||||||
|
|
|
|
|
|
|
|||||||
|
Balance as of January 1, 2013 |
125,269 | 262,534 | 387,803 | |||||||||
|
Charge-offs: |
||||||||||||
|
Commercial loans |
(8,648 | ) | (27,381 | ) | (36,029 | ) | ||||||
|
Mortgage loans |
— | (3,242 | ) | (3,242 | ) | |||||||
|
Consumer loans |
— | (157,264 | ) | (157,264 | ) | |||||||
|
|
|
|
|
|
|
|||||||
|
Total charge-offs |
(8,648 | ) | (187,887 | ) | (196,535 | ) | ||||||
|
Debt exchange |
(12,556 | ) | — | (12,556 | ) | |||||||
|
Allowances established |
34,668 | 228,045 | 262,713 | |||||||||
|
Allowances released |
(2,127 | ) | — | (2,127 | ) | |||||||
|
|
|
|
|
|
|
|||||||
|
Balance as of December 31, 2013 |
136,606 | 302,692 | 439,298 | |||||||||
|
|
|
|
|
|
|
|||||||
F-64
Table of Contents
NOTES TO THE CONSOLIDATED FINANCIAL STATEMENTS, Continued
| 11. | Loans to Customers, net, continued: |
| (c) | During 2012 and 2013, the Bank and its subsidiaries presented the following allowance for loan losses associated with impaired loans and with non-impaired loans: |
| As of December 31, | ||||||||
|
2012
MCh$ |
2013
MCh$ |
|||||||
|
Individual impaired |
76,373 | 94,806 | ||||||
|
Group impaired |
134,782 | 163,688 | ||||||
|
|
|
|
|
|||||
|
Allowances for impaired loans (*) |
211,155 | 258,494 | ||||||
|
Provision for not yet identified but incurred impairment |
176,648 | 180,804 | ||||||
|
|
|
|
|
|||||
|
Total allowances for loan losses |
387,803 | 439,298 | ||||||
|
|
|
|
|
|||||
| (*) |
Includes allowances related to individual and group impaired portfolios. Notes 11(a) and 11(b) include total allowance amounts from impaired and non-impaired portfolios |
| (d) | Finance Lease Contracts: |
The Bank’s scheduled cash flows to be received from finance leasing contracts have the following maturities:
| Total receivable | Unearned income | Net lease receivable (*) | ||||||||||||||||||||||
|
2012
MCh$ |
2013
MCh$ |
2012
MCh$ |
2013
MCh$ |
2012
MCh$ |
2013
MCh$ |
|||||||||||||||||||
|
Due within one year |
394,284 | 435,789 | (50,643 | ) | (53,920 | ) | 343,641 | 381,869 | ||||||||||||||||
|
Due after 1 year but within 2 years |
293,525 | 314,546 | (36,615 | ) | (39,405 | ) | 256,910 | 275,141 | ||||||||||||||||
|
Due after 2 years but within 3 years |
189,111 | 197,979 | (23,440 | ) | (25,097 | ) | 165,671 | 172,882 | ||||||||||||||||
|
Due after 3 years but within 4 years |
112,381 | 121,241 | (15,766 | ) | (16,987 | ) | 96,615 | 104,254 | ||||||||||||||||
|
Due after 4 years but within 5 years |
75,451 | 78,992 | (11,339 | ) | (12,663 | ) | 64,112 | 66,329 | ||||||||||||||||
|
Due after 5 years |
206,025 | 232,607 | (25,733 | ) | (29,879 | ) | 180,292 | 202,728 | ||||||||||||||||
|
|
|
|
|
|
|
|
|
|
|
|
|
|||||||||||||
|
Total |
1,270,777 | 1,381,154 | (163,536 | ) | (177,951 | ) | 1,107,241 | 1,203,203 | ||||||||||||||||
|
|
|
|
|
|
|
|
|
|
|
|
|
|||||||||||||
| (*) |
The net balance receivable does not include past-due portfolio totaling MCh$6,031 and MCh$6,544 as of December 31, 2012 and 2013, respectively. |
The leasing contracts are related to real estate, industrial machinery, vehicles and computer equipment. The leasing contracts have an average life of between 3 and 8 years.
F-65
Table of Contents
NOTES TO THE CONSOLIDATED FINANCIAL STATEMENTS, Continued
| 11. | Loans to Customers, net, continued: |
| (e) | Loans by industry sector: |
The following table details the Bank’s loan portfolio (before allowances for loans losses) as of December 31, 2012 and 2013 by the customer’s industry sector:
| Location | ||||||||||||||||||||||||||||||||
| Chile | Abroad | Total | ||||||||||||||||||||||||||||||
|
2012
MCh$ |
2013
MCh$ |
2012
MCh$ |
2013
MCh$ |
2012
MCh$ |
% |
2013
MCh$ |
% | |||||||||||||||||||||||||
|
Commercial loans: |
||||||||||||||||||||||||||||||||
|
Commerce |
2,296,496 | 2,524,546 | 28,173 | 39,677 | 2,324,669 | 12.38 | 2,564,223 | 12.28 | ||||||||||||||||||||||||
|
Transportation |
1,470,358 | 1,602,348 | — | — | 1,470,358 | 7.83 | 1,602,348 | 7.67 | ||||||||||||||||||||||||
|
Manufacturing |
1,380,994 | 1,365,562 | — | — | 1,380,994 | 7.36 | 1,365,562 | 6.54 | ||||||||||||||||||||||||
|
Services |
1,310,573 | 1,240,028 | — | — | 1,310,573 | 6.98 | 1,240,028 | 5.94 | ||||||||||||||||||||||||
|
Construction |
1,252,546 | 1,457,770 | — | 311 | 1,252,546 | 6.67 | 1,458,081 | 6.98 | ||||||||||||||||||||||||
|
Financial Services |
1,148,094 | 1,627,844 | 706,477 | 415,345 | 1,854,571 | 9.88 | 2,043,189 | 9.79 | ||||||||||||||||||||||||
|
Agriculture and livestock |
901,300 | 914,105 | — | — | 901,300 | 4.80 | 914,105 | 4.38 | ||||||||||||||||||||||||
|
Electricity, gas and water |
328,763 | 504,088 | — | 27,885 | 328,763 | 1.75 | 531,973 | 2.55 | ||||||||||||||||||||||||
|
Mining |
305,386 | 340,045 | 67,051 | — | 372,437 | 1.98 | 340,045 | 1.63 | ||||||||||||||||||||||||
|
Fishing |
233,893 | 219,173 | — | — | 233,893 | 1.25 | 219,173 | 1.05 | ||||||||||||||||||||||||
|
Other |
226,999 | 790,290 | 84,477 | 18,750 | 311,476 | 1.67 | 809,040 | 3.87 | ||||||||||||||||||||||||
|
|
|
|
|
|
|
|
|
|
|
|
|
|
|
|
|
|||||||||||||||||
|
Subtotal |
10,855,402 | 12,585,799 | 886,178 | 501,968 | 11,741,580 | 62.55 | 13,087,767 | 62.68 | ||||||||||||||||||||||||
|
|
|
|
|
|
|
|
|
|
|
|
|
|
|
|
|
|||||||||||||||||
|
Residential mortgage loans |
4,198,667 | 4,732,307 | — | — | 4,198,667 | 22.37 | 4,732,307 | 22.66 | ||||||||||||||||||||||||
|
Consumer loans |
2,831,514 | 3,060,696 | — | — | 2,831,514 | 15.08 | 3,060,696 | 14.66 | ||||||||||||||||||||||||
|
|
|
|
|
|
|
|
|
|
|
|
|
|
|
|
|
|||||||||||||||||
|
Total |
17,885,583 | 20,378,802 | 886,178 | 501,968 | 18,771,761 | 100.00 | 20,880,770 | 100.00 | ||||||||||||||||||||||||
|
|
|
|
|
|
|
|
|
|
|
|
|
|
|
|
|
|||||||||||||||||
F-66
Table of Contents
NOTES TO THE CONSOLIDATED FINANCIAL STATEMENTS, Continued
| 12. | Financial Assets Available-for-sale: |
As of December 31, 2012 and 2013, investment securities classified as available-for-sale are detailed as follows:
|
2012
MCh$ |
2013
MCh$ |
|||||||
|
Instruments issued by the Chilean Government and Central Bank: |
||||||||
|
Bonds issued by the Chilean Government and Central Bank |
110,569 | 333,035 | ||||||
|
Promissory notes issued by the Chilean Government and Central Bank |
969 | 50,415 | ||||||
|
Other instruments |
140,246 | 202,958 | ||||||
|
Other instruments issued in Chile: |
||||||||
|
Equity instruments valued at cost |
613 | 352 | ||||||
|
Equity instruments valued at fair value |
7,263 | 7,827 | ||||||
|
Mortgage bonds from domestic banks |
85,688 | 96,933 | ||||||
|
Bonds from domestic banks |
116,100 | 128,500 | ||||||
|
Deposits from domestic banks |
560,390 | 617,816 | ||||||
|
Bonds from other Chilean companies |
32,281 | 13,558 | ||||||
|
Promissory notes issued by other Chilean companies |
— | — | ||||||
|
Other instruments |
129,693 | 154,267 | ||||||
|
Instruments issued by foreign institutions: |
||||||||
|
Other instruments issued abroad |
88,504 | 76,222 | ||||||
|
|
|
|
|
|||||
|
Total |
1,272,316 | 1,681,883 | ||||||
|
|
|
|
|
|||||
Instruments issued by the Chilean Government and Central Bank include instruments with agreements to repurchase sold to clients and financial institutions, totaling MCh$16,840 as of December 31, 2013 (there were no changes for this item as of December 31, 2012). The agreements to repurchase have an average maturity of 3 days as of December 31, 2013.
Under classification of Other instruments issued in Chile are included securities sold under repurchase agreements to customers and financial institutions for an amount of MCh$109 million (MCh$5,266 million in 2012).
In instruments issued abroad are include mainly bonds banks and shares.
As of December 31, 2013, the portfolio of financial assets available-for-sale includes a net unrealized gain of MCh$36,443 (MCh$24,829 in 2012), recorded in other comprehensive income within equity.
The equity investments values at cost represent shares of exchange houses and servicing companies that the Bank is obliged to hold in order to benefit from these services. There is no active market for these shares and their fair value cannot be measured reliably. However, the difference between cost and fair value is not expected to be significant.
During 2012 and 2013, there was no evidence of impairment of financial assets available-for-sale.
As of December 31, 2012 and 2013, the Bank and its subsidiaries do not hold financial assets held-to-maturity.
F-67
Table of Contents
NOTES TO THE CONSOLIDATED FINANCIAL STATEMENTS, Continued
| 12. | Financial Assets Available-for-sale, continued: |
Realized profits and losses are calculated as the proceeds from sales less the cost (specific identification method) of the investments identified as for sale. In addition, any unrealized profit or loss previously recorded in equity for these investments is reversed when recorded in the income statements.
The gross gains (loss) realized in sale of financial assets available-for-sale, as of December 31, 2012 and 2013, is recorded in the item “Net financial operating income” (Note 31).
Gross profits and losses realized and unrealized on the sale of available for sale investments for the periods ended December 31, 2011, 2012 and 2013 are as follows:
|
2011
MCh$ |
2012
MCh$ |
2013
MCh$ |
||||||||||
|
Net gain (loss) on available for sale before income tax (1) |
(9,484 | ) | 30,127 | 14,518 | ||||||||
|
Tax (expense) benefit (2) |
1,866 | (5,994 | ) | (2,904 | ) | |||||||
|
|
|
|
|
|
|
|||||||
|
Net of tax amount (3) |
(7,618 | ) | 24,133 | 11,614 | ||||||||
|
|
|
|
|
|
|
|||||||
| (1) | These amounts do not included realized gain or loss recorded under item “Net financial operating income”. As of December 31, 2011, 2012 and 2013 these amounts are MCh$932, MCh$(1,749) and MCh$(11,751), respectively. |
| (2) | This amount corresponds to the deferred taxes of the unrealized gain or loss and which are included in Note 17(d). |
| (3) | This amount corresponds to the unrealized gain or loss, net of deferred tax and which are included in “Consolidated Statement of Changes in Equity”. |
F-68
Table of Contents
NOTES TO THE CONSOLIDATED FINANCIAL STATEMENTS, Continued
| 13. | Investments in Other Companies: |
| (a) | This item includes investments in other companies for an amount of MCh$11,674 and MCh$14,407 as of December 31, 2012 and 2013, respectively, which is detailed as follows: |
| Investment | ||||||||||||||||||||||||||||||||||||||
| Ownership Interest | Equity | Book Value | Income (Loss) | |||||||||||||||||||||||||||||||||||
|
Company |
Shareholder |
2012
% |
2013
% |
2012
MCh$ |
2013
MCh$ |
2012
MCh$ |
2013
MCh$ |
2011
MCh$ |
2012
MCh$ |
2013
MCh$ |
||||||||||||||||||||||||||||
|
Associates |
||||||||||||||||||||||||||||||||||||||
|
Administrador Financiero del Transantiago S.A. |
Banco de Chile | 20.00 | 20.00 | 6,076 | 9,737 | 1,215 | 1,948 | 967 | (527 | ) | 733 | |||||||||||||||||||||||||||
|
Soc. Operadora de Tarjetas de Crédito Nexus S.A. |
Banco de Chile | 25.81 | 25.81 | 6,412 | 7,197 | 1,655 | 1,858 | 300 | 556 | 289 | ||||||||||||||||||||||||||||
|
Redbanc S.A. |
Banco de Chile | 38.13 | 38.13 | 4,109 | 4,401 | 1,567 | 1,678 | 492 | (376 | ) | 159 | |||||||||||||||||||||||||||
|
Sociedad Imerc OTC S.A. |
Banco de Chile | — | 12.49 | — | 11,411 | — | 1,425 | — | — | (18 | ) | |||||||||||||||||||||||||||
|
Transbank S.A. |
Banco de Chile | 26.16 | 26.16 | 6,306 | 5,232 | 1,649 | 1,368 | 313 | 322 | 9 | ||||||||||||||||||||||||||||
|
Soc. Operadora de la Cámara de Compensación de Pagos de Alto Valor S.A. |
Banco de Chile | 15.00 | 15.00 | 4,337 | 4,529 | 651 | 679 | 102 | 112 | 62 | ||||||||||||||||||||||||||||
|
Centro de Compensación Automatizado S.A. |
Banco de Chile | 33.33 | 33.33 | 1,609 | 1,982 | 536 | 661 | 105 | 115 | 125 | ||||||||||||||||||||||||||||
|
Sociedad Interbancaria de Depósitos de Valores S.A. |
Banco de Chile | 26.81 | 26.81 | 1,711 | 1,978 | 459 | 530 | 92 | 79 | 102 | ||||||||||||||||||||||||||||
|
|
|
|
|
|
|
|
|
|
|
|
|
|
|
|||||||||||||||||||||||||
|
Subtotal Associates |
30,560 | 46,467 | 7,732 | 10,147 | 2,371 | 281 | 1,461 | |||||||||||||||||||||||||||||||
|
|
|
|
|
|
|
|
|
|
|
|
|
|
|
|||||||||||||||||||||||||
|
Joint Ventures |
||||||||||||||||||||||||||||||||||||||
|
Servipag Ltda. |
Banco de Chile | 50.00 | 50.00 | 6,756 | 7,180 | 3,378 | 3,590 | 611 | (321 | ) | 213 | |||||||||||||||||||||||||||
|
Artikos Chile S.A. |
Banco de Chile | 50.00 | 50.00 | 1,129 | 1,341 | 564 | 670 | 72 | (428 | ) | 106 | |||||||||||||||||||||||||||
|
|
|
|
|
|
|
|
|
|
|
|
|
|
|
|||||||||||||||||||||||||
|
Subtotal Joint Ventures |
7,885 | 8,521 | 3,942 | 4,260 | 683 | (749 | ) | 319 | ||||||||||||||||||||||||||||||
|
|
|
|
|
|
|
|
|
|
|
|
|
|
|
|||||||||||||||||||||||||
|
Total |
38,445 | 54,988 | 11,674 | 14,407 | 3,054 | (468 | ) | 1,780 | ||||||||||||||||||||||||||||||
|
|
|
|
|
|
|
|
|
|
|
|
|
|
|
|||||||||||||||||||||||||
F-69
Table of Contents
NOTES TO THE CONSOLIDATED FINANCIAL STATEMENTS, Continued
| 13. | Investments in Other Companies, continued: |
| (b) | The total carrying amount of the Bank’s associates is explained as follows: |
|
2012
MCh$ |
2013
MCh$ |
|||||||
|
Associate’s statement of financial position |
||||||||
|
Current assets |
383,155 | 537,515 | ||||||
|
Non-current assets |
53,946 | 64,904 | ||||||
|
|
|
|
|
|||||
|
Total assets |
437,101 | 602,419 | ||||||
|
Current liabilities |
397,540 | 550,023 | ||||||
|
Non-current liabilities |
9,001 | 5,919 | ||||||
|
|
|
|
|
|||||
|
Total liabilities |
406,541 | 555,942 | ||||||
|
Equity |
30,560 | 46,467 | ||||||
|
Minority interest |
— | 10 | ||||||
|
|
|
|
|
|||||
|
Total liabilities and equity |
437,101 | 602,419 | ||||||
|
Associate’s revenue and profit |
||||||||
|
Revenue |
2,088 | 7,279 | ||||||
|
Profit |
1 | 6,297 | ||||||
|
Carrying amount of the investment |
11,674 | 14,407 | ||||||
| (c) | Joint Ventures |
The Bank has a 50% interest in Servipag Ltda. and a 50% interest in Artikos S.A., two jointly controlled entity. Bank’s interest of both entities is accounted for using the equity method in the consolidated financial statements.
Below is summarized financial information of entities controlled jointly:
| Artikos | Servipag | |||||||||||||||
|
2012
MCh$ |
2013
MCh$ |
2012
MCh$ |
2013
MCh$ |
|||||||||||||
|
Current assets |
442 | 920 | 37,416 | 42,788 | ||||||||||||
|
Non-current assets |
925 | 734 | 16,708 | 16,256 | ||||||||||||
|
|
|
|
|
|
|
|
|
|||||||||
|
Total Assets |
1,367 | 1,654 | 54,124 | 59,044 | ||||||||||||
|
|
|
|
|
|
|
|
|
|||||||||
|
Current liabilities |
238 | 313 | 44,137 | 48,343 | ||||||||||||
|
Non-current liabilities |
— | — | 3,231 | 3,521 | ||||||||||||
|
|
|
|
|
|
|
|
|
|||||||||
|
Total Liabilities |
238 | 313 | 47,368 | 51,864 | ||||||||||||
|
Equity |
1,129 | 1,341 | 6,756 | 7,180 | ||||||||||||
|
|
|
|
|
|
|
|
|
|||||||||
|
Total Liabilities and Equity |
1,367 | 1,654 | 54,124 | 59,044 | ||||||||||||
|
|
|
|
|
|
|
|
|
|||||||||
|
Revenue |
2,451 | 2,486 | 36,645 | 35,371 | ||||||||||||
|
Operating expenses |
(3,027 | ) | (2,270 | ) | (36,404 | ) | (34,042 | ) | ||||||||
|
Other income (expenses) |
(8 | ) | 4 | (729 | ) | (808 | ) | |||||||||
|
|
|
|
|
|
|
|
|
|||||||||
|
Profit (loss) before tax |
(584 | ) | 220 | (488 | ) | 521 | ||||||||||
|
Income tax |
(272 | ) | (8 | ) | (154 | ) | (97 | ) | ||||||||
|
|
|
|
|
|
|
|
|
|||||||||
|
Profit (loss) for the year |
(856 | ) | 212 | (642 | ) | 424 | ||||||||||
|
|
|
|
|
|
|
|
|
|||||||||
F-70
Table of Contents
NOTES TO THE CONSOLIDATED FINANCIAL STATEMENTS, Continued
| 13. | Investments in Other Companies, continued: |
| (d) | The reconciliation between opening and ending balance of investments in other companies that are not consolidated in 2011, 2012 and 2013 is detailed as follows: |
|
2011
MCh$ |
2012
MCh$ |
2013
MCh$ |
||||||||||
|
Balance as of January 1, |
11,072 | 13,196 | 11,674 | |||||||||
|
Acquisitions (sales) |
— | 71 | 1,440 | |||||||||
|
Participation in net income |
3,054 | (468 | ) | 1,780 | ||||||||
|
Dividends received |
(761 | ) | (943 | ) | (956 | ) | ||||||
|
Other |
(169 | ) | (182 | ) | 469 | |||||||
|
|
|
|
|
|
|
|||||||
|
Balance as of December 31, |
13,196 | 11,674 | 14,407 | |||||||||
|
|
|
|
|
|
|
|||||||
| (e) | As of December 31, 2012 and 2013, no impairment has incurred in these investments. |
F-71
Table of Contents
NOTES TO THE CONSOLIDATED FINANCIAL STATEMENTS, Continued
| 14. | Intangible Assets: |
| (a) | Changes in intangible assets during the 2011, 2012 and 2013 periods are as follows: |
|
Goodwill
(1)
MCh$ |
Intangible
assets arising from business combinations (2) MCh$ |
Software or
computer programs MCh$ |
Total
MCh$ |
|||||||||||||
|
Gross Balance |
||||||||||||||||
|
Balance as of January 1, 2011 |
16,714 | 56,249 | 84,428 | 157,391 | ||||||||||||
|
Acquisitions |
— | — | 9,597 | 9,597 | ||||||||||||
|
Disposals |
— | — | (1,903 | ) | (1,903 | ) | ||||||||||
|
|
|
|
|
|
|
|
|
|||||||||
|
Balance as of December 31, 2011 |
16,714 | 56,249 | 92,122 | 165,085 | ||||||||||||
|
Acquisitions |
— | — | 9,116 | 9,116 | ||||||||||||
|
Disposals |
— | — | (395 | ) | (395 | ) | ||||||||||
|
|
|
|
|
|
|
|
|
|||||||||
|
Balance as of December 31, 2012 |
16,714 | 56,249 | 100,843 | 173,806 | ||||||||||||
|
Acquisitions |
— | 5,137 | 374 | 5,511 | ||||||||||||
|
Disposals |
— | (859 | ) | (485 | ) | (1,344 | ) | |||||||||
|
|
|
|
|
|
|
|
|
|||||||||
|
Balance as of December 31, 2013 |
16,714 | 60,527 | 100,732 | 177,973 | ||||||||||||
|
|
|
|
|
|
|
|
|
|||||||||
|
Accumulated Amortization and Impairment |
||||||||||||||||
|
Balance as of January 1, 2011 |
— | (18,681 | ) | (50,247 | ) | (68,928 | ) | |||||||||
|
Amortization for the year |
— | (6,274 | ) | (9,288 | ) | (15,562 | ) | |||||||||
|
Impairment loss |
— | — | (296 | ) | (296 | ) | ||||||||||
|
Disposals |
— | — | 727 | 727 | ||||||||||||
|
|
|
|
|
|
|
|
|
|||||||||
|
Balance as of December 31, 2011 |
— | (24,955 | ) | (59,104 | ) | (84,059 | ) | |||||||||
|
Amortization for the year |
— | (5,071 | ) | (9,461 | ) | (14,532 | ) | |||||||||
|
Impairment loss |
— | — | — | — | ||||||||||||
|
Disposals |
— | — | 395 | 395 | ||||||||||||
|
|
|
|
|
|
|
|
|
|||||||||
|
Balance as of December 31, 2012 |
— | (30,026 | ) | (68,170 | ) | (98,196 | ) | |||||||||
|
Amortization for the year |
— | (7,891 | ) | (506 | ) | (8,397 | ) | |||||||||
|
Impairment loss |
— | (28 | ) | — | (28 | ) | ||||||||||
|
Disposals |
— | 859 | 12 | 871 | ||||||||||||
|
|
|
|
|
|
|
|
|
|||||||||
|
Balance as of December 31, 2013 |
— | (37,086 | ) | (68,664 | ) | (105,750 | ) | |||||||||
|
|
|
|
|
|
|
|
|
|||||||||
|
Net balance as of December 31, 2011 |
16,714 | 31,294 | 33,018 | 81,026 | ||||||||||||
|
|
|
|
|
|
|
|
|
|||||||||
|
Net balance as of December 31, 2012 |
16,714 | 26,223 | 32,673 | 75,610 | ||||||||||||
|
|
|
|
|
|
|
|
|
|||||||||
|
Net balance as of December 31, 2013 |
16,714 | 23,441 | 32,068 | 72,223 | ||||||||||||
|
|
|
|
|
|
|
|
|
|||||||||
| (1) | Goodwill corresponds mainly to business combination with Citibank Chile whose amount is of MCh$12,595 that represents the value of synergies to be generated in the combination process and the acquisition of know-how. |
| (2) | Intangible assets arising from business combinations include assets with indefinite useful lives acquired in the business combination with Citibank Chile (Brands). |
F-72
Table of Contents
NOTES TO THE CONSOLIDATED FINANCIAL STATEMENTS, Continued
| 14. | Intangible Assets, continued: |
| (b) | Impairment testing of Goodwill |
For goodwill impairment purposes, testing is carried out at the level of business segments described above and in Note 5 to financial statements. This methodology is in line with IAS 36, where business segments represent the lowest level within the entity at which the goodwill is monitored for internal management purposes.
Accordingly, for impairment testing purposes, goodwill acquired through business combinations has been allocated to four individual business segments, as follows:
|
Business Segments |
2012
MCh$ |
2013
MCh$ |
||||||
|
Retail |
5,928 | 5,928 | ||||||
|
Wholesale |
2,135 | 2,135 | ||||||
|
Treasury and money market operations |
4,512 | 4,512 | ||||||
|
Subsidiaries |
4,139 | 4,139 | ||||||
|
|
|
|
|
|||||
|
Total |
16,714 | 16,714 | ||||||
|
|
|
|
|
|||||
Below are the key assumptions used for determining the value in use for impairment testing purposes:
| • |
The Bank determines the recoverable amount of its business segments on the basis of value in use and employs a discounted cash flows (“DCF”) valuation model. The DCF model reflects the characteristics of the banking business, the bank’s market position, competition and the regulatory environment. The model determines the present value of the estimated future earnings that are distributed to shareholders, once the respective regulatory capital requirements are met. |
| • |
For purposes of the goodwill impairment testing, the DCF model uses earnings projections for a ten-year period that are discounted to their present value. Estimating future earnings requires judgment based on the bank’s past and current performance as well as expected developments in the industry, related markets and main macro-economic variables. Earnings projections beyond the ten-year period are involved in the terminal value. Real growth rates are considered to be slightly higher than the industry rates within the ten-year period, assuming that a market share of 20% is achieved at year ten. For purposes of business segments valuation, the DCF model considered discount rates of 10%, 11% and 12% as of December 31, 2013. |
| • |
The value in use of every business segment is sensitive to earnings projections, discount rates and, into a much lesser extent, long-term growth rates. Discount rates have been determined based on the capital asset pricing model. Variations in market factors may affect the discount rates calculation. |
Based on the above, as of December 31, 2012 and 2013, the Bank determined that there was not any impairment of goodwill.
F-73
Table of Contents
NOTES TO THE CONSOLIDATED FINANCIAL STATEMENTS, Continued
| 14. | Intangible Assets, continued: |
| (c) | As of December 31, 2012 and 2013, the Bank has made the following commitments to purchase intangible assets, which have not been capitalized: |
| Amount of Commitment | ||||||||
|
2012
MCh$ |
2013
MCh$ |
|||||||
|
Software and licences |
6,681 | 9,299 | ||||||
F-74
Table of Contents
NOTES TO THE CONSOLIDATED FINANCIAL STATEMENTS, Continued
| 15. | Property and Equipment: |
| (a) | As of December 31, 2012 and 2013, this account and its changes are detailed as follows: |
|
Land
and
Buildings MCh$ |
Equipment
MCh$ |
Other
MCh$ |
Total
MCh$ |
|||||||||||||
|
(a.1) Cost, net of accumulated depreciation |
||||||||||||||||
|
Balance as of January 1, 2012 |
176,266 | 124,632 | 137,132 | 438,030 | ||||||||||||
|
Additions |
337 | 7,750 | 9,894 | 17,981 | ||||||||||||
|
Disposals/write-downs |
(451 | ) | (1,512 | ) | (2,232 | ) | (4,195 | ) | ||||||||
|
Transfers |
— | — | — | — | ||||||||||||
|
Accumulated depreciation (see (a.2)) |
(34,798 | ) | (109,930 | ) | (101,723 | ) | (246,451 | ) | ||||||||
|
Impairment loss (*) (***) |
— | (31 | ) | (164 | ) | (195 | ) | |||||||||
|
Reclassifications |
— | — | 19 | 19 | ||||||||||||
|
|
|
|
|
|
|
|
|
|||||||||
|
Balance as of December 31, 2012 |
141,354 | 20,909 | 42,926 | 205,189 | ||||||||||||
|
Balance as of January 1, 2013 |
176,152 | 130,839 | 144,649 | 451,640 | ||||||||||||
|
Additions |
62 | 7,509 | 4,678 | 12,249 | ||||||||||||
|
Disposals/write-downs |
(365 | ) | (1,406 | ) | (1,710 | ) | (3,481 | ) | ||||||||
|
Transfers |
— | (218 | ) | 218 | — | |||||||||||
|
Accumulated depreciation (see (a.2)) |
(37,543 | ) | (116,079 | ) | (108,698 | ) | (262,320 | ) | ||||||||
|
Impairment loss (*) (***) |
— | (84 | ) | (426 | ) | (510 | ) | |||||||||
|
Reclassifications |
— | — | — | — | ||||||||||||
|
|
|
|
|
|
|
|
|
|||||||||
|
Balance as of December 31, 2013 |
138,306 | 20,561 | 38,711 | 197,578 | ||||||||||||
|
|
|
|
|
|
|
|
|
|||||||||
|
(a.2) Accumulated Depreciation |
||||||||||||||||
|
Balance as of January 1, 2012 |
(32,329 | ) | (103,013 | ) | (94,800 | ) | (230,142 | ) | ||||||||
|
Reclassifications |
— | — | (19 | ) | (19 | ) | ||||||||||
|
Depreciation charges in the period (*) (**) |
(2,920 | ) | (8,429 | ) | (8,884 | ) | (20,233 | ) | ||||||||
|
Sales and disposals in the period |
451 | 1,512 | 1,980 | 3,943 | ||||||||||||
|
Transfers |
— | — | — | — | ||||||||||||
|
|
|
|
|
|
|
|
|
|||||||||
|
Accumulated Depreciation as of December 31, 2012 |
(34,798 | ) | (109,930 | ) | (101,723 | ) | (246,451 | ) | ||||||||
|
Reclassifications |
— | (19 | ) | 19 | — | |||||||||||
|
Depreciation charges in the period (*) (**) |
(2,873 | ) | (7,716 | ) | (8,310 | ) | (18,899 | ) | ||||||||
|
Sales and disposals in the period |
128 | 1,586 | 1,316 | 3,030 | ||||||||||||
|
Transfers |
— | — | — | — | ||||||||||||
|
|
|
|
|
|
|
|
|
|||||||||
|
Accumulated Depreciation as of December 31, 2013 |
(37,543 | ) | (116,079 | ) | (108,698 | ) | (262,320 | ) | ||||||||
|
|
|
|
|
|
|
|
|
|||||||||
| (*) | See Note No. 36 about Depreciation, Amortization and Impairment |
| (**) | It does not include depreciation of the year of Investment Properties, which it registers under the item “Other assets” for an amount of MCh$381 (MCh$381 in 2012) |
| (***) | It does not include charge-offs provision of Property and Equipment for an amount of MCh$247 (MCh$153 in 2012) |
F-75
Table of Contents
NOTES TO THE CONSOLIDATED FINANCIAL STATEMENTS, Continued
| 15. | Property and Equipment, continued: |
| (b) | As of December 31, 2012 and 2013, the Bank has operating lease agreements, in which it acts as lessee, that cannot be terminated unilaterally; Information on the future payments is detailed as follows: |
|
Expenses for the year |
Up to 1 month |
Over 1 month and up to 3 months |
Over 3 months and up to 12 months |
Over 1 year and up to 3 years |
Over 3 years and up to 5 years |
Over 5 years | Total | |||||||||||||||||||||||||||||||||||||||||||||||||||||||||
|
2012
MCh$ |
2013
MCh$ |
2012
MCh$ |
2013
MCh$ |
2012
MCh$ |
2013
MCh$ |
2012
MCh$ |
2013
MCh$ |
2012
MCh$ |
2013
MCh$ |
2012
MCh$ |
2013
MCh$ |
2012
MCh$ |
2013
MCh$ |
2012
MCh$ |
2013
MCh$ |
|||||||||||||||||||||||||||||||||||||||||||||||||
|
Lease agreements |
28,036 | 28,876 | 2,274 | 2,320 | 4,561 | 4,633 | 19,219 | 19,833 | 37,094 | 37,497 | 27,066 | 26,517 | 49,523 | 48,815 | 139,737 | 139,615 | ||||||||||||||||||||||||||||||||||||||||||||||||
As these lease agreements are operating leases under IAS 17 the leased assets are not presented in the Bank’s statement of financial position.
The Bank has entered into commercial leases of real estate. These leases have an average life of 10 years. There are no restrictions placed upon the lessee by entering into the lease.
| (c) | As of December 31, 2012 and 2013, the Bank does not have any finance lease agreements as lessee and, therefore, there are no property and equipment balances to be reported from such transactions as of December 31, 2012 and 2013. |
F-76
Table of Contents
NOTES TO THE CONSOLIDATED FINANCIAL STATEMENTS, Continued
| 16. | Investment Properties: |
|
2011
MCh$ |
2012
MCh$ |
2013
MCh$ |
||||||||||
|
Net Balance as of January 1, |
17,459 | 17,079 | 16,698 | |||||||||
|
Additions resulting from business combinations |
— | — | — | |||||||||
|
Disposals |
— | — | — | |||||||||
|
Depreciation charges in the period |
(380 | ) | (381 | ) | (381 | ) | ||||||
|
Impairment |
— | — | — | |||||||||
|
|
|
|
|
|
|
|||||||
|
Net Balance as of December 31, |
17,079 | 16,698 | 16,317 | |||||||||
|
|
|
|
|
|
|
|||||||
Estimated useful lives applied by the Bank are presented in Note 2(o) on Property and equipment.
As of December 31, 2013, the fair value of the investment properties held by the Bank is MCh$57,222 million (MCh$57,193 million as of December 31, 2012).
In 2013, the Bank earned income of MCh$5,245 million (Ch$5,198 million in 2012) renting out their investment properties. In the same period the Bank incurred corresponding expenses of MCh$2,427 and MCh$2,205 per year in 2012 and 2013.
| 17. | Current Taxes and Deferred Taxes: |
| (a) | Current Tax: |
As of each year end, the Bank and its subsidiaries have established a First Category Income Tax Provision of MCh$23,189 and MCh$7,131 as of December 31, 2012 and 2013, determined in accordance with current tax laws. The net tax to be paid or recovered is detailed as follows:
|
2012
MCh$ |
2013
MCh$ |
|||||||
|
Income taxes, 20% rate |
61,876 | 85,336 | ||||||
|
Sole first category tax |
— | 23 | ||||||
|
Tax on non-deductible expenses (tax rate 35%) |
3,860 | 1,885 | ||||||
|
Less: |
||||||||
|
Monthly prepaid taxes (PPM) |
(41,960 | ) | (73,694 | ) | ||||
|
Credit for training expenses |
(1,545 | ) | (1,714 | ) | ||||
|
Other |
958 | (4,705 | ) | |||||
|
|
|
|
|
|||||
|
Total |
23,189 | 7,131 | ||||||
|
|
|
|
|
|||||
F-77
Table of Contents
NOTES TO THE CONSOLIDATED FINANCIAL STATEMENTS, Continued
| 17. | Current Taxes and Deferred Taxes, continued: |
| (b) | Income Tax: |
The Bank’s tax expense recorded for the years ended December 31, 2011, 2012 and 2013 is detailed as follows:
|
2011
MCh$ |
2012
MCh$ |
2013
MCh$ |
||||||||||
|
Income tax expense: |
||||||||||||
|
Current year taxes |
(64,590 | ) | (61,876 | ) | (88,714 | ) | ||||||
|
Tax from previous period |
1,203 | 1,147 | 433 | |||||||||
|
|
|
|
|
|
|
|||||||
|
Subtotal |
(63,387 | ) | (60,729 | ) | (88,281 | ) | ||||||
|
|
|
|
|
|
|
|||||||
|
Credit (charge) for deferred taxes: |
||||||||||||
|
Origin and reversal of temporary differences |
5,433 | (7,034 | ) | 3,231 | ||||||||
|
Effect of changes in tax rate |
(5,042 | ) | 9,029 | — | ||||||||
|
|
|
|
|
|
|
|||||||
|
Subtotal |
391 | 1,995 | 3,231 | |||||||||
|
Non deductible expenses (Art. 21 Income Tax Law) |
(1,701 | ) | (3,860 | ) | (1,885 | ) | ||||||
|
Other |
(734 | ) | (1,334 | ) | (2,150 | ) | ||||||
|
|
|
|
|
|
|
|||||||
|
Net charge to income for income taxes |
(65,431 | ) | (63,928 | ) | (89,085 | ) | ||||||
|
|
|
|
|
|
|
|||||||
|
Tax Rate |
20.00 | % | 20.00 | % | 20.00 | % | ||||||
| (c) | Reconciliation of effective tax rate: |
The following table reconciles the income tax rate to the effective rate applied to determine the Bank’s income tax expense as of December 31, 2011, 2012 and 2013:
| 2011 | 2012 | 2013 | ||||||||||||||||||||||
|
Tax rate
% |
MCh$ |
Tax rate
% |
MCh$ |
Tax rate
% |
MCh$ | |||||||||||||||||||
|
Income tax calculated on net income before tax |
20.00 | 100,715 | 20.00 | 108,762 | 20.00 | 127,856 | ||||||||||||||||||
|
Additions or deductions (1) |
(7.33 | ) | (36,929 | ) | (6.81 | ) | (37,056 | ) | (6.36 | ) | (40,653 | ) | ||||||||||||
|
Non-deductible expenses tax |
0.34 | 1,701 | 0.71 | 3,860 | 0.29 | 1,885 | ||||||||||||||||||
|
Tax from previous years |
(0.24 | ) | (1,203 | ) | (0.21 | ) | (1,147 | ) | (0.07 | ) | (432 | ) | ||||||||||||
|
Effect of changes in tax rate (*) |
1.00 | 5,042 | (1.66 | ) | (9,029 | ) | — | — | ||||||||||||||||
|
Lease deferred tax adjustment |
— | — | 0.54 | 2,942 | — | — | ||||||||||||||||||
|
Other |
(0.77 | ) | (3,895 | ) | (0.82 | ) | (4,404 | ) | 0.07 | 429 | ||||||||||||||
|
|
|
|
|
|
|
|
|
|
|
|
|
|||||||||||||
|
Effective rate and income tax expense |
13.00 | 65,431 | 11.75 | 63,928 | 13.93 | 89,085 | ||||||||||||||||||
| (*) | According to the Law No. 20,630 issued on September 27th, 2012 the tax rates for the first category are permanently changed to 20.00%. |
| (1) |
The deductions of the tax rate for 2011, 2012 and 2013 mainly relate to specific adjustments from tax-exempt distribution of income to SAOS of 32.89% in 2011, 31.81% in 2012 and 30.69% in 2013 of the Bank’s profits as well as adjustments relating to its subsidiaries. |
F-78
Table of Contents
NOTES TO THE CONSOLIDATED FINANCIAL STATEMENTS, Continued
| 17. | Current Taxes and Deferred Taxes, continued: |
| (d) | Effect of deferred taxes on income and equity: |
During 2013, the Bank has recorded the effects of deferred taxes in accordance with IAS 12.
The effects of deferred taxes on assets, liabilities and income accounts are detailed as follows:
|
Balance as
of
December 31, 2010 MCh$ |
Effect |
Balance as
of
December 31, 2011 MCh$ |
Effect |
Unrecognized
temporary differences MCh$ |
Balance as
of
December 31, 2012 MCh$ |
Effect |
Balance as
of
December 31, 2013 MCh$ |
|||||||||||||||||||||||||||||||||||||
|
Income
MCh$ |
Equity
MCh$ |
Income
MCh$ |
Equity
MCh$ |
Income
MCh$ |
Equity
MCh$ |
|||||||||||||||||||||||||||||||||||||||
|
Debit differences: |
||||||||||||||||||||||||||||||||||||||||||||
|
Allowances for loan losses |
63,303 | (2,565 | ) | — | 60,738 | 14,581 | — | — | 75,319 | 5,012 | — | 80,331 | ||||||||||||||||||||||||||||||||
|
Obligations with agreements to repurchase |
(240 | ) | 997 | — | 757 | (1,736 | ) | — | — | (979 | ) | 216 | — | (763 | ) | |||||||||||||||||||||||||||||
|
Personnel provisions |
4,681 | 532 | — | 5,213 | 1,162 | — | — | 6,375 | (345 | ) | — | 6,030 | ||||||||||||||||||||||||||||||||
|
Staff vacations |
3,596 | 41 | — | 3,637 | 421 | — | — | 4,058 | 321 | — | 4,379 | |||||||||||||||||||||||||||||||||
|
Accrued interest and indexation adjustments from past due loans |
1,466 | 107 | — | 1,573 | 550 | — | — | 2,123 | 290 | — | 2,413 | |||||||||||||||||||||||||||||||||
|
Staff severance indeminities provision |
1,118 | 61 | — | 1,179 | 665 | — | — | 1,844 | (22 | ) | 33 | 1,855 | ||||||||||||||||||||||||||||||||
|
Provisions of credit card expenses |
2,597 | 1,729 | — | 4,326 | 368 | — | — | 4,694 | 1,799 | — | 6,493 | |||||||||||||||||||||||||||||||||
|
Provisions of accrued expenses |
3,538 | 1,148 | — | 4,686 | 2,696 | — | — | 7,382 | 349 | — | 7,731 | |||||||||||||||||||||||||||||||||
|
Other adjustments |
2,970 | (7,324 | ) | — | (4,354 | ) | (470 | ) | — | 119 | (4,705 | ) | 4,268 | — | (437 | ) | ||||||||||||||||||||||||||||
|
|
|
|
|
|
|
|
|
|
|
|
|
|
|
|
|
|
|
|
|
|
|
|||||||||||||||||||||||
|
Total debit differences |
83,029 | (5,274 | ) | — | 77,755 | 18,237 | — | 119 | 96,111 | 11,888 | 33 | 108,032 | ||||||||||||||||||||||||||||||||
|
|
|
|
|
|
|
|
|
|
|
|
|
|
|
|
|
|
|
|
|
|
|
|||||||||||||||||||||||
|
Credit differences: |
||||||||||||||||||||||||||||||||||||||||||||
|
Investments with agreement to repurchase |
872 | 1,239 | — | 2,111 | (1,986 | ) | — | — | 125 | — | — | 125 | ||||||||||||||||||||||||||||||||
|
Depreciation of property and equipment and investment properties |
15,630 | (1,434 | ) | — | 14,196 | 1,227 | — | — | 15,423 | (987 | ) | — | 14,436 | |||||||||||||||||||||||||||||||
|
Deferred taxes, modification of accounting method in equity |
— | — | — | — | — | — | — | — | — | — | — | |||||||||||||||||||||||||||||||||
|
Adjustment for valuation financial assets available-for-sale |
1,493 | — | (1,866 | ) | (373 | ) | — | 5,994 | — | 5,621 | — | 2,644 | 8,265 | |||||||||||||||||||||||||||||||
|
Hedge cash adjustment |
— | — | (90 | ) | (90 | ) | — | 349 | — | 259 | — | — | 259 | |||||||||||||||||||||||||||||||
|
Leasing equipment |
(8,894 | ) | (3,426 | ) | — | (12,320 | ) | 16,038 | — | — | 3,718 | 3,688 | — | 7,406 | ||||||||||||||||||||||||||||||
|
Transitory assets |
1,669 | 1,011 | — | 2,680 | 924 | — | — | 3,604 | 290 | — | 3,894 | |||||||||||||||||||||||||||||||||
|
Derivative instruments adjustments |
1,319 | (1,614 | ) | — | (295 | ) | (1,505 | ) | — | — | (1,800 | ) | 4,248 | — | 2,448 | |||||||||||||||||||||||||||||
|
Assets received in lieu of payments |
1,203 | (495 | ) | — | 708 | 578 | — | — | 1,286 | — | — | 1,286 | ||||||||||||||||||||||||||||||||
|
Accrued interest to effective rate |
— | 1,058 | — | 1,058 | (17 | ) | — | — | 1,041 | — | — | 1,041 | ||||||||||||||||||||||||||||||||
|
Intangible assets amortization |
6,516 | 71 | — | 6,587 | (961 | ) | — | — | 5,626 | 248 | — | 5,874 | ||||||||||||||||||||||||||||||||
|
Other adjustments |
5,543 | (2,075 | ) | — | 3,468 | 1,944 | — | (5 | ) | 5,407 | 1,170 | — | 6,577 | |||||||||||||||||||||||||||||||
|
|
|
|
|
|
|
|
|
|
|
|
|
|
|
|
|
|
|
|
|
|
|
|||||||||||||||||||||||
|
Total credit differences |
25,351 | (5,665 | ) | (1,956 | ) | 17,730 | 16,242 | 6,343 | (5 | ) | 40,310 | 8,657 | 2,644 | 51,611 | ||||||||||||||||||||||||||||||
|
|
|
|
|
|
|
|
|
|
|
|
|
|
|
|
|
|
|
|
|
|
|
|||||||||||||||||||||||
|
Total Assets (Liabilities) net |
57,678 | 391 | 1,956 | 60,025 | 1,995 | (6,343 | ) | 124 | 55,801 | 3,231 | (2,611 | ) | 56,421 | |||||||||||||||||||||||||||||||
|
|
|
|
|
|
|
|
|
|
|
|
|
|
|
|
|
|
|
|
|
|
|
|||||||||||||||||||||||
F-79
Table of Contents
NOTES TO THE CONSOLIDATED FINANCIAL STATEMENTS, Continued
| 18. | Other Assets: |
As of December 31, 2012 and 2013, other assets are detailed as follows:
|
2012
MCh$ |
2013
MCh$ |
|||||||
|
Documents intermediated (*) |
89,800 | 74,366 | ||||||
|
Assets held for leasing (**) |
74,986 | 74,723 | ||||||
|
Mutual funds |
33,042 | 66,213 | ||||||
|
Cash deposit guarantee |
25,984 | 60,309 | ||||||
|
Other accounts and notes receivable |
20,001 | 8,682 | ||||||
|
Assets received or awarded as payment (***) : |
||||||||
|
Assets received in lieu of payment |
16,391 | 19,032 | ||||||
|
Provisions for assets received in lieu of payment |
(40 | ) | (46 | ) | ||||
|
Transactions in progress (****) |
8,676 | 1,803 | ||||||
|
Commissions receivable |
6,392 | 7,784 | ||||||
|
Recoverable income taxes |
7,695 | 6,048 | ||||||
|
Prepaid expenses |
3,476 | 6,589 | ||||||
|
Rental guarantees |
1,386 | 1,456 | ||||||
|
Recovered leased assets for sale |
777 | 5,463 | ||||||
|
Accounts receivable for sale of assets received in lieu of payment |
423 | 1,286 | ||||||
|
Other |
28,776 | 40,279 | ||||||
|
|
|
|
|
|||||
|
Total |
317,765 | 373,987 | ||||||
|
|
|
|
|
|||||
| (*) | Documents intermediated refers to securities lending agreements managed by the Bank’s subsidiary Banchile Corredores de Bolsa S.A. |
| (**) | These correspond to property and equipment to be given under a finance lease. |
| (***) | Assets received in lieu of payment are valued at fair value, which is calculated considering the lesser between appraised value and value of award, less cost of sell. |
| (****) | Transactions in progress includes transactions in the normal course of operations of the Bank, which for different reasons could not be input into their final accounts (salary advances for personnel, pending transactions cash, etc.) |
F-80
Table of Contents
NOTES TO THE CONSOLIDATED FINANCIAL STATEMENTS, Continued
| 19. | Current Accounts and Other Demand Deposits: |
As of December 31, 2012 and 2013, current accounts and other demand deposits are detailed as follows:
|
2012
MCh$ |
2013
MCh$ |
|||||||
|
Current accounts |
4,495,134 | 5,018,155 | ||||||
|
Other demand deposits |
599,320 | 593,444 | ||||||
|
Other demand deposits and accounts |
376,517 | 372,733 | ||||||
|
|
|
|
|
|||||
|
Total |
5,470,971 | 5,984,332 | ||||||
|
|
|
|
|
|||||
| 20. | Saving Accounts and Time Deposits: |
As of December 31, 2012 and 2013, saving accounts and time deposits are detailed as follows:
|
2012
MCh$ |
2013
MCh$ |
|||||||
|
Time deposits |
9,370,063 | 10,151,612 | ||||||
|
Term saving accounts |
179,465 | 178,012 | ||||||
|
Other term balances payable |
63,422 | 73,101 | ||||||
|
|
|
|
|
|||||
|
Total |
9,612,950 | 10,402,725 | ||||||
|
|
|
|
|
|||||
F-81
Table of Contents
NOTES TO THE CONSOLIDATED FINANCIAL STATEMENTS, Continued
| 21. | Borrowings from Financial Institutions: |
As of December 31, 2012 and 2013, borrowings from financial institutions are detailed as follows:
|
2012
MCh$ |
2013
MCh$ |
|||||||
|
Domestic banks |
||||||||
|
Interbank loans |
— | — | ||||||
|
Current account overdrafts |
— | — | ||||||
|
|
|
|
|
|||||
|
Subtotal |
— | — | ||||||
|
|
|
|
|
|||||
|
Foreign banks |
||||||||
|
Foreign trade financing |
||||||||
|
Chilean export financing |
882,920 | 685,255 | ||||||
|
Chilean import financing |
28,906 | 22,784 | ||||||
|
Obligations for transactions between other countries |
— | 94,327 | ||||||
|
Borrowings and other obligations |
||||||||
|
Short-term borrowings |
— | — | ||||||
|
Current account overdrafts |
28,328 | 55,440 | ||||||
|
Long-term borrowings |
168,509 | 131,649 | ||||||
|
|
|
|
|
|||||
|
Subtotal |
1,108,663 | 989,455 | ||||||
|
|
|
|
|
|||||
|
Chilean Central Bank |
||||||||
|
Borrowings and other obligations |
— | — | ||||||
|
Debt reprogramming credit lines |
18 | 10 | ||||||
|
|
|
|
|
|||||
|
Subtotal |
18 | 10 | ||||||
|
|
|
|
|
|||||
|
Total |
1,108,681 | 989,465 | ||||||
|
|
|
|
|
|||||
F-82
Table of Contents
NOTES TO THE CONSOLIDATED FINANCIAL STATEMENTS, Continued
| 22. | Debt Issued: |
As of December 31, 2012 and 2013, Debt issued is detailed as follows:
|
2012
MCh$ |
2013
MCh$ |
|||||||
|
Mortgage bonds |
115,196 | 86,491 | ||||||
|
Bonds |
2,412,233 | 3,533,462 | ||||||
|
Subordinated bonds |
746,504 | 747,007 | ||||||
|
|
|
|
|
|||||
|
Total |
3,273,933 | 4,366,960 | ||||||
|
|
|
|
|
|||||
During the period ended as of December 31, 2013, Banco de Chile issued bonds by an amount of MCh$1,607,265, of which corresponds to bonds, commercial papers and subordinated bonds in amounts of MCh$1,093,749, MCh$509,920 and MCh$3,596 respectively, according to the following details:
Bonds
|
Series |
MCh$ |
Term
(years) |
Interest
rate |
Currency | Issued date |
Maturity
date |
||||||||||||||
|
BCHIUR1011 |
22,114 | 12 | 3.40 | UF | 01/08/2013 | 01/08/2025 | ||||||||||||||
|
BCHIUR1011 |
8,521 | 12 | 3.40 | UF | 01/09/2013 | 01/09/2025 | ||||||||||||||
|
BCHIUJ0811 |
1,572 | 8 | 3.20 | UF | 01/29/2013 | 01/29/2021 | ||||||||||||||
|
BCHIUZ1011 |
89,313 | 7 | 3.20 | UF | 01/31/2013 | 01/31/2020 | ||||||||||||||
|
BCHIAC1011 |
45,456 | 15 | 3.50 | UF | 02/28/2013 | 02/28/2028 | ||||||||||||||
|
BCHIAC1011 |
34,185 | 15 | 3.50 | UF | 03/26/2013 | 03/26/2028 | ||||||||||||||
|
BCHIUN1011 |
72,022 | 7 | 3.20 | UF | 04/08/2013 | 04/08/2020 | ||||||||||||||
|
BCHIUU0212 |
68,379 | 12 | 3.40 | UF | 08/29/2013 | 08/29/2025 | ||||||||||||||
|
BCHIAU0213 |
69,746 | 12 | 3.60 | UF | 09/11/2013 | 09/11/2025 | ||||||||||||||
|
BCHIAG0213 |
46,585 | 5 | 3.40 | UF | 09/13/2013 | 09/13/2018 | ||||||||||||||
|
BCHIAV0613 |
47,283 | 12 | 3.60 | UF | 10/16/2013 | 09/13/2025 | ||||||||||||||
|
BONO HKD |
43,066 | 10 | 3.23 | HKD | 04/22/2013 | 04/24/2023 | ||||||||||||||
|
BONO HKD |
45,133 | 15 | 4.25 | HKD | 10/08/2013 | 10/16/2028 | ||||||||||||||
|
BONO CHF |
100,371 | 5 | 1.13 | CHF | 04/26/2013 | 05/23/2018 | ||||||||||||||
|
BONO CHF |
25,019 | 5 | 1.13 | CHF | 05/07/2013 | 05/23/2018 | ||||||||||||||
|
BONO CHF |
122,380 | 3 | 0.60 | CHF | 06/11/2013 | 07/18/2016 | ||||||||||||||
|
BONO CHF |
66,164 | 4 | 1.13 | CHF | 06/28/2013 | 05/23/2017 | ||||||||||||||
|
BONO CHF |
98,555 | 6 | 1.50 | CHF | 11/07/2013 | 12/03/2019 | ||||||||||||||
|
BONO JPY |
57,716 | 3 | 0.74 | JPY | 11/25/2013 | 11/25/2016 | ||||||||||||||
|
BONO JPY |
30,169 | 6 | 1.03 | JPY | 12/05/2013 | 03/18/2019 | ||||||||||||||
|
|
|
|||||||||||||||||||
|
Total 2013 |
1,093,749 | |||||||||||||||||||
|
|
|
|||||||||||||||||||
F-83
Table of Contents
NOTES TO THE CONSOLIDATED FINANCIAL STATEMENTS, Continued
| 22. | Debt Issued, continued: |
Commercial Papers
|
Counterparty |
MCh$ | Interest rate % | Currency | Issue date | Maturity date | |||||||||||
|
WELLS FARGO BANK |
18,849 | 0.38 | USD | 01/07/2013 | 04/05/2013 | |||||||||||
|
WELLS FARGO BANK |
4,712 | 0.38 | USD | 01/07/2013 | 04/05/2013 | |||||||||||
|
GOLDMAN SACHS |
4,712 | 0.36 | USD | 01/07/2013 | 04/08/2013 | |||||||||||
|
WELLS FARGO BANK |
9,427 | 0.38 | USD | 01/09/2013 | 04/08/2013 | |||||||||||
|
CITIBANK N.A. |
28,503 | 0.35 | USD | 01/15/2013 | 04/22/2013 | |||||||||||
|
MERRYL LYNCH |
14,130 | 0.33 | USD | 01/22/2013 | 04/22/2013 | |||||||||||
|
WELLS FARGO BANK |
23,543 | 0.33 | USD | 02/14/2013 | 05/15/2013 | |||||||||||
|
JP.MORGAN CHASE |
9,417 | 0.33 | USD | 02/14/2013 | 05/15/2013 | |||||||||||
|
CITIBANK N.A. |
9,417 | 0.33 | USD | 02/14/2013 | 05/15/2013 | |||||||||||
|
GOLDMAN SACHS |
9,417 | 0.32 | USD | 02/14/2013 | 05/15/2013 | |||||||||||
|
GOLDMAN SACHS |
28,304 | 0.32 | USD | 03/15/2013 | 06/14/2013 | |||||||||||
|
CITIBANK N.A. |
9,199 | 0.32 | USD | 03/15/2013 | 06/14/2013 | |||||||||||
|
CITIBANK N.A. |
9,444 | 0.32 | USD | 04/02/2013 | 06/28/2013 | |||||||||||
|
GOLDMAN SACHS |
9,444 | 0.33 | USD | 04/02/2013 | 07/02/2013 | |||||||||||
|
JP.MORGAN CHASE |
9,444 | 0.33 | USD | 04/02/2013 | 07/02/2013 | |||||||||||
|
MERRYL LYNCH |
9,444 | 0.33 | USD | 04/02/2013 | 07/02/2013 | |||||||||||
|
WELLS FARGO BANK |
9,444 | 0.33 | USD | 04/02/2013 | 07/02/2013 | |||||||||||
|
CITIBANK N.A. |
23,448 | 0.31 | USD | 04/05/2013 | 06/28/2013 | |||||||||||
|
CITIBANK N.A. |
14,013 | 0.26 | USD | 04/09/2013 | 06/07/2013 | |||||||||||
|
WELLS FARGO BANK |
4,979 | 0.65 | USD | 07/17/2013 | 07/11/2014 | |||||||||||
|
WELLS FARGO BANK |
25,505 | 0.35 | USD | 09/03/2013 | 03/03/2014 | |||||||||||
|
WELLS FARGO BANK |
12,549 | 0.30 | USD | 09/17/2013 | 12/17/2013 | |||||||||||
|
CITIBANK N.A. |
37,646 | 0.30 | USD | 09/17/2013 | 12/17/2013 | |||||||||||
|
CITIBANK N.A. |
15,037 | 0.33 | USD | 09/25/2013 | 01/22/2014 | |||||||||||
|
MERRYL LYNCH |
10,024 | 0.33 | USD | 09/25/2013 | 01/21/2014 | |||||||||||
|
WELLS FARGO BANK |
15,037 | 0.33 | USD | 09/25/2013 | 01/22/2014 | |||||||||||
|
WELLS FARGO BANK |
10,024 | 0.33 | USD | 09/25/2013 | 01/22/2014 | |||||||||||
|
GOLDMAN SACHS |
24,844 | 0.30 | USD | 10/18/2013 | 01/21/2014 | |||||||||||
|
CITIBANK N.A. |
9,937 | 0.30 | USD | 10/18/2013 | 01/21/2014 | |||||||||||
|
WELLS FARGO BANK |
26,633 | 0.35 | USD | 12/02/2013 | 03/03/2014 | |||||||||||
|
CITIBANK N.A. |
10,653 | 0.30 | USD | 12/02/2013 | 03/04/2014 | |||||||||||
|
WELLS FARGO BANK |
13,186 | 0.30 | USD | 12/17/2013 | 03/17/2014 | |||||||||||
|
CITIBANK N.A. |
39,555 | 0.31 | USD | 12/17/2013 | 03/20/2014 | |||||||||||
|
|
|
|||||||||||||||
|
Total |
509,920 | |||||||||||||||
|
|
|
|||||||||||||||
F-84
Table of Contents
NOTES TO THE CONSOLIDATED FINANCIAL STATEMENTS, Continued
| 22. | Debt Issued, continued: |
Subordinated Bonds
|
Series |
MCh$ |
Term
(years) |
Interest
rate |
Currency | Issued date |
Maturity
date |
||||||||
|
UCHI-G1111 |
3,596 | 25 | 3.75 | UF | 01/25/2013 | 01/25/2038 | ||||||||
|
|
|
|||||||||||||
|
Total |
3,596 | |||||||||||||
|
|
|
|||||||||||||
During the period ended as of December 31, 2012, Banco de Chile issued bonds in an amount of MCh$1,233,985, including unsubordinated bonds, commercial papers and subordinated bonds in amounts of MCh$691,380, MCh$516,428 and MCh$26,177, respectively, according to the following details:
Bonds
|
Series |
MCh$ | Term |
Interest
rate |
Currency | Issue date |
Maturity
date |
||||||||||||||
|
BCHIUO0911 |
89,896 | 10 years | 3.40 | UF | 02/15/2012 | 02/15/2022 | ||||||||||||||
|
BCHIUD0510 |
14,109 | 6 years | 2.20 | UF | 02/16/2012 | 02/16/2018 | ||||||||||||||
|
BCHIUI0611 |
1,338 | 7 years | 3.20 | UF | 03/05/2012 | 03/05/2019 | ||||||||||||||
|
BCHIUI0611 |
3,352 | 7 years | 3.20 | UF | 03/07/2012 | 03/07/2019 | ||||||||||||||
|
BCHIUI0611 |
1,116 | 7 years | 3.20 | UF | 03/23/2012 | 03/23/2019 | ||||||||||||||
|
BCHIUP1211 |
88,345 | 10 years | 3.40 | UF | 04/04/2012 | 04/04/2022 | ||||||||||||||
|
BCHIUI0611 |
2,236 | 7 years | 3.20 | UF | 04/17/2012 | 04/17/2019 | ||||||||||||||
|
BCHIUQ1011 |
27,343 | 11 years | 3.40 | UF | 05/08/2012 | 05/08/2023 | ||||||||||||||
|
BCHIUQ1011 |
48,568 | 11 years | 3.40 | UF | 05/11/2012 | 05/11/2023 | ||||||||||||||
|
BCHIUQ1011 |
12,449 | 11 years | 3.40 | UF | 06/04/2012 | 06/04/2023 | ||||||||||||||
|
BCHIUS0212 |
46,428 | 11 years | 3.40 | UF | 06/04/2012 | 06/04/2023 | ||||||||||||||
|
BCHIUS0212 |
20,552 | 11 years | 3.40 | UF | 06/07/2012 | 06/07/2023 | ||||||||||||||
|
BCHIUT0112 |
66,850 | 12 years | 3.40 | UF | 06/12/2012 | 06/12/2024 | ||||||||||||||
|
BCHIUR1011 |
33,295 | 12 years | 3.40 | UF | 06/20/2012 | 06/20/2024 | ||||||||||||||
|
BCHIUR1011 |
4,450 | 12 years | 3.40 | UF | 07/30/2012 | 07/30/2024 | ||||||||||||||
|
BCHIUR1011 |
13,469 | 12 years | 3.40 | UF | 09/14/2012 | 09/14/2024 | ||||||||||||||
|
BCHIUR1011 |
1,799 | 12 years | 3.40 | UF | 09/24/2012 | 09/24/2024 | ||||||||||||||
|
BCHIUR1011 |
5,284 | 12 years | 3.40 | UF | 09/25/2012 | 09/25/2024 | ||||||||||||||
|
BCHIUJ0811 |
1,334 | 8 years | 3.20 | UF | 10/05/2012 | 10/05/2020 | ||||||||||||||
|
BCHIUJ0811 |
33,456 | 8 years | 3.20 | UF | 10/10/2012 | 10/10/2020 | ||||||||||||||
|
BCHIUV1211 |
67,842 | 13 years | 3.50 | UF | 10/10/2012 | 10/10/2025 | ||||||||||||||
|
BCHIUJ0811 |
1,566 | 8 years | 3.20 | UF | 10/19/2012 | 10/19/2020 | ||||||||||||||
|
BCHIUJ0811 |
2,241 | 8 years | 3.20 | UF | 10/22/2012 | 10/22/2020 | ||||||||||||||
|
BCHIAC1011 |
11,118 | 15 years | 3.50 | UF | 10/22/2012 | 10/22/2027 | ||||||||||||||
|
BONO HKD (*) |
24,487 | 15 years | 4.00 | HKD | 09/05/2012 | 09/05/2027 | ||||||||||||||
|
BONO HKD (*) |
54,374 | 15 years | 4.00 | HKD | 11/07/2012 | 09/09/2027 | ||||||||||||||
|
BONO PEN (**) |
14,083 | 5 years | 4.04 | PEN | 10/30/2012 | 10/30/2017 | ||||||||||||||
|
|
|
|||||||||||||||||||
|
Total as of December 31, 2012 |
691,380 | |||||||||||||||||||
|
|
|
|||||||||||||||||||
| (*) | On August 9, 2012, the Bank approved in Board Meeting No. 2,759 a bond issue program in Hong Kong, pursuant to Regulation S of the SEC (Securities and Exchange Commission) for an amount of US$60,000,000 to be placed in international markets, of which on September 5, 2012 an amount of 400,000,000 Hong Kong dollars was issued and placed. |
On October 25, 2012, the Bank approved in Board Meeting No. 2,764 a complementary program of bonds pursuant to Regulation S of the SEC for an amount of US$130,000,000 to be placed in international markets, of which on November 7, 2012 an amount of 875,000,000 Hong Kong dollars was issued and placed.
| (**) | On October 11, 2012, the Bank approved in Board Meeting No. 2,763 a program issue of bonds pursuant to Regulation S of the SEC for up to US$100,000,000, of which PEN 75,000,000, or US$28,000,000, was issued and placed on October 30, 2012. |
F-85
Table of Contents
NOTES TO THE CONSOLIDATED FINANCIAL STATEMENTS, Continued
| 22. | Debt Issued, continued: |
Commercial Paper
On May 4, 2012, the Bank began issuing bonds denominated “Commercial Paper”, which are short-term financial instruments of the Bank that can be issued with varying maturities, but these maturities will be not greater than 365 days. The total issuance was MCh$516,428, according to the following detail:
|
Counterparty |
MCh$ | Interest rate | Currency | Issue date | Maturity date | |||||||
|
Citibank |
120 | 0.67 | USD | 05/04/2012 | 05/07/2012 | |||||||
|
Citibank |
120 | 0.67 | USD | 05/04/2012 | 05/07/2012 | |||||||
|
Citibank |
19,179 | 0.67 | USD | 05/07/2012 | 08/06/2012 | |||||||
|
Citibank |
14,384 | 0.67 | USD | 05/08/2012 | 08/06/2012 | |||||||
|
Goldman Sachs |
23,974 | 0.67 | USD | 05/08/2012 | 08/08/2012 | |||||||
|
Merrill Lynch |
14,384 | 0.67 | USD | 05/08/2012 | 08/06/2012 | |||||||
|
Merrill Lynch |
9,589 | 0.67 | USD | 05/08/2012 | 08/06/2012 | |||||||
|
Merrill Lynch |
4,795 | 0.67 | USD | 05/08/2012 | 08/06/2012 | |||||||
|
Merrill Lynch |
9,589 | 0.75 | USD | 05/24/2012 | 09/06/2012 | |||||||
|
Goldman Sachs |
19,179 | 0.67 | USD | 05/25/2012 | 08/23/2012 | |||||||
|
Merrill Lynch |
9,589 | 0.68 | USD | 05/30/2012 | 08/28/2012 | |||||||
|
JP Morgan |
23,974 | 0.68 | USD | 05/30/2012 | 08/28/2012 | |||||||
|
Merrill Lynch |
8,630 | 0.66 | USD | 06/28/2012 | 09/25/2012 | |||||||
|
Wells Fargo |
8,630 | 0.66 | USD | 06/28/2012 | 09/25/2012 | |||||||
|
Citibank |
8,630 | 0.66 | USD | 06/28/2012 | 09/25/2012 | |||||||
|
JP Morgan |
8,630 | 0.66 | USD | 06/28/2012 | 09/25/2012 | |||||||
|
Goldman Sachs |
8,630 | 0.66 | USD | 06/28/2012 | 09/25/2012 | |||||||
|
Wells Fargo |
7,192 | 1.27 | USD | 07/17/2012 | 07/11/2013 | |||||||
|
Wells Fargo |
9,589 | 0.57 | USD | 08/06/2012 | 10/31/2012 | |||||||
|
Merrill Lynch |
9,589 | 0.57 | USD | 08/06/2012 | 10/31/2012 | |||||||
|
Citibank |
9,589 | 0.57 | USD | 08/06/2012 | 10/31/2012 | |||||||
|
Citibank |
9,589 | 0.62 | USD | 08/06/2012 | 11/27/2012 | |||||||
|
JPMorgan |
9,589 | 0.57 | USD | 08/06/2012 | 10/31/2012 | |||||||
|
Morgan Stanley |
9,589 | 0.57 | USD | 08/06/2012 | 10/31/2012 | |||||||
|
Wells Fargo |
21,576 | 0.59 | USD | 08/13/2012 | 11/27/2012 | |||||||
|
Wells Fargo |
2,397 | 0.55 | USD | 09/26/2012 | 03/15/2013 | |||||||
|
Citibank |
16,781 | 0.41 | USD | 09/27/2012 | 01/15/2013 | |||||||
|
Citibank |
7,624 | 0.37 | USD | 10/05/2012 | 01/15/2013 | |||||||
|
Merrill Lynch |
14,384 | 0.33 | USD | 10/24/2012 | 01/22/2013 | |||||||
|
Citibank |
4,795 | 0.78 | USD | 10/25/2012 | 07/25/2013 | |||||||
|
JP Morgan |
9,589 | 0.27 | USD | 10/26/2012 | 12/13/2012 | |||||||
|
Merrill Lynch |
9,589 | 0.27 | USD | 10/26/2012 | 12/13/2012 | |||||||
|
Wells Fargo |
9,589 | 0.27 | USD | 10/26/2012 | 12/13/2012 | |||||||
|
Wells Fargo |
9,589 | 0.27 | USD | 10/26/2012 | 12/13/2012 | |||||||
|
Goldman Sachs |
9,589 | 0.27 | USD | 10/26/2012 | 12/13/2012 | |||||||
|
Citibank |
9,589 | 0.40 | USD | 10/31/2012 | 02/14/2013 | |||||||
|
Goldman Sachs |
9,589 | 0.40 | USD | 10/31/2012 | 02/14/2013 | |||||||
|
JP Morgan |
9,589 | 0.40 | USD | 10/31/2012 | 02/14/2013 | |||||||
|
Citibank |
2,328 | 0.25 | USD | 11/14/2012 | 01/14/2013 | |||||||
|
Wells Fargo |
23,974 | 0.35 | USD | 11/15/2012 | 02/14/2013 | |||||||
|
Goldman Sachs |
4,795 | 0.35 | USD | 11/26/2012 | 02/25/2013 | |||||||
F-86
Table of Contents
NOTES TO THE CONSOLIDATED FINANCIAL STATEMENTS, Continued
| 22. | Debt Issued, continued: |
|
Counterparty |
MCh$ | Interest rate | Currency | Issue date | Maturity date | |||||||
|
Merrill Lynch |
9,589 | 0.38 | USD | 11/27/2012 | 03/07/2013 | |||||||
|
Citibank |
2,397 | 0.38 | USD | 11/27/2012 | 03/07/2013 | |||||||
|
Citibank |
24,609 | 0.35 | USD | 12/03/2012 | 02/25/2013 | |||||||
|
Wells Fargo |
2,397 | 0.86 | USD | 12/03/2012 | 11/25/2013 | |||||||
|
Goldman Sachs |
28,777 | 0.42 | USD | 12/13/2012 | 03/15/2013 | |||||||
|
Citibank |
9,350 | 0.40 | USD | 12/13/2012 | 03/15/2013 | |||||||
|
Wells Fargo |
2,397 | 0.51 | USD | 12/17/2012 | 06/13/2013 | |||||||
|
Wells Fargo |
2,397 | 0.60 | USD | 12/19/2012 | 08/29/2013 | |||||||
|
Citibank |
2,397 | 0.20 | USD | 12/21/2012 | 02/20/2013 | |||||||
|
|
|
|||||||||||
|
Total as of December 31, 2012 |
516,428 | |||||||||||
Subordinated Bonds
|
Series |
MCh$ | Term |
Interest
rate |
Currency | Issue date |
Maturity
date |
||||||||
|
UCHI-G1111 |
13,191 | 25 years | 3.75 | UF | 07/30/2012 | 07/30/2037 | ||||||||
|
UCHI-G1111 |
1,099 | 25 years | 3.75 | UF | 07/31/2012 | 07/31/2037 | ||||||||
|
UCHI-G1111 |
1,782 | 25 years | 3.75 | UF | 08/31/2012 | 08/31/2037 | ||||||||
|
UCHI-G1111 |
10,105 | 25 years | 3.75 | UF | 12/28/2012 | 12/28/2037 | ||||||||
|
|
|
|||||||||||||
|
Total |
26,177 | |||||||||||||
|
|
|
|||||||||||||
The Bank has not had breaches of capital and interest with respect to its debts instruments and has complied with its debt covenants and other compromises related to debt issued during periods 2012 and 2013.
F-87
Table of Contents
NOTES TO THE CONSOLIDATED FINANCIAL STATEMENTS, Continued
| 23. | Other Financial Obligations: |
As of December 31, 2012 and 2013, other financial institutions are detailed as follows:
|
2012
MCh$ |
2013
MCh$ |
|||||||
|
Public sector obligations |
106,537 | 160,612 | ||||||
|
Other Chilean obligations |
55,586 | 50,314 | ||||||
|
|
|
|
|
|||||
|
Total |
162,123 | 210,926 | ||||||
|
|
|
|
|
|||||
F-88
Table of Contents
NOTES TO THE CONSOLIDATED FINANCIAL STATEMENTS, Continued
| 24. | Provisions: |
| (a) | As of December 31, 2012 and 2013, provisions are detailed as follows: |
|
2012
MCh$ |
2013
MCh$ |
|||||||
|
Provision for minimum dividens |
139,755 | 154,081 | ||||||
|
Other provisions for contingencies |
2,084 | 569 | ||||||
|
|
|
|
|
|||||
|
Total |
141,839 | 154,650 | ||||||
|
|
|
|
|
|||||
| (b) | The following table details the changes in provisions during 2012 and 2013: |
|
Minimum
dividends MCh$ |
Other
contingencies MCh$ |
Total
MCh$ |
||||||||||
|
Balances as of January 1, 2011 |
113,559 | 1,126 | 114,685 | |||||||||
|
Provisions established |
128,642 | 1,966 | 130,608 | |||||||||
|
Provisions used |
(113,559 | ) | (215 | ) | (113,774 | ) | ||||||
|
Provisions released |
— | (175 | ) | (175 | ) | |||||||
|
Other movements |
— | — | — | |||||||||
|
|
|
|
|
|
|
|||||||
|
Balances as of December 31, 2011 |
128,642 | 2,702 | 131,344 | |||||||||
|
|
|
|
|
|
|
|||||||
|
Balances as of January 1, 2012 |
128,642 | 2,702 | 131,344 | |||||||||
|
Provisions established |
139,755 | 229 | 139,984 | |||||||||
|
Provisions used |
(128,642 | ) | (223 | ) | (128,865 | ) | ||||||
|
Provisions released |
— | (624 | ) | (624 | ) | |||||||
|
Other movements |
— | — | — | |||||||||
|
|
|
|
|
|
|
|||||||
|
Balances as of December 31, 2012 |
139,755 | 2,084 | 141,839 | |||||||||
|
|
|
|
|
|
|
|||||||
|
Balances as of January 1, 2013 |
139,755 | 2,084 | 141,839 | |||||||||
|
Provisions established |
154,081 | 230 | 154,311 | |||||||||
|
Provisions used |
(139,755 | ) | (369 | ) | (140,124 | ) | ||||||
|
Provisions released |
— | (1,376 | ) | (1,376 | ) | |||||||
|
Other movements |
— | — | — | |||||||||
|
|
|
|
|
|
|
|||||||
|
Balances as of December 31, 2013 |
154,081 | 569 | 154,650 | |||||||||
|
|
|
|
|
|
|
|||||||
F-89
Table of Contents
NOTES TO THE CONSOLIDATED FINANCIAL STATEMENTS, Continued
| 25. | Employee Benefits: |
| (a) | Provisions for personnel benefits and payroll: |
|
2012
MCh$ |
2013
MCh$ |
|||||||
|
Short-term personnel benefits ((c)) |
29,649 | 32,000 | ||||||
|
Vacation accrual ((d)) |
20,842 | 21,895 | ||||||
|
Pension plan – defined benefit plan ((b)) |
10,633 | 10,696 | ||||||
|
Other benefits |
3,421 | 3,353 | ||||||
|
|
|
|
|
|||||
|
Total |
64,545 | 67,944 | ||||||
|
|
|
|
|
|||||
| (b) | Pension plan – Defined benefit plan: |
|
2012
MCh$ |
2013
MCh$ |
|||||||
|
Current service cost |
340 | 288 | ||||||
|
Interest cost on benefit obligation |
468 | 505 | ||||||
|
Actuarial gains and losses |
2,200 | 166 | ||||||
|
|
|
|
|
|||||
|
Net benefit expense |
3,008 | 959 | ||||||
|
|
|
|
|
|||||
The net benefit expense is recognized under “Personnel Expenses” (Note 34).
The principal assumptions used in determining pension obligations for the Bank’s plan are shown below:
|
December 31,
2012 % |
December 31,
2013 % |
|||||||
|
Discount rate |
5.50 | 5.19 | ||||||
|
Annual salary increase |
5.08 | 5.19 | ||||||
|
Payment probability |
99.99 | 99.99 | ||||||
The most recent actuarial valuation of the present value of the benefit plan obligation was carried out at December 31, 2013.
F-90
Table of Contents
NOTES TO THE CONSOLIDATED FINANCIAL STATEMENTS, Continued
| 25. | Employee Benefits, continued |
| (b) | Pension plan – Defined benefit plan, continued: |
Changes in the present value of the defined benefit obligation are as follows:
|
2012
MCh$ |
2013
MCh$ |
|||||||
|
Opening defined benefit obligation, January 1, |
8,511 | 10,633 | ||||||
|
Contributions by the employer |
808 | 793 | ||||||
|
Benefits paid |
(864 | ) | (896 | ) | ||||
|
Prepayments |
(22 | ) | — | |||||
|
Actuarial gains and losses |
2,200 | 166 | ||||||
|
|
|
|
|
|||||
|
Closing defined benefit obligation |
10,633 | 10,696 | ||||||
|
|
|
|
|
|||||
| (c) | The following table details the changes in provisions for incentive plans during 2012 and 2013: |
|
2012
MCh$ |
2013
MCh$ |
|||||||
|
Balances as of January 1, |
28,827 | 29,649 | ||||||
|
Provisions established |
28,406 | 32,456 | ||||||
|
Provisions used |
(27,584 | ) | (27,069 | ) | ||||
|
Provisions released |
— | (3,036 | ) | |||||
|
|
|
|
|
|||||
|
Balances as of December 31, |
29,649 | 32,000 | ||||||
|
|
|
|
|
|||||
| (d) | The following table details the changes in provisions for vacation during 2012 and 2013: |
|
2012
MCh$ |
2013
MCh$ |
|||||||
|
Balances as of January 1, |
20,361 | 20,842 | ||||||
|
Provisions established |
5,655 | 5,410 | ||||||
|
Provisions used |
(4,363 | ) | (4,181 | ) | ||||
|
Provisions released |
(811 | ) | (176 | ) | ||||
|
|
|
|
|
|||||
|
Balances as of December 31, |
20,842 | 21,895 | ||||||
|
|
|
|
|
|||||
F-91
Table of Contents
NOTES TO THE CONSOLIDATED FINANCIAL STATEMENTS, Continued
| 25. | Employee Benefits, continued |
| (e) | Provisions for share-based employee benefits: |
As of December 31, 2012 and 2013, the Bank and its subsidiaries do not have a stock compensation plan.
| 26. | Other Liabilities: |
As of December 31, 2012 and 2013, other liabilities are detailed as follows:
|
2012
MCh$ |
2013
MCh$ |
|||||||
|
Documents intermediated |
132,651 | 108,380 | ||||||
|
Accounts and notes payable (*) |
111,358 | 100,081 | ||||||
|
Financial guarantees |
13,333 | 17,613 | ||||||
|
VAT payable |
2,397 | 3,200 | ||||||
|
Leasing deferred gains |
5,900 | 4,207 | ||||||
|
Deferred income |
5,357 | 4,592 | ||||||
|
Insurance payments |
5,080 | 1,144 | ||||||
|
Pending transactions |
135 | 476 | ||||||
|
Other |
28,894 | 36,069 | ||||||
|
|
|
|
|
|||||
|
Total |
305,105 | 275,762 | ||||||
|
|
|
|
|
|||||
| (*) | This item includes obligations that fall outside the Bank’s line of business such as withholding taxes, social security payments, insurance payable, and balances from material purchases and provisions for expenses pending payment. |
F-92
Table of Contents
NOTES TO THE CONSOLIDATED FINANCIAL STATEMENTS, Continued
| 27. | Contingencies and Commitments: |
| (a) | Commitments accounted for in off-balance-sheet accounts: |
In order to satisfy its customers’ needs, the Bank entered into several irrevocable commitments and contingent obligations. Although these obligations are not recognized in the Statement of Financial Position, they entail credit risks and, therefore, form part of the Bank’s overall risk.
|
2012
MCh$ |
2013
MCh$ |
|||||||
|
Off-balance-sheet accounts |
||||||||
|
Guarantees and surety bonds |
323,924 | 491,465 | ||||||
|
Confirmed foreign letters of credit |
85,272 | 68,631 | ||||||
|
Issued foreign letters of credit |
138,714 | 166,849 | ||||||
|
Bank guarantees |
1,437,312 | 1,402,399 | ||||||
|
Immediately available credit lines |
5,481,235 | 5,436,938 | ||||||
|
Other commitments |
122,997 | — | ||||||
|
Transactions on behalf of third parties |
||||||||
|
Collections |
386,006 | 357,672 | ||||||
|
Third-party resources managed by the Bank: |
||||||||
|
Financial assets managed on behalf of third parties |
12,144 | 1,311 | ||||||
|
Other assets managed on behalf of third parties |
— | — | ||||||
|
Financial assets acquired on its own behalf |
22,802 | 44,839 | ||||||
|
Fiduciary activities |
||||||||
|
Securities held in safe custody in the Bank |
6,237,859 | 7,342,425 | ||||||
|
Securities held in safe custody in other entities |
4,483,567 | 4,501,555 | ||||||
|
|
|
|
|
|||||
|
Total |
18,731,832 | 19,814,084 | ||||||
|
|
|
|
|
|||||
| (b) | Lawsuits and legal proceedings: |
| (b.1) | Legal contingencies within the ordinary course of business: |
In the ordinary course of business, the Bank and its subsidiaries act as defendant or co-defendant in various litigation matters. Although there can be no assurances, the Bank’s management believes, based on information currently available, that the ultimate resolution of these legal proceedings are not likely to have a material adverse effect on its results of operations, financial condition, or liquidity. As of December 31, 2012 and 2013, the Bank has established provisions for this concept in the amount of MCh$474 and MCh$339, recorded within “Provisions” in the statement of financial position. The following table presents estimated date of completion of the respective litigation:
| As of December 31, 2013 | ||||||||||||||||||||||||
|
2014
MCh$ |
2015
MCh$ |
2016
MCh$ |
2017
MCh$ |
2018
MCh$ |
Total
MCh$ |
|||||||||||||||||||
|
Legal contingencies |
30 | 5 | 72 | 149 | 83 | 339 | ||||||||||||||||||
F-93
Table of Contents
NOTES TO THE CONSOLIDATED FINANCIAL STATEMENTS, Continued
| 27. | Contingencies and Commitments, continued: |
| (b.2) | Contingencies for significant lawsuits: |
As of December 31, 2012 and 2013, the Bank is not party to any significant lawsuits that affect or may affect these consolidated financial statements.
| (c) | Guarantees granted: |
| (i) | In subsidiary Banchile Administradora General de Fondos S.A.: |
In compliance with article 226 and subsequent articles of Law 18,045, Banchile Administradora General de Fondos S.A., has designated Banco de Chile as the representative of the beneficiaries of the guarantees it has established and in that character the Bank has issued bank guarantees totaling UF 2,515,000, maturing January 9, 2014.
For Mutual Funds that have not begun its operations as of December 31, 2013, it has constituted bank guarantees, which corresponds to Mutual Fund Booster Brasil 2014 by UF10,000 and Mutual Fund Deposito Plus V – Guaranteed by UF10,000.
In addition to these guarantees for creating mutual funds, there are other guarantees for a guaranteed capital on certain mutual funds, totaling Ch$75,474 million as of December 31, 2013 (Ch$118,734 million in 2012).
| Fund |
2013
MCh$ |
|||
|
Mutual Fund Deposito Plus IV |
16,325 | |||
|
Mutual Fund Deposito Plus |
14,241 | |||
|
Mutual Fund Deposito Plus III |
12,937 | |||
|
Mutual Fund Depósito Plus II |
9,308 | |||
|
Mutual Fund Small Cap USA |
5,197 | |||
|
Mutual Fund Chile Bursátil |
5,050 | |||
|
Mutual Fund Twin Win Europa 103 |
3,537 | |||
|
Mutual Fund Global Stocks |
2,964 | |||
|
Mutual Fund Second Best Chile EEUU |
2,207 | |||
|
Mutual Fund Europa Accionario |
2,059 | |||
|
Mutual Fund Second Best Europa China |
1,649 | |||
|
|
|
|||
|
Total |
75,474 | |||
|
|
|
|||
In compliance with the stablished by the Superintendence of Securities and Insurance in letter f) of Circular 1,894 of September 24, 2008, the entity has constituted guarantees, by management portfolio, in benefit of investor. Such guarantee corresponds to a bank guarantee for UF100,000, with maturity on January 9, 2014.
F-94
Table of Contents
NOTES TO THE CONSOLIDATED FINANCIAL STATEMENTS, Continued
| 27. | Contingencies and Commitments, continued: |
| (c) | Guarantees granted, continued: |
| (ii) | In subsidiary Banchile Corredores de Bolsa S.A.: |
For the purposes of ensuring correct and complete compliance with all of its obligations as broker-dealer entity, in conformity with the provisions of article 30 and subsequent articles of Law 18,045 on Securities Markets, the subsidiary established a guarantee in an insurance policy for UF 20,000, insured by Cía. de Seguros de Crédito Continental S.A., that matures April 22, 2014, whereby the Securities Exchange of the Santiago Stock Exchange was appointed as the subsidiary’s creditors to representative.
The Bank has given the following guarantees in relation to this subsidiary’s business activities:
|
2012
MCh$ |
2013
MCh$ |
|||||||
|
Guarantees: |
||||||||
|
Shares to secure short-sale transactions in: |
||||||||
|
Securities Exchange of the Santiago Stock Exchange |
69 | 16,946 | ||||||
|
Securities Exchange of the Electronic Stock Exchange of Chile |
33,693 | 10,644 | ||||||
|
Fixed income securities to ensure system CCLV, Bolsa de Comercio de Santiago, Bolsa de Valores |
3,068 | 2,995 | ||||||
|
Fixed income securities to ensure stock loan, Bolsa Eléctronica de Chile, Bolsa de Valores |
47 | 68 | ||||||
|
|
|
|
|
|||||
|
Total |
36,877 | 30,653 | ||||||
|
|
|
|
|
|||||
In conformity with the provisions of internal stock market regulations, and for the purpose of securing the broker’s correct performance, the company established a pledge on its share of the Santiago Stock Exchange in favor of that institution, as recorded in Public Deed on September 13, 1990, signed before Santiago public notary Mr. Raúl Perry Pefaur, and on its share in the Electronic Stock Exchange of Chile in favor of that institution, as recorded in a contract entered into by both parties on May 16, 1990.
Banchile Corredores de Bolsa S.A. keeps an insurance policy current with Chartis Chile – Compañía de Seguros Generales S.A. that expires January 2, 2013, and that covers employee fidelity, physical losses, falsification or adulteration, and currency fraud with a coverage amount equivalent to US$ 10,000,000. This secure was renewed on January 2, 2013 with maturity of January 2, 2014 for the same amount with “AIG Chile Compañía de Seguros Generales S.A.”
F-95
Table of Contents
NOTES TO THE CONSOLIDATED FINANCIAL STATEMENTS, Continued
| 27. | Contingencies and Commitments, continued: |
| (c) | Guarantees granted, continued: |
| (ii) | In subsidiary Banchile Corredores de Bolsa S.A., continued: |
According to disposition of Chilean Central Bank, it was constituted a bank guarantee corresponding to UF10,500, with purposes to comply with the contract SOMA (Contract for Service System Open Market Operations) of Chilean Central Bank. This bank guarantee is revaluated in UF to fixed term, not endorsable with maturity of July 17, 2014.
It was constituted a bank guarantee No. 373148-0 corresponds to UF272,000, in benefits of investors with contracts of portfolio management. This bank guarantee is revaluated in UF to fixed term, not endorsable with maturity of January 9, 2014.
It was constituted a cash guarantee for an amount of US$122,494.32, whose purpose is to comply obligations with Pershing, by operations made through this broker.
| (iii) | In subsidiary Banchile Corredores de Seguros Ltda. |
According to established in article No. 58, letter D of D.F.L. 251, as of December 31, 2013, the entity maintains two insurance policies that protect it in the face of possible damages that it could affect it, due to infractions of the law, regulations and complementary rules that regulate insurance brokers, and specially when the non-compliance is from acts, mistakes or omissions of the brokers, its represents, agent or dependent that participate in the intermediation.
The policies contracted are the following:
| Matter insured | Amount Insured (UF) | |||
|
Responsibility for errors and omissions policy |
60,000 | |||
|
Civil responsibility policy |
500 | |||
F-96
Table of Contents
NOTES TO THE CONSOLIDATED FINANCIAL STATEMENTS, Continued
| 28. | Equity: |
| (a) | Authorized, subscribed and paid shares: |
As of December 31, 2013, the paid-in capital of Banco de Chile is represented by 93,175,043,991 registered shares (89,898,992,667 in 2012), with no par value, subscribed and fully paid.
| (b) | Capital increase: |
On October 17, 2012, institutions at the Extraordinary Shareholders Meeting agreed to increase the Bank’s capital in the amount of Ch$250,000,000,000 by means of the issuance of 3,939,489,442 cash shares, designated “Banco de Chile-T” series, with that same rights as all other ordinary Banco de Chile shares, with the exception that they will not allow its shareholders to receive dividends and/or fully paid-in shares with respect to our net distributable earnings for fiscal year 2012. Once these dividends and/or fully paid-in shares are distributed and paid, the “Banco de Chile-T” shares will be automatically converted into “Banco de Chile” shares.
| (c) | Shares: |
| (c.1) | On May 13, 2013, Banco de Chile informed of the capitalization of 30% of the distributable net income obtained during the fiscal year ending December 31, 2012, through the issuance of fully paid-in shares, of no par value, agreed in the Extraordinary Shareholders Meeting held on March 21, 2013, which are as follows: |
In the said Extraordinary Shareholders Meeting, it was agreed to increase the Bank´s capital in the amount of Ch$86,201,422,505 through the issuance of 1,197,741,038 fully paid-in shares, of no par value, payable under the distributable net income for the year 2012 that was not distributed as dividends as agreed at the Ordinary Shareholders Meeting held on the same day.
The issuance of fully in paid shares was registered in the Securities Register of the Superintendence of Banks and Financial Institutions with No. 2/2013, on May 10, 2013.
The Board of Directors of Banco de Chile, at the meeting No. 2,775, dated May 9, 2013, set May 30, 2013, as the date for issuance and distribution of the fully paid in shares.
| (c.2) | During the period 2013, it was finished subscription and payment of 2,078,310,286 shares by an amount of Ch$134,071 million, corresponding to the capital increase agreed in Extraordinary Shareholders Meeting held on October 17, 2012. |
F-97
Table of Contents
NOTES TO THE CONSOLIDATED FINANCIAL STATEMENTS, Continued
| 28. | Equity, continued: |
| (c) | Shares, continued |
| (c.3) | The following table shows the share movements from December 31, 2011 to December 31, 2013: |
| Ordinary shares |
Ordinary T
Series shares (*) |
Total shares | ||||||||||
|
Total shares as of December 31, 2011 |
86,942,514,973 | — | 86,942,514,973 | |||||||||
|
|
|
|
|
|
|
|||||||
|
Capitalization of retained earnings (**) |
1,095,298,538 | — | 1,095,298,538 | |||||||||
|
Fully paid and subscribed shares |
— | 1,861,179,156 | 1,861,179,156 | |||||||||
|
|
|
|
|
|
|
|||||||
|
Total shares subscribed and fully paid as of December 31, 2012 |
88,037,813,511 | 1,861,179,156 | 89,898,992,667 | |||||||||
|
Shares subscribed and paid period 2013 |
— | 2,078,310,286 | 2,078,310,286 | |||||||||
|
Conversion of “Banco de Chile- T” shares into “Banco de Chile” shares |
3,939,489,442 | (3,939,489,442 | ) | — | ||||||||
|
Capitalization of retained earnings (***) |
1,197,741,038 | — | 1,197,741,038 | |||||||||
|
|
|
|
|
|
|
|||||||
|
Total Shares as of December 31, 2013 |
93,175,043,991 | — | 93,175,043,991 | |||||||||
|
|
|
|
|
|
|
|||||||
| (*) | Capital increase as of October 17, 2012. |
| (**) | Capitalization of March 22, 2012 |
| (***) | Capitalization of May 13, 2013. |
F-98
Table of Contents
NOTES TO THE CONSOLIDATED FINANCIAL STATEMENTS, Continued
| 28. | Equity, continued: |
| (d) | Shareholders’ composition: |
As of December 31, 2012, the shareholder composition was as follows:
|
Corporate Name or Shareholder’s Name |
Shares |
% of
Equity Holding |
||||||
|
LQ Inversiones Financieras S.A. |
29,760,938,681 | 33.10 | ||||||
|
Sociedad Administradora de la Obligación Subordinada SAOS S.A. |
28,593,701,789 | 31.81 | ||||||
|
Sociedad Matriz del Banco de Chile S.A. SM-Chile S.A. |
12,138,537,826 | 13.50 | ||||||
|
Other minority shareholders |
19,405,814,371 | 21.59 | ||||||
|
|
|
|
|
|||||
|
Total |
89,898,992,667 | 100.00 | ||||||
|
|
|
|
|
|||||
As of December 31, 2013, the shareholder composition was as follows:
|
Corporate Name or Shareholder’s Name |
Shares |
% of
Equity Holding |
||||||
|
LQ Inversiones Financieras S.A. |
30,353,093,809 | 32.58 | ||||||
|
Sociedad Administradora de la Obligación Subordinada SAOS S.A. |
28,593,701,789 | 30.69 | ||||||
|
Sociedad Matriz del Banco de Chile S.A. SM-Chile S.A. |
12,138,543,602 | 13.03 | ||||||
|
Other minority shareholders |
22,089,704,791 | 23.70 | ||||||
|
|
|
|
|
|||||
|
Total |
93,175,043,991 | 100.00 | ||||||
|
|
|
|
|
|||||
F-99
Table of Contents
NOTES TO THE CONSOLIDATED FINANCIAL STATEMENTS, Continued
| 28. | Equity, continued: |
| (e) | Approval and payment of dividends: |
At the Ordinary Shareholders’ Meeting held on March 22, 2012, the Bank’s shareholders agreed to distribute and pay dividend No. 200 amounting to Ch$2.984740 per common share of Banco de Chile, with charge to net income for the year ended December 31, 2011. The amount of dividend paid of the period 2012 was Ch$296,802 million.
At the Ordinary Shareholders’ Meeting held on March 21, 2013, the Bank’s shareholders agreed to distribute and pay dividend No. 201 amounting to Ch$3.41625263165 per common share of Banco de Chile, with charge to net income for the year ended December 31, 2012. The amount of dividend paid of the period 2013 was Ch$343,455 million.
The following dividends were declared and paid by the Bank for the year ended as of December 31, 2011, 2012 and 2013:
|
2011
MCh$ |
2012
MCh$ |
2013
MCh$ |
||||||||||
|
Dividends on ordinary shares: |
279,216 | 296,802 | 343,455 | |||||||||
|
Dividends per ordinary share (1) : |
Ch$ | 3.38 | Ch$ | 3.41 | Ch$ | 3.90 | (*) | |||||
| (1) | Dividends per share are calculated by dividing the amount of the dividend paid during each year by the previous year’s number of shares outstanding. |
| (*) | This dividend per share is composed of the dividend paid to the Central Bank and common shareholders for amounts of MCh$142,318 and MCh$201,137, respectively. The Central Bank has 29,161.4 shares with a payment of Ch$4.880361 per common share of Banco de Chile and for common shareholders the number of shares are 58,876.4 with a payment of Ch$3.416253 per common share of Banco de Chile. |
| (f) | Provision for minimum dividends: |
Chilean Corporations Law mandates a minimum distribution of 30% of distributable income. Accordingly, the Bank recorded a liability under the line item “Provisions” for an amount of MCh$154,081 (MCh$139,755 in December 31, 2012) against “Retained earnings”.
| (g) | Other comprehensive income: |
The cumulative translation adjustment is generated from the Bank’s translation of its investments in foreign companies, as it records the effects of foreign currency translation for these items in equity.
In accordance with Note 2(x), the fair market value adjustment for available-for-sale instruments is generated by fluctuations in the fair value of that portfolio, with a charge or credit to equity, net of deferred taxes (see Note 12).
F-100
Table of Contents
NOTES TO THE CONSOLIDATED FINANCIAL STATEMENTS, Continued
| 28. | Equity, continued: |
| (h) | Earnings per share |
Earnings per share is calculated by dividing the net profit for the year attributable to the ordinary equity holders of the Bank by the weighted average number of ordinary shares outstanding during the year.
The following table shows the income and share data used in the calculation of EPS:
| As of December 31, | ||||||||||||
| 2011 | 2012 | 2013 | ||||||||||
|
Basic and diluted earnings per share: |
||||||||||||
|
Net profits attributable to ordinary equity holders of the Bank |
438,143 | 479,880 | 550,188 | |||||||||
|
Weighted average number of ordinary shares (*) |
89,285,134,103 | 89,347,559,416 | 92,991,448,281 | |||||||||
|
Earnings per share |
4.91 | 5.37 | 5.92 | |||||||||
| (*) |
During 2011, 2012 and 2013 were capitalized 1,095,298,538; 1,005,766,185 and 1,197,741,038 shares respectively, which are considered in earnings per share calculation as if they had been outstanding during all periods presented. |
During the periods presented the Bank did not have any instruments that could lead to a dilution of its ordinary shares.
There have been no transactions involving ordinary shares or potential ordinary shares between the reporting date and the date of the completion of these financial statements.
| 29. | Interest Revenue and Expenses: |
| (a) | As of each year end, interest revenue is detailed as follows: |
| 2011 | 2012 | 2013 | ||||||||||
| MCh$ | MCh$ | MCh$ | ||||||||||
|
Commercial loans |
711,946 | 790,696 | 833,163 | |||||||||
|
Consumer loans |
435,978 | 522,907 | 567,987 | |||||||||
|
Residential mortgage loans |
266,914 | 266,625 | 288,890 | |||||||||
|
Financial investments |
71,669 | 76,576 | 85,124 | |||||||||
|
Repurchase agreements |
14,605 | 12,553 | 2,496 | |||||||||
|
Loans and advances to banks |
10,322 | 12,993 | 15,728 | |||||||||
|
Loss from accounting hedges |
(12,411 | ) | (11,296 | ) | (29,097 | ) | ||||||
|
Other interest revenue |
2,661 | 1,712 | 1,651 | |||||||||
|
|
|
|
|
|
|
|||||||
|
Total |
1,501,684 | 1,672,766 | 1,765,942 | |||||||||
|
|
|
|
|
|
|
|||||||
F-101
Table of Contents
NOTES TO THE CONSOLIDATED FINANCIAL STATEMENTS, Continued
| 29. | Interest Revenue and Expenses, continued: |
| (b) | As of each year end, interest expenses are detailed as follows: |
| 2011 | 2012 | 2013 | ||||||||||
| MCh$ | MCh$ | MCh$ | ||||||||||
|
Saving accounts and time deposits |
425,968 | 496,985 | 482,600 | |||||||||
|
Debt issued |
153,896 | 170,222 | 199,330 | |||||||||
|
Borrowings from financial institutions |
3,823 | 3,078 | 2,814 | |||||||||
|
Demand deposits |
10,849 | 14,986 | 13,149 | |||||||||
|
Other financial obligations |
23,784 | 22,308 | 13,791 | |||||||||
|
Repurchase agreements |
(185 | ) | (3,003 | ) | (10,565 | ) | ||||||
|
Loss from accounting hedges |
5,934 | 3,946 | 3,153 | |||||||||
|
Other interest expenses |
140 | 107 | 99 | |||||||||
|
|
|
|
|
|
|
|||||||
|
Total |
624,209 | 708,629 | 704,371 | |||||||||
|
|
|
|
|
|
|
|||||||
| (c) | As of each year end, loss from accounting hedge is the following: |
| 2011 | 2012 | 2013 | ||||||||||
| MCh$ | MCh$ | MCh$ | ||||||||||
|
Cash Flow hedge |
(1,029 | ) | (2,318 | ) | (51,795 | ) | ||||||
|
Fair value hedge |
(11,197 | ) | (5,975 | ) | 33,263 | |||||||
|
|
|
|
|
|
|
|||||||
|
Total |
(12,226 | ) | (8,293 | ) | (18,532 | ) | ||||||
|
|
|
|
|
|
|
|||||||
F-102
Table of Contents
NOTES TO THE CONSOLIDATED FINANCIAL STATEMENTS, Continued
| 30. | Income and Expenses from Fees and Commissions: |
The income and expenses for fees and commissions shown in the Consolidated Statement of Comprehensive Income refers to the following items:
| 2011 | 2012 | 2013 | ||||||||||
| MCh$ | MCh$ | MCh$ | ||||||||||
|
Income from fees and commissions |
||||||||||||
|
Card services |
92,282 | 104,007 | 108,851 | |||||||||
|
Collections and payments |
49,764 | 60,341 | 64,135 | |||||||||
|
Investments in mutual funds and other |
63,809 | 56,043 | 54,833 | |||||||||
|
Portfolio management |
29,851 | 31,446 | 35,920 | |||||||||
|
Lines of credit and overdrafts |
22,771 | 22,892 | 22,206 | |||||||||
|
Insurance brokerage |
20,480 | 17,404 | 18,840 | |||||||||
|
Guarantees and letter of credit |
12,888 | 14,454 | 17,611 | |||||||||
|
Trading and securities management |
27,779 | 16,892 | 17,526 | |||||||||
|
Use of distribution channel |
18,430 | 15,942 | 14,705 | |||||||||
|
Financial advisory services |
3,186 | 3,955 | 4,054 | |||||||||
|
Other fees earned |
26,726 | 29,391 | 28,051 | |||||||||
|
|
|
|
|
|
|
|||||||
|
Total income from fees and commissions |
367,966 | 372,767 | 386,732 | |||||||||
|
|
|
|
|
|
|
|||||||
|
Expenses from fees and commissions |
||||||||||||
|
Credit card transactions |
(54,187 | ) | (62,020 | ) | (75,083 | ) | ||||||
|
Sales force fees |
(8,312 | ) | (10,098 | ) | (11,815 | ) | ||||||
|
Fees for collections and payments |
(6,619 | ) | (6,534 | ) | (6,658 | ) | ||||||
|
Fees for securities transactions |
(4,246 | ) | (2,994 | ) | (3,103 | ) | ||||||
|
Sale of mutual fund units |
(3,038 | ) | (2,488 | ) | (2,318 | ) | ||||||
|
Other fees |
(1,456 | ) | (1,361 | ) | (662 | ) | ||||||
|
|
|
|
|
|
|
|||||||
|
Total expenses from fees and commissions |
(77,858 | ) | (85,495 | ) | (99,639 | ) | ||||||
|
|
|
|
|
|
|
|||||||
F-103
Table of Contents
NOTES TO THE CONSOLIDATED FINANCIAL STATEMENTS, Continued
| 31. | Net Financial Operating Income: |
The gain (losses) from trading and brokerage activities is detailed as follows:
| 2011 | 2012 | 2013 | ||||||||||
| MCh$ | MCh$ | MCh$ | ||||||||||
|
Financial assets held-for-trading |
13,386 | 9,031 | 24,584 | |||||||||
|
Sale of available-fro-sale instruments |
2,289 | 8,088 | 14,881 | |||||||||
|
Net loss of other transactions(*) |
(353 | ) | 2,567 | (1,089 | ) | |||||||
|
Derivative instruments |
41,346 | (3,633 | ) | (6,018 | ) | |||||||
|
Sale of loan portfolio |
1,433 | 146 | 314 | |||||||||
|
|
|
|
|
|
|
|||||||
|
Total |
58,101 | 16,199 | 32,672 | |||||||||
|
|
|
|
|
|
|
|||||||
| (*) | Includes hedge ineffectiveness recognized in income statement for an amount of MCh$(89) |
| 32. | Foreign Exchange Transaction, net: |
| 2011 | 2012 | 2013 | ||||||||||
| MCh$ | MCh$ | MCh$ | ||||||||||
|
Translation difference, net |
(18,495 | ) | 44,736 | (1,796 | ) | |||||||
|
Indexed foreign currency |
11,489 | (9,404 | ) | 7,451 | ||||||||
|
Loss from accounting hedges |
(967 | ) | (196 | ) | 65,802 | |||||||
|
|
|
|
|
|
|
|||||||
|
Total |
(7,973 | ) | 35,136 | 71,457 | ||||||||
|
|
|
|
|
|
|
|||||||
F-104
Table of Contents
NOTES TO THE CONSOLIDATED FINANCIAL STATEMENTS, Continued
| 33. | Provisions for Loan Losses: |
The changes during 2011, 2012 and 2013 are the following:
| Loans to customers as of December 31, 2011 | ||||||||||||||||||||||||||||
|
Loans and
advance to banks |
Commercial
loans |
Mortgage
loans |
Consumer
loans |
Total |
Financial
guarantees |
Total | ||||||||||||||||||||||
|
Provisions established: |
||||||||||||||||||||||||||||
|
Individual provisions |
(396 | ) | (51,160 | ) | — | — | (51,160 | ) | (4,412 | ) | (55,968 | ) | ||||||||||||||||
|
Group provisions |
— | (42,132 | ) | (3,553 | ) | (110,344 | ) | (156,029 | ) | — | (156,029 | ) | ||||||||||||||||
|
|
|
|
|
|
|
|
|
|
|
|
|
|
|
|||||||||||||||
|
Provisions established, net |
(396 | ) | (93,292 | ) | (3,553 | ) | (110,344 | ) | (207,189 | ) | (4,412 | ) | (211,997 | ) | ||||||||||||||
|
|
|
|
|
|
|
|
|
|
|
|
|
|
|
|||||||||||||||
|
Provisions released: |
||||||||||||||||||||||||||||
|
Individual provisions |
— | 14,515 | — | — | 14,515 | — | 14,515 | |||||||||||||||||||||
|
Group provisions |
— | — | — | — | — | 4,902 | 4,902 | |||||||||||||||||||||
|
|
|
|
|
|
|
|
|
|
|
|
|
|
|
|||||||||||||||
|
Provisions released, net |
— | 14,515 | — | — | 14,515 | 4,902 | 19,417 | |||||||||||||||||||||
|
|
|
|
|
|
|
|
|
|
|
|
|
|
|
|||||||||||||||
|
Recovery of written-off assets |
— | 16,104 | 1,106 | 28,445 | 45,655 | — | 45,655 | |||||||||||||||||||||
|
|
|
|
|
|
|
|
|
|
|
|
|
|
|
|||||||||||||||
|
Provisions, net allowances for credit risk |
(396 | ) | (62,673 | ) | (2,447 | ) | (81,899 | ) | (147,019 | ) | 490 | (146,925 | ) | |||||||||||||||
|
|
|
|
|
|
|
|
|
|
|
|
|
|
|
|||||||||||||||
F-105
Table of Contents
NOTES TO THE CONSOLIDATED FINANCIAL STATEMENTS, Continued
| 33. | Provisions for Loan Losses, continued: |
| Loans to customers as of December 31, 2012 | ||||||||||||||||||||||||||||
|
Loans and
advance to banks |
Commercial
loans |
Mortgage
loans |
Consumer
loans |
Total |
Financial
Guarantees |
Total | ||||||||||||||||||||||
|
Provisions established: |
||||||||||||||||||||||||||||
|
Individual provisions |
— | (13,668 | ) | — | — | (13,668 | ) | (1,394 | ) | (15,062 | ) | |||||||||||||||||
|
Group provisions |
— | (46,807 | ) | (4,428 | ) | (160,775 | ) | (212,010 | ) | (222 | ) | (212,232 | ) | |||||||||||||||
|
|
|
|
|
|
|
|
|
|
|
|
|
|
|
|||||||||||||||
|
Provisions established, net |
— | (60,475 | ) | (4,428 | ) | (160,775 | ) | (225,678 | ) | (1,616 | ) | (227,294 | ) | |||||||||||||||
|
|
|
|
|
|
|
|
|
|
|
|
|
|
|
|||||||||||||||
|
Provisions released: |
||||||||||||||||||||||||||||
|
Individual provisions |
47 | 17,883 | — | — | 17,883 | 1,982 | 19,912 | |||||||||||||||||||||
|
Group provisions |
— | — | — | — | — | — | — | |||||||||||||||||||||
|
|
|
|
|
|
|
|
|
|
|
|
|
|
|
|||||||||||||||
|
Provisions released, net |
47 | 17,883 | — | — | 17,883 | 1,982 | 19,912 | |||||||||||||||||||||
|
|
|
|
|
|
|
|
|
|
|
|
|
|
|
|||||||||||||||
|
Recovery of written-off assets |
— | 14,892 | 1,971 | 24,099 | 40,962 | — | 40,962 | |||||||||||||||||||||
|
|
|
|
|
|
|
|
|
|
|
|
|
|
|
|||||||||||||||
|
Provisions, net allowances for credit risk |
47 | (27,700 | ) | (2,457 | ) | (136,676 | ) | (166,833 | ) | 366 | (166,420 | ) | ||||||||||||||||
|
|
|
|
|
|
|
|
|
|
|
|
|
|
|
|||||||||||||||
F-106
Table of Contents
NOTES TO THE CONSOLIDATED FINANCIAL STATEMENTS, Continued
| 33. | Provisions for Loan Losses, continued: |
| Loans to customers as of December 31, 2013 | ||||||||||||||||||||||||||||
|
Loans and
advance to banks |
Commercial
loans |
Mortgage
loans |
Consumer
loans |
Total |
Financial
Guarantees |
Total | ||||||||||||||||||||||
|
Provisions established: |
||||||||||||||||||||||||||||
|
Individual provisions |
(333 | ) | (39,744 | ) | — | — | (39,744 | ) | (3,955 | ) | (44,032 | ) | ||||||||||||||||
|
Group provisions |
— | (49,808 | ) | (5,665 | ) | (167,496 | ) | (222,969 | ) | (8,737 | ) | (231,706 | ) | |||||||||||||||
|
|
|
|
|
|
|
|
|
|
|
|
|
|
|
|||||||||||||||
|
Provisions established net |
(333 | ) | (89,552 | ) | (5,665 | ) | (167,496 | ) | (262,713 | ) | (12,692 | ) | (275,738 | ) | ||||||||||||||
|
|
|
|
|
|
|
|
|
|
|
|
|
|
|
|||||||||||||||
|
Provisions released: |
||||||||||||||||||||||||||||
|
Individual provisions |
— | 2,127 | — | — | 2,127 | 9,003 | 11,130 | |||||||||||||||||||||
|
Group provisions |
— | — | — | — | — | — | — | |||||||||||||||||||||
|
|
|
|
|
|
|
|
|
|
|
|
|
|
|
|||||||||||||||
|
Provisions released net |
— | 2,127 | — | — | 2,127 | 9,003 | 11,130 | |||||||||||||||||||||
|
|
|
|
|
|
|
|
|
|
|
|
|
|
|
|||||||||||||||
|
Recovery of written-off assets |
— | 13,330 | 1,927 | 27,698 | 42,955 | — | 42,955 | |||||||||||||||||||||
|
|
|
|
|
|
|
|
|
|
|
|
|
|
|
|||||||||||||||
|
Provisions net allowances for credit risk |
(333 | ) | (74,095 | ) | (3,738 | ) | (139,798 | ) | (217,631 | ) | (3,689 | ) | (221,653 | ) | ||||||||||||||
|
|
|
|
|
|
|
|
|
|
|
|
|
|
|
|||||||||||||||
F-107
Table of Contents
NOTES TO THE CONSOLIDATED FINANCIAL STATEMENTS, Continued
| 34. | Personnel Expenses: |
Personnel expenses in 2011, 2012 and 2013 are detailed as follows:
| 2011 | 2012 | 2013 | ||||||||||
| MCh$ | MCh$ | MCh$ | ||||||||||
|
Remuneration |
169,114 | 185,479 | 192,182 | |||||||||
|
Bonuses |
100,494 | 71,674 | 76,285 | |||||||||
|
Lunch and health benefits |
20,272 | 21,954 | 22,631 | |||||||||
|
Staff severance indemnities |
6,221 | 10,408 | 10,523 | |||||||||
|
Training expenses |
1,493 | 1,671 | 2,877 | |||||||||
|
Other personnel expenses |
19,451 | 18,679 | 18,738 | |||||||||
|
|
|
|
|
|
|
|||||||
|
Total |
317,045 | 309,865 | 323,236 | |||||||||
|
|
|
|
|
|
|
|||||||
| 35. | Administrative Expenses: |
As of December 31, 2011, 2012 and 2013, administrative expenses are detailed as follows:
| 2011 | 2012 | 2013 | ||||||||||
| MCh$ | MCh$ | MCh$ | ||||||||||
|
General administrative expenses |
153,191 | 160,717 | 164,228 | |||||||||
|
Outsources services |
37,601 | 42,015 | 44,118 | |||||||||
|
Marketing expenses |
26,515 | 30,572 | 29,053 | |||||||||
|
Taxes, payroll taxes and contributions |
9,879 | 11,499 | 12,514 | |||||||||
|
Board expenses |
2,733 | 2,656 | 2,589 | |||||||||
|
|
|
|
|
|
|
|||||||
|
Total |
229,919 | 247,459 | 252,502 | |||||||||
|
|
|
|
|
|
|
|||||||
F-108
Table of Contents
NOTES TO THE CONSOLIDATED FINANCIAL STATEMENTS, Continued
| 36. | Depreciation, Amortization and Impairment: |
| (a) | Amounts charged to income for depreciation and amortization during 2011, 2012 and 2013 are detailed as follows: |
| 2011 | 2012 | 2013 | ||||||||||
| MCh$ | MCh$ | MCh$ | ||||||||||
|
Depreciation and amortization |
||||||||||||
|
Depreciation of property and equipment (Note No.15a) |
20,543 | 20,614 | 19,280 | |||||||||
|
Amortization of intangibles assets (Note No.14a) |
14,588 | 14,532 | 8,397 | |||||||||
|
|
|
|
|
|
|
|||||||
|
Total |
35,131 | 35,146 | 27,677 | |||||||||
|
|
|
|
|
|
|
|||||||
| (b) | As of December 31, 2011, 2012 and 2013, the impairment loss is detailed as follows: |
| 2011 | 2012 | 2013 | ||||||||||
| MCh$ | MCh$ | MCh$ | ||||||||||
|
Impairment loss |
||||||||||||
|
Impairment loss on investment instruments |
— | 551 | — | |||||||||
|
Impairment loss on property and equipment (Note No.15a) |
335 | 348 | 757 | |||||||||
|
Impairment loss on intangibles assets (Note No.14a)(*) |
296 | — | 1,490 | |||||||||
|
|
|
|
|
|
|
|||||||
|
Total |
631 | 899 | 2,247 | |||||||||
|
|
|
|
|
|
|
|||||||
| (*) | As of December 31, 2013 we recognized impairment by an amount of MCh$1,462 |
F-109
Table of Contents
NOTES TO THE CONSOLIDATED FINANCIAL STATEMENTS, Continued
| 37. | Other Operating Income: |
During 2011, 2012 and 2013, the Bank and its subsidiaries presented the following under other operating income:
| 2011 | 2012 | 2013 | ||||||||||
| MCh$ | MCh$ | MCh$ | ||||||||||
|
Rental income |
5,614 | 6,007 | 7,440 | |||||||||
|
Income for assets received in lieu of payment |
5,918 | 5,674 | 6,126 | |||||||||
|
Expense recovery |
1,957 | 2,895 | 3,670 | |||||||||
|
Recovery from correspondent banks |
2,207 | 2,379 | 2,264 | |||||||||
|
Release of provisions for contingencies |
173 | 624 | 1,376 | |||||||||
|
Refund of insurance |
1,594 | 19 | 40 | |||||||||
|
Foreign advisory services |
1,474 | — | — | |||||||||
|
Other |
5,798 | 3,289 | 4,968 | |||||||||
|
|
|
|
|
|
|
|||||||
|
Total |
24,735 | 20,887 | 25,884 | |||||||||
|
|
|
|
|
|
|
|||||||
| 38. | Other Operating Expenses: |
During 2011, 2012 and 2013, the Bank and its subsidiaries incurred the following other operating expenses:
| 2011 | 2012 | 2013 | ||||||||||
| MCh$ | MCh$ | MCh$ | ||||||||||
|
Provision for other assets |
755 | 6,333 | 4,745 | |||||||||
|
Write-offs for operatings risks |
3,002 | 9,526 | 4,145 | |||||||||
|
Card administration |
1,297 | 1,113 | 1,106 | |||||||||
|
Provisions for contingencies |
2,495 | 1,109 | 582 | |||||||||
|
Other |
4,725 | 1,484 | 3,290 | |||||||||
|
|
|
|
|
|
|
|||||||
|
Total |
12,274 | 19,565 | 13,868 | |||||||||
|
|
|
|
|
|
|
|||||||
F-110
Table of Contents
NOTES TO THE CONSOLIDATED FINANCIAL STATEMENTS, Continued
| 39. | Related Party Transactions: |
The related parties of companies and their subsidiaries include entities of the company’s corporate group; corporations which are the company’s parent company, associated companies, subsidiaries and associates; directors, managers, administrators, main executives or receivers of the company on their own behalf or in representation of persons other than the company, and their respective spouses or family members up to the second degree of consanguinity or affinity, as well as any entity directly or indirectly controlled through any of them, the partnerships or companies in which the aforementioned persons are owners, directly or through other individuals or corporations, of 10% or more of their capital or directors, managers, administrators or main executives; any person that on their own or with others with whom they have a joint action agreement can designate at least one member of the company’s management or controls 10% or more of the capital or of the voting capital, if dealing with a public corporation; those that establish the company’s bylaws, or with a sound basis identify the directors’ committee; and those who have held the position of director, manager, administrator, main executive or receiver within the last eighteen months.
Corporations Art. 147 states that a public corporation can only enter into transactions with related parties when the objective is to contribute to the company’s interests, when terms of price, terms and conditions are commensurate to those prevailing in the market at the time of their approval and comply with the requirements and procedures stated in the same standard.
Moreover, article 84 of the General Banking Law establishes limits for loans granted to related parties and prohibits the granting of loans to the Bank’s directors, managers and general representatives.
F-111
Table of Contents
NOTES TO THE CONSOLIDATED FINANCIAL STATEMENTS, Continued
| 39. | Related Party Transactions, continued: |
| (a) | Loans to related parties: |
The following table details loans and accounts receivable, contingent loans and assets related to trading and investment securities, corresponding to related entities.
|
Operating
Companies (*) |
Investment
Companies (**) |
Individuals (***) | Total | |||||||||||||||||||||||||||||
| 2012 | 2013 | 2012 | 2013 | 2012 | 2013 | 2012 | 2013 | |||||||||||||||||||||||||
| MCh$ | MCh$ | MCh$ | MCh$ | MCh$ | MCh$ | MCh$ | MCh$ | |||||||||||||||||||||||||
|
Loans and accounts receivable: |
||||||||||||||||||||||||||||||||
|
Commercial loans |
250,983 | 287,500 | 63,576 | 70,004 | 704 | 1,199 | 315,263 | 358,703 | ||||||||||||||||||||||||
|
Residential mortgage loans |
— | — | — | — | 14,974 | 16,911 | 14,974 | 16,911 | ||||||||||||||||||||||||
|
Consumer loans |
— | — | — | — | 3,920 | 3,790 | 3,920 | 3,790 | ||||||||||||||||||||||||
|
|
|
|
|
|
|
|
|
|
|
|
|
|
|
|
|
|||||||||||||||||
|
Gross loans |
250,983 | 287,500 | 63,576 | 70,004 | 19,598 | 21,900 | 334,157 | 379,404 | ||||||||||||||||||||||||
|
Provision for loan losses |
(761 | ) | (929 | ) | (136 | ) | (152 | ) | (68 | ) | (52 | ) | (965 | ) | (1,133 | ) | ||||||||||||||||
|
|
|
|
|
|
|
|
|
|
|
|
|
|
|
|
|
|||||||||||||||||
|
Net loans |
250,222 | 286,571 | 63,440 | 69,852 | 19,530 | 21,848 | 333,192 | 378,271 | ||||||||||||||||||||||||
|
|
|
|
|
|
|
|
|
|
|
|
|
|
|
|
|
|||||||||||||||||
|
Off balance sheet accounts: |
||||||||||||||||||||||||||||||||
|
Guarantees |
1,864 | 1,109 | — | — | — | — | 1,864 | 1,109 | ||||||||||||||||||||||||
|
Letters of credits |
280 | 3,390 | — | — | — | — | 280 | 3,390 | ||||||||||||||||||||||||
|
Banks guarantees |
24,361 | 23,172 | 2,374 | 1,599 | — | — | 26,735 | 24,771 | ||||||||||||||||||||||||
|
Immediately available credit lines |
46,179 | 58,023 | 4,532 | 9,519 | 9,320 | 10,165 | 60,031 | 77,707 | ||||||||||||||||||||||||
|
|
|
|
|
|
|
|
|
|
|
|
|
|
|
|
|
|||||||||||||||||
|
Total off balance sheet account |
72,684 | 85,694 | 6,906 | 11,118 | 9,320 | 10,165 | 88,910 | 106,977 | ||||||||||||||||||||||||
|
Provision for contingencies loans |
(44 | ) | (34 | ) | (1 | ) | (1 | ) | — | — | (45 | ) | (35 | ) | ||||||||||||||||||
|
|
|
|
|
|
|
|
|
|
|
|
|
|
|
|
|
|||||||||||||||||
|
Off balance sheet account, net |
72,640 | 85,660 | 6,905 | 11,117 | 9,320 | 10,165 | 88,865 | 106,942 | ||||||||||||||||||||||||
|
|
|
|
|
|
|
|
|
|
|
|
|
|
|
|
|
|||||||||||||||||
|
Amount covered by Collateral: |
||||||||||||||||||||||||||||||||
|
Mortgage |
31,034 | 27,122 | 55 | 55 | 15,325 | 14,476 | 46,414 | 41,653 | ||||||||||||||||||||||||
|
Warrant |
— | — | — | — | — | — | — | — | ||||||||||||||||||||||||
|
Pledge |
13 | 13 | — | — | 7 | 7 | 20 | 20 | ||||||||||||||||||||||||
|
Other (****) |
2,842 | 2,849 | 17,300 | 17,300 | 10 | 10 | 20,152 | 20,159 | ||||||||||||||||||||||||
|
|
|
|
|
|
|
|
|
|
|
|
|
|
|
|
|
|||||||||||||||||
|
Total collateral |
33,889 | 29,984 | 17,355 | 17,355 | 15,342 | 14,493 | 66,586 | 61,832 | ||||||||||||||||||||||||
|
|
|
|
|
|
|
|
|
|
|
|
|
|
|
|
|
|||||||||||||||||
|
Acquired Instruments |
||||||||||||||||||||||||||||||||
|
For trading purposes |
— | 1,078 | — | — | — | — | — | 1,078 | ||||||||||||||||||||||||
|
For investment purposes |
— | — | — | — | — | — | — | — | ||||||||||||||||||||||||
|
|
|
|
|
|
|
|
|
|
|
|
|
|
|
|
|
|||||||||||||||||
|
Total acquired instruments |
— | 1,078 | — | — | — | — | — | 1,078 | ||||||||||||||||||||||||
|
|
|
|
|
|
|
|
|
|
|
|
|
|
|
|
|
|||||||||||||||||
| (*) | Operating companies are legal entities which comply with the following conditions: |
| i) | They engage in operating activities and generate a separable flow of income, |
| ii) | Less than 50% of their assets are trading securities or investments. |
| (**) | Investment companies include those legal entities that do not comply with the conditions for operating companies and are profit-oriented. |
| (***) | Individuals include key members of the management, who directly or indirectly posses the authority and responsibility of planning, administrating and controlling the activities of the organization, including directors. This category also includes their family members who are expected to have an influence or to be influenced by such individuals in their interactions with the organization. |
| (****) | These guarantees correspond mainly to shares and other financial guarantees. |
F-112
Table of Contents
NOTES TO THE CONSOLIDATED FINANCIAL STATEMENTS, Continued
| 39. | Related Party Transactions, continued: |
| (b) | Other assets and liabilities with related parties: |
| 2012 | 2013 | |||||||
| MCh$ | MCh$ | |||||||
|
Assets |
||||||||
|
Cash and due from banks |
11,174 | 12,692 | ||||||
|
Derivative instruments |
107,487 | 76,532 | ||||||
|
Other assets |
2,931 | 2,847 | ||||||
|
|
|
|
|
|||||
|
Total |
121,592 | 92,071 | ||||||
|
|
|
|
|
|||||
|
Liabilities |
||||||||
|
Demand deposits |
87,480 | 123,223 | ||||||
|
Savings accounts and time deposits |
378,965 | 233,172 | ||||||
|
Derivative instruments |
83,582 | 85,694 | ||||||
|
Borrowings from financial institutions |
134,820 | 192,682 | ||||||
|
Other liabilities |
9,044 | 23,836 | ||||||
|
|
|
|
|
|||||
|
Total |
693,891 | 658,607 | ||||||
|
|
|
|
|
|||||
| (c) | Income and expenses from related party transactions: |
| 2012 | 2013 | |||||||||||||||
| Income | Expense | Income | Expense | |||||||||||||
| MCh$ | MCh$ | MCh$ | MCh$ | |||||||||||||
|
Type of income or expense recognized |
||||||||||||||||
|
Interest and revenue expenses |
18,759 | 21,501 | 21,280 | 15,917 | ||||||||||||
|
Fees and commission income |
56,717 | 33,337 | 61,560 | 35,897 | ||||||||||||
|
Net financial operating income |
36,171 | — | — | 47,348 | ||||||||||||
|
Provision for credit risk |
— | 677 | 81 | — | ||||||||||||
|
Operating expenses |
— | 64,213 | — | 66,313 | ||||||||||||
|
Other income and expenses |
744 | 40 | 553 | 27 | ||||||||||||
|
|
|
|
|
|
|
|
|
|||||||||
|
Total |
112,391 | 119,768 | 83,474 | 165,502 | ||||||||||||
|
|
|
|
|
|
|
|
|
|||||||||
F-113
Table of Contents
NOTES TO THE CONSOLIDATED FINANCIAL STATEMENTS, Continued
| 39. | Related Party Transactions, continued: |
| (d) | Directors’ expenses and remunerations: |
| Remunerations |
Fees for attending
Board meetings |
Fees for attending
Committees and Subsidiary Board meetings (1) |
Consulting | Total | ||||||||||||||||||||||||||||||||||||
| 2012 | 2013 | 2012 | 2013 | 2012 | 2013 | 2012 | 2013 | 2012 | 2013 | |||||||||||||||||||||||||||||||
| MCh$ | MCh$ | MCh$ | MCh$ | MCh$ | MCh$ | MCh$ | MCh$ | MCh$ | MCh$ | |||||||||||||||||||||||||||||||
|
Name of Directors |
||||||||||||||||||||||||||||||||||||||||
|
Pablo Granifo Lavín |
358 | (*) | 363 | (*) | 45 | 48 | 294 | 321 | — | — | 697 | 732 | ||||||||||||||||||||||||||||
|
Andrónico Luksic Craig |
147 | 149 | 8 | 13 | — | — | — | — | 155 | 162 | ||||||||||||||||||||||||||||||
|
Jorge Awad Mehech |
49 | 50 | 23 | 24 | 110 | 113 | — | — | 182 | 187 | ||||||||||||||||||||||||||||||
|
Gonzalo Menéndez Duque |
49 | 50 | 21 | 20 | 112 | 110 | — | — | 182 | 180 | ||||||||||||||||||||||||||||||
|
Jaime Estévez Valencia |
49 | 50 | 23 | 23 | 92 | 97 | — | — | 164 | 170 | ||||||||||||||||||||||||||||||
|
Francisco Pérez Mackenna |
49 | 50 | 17 | 21 | 50 | 60 | — | — | 116 | 131 | ||||||||||||||||||||||||||||||
|
Rodrigo Manubens Moltedo |
49 | 50 | 23 | 23 | 49 | 52 | — | — | 121 | 125 | ||||||||||||||||||||||||||||||
|
Jorge Ergas Heyman |
49 | 50 | 17 | 19 | 47 | 46 | — | — | 113 | 115 | ||||||||||||||||||||||||||||||
|
Thomas Fürst Freiwirth |
49 | 50 | 18 | 20 | 37 | 39 | — | — | 104 | 109 | ||||||||||||||||||||||||||||||
|
Jean-Paul Luksic Fontbona |
— | 34 | — | 10 | — | 2 | — | — | — | 46 | ||||||||||||||||||||||||||||||
|
Guillermo Luksic Craig |
49 | 12 | 4 | — | — | — | — | — | 53 | 12 | ||||||||||||||||||||||||||||||
|
Jacob Ergas Ergas |
— | — | — | — | 9 | 8 | — | — | 9 | 8 | ||||||||||||||||||||||||||||||
|
Other directors’ subsidiaries |
— | — | — | — | 165 | 149 | — | — | 165 | 149 | ||||||||||||||||||||||||||||||
|
|
|
|
|
|
|
|
|
|
|
|
|
|
|
|
|
|
|
|
|
|||||||||||||||||||||
|
Total |
897 | 908 | 199 | 221 | 965 | 997 | — | — | 2,061 | 2,126 | ||||||||||||||||||||||||||||||
|
|
|
|
|
|
|
|
|
|
|
|
|
|
|
|
|
|
|
|
|
|||||||||||||||||||||
| (1) | Includes fees paid to members of the Advisory Committee of Banchile Corredores de Seguros Ltda. of MCh$15 (MCh$19 in 2012). |
| (*) | Includes a provision of MCh$214 (MCh$210 in 2012) for an incentive subject to achieving the Bank’s forecasted earnings. |
Fees paid for advisory services to the Board of Directors amount to MCh$273 (MCh$266 in 2012).
Travel and other related expenses amount to MCh$190 (MCh$329 in 2012).
F-114
Table of Contents
NOTES TO THE CONSOLIDATED FINANCIAL STATEMENTS, Continued
| 40. | Fair Value of Financial Assets and Liabilities: |
Banco de Chile and its subsidiaries have defined a corporate framework for the Fair Value measurement and control to accomplish the Fair Value process according to local regulations, market standards and best practices in the industry. This framework is contained in Banco de Chile’s Fair Value Policy.
One of the most important definitions in this framework is the Product Control Unit, (“PCU”) function. This area is independent from both the principal management and the business unit, and reports to the CFO of Banco de Chile. This area is responsible for the independent verification of Profit and Losses, and Fair Value measurement and control for all Treasury transactions; Trading, Funding and gapping and Investments deals.
To accomplish the measurements and controls, Banco de Chile and its subsidiaries, take into account at least the following aspects:
| (a) | Industry standards of fair value measurements. |
In the fair value calculation process, standard methodologies: closing prices, discounted cash flows and option models, and the Black-Scholes model, in the options case. The input parameters are rates, prices and volatility levels for each term and market factor that can change the fair value of any instrument in the portfolio.
| (b) | Quoted prices in active markets. |
The fair value for instruments with quoted prices in active markets is determined using daily quotes from electronic systems information as Bloomberg and Bolsa de Comercio de Santiago terminals. This quote represents the price at which the instrument is frequently bought and sold in financial markets.
The prices used to determine the fair value of each instrument correspond to the midpoint for a specific market factor, currency and term.
| (c) | Valuation techniques. |
If there are not market quotes in active markets for the financial instrument, valuation techniques will be used to determine the fair value.
Due to the fact that fair value models require a set of market parameters as inputs, it is part of the fair value process to maximize the utilization of observable quoted prices or derived from similar instruments in active markets. Nevertheless, there are some cases for which neither quoted prices nor derived prices are available; in these cases external data from specialized providers, such as the broker ICAP, prices for similar transactions and historical information is used to validate the parameters that will be used as inputs.
F-115
Table of Contents
NOTES TO THE CONSOLIDATED FINANCIAL STATEMENTS, Continued
| 40. | Fair Value of Financial Assets and Liabilities, continued: |
| (d) | Fair value adjustments. |
Part of the fair value process consist of adjustments, Market Value Adjustments or MVA for short, to take into account two different market inputs: bid/offer spreads and market factors liquidity. These adjustments are calculated and analyzed by the PCU and Risk Market areas.
The bid/offer spread adjustment reflects the expected impact on fair value due to long or short positions in a specific market factor and term, valuated at their midpoint. For example, long positions in an asset will be impacted in order to reflect the fact that in selling that position prices will be quoted at bid instead at midpoint. For the bid/offer spread adjustment, market quotes or indicative prices for each position, instrument, currency and term are used. Bid, mid and offer market quotes are considered.
The liquidity adjustment considers the relative size to the market of each position in the portfolio. This adjustment is intended to reflect the relative size of Banco de Chile and the deepness of the markets. For this adjustment, the size of each position, recent transaction in active markets and recently observed liquidity are taking into account.
| (e) | Fair value control. |
To ensure that the market input parameters that Banco de Chile is using for fair value calculations represent the state of the market and the best estimates of fair value, the PCU runs on a daily basis an independent verification of prices and rates. This process aims to set a preventive control on the official market parameters provided by the respective business area. A comparative control based on mark-to-market differences, using one set of inputs prepared by the business area and one set prepared by the PCU, is conducted before fair value calculations. The output of this process is a set of differences in fair value by currency, product and portfolio. These differences are compared with specific ranges by grouping level, currency, product and portfolio.
In the event when significant differences were detected, these differences are scaled according to the amount of materiality for each grouping level, from a single report to the trader until a report to the Board. These ranges of materiality control are approved by the Assets and Liabilities Committee (“ALCO”).
Complementary and in parallel, the PCU generates daily reports of P&L and risk market exposure. These two kinds of reports allows adequate control and consistency of the parameters used in the valuation and post-valuation confirmation.
F-116
Table of Contents
NOTES TO THE CONSOLIDATED FINANCIAL STATEMENTS, Continued
| 40. | Fair Value of Financial Assets and Liabilities, continued: |
| (f) | Judgmental analysis and information to Senior Management. |
In particular cases where there is no market quotations for the instrument, similar transaction prices or indicative parameters, a reasoned analysis and specific controls should be made to estimate the fair value of the operation or transaction. Within Banco de Chile’s framework for fair value, described in the Fair Value Policy approved by the Board of Banco de Chile, the approval level required for this kind of instruments, where there is no market information or available inferences from prices or rates, is established.
| (i) | Fair value hierarchy |
Banco de Chile and his subsidiaries, taken into account the preceding statements, classify all the financial instruments among the following levels:
| Level 1: | Quoted market prices in an active market (that are unadjusted) for identical assets or liabilities that the Bank can access at the measurement date. | |
| In this level are considered the following instruments: currency futures, Chilean central bank and treasury securities, mutual funds investments and equity. | ||
| For the Chilean central bank and treasury securities, all instruments that belong to one of the following benchmark groups will be considered as Level 1: Pesos-02, Pesos-05, Pesos-07, Pesos-10, UF-02, UF-05, UF-07, UF-10, UF-20, UF-30. A benchmark group is composed by a number of instruments that have similar duration and share the same quoted price within the group. This condition allows for a greater depth of the market, assuring daily observable quotes. | ||
| For each and every one of these instruments exist daily observable market valuation parameters; internal rates of return and closing prices, respectively, therefore no assumptions are needed to calculate the fair value. For currency futures as well as mutual funds and equity, closing prices times the number of instruments is used for fair value calculations. For Chilean central bank and treasury securities, the internal rate of return is used to discount every cash flow and obtain the fair value of each instrument, for each currency, CLP or CLF. | ||
| The preceding described methodology corresponds to the one utilized for the Bolsa de Comercio de Santiago (Santiago’s main Exchange) and is recognized as the standard in the market. | ||
F-117
Table of Contents
NOTES TO THE CONSOLIDATED FINANCIAL STATEMENTS, Continued
| 40. | Fair Value of Financial Assets and Liabilities, continued: |
| (i) | Fair value hierarchy, continued |
| Level 2: | Valuation techniques whose inputs are other than quoted prices included within Level 1 that are observable for the assets or liabilities, either directly or indirectly. For instruments in this level the valuation is done based on inference from observable market parameters; quoted prices for similar instruments in active markets. | |
| This level is composed mostly of derivatives, currency and rate derivatives, bank’s debt securities, mortgage claims, money market instruments and less liquid Chilean central bank and treasury securities. | ||
| For derivatives the fair value process depend upon his value is impacted by volatility as a relevant market factor; if is the case, Black-Scholes-Merton type of formula it is used. For the rest of the derivatives, swaps and forwards, net present value through discounted cash flows is used. For securities classified as level 2, the obtained internal rate of return is used to discount every cash flow and obtain the fair value of each instrument, for each currency. | ||
| In the event that there is no observable price for an instrument in a specific term, the price will be inferred from the interpolation between periods that do have observable quoted price in active markets. These models incorporate various market variables, including foreign exchange rates and interest rate curves. In some cases external data from specialized providers, brokers such as ICAP and Riskamerica, price for similar transactions and historical information it is used for validate the parameters that will be used as inputs. | ||
| The techniques described above are used by the Santiago Stock Exchange in Chile, Bloomberg or the Over-the-Counter, and correspond to the standard methodology used in the local and international markets. | ||
| Level 3: | Valuation techniques for which the lowest level input that is significant to the fair value measurement is unobservable. This category also includes instruments that are valued based on quoted prices for similar instruments where adjustments or assumptions are needed to reflect the differences between them. | |
| Instruments classified as level 3 correspond to Corporate Debt issued mainly Chilean and foreign companies, issued both in Chile and abroad. These instruments are classified, for accounting purposes, as Available for Sale. For this securities classified as level 3, the indicative internal rate of return is used to discount every cash flow and obtain the fair value of each instrument, for each currency. In this case only external data from specialized providers, brokers such as ICAP, Riskamerica and Interactive Data, it is used to for validate the parameters that will be used as inputs. | ||
F-118
Table of Contents
NOTES TO THE CONSOLIDATED FINANCIAL STATEMENTS, Continued
| 40. | Fair Value of Financial Assets and Liabilities, continued: |
| (i) | Fair value hierarchy, continued |
| For this level corresponds to the described technique used by both the Bolsa de Comercio de Santiago de Chile as Bloomberg, and correspond to the standard methodology used in the local and international market. |
F-119
Table of Contents
NOTES TO THE CONSOLIDATED FINANCIAL STATEMENTS, Continued
| 40. | Fair Value of Financial Assets and Liabilities, continued: |
| (ii) | Level hierarchy classification and figures |
The following table shows the figures by hierarchy, for instruments registered at fair value.
| Level 1 | Level 2 | Level 3 | Total | |||||||||||||||||||||||||||||
| 2012 | 2013 | 2012 | 2013 | 2012 | 2013 | 2012 | 2013 | |||||||||||||||||||||||||
| MCh$ | MCh$ | MCh$ | MCh$ | MCh$ | MCh$ | MCh$ | MCh$ | |||||||||||||||||||||||||
|
Financial Assets |
||||||||||||||||||||||||||||||||
|
Financial assets held-for-trading |
||||||||||||||||||||||||||||||||
|
From the Chilean government and Central Bank |
65,548 | 31,326 | 6,831 | 33,611 | — | — | 72,379 | 64,937 | ||||||||||||||||||||||||
|
Other instruments issued in Chile |
188 | 1,034 | 87,115 | 255,597 | — | 5,353 | 87,303 | 261,984 | ||||||||||||||||||||||||
|
|
|
|
|
|
|
|
|
|
|
|
|
|
|
|
|
|||||||||||||||||
|
Subtotal |
65,736 | 32,360 | 93,946 | 289,208 | — | 5,353 | 159,682 | 326,921 | ||||||||||||||||||||||||
|
|
|
|
|
|
|
|
|
|
|
|
|
|
|
|
|
|||||||||||||||||
|
Derivative contracts for trading purposes |
||||||||||||||||||||||||||||||||
|
Forwards |
— | — | 70,310 | 58,086 | — | — | 70,310 | 58,086 | ||||||||||||||||||||||||
|
Swaps |
— | — | 258,496 | 291,429 | — | — | 258,496 | 291,429 | ||||||||||||||||||||||||
|
Call options |
— | — | 472 | 2,301 | — | — | 472 | 2,301 | ||||||||||||||||||||||||
|
Put options |
— | — | 341 | 600 | — | — | 341 | 600 | ||||||||||||||||||||||||
|
Futures |
— | — | — | — | — | — | — | — | ||||||||||||||||||||||||
|
|
|
|
|
|
|
|
|
|
|
|
|
|
|
|
|
|||||||||||||||||
|
Subtotal |
— | — | 329,619 | 352,416 | — | — | 329,619 | 352,416 | ||||||||||||||||||||||||
|
|
|
|
|
|
|
|
|
|
|
|
|
|
|
|
|
|||||||||||||||||
|
Hedge derivative contracts |
||||||||||||||||||||||||||||||||
|
Swaps |
— | — | 22 | 38,684 | — | — | 22 | 38,684 | ||||||||||||||||||||||||
|
|
|
|
|
|
|
|
|
|
|
|
|
|
|
|
|
|||||||||||||||||
|
Subtotal |
— | — | 22 | 38,684 | — | — | 22 | 38,684 | ||||||||||||||||||||||||
|
CVA |
— | — | (3,558 | ) | (16,413 | ) | — | — | (3,558 | ) | (16,413 | ) | ||||||||||||||||||||
|
|
|
|
|
|
|
|
|
|
|
|
|
|
|
|
|
|||||||||||||||||
|
Total |
— | — | 326,083 | 374,687 | — | — | 326,083 | 374,687 | ||||||||||||||||||||||||
|
|
|
|
|
|
|
|
|
|
|
|
|
|
|
|
|
|||||||||||||||||
|
Financial assets available-for-sale (1) |
||||||||||||||||||||||||||||||||
|
From the Chilean government and Central Bank |
136,554 | 163,875 | 115,230 | 422,533 | — | — | 251,784 | 586,408 | ||||||||||||||||||||||||
|
Other instruments issued in Chile |
— | — | 653,955 | 722,926 | 278,073 | 296,327 | 932,028 | 1,019,253 | ||||||||||||||||||||||||
|
Instruments issued abroad |
30,538 | 42,236 | — | — | 57,966 | 33,986 | 88,504 | 76,222 | ||||||||||||||||||||||||
|
|
|
|
|
|
|
|
|
|
|
|
|
|
|
|
|
|||||||||||||||||
|
Subtotal |
167,092 | 206,111 | 769,185 | 1,145,459 | 336,039 | 330,313 | 1,272,316 | 1,681,883 | ||||||||||||||||||||||||
|
Other assets |
||||||||||||||||||||||||||||||||
|
Mutual fund investments |
33,042 | 66,213 | — | — | — | — | 33,042 | 66,213 | ||||||||||||||||||||||||
|
|
|
|
|
|
|
|
|
|
|
|
|
|
|
|
|
|||||||||||||||||
|
Subtotal |
33,042 | 66,213 | — | — | — | — | 33,042 | 66,213 | ||||||||||||||||||||||||
|
|
|
|
|
|
|
|
|
|
|
|
|
|
|
|
|
|||||||||||||||||
|
Total |
265,870 | 304,684 | 1,189,214 | 1,809,354 | 336,039 | 335,666 | 1,791,123 | 2,449,704 | ||||||||||||||||||||||||
|
|
|
|
|
|
|
|
|
|
|
|
|
|
|
|
|
|||||||||||||||||
|
Financial Liabilities |
||||||||||||||||||||||||||||||||
|
Derivative contracts for trading purposes |
||||||||||||||||||||||||||||||||
|
Forwards |
— | — | 81,790 | 65,463 | — | — | 81,790 | 65,463 | ||||||||||||||||||||||||
|
Swaps |
— | — | 264,052 | 343,467 | — | — | 264,052 | 343,467 | ||||||||||||||||||||||||
|
Call options |
— | — | 395 | 3,559 | — | — | 395 | 3,559 | ||||||||||||||||||||||||
|
Put options |
— | — | 387 | 705 | — | — | 387 | 705 | ||||||||||||||||||||||||
|
Futures |
— | — | — | — | — | — | — | — | ||||||||||||||||||||||||
|
Other |
— | — | — | — | — | — | — | — | ||||||||||||||||||||||||
|
|
|
|
|
|
|
|
|
|
|
|
|
|
|
|
|
|||||||||||||||||
|
Subtotal |
— | — | 346,624 | 413,194 | — | — | 346,624 | 413,194 | ||||||||||||||||||||||||
|
|
|
|
|
|
|
|
|
|
|
|
|
|
|
|
|
|||||||||||||||||
|
Hedge derivative contracts |
||||||||||||||||||||||||||||||||
|
Swaps |
— | — | 33,698 | 32,005 | — | — | 33,698 | 32,005 | ||||||||||||||||||||||||
|
|
|
|
|
|
|
|
|
|
|
|
|
|
|
|
|
|||||||||||||||||
|
Subtotal |
— | — | 33,698 | 32,005 | — | — | 33,698 | 32,005 | ||||||||||||||||||||||||
|
|
|
|
|
|
|
|
|
|
|
|
|
|
|
|
|
|||||||||||||||||
|
DVA |
— | — | — | (19,089 | ) | — | — | — | (19,089 | ) | ||||||||||||||||||||||
|
|
|
|
|
|
|
|
|
|
|
|
|
|
|
|
|
|||||||||||||||||
|
Total |
— | — | 380,322 | 426,110 | — | — | 380,322 | 426,110 | ||||||||||||||||||||||||
|
|
|
|
|
|
|
|
|
|
|
|
|
|
|
|
|
|||||||||||||||||
| (1) | As of December 31, 2013, 92% of instruments of level 3 have denomination “Investment Grade”, meaning are assets with a classification BBB- or higher. Also, 90% of total of these financial instruments correspond to domestic issuers. |
F-120
Table of Contents
NOTES TO THE CONSOLIDATED FINANCIAL STATEMENTS, Continued
| 40. | Fair Value of Financial Assets and Liabilities, continued: |
| (iii) | Level 3 Reconciliation: |
The following tables show the reconciliation between the beginning and ending balances of instruments classified as Level 3, whose fair value is reflected in the financial statements.
|
Balance as of
January 1, 2012 |
Gain (loss)
Recognized in Income |
Gain (loss)
Recognized in Equity |
Purchases, Sales
and Agreements, net |
Transfer to
Level 1 and 2 |
Balance as of
December 31, 2012 |
|||||||||||||||||||
| MCh$ | MCh$ | MCh$ | MCh$ | MCh$ | MCh$ | |||||||||||||||||||
|
Financial Assets |
||||||||||||||||||||||||
|
Financial assets held-for-trading |
||||||||||||||||||||||||
|
Other instruments issued in Chile |
585 | 183 | — | (768 | ) | — | — | |||||||||||||||||
|
Instruments issued abroad |
— | — | — | — | — | — | ||||||||||||||||||
|
|
|
|
|
|
|
|
|
|
|
|
|
|||||||||||||
|
Subtotal |
585 | 183 | — | (768 | ) | — | — | |||||||||||||||||
|
|
|
|
|
|
|
|
|
|
|
|
|
|||||||||||||
|
Financial assets available-for-sale |
||||||||||||||||||||||||
|
Other instruments issued in Chile |
321,378 | 1,511 | (1,410 | ) | (43,406 | ) | — | 278,073 | ||||||||||||||||
|
Instruments issued abroad |
128,403 | (5,713 | ) | 19,666 | (59,432 | ) | (24,958 | ) | 57,966 | |||||||||||||||
|
|
|
|
|
|
|
|
|
|
|
|
|
|||||||||||||
|
Subtotal |
449,781 | (4,202 | ) | 18,256 | (102,838 | ) | (24,958 | ) | 336,039 | |||||||||||||||
|
|
|
|
|
|
|
|
|
|
|
|
|
|||||||||||||
|
Total |
450,366 | (4,019 | ) | 18,256 | (103,606 | ) | (24,958 | ) | 336,039 | |||||||||||||||
|
|
|
|
|
|
|
|
|
|
|
|
|
|||||||||||||
|
Balance as of
January 1, 2013 |
Gain (loss)
Recognized in Income |
Gain (loss)
Recognized in Equity |
Purchases, Sales
and Agreements, net |
Transfer to
Level 1 and 2 |
Balance as of
December 31, 2013 |
|||||||||||||||||||
| MCh$ | MCh$ | MCh$ | MCh$ | MCh$ | MCh$ | |||||||||||||||||||
|
Financial Assets |
||||||||||||||||||||||||
|
Financial assets held-for-trading |
||||||||||||||||||||||||
|
Other instruments issued in Chile |
— | (1,526 | ) | — | 6,879 | — | 5,353 | |||||||||||||||||
|
Instruments issued abroad |
— | — | — | — | — | — | ||||||||||||||||||
|
|
|
|
|
|
|
|
|
|
|
|
|
|||||||||||||
|
Subtotal |
— | (1,526 | ) | — | 6,879 | — | 5,353 | |||||||||||||||||
|
|
|
|
|
|
|
|
|
|
|
|
|
|||||||||||||
|
Financial assets available-for-sale |
||||||||||||||||||||||||
|
Other instruments issued in Chile |
278,073 | (5,441 | ) | 4,903 | 18,792 | — | 296,327 | |||||||||||||||||
|
Instruments issued abroad |
57,966 | (4,320 | ) | 412 | (20,072 | ) | — | 33,986 | ||||||||||||||||
|
|
|
|
|
|
|
|
|
|
|
|
|
|||||||||||||
|
Subtotal |
336,039 | (9,761 | ) | 5,315 | (1,280 | ) | — | 330,313 | ||||||||||||||||
|
|
|
|
|
|
|
|
|
|
|
|
|
|||||||||||||
|
Total |
336,039 | (11,287 | ) | 5,315 | 5,599 | — | 335,666 | |||||||||||||||||
|
|
|
|
|
|
|
|
|
|
|
|
|
|||||||||||||
F-121
Table of Contents
NOTES TO THE CONSOLIDATED FINANCIAL STATEMENTS, Continued
| 40. | Fair Value of Financial Assets and Liabilities, continued: |
| (iv) | Transfers between levels |
The following tables show transfers between levels for financial assets and liabilities whose fair value it is recorded in the consolidated financial statements:
|
Transfers from level 1 to level 2 |
||||
| 2012 | ||||
| MCh$ | ||||
|
Financial assets |
||||
|
Financial assets held-for-trading instruments |
||||
|
From the Chilean Government and Central Bank |
— | |||
|
Financial assets available-for-sale instruments |
||||
|
From the Chilean Government and Central Bank |
— | |||
|
Transfers from level 2 to level 1 |
||||
| 2012 | ||||
| MCh$ | ||||
|
Financial assets |
||||
|
Financial assets held-for-trading instruments |
||||
|
From the Chilean Government and Central Bank |
— | |||
|
Financial assets Available-for-sale instruments |
||||
|
From the Chilean Government and Central Bank |
53,592 | |||
|
Transfers
from level 1 to level 2 |
||||
| 2013 | ||||
| MCh$ | ||||
|
Financial assets |
||||
|
Financial assets held-for-trading instruments |
||||
|
From the Chilean Government and Central Bank |
16 | |||
|
Financial assets Available-for-sale instruments |
||||
|
From the Chilean Government and Central Bank |
106 | |||
|
Transfers
from level 2 to level 1 |
||||
| 2013 | ||||
| MCh$ | ||||
|
Financial assets |
||||
|
Financial assets held-for-trading instruments |
||||
|
From the Chilean Government and Central Bank |
48 | |||
|
Financial assets Available-for-sale instruments |
||||
|
From the Chilean Government and Central Bank |
— | |||
F-122
Table of Contents
NOTES TO THE CONSOLIDATED FINANCIAL STATEMENTS, Continued
| 40. | Fair Value of Financial Assets and Liabilities, continued: |
| (v) | Sensitivity of level 3 instruments to changes in key assumptions of the input parameters for the valuation model . |
The following table shows the impact on the fair value of Level 3 financial instruments using alternative assumptions that are reasonably possible. It is believed that the positive and negative impacts are similar:
| As of December 31, 2012 | As of December 31, 2013 | |||||||||||||||
| Level 3 |
Sensitivity to
changes in key assumptions of models |
Level 3 |
Sensitivity to
changes in key assumptions of models |
|||||||||||||
| MCh$ | MCh$ | MCh$ | MCh$ | |||||||||||||
|
Financial Assets |
||||||||||||||||
|
Financial assets held-for-trading |
||||||||||||||||
|
Other instruments issued in Chile |
— | — | 5,353 | (320 | ) | |||||||||||
|
|
|
|
|
|
|
|
|
|||||||||
|
Total |
— | — | 5,353 | (320 | ) | |||||||||||
|
|
|
|
|
|
|
|
|
|||||||||
|
Financial assets available-for-sale |
||||||||||||||||
|
Other instruments issued in Chile |
278,073 | 4,664 | 296,327 | (3,971 | ) | |||||||||||
|
Instruments issued abroad |
57,966 | 612 | 33,986 | (227 | ) | |||||||||||
|
|
|
|
|
|
|
|
|
|||||||||
|
Total |
336,039 | 5,276 | 330,313 | (4,198 | ) | |||||||||||
|
|
|
|
|
|
|
|
|
|||||||||
Financial assets correspond to bank bonds and corporate bonds, considering that these instruments do not have current prices or observables, prices based on broker quotes or runs were used as input prices. Prices are generally calculated as a base rate plus a spread. For local bonds, this was determined by applying a 10% impact on the price, while for offshore bonds this was determined by applying only a 10% impact on the spread because the base rate is hedged with instruments on interest rate swaps (so-called hedge accounting). The impact of 10% is considered a reasonable fluctuation considering the market performance of these instruments and comparing it against the adjustment bid / offer that is provided for by these instruments.
F-123
Table of Contents
NOTES TO THE CONSOLIDATED FINANCIAL STATEMENTS, Continued
| 40. | Fair Value of Financial Assets and Liabilities, continued: |
| (vi) | Other assets and liabilities |
The following table summarizes the fair values of the Bank’s main financial assets and liabilities that are not recorded at fair value in the Statement of Financial Position. The values shown in this note do not attempt to estimate the value of the Bank’s income-generating assets, nor forecast their future behavior. The estimated fair value is as follows:
| Book Value | Fair Value | |||||||||||||||
| 2012 | 2013 | 2012 | 2013 | |||||||||||||
| MCh$ | MCh$ | MCh$ | MCh$ | |||||||||||||
|
Assets |
||||||||||||||||
|
Cash and due from banks |
684,925 | 873,308 | 684,925 | 873,308 | ||||||||||||
|
Transactions in the course of collection |
310,077 | 300,026 | 396,611 | 300,026 | ||||||||||||
|
Cash collateral on securities borrowed and reverse repurchase agreements |
35,100 | 82,422 | 35,100 | 82,422 | ||||||||||||
|
|
|
|
|
|
|
|
|
|||||||||
|
Subtotal |
1,030,102 | 1,255,756 | 1,116,636 | 1,255,756 | ||||||||||||
|
|
|
|
|
|
|
|
|
|||||||||
|
Loans and advances to banks |
||||||||||||||||
|
Domestic banks |
14,304 | 99,976 | 14,304 | 99,976 | ||||||||||||
|
Chilean Central Bank |
1,100,696 | 600,581 | 1,100,696 | 600,581 | ||||||||||||
|
Foreign banks |
228,322 | 361,499 | 228,322 | 361,499 | ||||||||||||
|
|
|
|
|
|
|
|
|
|||||||||
|
Subtotal |
1,343,322 | 1,062,056 | 1,343,322 | 1,062,056 | ||||||||||||
|
|
|
|
|
|
|
|
|
|||||||||
|
Loans to customers, net |
||||||||||||||||
|
Commercial loans |
11,527,694 | 12,832,455 | 11,473,251 | 12,695,722 | ||||||||||||
|
Residential mortgage loans |
4,182,587 | 4,713,805 | 4,201,091 | 4,760,593 | ||||||||||||
|
Consumer loans |
2,673,677 | 2,895,212 | 2,683,593 | 2,914,188 | ||||||||||||
|
|
|
|
|
|
|
|
|
|||||||||
|
Subtotal |
18,383,958 | 20,441,472 | 18,357,935 | 20,370,503 | ||||||||||||
|
|
|
|
|
|
|
|
|
|||||||||
|
Total |
20,757,382 | 22,759,284 | 20,817,893 | 22,688,315 | ||||||||||||
|
|
|
|
|
|
|
|
|
|||||||||
|
Liabilities |
||||||||||||||||
|
Current accounts and other demand deposits |
5,470,971 | 5,984,332 | 5,470,971 | 5,984,332 | ||||||||||||
|
Transactions in the course of payment |
72,684 | 51,898 | 159,218 | 51,898 | ||||||||||||
|
Cash collateral on securities lent and reverse repurchase agreements |
226,396 | 256,766 | 226,396 | 256,766 | ||||||||||||
|
Saving accounts and time deposits |
9,612,950 | 10,402,725 | 9,589,643 | 10,422,095 | ||||||||||||
|
Borrowings from financial institutions |
1,108,681 | 989,465 | 1,103,252 | 984,999 | ||||||||||||
|
Other financial obligations |
162,123 | 210,926 | 162,123 | 210,926 | ||||||||||||
|
|
|
|
|
|
|
|
|
|||||||||
|
Subtotal |
16,653,805 | 17,896,112 | 16,711,603 | 17,911,016 | ||||||||||||
|
|
|
|
|
|
|
|
|
|||||||||
|
Debt issued |
||||||||||||||||
|
Letters of credit for residential purposes |
85,967 | 67,514 | 87,088 | 70,351 | ||||||||||||
|
Letters of credit for general purposes |
29,229 | 18,977 | 29,610 | 19,775 | ||||||||||||
|
Bonds |
2,412,233 | 3,533,462 | 2,282,014 | 3,446,571 | ||||||||||||
|
Subordinated bonds |
746,504 | 747,007 | 726,369 | 739,184 | ||||||||||||
|
|
|
|
|
|
|
|
|
|||||||||
|
Subtotal |
3,273,933 | 4,366,960 | 3,125,081 | 4,275,881 | ||||||||||||
|
|
|
|
|
|
|
|
|
|||||||||
|
Total |
19,927,738 | 22,263,072 | 19,836,684 | 22,186,897 | ||||||||||||
|
|
|
|
|
|
|
|
|
|||||||||
F-124
Table of Contents
NOTES TO THE CONSOLIDATED FINANCIAL STATEMENTS, Continued
| 40. | Fair Value of Financial Assets and Liabilities, continued: |
| (vi) | Other assets and liabilities |
The fair value of assets not presented at fair value in the Statement of Financial Position is derived from balance sheet stocks and cash flows that Banco de Chile expects to receive, discounted using the relevant market interest rate for each type of transaction. These cash flows are obtained from regulatory reports, in particular the C40 report, which is issued by the Bank.
The C40 report contains cash flows, in future value, for assets and liabilities, by maturity and currency. For long term assets and liabilities, contractual cash flows are used to calculate the fair value. The cash flows are discounted by type of asset and currency to obtain their present value. The discount rates used to calculate the present value for each type of asset and liability correspond to the marginal rates of each product, considering specific rates by currency and term to capture both the risk inherent to the term as well as the expected level of each currency.
For financial assets and liabilities that have a short term maturity (less than three months) it is assumed that the carrying amounts approximate their fair value. This assumption is also applied to demand deposits and savings accounts without specific maturity.
For loans, contractual cash flows and loan loss provisions are used to calculate the fair value. The cash flows are discounted by type of asset and currency to obtain their present value. Consecutively, the loan loss provision, by type of asset, is subtracted from the present value to take into account the fact that the Bank has already model the estimate probability that his customers do not fulfill their obligations.
The fair value of liabilities that do not have quoted market prices, it is based on discounted cash flows, using interest rates to similar terms.
F-125
Table of Contents
NOTES TO THE CONSOLIDATED FINANCIAL STATEMENTS, Continued
| 40. | Fair Value of Financial Assets and Liabilities, continued: |
| (vii) | Offsetting of financial assets and liabilities |
In accordance with IAS 32 Financial Instruments: Presentation, the Bank should report financial assets and financial liabilities on a net basis on the balance sheet only if there is a legally enforceable right to set off the recognized amounts and there is intention to settle on a net basis, or to realize the asset and settle the liability simultaneously. Because Bank´s netting agreements do not qualify for balance sheet netting, it presents its financial instruments on a gross basis on the balance sheet.
The following table shows the impact of netting arrangements on all derivative financial instruments that are subject to enforceable master netting agreements or similar agreements (including financial collaterals), but do not qualify for balance sheet netting.
The “Net amounts” presented below are not intended to represent the Bank’s actual exposure to credit risk, as a variety of credit mitigation strategies are employed in addition to netting and collateral arrangements.
| Effects of offsetting on balance sheet | Related amount not offset | |||||||||||||||||||||||
|
As of December 31, 2012 |
Gross amount
MCh$ |
Amounts
offset MCh$ |
Net amounts reported on the
balance sheet MCh$ |
Financial
Instruments MCh$ |
Financial
Collateral MCh$ |
Net
amount MCh$ |
||||||||||||||||||
|
Derivative financial assets |
326,083 | — | 326,083 | (147,241 | ) | (42,635 | ) | 136,207 | ||||||||||||||||
|
Derivative financial liabilities |
380,322 | — | 380,322 | — | — | 380,322 | ||||||||||||||||||
| Effect of offsetting on balance sheet | Related amount not offset | |||||||||||||||||||||||
|
As of December 31, 2013 |
Gross amount
MCh$ |
Amounts
offset MCh$ |
Net amounts reported on the
balance sheet MCh$ |
Financial
Instruments MCh$ |
Financial
Collateral MCh$ |
Net
amount MCh$ |
||||||||||||||||||
|
Derivative financial assets |
374,687 | — | 374,687 | (158,410 | ) | (31,651 | ) | 184,626 | ||||||||||||||||
|
Derivative financial liabilities |
426,110 | — | 426,110 | — | — | 426,110 | ||||||||||||||||||
Derivative assets and liabilities
The “Financial Instruments” column identifies financial assets and liabilities that are subject to set off under netting agreements, such as the ISDA Master Agreement of derivative exchange or clearing counterparty agreements, whereby all outstanding transactions with the same counterparty could be offset and close-out netting applied across all outstanding transaction covered by the agreements if an event of default or other predetermined events occur (“early contract termination”).
Financial collateral refers to cash and non-cash collateral obtained, typically daily or weekly, to cover the net exposure between counterparties by enabling the collateral to be realized in an event of default or if other predetermined events occur (“early contract termination”).
F-126
Table of Contents
NOTES TO THE CONSOLIDATED FINANCIAL STATEMENTS, Continued
| 41. | Maturity of Assets and Liabilities: |
The table below shows the classification of assets and liabilities as current and non-current as the balance sheet is presented in the order of liquidity without indicating this information.
| As of December 31, 2012 | ||||||||||||
|
Less than
12 months MCh$ |
Over 1 year
MCh$ |
Total
MCh$ |
||||||||||
|
Assets |
||||||||||||
|
Cash and due from banks |
684,925 | — | 684,925 | |||||||||
|
Transactions in the course of collection |
310,077 | — | 310,077 | |||||||||
|
Financial assets held-for-trading |
159,682 | — | 159,682 | |||||||||
|
Receivables from repurchase agreements and security borrowing |
35,100 | — | 35,100 | |||||||||
|
Derivative instruments |
127,507 | 198,576 | 326,083 | |||||||||
|
Loans in advance to banks |
1,344,281 | — | 1,344,281 | |||||||||
|
Loans to customers |
8,062,399 | 10,709,362 | 18,771,761 | |||||||||
|
Financial assets available-for-sale |
787,053 | 485,263 | 1,272,316 | |||||||||
|
Investments in other companies |
— | 11,674 | 11,674 | |||||||||
|
Property and equipment |
— | 205,189 | 205,189 | |||||||||
|
Investment properties |
— | 16,698 | 16,698 | |||||||||
|
Intangible assets |
— | 75,610 | 75,610 | |||||||||
|
Current tax assets |
— | — | — | |||||||||
|
Deferred tax assets, net |
— | 55,801 | 55,801 | |||||||||
|
Other assets |
122,842 | 194,923 | 317,765 | |||||||||
|
|
|
|
|
|
|
|||||||
|
Total Assets |
11,633,866 | 11,953,096 | 23,586,962 | |||||||||
|
|
|
|
|
|
|
|||||||
| As of December 31, 2013 | ||||||||||||
|
Less than
12 months MCh$ |
Over 1 year
MCh$ |
Total
MCh$ |
||||||||||
|
Assets |
||||||||||||
|
Cash and due from banks |
873,308 | — | 873,308 | |||||||||
|
Transactions in the course of collection |
300,026 | — | 300,026 | |||||||||
|
Financial assets held-for-trading |
326,921 | — | 326,921 | |||||||||
|
Receivables from repurchase agreements and security borrowing |
82,422 | — | 82,422 | |||||||||
|
Derivative instruments |
90,042 | 284,645 | 374,687 | |||||||||
|
Loans in advance to banks |
1,063,348 | — | 1,063,348 | |||||||||
|
Loans to customers |
8,976,983 | 11,903,787 | 20,880,770 | |||||||||
|
Financial assets available-for-sale |
365,178 | 1,316,705 | 1,681,883 | |||||||||
|
Investments in other companies |
— | 14,407 | 14,407 | |||||||||
|
Property and equipment |
— | 197,578 | 197,578 | |||||||||
|
Investment properties |
— | 16,317 | 16,317 | |||||||||
|
Intangible assets |
— | 72,223 | 72,223 | |||||||||
|
Current tax assets |
— | — | — | |||||||||
|
Deferred tax assets, net |
— | 56,421 | 56,421 | |||||||||
|
Other assets |
140,579 | 233,408 | 373,987 | |||||||||
|
|
|
|
|
|
|
|||||||
|
Total Assets |
12,218,807 | 14,095,491 | 26,314,298 | |||||||||
|
|
|
|
|
|
|
|||||||
| (*) | The respective provisions, which amount to MCh$387,803 and MCh$439,298 in 2012 and 2013, respectively, for loans to customers and MCh$959 and MCh$1,292 for loans and advances to banks, have not been deducted from these balances. |
F-127
Table of Contents
NOTES TO THE CONSOLIDATED FINANCIAL STATEMENTS, Continued
| 41. | Maturity of Assets and Liabilities, continued: |
| As of December 31, 2012 | ||||||||||||
|
Less than
12 months MCh$ |
Over 1 year
MCh$ |
Total
MCh$ |
||||||||||
|
Liabilities |
||||||||||||
|
Current accounts and other demand deposits |
5,470,971 | — | 5,470,971 | |||||||||
|
Transactions in the course of payment |
72,684 | — | 72,684 | |||||||||
|
Payables from repurchase agreements and security lending |
226,396 | — | 226,396 | |||||||||
|
Saving accounts and time deposits |
9,035,534 | 577,416 | 9,612,950 | |||||||||
|
Derivative instruments |
118,734 | 261,588 | 380,322 | |||||||||
|
Borrowings from financial institutions |
966,725 | 141,956 | 1,108,681 | |||||||||
|
Debt issued |
302,556 | 2,971,377 | 3,273,933 | |||||||||
|
Other financial obligations |
113,117 | 49,006 | 162,123 | |||||||||
|
Current tax liabilities |
— | 23,189 | 23,189 | |||||||||
|
Employee benefits |
— | 64,545 | 64,545 | |||||||||
|
Provisions |
— | 141,839 | 141,839 | |||||||||
|
Other liabilities |
132,651 | 172,454 | 305,105 | |||||||||
|
|
|
|
|
|
|
|||||||
|
Total Liabilities |
16,439,368 | 4,403,370 | 20,842,738 | |||||||||
|
|
|
|
|
|
|
|||||||
| As of December 31, 2013 | ||||||||||||
|
Less than
12 months MCh$ |
Over 1 year
MCh$ |
Total
MCh$ |
||||||||||
|
Liabilities |
||||||||||||
|
Current accounts and other demand deposits |
5,984,332 | — | 5,984,332 | |||||||||
|
Transactions in the course of payment |
51,898 | — | 51,898 | |||||||||
|
Payables from repurchase agreements and security lending |
256,766 | — | 256,766 | |||||||||
|
Saving accounts and time deposits |
10,017,201 | 385,524 | 10,402,725 | |||||||||
|
Derivative instruments |
140,318 | 285,792 | 426,110 | |||||||||
|
Borrowings from financial institutions |
721,879 | 267,586 | 989,465 | |||||||||
|
Debt issued |
513,966 | 3,852,994 | 4,366,960 | |||||||||
|
Other financial obligations |
166,902 | 44,024 | 210,926 | |||||||||
|
Current tax liabilities |
— | 7,131 | 7,131 | |||||||||
|
Employee benefits |
— | 67,944 | 67,944 | |||||||||
|
Provisions |
— | 154,650 | 154,650 | |||||||||
|
Other liabilities |
108,383 | 167,379 | 275,762 | |||||||||
|
|
|
|
|
|
|
|||||||
|
Total Liabilities |
17,961,645 | 5,233,024 | 23,194,679 | |||||||||
|
|
|
|
|
|
|
|||||||
F-128
Table of Contents
NOTES TO THE CONSOLIDATED FINANCIAL STATEMENTS, Continued
| 42. | Risk Management: |
| (1) | Introduction |
The Bank’s risk management is based on specialization, knowledge of the business and the experience of its teams, with professionals specifically dedicated to each different type of risk. Our policy is to maintain an integrated, forward looking approach to risk management, taking into account the current and forecasted economic environment and the risk/return ratio of all products for both the Bank and its subsidiaries.
Our credit policies and processes acknowledge the particularities of each market and segment, thus affording specialized treatment to each one of them. The integrated information prepared for risk analysis is key to developing our strategic plan, this objectives include: determining the desired risk level for each business line; aligning all strategies with the established risk level; communicating desired risk levels to Bank’s commercial areas; developing models, processes and tools for evaluating, measuring and controlling risk throughout the different business lines and areas; informing the board of directors about risks and their evolution; proposing action plans to address important deviations in risk indicators and enforcing compliance of applicable standards and regulations.
| (a) | Risk Management Structure |
Credit and Market Risk Management lies at the all levels of the Organization, with a structure that recognizes the relevance of the different risk areas that exist. Current levels are:
| (i) | Board of Directors |
The Board is responsible for the establishment and monitoring of the Bank’s risk management structure. Due to the above, it is permanently informed regarding the evolution of the different risk areas, participating through its Finance and Financial Risk Committees, Credit Committees, Portfolio Committees and Audit Committee, which check the status of credit and market risks. In addition, it actively participates in each of them, informed of the status of the portfolio and participating in the strategic definitions that impact the quality of the portfolio.
Risk management policies are established in order to identify and analyze the risks faced by the Bank, to set adequate limits and controls and monitor risks and compliance with limits. The policies and risk management systems are regularly reviewed in order for them to reflect changes in market conditions and the Bank’s activities. It, through its standards and management procedures intends to develop a disciplined and constructive control environment in which all employees understand their roles and obligations.
F-129
Table of Contents
NOTES TO THE CONSOLIDATED FINANCIAL STATEMENTS, Continued
| 42. | Risk Management, continued: |
| (1) | Introduction, continued |
| (a) | Risk Management Structure, continued |
| (ii) | Finance, International and Financial Risk Committee |
This committee meets monthly to review developments and the current status of financial positions and market, price and liquidity risk. It reviews estimated results from financial positions in order to measure the risk/return ratio of the Bank’s Treasury business, as well as the evolution of and forecasts regarding use of capital. The knowledge of the current state of the market risks allow to forecast potential future loss, with an important confidence level, in the case of adverse transactions in the main market variables or illiquidity (exchange rate, interest rates and options volatility) or tight liquidity (either liquidity of trading in financial instruments or funding liquidity).
Additionally, the Committee reviews the estimated financial results that generate these positions separately, in order to measure the risk-return businesses involved in handling financial positions of the Treasury, the evolution of the use of capital, and the estimated credit risk and market that the Bank will face in the future. The Committee also discussed the international financial exposure and liabilities major credit exposures generated by derivatives transactions.
The Committee is responsible for the design of policies and procedures related to the establishment of limits and alerts financial positions, as well as measurement, control and reporting of the same. Subsequently, policies and procedures are subject to approval by the Bank’s Board.
The Finance, International and Financial Risk Committee comprises the Chairman, four Directors, the General Manager, the Manager of Corporate Risk Division, the Manager of the Corporate and Investment Banking Division, the Manager of Financial Control Division, the Manager of Treasury Division and the Manager of Financial Risk Area.
The Committee meets in regular session once a month and may be cited extraordinary request of the President, two Directors or the General Manager.
| (iii) | Credit Committees |
The corporate governance structure of the Bank provides various credit committees responsible for credit decisions related to the different business segments and the type of risk involved. These committees have higher expression in the Credit Committee of the Board, consisting of the General Manager, the Manager of Corporate Risk Division, and at least three directors who review weekly all operations that exceed UF750,000.
Each credit committee is responsible for defining the terms and conditions of acceptance of counterparty risks considered in the evaluation, and are comprised of members with sufficient powers for decision-making. The Corporate Risk Division participates in an independently and autonomously from commercial areas.
F-130
Table of Contents
NOTES TO THE CONSOLIDATED FINANCIAL STATEMENTS, Continued
| 42. | Risk Management, continued: |
| (1) | Introduction, continued |
| (a) | Risk Management Structure, continued |
| (iv) | Portfolio Risk Committee |
The main function of the Portfolio Risk Committee is to understand, from a overall perspective, the composition of the Bank’s loan portfolio. This is, according to economic sectors, business segments, products, terms and everything that would have a broad view of counterparty risk is assumed. This Committee reviews, in detail, the main exposures by economic groups, debtors and behavioral parameters such as default indicators, past due loans, impairment, charges-off and provisions for loan losses for each segment.
The mission of this Committee is to approve and propose various risk management strategies to the Board. This includes credit policies, portfolio assessment methodologies and the calculation of provisions to cover expected losses. It is also responsible for the sufficiency of provisions; authorizing extraordinary charge-offs when recovery attempts have been exhausted; and management control settlement of assets received in lieu of payments. It also reviews the methodological guidelines for the development of credit risk models, which are assessed on the Technical Committee for the Supervision of internal models.
The Portfolio Risk Committee meets monthly and is composed of the Chairman of the Board, two Directors, the General Manager, the Manager of Corporate Risk Division, the Manager of the Risk Division and the Area Manager Risk Architecture. The Committee may be summoned to an extraordinary request of the President, two Directors or the General Manager.
| (v) | Treasury |
The Bank’s Treasury Division is responsible for managing price risks (interest rates, exchange rates and options volatility) for its Trading and Accrual Portfolios, based on limits approved by the Board of Directors. In addition, it is the sole body responsible for ensuring that the Bank maintains adequate liquidity levels in line with market conditions and the needs of its different business units.
F-131
Table of Contents
NOTES TO THE CONSOLIDATED FINANCIAL STATEMENTS, Continued
| 42. | Risk Management, continued: |
| (1) | Introduction, continued |
| (a) | Risk Management Structure, continued |
| (vi) | Corporate Risk Division |
Banco de Chile has a team with a vast experience and knowledge in each matter related to risks associated with credit, market, operational and technology, which ensures comprehensive and consolidated management of the same, including the Bank and its subsidiaries, identifying and evaluating the risks generated with customers, in their own operations and their suppliers. The focus is on the future, and determining which different techniques and tools may lead to better solvency, liquidity, operations or reputational value for Banco of Chile.
Regarding the management of Credit Risk, the Corporate Risk Division oversees the quality of the portfolio and improving the risk-return tradeoff for all segments of people and companies as the Bank manages the stages of approval, monitoring and recovery of loans granted.
| (vii) | Operational Risk Committee |
The mission of the Operational Risk Committee is to identify, prioritize and set strategies to mitigate key operational risk events, ensure the implementation of the management model, establish tolerances risk, ensure compliance programs, policies and procedures relating to Privacy and Information Security, Business Continuity and Operational Risk for Banco de Chile.
This year the Bank increased the frequency of meetings, creating a monthly Operational Risk Committee, which has become the governing body for Operational Risk Management and Technology Risk management also involves the Directors of the Bank through quarterly presentations to Directors and the Audit Committee on these matters.
The Operational Risk Committee is composed of the General Manager, Division Manager Corporate Risk, Manager of Financial Control Division, Manager of Operations and Technology Division, Manager of Commercial Banking Area and Manager of Operational Risk and Technology.
| (b) | Internal Audit |
Risk management processes throughout the Bank are continually audited by the Internal Audit Area, which analyzes the sufficiency of and compliance with risk management procedures. Internal Audit discusses the results of all evaluations with management and reports its findings and recommendations to the Board of Directors.
| (c) | Measurement Methodology |
In terms of Credit Risk, provision levels and portfolio expenses are the basic measurements used to determine the credit quality of our portfolio.
Risk monitoring and control are performed primarily based on established limits. These limits reflect the Bank’s business and market strategy as well as the risk level it is willing to accept, with added emphasis on selected industry sectors.
F-132
Table of Contents
NOTES TO THE CONSOLIDATED FINANCIAL STATEMENTS, Continued
| 42. | Risk Management, continued: |
| (1) | Introduction, continued |
| (c) | Measurement Methodology, continued |
The Bank’s Chief Executive Officer, on a daily basis, and the Finance, International and Market Risk Committee, on a monthly basis, receive a report detailing the evolution of the Bank’s price and liquidity risk, based on both internal and regulator-imposed metrics.
Each year, the Board of Directors is presented with the results of a sufficiency test for allowances for loan loss. This test shows whether the Bank’s existing level of allowances for loan loss, both for the individual and group portfolios, is sufficient, based on historic losses or impairment experienced by the portfolio. The Board of Directors must issue a formal opinion on its sufficiency. The sufficiency test of the Chilean GAAP allowance and the related review by the Board has not resulted in supplementary provisions for our Chilean GAAP allowance, hence nor for our IFRS allowance. However, we consider similar factors for both our IFRS allowance and our Chilean GAAP allowance. If necessary we would adjust our IFRS allowance based on the results of the sufficiency test and the Board review if the underlying reason for the supplemental provision under Chilean GAAP were also an input or model used in our IFRS allowance methodology.
| (2) | Credit Risk |
Credit risk is the risk that we will incur a loss because a customer or counterparty does not comply with their contractual obligations.
This risk is managed using a global, unified and forward-looking strategy, which recognizes the current and projected economic environment of the markets and segments in which our different businesses are developing and grants appropriate credit treatment to each such market or segment by using risk limits that we are willing to accept from counterparties.
Managing credit risk is, therefore, inherent to our business and must be incorporated into each segment in which we do business: in this way, we hope to achieve an optimum balance between assumed risks and attained returns and properly allocate capital to each business line while complying with regulations and criteria defined by the Board, in order to ensure that the Bank has an appropriate capital base for potential losses that may arise from its credit exposure.
Counterparty limits are established by analyzing financial information, risk ratings, the nature of the exposure, documentation, guarantees, market conditions and the pertinent industry sector, among other factors. The process of monitoring credit quality also includes identifying in advance any possible changes in counterparty’s payment capacity, which enables us to evaluate the potential loss from these risks and take corrective actions.
F-133
Table of Contents
NOTES TO THE CONSOLIDATED FINANCIAL STATEMENTS, Continued
| 42. | Risk Management, continued: |
| (2) | Credit Risk, continued |
Individual and SME (Small and Medium Enterprises) Banking
| (a) | Approval Process |
Examination and approval of Bank loans operating under a differentiated approach, because there are different nature of the segments, which it characterizes by different basics in its variables of explanation of its financial structure and repayment ability. The areas involved in each approval process are:
| • |
Politicies and procedures |
| • |
Specialization and experience level of participant of the process |
| • |
Types and depth of technological platforms required |
| • |
Type of model/indicators predictives for each segments (Scoring or Rating) |
Automated Model
This methodology is recursively used in segments of individuals without commercial business of Commercial Banking and Bank Credichile. It applies models that must qualify three important dimensions for assess massive requests of credits:
According to the mentioned above there are three areas relevant to the admissions process:
Minimum credit profile (scoring)
Borrowing Limits (exposure)
Target Market
The credit profile is evaluated using statistics models of “Credit Scoring”, which are different for Commercial Area and Credichile, and also are segmented and specifics for different types of clients.
The predictive ability of the models is fundamental to do successful risk management during different economics cycles, which force to be permanently reviewed actual market conditions.
For ensure high standards in quality of information of customers, Risk area consolidates an important volume of input data to our clients system and also it has permanent process of revision or audits to verify the correct application of process of credit.
Definition of target market is an elemental dimension to guide the commercial efforts and business strategies. An offer of products more efficiently, it allows maximizing the individual exposition and expected returns.
Parametric Model :
The SME segment is a segment that has developed assessment schemes and ad hoc admission to their characteristics. This segment has defined a parametric model that is responsible for mass segment features a segment as well as case by case analysis. This model considers the evaluation of customers based on three pillars. These are payment behavior, internal and external, financial reporting analysis and evaluation of the client’s business. This process yields a parametric evaluation category that summarizes the credit quality of the customer through a rating, which is linked directly to the powers of credit required for each operation.
F-134
Table of Contents
NOTES TO THE CONSOLIDATED FINANCIAL STATEMENTS, Continued
| 42. | Risk Management, continued: |
| (2) | Credit Risk, continued |
Individual and SME (Small and Medium Enterprises) Banking, continued
| (a) | Approval Process, continued |
Some cases occur in which lower level of information available and/or economic sector, do not have a rating, in such cases being managed directly by the Risk area, which makes the credit assessment criteria applying their expert. Note that internal audits are performed on an ongoing basis to ensure the quality of the information used in the preparation of Rating.
Additionally, the Corporate Risk Division supports business significantly through the process of pre-approval of loans to customers, to optimize the relation of risk-return of these segments. Thus, both in retail market and in small and medium enterprises, there are specialized units that generate credit offers, according to predefined strategies for different group of clients, using statistic models, which it is modifying, depending of evolution of macroeconomics variables and the behavior of that group. These offers of credits and operations approval are supported by the constitution of collateral.
| (b) | Control and Follow up |
In the individual banking, control and follow-up focus on constant monitoring of aggregate portfolio’s main indicators and monthly source of new customers.
The most relevant are the following:
| • |
Follow-up of the expected loss of the portfolio through a general model of provisions and back-test of losses for the portfolios that have the maturity required. |
| • |
Analysis of new customers and decomposition respective of the loss rate in according to the product, champion / challenger campaigns and segments. |
| • |
Follow-up arrears indicators portfolio and its spending detailed by product, customer segment, sales process (pre-approved v / s evaluated), areas, etc. Mainly oriented to early detection of potential sources of risk higher than expected in portfolio, regularization of cases and management of credit policy and campaigns pre-approval. |
| • |
Approval and rejection rates applications submitted in the first instance and through appeal, with openings of approvers, branches, etc. |
| • |
Follow-up mortgage portfolio in according of policy variables, financing tranches (Loan to Value), deadlines, relation dividend / income customers, segments, income brackets, etc. |
| • |
Risk segmentation strategies for collection processes and policies to better integrate loan approval and monitoring processes, aligned behind single vision of customer credit fundamentals |
F-135
Table of Contents
NOTES TO THE CONSOLIDATED FINANCIAL STATEMENTS, Continued
| 42. | Risk Management, continued: |
| (2) | Credit Risk, continued |
Corporate Banking
| (a) | Approval Process |
Case by case model :
This type of analysis applies to wholesale market, corporations and real-state. Consist in individual assessment expert, which provides the level of risk, terms, transaction amount and complexity and perspective of the business, among other variables. This approval process is also supported by a rating model which gives a more uniform assessment and determines the level of credit. In this sense there are a process and consolidated team with high level of experience and expertise in approving appropriations for the various segments and sectors in which the Bank participates, with a perspective of medium and long term respect different industries and clients. Additionally, to make more effective the admission process, improving quality of assessment and optimizing times of responses to clients, the process of data collection, analysis and discussion of the proposed credit are supported by the areas of credit risk.
| (b) | Control and Follow up |
In the wholesale business segment, control and follow-up are realized through a combination of reviews. The most relevant are the following:
| • |
Delinquencies management, supported by the information of predictive indicators of risk level, with follow up and action plans in the case of more important clients, also manage of different strategies of early collection. |
| • |
Structured controls of clients with credit covenants |
| • |
Quick review of the portfolio, determining clients potentially affected by a price change of any macroeconomic variable in specific sector or segment. |
| • |
Systematic follow up of variables of credit behavior and financial figures of the corporations, as well as particular conditions and restrictions of credits. |
| • |
Management portfolio classification, which determines risk and required rate of provision, according to general rules established by the Superintendency of Banks and Financial Institutions and specific criteria set out in the Bank, allowing correct application over special clients. |
| • |
Management portfolio in special follow up (Vigilance), through committee periodic and permanent monitoring, allowing establish action plans for entities that presents risk alerts. |
F-136
Table of Contents
NOTES TO THE CONSOLIDATED FINANCIAL STATEMENTS, Continued
| 42. | Risk Management, continued: |
| (2) | Credit Risk, continued |
| (c) | Derivative Instruments |
Counterparty credit exposures generated by derivative transactions are determined utilizing SBIF and internal models.
Credit exposures under the SBIF framework are computed as follows:
Credit Exposure = Maximum (CMTM, 0) + Factor*Notional
CMTM: Current Mark-to-Market of the transaction
Notional: Transaction notional amount
Factor: Factors suggested by the BIS (Bank for International Settlements) in 1996
The exposures computed following SBIF models are measured daily, controlled and reported by counterparty against specific credit lines approved for each of them during the entire life of the transactions.
Additionally, we generate another metric which is the pre-settlement exposure (PSE at 95% confidence level) under internal models, as follows:
PSE =Maximum (CMTM + CEF*Notional, 0)
CMTM: Current Mark-to-Market of the transaction
Notional: Transaction notional amount
CEF: Credit Exposure Factor, which reflects the peak exposure of the transaction under 95% of confidence level
This metric for each counterparty, is currently compared against the credit line at inception only. However, it will be computed on a daily basis from October 2012 onward.
We will have soon two metrics for measuring and reporting credit exposures for derivative transactions: the regulatory one and that calculated under internal models. The former will be used for computing regulatory ratios and the latter will be used for measuring, limiting, controlling and reporting credit exposures generated by these transactions.
Credit mitigating conditions for derivative transactions, such as thresholds, margin calls, etc. have become popular in the local financial markets. Collateral agreements have been demanded by certain banks for inter-banking transactions but the effective application of netting in the case of bank’s default in Chile is doubtful; in fact, Chilean Bank Law allows the intervention of bank under stress by regulatory entities previous to the execution of the default. Therefore, we are not considering credit mitigations for transactions with banks domiciled in Chile. Conversely, netting is possible with non-banking corporations and there are a few corporate customers that have accepted credit mitigations conditions. In any case, all transactions are documented under a regular Master Agreement, which has been reviewed by the local regulatory entities.
Derivatives transactions closed with counterparts residing abroad (mostly global banks) are documented utilizing ISDA and CSA. Netting and cash collateral above a certain threshold level are the typical credit mitigations in place for this kind of transactions.
F-137
Table of Contents
NOTES TO THE CONSOLIDATED FINANCIAL STATEMENTS, Continued
| 42. | Risk Management, continued: |
| (2) | Credit Risk, continued |
The following tables show credit risk exposure per balance sheet item, including derivatives, detailed by both geographic region and industry sector as of December 31, 2012:
| Chile |
United
States |
Brazil | Other | Total | ||||||||||||||||
| MCh$ | MCh$ | MCh$ | MCh$ | MCh$ | ||||||||||||||||
|
Financial Assets |
||||||||||||||||||||
|
Cash and Due from Banks |
499,473 | 167,186 | — | 18,266 | 684,925 | |||||||||||||||
|
|
|
|
|
|
|
|
|
|
|
|||||||||||
|
Financial Assets held-for-trading |
— | — | — | — | — | |||||||||||||||
|
From the Chilean Government and Central Bank of Chile |
72,379 | — | — | — | 72,379 | |||||||||||||||
|
Other instruments issued in Chile |
87,303 | — | — | — | 87,303 | |||||||||||||||
|
Instruments issued abroad |
— | — | — | — | — | |||||||||||||||
|
|
|
|
|
|
|
|
|
|
|
|||||||||||
|
Subtotal |
159,682 | — | — | — | 159,682 | |||||||||||||||
|
|
|
|
|
|
|
|
|
|
|
|||||||||||
|
Cash collateral on securities borrowed and reverse repurchase agreements |
35,100 | — | — | — | 35,100 | |||||||||||||||
|
|
|
|
|
|
|
|
|
|
|
|||||||||||
|
Derivative Contracts for Trading Purposes |
||||||||||||||||||||
|
Forwards |
54,438 | 2,652 | — | 9,662 | 66,752 | |||||||||||||||
|
Swaps |
99,245 | 123,676 | — | 35,575 | 258,496 | |||||||||||||||
|
Call Options |
439 | — | — | 33 | 472 | |||||||||||||||
|
Put Options |
341 | — | — | — | 341 | |||||||||||||||
|
Futures |
— | — | — | — | — | |||||||||||||||
|
Other |
— | — | — | — | — | |||||||||||||||
|
|
|
|
|
|
|
|
|
|
|
|||||||||||
|
Subtotal |
154,463 | 126,328 | — | 45,270 | 326,061 | |||||||||||||||
|
|
|
|
|
|
|
|
|
|
|
|||||||||||
|
Hedge Derivative Contracts |
||||||||||||||||||||
|
Forwards |
— | — | — | — | — | |||||||||||||||
|
Swaps |
22 | — | — | — | 22 | |||||||||||||||
|
Call Options |
— | — | — | — | — | |||||||||||||||
|
Put Options |
— | — | — | — | — | |||||||||||||||
|
Futures |
— | — | — | — | — | |||||||||||||||
|
Other |
— | — | — | — | — | |||||||||||||||
|
|
|
|
|
|
|
|
|
|
|
|||||||||||
|
Subtotal |
22 | — | — | — | 22 | |||||||||||||||
|
|
|
|
|
|
|
|
|
|
|
|||||||||||
|
Loans and advances to Banks |
||||||||||||||||||||
|
Central Bank of Chile |
1,100,696 | — | — | — | 1,100,696 | |||||||||||||||
|
Domestic banks |
14,309 | — | — | — | 14,309 | |||||||||||||||
|
Foreign banks |
80,458 | — | 109,505 | 39,313 | 229,276 | |||||||||||||||
|
|
|
|
|
|
|
|
|
|
|
|||||||||||
|
Subtotal |
1,195,463 | — | 109,505 | 39,313 | 1,344,281 | |||||||||||||||
|
|
|
|
|
|
|
|
|
|
|
|||||||||||
|
Loans to Customers (before allowances for loans losses) |
||||||||||||||||||||
|
Commercial loans |
11,580,495 | 17,534 | 15,507 | 128,044 | 11,741,580 | |||||||||||||||
|
Residential mortgage loans |
4,198,667 | — | — | — | 4,198,667 | |||||||||||||||
|
Consumer loans |
2,831,514 | — | — | — | 2,831,514 | |||||||||||||||
|
|
|
|
|
|
|
|
|
|
|
|||||||||||
|
Subtotal |
18,610,676 | 17,534 | 15,507 | 128,044 | 18,771,761 | |||||||||||||||
|
|
|
|
|
|
|
|
|
|
|
|||||||||||
|
Financial Assets Available-for-Sale |
||||||||||||||||||||
|
from the Chilean Government and Central Bank of Chile |
251,784 | — | — | — | 251,784 | |||||||||||||||
|
Other instruments issued in Chile |
932,028 | — | — | — | 932,028 | |||||||||||||||
|
|
|
|
|
|
|
|
|
|
|
|||||||||||
|
Instruments issued abroad |
— | 83,759 | 4,745 | — | 88,504 | |||||||||||||||
|
|
|
|
|
|
|
|
|
|
|
|||||||||||
|
Subtotal |
1,183,812 | 83,759 | 4,745 | — | 1,272,316 | |||||||||||||||
|
|
|
|
|
|
|
|
|
|
|
|||||||||||
|
Financial assets held-to-Maturity |
— | — | — | — | — | |||||||||||||||
|
|
|
|
|
|
|
|
|
|
|
|||||||||||
F-138
Table of Contents
NOTES TO THE CONSOLIDATED FINANCIAL STATEMENTS, Continued
| 42. | Risk Management, continued: |
|
Financial
Services MCh$ |
Government
MCh$ |
Retail
(Individuals) MCh$ |
Trade
MCh$ |
Manufacturing
MCh$ |
Mining
MCh$ |
Electricity,
Gas and Water MCh$ |
Agriculture
and Livestock MCh$ |
Forestry
MCh$ |
Fishing
MCh$ |
Transportation
and Telecom MCh$ |
Construction
MCh$ |
Services
MCh$ |
Other | Total | ||||||||||||||||||||||||||||||||||||||||||||||
|
Financial Assets |
||||||||||||||||||||||||||||||||||||||||||||||||||||||||||||
|
Cash and Due from Banks |
216,843 | — | — | — | — | — | — | — | — | — | — | — | — | 468,082 | 684,925 | |||||||||||||||||||||||||||||||||||||||||||||
|
|
|
|
|
|
|
|
|
|
|
|
|
|
|
|
|
|
|
|
|
|
|
|
|
|
|
|
|
|
|
|||||||||||||||||||||||||||||||
|
Financial Assets held-for-trading |
72,379 | 72,379 | ||||||||||||||||||||||||||||||||||||||||||||||||||||||||||
|
from the Chilean Government and Central Bank of Chile |
87,115 | — | — | — | — | — | — | — | — | — | — | — | — | 188 | 87,303 | |||||||||||||||||||||||||||||||||||||||||||||
|
Other instruments issued in Chile |
— | — | — | — | — | — | — | — | — | — | — | — | — | — | — | |||||||||||||||||||||||||||||||||||||||||||||
|
Instruments issued abroad |
— | — | — | — | — | — | — | — | — | — | — | — | — | — | — | |||||||||||||||||||||||||||||||||||||||||||||
|
|
|
|
|
|
|
|
|
|
|
|
|
|
|
|
|
|
|
|
|
|
|
|
|
|
|
|
|
|
|
|||||||||||||||||||||||||||||||
|
Subtotal |
87,115 | — | — | — | — | — | — | — | — | — | — | — | — | 72,567 | 159,682 | |||||||||||||||||||||||||||||||||||||||||||||
|
|
|
|
|
|
|
|
|
|
|
|
|
|
|
|
|
|
|
|
|
|
|
|
|
|
|
|
|
|
|
|||||||||||||||||||||||||||||||
|
Cash collateral on securities borrowed and reverse repurchase agreements Payables |
25,979 | — | 2,280 | 3,212 | — | — | — | 160 | — | — | — | 1,854 | 1,615 | — | 35,100 | |||||||||||||||||||||||||||||||||||||||||||||
|
|
|
|
|
|
|
|
|
|
|
|
|
|
|
|
|
|
|
|
|
|
|
|
|
|
|
|
|
|
|
|||||||||||||||||||||||||||||||
|
Derivative Contracts for Trading Purposes |
||||||||||||||||||||||||||||||||||||||||||||||||||||||||||||
|
Forwards |
61,699 | — | 1 | 3,092 | 1,084 | 53 | 75 | 321 | — | 114 | 207 | 13 | 93 | — | 66,752 | |||||||||||||||||||||||||||||||||||||||||||||
|
Swaps |
232,459 | — | — | 6,039 | 5,447 | 725 | 4,986 | 1,819 | — | 279 | 5,569 | 963 | 210 | — | 258,496 | |||||||||||||||||||||||||||||||||||||||||||||
|
Call Options |
354 | — | — | 92 | 26 | — | — | — | — | — | — | — | — | — | 472 | |||||||||||||||||||||||||||||||||||||||||||||
|
Put Options |
85 | — | — | 215 | 27 | — | — | — | 9 | 5 | — | — | — | — | 341 | |||||||||||||||||||||||||||||||||||||||||||||
|
Futures |
— | — | — | — | — | — | — | — | — | — | — | — | — | — | — | |||||||||||||||||||||||||||||||||||||||||||||
|
Other |
— | — | — | — | — | — | — | — | — | — | — | — | — | — | — | |||||||||||||||||||||||||||||||||||||||||||||
|
|
|
|
|
|
|
|
|
|
|
|
|
|
|
|
|
|
|
|
|
|
|
|
|
|
|
|
|
|
|
|||||||||||||||||||||||||||||||
|
Subtotal |
294,597 | — | 1 | 9,438 | 6,584 | 778 | 5,061 | 2,140 | 9 | 398 | 5,776 | 976 | 303 | — | 326,061 | |||||||||||||||||||||||||||||||||||||||||||||
|
|
|
|
|
|
|
|
|
|
|
|
|
|
|
|
|
|
|
|
|
|
|
|
|
|
|
|
|
|
|
|||||||||||||||||||||||||||||||
|
Hedge Derivative Contracts |
||||||||||||||||||||||||||||||||||||||||||||||||||||||||||||
|
Forwards |
— | — | — | — | — | — | — | — | — | — | — | — | — | — | — | |||||||||||||||||||||||||||||||||||||||||||||
|
Swaps |
22 | — | — | — | — | — | — | — | — | — | — | — | — | — | 22 | |||||||||||||||||||||||||||||||||||||||||||||
|
Call Options |
— | — | — | — | — | — | — | — | — | — | — | — | — | — | — | |||||||||||||||||||||||||||||||||||||||||||||
|
Put Options |
— | — | — | — | — | — | — | — | — | — | — | — | — | — | — | |||||||||||||||||||||||||||||||||||||||||||||
|
Futures |
— | — | — | — | — | — | — | — | — | — | — | — | — | — | — | |||||||||||||||||||||||||||||||||||||||||||||
|
Other |
— | — | — | — | — | — | — | — | — | — | — | — | — | — | — | |||||||||||||||||||||||||||||||||||||||||||||
|
|
|
|
|
|
|
|
|
|
|
|
|
|
|
|
|
|
|
|
|
|
|
|
|
|
|
|
|
|
|
|||||||||||||||||||||||||||||||
|
Subtotal |
22 | — | — | — | — | — | — | — | — | — | — | — | — | — | 22 | |||||||||||||||||||||||||||||||||||||||||||||
|
|
|
|
|
|
|
|
|
|
|
|
|
|
|
|
|
|
|
|
|
|
|
|
|
|
|
|
|
|
|
|||||||||||||||||||||||||||||||
|
Loans and advances to Banks |
||||||||||||||||||||||||||||||||||||||||||||||||||||||||||||
|
Central Bank of Chile |
— | — | — | — | — | — | — | — | — | — | — | — | — | 1,100,696 | 1,100,696 | |||||||||||||||||||||||||||||||||||||||||||||
|
Domestic banks |
14,309 | — | — | — | — | — | — | — | — | — | — | — | — | 14,309 | ||||||||||||||||||||||||||||||||||||||||||||||
|
Foreign banks |
229,276 | — | — | — | — | — | — | — | — | — | — | — | — | 229,276 | ||||||||||||||||||||||||||||||||||||||||||||||
|
|
|
|
|
|
|
|
|
|
|
|
|
|
|
|
|
|
|
|
|
|
|
|
|
|
|
|
|
|
|
|||||||||||||||||||||||||||||||
|
Subtotal |
243,585 | — | — | — | — | — | — | — | — | — | — | — | — | 1,100,696 | 1,344,281 | |||||||||||||||||||||||||||||||||||||||||||||
|
|
|
|
|
|
|
|
|
|
|
|
|
|
|
|
|
|
|
|
|
|
|
|
|
|
|
|
|
|
|
|||||||||||||||||||||||||||||||
|
Loans to Customers, Net |
||||||||||||||||||||||||||||||||||||||||||||||||||||||||||||
|
Commercial loans (*) |
||||||||||||||||||||||||||||||||||||||||||||||||||||||||||||
|
Residential mortgage loans |
6,609 | 3,503,474 | 80,676 | 15,970 | 2,702 | 27,697 | 1,840 | 23,934 | 17,322 | 105,181 | 413,262 | 4,198,667 | ||||||||||||||||||||||||||||||||||||||||||||||||
|
Consumer loans |
3,131 | 2,557,411 | 40,109 | 9,400 | 1,532 | 5 | 33,664 | 840 | 16,280 | 9,870 | 38,440 | 120,832 | 2,831,514 | |||||||||||||||||||||||||||||||||||||||||||||||
|
Financial Assets Available-for-Sale |
||||||||||||||||||||||||||||||||||||||||||||||||||||||||||||
|
from the Chilean Government and Central Bank of Chile |
— | — | — | — | — | — | — | — | — | — | — | — | 251,784 | 251,784 | ||||||||||||||||||||||||||||||||||||||||||||||
|
Other instruments issued in Chile |
809,035 | — | — | 18,262 | — | 5,024 | 41,309 | — | 44,303 | — | 7,640 | — | 2,164 | 4,291 | 932,028 | |||||||||||||||||||||||||||||||||||||||||||||
|
Instruments issued abroad |
88,504 | — | — | — | — | — | — | — | — | — | — | — | — | — | 88,504 | |||||||||||||||||||||||||||||||||||||||||||||
|
|
|
|
|
|
|
|
|
|
|
|
|
|
|
|
|
|
|
|
|
|
|
|
|
|
|
|
|
|
|
|||||||||||||||||||||||||||||||
|
Subtotal |
897,539 | — | — | 18,262 | — | 5,024 | 41,309 | — | 44,303 | — | 7,640 | — | 2,164 | 256,075 | 1,272,316 | |||||||||||||||||||||||||||||||||||||||||||||
|
|
|
|
|
|
|
|
|
|
|
|
|
|
|
|
|
|
|
|
|
|
|
|
|
|
|
|
|
|
|
|||||||||||||||||||||||||||||||
|
Financial assets held-to-Maturity |
— | — | — | — | — | — | — | — | — | — | — | — | — | — | — | |||||||||||||||||||||||||||||||||||||||||||||
|
|
|
|
|
|
|
|
|
|
|
|
|
|
|
|
|
|
|
|
|
|
|
|
|
|
|
|
|
|
|
|||||||||||||||||||||||||||||||
| (*) | See commercial loans by industry sector in Note 11(e). |
F-139
Table of Contents
NOTES TO THE CONSOLIDATED FINANCIAL STATEMENTS, Continued
| 42. | Risk Management, continued: |
The following tables show credit risk exposure per balance sheet item, including derivatives, detailed by both geographic region and industry sector as of December 31, 2013:
| Chile |
United
States |
Brazil | Other | Total | ||||||||||||||||
| MCh$ | MCh$ | MCh$ | MCh$ | MCh$ | ||||||||||||||||
|
Financial Assets |
||||||||||||||||||||
|
Cash and Due from Banks |
582,022 | 268,217 | — | 23,069 | 873,308 | |||||||||||||||
|
|
|
|
|
|
|
|
|
|
|
|||||||||||
|
Financial Assets held-for-trading |
||||||||||||||||||||
|
from the Chilean Government and Central Bank of Chile |
64,937 | — | — | — | 64,937 | |||||||||||||||
|
Other instruments issued in Chile |
261,984 | — | — | — | 261,984 | |||||||||||||||
|
Instruments issued abroad |
— | — | — | — | — | |||||||||||||||
|
|
|
|
|
|
|
|
|
|
|
|||||||||||
|
Subtotal |
326,921 | — | — | — | 326,921 | |||||||||||||||
|
|
|
|
|
|
|
|
|
|
|
|||||||||||
|
Cash collateral on securities borrowed and reverse repurchase agreements |
82,422 | — | — | — | 82,422 | |||||||||||||||
|
|
|
|
|
|
|
|
|
|
|
|||||||||||
|
Derivative Contracts for Trading Purposes |
||||||||||||||||||||
|
Forwards |
28,701 | 1,833 | — | 11,139 | 41,673 | |||||||||||||||
|
Swaps |
158,810 | 88,495 | — | 44,124 | 291,429 | |||||||||||||||
|
Call Options |
2,241 | — | — | 60 | 2,301 | |||||||||||||||
|
Put Options |
525 | — | — | 75 | 600 | |||||||||||||||
|
Futures |
— | — | — | — | — | |||||||||||||||
|
Others |
— | — | — | — | — | |||||||||||||||
|
|
|
|
|
|
|
|
|
|
|
|||||||||||
|
Subtotal |
190,277 | 90,328 | — | 55,398 | 336,003 | |||||||||||||||
|
|
|
|
|
|
|
|
|
|
|
|||||||||||
|
Hedge Derivative Contracts |
||||||||||||||||||||
|
Forwards |
— | — | — | — | — | |||||||||||||||
|
Swaps |
2,992 | 3,971 | — | 31,721 | 38,684 | |||||||||||||||
|
Call Options |
— | — | — | — | — | |||||||||||||||
|
Put Options |
— | — | — | — | — | |||||||||||||||
|
Futures |
— | — | — | — | — | |||||||||||||||
|
Others |
— | — | — | — | — | |||||||||||||||
|
|
|
|
|
|
|
|
|
|
|
|||||||||||
|
Subtotal |
2,992 | 3,971 | — | 31,721 | 38,684 | |||||||||||||||
|
Loans and advances to Banks |
||||||||||||||||||||
|
Central Bank of Chile |
600,581 | — | — | — | 600,581 | |||||||||||||||
|
Domestic banks |
100,012 | — | — | — | 100,012 | |||||||||||||||
|
Foreign banks |
— | — | 254,977 | 107,778 | 362,755 | |||||||||||||||
|
|
|
|
|
|
|
|
|
|
|
|||||||||||
|
Subtotal |
700,593 | — | 254,977 | 107,778 | 1,063,348 | |||||||||||||||
|
|
|
|
|
|
|
|
|
|
|
|||||||||||
|
Loans to Customers (before allowances for loans losses) |
||||||||||||||||||||
|
Commercial loans |
12,577,004 | 51,268 | 270,480 | 180,221 | 13,078,973 | |||||||||||||||
|
Residential mortgage loans |
4,732,307 | — | — | — | 4,732,307 | |||||||||||||||
|
Consumer loans |
3,069,490 | — | — | — | 3,069,490 | |||||||||||||||
|
|
|
|
|
|
|
|
|
|
|
|||||||||||
|
Subtotal |
20,378,801 | 51,268 | 270,480 | 180,221 | 20,880,770 | |||||||||||||||
|
|
|
|
|
|
|
|
|
|
|
|||||||||||
|
Financial Assets Available-for-Sale |
||||||||||||||||||||
|
from the Chilean Government and Central Bank of Chile |
586,408 | — | — | — | 586,408 | |||||||||||||||
|
Other instruments issued in Chile |
1,019,253 | — | — | — | 1,019,253 | |||||||||||||||
|
Instruments issued abroad |
— | 71,533 | 4,689 | — | 76,222 | |||||||||||||||
|
|
|
|
|
|
|
|
|
|
|
|||||||||||
|
Subtotal |
1,605,661 | 71,533 | 4,689 | — | 1,681,883 | |||||||||||||||
|
|
|
|
|
|
|
|
|
|
|
|||||||||||
|
Financial assets held-to-Maturity |
— | — | — | — | — | |||||||||||||||
|
|
|
|
|
|
|
|
|
|
|
|||||||||||
F-140
Table of Contents
NOTES TO THE CONSOLIDATED FINANCIAL STATEMENTS, Continued
| 42. | Risk Management, continued: |
|
Financial
Services MCh$ |
Government
MCh$ |
Retail
(Individuals) MCh$ |
Trade
MCh$ |
Manufacturing
MCh$ |
Mining
MCh$ |
Electricity,
Gas and Water MCh$ |
Agriculture
and Livestock MCh$ |
Forestry
MCh$ |
Fishing
MCh$ |
Transportation
and Telecom MCh$ |
Construction
MCh$ |
Services
MCh$ |
Other
MCh$ |
Total
MCh$ |
||||||||||||||||||||||||||||||||||||||||||||||
|
Financial Assets |
||||||||||||||||||||||||||||||||||||||||||||||||||||||||||||
|
Cash and Due from Banks |
801,521 | 71,787 | — | — | — | — | — | — | — | — | — | — | — | — | 873,308 | |||||||||||||||||||||||||||||||||||||||||||||
|
|
|
|
|
|
|
|
|
|
|
|
|
|
|
|
|
|
|
|
|
|
|
|
|
|
|
|
|
|
|
|||||||||||||||||||||||||||||||
|
Financial Assets held-for-trading |
||||||||||||||||||||||||||||||||||||||||||||||||||||||||||||
|
from the Chilean Government and Central Bank of Chile |
— | 64,937 | — | — | — | — | — | — | — | — | — | — | — | — | 64,937 | |||||||||||||||||||||||||||||||||||||||||||||
|
Other instruments issued in Chile |
257,523 | — | — | — | — | — | — | — | — | — | — | — | — | 4,461 | 261,984 | |||||||||||||||||||||||||||||||||||||||||||||
|
Instruments issued abroad |
— | — | — | — | — | — | — | — | — | — | — | — | — | — | — | |||||||||||||||||||||||||||||||||||||||||||||
|
|
|
|
|
|
|
|
|
|
|
|
|
|
|
|
|
|
|
|
|
|
|
|
|
|
|
|
|
|
|
|||||||||||||||||||||||||||||||
|
Subtotal |
257,523 | 64,937 | — | — | — | — | — | — | — | — | — | — | — | 4,461 | 326,921 | |||||||||||||||||||||||||||||||||||||||||||||
|
|
|
|
|
|
|
|
|
|
|
|
|
|
|
|
|
|
|
|
|
|
|
|
|
|
|
|
|
|
|
|||||||||||||||||||||||||||||||
|
Cash collateral on securities borrowed and reverse repurchase agreements Payables |
82,422 | — | — | — | — | — | — | — | — | — | — | — | — | — | 82,422 | |||||||||||||||||||||||||||||||||||||||||||||
|
|
|
|
|
|
|
|
|
|
|
|
|
|
|
|
|
|
|
|
|
|
|
|
|
|
|
|
|
|
|
|||||||||||||||||||||||||||||||
|
Derivative Contracts for Trading Purposes |
||||||||||||||||||||||||||||||||||||||||||||||||||||||||||||
|
Forwards |
34,384 | — | 13 | 1,024 | 2,885 | 1,050 | 25 | 694 | — | 546 | 450 | 11 | 105 | 486 | 41,673 | |||||||||||||||||||||||||||||||||||||||||||||
|
Swaps |
233,083 | — | — | 7,470 | 6,613 | 249 | 11,660 | 26,420 | — | 182 | 2,353 | 2,050 | 1,224 | 125 | 291,429 | |||||||||||||||||||||||||||||||||||||||||||||
|
Call Options |
446 | — | — | 647 | 1,017 | — | — | 48 | — | — | 60 | 8 | 75 | — | 2,301 | |||||||||||||||||||||||||||||||||||||||||||||
|
Put Options |
322 | — | — | 231 | 42 | — | — | — | — | — | — | 4 | — | 1 | 600 | |||||||||||||||||||||||||||||||||||||||||||||
|
Futures |
— | — | — | — | — | — | — | — | — | — | — | — | — | — | — | |||||||||||||||||||||||||||||||||||||||||||||
|
|
|
|
|
|
|
|
|
|
|
|
|
|
|
|
|
|
|
|
|
|
|
|
|
|
|
|
|
|
|
|||||||||||||||||||||||||||||||
|
Subtotal |
268,235 | — | 13 | 9,372 | 10,557 | 1,299 | 11,685 | 27,162 | — | 728 | 2,863 | 2,073 | 1,404 | 612 | 336,003 | |||||||||||||||||||||||||||||||||||||||||||||
|
|
|
|
|
|
|
|
|
|
|
|
|
|
|
|
|
|
|
|
|
|
|
|
|
|
|
|
|
|
|
|||||||||||||||||||||||||||||||
|
Hedge Derivative Contracts |
||||||||||||||||||||||||||||||||||||||||||||||||||||||||||||
|
Forwards |
— | — | — | — | — | — | — | — | — | — | — | — | — | — | — | |||||||||||||||||||||||||||||||||||||||||||||
|
Swaps |
38,684 | — | — | — | — | — | — | — | — | — | — | — | — | — | 38,684 | |||||||||||||||||||||||||||||||||||||||||||||
|
Call Options |
— | — | — | — | — | — | — | — | — | — | — | — | — | — | — | |||||||||||||||||||||||||||||||||||||||||||||
|
Put Options |
— | — | — | — | — | — | — | — | — | — | — | — | — | — | — | |||||||||||||||||||||||||||||||||||||||||||||
|
Futures |
— | — | — | — | — | — | — | — | — | — | — | — | — | — | — | |||||||||||||||||||||||||||||||||||||||||||||
|
|
|
|
|
|
|
|
|
|
|
|
|
|
|
|
|
|
|
|
|
|
|
|
|
|
|
|
|
|
|
|||||||||||||||||||||||||||||||
|
Subtotal |
38,684 | — | — | — | — | — | — | — | — | — | — | — | — | — | 38,684 | |||||||||||||||||||||||||||||||||||||||||||||
|
|
|
|
|
|
|
|
|
|
|
|
|
|
|
|
|
|
|
|
|
|
|
|
|
|
|
|
|
|
|
|||||||||||||||||||||||||||||||
|
Loans and advances to Banks |
||||||||||||||||||||||||||||||||||||||||||||||||||||||||||||
|
Central Bank of Chile |
— | 600,581 | — | — | — | — | — | — | — | — | — | — | — | — | 600,581 | |||||||||||||||||||||||||||||||||||||||||||||
|
Domestic banks |
100,012 | — | — | — | — | — | — | — | — | — | — | — | — | — | 100,012 | |||||||||||||||||||||||||||||||||||||||||||||
|
Foreign banks |
362,755 | — | — | — | — | — | — | — | — | — | — | — | — | — | 362,755 | |||||||||||||||||||||||||||||||||||||||||||||
|
|
|
|
|
|
|
|
|
|
|
|
|
|
|
|
|
|
|
|
|
|
|
|
|
|
|
|
|
|
|
|||||||||||||||||||||||||||||||
|
Subtotal |
462,767 | 600,581 | — | — | — | — | — | — | — | — | — | — | — | — | 1,063,348 | |||||||||||||||||||||||||||||||||||||||||||||
|
|
|
|
|
|
|
|
|
|
|
|
|
|
|
|
|
|
|
|
|
|
|
|
|
|
|
|
|
|
|
|||||||||||||||||||||||||||||||
|
Loans to Customers, Net |
||||||||||||||||||||||||||||||||||||||||||||||||||||||||||||
|
Commercial loans (*) |
— | — | — | — | — | — | — | — | — | — | — | — | — | — | — | |||||||||||||||||||||||||||||||||||||||||||||
|
Residential mortgage loans |
9,393 | — | 3,976,564 | 90,981 | 18,879 | 3,221 | — | 28,928 | — | 1,777 | 26,801 | 19,539 | 148,419 | 407,805 | 4,732,307 | |||||||||||||||||||||||||||||||||||||||||||||
|
Consumer loans |
12,827 | — | 2,772,544 | 41,052 | 9,537 | 1,683 | 18 | 34,650 | — | 823 | 16,920 | 10,320 | 51,633 | 117,483 | 3,069,490 | |||||||||||||||||||||||||||||||||||||||||||||
|
Financial Assets Available-for-Sale |
||||||||||||||||||||||||||||||||||||||||||||||||||||||||||||
|
from the Chilean Government and Central Bank of Chile |
— | 586,408 | — | — | — | — | — | — | — | — | — | — | — | — | 586,408 | |||||||||||||||||||||||||||||||||||||||||||||
|
Other instruments issued in Chile |
856,120 | — | — | 15,826 | — | 13,750 | 36,861 | 49 | 72,804 | — | — | 1,671 | — | 22,172 | 1,019,253 | |||||||||||||||||||||||||||||||||||||||||||||
|
Instruments issued abroad |
76,222 | — | — | — | — | — | — | — | — | — | — | — | — | — | 76,222 | |||||||||||||||||||||||||||||||||||||||||||||
|
|
|
|
|
|
|
|
|
|
|
|
|
|
|
|
|
|
|
|
|
|
|
|
|
|
|
|
|
|
|
|||||||||||||||||||||||||||||||
|
Subtotal |
932,342 | 586,408 | — | 15,826 | — | 13,750 | 36,861 | 49 | 72,804 | — | — | 1,671 | — | 22,172 | 1,681,883 | |||||||||||||||||||||||||||||||||||||||||||||
|
|
|
|
|
|
|
|
|
|
|
|
|
|
|
|
|
|
|
|
|
|
|
|
|
|
|
|
|
|
|
|||||||||||||||||||||||||||||||
|
Financial assets held-to-Maturity |
— | — | — | — | — | — | — | — | — | — | — | — | — | — | — | |||||||||||||||||||||||||||||||||||||||||||||
|
|
|
|
|
|
|
|
|
|
|
|
|
|
|
|
|
|
|
|
|
|
|
|
|
|
|
|
|
|
|
|||||||||||||||||||||||||||||||
| (*) | See commercial loans by industry sector in Note 11(e). |
F-141
Table of Contents
NOTES TO THE CONSOLIDATED FINANCIAL STATEMENTS, Continued
| 42. | Risk Management, continued: |
| (2) | Credit Risk, continued |
| (e) | Collaterals and Other Credit Enhancements |
The following table contains a detail of the type of collateral that are maintained for mitigate the exposure to credit risk:
|
Value of collateral and credit enhancements held as of
December 31, 2012 |
||||||||||||||||||||||||||||||||
|
Loans to customers: |
Maximum
exposure to credit risk MCh$ |
Mortgages
MCh$ |
Pledge(*)
MCh$ |
Securities
MCh$ |
Warrants
MCh$ |
Others
MCh$ |
Net
collateral MCh$ |
Net
exposure MCh$ |
||||||||||||||||||||||||
|
Corporate lending |
9,282,374 | 2,469,231 | 301,956 | 855,479 | 2,665 | 297,317 | 3,926,648 | 5,355,726 | ||||||||||||||||||||||||
|
Small business lending |
2,459,206 | 1,638,485 | 63,593 | 42,642 | — | 50,497 | 1,795,217 | 663,989 | ||||||||||||||||||||||||
|
Consumer lending |
2,831,514 | 228,946 | 8,331 | 3,569 | — | 15,983 | 256,829 | 2,574,685 | ||||||||||||||||||||||||
|
Mortgage lending |
4,198,667 | 3,965,927 | 388 | 957 | — | — | 3,967,272 | 231,395 | ||||||||||||||||||||||||
|
|
|
|
|
|
|
|
|
|
|
|
|
|
|
|
|
|||||||||||||||||
|
Total |
18,771,761 | 8,302,589 | 374,268 | 902,647 | 2,665 | 363,797 | 9,945,966 | 8,825,795 | ||||||||||||||||||||||||
|
|
|
|
|
|
|
|
|
|
|
|
|
|
|
|
|
|||||||||||||||||
|
Fair value of collateral and credit enhancements held as of
December 31, 2013 |
||||||||||||||||||||||||||||||||
|
Loans to customers: |
Maximum
exposure to credit risk MCh$ |
Mortgages
MCh$ |
Pledge(*)
MCh$ |
Securities
MCh$ |
Warrants
MCh$ |
Others
MCh$ |
Net
collateral MCh$ |
Net
exposure MCh$ |
||||||||||||||||||||||||
|
Corporate lending |
9,739,552 | 2,584,481 | 295,387 | 927,826 | 2,292 | 468,023 | 4,278,009 | 5,461,543 | ||||||||||||||||||||||||
|
Small business lending |
3,339,421 | 1,793,299 | 71,596 | 313,326 | — | 42,350 | 2,220,571 | 1,118,850 | ||||||||||||||||||||||||
|
Consumer lending |
3,069,490 | 248,625 | 8,404 | 4,357 | — | 18,262 | 279,648 | 2,789,842 | ||||||||||||||||||||||||
|
Mortgage lending |
4,732,307 | 4,365,861 | 242 | 1,054 | — | — | 4,367,157 | 365,150 | ||||||||||||||||||||||||
|
|
|
|
|
|
|
|
|
|
|
|
|
|
|
|
|
|||||||||||||||||
|
Total |
20,880,770 | 8,992,266 | 375,629 | 1,246,563 | 2,292 | 528,635 | 11,145,385 | 9,735,385 | ||||||||||||||||||||||||
|
|
|
|
|
|
|
|
|
|
|
|
|
|
|
|
|
|||||||||||||||||
| (*) | Includes agricultural and industrial pledges and pledges without conveyance |
The above table presents the value of collateral that the Bank uses for mitigate the exposure risk. These value corresponds to a value that is generally assessed, at a minimum, at inception by a certified appraiser and later, this amount is adjusted by a financial model that considers several different factors (see note 2 (h)).
F-142
Table of Contents
NOTES TO THE CONSOLIDATED FINANCIAL STATEMENTS, Continued
| 42. | Risk Management, continued: |
| (2) | Credit Risk, continued |
| (e) | Collaterals and Other Credit Enhancements, continued |
The amount and type of collateral required depends on the counterparty’s credit risk assessment.
The Bank has guidelines regarding the acceptability of types of collateral and valuation parameters.
The main types of collateral obtained are:
| • |
For commercial loans: Residential and non-residential real estate, liens and inventory. |
| • |
For retail loans: Mortgages on residential property. |
The Bank also obtains collateral from parent companies for loans granted to their subsidiaries.
Management makes sure its collateral is acceptable according to both external standards and internal policy guidelines and parameters. The Bank has approximately 182,387 collateral assets, the majority of which consist of real estate.
The Bank also uses the following mitigating tactics for credit risk on derivative transactions:
| • |
Accelerating transactions and net payment using market values at the date of default of one of the parties. |
| • |
Option for both parties to terminate early any transactions with a counterparty at a given date, using market values as of the respective date. |
| • |
Margins established with time deposits by customers that close FX forwards with subsidiary Banchile Corredores de Bolsa S.A. |
| (f) | Credit Quality by Asset Class |
The Bank determines the credit quality of financial assets using internal credit ratings. The rating process is linked to the Bank’s approval and monitoring processes and is carried out in accordance with risk categories established by current standards. Credit quality is continuously updated based on any favorable or unfavorable developments to customers or their environments, considering aspects such as commercial and payment behavior as well as financial information.
The Bank also conducts reviews of companies in certain industry sectors that are affected by macroeconomic or sector-specific variables. Such reviews allow the Bank to timely establish any necessary allowance loan losses that are sufficient to cover losses for potentially uncollectable loans.
F-143
Table of Contents
NOTES TO THE CONSOLIDATED FINANCIAL STATEMENTS, Continued
| 42. | Risk Management, continued: |
| (2) | Credit Risk, continued |
| (f) | Credit Quality by Asset Class, continued: |
The following table shows credit quality by asset class for balance sheet items, based on the Bank’s credit rating system.
| As of December 31, 2012 | ||||||||||||||||||||||||
| Individual Portfolio | Group Portfolio | |||||||||||||||||||||||
| Normal | Substandard | Non-complying | Normal | Non-complying | Total | |||||||||||||||||||
| MCh$ | MCh$ | MCh$ | MCh$ | MCh$ | MCh$ | |||||||||||||||||||
|
Financial Assets |
||||||||||||||||||||||||
|
Loans and advances to banks |
||||||||||||||||||||||||
|
Central Bank of Chile |
1,100,696 | — | — | — | — | 1,100,696 | ||||||||||||||||||
|
Domestic banks |
14,309 | — | — | — | — | 14,309 | ||||||||||||||||||
|
Foreign banks |
229,276 | — | — | — | — | 229,276 | ||||||||||||||||||
|
|
|
|
|
|
|
|
|
|
|
|
|
|||||||||||||
|
Subtotal |
1,344,281 | — | — | — | — | 1,344,281 | ||||||||||||||||||
|
|
|
|
|
|
|
|
|
|
|
|
|
|||||||||||||
|
Loans to customers (before allowances for loan losses) |
||||||||||||||||||||||||
|
Commercial loans |
9,331,413 | 204,371 | 148,798 | 1,864,800 | 185,988 | 11,735,370 | ||||||||||||||||||
|
Residential mortgage loans |
— | — | — | 4,149,264 | 49,403 | 4,198,667 | ||||||||||||||||||
|
Consumer loans |
— | — | — | 2,651,351 | 186,373 | 2,837,724 | ||||||||||||||||||
|
|
|
|
|
|
|
|
|
|
|
|
|
|||||||||||||
|
Subtotal |
9,331,413 | 204,371 | 148,798 | 8,665,415 | 421,764 | 18,771,761 | ||||||||||||||||||
|
|
|
|
|
|
|
|
|
|
|
|
|
|||||||||||||
| As of December 31, 2013 | ||||||||||||||||||||||||
| Individual Portfolio | Group Portfolio | |||||||||||||||||||||||
| Normal | Substandard | Non-complying | Normal | Non-complying | Total | |||||||||||||||||||
| MCh$ | MCh$ | MCh$ | MCh$ | MCh$ | MCh$ | |||||||||||||||||||
|
Financial Assets |
||||||||||||||||||||||||
|
Loans and advances to banks |
||||||||||||||||||||||||
|
Central Bank of Chile |
600,581 | — | — | — | — | 600,581 | ||||||||||||||||||
|
Domestic banks |
100,012 | — | — | — | — | 100,012 | ||||||||||||||||||
|
Foreign banks |
362,755 | — | — | — | — | 362,755 | ||||||||||||||||||
|
|
|
|
|
|
|
|
|
|
|
|
|
|||||||||||||
|
Subtotal |
1,063,348 | — | — | — | — | 1,063,348 | ||||||||||||||||||
|
|
|
|
|
|
|
|
|
|
|
|
|
|||||||||||||
|
Loans to customers (before allowances for loan losses) |
||||||||||||||||||||||||
|
Commercial loans |
10,482,877 | 224,447 | 155,324 | 2,011,162 | 205,163 | 13,078,973 | ||||||||||||||||||
|
Residential mortgage loans |
— | — | — | 4,662,977 | 69,330 | 4,732,307 | ||||||||||||||||||
|
Consumer loans |
— | — | — | 2,856,365 | 213,125 | 3,069,490 | ||||||||||||||||||
|
|
|
|
|
|
|
|
|
|
|
|
|
|||||||||||||
|
Subtotal |
10,482,877 | 224,447 | 155,324 | 9,530,504 | 487,618 | 20,880,770 | ||||||||||||||||||
|
|
|
|
|
|
|
|
|
|
|
|
|
|||||||||||||
F-144
Table of Contents
NOTES TO THE CONSOLIDATED FINANCIAL STATEMENTS, Continued
| 42. | Risk Management, continued: |
| (2) | Credit Risk, continued |
| (f) | Credit Quality by Asset Class, continued: |
Substandard and Non-Complying loans
The following table shows the conciliation between Normal and Impaired Portfolio and classification criteria of impaired loans, which includes some categories of substandard loans:
| December | December | |||||||
|
2012
MCh$ |
2013
MCh$ |
|||||||
|
Individual Portfolio |
||||||||
|
Substandard (categories B1 – B4) |
204,371 | 224,447 | ||||||
|
Non-complying (categories C1 – C6) |
148,798 | 155,324 | ||||||
|
Group Portfolio |
||||||||
|
Non-complying |
421,764 | 487,618 | ||||||
|
|
|
|
|
|||||
|
Total substandard and non-complying categories (from B1 to C6) |
774,933 | 867,389 | ||||||
|
Total impaired loans (categories B3 – C6) |
619,023 | 725,899 | ||||||
|
|
|
|
|
|||||
|
Normal portfolio (categories B1 – B2) |
155,910 | 141,490 | ||||||
|
|
|
|
|
|||||
Categories B3 to C6 present objective evidence of impairment, as a result of the occurrence of one or more conditions or events described below, according to paragraph 59 of IAS 39.
Related to categories B1 and B2 correspond to debtors who have sufficient credit quality, so these categories are not considered impaired.
The classification criteria are the following:
|
Categories |
Criteria |
|||||
| B1 – Normal | • | Vulnerable ability to make payments, with some difficult in some of them, but debtor regularized payments on a timely basis | ||||
| B2 – Normal | • | Debtor with low but sufficient credit quality | ||||
| B3 – Impaired | • | Debtor with a very low credit quality | ||||
| • | Weak ability to make payments, and it has shown delinquency in its payments, may need a financial restructuring | |||||
| B4 – Impaired | • | Debtor with minimum credit quality | ||||
| • | This debtor type presents a history of negative behaviors in the past 12 months | |||||
| C1-C6 Impaired | • | These categories include debtors and their credits, the recovery of which is considered remote, as they present a deteriorating or no ability to pay | ||||
| • | Debtors with obvious signs of possible bankruptcy, as well as those debtors where a forced restructuring of debt is necessary to avoid default | |||||
| • | These categories comprise all loans outstanding from debtors that have at least one installment payment of interest or principal overdue for 90 days or more | |||||
F-145
Table of Contents
NOTES TO THE CONSOLIDATED FINANCIAL STATEMENTS, Continued
| 42. | Risk Management, continued: |
| (f) | Credit Quality by Asset Class, continued: |
Analysis of age of past due portfolio loans by type of credit of default:
Terms:
Default 1: 1 to 29 days
Default 2: 30 to 59 days
Default 3: 60 to 89 days
As of December 31, 2012:
|
Default 1
MCh$ |
Default 2
MCh$ |
Default 3
MCh$ |
Total
MCh$ |
|||||||||||||
|
Loans and advances to banks |
52 | — | — | 52 | ||||||||||||
|
Commercial loans |
23,049 | 20,677 | 3,774 | 47,500 | ||||||||||||
|
Import-export financing |
22,717 | 102 | 193 | 23,012 | ||||||||||||
|
Factoring transactions |
38,976 | 6,289 | 1,061 | 46,326 | ||||||||||||
|
Commercial lease transactions |
2,551 | 750 | 366 | 3,667 | ||||||||||||
|
Other loans and receivables |
1,269 | 1,050 | 920 | 3,239 | ||||||||||||
|
Residential mortgage loans |
1,111 | 647 | 457 | 2,215 | ||||||||||||
|
Consumer loans |
16,010 | 6,775 | 6,873 | 29,658 | ||||||||||||
|
|
|
|
|
|
|
|
|
|||||||||
|
Total |
105,735 | 36,290 | 13,644 | 155,669 | ||||||||||||
|
|
|
|
|
|
|
|
|
|||||||||
As of December 31, 2013:
|
Default 1
MCh$ |
Default 2
MCh$ |
Default 3
MCh$ |
Total
MCh$ |
|||||||||||||
|
Loans and advances to banks |
1,515 | — | — | 1,515 | ||||||||||||
|
Commercial loans |
23,699 | 8,281 | 4,737 | 36,717 | ||||||||||||
|
Import-export financing |
34,906 | 230 | 368 | 35,504 | ||||||||||||
|
Factoring transactions |
30,158 | 5,754 | 1,606 | 37,518 | ||||||||||||
|
Commercial lease transactions |
2,660 | 970 | 723 | 4,353 | ||||||||||||
|
Other loans and receivables |
837 | 808 | 533 | 2,178 | ||||||||||||
|
Residential mortgage loans |
1,016 | 642 | 428 | 2,086 | ||||||||||||
|
Consumer loans |
19,539 | 8,148 | 7,564 | 35,251 | ||||||||||||
|
|
|
|
|
|
|
|
|
|||||||||
|
Total |
114,330 | 24,833 | 15,959 | 155,122 | ||||||||||||
|
|
|
|
|
|
|
|
|
|||||||||
F-146
Table of Contents
NOTES TO THE CONSOLIDATED FINANCIAL STATEMENTS, Continued
| 42. | Risk Management, continued: |
| (f) | Credit Quality by Asset Class, continued: |
As of December 31, the aging analysis of loans is as follows:
| Past due but not impaired | ||||||||||||||||||||||||||||
|
As of December 31, |
Neither
past due or impaired MCh$ |
Up to
30 days MCh$ |
Over
30 days and up to 60 days MCh$ |
Over
60 days and up to 90 days MCh$ |
Over
90 days and up to 120 days MCh$ |
Over
120 days MCh$ |
Total
MCh$ |
|||||||||||||||||||||
|
2013 |
20,633,029 | 114,490 | 24,774 | 15,789 | 8,886 | 83,802 | 20,880,770 | |||||||||||||||||||||
|
2012 |
18,587,726 | 69,796 | 30,146 | 12,597 | 8,816 | 62,680 | 18,771,761 | |||||||||||||||||||||
| (g) | Collateral |
The value of collateral maintained by the Bank for loans individually classified as impaired as of December 31, 2012 and 2013 is MCh$29,952 and MCh$91,105, respectively.
The value of collateral maintained by the Bank for loans over-due but non-impaired as of December 31, 2012 and 2013 is MCh$214,093 and MCh$249,058, respectively.
| (h) | Assets Received in Lieu of Payment |
The Bank has received assets in lieu of payment totaling MCh$2,556and MCh$3,012 as of December 31, 2012 and 2013, respectively, the majority of which are properties. All of these assets are managed for sale.
F-147
Table of Contents
NOTES TO THE CONSOLIDATED FINANCIAL STATEMENTS, Continued
| 42. | Risk Management, continued: |
| (g) | Renegotiated Assets |
The impaired loans are considered to be renegotiated when the corresponding financial commitments are restructured and the Bank assesses the probability of recovery as sufficiently high.
The following table details the book value of loans with renegotiated terms per financial asset class:
| 2012 | 2013 | |||||||
| MCh$ | MCh$ | |||||||
|
Financial assets |
||||||||
|
Loans and advances to banks |
||||||||
|
Domestic banks |
— | — | ||||||
|
Foreign banks |
— | — | ||||||
|
|
|
|
|
|||||
|
Subtotal |
— | — | ||||||
|
Loans to customers, net |
— | |||||||
|
Commercial loans |
149,323 | 163,827 | ||||||
|
Residential mortgage loans |
23,132 | 21,411 | ||||||
|
Consumer loans |
220,451 | 311,363 | ||||||
|
|
|
|
|
|||||
|
Subtotal |
392,906 | 496,601 | ||||||
|
|
|
|
|
|||||
|
Total renegotiated financial assets |
392,906 | 496,601 | ||||||
|
|
|
|
|
|||||
The Bank evaluates allowances loan losses in two segments: individually assessed allowances loan losses and group assessed allowances loan losses, which are described in more detail in Note 2(h).
Complementary Information
The renegotiated portfolio of Banco de Chile represents 2.37% of the total loans and the redefault rate of these loans for retail segment is 27.85% as of December 31, 2013 (the Bank does not have this information for other segments for internal purposes).
The most common type of modification is to extend the term of the loan. For payment extensions, depending on the characteristics of each credit, the Bank may change the initial conditions in terms of interest rate and initial grace period for the first payment. With respect to forgiveness of principal, the Bank typically does not give this benefit. The Board of Directors might on rare occasions approve a portion of principal forgiveness on certain credit-operations that have been impaired and provisioned previously. Based on this knowledge, the Bank estimates that about 80% of renegotiated loans extend the maturity date, including a new amortization schedule. Only those borrowers which are considered viable are renegotiated, and that the average term of the commercial credit renegotiated is 38 months, demonstrating the relatively short payment extensions given. If the debtor is not considered to be financially viable, the Bank proceeds to the legal collection of debts.
F-148
Table of Contents
NOTES TO THE CONSOLIDATED FINANCIAL STATEMENTS, Continued
| 42. | Risk Management, continued: |
| (g) | Renegotiated Assets, continued |
The Bank does not have information related to the balance of loans modified by type of concession because is not required to record this information by the local banking regulator and this information is much used by our peers. However, the Bank continually monitors its deteriorated portfolio as defined in Note 2(l)(iv). Also, for internal purposes the renegotiated loan portfolio is analyzed and reviewed as part of the impaired portfolio. Therefore, for management and regulatory (local and IFRS) reporting purposes the bank does not frequently use information on loans modified by types of concession.
The Bank determines the appropriate amount of allowance for loan losses as follows:
The commercial loan renegotiations are always evaluated and approved individually by the credit committee with all the background and history of previous approvals, including financial records, delinquencies or other previous renegotiations of the debtor. Since almost the entire commercial portfolio is individually provisioned, it is in this approval step of the renegotiation where the level of provision for each debtor is determined.
Among the variables that are considered by the credit committee to establish the level of provisions is payment capacity and the collateral coverage. The condition of a new default of a renegotiated credit is considered when the credit committee is establishing the new level of provisions, which in general as a consequence of this higher risk, could increase up to 65% of the loan.
On the other hand, for the portfolio evaluated for provisioning purposes as a group, the models contain past behavior variables, incorporating delinquencies and default prior to renegotiation for six months, recognizing the increased risk and generating a higher level of provisions. The provision can only be decreased if the renegotiated client has good payment behavior (an overdue period of less than 30 days), in a period of over seven months.
Moreover, an operation identified as renegotiation never leaves this classification for purposes of monitoring and provisioning.
| (h) | Impairment Testing |
The main tools used to test loan impairment include an analysis of whether principal or interest payments are more than 90 days past due or if the counterparty is experiencing any known cash flow problems, reductions in credit ratings or default of the original contractual terms.
| (i) | Off balance sheet accounts |
In order to meet our customers’ financial needs, the Bank has extended several irrevocable commitments and contingent obligations. Even though these obligations are not recognized in the balance sheet, they involve credit risk and thus form part of the Bank’s general risk exposure.
Credit risk exposure generated by contingent obligations is disclosed in Note 27.
F-149
Table of Contents
NOTES TO THE CONSOLIDATED FINANCIAL STATEMENTS, Continued
| 42. | Risk Management, continued: |
| (3) | Market Risk |
Market Risk is referred as to the potential loss the Bank may incur due to the scarcity of liquidity or due to an adverse change of market factors levels (such as FX rates, equity prices, interest rates, options volatility, etc).
| (a) | Liquidity Risk: |
Liquidity Risk Measurement and Limits
The Bank measure and control the Trading Liquidity risk for trading portfolios by establishing: DV01 limits to certain specific tenors for each yield curve, limits to spot positions for FX or Equity portfolios and vega limits to FX options portfolios. Trading Liquidity for debt instruments that are part of the Accrual Book is not limited explicitly, taking into account that in this case the positions are expected to be held until medium term or even until maturity.
Funding Liquidity is controlled and limited using the regulatory C08 Index report.
The SBIF sets the following limits for the C08 index:
| Foreign Currency balance sheet: | 1-30 days C08 index < 1x TIER 1 Capital | |||||
| All Currencies balance sheet: | 1-30 days C08 index < 1x TIER 1 Capital | |||||
| All Currencies balance sheet: | 1-90 days C08 index < 2x TIER 1 Capital | |||||
The SBIF authorized Banco de Chile to utilize the C08 Adjusted Index report, which includes, in addition to the regular report, behavioral maturity assumptions for some specific balance sheet items, such as roll-over or evergreen pattern for some portion of the loan portfolio; some portion of the demand deposits are considered core and therefore no withdrawal is reported, etc.
As of December 31, 2013, the 1-30 days Adjusted C08 Index for the foreign currency balance sheet items was slightly lower than -0.01. The 1-30 days Adjusted C08 Index for all currencies balance sheet items on that date is reported as 0.16; the value of the same index for the period 1 to 90 days is 0.64.
F-150
Table of Contents
NOTES TO THE CONSOLIDATED FINANCIAL STATEMENTS, Continued
| 42. | Risk Management, continued: |
| (3) | Market Risk, continued: |
| (a) | Liquidity Risk, continued |
The maturity profile of the consolidated financial liabilities of Banco de Chile and its subsidiaries, as of 2012 and 2013 end-of-year, is detailed below:
|
Up to 1
month MCh$ |
Between
1 and
|
Between 3
and 12 months MCh$ |
Between
1 and 3
|
Between
3 and 5 years MCh$ |
More than
5 years
|
Total MCh$ |
||||||||||||||||||||||
|
Liabilities as of December 31, 2012 |
||||||||||||||||||||||||||||
|
Current accounts and other demand deposits |
5,470,971 | — | — | — | — | — | 5,470,971 | |||||||||||||||||||||
|
Transactions in the course of payment |
159,218 | — | — | — | — | — | 159,218 | |||||||||||||||||||||
|
Accounts Payable from repurchase agreements and security lending |
226,396 | — | — | — | — | — | 226,396 | |||||||||||||||||||||
|
Savings accounts and time deposits |
4,271,345 | 2,508,688 | 2,814,055 | 393,247 | 279 | 30 | 9,987,644 | |||||||||||||||||||||
|
Derivative instruments |
231,117 | 134,729 | 321,148 | 244,826 | 132,688 | 236,071 | 1,300,579 | |||||||||||||||||||||
|
Borrowings from financial institutions |
135,353 | 176,467 | 630,745 | 141,444 | — | — | 1,084,009 | |||||||||||||||||||||
|
Other financial obligations |
875,866 | 606,008 | 499,644 | 832,427 | 691,489 | 2,267,548 | 5,772,982 | |||||||||||||||||||||
|
Debt issued in foreign currency different USD |
234 | 469 | 6,075 | 65,891 | 21,564 | 110,414 | 204,647 | |||||||||||||||||||||
|
|
|
|
|
|
|
|
|
|
|
|
|
|
|
|||||||||||||||
|
Total undiscounted financial liabilities (excluding derivatives with offsetting agreements) |
11,370,500 | 3,426,361 | 4,271,667 | 1,677,835 | 846,020 | 2,614,063 | 24,206,446 | |||||||||||||||||||||
|
|
|
|
|
|
|
|
|
|
|
|
|
|
|
|||||||||||||||
|
Derivatives with offsetting agreements |
154,600 | 79,406 | 256,717 | 425,612 | 229,070 | 434,677 | 1,580,082 | |||||||||||||||||||||
|
|
|
|
|
|
|
|
|
|
|
|
|
|
|
|||||||||||||||
|
Up to 1
month MCh$ |
Between
1 and
|
Between 3
and 12 months MCh$ |
Between
1 and 3
|
Between
3 and 5
|
More than
5 years
|
Total MCh$ |
||||||||||||||||||||||
|
Liabilities as of December 31, 2013 |
||||||||||||||||||||||||||||
|
Current accounts and other demand deposits |
5,984,332 | — | — | — | — | — | 5,984,332 | |||||||||||||||||||||
|
Transactions in the course of payment |
126,343 | — | — | — | — | — | 126,343 | |||||||||||||||||||||
|
Accounts Payable from repurchase agreements and security lending |
259,688 | — | — | — | — | — | 259,688 | |||||||||||||||||||||
|
Savings accounts and time deposits |
5,009,358 | 2,351,121 | 3,005,112 | 213,203 | 145 | 31 | 10,578,970 | |||||||||||||||||||||
|
Derivative instruments |
301,981 | 159,374 | 293,688 | 236,384 | 244,998 | 377,838 | 1,614,263 | |||||||||||||||||||||
|
Borrowings from financial institutions |
95,776 | 361,825 | 262,142 | — | — | — | 719,743 | |||||||||||||||||||||
|
Other financial obligations |
267,881 | 144,898 | 259,689 | 826,803 | 803,737 | 2,500,987 | 4,803,995 | |||||||||||||||||||||
|
Debt issued in foreign currency different USD |
437 | 770 | 70,215 | 204,925 | 248,714 | 345,363 | 870,424 | |||||||||||||||||||||
|
|
|
|
|
|
|
|
|
|
|
|
|
|
|
|||||||||||||||
|
Total undiscounted financial liabilities (excluding derivatives with offsetting agreements) |
12,045,796 | 3,017,988 | 3,890,846 | 1,481,315 | 1,297,594 | 3,224,219 | 24,957,758 | |||||||||||||||||||||
|
|
|
|
|
|
|
|
|
|
|
|
|
|
|
|||||||||||||||
|
Derivatives with offsetting agreements |
45,775 | 188,282 | 513,583 | 688,081 | 519,512 | 899,830 | 2,855,063 | |||||||||||||||||||||
|
|
|
|
|
|
|
|
|
|
|
|
|
|
|
|||||||||||||||
The Loans-to-deposit ratio for 2012 and 2013 is detailed below:
Loans-to-Deposit Ratio
|
December 31, 2012 |
December 31, 2013 |
|||
|
Maximum |
2.35 | 2.47 | ||
|
Minimum |
2.20 | 2.28 | ||
|
Average |
2.31 | 2.38 |
F-151
Table of Contents
NOTES TO THE CONSOLIDATED FINANCIAL STATEMENTS, Continued
| 42. | Risk Management, continued: |
| (3) | Market Risk, continued |
| (a) | Liquidity Risk, continued: |
Banco de Chile has established internal liquidity metrics, in addition to those required by the regulatory entities, with the objective of covering other dimensions of liquidity risk, such as large funds providers diversification; maturity concentration triggers; etc. These and other financial ratios are monthly monitored in order to early detect structural changes of the balance sheet profile. Additionally, the bank is closely monitoring market triggers, such as interest rates levels, intervention of the markets made by the Central Bank, the 5-year Chile CDS spread, etc. These allow the bank to early prevent systemic crisis due to market conditions.
| (b) | Price Risk: |
Price Risk Measurement and Limits
The Price Risk measurement and management processes are implemented utilizing various internal metrics and reports. These are built for the Trading portfolio and separately for the Bank book (also referred as to the Accrual book). In addition to this, and just on supplementary basis, the bank submits regulatory reports to the corresponding regulatory entities.
The regulatory risk measurement for the Trading portfolio (SBIF C41 report) is made by using standardized methodologies provided by the regulatory entities (Central Bank of Chile and SBIF), which are adopted from BIS 1993 standardized methodologies for the risk measurement of such portfolios. The referred methodologies estimate the potential loss that the Bank may incur, considering standardized fluctuations of the relevant market factors (FX rates, interest rates, volatility, etc.) that may adversely impact the value of the Trading portfolios. The interest rate shifts are provided by the regulatory entity; in addition, conservative correlation factors are included in order to include non-parallel yield curve shifts reflecting steepening and flattening behaviors. The impact due to FX open positions is obtained by using large FX rate fluctuations (8% for liquid FX rates and 30% for illiquid FX rates). Gamma and vega impacts are also included for options portfolios using simple approaches. The SBIF does not establish a separate limit for this particular risk but a global one that includes this risk (also called Market Risk Equivalent or ERM) and the Risk Weighted Assets (also called RAAP assets). The sum of ERM and the 10% of the RAAP assets cannot exceed the 100% of the bank’s Tier2 Capital. In the future, the Operational Risk will be included to the above sum.
Additionally, the Bank has established internal limits for the Trading Book. In fact, there are limits for the FX net open positions (FX delta), for the interest rate sensitivities generated by the derivatives and debt securities portfolios (DV01 or also referred as to rho) and for the FX volatility sensitivity (vega). Limits are established on an aggregate basis but also for some specific repricing tenor points. The use of these limits are monitored, controlled and reported on a daily basis by independent parties to the senior management of the Bank. The internal governance framework also establishes that these limits are approved by the board and must be reviewed at least annually.
The Bank utilizes the parametric VaR (Value-at-Risk or VaR) as the risk measurement tool for the trading portfolio exposures. The model includes 99% confidence level; overnight volatility of market factors fluctuations and correlations between them are obtained from historical closing rates observed the most recent one-year period. This VaR number is escalated by 22 days (a calendar month) for reporting purposes.
F-152
Table of Contents
NOTES TO THE CONSOLIDATED FINANCIAL STATEMENTS, Continued
| 42. | Risk Management, continued: |
| (3) | Market Risk, continued |
| (b) | Price Risk, continued: |
The regulatory risk measurement for the Bank Book (SBIF C40 report) due to interest rate fluctuations is made by using standardized methodologies provided by the regulatory entities (Central Bank of Chile and SBIF). The report includes models for reporting interest rate gaps and standardized adverse interest rate fluctuations. In addition to this, the regulatory entity has requested from banks to establish internal limits for this regulatory risk measurement. Limits must be established separately for short term and long term portfolios. The short term risk limit must be expressed as a percentage of the NIM and the long term risk limit as a percentage of the Tier-2 Capital. The bank is currently using 25% for both limits. The use of these limits during 2013 is illustrated below:
|
Banking Risk Book Short term |
Banking Risk Book Long Term |
|||||||
|
Maximum Use |
11.4 | % | 18.1 | % | ||||
|
Average Use |
9.6 | % | 17.4 | % | ||||
|
Minimum Use |
8.1 | % | 16.8 | % | ||||
Additionally, the Bank utilizes build-in models for measuring, limiting, controlling and reporting interest rate exposures (IRE) and interest rate risks (also called Earnings at Risk or EaR) for the Accrual Book. The Accrual book includes all balance sheet items (even some items that are excluded by the regulators in the analysis of the Bank Book, such as Capital and Fixed Assets, for example). The internal models consider a more comprehensive and detailed analysis of interest rates fluctuations, exchange rates and inflation than the SBIF C40 report required by regulators.
In addition to the above, the Market Risk Policy of Banco de Chile enforces to perform daily stress tests for trading portfolios and on a monthly basis for accrual portfolios. The output of the stress testing process is compared to corresponding trigger levels: in the case triggers are breached, the senior management is notified in order to implement further actions, if necessary. Moreover, intra-month actual P&L for trading activities is compared to some trigger levels: escalation to senior levels is also done when breaches occur.
F-153
Table of Contents
NOTES TO THE CONSOLIDATED FINANCIAL STATEMENTS, Continued
| 42. | Risk Management, continued: |
| (3) | Market Risk, continued: |
| (b) | Price Risk, continued |
The following table illustrates the interest rate positions of the Bank Book (repricing tenors) as of December 31, 2012 and 2013:
Accrual Book Interest Rate Exposure by Maturity
|
Up to 1
month MCh$ |
Between 1 and
3 months
|
Between 3
12 months
|
Between
1 and 3
|
Between
3 and 5
|
More
than 5
|
Total MCh$ |
||||||||||||||||||||||
|
Assets as of December 31, 2012 |
||||||||||||||||||||||||||||
|
Cash and due from banks |
653,511 | — | — | — | — | — | 653,511 | |||||||||||||||||||||
|
Transactions in the course of collection |
366,036 | — | — | — | — | — | 366,036 | |||||||||||||||||||||
|
Accounts receivable from repurchase agreements and security borrowing |
582 | — | — | — | — | — | 582 | |||||||||||||||||||||
|
Derivative instruments |
128,964 | 81,085 | 150,971 | 7,463 | 21,564 | 110,414 | 500,461 | |||||||||||||||||||||
|
Loans and advances to banks |
1,152,648 | 14,731 | 178,761 | — | — | — | 1,346,140 | |||||||||||||||||||||
|
Loans to customers, net |
3,172,424 | 2,390,933 | 4,769,542 | 4,329,131 | 2,083,220 | 5,314,078 | 22,059,328 | |||||||||||||||||||||
|
Financial assets available-for-sale |
57,370 | 178,055 | 381,448 | 235,786 | 192,490 | 323,967 | 1,369,116 | |||||||||||||||||||||
|
Financial assets held-to-maturity |
— | — | — | — | — | — | — | |||||||||||||||||||||
|
|
|
|
|
|
|
|
|
|
|
|
|
|
|
|||||||||||||||
|
Total assets |
5,531,535 | 2,664,804 | 5,480,722 | 4,572,380 | 2,297,274 | 5,748,459 | 26,295,174 | |||||||||||||||||||||
|
|
|
|
|
|
|
|
|
|
|
|
|
|
|
|||||||||||||||
|
Up to 1
month MCh$ |
Between 1 and
3 months
|
Between 3
12 months
|
Between
1 and 3
|
Between
3 and 5
|
More
than 5
|
Total MCh$ |
||||||||||||||||||||||
|
Assets as of December 31, 2013 |
||||||||||||||||||||||||||||
|
Cash and due from banks |
848,757 | — | — | — | — | — | 848,757 | |||||||||||||||||||||
|
Transactions in the course of collection |
360,806 | — | — | — | — | — | 360,806 | |||||||||||||||||||||
|
Accounts receivable from repurchase agreements and security borrowing |
54,591 | — | — | — | — | — | 54,591 | |||||||||||||||||||||
|
Derivative instruments |
361,734 | 86,268 | 176,636 | 80,287 | 258,915 | 374,745 | 1,338,585 | |||||||||||||||||||||
|
Loans and advances to banks |
791,728 | 117,220 | 156,297 | — | — | — | 1,065,245 | |||||||||||||||||||||
|
Loans to customers, net |
3,457,101 | 2,743,019 | 5,681,608 | 4,582,528 | 2,293,838 | 5,890,051 | 24,648,145 | |||||||||||||||||||||
|
Financial assets available-for-sale |
85,500 | 187,044 | 455,332 | 174,413 | 517,638 | 388,187 | 1,808,114 | |||||||||||||||||||||
|
Financial assets held-to-maturity |
— | — | — | — | — | — | — | |||||||||||||||||||||
|
|
|
|
|
|
|
|
|
|
|
|
|
|
|
|||||||||||||||
|
Total assets |
5,960,217 | 3,133,551 | 6,469,873 | 4,837,228 | 3,070,391 | 6,652,983 | 30,124,243 | |||||||||||||||||||||
|
|
|
|
|
|
|
|
|
|
|
|
|
|
|
|||||||||||||||
F-154
Table of Contents
NOTES TO THE CONSOLIDATED FINANCIAL STATEMENTS, Continued
| 42. | Risk Management, continued: |
| (3) | Market Risk, continued |
| (b) | Price Risk, continued |
The tables below included projected contractual interest, as of December 31, 2012 and 2013:
|
Up to 1
month MCh$ |
Between 1 and
3 months
|
Between 3
and 12 months MCh$ |
Between 1
and 3 years MCh$ |
Between
3 and 5 years MCh$ |
More
than 5
|
Total MCh$ |
||||||||||||||||||||||
|
Liabilities as of December 31, 2012 |
||||||||||||||||||||||||||||
|
Current accounts and demand deposits |
5,531,827 | — | — | — | — | — | 5,531,827 | |||||||||||||||||||||
|
Transactions in the course of payment |
127,611 | — | — | — | — | — | 127,611 | |||||||||||||||||||||
|
Accounts payable from repurchase agreements and security lending |
5,268 | — | — | — | — | — | 5,268 | |||||||||||||||||||||
|
Savings accounts and time deposits |
4,223,812 | 2,371,455 | 2,908,748 | 417,885 | 279 | 30 | 9,922,209 | |||||||||||||||||||||
|
Derivative instruments |
3,903 | 3,477 | 26,924 | 175,376 | 83,186 | 260,272 | 553,138 | |||||||||||||||||||||
|
Borrowings from financial institutions |
304,070 | 450,332 | 348,390 | — | — | — | 1,102,792 | |||||||||||||||||||||
|
Debt issued |
119,449 | 162,656 | 253,617 | 683,676 | 689,980 | 2,337,558 | 4,246,936 | |||||||||||||||||||||
|
Other financial obligations |
96,108 | 1,373 | 7,246 | 15,543 | 11,432 | 34,754 | 166,456 | |||||||||||||||||||||
|
|
|
|
|
|
|
|
|
|
|
|
|
|
|
|||||||||||||||
|
Total liabilities |
10,412,048 | 2,989,293 | 3,544,925 | 1,292,480 | 784,877 | 2,632,614 | 21,656,237 | |||||||||||||||||||||
|
|
|
|
|
|
|
|
|
|
|
|
|
|
|
|||||||||||||||
|
Up to 1
month MCh$ |
Between
1 and
|
Between 3
and 12 months MCh$ |
Between 1
and 3 years MCh$ |
Between
3 and 5
|
More
than 5
|
Total MCh$ |
||||||||||||||||||||||
|
Liabilities as of December 31, 2013 |
||||||||||||||||||||||||||||
|
Current accounts and demand deposits |
6,012,841 | — | — | — | — | — | 6,012,841 | |||||||||||||||||||||
|
Transactions in the course of payment |
114,589 | — | — | — | — | — | 114,589 | |||||||||||||||||||||
|
Accounts payable from repurchase agreements and security lending |
16,964 | — | — | — | — | — | 16,964 | |||||||||||||||||||||
|
Savings accounts and time deposits |
5,141,774 | 2,211,623 | 3,005,229 | 213,224 | 135 | 31 | 10,572,016 | |||||||||||||||||||||
|
Derivative instruments |
12,396 | 3,372 | 142,660 | 435,245 | 279,419 | 492,682 | 1,365,774 | |||||||||||||||||||||
|
Borrowings from financial institutions |
279,063 | 513,096 | 194,863 | — | — | — | 987,022 | |||||||||||||||||||||
|
Debt issued |
300,614 | 143,669 | 259,129 | 881,605 | 1,033,552 | 2,819,652 | 5,438,221 | |||||||||||||||||||||
|
Other financial obligations |
161,134 | 1,258 | 7,013 | 13,604 | 17,438 | 23,840 | 224,287 | |||||||||||||||||||||
|
|
|
|
|
|
|
|
|
|
|
|
|
|
|
|||||||||||||||
|
Total liabilities |
12,039,375 | 2,873,018 | 3,608,894 | 1,543,678 | 1,330,544 | 3,336,205 | 24,731,714 | |||||||||||||||||||||
|
|
|
|
|
|
|
|
|
|
|
|
|
|
|
|||||||||||||||
F-155
Table of Contents
NOTES TO THE CONSOLIDATED FINANCIAL STATEMENTS, Continued
| 42. | Risk Management, continued: |
| (3) | Market Risk, continued: |
The Bank has focused on stress tests as the main measurement tool for analyzing price risk sensitivity. The analysis is implemented for the Trading Book and the Bank Book separately. After the financial crisis started during 2008 and based on the various studies and analyses made on this specific matter, the Bank adopted this tool, for sensitivity analysis, when it notices that it is more reliable than normal distribution instruments such as VaR for trading portfolios or EaR for accrual portfolios, since:
| (a) | The financial crisis shows fluctuations that are materially higher than those used in the VaR with 99% of confidence level. |
| (b) | The financial crisis shows also that correlations between these fluctuations that are materially different to those used in the VaR, since crisis precisely indicate severe disconnections between the behavior of market factors respect to the patterns normally observed. |
| (c) | Trading liquidity dramatically decreased in emerging markets during the financial crisis (in the case of Chile too) and therefore, the escalation of the daily VaR is a very gross approximation of the expected loss. |
Stress tests are produced observing historical events and collecting market factors data.
The former allow the Bank to gauge actual distress events in terms of magnitude but mainly focused on detecting unusual fluctuations.
The latter gives the Bank the technical background for implementing statistical analysis. An updated database is maintained including historical data of foreign exchange rates, debt instruments yields to maturity, derivatives swap yields, foreign exchange volatilities, etc. that enable the Bank to maintain up-to-date records of historical volatility of market factors fluctuations and correlations between these ones.
Given the above, the stress tests may be implemented modeling directional fluctuations but also knowing the magnitude of the modeled fluctuations relative to statistical data and also how frequent the fluctuation modeled occurred in the past.
F-156
Table of Contents
NOTES TO THE CONSOLIDATED FINANCIAL STATEMENTS, Continued
| 42. | Risk Management, continued: |
| (3) | Market Risk, continued: |
| (b) | Price Risk, continued: |
In order to comply with IFRS 7.40, we include the following exercise illustrating an estimation of the impact of feasible but reasonable fluctuations of interest rates, swaps yield, foreign exchange rates and foreign exchange volatilities embedded in the Trading and Accrual portfolios. Given that the Bank’s portfolio includes positions denominated in nominal and real interest rates, these fluctuations must be aligned with realistic inflation changes forecast. The exercise is implemented in a very simplistic way: trading portfolios impacts are estimated by multiplying DV01s by expected interest rates shifts; accrual portfolios impacts are computed by multiplying cumulative gaps by forward interest rates modeled fluctuations. It is relevant to note, this methodology includes the limitation that the interest rates convexity is not properly captured when material fluctuations are modeled; additionally, neither convexity nor prepayments behaviors are captured for the accrual portfolio analysis. In any case, given the magnitude of the shifts, the methodology may be accurate enough for the purposes and scope of the analysis.
The following table illustrates the fluctuations modeled and used in the stress testing process. Bonds yields, derivatives yields, FX rates, FX CLP/USD volatility and inflation fluctuations are shown for each tenor point. Equity prices fluctuations are not included given that the positions held in the stockbrokerage house (Banchile Corredores de Bolsa SA) are negligible. In fact, equity positions are typically very small given that this legal vehicle is mostly focused on customer driven transactions (brokerage service or equity swaps transactions closed with customers).
The directions of these fluctuations were chosen between four scenarios (two positive economic scenarios and two negative economic scenarios) in order to generate the worst impact within the four above mentioned:
|
Market Factor Fluctuations: most adverse scenario |
||||||||||||||||||||||||||||||||
|
CLP
Derivatives (bps) |
CLP
Bonds (bps) |
CLF
Derivatives (bps) |
CLF
Bonds (bps) |
USD
Offshore 3m Derivatives (bps) |
Spread
USD On/Off Derivatives (bps) |
Vol FX
CLP/USD (%) |
Inflation’s
Change Period n-1 to n (Monthly Basis) (%) |
|||||||||||||||||||||||||
|
3 m |
(93 | ) | (75 | ) | 533 | 601 | (2 | ) | 295 | 7.3 | % | (0.60 | )% | |||||||||||||||||||
|
6 m |
(116 | ) | (88 | ) | 245 | 267 | (8 | ) | 225 | 6.1 | % | (0.12 | )% | |||||||||||||||||||
|
9 m |
(128 | ) | (95 | ) | 108 | 128 | (10 | ) | 213 | 5.5 | % | (0.07 | )% | |||||||||||||||||||
|
1 yr |
(140 | ) | (99 | ) | 27 | 55 | (11 | ) | 188 | 5.1 | % | (0.07 | )% | |||||||||||||||||||
|
2 yrs |
(153 | ) | (95 | ) | (22 | ) | 4 | (18 | ) | 104 | 5.1 | % | — | |||||||||||||||||||
|
4 yrs |
(174 | ) | (127 | ) | (62 | ) | (46 | ) | (31 | ) | 76 | — | (0.02 | )% | ||||||||||||||||||
|
6 yrs |
(162 | ) | (127 | ) | (76 | ) | (70 | ) | (38 | ) | 70 | — | — | |||||||||||||||||||
|
10 yrs |
(139 | ) | (125 | ) | (91 | ) | (87 | ) | (42 | ) | 78 | — | (0.01 | )% | ||||||||||||||||||
|
16 yrs |
(143 | ) | (127 | ) | (80 | ) | (76 | ) | (43 | ) | 83 | — | (0.06 | )% | ||||||||||||||||||
|
20 yrs |
(151 | ) | (127 | ) | (79 | ) | (71 | ) | (44 | ) | 86 | — | (0.06 | )% | ||||||||||||||||||
Bps = Basis points
F-157
Table of Contents
NOTES TO THE CONSOLIDATED FINANCIAL STATEMENTS, Continued
| 42. | Risk Management, continued: |
| (3) | Market Risk, continued: |
| (b) | Price Risk, continued |
The impact on the Trading Book, as the result of the interest rate fluctuations illustrated above, is the following as of December 31 st . 2013:
POTENTIAL P&L IMPACT
TRADING BOOK
| MCh$ | ||||
|
CLP Interest Rate |
(3,383 | ) | ||
|
Derivatives |
(3,578 | ) | ||
|
Securities |
195 | |||
|
|
|
|||
|
CLF Interest Rate |
(4,824 | ) | ||
|
Derivatives |
(5,248 | ) | ||
|
Securities |
424 | |||
|
|
|
|||
|
USD, EUR, JPY Offshore Interest Rate |
(857 | ) | ||
|
USD, EUR, JPY On/Off Spread |
4,232 | |||
|
Total Interest Rate |
(4,832 | ) | ||
|
|
|
|||
|
Total FX |
(100 | ) | ||
|
|
|
|||
|
Total FX OPTION Vega |
1,312 | |||
|
|
|
|||
|
Potential P&L Impact: Interest Rate + FX + Vega |
(3,620 | ) | ||
|
|
|
|||
|
Banco de Chile Tier1 Capital |
2,284,314 | |||
|
|
|
|||
The scenario modeled would generate losses in the Trading Book up to Ch$ 3,600 MM or slightly above USD 7 MM. In any case, these huge fluctuations would not result in material losses compared to the historical observed P&L for one month or the Tier 1 Capital.
The impact of such fluctuations in the Accrual portfolio, which is not necessarily a gain/loss but greater/lower net revenue from funds generation, is illustrated below:
POTENTIAL MARGINAL NRFF(*) ACCRUAL
BOOK (next 12 months)
| MCh$ | ||||
|
Higher / (Lower) NRFF |
(146,485 | ) | ||
|
|
|
|||
|
Impact due to Inter-Banking yield curve (Swap yield) shock |
(121,170 | ) | ||
|
Impact due to spreads shock |
(25,315 | ) | ||
F-158
Table of Contents
NOTES TO THE CONSOLIDATED FINANCIAL STATEMENTS, Continued
| 42. | Risk Management, continued: |
| (3) | Market Risk, continued: |
| (b) | Price Risk, continued |
The adverse impact in the Accrual book would be the result of two events: a severe drop in the local inflation and the increase of our funding spread. The lower net revenues from funds in the following 12 months would reach CH$ 146 billion, which is still much lower of the current annual 12-month rolling P&L generation.
The following table illustrates the changes in fair value of Available-for-Sale securities as the result of stress test modeled above. These changes are recorded in Other Comprehensive Income, a component of shareholder’s Equity, and not current earnings:
AVAILABLE FOR SALE PORTFOLIO IMPACT
ADVERSE SCENARIO
| Instrument |
DV01(+1 bps) (USD) |
Impact
due to interest rate change (USD) |
Impact due to
interest rate change (MCh$) |
|||||||||
|
CLP |
(189,961 | ) | (11.9 | ) | (6,230 | ) | ||||||
|
CLF |
(500,888 | ) | (37.6 | ) | (19,781 | ) | ||||||
|
USD |
(146,947 | ) | (16.1 | ) | (8,442 | ) | ||||||
|
|
|
|
|
|||||||||
|
Total |
(65.6 | ) | (34,453 | ) | ||||||||
|
|
|
|
|
|||||||||
| (4) | Capital Requirements and Capital Management: |
The main objectives of the Capital Management process are to ensure the compliance with regulatory requirements, to keep a strong credit rating and healthy capital ratios. Within 2013, the Bank has complied with all these tasks.
As a part of the Capital Management Policy, it has been established capital sufficiency triggers in order to prevent capital ratios usage close to the limits. The triggers are established at levels much lower than the limits and the usage is monitored monthly. Within 2013, there were no triggers’ breaches.
The capital amount is managed according to the risk environment, the economic performance of Chile and the main economies and the business cycle. For implementing this, the board may change the dividend policy or authorize equity issuance or stocks repurchase programs.
F-159
Table of Contents
NOTES TO THE CONSOLIDATED FINANCIAL STATEMENTS, Continued
| 42. | Risk Management, continued: |
| (4) | Capital Requirements and Capital Management, continued: |
Regulatory Capital
According to the Chilean Bank Law, banks must comply with a minimum Basel I Tier 2 Capital ratio of 8%. Therefore, the bank must maintain a minimum Tier 2 Capital that cannot be lower than 8% of the sum of 12.5 times the ERM (market risk computed for trading portfolios, see 41 (3) (b) above) and RAAP assets. Additionally, the Bank must comply with a minimum capital to total assets ratio: the law establish that banks must maintain a minimum Tier 1 Capital that cannot be lower than the 3% of total assets. The authorities have requested Banco de Chile, due to the merge with the operation of Citibank, N.A. in Chile that maintains the first percentage as a minimum of 10%.
Tier 1 and Tier 2 Capital are computed according the international standards; assets are risk weighted, for reporting purposes, according to SBIF instructions which are adopted from BIS guidelines. For derivatives, the risk weighting process is applied over the “loan equivalent” of each derivative transaction. The loan equivalent is sum of the current value of the transaction, if positive, and the maximum exposure the Bank may face in the future, along the life of the transaction, considering the increase in value of it due to market factor fluctuations including some confidence level. The loan equivalent is expressed as a percentage of the notional amount of the transaction, being these percentages much larger for FX transactions than for interest rate swaps or for longer tenors than for shorter ones.
F-160
Table of Contents
NOTES TO THE CONSOLIDATED FINANCIAL STATEMENTS, Continued
| 42. | Risk Management, continued: |
| (4) | Capital Requirements and Capital Management, continued: |
Levels of Tier 1 and Tier 2 as of December 31, 2012 and 2013 are as follows:
| Consolidated assets | Risk-weighted assets | |||||||||||||||
| 2012 | 2013 | 2012 | 2013 | |||||||||||||
| MCh$ | MCh$ | MCh$ | MCh$ | |||||||||||||
|
|
||||||||||||||||
|
Cash and due from banks |
684,925 | 873,308 | 832 | 20,654 | ||||||||||||
|
Transactions in the course of collection |
310,077 | 300,026 | 53,978 | 39,728 | ||||||||||||
|
Financial Assets held-for-trading |
159,682 | 326,921 | 55,025 | 124,932 | ||||||||||||
|
Cash collateral on securities borrowed and reverse repurchase agreements |
35,100 | 82,422 | 35,100 | 82,422 | ||||||||||||
|
Derivative instruments |
326,083 | 374,687 | 328,642 | 460,537 | ||||||||||||
|
Loans and advances to banks |
1,343,322 | 1,062,056 | 231,182 | 381,494 | ||||||||||||
|
Loans to customers, net |
18,383,958 | 20,441,472 | 16,658,476 | 18,505,593 | ||||||||||||
|
Financial assets available-for-sale |
1,272,316 | 1,681,883 | 416,938 | 432,995 | ||||||||||||
|
Financial assets held-to-maturity |
— | — | — | — | ||||||||||||
|
Investments in other companies |
11,674 | 14,407 | 13,933 | 16,670 | ||||||||||||
|
Intangible assets |
75,610 | 72,223 | 33,151 | 29,671 | ||||||||||||
|
Property and equipment |
205,189 | 197,578 | 205,189 | 197,578 | ||||||||||||
|
Investment properties |
16,698 | 16,317 | — | — | ||||||||||||
|
Current tax assets |
— | — | 268 | 320 | ||||||||||||
|
Deferred tax assets |
55,801 | 56,421 | 12,714 | 14,590 | ||||||||||||
|
Other assets |
317,765 | 373,987 | 296,879 | 318,029 | ||||||||||||
|
|
|
|
|
|||||||||||||
|
Subtotal |
18,342,307 | 20,625,213 | ||||||||||||||
|
Off-balance-sheet assets |
||||||||||||||||
|
Contingent loans |
3,945,940 | 3,927,627 | 2,367,215 | 2,355,879 | ||||||||||||
|
|
|
|
|
|||||||||||||
|
Total risk-weighted assets |
20,709,522 | 22,981,092 | ||||||||||||||
|
|
|
|
|
|||||||||||||
| As of December 31, 2012 | As of December 31, 2013 | |||||||||||||||
| MCh$ | % | MCh$ | % | |||||||||||||
|
Tier 1 Capital (*) |
2,007,057 | 7.33 | 2,284,314 | 7.57 | ||||||||||||
|
Tier 2 Capital |
2,738,311 | 13.22 | 2,999,061 | 13.05 | ||||||||||||
| (*) | Tier 1 corresponds to equity attributable to equity holders in the Statement of Consolidated Financial Position |
F-161
Table of Contents
NOTES TO THE CONSOLIDATED FINANCIAL STATEMENTS, Continued
| 43. | Unconsolidated structured entities : |
During 2012, the Bank entered into a non-recourse securitization issuance and assignment agreement with the subsidiary Banchile Securitizadora S.A., whereby two fixed rate commercial loans were transferred. Then Banchile Securitizadora S.A. created the Segregated Equity (“Patrimonio Separado”) according to the title XVIII of the law No. 18,045. The securitized assets finally became part of the separated equity in order to support the series A bond issuance, which was fully transferred to third parties.
As of the transaction date, the book value of the credits assigned was MCh$30,276 and the effective amount received in the transference was MCh$30,407, which generated income of MCh$131 and also a credit provisions release for MCh$24. Furthermore, the subsidiary Banchile Securitizadora S.A. charged a commission of MCh$160 to the bank for debt structured process services.
The bank acquired the subordinated bond (serie C) issued by Segregated Equity in Ch$22,845 equivalent to UF 1 (Unidad de Fomento), which represented less than 0.001% of the total amount of the Bond issued by Segregated Equity, which amounted MCh$30,407 (par value amounted MCh$30,196). This bond was registered in available-for-sale and as of December 31, 2013 its fair value is Ch$23,310 ($22,841 in 2012), this amount represents the maximum exposure of the bank will have in this transaction.
The Segregated Equity will pay to the Bank an annual fee equivalent to UF 430 for collection concept. The bank analyzed all the relevant aspects of the transaction, according to the NIC 39 and the IFRS 10, related to assets derecognized and consolidation rules. In this regard the bank concludes that it (i) has substantially transferred all benefits and risks of assets assigned to the Segregated Equity; (ii) does not manage directly or indirectly the activities of the segregated equity; (iii) does not have decision rights which allow it to obtain substantial benefits from the assets assigned; and (iv) does not maintain any control over assets assigned or the Segregate Equity. According to the established by Law 18,045, the bond holders of Segregated Equity 17 are who have the power for to decide in the case of default of compromises, according to the established in Securities Market Act, as well as the detailed in the respective regulation of the contract. As a consequence, the bank proceeded to derecognized the credits involved in the transaction and have not consolidated them with the Segregated Equity.
|
Additional information regarding the transaction |
2012 | 2013 | ||||||
|
Securitized asset value |
MCh$ | 24,795 | MCh$ | 20,517 | ||||
|
Securitized bond value |
MCh$ | 24,644 | MCh$ | 20,385 | ||||
|
Securitized assets - remaining term |
5 years | 4 years | ||||||
|
Securitized bond - remaining term |
5 years | 4 years | ||||||
|
Rate securitized assets |
UF + 4.83 | % | UF + 4.83 | % | ||||
|
Rate securitized bond |
UF + 4.54 | % | UF + 4.54 | % | ||||
During 2013, the bank did not executed securitization transaction involving its own assets.
F-162
Table of Contents
NOTES TO THE CONSOLIDATED FINANCIAL STATEMENTS, Continued
| 44. | New Accounting Pronouncements: |
The following is a summary of new standards, interpretations and improvements to the International Financial Reporting Standards issued by the International Accounting Standards Board (IASB) that it is not effective as of December 31, 2013:
IAS 32 Financial Instruments: Presentation
Amendments issued in December 2011 provide clarifications on the application of the offsetting rules, clarifying the meaning of the criterion “currently has a legally enforceable right to set-off” and clarifying the criterion “intention to settle on a net basis, or to realize assets and settle liabilities simultaneously” and this way reduce the diversification that exist in actual practices. The standard is effective for annual periods beginning on or after January 1, 2014 and early adoption is permitted.
According the assessment, current rules about netting force in Chile and practice used by the Bank in financial contracts with foreign counterparties, this rule has no impact on the consolidated financial statements of Banco de Chile and its subsidiaries.
IAS 36 Impairment assets
On May 29, 2013, the IASB issued amendments to IAS 36 respect to disclosures information related to recoverable amount of impaired assets, if this amount corresponded to fair value less disposal cost. These modifications are related to IFRS 13: “Fair Value measurement”.
The amendments will be applied retrospectively to annual periods beginning in January 1, 2014 . Early adoption is permitted for the periods that the entity has applied IFRS 13.
The Bank and its subsidiaries assess that this amendment will not have impact in the consolidated financial statements.
IAS 39 Financial Instruments: Recognition and Measurement
On June 27, 2013 the IASB issue amendments to IAS 39 related to continuing hedge accounting after novation. This amendment provides an exception to the requirement to discontinue hedge accounting in situations where over-the-counter (OTC) derivatives designated in hedging relationships are directly or indirectly, novated to a central counterparty (CCP) as a consequence of laws or regulations, or the introduction of laws or regulations.
The effective date for annual periods beginning on or after January 1, 2014 . Early adoption is permitted.
The Bank will make updates related to documentation that will be required and adjustments in operating process for compliance of novations. Hedges will not be interrupted for this novation, so there is no impact in financial statements.
F-163
Table of Contents
NOTES TO THE CONSOLIDATED FINANCIAL STATEMENTS, Continued
| 44. | New Accounting Pronouncements, continued: |
IFRS 9 Financial Instruments: Financial liabilities
On October 28, 2010, the IASB incorporated in IFRS 9 accounting treatment of financial liabilities, maintaining classification and measurement criteria of IAS 39 for all liabilities except those that the entity has used fair value. Entities that their liabilities are valued through fair value shall determine the amount of variation related to credit risk and if they not produce accounting mismatch register them in equity.
IFRS 9 Financial Instruments: Recognition and Measurement
In November 2009, the IASB issued IFRS 9, “Financial Instruments,” the first step in its project to replace IAS 39, “Financial Instruments: Recognition and Measurement”. IFRS 9 introduces new requirements for classifying and measuring financial assets that are in the scope of the application of IAS 39. This new regulation requires that all financial assets be classified in function of the entity’s business model for the management of financial assets and of the characteristics of the contractual cash flows of financial assets. A financial asset shall be measured at amortized cost if two criteria are fulfilled: (a) the objective of the business model is to maintain a financial asset to receive contractual cash flows, and (b) contractual cash flows represent principal and interest payments. Should a financial asset not comply with the aforementioned conditions, it will be measured at fair value. In addition, this standard allows a financial asset that fulfills the criteria to be valued at amortized cost to be designated at fair value with changes in income under the fair value option, as long as this significantly reduces or eliminates an accounting asymmetry. Likewise, IFRS 9 eliminates the requirement of separating embedded derivatives from the host financial assets. Therefore, it requires that a hybrid contract be classified entirely in amortized cost or fair value.
IFRS 9 requires, mandatory and prospective way, that the entity makes reclassifications of financial assets when the entity modifies the business model.
Under IFRS 9, all equity investments of are measured at fair value. However, the Management has the option of present the changes of fair value in the item “Other Comprehensive Income” in equity. This accounting treatment is available for the initial recognition of an instruments and it is irrevocable. The unrealized income (loss) recognized in “Other Comprehensive Income”, derived from the changes of fair value, and must be not included in income statements.
In November 2013 IASB issued amendment to IFRS 9 to introduce a new model of hedge accounting, which aligns hedge accounting with risk management.
This amendment removes date of adoption date (January 1, 2015). So, effective date is in process of decision by IASB.
At date, this rule has not approved by the Superintendency of Banks, situation required for its application.
F-164
Table of Contents
NOTES TO THE CONSOLIDATED FINANCIAL STATEMENTS, Continued
| 44. | New Accounting Pronouncements, continued: |
IFRS 10 Consolidated Financial Statement, IFRS 12 Disclosure of Interests in Other Entities and IAS 27 Separate Financial Statements
During October 2012, IASB issued amendments to definition of an investment entity and introduced an exception for consolidate certain subsidiaries pertaining to investment entity. This modification requires that an entity considered of investment measures its investments in subsidiaries to fair value with changes in profit or loss according IFRS 9 – Financial Statements, in its Consolidated and Separated Financial Statements instead to consolidate such subsidiaries.
Amendments also introduce new disclosure requirements related to investment entities IFRS 12 and IAS 27.
If an entity applies these amendments but not applies IFRS 9 yet, any reference in this document to IFRS 9 must be interpreted as a reference to IAS 39 Financial Instruments: Recognition and Measurement.
The standard is effective for annual periods beginning on or after January 1, 2014 and early adoption is permitted.
These modifications will not affect Consolidated Statement of Financial Position.
IAS 19 Employee benefits
On November 2013, IASB modified requirements of IAS 19 respect to employee contributions or third parties contributions, which are related to defined benefit plans.
Adoption date of this modification is beginning July 1, 2014 , and anticipated adoption is permitted.
The Bank has not employee contributions related to defined benefit plans, so this amendment has not impacts over consolidated financial statements of Banco de Chile and its subsidiaries.
F-165
Table of Contents
NOTES TO THE CONSOLIDATED FINANCIAL STATEMENTS, Continued
| 44. | New Accounting Pronouncements, continued: |
Annual improvements IFRS 2010 – 2012 Cycle and 2011 – 2013 Cycle
On December 12, 2013, IASB issued two cycles of annual improvements to IFRS: 2010 – 2012 and 2011 – 2013 Cycles, these contain 11 changes in 9 rules:
| • |
IFRS 1 – First time adoption; Meaning of “effective IFRS” . Not applicable. |
| • |
IFRS 2 – Share based payments; Definition relating to vesting conditions . Not applicable. |
| • |
IFRS 3 – Business combination; Accounting for contingent consideration in a business combination . Without impact. |
| • |
IFRS 8 – Operating Segments; Aggregation of operating segments and Reconciliation of the total of the reportable segment assets to the entity’s total assets . The Bank and its subsidiaries are assessing the impact of adoption of these changes in its financial position. |
| • |
IFRS 13 – Fair Value measurement; Scope of portfolio exception (paragraph 52). The Bank and its subsidiaries are assessing the impact of adoption of these changes in its financial position. |
| • |
IAS 16 – Property, plant and equipment; Revaluation method proportionate restatement of accumulated depreciation . Not applicable. |
| • |
IAS 24 – Related party disclosures; Key management personnel . Not applicable |
| • |
IAS 38 – Intangible assets; Revaluation method proportionate restatement of accumulated depreciation . Not applicable |
| • |
IAS 40 – Investment properties. Interrelationship between IFRS 3 and IAS 40 . Without impact |
The effective date of these amendments are beginning on July 1, 2014 , except by modifications of IFRS 13 and IFRS 1, which affect basics of conclusions of respective rules and, so are effective immediately.
F-166
Table of Contents
NOTES TO THE CONSOLIDATED FINANCIAL STATEMENTS, Continued
| 45. | Subsequent Events: |
| (a) | On January 9, 2014 LQ Inversiones Financieras S.A. (“LQIF”) informed Banco de Chile that LQIF will carry out a process to offer for sale or transfer up to 6,900,000,000 shares of Banco de Chile (a secondary offering). In addition, LQIF has requested that Banco de Chile perform all the actions related to the execution of this kind of transaction in the local and international markets. |
Furthermore, the letter indicates that, if consummated, this transaction will reduce LQIF’s share of outstanding voting rights from 58.4% to 51%, so that the control status of LQIF with respect to Banco de Chile will not be altered.
With regard to the above, on this date the Board of Directors of Banco de Chile has agreed to LQIF’s request and the conditions under which Banco de Chile will participate in the appropriate filings with foreign regulators, the entering into of contracts and other documents required by law and consistent with securities market practice in the United States of America and other international markets, and in the performing of such other steps and actions as are necessary for the consummation of this transaction in the local and international markets and that are related to the commercial and financial condition of Banco de Chile.
| (b) | On January 14, 2014, in relation to the relevant event dated January 9, 2014, it is informed that Banco de Chile has filed with the Securities and Exchange Commission of the United States of America (SEC), Supplemental Preliminary a prospectus which contains financial and business information of the Bank. |
Also, it has been registered the agreed contract text called Underwriting Agreement that will be subscribed by LQ Inversiones Financieras S.A. (LQIF), as a seller of securities, Banco de Chile as issuer, and Citigroup Global Markets Inc., Merrill Lynch, Pierce, Fenner & Smith Incorporated, Deutsche Bank Securities Inc. and Banco BTG Pactual S.A. – Cayman Branch, as underwriters.
Additionally, LQIF and Banco de Chile have agreed the terms and general conditions under which the Bank will participate in this process.
| (c) | On January 29, 2014, LQ Inversiones Financieras S.A. informed as a relevant event that was placed of 6,700,000,000 shares of Banco de Chile, in the local market and the United States of America, by American Depositary Receipts Program, at a price of $ 67 per share, declaring successful offer for sale. Additionally, it informed that the 6,700,000,000 shares of Banco de Chile offered for sale will be placed in stock exchange at price stated on January 29, 2014. |
| (d) | On January 29, 2014, Bank is informed that in relation to the secondary offering shares of Banco de Chile that is performing with LQ Inversiones Financieras S.A., in this date Banco de Chile as issuer, LQ Investments SA, as seller of the securities, and Citigroup Global Markets Inc., Merrill Lynch, Pierce, Fenner & Smith Incorporated, Deutsche Bank Securities Inc., and Banco BTG Pactual SA – Cayman Branch as underwriters, have been subscribed a contract called Underwriting Agreement, according to relevant event dated January 14, 2014. |
Also, later than January 30, 2014, Banco de Chile will proceed to register in Securities and Exchange Commission of the United States of America (SEC), Final Prospectus Supplement, which contains financial and commercial information of the Bank.
F-167
Table of Contents
NOTES TO THE CONSOLIDATED FINANCIAL STATEMENTS, Continued
| 45. | Subsequent events, continued |
| (e) | On January 31, 2014, it was informed that in the Ordinary Meeting No. BCH 2,790 held on January 30th, 2014, the Board of Directors of Banco de Chile resolved to call an Ordinary Shareholders Meeting to be held on March 27th, 2014, with the objective of proposing, among other matters, the distribution of the Dividend number 202 of $3.48356970828 per each of the 93,175,043,991 “Banco de Chile” shares, which will be payable at the expense of the distributable net income obtained during the fiscal year ending on December 31st, 2013, corresponding to the 70% of such income. |
Likewise, the Board of Directors resolved to call an Extraordinary Shareholders Meeting to be held on the same date in order to propose, among other things, the capitalization of the 30% of the distributable net income of the Bank obtained during the fiscal year ending on December 31st, 2013, through the issuance of fully paid-in shares, of no par value, with a value of $64.56 per “Banco de Chile “share, which will be distributed among the shareholders in the proportion of 0.02312513083 shares for each “Banco de Chile” share and to adopt the necessary agreements subject to the exercise of the options established in article 31 of Law 19,396.
| (f) | On January 29, 2014 It was published the prospectus supplement (the “Selling Shareholder”) where it was offered 6,700,000,000 shares of our common stock (“shares”). This prospectus supplement relates to an offering by the international underwriters named herein of 1,809,000,000 shares in the form of American Depositary Shares (“ADSs”) in the United States and elsewhere outside Chile and an offering by the Chilean placement agents named herein of 4,891,000,000 shares in Chile. Each ADS represents 600 shares. The ADSs are evidenced by American Depositary Receipts (“ADRs”). |
All of the shares will be sold by the Selling Shareholder in one block through a book auction on the Santiago Stock Exchange in a process known as subasta de un libro de órdenes , in compliance with Chilean law and the rules of the Santiago Stock Exchange. All orders of shares made by prospective purchasers, including by the international underwriters for purposes of the international offering, must be placed through an authorized Chilean broker under Chilean law. The shares awarded to the international underwriters in the subasta de un libro de órdenes will be eligible for deposit in our ADR facility, subject to the terms of our deposit agreement dated as of November 27, 2001, as amended (the “Deposit Agreement”).
On January 28, 2014, the last reported closing price of the ADSs on the New York Stock Exchange was US$74.95 per ADS and the last reported closing price of the shares on the Santiago Stock Exchange, the Electronic Stock Exchange and the Valparaiso Stock Exchange was Ch$68.32 per share.
| (g) | By Oficio Reservado No.064 dated January 30th, 2014 the Superintendency of Securities and Insurance (“Superintendencia de Valores y Seguros”) brought charges against Banchile Corredores de Bolsa S.A. for the alleged infringement of Article 53 second paragraph of Law 18,045 (“Ley de Mercado de Valores”), for certain specific transactions performed during the years 2009, 2010 and 2011. |
| (h) | On March 27, 2014 it was informed that at the Ordinary Shareholders’ Meeting of the Bank, the payment of dividend No.202 had been approved, in the amount of CLP$3.48356970828 per “Banco de Chile” share, with charge to year 2013 net distributable income of Banco de Chile. Also, our shareholders agreed to a stock dividend in connection with the capitalization of 30% of our distributable net income obtained during the fiscal year 2013, through the issuance of fully paid-in shares, of no par value, with a value of Ch$64.56 per share, which will be distributed to the shareholders at the fixed rate of 0.02312513083 fully paid-in shares per share currently held, subject to the exercise of the options established in article 31 of Law 19,396. |
F-168
Table of Contents
NOTES TO THE CONSOLIDATED FINANCIAL STATEMENTS, Continued
| 45. | Subsequent events, continued |
| (i) |
On April 1, 2014 it was informed as an Essential Information that, as of this date, the Central Bank of Chile has communicated to Banco de Chile that the Board of such institution (Consejo), in Extraordinary Session No 1813E, considering the resolutions adopted by the shareholders’ meetings of Banco de Chile of March 27, 2014, regarding distribution of dividends and the increase of capital through the issuance of fully paid-in shares corresponding to the 30% of the net income obtained during the fiscal year ending on December 31 st , 2013, resolved to take the option that the entirety of its corresponding surplus, including the part of the profits proportional to the agreed capitalization, be paid to the Central Bank of Chile in cash currency, according to the letter b) of the article 31 of the law No 19.396, regarding a modification of the way of payment of the subordinated obligation and other applicable legislation. |
In Management’s opinion, there are no other significant subsequent events that affect or could affect the consolidated financial statements of the Bank and its subsidiaries between December 31, 2013 and the date of issuance of these consolidated financial statements.
F-169
Table of Contents
SIGNATURE
The registrant, Banco de Chile, hereby certifies that it meets all of the requirements for filing on Form 20-F and that it has duly caused and authorized the undersigned to sign this annual report on its behalf.
| BANCO DE CHILE | ||||
| By |
/s/ Arturo Tagle Q. |
|||
| Name: | Arturo Tagle Q. | |||
| Title: | Chief Executive Officer | |||
Date: April 25, 2014