BALCHEM CORP
10-Ks and 10-Qs
|
|
|
|
|
|
|
|
|
|
|
|
|
|
|
|
|
|
|
|
|
|
|
|
|
|
|
|
|
|
|
|
|
|
|
|
|
|
|
|
|
|
|
|
|
|
|
|
|
|
|
|
|
|
|
|
|
|
|
UNITED STATES
SECURITIES AND EXCHANGE COMMISSION
Washington, D.C. 20549
FORM 10-K
(Mark One)
| ☑ | ANNUAL REPORT PURSUANT TO SECTION 13 OR SECTION 15(d) OF THE SECURITIES EXCHANGE ACT OF 1934 |
For the fiscal year ended December 31, 2014
OR
| ☐ | TRANSITION REPORT PURSUANT TO SECTION 13 OR 15(d) OF THE SECURITIES EXCHANGE ACT OF 1934 |
For the transition period from
_______
to
____
_
.
Commission file number: 1-13648
Balchem Corporation
(Exact name of Registrant as specified in its charter)
|
Maryland
|
13-2578432
|
|
|
(State or other jurisdiction of incorporation or organization)
|
(I.R.S. Employer Identification Number)
|
52 Sunrise Park Road, New Hampton, NY 10958
(Address of principal executive offices) (Zip Code)
Registrant’s telephone number, including area code: (845) 326-5600
Securities registered pursuant to Section 12(b) of the Act:
|
Title of each class
|
Name of each exchange on which registered
|
|
|
Common Stock, par value $.06-2/3 per share
|
Nasdaq Global Market
|
Securities registered pursuant to Section 12(g) of the Act:
None
Indicate by check mark whether the Registrant is a well-known seasoned issuer, as defined in Rule 405 of the Securities Act. Yes ☑ No ☐
Indicate by check mark whether the Registrant is not required to file reports pursuant to Section 13 or Section 15(d) of the Act. Yes
☐
No
☑
Indicate by check mark whether the Registrant (1) has filed all reports required to be filed by Section 13 or 15(d) of the Securities Exchange Act of 1934 during the preceding 12 months (or such shorter period that the Registrant was required to file such reports), and (2) has been subject to such filing requirements for the past 90 days. Yes
☑
No
☐
Indicate by check mark whether the registrant has submitted electronically and posted on its corporate Web site, if any, every Interactive Data File required to be submitted and posted pursuant to Rule 405 of Regulation S-T (§232.405 of this chapter) during the preceding 12 months (or for such shorter period that the registrant was required to submit and post such files).
Yes
☑
No
☐
Indicate by check mark if disclosure of delinquent filers pursuant to Item 405 of Regulation S-K is not contained herein, and will not be contained, to the best of Registrant’s knowledge, in definitive proxy or information statements incorporated by reference in Part III of this Form 10-K or any amendment to this Form 10-K.
☑
Indicate by check mark whether the Registrant is a
large accelerated filer, an accelerated filer, a non-accelerated filer, or a smaller reporting company
. See
the definitions of “large accelerated filer,” “accelerated filer” and “smaller reporting company” in Rule 12b-2 of the Exchange
Act.
|
(Check one):
|
Large accelerated filer
☑
|
Accelerated filer
☐
|
|
|
Non-accelerated filer
☐
|
Smaller reporting company
o
|
Indicate by check mark whether the Registrant is a shell company (as defined in Rule 12b-2 of the Exchange Act).
Yes
☐
No
☑
The aggregate market value of the common stock, par value $.06-2/3 per share (the “Common Stock”), issued and outstanding and held by non-affiliates of the Registrant, based upon the closing price for the Common Stock on the NASDAQ Global Market on June 30, 2014 was approximately $1,610,000,000. For purposes of this calculation, shares of the Registrant held by directors and officers of the Registrant and under the Registrant's 401(k)/profit sharing plan have been excluded.
The number of shares outstanding of the Registrant's Common Stock was 30,945,086 as of February 20, 2015.
DOCUMENTS INCORPORATED BY REFERENCE
Selected portions of the Registrant’s proxy statement for its 2015 Annual Meeting of Stockholders (the “2015 Proxy Statement”) to be filed with the Securities and Exchange Commission pursuant to Regulation 14A within 120 days after Registrant’s fiscal year-end of December 31, 2014 are incorporated by reference in Part III of this Annual Report on Form 10-K to the extent states therein.
Cautionary Statement Regarding Forward-Looking Statements
This Annual Report on Form 10-K contains “forward-looking statements” within the meaning of Section 21E of the Securities Exchange Act of 1934, as amended. Forward-looking statements are not statements of historical facts, but rather reflect our current expectations or beliefs concerning future events and results. We generally use the words “believes,” “expects,” “intends,” “plans,” “anticipates,” “likely,” “will,” “estimates,” “project” and similar expressions to identify forward-looking statements. Such forward-looking statements, including those concerning our expectations, involve risks, uncertainties and other factors, some of which are beyond our control, which may cause our actual results, performance or achievements, or industry results, to be materially different from any future results, performance or achievements expressed or implied by such forward-looking statements. The risks, uncertainties and factors that could cause our results to differ materially from our expectations and beliefs include, but are not limited to, those factors set forth in this Annual Report on Form 10-K under “Item 1A. - Risk Factors” below, including the following:
| · | changes in laws or regulations affecting our operations; |
| · | changes in our business tactics or strategies; |
| · | acquisitions of new or complementary operations; |
| · | sales of any of our existing operations; |
| · | changing market forces or contingencies that necessitate, in our judgment, changes in our plans, strategy or tactics; and |
| · | fluctuations in the investment markets or interest rates, which might materially affect our operations or financial condition. |
We cannot assure you that the expectations or beliefs reflected in these forward-looking statements will prove correct. We undertake no obligation to publicly update or revise any forward-looking statements, whether as a result of new information, future events or otherwise. You are cautioned not to unduly rely on such forward-looking statements when evaluating the information presented in this Annual Report on Form 10-K and all subsequent written and oral forward-looking statements made by us or persons acting on our behalf are expressly qualified in their entirety by the cautionary statements contained herein.
PART I
|
Item1.
|
Business
|
General:
Balchem Corporation (“Balchem,” the “Company,” “we” or “us”), incorporated in the State of Maryland in 1967, is engaged in the development, manufacture and marketing of specialty performance ingredients and products for the food, nutritional, feed, pharmaceutical and medical sterilization industries. Our reportable segments are strategic businesses that offer products and services to different markets. We presently have three reportable segments: SensoryEffects; Animal Nutrition & Health; and Specialty Products.
The Company sells its products through its own sales force, independent distributors and sales agents. Financial information concerning the Company's business, business segments and geographic information appears in Management’s Discussion and Analysis of Financial Condition and Results of Operations under Item 7 below and in the Notes to our Consolidated Financial Statements included under Item 8 below, which information is incorporated herein by reference.
The Company operates three domestic subsidiaries which are wholly-owned: Performance Chemicals and Ingredients Company (d/b/a/ SensoryEffects) (“PCI”), a Delaware corporation, BCP
1
Ingredients, Inc. (“BCP”), a Delaware corporation, and Aberco, Inc. (“Aberco”), a Maryland corporation. We also operate two wholly-owned subsidiaries in Europe: Balchem BV, a Dutch limited liability company, and Balchem Italia Srl, an Italian limited liability company. Unless otherwise stated to the contrary, or unless the context otherwise requires, references to the Company in this report includes Balchem Corporation and its subsidiaries.
SensoryEffects (formerly Food, Pharma & Nutrition (“FPN”))
On May 7, 2014, the Company acquired 100 percent (100%) of the outstanding common shares of Performance Chemicals & Ingredients Company (d/b/a SensoryEffects), a privately held supplier of customized food and ingredient systems, headquartered in St. Louis, Missouri (the “Acquisition”). The Company made payments of approximately $569 million on the purchase date, amounting to $494 million to the former shareholders, including adjustments for working capital acquired and $75 million to SensoryEffects’ lenders to pay off all SensoryEffects bank debt. SensoryEffects is a leader in powder, solid and liquid flavor systems, creamer and specialty emulsified powders, cereal-based products and other functional ingredient food and beverage delivery systems. SensoryEffects was merged with the Company’s Food, Pharma & Nutrition segment (“FPN”) and the segment was renamed “SensoryEffects.” FPN continues to provide microencapsulation solutions to a variety of applications in food, pharmaceutical and nutritional ingredients to enhance performance of nutritional fortification, processing and packaging applications and shelf-life
for
applications
in
baked, refrigerated and frozen dough, processed meats, seasoning blends, confections, and nutritional supplements. We also produce and market human grade choline for wellness applications. Choline
has
a key role in the development and structural integrity of brain cell membranes in infants, processing dietary fat, reproductive development and neural functions, such as memory and muscle function.
Animal Nutrition & Health
Our Animal Nutrition & Health (“ANH”) segment provides nutritional products derived from our microencapsulation and chelation technologies in addition to basic choline chloride.
For ruminant animals
, our microencapsulated
products
boosts health and milk production, delivering nutrient supplements that are biologically available, providing required nutritional levels. Our proprietary chelation technology, our
KEYSHURE
®
line products, provides enhanced nutrient absorption for various species of production and companion animals and is marketed for use in animal feed throughout the world. ANH also manufactures and supplies choline chloride, an essential nutrient for
monogastric
animal health, predominantly to the poultry, pet and swine industries. Choline, which is manufactured and sold in both dry and aqueous forms, plays a vital role in the metabolism of fat. Choline deficiency can result in reduced growth and perosis in poultry; fatty liver, kidney necrosis and general poor health conditions in swine. Certain derivatives of choline chloride are also manufactured and sold into industrial applications predominately as a component for hydraulic fracturing of shale natural gas wells. The ANH segment also includes the manufacture and sale of methylamines. Methylamines are a primary building block for the manufacture of choline products and are also
produced at our Italian operation and sold for
a wide range of industrial applications
in Europe
.
Specialty Products
Our Specialty Products segment operates
commercially
as ARC Specialty Products.
Ethylene oxide, at the 100% level, is sold as a sterilant gas, primarily for use in the health care industry. It is used to sterilize a wide range of medical devices because of its versatility and effectiveness in treating hard or soft surfaces, composites, metals, tubing and different types of plastics without negatively impacting the performance of the device being sterilized. Our 100% ethylene oxide product is distributed in uniquely designed, reusable, double-walled, stainless steel drums to assure compliance with safety, quality and environmental standards as outlined by the U.S. Environmental Protection Agency ("EPA") and the U.S. Department of Transportation (“DOT”). Our inventory of these specially built drums, along with our two filling facilities, represents a significant capital investment. Contract sterilizers and medical device
2
manufacturers are principal customers for this product.
We
also sell single use canisters with 100% ethylene oxide for
sterilizing re-usable devices typically processed
in
autoclave units in hospitals
. As a fumigant, ethylene oxide blends are highly effective in killing bacteria, fungi, and insects in spices and other seasoning materials.
Propylene oxide is marketed and sold as a fumigant to aid in the control of insects and microbiological spoilage; and to reduce bacterial and mold contamination on certain shell and processed nut meats, processed spices, cacao beans, cocoa powder, raisins, figs and prunes. We distribute our propylene oxide product primarily in recyclable, single-walled, carbon steel cylinders according to standards outlined by the EPA and the DOT. Our inventory of these cylinders also represents a significant capital investment. Propylene oxide is also sold to customers seeking smaller (as opposed to bulk) quantities and whose requirements include utilization in various chemical synthesis applications, such as increasing paint durability and manufacturing specialty starches and textile coatings.
Raw Materials
The raw materials utilized by the Company in the manufacture of its products are sourced from suppliers both domestically and internationally. Such raw materials include materials derived from petrochemicals, minerals, metals, agricultural commodities and other readily available commodities and are subject to price fluctuations due to market conditions. The Company is not experiencing any current difficulties in procuring such materials and does not anticipate any such problems; however, we cannot assure that will always be the case.
Intellectual Property
The Company currently holds 16 patents in the United States and overseas and uses certain trade-names and trademarks. It also uses know-how, trade secrets, formulae, and manufacturing techniques that assist in maintaining competitive positions of certain of its products. Formulae and know-how are of particular importance in the manufacture of a number of the Company’s proprietary products. The Company believes that certain of its patents, in the aggregate, are advantageous to its business. However, it is believed that no single patent or related group of patents is currently so material to the Company that the expiration or termination of any single patent or group of patents would materially affect its business.
Our U.S. patents expire between 2016 and 2024
. The Company believes that its sales and competitive position are dependent primarily upon the quality of its products, technical sales efforts and market conditions, rather than on patent protection.
Seasonality
In general, the businesses of our segments are not seasonal to any material extent.
Backlog
At December 31, 2014, the Company had a total backlog of $38,798,000 (including $23,703,000 for the SensoryEffects segment; $14,396,000 for the ANH segment and $699,000 for the Specialty Products segment), as compared to a total backlog of $12,496,000 at December 31, 2013 (including$2,606,000 for the SensoryEffects segment; $9,236,000 for the ANH segment and $654,000 for the Specialty Products segment). It has generally been the Company’s policy and practice to maintain an inventory of finished products and/or component materials for its segments to enable it to ship products within two months after receipt of a product order. All orders in the current backlog are expected to be filled in the 2015 fiscal year.
Competition
3
Our competitors include many large and small companies, some of which have greater financial, research and development, production and other resources than the Company. Competition in the food and ingredient markets served by the Company is based primarily on product performance, customer support, quality, service and price. The development of new and improved products is important to the Company’s success. This competitive environment requires substantial investments in product and manufacturing process research and development. In addition, the winning and retention of customer acceptance of the Company’s food and nutrition products involve substantial expenditures for application testing, either internally or at customer/prospect sites, and sales efforts. Our competition in this market includes a variety of ingredient and nutritional supplement companies many of which are privately-held. Therefore, it is difficult to assess the size of all of our segment competitors or where we rank in comparison to such privately-held competitors.
Competition in the animal feed and industrial markets served by the Company is based primarily on quality, service and price. The markets for our products are subject to competitive risks because these markets are highly price competitive
.
Our competition in
this market
includes a
variety
of animal nutrition and health ingredient companies, along with certain industrial companies, many of which are privately-held. Therefore, we are unable to assess the size of all of our competitors or where we rank in comparison to such privately-held competitors
.
In the
Specialty Products
segment, the Company’s products face competition from alternative sterilizing technologies and products. Competition in this marketplace is based primarily on medical device compositions, product performance, customer support, quality, service and price.
Our competition in
this market
includes sterilization companies, a number of which are privately-held. Therefore, we are unable to assess the size of all of our competitors or where we rank in comparison to such privately-held competitors. We do, however, conduct an informal survey which indicates that our market share is modestly growing. We are focused on the North American market due to EPA, United States Food and Drug Administration (“FDA”) and DOT regulations that are not yet required globally.
Research & Development
During the years ended December 31, 2014, 2013 and 2012, the Company incurred research and development expenses of approximately $4.8 million, $3.6 million and $3.4 million, respectively, on Company-sponsored research and development for new products and improvements to existing products and manufacturing processes. At December 31, 2014, approximately 40 employees were devoted full time to research and development activities. The Company has historically funded its research and development programs with funds available from current operations with the intent of recovering those costs from profits derived from future sales of products resulting from, or enhanced by, the research and development effort.
The Company prioritizes its product development activities in an effort to allocate resources to those product candidates that, the Company believes, have the greatest commercial potential. Factors considered by the Company in determining the products to pursue include projected markets and needs, status of its proprietary rights, technical feasibility, expected and known product attributes, and estimated costs to bring the product to market.
Capital Projects
The Company continues to invest in projects across all production facilities and capital expenditures were approximately $13.2 million, $8.2 million and $13.9 million for 2014, 2013 and 2012, respectively. In 2014, capital expenditures of $4.8 million were related to expanding the Company’s Animal Nutrition & Health capacity in the manufacturing facility located in Verona, Missouri. For 2013 and 2012, respectively, $3.3 million and $7.3 million of the capital expenditures were for the Company’s new manufacturing facility in Covington, Virginia. Capital expenditures are projected to range from $30.0 million to $40.0 million for 2015.
Environmental / Regulatory Matters
4
The Federal Insecticide, Fungicide and Rodenticide Act (“FIFRA”), a health and safety statute, requires that certain products within our specialty products segment must be registered with the EPA because they are considered pesticides. In order to obtain a registration, an applicant typically must demonstrate, through extensive test data, that its product will not cause unreasonable adverse effects on human health or the environment. We hold EPA registrations permitting us to sell ethylene oxide as a medical device sterilant and spice fumigant, and propylene oxide as a fumigant of nuts and spices.
With respect to the treatment of spices with ethylene oxide, the EPA allows the use of EO on the vast majority of spices. However, EPA prohibited its use for the treatment of basil, effective August 1, 2007, but allows the continuing use of ethylene oxide to treat all other spices, provided specific treatment parameters are used. During 2009, the EPA mandated that a toxicity study be performed on ethylene chlorohydrin, which is a “residue of concern”, according to the EPA. This study was financed by an industry trade association of which we are a member, and was submitted to the EPA in March 2012. At this time, review of this study has not been completed. When the review is completed, we anticipate the results will not negatively impact the use of ethylene oxide to treat spices.
In April 2008, the EPA issued a RED (“Reregistration Eligibility Decision”) for ethylene oxide which permitted the continued use of ethylene oxide “to sterilize medical or laboratory equipment, pharmaceuticals, and aseptic packaging, or to reduce microbial load on musical instruments, cosmetics, whole and ground spices and other seasoning materials and artifacts, archival material or library objects”. Currently, the EPA has initiated a new registration review of ethylene oxide, in line with and part of the registration review scheduled for a large number of other pesticides. A Final Work Plan was issued in March 2014, with a target date of September 2021 for final registration decision. As part of the process, EPA has identified several potential additional testing requirements. The EPA and the registrants are in discussions regarding the additional testing. While some additional testing will be necessary, we believe that the use of ethylene oxide will continue to be permitted. The product, when used as a sterilant for certain medical devices, has no known equally effective substitute. Management believes the lack of availability of this product could not be easily tolerated by various medical device manufacturers or the health care industry due to the resultant infection potential.
Similarly, the EPA issued a RED for propylene oxide in August 2006. At that time, the EPA “determined that products containing the active ingredient PPO [propylene oxide] are eligible for reregistration provided that…risk mitigation measures…are adopted.” Our product label was amended as required to reflect these mitigation measures and also to show that propylene oxide has been reclassified as a restricted use pesticide. Currently, the EPA has initiated a new registration review of propylene oxide, in line with and part of the registration review scheduled for a large number of other pesticides. A Final Work Plan was issued in March 2014. The EPA anticipates this review process will take approximately seven years. As part of the process, the EPA has identified several potential additional testing requirements. The Company has committed to conduct an additional study, and is in discussions with the EPA regarding other studies. While it is possible that we will be required to perform additional testing, we believe that the use of propylene oxide to treat nuts and spices will continue to be permitted.
The Company’s facility in Verona, Missouri, while held by a prior owner, was designated by the EPA as a Superfund site and placed on the National Priorities List in 1983, because of dioxin contamination on portions of the site. Remediation conducted by the prior owner under the oversight of the EPA and the Missouri Department of Natural Resources (“MDNR”) included removal of dioxin contaminated soil and equipment, capping of areas of residual contamination in four relatively small areas of the site separate from the manufacturing facilities, and the installation of wells to monitor groundwater and surface water for contamination for certain organic chemicals. No ground water or surface water treatment has been required. In 1998, the EPA certified the work on the contaminated soils to be complete. In February 2000, after the conclusion of two years of monitoring groundwater and surface water, the former owner submitted a draft third party risk assessment report to the EPA and MDNR recommending no further action. The prior owner is awaiting the response of the EPA and MDNR to the draft risk assessment.
5
While the Company must maintain the integrity of the capped areas in the remediation areas on the site, the prior owner is responsible for completion of any further Superfund remedy. The Company is indemnified by the sellers under its May 2001 asset purchase agreement covering its acquisition of the Verona facility for potential liabilities associated with the Superfund site and one of the sellers, in turn, has the benefit of certain contractual indemnification by the prior owner that executed the above-described Superfund remedy.
In connection with normal operations at its plant facilities, the Company is required to maintain environmental and other permits, including those relating to the ethylene oxide operations.
The Company believes it is in compliance in all material respects with federal, state, local and international provisions that have been enacted or adopted regulating the discharge of materials into the environment or otherwise relating to the protection of the environment. Such compliance includes the maintenance of required permits under air pollution regulations and compliance with requirements of the Occupational Safety and Health Administration. The cost of such compliance has not had a material effect upon the results of operations or financial condition of the Company. In 1982, the Company discovered and thereafter removed a number of buried drums containing unidentified waste material from the Company’s site in Slate Hill, New York. The Company thereafter entered into a Consent Decree to evaluate the drum site with the New York Department of Environmental Conservation (“NYDEC”) and performed a Remedial Investigation/Feasibility Study that was approved by NYDEC in February 1994. Based on NYDEC requirements, the Company remediated the area and removed soil from the drum burial site. This proceeding has been substantially completed (see Item 3).
In June 2011, we terminated our lease and ceased operations at a manufacturing facility in Channahon, Illinois, which had previously served as our pharmaceutical grade ingredient manufacturing facility, which was registered with the FDA as a drug manufacturing facility. We will continue to produce products which are required to be manufactured in conformity with current Good Manufacturing Practice (“cGMP”) regulations as interpreted and enforced by the FDA, but will do so through third party contract arrangement. Modifications, enhancements or changes in contracted manufacturing facilities or procedures relating to our pharmaceutical products are, in many circumstances, subject to FDA approval, which may be subject to a lengthy application process or which we may be unable to obtain. Any contracted manufacturing facilities that manufacture our pharmaceutical products are periodically subject to inspection by the FDA and other governmental agencies, and operations at these facilities could be interrupted or halted if the results of these inspections are unsatisfactory.
Employees
As of January 31, 2015, the Company employed approximately 845 persons. Approximately 85 employees at our Marano, Ticino, Italy facility are covered by a national collective bargaining agreement, which expires in 2015. Approximately 70 employees at the Company’s Verona, Missouri facility are covered by a collective bargaining agreement, which expires in 2017.
Available Information
The Company’s headquarters is located at 52 Sunrise Park Road, New Hampton, NY 10958. The Company’s telephone number is (845) 326-5600 and its Internet website address is www.balchem.com. The Company makes available through its website, free of charge, its Annual Reports on Form 10-K, Quarterly Reports on Form 10-Q and Current Reports on Form 8-K, and amendments to such reports, as soon as reasonably practicable after they have been electronically filed with the Securities and Exchange Commission. Such reports are available via a link from the Investor Relations page on the Company’s website to a list of the Company’s reports on the Securities and Exchange Commission’s EDGAR website.
|
Item1A.
|
Risk Factors
|
6
Our business is subject to a high degree of risk and uncertainty, including the following risks and uncertainties, which could adversely affect our business, financial condition, results of operation, cash flows and the trading price of our Common Stock:
Global economic conditions may adversely affect our business, operating results and financial condition.
Unfavorable changes in economic conditions, including inflation, recession, or other changes in economic conditions, may adversely impact the markets in which we operate. These conditions may make it extremely difficult for our customers, our vendors and us to accurately forecast and plan future business activities, and they could cause U.S. and foreign businesses to slow spending on our products which would reduce our revenues and profitability. Furthermore, during challenging economic times our customers may face issues gaining timely access to sufficient credit, which could result in an impairment of their ability to make timely payments to us. If that were to occur, we may be required to increase our allowance for doubtful accounts and cash flow would be negatively impacted. We cannot predict the timing, depth or duration of any economic slowdown or subsequent economic recovery, worldwide, or in the markets in which we operate. Also, at any point in time we have funds in our cash accounts that are with third party financial institutions. These balances in the U.S. exceed the Federal Deposit Insurance Corporation (“FDIC”) insurance limits. While we monitor the cash balances in our accounts, these balances could be impacted if the underlying financial institutions fail or could be subject to other adverse conditions in the financial markets.
Increased competition could hurt our business and financial results.
We face competition in our markets from a number of large and small companies, some of which have greater financial, research and development, production and other resources than we do. Our competitive position is based principally on performance, quality, customer support, service, breadth of product line, manufacturing or packaging technology and the selling prices of our products. Our competitors may improve the design and performance of their products and introduce new products with competitive price and performance characteristics. We expect to do the same to maintain our current competitive position and market share.
The loss of governmental permits and approvals would materially harm some of our businesses.
Pursuant to applicable environmental and safety laws and regulations, we are required to obtain and maintain certain governmental permits and approvals, including EPA registrations under FIFRA for two of our products. We maintain EPA FIFRA registrations for ethylene oxide as a medical device sterilant and spice fumigant and for propylene oxide as a fumigant of nuts and spices. The EPA has issued Reregistration Eligibility Decisions for both products in recent years and these uses have been approved for the time being. The EPA may re-examine the registrations in the future in accordance with the provisions of FIFRA. Any future failure of the EPA to allow reregistration of ethylene oxide or propylene oxide would have a material adverse effect on our business and financial results.
Commercial supply of pharmaceutical products that we may develop, subject to cGMP manufacturing regulations, will be performed by third-party cGMP manufacturers. Modifications, enhancements or changes in third-party manufacturing facilities or procedures of our pharmaceutical products are, in many circumstances, subject to FDA approval, which may be subject to a lengthy application process or which we may be unable to obtain. Any third-party cGMP manufacturers that we may use are periodically subject to inspection by the FDA and other governmental agencies, and operations at these facilities could be interrupted or halted if the results of these inspections are unsatisfactory. Failure to comply with the FDA or other governmental regulations can result in fines, unanticipated compliance expenditures, recall or seizure of products, total or partial suspension of production, enforcement actions, injunctions and criminal prosecution, which could have a material adverse effect on our business and financial results.
7
Permits and approvals may be subject to revocation, modification or denial under certain circumstances. Our operations or activities (including the status of compliance by the prior owner of the Verona, Missouri facility under Superfund remediation) could result in administrative or private actions, revocation of required permits or licenses, or fines, penalties or damages, which could have an adverse effect on us. In addition, we cannot predict the extent to which any legislation or regulation may affect the market for our products or our cost of doing business.
Raw material shortages or price increases could adversely affect our business and financial results.
The principal raw materials that we use in the manufacture of our products can be subject to price fluctuations due to market conditions. Such raw materials include materials derived from petrochemicals, minerals, metals, agricultural commodities and other commodities. While the selling prices of our products tend to increase or decrease over time with the cost of raw materials, these changes may not occur simultaneously or to the same degree. At times, we may be unable to pass increases in raw material costs through to our customers due to certain contractual obligations. Such increases in the price of raw materials, if not offset by product price increases, or substitute raw materials, would have an adverse impact on our profitability. We believe we have reliable sources of supply for our raw materials under normal market conditions. We cannot, however, predict the likelihood or impact of any future raw material shortages. Any shortages could have a material adverse impact on our results of operations.
Our financial success depends in part on the reliability and sufficiency of our manufacturing facilities.
Our revenues depend on the effective operation of our manufacturing, packaging, and processing facilities. The operation of our facilities involves risks, including the breakdown, failure, or substandard performance of equipment, power outages, the improper installation or operation of equipment, explosions, fires, natural disasters, failure to achieve or maintain safety or quality standards, work stoppages, supply or logistical outages, and the need to comply with environmental and other directives of governmental agencies. The occurrence of material operational problems, including, but not limited to, the above events, could adversely affect our profitability during the period of such operational difficulties.
Our business exposes us to potential product liability claims and recalls, which could adversely impact our financial condition and performance.
Our development, manufacture and sales of food ingredient, pharmaceutical and nutritional supplement products involve an inherent risk of exposure to product liability claims, product recalls, product seizures and related adverse publicity. A product liability judgment against us could also result in substantial and unexpected expenditures, affect consumer confidence in our products, and divert management’s attention from other responsibilities. Although we maintain product liability insurance coverage in amounts we believe are customary within the industry, there can be no assurance that this level of coverage is adequate or that we will be able to continue to maintain our existing insurance or obtain comparable insurance at a reasonable cost, if at all. A product recall or a partially or completely uninsured judgment against us could have a material adverse effect on results of operations and financial condition.
We face risks associated with our sales to customers and manufacturing operations outside the United States.
For the year ended December 31, 2014, approximately 22% of our net sales consisted of sales outside the United States. In addition, we conduct a portion of our manufacturing outside the United States. International sales are subject to inherent risks. The majority of our foreign sales occur through our foreign subsidiaries and the remainder of our foreign sales result from exports to foreign distributors, resellers and customers. Our foreign sales and operations are subject to a number of risks, including: longer accounts
8
receivable collection periods; the impact of recessions and other economic conditions in economies outside the United States; export duties and quotas; unexpected changes in regulatory requirements; certification requirements; environmental regulations; reduced protection for intellectual property rights in some countries; potentially adverse tax consequences; political and economic instability; and preference for locally produced products. These factors could have a material adverse impact on our ability to increase or maintain our international sales.
We may, from time to time, experience problems in our labor relations.
In North America, approximately 70 employees, or 9% of our North American workforce, as of December 31, 2014, are represented by a union under a single collective bargaining agreement, which was re-negotiated and is effective as of July 9, 2012. It will expire in 2017. In Europe, approximately 85 employees are covered by a collective bargaining agreement, which was also re-negotiated in 2012 and will expire in 2015. We believe that our present labor relations with all of our union employees are satisfactory, however, our failure to renew these agreements on reasonable terms could result in labor disruptions and increased labor costs, which could adversely affect our financial performance. Similarly, if our relations with the union portion of our workforce do not remain positive, such employees could initiate a strike, work stoppage or slowdown in the future. In the event of such an action, we may not be able to adequately meet the needs of our customers using our remaining workforce and our operations and financial condition could be adversely affected.
Our international operations subject us to currency translation risk and currency transaction risk which could cause our results to fluctuate from period to period.
The financial condition and results of operations of our foreign subsidiaries are reported in Euros and then translated into U.S. dollars at the applicable currency exchange rate for inclusion in our consolidated financial statements. Exchange rates between these currencies in recent years have fluctuated and may do so in the future. Furthermore, we incur currency transaction risk whenever we enter into either a purchase or a sales transaction using a currency different than the functional currency. Given the volatility of exchange rates, we may not be able to effectively manage our currency transactions and/or translation risks. Volatility in currency exchange rates could impact our business and financial results.
Our debt instruments impose operating and financial restrictions which could have an adverse impact on our business and results of operations.
Our recent incurrence of indebtedness could have negative consequences to us, including the following:
| • | limiting our ability to borrow additional monies for our working capital, capital expenditures, acquisitions; debt service requirements or other general corporate purposes; |
| • | limiting our flexibility in planning for, or reacting to, changes in our operations, our business or the industries in which we compete; |
| • | our leverage may place us at a competitive disadvantage by limiting our ability to invest in the business or in further research and development; |
| • | making us more vulnerable to downturns in our business or the economy; and |
| • | there would be a material adverse effect on our business and financial condition if we were unable to service our indebtedness or obtain additional financing, as needed. |
Our ability to make payments on our indebtedness depends on our ability to generate cash in the future. If we do not generate sufficient cash flow to meet our debt service and working capital requirements, we may need to seek additional financing or sell assets. This may make it more difficult for us to obtain financing on terms that are acceptable to us, or at all. Without any such financing, we could be forced to sell assets to make up for any shortfall in our payment obligations under unfavorable circumstances.
9
Interest payable in accordance with our credit agreement is based on LIBOR. In light of potential fluctuations, we are exposed to risk resulting from adverse changes in interest rates.
Adverse publicity or consumer concern regarding the safety or quality of food products containing our products, or health concerns, whether with our products, products in the same general class as our products or for food products containing our products, may result in the loss of sales. Also, consumer preferences for products containing our products may change.
We are dependent upon consumers' perception of the safety, quality and possible dietary benefits of products containing our food ingredient products. As a result, substantial negative publicity concerning our products or other foods and beverages in which our products are used could lead to a loss of consumer confidence in those products, removal of those products from retailers' shelves and reduced sales and prices of our products. Product quality issues, actual or perceived, or allegations of product contamination, even when false or unfounded, could hurt the image of our products or of brands of products containing our products, and cause consumers to choose other products. Further, any product recall, whether our own or by a third party, whether due to real or unfounded allegations, could impact demand on food products containing our products or even our products. Any of these events could have a material adverse effect on our business, results of operations and financial condition. Consumer preferences, as well as trends, within the food industries change often and our failure to anticipate, identify or react to changes in these preferences and trends could, among other things, lead to reduced demand and price reductions, and could have an adverse effect on our business, results of operations and financial condition. While we continue to diversify our product offerings, developing new products entails risks and we cannot be certain that demand for our products and products containing our products will continue at current levels or increase in the future.
Demand for certain of our products is dependent on the levels of
productivity
by the oil and gas industry
, particularly as it relates to shale gas fracturing
. A substantial or an extended decline in oil and gas prices could result in lower expenditures by the oil and gas industry, which could have an adverse effect on our results of operations.
The oil and gas industry historically experiences periodic downturns. Demand for certain of our products depends on the level of expenditures by the oil and gas industry for the exploration, development and production of oil and natural gas reserves. These expenditures are generally dependent on the industry’s view of future oil and natural gas prices and are sensitive to the industry’s view of future economic growth and the resulting impact on demand for oil and natural gas. Declines in oil and gas prices could result in significant downturn in the oil and gas industry and thereby result in a reduction in demand for oilfield services and related products, which could lead to reduced demand for our products and downward pressure on the prices we charge. These effects could have an adverse effect on our results of operations and cash flows.
We may not be able to successfully consummate and manage acquisition, joint venture and divestiture activities which could have an impact on our results.
From time to time, we may acquire other businesses, enter into joint ventures and, based on an evaluation of our business portfolio, divest existing businesses. These acquisitions, joint ventures and divestitures may present financial, managerial and operational challenges, including diversion of management attention from existing businesses, difficulty with integrating or separating personnel and financial and other systems, increased expenses, assumption of unknown liabilities and indemnities, and potential disputes with the buyers or sellers. In addition, we may be required to incur asset impairment charges (including charges related to tangible asset, goodwill and other intangible assets) in connection with acquired businesses which may reduce our profitability. If we are unable to consummate such transactions, or successfully integrate and grow acquisitions and achieve contemplated revenue synergies and cost savings, our financial results could be adversely affected. Additionally, joint ventures inherently involve a lesser degree of control over business operations, thereby potentially increasing the financial, legal, operational and/or compliance risks.
10
Technology failures or cyber security breaches could have an adverse effect on the Company’s operations.
The Company relies on information technology systems to process, transmit, store, and protect electronic information. For example, a significant portion of the communications between the Company’s personnel, customers, and suppliers depends on information technology. Information technology systems of the Company may be vulnerable to a variety of interruptions due to events beyond its control including, but not limited to, natural disasters, terrorist attacks, telecommunications failures, computer viruses, hackers, and other security issues. The Company has technology and information security processes and disaster recovery plans in place to mitigate its risk to these vulnerabilities; however, these measures may not be adequate to ensure that its operations will not be disrupted, should such an event occur.
|
Item1B.
|
Unresolved Staff Comments
|
None.
| Item 2. | Properties |
We and our affiliates own or lease several manufacturing facilities and sales offices throughout the United States, and we own a single manufacturing facility in Europe. The following table sets forth a list of our principal offices, production and other facilities throughout the world as of December 31, 2014.
|
Site
|
Leased/Owned
|
Sq. Footage
|
Products/Functions
|
||||
|
Corporate Offices
|
|||||||
|
New Hampton, NY
|
Leased
|
20,000
|
Corporate headquarters
|
||||
|
St. Louis, MO
|
Leased (SensoryEffects)
|
4,437
|
Administrative offices SensoryEffects
|
||||
|
Manufacturing Facilities
|
|||||||
|
Verona, MO
|
Owned (BCP)
|
151,000
|
aqueous and dry choline chloride, animal feed products, human choline nutrients, repackaging for
Specialty Products,
and warehousing
|
||||
|
Slate Hill, NY
|
Owned
|
51,000
|
encapsulated products,
blending
and repackaging for Specialty Products
|
||||
|
Green Pond, SC
|
Owned
|
34,000
|
repackaging for Specialty Products
|
||||
|
Salt Lake City, UT
|
Owned
|
16,500
|
chelated mineral nutrients, and warehousing
|
||||
|
Covington, VA
|
Owned
|
70,000
|
encapsulated
animal feed products, and warehousing
|
||||
|
St. Gabriel, LA
|
Owned (BCP)
|
15,130
|
aqueous choline chloride
|
||||
|
Marano Ticino, Italy
|
Owned (Balchem Italia)
|
342,734
|
methylamines, metam sodium, animal, human and industrial grade choline, and warehousing
|
||||
|
Sleepy Eye, MN
|
Owned (SensoryEffects)
|
32,000
|
spray drying of
dairy creamers
and
cocoa blends
|
||||
|
Bridgeton, MO
|
Owned (SensoryEffects)
|
84,000
|
creamer products, cocoa powders, liquid and solid flavor inclusions
|
11
|
Marshfield, WI
|
Owned (SensoryEffects)
|
70,000
|
spray drying of lipid based powders
and
blending
|
||||
|
Reading, PA
|
Owned (SensoryEffects)
|
39,750
|
spray drying of
human nutritional products
|
||||
|
Defiance, OH
|
Owned (SensoryEffects)
|
140,700
|
spray drying of
creamer products, solid flavor inclusions for baking
and
blending
|
||||
|
Lincoln, NE
|
Leased (SensoryEffects)
|
87,650
|
cereal products, and warehousing
|
| Item 3. | Legal Proceedings |
In 1982, the Company discovered and thereafter removed a number of buried drums containing unidentified waste material from the Company’s site in Slate Hill, New York. The Company thereafter entered into a Consent Decree to evaluate the drum site with the New York Department of Environmental Conservation (“NYDEC”) and performed a Remedial Investigation/Feasibility Study that was approved by NYDEC in February 1994. Based on NYDEC requirements, the Company remediated the area and removed soil from the drum burial site. Clean-up was completed in 1996, and NYDEC required the Company to monitor the site through 1999. The Company continues to be involved in discussions with NYDEC to evaluate monitoring results and determine what, if any, additional actions will be required on the part of the Company to close out the remediation of this site. Additional actions, if any, would likely require the Company to continue monitoring the site. The cost of such monitoring has recently been less than $5,000 per year.
The Company is also involved in other legal proceedings through the normal course of business. Management believes that any unfavorable outcome related to these proceedings will not have a material effect on the Company’s financial position, results of operations or liquidity.
| Item 4. | Mine Safety Disclosures |
None.
PART II
| Item 5. | Market for the Registrant's Common Equity, Related Stockholder Matters and Issuer Purchases of Equity Securities |
| (a) | Market Information. |
Our Common Stock is listed on the Nasdaq Global Market under the symbol “BCPC.”
The high and low closing prices for the Common Stock as recorded for each quarterly period during the years ended December 31, 2014 and 2013 were as follows:
|
Quarterly Period
|
High
|
Low
|
||||||
|
Ended March 31, 2014
|
$
|
57.87
|
$
|
49.63
|
||||
|
Ended June 30, 2014
|
63.98
|
52.48
|
||||||
|
Ended September 30, 2014
|
58.48
|
49.08
|
||||||
|
Ended December 31, 2014
|
68.46
|
52.01
|
||||||
12
|
Quarterly Period
|
High
|
Low
|
||||||
|
Ended March 31, 2013
|
$
|
43.94
|
$
|
36.07
|
||||
|
Ended June 30, 2013
|
48.52
|
41.67
|
||||||
|
Ended September 30, 2013
|
53.44
|
44.45
|
||||||
|
Ended December 31, 2013
|
59.43
|
50.12
|
||||||
On February 20, 2015, the closing price for the Common Stock on the Nasdaq Global Market was $58.90.
| (b) | Record Holders. |
As of February 20, 2015, the approximate number of holders of record of the Company’s Common Stock was 115. Such number does not include stockholders who hold their stock in street name. As of February 20, 2015, the total number of beneficial owners of the Company's Common Stock is estimated to be approximately
21,990
.
|
(c)
|
Dividends.
|
The Company declared cash dividends of $0.30 and $0.26 per share on its Common Stock during its fiscal years ended December 31, 2014 and 2013, respectively.
|
(d)
|
Securities Authorized for Issuance Under Equity Compensation Plans.
|
For information concerning prior stockholder approval of and other matters relating to our equity incentive plans, see Item 12 in this Annual Report on Form 10-K.
|
(e)
|
Performance Graph.
|
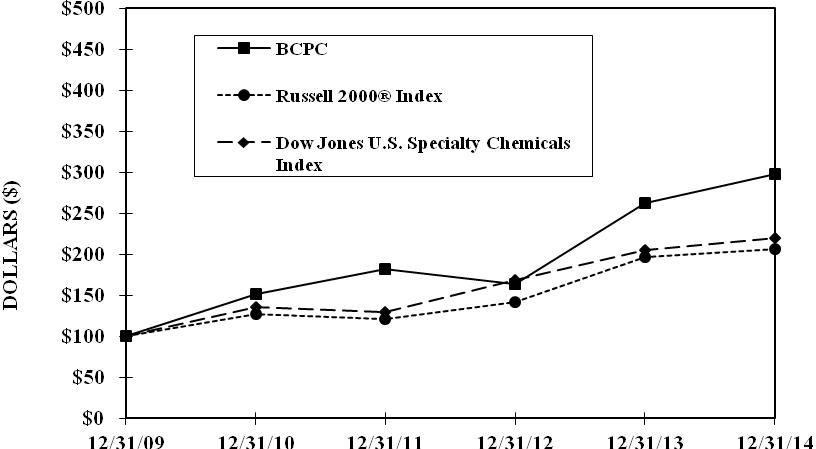
The graph below sets forth the cumulative total stockholder return on the Company's Common Stock (referred to in the table as “BCPC”) for the five years ended December 31, 2014, the overall stock market return during such period for shares comprising the Russell 2000® Index (which the Company believes includes companies with market capitalization similar to that of the Company), and the overall stock market return during such period for shares comprising the Dow Jones U.S. Specialty Chemicals Index, in each case assuming a comparable initial investment of $100 on December 31, 2009 and the subsequent reinvestment of dividends. The Russell 2000® Index measures the performance of the shares of the 2000 smallest companies included in the Russell 3000® Index. In light of the Company's industry segments, the Company does not believe that published industry-specific indices are necessarily representative of stocks comparable to the Company. Nevertheless, the Company considers the Dow Jones U.S. Specialty Chemicals Index to be potentially useful as a peer group index with respect to the Company. The performance of the Company's Common Stock shown on the graph below is historical only and not necessarily indicative of future performance.
13
| Item 6. | Selected Financial Data |
The selected statements of operations data set forth below for the three years in the period ended December 31, 2014 and the selected balance sheet data as of December 31, 2014 and 2013 have been derived from our Consolidated Financial Statements included elsewhere herein. The selected financial data as of December 31, 2012, 2011 and 2010 and for the years ended December 31, 2011 and 2010 have been derived from audited Consolidated Financial Statements not included herein, but which were previously filed with the SEC. The following information should be read in conjunction with Item 7 — “Management’s Discussion and Analysis of Financial Condition and Results of Operations” and the Consolidated Financial Statements and notes thereto included elsewhere herein.
(In thousands, except per share data)
|
Year ended December 31,
|
2014
|
2013
|
2012
|
2011
|
2010
|
|||||||||||||||
|
Statement of Operations Data
|
||||||||||||||||||||
|
Net sales
|
$
|
541,383
|
$
|
337,173
|
$
|
310,393
|
$
|
291,867
|
$
|
255,071
|
||||||||||
|
Earnings before income tax expense
|
77,052
|
65,818
|
59,844
|
56,738
|
50,131
|
|||||||||||||||
|
Income tax expense
|
24,226
|
20,944
|
19,839
|
17,973
|
16,854
|
|||||||||||||||
|
Net earnings
|
52,826
|
44,874
|
40,005
|
38,765
|
33,277
|
|||||||||||||||
|
Basic net earnings per common share
|
$
|
1.74
|
$
|
1.51
|
$
|
1.38
|
$
|
1.36
|
$
|
1.19
|
||||||||||
|
Diluted net earnings per common share
|
$
|
1.69
|
$
|
1.45
|
$
|
1.32
|
$
|
1.28
|
$
|
1.12
|
||||||||||
|
At December 31,
|
2014
|
2013
|
2012
|
2011
|
2010
|
|||||||||||||||
|
Balance Sheet Data
|
||||||||||||||||||||
|
Total assets
|
$
|
861,271
|
$
|
376,872
|
$
|
312,545
|
$
|
271,717
|
$
|
228,624
|
||||||||||
|
Long-term debt (including current portion)
|
332,500
|
-
|
-
|
1,410
|
4,914
|
|||||||||||||||
|
Other long-term obligations
|
5,950
|
3,877
|
3,431
|
2,788
|
2,575
|
|||||||||||||||
14
|
Total stockholders’ equity
|
391,898
|
331,358
|
273,012
|
232,009
|
187,467
|
|||||||||||||||
|
Dividends per common share
|
$
|
.30
|
$
|
.26
|
$
|
.22
|
$
|
.18
|
$
|
.15
|
| Item 7. | Management's Discussion and Analysis of Financial Condition and Results of Operations |
The following discussion and analysis of our financial condition and results of operations should be read in conjunction with Item 6
—
“Selected Financial Data” and our Consolidated Financial Statements and the related notes included in this report. Those statements in the following discussion that are not historical in nature should be considered to be forward-looking statements that are inherently uncertain. See “Cautionary Statement Regarding Forward-Looking Statements.”
Overview
We develop, manufacture, distribute and market specialty performance ingredients and products for the food, nutritional, pharmaceutical, animal health and medical device sterilization industries. Our three reportable segments are strategic businesses that offer products and services to different markets: SensoryEffects (formerly Food, Pharma & Nutrition); Animal Nutrition & Health; and Specialty Products.
Acquisition of Performance Chemicals & Ingredients Company (d/b/a SensoryEffects) and Long-term Debt
On May 7, 2014, the Company acquired 100 percent (the “Acquisition) of the outstanding common shares of Performance Chemicals & Ingredients Company (d/b/a SensoryEffects) a privately held supplier of customized food and ingredient systems, headquartered in St. Louis, Missouri. The Company made payments of approximately $569 million on the purchase date, amounting to $494 million to the former shareholders, including adjustments for working capital acquired and $75 million to SensoryEffects’ lenders to pay off all SensoryEffects bank debt. SensoryEffects is a leader in powder, solid and liquid flavor systems, creamer and specialty emulsified powders, cereal-based products and other functional ingredient food and beverage delivery systems. The Acquisition of SensoryEffects accelerates the Company’s growth into health and wellness markets. SensoryEffects was merged with the Company’s Food, Pharma & Nutrition segment, strengthening its market leadership position, and the segment was renamed SensoryEffects.
On May 7, 2014, the Company and a bank syndicate entered into a loan agreement providing for a senior secured term loan of $350,000 and revolving loan of $100,000 (collectively referred to as the “loans”). The term loan and $50,000 of the revolving loan were used to fund the Acquisition of SensoryEffects and for general corporate purposes. The Company has made debt payments of $67,500 related to these loans and has $100,000 available under the revolving loan.
SensoryEffects Segment
Our SensoryEffects segment supplies ingredients in the food and beverage industry; providing customized solutions in powder, solid and liquid flavor delivery systems, spray dried emulsified powder systems, and cereal systems. Our products include creamer systems, dairy replacers, powdered fats, nutritional beverage bases, beverages, juice & dairy bases, chocolate systems, ice cream bases & variegates, ready-to-eat cereals, grain based snacks, and cereal based ingredients. Additionally, we provide microencapsulation solutions to a variety of applications in food, pharmaceutical and nutritional ingredients to enhance performance of nutritional fortification, processing, mixing, and packaging applications and shelf-life. Major product applications are baked goods, refrigerated and frozen dough systems, processed meats, seasoning blends, confections, and nutritional supplements. We also produce and market human grade choline nutrient products through this segment for wellness applications. Choline is recognized to play a key role in the development and structural integrity of brain cell membranes in infants, processing dietary fat, reproductive development and neural functions, such as memory and muscle function.
Animal Nutrition & Health
15
Our Animal Nutrition & Health (“ANH”) segment provides nutritional products derived from our microencapsulation and chelation technologies in addition to basic choline chloride.
For ruminant animals
, our microencapsulated
products
boosts health and milk production, delivering nutrient supplements that are biologically available, providing required nutritional levels. Our proprietary chelation technology provides enhanced nutrient absorption for various species of production and companion animals and is marketed for use in animal feed throughout the world. ANH also manufactures and supplies choline chloride, an essential nutrient for
monogastric
animal health, predominantly to the poultry
, pet
and swine industries. Choline, which is manufactured and sold in both dry and aqueous forms, plays a vital role in the metabolism of fat. Choline deficiency can result in reduced growth and perosis in poultry; fatty liver, kidney necrosis and general poor health condition in swine. Certain derivatives of choline chloride are also manufactured and sold into industrial applications predominately as a component for hydraulic fracturing of shale natural gas wells. The ANH segment also includes the manufacture and sale of methylamines. Methylamines are a primary building block for the manufacture of choline products and are also
produced at our Italian operation and sold for
a wide range of industrial applications
in Europe
.
Sales of specialty products for the animal nutrition and health industry are highly dependent on dairy industry economics as well as the ability of the Company to leverage the results of university
and field
research on the animal health benefits of the Company’s products. Management believes that success in the commodity-oriented basic choline chloride marketplace is highly dependent on the Company’s ability to maintain its strong reputation for excellent product quality and customer service.
The
Company
continues
to increase production efficiencies in order to maintain its low-cost position to effectively compete in a competitive global marketplace.
Specialty Products
Our Specialty Products segment operates
commercially
as ARC Specialty Products.
Ethylene oxide, at the 100% level, is sold as a sterilant gas, primarily for use in the health care industry. It is used to sterilize a wide range of medical devices because of its versatility and effectiveness in treating hard or soft surfaces, composites, metals, tubing and different types of plastics without negatively impacting the performance of the device being sterilized. Our 100% ethylene oxide product is distributed in uniquely designed, recyclable, double-walled, stainless steel drums to assure compliance with safety, quality and environmental standards as outlined by the EPA and the DOT. Our inventory of these specially built drums, along with our two filling facilities, represents a significant capital investment. Contract sterilizers and medical device manufacturers are principal customers for this product.
We
also sell single use canisters with 100% ethylene oxide for use in
sterilizing re-usable devices typically processed in autoclave units in hospitals
. As a fumigant, ethylene oxide blends are highly effective in killing bacteria, fungi, and insects in spices and other seasoning materials.
Propylene oxide is marketed and sold as a fumigant to aid in the control of insects and microbiological spoilage; and to reduce bacterial and mold contamination in certain shell and processed nut meats, processed spices, cacao beans, cocoa powder, raisins, figs and prunes. We distribute our propylene oxide product primarily in recyclable, single-walled, carbon steel cylinders according to standards outlined by the EPA and the DOT. Our inventory of these cylinders also represents a significant capital investment. Propylene oxide is also sold to customers seeking smaller (as opposed to bulk) quantities and whose requirements include utilization in various chemical synthesis applications, such as increasing paint durability and manufacturing specialty starches and textile coatings.
Management believes that future success in this segment is highly dependent on the Company’s ability to maintain its
government registrations,
strong reputation for excellent quality, safety and customer service.
16
The Company sells products for all three segments through its own sales force, independent distributors, and sales agents.
The following tables summarize consolidated net sales by segment and business segment earnings from operations for the three years ended December 31, 2014, 2013 and 2012 (in thousands):
Business Segment Net Sales:
|
2014
|
2013
|
2012
|
||||||||||
|
Specialty Products
|
$
|
54,053
|
$
|
51,086
|
$
|
49,990
|
||||||
|
SensoryEffects
|
206,101
|
47,569
|
44,070
|
|||||||||
|
Animal Nutrition & Health
|
281,229
|
238,518
|
216,333
|
|||||||||
|
Total
|
$
|
541,383
|
$
|
337,173
|
$
|
310,393
|
||||||
Business Segment Earnings From Operations:
|
2014
|
2013
|
2012
|
||||||||||
|
Specialty Products
|
$
|
21,316
|
$
|
20,224
|
$
|
20,332
|
||||||
|
SensoryEffects
|
21,260
|
11,233
|
11,335
|
|||||||||
|
Animal Nutrition & Health
|
40,219
|
34,145
|
28,110
|
|||||||||
|
Total
|
$
|
82,795
|
$
|
65,602
|
$
|
59,777
|
||||||
Fiscal Year 2014 compared to Fiscal Year 2013
(All amounts in thousands, except share and per share data)
Net Sales
Net sales for 2014 were $541,383 as compared with $337,173 for 2013, an increase of $204,210 or 60.6%. Net sales for the SensoryEffects segment (formerly Food, Pharma & Nutrition) were $206,101, compared with $47,569, for the year ended December 31, 2014, an increase of $158,312 or 333.3%. Net sales from the recently acquired SensoryEffects business contributed $156,192 to the overall increase. The acquired Powder & Flavor Systems and Cereal Systems product lines comprised $132,971 and $17,499 of the increase, respectively. Also contributing to the higher sales was a $2,400 or 9.5% increase in encapsulated ingredients used for baking and food preservation; due to a favorable product mix and greater volume. Net sales for the Animal Nutrition & Health segment were $281,229 for 2014 compared with $238,518 for the prior year, an increase of $42,711 or 17.9%. Sales of products targeted for ruminant animal feed markets realized sales growth of 33.2% or $12,898 from the prior period. The improvement was primarily due to higher sales volumes of Aminoshure, Nitroshure and ReaShure products due to strong dairy economics, which increased demand for our products. Global feed grade choline product sales increased $6,689 or 6.1% primarily due to increased volumes of choline products sourced from our Italian operation and sold into the European and other international markets. The Company experienced Industrial sales growth of $21,961 or 26.5% over the prior year predominately due to volume increases of various choline and choline derivatives used in North America industrial applications, most notably for shale fracking. Sales for industrial applications comprised approximately 37.2% of sales in the segment, as compared to 34.7% in 2013. Specialty Products segment sales were $54,053 for 2014, as compared with $51,086 for 2013, an increase of $2,967 or 5.8%. Increased sales of ethylene oxide products used for medical device sterilization were partially offset by lower sales volumes of propylene oxide products used for industrial applications.
17
Gross Margin
Gross margin for 2014 increased to $144,172 compared to $97,241 for 2013, an increase of $46,931 or 48.2% and was principally a result of higher sales volumes. Gross margin as a percentage of sales for 2014 decreased to 26.6% from 28.9% in the prior year comparative period. Gross margins for the SensoryEffects segment declined 10.8% in 2014 as compared to 2013. The acquired product lines within the SensoryEffects segment carry a lower gross margin and the valuation of acquired inventory to fair value increased cost of sales by $4,735. Gross margin percentage for the Animal Nutrition and Health segment was 21.0%, a slight decrease compared to 2013. A heavier weighting towards choline chloride products used in industrial applications as well as increases in certain petrochemical raw material costs were offset by operating efficiencies from higher volumes. Gross margin percentage for the Specialty Products segment was flat.
Operating Expenses
Operating expenses for 2014 were $62,029 or 11.5% of net sales as compared to $31,819 or 9.4% of net sales for 2013. The increase was primarily due to the Acquisition, including increased amortization expense of $15,072 related to the acquired intangible assets, and transaction and integration expenses of $3,652. Partially offsetting the increased expenses was a $2.9 million favorable net legal settlement. During 2014 and 2013, the Company spent $4,810 and $3,622 respectively, on research and development programs, most of which pertained to the Company’s SensoryEffects and Animal Nutrition & Health segments.
Earnings From Operations
Principally as a result of the above-noted details, earnings from operations for 2014 were $82,143 as compared to $65,602 for 2013, an increase of $16,541 or 25.2%. Earnings from operations as a percentage of sales (“operating margin”) for 2014 was 15.2% declining from 19.5% in 2013 primarily due to the aforementioned amortization expense associated with acquired intangible assets, the impact of the valuation of the acquired inventory, transaction and integration expenses and product mix; partially offset by the legal settlement. Excluding the impact of amortization expenses, valuation of the acquired inventory, and transaction and integration expenses and legal settlement, the earnings from operations were $106,022 or 19.6% of sales. The Company is continuing to focus on leveraging its plant capabilities, driving efficiencies from core volume growth, broadening product applications of human and animal health specialty products into both the domestic and international markets, as well as capitalizing logistically on the Company’s varied choline production capabilities. Earnings from operations for SensoryEffects were $21,260, an increase of $10,027 or 89.3% primarily due to increased sales from the Acquisition partially offset by increased amortization expense and the impact of the valuation of acquired inventory. Earnings from operations for Animal Nutrition & Health increased by $6,074 or 17.8% to $40,219, principally due to the aforementioned higher sales. Earnings from operations for the Specialty Products segment were $21,260 an increase of $1,092 or 5.4%.
Other Expenses (Income)
Interest expense for 2014 was $5,145 and is primarily related to the loans entered into on May 7, 2014 to finance the Acquisition of SensoryEffects. Interest income was $64 and $277 for 2014 and 2013, respectively. The Company has invested available cash primarily in certificates of deposit and money market investments that have been classified as cash equivalents due to the short maturities of these investments. Other expense was $10 and $37 for 2014 and 2013, respectively and is primarily the result of unfavorable fluctuations in foreign currency exchange rates between the US Dollar (the reporting currency) and foreign functional currencies.
Income Tax Expense
18
The Company’s effective tax rate for 2014 and 2013 was 31.4% and 31.8%, respectively. The decrease in the effective tax rate is primarily attributable to certain tax credits and a purchase price reduction related to the SensoryEffects acquisition.
Net Earnings
Principally as a result of the above-noted details, net earnings were $52,826 for 2014, as compared with $44,874 for 2013, an increase of 17.7%.
Fiscal Year 2013 compared to Fiscal Year 2012
(All amounts in thousands, except share and per share data)
Net Sales
Net sales for 2013 were $337,173 as compared with $310,393 for 2012, an increase of $26,780 or 8.6%. Net sales for the Specialty Products segment were $51,086 for 2013, as compared with $49,990 for 2012, an increase of $1,096 or 2.2%. Approximately 79% of this increase in sales was from propylene oxide products for use in industrial applications and nutmeat fumigation. The balance of the increased sales is principally a result of higher sales from ethylene oxide products for use in medical device sterilization. Net sales for the SensoryEffects segment were $47,569 for 2013 compared with $44,070 for 2012, an increase of $3,499 or 7.9%. This result was primarily due to a 10.2% increase in sales in the food sector, principally due to higher volumes and product mix of encapsulated ingredients for baking and food preservation end markets. Also contributing to the higher sales was an increase in sales of 28.2% for VitaShure
®
products for nutritional enhancement, including sustained release amino acid products for sports performance products. Net sales of $238,518 were realized for 2013 for the Animal Nutrition & Health segment, as compared with $216,333 for the prior year, an increase of $22,185 or 10.3%. The ANH specialty ingredients, largely targeted to the ruminant and companion animal markets, realized 6.6% sales growth from the prior year comparable period. The improvement was due to higher sales of non-AminoShure
®
products, which were up 22.5% compared with prior year, and were led by strong volume growth of ReaShure, NitroShure and chelated minerals. This was partially offset by lower volumes of AminoShure products, related mainly to the adverse impact of the previously announced suspension of sales of AminoShure–L, 52% lysine (the “Product”) in the second quarter of 2012. Global feed grade choline product sales increased by approximately 5.1% due to modest price increases, implemented globally, to partially offset increased raw material costs. The Company experienced increased sales of various choline and choline derivative products used for industrial applications, predominantly in North America, including usage in fracking for natural gas. Industrial sales grew 20.4% over the prior year with the increase coming primarily from higher volumes for usage in fracking. Sales for industrial applications comprised approximately 34.7% of the sales in this segment for 2013.
Gross Margin
Gross margin for 2013 increased to $97,421 compared to $89,539 for 2012, an increase of 8.8%. This $7,882 increase was principally a result of higher sales volumes. Gross margin percentage for 2013 increased to 28.9% as compared to 28.8% in the prior year comparative period, primarily due to operating efficiencies from higher volumes, which were partially offset by increases in certain key raw material costs. Gross margin percentage for the Specialty Products segment increased by 0.7% primarily due to product mix and operating efficiencies from higher volumes. Gross margin percentage in the SensoryEffects segment decreased by 2.3% primarily due to higher raw material costs for human choline products. Gross margin percentage in the Animal Nutrition and Health segment increased by 0.9%, principally due to operating efficiencies from increased volumes.
Operating Expenses
19
Operating expenses for 2013 were $31,819, as compared to $29,762 for 2012, an increase of $2,057 or 6.9%. This was principally due to an increase of employee headcount and additional compensation-related expenses totaling $1,039, higher outside services and professional fees of $277 and increased advertising of $238. Operating expenses were 9.4% of sales or 0.2 percentage points less than the operating expenses as a percentage of sales in the prior year. During 2013 and 2012, the Company spent $3,622 and $3,422 respectively, on research and development programs, most of which pertained to the Company’s SensoryEffects and Animal Nutrition & Health segments.
Earnings From Operations
Principally as a result of the above-noted details, earnings from operations for 2013 were $65,602 as compared to $59,777 for 2012, an increase of $5,825 or 9.7%. Earnings from operations as a percentage of sales (“operating margin”) for 2013 increased to 19.5% from 19.3% for 2012. The Company is continuing to focus on leveraging its plant capabilities, driving efficiencies from core volume growth, broadening product applications of human and animal health specialty products into both the domestic and international markets, as well as capitalizing logistically on the Company’s varied choline production capabilities. Earnings from operations for the Specialty Products segment were $20,224, a decrease of $108 or 0.5%, primarily due to certain higher operating expenses, which were partially offset by the above-noted higher sales of propylene oxide and operating efficiencies from increased volumes. Earnings from operations for SensoryEffects were $11,233, a decrease of $102 or 0.9%, due largely to the aforementioned higher raw material costs for human choline products, which were partially offset by the previously-noted higher sales. Earnings from operations for Animal Nutrition & Health increased by $6,035 or 21.5% to $34,145, principally due to the aforementioned higher sales and operating efficiencies from increased volumes, partially offset by certain higher operating expenses.
Other Expenses (Income)
Interest income for 2013 totaled $277 as compared to $10 for 2012. The Company has invested available cash primarily in certificates of deposit and money market investments that have been classified as cash equivalents due to the short maturities of these investments.
Interest expense was $24 for 2013 compared to $10 for 2012. Other expense of $37 for 2013 is primarily the result of unfavorable fluctuations in foreign currency exchange rates between the US Dollar (the reporting currency) and foreign functional currencies. Other income of $67 for 2012 is primarily the result of a favorable adjustment related to a prior year sale of a non-core calcium carbonate product line.
Income Tax Expense
The Company’s effective tax rate for 2013 and 2012 was 31.8% and 33.2%, respectively. This decrease in the effective tax rate is primarily attributable to the timing of certain tax credits and deductions.
Net Earnings
Principally as a result of the above-noted details, net earnings were $44,874 for 2013, as compared with $40,005 for 2012, an increase of 12.2%.
LIQUIDITY AND CAPITAL RESOURCES
(All amounts in thousands, except share and per share data)
Contractual Obligations
20
The Company's contractual obligations as of December 31, 2014, are summarized in the table below:
|
Payments due by period
|
||||||||||||||||||||
|
Contractual Obligations
|
Total
|
Less than 1
year
|
1-3
years
|
3-5
years
|
More than
5 years
|
|||||||||||||||
|
Operating lease obligations (1)
|
$
|
7,885
|
$
|
1,811
|
$
|
2,600
|
$
|
1,371
|
$
|
2,103
|
||||||||||
|
Purchase obligations (2)
|
19,588
|
19,588
|
-
|
-
|
-
|
|||||||||||||||
|
Debt (3)
|
332,500
|
35,000
|
70,000
|
227,500
|
-
|
|||||||||||||||
|
Total
|
$
|
359,973
|
$
|
56,399
|
$
|
72,600
|
$
|
228,871
|
$
|
2,103
|
||||||||||
| (1) | Principally includes obligations associated with future minimum non-cancelable operating lease obligations (including the headquarters office space entered into in 2002 and extended in 2012 for six (6) years) and warehouse space entered into in 2013 for three (3) years. |
| (2) | Principally includes open purchase orders with vendors for inventory not yet received or recorded on our balance sheet. |
| (3) | Consists of $332,500 senior secured term loan. |
The table above excludes a $5,205 liability for uncertain tax positions, including the related interest and penalties, recorded in accordance with ASC 740-10, as we are unable to reasonably estimate the timing of settlement, if any.
The Company knows of no current or pending demands on, or commitments for, its liquid assets that will materially affect its liquidity.
The Company expects its operations to continue generating sufficient cash flow to fund working capital requirements and necessary capital investments. The Company is actively pursuing additional acquisition candidates. The Company could seek additional bank loans or access to financial markets to fund such acquisitions, its operations, working capital, necessary capital investments or other cash requirements should it deem it necessary to do so.
Cash
Cash and cash equivalents decreased to $50,287 at December 31, 2014 from $208,747 at December 31, 2013 primarily resulting from the activity detailed below. At December 31, 2014, the Company had $10,805 of cash and cash equivalents held by our foreign subsidiaries. It is our intention to permanently reinvest these funds in our foreign operations by continuing to make additional plant related investments as needed and potentially invest in additional acquisitions; therefore, we do not currently expect to repatriate these funds in order to fund our U.S. operations or obligations. However, if these funds are needed for our operations in the U.S., we could be required to pay additional U.S. taxes to repatriate these funds. Working capital amounted to $85,780 at December 31, 2014 as compared to $242,021 at December 31, 2013, a decrease of $156,241.
Operating Activities
Cash flows from operating activities provided $85,350 for 2014 compared to $55,692 for 2013. The increase in cash flows from operating activities was primarily due to higher amortization and
21
depreciation adjustments, net earnings, and favorable working capital changes. This was partially offset by unfavorable changes in deferred income taxes.
Investing Activities
As previously noted, on May 7, 2014, the Company acquired SensoryEffects for a purchase price of approximately $494,000, including working capital. The Company continues to invest in projects across all production facilities and capital expenditures were $13,199 and 8,187 for the year ended December 31, 2014 and 2013, respectively. In 2014,
larger
capital expenditures of $4,833 were related to expanding of the Company’s Animal Nutrition & Health capacity in the manufacturing facility in Verona, Missouri. In 2013, capital expenditures
of
$3,341
were
for the new manufacturing facility in Covington, Virginia.
Financing Activities
On May 7, 2014, the Company and a bank syndicate entered into a loan agreement providing for a senior secured term loan of $350,000 and revolving loan of $100,000. The term loan and $50,000 of the revolving loan were used to fund the Acquisition of SensoryEffects and for general corporate purposes. The Company has made debt payments of $67,500 related to these loans and has $100,000 available under the revolving loan. Additionally, on May 7, 2014, the Company made a payment of $75,550 to SensoryEffects’ lenders to pay off all SensoryEffects bank debt.
The Company has an approved stock repurchase program. The total authorization under this program is 3,763,038 shares. Since the inception of the program in June 1999, a total of 2,105,231 shares have been purchased, none of which remained in treasury at December 31, 2014. During the year ended December 31, 2014, a total of 17,497 shares have been purchased at an average cost of $61.06 per share. The Company intends to acquire shares from time to time at prevailing market prices if and to the extent it deems it advisable to do so based on its assessment of corporate cash flow, market conditions and other factors.
Proceeds from stock options exercised and restricted shares purchased totaled $9,106, $9,082 and $1,905 for 2014, 2013 and 2012, respectively. Dividend payments were $7,856, $-0-, and $11,703 for 2014, 2013 and 2012, respectively. $6,466, or $0.22 per share, of the 2012 dividend payments represents an accelerated dividend in 2012 that would normally have been paid in the first quarter of 2013, but was accelerated due to the anticipated increase in the federal tax on dividends paid after December 31, 2012.
Other Matters Impacting Liquidity
The Company currently provides postretirement benefits in the form of a retirement medical plan under a collective bargaining agreement covering eligible retired employees of its Verona, Missouri facility. The amount recorded on the Company’s balance sheet as of December 31, 2014 for this obligation is $1,111.
The postretirement plan is not funded. Historical cash payments made under such plan have typically been less than $100 per year.
Critical Accounting Policies
Management of the Company is required to make certain estimates and assumptions during the preparation of consolidated financial statements in accordance with accounting principles generally accepted in the United States of America. These estimates and assumptions impact the reported amount of assets and liabilities and disclosures of contingent assets and liabilities as of the date of the consolidated financial statements. Estimates and assumptions are reviewed periodically and the effects of revisions are reflected in the consolidated financial statements in the period they are determined to be necessary. Actual results could differ from those estimates.
The Company’s “critical accounting policies” are those that require application of management's most difficult, subjective or complex judgments, often as a result of the need to make estimates about the
22
effect of matters that are inherently uncertain and that may change in subsequent periods. Management considers the following accounting policies to be critical.
Revenue Recognition
Revenue for each of our business segments is recognized upon product shipment, passage of title and risk of loss, and when collection is reasonably assured. The Company reports amounts billed to customers related to shipping and handling as revenue and includes costs incurred for shipping and handling in cost of sales. Amounts received for unshipped merchandise are not recognized as revenue but rather they are recorded as customer deposits and are included in current liabilities. In instances of shipments made on consignment, revenue is deferred until a customer indicates to the Company that it has used the Company’s products. The Company does not charge its customers rental fees on cylinders or drums used to ship its products.
Inventories
Inventories are valued at the lower of cost (first in, first out or average) or market value and have been reduced by an allowance for excess or obsolete inventories. The
write-down of potentially obsolete or slow-moving inventory is recorded based on management’s assumptions about future demand and market conditions.
Long-lived assets
Long-lived assets, such as property, plant, and equipment and intangible assets with finite lives, are reviewed for impairment whenever events or changes in circumstances indicate that the carrying amount of an asset may not be recoverable. Recoverability of assets to be held and used is measured by a comparison of the carrying amount of an asset to estimated undiscounted future cash flows expected to be generated by the asset. If the carrying amount of an asset exceeds its estimated future cash flows, an impairment charge is recognized by the amount by which the carrying amount of the asset exceeds the fair value of the asset, which is generally based on discounted cash flows. For the year ended December 31, 2014, there were no triggering events which required asset impairment reviews.
Goodwill represents the excess of costs over fair value of assets of businesses acquired. ASC 350, “Intangibles-Goodwill and Other,” requires the use of the acquisition method of accounting for a business combination and defines an intangible asset. Goodwill and intangible assets acquired in a business combination and determined to have an indefinite useful life are not amortized, but are instead assessed for impairment annually and more frequently if events and circumstances indicate that the asset might be impaired, in accordance with the provisions of ASC 350. The Company performed its annual test as of October 1. ASC 350 also requires that intangible assets with estimable useful lives be amortized over their respective estimated useful lives to their estimated residual values, and reviewed for impairment if events and circumstances indicate that the asset might be impaired.
As of December 31, 2012, the Company adopted
ASU No. 2011-08, “Intangibles—Goodwill and Other (Topic 350): Testing Goodwill for Impairment” (“ASU 2011-08”).
The Company first assesses qualitative factors to determine whether it is “more likely than not” (i.e. a likelihood of more than 50%) that the fair values of our reporting units are less than their respective carrying amounts, including goodwill, as a basis for determining whether it is necessary to perform the two step goodwill impairment test. If determined to be necessary, the two step impairment test shall be used to identify potential goodwill impairment and measure the amount of a goodwill impairment loss to be recognized (if any). The Company has an unconditional option to bypass the qualitative assessment and proceed directly to performing the first step of the goodwill impairment test.
As of October 1, 2014 and 2013, the Company opted to bypass the qualitative assessment and proceeded directly to performing the first step of the goodwill impairment test. We assessed the fair values of our reporting units by utilizing the income approach, based on a discounted cash flow valuation model as
23
the basis for our conclusions. Our estimates of future cash flows included significant management assumptions such as revenue growth rates, operating margins, discount rates, estimated terminal values and future economic and market conditions. Our assessment concluded that the fair values of the three reporting units exceeded their carrying amounts, including goodwill. Accordingly, the goodwill of the three reporting units was not considered impaired. The Company may resume performing the qualitative assessment in subsequent periods.
As of October 1, 2012, the Company performed a qualitative assessment of whether there was an indication that goodwill was impaired. In connection therewith, the Company determined that it was not “more likely than not” that the fair values of its three reporting units are less than their respective carrying amounts, including goodwill. Accordingly the Company was not required to perform any further impairment tests.
Accounts Receivable
We market our products to a diverse customer base, principally throughout the United States, Europe, and Asia. We grant credit terms in the normal course of business to our customers. We perform on-going credit evaluations of our customers and adjust credit limits based upon payment history and the customer's current credit worthiness, as determined through review of their current credit information. We continuously monitor collections and payments from customers and maintain allowances for doubtful accounts for estimated losses resulting from the inability of our customers to make required payments. Estimated losses are based on historical experience and any specific customer collection issues identified. If the financial condition of our customers were to deteriorate resulting in an impairment of their ability to make payments, additional allowances and related bad debt expense may be required.
Post-employment Benefits
The Company provides life insurance and health care benefits for certain eligible retirees and health care benefits for certain retirees’ eligible survivors. The costs and obligations related to these benefits reflect the Company’s assumptions as to general economic conditions and health care cost trends. The cost of providing plan benefits also depends on demographic assumptions including retirements, mortality, turnover, and plan participation. If actual experience differs from these assumptions, the cost of providing these benefits could increase or decrease.
In accordance with ASC 715, “Compensation—Retirement Benefits,” the Company is required to recognize the over funded or under funded status of a defined benefit post retirement plan (other than a multiemployer plan) as an asset or liability in its statement of financial position, and to recognize changes in that funded status in the year in which the changes occur through comprehensive income.
Intangible Assets with Finite Lives
The useful life of an intangible asset is based on the Company’s assumptions regarding expected use of the asset; the relationship of the intangible asset to another asset or group of assets; any legal, regulatory or contractual provisions that may limit the useful life of the asset or that enable renewal or extension of the asset’s legal or contractual life without substantial cost; the effects of obsolescence, demand, competition and other economic factors; and the level of maintenance expenditures required to obtain the expected future cash flows from the asset and their related impact on the asset’s useful life. If events or circumstances indicate that the life of an intangible asset has changed, it could result in higher future amortization charges or recognition of an impairment loss.
Income Taxes
Income taxes are accounted for under the asset and liability method. Deferred tax assets and liabilities are recognized for the future tax consequences attributable to differences between the financial statement carrying amounts of existing assets and liabilities and their respective tax bases and operating loss and tax credit carryforwards. Deferred tax assets and liabilities are measured using enacted tax rates
24
expected to apply to taxable income in the years in which those temporary differences are expected to be recovered or settled. The effect on deferred tax assets and liabilities of a change in tax rates is recognized in earnings in the period that includes the enactment date.
The Company regularly reviews its deferred tax assets for recoverability and would establish a valuation allowance if it believed that such assets may not be recovered, taking into consideration historical operating results, expectations of future earnings, changes in its operations and the expected timing of the reversals of existing temporary differences.
We account for uncertainty in income taxes utilizing ASC 740-10. ASC 740-10 clarifies whether or not to recognize assets or liabilities for tax positions taken that may be challenged by a tax authority. It prescribes a recognition threshold and measurement attribute for financial statement disclosure of tax positions taken or expected to be taken. This interpretation also provides guidance on derecognition, classification, interest and penalties, accounting in interim periods, and disclosures. The application of
ASC 740-10
requires judgment related to the uncertainty in income taxes and could impact our effective tax rate.
Stock-based Compensation
We account for stock-based compensation in accordance with the provisions of ASC 718, “Compensation-Stock Compensation.” Under the fair value recognition provisions of this statement, share-based compensation cost is measured at the grant date based on the value of the award and is recognized as expense over the vesting period. Determining the fair value of share-based awards at the grant date requires judgment, including estimating our stock price volatility, employee stock option exercise behaviors and employee option forfeiture rates. Expected volatilities are based on historical volatility of the Company’s stock. The expected term of the options is based on the Company’s historical experience of employees’ exercise behavior. As stock-based compensation expense recognized in the Consolidated Statements of Earnings is based on awards ultimately expected to vest, the amount of expense has been reduced for estimated forfeitures. ASC 718 requires forfeitures to be estimated at the time of grant and revised, if necessary, in subsequent periods if actual forfeitures differ from those estimates. Forfeitures were estimated based on historical experience. If factors change and we employ different assumptions in the application of ASC 718, the compensation expense that we record in future periods may differ significantly from what we have recorded in the current period. See Note 3 in Notes to Consolidated Financial Statements for additional information.
|
Item7A.
|
Quantitative and Qualitative Disclosures About Market Risk
|
Cash and cash equivalents are held primarily in money market investment funds. The Company has no derivative financial instruments or derivative commodity instruments, nor does the Company have any financial instruments entered into for trading or hedging purposes. As of December 31, 2014, the Company had borrowings of $332,500. The Company is exposed to market risks for changes in foreign currency rates and has exposure to commodity price risks, including prices of our primary raw materials. Our objective is to seek a reduction in the potential negative earnings impact of changes in foreign exchange rates and raw material pricing arising in our business activities. The Company manages these financial exposures, where possible, through pricing and operational means. Our practices may change as economic conditions change.
25
| Item 8. | Financial Statements and Supplementary Data |
|
Index to Financial Statements and Supplementary Data:
|
Page
|
|
Report of Independent Registered Public Accounting Firm
|
27
|
|
Consolidated Balance Sheets as of December 31, 2014 and 2013
|
29
|
|
Consolidated Statements of Earnings for the years ended December 31, 2014, 2013 and 2012
|
30
|
|
Consolidated Statements of Comprehensive Income for the years ended December 31, 2014, 2013 and 2012
|
31
|
|
Consolidated Statements of Stockholders' Equity for the years ended December 31, 2014, 2013 and 2012
|
32
|
|
Consolidated Statements of Cash Flows for the years ended December 31, 2014, 2013 and 2012
|
33
|
|
Notes to Consolidated Financial Statements
|
34
|
|
Schedule II – Valuation and Qualifying Accounts for the years ended December 31, 2014, 2013 and 2012
|
55
|
26
REPORT OF INDEPENDENT REGISTERED PUBLIC ACCOUNTING FIRM
To the Board of Directors and Stockholders
Balchem Corporation
We have audited the accompanying consolidated balance sheets of Balchem Corporation and Subsidiaries as of December 31, 2014 and 2013, and the related consolidated statements of earnings, comprehensive income, stockholders' equity and cash flows for each of the three years in the period ended December 31, 2014, and the financial statement schedule of Balchem Corporation listed in the Index at Item 8. We also have audited Balchem Corporation’s internal control over financial reporting as of December 31, 2014, based on criteria established in
Internal Control—Integrated Framework
issued by the Committee of Sponsoring Organizations of the Treadway Commission in 2013. Balchem Corporation's management is responsible for these financial statements and financial statement schedule, for maintaining effective internal control over financial reporting, and for its assessment of the effectiveness of internal control over financial reporting included in the accompanying Management’s Report on Internal Control Over Financial Reporting. Our responsibility is to express an opinion on these financial statements and an opinion on the Company's internal control over financial reporting based on our audits.
We conducted our audits in accordance with the standards of the Public Company Accounting Oversight Board (United States). Those standards require that we plan and perform the audits to obtain reasonable assurance about whether the financial statements are free of material misstatement and whether effective internal control over financial reporting was maintained in all material respects. Our audits of the financial statements included examining, on a test basis, evidence supporting the amounts and disclosures in the financial statements, assessing the accounting principles used and significant estimates made by management, and evaluating the overall financial statement presentation. Our audit of internal control over financial reporting included obtaining an understanding of internal control over financial reporting, assessing the risk that a material weakness exists, and testing and evaluating the design and operating effectiveness of internal control based on the assessed risk. Our audits also included performing such other procedures as we considered necessary in the circumstances. We believe that our audits provide a reasonable basis for our opinions.
A company's internal control over financial reporting is a process designed to provide reasonable assurance regarding the reliability of financial reporting and the preparation of financial statements for external purposes in accordance with generally accepted accounting principles. A company's internal control over financial reporting includes those policies and procedures that
(a)
pertain to the maintenance of records that, in reasonable detail, accurately and fairly reflect the transactions and dispositions of the assets of the company;
(b)
provide reasonable assurance that transactions are recorded as necessary to permit preparation of financial statements in accordance with generally accepted accounting principles, and that receipts and expenditures of the company are being made only in accordance with authorizations of management and directors of the company; and
(c)
provide reasonable assurance regarding prevention or timely detection of unauthorized acquisition, use, or disposition of the company's assets that could have a material effect on the financial statements.
Because of its inherent limitations, internal control over financial reporting may not prevent or detect misstatements. Also, projections of any evaluation of effectiveness to future periods are subject to the risk that controls may become inadequate because of changes in conditions, or that the degree of compliance with the policies or procedures may deteriorate.
In our opinion, the consolidated financial statements referred to above present fairly, in all material respects, the financial position of Balchem Corporation and Subsidiaries as of December 31, 2014 and 2013, and the results of their operations and their cash flows for each of the years in the three-year period ended December 31, 2014, in conformity with accounting principles generally accepted in the United States of America, and, in our opinion, the related financial statement schedule, when considered in relation to the basic consolidated financial statements taken as a whole, presents fairly in all material respects the information set forth therein. Also in our opinion, Balchem Corporation maintained, in all material respects, effective internal control over financial reporting as of December 31, 2014, based on criteria
27
established in
Internal Control—Integrated Framework
issued by the Committee of Sponsoring Organizations of the Treadway Commission in 2013.
Balchem Corporation completed an acquisition of 100 percent of the outstanding common shares of Performance Chemicals & Ingredients Company (d/b/a SensoryEffects) effective May 7, 2014. Management’s Report on Internal Control Over Financial Reporting as of December 31, 2014 excluded from its assessment of the effectiveness of Balchem Corporation’s internal control over financial reporting the operations of Performance Chemicals & Ingredients Company representing total assets of $636,130,000 and total revenues of $156,192,000 included in the consolidated financial statements of Balchem Corporation and Subsidiaries as of and for the year ended December 31, 2014. Our audit of internal control over financial reporting of Balchem Corporation and Subsidiaries also excluded an evaluation of the effectiveness of internal control over financial reporting of Performance Chemicals & Ingredients Company.
New York, New York
February 27, 2015
28
BALCHEM CORPORATION
Consolidated Balance Sheets
December 31, 2014 and 2013
(Dollars in thousands, except share and per share data)
|
2014
|
2013
|
|||||||
|
Current assets:
|
||||||||
|
Cash and cash equivalents
|
$
|
50,287
|
$
|
208,747
|
||||
|
Accounts receivable, net of allowance for doubtful accounts of $288 and $115 at December 31, 2014 and 2013, respectively
|
71,982
|
39,386
|
||||||
|
Inventories
|
49,623
|
24,824
|
||||||
|
Prepaid expenses
|
4,545
|
2,580
|
||||||
|
Prepaid income taxes
|
-
|
899
|
||||||
|
Deferred income taxes
|
1,390
|
893
|
||||||
|
Other current assets
|
3,475
|
445
|
||||||
|
Total current assets
|
181,302
|
277,774
|
||||||
|
Property, plant and equipment, net
|
131,588
|
54,916
|
||||||
|
Goodwill
|
383,646
|
28,515
|
||||||
|
Intangible assets with finite lives, net
|
160,394
|
15,126
|
||||||
|
Other assets
|
4,341
|
541
|
||||||
|
Total assets
|
$
|
861,271
|
$
|
376,872
|
||||
|
Liabilities and Stockholders' Equity
|
||||||||
|
Current liabilities:
|
||||||||
|
Trade accounts payable
|
$
|
24,352
|
$
|
12,395
|
||||
|
Accrued expenses
|
15,614
|
10,732
|
||||||
|
Accrued compensation and other benefits
|
9,137
|
4,770
|
||||||
|
Dividends payable
|
9,251
|
7,856
|
||||||
|
Income taxes payable
|
2,168
|
-
|
||||||
|
Current portion of long-term debt
|
35,000
|
-
|
||||||
|
Total current liabilities
|
95,522
|
35,753
|
||||||
|
Long-term debt
|
297,500
|
-
|
||||||
|
Deferred income taxes
|
70,401
|
5,884
|
||||||
|
Other long-term obligations
|
5,950
|
3,877
|
||||||
|
Total liabilities
|
469,373
|
45,514
|
||||||
|
Commitments and contingencies (note 11)
|
||||||||
|
Stockholders' equity:
|
||||||||
|
Preferred stock, $25 par value. Authorized 2,000,000 shares; none issued and outstanding
|
-
|
-
|
||||||
|
Common stock, $.0667 par value. Authorized 60,000,000 shares; 30,845,586 shares issued and outstanding at December 31, 2014 and 30,225,763 shares issued and outstanding at December 31, 2013
|
2,058
|
2,016
|
||||||
|
Additional paid-in capital
|
97,289
|
77,517
|
||||||
|
Retained earnings
|
295,202
|
251,627
|
||||||
|
Accumulated other comprehensive (loss)/income
|
(2,651
|
)
|
198
|
|||||
|
Total stockholders' equity
|
391,898
|
331,358
|
||||||
|
Total liabilities and stockholders' equity
|
$
|
861,271
|
$
|
376,872
|
||||
29
BALCHEM CORPORATION
Consolidated Statements of Earnings
Years Ended December 31, 2014, 2013 and 2012
(In thousands, except per share data)
|
2014
|
2013
|
2012
|
||||||||||
|
Net sales
|
$
|
541,383
|
$
|
337,173
|
$
|
310,393
|
||||||
|
Cost of sales
|
397,211
|
239,752
|
220,854
|
|||||||||
|
Gross margin
|
144,172
|
97,421
|
89,539
|
|||||||||
|
Operating expenses:
|
||||||||||||
|
Selling expenses
|
35,758
|
15,920
|
15,934
|
|||||||||
|
Research and development expenses
|
4,810
|
3,622
|
3,422
|
|||||||||
|
General and administrative expenses
|
21,461
|
12,277
|
10,406
|
|||||||||
|
62,029
|
31,819
|
29,762
|
||||||||||
|
Earnings from operations
|
82,143
|
65,602
|
59,777
|
|||||||||
|
Other expenses (income):
|
||||||||||||
|
Interest income
|
(64
|
)
|
(277
|
)
|
(10
|
)
|
||||||
|
Interest expense
|
5,145
|
24
|
10
|
|||||||||
|
Other, net
|
10
|
37
|
(67
|
)
|
||||||||
|
Earnings before income tax expense
|
77,052
|
65,818
|
59,844
|
|||||||||
|
Income tax expense
|
24,226
|
20,944
|
19,839
|
|||||||||
|
Net earnings
|
$
|
52,826
|
$
|
44,874
|
$
|
40,005
|
||||||
|
Basic net earnings per common share
|
$
|
1.74
|
$
|
1.51
|
$
|
1.38
|
||||||
|
Diluted net earnings per common share
|
$
|
1.69
|
$
|
1.45
|
$
|
1.32
|
||||||
30
BALCHEM CORPORATION
Consolidated Statements of Comprehensive Income
Years Ended December 31, 2014, 2013 and 2012
(In thousands)
|
2014
|
2013
|
2012
|
||||||||||
|
Net earnings
|
$
|
52,826
|
$
|
44,874
|
$
|
40,005
|
||||||
|
Other comprehensive (loss)/income, net of tax:
|
||||||||||||
|
Net foreign currency translation adjustment
|
(2,972
|
)
|
856
|
342
|
||||||||
|
Net change in postretirement benefit plan, net of taxes of $56,$60, and $86 at December 31, 2014, 2013, and 2012, respectively
|
123
|
101
|
(163
|
)
|
||||||||
|
Other comprehensive (loss)/income
|
(2,849
|
)
|
957
|
179
|
||||||||
|
Comprehensive income
|
$
|
49,977
|
$
|
45,831
|
$
|
40,184
|
||||||
31
BALCHEM CORPORATION
Consolidated Statements of Stockholders' Equity
Years Ended December 31, 2014, 2013 and 2012
(Dollars in thousands, except share and per share data)
|
Total
Stockholders'
|
Retained
|
Accumulated
Other
|
Common Stock
|
Treasury Stock
|
Additional
Paid-in
|
|||||||||||||||||||||||||||
|
Equity
|
Earnings
|
Income (Loss)
|
Shares
|
Amount
|
Shares
|
Amount
|
Capital
|
|||||||||||||||||||||||||
|
Balance - December 31, 2011
|
$
|
232,009
|
$
|
181,070
|
$
|
(938
|
)
|
29,165,721
|
$
|
1,944
|
-
|
$
|
-
|
$
|
49,933
|
|||||||||||||||||
|
Net earnings
|
40,005
|
40,005
|
-
|
-
|
-
|
-
|
-
|
-
|
||||||||||||||||||||||||
|
Other comprehensive income
|
179
|
-
|
179
|
-
|
-
|
-
|
-
|
-
|
||||||||||||||||||||||||
|
Dividends ($.22 per share)
|
(6,466
|
)
|
(6,466
|
)
|
-
|
-
|
-
|
-
|
-
|
-
|
||||||||||||||||||||||
|
Treasury shares purchased
|
(1,699
|
)
|
-
|
-
|
-
|
-
|
(43,680
|
)
|
(1,699
|
)
|
-
|
|||||||||||||||||||||
|
Shares issued under employeebenefitplansand other
|
311
|
-
|
-
|
10,145
|
1
|
-
|
-
|
310
|
||||||||||||||||||||||||
|
Shares and options issued under stock plans and an income tax benefit of $2,862
|
8,673
|
-
|
-
|
278,305
|
19
|
43,680
|
1,699
|
6,955
|
||||||||||||||||||||||||
|
Balance - December 31, 2012
|
273,012
|
214,609
|
(759
|
)
|
29,454,171
|
1,964
|
-
|
-
|
57,198
|
|||||||||||||||||||||||
|
Net earnings
|
44,874
|
44,874
|
-
|
-
|
-
|
-
|
-
|
-
|
||||||||||||||||||||||||
|
Other comprehensive income
|
957
|
-
|
957
|
-
|
-
|
-
|
-
|
-
|
||||||||||||||||||||||||
|
Dividends ($.26 per share)
|
(7,856
|
)
|
(7,856
|
)
|
-
|
-
|
-
|
-
|
-
|
-
|
||||||||||||||||||||||
|
Treasury shares purchased
|
(1,925
|
)
|
-
|
-
|
-
|
-
|
(33,566
|
)
|
(1,925
|
)
|
-
|
|||||||||||||||||||||
|
Shares and options issued under stock plans and an income tax benefit of $9,397
|
22,296
|
-
|
-
|
771,592
|
52
|
33,566
|
1,925
|
20,319
|
||||||||||||||||||||||||
|
Balance - December 31, 2013
|
331,358
|
251,627
|
198
|
30,225,763
|
2,016
|
-
|
-
|
77,517
|
||||||||||||||||||||||||
|
Net earnings
|
52,826
|
52,826
|
-
|
-
|
-
|
-
|
-
|
-
|
||||||||||||||||||||||||
|
Other comprehensive loss
|
(2,849
|
)
|
-
|
(2,849
|
)
|
-
|
-
|
-
|
-
|
-
|
||||||||||||||||||||||
|
Dividends ($.30 per share)
|
(9,251
|
)
|
(9,251
|
)
|
-
|
-
|
-
|
-
|
-
|
-
|
||||||||||||||||||||||
|
Treasury shares purchased
|
(1,068
|
)
|
-
|
-
|
-
|
-
|
(17,497
|
)
|
(1,068
|
)
|
-
|
|||||||||||||||||||||
|
Shares and options issued under stock plans and
|
||||||||||||||||||||||||||||||||
|
an income tax benefit of $7,220
|
20,882
|
-
|
-
|
619,823
|
42
|
17,497
|
1,068
|
19,772
|
||||||||||||||||||||||||
|
Balance - December 31, 2014
|
$
|
391,898
|
$
|
295,202
|
$
|
(2,651
|
)
|
30,845,586
|
$
|
2,058
|
-
|
$
|
-
|
$
|
97,289
|
|||||||||||||||||
32
BALCHEM CORPORATION
Consolidated Statements of Cash Flows
Years Ended December 31, 2014, 2013 and 2012
(In thousands)
|
2014
|
2013
|
2012
|
||||||||||
|
Cash flows from operating activities:
|
||||||||||||
|
Net earnings
|
$
|
52,826
|
$
|
44,874
|
$
|
40,005
|
||||||
|
Adjustments to reconcile net earnings to net cash provided by operating activities:
|
||||||||||||
|
Depreciation and amortization
|
30,524
|
10,474
|
9,641
|
|||||||||
|
Stock compensation expense
|
4,557
|
3,817
|
3,906
|
|||||||||
|
Shares issued under employee benefit plans
|
-
|
-
|
311
|
|||||||||
|
Deferred income taxes
|
(11,259
|
)
|
(315
|
)
|
(92
|
)
|
||||||
|
Provision for doubtful accounts
|
238
|
-
|
57
|
|||||||||
|
Foreign currency transaction loss
|
105
|
92
|
88
|
|||||||||
|
Loss on disposal of assets
|
150
|
-
|
-
|
|||||||||
|
Changes in assets and liabilities, net of acquired balances
|
||||||||||||
|
Accounts receivable
|
(8,395
|
)
|
2,958
|
(7,642
|
)
|
|||||||
|
Inventories
|
6,698
|
(3,942
|
)
|
(1,979
|
)
|
|||||||
|
Prepaid expenses and other current assets
|
(848
|
)
|
495
|
(387
|
)
|
|||||||
|
Accounts payable and accrued expenses
|
7,747
|
(2,770
|
)
|
5,775
|
||||||||
|
Income taxes
|
3,370
|
(620
|
)
|
3,890
|
||||||||
|
Other
|
(363
|
)
|
629
|
208
|
||||||||
|
Net cash provided by operating activities
|
85,350
|
55,692
|
53,781
|
|||||||||
|
Cash flows from investing activities:
|
||||||||||||
|
Capital expenditures
|
(13,199
|
)
|
(8,187
|
)
|
(13,883
|
)
|
||||||
|
Cash paid for acquisition, net of cash acquired
|
(491,057
|
)
|
-
|
-
|
||||||||
|
Proceeds from sale of property, plant and equipment
|
1
|
40
|
-
|
|||||||||
|
Intangible assets acquired
|
(169
|
)
|
(230
|
)
|
(121
|
)
|
||||||
|
Net cash used in investing activities
|
(504,424
|
)
|
(8,377
|
)
|
(14,004
|
)
|
||||||
|
Cash flows from financing activities:
|
||||||||||||
|
Proceeds from long-term debt
|
350,000
|
-
|
178
|
|||||||||
|
Principal payments on long-term debt
|
(17,500
|
)
|
-
|
(1,386
|
)
|
|||||||
|
Proceeds from revolving loan
|
50,000
|
-
|
-
|
|||||||||
|
Principal payments on revolving loan
|
(50,000
|
)
|
-
|
-
|
||||||||
|
Principal payment on acquired debt
|
(75,550
|
)
|
||||||||||
|
Cash paid for financing costs
|
(2,593
|
)
|
-
|
-
|
||||||||
|
Repayments of short-term obligations
|
(89
|
)
|
(89
|
)
|
-
|
|||||||
|
Proceeds from stock options exercised
|
9,106
|
9,082
|
1,905
|
|||||||||
|
Excess tax benefits from stock compensation
|
7,220
|
9,397
|
2,862
|
|||||||||
|
Dividends paid
|
(7,856
|
)
|
-
|
(11,703
|
)
|
|||||||
|
Purchase of treasury stock
|
(1,068
|
)
|
(1,925
|
)
|
(1,699
|
)
|
||||||
|
Net cash provided by (used in) financing activities
|
261,670
|
16,465
|
(9,843
|
)
|
||||||||
|
Effect of exchange rate changes on cash
|
(1,056
|
)
|
230
|
22
|
||||||||
|
Increase/(Decrease) in cash and cash equivalents
|
(158,460
|
)
|
64,010
|
29,956
|
||||||||
|
Cash and cash equivalents beginning of period
|
208,747
|
144,737
|
114,781
|
|||||||||
|
Cash and cash equivalents end of period
|
$
|
50,287
|
$
|
208,747
|
$
|
144,737
|
||||||
|
Supplemental Cash Flow Information - see Note 15
|
||||||||||||
33
BALCHEM CORPORATION
Notes to Consolidated Financial Statements
(All amounts in thousands, except share and per share data)
Business Description
Balchem Corporation (including, unless the context otherwise requires, its wholly-owned subsidiaries, Performance Chemicals & Ingredients Company (d/b/a SensoryEffects), BCP Ingredients, Inc., Aberco, Inc., Balchem BV, Balchem Trading BV, and Balchem Italia Srl (“Balchem” or the “Company”)), incorporated in the State of Maryland in 1967, is engaged in the development, manufacture and marketing of specialty performance ingredients and products for the food, nutritional, feed, pharmaceutical and medical sterilization industries. As of December 31, 2013, Balchem Trading BV was merged into Balchem Italia Srl.
Principles of Consolidation
The consolidated financial statements include the financial statements of the Company and its subsidiaries. All significant intercompany balances and transactions have been eliminated in consolidation.
Revenue Recognition
Revenue for each of our business segments is recognized upon product shipment, passage of title and risk of loss, and when collection is reasonably assured. The Company reports amounts billed to customers related to shipping and handling as revenue and includes costs incurred for shipping and handling in cost of sales. Amounts received for unshipped merchandise are not recognized as revenue but rather they are recorded as customer deposits and are included in current liabilities. In instances of shipments made on consignment, revenue is deferred until a customer indicates to the Company that it has used the Company’s products. The Company does not charge its customers rental fees on cylinders or drums used to ship its products.
Cash and Cash Equivalents
The Company considers all highly liquid investments with a maturity of three months or less to be cash equivalents. The Company has
funds in its cash accounts that are with third party financial institutions, primarily in certificates of deposit and money market funds. The Company’s U.S. cash balances at these financial institutions exceed the Federal Deposit Insurance Corporation (“FDIC”) insurance limits.
Accounts Receivable
Credit terms are granted in the normal course of business to our customers. On-going credit evaluations are performed on our customers and credit limits are adjusted based upon payment history and the customer's current credit worthiness, as determined through review of their current credit information. Collections and payments from customers are continuously monitored and allowances for doubtful accounts for estimated losses resulting from the inability of our customers to make required payments are maintained. Estimated losses are based on historical experience and any specific customer collection issues identified.
Inventories
Inventories are valued at the lower of cost (first in, first out or average) or market value and have been reduced by an allowance for excess or obsolete inventories. Cost elements include material, labor and manufacturing overhead.
Property, Plant and Equipment and Depreciation
34
Property, plant and equipment are stated at cost. Depreciation of plant and equipment is calculated using the straight-line method over the estimated useful lives of the assets as follows:
|
Buildings
|
15-25
years
|
|
Equipment
|
2-28 years
|
Expenditures for repairs and maintenance are charged to expense. Alterations and major overhauls that extend the lives or increase the capacity of plant assets are capitalized. When assets are retired or otherwise disposed of, the cost of the assets and the related accumulated depreciation are removed from the accounts and any resultant gain or loss is included in earnings.
Business Concentrations
Financial instruments that subject the Company to credit risk consist primarily of certificates of deposit, money market investments and accounts receivable. Investments are managed within established guidelines to mitigate risks. Accounts receivable subject the Company to credit risk partially due to the concentration of amounts due from customers. The Company extends credit to its customers based upon an evaluation of the customers’ financial condition and credit histories. The majority of the Company’s customers are major national or international corporations. In 2014, 2013 and 2012, no customer accounted for more than 10% of total net sales.
Goodwill and Acquired Intangible Assets
Goodwill represents the excess of costs over fair value of assets of businesses acquired. ASC 350, “Intangibles-Goodwill and Other,” requires the use of the acquisition method of accounting for a business combination and defines an intangible asset. Goodwill and intangible assets acquired in a business combination and determined to have an indefinite useful life are not amortized, but are instead assessed for impairment annually and more frequently if events and circumstances indicate that the asset might be impaired, in accordance with the provisions of ASC 350. The Company performs its annual test as of October 1. ASC 350 also requires that intangible assets with estimable useful lives be amortized over their respective estimated useful lives to their estimated residual values, and reviewed for impairment if events and circumstances indicate that the asset might be impaired.
As of December 31, 2012, the Company adopted
ASU No. 2011-08, “Intangibles—Goodwill and Other (Topic 350): Testing Goodwill for Impairment” (“ASU 2011-08”).
The Company first assesses qualitative factors to determine whether it is “more likely than not” (i.e. a likelihood of more than 50%) that the fair values of our reporting units are less than their respective carrying amounts, including goodwill, as a basis for determining whether it is necessary to perform the two step goodwill impairment test. If determined to be necessary, the two step impairment test shall be used to identify potential goodwill impairment and measure the amount of a goodwill impairment loss to be recognized (if any). The Company has an unconditional option to bypass the qualitative assessment and proceed directly to performing the first step of the goodwill impairment test.
As of October 1, 2014 and 2013, the Company opted to bypass the qualitative assessment and proceeded directly to performing the first step of the goodwill impairment test. We assessed the fair values of our reporting units by utilizing the income approach, based on a discounted cash flow valuation model as the basis for our conclusions. Our estimates of future cash flows included significant management assumptions such as revenue growth rates, operating margins, discount rates, estimated terminal values and future economic and market conditions. Our assessment concluded that the fair values of the three reporting units exceeded their carrying amounts, including goodwill. Accordingly, the goodwill of the three reporting units is not considered impaired. The Company may resume performing the qualitative assessment in subsequent periods.
The Company had unamortized goodwill in the amount of $383,646 and $28,515 at December 31, 2014 and December 31, 2013, respectively, subject to the provisions of ASC 350. Unamortized goodwill is allocated to the Company’s reportable segments as follows:
|
2014
|
2013
|
|||||||
|
Specialty Products
|
$
|
7,160
|
$
|
7,160
|
||||
35
|
SensoryEffects
|
363,524
|
8,393
|
||||||
|
Animal Nutrition and Health
|
12,962
|
12,962
|
||||||
|
Total
|
$
|
383,646
|
$
|
28,515
|
The following intangible assets with finite lives are stated at cost and are amortized either on an accelerated basis or on a straight-line basis over the following estimated useful lives:
|
Amortization Period
|
||||
|
(in years)
|
||||
|
Customer relationships and lists
|
10
|
|||
|
Trademarks & trade names
|
17
|
|||
|
Developed technology
|
5
|
|||
|
Regulatory registration costs
|
5 - 10
|
|||
|
Patents & trade secrets
|
15 - 17
|
|||
|
Other
|
5 - 10
|
|||
For the year ended December 31, 2014, there were no triggering events which required asset impairment reviews.
Income Taxes
Income taxes are accounted for under the asset and liability method. Deferred tax assets and liabilities are recognized for the future tax consequences attributable to differences between the financial statement carrying amounts of existing assets and liabilities and their respective tax bases and operating loss and tax credit carry-forwards. Deferred tax assets and liabilities are measured using enacted tax rates expected to apply to taxable income in the years in which those temporary differences are expected to be recovered or settled. The effect on deferred tax assets and liabilities of a change in tax rates is recognized in income in the period that includes the enactment date.
Use of Estimates
Management of the Company is required to make certain estimates and assumptions during the preparation of consolidated financial statements in accordance with accounting principles generally accepted in the United States of America. These estimates and assumptions impact the reported amount of assets and liabilities and disclosures of contingent assets and liabilities as of the date of the consolidated financial statements and revenues and expenses during the reporting period. Estimates and assumptions are reviewed periodically and the effects of revisions are reflected in the consolidated financial statements in the period they are determined to be necessary. Actual results could differ from those estimates.
Fair Value of Financial Instruments
The Company has a number of financial instruments, none of which are held for trading purposes. The Company estimates that the fair value of all financial instruments at December 31, 2014 and 2013 does not differ materially from the aggregate carrying values of its financial instruments recorded in the accompanying consolidated balance sheets. The estimated fair value amounts have been determined by the Company using available market information and appropriate valuation methodologies. Considerable judgment is necessarily required in interpreting market data to develop the estimates of fair value, and, accordingly, the estimates are not necessarily indicative of the amounts that the Company could realize in a current market exchange. The carrying value of debt approximates fair value as the interest rate is based on market and the Company’s consolidated leverage ratio. The Company’s financial instruments also includes cash equivalents, accounts receivable, accounts payable and accrued liabilities, and are carried at cost which approximates fair value due to the short-term maturity of these instruments.
Cost of Sales
Cost of sales are primarily comprised of raw materials and supplies consumed in the manufacture of product, as well as manufacturing labor, maintenance labor, depreciation expense, and direct overhead expense necessary to convert purchased materials and supplies into finished product. Cost of sales also
36
includes inbound freight costs, outbound freight costs for shipping products to customers, warehousing costs, quality control and obsolescence expense.
Selling, General and Administrative Expenses
Selling expenses consist primarily of compensation and benefit costs, amortization of customer relationships and lists, trade promotions, advertising, commissions and other marketing costs. General and administrative expenses consist primarily of payroll and benefit costs, occupancy and operating costs of corporate offices, depreciation and amortization expense on non-manufacturing assets, information systems costs and other miscellaneous administrative costs. In 2014, general and administrative expenses were reduced by a $2.9 million net legal settlement.
Research and Development
Research and development costs are expensed as incurred.
Net Earnings Per Common Share
Basic net earnings per common share is calculated by dividing net income by the weighted average number of common shares outstanding during the period. Diluted net earnings per common share is calculated in a manner consistent with basic net earnings per common share except that the weighted average number of common shares outstanding also includes the dilutive effect of stock options outstanding and unvested restricted stock (using the treasury stock method).
Stock-based Compensation
The Company has stock-based employee compensation plans, which are described more fully in Note 3. The Company accounts for stock-based compensation in accordance with ASC 718, “Compensation-Stock Compensation,” which requires all share-based payments, including grants of stock options, to be recognized in the income statement as an operating expense, based on their fair values. The Company estimates the fair value of each option award on the date of grant using a Black-Scholes based option-pricing model. Estimates of and assumptions about forfeiture rates, terms, volatility, interest rates and dividend yields are used to calculate stock-based compensation. A significant change to these estimates could materially affect the Company’s operating results.
Impairment of Long-lived Assets
Long-lived assets, such as property, plant, and equipment, and purchased intangibles subject to amortization, are reviewed for impairment whenever events or changes in circumstances indicate that the carrying amount of an asset may not be recoverable. Recoverability of assets to be held and used is measured by a comparison of the carrying amount of an asset to estimated undiscounted future cash flows expected to be generated by the asset. If the carrying amount of an asset exceeds its estimated future cash flows, an impairment charge is recognized by the amount by which the carrying amount of the asset exceeds the fair value of the asset, which is generally based on discounted cash flows.
Reclassifications
Certain reclassifications have been made to the prior years’ financial statements to conform to the current year’s presentation with no impact on net earnings or stockholders’ equity.
On May 7, 2014, the Company acquired 100 percent (the “Acquisition”) of the outstanding common shares of Performance Chemicals & Ingredients Company (d/b/a SensoryEffects), a privately held supplier of customized food and ingredient systems, headquartered in St. Louis, Missouri. The Company made payments of approximately $569 million on the acquisition date, amounting to approximately $494 million to the former
37
shareholders, including adjustments for working capital acquired, and approximately $75 million to SensoryEffects’ lenders to pay off all SensoryEffects bank debt. SensoryEffects is a leader in powder, solid and liquid flavor systems, creamer and specialty emulsified powders, cereal-based products and other functional ingredient food and beverage delivery systems. The Acquisition of SensoryEffects accelerates the Company’s growth into the health and wellness markets. SensoryEffects was merged with the Company’s Food, Pharma & Nutrition segment, strengthening its market leadership position, and the segment was renamed SensoryEffects.
The estimated goodwill of $355,131 arising from the Acquisition consists largely of expected synergies, including the combined entities experience and technical problem solving capabilities, and acquired workforce. The goodwill is assigned to the SensoryEffects segment and approximately $20,466 is expected to be tax deductible for income tax purposes.
The following table summarizes the estimated fair values of the assets acquired and liabilities assumed.
|
Cash and cash equivalents
|
$
|
2,635
|
||
|
Accounts receivable
|
25,674
|
|||
|
Inventories
|
32,000
|
|||
|
Property, plant and equipment
|
75,850
|
|||
|
Customer relationships
|
130,300
|
|||
|
Trade names
|
31,100
|
|||
|
Developed technology
|
3,200
|
|||
|
Other assets
|
3,955
|
|||
|
Indemnification asset
|
1,650
|
|||
|
Trade accounts payable
|
(10,427
|
)
|
||
|
Accrued expenses
|
(6,326
|
)
|
||
|
Bank debt
|
(75,550
|
)
|
||
|
Deferred income taxes
|
(75,500
|
)
|
||
|
Goodwill
|
355,131
|
|||
|
Amount paid to shareholders
|
493,692
|
|||
|
SensoryEffects bank debt paid on purchase date
|
75,550
|
|||
|
Total amount paid on acquisition date
|
$
|
569,242
|
The estimated fair value of tangible and intangible assets acquired and liabilities assumed is based on management’s estimates and assumptions that are subject to change. In preparing our preliminary fair value estimates of the intangible assets and certain tangible assets acquired, management, among other things, consulted an independent advisor. The gross contractual amount of accounts receivable approximate their recorded fair value. Certain intangible assets are not tax deductible and the related deferred tax liabilities are preliminary pending management’s final review of the acquisition date tax returns. As a result of our ongoing reviews of the tax balances, a $2.0 million reduction of the deferred income taxes and goodwill, from our original purchase price allocation, was recorded during the fourth quarter.
Customer relationships are amortized over a 10-year period utilizing an accelerated method based on the estimated average customer attrition rate. Trade names and developed technology are amortized over 10 years and 5 years, respectively, utilizing the straight-line method as the consumption pattern of the related economic benefits cannot be reliably determined.
The Company is indemnified for tax liabilities prior to the Acquisition date. The indemnification asset balance increased by $272 from May 7, 2014 to December 31, 2014
to $1,922
.
Transaction and integration related costs included in selling, general, and administrative expenses for the year ended December 31, 2014 are $3,652.
The following unaudited pro forma information has been prepared as if the Acquisition had occurred on January 1, 2013.
38
|
Year Ended
December 31, 2014
|
Year Ended
December 31, 2013
|
|||||||||||||||
|
Net Sales
|
Net Earnings
|
Net Sales
|
Net Earnings
|
|||||||||||||
|
SensoryEffects actual results included in the Company’s consolidated income statement from May 7, 2014 through December 31, 2014
|
$
|
$156,192
|
$
|
$ 6,632
|
$
|
$ -0-
|
$
|
$ -0-
|
||||||||
|
Supplemental pro forma combined financial information
|
$
|
$625,400
|
$
|
$ 61,730
|
$
|
$ 545,592
|
$
|
$ 41,603
|
||||||||
|
Basic earnings per share
|
$
|
$ 2.03
|
$
|
$ 1.40
|
||||||||||||
|
Diluted earnings per share
|
$
|
$ 1.98
|
$
|
$ 1.35
|
||||||||||||
2014 supplemental pro forma earnings for the year ended December 31, 2014 exclude $17,248 of acquisition-related costs incurred and $4,735 of nonrecurring expenses related to the fair value adjustment to acquisition-date inventory. The 2013 supplemental pro forma earnings were adjusted to include the $4,735 of nonrecurring expense related to the fair value adjustment to acquisition date inventory. The pro forma information presented does not purport to be indicative of the results that actually would have been attained if the SensoryEffects acquisition had occurred at the beginning of the periods presented and is not intended to be a projection of future results.
STOCK-BASED COMPENSATION
In accordance with ASC 718, all share-based payments, including grants of stock options, are recognized in the income statement as an operating expense, based on their fair values.
As required by ASC 718, the Company has made an estimate of expected forfeitures, based on its historical experience, and is recognizing compensation cost only for those stock-based compensation awards expected to vest.
Additionally, since adoption of ASC 718, excess tax benefits related to stock compensation are presented as a cash inflow from financing activities. This change had the effect of decreasing cash flows from operating activities and increasing cash flows from financing activities by $7,220, $9,397 and $2,862 for the years ended December 31, 2014, 2013 and 2012, respectively.
The Company’s results for the years ended December 31, 2014, 2013 and 2012 reflected the following compensation cost as a result of adopting ASC 718 and such compensation cost had the following effects on net earnings:
|
Increase/(Decrease) for the
Years Ended December 31,
|
||||||||||||
|
2014
|
2013
|
2012
|
||||||||||
|
Cost of sales
|
$
|
593
|
$
|
607
|
$
|
523
|
||||||
|
Operating expenses
|
3,963
|
3,210
|
3,383
|
|||||||||
|
Net earnings
|
(2,926
|
)
|
(2,370
|
)
|
(2,469
|
)
|
||||||
On December 31, 2014, the Company had one share-based compensation plan, which is described below (the “1999 Stock Plan”).
In June 1999, the Company adopted the Balchem Corporation 1999 Stock Plan for officers, directors, directors emeritus and employees of and consultants to the Company and its subsidiaries. The 1999 Stock Plan is administered by the Compensation Committee of the Board of Directors of the Company. Under the plan, options and rights to purchase shares of the Company’s Common Stock are granted at prices established at the time of grant. Option grants generally become exercisable 20% after 1 year, 60% after 2 years and 100% after 3 years from the date of grant for employees and are fully exercisable on the date of grant for directors. Other option grants are either fully exercisable on the date of grant or become exercisable thereafter in such installments as the Committee may specify. Options granted under the 1999 Stock Plan expire ten years from the date of grant. The 1999 Stock Plan initially reserved an aggregate of 600,000 shares (unadjusted for the stock splits) of Common Stock for issuance under the Plan. In April 2003, the Board of Directors of the Company adopted and stockholders subsequently approved, the Amended and Restated 1999 Stock Plan (the “Amended Plan”) which amended the 1999
39
Stock Plan by: (i) increasing the number of shares of Common Stock reserved for issuance under the 1999 Stock Plan by 600,000 shares (unadjusted for the stock splits), to a total of 1,200,000 shares (unadjusted for the stock splits) of Common Stock; and (ii) confirming the right of the Company to grant awards of Common Stock (“Awards”) in addition to the other Stock Rights available under the 1999 Stock Plan, and providing certain language changes relating thereto. The Amended Plan was scheduled to expire in April, 2009. In April, 2008, the Board of Directors of the Company adopted and stockholders subsequently approved, the adoption of an amendment and restatement of the Amended Plan (collectively to be referred to as the “Second Amended Plan”), which provides as follows: (i) for a termination date of April 9, 2018; (ii) to
authorize 6,000,000 shares reserved for future grants under the Second Amended Plan; (iii) for the making of grants of stock appreciation rights, restricted stock and performance awards; (iv) for immediate acceleration of vesting of awards issued under the plan in the event of a change in control of the Company; and (v) for compliance with the requirements of Sections 409A and 162(m) of the Internal Revenue Code of 1986, as amended (the “Internal Revenue Code” or the “Code”).
The 1999 Stock Plan replaced the Company's incentive stock option plan (the “ISO Plan”) and its non-qualified stock option plan (the “Non-Qualified Plan”), both of which expired on June 24, 1999. Unexercised options granted under the ISO Plan and the Non-Qualified Plan prior to such termination remained exercisable in accordance with their terms and expired ten years from the date of grant.
The shares to be issued upon exercise of the outstanding options have been approved, reserved and are adequate to cover all exercises. As of December 31, 2014, the plans had 4,064,576 shares available for future awards.
The Company has Restricted Stock Purchase Agreements (the “RSP Agreements”) with its non-employee directors and certain employees of the Company to purchase the Company’s Common Stock pursuant to the Company’s 1999 Stock Plan. Under the RSP Agreements, certain shares have been purchased, ranging from 1,000 shares to 20,250 shares, of the Company’s Common Stock at purchase prices ranging from approximately $.02 per share to $.07 per share. The purchased stock is subject to a repurchase option in favor of the Company and to restrictions on transfer until it vests in accordance with the provisions of the RSP Agreements. In 2011, the Company discontinued the use of RSP Agreements and replaced them with Restricted Stock Grant Agreements for the Company’s non-employee directors and certain employees. Under the Restricted Stock Grant Agreements, certain shares of the Company’s Common Stock have been granted, ranging from 500 shares to 20,000 shares, to its non-employee directors and certain employees, subject to time-based vesting requirements.
The fair value of each option award issued under the 1999 Stock Plan is estimated on the date of grant using a Black-Scholes based option-pricing model that uses the assumptions noted in the following table. Expected volatilities are based on historical volatility of the Company’s stock. The expected term of the options is based on the Company’s historical experience of employees’ exercise behavior. Dividend yields are based on the Company’s historical dividend yields. Risk-free interest rates are based on the implied yields currently available on U.S. Treasury zero coupon issues with a remaining term equal to the expected life.
|
Weighted Average Assumptions:
|
2014
|
Years Ended
December 31, 2013
|
2012
|
|||||||||
|
Expected Volatility
|
33.7
|
%
|
39.2
|
%
|
40.6
|
%
|
||||||
|
Expected Term (in years)
|
5.6
|
5.0
|
4.6
|
|||||||||
|
Risk-Free Interest Rate
|
1.8
|
%
|
1.0
|
%
|
0.7
|
%
|
||||||
|
Dividend Yield
|
0.5
|
%
|
0.5
|
%
|
0.5
|
%
|
||||||
The value of the restricted shares is based on the fair value of the award at the date of grant.
40
Compensation expense for stock options and restricted stock awards is recognized on a straight-line basis over the vesting period, generally three years for stock options, ninety days to four years for employee restricted stock awards, and four to seven years for non-employee director restricted stock awards.
A summary of stock option plan activity for 2014, 2013, and 2012 for all plans is as follows:
|
2014
|
# of
Shares (000s)
|
Weighted Average
Exercise Price
|
||||||
|
Outstanding at beginning of year
|
1,893
|
$
|
20.94
|
|||||
|
Granted
|
313
|
53.38
|
||||||
|
Exercised
|
(610
|
)
|
14.92
|
|||||
|
Forfeited
|
(126
|
)
|
56.03
|
|||||
|
Outstanding at end of year
|
1,470
|
$
|
27.35
|
|||||
|
Exercisable at end of year
|
1,066
|
$
|
21.52
|
|||||
|
2013
|
# of
Shares (000s)
|
Weighted Average
Exercise Price
|
||||||
|
Outstanding at beginning of year
|
2,543
|
$
|
16.87
|
|||||
|
Granted
|
177
|
38.73
|
||||||
|
Exercised
|
(796
|
)
|
11.40
|
|||||
|
Forfeited
|
(31
|
)
|
33.90
|
|||||
|
Outstanding at end of year
|
1,893
|
$
|
20.94
|
|||||
|
Exercisable at end of year
|
1,516
|
$
|
17.64
|
|||||
|
2012
|
# of
Shares (000s)
|
Weighted Average
Exercise Price
|
||||||
|
Outstanding at beginning of year
|
2,514
|
$
|
14.68
|
|||||
|
Granted
|
276
|
30.35
|
||||||
|
Exercised
|
(231
|
)
|
8.24
|
|||||
|
Forfeited
|
(16
|
)
|
28.53
|
|||||
|
Outstanding at end of year
|
2,543
|
$
|
16.87
|
|||||
|
Exercisable at end of year
|
2,155
|
$
|
14.30
|
|||||
The aggregate intrinsic value for outstanding stock options was $57,742, $71,465 and $49,845 at December 31, 2014, 2013 and 2012, respectively, with a weighted average remaining contractual term of 5.6 years at December 31, 2014. Exercisable stock options at December 31, 2014 had an aggregate intrinsic value of $48,085 with a weighted average remaining contractual term of 4.4 years.
Other information pertaining to option activity during the years ended December 31, 2014, 2013 and 2012 was as follows:
|
Years Ended December 31,
|
||||||||||||
|
2014
|
2013
|
2012
|
||||||||||
|
Weighted-average fair value of options granted
|
$
|
17.36
|
$
|
13.07
|
$
|
10.09
|
||||||
41
|
Total intrinsic value of stock options exercised ($000s)
|
$
|
25,224
|
$
|
28,776
|
$
|
6,524
|
Additional information related to stock options outstanding under all plans at December 31, 2014 is as follows:
|
Options Outstanding
|
Options Exercisable | |||||||||||||||||
|
Range of Exercise
Prices
|
Shares Outstanding (000s)
|
Weighted
Average
Remaining
Contractual
Term
|
Weighted Average Exercise
Price
|
Number Exercisable (000s)
|
Weighted Average Exercise
Price
|
|||||||||||||
| $ |
9.21 - $22.34
|
702
|
3.4 years
|
$
|
16.09
|
702
|
$
|
16.09
|
||||||||||
|
24.95 - 32.21
|
401
|
6.5 years
|
30.68
|
322
|
31.08
|
|||||||||||||
|
33.81 - 58.42
|
367
|
8.7 years
|
45.28
|
42
|
39.19
|
|||||||||||||
|
1,470
|
5.6 years
|
$
|
27.35
|
1,066
|
$
|
21.52
|
||||||||||||
Non-vested restricted stock activity for the years ended December 31, 2014, 2013 and 2012 is summarized below:
|
Shares (000s)
|
Weighted Average Grant Date Fair
Value
|
|||||||
|
Non-vested balance as of December 31, 2013
|
172
|
$
|
33.69
|
|||||
|
Granted
|
33
|
54.86
|
||||||
|
Vested
|
(65
|
)
|
34.19
|
|||||
|
Forfeited
|
(6
|
)
|
45.32
|
|||||
|
Non-vested balance as of December 31, 2014
|
134
|
$
|
38.13
|
|||||
|
Shares (000s)
|
Weighted Average Grant Date Fair
Value
|
|||||||
|
Non-vested balance as of December 31, 2012
|
258
|
$
|
26.88
|
|||||
|
Granted
|
32
|
44.69
|
||||||
|
Vested
|
(94
|
)
|
19.31
|
|||||
|
Forfeited
|
(24
|
)
|
31.97
|
|||||
|
Non-vested balance as of December 31, 2013
|
172
|
$
|
33.69
|
|||||
|
Shares (000s)
|
Weighted Average Grant Date Fair
Value
|
|||||||
|
Non-vested balance as of December 31, 2011
|
354
|
$
|
18.77
|
|||||
|
Granted
|
91
|
32.72
|
||||||
|
Vested
|
(187
|
)
|
14.38
|
|||||
|
Forfeited
|
-
|
-
|
||||||
|
Non-vested balance as of December 31, 2012
|
258
|
$
|
26.88
|
|||||
As of December 31, 2014, 2013 and 2012, there was $5,981, $5,947 and $7,012, respectively, of total unrecognized compensation cost related to non-vested share-based compensation arrangements granted under the plans. As of December 31, 2014, the unrecognized compensation cost is expected to be recognized over a weighted-average period of 2 years. We estimate that share-based compensation expense for the year ended December 31, 2015 will be approximately $4,900.
REPURCHASE OF COMMON STOCK
42
The Company has an approved stock repurchase program. The total authorization under this program is 3,763,038 shares. Since the inception of the program in June 1999, a total of 2,105,231 shares have been purchased, none of which remained in treasury at December 31, 2014 or 2013. During 2014, a total of 17,497 shares have been purchased at an average cost of $61.06 per share. The Company intends to acquire shares from time to time at prevailing market prices if and to the extent it deems it advisable to do so based on its assessment of corporate cash flow, market conditions and other factors.
Inventories at December 31, 2014 and 2013 consisted of the following:
|
2014
|
2013
|
|||||||
|
Raw materials
|
$
|
19,822
|
$
|
8,454
|
||||
|
Work in progress
|
1,989
|
1,330
|
||||||
|
Finished goods
|
27,812
|
15,040
|
||||||
|
Total inventories
|
$
|
49,623
|
$
|
24,824
|
||||
On a regular
basis, the Company evaluates its inventory balances for excess quantities and obsolescence by analyzing demand, inventory on hand, sales levels and other information. Based on these evaluations, inventory balances are reduced, if necessary. The reserve for inventory was $1,682 and $181 at December 31, 2014 and 2013, respectively.
Property, plant and equipment at December 31, 2014 and 2013 are summarized as follows:
|
2014
|
2013
|
|||||||
|
Land
|
$
|
3,130
|
$
|
2,054
|
||||
|
Building
|
31,030
|
19,732
|
||||||
|
Equipment
|
150,170
|
86,147
|
||||||
|
Construction in progress
|
10,969
|
1,754
|
||||||
|
195,299
|
109,687
|
|||||||
|
Less: Accumulated depreciation
|
63,711
|
54,771
|
||||||
|
Property, plant and equipment, net
|
$
|
131,588
|
$
|
54,916
|
||||
Depreciation expense was $10,599, $6,498 and $5,672 for the years ended December 31, 2014, 2013 and 2012, respectively.
The Company had goodwill in the amount of $383,646 as of December 31, 2014 and $28,515 as of December 31, 2013 subject to the provisions of ASC 350, “Intangibles-Goodwill and Other.”
The changes in the carrying amount of goodwill for the year ended December 31, 2014, are as follows:
|
Goodwill at January 1, 2014
|
$
|
28,515
|
||
|
Goodwill as a result of the Acquisition of Performance Chemicals & Ingredients Company – see Note 2
|
355,131
|
|||
|
Goodwill at December 31, 2014
|
$
|
383,646
|
As of December 31, 2014 and 2013, the Company had identifiable intangible assets as follows:
43
|
Amortization
Period
(In years)
|
2014
Gross
Carrying
Amount
|
2014
Accumulated Amortization
|
2013
Gross
Carrying
Amount
|
2013
Accumulated Amortization
|
||||||||||||||||
|
Customer relationships & lists
|
10
|
$
|
167,442
|
$
|
41,238
|
$
|
37,142
|
$
|
24,552
|
|||||||||||
|
Trademarks & trade names
|
17
|
32,014
|
2,540
|
910
|
461
|
|||||||||||||||
|
Developed technology
|
5
|
3,200
|
420
|
-0-
|
-0-
|
|||||||||||||||
|
Regulatory registration costs
|
5-10
|
1,704
|
667
|
1,644
|
514
|
|||||||||||||||
|
Patents & trade secrets
|
15-17
|
1,665
|
933
|
1,593
|
849
|
|||||||||||||||
|
Other
|
5-10
|
754
|
587
|
754
|
541
|
|||||||||||||||
|
$
|
206,779
|
$
|
46,385
|
$
|
42,043
|
$
|
26,917
|
|||||||||||||
Amortization of identifiable intangible assets was $19,468, $3,976 and $3,969 for 2014, 2013 and 2012, respectively. Assuming no change in the gross carrying value of identifiable intangible assets, the estimated amortization expense is approximately $26,490 in 2015, $24,300 in 2016, $20,345 in 2017, $18,085 in 2018 and $16,285 in 2019. At December 31, 2014 and 2013, there were no identifiable intangible assets with indefinite useful lives as defined by ASC 350, “Intangibles-Goodwill and Other.” Identifiable intangible assets are reflected in the Company’s consolidated balance sheets under Intangible assets with finite lives, net. There were no changes to the useful lives of intangible assets subject to amortization in 2014 and 2013.
At December 31, 2014, the gross carrying amount included customer relationships, trademarks & trade names and developed technology acquired as part of the Performance Chemicals & Ingredients acquisition in 2014.
The Federal Insecticide, Fungicide and Rodenticide Act, (“FIFRA”), a health and safety statute, requires that certain products within our specialty products segment must be registered with the U.S. Environmental Protection Agency (“EPA”) because they are considered pesticides. Costs of such registration are included as regulatory registration costs in the table above.
On May 7, 2014, the Company and a bank syndicate entered into a loan agreement providing for a senior secured term loan of $350,000 and revolving loan of $100,000 (collectively referred to as the “loans”). The term loan and $50,000 of the revolving loan were used to fund the Performance Chemicals & Ingredients Company acquisition (see Note 2) and for general corporate purposes. At December 31, 2014, the Company had a total of $332,500 of debt outstanding. The term loan is payable in quarterly installments of $8,750 commencing on September 30, 2014, with the outstanding principal due on the maturity date. The Company may draw on the revolving loan at its discretion and the revolving loan does not have installments and all outstanding amounts are due on the maturity date. The loans may be voluntarily prepaid in whole or in part without premium or penalty and have a maturity date of May 7, 2019. The loans are subject to an interest rate equal to LIBOR or a fluctuating rate as defined by the loan agreement, at the Company’s discretion; plus an applicable rate. The applicable rate is based upon the Company’s consolidated leverage ratio, as defined in the loan agreement, and the interest rate was 1.92% at December 31, 2014. The Company has $100,000 of undrawn revolving loan at December 31, 2014 that is subject to a commitment fee; which is based on the Company’s consolidated leverage ratio as defined in the loan agreement. The loan agreement contains quarterly covenants requiring the consolidated leverage ratio to be less than a certain maximum ratio and the consolidated fixed charge coverage ratio to exceed a certain minimum ratio. At December 31, 2014, the Company was in compliance with these covenants. Indebtedness under the Company’s loan agreements are secured by assets of the company.
The following table summarizes the future minimum debt payments:
|
2015
|
2016
|
2017
|
2018
|
2019
|
||||||||||||||||
|
Current portion of long-term debt
|
$
|
35,000
|
-
|
-
|
-
|
-
|
||||||||||||||
44
|
Long-term debt
|
-
|
$
|
35,000
|
$
|
35,000
|
$
|
35,000
|
$
|
192,500
|
|||||||||||
|
Total
|
$
|
35,000
|
$
|
35,000
|
$
|
35,000
|
$
|
35,000
|
$
|
192,500
|
Costs associated with the issuance of debt instruments are capitalized and amortized over the terms of the respective financing arrangements using the effective interest method. If debt is retired early, the related unamortized costs are expensed in the period the debt is retired. Capitalized costs net of accumulated amortization total $2,139 at December 31, 2014, of which $603 is included in other current assets and $1,536 is included in other assets. Amortization expense pertaining to these costs totaled $457 for the year ended December 31, 2014 and is included in interest expense in the accompanying condensed consolidated statements of earnings.
Income tax expense consists of the following:
|
2014
|
2013
|
2012
|
||||||||||
|
Current:
|
||||||||||||
|
Federal
|
$
|
25,937
|
$
|
18,366
|
$
|
17,748
|
||||||
|
Foreign
|
2,141
|
1,418
|
1,080
|
|||||||||
|
State
|
2,412
|
1,475
|
1,104
|
|||||||||
|
Deferred:
|
||||||||||||
|
Federal
|
(5,772
|
)
|
(75
|
)
|
(332
|
)
|
||||||
|
Foreign
|
85
|
74
|
148
|
|||||||||
|
State
|
(577
|
)
|
(314
|
)
|
91
|
|||||||
|
Total income tax provision
|
$
|
24,226
|
$
|
20,944
|
$
|
19,839
|
||||||
The provision for income taxes differs from the amount computed by applying the Federal statutory rate of 35% to earnings before income tax expense due to the following:
|
2014
|
2013
|
2012
|
||||||||||
|
Income tax at Federal statutory rate
|
$
|
26,968
|
$
|
23,036
|
$
|
20,945
|
||||||
|
State income taxes, net of Federal income taxes
|
1,182
|
908
|
659
|
|||||||||
|
Domestic production activities deduction
|
(2,567
|
)
|
(1,804
|
)
|
(1,775
|
)
|
||||||
|
Other
|
(1,357
|
)
|
(1,196
|
)
|
10
|
|||||||
|
Total income tax provision
|
$
|
24,226
|
$
|
20,944
|
$
|
19,839
|
||||||
The tax effects of temporary differences that give rise to significant portions of the deferred tax assets and deferred tax liabilities at December 31, 2014 and 2013 were as follows:
|
2014
|
2013
|
|||||||
|
Deferred tax assets:
|
||||||||
|
Inventories
|
$
|
1,774
|
$
|
608
|
||||
|
Restricted stock and stock options
|
4,716
|
4,590
|
||||||
|
Other
|
4,019
|
758
|
||||||
|
Total deferred tax assets
|
10,509
|
5,956
|
||||||
|
Deferred tax liabilities:
|
||||||||
|
Amortization
|
$
|
60,056
|
$
|
3,031
|
||||
|
Depreciation
|
17,969
|
6,978
|
||||||
|
Prepaid expense
|
932
|
542
|
||||||
|
Other
|
563
|
396
|
||||||
|
Total deferred tax liabilities
|
79,520
|
10,947
|
||||||
|
Net deferred tax liability
|
$
|
69,011
|
$
|
4,991
|
||||
There is no valuation allowance for deferred tax assets at December 31, 2014 and 2013. In assessing the realizability of deferred tax assets, management considers whether it is more likely than not that some portion or all of the deferred tax assets will not be realized. The ultimate realization of deferred tax assets is
45
dependent upon the generation of future taxable income during the periods in which those temporary differences become deductible. Management considers the scheduled reversal of deferred tax liabilities, projected future taxable income and tax planning strategies in making this assessment. Based upon the level of historical taxable income and projections for future taxable income over the periods in which the deferred tax assets are deductible, management believes it is more likely than not the Company will realize the benefits of these deductible differences. The amount of deferred tax asset realizable, however, could change if management’s estimate of future taxable income should change.
Provisions of ASC 740-10 clarify whether or not to recognize assets or liabilities for tax positions taken that may be challenged by a tax authority. A reconciliation of the beginning and ending amount of unrecognized tax benefits, which is included in other long-term obligations on the Company’s consolidated balance sheets, is as follows:
|
2014
|
2013
|
2012
|
||||||||||
|
Balance at beginning of period
|
$
|
3,076
|
$
|
2,292
|
$
|
2,021
|
||||||
|
Increases for tax positions of prior years
|
1,922
|
445
|
116
|
|||||||||
|
Decreases for tax positions of prior years
|
(417
|
)
|
(166
|
)
|
(224
|
)
|
||||||
|
Increases for tax positions related to current year
|
624
|
505
|
379
|
|||||||||
|
Balance at end of period
|
$
|
5,205
|
$
|
3,076
|
$
|
2,292
|
||||||
All of the Company’s unrecognized tax benefits, if recognized in future periods, would impact the Company’s effective tax rate in such future periods.
The Company recognizes both interest and penalties as part of the income tax provision. During the years ended December 31, 2014, 2013 and 2012, the Company recognized approximately $37, $130 and $40 in interest and penalties, respectively. As of December 31, 2014 and 2013, accrued interest and penalties were $1,643 and $1,052, respectively.
The Company files income tax returns in the U.S. and in various states and foreign countries. In the major jurisdictions where the Company operates, it is generally no longer subject to income tax examinations by tax authorities for years before 2010. The Company does not anticipate any material change in the total amount of unrecognized tax benefits to occur within the next twelve months.
The following presents a reconciliation of the net earnings and shares used in calculating basic and diluted net earnings per common share:
|
2014
|
Earnings
(Numerator)
|
Number of Shares
(Denominator)
|
Per Share Amount
|
|||||||||
|
Basic EPS – Net earnings and weighted average common shares outstanding
|
$
|
52,826
|
30,381,310
|
$
|
1.74
|
|||||||
|
Effect of dilutive securities – stock options and restricted stock
|
790,412
|
|||||||||||
|
Diluted EPS – Net earnings and weighted average common shares outstanding and effect of stock options and restricted stock
|
$
|
52,826
|
31,171,722
|
$
|
1.69
|
|||||||
|
2013
|
Earnings
(Numerator)
|
Number of Shares
(Denominator)
|
Per Share Amount
|
|||||||||
|
Basic EPS – Net earnings and weighted average common shares outstanding
|
$
|
44,874
|
29,623,952
|
$
|
1.51
|
|||||||
46
|
Effect of dilutive securities – stock options and restricted stock
|
1,223,183
|
|||||||||||
|
Diluted EPS – Net earnings and weighted average common shares outstanding and effect of stock options and restricted stock
|
$
|
44,874
|
30,847,135
|
$
|
1.45
|
|
2012
|
Earnings
(Numerator)
|
Number of Shares
(Denominator)
|
Per Share Amount
|
|||||||||
|
Basic EPS – Net earnings and weighted average common shares outstanding
|
$
|
40,005
|
28,994,212
|
$
|
1.38
|
|||||||
|
Effect of dilutive securities – stock options and restricted stock
|
1,358,364
|
|||||||||||
|
Diluted EPS – Net earnings and weighted average common shares outstanding and effect of stock options and restricted stock
|
$
|
40,005
|
30,352,576
|
$
|
1.32
|
|||||||
The Company had 56,500, 10,000 and 282,027 stock options outstanding at December 31, 2014, 2013 and 2012, respectively that could potentially dilute basic earnings per share in future periods that were not included in diluted earnings per share because their effect on the period presented was anti-dilutive.
The Company has some share-based payment awards that have non-forfeitable dividend rights. These awards are restricted shares and they participate on a one-for-one basis with holders of Common Stock. These awards have an immaterial impact as participating securities with regard to the calculation using the two-class method for determining earnings per share.
The Company sponsors two 401(k) savings plans for eligible employees. The plans allows participants to make pretax contributions and the Company matches certain percentages of those pretax contributions. One of the plans has a discretionary profit sharing portion and the Company match is made with shares of the Company’s Common Stock. All amounts contributed to the plan are deposited into a trust fund administered by independent trustees. The plans were merged in January 2015. The Company provided for profit sharing contributions and matching 401(k) savings plan contributions of $938 and $804 in 2014, $918 and $525 in 2013 and $837 and $508 in 2012, respectively.
The Company also provides postretirement benefits in the form of an unfunded retirement medical plan under a collective bargaining agreement covering eligible retired employees of the Verona facility. The Company uses a December 31 measurement date for its postretirement medical plan. In accordance with ASC 715, “Compensation—Retirement Benefits,” the Company is required to recognize the over funded or under funded status of a defined benefit post retirement plan (other than a multiemployer plan) as an asset or liability in its statement of financial position, and to recognize changes in that funded status in the year in which the changes occur through comprehensive income.
The actuarial recorded liabilities for such unfunded postretirement benefit is as follows:
Change in benefit obligation:
47
|
2014
|
2013
|
|||||||
|
Benefit obligation at beginning of year
|
$
|
1,152
|
$
|
1,301
|
||||
|
Service cost with interest to end of year
|
57
|
67
|
||||||
|
Interest cost
|
48
|
42
|
||||||
|
Participant contributions
|
3
|
1
|
||||||
|
Benefits paid*
|
42
|
(97
|
)
|
|||||
|
Actuarial gain
|
(191
|
)
|
(162
|
)
|
||||
|
Benefit obligation at end of year
|
$
|
1,111
|
$
|
1,152
|
||||
Change in plan assets:
|
2014
|
2013
|
|||||||
|
Fair value of plan assets at beginning of year
|
$
|
-
|
$
|
-
|
||||
|
Employer (reimbursement)/contributions*
|
(45
|
)
|
96
|
|||||
|
Participant contributions
|
3
|
1
|
||||||
|
Benefits paid*
|
42
|
(97
|
)
|
|||||
|
Fair value of plan assets at end of year
|
$
|
-
|
$
|
-
|
||||
*Stop loss reimbursement credit received in 2014.
Amounts recognized in consolidated balance sheet:
|
2014
|
2013
|
|||||||
|
Accumulated postretirement benefit obligation
|
$
|
(1,111
|
)
|
$
|
(1,152
|
)
|
||
|
Fair value of plan assets
|
-
|
-
|
||||||
|
Funded status
|
(1,111
|
)
|
(1,152
|
)
|
||||
|
Unrecognized prior service cost
|
N/A
|
|
||||||
|
Unrecognized net (gain)/loss
|
N/A
|
|
N/A
|
|||||
|
Net amount recognized in consolidated balance sheet (after ASC 715) (included in other long-term obligations)
|
$
|
1,111
|
$
|
1,152
|
||||
|
Accrued postretirement benefit cost (included in other long-term obligations)
|
$
|
N/A
|
|
$
|
N/A
|
|||
Components of net periodic benefit cost:
|
2014
|
2013
|
2012
|
||||||||||
|
Service cost with interest to end of year
|
$
|
57
|
$
|
67
|
$
|
53
|
||||||
|
Interest cost
|
48
|
42
|
41
|
|||||||||
|
Amortization of prior service credit
|
(18
|
)
|
(18
|
)
|
(18
|
)
|
||||||
|
Amortization of gain
|
6
|
17
|
4
|
|||||||||
|
Total net periodic benefit cost
|
$
|
93
|
$
|
108
|
$
|
80
|
||||||
Estimated future employer contributions and benefit payments are as follows:
|
Year
|
||||
|
2015
|
$
|
21
|
||
|
2016
|
34
|
|||
|
2017
|
45
|
|||
|
2018
|
75
|
|||
|
2019
|
101
|
|||
|
Years 2020-2024
|
407
|
|||
Assumed health care cost trend rates have been used in the valuation of postretirement health insurance benefits. The trend rate is 7.55% in 2014 declining to 4.50% in 2027 and thereafter. A one percentage point increase in health care cost trend rates in each year would increase the accumulated postretirement benefit obligation as of December 31, 2014 by $122 and the net periodic postretirement benefit cost for 2014 by $15. A one percentage point decrease in health care cost trend rates in each year would decrease the
48
accumulated postretirement benefit obligation as of December 31, 2014 by $106 and the net periodic postretirement benefit cost for 2014 by $13. The weighted average discount rate used in determining the accumulated postretirement benefit obligation was 3.30% in 2014 and 4.20% in 2013.
The Company contributes to one multiemployer defined benefit plan under the terms of a collective-bargaining agreement covering its union-represented employees of the Verona facility. The risks of participation in this multiemployer plan are different from single-employer plans in the following aspects: (a) assets contributed to the multiemployer plan by one employer may be used to provide benefits to employees of other participating employers, (b) if a participating employer stops contributing to the plan, the unfunded obligations of the plan may be borne by the remaining participating employers, and (c) if the Company chooses to stop participating in its multiemployer plan, the Company will be required to pay that plan an amount based on the underfunded status of the plan, referred to as the withdrawal liability.
The Company’s participation in this plan for the annual period ended December 31, 2014 is outlined in the table below. The “EIN/Pension Plan Number” column provides the Employee Identification Number (EIN). The zone status is based on information that the Company received from the plan and is certified by the plan’s actuary. Among other factors, plans in the red zone are generally less than 65 percent funded, plans in the yellow zone are less than 80 percent funded, and plans in the green zone are at least 80 percent funded. The “FIP/RP Status Pending/Implemented” column indicates plans for which a financial improvement plan (FIP) or a rehabilitation plan (RP) is either pending or has been implemented. The last column lists the expiration date of the collective-bargaining agreement to which the plan is subject. Finally, the period-to-period comparability of the contributions for 2014 and 2013 was affected by a 4.5% increase in the number of employees covered by the Company’s multiemployer plan as well as a 4.0% increase in the 2014 contribution rate. There have been no other significant changes that affect the comparability of 2014 and 2013 contributions. The Company does not represent more than 5% of the contributions to this pension fund.
|
Pension Plan Protection Act
Zone Status |
Contributions of Balchem Corporation
|
||||||||||||||||||||
|
Pension
Fund
|
EIN/Pension Plan
Number |
2014
|
2013
|
FIP/RP Status Pending/Implemented
|
2014
|
2013
|
2012
|
Surcharge Imposed
|
Expiration Date of
Collective-Bargaining
Agreement
|
||||||||||||
|
Central States,
Southeast and
Southwest Areas
Pension Fund
|
36-6044243
|
Red as of 1/1/2014
|
Red as of 1/1/2013
|
Implemented
|
$
|
498
|
$
|
451
|
$
|
415
|
No
|
5/31/2017
|
|||||||||
In 2012, the Company entered into a six (6) year lease extension for approximately 20,000 square feet of office space. The office space serves as the Company’s general offices and as a laboratory facility. The Company leases most of its vehicles and office equipment under non-cancelable operating leases, which expire at various times through 2029. Rent expense charged to operations under such lease agreements for 2014, 2013 and 2012 aggregated approximately $1,595, $1,040 and $965, respectively. Aggregate future minimum rental payments required under non-cancelable operating leases at December 31, 2014 are as follows:
|
Year
|
||||
|
2015
|
$
|
1,811
|
||
|
2016
|
1,430
|
|||
|
2017
|
1,170
|
|||
|
2018
|
923
|
|||
|
2019
|
448
|
|||
|
Thereafter
|
2,103
|
|||
|
Total minimum lease payments
|
$
|
7,885
|
||
In 1982, the Company discovered and thereafter removed a number of buried drums containing unidentified waste material from the Company’s site in Slate Hill, New York. The Company thereafter entered into a Consent Decree to evaluate the drum site with the New York Department of Environmental Conservation (“NYDEC”) and performed a Remedial Investigation/Feasibility Study that was approved by NYDEC in February 1994. Based on NYDEC requirements, the Company cleaned the area and removed soil from the drum burial site, which was completed in 1996. The Company continues to be involved in
49
discussions with NYDEC to evaluate test results and determine what, if any, additional actions will be required on the part of the Company to close out the remediation of this site. Additional actions, if any, would likely require the Company to continue monitoring the site. The cost of such monitoring has been less than $5 per year for the period 2004 to date.
The Company’s Verona, Missouri facility, while held by a prior owner, was designated by the EPA as a Superfund site and placed on the National Priorities List in 1983, because of dioxin contamination on portions of the site. Remediation conducted by the prior owner under the oversight of the EPA and the Missouri Department of Natural Resources (“MDNR”) included removal of dioxin contaminated soil and equipment, capping of areas of residual contamination in four relatively small areas of the site separate from the manufacturing facilities, and the installation of wells to monitor groundwater and surface water contamination by organic chemicals. No ground water or surface water treatment was required. The Company believes that remediation of the site is complete. In 1998, the EPA certified the work on the contaminated soils to be complete. In February 2000, after the conclusion of two years of monitoring groundwater and surface water, the former owner submitted a draft third party risk assessment report to the EPA and MDNR recommending no further action. The prior owner is awaiting the response of the EPA and MDNR to the draft risk assessment.
While the Company must maintain the integrity of the capped areas in the remediation areas on the site, the prior owner is responsible for completion of any further Superfund remedy. The Company is indemnified by the sellers under its May 2001 asset purchase agreement covering its acquisition of the Verona, Missouri facility for potential liabilities associated with the Superfund site and one of the sellers, in turn, has the benefit of certain contractual indemnification by the prior owner that is implementing the above-described Superfund remedy.
From time to time, the Company is a party to various litigation, claims and assessments. Management believes that the ultimate outcome of such matters will not have a material effect on the Company’s consolidated financial position, results of operations, or liquidity.
The Company has a number of financial instruments, none of which are held for trading purposes. The Company estimates that the fair value of all financial instruments at December 31, 2014 and December 31, 2013 does not differ materially from the aggregate carrying values of its financial instruments recorded in the accompanying consolidated balance sheets. The estimated fair value amounts have been determined by the Company using available market information and appropriate valuation methodologies. Considerable judgment is necessarily required in interpreting market data to develop the estimates of fair value, and, accordingly, the estimates are not necessarily indicative of the amounts that the Company could realize in a current market exchange. The carrying value of debt approximates fair value as the interest rate is based on market and the Company’s consolidated leverage ratio. The Company’s financial instruments also include cash equivalents, accounts receivable, accounts payable and accrued liabilities, and are carried at cost which approximates fair value due to the short-term maturity of these instruments. Cash and cash equivalents at December 31, 2014 and 2013, includes $772 and $50,764 in money market funds, respectively and $-0- and $109,000 in certificates of deposits, respectively. The money market funds and certificates of deposit are valued using level one and level two inputs, respectively, as defined by ASC 820, “Fair Value Measurement.”
In February 2013, the Financial Accounting Standards Board (“FASB”) issued Accounting Standards Update (“ASU”) No. 2013-02, “Reporting of Amounts Reclassified Out of Accumulated Other Comprehensive Income” (“ASU 2013-02”). This guidance is the culmination of the FASB’s deliberation on reporting reclassification adjustments from accumulated other comprehensive income (“AOCI”). The amendments in ASU 2013-02 do not change the current requirements for reporting net income or other comprehensive income. However, the amendments require disclosure of amounts reclassified out of AOCI in its entirety, by component, on the face of the statement of operations or in the notes thereto. Amounts that are not required to be reclassified in their entirety to net income must be cross-referenced to other disclosures that provide additional detail. This standard is effective prospectively for annual and interim reporting periods beginning after December 15, 2012. Other than the additional disclosure requirements
50
(see below), the adoption of these changes had no impact on the Company’s consolidated financial statements.
The changes in accumulated other comprehensive income (loss) were as follows:
|
Years Ended
December 31,
|
||||||||||||
|
2014
|
2013
|
2012
|
||||||||||
|
Net foreign currency translation adjustment
|
$
|
(2,972
|
)
|
$
|
856
|
$
|
342
|
|||||
|
Net change in postretirement benefit plan (see Note 10 for further information)
|
||||||||||||
|
Net (loss)/gain arising during the period
|
191
|
162
|
(235
|
)
|
||||||||
|
Amortization of prior service credit
|
(18
|
)
|
(18
|
)
|
(18
|
)
|
||||||
|
Amortization of (loss)/gain
|
6
|
17
|
4
|
|||||||||
|
Total before tax
|
179
|
161
|
(249
|
)
|
||||||||
|
Tax
|
(56
|
)
|
(60
|
)
|
86
|
|||||||
|
Net of tax
|
123
|
101
|
(163
|
)
|
||||||||
|
Total other comprehensive income (loss)
|
$
|
(2,849
|
)
|
$
|
957
|
$
|
179
|
|||||
The Company’s reportable segments are strategic businesses that offer products and services to different markets. The Company presently has three segments: SensoryEffects; Animal Nutrition & Health; and Specialty Products. Our SensoryEffects segment supplies ingredients in the food and beverage industry; providing customized solutions in powder and liquid flavor delivery systems, spray dried emulsified powder systems, and cereal systems. This segment provides microencapsulation solutions to a variety of applications in food, pharmaceutical and nutritional ingredients to enhance performance of nutritional fortification, processing
and
packaging applications and shelf-life. Human
grade
choline, pharmaceutical products and encapsulated products are also reported in the SensoryEffects segment. The Animal Nutrition & Health segment manufactures and supplies choline chloride, an essential nutrient for animal health, to the poultry
, pet
and swine industries. In addition, certain derivatives of choline chloride are manufactured and sold into industrial applications and are included in this segment. Chelated minerals and specialty nutritional products for the animal health industry are also reported in this segment. The Specialty Products segment provides specialty-packaged chemicals for use in healthcare and other industries. The Company sells products for all segments through its own sales force, independent distributors, and sales agents. The accounting policies of the segments are the same as those described in the summary of significant accounting policies.
Business Segment Net Sales:
|
2014
|
2013
|
2012
|
||||||||||
|
Specialty Products
|
$
|
54,053
|
$
|
51,086
|
$
|
49,990
|
||||||
|
SensoryEffects
|
206,101
|
47,569
|
44,070
|
|||||||||
|
Animal Nutrition & Health
|
281,229
|
238,518
|
216,333
|
|||||||||
|
Total
|
$
|
541,383
|
$
|
337,173
|
$
|
310,393
|
||||||
Business Segment Earnings Before Income Taxes:
|
2014
|
2013
|
2012
|
||||||||||
|
Specialty Products
|
$
|
21,316
|
$
|
20,224
|
$
|
20,332
|
||||||
|
SensoryEffects
|
21,260
|
11,233
|
11,335
|
|||||||||
51
|
Animal Nutrition & Health
|
40,219
|
34,145
|
28,110
|
|||||||||
|
Transaction costs, integration costs and legal settlement
|
(652
|
)
|
-
|
-
|
||||||||
|
Interest and other income, net
|
(5,091
|
)
|
216
|
67
|
||||||||
|
Total
|
$
|
77,052
|
$
|
65,818
|
$
|
59,844
|
Depreciation/Amortization:
|
2014
|
2013
|
2012
|
||||||||||
|
Specialty Products
|
$
|
1,330
|
$
|
1,386
|
$
|
1,369
|
||||||
|
SensoryEffects
|
21,031
|
1,356
|
1,444
|
|||||||||
|
Animal Nutrition & Health
|
7,706
|
7,732
|
6,828
|
|||||||||
|
Total
|
$
|
30,067
|
$
|
10,474
|
$
|
9,641
|
||||||
Business Segment Assets:
|
2014
|
2013
|
2012
|
||||||||||
|
Specialty Products
|
$
|
24,913
|
$
|
24,850
|
$
|
26,964
|
||||||
|
SensoryEffects
|
655,870
|
22,343
|
21,393
|
|||||||||
|
Animal Nutrition & Health
|
122,980
|
116,710
|
116,035
|
|||||||||
|
Other Unallocated
|
57,508
|
212,969
|
148,153
|
|||||||||
|
Total
|
$
|
861,271
|
$
|
376,872
|
$
|
312,545
|
||||||
Other unallocated assets consist of certain cash, receivables, prepaid expenses, equipment and leasehold improvements, net of accumulated depreciation, and deferred income taxes, which the Company does not allocate to its individual business segments.
Capital Expenditures:
|
2014
|
2013
|
2012
|
||||||||||
|
Specialty Products
|
$
|
896
|
$
|
725
|
$
|
836
|
||||||
|
SensoryEffects
|
3,342
|
1,318
|
924
|
|||||||||
|
Animal Nutrition & Health
|
8,961
|
6,144
|
12,123
|
|||||||||
|
Total
|
$
|
13,199
|
$
|
8,187
|
$
|
13,883
|
||||||
Geographic Revenue Information:
|
2014
|
2013
|
2012
|
||||||||||
|
United States
|
$
|
420,324
|
$
|
227,651
|
$
|
207,490
|
||||||
|
Foreign Countries
|
121,059
|
109,522
|
102,903
|
|||||||||
|
Total
|
$
|
541,383
|
$
|
337,173
|
$
|
310,393
|
||||||
Geographic Area Data – Long-Lived Assets (excluding intangible assets):
|
2014
|
2013
|
2012
|
||||||||||
|
United States
|
$
|
121,090
|
$
|
43,078
|
$
|
41,183
|
||||||
|
Italy
|
10,498
|
11,838
|
11,542
|
|||||||||
|
Total
|
$
|
131,588
|
$
|
54,916
|
$
|
52,725
|
||||||
Cash paid during the year for:
|
2014
|
2013
|
2012
|
||||||||||
|
Income taxes
|
$
|
25,304
|
$
|
12,096
|
$
|
14,836
|
||||||
|
Interest
|
$
|
4,685
|
$
|
40
|
$
|
6
|
||||||
Non-cash financing activities:
|
2014
|
2013
|
2012
|
||||||||||
|
Dividends payable
|
$
|
9,251
|
$
|
7,856
|
$
|
-
|
||||||
52
(In thousands, except per share data)
|
2014
|
2013
|
|||||||||||||||||||||||||||||||
|
First Quarter
|
Second Quarter
|
Third Quarter
|
Fourth Quarter
|
First Quarter
|
Second Quarter
|
Third Quarter
|
Fourth Quarter
|
|||||||||||||||||||||||||
|
Net sales
|
$
|
85,995
|
$
|
132,230
|
$
|
160,490
|
$
|
162,668
|
$
|
84,651
|
$
|
83,296
|
$
|
87,593
|
$
|
81,633
|
||||||||||||||||
|
Gross profit
|
23,215
|
32,335
|
44,487
|
44,135
|
24,232
|
24,885
|
24,522
|
23,782
|
||||||||||||||||||||||||
|
Earnings before
income taxes
|
13,372
|
15,291
|
23,209
|
25,180
|
15,863
|
16,682
|
17,060
|
16,213
|
||||||||||||||||||||||||
|
Net earnings
|
8,894
|
9,732
|
15,178
|
19,022
|
10,888
|
11,582
|
11,657
|
10,747
|
||||||||||||||||||||||||
|
Basic net earnings per common share
|
$
|
.30
|
$
|
.32
|
$
|
.50
|
$
|
.62
|
$
|
.37
|
$
|
.39
|
$
|
.39
|
$
|
.36
|
||||||||||||||||
|
Diluted net earnings per common share
|
$
|
.29
|
$
|
.31
|
$
|
.49
|
$
|
.61
|
$
|
.36
|
$
|
.38
|
$
|
.38
|
$
|
.35
|
||||||||||||||||
53
BALCHEM CORPORATION
Valuation and Qualifying Accounts
Years Ended December 31, 2014, 2013 and 2012
(In thousands)
|
Description
|
Balance at
Beginning of
Year
|
Additions
Charged (Credited)
to Costs and
Expenses
|
Deductions
|
Balance at End
of Year
|
||||||||||||
|
Year ended December 31, 2014
|
||||||||||||||||
|
Allowance for doubtful accounts
|
$
|
115
|
$
|
238
|
$
|
(65
|
)(a)
|
$
|
288
|
|||||||
|
Inventory reserve
|
181
|
2,073
|
(572
|
)(a)
|
1,682
|
|||||||||||
|
Year ended December 31, 2013
|
||||||||||||||||
|
Allowance for doubtful accounts
|
$
|
115
|
$
|
-
|
$
|
-
|
$
|
115
|
||||||||
|
Inventory reserve
|
236
|
97
|
(152
|
)(a)
|
181
|
|||||||||||
|
Year ended December 31, 2012
|
||||||||||||||||
|
Allowance for doubtful accounts
|
$
|
58
|
$
|
57
|
$
|
-
|
$
|
115
|
||||||||
|
Inventory reserve
|
132
|
142
|
(38
|
)(a)
|
236
|
|||||||||||
(a) represents write-offs.
54
| Item 9. | Changes in and Disagreements with Accountants on Accounting and Financial Disclosure |
None.
| Item 9A. | Controls and Procedures |
Disclosure Controls and Procedures
We maintain “disclosure controls and procedures,” as such term is defined in Rules 13a-15(e) and 15d-15(e) under the Securities Exchange Act of 1934 (the “Exchange Act”), that are designed to ensure that information required to be disclosed by us in reports that we file or submit under the Exchange Act is recorded, processed, summarized, and reported within the time periods specified in SEC rules and forms, and that such information is accumulated and communicated to our management, including our Chief Executive Officer and Chief Financial Officer, as appropriate, to allow timely decisions regarding required disclosure. In designing and evaluating our disclosure controls and procedures, management recognized that disclosure controls and procedures, no matter how well conceived and operated, can provide only reasonable, not absolute, assurance that the objectives of the disclosure controls and procedures are met. Additionally, in designing disclosure controls and procedures, our management necessarily was required to apply its judgment in evaluating the cost-benefit relationship of possible disclosure controls and procedures. The design of any disclosure controls and procedures also is based in part upon certain assumptions about the likelihood of future events, and there can be no assurance that any design will succeed in achieving its stated goals under all potential future conditions.
Our management, with the participation of our Chief Executive Officer and Chief Financial Officer, has evaluated the effectiveness of the design and operation of our disclosure controls and procedures as of December 31, 2014. Based on that evaluation, our Chief Executive Officer and Chief Financial Officer have concluded that, as of such date, our disclosure controls and procedures were effective.
Management's Report on Internal Control Over Financial Reporting
Management of the Company is responsible for establishing and maintaining adequate internal control over financial reporting. The Company's internal control over financial reporting is a process designed under the supervision of the Company's principal executive and principal financial officers to provide reasonable assurance regarding the reliability of financial reporting and the preparation of the Company's financial statements for external reporting purposes in accordance with U.S. generally accepted accounting principles.
Our internal control over financial reporting includes policies and procedures that pertain to the maintenance of records that, in reasonable detail, accurately and fairly reflect transactions and dispositions of assets; provide reasonable assurances that transactions are recorded as necessary to permit preparation of financial statements in accordance with U.S. generally accepted accounting principles, and that receipts and expenditures are being made only in accordance with authorizations of management and the directors of the Company; and provide reasonable assurance regarding prevention or timely detection of unauthorized acquisition, use or disposition of the Company's assets that could have a material effect on our financial statements.
A control system, no matter how well designed and operated, can provide only reasonable, not absolute, assurance that the objectives of the control system are met. Further, the design of a control system must reflect the fact that there are resource constraints, and the benefits of controls must be considered relative to their costs. Because of the inherent limitations in a cost-effective control system, no evaluation of internal control over financial reporting can provide absolute assurance that misstatements due to error or fraud will not occur or that all control issues and instances of fraud, if any, within our Company have been detected. Therefore, even those systems determined to be effective can provide only reasonable assurance with respect to financial statement preparation and presentation. Management does not expect that the Company’s disclosure controls and procedures or its internal control over financial reporting will prevent or detect all errors and all fraud.
These inherent limitations include the realities that judgments in decision-making can be faulty and that breakdowns can occur because of simple error or mistake. Controls can also be circumvented by
55
the individual acts of some persons, by collusion of two or more people, or by management override of the controls. The design of any system of controls is based in part on certain assumptions about the likelihood of future events, and there can be no assurance that any design will succeed in achieving its stated goals under all potential future conditions. Projections of any evaluation of controls effectiveness to future periods are subject to risks. Over time, controls may become inadequate because of changes in conditions or deterioration in the degree of compliance with policies or procedures.
Balchem Corporation completed an acquisition of Performance Chemicals & Ingredients Company (d/b/a SensoryEffects) effective May 7, 2014. Management’s assessment of and conclusion on the effectiveness of our internal control over financial reporting excludes the internal controls over financial reporting of Performance Chemicals & Ingredients Company. The acquisition contributed approximately 28.9 percent of our net sales for the year ended December 31, 2014 and accounted for approximately 73.9 percent of our total assets as of December 31, 2014. Registrants are permitted to exclude acquisitions from their assessment of internal controls over financial reporting during the first year if, among other circumstances and factors, there is not adequate time between the consummation date of the acquisition and the assessment date for assessing internal controls.
As of December 31, 2014, management
used the criteria set forth by the Committee of Sponsoring Organizations of the Treadway Commission (COSO) in the 2013
Internal Control—Integrated Framework
(New Framework
)
to conduct an assessment of the effectiveness of the Company's internal control over financial reporting. Based on this assessment, management has determined that the Company's internal control over financial reporting was effective as of December 31, 2014.
Attestation Report of Registered Public Accounting Firm
The independent registered public accounting firm of
McGladrey LLP
has issued an attestation report on the Company’s internal control over financial reporting, which is included herein.
Changes in Internal Control Over Financial Reporting
There has been no change in our internal control over financial reporting in our most recent fiscal quarter that has materially affected, or is reasonably likely to materially affect, our internal control over financial reporting.
| Item 9B. | Other Information |
None.
PART III
| Item 10. | Directors, Executive Officers of the Registrant, and Corporate Governance. |
| (a) | Directors of the Company. |
The required information is to be set forth in the Company's Proxy Statement for the 2015 Annual Meeting of Stockholders (the “2015 Proxy Statement”) under the caption “Directors and Executive Officers,” which information is hereby incorporated herein by reference.
| (b) | Executive Officers of the Company. |
The required information is to be set forth in the 2015 Proxy Statement under the caption “Directors and Executive Officers,” which information is hereby incorporated herein by reference.
| (c) | Section 16(a) Beneficial Ownership Reporting Compliance. |
The required information is to be set forth in the 2015 Proxy Statement under the caption “Section 16(a) Beneficial Ownership Reporting Compliance,” which information is hereby incorporated herein by reference.
| (d) | Code of Ethics. |
56
The required information is to be set forth in the 2015 Proxy Statement under the caption “Code of Business Conduct and Ethics,” which information is hereby incorporated herein by reference. The Company’s Code of Ethics for Senior Financial Officers is available on the Corporate Governance page in the Investor Relations section of the Company’s website, www.balchem.com.
| (e) | Corporate Governance. |
The required information is to be set forth in the 2015 Proxy Statement under the caption “Nomination of Directors,” and “Committees of the Board of Directors,” which information is hereby incorporated herein by reference.
| Item 11. | Executive Compensation. |
The information required by this Item is to be set forth in the 2015 Proxy Statement under the caption “Executive Compensation,” “Compensation Committee Report,” and “Compensation Committee Interlocks and Insider Participation,” which information is hereby incorporated herein by reference.
| Item 12. | Security Ownership of Certain Beneficial Owners and Management and Related Stockholder Matters. |
The information required by this Item is to be set forth in the 2015 Proxy Statement under the caption “Security Ownership of Certain Beneficial Owners and of Management” and the caption “Equity Compensation Plan Information,” all of which information is hereby incorporated herein by reference.
|
Item 13.
|
Certain Relationships and Related Transactions and Director Independence.
|
The information required by this Item is set forth in the 2015 Proxy Statement under the caption “Related Party Transactions,” and “Director Independence,” which information is hereby incorporated herein by reference.
|
Item 14.
|
Principal Accountant Fees and Services.
|
The information required by this Item is set forth in the 2015 Proxy Statement under the caption “Proposal No. 2 – Ratification of Appointment of Independent Registered Public Accounting Firm,” which information is hereby incorporated herein by reference.
|
Item 15.
|
Exhibits and Financial Statement Schedules.
|
The following documents are filed as part of this Form 10-K:
|
1.
|
Financial Statements
|
Form 10-K
Page Number
|
|
|
|
|
|
|
Report of Independent Registered Public Accounting Firm
|
27
|
|
|
|
|
|
|
Consolidated Balance Sheets as of December 31, 2014 and 2013
|
29
|
|
|
|
|
|
|
Consolidated Statements of Earnings for the years ended December 31, 2014, 2013 and 2012
|
30
|
|
|
|
|
|
|
Consolidated Statements of Comprehensive Income for the years ended December 31, 2014, 2013 and 2012
|
31
|
|
|
|
|
|
|
Consolidated Statements of Stockholders' Equity for the years ended December 31, 2014, 2013 and 2012
|
32
|
|
|
|
|
|
|
Consolidated Statements of Cash Flows
for the years ended December 31, 2014, 2013 and 2012
|
33
|
57
|
|
Notes to Consolidated Financial Statements
|
34
|
|
|
|
|
|
2.
|
Financial Statement Schedules
|
|
|
|
|
|
|
|
Schedule II – Valuation and Qualifying Accounts for the years ended December 31, 2014, 2013 and 2012
|
55
|
| 3. | Exhibits |
| 3.1 | 3.1 Composite Articles of Incorporation of the Company (incorporated by reference to Exhibit 3.1 to the Company’s Annual Report on Form 10-K dated March 16, 2006 for the year ended December 31, 2005). |
|
3.2
|
Balchem Corporation Articles of Amendment (incorporated by reference to Exhibit A to the Company’s definitive proxy statement on Schedule 14A filed with the Commission on April 25, 2008).
|
|
3.3
|
Balchem Corporation Articles of Amendment (incorporated by reference to Exhibit A to the Company’s definitive proxy statement on Schedule 14A filed with the Commission on April 28, 2011).
|
|
3.4
|
By-laws of the Company, as amended and restated as of April 1, 2014 (incorporated by reference to Exhibit 3.2 to the Company’s Current Report on Form 8-K dated March 28, 2014).
|
|
10.1
|
Incentive Stock Option Plan of the Company, as amended, (incorporated by reference to the Company’s Registration Statement on Form S-8, File No. 333-35910, dated October 25, 1996, and to Proxy Statement, dated April 22, 1998, for the Company's 1998 Annual Meeting of Stockholders (the “1998 Proxy Statement”)).*
|
|
10.2
|
Stock Option Plan for Directors of the Company, as amended (incorporated by reference to the Company’s Registration Statement on Form S-8, File No. 333-35912, dated October 25, 1996, and to the 1998 Proxy Statement).
|
|
10.3
|
Balchem Corporation Amended and Restated 1999 Stock Plan (incorporated by reference to Exhibit 10.3 to the Company’s Quarterly Report on Form 10-Q for the quarter ended June 30, 2003).*
|
|
10.4
|
Balchem Corporation Second Amended and Restated 1999 Stock Plan, (incorporated by reference to the Company’s Registration Statement on Form S-8, File No. No. 333-155655, dated November 25, 2008, and to Proxy Statement, dated April 25, 2008, for the Company's 2008 Annual Meeting of Stockholders).*
|
|
10.5
|
Balchem Corporation 401(k)/Profit Sharing Plan, dated January 1, 1998 (incorporated by reference to Exhibit 4 to the Company's Registration Statement on Form S-8, File No. 333-118291, dated August 17, 2004).*
|
|
10.6
|
Employment Agreement, dated as of January 1, 2001, between the Company and Dino A. Rossi (incorporated by reference to Exhibit 10.5 to the Company’s Annual Report on Form 10-K for the year ended December 31, 2001 (the “2001 10-K”)).*
|
|
10.7
|
Employment Agreement, dated as of December 1, 2012, between the Company and Richard A. Bendure (incorporated by reference to Exhibit 10.8 to the Company’s Annual Report on Form 10-K for the year ended December 31, 2012).*
|
|
10.8
|
Form of Restricted Stock Grant Agreement and Stock Option Agreement (incorporated by reference to Exhibit 10.14 to the Company’s Annual Report on Form 10-K for the year ended December 31, 2012 (the “2011 10-K”)).
|
|
10.9
|
Stock Purchase Agreement, dated as of March 31, 2014, among Performance Chemicals & Ingredients Company (d/b/a SensoryEffects), a Delaware corporation, certain equity owners thereof, the Company and, solely for the limited purposes described therein, Highlander Partners, L.P. (incorporated by reference to the Company’s Current Report on Form 8-K dated April 1, 2014). (Pursuant to Item 601(b)(2) of Regulation S-K, the |
58
|
schedules to the Stock Purchase Agreement have been omitted and the Company agrees to furnish supplementally a copy of any such omitted schedule to the SEC upon request).
|
|
|
10.10
|
Credit Agreement dated May 7, 2014 among the Company, certain guarantors, lenders and Bank of America, N.A. (incorporated by reference to Exhibit 4.1 to the Company’s Current Report on Form 8-K dated May 13, 2014).
|
|
10.11
|
Security and Pledge Agreement dated May 7, 2014 among the Company, certain guarantors and Bank of America, N.A. (incorporated by reference to Exhibit 4.12 to the Company’s Current Report on Form 8-K dated May 13, 2014).
|
|
21.
|
Subsidiaries of Registrant.
|
|
23.1
|
Consent of McGladrey LLP, Independent Registered Public Accounting Firm.
|
|
31.1
|
Certification of Chief Executive Officer pursuant to Rule 13a-14(a).
|
|
31.2
|
Certification of Chief Financial Officer pursuant to Rule 13a-14(a).
|
|
32.1
|
Certification of Chief Executive Officer pursuant to Rule 13a-14(b) and Section 1350 of Chapter 63 of Title 18 of the United States Code.
|
|
32.2
|
Certification of Chief Financial Officer pursuant to Rule 13a-14(b) and Section 1350 of Chapter 63 of Title 18 of the United States Code.
|
|
101.INS
|
XBRL Instance Document
|
|
101.SCH
|
XBRL Taxonomy Extension Schema Document
|
|
101.CAL
|
XBRL Taxonomy Extension Calculation Linkbase Document
|
|
101.DEF
|
XBRL Taxonomy Extension Definition Linkbase Document
|
|
101.LAB
|
XBRL Taxonomy Extension Label Linkbase Document
|
|
101.PRE
|
XBRL Taxonomy Extension Presentation Linkbase Document
|
|
*
|
Each of the Exhibits noted by an asterisk is a management compensatory plan or arrangement.
|
59
SIGNATURES
Pursuant to the requirements of Section 13 or 15(d) of the Securities Exchange Act of 1934, the registrant has caused this report to be signed on its behalf by the undersigned, thereunto duly authorized.
|
Date: FEBRUARY 27, 2015
|
BALCHEM CORPORATION
|
|
|
By:/s/ Dino A. Rossi
|
||
|
Dino A. Rossi, Chairman, President, and
|
||
|
Chief Executive Officer
|
SIGNATURES
Pursuant to the requirements of the Securities Exchange Act of 1934, this report has been signed by the following persons on behalf of the registrant and in the capacities and on the dates indicated.
|
/s/ Dino A. Rossi
|
|
|
Dino A. Rossi, Chairman, President, and
|
|
|
Chief Executive Officer (Principal Executive Officer)
|
|
|
Date: February 27, 2015
|
|
|
/s/ William A. Backus
|
|
|
William A. Backus, Chief Financial Officer
|
|
|
and Treasurer (Principal Financial and Principal Accounting Officer)
|
|
|
Date: February 27, 2015
|
|
|
/s/ Paul D. Coombs
|
|
|
Paul D. Coombs, Director
|
|
|
Date: February 27, 2015
|
|
|
/s/ David B. Fischer
|
|
|
David B. Fischer, Director
|
|
|
Date: February 27, 2015
|
|
|
/s/ Edward L. McMillan
|
|
|
Edward L. McMillan, Director
|
|
|
Date: February 27, 2015
|
|
|
/s/ Perry W. Premdas
|
|
|
Perry W. Premdas, Director
|
|
|
Date: February 27, 2015
|
|
|
/s/ Dr. John Televantos
|
|
|
Dr. John Televantos, Director
|
|
|
Date: February 27, 2015
|
|
60
EXHIBIT INDEX
|
Exhibit
Number
|
Description |
|
3.1
|
Composite Articles of Incorporation of the Company (incorporated by reference to Exhibit 3.1 to the Company’s Annual Report on Form 10-K dated March 16, 2006 for the year ended December 31, 2005).
|
|
3.2
|
Balchem Corporation Articles of Amendment (incorporated by reference to Exhibit A to the Company’s definitive proxy statement on Schedule 14A filed with the Commission on April 25, 2008).
|
|
3.3
|
Balchem Corporation Articles of Amendment (incorporated by reference to Exhibit A to the Company’s definitive proxy statement on Schedule 14A filed with the Commission on April 28, 2011).
|
|
3.4
|
By-laws of the Company, as amended and restated as of April 1, 2014 (incorporated by reference to Exhibit 3.2 to the Company’s Current Report on Form 8-K dated March 28, 2014).
|
|
10.1
|
Incentive Stock Option Plan of the Company, as amended, (incorporated by reference to the Company’s Registration Statement on Form S-8, File No. 333-35910, dated October 25, 1996, and to Proxy Statement, dated April 22, 1998, for the Company's 1998 Annual Meeting of Stockholders (the “1998 Proxy Statement”)).*
|
|
10.2
|
Stock Option Plan for Directors of the Company, as amended (incorporated by reference to the Company’s Registration Statement on Form S-8, File No. 333-35912, dated October 25, 1996, and to the 1998 Proxy Statement).
|
|
10.3
|
Balchem Corporation Amended and Restated 1999 Stock Plan (incorporated by reference to Exhibit 10.3 to the Company’s Quarterly Report on Form 10-Q for the quarter ended June 30, 2003).*
|
|
10.4
|
Balchem Corporation Second Amended and Restated 1999 Stock Plan, (incorporated by reference to the Company’s Registration Statement on Form S-8, File No. No. 333-155655, dated November 25, 2008, and to Proxy Statement, dated April 25, 2008, for the Company's 2008 Annual Meeting of Stockholders).*
|
|
10.5
|
Balchem Corporation 401(k)/Profit Sharing Plan, dated January 1, 1998 (incorporated by reference to Exhibit 4 to the Company's Registration Statement on Form S-8, File No. 333-118291, dated August 17, 2004).*
|
|
10.6
|
Employment Agreement, dated as of January 1, 2001, between the Company and Dino A. Rossi (incorporated by reference to Exhibit 10.5 to the Company’s Annual Report on Form 10-K for the year ended December 31, 2001 (the “2001 10-K”)).*
|
|
10.7
|
Employment Agreement, dated as of December 1, 2012, between the Company and Richard A. Bendure (incorporated by reference to Exhibit 10.8 to the Company’s Annual Report on Form 10-K for the year ended December 31, 2012).*
|
|
10.8
|
Form of Restricted Stock Grant Agreement and Stock Option Agreement (incorporated by reference to Exhibit 10.14 to the Company’s Annual Report on Form 10-K for the year ended December 31, 2012 (the “2011 10-K”)).
|
61
|
10.9
|
Stock Purchase Agreement, dated as of March 31, 2014, among Performance Chemicals & Ingredients Company (d/b/a SensoryEffects), a Delaware corporation, certain equity owners thereof, the Company and, solely for the limited purposes described therein, Highlander Partners, L.P. (incorporated by reference to the Company’s Current Report on Form 8-K dated April 1, 2014). (Pursuant to Item 601(b)(2) of Regulation S-K, the schedules to the Stock Purchase Agreement have been omitted and the Company agrees to furnish supplementally a copy of any such omitted schedule to the SEC upon request).
|
|
10.10
|
Credit Agreement dated May 7, 2014 among the Company, certain guarantors, lenders and Bank of America, N.A. (incorporated by reference to Exhibit 4.1 to the Company’s Current Report on Form 8-K dated May 13, 2014).
|
|
10.11
|
Security and Pledge Agreement dated May 7, 2014 among the Company, certain guarantors and Bank of America, N.A. (incorporated by reference to Exhibit 4.12 to the Company’s Current Report on Form 8-K dated May 13, 2014).
|
|
Subsidiaries of Registrant.
|
|
|
Consent of McGladrey LLP, Independent Registered Public Accounting Firm.
|
|
|
Certification of Chief Executive Officer pursuant to Rule 13a-14(a).
|
|
|
Certification of Chief Financial Officer pursuant to Rule 13a-14(a).
|
|
|
Certification of Chief Executive Officer pursuant to Rule 13a-14(b) and Section 1350 of Chapter 63 of Title 18 of the United States Code.
|
|
|
Certification of Chief Financial Officer pursuant to Rule 13a-14(b) and Section 1350 of Chapter 63 of Title 18 of the United States Code.
|
|
|
101.INS
|
XBRL Instance Document
|
|
101.SCH
|
XBRL Taxonomy Extension Schema Document
|
|
101.CAL
|
XBRL Taxonomy Extension Calculation Linkbase Document
|
|
101.DEF
|
XBRL Taxonomy Extension Definition Linkbase Document
|
|
101.LAB
|
XBRL Taxonomy Extension Label Linkbase Document
|
|
101.PRE
|
XBRL Taxonomy Extension Presentation Linkbase Document
|
|
*
|
Each of the Exhibits noted by an asterisk is a management compensatory plan or arrangement.
|
63
TABLE OF CONTENTS
Part IItem 2. PropertiesItem 3. Legal ProceedingsItem 4. Mine Safety DisclosuresPart IIItem 5. Market For The Registrant's Common Equity, Related Stockholder Matters and Issuer Purchases Of Equity SecuritiesItem 6. Selected Financial DataItem 7. Management's Discussion and Analysis Of Financial Condition and Results Of OperationsItem 8. Financial Statements and Supplementary DataNote 1 - Business Description and Summary Of Significant Accounting PoliciesNote 2 AcquisitionsNote 3 - Stockholders EquityNote 4 - InventoriesNote 5 - Property, Plant and EquipmentNote 6 - Intangible AssetsNote 7 Long Term DebtNote 8 - Income TaxesNote 9 - Net Earnings Per Common ShareNote 10 - Employee Benefit PlansNote 11 - Commitments and ContingenciesNote 12 Fair Value Of Financial InstrumentsNote 13 Accumulated Other Comprehensive IncomeNote 14 - Segment InformationNote 15 - Supplemental Cash Flow InformationNote 16 - Quarterly Financial Information (unaudited)Item 9. Changes in and Disagreements with Accountants on Accounting and Financial DisclosureItem 9A. Controls and ProceduresItem 9B. Other InformationPart IIIItem 10. Directors, Executive Officers Of The Registrant, and Corporate GovernanceItem 11. Executive CompensationItem 12. Security Ownership Of Certain Beneficial Owners and Management and Related Stockholder MattersItem 13. Certain Relationships and Related Transactions and Director IndependenceItem 14. Principal Accountant Fees and ServicesItem 15. Exhibits and Financial Statement Schedules