BRANDYWINE REALTY TRUST
10-Ks and 10-Qs
|
|
|
|
|
|
|
|
|
|
|
|
|
|
|
|
|
|
|
|
|
|
|
|
|
|
|
|
|
|
|
|
|
|
|
|
|
|
|
|
|
|
|
|
|
|
|
|
|
|
|
|
|
|
|
|
UNITED STATES SECURITIES AND EXCHANGE COMMISSION
Washington, D.C. 20549
FORM 10-K
(Mark One)
|
þ
|
|
ANNUAL REPORT PURSUANT TO SECTION 13 OR 15(d) OF THE SECURITIES EXCHANGE ACT OF 1934
|
For the fiscal year ended December 31, 2013
OR
|
o
|
|
TRANSITION REPORT PURSUANT TO SECTION 13 OR 15(d) OF THE SECURITIES EXCHANGE ACT OF 1934
|
For the transition period from
to
Commission file number 001-9106 (Brandywine Realty Trust)
000-24407 (Brandywine Operating Partnership, L.P.)
Brandywine Realty Trust
Brandywine Operating Partnership, L.P.
(Exact name of registrant as specified in its charter)
|
MARYLAND
(Brandywine Realty Trust)
|
23-2413352
|
|
DELAWARE
(Brandywine Operating Partnership L.P.)
|
23-2862640
|
|
(State or other jurisdiction of incorporation or organization)
|
(I.R.S. Employer Identification No.)
|
|
|
|
|
555 East Lancaster Avenue
|
|
|
Radnor, Pennsylvania
|
19087
|
|
(Address of principal executive offices)
|
(Zip Code)
|
Registrant’s telephone number, including area code
(610) 325-5600
Securities registered pursuant to Section 12(b) of the Act:
|
Title of each class
|
Name of each exchange on which registered
|
|
Common Shares of Beneficial Interest,
|
New York Stock Exchange
|
|
par value $0.01 per share
|
|
|
(Brandywine Realty Trust)
|
|
|
|
|
|
6.90% Series E Cumulative Redeemable Preferred
|
New York Stock Exchange
|
|
Shares of Beneficial Interest
|
|
|
par value $0.01 per share
|
|
|
(Brandywine Realty Trust)
|
|
|
|
|
Securities registered pursuant to Section 12(g) of the Act:
Units of General Partnership Interest (Brandywine Operating Partnership, L.P.)
(Title of class)
Indicate by check mark if the registrant is a well-known seasoned issuer, as defined in Rule 405 of the Securities Act.
|
Brandywine Realty Trust
|
Yes
þ
No
o
|
|
Brandywine Operating Partnership, L.P.
|
Yes
þ
No
o
|
Indicate by check mark if the registrant is not required to file reports pursuant to Section 13 or Section 15(d) of the Act.
|
Brandywine Realty Trust
|
Yes
o
No
þ
|
|
Brandywine Operating Partnership, L.P.
|
Yes
o
No
þ
|
Indicate by check mark whether the registrant (1) has filed all reports required to be filed by Section 13 or 15(d) of the Securities Exchange Act of 1934 during the preceding 12 months (or for such shorter period that the registrant was required to file such reports), and (2) has been subject to such filing requirements for the past 90 days.
|
Brandywine Realty Trust
|
Yes
þ
No
o
|
|
Brandywine Operating Partnership, L.P.
|
Yes
þ
No
o
|
Indicate by check mark whether the registrant has submitted electronically and posted on its corporate Web site, if any, every Interactive Data File required to be submitted and posted pursuant to Rule 405 of Regulation S-T (§232.405 of this chapter) during the preceding 12 months (or for such shorter period that the registrant was required to submit and post such files).
|
Brandywine Realty Trust
|
Yes
þ
No
o
|
|
Brandywine Operating Partnership, L.P.
|
Yes
þ
No
o
|
1
Indicate by check mark if disclosure of delinquent filers pursuant to Item 405 of Regulation S-K is not contained herein, and will not be contained, to the best of Registrant’s knowledge, in definitive proxy or information statements incorporated by reference in Part III of this Form 10-K or any amendment to this Form 10-K.
þ
Indicate by check mark whether the registrant is a large accelerated filer, an accelerated filer, a non-accelerated filer or a smaller reporting company. See the definitions of “large accelerated filer,” “accelerated filer” and “smaller reporting company” in Rule 12b-2 of the Exchange Act (Check one):
Brandywine Realty Trust:
Large accelerated filer þ Accelerated filer o Non-accelerated filer o Smaller reporting company o
Large accelerated filer þ Accelerated filer o Non-accelerated filer o Smaller reporting company o
Brandywine Operating Partnership, L.P.:
Large accelerated filer o Accelerated filer o Non-accelerated filer þ Smaller reporting company o
Large accelerated filer o Accelerated filer o Non-accelerated filer þ Smaller reporting company o
Indicate by check mark whether the registrant is a shell company (as defined in Rule 12b-2 of the Exchange Act).
|
Brandywine Realty Trust
|
Yes
o
No
þ
|
|
Brandywine Operating Partnership, L.P.
|
Yes
o
No
þ
|
As of June 28, 2013, the aggregate market value of the Common Shares of Beneficial Interest held by non-affiliates of Brandywine Realty Trust was
$2,091,192,105
based upon the last reported sale price of $13.52 per share on the New York Stock Exchange on June 28, 2013. An aggregate of
156,738,955
Common Shares of Beneficial Interest were outstanding as of February 20, 2014.
As of June 28, 2013, the aggregate market value of the 1,763,639 common units of limited partnership (“Units”) held by non-affiliates of Brandywine Operating Partnership, L.P. was $23,844,399 based upon the last reported sale price of $13.52 per share on the New York Stock Exchange on June 28, 2013 of the Common Shares of Beneficial Interest of Brandywine Realty Trust, the sole general partner of Brandywine Operating Partnership, L.P. (For this computation, the Registrant has excluded the market value of all Units beneficially owned by Brandywine Realty Trust.)
Documents Incorporated By Reference
Portions of the proxy statement for the 2014 Annual Meeting of Shareholders of Brandywine Realty Trust are incorporated by reference into Part III of this Form 10-K.
2
EXPLANATORY NOTE
This report combines the annual reports on Form 10-K for the year ended
December 31, 2013
of Brandywine Realty Trust (the “Parent Company”) and Brandywine Operating Partnership, L.P. (the “Operating Partnership”). The Parent Company is a Maryland real estate investment trust, or REIT, that owns its assets and conducts its operations through the Operating Partnership, a Delaware limited partnership, and subsidiaries of the Operating Partnership. The Parent Company, the Operating Partnership and their consolidated subsidiaries are collectively referred to in this report as the “Company”. In addition, terms such as “we”, “us”, or “our” used in this report may refer to the Company, the Parent Company, or the Operating Partnership.
The Parent Company is the sole general partner of the Operating Partnership and as of
December 31, 2013
, owned a
98.8%
interest in the Operating Partnership. The remaining
1.2%
interest consists of common units of limited partnership interest issued by the Operating Partnership to third parties in exchange for contributions of properties to the Operating Partnership. As the sole general partner of the Operating Partnership, the Parent Company has full and complete authority over the Operating Partnership’s day-to-day operations and management.
As general partner with control of the Operating Partnership, the Parent Company consolidates the Operating Partnership for financial reporting purposes, and the Parent Company does not have significant assets other than its investment in the Operating Partnership. Therefore, the assets and liabilities of the Parent Company and the Operating Partnership are the same on their respective financial statements. The separate discussions of the Parent Company and the Operating Partnership in this report should be read in conjunction with each other to understand the results of the Company's operations on a consolidated basis and how management operates the Company.
Management operates the Parent Company and the Operating Partnership as one enterprise. The management of the Parent Company consists of the same members as the management of the Operating Partnership. These members are officers of both the Parent Company and of the Operating Partnership.
The Company believes that combining the annual reports on Form 10-K of the Parent Company and the Operating Partnership into a single report will result in the following benefits:
|
•
|
facilitate a better understanding by the investors of the Parent Company and the Operating Partnership by enabling them to view the business as a whole in the same manner as management views and operates the business;
|
|
•
|
remove duplicative disclosures and provide a more straightforward presentation in light of the fact that a substantial portion of the disclosure applies to both the Parent Company and the Operating Partnership; and
|
|
•
|
create time and cost efficiencies through the preparation of one combined report instead of two separate reports.
|
There are few differences between the Parent Company and the Operating Partnership, which are reflected in the footnote disclosures in this report. The Company believes it is important to understand the differences between the Parent Company and the Operating Partnership in the context of how these entities operate as an interrelated consolidated company. The Parent Company is a REIT, whose only material asset is its ownership of the partnership interests of the Operating Partnership. As a result, the Parent Company does not conduct business itself, other than acting as the sole general partner of the Operating Partnership, issuing public equity from time to time and guaranteeing the debt obligations of the Operating Partnership. The Operating Partnership holds substantially all the assets of the Company and directly or indirectly holds the ownership interests in the Company’s real estate ventures. The Operating Partnership conducts the operations of the Company’s business and is structured as a partnership with no publicly traded equity. Except for net proceeds from equity issuances by the Parent Company, which are contributed to the Operating Partnership in exchange for partnership units, the Operating Partnership generates the capital required by the Company’s business through the Operating Partnership’s operations, by the Operating Partnership’s direct or indirect incurrence of indebtedness or through the issuance of partnership units of the Operating Partnership or equity interests in subsidiaries of the Operating Partnership.
The equity and non-controlling interests in the Parent Company and the Operating Partnership’s equity are the main areas of difference between the consolidated financial statements of the Parent Company and the Operating Partnership. The common units of limited partnership interest in the Operating Partnership are accounted for as partners’ equity in the Operating Partnership’s financial statements while the common units of limited partnership interests held by parties other than the Parent Company are presented as non-controlling interests in the Parent Company’s financial statements. The differences between the Parent Company and the Operating Partnership’s equity relate to the differences in the equity issued at the Parent Company and Operating Partnership levels.
To help investors understand the significant differences between the Parent Company and the Operating Partnership, this report presents the following as separate notes or sections for each of the Parent Company and the Operating Partnership:
|
•
|
Consolidated Financial Statements;
|
3
|
•
|
Parent Company’s and Operating Partnership’s Equity
|
This report also includes separate Item 9A. (Controls and Procedures) disclosures and separate Exhibit 31 and 32 certifications for each of the Parent Company and the Operating Partnership in order to establish that the Chief Executive Officer and the Chief Financial Officer of each entity have made the requisite certifications and that the Parent Company and Operating Partnership are compliant with Rule 13a-15 or Rule 15d-15 of the Securities Exchange Act of 1934, as amended, and 18 U.S.C. § 1350.
In order to highlight the differences between the Parent Company and the Operating Partnership, the separate sections in this report for the Parent Company and the Operating Partnership specifically refer to the Parent Company and the Operating Partnership. In the sections that combine disclosures of the Parent Company and the Operating Partnership, this report refers to such disclosures as those of the Company.
4
TABLE OF CONTENTS
|
|
Page
|
|
|
|
|
|
|
|
|
|
|
|
|
|
|
|
|
|
|
|
|
|
|
|
|
|
|
|
|
|
|
|
|
|
|
|
|
|
|
|
|
|
|
|
|
|
|
|
|
|
|
|
|
|
|
|
|
|
|
|
|
|
|
|
5
|
|
|
|
|
|
|
|
|
|
|
|
|
Exhibit 3.1.29
|
|
|
Exhibit 10.16
|
|
|
Exhibit 12.1
|
|
|
Exhibit 12.2
|
|
|
Exhibit 21
|
|
|
Exhibit 23.1
|
|
|
Exhibit 23.2
|
|
|
Exhibit 31.1
|
|
|
Exhibit 31.2
|
|
|
Exhibit 31.3
|
|
|
Exhibit 31.4
|
|
|
Exhibit 32.1
|
|
|
Exhibit 32.2
|
|
|
Exhibit 32.3
|
|
|
Exhibit 32.4
|
|
|
Exhibit 99.1
|
|
|
EX-101 INSTANCE DOCUMENT
|
|
|
EX-101 SCHEMA DOCUMENT
|
|
|
EX-101 CALCULATION LINKBASE DOCUMENT
|
|
|
EX-101 LABELS LINKBASE DOCUMENT
|
|
|
EX-101 PRESENTATION LINKBASE DOCUMENT
|
|
|
EX-101 DEFINITION LINKBASE DOCUMENT
|
|
6
Filing Format
This combined Form 10-K is being filed separately by Brandywine Realty Trust (the “Parent Company”) and Brandywine Operating Partnership, L.P. (the “Operating Partnership”).
Forward-Looking Statements
The Private Securities Litigation Reform Act of 1995 provides a “safe harbor” for forward-looking statements. This Annual Report on Form 10-K and other materials filed by us with the Securities and Exchange Commission (the "SEC") (as well as information included in oral or other written statements made by us) contain statements that are forward-looking, including statements relating to business and real estate development activities, acquisitions, dispositions, future capital expenditures, financing sources, governmental regulation (including environmental regulation) and competition. We intend such forward-looking statements to be covered by the safe-harbor provisions of the 1995 Act. The words “anticipate,” “believe,” “estimate,” “expect,” “intend,” “will,” “should” and similar expressions, as they relate to us, are intended to identify forward-looking statements. Although we believe that the expectations reflected in such forward-looking statements are based on reasonable assumptions, we can give no assurance that our expectations will be achieved. As forward-looking statements, these statements involve important risks, uncertainties and other factors that could cause actual results to differ materially from the expected results and, accordingly, such results may differ from those expressed in any forward-looking statements made by us or on our behalf. Factors that could cause actual results to differ materially from our expectations include, but are not limited to:
|
•
|
the continuing impact of modest global economic growth, which is having and may continue to have a negative effect on the following, among other things:
|
|
•
|
the fundamentals of our business, including overall market occupancy, demand for office space and rental rates;
|
|
•
|
the financial condition of our tenants, many of which are financial, legal and other professional firms, our lenders, counterparties to our derivative financial instruments and institutions that hold our cash balances and short-term investments, which may expose us to increased risks of default by these parties;
|
|
•
|
the availability of financing on attractive terms or at all, which may adversely impact our future interest expense and our ability to pursue acquisition and development opportunities and refinance existing debt; and
|
|
•
|
a decline in real estate asset valuations, which may limit our ability to dispose of assets at attractive prices or obtain or maintain debt financing secured by our properties or on an unsecured basis.
|
|
•
|
changes in local real estate conditions (including changes in rental rates and the number of properties that compete with our properties);
|
|
•
|
our failure to lease unoccupied space in accordance with our projections;
|
|
•
|
our failure to re-lease occupied space upon expiration of leases;
|
|
•
|
tenant defaults and the bankruptcy of major tenants;
|
|
•
|
increases in interest rates;
|
|
•
|
failure of interest rate hedging contracts to perform as expected and the effectiveness of such arrangements;
|
|
•
|
failure of acquisitions to perform as expected;
|
|
•
|
unanticipated costs associated with the acquisition, integration and operation of our acquisitions;
|
|
•
|
unanticipated costs to complete, lease-up and operate our developments and redevelopments;
|
|
•
|
unanticipated costs associated with land development, including building moratoriums and inability to obtain necessary zoning, land-use, building, occupancy and other required governmental approvals, construction cost increases or overruns and construction delays;
|
|
•
|
impairment charges;
|
|
•
|
increased costs for, or lack of availability of, adequate insurance, including for terrorist acts or environmental liabilities;
|
|
•
|
actual or threatened terrorist attacks;
|
|
•
|
the impact on workplace and tenant space demands driven by technology, employee culture and commuting patterns;
|
|
•
|
demand for tenant services beyond those traditionally provided by landlords;
|
|
•
|
liability and clean-up costs under environmental or other laws;
|
|
•
|
failure or bankruptcy of real estate venture partners;
|
|
•
|
inability of real estate venture partners to fund venture obligations;
|
|
•
|
failure to manage effectively our growth into new product types within our real estate venture arrangements;
|
|
•
|
failure of dispositions to close in a timely manner;
|
|
•
|
failure of buyers of our properties to comply with terms of their financing agreements to us;
|
|
•
|
earthquakes and other natural disasters;
|
|
•
|
the unforeseen impact of climate change and compliance costs relating to laws and regulations governing climate change;
|
|
•
|
risks associated with federal, state and local tax audits;
|
7
|
•
|
complex regulations relating to our status as a REIT and the adverse consequences of our failure to qualify as a REIT; and
|
|
•
|
the impact of newly adopted accounting principles on our accounting policies and on period-to-period comparisons of financial results.
|
Given these uncertainties, and the other risks identified in the “Risk Factors” section and elsewhere in this Annual Report on Form 10-K, we caution readers not to place undue reliance on forward-looking statements. We assume no obligation to update or supplement forward-looking statements that become untrue because of subsequent events.
|
Item 1.
|
Business
|
Introduction
We are a self-administered and self-managed REIT that provides leasing, property management, development, redevelopment, acquisition and other tenant-related services for a portfolio of office, mixed-use and industrial properties. As of
December 31, 2013
, we owned
204
properties that contain an aggregate of approximately
24.8 million
net rentable square feet and consist of
176
office properties,
19
industrial facilities,
five
mixed-use properties,
one
development property,
two
redevelopment properties and
one
re-entitlement property (collectively, the “Properties”). In addition, as of
December 31, 2013
, we owned economic interests in
17
unconsolidated real estate ventures that that own properties that contain approximately
5.7 million
net rentable square feet (collectively, the “Real Estate Ventures”). As of
December 31, 2013
, we also owned
432
acres of undeveloped land, and held options to purchase approximately
51
additional acres of undeveloped land. As of December 31, 2013, the total potential development that these land parcels could support under current zoning, entitlements or combination thereof, amounted to
6.8 million
square feet. The Properties and the properties owned by the Real Estate Ventures are located in or near Philadelphia, Pennsylvania; Metropolitan Washington, D.C.; Southern New Jersey; Richmond, Virginia; Wilmington, Delaware; Austin, Texas and Oakland, Concord, and Carlsbad, California. In addition to managing properties that we own, as of
December 31, 2013
, we were managing approximately
7.9 million
net rentable square feet of office and industrial properties for third parties and the Real Estate Ventures. Unless otherwise indicated, all references in this Form 10-K to square feet represent net rentable area. We do not have any foreign operations and our business is not seasonal. Our operations are not dependent on a single tenant or a few tenants and no single tenant accounted for more than 10% of our total 2013 revenue.
Organization
The Parent Company was organized and commenced its operations in 1986 as a Maryland REIT. The Parent Company owns its assets and conducts its operations through the Operating Partnership and subsidiaries of the Operating Partnership. The Operating Partnership was formed in 1996 as a Delaware limited partnership. The Parent Company controls the Operating Partnership as its sole general partner. As of
December 31, 2013
, the Parent Company owned a
98.8%
interest in the Operating Partnership. The remaining
1.2%
interest in the Operating Partnership consists of common units of limited partnership interest issued to the holders in exchange for contributions of properties to the Operating Partnership. Our structure as an “UPREIT” is designed, in part, to permit persons contributing properties to us to defer some or all of the tax liability they might otherwise incur in a sale of properties. Our executive offices are located at 555 East Lancaster Avenue, Suite 100, Radnor, Pennsylvania 19087 and our telephone number is (610) 325-5600. We have offices in Philadelphia, Pennsylvania; McLean, Virginia; Mount Laurel, New Jersey; Richmond, Virginia; Austin, Texas; and Carlsbad, California. We have an internet website at www.brandywinerealty.com. We are not incorporating by reference into this Annual Report on Form 10-K any material from our website. The reference to our website is an inactive textual reference to the uniform resource locator (URL) and is for your reference only.
2013 Transactions
Real Estate Acquisitions
On December 19, 2013, we increased our equity ownership interest in One and Two Commerce Square, two Class A trophy office properties in Philadelphia, Pennsylvania, from 25% to 99%. These two properties contain
1,896,142
of net rentable square feet of office space and were 83.7% and 89.6% occupied, respectively, as of December 31, 2013. We acquired the additional ownership interests from an unaffiliated third party for cash proceeds of
$73.1 million
. We used available corporate funds for the cash portion of the acquisition price.
8
In connection with the acquisition of One Commerce Square, we assumed a
$125.1 million
existing non-recourse first mortgage with a fixed interest rate of
5.67%
and a maturity date of January 6, 2016. In connection with the acquisition of Two Commerce Square, we assumed a
$112.0 million
existing non-recourse first mortgage with a fixed interest rate of
3.96%
and a maturity date of April 5, 2023.
On
December 19, 2013
, we acquired, from an unaffiliated third party, a two building office property totaling
192,396
of net rentable square feet known as Four Points Centre, together with
22.3
acres of nearby land parcels in Austin, Texas for an aggregate
$47.3 million
. This office property was
99.2%
occupied as of
December 31, 2013
. We funded the acquisition price with available corporate funds.
On
November 19, 2013
, we acquired, from an unaffiliated third party, the
0.8
acre land parcel underlying our Cira Centre office tower in Philadelphia, Pennsylvania for
$24.6 million
. We had developed and owned Cira Centre on land subject to a long-term ground lease, and our acquisition of the land resulted in termination of the ground lease. We funded the acquisition with available corporate funds and capitalized
$1.4 million
of acquisition related costs as part of our basis in the operating land.
On
April 25, 2013
, we acquired the
1.8
acre land parcel underlying our Three Logan Square office tower in
Philadelphia, Pennsylvania
for
$20.8 million
. We acquired Three Logan Square in 2010 on land subject to a long-term ground lease, and, as part of our 2010 acquisition, held an option to acquire the land. Our 2013 acquisition of the land resulted in termination of the ground lease. We funded the acquisition with available corporate funds and capitalized
$0.1 million
of acquisition related costs as part of basis in the operating land.
For additional information on our 2013 acquisitions, please see Item 2 of this Form 10-K below.
Real Estate Dispositions
On
December 19, 2013
, we sold a
50,000
net rentable square feet office property located in
King of Prussia, Pennsylvania
known as
875 First Avenue
, for a sales price of
$3.8 million
resulting in a
$0.1 million
gain on sale after closing and other transaction related costs.
On
October 17, 2013
, we sold a
39,330
net rentable square feet office property located in
West Chester, Pennsylvania
known as
1336 Enterprise Drive
, for a sales price of
$2.6 million
resulting in a $0.2 million gain on sale after closing and other transaction related costs.
On
August 5, 2013
, the Company sold an
eight
-acre parcel of land located in
Richmond, Virginia
known as Dabney Land East, for a sales price of
$0.5 million
resulting in a $0.1 million loss on sale after closing and other transaction related costs. The land parcel was undeveloped as of the date of sale.
On
June 28, 2013
, the Company sold 16870 West Bernardo Drive, a
68,708
net rentable square feet office property located in
San Diego, California
, for a sales price of
$18.0 million
resulting in a $0.9 million loss on sale after closing and other transaction related costs.
On
June 28, 2013
, the Company sold 100 Arrandale Boulevard, a
34,931
net rentable square feet office property located in
Exton, Pennsylvania
, for a sales price of
$3.5 million
resulting in a $0.4 million loss on sale after closing and other transaction related costs.
On
June 19, 2013
, the Company sold 1700 Paoli Pike, a
28,000
net rentable square feet office property located in
Malvern, Pennsylvania
known as 100 Applebrook, for a sales price of
$2.7 million
resulting in a $0.4 million loss on sale after closing and other transaction related costs.
On
June 14, 2013
, the Company sold Pacific View Plaza, a
51,695
net rentable square feet office property located in
Carlsbad, California
, for a sales price of
$10.3 million
resulting in a $0.5 million loss on sale after closing and other transaction related costs.
On
February 25, 2013
, the Company sold a portfolio of
eight
office properties, containing
800,546
square feet in
Lawrenceville, New Jersey
for an aggregate sales price of
$121.0 million
resulting in a $5.3 million gain on sale after closing and other transaction related costs.
9
Austin Venture Formation
On
October 16, 2013
, we contributed a portfolio of
seven
office properties containing an aggregate of
1,398,826
net rentable square feet and located in Austin, Texas (the "Austin Properties") to a new unconsolidated real estate venture (the "Austin Venture") that we formed with G&I VII Austin Office LLC (“DRA”), an investment vehicle unaffiliated with us and advised by DRA Advisors LLC. The Austin Properties and related assets represent our entire remaining property portfolio within the Austin, Texas region, with the exception of Four Points Centre which was acquired in December 2013. Based on arm's-length negotiation, we and DRA agreed to a
$330.0 million
aggregate gross valuation of the properties we contributed into the Austin Venture subject to our obligation to fund the first
$5.2 million
of post-closing capital expenditures of the Austin Venture, of which $0.8 million had been funded by us through December 31, 2013.
We and DRA each own a
50%
interest in the Austin Venture, subject to our receipt of a "promoted interest" that entitles us to receive (in addition to receipts on account of our 50% interest) up to an additional
10%
of net proceeds from capital events, such as property sales, if and after DRA and we have received an agreed upon internal rate of return on our respective capital contributions to the Austin Venture.
Upon its formation, the Austin Venture obtained third party non-recourse debt financing of approximately
$230.6 million
secured by mortgages on the Austin Properties and used proceeds of this financing together with
$49.7 million
of cash contributed to the Austin Venture by DRA (less
$1.9 million
of closing costs and
$6.9 million
of closing prorations and lender holdbacks) to fund a
$271.5 million
distribution to us. We have agreed to fund the first
$5.2 million
of post-closing capital expenditures on behalf of the Austin Venture, resulting in net proceeds to us of
$266.3 million
after funding our capital expenditure obligation. As part of the transaction, our subsidiary management company executed an agreement with the Austin Venture to provide property management and leasing services to the Austin Venture in exchange for a market-based fee.
4040 Wilson Venture Formation
On
July 31, 2013
, we formed 4040 Wilson LLC Venture ("4040 Wilson"), as a joint venture between us and Ashton Park Associates LLC (“Ashton Park”), an unaffiliated third party. We and Ashton Park each owns a
50%
interest in 4040 Wilson. 4040 Wilson expects to construct a 426,900 square foot office building representing the final phase of the eight building, mixed-use, Liberty Center complex developed by the parent company of Ashton Park in the Ballston submarket of Arlington, Virginia. 4040 Wilson expects to develop the office building on a
1.3
acre land parcel contributed by Ashton Park to 4040 Wilson at an agreed upon valuation of
$36.0 million
. The total estimated project costs are
$194.1
million, which we expect will be financed through approximately
$72.0
million of partner capital contributions (consisting of
$36.0 million
in cash from the Company and land with a value of
$36.0 million
from Ashton Park) and approximately
$125.1
million of debt financing through a construction lender that has not yet been determined. We expect groundbreaking to commence upon achievement of certain of pre-leasing levels, at which point 4040 Wilson would expect to obtain debt financing for a portion of the project costs.
In our joint venture agreement with Ashton Park, we agreed to guarantee 100% of any lender mandated recourse. As of December 31, 2013, we had no outstanding guarantees related to 4040 Wilson.
Two and Six Tower Bridge Exchange Transaction
On June 19, 2013, we acquired an unaffiliated third party's ownership interest in Six Tower Bridge, an office property containing 116,174 net rentable square feet in Conshohocken, Pennsylvania. Prior to the June 2013 acquisition, we had a 63% ownership interest in the real estate venture that held title to this property. We acquired full ownership of Six Tower Bridge by exchanging our entire 37% ownership interest in a separate real estate venture that held title to Two Tower Bridge, an office property also in Conshohocken, for the remaining 35% ownership interest in Six Tower Bridge. Please see Note 4, "Investment in Unconsolidated Real Estate Ventures," to our consolidated financial statements for further discussion.
evo at Cira Centre South Venture (formerly the Grove Venture)
On
January 25, 2013
, we formed the HSRE-Campus Crest IX Real Estate Venture ("evo at Cira"), a joint venture among the Company and two unaffiliated third parties: Campus Crest Properties, LLC ("Campus Crest") and HSRE-Campus Crest IXA, LLC ("HSRE"). evo at Cira has commenced construction of a
33
-story,
850
-bed student housing tower located in the University City submarket of Philadelphia, Pennsylvania. The project is targeted for completion during the third quarter of 2014. We and Campus Crest each own a
30%
interest in the evo at Cira and HSRE owns a
40%
interest. evo at Cira is developing the project on a
one
-acre land parcel held under a long-term ground lease with the University of Pennsylvania, as ground lessor. We contributed to evo at Cira our tenancy rights under the long-term ground lease, together with associated development rights, at an agreed-upon value of
$8.5 million
. The total estimated project costs are
$158.5 million
, which are being financed through partner capital contributions totaling
$60.7 million
, and through
$97.8 million
of secured debt construction financing provided by PNC Bank,
10
Capital One, and First Niagara Bank. We and Campus Crest have each provided, in addition to customary non-recourse carve-out guarantees, a completion and cost overrun guaranty, as well as a payment guaranty, on the construction financing (with the share of the payment guaranty for each of us and Campus Crest being approximately
$24.7 million
). As of December 31, 2013, we have funded 100% of our anticipated equity contributions. Construction has already commenced, with a targeted project completion in 2014.
The Parc at Plymouth Meeting Venture
Our 50%-owned unconsolidated real estate venture with Toll Brothers, Inc., a residential home builder, owns a 20-acre parcel of land located in Plymouth Meeting, Pennsylvania, which we contributed to the venture upon its formation in 2012 at a negotiated valuation of $15.5 million. This venture, known as “TB-BDN Plymouth Apartments, L.P.,” commenced construction of a 398 unit apartment complex in 2013 and we expect this development to be completed in the fourth quarter of 2015. We expect the project will cost approximately $77.0 million, of which $25.0 million had been funded as of December 31, 2013 through capital contributions to the venture consisting of $15.5 million funded by us through our land contribution and $15.5 million funded by Toll Brothers in cash and net of a $3.0 million excess capital distribution made to each partner in December 2013. We expect to fund a substantial portion of the remaining costs through a $56.0 million secured construction loan. The TB-BDN Plymouth Venture obtained this construction loan in December 2013. In addition to providing the lender a guaranty of 50% of costs overruns on the construction, we have provided the lender a payment guaranty on the loan covering $3.2 million.
BDN Beacon Venture Termination
On
March 26, 2013
, we sold our entire
20%
ownership interest in an unconsolidated real estate venture that had been known as BDN Beacon Venture LLC (the "Beacon Venture"). The carrying amount of our investment in the Beacon Venture was
$17.0 million
at the sale date, with our share of the sales proceeds effectively matching the carrying amount.
Developments
As of
December 31, 2013
, we owned
432
acres of undeveloped land, and held options to purchase approximately
51
additional acres of undeveloped land.
We are a party to a development agreement and related ground leases with the University of Pennsylvania covering two adjacent parcels of land. As described above under "evo at Cira Centre South Venture (formerly the Grove Venture)", on January 25, 2013, we contributed our development and ground lease rights in one of the land parcels to the evo at Cira, which has commenced construction of a student housing tower.
As to the other land parcel, we have the right, on terms and conditions in the development agreement and applicable ground lease, to commence development of such other parcel by December 31, 2015. On October 31, 2013, we determined to proceed with development of the Cira Walnut Tower ("Cira Walnut"), which we currently contemplate as a 47-story office and residential tower at 30
th
and Walnut Streets in Philadelphia. We currently expect Cira Walnut to be ready for initial occupancy during the second quarter of 2016 and to include approximately 575,000 square feet of office space, 245,000 square feet of residential space consisting of 260 market rate finished and unfinished rental apartment units, and 10,000 square feet of retail space, with an additional floor containing a full range of amenities.
As of December 31, 2013, we have pre-leased an aggregate of 61% of the office square feet of Cira Walnut. The anchor tenant for approximately 253,000 square feet of this office space under a 16 year lease is FMC Corporation, a diversified chemical company serving agricultural, consumer and industrial markets globally. In addition, we have pre-leased 100,000 square feet of office space to the University of Pennsylvania under a 20-year lease. Cira Walnut will be known as The FMC Tower at Cira Centre South.
We currently anticipate that the office component of the project will cost approximately $236.0 million with the residential and retail components costing approximately $105.0 million for a total project cost of $341.0 million. We intend to fund these development costs through a combination of existing cash balances, capital raised through one or more joint venture formations, proceeds from additional asset sales and equity and debt financing including third party sources. Our current expectation is to either joint venture or pre-sell the residential component of the FMC Tower at Cira Centre South. We have executed a non-binding letter of intent with a residential development and operating company that contemplates either outcome.
Our ground lease with the University of Pennsylvania has a term through July 2097, with a variable rent that would provide the University with a percentage of the cash flow or proceeds of specified capital events subject to receipt of a priority return on eligible investments.
11
We are currently redeveloping an office property known as 660 West Germantown Pike. This property contains 154,392 net rentable square feet and is located in Plymouth Meeting, Pennsylvania. We acquired this property in 2012 for $9.1 million and we expect to complete its redevelopment in the first quarter of 2014. We expect the total redevelopment costs to be $27.9 million (including the initial acquisition cost), of which $26.7 million had been funded as of December 31, 2013. We expect to fund the balance of the costs with available corporate funds. This property was 80.3% leased at December 31, 2013.
We are currently developing a retail and restaurant complex that will contain 17,884 net rentable square feet complex and will be located on Radnor Chester Road, in Radnor, Pennsylvania. We acquired this property in April 2013 and expect to complete the development in the first quarter of 2014. We expect the total development costs to be $7.4 million (including the land acquisition cost), of which $6.0 million had been funded as of December 31, 2013. We expect to fund the balance of the costs with available corporate funds. This property was 90.7% pre-leased to various tenants at December 31, 2013.
Business Objective and Strategies for Growth
Our business objective is to deploy capital effectively to maximize our return on investment and thereby maximize our total return to shareholders. To accomplish this objective we seek to:
|
•
|
concentrate on urban town centers and central business districts in selected regions, and be the best of class owner and developer in those markets;
|
|
•
|
maximize cash flow through leasing strategies designed to capture rental growth as rental rates increase and as leases are renewed;
|
|
•
|
attain a high tenant retention rate by providing a full array of property management and maintenance services and tenant service programs responsive to the varying needs of our diverse tenant base;
|
|
•
|
form joint venture opportunities with high-quality partners having attractive real estate holdings or significant financial resources;
|
|
•
|
utilize our reputation as a full-service real estate development and management organization to identify acquisition and development opportunities that will expand our business and create long-term value; and
|
|
•
|
increase the economic diversification of our tenant base while maximizing economies of scale.
|
We also consider the following to be important objectives:
|
•
|
to acquire and develop high-quality office and industrial properties at attractive yields in markets that we expect will experience economic growth and where we can achieve operating efficiencies;
|
|
•
|
to monetize or deploy our land inventory for development of high-quality office and industrial properties, or rezone from office/industrial to residential, retail and hotel to align with market and demand shifts as appropriate; and
|
|
•
|
to capitalize on our redevelopment expertise to selectively develop, redevelop and reposition properties in desirable locations that other organizations may not have the resources to pursue.
|
We expect to concentrate our real estate activities in markets where we believe that:
|
•
|
current and projected market rents and absorption statistics justify construction activity;
|
|
•
|
we can maximize market penetration by accumulating a critical mass of properties and thereby enhance operating efficiencies;
|
|
•
|
barriers to entry (such as zoning restrictions, utility availability, infrastructure limitations, development moratoriums and limited developable land) will create supply constraints on office and industrial space; and
|
|
•
|
there is potential for economic growth, particularly job growth and industry diversification.
|
Operating Strategy
We currently expect to continue to operate in markets where we have a concentration advantage due to economies of scale. We believe that where possible, it is best to operate with a strong base of properties in order to benefit from the personnel allocation and the market strength associated with managing multiple properties in the same market. We also intend to selectively dispose of properties and redeploy capital if we determine a property cannot meet our long term earnings growth expectations. We believe that recycling capital is an important aspect of maintaining the overall quality of our portfolio.
Our broader strategy remains focused on continuing to enhance liquidity and strengthen our balance sheet through capital retention, debt reduction, targeted sales activity and management of our existing and prospective liabilities.
In the long term, we believe that we are well positioned in our current markets and have the expertise to take advantage of both development and acquisition opportunities, as warranted by market and economic conditions, in new markets that have healthy
12
long-term fundamentals and strong growth projections. This capability, combined with what we believe is a conservative financial structure, should allow us to achieve disciplined growth. These abilities are integral to our strategy of having a diverse portfolio of assets, which will meet the needs of our tenants.
We use experienced on site construction superintendents, operating under the supervision of project managers and senior management, to control the construction process and mitigate the various risks associated with real estate development.
In order to fund developments, redevelopments and acquisitions, as well as refurbish and improve existing properties, we must use excess cash from operations after satisfying our dividend and other requirements. The availability of funds for new investments and maintenance of existing properties depends in large measure on capital markets and liquidity factors over which we can exert little control.
Policies With Respect To Certain Activities
The following is a discussion of our investment, financing and other policies. These policies have been determined by our Board of Trustees and our Board of Trustees may revise these policies without a vote of shareholders.
Investments in Real Estate or Interests in Real Estate
We may develop, purchase or lease income-producing properties for long-term investment, expand and improve the properties presently owned or other properties purchased, or sell such properties, in whole or in part, as circumstances warrant. Although there is no limitation on the types of development activities that we may undertake, we expect that our development activities will meet current market demand and will generally be on a build-to-suit basis for particular tenants where a significant portion of the building is pre-leased before construction begins. We continue to participate with other entities in property ownership through existing joint ventures or other types of co-ownership. Our equity investments may be subject to existing or future mortgage financing and other indebtedness that will have priority over our equity investments.
Securities of or Interests in Entities Primarily Engaged in Real Estate Activities and Other Issuers
Subject to the percentage of ownership limitations and gross income tests necessary for REIT qualification, we may invest in securities of other REITs, other entities engaged in real estate activities or securities of other issuers. We may enter into joint ventures or partnerships for the purpose of obtaining an equity interest in a particular property. We do not currently intend to invest in the securities of other issuers except in connection with joint ventures or acquisitions of indirect interests in properties.
Investments in Real Estate Mortgages
While our current portfolio consists of, and our business objectives emphasize, equity investments in commercial real estate, we may, at the discretion of management or our Board of Trustees, invest in other types of equity real estate investments, mortgages and other real estate interests. We do not presently intend to invest to a significant extent in mortgages or deeds of trust, but may invest in participating mortgages if we conclude that we may benefit from the cash flow or any appreciation in the value of the property securing a mortgage. From time to time, we provide seller financing to buyers of our properties. We do this when the buyer requires additional funds for the purchase and provision of seller financing will be beneficial to us and the buyer compared to a mortgage loan from a third party lender.
Dispositions
Our disposition of properties is based upon management’s periodic review of our portfolio and the determination by management or our Board of Trustees that a disposition would be in our best interests. We intend to use selective dispositions to fund our capital and refinancing needs.
Financing Policies
A primary objective of our financing policy has been to manage our financial position to allow us to raise capital from a variety of sources at competitive rates. Our mortgages, credit facilities and unsecured debt securities contain restrictions on our ability to incur indebtedness. Our charter documents do not limit the indebtedness that we may incur. Our financing strategy is to maintain a strong and flexible financial position by limiting our debt to a prudent level and minimizing our variable interest rate exposure. We intend to finance future growth and future maturing debt with the most advantageous source of capital then available to us. These sources may include selling additional common or preferred equity and debt securities through public offerings or private placements, utilizing availability under our credit facilities or incurring additional indebtedness through secured or unsecured borrowings. To qualify as a REIT, we must distribute to our shareholders each year at least ninety percent of our net taxable income, excluding any net capital gain. This distribution requirement limits our ability to fund future capital needs, including for acquisitions
13
and developments, from income from operations. Therefore, we expect to continue to rely on third party sources of capital to fund future capital needs.
Guarantees
As of
December 31, 2013
, we have provide guarantees on behalf of certain of the real estate ventures, consisting of (i) a
$24.7 million
payment guaranty on the construction loan for the project being undertaken by evo at Cira; (ii) a
$3.2 million
payment guarantee on the construction loan for a project being undertaken by TB-BDN Plymouth Apartments; and (iii) a
$0.5 million
payment guarantee on a loan provided to PJP VII. In addition, during construction undertaken by real estate ventures we have provided and expect to continue to provide cost overrun and completion guarantees, with rights of contribution among partners in the venture, as well as customary environmental indemnities and guarantees of customary exceptions to nonrecourse provisions in loan agreements.
Working Capital Reserves
We maintain working capital reserves and access to borrowings in amounts that our management determines to be adequate to meet our normal contingencies.
Policies with Respect to Other Activities
We expect to issue additional common and preferred equity in the future and may authorize our Operating Partnership to issue additional common and preferred units of limited partnership interest, including to persons who contribute their interests in properties to us in exchange for such units. We have not engaged in trading, underwriting or agency distribution or sale of securities of unaffiliated issuers and we do not intend to do so. We intend to make investments consistent with our qualification as a REIT, unless because of circumstances or changes in the Internal Revenue Code of 1986, as amended (or the Treasury Regulations), our Board of Trustees determines that it is no longer in our best interests to qualify as a REIT. We may make loans to third parties, including to joint ventures in which we participate and to buyers of our real estate. We intend to make investments in such a way that we will not be treated as an investment company under the Investment Company Act of 1940.
Management Activities
We provide third-party real estate management services primarily through wholly-owned subsidiaries of the Operating Partnership (collectively, the “Management Companies”). As of
December 31, 2013
, the Management Companies were managing properties containing an aggregate of approximately
32.7 million
net rentable square feet, of which approximately
24.8 million
net rentable square feet related to properties owned by us and approximately
7.9 million
net rentable square feet related to properties owned by third parties and unconsolidated Real Estate Ventures.
Geographic Segments
During the year ended
December 31, 2013
, we were managing our portfolio within seven segments: (1) Pennsylvania Suburbs, (2) Philadelphia Central Business District (“CBD”), (3) Metropolitan Washington D.C., (4) New Jersey/Delaware, (5) Richmond, Virginia, (6) Austin, Texas and (7) California. The Pennsylvania Suburbs segment includes properties in Chester, Delaware, and Montgomery counties in the Philadelphia suburbs. The Philadelphia CBD segment includes properties located in the City of Philadelphia in Pennsylvania. The Metropolitan Washington, D.C. segment includes properties in Northern Virginia and southern Maryland. The New Jersey/Delaware segment includes properties in Burlington and Camden counties in New Jersey and New Castle county in the state of Delaware. The Richmond, Virginia segment includes properties primarily in Albemarle, Chesterfield, Goochland and Henrico counties and
one
property in Durham, North Carolina. The Austin, Texas segment includes properties in Austin. On October 16, 2013 seven properties within the Austin portfolio were contributed to a newly formed real estate venture. After contributing the properties, the Company wholly owns one property in Austin, Texas. The California segment includes properties in Oakland, Concord, and Carlsbad. Our corporate group is responsible for cash and investment management, development of certain real estate properties during the construction period, and certain other general support functions.
14
Competition
The real estate business is highly competitive. Our Properties compete for tenants with similar properties primarily on the basis of location, total occupancy costs (including base rent and operating expenses), services provided, and the design and condition of the improvements. We also face competition when attempting to acquire or develop real estate, including competition from domestic and foreign financial institutions, other REITs, life insurance companies, pension funds, partnerships and individual investors. Additionally, our ability to compete depends upon trends in the economies of our markets, investment alternatives, financial condition and operating results of current and prospective tenants, availability and cost of capital, construction and renovation costs, land availability, our ability to obtain necessary construction approvals, taxes, governmental regulations, legislation and population trends.
Insurance
We maintain commercial general liability and “all risk” property insurance on our properties. We intend to obtain similar coverage for properties we acquire in the future. There are types of losses, generally of a catastrophic nature, such as losses from war, terrorism, environmental issues, floods, hurricanes and earthquakes that are subject to limitations in certain areas or which may be uninsurable risks. We exercise our discretion in determining amounts, coverage limits and deductibility provisions of insurance, with a view to maintaining appropriate insurance on our investments at a reasonable cost and on suitable terms. If we suffer a substantial loss, our insurance coverage may not be sufficient to pay the full current market value or current replacement cost of our lost investment. Inflation, changes in building codes and ordinances, environmental considerations and other factors also might make it impractical to use insurance proceeds to fully replace or restore a property after it has been damaged or destroyed.
Employees
As of
December 31, 2013
, we had
406
full-time employees, including
20
union employees.
Government Regulations Relating to the Environment
Many laws and governmental regulations relating to the environment apply to us and changes in these laws and regulations, or their interpretation by agencies and the courts, occur frequently and may adversely affect us.
Existing conditions at some of our Properties
. Independent environmental consultants have conducted Phase I or similar environmental site assessments on our Properties. We generally obtain these assessments prior to the acquisition of a property and may later update them as required for subsequent financing of the property or as requested by a tenant. Site assessments are generally performed to ASTM standards then existing for Phase I site assessments, and typically include a historical review, a public records review, a visual inspection of the surveyed site, and the issuance of a written report. These assessments do not generally include any soil samplings or subsurface investigations. Depending on the age of the property, the Phase I may have included an assessment of asbestos-containing materials. For properties where asbestos-containing materials were identified or suspected, an operations and maintenance plan was generally prepared and implemented. See Note 2 to our consolidated financial statements for our evaluation in accordance with the accounting standard governing asset retirement obligations.
Historical operations at or near some of our Properties, including the operation of underground storage tanks, may have caused soil or groundwater contamination. We are not aware of any such condition, liability or concern by any other means that would give rise to material, uninsured environmental liability. However, the assessments may have failed to reveal all environmental conditions, liabilities or compliance concerns; there may be material environmental conditions, liabilities or compliance concerns that a review failed to detect or which arose at a property after the review was completed; future laws, ordinances or regulations may impose material additional environmental liability; and current environmental conditions at our Properties may be affected in the future by tenants, third parties or the condition of land or operations near our Properties, such as the presence of underground storage tanks. We cannot be certain that costs of future environmental compliance will not affect our ability to make distributions to our shareholders.
Use of hazardous materials by some of our tenants.
Some of our tenants handle hazardous substances and wastes on our Properties as part of their routine operations. Environmental laws and regulations may subject these tenants, and potentially us, to liability resulting from such activities. We generally require our tenants, in their leases, to comply with these environmental laws and regulations and to indemnify us for any related liabilities. These tenants are primarily involved in the life sciences and the light industrial and warehouse businesses. We are not aware of any material noncompliance, liability or claim relating to hazardous or toxic substances or petroleum products in connection with any of our Properties, and we do not believe that on-going activities by our tenants will have a material adverse effect on our operations.
15
Costs related to government regulation and private litigation over environmental matters
. Under environmental laws and regulations, we may be liable for the costs of removal, remediation or disposal of hazardous or toxic substances present or released on our Properties. These laws could impose liability without regard to whether we are responsible for, or knew of, the presence or release of the hazardous materials. Government investigations and remediation actions may entail substantial costs and the presence or release of hazardous substances on a property could result in governmental cleanup actions or personal injury or similar claims by private plaintiffs.
Potential environmental liabilities may exceed our environmental insurance coverage limits.
We carry what we believe to be sufficient environmental insurance to cover potential liability for soil and groundwater contamination, mold impact, and the presence of asbestos-containing materials at the affected sites identified in our environmental site assessments. Our insurance policies are subject to conditions, qualifications and limitations. Therefore, we cannot provide any assurance that our insurance coverage will be sufficient to cover all liabilities for losses.
Potential environmental liabilities may adversely impact our ability to use or sell assets
. The presence of contamination or the failure to remediate contamination may impair our ability to sell or lease real estate or to borrow using the real estate as collateral.
Code of Conduct
We maintain a Code of Business Conduct and Ethics applicable to our Board of Trustees and all of our officers and employees, including our principal executive officer, principal financial officer, principal accounting officer, controller and persons performing similar functions. A copy of our Code of Business Conduct and Ethics is available on our website, www.brandywinerealty.com. In addition to being accessible through our website, copies of our Code of Business Conduct and Ethics can be obtained, free of charge, upon written request to Investor Relations, 555 East Lancaster Avenue, Suite 100, Radnor, PA 19087. Any amendments to or waivers of our Code of Business Conduct and Ethics that apply to our principal executive officer, principal financial officer, principal accounting officer, controller and persons performing similar functions and that relate to any matter enumerated in Item 406(b) of Regulation S-K promulgated by the SEC will be disclosed on our website.
Corporate Governance Principles and Board Committee Charters
Our Corporate Governance Principles and the charters of the Executive Committee, Audit Committee, Compensation Committee and Corporate Governance Committee of the Board of Trustees of Brandywine Realty Trust and additional information regarding our corporate governance are available on our website, www.brandywinerealty.com. In addition to being accessible through our website, copies of our Corporate Governance Principles and charters of our Board Committees can be obtained, free of charge, upon written request to Investor Relations, 555 Lancaster Avenue, Suite 100, Radnor, PA 19087.
Availability of SEC Reports
We file annual reports on Form 10-K, quarterly reports on Form 10-Q and current reports on Form 8-K and other information with the SEC. Members of the public may read and copy materials that we file with the SEC at the SEC’s Public Reference Room at 100 F Street, N.E., Washington, D.C. 20549. Members of the public may also obtain information on the Public Reference Room by calling the SEC at 1-800-732-0330. The SEC also maintains an Internet web site that contains reports, proxy and information statements and other information regarding issuers, including us, that file electronically with the SEC. The address of that site is http://www.sec.gov. Our annual reports on Form 10-K, quarterly reports on Form 10-Q and current reports on Form 8-K and other information filed by us with the SEC are available, without charge, on our Internet web site, http://www.brandywinerealty.com as soon as reasonably practicable after they are filed electronically with the SEC. Copies are also available, free of charge, upon written request to Investor Relations, Brandywine Realty Trust, 555 East Lancaster Avenue, Suite 100, Radnor, PA 19087.
|
Item 1A.
|
Risk Factors
|
Our business, financial condition, results from operations and ability to make distributions on our equity and to pay debt service on our indebtedness may be affected by the risk factors set forth below. All investors should consider the following risk factors before deciding to purchase our securities.
Adverse economic and geopolitical conditions could have a material adverse effect on our results of operations, financial condition and our ability to pay distributions to you.
Our business is affected by the ongoing recovery in the global economy, and other market or economic challenges experienced by the U.S. economy or the real estate industry as a whole. While there are signs of recovery in the U.S. economy, the recovery rate has been much slower than anticipated. Our portfolio consists primarily of office buildings (as compared to a more diversified real estate portfolio); if economic conditions again deteriorate, our results of operations, financial condition, financial results and
16
ability to service current debt and to pay distributions to our shareholders may be adversely affected by the following, among other potential conditions:
|
•
|
significant job losses in the financial and professional services industries may occur, which may decrease demand for our office space, causing market rental rates and property values to be negatively impacted;
|
|
•
|
our ability to borrow on terms and conditions that we find acceptable, or at all, may be limited, which could reduce our ability to complete development opportunities and refinance existing debt;
|
|
•
|
reduced values of our properties may limit our ability to dispose of assets at attractive prices or to obtain debt financing secured by our properties and may reduce the availability of unsecured loans;
|
|
•
|
the value and liquidity of our short-term investments and cash deposits could be reduced as a result of a deterioration of the financial condition of the institutions that hold our cash deposits or the institutions or assets in which we have made short-term investments, the dislocation of the markets for our short-term investments, increased volatility in market rates for such investments or other factors;
|
|
•
|
reduced liquidity in debt markets and increased credit risk premiums for certain market participants may impair our ability to access capital;
|
|
•
|
one or more lenders under our line of credit could refuse or be unable to fund their financing commitment to us and we may not be able to replace the financing commitment of any such lenders on favorable terms, or at all; and
|
|
•
|
the value of our investments could deteriorate and we could be required to reduce the carrying value of our equity method investments if a loss in the carrying value of the investment is other than a temporary decline pursuant to the accounting standard governing the equity method of accounting.
|
These conditions, which could have a material adverse effect on our results of operations, financial condition and ability to pay distributions, may continue or worsen in the future.
Our performance is subject to risks associated with our properties and with the real estate industry.
Our economic performance and the value of our real estate assets, and consequently the value of our securities, are subject to the risk that if our properties do not generate revenues sufficient to meet our operating expenses, including debt service and capital expenditures, our cash flow and ability to pay distributions to our shareholders will be adversely affected. Events or conditions beyond our control that may adversely affect our operations or the value of our properties include:
|
•
|
downturns in the national, regional and local economic climate including increases in the unemployment rate and inflation;
|
|
•
|
competition from other office, mixed-use, industrial and commercial buildings;
|
|
•
|
local real estate market conditions, such as oversupply or reduction in demand for office, industrial or commercial space;
|
|
•
|
changes in interest rates and availability of financing;
|
|
•
|
vacancies, changes in market rental rates and the need to periodically repair, renovate and re-lease space;
|
|
•
|
increased operating costs, including insurance expense, utilities, real estate taxes, janitorial costs, state and local taxes, labor shortages and heightened security costs;
|
|
•
|
civil disturbances, earthquakes and other natural disasters, or terrorist acts or acts of war which may result in uninsured or underinsured losses;
|
|
•
|
significant expenditures associated with each investment, such as debt service payments, real estate taxes, insurance and maintenance costs which are generally not reduced when circumstances cause a reduction in revenues from a property; and
|
|
•
|
declines in the financial condition of our tenants and our ability to collect rents from our tenants.
|
We face risks associated with the development of mixed-use commercial properties.
We operate, are currently developing, and may in the future develop, properties either alone or through joint ventures with other persons that are known as “mixed-use” developments. This means that in addition to the development of office space, the project may also include space for residential, retail, hotel or other commercial purposes. We have limited experience in developing and managing non-office real estate. As a result, if a development project includes a non-office or non-retail use, we may seek to develop that component ourselves, sell the rights to that component to a third-party developer with experience in that use or we may seek to partner with such a developer. If we do not sell the rights or partner with such a developer, or if we choose to develop the other component ourselves, we would be exposed not only to those risks typically associated with the development of commercial real estate generally, but also to specific risks associated with the development and ownership of non-office and non-retail real estate. In addition, even if we sell the rights to develop certain components or elect to participate in the development through a joint venture, we may be exposed to the risks associated with the failure of the other party to complete the development as expected. These include the risk that the other party would default on its obligations necessitating that we complete the other component ourselves (including providing any necessary financing). In the case of residential properties, these risks include competition for
17
prospective residents from other operators whose properties may be perceived to offer a better location or better amenities or whose rent may be perceived as a better value given the quality, location and amenities that the resident seeks. Because we have limited experience with residential properties, we expect to retain third parties to manage our residential properties. If we decide to not sell or participate in a joint venture and instead hire a third party manager, we would be dependent on them and their key personnel who provide services to us and we may not find a suitable replacement if the management agreement is terminated, or if key personnel leave or otherwise become unavailable to us.
We may suffer adverse consequences due to the financial difficulties, bankruptcy or insolvency of our tenants.
The current economic conditions have caused some of our tenants to experience financial difficulties. If more of our tenants were to continue to experience financial difficulties, including bankruptcy, insolvency or a general downturn in their business, there could be an adverse effect on our financial performance and distributions to shareholders. We cannot assure you that any tenant that files for bankruptcy protection will continue to pay us rent. A bankruptcy filing by or relating to one of our tenants or a lease guarantor would bar efforts by us to collect pre-bankruptcy debts from that tenant or lease guarantor, or its property, unless we receive an order permitting us to do so from the bankruptcy court. In addition, we cannot evict a tenant solely because of bankruptcy. The bankruptcy of a tenant or lease guarantor could delay our efforts to collect past due balances under the relevant leases, and could ultimately preclude collection of these sums. If a lease is assumed by the tenant in bankruptcy, all pre-bankruptcy balances due under the lease must be paid to us in full. If, however, a lease is rejected by a tenant in bankruptcy, we would have only a general, unsecured claim for damages. Any such unsecured claim would only be paid to the extent that funds are available and only in the same percentage as is paid to all other holders of general, unsecured claims. Restrictions under the bankruptcy laws further limit the amount of any other claims that we can make if a lease is rejected. As a result, it is likely that we would recover substantially less than the full value of the remaining rent during the term. See "Item 7. Management's Discussion and Analysis of Financial Condition and Results of Operations - Factors that May Influence Future Results of Operations - Tenant Credit Risk."
An increase in interest rates would increase our interest costs on variable rate debt and could adversely impact our ability to refinance existing debt or sell assets on favorable terms or at all.
As of December 31, 2013 we had $100.0 million of unhedged variable rate indebtedness and may incur additional such indebtedness in the future. If interest rates increase, then so would the interest costs on our unhedged variable rate debt, which could adversely affect our cash flow and our ability to pay principal and interest on our debt and our ability to make distributions to our shareholders. Further, rising interest rates could limit our ability to refinance existing debt when it matures or significantly increase our future interest expense. From time to time, we enter into interest rate swap agreements and other interest rate hedging contracts. While these agreements are intended to lessen the impact of rising interest rates on us, they also expose us to the risk that the other parties to the agreements will not perform, we could incur significant costs associated with the settlement of the agreements, the agreements will be unenforceable and the underlying transactions will fail to qualify as highly-effective cash flow hedges under the applicable accounting guidance. In addition, an increase in interest rates could decrease the amounts third-parties are willing to pay for our assets, thereby limiting our ability to change our portfolio promptly in response to changes in economic or other conditions.
Our degree of leverage could limit our ability to obtain additional financing or affect the market price of our equity shares or debt securities.
Like other real estate companies which incur debt, we are subject to risks associated with debt financing, such as the insufficiency of cash flow to meet required debt service payment obligations and the inability to refinance existing indebtedness. If our debt cannot be paid, refinanced or extended at maturity, we may not be able to make distributions to shareholders at expected levels or at all. Furthermore, an increase in our interest expense could adversely affect our cash flow and ability to make distributions to shareholders. If we do not meet our debt service obligations, any properties securing such indebtedness could be foreclosed on, which would have a material adverse effect on our cash flow and ability to make distributions and, depending on the number of properties foreclosed on, could threaten our continued viability. Our degree of leverage could also make us more vulnerable to a downturn in business or the economy in general.
The terms and covenants relating to our indebtedness could adversely impact our economic performance.
Our credit facilities, term loans and the indenture governing our unsecured public debt securities contain (and any new or amended facility and term loans will contain) restrictions, requirements and other limitations on our ability to incur indebtedness, including total debt to asset ratios, secured debt to total asset ratios, debt service coverage ratios and minimum ratios of unencumbered assets to unsecured debt which we must maintain. Our ability to borrow under our credit facilities is subject to compliance with such financial and other covenants. In the event that we fail to satisfy these covenants, we would be in default under the credit facilities, the term loans and the indenture and may be required to repay such debt with capital from other sources. Under such circumstances, other sources of capital may not be available to us, or may be available only on unattractive terms. In addition, the mortgages on
18
our properties contain customary covenants such as those that limit our ability, without the prior consent of the lender, to further mortgage the applicable property or to discontinue insurance coverage. If we breach covenants in our secured debt agreements, the lenders can declare a default and take possession of the property securing the defaulted loan.
A downgrading of our debt could subject us to higher borrowing costs.
In the event that our unsecured debt is downgraded by Moody’s Investor Services and Standard & Poor’s from the current ratings, we would likely incur higher borrowing costs and the market prices of our common shares and debt securities might decline.
We may experience increased operating costs, which might reduce our profitability.
Our properties are subject to increases in operating expenses such as for cleaning, electricity, heating, ventilation and air conditioning, administrative costs and other costs associated with security, landscaping and repairs and maintenance of our properties. In general, under our leases with tenants, we pass through all or a portion of these costs to them. We cannot assure you, however, that tenants will actually bear the full burden of these higher costs, or that such increased costs will not lead them, or other prospective tenants, to seek office space elsewhere. If operating expenses increase, the availability of other comparable office space in our core geographic markets might limit our ability to increase rents; if operating expenses increase without a corresponding increase in revenues, our profitability could diminish and limit our ability to make distributions to shareholders.
Our investment in property development or redevelopment may be more costly or difficult to complete than we anticipate.
We intend to continue to develop properties where market conditions warrant such investment. Once made, these investments may not produce results in accordance with our expectations. Risks associated with our development and construction activities include:
|
•
|
the unavailability of favorable financing alternatives in the private and public debt markets;
|
|
•
|
having sufficient capital to pay development costs;
|
|
•
|
dependence on the financial and professional services sector as part of our tenant base;
|
|
•
|
construction costs exceeding original estimates due to rising interest rates, diminished availability of materials and labor, and increases in the costs of materials and labor;
|
|
•
|
construction and lease-up delays resulting in increased debt service, fixed expenses and construction or renovation costs;
|
|
•
|
expenditure of funds and devotion of management’s time to projects that we do not complete;
|
|
•
|
the unavailability or scarcity of utilities;
|
|
•
|
occupancy rates and rents at newly completed properties may fluctuate depending on a number of factors, including market and economic conditions, resulting in lower than projected rental rates and a corresponding lower return on our investment;
|
|
•
|
complications (including building moratoriums and anti-growth legislation) in obtaining necessary zoning, occupancy and other governmental permits; and
|
|
•
|
increased use restrictions by local zoning or planning authorities limiting our ability to develop and impacting the size of developments.
|
See "Item 7. Management's Discussion and Analysis of Financial Condition and Results of Operations - Factors that May Influence Future Results of Operations - Development Risk."
We face risks associated with property acquisitions.
We have recently acquired properties, and may in the future continue to acquire properties and portfolios of properties, including large portfolios that would increase our size and potentially alter our capital structure. Although we believe that the acquisitions that we have completed and that we expect to undertake in the future have, and will, enhance our future financial performance, the success of such transactions is subject to a number of factors, including the risks that:
|
•
|
we may not be able to obtain financing for acquisitions on favorable terms;
|
|
•
|
acquired properties may fail to perform as expected;
|
|
•
|
the actual costs of repositioning or redeveloping acquired properties may be higher than our estimates;
|
|
•
|
acquired properties may be located in new markets where we may have limited knowledge and understanding of the local economy, an absence of business relationships in the area or unfamiliarity with local governmental and permitting procedures; and
|
|
•
|
we may not be able to efficiently integrate acquired properties, particularly portfolios of properties, into our organization and manage new properties in a way that allows us to realize cost savings and synergies.
|
19
Acquired properties may subject us to known and unknown liabilities.
Properties that we acquire may be subject to known and unknown liabilities for which we would have no recourse, or only limited recourse, to the former owners of such properties. As a result, if a liability were asserted against us based upon ownership of an acquired property, we might be required to pay significant sums to settle it, which could adversely affect our financial results and cash flow. Unknown liabilities relating to acquired properties could include:
|
•
|
liabilities for clean-up of pre-existing disclosed or undisclosed environmental contamination;
|
|
•
|
claims by tenants, vendors or other persons arising on account of actions or omissions of the former owners of the properties; and
|
|
•
|
liabilities incurred in the ordinary course of business.
|
The acquisition of new properties or the development of new properties which lack operating history with us may give rise to difficulties in predicting revenue potential.
New acquisitions and developments could fail to perform in accordance with expectations. If we fail to accurately estimate occupancy levels, operating costs or costs of improvements to bring an acquired property or a development property up to the standards established for our intended market position, the performance of the property may be below expectations. Acquired properties may have characteristics or deficiencies affecting their valuation or revenue potential that we have not yet discovered. We cannot assure you that the performance of properties acquired or developed by us will increase or be maintained under our management.
We have agreed not to sell certain of our properties and to maintain indebtedness subject to guarantees.
We acquired in the past and in the future may acquire properties or portfolios of properties through tax deferred contribution transactions in exchange for partnership interests in our Operating Partnership. This acquisition structure has the effect, among other factors, of reducing the amount of tax depreciation we can deduct over the tax life of the acquired properties, and typically requires that we agree to protect the contributors’ ability to defer recognition of taxable gain through restrictions on our ability to dispose of the acquired properties and/or the allocation of partnership debt to the contributors to maintain their tax bases. We agreed not to sell some of our properties for varying periods of time, in transactions that would trigger taxable income to the former owners, and we may enter into similar arrangements as a part of future property acquisitions. These agreements generally provide that we may dispose of the subject properties only in transactions that qualify as tax-free exchanges under Section 1031 of the Internal Revenue Code or in other tax deferred transactions. Such transactions can be difficult to complete and can result in the property acquired in exchange for the disposed of property inheriting the tax attributes (including tax protection covenants) of the sold property. Violation of these tax protection agreements would impose significant costs on us. As a result, we are restricted with respect to decisions related to financing, encumbering, expanding or selling these properties. These restrictions on dispositions could limit our ability to sell an asset or pay down partnership debt during a specified time, or on terms, that would be favorable absent such restrictions.
We have also entered into agreements that provide prior owners of properties with the right to guarantee specific amounts of indebtedness and, in the event that the specific indebtedness that they guarantee is repaid or reduced, we would be required to provide substitute indebtedness for them to guarantee. These agreements may hinder actions that we may otherwise desire to take to repay or refinance guaranteed indebtedness because we would be required to make payments to the beneficiaries of such agreements if we violate these agreements.
We may be unable to renew leases or re-lease space as leases expire; certain leases may expire early.
If tenants do not renew their leases upon expiration, we may be unable to re-lease the space. Even if the tenants do renew their leases or if we can re-lease the space, the terms of renewal or re-leasing (including the cost of required renovations) may be less favorable than the current lease terms. Certain leases grant the tenants an early termination right upon payment of a termination penalty or if we fail to comply with certain material lease terms. Our inability to renew or release spaces and the early termination of certain leases could affect our ability to make distributions to shareholders. See "Item 7. Management's Discussion and Analysis of Financial Condition and Results of Operations - Factors that May Influence Future Results of Operations - Tenant Rollover Risk."
We face significant competition from other real estate developers.
We compete with real estate developers, operators and institutions for tenants and acquisition and development opportunities. Some of these competitors may have significantly greater financial resources than we have. Such competition may reduce the
20
number of suitable investment opportunities available to us, may interfere with our ability to attract and retain tenants and may increase vacancies, which could result in increased supply and lower market rental rates, reducing our bargaining leverage and adversely affect our ability to improve our operating leverage. In addition, some of our competitors may be willing (e.g., because their properties may have vacancy rates higher than those for our properties) to make space available at lower rental rates or with higher tenant concession percentages than available space in our properties. We cannot assure you that this competition will not adversely affect our cash flow and our ability to make distributions to shareholders.
Property ownership through joint ventures may limit our ability to act exclusively in our interest.
We develop, acquire, and contribute properties in joint ventures with other persons or entities when we believe circumstances warrant the use of such structures. As of
December 31, 2013
, we had net investments totaling
$180.5 million
in
17
unconsolidated Real Estate Ventures. We could become engaged in a dispute with one or more of our joint venture partners that might affect our ability to operate a jointly-owned property. Moreover, our joint venture partners may, at any time, have business, economic or other objectives that are inconsistent with our objectives, including objectives that relate to the appropriate timing and terms of any sale or refinancing of a property. In some instances, our joint venture partners may have competing interests in our markets that could create conflicts of interest. If the objectives of our joint venture partners or the lenders to our joint ventures are inconsistent with our own objectives, we may not be able to act exclusively in our interests.
Because real estate is illiquid, we may not be able to sell properties when in our best interest.
Real estate investments generally, and in particular large office and industrial/flex properties like those that we own, often cannot be sold quickly. The capitalization rates at which properties may be sold could be higher than historic rates, thereby reducing our potential proceeds from sale. Consequently, we may not be able to alter our portfolio promptly in response to changes in economic or other conditions. In addition, the Internal Revenue Code limits our ability to sell properties that we have held for fewer than two years without potential adverse consequences to our shareholders. Furthermore, properties that we have developed and have owned for a significant period of time or that we acquired in exchange for partnership interests in the Operating Partnership often have a low tax basis. If we were to dispose of any of these properties in a taxable transaction, we may be required under provisions of the Internal Revenue Code applicable to REITs to distribute a significant amount of the taxable gain to our shareholders and this could, in turn, impact our cash flow. In some cases, tax protection agreements with third parties will prevent us from selling certain properties in a taxable transaction without incurring substantial costs. In addition, purchase options and rights of first refusal held by tenants or partners in joint ventures may also limit our ability to sell certain properties. All of these factors reduce our ability to respond to changes in the performance of our investments and could adversely affect our cash flow and ability to make distributions to shareholders as well as the ability of someone to purchase us, even if a purchase were in our shareholders’ best interests.
Some potential losses are not covered by insurance.
We currently carry comprehensive “all-risk” property, and rental loss insurance and commercial general liability coverage on all of our properties. We believe the policy specifications and insured limits of these policies are adequate and appropriate. There are, however, types of losses, such as lease and other contract claims, biological, radiological and nuclear hazards and acts of war that generally are not insured. We cannot assure you that we will be able to renew insurance coverage in an adequate amount or at reasonable prices. In addition, insurance companies may no longer offer coverage against certain types of losses, such as losses due to earthquake, terrorist acts and mold, flood, or, if offered, these types of insurance may be prohibitively expensive. Should an uninsured loss or a loss in excess of insured limits occur, we could lose all or a portion of the capital we have invested in a property, as well as the anticipated future revenue from the property. In such an event, we might nevertheless remain obligated for any mortgage debt or other financial obligations related to the property. We cannot assure you that material losses in excess of insurance proceeds will not occur in the future. If any of our properties were to experience a catastrophic loss, it could seriously disrupt our operations, delay revenue and result in large expenses to repair or rebuild the property. Such events could adversely affect our cash flow and ability to make distributions to shareholders. If one or more of our insurance providers were to fail to pay a claim as a result of insolvency, bankruptcy or otherwise, the nonpayment of such claims could have an adverse effect on our financial condition and results of operations. In addition, if one or more of our insurance providers were to become subject to insolvency, bankruptcy or other proceedings and our insurance policies with the provider were terminated or cancelled as a result of those proceedings, we cannot guarantee that we would be able to find alternative coverage in adequate amounts or at reasonable prices. In such case, we could experience a lapse in any or adequate insurance coverage with respect to one or more properties and be exposed to potential losses relating to any claims that may arise during such period of lapsed or inadequate coverage.
21
Terrorist attacks and other acts of violence or war may adversely impact our performance and may affect the markets on which our securities are traded.
Terrorist attacks against our properties, or against the United States or our interests, may negatively impact our operations and the value of our securities. Attacks or armed conflicts could result in increased operating costs; for example, it might cost more in the future for building security, property and casualty insurance, and property maintenance. As a result of terrorist activities and other market conditions, the cost of insurance coverage for our properties could also increase. We might not be able to pass through the increased costs associated with such increased security measures and insurance to our tenants, which could reduce our profitability and cash flow. Furthermore, any terrorist attacks or armed conflicts could result in increased volatility in or damage to the United States and worldwide financial markets and economy. Such adverse economic conditions could affect the ability of our tenants to pay rent and our cost of capital, which could have a negative impact on our results.
Our ability to make distributions is subject to various risks.
Historically, we have paid quarterly distributions to our shareholders. Our ability to make distributions in the future will depend upon:
|
•
|
the operational and financial performance of our properties;
|
|
•
|
capital expenditures with respect to existing, developed and newly acquired properties;
|
|
•
|
general and administrative costs associated with our operation as a publicly-held REIT;
|
|
•
|
the amount of, and the interest rates on, our debt; and
|
|
•
|
the absence of significant expenditures relating to environmental and other regulatory matters.
|
Certain of these matters are beyond our control and any significant difference between our expectations and actual results could have a material adverse effect on our cash flow and our ability to make distributions to shareholders.
Changes in the tax rates and regulatory requirements may adversely affect our cash flow.
Because increases in income and service taxes are generally not passed through to tenants under leases, such increases may adversely affect our cash flow and ability to make expected distributions to shareholders. Our properties are also subject to various regulatory requirements, such as those relating to the environment, fire and safety. Our failure to comply with these requirements could result in the imposition of fines and damage awards and could result in a default under some of our tenant leases. Moreover, the costs to comply with any new or different regulations could adversely affect our cash flow and our ability to make distributions. Although we believe that our properties are in material compliance with all such requirements, we cannot assure you that these requirements will not change or that newly imposed requirements will not require significant expenditures in order to be compliant.
Potential liability for environmental contamination could result in substantial costs.
Under various federal, state and local laws, ordinances and regulations, we may be liable for the costs to investigate and remove or remediate hazardous or toxic substances on or in our properties, often regardless of whether we know of or are responsible for the presence of these substances. These costs may be substantial. While we do maintain environmental insurance, we cannot be assured that our insurance coverage will be sufficient to protect us from all of the aforesaid remediation costs. Also, if hazardous or toxic substances are present on a property, or if we fail to properly remediate such substances, our ability to sell or rent the property or to borrow using that property as collateral may be adversely affected.
Other laws and regulations govern indoor and outdoor air quality including those that can require the abatement or removal of asbestos-containing materials in the event of damage, demolition, renovation or remodeling and also govern emissions of and exposure to asbestos fibers in the air. The maintenance and removal of lead paint and certain electrical equipment containing polychlorinated biphenyls (PCBs) and underground storage tanks are also regulated by federal and state laws. We are also subject to risks associated with human exposure to chemical or biological contaminants such as molds, pollens, viruses and bacteria which, above certain levels, can be alleged to be connected to allergic or other health effects and symptoms in susceptible individuals. We could incur fines for environmental compliance and be held liable for the costs of remedial action with respect to the foregoing regulated substances or tanks or related claims arising out of environmental contamination or human exposure to contamination at or from our properties.
Additionally, we develop, manage, lease and/or operate various properties for third parties. Consequently, we may be considered to have been or to be an operator of these properties and, therefore, potentially liable for removal or remediation costs or other potential costs that could relate to hazardous or toxic substances.
22
An earthquake or other natural disasters could adversely affect our business.
Some of our properties are located in California which is a high risk geographical area for earthquakes or other natural disasters. Depending upon its magnitude, an earthquake could severely damage our properties which would adversely affect our business. We maintain earthquake insurance for our California properties and the resulting business interruption. We cannot assure that our insurance will be sufficient if there is a major earthquake.
Americans with Disabilities Act compliance could be costly.
The Americans with Disabilities Act of 1990, as amended (“ADA”), requires that all public accommodations and commercial facilities, including office buildings, meet certain federal requirements related to access and use by disabled persons. Compliance with ADA requirements could involve the removal of structural barriers from certain disabled persons’ entrances which could adversely affect our financial condition and results of operations. Other federal, state and local laws may require modifications to or restrict further renovations of our properties with respect to such accesses. Although we believe that our properties are in material compliance with present requirements, noncompliance with the ADA or similar or related laws or regulations could result in the United States government imposing fines or private litigants being awarded damages against us. In addition, changes to existing requirements or enactments of new requirements could require significant expenditures. Such costs may adversely affect our cash flow and ability to make distributions to shareholders.
Failure to qualify as a REIT would subject us to U.S. federal income tax which would reduce the cash available for distribution to our shareholders.
We operate our business to qualify to be taxed as a REIT for federal income tax purposes. We have not requested and do not plan to request a ruling from the IRS that we qualify as a REIT, and the statements in this Report are not binding on the IRS or any court. As a REIT, we generally will not be subject to federal income tax on the income that we distribute currently to our shareholders. Many of the REIT requirements, however, are highly technical and complex. The determination that we are a REIT requires an analysis of various factual matters and circumstances that may not be totally within our control. For example, to qualify as a REIT, at least 95% of our gross income must come from specific passive sources, such as rent, that are itemized in the REIT tax laws. In addition, to qualify as a REIT, we cannot own specified amounts of debt and equity securities of some issuers. We also are required to distribute to our shareholders with respect to each year at least 90% of our REIT taxable income (excluding net capital gains). The fact that we hold substantially all of our assets through the Operating Partnership and its subsidiaries and joint ventures further complicates the application of the REIT requirements for us. Even a technical or inadvertent mistake could jeopardize our REIT status and, given the highly complex nature of the rules governing REITs and the ongoing importance of factual determinations, we cannot provide any assurance that we will continue to qualify as a REIT. Furthermore, Congress and the IRS might make changes to the tax laws and regulations, and the courts might issue new rulings, that make it more difficult, or impossible, for us to remain qualified as a REIT. If we fail to qualify as a REIT for federal income tax purposes and are able to avail ourselves of one or more of the statutory savings provisions in order to maintain our REIT status, we would nevertheless be required to pay penalty taxes of $50,000 or more for each such failure.
If we fail to qualify as a REIT for federal income tax purposes, and are unable to avail ourselves of certain savings provisions set forth in the Internal Revenue Code, we would be subject to federal income tax at regular corporate rates on all of our income. As a taxable corporation, we would not be allowed to take a deduction for distributions to shareholders in computing our taxable income or pass through long term capital gains to individual shareholders at favorable rates. We also could be subject to the federal alternative minimum tax and possibly increased state and local taxes. We would not be able to elect to be taxed as a REIT for four years following the year we first failed to qualify unless the IRS were to grant us relief under certain statutory provisions. If we failed to qualify as a REIT, we would have to pay significant income taxes, which would reduce our net earnings available for investment or distribution to our shareholders. This likely would have a significant adverse effect on our earnings and likely would adversely affect the value of our securities. In addition, we would no longer be required to pay any distributions to shareholders.
Failure of the Operating Partnership (or a subsidiary partnership or joint venture) to be treated as a partnership would have serious adverse consequences to our shareholders.
If the IRS were to successfully challenge the tax status of the Operating Partnership or any of its subsidiary partnerships or joint ventures for federal income tax purposes, the Operating Partnership or the affected subsidiary partnership or joint venture would be taxable as a corporation. In such event we would cease to qualify as a REIT and the imposition of a corporate tax on the Operating Partnership, subsidiary partnership or joint venture would reduce the amount of cash available for distribution from the Operating Partnership to us and ultimately to our shareholders.
23
To maintain our REIT status, we may be forced to borrow funds on a short term basis during unfavorable market conditions.
As a REIT, we are subject to certain distribution requirements, including the requirement to distribute 90% of our REIT taxable income. That may result in our having to make distributions at a disadvantageous time or to borrow funds at unfavorable rates. Compliance with this requirement may hinder our ability to operate solely on the basis of maximizing profits.
We will pay some taxes even if we qualify as a REIT, which will reduce the cash available for distribution to our shareholders.
Even if we qualify as a REIT for federal income tax purposes, we will be required to pay certain federal, state and local taxes on our income and property. For example, we will be subject to income tax to the extent we distribute less than 100% of our REIT taxable income, including capital gains. Additionally, we will be subject to a 4% nondeductible excise tax on the amount, if any, by which dividends paid by us in any calendar year are less than the sum of 85% of our ordinary income, 95% of our capital gain net income and 100% of our undistributed income from prior years. Moreover, if we have net income from “prohibited transactions,” that income will be subject to a 100% penalty tax. In general, prohibited transactions are sales or other dispositions of property held primarily for sale to customers in the ordinary course of business. The determination as to whether a particular sale is a prohibited transaction depends on the facts and circumstances related to that sale. We cannot guarantee that sales of our properties would not be prohibited transactions unless we comply with certain statutory safe-harbor provisions.
In addition, any net taxable income earned directly by our taxable REIT subsidiaries, or through entities that are disregarded for federal income tax purposes as entities separate from our taxable REIT subsidiaries, will be subject to federal and possibly state corporate income tax. In this regard, several provisions of the laws applicable to REITs and their subsidiaries ensure that a taxable REIT subsidiary will be subject to an appropriate level of federal income taxation. For example, a taxable REIT subsidiary is limited in its ability to deduct certain interest payments made to an affiliated REIT. In addition, the REIT has to pay a 100% penalty tax on some payments that it receives or on some deductions taken by a taxable REIT subsidiary if the economic arrangements between the REIT, the REIT’s customers, and the taxable REIT subsidiary are not comparable to similar arrangements between unrelated parties. Finally, some state and local jurisdictions may tax some of our income even though as a REIT we are not subject to federal income tax on that income because not all states and localities follow the federal income tax treatment of REITs. To the extent that we and our affiliates are required to pay federal, state and local taxes, we will have less cash available for distributions to our shareholders.
We face possible federal, state and local tax audits.
Because we are organized and qualify as a REIT, we are generally not subject to federal income taxes, but are subject to certain state and local taxes. Certain entities through which we own real estate have undergone tax audits. There can be no assurance that future audits will not have a material adverse effect on our results of operations.
Competition for skilled personnel could increase labor costs.
We compete with various other companies in attracting and retaining qualified and skilled personnel. We depend on our ability to attract and retain skilled management personnel who are responsible for the day-to-day operations of our company. Competitive pressures may require that we enhance our pay and benefits package to compete effectively for such personnel. We may not be able to offset such added costs by increasing the rates we charge our tenants. If there is an increase in these costs or if we fail to attract and retain qualified and skilled personnel, our business and operating results could be harmed.
We are dependent upon our key personnel.
We are dependent upon our key personnel whose continued service is not guaranteed. We are dependent on our executive officers for strategic business direction and real estate experience. Loss of their services could adversely affect our operations.
Although we have an employment agreement with Gerard H. Sweeney, our President and Chief Executive Officer, this agreement does not restrict his ability to become employed by a competitor following the termination of his employment. We do not have key man life insurance coverage on our executive officers.
Certain limitations will exist with respect to a third party’s ability to acquire us or effectuate a change in control.
Limitations imposed to protect our REIT status
. In order to protect us against the loss of our REIT status, our Declaration of Trust limits any shareholder from owning more than 9.8% in value of our outstanding shares, subject to certain exceptions. The ownership limit may have the effect of precluding acquisition of control of us. If anyone acquires shares in excess of the ownership limit, we may:
|
•
|
consider the transfer to be null and void;
|
24
|
•
|
not reflect the transaction on our books;
|
|
•
|
institute legal action to stop the transaction;
|
|
•
|
not pay dividends or other distributions with respect to those shares;
|
|
•
|
not recognize any voting rights for those shares; and
|
|
•
|
consider the shares held in trust for the benefit of a person to whom such shares may be transferred.
|
Limitation due to our ability to issue preferred shares.
Our Declaration of Trust authorizes our Board of Trustees to cause us to issue preferred shares, without limitation as to amount and without shareholder consent. Our Board of Trustees is able to establish the preferences and rights of any preferred shares issued and these shares could have the effect of delaying or preventing someone from taking control of us, even if a change in control were in our shareholders’ best interests.
Limitation imposed by the Maryland Business Combination Law
. The Maryland General Corporation Law, as applicable to Maryland REITs, establishes special restrictions against “business combinations” between a Maryland REIT and “interested shareholders” or their affiliates unless an exemption is applicable. An interested shareholder includes a person, who beneficially owns, and an affiliate or associate of the trust who, at any time within the two-year period prior to the date in question, was the beneficial owner of, ten percent or more of the voting power of our then-outstanding voting shares. Among other things, Maryland law prohibits (for a period of five years) a merger and certain other transactions between a Maryland REIT and an interested shareholder unless the board of trustees had approved the transaction before the party became an interested shareholder. The five-year period runs from the most recent date on which the interested shareholder became an interested shareholder. Thereafter, any such business combination must be recommended by the board of trustees and approved by two super-majority shareholder votes unless, among other conditions, the common shareholders receive a minimum price for their shares and the consideration is received in cash or in the same form as previously paid by the interested shareholder for our shares or unless the board of trustees approved the transaction before the party in question became an interested shareholder. The business combination statute could have the effect of discouraging offers to acquire us and of increasing the difficulty of consummating any such offers, even if the acquisition would be in our shareholders’ best interests.
Maryland Control Share Acquisition Act
. Maryland law provides that “control shares” of a REIT acquired in a “control share acquisition” shall have no voting rights except to the extent approved by a vote of two-thirds of the vote eligible to be cast on the matter under the Maryland Control Share Acquisition Act. Shares construed as “control shares” means that, if aggregated with all other shares previously acquired by the acquirer or in respect of which the acquirer is able to exercise or direct the exercise of voting power (except solely by virtue of a revocable proxy), would entitle the acquirer to exercise voting power in electing trustees within one of the following ranges of voting power: one-tenth or more but less than one-third, one-third or more but less than a majority or a majority or more of all voting power. Control shares do not include shares the acquiring person is then entitled to vote as a result of having previously obtained shareholder approval. A “control share acquisition” means the acquisition of control shares, subject to certain exceptions. If voting rights or control shares acquired in a control share acquisition are not approved at a shareholder’s meeting, then subject to certain conditions and limitations the issuer may redeem any or all of the control shares for fair value. If voting rights of such control shares are approved at a shareholder’s meeting and the acquirer becomes entitled to vote a majority of the shares entitled to vote, all other shareholders may exercise appraisal rights. Any control shares acquired in a control share acquisition which are not exempt under our Bylaws are subject to the Maryland Control Share Acquisition Act. Our Bylaws contain a provision exempting from the control share acquisition statute any and all acquisitions by any person of our shares. We cannot assure you that this provision will not be amended or eliminated at any time in the future.
Advance Notice Provisions for Shareholder Nominations and Proposals
.
Our bylaws require advance notice for shareholders to nominate persons for election as trustees at, or to bring other business before, any meeting of our shareholders. This bylaw provision limits the ability of shareholders to make nominations of persons for election as trustees or to introduce other proposals unless we are notified in a timely manner prior to the meeting.
Many factors can have an adverse effect on the market value of our securities.
A number of factors might adversely affect the price of our securities, many of which are beyond our control. These factors include:
|
•
|
increases in market interest rates, relative to the dividend yield on our shares. If market interest rates go up, prospective purchasers of our securities may require a higher yield. Higher market interest rates would not, however, result in more funds for us to distribute and, to the contrary, would likely increase our borrowing costs and potentially decrease funds available for distribution. Thus, higher market interest rates could cause the market price of our common shares to go down;
|
|
•
|
anticipated benefit of an investment in our securities as compared to investment in securities of companies in other industries (including benefits associated with tax treatment of dividends and distributions);
|
|
•
|
perception by market professionals of REITs generally and REITs comparable to us in particular;
|
|
•
|
level of institutional investor interest in our securities;
|
25
|
•
|
relatively low trading volumes in securities of REITs;
|
|
•
|
our results of operations and financial condition; and
|
|
•
|
investor confidence in the stock market generally.
|
The market value of our common shares is based primarily upon the market’s perception of our growth potential and our current and potential future earnings and cash distributions. Consequently, our common shares may trade at prices that are higher or lower than our net asset value per common share. If our future earnings or cash distributions are less than expected, it is likely that the market price of our common shares will diminish.
Additional issuances of equity securities may be dilutive to shareholders.
The interests of our shareholders could be diluted if we issue additional equity securities to finance future developments or acquisitions or to repay indebtedness. Our Board of Trustees may authorize the issuance of additional equity securities without shareholder approval. Our ability to execute our business strategy depends upon our access to an appropriate blend of debt financing, including unsecured lines of credit and other forms of secured and unsecured debt, and equity financing, including the issuance of common and preferred equity.
The issuance of preferred securities may adversely affect the rights of holders of our common shares.
Because our Board of Trustees has the power to establish the preferences and rights of each class or series of preferred shares, we may afford the holders in any series or class of preferred shares preferences, distributions, powers and rights, voting or otherwise, senior to the rights of holders of common shares. Our Board of Trustees also has the power to establish the preferences and rights of each class or series of units in the Operating Partnership, and may afford the holders in any series or class of preferred units preferences, distributions, powers and rights, voting or otherwise, senior to the rights of holders of common units.
Our performance is dependent upon the economic conditions of the markets in which our properties are located.
Our properties are located in Pennsylvania, New Jersey, Delaware, Maryland, Virginia, Texas, and California. Like other real estate markets, these commercial real estate markets have been impacted by the ongoing economic recovery from the recent recession, and any adverse changes in economic conditions in the future in any of these economies or real estate markets could negatively affect cash available for distribution. Our financial performance and ability to make distributions to our shareholders will be particularly sensitive to the economic conditions in these markets. The local economic climate, which may be adversely impacted by business layoffs or downsizing, industry slowdowns, changing demographics and other factors, and local real estate conditions, such as oversupply of or reduced demand for office, industrial and other competing commercial properties, may affect revenues and the value of properties, including properties to be acquired or developed. We cannot assure you that these local economies will grow in the future.
Data security breaches may cause damage to our business and reputation.
In the ordinary course of our business we maintain sensitive data, including our proprietary business information and the information of our tenants and business partners, in our data centers and on our networks. Notwithstanding the security measures undertaken, our information technology may be vulnerable to attacks or breached and result in proprietary information being publicly disclosed, lost or stolen. Any such data breach could disrupt our operations and damage our reputation, which may in turn have an adverse impact on our results of operations.
|
Item 1B.
|
Unresolved Staff Comments
|
None.
|
Item 2.
|
Properties
|
Property Acquisitions
One and Two Commerce Square
On December 19, 2013, we increased our equity ownership interest in One and Two Commerce Square, two Class A trophy office properties in Philadelphia, Pennsylvania, from 25% to 99%. These two properties contain
1,896,142
of net rentable square feet of office space and were 83.7% and 89.6% occupied, respectively, as of December 31, 2013. We acquired the additional ownership interests from an unaffiliated third party for cash proceeds of
$73.1 million
. We used available corporate funds for the cash portion of the acquisition price.
26
In connection with the acquisition of One Commerce Square, we assumed a
$125.1 million
existing non-recourse first mortgage with a fixed interest rate of
5.67%
and a maturity date of January 6, 2016. In connection with the acquisition of Two Commerce Square, we assumed a
$112.0 million
existing non-recourse first mortgage with a fixed interest rate of
3.96%
and a maturity date of April 5, 2023.
Four Points Centre
On
December 19, 2013
, we acquired, from an unaffiliated third party, a two-building office property totaling
192,396
of net rentable square feet known as Four Points Centre, together with
22.3
acres of nearby land parcels in Austin, Texas for an aggregate of
$47.3 million
. The office property was
99.2%
occupied as of December 31, 2013. We funded the acquisition price with available corporate funds.
Cira Centre
On
November 19, 2013
, we acquired, from an unaffiliated third party, the
0.8
acre land parcel underlying our Cira Centre office tower in Philadelphia, Pennsylvania for
$24.6 million
. We had developed and owned Cira Centre on land subject to a long-term ground lease, and our acquisition of the land resulted in termination of the ground lease. We funded the acquisition with available corporate funds and capitalized
$1.4 million
of acquisition related costs as part of basis in the operating land.
Three Logan Square
On
April 25, 2013
, we acquired, the
1.8
acre land parcel underlying our Three Logan Square office tower in
Philadelphia, Pennsylvania
for
$20.8 million
. We acquired Three Logan Square in 2010 on land subject to a long-term ground lease, and, as part of our 2010 acquisition, held an option to acquire the land. Our 2013 acquisition of the land resulted in termination of the ground lease. We funded the acquisition with available corporate funds and capitalized
$0.1 million
of acquisition related costs as part of basis in the operating land.
Development and Redevelopment Properties Placed in Service
During
2013
, we did not place any development or redevelopment properties into service. At
December 31, 2013
, we were proceeding on the following activity:
|
Construction Commencement Date
|
Expected Completion
|
Activity Type
|
Property/Portfolio Name
|
Location
|
Number of Buildings
|
Square Footage
|
Budgeted Costs (000's)
|
Costs Incurred(000's)
|
||||||||||||||
|
April-13
|
Q1 2014
|
Development
|
200 Radnor Chester Road
|
Radnor, PA
|
1
|
|
17,884
|
|
$
|
7,434
|
|
$
|
6,044
|
|
||||||||
|
Jan-12
|
Q1 2014
|
Redevelopment
|
660 West Germantown Pike
|
Plymouth Meeting, PA
|
1
|
|
154,392
|
|
27,910
|
|
26,668
|
|
||||||||||
|
Total
|
2
|
|
172,276
|
|
$
|
35,344
|
|
$
|
32,712
|
|
||||||||||||
As discussed above in Item 1 under the heading “2013 Transactions,” as of December 31, 2013, we were proceeding through two of our unconsolidated real estate ventures (evo at Cira Centre and The Parc at Plymouth Meeting) on two development projects. In addition, as also discussed in Item 1 above, as of December 31, 2013, we had entered into two leases with third parties under which we have agreed to develop the Cira Walnut Tower for initial occupancy during the second quarter of 2016.
27
Property Sales
We sold the following office properties during the year ended
December 31, 2013
:
|
Month of
Sale
|
Property/Portfolio Name
|
Location
|
# of
Properties
|
Rentable Square
Feet
|
Property/Portfolio Occupancy %
at Date of Sale
|
Net Proceeds on Sale (000's)
|
Gain (Loss) on Sale (000's) (a)
|
||||||||||||||
|
Dec-13
|
875 First Avenue
|
King of Prussia, PA
|
1
|
|
50,000
|
|
—
|
%
|
$
|
3,658
|
|
$
|
131
|
|
|||||||
|
Oct-13
|
1336 Enterprise Drive
|
West Chester, PA
|
1
|
|
39,330
|
|
—
|
%
|
2,521
|
|
156
|
|
|||||||||
|
Oct-13
|
Austin Properties/DRA JV (b)
|
Austin, TX
|
7
|
|
1,398,826
|
|
96.8
|
%
|
270,749
|
|
25,921
|
|
|||||||||
|
Jun-13
|
The Bluffs
|
San Diego, CA
|
1
|
|
68,708
|
|
98.8
|
%
|
17,403
|
|
(856
|
)
|
|||||||||
|
Jun-13
|
100 Arrandale Boulevard
|
Exton, PA
|
1
|
|
34,931
|
|
—
|
%
|
3,268
|
|
(400
|
)
|
|||||||||
|
Jun-13
|
1700 Paoli Pike
|
Malvern, PA
|
1
|
|
28,000
|
|
—
|
%
|
2,544
|
|
(444
|
)
|
|||||||||
|
Jun-13
|
Pacific View Plaza
|
Carlsbad, CA
|
1
|
|
51,695
|
|
90.5
|
%
|
9,950
|
|
(521
|
)
|
|||||||||
|
Feb-13
|
Princeton Pike Corp Center
|
Lawrenceville, NJ
|
8
|
|
800,546
|
|
86.9
|
%
|
112,876
|
|
5,316
|
|
|||||||||
|
|
Total Office Properties Sold
|
|
21
|
|
2,472,036
|
|
|
|
$
|
422,969
|
|
$
|
29,303
|
|
|||||||
|
(a)
|
Includes closing and other transaction related costs.
|
|
(b)
|
The Austin Properties were contributed to an unconsolidated real estate venture.
|
We sold the following land parcel during the year ended
December 31, 2013
:
|
Month of
Sale
|
Property/Portfolio Name
|
Location
|
# of
Parcels
|
Acres
|
Property/Portfolio Occupancy %
at Date of Sale
|
Net Proceeds on Sale (in thousands)
|
Gain (Loss) on Sale (a)
|
||||||||||||||
|
Aug-13
|
Dabney Land East
|
Richmond, VA
|
1
|
|
8.0
|
|
—
|
%
|
$
|
511
|
|
$
|
(137
|
)
|
|||||||
|
|
Total Land Sold
|
|
1
|
|
8.0
|
|
|
|
$
|
511
|
|
$
|
(137
|
)
|
|||||||
|
(a)
|
Includes closing and other transaction related costs.
|
28
Properties
As of
December 31, 2013
, we owned
204
properties that contain an aggregate of approximately
24.8 million
net rentable square feet and consist of
176
office properties,
19
industrial facilities,
five
mixed-use properties (
200
core properties),
one
development property,
two
redevelopment properties and
one
re-entitlement property. The properties are located in or near Philadelphia, Pennsylvania; Metropolitan Washington, D.C.; Southern New Jersey; Richmond, Virginia; Wilmington, Delaware; Austin, Texas; and Oakland, Concord, and Carlsbad, California. As of
December 31, 2013
, the properties were approximately
89.5%
occupied by
1,376
tenants and had an average age of approximately
21.6
years. The office properties are a combination of urban, transit oriented and suburban office buildings containing an average of approximately
131,085
net rentable square feet. The industrial and mixed-use properties accommodate a variety of tenant uses, including light manufacturing, assembly, distribution and warehousing. We carry comprehensive liability, fire, extended coverage and rental loss insurance covering all of the properties, with policy specifications and insured limits which we believe are adequate.
The following table sets forth information with respect to our core properties at
December 31, 2013
:
|
Location
|
State
|
Year Built/ Renovated
|
Net Rentable Square Feet
|
Percentage Leased as of December 31, 2013 (a)
|
Total Base Rent for the Twelve Months Ended December 31, 2013 (b) (000's)
|
Average Annualized Rental Rate as of December 31, 2013 (c)
|
|||||||||||||||||
|
PENNSYLVANIA SUBURBS SEGMENT
|
|||||||||||||||||||||||
|
150 Radnor Chester Road
|
Radnor
|
PA
|
1983
|
|
340,380
|
|
100.0
|
%
|
$
|
9,948
|
|
$
|
33.39
|
|
|||||||||
|
201 King of Prussia Road
|
Radnor
|
PA
|
2001
|
|
251,434
|
|
100.0
|
%
|
6,827
|
|
31.54
|
|
|||||||||||
|
555 Lancaster Avenue
|
Radnor
|
PA
|
1973
|
|
241,687
|
|
98.7
|
%
|
6,579
|
|
32.38
|
|
|||||||||||
|
401 Plymouth Road
|
Plymouth Meeting
|
PA
|
2001
|
|
204,186
|
|
93.7
|
%
|
5,256
|
|
29.26
|
|
|||||||||||
|
One Radnor Corporate Center
|
Radnor
|
PA
|
1998
|
|
201,874
|
|
100.0
|
%
|
5,407
|
|
27.39
|
|
|||||||||||
|
101 West Elm Street
|
W. Conshohocken
|
PA
|
1999
|
|
173,827
|
|
94.4
|
%
|
4,068
|
|
26.32
|
|
|||||||||||
|
Five Radnor Corporate Center
|
Radnor
|
PA
|
1998
|
|
164,505
|
|
95.1
|
%
|
4,552
|
|
31.37
|
|
|||||||||||
|
Four Radnor Corporate Center
|
Radnor
|
PA
|
1995
|
|
164,464
|
|
100.0
|
%
|
4,041
|
|
27.78
|
|
|||||||||||
|
751-761 Fifth Avenue
|
King Of Prussia
|
PA
|
1967
|
|
158,000
|
|
100.0
|
%
|
704
|
|
4.13
|
|
|||||||||||
|
630 Allendale Road
|
King of Prussia
|
PA
|
2000
|
|
150,000
|
|
61.9
|
%
|
1,974
|
|
25.35
|
|
|||||||||||
|
640 Freedom Business Center
|
(d)
|
King Of Prussia
|
PA
|
1991
|
|
132,000
|
|
81.0
|
%
|
2,154
|
|
23.10
|
|
||||||||||
|
52 Swedesford Square
|
East Whiteland Twp.
|
PA
|
1988
|
|
131,017
|
|
69.3
|
%
|
1,434
|
|
12.67
|
|
|||||||||||
|
400 Berwyn Park
|
Berwyn
|
PA
|
1999
|
|
124,182
|
|
95.4
|
%
|
2,801
|
|
26.38
|
|
|||||||||||
|
4000 Chemical Road
|
Plymouth Meeting
|
PA
|
2007
|
|
120,877
|
|
100.0
|
%
|
3,020
|
|
29.33
|
|
|||||||||||
|
Three Radnor Corporate Center
|
Radnor
|
PA
|
1998
|
|
119,087
|
|
100.0
|
%
|
3,249
|
|
31.24
|
|
|||||||||||
|
101 Lindenwood Drive
|
Malvern
|
PA
|
1988
|
|
118,121
|
|
100.0
|
%
|
2,385
|
|
21.76
|
|
|||||||||||
|
181 Washington Street
|
Conshohocken
|
PA
|
1999
|
|
116,174
|
|
87.9
|
%
|
1,443
|
|
25.22
|
|
|||||||||||
|
300 Berwyn Park
|
Berwyn
|
PA
|
1989
|
|
107,702
|
|
96.8
|
%
|
2,249
|
|
24.82
|
|
|||||||||||
|
Two Radnor Corporate Center
|
Radnor
|
PA
|
1998
|
|
97,576
|
|
100.0
|
%
|
2,652
|
|
22.97
|
|
|||||||||||
|
301 Lindenwood Drive
|
Malvern
|
PA
|
1984
|
|
97,813
|
|
100.0
|
%
|
1,771
|
|
18.30
|
|
|||||||||||
|
1 West Elm Street
|
W. Conshohocken
|
PA
|
1999
|
|
97,737
|
|
100.0
|
%
|
2,654
|
|
9.40
|
|
|||||||||||
|
555 Croton Road
|
King of Prussia
|
PA
|
1999
|
|
96,909
|
|
74.5
|
%
|
1,446
|
|
22.73
|
|
|||||||||||
|
500 North Gulph Road
|
King Of Prussia
|
PA
|
1979
|
|
93,082
|
|
51.4
|
%
|
827
|
|
19.83
|
|
|||||||||||
|
620 West Germantown Pike
|
Plymouth Meeting
|
PA
|
1990
|
|
90,183
|
|
100.0
|
%
|
1,635
|
|
26.30
|
|
|||||||||||
|
610 West Germantown Pike
|
Plymouth Meeting
|
PA
|
1987
|
|
90,088
|
|
94.2
|
%
|
1,692
|
|
25.04
|
|
|||||||||||
|
630 West Germantown Pike
|
Plymouth Meeting
|
PA
|
1988
|
|
89,870
|
|
95.3
|
%
|
2,281
|
|
29.99
|
|
|||||||||||
|
600 West Germantown Pike
|
Plymouth Meeting
|
PA
|
1986
|
|
89,626
|
|
91.3
|
%
|
1,787
|
|
26.58
|
|
|||||||||||
|
630 Freedom Business Center
|
(d)
|
King Of Prussia
|
PA
|
1989
|
|
86,683
|
|
95.8
|
%
|
1,624
|
|
22.15
|
|
||||||||||
|
1200 Swedesford Road
|
Berwyn
|
PA
|
1994
|
|
86,622
|
|
100.0
|
%
|
1,824
|
|
29.57
|
|
|||||||||||
|
620 Freedom Business Center
|
(d)
|
King Of Prussia
|
PA
|
1986
|
|
86,570
|
|
100.0
|
%
|
1,690
|
|
23.94
|
|
||||||||||
|
595 East Swedesford Road
|
Wayne
|
PA
|
1998
|
|
81,890
|
|
100.0
|
%
|
1,672
|
|
22.69
|
|
|||||||||||
|
1050 Westlakes Drive
|
Berwyn
|
PA
|
1984
|
|
80,000
|
|
100.0
|
%
|
2,143
|
|
28.25
|
|
|||||||||||
|
One Progress Drive
|
Horsham
|
PA
|
1986
|
|
79,204
|
|
80.0
|
%
|
798
|
|
19.59
|
|
|||||||||||
|
1060 First Avenue
|
(d)
|
King Of Prussia
|
PA
|
1987
|
|
77,718
|
|
100.0
|
%
|
1,228
|
|
22.48
|
|
||||||||||
|
741 First Avenue
|
King Of Prussia
|
PA
|
1966
|
|
77,184
|
|
100.0
|
%
|
376
|
|
6.25
|
|
|||||||||||
|
1040 First Avenue
|
(d)
|
King Of Prussia
|
PA
|
1985
|
|
75,488
|
|
100.0
|
%
|
191
|
|
—
|
|
||||||||||
|
200 Berwyn Park
|
Berwyn
|
PA
|
1987
|
|
75,025
|
|
83.1
|
%
|
1,319
|
|
24.61
|
|
|||||||||||
|
1020 First Avenue
|
(d)
|
King Of Prussia
|
PA
|
1984
|
|
74,556
|
|
100.0
|
%
|
1,830
|
|
22.53
|
|
||||||||||
|
1000 First Avenue
|
(d)
|
King Of Prussia
|
PA
|
1980
|
|
74,139
|
|
84.7
|
%
|
1,431
|
|
23.09
|
|
||||||||||
29
|
Location
|
State
|
Year Built/ Renovated
|
Net Rentable Square Feet
|
|
Percentage Leased as of December 31, 2013 (a)
|
|
Total Base Rent for the Twelve Months Ended December 31, 2013 (b) (000's)
|
Average Annualized Rental Rate as of December 31, 2013 (c)
|
|
||||||||||||||
|
130 Radnor Chester Road
|
Radnor
|
PA
|
1983
|
|
71,349
|
|
100.0
|
%
|
2,150
|
|
33.83
|
|
|||||||||||
|
14 Campus Boulevard
|
Newtown Square
|
PA
|
1998
|
|
69,542
|
|
100.0
|
%
|
1,815
|
|
27.72
|
|
|||||||||||
|
170 Radnor Chester Road
|
Radnor
|
PA
|
1983
|
|
68,143
|
|
100.0
|
%
|
1,534
|
|
21.30
|
|
|||||||||||
|
500 Enterprise Road
|
Horsham
|
PA
|
1990
|
|
66,751
|
|
100.0
|
%
|
823
|
|
20.13
|
|
|||||||||||
|
575 East Swedesford Road
|
Wayne
|
PA
|
1985
|
|
66,265
|
|
100.0
|
%
|
1,229
|
|
28.94
|
|
|||||||||||
|
610 Freedom Business Center
|
(d)
|
King Of Prussia
|
PA
|
1985
|
|
62,991
|
|
97.7
|
%
|
1,042
|
|
22.05
|
|
||||||||||
|
925 Harvest Drive
|
Blue Bell
|
PA
|
1990
|
|
62,957
|
|
86.6
|
%
|
924
|
|
20.89
|
|
|||||||||||
|
980 Harvest Drive
|
Blue Bell
|
PA
|
1988
|
|
62,379
|
|
94.0
|
%
|
1,132
|
|
18.86
|
|
|||||||||||
|
426 Lancaster Avenue
|
Devon
|
PA
|
1990
|
|
61,102
|
|
100.0
|
%
|
1,213
|
|
22.93
|
|
|||||||||||
|
1180 Swedesford Road
|
Berwyn
|
PA
|
1987
|
|
60,371
|
|
66.6
|
%
|
612
|
|
4.26
|
|
|||||||||||
|
1160 Swedesford Road
|
Berwyn
|
PA
|
1986
|
|
60,099
|
|
89.6
|
%
|
156
|
|
—
|
|
|||||||||||
|
100 Berwyn Park
|
Berwyn
|
PA
|
1986
|
|
57,730
|
|
96.1
|
%
|
986
|
|
23.35
|
|
|||||||||||
|
640 Allendale Road
|
(f)
|
King of Prussia
|
PA
|
2000
|
|
56,034
|
|
100.0
|
%
|
314
|
|
7.94
|
|
||||||||||
|
565 East Swedesford Road
|
Wayne
|
PA
|
1984
|
|
55,456
|
|
98.6
|
%
|
936
|
|
20.97
|
|
|||||||||||
|
650 Park Avenue
|
King Of Prussia
|
PA
|
1968
|
|
54,338
|
|
100.0
|
%
|
855
|
|
17.29
|
|
|||||||||||
|
910 Harvest Drive
|
Blue Bell
|
PA
|
1990
|
|
52,611
|
|
100.0
|
%
|
1,040
|
|
22.02
|
|
|||||||||||
|
2240/50 Butler Pike
|
Plymouth Meeting
|
PA
|
1984
|
|
52,229
|
|
100.0
|
%
|
960
|
|
22.14
|
|
|||||||||||
|
920 Harvest Drive
|
Blue Bell
|
PA
|
1990
|
|
51,875
|
|
100.0
|
%
|
1,055
|
|
21.88
|
|
|||||||||||
|
660 Allendale Road
|
King of Prussia
|
PA
|
2011
|
|
50,635
|
|
100.0
|
%
|
677
|
|
16.89
|
|
|||||||||||
|
620 Allendale Road
|
King Of Prussia
|
PA
|
1961
|
|
50,000
|
|
100.0
|
%
|
629
|
|
13.81
|
|
|||||||||||
|
15 Campus Boulevard
|
Newtown Square
|
PA
|
2002
|
|
49,621
|
|
100.0
|
%
|
1,223
|
|
27.13
|
|
|||||||||||
|
17 Campus Boulevard
|
Newtown Square
|
PA
|
2001
|
|
48,565
|
|
100.0
|
%
|
1,137
|
|
27.30
|
|
|||||||||||
|
11 Campus Boulevard
|
Newtown Square
|
PA
|
1998
|
|
47,700
|
|
100.0
|
%
|
998
|
|
22.45
|
|
|||||||||||
|
585 East Swedesford Road
|
Wayne
|
PA
|
1998
|
|
43,683
|
|
100.0
|
%
|
775
|
|
29.61
|
|
|||||||||||
|
1100 Cassett Road
|
Berwyn
|
PA
|
1997
|
|
43,480
|
|
100.0
|
%
|
1,204
|
|
27.75
|
|
|||||||||||
|
600 Park Avenue
|
King Of Prussia
|
PA
|
1964
|
|
39,000
|
|
100.0
|
%
|
234
|
|
6.00
|
|
|||||||||||
|
18 Campus Boulevard
|
Newtown Square
|
PA
|
1990
|
|
37,374
|
|
52.6
|
%
|
530
|
|
23.73
|
|
|||||||||||
|
300 Lindenwood Drive
|
Malvern
|
PA
|
1991
|
|
33,000
|
|
100.0
|
%
|
794
|
|
25.77
|
|
|||||||||||
|
2260 Butler Pike
|
Plymouth Meeting
|
PA
|
1984
|
|
31,892
|
|
100.0
|
%
|
397
|
|
22.94
|
|
|||||||||||
|
120 West Germantown Pike
|
Plymouth Meeting
|
PA
|
1984
|
|
30,574
|
|
100.0
|
%
|
483
|
|
17.24
|
|
|||||||||||
|
140 West Germantown Pike
|
Plymouth Meeting
|
PA
|
1984
|
|
25,357
|
|
100.0
|
%
|
519
|
|
23.86
|
|
|||||||||||
|
100 Lindenwood Drive
|
Malvern
|
PA
|
1985
|
|
18,400
|
|
100.0
|
%
|
373
|
|
22.83
|
|
|||||||||||
|
200 Lindenwood Drive
|
Malvern
|
PA
|
1984
|
|
12,600
|
|
100.0
|
%
|
212
|
|
19.20
|
|
|||||||||||
|
SUBTOTAL - PENNSYLVANIA SUBURBS SEGMENT
|
6,471,583
|
|
94.3
|
%
|
$
|
129,923
|
|
$
|
24.38
|
|
|||||||||||||
|
PHILADELPHIA CENTRAL BUSINESS DISTRICT SEGMENT
|
|||||||||||||||||||||||
|
1717 Arch Street
|
Philadelphia
|
PA
|
1990
|
|
1,029,413
|
|
96.1
|
%
|
$
|
21,968
|
|
$
|
28.76
|
|
|||||||||
|
Two Commerce Square
|
Philadelphia
|
PA
|
1992
|
|
953,276
|
|
90.4
|
%
|
703
|
|
25.15
|
|
|||||||||||
|
One Commerce Square
|
Philadelphia
|
PA
|
1987
|
|
942,866
|
|
84.2
|
%
|
738
|
|
28.18
|
|
|||||||||||
|
2970 Market Street
|
Philadelphia
|
PA
|
2010
|
|
862,692
|
|
100.0
|
%
|
19,543
|
|
31.42
|
|
|||||||||||
|
2929 Arch Street
|
(d)
|
Philadelphia
|
PA
|
2005
|
|
730,187
|
|
100.0
|
%
|
25,929
|
|
36.45
|
|
||||||||||
|
100 North 18th Street
|
(e)
|
Philadelphia
|
PA
|
1988
|
|
708,844
|
|
86.1
|
%
|
16,493
|
|
31.28
|
|
||||||||||
|
130 North 18th Street
|
Philadelphia
|
PA
|
1989
|
|
595,041
|
|
91.3
|
%
|
12,917
|
|
30.43
|
|
|||||||||||
|
101 - 103 Juniper Street
|
(i), (g)
|
Philadelphia
|
PA
|
2011
|
|
N/A
|
|
—
|
%
|
—
|
|
—
|
|
||||||||||
|
2930 Chestnut Street
|
(d), (g)
|
Philadelphia
|
PA
|
2010
|
|
553,421
|
|
100.0
|
%
|
200
|
|
11.54
|
|
||||||||||
|
3020 Market Street
|
Philadelphia
|
PA
|
2008
|
|
190,925
|
|
90.7
|
%
|
2,753
|
|
21.97
|
|
|||||||||||
|
Philadelphia Marine Center
|
(d), (g)
|
Philadelphia
|
PA
|
Various
|
|
181,900
|
|
100.0
|
%
|
1,299
|
|
4.79
|
|
||||||||||
|
SUBTOTAL - PHILADELPHIA CENTRAL BUSINESS DISTRICT
|
6,748,565
|
|
93.3
|
%
|
$
|
102,543
|
|
$
|
27.44
|
|
|||||||||||||
30
|
Location
|
State
|
Year Built/ Renovated
|
Net Rentable Square Feet
|
|
Percentage Leased as of December 31, 2013 (a)
|
|
Total Base Rent for the Twelve Months Ended December 31, 2013 (b) (000's)
|
Average Annualized Rental Rate as of December 31, 2013 (c)
|
|
||||||||||||||
|
METROPOLITAN WASHINGTON D.C. SEGMENT
|
|||||||||||||||||||||||
|
1676 International Drive
|
McLean
|
VA
|
1999
|
|
299,387
|
|
96.8
|
%
|
$
|
10,565
|
|
$
|
35.35
|
|
|||||||||
|
2340 Dulles Corner Boulevard
|
Herndon
|
VA
|
1987
|
|
264,405
|
|
100.0
|
%
|
8,012
|
|
33.53
|
|
|||||||||||
|
2291 Wood Oak Drive
|
Herndon
|
VA
|
1999
|
|
230,389
|
|
100.0
|
%
|
7,837
|
|
34.05
|
|
|||||||||||
|
1900 Gallows Road
|
Vienna
|
VA
|
1989
|
|
210,632
|
|
87.5
|
%
|
5,177
|
|
25.76
|
|
|||||||||||
|
3141 Fairview Park Drive
|
(h)
|
Falls Church
|
VA
|
1988
|
|
183,618
|
|
97.4
|
%
|
4,526
|
|
28.55
|
|
||||||||||
|
2411 Dulles Corner Park
|
Herndon
|
VA
|
1990
|
|
180,510
|
|
79.1
|
%
|
3,972
|
|
32.15
|
|
|||||||||||
|
2355 Dulles Corner Boulevard
|
Herndon
|
VA
|
1988
|
|
179,176
|
|
77.0
|
%
|
4,230
|
|
32.74
|
|
|||||||||||
|
1880 Campus Commons Drive
|
Reston
|
VA
|
1985
|
|
172,943
|
|
97.1
|
%
|
3,680
|
|
23.87
|
|
|||||||||||
|
2121 Cooperative Way
|
Herndon
|
VA
|
2000
|
|
162,578
|
|
92.8
|
%
|
4,167
|
|
16.43
|
|
|||||||||||
|
6600 Rockledge Drive
|
(d)
|
Bethesda
|
MD
|
1981
|
|
160,173
|
|
100.0
|
%
|
4,560
|
|
31.71
|
|
||||||||||
|
8260 Greensboro Drive
|
McLean
|
VA
|
1980
|
|
158,961
|
|
90.3
|
%
|
3,588
|
|
27.76
|
|
|||||||||||
|
2251 Corporate Park Drive
|
Herndon
|
VA
|
2000
|
|
158,016
|
|
100.0
|
%
|
4,689
|
|
32.03
|
|
|||||||||||
|
12015 Lee Jackson Memorial Highway
|
Fairfax
|
VA
|
1985
|
|
153,255
|
|
82.6
|
%
|
3,498
|
|
27.07
|
|
|||||||||||
|
13880 Dulles Corner Lane
|
Herndon
|
VA
|
1997
|
|
151,853
|
|
71.6
|
%
|
2,443
|
|
19.90
|
|
|||||||||||
|
8521 Leesburg Pike
|
Vienna
|
VA
|
1984
|
|
150,897
|
|
97.6
|
%
|
2,453
|
|
25.68
|
|
|||||||||||
|
2273 Research Boulevard
|
Rockville
|
MD
|
1999
|
|
147,689
|
|
100.0
|
%
|
4,111
|
|
30.14
|
|
|||||||||||
|
2275 Research Boulevard
|
Rockville
|
MD
|
1990
|
|
147,650
|
|
62.0
|
%
|
2,852
|
|
21.45
|
|
|||||||||||
|
2201 Cooperative Way
|
Herndon
|
VA
|
1990
|
|
128,173
|
|
76.2
|
%
|
1,788
|
|
19.91
|
|
|||||||||||
|
2277 Research Boulevard
|
Rockville
|
MD
|
1986
|
|
137,045
|
|
100.0
|
%
|
3,763
|
|
30.98
|
|
|||||||||||
|
11781 Lee Jackson Memorial Highway
|
Fairfax
|
VA
|
1982
|
|
130,935
|
|
77.8
|
%
|
2,466
|
|
25.04
|
|
|||||||||||
|
11720 Beltsville Drive
|
Beltsville
|
MD
|
1987
|
|
128,903
|
|
58.8
|
%
|
1,859
|
|
25.01
|
|
|||||||||||
|
13825 Sunrise Valley Drive
|
Herndon
|
VA
|
1989
|
|
103,967
|
|
96.0
|
%
|
1,505
|
|
15.38
|
|
|||||||||||
|
198 Van Buren Street
|
Herndon
|
VA
|
1996
|
|
98,934
|
|
100.0
|
%
|
1,521
|
|
10.61
|
|
|||||||||||
|
196 Van Buren Street
|
Herndon
|
VA
|
1991
|
|
98,291
|
|
88.2
|
%
|
2,359
|
|
28.42
|
|
|||||||||||
|
11700 Beltsville Drive
|
Beltsville
|
MD
|
1981
|
|
96,843
|
|
82.8
|
%
|
2,015
|
|
25.21
|
|
|||||||||||
|
11710 Beltsville Drive
|
Beltsville
|
MD
|
1987
|
|
81,281
|
|
67.6
|
%
|
1,032
|
|
19.38
|
|
|||||||||||
|
4401 Fair Lakes Court
|
Fairfax
|
VA
|
1988
|
|
55,972
|
|
87.7
|
%
|
1,387
|
|
28.81
|
|
|||||||||||
|
11740 Beltsville Drive
|
Beltsville
|
MD
|
1987
|
|
6,783
|
|
100.0
|
%
|
132
|
|
23.48
|
|
|||||||||||
|
SUBTOTAL - METROPOLITAN WASHINGTON D.C. SEGMENT
|
4,179,259
|
|
89.0
|
%
|
$
|
100,187
|
|
$
|
27.11
|
|
|||||||||||||
|
NEW JERSEY/DELAWARE SEGMENT
|
|||||||||||||||||||||||
|
300 Delaware Avenue
|
Wilmington
|
DE
|
1989
|
|
298,071
|
|
78.8
|
%
|
$
|
2,699
|
|
$
|
14.56
|
|
|||||||||
|
920 North King Street
|
Wilmington
|
DE
|
1989
|
|
203,328
|
|
96.7
|
%
|
4,183
|
|
27.59
|
|
|||||||||||
|
10000 Midlantic Drive
|
Mt. Laurel
|
NJ
|
1990
|
|
186,908
|
|
82.5
|
%
|
1,873
|
|
20.97
|
|
|||||||||||
|
400 Commerce Drive
|
Newark
|
DE
|
1997
|
|
154,086
|
|
84.1
|
%
|
2,076
|
|
18.37
|
|
|||||||||||
|
457 Haddonfield Road
|
Cherry Hill
|
NJ
|
1990
|
|
121,737
|
|
95.2
|
%
|
1,877
|
|
23.71
|
|
|||||||||||
|
2000 Midlantic Drive
|
Mt. Laurel
|
NJ
|
1989
|
|
121,658
|
|
72.0
|
%
|
1,339
|
|
21.36
|
|
|||||||||||
|
700 East Gate Drive
|
Mt. Laurel
|
NJ
|
1984
|
|
119,272
|
|
100.0
|
%
|
1,800
|
|
23.44
|
|
|||||||||||
|
1000 Howard Boulevard
|
Mt. Laurel
|
NJ
|
1988
|
|
105,312
|
|
97.4
|
%
|
1,497
|
|
13.72
|
|
|||||||||||
|
One Righter Parkway
|
(d)
|
Wilmington
|
DE
|
1989
|
|
104,761
|
|
100.0
|
%
|
2,322
|
|
24.48
|
|
||||||||||
|
1000 Atrium Way
|
Mt. Laurel
|
NJ
|
1989
|
|
99,668
|
|
100.0
|
%
|
1,190
|
|
21.41
|
|
|||||||||||
|
Two Righter Parkway
|
(d)
|
Wilmington
|
DE
|
1987
|
|
95,514
|
|
100.0
|
%
|
1,838
|
|
21.41
|
|
||||||||||
|
1120 Executive Boulevard
|
Mt. Laurel
|
NJ
|
1987
|
|
95,183
|
|
42.3
|
%
|
473
|
|
17.78
|
|
|||||||||||
|
15000 Midlantic Drive
|
Mt. Laurel
|
NJ
|
1991
|
|
84,056
|
|
94.1
|
%
|
1,060
|
|
22.30
|
|
|||||||||||
|
220 Lake Drive East
|
Cherry Hill
|
NJ
|
1988
|
|
78,509
|
|
88.8
|
%
|
838
|
|
22.73
|
|
|||||||||||
|
200 Lake Drive East
|
Cherry Hill
|
NJ
|
1989
|
|
76,352
|
|
88.7
|
%
|
1,063
|
|
25.29
|
|
|||||||||||
|
200 Commerce Drive
|
Newark
|
DE
|
1998
|
|
68,034
|
|
100.0
|
%
|
1,327
|
|
21.42
|
|
|||||||||||
|
9000 Midlantic Drive
|
Mt. Laurel
|
NJ
|
1989
|
|
67,299
|
|
90.0
|
%
|
849
|
|
21.46
|
|
|||||||||||
|
100 Commerce Drive
|
Newark
|
DE
|
1989
|
|
62,787
|
|
77.8
|
%
|
797
|
|
18.94
|
|
|||||||||||
|
701 East Gate Drive
|
Mt. Laurel
|
NJ
|
1986
|
|
61,794
|
|
94.4
|
%
|
602
|
|
19.24
|
|
|||||||||||
31
|
Location
|
State
|
Year Built/ Renovated
|
Net Rentable Square Feet
|
|
Percentage Leased as of December 31, 2013 (a)
|
Total Base Rent for the Twelve Months Ended December 31, 2013 (b) (000's)
|
|
Average Annualized Rental Rate as of December 31, 2013 (c)
|
|
||||||||||||||
|
210 Lake Drive East
|
Cherry Hill
|
NJ
|
1986
|
|
60,604
|
|
72.2
|
%
|
461
|
|
22.48
|
|
|||||||||||
|
308 Harper Drive
|
Moorestown
|
NJ
|
1976
|
|
59,500
|
|
83.3
|
%
|
560
|
|
18.67
|
|
|||||||||||
|
305 Fellowship Drive
|
Mt. Laurel
|
NJ
|
1980
|
|
56,824
|
|
83.7
|
%
|
323
|
|
10.53
|
|
|||||||||||
|
309 Fellowship Drive
|
Mt. Laurel
|
NJ
|
1982
|
|
55,911
|
|
89.6
|
%
|
739
|
|
22.04
|
|
|||||||||||
|
307 Fellowship Drive
|
Mt. Laurel
|
NJ
|
1981
|
|
54,485
|
|
68.6
|
%
|
397
|
|
18.91
|
|
|||||||||||
|
303 Fellowship Drive
|
Mt. Laurel
|
NJ
|
1979
|
|
53,768
|
|
75.1
|
%
|
489
|
|
18.39
|
|
|||||||||||
|
1000 Bishops Gate
|
Mt. Laurel
|
NJ
|
2005
|
|
53,281
|
|
100.0
|
%
|
1,023
|
|
23.72
|
|
|||||||||||
|
2 Foster Avenue
|
(f)
|
Gibbsboro
|
NJ
|
1974
|
|
50,761
|
|
100.0
|
%
|
220
|
|
4.43
|
|
||||||||||
|
4000 Midlantic Drive
|
Mt. Laurel
|
NJ
|
1998
|
|
46,945
|
|
100.0
|
%
|
601
|
|
20.48
|
|
|||||||||||
|
Five Eves Drive
|
Marlton
|
NJ
|
1986
|
|
45,564
|
|
97.8
|
%
|
688
|
|
21.38
|
|
|||||||||||
|
161 Gaither Drive
|
Mount Laurel
|
NJ
|
1987
|
|
44,739
|
|
79.5
|
%
|
490
|
|
22.30
|
|
|||||||||||
|
Main Street - Piazza
|
Voorhees
|
NJ
|
1990
|
|
44,708
|
|
100.0
|
%
|
617
|
|
21.37
|
|
|||||||||||
|
20 East Clementon Road
|
Gibbsboro
|
NJ
|
1986
|
|
38,260
|
|
93.5
|
%
|
419
|
|
19.59
|
|
|||||||||||
|
Two Eves Drive
|
Marlton
|
NJ
|
1987
|
|
37,532
|
|
96.7
|
%
|
383
|
|
17.23
|
|
|||||||||||
|
Main Street - Promenade
|
Voorhees
|
NJ
|
1988
|
|
31,445
|
|
97.1
|
%
|
266
|
|
12.55
|
|
|||||||||||
|
Four B Eves Drive
|
Marlton
|
NJ
|
1987
|
|
27,011
|
|
83.3
|
%
|
363
|
|
18.02
|
|
|||||||||||
|
815 East Gate Drive
|
Mt. Laurel
|
NJ
|
1986
|
|
25,500
|
|
100.0
|
%
|
218
|
|
15.98
|
|
|||||||||||
|
817 East Gate Drive
|
Mt. Laurel
|
NJ
|
1986
|
|
25,351
|
|
60.0
|
%
|
258
|
|
12.22
|
|
|||||||||||
|
Four A Eves Drive
|
Marlton
|
NJ
|
1987
|
|
24,687
|
|
69.8
|
%
|
236
|
|
16.52
|
|
|||||||||||
|
1 Foster Avenue
|
(f)
|
Gibbsboro
|
NJ
|
1972
|
|
24,255
|
|
100.0
|
%
|
111
|
|
4.58
|
|
||||||||||
|
4 Foster Avenue
|
(f)
|
Gibbsboro
|
NJ
|
1974
|
|
23,372
|
|
100.0
|
%
|
164
|
|
7.81
|
|
||||||||||
|
7 Foster Avenue
|
Gibbsboro
|
NJ
|
1983
|
|
22,158
|
|
100.0
|
%
|
177
|
|
12.86
|
|
|||||||||||
|
10 Foster Avenue
|
Gibbsboro
|
NJ
|
1983
|
|
18,651
|
|
95.7
|
%
|
193
|
|
17.50
|
|
|||||||||||
|
5 U.S. Avenue
|
(f)
|
Gibbsboro
|
NJ
|
1987
|
|
5,000
|
|
100.0
|
%
|
32
|
|
6.00
|
|
||||||||||
|
50 East Clementon Road
|
Gibbsboro
|
NJ
|
1986
|
|
3,080
|
|
100.0
|
%
|
160
|
|
51.90
|
|
|||||||||||
|
5 Foster Avenue
|
Gibbsboro
|
NJ
|
1968
|
|
2,000
|
|
100.0
|
%
|
—
|
|
—
|
|
|||||||||||
|
SUBTOTAL - NEW JERSEY/DELAWARE SEGMENT
|
3,139,721
|
|
87.9
|
%
|
$
|
39,291
|
|
$
|
19.86
|
|
|||||||||||||
|
RICHMOND, VA SEGMENT
|
|||||||||||||||||||||||
|
300 Arboretum Place
|
Richmond
|
VA
|
1988
|
|
212,228
|
|
90.2
|
%
|
$
|
3,234
|
|
$
|
17.86
|
|
|||||||||
|
6800 Paragon Place
|
Richmond
|
VA
|
1986
|
|
145,647
|
|
82.6
|
%
|
1,881
|
|
15.43
|
|
|||||||||||
|
6802 Paragon Place
|
Richmond
|
VA
|
1989
|
|
143,788
|
|
98.3
|
%
|
2,487
|
|
17.60
|
|
|||||||||||
|
7501 Boulders View Drive
|
Richmond
|
VA
|
1990
|
|
136,654
|
|
100.0
|
%
|
2,115
|
|
16.99
|
|
|||||||||||
|
2511 Brittons Hill Road
|
(f)
|
Richmond
|
VA
|
1987
|
|
132,548
|
|
100.0
|
%
|
659
|
|
6.67
|
|
||||||||||
|
2100-2116 West Laburnam Avenue
|
Richmond
|
VA
|
1976
|
|
128,337
|
|
95.2
|
%
|
1,676
|
|
14.76
|
|
|||||||||||
|
7300 Beaufont Springs Drive
|
Richmond
|
VA
|
2000
|
|
120,665
|
|
100.0
|
%
|
1,646
|
|
20.39
|
|
|||||||||||
|
1025 Boulders Parkway
|
Richmond
|
VA
|
1994
|
|
93,143
|
|
74.5
|
%
|
1,159
|
|
16.03
|
|
|||||||||||
|
2201-2245 Tomlynn Street
|
(f)
|
Richmond
|
VA
|
1989
|
|
85,861
|
|
97.2
|
%
|
433
|
|
6.60
|
|
||||||||||
|
7401 Beaufont Springs Drive
|
Richmond
|
VA
|
1998
|
|
82,732
|
|
82.5
|
%
|
931
|
|
13.92
|
|
|||||||||||
|
7325 Beaufont Springs Drive
|
Richmond
|
VA
|
1999
|
|
75,218
|
|
54.6
|
%
|
747
|
|
20.96
|
|
|||||||||||
|
100 Gateway Centre Parkway
|
Richmond
|
VA
|
2001
|
|
74,991
|
|
77.3
|
%
|
521
|
|
11.38
|
|
|||||||||||
|
6806 Paragon Place
|
Richmond
|
VA
|
2007
|
|
74,480
|
|
100.0
|
%
|
1,613
|
|
20.51
|
|
|||||||||||
|
9011 Arboretum Parkway
|
Richmond
|
VA
|
1991
|
|
73,183
|
|
65.0
|
%
|
652
|
|
13.81
|
|
|||||||||||
|
4870 Sadler Road
|
Glen Allen
|
VA
|
2000
|
|
63,832
|
|
96.0
|
%
|
1,368
|
|
21.75
|
|
|||||||||||
|
4880 Sadler Road
|
Glen Allen
|
VA
|
1998
|
|
63,427
|
|
100.0
|
%
|
1,280
|
|
20.28
|
|
|||||||||||
|
4805 Lake Brooke Drive
|
Glen Allen
|
VA
|
1996
|
|
60,867
|
|
63.5
|
%
|
533
|
|
4.87
|
|
|||||||||||
|
9100 Arboretum Parkway
|
Richmond
|
VA
|
1988
|
|
58,446
|
|
93.4
|
%
|
748
|
|
14.29
|
|
|||||||||||
|
2812 Emerywood Parkway
|
Henrico
|
VA
|
1980
|
|
56,984
|
|
97.5
|
%
|
870
|
|
15.34
|
|
|||||||||||
|
4364 South Alston Avenue
|
Durham
|
NC
|
1985
|
|
56,601
|
|
60.0
|
%
|
576
|
|
17.39
|
|
|||||||||||
|
2277 Dabney Road
|
(f)
|
Richmond
|
VA
|
1986
|
|
50,400
|
|
100.0
|
%
|
313
|
|
8.05
|
|
||||||||||
|
9200 Arboretum Parkway
|
Richmond
|
VA
|
1988
|
|
49,542
|
|
89.7
|
%
|
716
|
|
16.86
|
|
|||||||||||
|
9210 Arboretum Parkway
|
Richmond
|
VA
|
1988
|
|
48,012
|
|
74.5
|
%
|
425
|
|
14.67
|
|
|||||||||||
|
2212-2224 Tomlynn Street
|
(f)
|
Richmond
|
VA
|
1985
|
|
45,353
|
|
100.0
|
%
|
334
|
|
9.28
|
|
||||||||||
32
|
Location
|
State
|
Year Built/ Renovated
|
Net Rentable Square Feet
|
|
Percentage Leased as of December 31, 2013 (a)
|
Total Base Rent for the Twelve Months Ended December 31, 2013 (b) (000's)
|
|
Average Annualized Rental Rate as of December 31, 2013 (c)
|
|
||||||||||||||
|
2221-2245 Dabney Road
|
(f)
|
Richmond
|
VA
|
1994
|
|
45,250
|
|
100.0
|
%
|
248
|
|
8.00
|
|
||||||||||
|
2251 Dabney Road
|
(f)
|
Richmond
|
VA
|
1983
|
|
42,000
|
|
100.0
|
%
|
238
|
|
7.37
|
|
||||||||||
|
2161-2179 Tomlynn Street
|
(f)
|
Richmond
|
VA
|
1985
|
|
41,550
|
|
100.0
|
%
|
246
|
|
8.25
|
|
||||||||||
|
2256 Dabney Road
|
(f)
|
Richmond
|
VA
|
1982
|
|
33,413
|
|
100.0
|
%
|
217
|
|
9.13
|
|
||||||||||
|
2246 Dabney Road
|
(f)
|
Richmond
|
VA
|
1987
|
|
33,271
|
|
100.0
|
%
|
272
|
|
10.13
|
|
||||||||||
|
2244 Dabney Road
|
(f)
|
Richmond
|
VA
|
1993
|
|
33,050
|
|
100.0
|
%
|
269
|
|
9.94
|
|
||||||||||
|
9211 Arboretum Parkway
|
Richmond
|
VA
|
1991
|
|
30,791
|
|
100.0
|
%
|
338
|
|
13.73
|
|
|||||||||||
|
2248 Dabney Road
|
(f)
|
Richmond
|
VA
|
1989
|
|
30,184
|
|
100.0
|
%
|
200
|
|
6.85
|
|
||||||||||
|
2130-2146 Tomlynn Street
|
(f)
|
Richmond
|
VA
|
1988
|
|
29,700
|
|
100.0
|
%
|
211
|
|
8.96
|
|
||||||||||
|
2120 Tomlyn Street
|
(f)
|
Richmond
|
VA
|
1986
|
|
23,850
|
|
86.2
|
%
|
131
|
|
8.82
|
|
||||||||||
|
2240 Dabney Road
|
(f)
|
Richmond
|
VA
|
1984
|
|
15,389
|
|
100.0
|
%
|
125
|
|
14.64
|
|
||||||||||
|
SUBTOTAL - RICHMOND, VA SEGMENT
|
2,491,387
|
|
90.1
|
%
|
$
|
29,412
|
|
$
|
14.16
|
|
|||||||||||||
|
AUSTIN, TX SEGMENT
|
|
||||||||||||||||||||||
|
11305 Four Points Drive
|
Austin
|
TX
|
1,984
|
|
192,396
|
|
100
|
%
|
80
|
|
19.71
|
|
|||||||||||
|
SUBTOTAL - AUSTIN, TX SEGMENT
|
192,396
|
|
99.8
|
%
|
80
|
|
26.65
|
|
|||||||||||||||
|
CALIFORNIA SEGMENT
|
|||||||||||||||||||||||
|
155 Grand Avenue
|
Oakland
|
CA
|
1990
|
|
204,336
|
|
86.4
|
%
|
$
|
4,793
|
|
$
|
32.79
|
|
|||||||||
|
2 Kaiser Land
|
(g)
|
Oakland
|
CA
|
N/A
|
|
—
|
|
—
|
%
|
—
|
|
—
|
|
||||||||||
|
Oakland Lot B
|
(g)
|
Oakland
|
CA
|
N/A
|
|
—
|
|
—
|
%
|
—
|
|
—
|
|
||||||||||
|
1220 Concord Avenue
|
Concord
|
CA
|
1984
|
|
175,153
|
|
100.0
|
%
|
4,204
|
|
25.07
|
|
|||||||||||
|
1200 Concord Avenue
|
Concord
|
CA
|
1984
|
|
175,103
|
|
100
|
%
|
4,409
|
|
26.37
|
|
|||||||||||
|
5900 & 5950 La Place Court
|
Carlsbad
|
CA
|
1988
|
|
80,506
|
|
82.8
|
%
|
1,158
|
|
15.12
|
|
|||||||||||
|
5963 La Place Court
|
Carlsbad
|
CA
|
1987
|
|
61,587
|
|
78.3
|
%
|
886
|
|
18.53
|
|
|||||||||||
|
2035 Corte Del Nogal
|
Carlsbad
|
CA
|
1991
|
|
53,982
|
|
73.8
|
%
|
713
|
|
20.71
|
|
|||||||||||
|
SUBTOTAL - CALIFORNIA SEGMENT
|
750,667
|
|
92.7
|
%
|
$
|
16,163
|
|
$
|
24.16
|
|
|||||||||||||
|
TOTAL CORE PORTFOLIO
|
23,973,578
|
|
91.8
|
%
|
$
|
417,599
|
|
24.05
|
|
||||||||||||||
|
(a)
|
Calculated by dividing net rentable square feet included in leases signed on or before
December 31, 2013
at the property by the aggregate net rentable square feet of the property.
|
|
(b)
|
“Total Base Rent” for the twelve months ended
December 31, 2013
represents base rents earned during such period, excluding tenant reimbursements, parking income, tenant inducements and deferred market rent adjustments, calculated in accordance with generally accepted accounting principles (GAAP) determined on a straight-line basis.
|
|
(c)
|
“Average Annualized Rental Rate” is calculated by taking: (i) for office leases written on a triple net basis, the sum of the annualized base rent utilizing contractual rental rates pursuant to executed leases as of
December 31, 2013
exclusive of concessions and abatements plus the prorata
2013
budgeted operating expense reimbursements excluding tenant electricity; and (ii) for office leases written on a full service basis, the annualized base rent utilizing contractual rental rates pursuant to executed leases as of
December 31, 2013
exclusive of concessions and abatements, and dividing the sum of such amounts by the total square footage occupied as of
December 31, 2013
.
|
|
(d)
|
These properties are subject to a ground lease with a third party.
|
|
(e)
|
We hold our interest in Two Logan Square (100 North 18th Street) through our ownership of second and third mortgages that are secured by this property and that are junior to a first mortgage held by a third party lender. Our ownership of these two mortgages currently provides us with all of the cash flows from Two Logan Square after the payment of operating expenses and debt service on the first mortgage.
|
|
(f)
|
These properties are industrial facilities.
|
|
(g)
|
These are mixed-use properties.
|
33
|
(h)
|
We contributed this property to an unconsolidated real estate venture. However, we continue to consolidate this property due to our continuing involvement resulting from our ongoing lease of space, and our 50% ownership interest in the real estate venture.
|
|
(i)
|
This is a 220-space parking garage facility.
|
The following table shows information regarding rental rates and lease expirations for the Properties at
December 31, 2013
and assumes that none of the tenants exercises renewal options or termination rights, if any, at or prior to scheduled expirations:
|
Year of
Lease
Expiration
December 31,
|
Number of
Leases
Expiring
Within the
Year
|
Rentable
Square
Footage
Subject to
Expiring
Leases
|
Final
Annualized
Base Rent
Under
Expiring
Leases (a)
|
Final
Annualized Base Rent
Per Square
Foot
Expiring
Leases
|
Percentage
of Total Final Annualized
Base Rent
Under
Expiring
Leases
|
Cumulative
Total
|
||||||||||||||
|
2013 (b)
|
31
|
|
46,524
|
|
$
|
902,202
|
|
$
|
19.39
|
|
0.2
|
%
|
0.2
|
%
|
||||||
|
2014
|
245
|
|
1,516,728
|
|
34,171,771
|
|
22.53
|
|
6.0
|
%
|
6.2
|
%
|
||||||||
|
2015
|
247
|
|
2,323,785
|
|
48,985,940
|
|
21.08
|
|
8.6
|
%
|
14.8
|
%
|
||||||||
|
2016
|
232
|
|
1,842,151
|
|
43,772,047
|
|
23.76
|
|
7.7
|
%
|
22.5
|
%
|
||||||||
|
2017
|
237
|
|
2,889,363
|
|
76,314,172
|
|
26.41
|
|
13.4
|
%
|
35.9
|
%
|
||||||||
|
2018
|
207
|
|
2,823,893
|
|
78,115,221
|
|
27.66
|
|
13.7
|
%
|
49.6
|
%
|
||||||||
|
2019
|
139
|
|
1,530,888
|
|
46,326,191
|
|
30.26
|
|
8.1
|
%
|
57.7
|
%
|
||||||||
|
2020
|
85
|
|
1,619,665
|
|
44,802,402
|
|
27.66
|
|
7.9
|
%
|
65.6
|
%
|
||||||||
|
2021
|
48
|
|
1,062,627
|
|
30,298,305
|
|
28.51
|
|
5.3
|
%
|
70.9
|
%
|
||||||||
|
2022
|
38
|
|
1,601,503
|
|
48,306,345
|
|
30.16
|
|
8.5
|
%
|
79.4
|
%
|
||||||||
|
2023
|
39
|
|
622,756
|
|
18,387,699
|
|
29.53
|
|
3.2
|
%
|
82.6
|
%
|
||||||||
|
2024 and thereafter
|
46
|
|
3,567,627
|
|
98,358,765
|
|
27.57
|
|
17.4
|
%
|
100.0
|
%
|
||||||||
|
|
1,594
|
|
21,447,510
|
|
$
|
568,741,060
|
|
$
|
26.52
|
|
100.0
|
%
|
|
|||||||
|
(a)
|
“Final Annualized Base Rent” for each lease scheduled to expire represents the cash rental rate of base rents, excluding tenant reimbursements, in the final month prior to expiration multiplied by 12. Tenant reimbursements generally include payment of a portion of real estate taxes, operating expenses and common area maintenance and utility charges.
|
|
(b)
|
Relates to existing month-to-month tenancy leases and to expired leases, which converted to month-to-month tenancies until a written notice to vacate is provided by us or until a new lease agreement is agreed upon with the tenant.
|
34
At
December 31, 2013
, our Properties were leased to
1,376
tenants that are engaged in a variety of businesses. The following table sets forth information regarding leases at the Properties with the 20 tenants having the largest amounts of space leased based upon Annualized Base Rent as of
December 31, 2013
:
|
Tenant Name (a)
|
Number
of
Leases
|
Weighted
Average Remaining Lease Term
Months
|
Aggregate
Leased Square
Feet
|
Aggregate
Leased Square Feet |
Annualized
Base Rent (in 000) (b) |
Percentage of
Aggregate Annualized Base
Rent
|
||||||||||||||
|
General Services Administration — U.S. Govt.
|
15
|
|
168
|
|
1,550,382
|
|
7.2
|
%
|
$
|
34,672
|
|
7.0
|
%
|
|||||||
|
Northrop Grumman Corporation
|
4
|
|
42
|
|
431,033
|
|
2.0
|
%
|
13,544
|
|
2.7
|
%
|
||||||||
|
Pepper Hamilton LLP
|
2
|
|
138
|
|
339,923
|
|
1.6
|
%
|
11,528
|
|
2.3
|
%
|
||||||||
|
Wells Fargo Bank, N.A.
|
10
|
|
41
|
|
423,028
|
|
2.0
|
%
|
11,005
|
|
2.2
|
%
|
||||||||
|
KPMG, LLP
|
2
|
|
100
|
|
241,828
|
|
1.1
|
%
|
8,310
|
|
1.7
|
%
|
||||||||
|
Comcast Corporation
|
4
|
|
53
|
|
354,469
|
|
1.7
|
%
|
8,245
|
|
1.7
|
%
|
||||||||
|
Dechert LLP
|
1
|
|
70
|
|
218,565
|
|
1.0
|
%
|
7,651
|
|
1.6
|
%
|
||||||||
|
Lockheed Martin
|
7
|
|
30
|
|
441,281
|
|
2.1
|
%
|
7,223
|
|
1.5
|
%
|
||||||||
|
Lincoln National Management Co.
|
1
|
|
91
|
|
198,079
|
|
0.9
|
%
|
6,753
|
|
1.4
|
%
|
||||||||
|
PricewaterhouseCoopers LLP
|
1
|
|
139
|
|
237,221
|
|
1.1
|
%
|
6,698
|
|
1.4
|
%
|
||||||||
|
Blank Rome LLP
|
1
|
|
97
|
|
236,903
|
|
1.1
|
%
|
6,393
|
|
1.3
|
%
|
||||||||
|
Drinker Biddle & Reath LLP
|
1
|
|
144
|
|
209,584
|
|
1.0
|
%
|
6,070
|
|
1.2
|
%
|
||||||||
|
Macquarie US
|
1
|
|
79
|
|
223,355
|
|
1.0
|
%
|
6,016
|
|
1.2
|
%
|
||||||||
|
Verizon
|
6
|
|
58
|
|
229,699
|
|
1.1
|
%
|
5,950
|
|
1.2
|
%
|
||||||||
|
Deltek Systems, Inc.
|
1
|
|
104
|
|
157,900
|
|
0.7
|
%
|
5,529
|
|
1.1
|
%
|
||||||||
|
Janney Montgomery Scott, LLC
|
3
|
|
165
|
|
160,544
|
|
0.7
|
%
|
445
|
|
4,452
|
|
0.9
|
%
|
||||||
|
AT&T
|
7
|
|
63
|
|
121,803
|
|
0.6
|
%
|
4,062
|
|
0.8
|
%
|
||||||||
|
Executive Health Resources, Inc.
|
4
|
|
36
|
|
197,618
|
|
0.9
|
%
|
4,047
|
|
0.8
|
%
|
||||||||
|
Marsh & McLennan Companies, Inc.
|
2
|
|
125
|
|
112,278
|
|
0.5
|
%
|
4,040
|
|
0.8
|
%
|
||||||||
|
VWR Management Services LLC
|
1
|
|
132
|
|
149,858
|
|
0.7
|
%
|
3,955
|
|
0.8
|
%
|
||||||||
|
Consolidated Total/Weighted Average
|
74
|
|
55
|
|
6,235,351
|
|
29.0
|
%
|
$
|
166,143
|
|
33.6
|
%
|
|||||||
|
(a)
|
The identified tenant includes affiliates in certain circumstances.
|
|
(b)
|
Annualized Base Rent represents the monthly base rent, excluding tenant reimbursements, for each lease in effect at
December 31, 2013
multiplied by 12. Tenant reimbursements generally include payment of a portion of real estate taxes, operating expenses and common area maintenance and utility charges.
|
Real Estate Ventures
As of
December 31, 2013
, we had an aggregate net investment of approximately
$180.5 million
in
17
unconsolidated Real Estate Ventures. We formed or acquired interests in these Real Estate Ventures with unaffiliated third parties to develop or manage office properties or to acquire land in anticipation of possible development of office or residential properties. As of
December 31, 2013
,
11
of the real estate ventures owned
55
office buildings that contain an aggregate of approximately
5.7 million
net rentable square feet;
two
real estate ventures owned
3.8
acres of undeveloped parcels of land;
three
real estate ventures owned
22.5
acres of land under active development; and
one
real estate venture owned a hotel property that contains
137
rooms in Conshohocken, PA.
As indicated in Note 4, "Investment in Unconsolidated Real Estate Ventures," to our consolidated financial statements, during 2013 we also held interests in five former real estate ventures that had a $2.9 million net impact to the "Equity in income of real estate ventures" line of our consolidated income statement for the year ended December 31, 2013.
We account for our investments in these Real Estate Ventures using the equity method. Our ownership interests range from
20%
to
65%
, subject to specified priority allocations in certain of the Real Estate Ventures. Our investments, initially recorded at cost, are subsequently adjusted for our share of the Real Estate Ventures’ income or loss and contributions to capital and distributions, unless we have no intent or obligation to fund losses in which case our investment would not go below zero.
As of
December 31, 2013
, we have provide guarantees on behalf of certain of the real estate ventures, consisting of (i) a
$24.7 million
payment guaranty on the construction loan for the project being undertaken by evo at Cira; (ii) a
$3.2 million
payment
35
guarantee on the construction loan for a project being undertaken by TB-BDN Plymouth Apartments; and (iii) a
$0.5 million
payment guarantee on a loan provided to PJP VII. In addition, during construction undertaken by real estate ventures we have provided and expect to continue to provide cost overrun and completion guarantees, with rights of contribution among partners in the venture, as well as customary environmental indemnities and guarantees of customary exceptions to nonrecourse provisions in loan agreements.
Austin Venture
On October 16, 2013, we contributed a portfolio of seven office properties containing an aggregate of 1,398,826 square feet located in Austin, Texas (the "Austin Properties") to a newly-formed unconsolidated real estate venture (the "Austin Venture") that we formed with G&I VII Austin Office LLC (“DRA”), an investment vehicle unaffiliated with us and advised by DRA Advisors LLC. The Austin Properties and related assets represent our entire remaining property portfolio within the Austin, Texas region, with the exception of Four Points Centre which was acquired in December 2013. DRA and the Company, based on arm's-length negotiation, agreed to an aggregate gross sales price of $330.0 million subject to an obligation on the Company's part to fund the first $5.2 million of post-closing capital expenditures, of which $0.8 million had been funded by us through December 31, 2013.
We and DRA each own a 50% interest in the Austin Venture, subject to our right to receive up to an additional 10% of distributions.
Upon its formation, the Austin Venture obtained third party non-recourse debt financing of approximately
$230.6 million
secured by mortgages on the Austin Properties and used proceeds of this financing together with
$49.7 million
of cash contributed to the Austin Venture by DRA (less
$1.9 million
of closing costs and
$6.9 million
of closing prorations and lender holdbacks) to fund a
$271.5 million
distribution to us. We have agreed to fund the first
$5.2 million
of post-closing capital expenditures on behalf of the Austin Venture, resulting in net proceeds to us of
$266.3 million
after funding our capital expenditure obligation. As part of the transaction, our subsidiary management company executed an agreement with the Austin Venture to provide property management and leasing services to the Austin Venture in exchange for a market-based fee.
We, along with DRA intend to jointly pursue additional office opportunities in targeted Austin sub-markets and plan to co-invest in acquisitions that meet certain investment criteria utilizing additional equity funding of up to $100.0 million per partner and to-be-determined third-party debt financing.
4040 Wilson Venture
On
July 31, 2013
, we formed 4040 Wilson LLC Venture ("4040 Wilson"), as a joint venture between us and Ashton Park Associates LLC (“Ashton Park”), an unaffiliated third party. We and Ashton Park each owns a
50%
interest in 4040 Wilson. 4040 Wilson expects to construct a 426,900 square foot office building representing the final phase of the eight building, mixed-use, Liberty Center complex developed by the parent company of Ashton Park in the Ballston submarket of Arlington, Virginia. 4040 Wilson expects to develop the office building on a
1.3
acre land parcel contributed by Ashton Park to 4040 Wilson at an agreed upon valuation of
$36.0 million
. The total estimated project costs are
$194.1
million, which we expect will be financed through approximately
$72.0
million of partner capital contributions (consisting of
$36.0 million
in cash from the Company and land with a value of
$36.0 million
from Ashton Park) and approximately
$125.1
million of debt financing through a construction lender that has not yet been determined. We expect groundbreaking to commence upon achievement of certain of pre-leasing levels, at which point 4040 Wilson would expect to obtain debt financing for a portion of the project costs.
In our joint venture agreement with Ashton Park, we agreed to guarantee 100% of any lender mandated recourse. As of December 31, 2013, we had no outstanding guarantees related to 4040 Wilson.
Two and Six Tower Bridge Exchange Transaction
On June 19, 2013, we acquired an unaffiliated third party's ownership interest in Six Tower Bridge, an office property containing 116,174 net rentable square feet in Conshohocken, Pennsylvania. Prior to the June 2013 acquisition, we had a 63% ownership interest in the real estate venture that held title to this property. We acquired full ownership of Six Tower Bridge by exchanging our entire ownership interest in a separate real estate venture that held title to Two Tower Bridge, an office property also in Conshohocken, Pennsylvania for the remaining 37% ownership interest in Six Tower Bridge. Please see Note 4, "Investment in Unconsolidated Real Estate Ventures," to our consolidated financial statements for further discussion.
36
evo at Cira Centre South Venture (formerly the Grove Venture)
On
January 25, 2013
, we formed the HSRE-Campus Crest IX Real Estate Venture ("evo at Cira"), a joint venture among the Company and two unaffiliated third parties: Campus Crest Properties, LLC ("Campus Crest") and HSRE-Campus Crest IXA, LLC ("HSRE"). evo at Cira has commenced construction of a
33
-story,
850
-bed student housing tower located in the University City submarket of Philadelphia, Pennsylvania. The project is targeted for completion during the third quarter of 2014. We and Campus Crest each own a
30%
interest in the evo at Cira and HSRE owns a
40%
interest. evo at Cira is developing the project on a
one
-acre land parcel held under a long-term ground lease with the University of Pennsylvania, as ground lessor. We contributed to evo at Cira our tenancy rights under the long-term ground lease, together with associated development rights, at an agreed-upon value of
$8.5 million
. The total estimated project costs are
$158.5 million
, which are being financed through partner capital contributions totaling
$60.7 million
, and through
$97.8 million
of secured debt construction financing provided by PNC Bank, Capital One, and First Niagara Bank. We and Campus Crest have each provided, in addition to customary non-recourse carve-out guarantees, a completion and cost overrun guaranty, as well as a payment guaranty, on the construction financing (with the share of the payment guaranty for each of us and Campus Crest being approximately
$24.7 million
). As of December 31, 2013, we have funded 100% of our share of the anticipated equity contributions. Construction has already commenced, with a targeted project completion in 2014.
BDN Beacon Venture
On
March 26, 2013
, we sold our entire
20%
ownership interest in an unconsolidated real estate venture known as BDN Beacon Venture LLC (the "Beacon Venture"). The carrying amount of our investment in the Beacon Venture amounted to
$17.0 million
at the sale date, with our proceeds effectively matching the carrying amount.
We are involved from time to time in legal proceedings, including tenant disputes, employee disputes, disputes arising out of agreements to purchase or sell properties and disputes relating to state and local taxes. We generally consider these disputes to be routine to the conduct of our business and management believes that the final outcome of such proceedings will not have a material adverse effect on our financial position, results of operations or liquidity.
Not applicable.
37
|
Item 5.
|
Market for Registrant’s Common Equity, Related Shareholder Matters and Issuer Purchases of Equity Securities
|
The common shares of Brandywine Realty Trust are traded on the New York Stock Exchange (“NYSE”) under the symbol “BDN.” There is no established trading market for units of partnership interests in the Operating Partnership. On
February 20, 2014
, there were
660
holders of record of our common shares and
35
holders of record (in addition to Brandywine Realty Trust) of Class A units of the Operating Partnership. On
February 20, 2014
, the last reported sales price of the common shares on the NYSE was
$14.44
. The following table sets forth the quarterly high and low sales price per common share reported on the NYSE for the indicated periods and the distributions paid by us with respect to each such period.
|
Share Price
High
|
Share Price
Low
|
Distributions
Paid During Quarter
|
|||||||||
|
First Quarter 2012
|
$
|
11.48
|
|
$
|
9.40
|
|
$
|
0.15
|
|
||
|
Second Quarter 2012
|
$
|
12.34
|
|
$
|
10.66
|
|
$
|
0.15
|
|
||
|
Third Quarter 2012
|
$
|
12.88
|
|
$
|
11.28
|
|
$
|
0.15
|
|
||
|
Fourth Quarter 2012
|
$
|
12.66
|
|
$
|
11.07
|
|
$
|
0.15
|
|
||
|
First Quarter 2013
|
$
|
14.85
|
|
$
|
12.18
|
|
$
|
0.15
|
|
||
|
Second Quarter 2013
|
$
|
15.94
|
|
$
|
12.61
|
|
$
|
0.15
|
|
||
|
Third Quarter 2013
|
$
|
14.56
|
|
$
|
12.45
|
|
$
|
0.15
|
|
||
|
Fourth Quarter 2013
|
$
|
14.35
|
|
$
|
12.67
|
|
$
|
0.15
|
|
||
For each quarter in
2013
and
2012
, the Operating Partnership paid a cash distribution per Class A unit in an amount equal to the dividend paid on a common share for each such quarter.
In order to maintain the status of Brandywine Realty Trust as a REIT, we must make annual distributions to shareholders of at least 90% of our taxable income (not including net capital gains). Future distributions will be declared at the discretion of our Board of Trustees and will depend on our actual cash flow, financial condition and capital requirements, the annual distribution requirements under the REIT provisions of the Internal Revenue Code and such other factors as our Board of Trustees deems relevant.
On
December 10, 2013
, our Board of Trustees declared a quarterly dividend distribution of
$0.15
per common share that was paid on
January 21, 2014
. On December 11, 2012, our Board of Trustees declared a quarterly dividend distribution of $0.15 per common share that was paid on January 18, 2013. Our Board of Trustees has adopted a dividend policy designed such that our distributions to our projected, normalized taxable income for
2014
.
The following table provides information as of
December 31, 2013
, with respect to compensation plans (including individual compensation arrangements) under which our common shares are authorized for issuance:
|
(a)
|
(b)
|
(c)
|
||||||||
|
Plan category
|
Number of securities to
be issued upon exercise of outstanding options,
warrants and rights
|
Weighted-average
exercise price of outstanding options,
warrants and rights
|
Number of securities
remaining available for future issuance under equity compensation plans (excluding securities
reflected in column (a))
|
|||||||
|
Equity compensation plans approved by security holders (1)
|
2,983,569
|
|
$
|
15.50
|
|
5,195,177
|
|
|||
|
Equity compensation plans not approved by security holders
|
—
|
|
—
|
|
—
|
|
||||
|
Total
|
2,983,569
|
|
$
|
15.50
|
|
5,195,177
|
|
|||
|
(1)
|
Relates to our Amended and Restated 1997 Long-Term Incentive Plan (the “1997 Plan”) and 46,667 options awarded prior to adoption of the 1997 Plan. Under the 1997 Plan, as amended, the number of common shares remaining available for awards
|
38
under the 1997 Plan was 5,195,177 as of December 31, 2013 (of which 3,600,000 were available solely for awards of options and share appreciation rights).
There were no common share repurchases under our repurchase program during the fiscal quarter ended December 31, 2013. The number of common shares remaining available for repurchase under our share repurchase program as of December 31, 2013 was 539,200.
39
SHARE PERFORMANCE GRAPH
The SEC requires us to present a chart comparing the cumulative total shareholder return on the common shares with the cumulative total shareholder return of (i) a broad equity index and (ii) a published industry or peer group index. The following chart compares the cumulative total shareholder return for the common shares with the cumulative shareholder return of companies on (i) the S&P 500 Index (ii) the Russell 2000 and (iii) the NAREIT ALL-REIT Total Return Index as provided by NAREIT for the period beginning December 31, 2008 and ending
December 31, 2013
and assumes an investment of $100, with reinvestment of all dividends, has been made in the common shares and in each index on December 31, 2008.
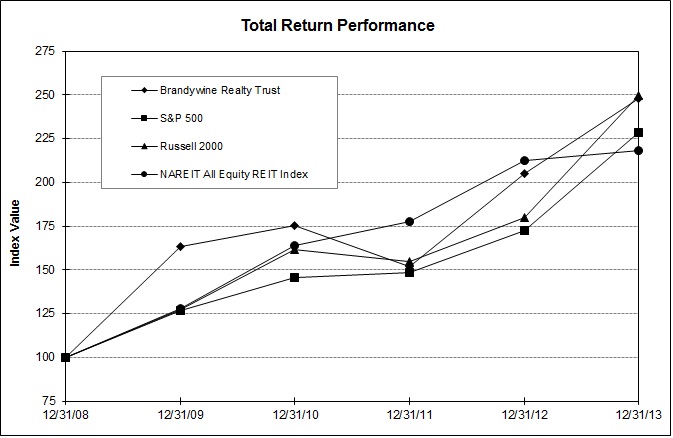
|
|
Year Ended
|
|||||||||||||||||
|
Index
|
12/31/2008
|
12/31/2009
|
12/31/2010
|
12/31/2011
|
12/31/2012
|
12/31/2013
|
||||||||||||
|
Brandywine Realty Trust
|
100.00
|
|
163.00
|
|
175.42
|
|
151.68
|
|
205.28
|
|
248.14
|
|
||||||
|
S&P 500
|
100.00
|
|
126.46
|
|
145.51
|
|
148.59
|
|
172.37
|
|
228.19
|
|
||||||
|
Russell 2000
|
100.00
|
|
127.17
|
|
161.32
|
|
154.59
|
|
179.86
|
|
249.69
|
|
||||||
|
NAREIT All Equity REIT Index
|
100.00
|
|
127.99
|
|
163.76
|
|
177.32
|
|
212.26
|
|
218.32
|
|
||||||
40
The following table sets forth selected financial and operating data and should be read in conjunction with the financial statements and related notes and “Management’s Discussion and Analysis of Financial Condition and Results of Operations” included in this Annual Report on Form 10-K. The selected data have been revised to reflect disposition of all properties since January 1, 2009, which have been reclassified as discontinued operations for all periods presented in accordance with the accounting standard governing discontinued operations.
Brandywine Realty Trust
(in thousands, except per common share data and number of properties)
|
Year Ended December 31,
|
2013
|
2012
|
2011
|
2010
|
2009
|
||||||||||||||||
|
Operating Results
|
|
|
|
||||||||||||||||||
|
Total revenue
|
$
|
562,210
|
|
$
|
535,679
|
|
$
|
538,568
|
|
$
|
516,280
|
|
$
|
526,378
|
|
||||||
|
Income (loss) from continuing operations
|
38,982
|
|
(37,309
|
)
|
(24,556
|
)
|
(43,000
|
)
|
(8,916
|
)
|
|||||||||||
|
Net income (loss)
|
43,189
|
|
6,529
|
|
(4,715
|
)
|
(17,606
|
)
|
8,089
|
|
|||||||||||
|
Income (loss) allocated to Common Shares
|
35,514
|
|
(8,238
|
)
|
(12,996
|
)
|
(25,578
|
)
|
(245
|
)
|
|||||||||||
|
Income (loss) from continuing operations per Common Share
|
|||||||||||||||||||||
|
Basic
|
$
|
0.20
|
|
$
|
(0.36
|
)
|
$
|
(0.24
|
)
|
$
|
(0.38
|
)
|
$
|
(0.15
|
)
|
||||||
|
Diluted
|
$
|
0.20
|
|
$
|
(0.36
|
)
|
$
|
(0.24
|
)
|
$
|
(0.38
|
)
|
$
|
(0.15
|
)
|
||||||
|
Earnings (loss) per Common Share
|
|||||||||||||||||||||
|
Basic
|
$
|
0.23
|
|
$
|
(0.06
|
)
|
$
|
(0.10
|
)
|
$
|
(0.19
|
)
|
$
|
—
|
|
||||||
|
Diluted
|
$
|
0.23
|
|
$
|
(0.06
|
)
|
$
|
(0.10
|
)
|
$
|
(0.19
|
)
|
$
|
—
|
|
||||||
|
Cash distributions paid per Common Share
|
$
|
0.60
|
|
$
|
0.60
|
|
$
|
0.60
|
|
$
|
0.60
|
|
$
|
0.60
|
|
||||||
|
|
|
|
|
||||||||||||||||||
|
Real estate investments, net of accumulated depreciation
|
$
|
3,853,006
|
|
$
|
3,922,893
|
|
$
|
4,061,461
|
|
$
|
4,201,410
|
|
$
|
4,164,992
|
|
||||||
|
Total assets
|
4,765,095
|
|
4,506,709
|
|
4,557,718
|
|
4,690,378
|
|
4,663,750
|
|
|||||||||||
|
Total indebtedness
|
2,595,381
|
|
2,465,330
|
|
2,393,995
|
|
2,430,446
|
|
2,454,577
|
|
|||||||||||
|
Total liabilities
|
2,843,660
|
|
2,733,193
|
|
2,668,022
|
|
2,712,604
|
|
2,742,010
|
|
|||||||||||
|
Noncontrolling interest
|
21,215
|
|
21,238
|
|
33,105
|
|
128,272
|
|
38,308
|
|
|||||||||||
|
Brandywine Realty Trust’s equity
|
1,900,220
|
|
1,752,278
|
|
1,856,591
|
|
1,849,502
|
|
1,883,432
|
|
|||||||||||
|
Other Data
|
|
|
|
||||||||||||||||||
|
Cash flows from:
|
|
|
|
||||||||||||||||||
|
Operating activities
|
$
|
183,484
|
|
$
|
159,110
|
|
$
|
177,247
|
|
$
|
185,127
|
|
$
|
220,405
|
|
||||||
|
Investing activities
|
104,708
|
|
(74,864
|
)
|
(46,163
|
)
|
(171,936
|
)
|
(102,549
|
)
|
|||||||||||
|
Financing activities
|
(26,534
|
)
|
(83,107
|
)
|
(147,239
|
)
|
1,807
|
|
(120,213
|
)
|
|||||||||||
|
Property Data
|
|
|
|||||||||||||||||||
|
Number of properties owned at year end
|
204
|
|
221
|
|
232
|
|
233
|
|
245
|
|
|||||||||||
|
Net rentable square feet owned at year end
|
24,765
|
|
25,079
|
|
25,221
|
|
25,633
|
|
25,563
|
|
|||||||||||
41
Brandywine Operating Partnership, L.P.
(in thousands, except per common partnership unit data and number of properties)
|
Year Ended December 31,
|
2013
|
2012
|
2011
|
2010
|
2009
|
|||||||||||||||
|
Operating Results
|
|
|
|
|||||||||||||||||
|
Total revenue
|
$
|
562,210
|
|
$
|
535,679
|
|
$
|
538,568
|
|
$
|
516.28
|
|
$
|
526,378
|
|
|||||
|
Loss from continuing operations
|
38,982
|
|
(37,309
|
)
|
(24,556
|
)
|
(43,000
|
)
|
(8,916
|
)
|
||||||||||
|
Net income (loss)
|
43,189
|
|
6,529
|
|
(4,715
|
)
|
(17,606
|
)
|
8,089
|
|
||||||||||
|
Loss from continuing operations per Common Partnership Unit
|
|
|
|
|||||||||||||||||
|
Basic
|
$
|
0.20
|
|
$
|
(0.36
|
)
|
$
|
(0.23
|
)
|
$
|
(0.37
|
)
|
$
|
(0.15
|
)
|
|||||
|
Diluted
|
$
|
0.20
|
|
$
|
(0.36
|
)
|
$
|
(0.23
|
)
|
$
|
(0.37
|
)
|
$
|
(0.15
|
)
|
|||||
|
Earnings (loss) per Common Partnership Units
|
||||||||||||||||||||
|
Basic
|
$
|
0.23
|
|
$
|
(0.06
|
)
|
$
|
(0.09
|
)
|
$
|
(0.19
|
)
|
$
|
—
|
|
|||||
|
Diluted
|
$
|
0.23
|
|
$
|
(0.06
|
)
|
$
|
(0.09
|
)
|
$
|
(0.19
|
)
|
$
|
—
|
|
|||||
|
Cash distributions paid per Common Partnership Unit
|
$
|
0.60
|
|
$
|
0.60
|
|
$
|
0.60
|
|
$
|
0.60
|
|
$
|
0.60
|
|
|||||
|
Balance Sheet Data
|
|
|
|
|||||||||||||||||
|
Real estate investments, net of accumulated depreciation
|
$
|
3,853,006
|
|
$
|
3,922,893
|
|
$
|
4,061,461
|
|
$
|
4,201,410
|
|
$
|
4,164,992
|
|
|||||
|
Total assets
|
4,765,095
|
|
4,506,709
|
|
4,557,718
|
|
4,690,378
|
|
4,657,320
|
|
||||||||||
|
Total indebtedness
|
2,595,381
|
|
2,465,330
|
|
2,393,995
|
|
2,430,446
|
|
2,454,577
|
|
||||||||||
|
Total liabilities
|
2,843,660
|
|
2,733,193
|
|
2,668,022
|
|
2,712,604
|
|
2,742,010
|
|
||||||||||
|
Redeemable limited partnership units
|
26,486
|
|
26,777
|
|
38,370
|
|
132,855
|
|
44,620
|
|
||||||||||
|
Non-controlling interest
|
—
|
|
—
|
|
—
|
|
—
|
|
65
|
|
||||||||||
|
Brandywine Operating Partnership’s equity
|
1,894,003
|
|
1,746,739
|
|
1,851,326
|
|
1,844,919
|
|
1,871,155
|
|
||||||||||
|
Other Data
|
|
|
|
|||||||||||||||||
|
Cash flows from:
|
|
|
|
|||||||||||||||||
|
Operating activities
|
$
|
183,484
|
|
$
|
159,110
|
|
$
|
177,247
|
|
$
|
185,127
|
|
$
|
220,405
|
|
|||||
|
Investing activities
|
104,708
|
|
(74,864
|
)
|
(46,163
|
)
|
(171,936
|
)
|
(102,549
|
)
|
||||||||||
|
Financing activities
|
(26,534
|
)
|
(83,107
|
)
|
(147,239
|
)
|
1,807
|
|
(120,213
|
)
|
||||||||||
|
Property Data
|
|
|
|
|||||||||||||||||
|
Number of properties owned at year end
|
204
|
|
221
|
|
232
|
|
233
|
|
245
|
|
||||||||||
|
Net rentable square feet owned at year end
|
24,765
|
|
25,079
|
|
25,221
|
|
25,663
|
|
25,563
|
|
||||||||||
|
Item 7.
|
Management’s Discussion and Analysis of Financial Condition and Results of Operations
|
The following discussion should be read in conjunction with the consolidated financial statements appearing elsewhere herein and is based primarily on our consolidated financial statements for the years ended
December 31, 2013
,
2012
and
2011
.
42
OVERVIEW
We are a self-administered and self-managed REIT that provides leasing, property management, development, redevelopment, acquisition and other tenant-related services for a portfolio of office, mixed-use and industrial properties. As of December 31, 2013, we owned
204
properties that contain an aggregate of approximately
24.8 million
net rentable square feet and consist of
176
office properties,
19
industrial facilities,
five
mixed-use properties,
one
development property,
two
redevelopment properties, and
one
re-entitlement property (collectively, the “Properties”). In addition, as of December 31, 2013, we owned economic interests in
17
unconsolidated real estate ventures which own properties that contain approximately
5.7 million
net rentable square feet (collectively, the “Real Estate Ventures”). As of December 31, 2013, we also owned
432
acres of undeveloped land, and held options to purchase approximately
51
additional acres of undeveloped land. As of December 31, 2013, the total potential development that these land parcels could support under current zoning, entitlements or combination thereof, amounted to
6.8 million
square feet. The Properties and the properties owned by the Real Estate Ventures are located in or near Philadelphia, Pennsylvania; Metropolitan Washington, D.C.; Southern New Jersey; Richmond, Virginia; Wilmington, Delaware; Austin, Texas and Oakland, Concord, and Carlsbad, California. In addition to managing properties that we own, as of December 31, 2013, we were managing approximately
7.9 million
net rentable square feet of office and industrial properties for third parties and the Real Estate Ventures. Unless otherwise indicated, all references in this Form 10-K to square feet represent net rentable area. We do not have any foreign operations and our business is not seasonal. Our operations are not dependent on a single tenant or a few tenants and no single tenant accounted for more than 10% of our total 2013 revenue.
During the year ended
December 31, 2013
, we were managing our portfolio within seven segments: (1) Pennsylvania Suburbs, (2) Philadelphia CBD, (3) Metropolitan Washington D.C., (4) New Jersey/Delaware, (5) Richmond, Virginia, (6) Austin, Texas and (7) California/Other. The Pennsylvania Suburbs segment includes properties in Chester, Delaware, and Montgomery counties in the Philadelphia suburbs. The Philadelphia CBD segment includes properties located in the City of Philadelphia in Pennsylvania. The Metropolitan Washington, D.C. segment includes properties in Northern Virginia and southern Maryland. The New Jersey/Delaware segment includes properties in Burlington and Camden counties in New Jersey and in New Castle county in the state of Delaware. The Richmond, Virginia segment includes properties primarily in Albemarle, Chesterfield, Goochland and Henrico counties and
one
property in Durham, North Carolina. The Austin, Texas segment includes properties in Austin. On October 16, 2013, we contributed seven properties within the Austin portfolio to a newly formed real estate venture. After contributing these properties, we wholly owned one property in Austin, Texas. For additional information, see Item 1. Business - 2013 Transactions. The California segment includes properties in Oakland, Concord, and Carlsbad. Our corporate group is responsible for cash and investment management, development of certain real estate properties during the construction period, and certain other general support functions.
We generate cash and revenue from leases of space at our properties and, to a lesser extent, from the management of properties owned by third parties and from investments in the Real Estate Ventures. Factors that we evaluate when leasing space include rental rates, costs of tenant improvements, tenant creditworthiness, current and expected operating costs, the length of the lease, vacancy levels and demand for office and industrial space. We also generate cash through sales of assets, including assets that we do not view as core to our portfolio, either because of location or expected growth potential, and assets that are commanding premium prices from third party investors.
Factors that May Influence Future Results of Operations
Global Market and Economic Conditions
In the U.S., market and economic conditions have been improving, characterized by more availability to credit and modest growth. While recent economic data reflects modest growth, the cost and availability of credit may be adversely affected by illiquid credit markets and wider credit spreads. Volatility in the U.S. and international markets and economies may adversely affect our liquidity and financial condition, and the liquidity and financial condition of our tenants. The continuance of these market conditions may limit our ability, as well as the ability of our tenants, to timely refinance maturing liabilities and access capital markets to meet liquidity needs.
Real Estate Asset Valuation
General economic conditions and the resulting impact on market conditions or a downturn in tenants’ businesses may adversely affect the value of our assets. Challenging economic conditions in the U.S., declining demand for leased office, mixed use, or industrial properties and/or a decrease in market rental rates and/or market values of real estate assets in our submarkets could have a negative impact on the value of our properties and related tenant improvements. If we were required under GAAP to write down the carrying value of any of our properties to the lower of cost or fair value due to impairment, or if as a result of an early lease termination we were required to remove or dispose of material amounts of tenant improvements that are not reusable to another tenant, our financial condition and results of operations could be negatively affected.
43
Leasing Activity and Rental Rates
The amount of net rental income generated by our properties depends principally on our ability to maintain the occupancy rates of currently leased space and to lease currently available space, newly developed or redeveloped properties and space available from unscheduled lease terminations. The amount of rental income we generate also depends on our ability to maintain or increase rental rates in our submarkets. Negative trends in one or more of these factors could adversely affect our rental income in future periods.
Development and Redevelopment Programs
Historically, a significant portion of our growth has come from our development and redevelopment efforts. We have a proactive planning process by which we continually evaluate the size, timing, costs and scope of our development and redevelopment programs and, as necessary, scale activity to reflect the economic conditions and the real estate fundamentals that exist in our strategic submarkets. We are currently proceeding on certain development and redevelopment projects, and we take a cautious and selective approach when determining if a certain development or redevelopment project will benefit our portfolio.
In addition, we may be unable to lease committed development or redevelopment properties at expected rental rates or within projected timeframes or complete development or redevelopment properties on schedule or within budgeted amounts, which could adversely affect our financial condition, results of operations and cash flow.
Financial and Operating Performance
Our financial and operating performance is dependent upon the demand for office, industrial and other commercial space in our markets, our leasing results, our acquisition, disposition and development activity, our financing activity, our cash requirements and economic and market conditions, including prevailing interest rates.
Adverse changes in economic conditions could result in a reduction of the availability of financing and potentially in higher borrowing costs. These factors, coupled with an ongoing economic recovery, have reduced the volume of real estate transactions and created credit stresses on some businesses. Vacancy rates may increase, and rental rates may decline, through 2014 and possibly beyond as the current economic climate may negatively impacts tenants.
Overall economic conditions, including but not limited to high unemployment and deteriorating financial and credit markets, could have a dampening effect on the fundamentals of our business, including increases in past due accounts, tenant defaults, lower occupancy and reduced effective rents. These conditions would negatively affect our future net income and cash flows and could have a material adverse effect on our financial condition. We believe that the quality of our assets and our strong balance sheet will enable us to raise debt capital, if necessary, in various forms and from different sources, including traditional term or secured loans from banks, pension funds and life insurance companies. However, there can be no assurance that we will be able to borrow funds on terms that are economically attractive or at all.
We continued to seek revenue growth in fiscal year 2013 by increasing occupancy and rental rates. Occupancy at our wholly owned properties at
December 31, 2013
was
89.5%
, compared to 88.3% at December 31, 2012.
44
The table below summarizes selected operating and leasing statistics of our wholly owned operating properties for the year ended
December 31, 2013
:
|
Year ended
|
|||
|
December 31, 2013
|
|||
|
Leasing Activity:
|
|||
|
Total net rentable square feet owned (1)
|
23,973,578
|
|
|
|
Occupancy percentage (end of period)
|
89.5
|
%
|
|
|
Average occupancy percentage
|
88.0
|
%
|
|
|
New leases and expansions commenced (square feet)
|
1,753,986
|
|
|
|
Leases renewed (square feet)
|
1,589,504
|
|
|
|
Net absorption (square feet) (2)
|
289,271
|
|
|
|
Percentage change in rental rates per square feet (3)
|
|||
|
New and expansion rental rates
|
7.1
|
%
|
|
|
Renewal rental rates
|
8.6
|
%
|
|
|
Combined rental rates
|
8.1
|
%
|
|
|
Capital Costs Committed (4)
|
|||
|
Leasing commissions (per square feet)
|
$3.38
|
||
|
Tenant Improvements (per square feet)
|
$8.60
|
||
|
(1) For each period, includes all properties in the core portfolio (i.e. not under development or redevelopment), including properties that were sold during these periods.
|
|||
|
(2) Includes leasing related to completed developments and redevelopments, as well as sold properties.
|
|||
|
(3) Rental rates include base rent plus reimbursement for operating expenses and real estate taxes.
|
|||
|
(4) Calculated on an average basis.
|
|||
In seeking to increase revenue through our operating, financing and investment activities, we also seek to minimize operating risks, including (i) tenant rollover risk, (ii) tenant credit risk and (iii) development risk.
Tenant Rollover Risk
:
We are subject to the risks that tenant leases, upon expiration, are not renewed, that space may not be relet; and that the terms of renewal or reletting (including the cost of renovations) may be less favorable to us than the current lease terms. Leases that accounted for approximately
6.2%
of our aggregate final annualized base rents as of
December 31, 2013
(representing approximately
6.5%
of the net rentable square feet of the properties) are scheduled to expire without penalty in
2014
. We maintain an active dialogue with our tenants in an effort to maximize lease renewals. Our retention rate for leases that were scheduled to expire in
2013
was
68.3%
compared to retention rate of 66.2% for leases that expired in 2012. Rental rates on leases expiring during 2013 did not deviate significantly from market renewal rates in the regions in which we operate. If we are unable to renew leases or relet space under expiring leases, at anticipated rental rates, or if tenants terminate their leases early, our cash flow would be adversely impacted.
Tenant Credit Risk
:
In the event of a tenant default, we may experience delays in enforcing our rights as a landlord and may incur substantial costs in protecting our investment. Our management regularly evaluates our accounts receivable reserve policy in light of our tenant base and general and local economic conditions. Our accounts receivable allowance was
$16.2
million or
10.3%
of total receivables (including accrued rent receivable) as of
December 31, 2013
compared to
$16.6 million
or
10.9%
of total receivables (including accrued rent receivable) as of
December 31, 2012
.
If economic conditions persist or deteriorate further, we may experience increases in past due accounts, defaults, lower occupancy and reduced effective rents. This condition would negatively affect our future net income and cash flows and could have a material adverse effect on our financial condition.
45
Development Risk
:
On October 31, 2013 we determined to proceed with development of the Cira Walnut Tower ("Cira Walnut"), which we currently contemplate as a
47
-story office and residential tower at 30
th
and Walnut Streets in Philadelphia on a site ground leased from the University of Pennsylvania. We currently expect Cira Walnut to be ready for initial occupancy during the second quarter of 2016 and to include approximately
575,000
square feet of office space,
245,000
square feet of residential space consisting of
260
market rate finished and unfinished rental apartment units, and
10,000
square feet of retail space, with an additional floor containing a full range of amenities.
To reduce development risk, we have pre-leased an aggregate of
61%
of the office square feet of Cira Walnut. The anchor tenant for approximately
253,000
square feet of office space is FMC Corporation, a diversified chemical company serving agricultural, consumer and industrial markets globally. The lease with FMC has an initial term of sixteen (16) years from initial occupancy. In addition, we also pre-leased approximately
100,000
square feet of office space to the University of Pennsylvania under a 20-year lease lease. Cira Walnut will be known as The FMC Tower at Cira Centre South.
We anticipate that the office component of the project will cost approximately
$236.0 million
with the residential component costing approximately
$105.0 million
for a total project cost of
$341.0 million
and intend to fund the Cira Walnut development costs through a combination of existing cash balances, capital raised through one or more joint venture formations, proceeds from additional asset sales or equity and debt financing including third party equity sources.
Our current intention is to either joint venture or pre-sell the residential component of the FMC Tower at Cira Centre South. Pursuant to this objective, we have executed a non-binding letter of intent with a residential development and operating company that contemplates either outcome.
Our ground lease with the University of Pennsylvania has a term through July 2097, with a variable rent that would provide the University with a percentage of the cash flow or proceeds of specified capital events subject to receipt of a priority return on the Operating Partnership's investment.
Development projects are subject to a variety of risks, including construction delays, construction cost overruns, inability to obtain financing on favorable terms, inability to lease space at projected rates, inability to enter into construction, development and other agreements on favorable terms, and unexpected environmental and other hazards. See Item 1A - Risk Factors.
CRITICAL ACCOUNTING POLICIES AND ESTIMATES
Management’s Discussion and Analysis of Financial Condition and Results of Operations discuss our consolidated financial statements, which have been prepared in accordance with accounting principles generally accepted in the United States of America (GAAP). The preparation of financial statements in conformity with GAAP requires management to make estimates and assumptions that affect the reported amounts of assets, liabilities, and the disclosure of contingent assets and liabilities at the date of the financial statements and the reported amounts of revenues and expenses for the reporting periods. Certain accounting policies are considered to be critical accounting policies, as they require management to make assumptions about matters that are highly uncertain at the time the estimate is made and changes in the accounting estimate are reasonably likely to occur from period to period. Management believes the following critical accounting policies reflect our more significant judgments and estimates used in the preparation of our consolidated financial statements. For a summary of all of our significant accounting policies, see Note 2 to our consolidated financial statements included elsewhere in this report.
Revenue Recognition
We recognize rental revenue on the straight-line basis from the later of the date of the commencement of the lease or the date of acquisition of the property subject to existing leases, which averages minimum rents over the terms of the leases. Lease incentives, which are included as reductions of rental revenue are recognized on a straight-line basis over the term of the lease.
Our leases also typically provide for tenant reimbursement of a portion of common area maintenance expenses and other operating expenses to the extent that a tenant’s pro rata share of expenses exceeds a base year level set in the lease or to the extent that the tenant has a lease on a triple net basis. For certain leases, we make significant assumptions and judgments in determining the lease term, including assumptions when the lease provides the tenant with an early termination option. The lease term impacts the period over which we determine and record minimum rents and also impacts the period over which we amortize lease-related costs.
In addition, our rental revenue is impacted by our determination of whether improvements to our properties, whether made by us or by the tenant, are landlord assets. The determination of whether an improvement is a landlord asset requires judgment. In making this judgment, our primary consideration is whether the improvement would be utilizable by another tenant upon move
46
out of the improved space by the then-existing tenant. If we have funded an improvement that we determine not to be landlord assets, then we treat the costs of the improvement as lease incentives. If the tenant has funded the improvement that we determine to be landlord assets, then we treat the costs of the improvement as deferred revenue and amortize this cost into revenue over the lease term.
Recoveries from tenants, consisting of amounts due from tenants for common area maintenance expenses, real estate taxes and other recoverable costs are recognized as revenue in the period during which the expenses are incurred.
Tenant reimbursements are recognized and presented in accordance with accounting guidance which requires that these reimbursements be recorded on a gross basis because we are generally the primary obligor with respect to the goods and services the purchase of which gives rise to the reimbursement obligation; because we have discretion in selecting the vendors and suppliers; and because we bear the credit risk in the event they do not reimburse us. We also receive payments from third parties for reimbursement of a portion of the payroll and payroll-related costs for certain of our personnel allocated to perform services for these third parties and we reflect these payments on a gross basis.
We recognize gains on sales of real estate at times and in amounts determined in accordance with the accounting guidance for sales of real estate. The guidance takes into account the terms of the transaction and any continuing involvement, including in the form of management, leasing of space or financial assistance associated with the properties. If the sales criteria for the full accrual method are not met, then we defer some or all of the gain recognition and account for the continued operations of the property by applying the finance, leasing, profit sharing, deposit, installment or cost recovery method, as appropriate, until the sales criteria are met
We derive parking revenues from leases, monthly parking and transient parking. We recognize parking revenue as earned.
We receive management and development fees from third parties.
Property management fees are recorded and earned based on a percentage of collected rents at the properties under management, and not on a straight-line basis, because such fees are contingent upon the collection of rents. We record development fees as earned taking into account the risk associated with each project. Profit on development fees earned from joint venture projects is recognized as revenue to the extent of the third party partners’ ownership interest.
Real Estate Investments
Real estate investments are carried at cost. We record acquisition of real estate investments treated as business combinations under the acquisition method of accounting and allocate the purchase price to land, buildings and intangible assets on a relative fair value basis. Depreciation is computed using the straight-line method over the useful lives of buildings and capital improvements (5 to 55 years) and over the shorter of the lease term or the life of the asset for tenant improvements. Direct construction costs related to the development of Properties and land holdings are capitalized as incurred. Capitalized costs include pre-construction costs essential to the development of the property, development and constructions costs, interest, property taxes, insurance, salaries and other project costs during the period of development. Estimates and judgments are required in determining when capitalization of certain costs such as interest should commence and cease. We expense routine repair and maintenance expenditures and capitalize those items that extend the useful lives of the underlying assets.
Real Estate Ventures
When we obtain an economic interest in an entity, we evaluate the entity to determine if the entity is deemed a variable interest entity (“VIE”), and if we are deemed to be the primary beneficiary, in accordance with the accounting standard for the consolidation of variable interest entities. This accounting standard requires significant use of judgments and estimates in determining its application. If the entity is not deemed to be a VIE, and we serve as the general partner or managing member within the entity, we evaluate to determine if our presumed control as the general partner or managing member is overcome by the “kick out” rights and other substantive participating rights of the limited partners or non-managing members in accordance with the same accounting standard.
We consolidate (i) entities that are VIEs and of which we are deemed to be the primary beneficiary and (ii) entities that are non-VIEs which we control. Entities that we account for under the equity method (i.e., at cost, increased or decreased by our share of earnings or losses, less distributions) include (i) entities that are VIEs and of which we are not deemed the primary beneficiary (ii) entities that are non-VIEs which we do not control, but over which we have the ability to exercise significant influence and (iii) entities that are non-VIEs which we maintain an ownership interest through our general partner status, but in which the limited partners in the entity have the substantive ability to dissolve the entity or remove us without cause or have substantive participating rights. We continuously assess our determination of whether an entity is a VIE and who the primary beneficiary is, and whether
47
or not the limited partners in an entity have substantive rights, including if certain events occur that are likely to cause a change in original determinations.
On a periodic basis, management assesses whether there are any indicators that the value of our investments in unconsolidated joint ventures may be impaired. An investment is impaired only if management’s estimate of the value of the investment is less than the carrying value of the investment, and such decline in value is deemed to be other than temporary. To the extent impairment has occurred, the loss shall be measured as the excess of the carrying amount of the investment over the fair value of the investment. Our estimates of value for each investment (particularly in commercial real estate joint ventures) are based on a number of assumptions that are subject to economic and market uncertainties including, among others, demand for space, competition for tenants, changes in market rental rates, and operating costs. These factors are difficult to predict and are subject to future events that may alter management’s assumptions; accordingly, the values estimated by management in its impairment analyses may not be realized.
Impairment or Disposal of Long-Lived Assets
We review our long-lived assets for impairment following the end of each quarter and when there is an event or change in circumstances that indicates an impairment in value. An impairment loss is recognized if the carrying amount of an asset is not recoverable and exceeds its fair value. In such case, an impairment loss is recognized in the amount of the excess of the carrying amount of the asset over its fair value. The evaluation of anticipated cash flows is highly subjective and is based in part on assumptions regarding future occupancy, rental rates and capital requirements that could differ materially from actual results in future periods. Since cash flows on properties considered to be “long-lived assets to be held and used” are considered on an undiscounted basis to determine whether an asset has been impaired, our established strategy of holding properties over the long term directly decreases the likelihood of recording an impairment loss. If our holding strategy were to change or if market conditions were to otherwise dictate an earlier sale date, then an impairment loss may be recognized and such loss could be material. If we determine that impairment has occurred, the affected assets must be reduced to their fair value.
The relevant accounting guidance for impairments requires that qualifying assets and liabilities and the results of operations that have been sold, or otherwise qualify as “held for sale,” be presented as discontinued operations in all periods presented if the property operations are expected to be eliminated and if we will not have significant continuing involvement following the sale. The components of the property’s net income that is reflected as discontinued operations include the net gain (or loss) upon the disposition of the property held for sale, operating results, depreciation and interest expense (if the property is subject to a secured loan). We generally consider assets to be “held for sale” when the transaction has been approved by our Board of Trustees, or by officers vested with authority to approve the transaction and there are no known significant contingencies relating to the sale of the property within one year of the consideration date and the consummation of the transaction is otherwise considered probable.
Following the classification of a property as “held for sale,” no further depreciation is recorded on the assets, and the asset is written down to the lower of carrying value or fair market value.
We determined during our impairment review of the years-ended December 31,
2013
and
2012
, that no impairment charges were necessary.
Income Taxes
Parent Company
The Parent Company has elected to be treated as a REIT under Sections 856 through 860 of the Internal Revenue Code of 1986, as amended (the “Internal Revenue Code”). In addition, the Parent Company may elect to treat one or more of its subsidiaries as REITs. In order to continue to qualify as a REIT, the Parent Company and each of its REIT subsidiaries are required to, among other things, distribute at least 90% of their REIT taxable income to their stockholders and meet certain tests regarding the nature of their income and assets. As REITs, the Parent Company and its REIT subsidiaries are not subject to federal income tax with respect to the portion of their income that meets certain criteria and is distributed annually to the stockholders. Accordingly, no provision for federal income taxes is included in the accompanying consolidated financial statements with respect to the operations of these REITs. The Parent Company and its REIT subsidiaries, if any, intend to continue to operate in a manner that allows them to continue to meet the requirements for taxation as REITs. Many of these requirements, however, are highly technical and complex. If the Parent Company or one of its REIT subsidiaries were to fail to meet these requirements, they would be subject to federal income tax.
The Parent Company may elect to treat one or more of its subsidiaries as a taxable REIT subsidiary, or TRS. In general, a TRS may perform additional services for our tenants and generally may engage in any real estate or non-real estate related business (except for the operation or management of health care facilities or lodging facilities or the provision to any person, under a
48
franchise, license or otherwise, of rights to any brand name under which any lodging facility or health care facility is operated). A TRS is subject to corporate federal income tax. The Parent Company has elected to treat certain of its corporate subsidiaries as TRSs; these entities provide third party property management services and certain services to tenants that could not otherwise be provided.
Operating Partnership
In general, the Operating Partnership is not subject to federal and state income taxes, and accordingly, no provision for income taxes has been made in the accompanying consolidated financial statements. The partners of the Operating Partnership are required to include their respective share of the Operating Partnership’s profits or losses in their respective tax returns. The Operating Partnership’s tax returns and the amount of allocable Partnership profits and losses are subject to examination by federal and state taxing authorities. If such examination results in changes to the Operating Partnership profits or losses, then the tax liability of the partners would be changed accordingly.
The Operating Partnership may elect to treat one or several of its subsidiaries as REITs under Sections 856 through 860 of the Internal Revenue Code. Each subsidiary REIT has met or intends to meet the requirements for treatment as a REIT under Sections 856 through 860 of the Internal Revenue Code, and, accordingly, no provision has been made for federal and state income taxes in the accompanying consolidated financial statements. If any subsidiary REIT fails to qualify as a REIT in any taxable year, that subsidiary REIT will be subject to federal and state income taxes and may not be able to qualify as a REIT for the four subsequent taxable years. Also, each subsidiary REIT may be subject to certain local income taxes.
The Operating Partnership has elected to treat several of its subsidiaries as TRSs, which are subject to federal, state and local income tax.
Allowance for Doubtful Accounts
We maintain an allowance for doubtful accounts that represents an estimate of losses that may be incurred from the inability of tenants to make required payments. The allowance is an estimate based on two calculations that are combined to determine the total amount reserved. First, we evaluate specific accounts where we have determined that a tenant may have an inability to meet its financial obligations. In these situations, we use our judgment, based on the facts and circumstances, and record a specific reserve for that tenant against amounts due to reduce the receivable to the amount that we expect to collect. These reserves are re-evaluated and adjusted as additional information becomes available. Second, a reserve is established for all tenants based on a range of percentages applied to receivable aging categories. If the financial condition of our tenants were to deteriorate, additional allowances may be required. For accrued rent receivables, we consider the results of the evaluation of specific accounts as well as other factors including assigning risk factors to different industries based on our tenants' standard industrial classification. Considering various factors including assigning a risk factor to different industries, these percentages are based on historical collection and write-off experience adjusted for current market conditions.
Deferred Costs
We incur direct costs related to the financing, development and leasing of our properties. Management exercises judgment in determining whether such costs, particularly internal costs, meet the criteria for capitalization or must be expensed. Capitalized financing fees are amortized over the related loan term on a basis that approximates the effective interest method while capitalized leasing costs are amortized over the related lease term. Management re-evaluates the remaining useful lives of leasing costs as the creditworthiness of our tenants and economic and market conditions change.
Purchase Price Allocation
We allocate the purchase price of properties to net tangible and identified intangible assets acquired based on fair values. Above-market and below-market in-place lease values for acquired properties are recorded based on the present value (using an interest rate which reflects the risks associated with the leases acquired) of the difference between (i) the contractual amounts to be paid pursuant to the in-place leases and (ii) our estimate of the fair market lease rates for the corresponding in-place leases, measured over a period equal to the remaining non-cancellable term of the lease (includes the below market fixed renewal period, if applicable). Capitalized above-market lease values are amortized as a reduction of rental income over the remaining non-cancellable terms of the respective leases. Capitalized below-market lease values are amortized as an increase of rental income over the remaining non-cancellable terms of the respective leases, including any fixed-rate renewal periods.
Other intangible assets also include amounts representing the value of tenant relationships and in-place leases based on our evaluation of the specific characteristics of each tenant’s lease and our overall relationship with the respective tenant. We estimate the cost to execute leases with terms similar to the remaining lease terms of the in-place leases, include leasing commissions, legal
49
and other related expenses. This intangible asset is amortized to expense over the remaining term of the respective leases and any fixed-rate bargain renewal periods. We estimate fair value through methods similar to those used by independent appraisers or by using independent appraisals. Factors that we consider in our analysis include an estimate of the carrying costs during the expected lease-up periods considering current market conditions and costs to execute similar leases. We also consider information obtained about each property as a result of our pre-acquisition due diligence, marketing and leasing activities in estimating the fair value of the tangible and intangible assets acquired. In estimating carrying costs, we include real estate taxes, insurance and other operating expenses and estimates of lost rentals at market rates during the expected lease-up periods, which primarily range from four to twelve months.
Characteristics that we consider in allocating value to our tenant relationships include the nature and extent of our business relationship with the tenant, growth prospects for developing new business with the tenant, the tenant’s credit quality and expectations of lease renewals. The value of tenant relationship intangibles is amortized over the remaining initial lease term and expected renewals, but in no event longer than the remaining depreciable life of the building. The value of in-place leases is amortized over the remaining non-cancellable term of the respective leases and any fixed-rate renewal periods.
In the event that a tenant terminates its lease at or prior to the end of the lease term, the unamortized portion of each intangible, including market rate adjustments, in-place lease values and tenant relationship values, would be charged to expense.
50
RESULTS OF OPERATIONS
The following discussion is based on our Consolidated Financial Statements for the years ended
December 31, 2013
,
2012
and
2011
. We believe that presentation of our consolidated financial information, without a breakdown by segment, will effectively present important information useful to our investors.
Net operating income (“NOI”) as presented in the comparative analysis below is defined as
revenue less property operating expenses, real estate taxes and third party management expenses. Property operating expenses that are included in determining NOI consist of costs that are necessary and allocable to our operating properties such as utilities, property-level salaries, repairs and maintenance, property insurance, management fees and bad debt expense. General and administrative expenses that are not reflected in NOI primarily consist of corporate-level salaries, amortization of share awards and professional fees that are incurred as part of corporate office management. NOI is a non-GAAP financial measure that we use internally to evaluate the operating performance of our real estate assets by segment, as presented in Note 18 to the consolidated financial statements, and of our business as a whole. We believe NOI provides useful information to investors regarding our financial condition and results of operations because it reflects only those income and expense items that are incurred at the property level. While NOI is a relevant and widely used measure of operating performance of real estate investment trusts, it does not represent cash flow from operations or net income as defined by GAAP and should not be considered as an alternative to those measures in evaluating our liquidity or operating performance. NOI also does not reflect general and administrative expenses, interest expenses, real estate impairment losses, depreciation and amortization costs, capital expenditures and leasing costs. Trends in development and construction activities that could materially impact our results from operations are also not included in NOI. We believe that net income, as defined by GAAP, is the most appropriate earnings measure. See Note 18 to the Consolidated Financial Statements for a reconciliation of NOI to our consolidated net income (loss).
Comparison of the Year Ended December 31, 2013 to the Year Ended December 31, 2012
The table below shows selected operating information for the “Same Store Property Portfolio” and the “Total Portfolio.” The Same Store Property Portfolio consists of
196
properties containing an aggregate of approximately
21.8 million
net rentable square feet, and represents properties that we owned for the twelve-month periods ended
December 31, 2013
and
2012
. The Same Store Property Portfolio includes properties acquired or placed in service on or prior to January 1,
2012
and owned through
December 31, 2013
. The Total Portfolio includes the effects of other properties that were either placed into service, acquired or redeveloped after January 1, 2011 or disposed prior to December 31, 2012. A property is excluded from our Same Store Property Portfolio and moved into the redevelopment column in the period that we determine that a redevelopment would be the best use of the asset, and when said asset is taken out of service or is undergoing re-entitlement for a future development strategy. This table also includes a reconciliation from the Same Store Property Portfolio to the Total Portfolio net income (i.e., all properties owned by us during the twelve-month periods ended
December 31, 2013
and
2012
) by providing information for the properties which were acquired, placed into service, under development or redevelopment and administrative/elimination information for the twelve-month periods ended
December 31, 2013
and
2012
(in thousands).
The Total Portfolio net income presented in the table is equal to the net income of the Parent Company and the Operating Partnership.
51
Comparison of Year Ended December 31, 2013 to the Year Ended December 31, 2012
|
|
Same Store Property Portfolio
|
Recently Completed
Properties (a)
|
Development Properties (b)
|
Other
(Eliminations) (c)
|
Total Portfolio
|
||||||||||||||||||||||||||||||||||||||||||
|
|
|
|
|
|
|
|
|
|
|||||||||||||||||||||||||||||||||||||||
|
(dollars in thousands)
|
2013
|
2012
|
Increase/
(Decrease)
|
2013
|
2012
|
2013
|
2012
|
2013
|
2012
|
2013
|
2012
|
Increase/
(Decrease)
|
|||||||||||||||||||||||||||||||||||
|
Revenue:
|
|||||||||||||||||||||||||||||||||||||||||||||||
|
Cash rents
|
$
|
407,422
|
|
$
|
392,528
|
|
$
|
14,894
|
|
$
|
2,833
|
|
$
|
—
|
|
$
|
9,095
|
|
$
|
1,095
|
|
$
|
14,834
|
|
$
|
15,531
|
|
$
|
434,184
|
|
$
|
409,154
|
|
$
|
25,030
|
|
|||||||||||
|
Straight-line rents
|
17,195
|
|
20,209
|
|
(3,014
|
)
|
280
|
|
—
|
|
2,580
|
|
757
|
|
(18
|
)
|
1,283
|
|
20,037
|
|
22,249
|
|
(2,212
|
)
|
|||||||||||||||||||||||
|
Above/below market rent amortization
|
5,765
|
|
5,865
|
|
(100
|
)
|
48
|
|
—
|
|
991
|
|
81
|
|
362
|
|
211
|
|
7,166
|
|
6,157
|
|
1,009
|
|
|||||||||||||||||||||||
|
Total rents
|
430,382
|
|
418,602
|
|
11,780
|
|
3,161
|
|
—
|
|
12,666
|
|
1,933
|
|
15,178
|
|
17,025
|
|
461,387
|
|
437,560
|
|
23,827
|
|
|||||||||||||||||||||||
|
Tenant reimbursements
|
64,195
|
|
63,616
|
|
579
|
|
280
|
|
—
|
|
1,821
|
|
921
|
|
12,791
|
|
12,523
|
|
79,087
|
|
77,060
|
|
2,027
|
|
|||||||||||||||||||||||
|
Termination fees
|
4,497
|
|
3,182
|
|
1,315
|
|
—
|
|
—
|
|
—
|
|
—
|
|
—
|
|
51
|
|
4,497
|
|
3,233
|
|
1,264
|
|
|||||||||||||||||||||||
|
Third party management fees, labor reimbursement and leasing
|
—
|
|
—
|
|
—
|
|
—
|
|
—
|
|
—
|
|
—
|
|
13,053
|
|
12,116
|
|
13,053
|
|
12,116
|
|
937
|
|
|||||||||||||||||||||||
|
Other
|
2,898
|
|
5,317
|
|
(2,419
|
)
|
1
|
|
—
|
|
176
|
|
12
|
|
1,111
|
|
381
|
|
4,186
|
|
5,710
|
|
(1,524
|
)
|
|||||||||||||||||||||||
|
Total revenue
|
501,972
|
|
490,717
|
|
11,255
|
|
3,442
|
|
—
|
|
14,663
|
|
2,866
|
|
42,133
|
|
42,096
|
|
562,210
|
|
535,679
|
|
26,531
|
|
|||||||||||||||||||||||
|
Property operating expenses
|
152,868
|
|
151,007
|
|
1,861
|
|
1,120
|
|
—
|
|
5,662
|
|
1,508
|
|
756
|
|
(196
|
)
|
160,406
|
|
152,319
|
|
8,087
|
|
|||||||||||||||||||||||
|
Real estate taxes
|
47,431
|
|
46,814
|
|
617
|
|
440
|
|
—
|
|
1,935
|
|
682
|
|
5,806
|
|
5,906
|
|
55,612
|
|
53,402
|
|
2,210
|
|
|||||||||||||||||||||||
|
Third party management expenses
|
—
|
|
—
|
|
—
|
|
—
|
|
—
|
|
—
|
|
—
|
|
5,751
|
|
5,127
|
|
5,751
|
|
5,127
|
|
624
|
|
|||||||||||||||||||||||
|
Net operating income
|
301,673
|
|
292,896
|
|
8,777
|
|
1,882
|
|
—
|
|
7,066
|
|
676
|
|
29,820
|
|
31,259
|
|
340,441
|
|
324,831
|
|
15,610
|
|
|||||||||||||||||||||||
|
General & administrative expenses
|
—
|
|
2
|
|
(2
|
)
|
301
|
|
—
|
|
1
|
|
96
|
|
27,326
|
|
25,315
|
|
27,628
|
|
25,413
|
|
2,215
|
|
|||||||||||||||||||||||
|
Depreciation and amortization
|
173,561
|
|
175,989
|
|
(2,428
|
)
|
1,385
|
|
—
|
|
7,386
|
|
1,069
|
|
14,689
|
|
11,324
|
|
197,021
|
|
188,382
|
|
8,639
|
|
|||||||||||||||||||||||
|
Operating income (loss)
|
$
|
128,112
|
|
$
|
116,905
|
|
$
|
11,207
|
|
$
|
196
|
|
$
|
—
|
|
$
|
(321
|
)
|
$
|
(489
|
)
|
$
|
(12,195
|
)
|
$
|
(5,380
|
)
|
$
|
115,792
|
|
$
|
111,036
|
|
$
|
4,756
|
|
|||||||||||
|
Number of properties
|
196
|
|
196
|
|
4
|
|
4
|
|
204
|
|
|
||||||||||||||||||||||||||||||||||||
|
Square feet
|
21,769
|
|
21,769
|
|
2,205
|
|
1,366
|
|
25,340
|
|
|
||||||||||||||||||||||||||||||||||||
|
Core Occupancy % (d)
|
89.6
|
%
|
87.7
|
%
|
87.8
|
%
|
N/A
|
|
89.5
|
%
|
|||||||||||||||||||||||||||||||||||||
|
Other Income (Expense):
|
|
|
|
|
|
|
|
|
|
|
|||||||||||||||||||||||||||||||||||||
|
Interest income
|
|
|
|
|
|
|
|
1,044
|
|
3,008
|
|
(1,964
|
)
|
||||||||||||||||||||||||||||||||||
|
Historic tax credit transaction income
|
|
|
|
|
|
|
|
11,853
|
|
11,840
|
|
13
|
|
||||||||||||||||||||||||||||||||||
|
Interest expense
|
|
|
|
|
|
|
|
(121,937
|
)
|
(132,939
|
)
|
11,002
|
|
||||||||||||||||||||||||||||||||||
|
Interest expense — Deferred financing costs
|
(4,676
|
)
|
(6,208
|
)
|
1,532
|
|
|||||||||||||||||||||||||||||||||||||||||
|
Recognized hedge activity
|
—
|
|
(2,985
|
)
|
2,985
|
|
|||||||||||||||||||||||||||||||||||||||||
|
Interest expense —Financing obligation
|
|
|
|
|
|
|
|
(972
|
)
|
(850
|
)
|
(122
|
)
|
||||||||||||||||||||||||||||||||||
|
Equity in income of real estate ventures
|
|
|
|
|
|
|
|
3,664
|
|
2,741
|
|
923
|
|
||||||||||||||||||||||||||||||||||
|
Net gain from remeasurement of investments in real estate ventures
|
6,866
|
|
—
|
|
6,866
|
|
|||||||||||||||||||||||||||||||||||||||||
|
Net gain (loss) on real estate venture transactions
|
29,604
|
|
(950
|
)
|
30,554
|
|
|||||||||||||||||||||||||||||||||||||||||
|
Net loss on sale of undepreciated real estate
|
(137
|
)
|
—
|
|
(137
|
)
|
|||||||||||||||||||||||||||||||||||||||||
|
Loss on early extinguishment of debt
|
|
|
|
|
|
|
|
(2,119
|
)
|
(22,002
|
)
|
19,883
|
|
||||||||||||||||||||||||||||||||||
|
Income (loss) from continuing operations
|
|
|
|
|
|
|
|
38,982
|
|
(37,309
|
)
|
76,291
|
|
||||||||||||||||||||||||||||||||||
|
Income from discontinued operations
|
|
|
|
|
|
|
|
4,207
|
|
43,838
|
|
(39,631
|
)
|
||||||||||||||||||||||||||||||||||
|
Net income
|
|
|
|
|
|
|
|
$
|
43,189
|
|
$
|
6,529
|
|
$
|
36,660
|
|
|||||||||||||||||||||||||||||||
|
Net income (loss) per common share
|
|
|
|
|
|
|
|
$
|
0.23
|
|
$
|
(0.06
|
)
|
$
|
0.29
|
|
|||||||||||||||||||||||||||||||
EXPLANATORY NOTES
|
(a)
|
Results include: Four assets completed/acquired and placed in service.
|
|
(b)
|
Results include: One development, two redevelopments and one re-entitlement property
|
|
(c)
|
Represents certain revenues and expenses at the corporate level as well as various intercompany costs that are eliminated in consolidation and third-party management fees. This also includes seven properties that were contributed to an unconsolidated real estate venture in which the Company has a 50% ownership interest.
|
52
|
(d)
|
Pertains to properties that are part of our core portfolio (i.e. not under development, redevelopment, or re-entitlement).
|
Total Revenue
Cash rents from the Total Portfolio
increased
by
$25.0 million
from
2012
to
2013
primarily reflecting the following
|
•
|
$14.9 million increase in rental income at our same store properties which is a result of 190 basis points increase in occupancy and a 100 basis point increase in cash rental rates from 2012 to 2013;
|
|
•
|
an increase of $8.0 million at our development properties related to the acquisition of 1900 Market Street during the fourth quarter of 2012 and a portion of 660 Germantown Pike which was placed into service subsequent to the fourth quarter of 2012;
|
|
•
|
an increase of $2.8 million related to the acquisition of One and Two Commerce Square during December of 2013 and Six Tower Bridge during the second quarter of 2013;
|
This increase is offset by a decrease of $0.7 million as a result of contributing our Austin portfolio to a joint venture during the fourth quarter of 2013.
Straight-line rents
decreased
by
$2.2 million
from
2012
to
2013
, as a result of the following: a decrease of $3.0 million at our same store properties as a result of free rent turning to cash rent subsequent to the fourth quarter of 2012 and $1.3 million related to the contribution of our Austin portfolio into a joint venture during the fourth quarter of 2013. This decrease was offset by $1.8 million related to increases in straight line rent earned at our development properties and increases of $0.3 million related to the acquisitions discussed above.
Tenant reimbursements
increased
$2.0 million
from
2012
to
2013
as a direct result of the $10.3 million increase in operating expenses over the same period. Please see the
Property Operating Expenses
and
Real Estate Taxes
explanations below and note that certain costs, such as snow removal costs, carry a higher tenant reimbursement percentage.
Termination fees at our Total Portfolio
increased
by
$1.3 million
due to timing and volume of tenant move-outs during
2013
when compared to
2012
.
Other income at our Total Portfolio
decreased
by
$1.5 million
during
2013
compared to
2012
as a result of real estate tax refunds received related to prior year's tax assessment appeals.
Property Operating Expenses
Property operating expenses across our total portfolio
increased
by
$8.1 million
from 2012 to 2013, mainly attributable to the following: (i) an increase of $4.2 million as a result of acquiring
1900 Market Street, Six Tower Bridge, Commerce Square and Four Points Centre as discussed above
, (ii) an increase of $1.1 million related to our development properties that were placed into service during 2013, (iii) an increase in repairs and maintenance expenses of $2.6 million, directly attributable the timing of tenant needs, (iv) an increase in snow removal costs of $0.7 million as a result of more severe winter experienced in our Pennsylvania and New Jersey submarkets, (v) an increase in bad debt expense of $0.7 million, and (vi) an increase in payroll expense of $0.6 million. These increases were offset by lower utility costs of $1.7 million.
Real Estate Taxes
Real estate taxes across our total portfolio
increased
by
$2.2 million
, primarily as a result of acquiring 1900 Market Street, Six Tower Bridge, One and Two Commerce Square and Four Points Centre as discussed above.
General and Administrative Expenses
General and administrative expenses
increased
by
$2.2 million
from
2012
to
2013
, mainly attributable to a $1.2 million increase in expenditures related to the acquisition activity discussed above. Stock compensation expense increased $0.8 million due to the fact that we accelerated the amortization of such compensation of our executive personnel meeting qualifying retirement provisions. Salary and benefits expense increased $0.7 million in 2013. These increases were offset by a $0.5 million decrease in professional fees and miscellaneous general and administrative expenses.
53
Depreciation and Amortization
Depreciation and amortization expense
increased
by
$8.6 million
, mainly attributable to the four property acquisitions discussed above. In addition, we also accelerated depreciation expense related to Plaza 1000 at Main Street. We are in the process of re-entitling this property for residential and mixed-use development, and accordingly, we shortened the lives of the buildings and related assets to the estimated demolition date. In addition, a portion of 660 Germantown Pike was placed into service subsequent to 2012 resulting in additional depreciation expense during 2013.
Interest Income
Interest income
decreased
by
$2.0 million
from 2012 to 2013 primarily due to the recognition of $1.0 million of accrued interest income related to the payoff of the Trenton note receivable during 2012. The remaining decrease is due to a decrease in interest income earned on investments in available-for-sale securities that were outstanding during 2012. Interest income earned during 2013 primarily represents interest earned on our available cash balances ($263.2 million as of December 31, 2013).
Interest Expense
The
decrease
in interest expense of
$11.0 million
is primarily due to the following:
|
•
|
a decrease of $14.3 million as a result of the repurchases of debt subsequent to the third quarter of 2012, including (i) $19.8 million of our 5.400% Guaranteed Notes due 2014, (ii) $69.7 million of our 7.500% Guaranteed Notes due 2015, (iii) $100.1 million of our 6.000% Guaranteed Notes due 2016; and (iv) $150.0 million of term loan indebtedness;
|
|
•
|
a decrease of $4.7 million in mortgage interest expense which is directly related to the $60.0 million decrease resulting from the repayment of two mortgage loans during the fourth quarter of 2012;
|
|
•
|
a decrease of $2.1 million related to our $151.5 million 5.400% Guaranteed Notes that matured and were repaid in full during April 2012; and,
|
|
•
|
an increase of $0.6 million in capitalized interest resulting in a decrease in interest expense.
|
The decrease of $21.7 million in interest expense described above was offset by an increase of $10.7 million, of which $9.7 million related to interest on our $250.0 million 3.950% Guaranteed Notes due 2023 issued in the fourth quarter of 2012 and $1.0 million relates to borrowings made during the first quarter of 2012 consisting of $250.0 million of 6.000% Guaranteed Notes due 2016, $150.0 million under the LIBOR + 1.750% Three-year Term Loan and $200.0 million under the LIBOR + 1.900% Seven-year Term Loan.
Interest Expense - Deferred Financing Costs
Deferred financing costs
decreased
$1.5 million
during
2013
compared to
2012
mainly due to the write-off of costs related to repurchases of debt during 2012, which included, (i) $19.8 million of our 5.400% Guaranteed Notes due 2014, (ii) $69.7 million of our 7.500% Guaranteed Notes due 2015, and (iii) $100.1 million of our 6.000% Guaranteed Notes due 2016, and (iv) $150.0 million of term loan indebtedness.
Recognized Hedge Activity
Recognized hedge activity
decreased
$3.0 million
during
2013
due to the recognition of $3.0 million of early termination fees related to the termination of interest rate swap contracts. The interest rate swap contracts were terminated in connection with the repayment of our $150.0 million fixed portion of our four-year term loan due February 1, 2016 during the fourth quarter of 2012 (see Note 7 of the notes to the consolidated financial statements for further details of these transactions). There were no comparable charges incurred during 2013.
Net Gain on Remeasurement of Investments in Real Estate Ventures
The net gain on remeasurement of investments in real estate ventures was $6.9 million during 2013 with no comparable gains recognized during 2012. These net gains resulted from the Company taking control of Six Tower Bridge and One and Two Commerce Square during 2013 which required the remeasurement at fair value of our existing equity interest in each partnership. See Footnote 3 and Footnote 4 of our consolidated financial statements.
54
Net Gain on Real Estate Venture Transactions
The $30.6 million increase in gain on real estate venture transactions is a result of the Company contributing seven properties to the newly-formed Austin Venture and recognizing a
$25.9 million
gain on sale during 2013. Additionally, a $3.7 million increase in gain on real estate venture transactions is the result of the exchange of our remaining ownership in the Two Tower Bridge Venture for the remaining ownership interest in the Six Tower Bridge Venture, as discussed above and in Footnote 4 of our consolidated financial statements.
Loss on real estate venture formation of $1.0 million incurred during 2012 was a result of our termination of an agreement with a third party broker that was entered into upon contributing two properties into a joint venture during December 2011. During the third quarter of 2012, we determined that it was in our best interest to terminate the contract in order to avoid additional commissions and fees on the future joint venture acquisitions, recognizing the fee as an additional cost of forming the real estate venture.
Loss on Early Extinguishment of Debt
During 2013, we repurchased (i) $0.5 million of our 6.000% Guaranteed Notes due 2016, (ii) $9.9 million of our 7.500% Guaranteed Notes due 2015, and (iii) $20.8 million of our 5.400% Guaranteed Notes due 2014, which resulted in a net loss on early extinguishment of debt of $2.1 million.
During 2012, we repurchased (i) $150.0 million of term loan indebtedness, (ii) $99.6 million of our 6.000% Guaranteed Notes due 2016, (iii) $60.8 million of our 7.500% Guaranteed Notes due 2015, (iv) $4.3 million of our 5.400% Guaranteed Notes due 2014, and (v) $0.3 million of our 5.750% Guaranteed Notes due 2012, which resulted in a net loss on early extinguishment of debt of $21.9 million. In addition, we prepaid the remaining balances on two of our existing mortgages, totaling $58.4 million, for which we incurred associated prepayment penalties of $0.1 million.
Discontinued Operations
During 2013, we sold a portfolio of eight office properties located in Lawrenceville, New Jersey, one property located in San Diego, California, one property located in Carlsbad, California, one property located in Malvern, Pennsylvania one property located in Exton, Pennsylvania, one property located in King of Prussia, Pennsylvania, and one property in West Chester, Pennsylvania. These properties had total revenues of $5.2 million, property operating expenses of $2.5 million and $1.9 million of depreciation and amortization expense. We recognized a net gain on sale related to these transactions of $3.4 million.
During 2012, we sold one property located in Moorestown, New Jersey, one property located in Herndon, Virginia, one property located in Carlsbad, California, and 11 flex/office properties located in Exton, Pennsylvania. 2012 discontinued operations were also reclassified for the properties sold during 2013. These properties had total revenues of $31.4 million, property operating expenses of $12.2 million, and $10.2 million of depreciation and amortization expense. In addition, we recognized a deferred gain related to two properties located in Trenton, New Jersey that were sold during the fourth quarter of 2009. The gain was deferred as a result of a note receivable that we held from the buyer in the amount of $22.5 million. The note receivable and accrued interest was paid in full during the second quarter of 2012, prior to its maturity date of October 2016. We recognized a net gain on sale related to these transactions of $34.8 million during 2012.
Net Income
Net income
increased
by
$36.7 million
from 2012 to 2013 as a result of the factors described above. Net income is significantly impacted by depreciation of operating properties and amortization of acquired intangibles. These non-cash charges do not directly affect our ability to pay dividends. Amortization of acquired intangibles will continue over the related lease terms or estimated duration of the tenant relationships.
Earnings per Common Share
Net income per share was
$0.23
during 2013 as compared to net loss per share of
$0.06
during 2012 as a result of the factors described above.
55
RESULTS OF OPERATIONS
Comparison of the Year Ended December 31, 2012 to the Year Ended December 31, 2011
The table below shows selected operating information for the “Same Store Property Portfolio” and the “Total Portfolio.” After giving consideration to property sales through December 31, 2013 the Same Store Property Portfolio consists of
191
properties containing an aggregate of approximately
21.4 million
net rentable square feet that we owned for the entire twelve-month periods ended December 31,
2012
and
2011
. The Same Store Property Portfolio includes properties acquired or placed in service on or prior to January 1,
2011
and owned through December 31,
2012
. The Total Portfolio includes the effects of other properties that were either placed into service, acquired or redeveloped after January 1,
2011
or disposed of prior to December 31,
2012
. A property is excluded from our Same Store Property Portfolio and moved into the redevelopment column in the period that we determine that a redevelopment would be the best use of the asset, and when said asset is taken out of service or is undergoing re-entitlement for a future development strategy. This table also includes a reconciliation from the Same Store Property Portfolio to the Total Portfolio net income (i.e., all properties owned by us during the twelve-month periods ended December 31,
2012
and
2011
) by providing information for the properties which were acquired, under development (including lease-up assets) or placed into service and administrative/elimination information for the twelve-month periods ended December 31,
2012
and
2011
(in thousands).
The Total Portfolio net income presented in the table is equal to the net income of the Parent Company and the Operating Partnership.
56
Comparison of Year Ended December 31, 2012 to the Year Ended December 31, 2011
|
|
Same Store Property Portfolio
|
Recently Completed
Properties
|
Development Properties
|
Other
(Eliminations) (a)
|
Total Portfolio
|
||||||||||||||||||||||||||||||||||||||||||
|
|
|
|
|
|
|
|
|
||||||||||||||||||||||||||||||||||||||||
|
(dollars in thousands)
|
2012
|
2011
|
Increase/
(Decrease) |
2012
|
2011
|
2012
|
2011
|
2012
|
2011
|
2012
|
2011
|
Increase/
(Decrease)
|
|||||||||||||||||||||||||||||||||||
|
Revenue:
|
|
|
|
|
|
|
|
|
|
|
|||||||||||||||||||||||||||||||||||||
|
Cash rents
|
$
|
387,207
|
|
$
|
387,600
|
|
$
|
(393
|
)
|
$
|
5,326
|
|
$
|
2,945
|
|
$
|
1,309
|
|
$
|
1,002
|
|
$
|
15,311
|
|
$
|
26,818
|
|
$
|
409,153
|
|
$
|
418,365
|
|
$
|
(9,212
|
)
|
|||||||||||
|
Straight-line rents
|
19,384
|
|
15,369
|
|
4,015
|
|
825
|
|
370
|
|
765
|
|
46
|
|
1,275
|
|
1,804
|
|
22,249
|
|
17,589
|
|
4,660
|
|
|||||||||||||||||||||||
|
Above/below market rent amortization
|
5,379
|
|
5,174
|
|
205
|
|
486
|
|
156
|
|
82
|
|
—
|
|
211
|
|
45
|
|
6,158
|
|
5,375
|
|
783
|
|
|||||||||||||||||||||||
|
Total rents
|
411,970
|
|
408,143
|
|
3,827
|
|
6,637
|
|
3,471
|
|
2,156
|
|
1,048
|
|
16,797
|
|
28,667
|
|
437,560
|
|
441,329
|
|
(3,769
|
)
|
|||||||||||||||||||||||
|
Tenant reimbursements
|
62,918
|
|
64,336
|
|
(1,418
|
)
|
702
|
|
309
|
|
998
|
|
1,007
|
|
12,442
|
|
11,752
|
|
77,060
|
|
77,404
|
|
(344
|
)
|
|||||||||||||||||||||||
|
Termination fees
|
3,182
|
|
2,951
|
|
231
|
|
—
|
|
—
|
|
—
|
|
—
|
|
51
|
|
—
|
|
3,233
|
|
2,951
|
|
282
|
|
|||||||||||||||||||||||
|
Third party management fees, labor reimbursement and leasing
|
—
|
|
—
|
|
—
|
|
—
|
|
—
|
|
—
|
|
—
|
|
12,116
|
|
11,536
|
|
12,116
|
|
11,536
|
|
580
|
|
|||||||||||||||||||||||
|
Other
|
5,289
|
|
3,249
|
|
2,040
|
|
28
|
|
14
|
|
12
|
|
60
|
|
381
|
|
2,025
|
|
5,710
|
|
5,348
|
|
362
|
|
|||||||||||||||||||||||
|
Total revenue
|
483,359
|
|
478,679
|
|
4,680
|
|
7,367
|
|
3,794
|
|
3,166
|
|
2,115
|
|
41,787
|
|
53,980
|
|
535,679
|
|
538,568
|
|
(2,889
|
)
|
|||||||||||||||||||||||
|
Property operating expenses
|
147,991
|
|
154,093
|
|
(6,102
|
)
|
3,018
|
|
1,565
|
|
1,765
|
|
1,898
|
|
(455
|
)
|
2,212
|
|
152,319
|
|
159,768
|
|
(7,449
|
)
|
|||||||||||||||||||||||
|
Real estate taxes
|
46,558
|
|
44,756
|
|
1,802
|
|
257
|
|
206
|
|
799
|
|
591
|
|
5,788
|
|
5,880
|
|
53,402
|
|
51,433
|
|
1,969
|
|
|||||||||||||||||||||||
|
Third party management expenses
|
—
|
|
—
|
|
—
|
|
—
|
|
—
|
|
—
|
|
—
|
|
5,127
|
|
5,590
|
|
5,127
|
|
5,590
|
|
(463
|
)
|
|||||||||||||||||||||||
|
Net Operating Income
|
288,810
|
|
279,830
|
|
8,980
|
|
4,092
|
|
2,023
|
|
602
|
|
(374
|
)
|
31,327
|
|
40,298
|
|
324,831
|
|
321,777
|
|
3,054
|
|
|||||||||||||||||||||||
|
General & administrative expenses
|
(12
|
)
|
74
|
|
(86
|
)
|
150
|
|
538
|
|
96
|
|
—
|
|
25,179
|
|
23,990
|
|
25,413
|
|
24,602
|
|
811
|
|
|||||||||||||||||||||||
|
Depreciation and amortization
|
172,392
|
|
178,950
|
|
(6,558
|
)
|
3,741
|
|
1,850
|
|
1,284
|
|
856
|
|
10,965
|
|
21,277
|
|
188,382
|
|
202,933
|
|
(14,551
|
)
|
|||||||||||||||||||||||
|
Operating Income (loss)
|
$
|
116,430
|
|
$
|
100,806
|
|
$
|
15,624
|
|
$
|
201
|
|
$
|
(365
|
)
|
$
|
(778
|
)
|
$
|
(1,230
|
)
|
$
|
(4,817
|
)
|
$
|
(4,969
|
)
|
$
|
111,036
|
|
$
|
94,242
|
|
$
|
16,794
|
|
|||||||||||
|
Number of properties
|
191
|
|
191
|
|
|
5
|
|
4
|
|
200
|
|
200
|
|
|
|||||||||||||||||||||||||||||||||
|
Square feet
|
21,398
|
|
21,398
|
|
|
369
|
|
22,607
|
|
|
|
|
|||||||||||||||||||||||||||||||||||
|
Core Occupancy % (b)
|
87.9
|
%
|
86.0
|
%
|
77.9
|
%
|
86.7
|
%
|
|||||||||||||||||||||||||||||||||||||||
|
Other Income (Expense):
|
|
|
|
|
|
|
|
|
|
|
|||||||||||||||||||||||||||||||||||||
|
Interest income
|
|
|
|
|
|
|
|
|
|
3,008
|
|
1,810
|
|
1,198
|
|
||||||||||||||||||||||||||||||||
|
Historic tax credit transaction income
|
|
|
|
|
|
|
|
|
|
11,840
|
|
12,026
|
|
(186
|
)
|
||||||||||||||||||||||||||||||||
|
Interest expense
|
|
|
|
|
|
|
|
|
|
(132,939
|
)
|
(131,405
|
)
|
(1,534
|
)
|
||||||||||||||||||||||||||||||||
|
Interest expense — Deferred financing costs
|
|
|
|
|
|
|
|
|
|
(6,208
|
)
|
(4,991
|
)
|
(1,217
|
)
|
||||||||||||||||||||||||||||||||
|
Recognized hedge activity
|
(2,985
|
)
|
—
|
|
(2,985
|
)
|
|||||||||||||||||||||||||||||||||||||||||
|
Interest expense — Financing Obligation
|
(850
|
)
|
—
|
|
(850
|
)
|
|||||||||||||||||||||||||||||||||||||||||
|
Equity in income of real estate ventures
|
|
|
|
|
|
|
|
|
|
2,741
|
|
3,775
|
|
(1,034
|
)
|
||||||||||||||||||||||||||||||||
|
Net gain on sale of interests in real estate
|
|
|
|
|
|
|
|
|
|
—
|
|
2,985
|
|
(2,985
|
)
|
||||||||||||||||||||||||||||||||
|
Loss on real estate venture formation
|
(950
|
)
|
(222
|
)
|
(728
|
)
|
|||||||||||||||||||||||||||||||||||||||||
|
Loss on early extinguishment of debt
|
(22,002
|
)
|
(2,776
|
)
|
(19,226
|
)
|
|||||||||||||||||||||||||||||||||||||||||
|
Loss from continuing operations
|
|
|
|
|
|
|
|
|
|
$
|
(37,309
|
)
|
$
|
(24,556
|
)
|
$
|
(12,753
|
)
|
|||||||||||||||||||||||||||||
|
Income from discontinued operations
|
|
|
|
|
|
|
|
|
|
43,838
|
|
19,841
|
|
23,997
|
|
||||||||||||||||||||||||||||||||
|
Net income (loss)
|
|
|
|
|
|
|
|
|
|
$
|
6,529
|
|
$
|
(4,715
|
)
|
$
|
11,244
|
|
|||||||||||||||||||||||||||||
|
Loss per common share
|
|
|
|
|
|
|
|
|
|
$
|
(0.06
|
)
|
$
|
(0.10
|
)
|
$
|
0.04
|
|
|||||||||||||||||||||||||||||
57
EXPLANATORY NOTES
|
(a)
|
Results include: Five assets placed in service and one acquired property.
|
|
(b)
|
Results include: Two redevelopments and two re-entitlement properties.
|
|
(c)
|
Represents certain revenues and expenses at the corporate level as well as various intercompany costs that are eliminated in consolidation and third-party management fees. This also includes nine properties that were contributed to two unconsolidated real estate ventures in which the Company has a 50% ownership interest in each venture.
|
|
(d)
|
Pertains to properties that are part of our core portfolio (i.e. not under development, redevelopment, or re-entitlement).
|
Total Revenue
Cash rents from the Total Portfolio
decreased
by
$9.2 million
from 2011 to 2012 primarily reflecting a decrease of $11.5 million of rental income as a result of contributing two properties to one of our unconsolidated joint ventures during the fourth quarter of 2011.
This decrease was offset by:
|
•
|
an increase of $2.4 million due to an increase related to the placement into service of the Juniper Street Garage and 660 Allendale Road during the third quarter of 2011, the acquisition of 3020 Market Street during the third quarter of 2011, and the acquisition of 7000 West at Lantana during the fourth quarter of 2012, and;
|
|
•
|
an increase of $0.3 million related to the redevelopment of 660 West Germantown Pike and 1900 Market Street during 2012.
|
Straight-line rents
increased
by
$4.7 million
from 2011 to 2012, consistent with the factors described above: an increase of $4.0 million due to an increase in same store occupancy of 190 basis points from 2011 to 2012, as well as a $0.5 million increase related to the acquisitions of the operating properties described above and an increase of $0.7 million due to the placement in service of the above mentioned redevelopment properties. This increase was offset by $0.5 million as a result of contributing two properties to one of our unconsolidated joint ventures during the fourth quarter of 2011.
Tenant reimbursements
decreased
by
$0.3 million
from 2011 to 2012 as a direct result of the $5.5 million decrease in operating expenses over the same period. Please see the
Property Operating Expenses
explanations below and note that certain costs, such as snow removal costs, carry a higher tenant reimbursement percentage.
Termination fees at our Total Portfolio increased by
$0.3 million
due to timing and volume of tenant move-outs during 2012 when compared to 2011.
Other income at our Total Portfolio increased by
$0.4 million
during 2012 compared to 2011 as a result of real estate tax refunds received related to prior year's tax assessment appeals.
Property Operating Expenses
Property operating expenses at the Total Portfolio
decreased
by
$7.4 million
from 2011 to 2012, mainly attributable to the following: (i) a decrease of $3.0 million in snow removal costs as a result of the mild winter experienced in our Pennsylvania and New Jersey submarkets during 2012 as compared to 2011, (ii) a decrease of $2.8 million related to lower utility costs, (iii) a decrease of $2.4 million as a result of contributing two properties to one of our unconsolidated joint ventures during the fourth quarter of 2011, (iv) a decrease of $1.7 million in repairs and maintenance expenses, directly attributable to timing and tenant needs, and (v) a decrease of $1.0 million in contracted janitorial and landscaping expenses as a result of entering into contracts at more favorable rates during 2012 as compared to 2011. These decreases were offset by: (i) an increase of $1.5 million in salaries, bonuses and related benefits from 2011 to 2012, (ii) an increase of $1.5 million due to the acquisition or placement in service of certain properties throughout 2011 and 2012, as mentioned above, and (iii) an increase of $0.5 million in state and local taxes during 2012, consistent with an increase in tax rates during the year.
Real Estate Taxes
Real estate taxes
increased
by
$2.0 million
primarily as a result of an increase in real estate tax rates across our portfolio during 2012 compared to 2011 of 3.0 million. The increase was offset by a $1.0 million decrease in real estate tax expenses for the two properties contributed to an unconsolidated real estate venture in 2011.
58
General & Administrative Expenses
General and Administrative Expense increased by
$0.8 million
from 2011 to 2012, mainly attributable to an increase in the amortization of performance-based compensation of $1.2 million. This increase is due to the fact that we accelerated the amortization of such compensation subsequent to certain of our executive personnel meeting qualifying retirement conditions during 2012, causing their associated performance-based compensation to fully vest (please refer to Footnote 14 of the notes to the consolidated financial statements for further discussion). This increase is offset by a decrease in acquisition costs of $0.4 million from 2011 to 2012.
Depreciation and Amortization
Depreciation and amortization expense
decreased
by
$14.6 million
, mainly attributable to a decrease of $6.7 million as a result of contributing two properties to one of our unconsolidated joint ventures during the fourth quarter of 2011. During 2011, we also recorded a $4.7 million out-of-period adjustment for intangible assets representing tenant relationships and in-place leases that should have been written-off in prior years. The remaining decreases are due to decreases related to asset write-offs related to early move-outs and fully amortized assets in 2012, without comparable expenses in 2011. These decreases were offset by an increase of $3.7 million related to the additional depreciation and amortization expense from the aforementioned properties that we acquired, placed into service, or redeveloped during 2012.
Interest Income
Interest income
increased
by
$1.2 million
primarily due to the recognition of $1.0 million of accrued interest income related to the payoff of the Trenton note receivable during 2012. The installment sale method was used to account for the transaction as a result of the note receivable, and therefore interest income is recognized on a cash basis. We recognized all of the interest income accrued to date during 2012 upon receipt of payment from the borrower. See "Discontinued Operations" section below.
Interest Expense
The decrease in interest expense of
$1.5 million
is primarily due to the following:
|
•
|
an increase of $11.4 million as a result of the incurrence of $600.0 million in New Term Loans which closed on February 1, 2012;
|
|
•
|
an increase of $5.8 million in swap interest expense. We have entered into interest rate swap agreements related to all of our variable rate debt except $100.0 million of term loan indebtedness and $69.0 million outstanding under our revolving credit facility;
|
|
•
|
an increase of $4.4 million related to our $325.0 million 4.950% Guaranteed Notes due 2018 issued in April 2011, and;
|
|
•
|
an increase of $0.4 million related to our $250.0 million 3.950% Guaranteed Notes Due 2023 issued in December 2012.
|
The increase of $22.0 million in interest expense described above was offset by the following decreases in interest expense during 2012 compared to 2011:
|
•
|
decrease of $7.1 million related to our $151.5 million 5.400% Guaranteed Notes that matured and were repaid in full during April 2012;
|
|
•
|
decrease of $5.4 million in mortgage interest expense which is directly related to the $208.4 million decrease in mortgage indebtedness during 2011 and the $60.0 million decrease during 2012;
|
|
•
|
decrease of $5.3 million related to the repurchases of debt subsequent to the fourth quarter of 2011, including (i) $4.3 million of our 5.400% Guaranteed Notes due 2014, (ii) $60.8 million of our 7.500% Guaranteed Notes due 2015, and (iii) $99.6 million of our 6.000% Guaranteed Notes due 2016;
|
|
•
|
decrease of $2.1 million related to the extinguishment of our Prior Term Loans, and;
|
|
•
|
decrease in interest expense of $0.6 million related to an increase in capitalized interest.
|
59
Interest Expense - Deferred Financing Costs
Deferred financing costs increased
$1.2 million
during 2012 compared to 2011 mainly due to the write-off of costs related to repurchases of debt during 2012, which included, (i) $0.3 million of our 5.750% Guaranteed Notes due 2012, (ii) $4.3 million of our 5.400% Guaranteed Notes due 2014, (iii) $60.8 million of our 7.500% Guaranteed Notes due 2015, (iv) $99.6 million of our 6.000% Guaranteed Notes due 2016 and (v) $150.0 million of term loan indebtedness.
Recognized Hedge Activity
Recognized hedge activity increased
$3.0 million
during 2012 due to the recognition of $3.0 million of early termination fees related to the termination of interest rate swap contracts. The interest rate swap contracts were terminated in connection with the repayment of the Company's $150.0 million fixed portion of its four-year term loan due February 1, 2016 during the fourth quarter of 2012 (see Note 7 of the notes to the consolidated financial statements for further details of these transactions). There were no comparable charges incurred during 2011.
Interest Expense - Financing obligation
Financing obligation interest expense relates to a property that we contributed to a joint venture in the fourth quarter of 2011 that did not qualify for sale accounting, and therefore increased by
$1.0 million
during 2012 as compared to 2011. The interest primarily represents our partner's 50% share of the net operating income of the property.
Equity in income of real estate ventures
The decrease in equity in income of real estate ventures of
$1.0 million
is primarily due to lower net income at the real estate venture properties during 2012 compared to 2011. We also recognized $0.7 million of net losses (inclusive of depreciation and amortization) related to the BDN AI Venture which was formed in the fourth quarter of 2011, of which $0.2 million related to acquisition costs incurred to acquire three properties during 2012.
Net Gain on Sales of Interests in Real Estate
During 2011, we recognized a
$3.0 million
net gain upon the sale of the remaining 11% ownership interest in three properties that we partially sold to one of our unconsolidated real estate ventures in December 2007. We had retained an 11% equity interest in these properties subject to a put/call at fixed prices for a period of three years from the time of the sale. In January 2011, we exercised the put/call which then transferred full ownership in the three properties to the real estate venture. Accordingly, our direct continuing involvement through our 11% interest in the properties ceased as a result of the transfer of the ownership interest. There were no comparable gains for 2012.
Loss on Real Estate Venture Formation
Loss on real estate venture formation increased by
$0.7 million
primarily due to our termination of an agreement with a third party broker that was entered into upon contributing two properties into a joint venture in December 2011. During 2012, we determined that it was in our best interest to terminate the contract in order to avoid additional commissions and fees on future joint venture acquisitions, recognizing the fee as an additional cost of forming the real estate venture.
Loss on Early Extinguishment of Debt
During 2012, we repurchased (i) $150.0 million of term loan indebtedness, (ii) $99.6 million of our 6.000% Guaranteed Notes due 2016, (iii) $60.8 million of our 7.500% Guaranteed Notes due 2015, (iv) $4.3 million of our 5.400% Guaranteed Notes due 2014, and (v) $0.3 million of our 5.750% Guaranteed Notes due 2012, which resulted in a net loss on early extinguishment of debt of $21.9 million. In addition, we prepaid the remaining balances on two of our existing mortgages, totaling $58.4 million, for which we incurred associated prepayment penalties of $0.1 million.
During 2011, we repurchased (i) $23.7 million of our 5.750% Guaranteed Notes due 2012 and (ii) $22.7 million of our 7.500% Guaranteed Notes due 2015, which resulted in a net loss on early extinguishment of debt of $3.3 million. The loss was offset by the write-off of the unamortized fixed-rate debt premium of $0.5 million related to the prepayment of two of our mortgage loans during 2011.
60
Discontinued Operations
During 2012, we sold one property located in Moorestown, New Jersey, one property located in Herndon, Virginia, one property located in Carlsbad, California, and 11 flex/office properties located in Exton, Pennsylvania. 2012 discontinued operations were also revised for the properties sold during 2013. These properties had total revenues of $31.4 million, property operating expenses of $12.2 million, and $10.2 million of depreciation and amortization expense. In addition, we recognized a deferred gain related to two properties located in Trenton, New Jersey that were sold during the fourth quarter of 2009. The gain was deferred as a result of a note receivable that we held from the buyer in the amount of $22.5 million. The note receivable and accrued interest was paid in full during the second quarter of 2012, prior to its maturity date of October 2016. We recognized a net gain on sale related to these transactions of $34.8 million during 2012.
The amounts for 2011 are reclassified to include the operations of the properties sold subsequent to December 31, 2011, as well as all properties that were sold through 2011. Therefore, the discontinued operations amount for 2011 includes total revenue of $43.1 million, operating expense of $19.3 million, and depreciation and amortization of $16.2 million.
Net Income (Loss)
Net income (loss) increased by
$11.2 million
from 2011 to 2012 as a result of the factors described above. Net income is significantly impacted by depreciation of operating properties and amortization of acquired intangibles. These non-cash charges do not directly affect our ability to pay dividends. Amortization of acquired intangibles will continue over the related lease terms or estimated duration of the tenant relationships.
Loss per Common Share
Loss per share was $0.06 during 2012 as compared to a loss per share of $0.10 during 2011 as a result of the factors described above.
LIQUIDITY AND CAPITAL RESOURCES
General
Our principal liquidity needs for the next twelve months are as follows:
|
•
|
fund normal recurring expenses,
|
|
•
|
fund capital expenditures, including capital and tenant improvements and leasing costs,
|
|
•
|
fund repayment of certain debt instruments when they mature,
|
|
•
|
fund current development and redevelopment costs, and
|
|
•
|
fund distributions to shareholders to maintain REIT status.
|
As of
December 31, 2013
, the Parent Company owned a
98.8%
interest in the Operating Partnership. The remaining interest of approximately
1.2%
pertains to common limited partnership interests owned by non-affiliated investors who contributed property to the Operating Partnership in exchange for their interests. As the sole general partner of the Operating Partnership, the Parent Company has full and complete responsibility for the Operating Partnership’s day-to-day operations and management. The Parent Company’s source of funding for its dividend payments and other obligations is the distributions it receives from the Operating Partnership.
We believe that our liquidity needs will be satisfied through available cash balances and cash flows generated by operations, financing activities and selective property sales. Rental revenue, expense recoveries from tenants, and other income from operations are the Company’s principal sources of cash to pay operating expenses, debt service, recurring capital expenditures and the minimum distributions required to maintain our REIT qualification. We seek to increase cash flows from our properties by maintaining quality standards for our properties that promote high occupancy rates and permit increases in rental rates while reducing tenant turnover and controlling operating expenses. Our revenue also includes third-party fees generated by our property management, leasing, development and construction businesses. We believe that our revenue, together with proceeds from property sales and debt financings, will continue to provide funds for our short-term liquidity needs. However, material changes in our operating or financing activities may adversely affect our net cash flows. With uncertain economic conditions, vacancy rates may increase, effective rental rates on new and renewed leases may decrease and tenant installation costs, including concessions, may increase in most or all of our markets throughout 2014 and possibly beyond. As a result, our revenues and cash flows could be insufficient to cover operating expenses, including increased tenant installation costs, pay debt service or make distributions to shareholders over the short-term. If this situation were to occur, we expect that we would finance cash deficits through borrowings under our unsecured credit facility and other sources of debt and equity financings. In addition, a material adverse change in cash provided by operations could adversely affect our compliance with financial performance covenants under our unsecured credit facility,
61
including unsecured term loans and unsecured notes. As of December 31, 2013, we were in compliance with all of our debt covenants and requirement obligations.
We use multiple financing sources to fund our long-term capital needs. When needed, we use borrowings under our unsecured credit facility for general business purposes, including to meet debt maturities and to fund distributions to shareholders as well as development and acquisition costs and other expenses from time to time as necessary. In light of the continuing volatility in financial markets and economic uncertainties, it is possible, that one or more lenders under our unsecured revolving credit facility could fail to fund a borrowing request. Such an event could adversely affect our ability to access funds from our unsecured credit facility when needed to fund distributions or pay expenses.
Our ability to incur additional debt is dependent upon a number of factors, including our credit ratings, the value of our unencumbered assets, our degree of leverage and borrowing restrictions imposed by our lenders. If one or more rating agencies were to downgrade our unsecured credit rating, our access to the unsecured debt market would be more limited and the interest rate under our unsecured credit facility and unsecured term loans would increase.
The Parent Company unconditionally guarantees the Operating Partnership’s secured and unsecured obligations, which, as of December 31, 2013, amounted to
$669.8 million
and
$1,929.7 million
, respectively.
We maintain a shelf registration statement that has registered the offering and sale of common shares, preferred shares, depositary shares, warrants and unsecured debt securities. Subject to the Company’s ongoing compliance with securities laws, and if warranted by market conditions, we may offer and sell equity and debt securities from time to time under the shelf registration statement.
The Parent Company, other than acting as the sole general partner of the Operating Partnership, also issues equity from time to time, the proceeds of which it contributes to the Operating Partnership in exchange for additional interests in the Operating Partnership, and guarantees debt obligations of the Operating Partnership. The Parent Company’s ability to sell common shares and preferred shares is dependent on, among other things, general market conditions for REITs, market perceptions about the Company as a whole and the current trading price of the Parent Company's shares.
On
April 10, 2013
, the Parent Company completed a public offering of
12,650,000
common shares, inclusive of
1,650,000
common shares issued upon exercise by the underwriters of the option granted to them to purchase additional shares. The Parent Company contributed the net proceeds from the sale of shares, amounting to
$181.5 million
after deducting underwriting discounts and commissions and other offering expenses, to the Operating Partnership in exchange for partnership units of the Operating Partnership. The Operating Partnership intends to continue to use the net proceeds for working capital, capital expenditures and other general corporate purposes, which may include acquisitions, developments and the repayment, repurchase and refinancing of debt.
The Operating Partnership also considers net sales of selected properties as another source of managing its liquidity. During
2013
, we sold
21
properties, including seven properties contributed to the Austin Venture, containing 2.5 million in net rentable square feet and 8.0 acres of land for aggregate net cash proceeds of
$423.5 million
. Also during
2013
, we purchased three properties containing 2.1 million net rentable square feet and 24.9 acres of land for aggregate net cash distributions of
$161.6 million
.
In addition, we sold interests in an unconsolidated real estate venture containing 0.6 million in net rentable square feet for net cash proceeds of $17.0 million.
Cash Flows
The following discussion of our cash flows is based on the consolidated statements of cash flows and is not meant to be a comprehensive discussion of the changes in our cash flows for the years presented.
As of
December 31, 2013
and
2012
, we maintained cash and cash equivalents of
$263.2 million
and
$1.5 million
, respectively. The following are the changes in cash flow from our activities for the years ended December 31, 2013, 2012 and 2011 (in thousands):
|
Activity
|
2013
|
2012
|
2011
|
|||||||||
|
Operating
|
$
|
183,484
|
|
$
|
159,110
|
|
$
|
177,247
|
|
|||
|
Investing
|
104,708
|
|
(74,864
|
)
|
(46,163
|
)
|
||||||
|
Financing
|
(26,534
|
)
|
(83,107
|
)
|
(147,239
|
)
|
||||||
|
Net cash flows
|
$
|
261,658
|
|
$
|
1,139
|
|
$
|
(16,155
|
)
|
|||
62
Our principal source of cash flows is from the operation of our properties. We do not restate our cash flows for discontinued operations.
The net
increase
of
$24.4 million
in cash from operating activities during 2013 compared to 2012 is primarily attributable to increased net operating income on the same store portfolio in the 2013 period as compared to the 2012 period along with decreased cash paid for interest expense, as well as the timing of cash receipts and cash expenditures in the normal course of operations.
The
increase
in net cash from investing activities of
$179.6 million
during 2013 compared to 2012 is primarily attributable to the following:
|
•
|
an
increase
of
$252.6 million
of net proceeds from 21 property sales during 2013, compared to 14 property sales during 2012 (see Note 3 to the consolidated financial statements for details);
|
|
•
|
an increase of $17.0 million from the sale of our interest in an unconsolidated real estate venture, compared to no such sales during 2012 (see Note 4 to the consolidated financial statements for details);
|
|
•
|
an increase from the reimbursement of $2.0 million in pre-formation development costs of an unconsolidated real estate venture;
|
|
•
|
a decrease in net investment in real estate ventures of $32.3 million, primarily reflecting 2012 activity including: $26.1 million that we contributed to fund our share of an acquisition of three office properties by the real estate venture known as "Brandywine-AI Venture LLC;" $24.2 million that we contributed to the real estate venture to fund our pro rata share of the repayment of mortgage indebtedness; and $9.7 million that we contributed to our then existing real estate ventures that owned One and Two Commerce Square; offset in 2013 by: contributions to 4040 Wilson totaling $13.5 million, contributions to the evo at Cira Centre South venture of $13.4 million and contributions to fund our share of One and Two Commerce Square ventures' operations totaling $6.6 million,
|
|
•
|
an
increase
in cash distributions from unconsolidated Real Estate Ventures of
$2.4 million
during 2013 compared to 2012, and;
|
|
•
|
a decrease in interest expense of $11.0 million due to debt repurchases.
|
The increase in net cash from investing activities was partially offset by the following transactions:
|
•
|
an
increase
of
$84.0 million
in funds used to acquire operating properties, attributable to the acquisitions of One and Two Commerce Square for $70.0 million, Four Points Centre for $46.1 million and the ground leases at Cira Centre and Three Logan Square totaling $45.3 million. During 2012 the acquisitions totaling $77.6 million were mainly attributable to the acquisitions of the 660 West Germantown Pike development, 1900 Market Street, and 7000 West at Lantana;
|
|
•
|
a
decrease
of
$23.2 million
related to proceeds received in connection with the repayment of two mortgage notes receivable during 2012. There were no comparable mortgage notes receivable repayments during 2013;
|
|
•
|
an
increase
in capital expenditures for tenant and building improvements and leasing commissions by
$22.2 million
during the 2013 compared to the 2012;
|
|
•
|
a
decrease
of
$0.6 million
in loan proceeds received from an unconsolidated real estate venture partner during 2012, with no such payments received during 2013; and,
|
|
•
|
a
decrease
in advances for purchase of tenant assets, net of repayments of
$0.4 million
during 2013 when compared to 2012.
|
The net
increase
of
$56.6 million
in cash from financing activities during 2013 compared to 2012 is mainly due to the following:
|
•
|
an increase in proceeds from credit facility borrowings of
$95.5 million
during 2013 compared to 2012;
|
|
•
|
a
decrease
in repayments of the Prior Credit Facility and mortgage notes payable of
$99.2 million
during 2013 compared to 2012;
|
|
•
|
proceeds from the issuance of common shares of
$181.5 million
during 2013 with no comparable proceeds in 2012;
|
|
•
|
the redemption of preferred shares and partnership units of
$118.2 million
during 2012 with no redemption in 2013;
|
|
•
|
a
decrease
in the repayment of unsecured notes of
$306.7 million
during 2013 compared to 2012;
|
63
|
•
|
the repayment of an unsecured term loan of
$190.5 million
during 2012 with no such repayment during 2013;
|
|
•
|
a
decrease
in debt financing costs of
$9.8 million
during 2013 compared to 2012, and;
|
|
•
|
an
increase
in stock option exercise proceeds of
$1.4 million
for 2013 compared to 2012;
|
The net increase in cash from financing activities described above was offset by the following:
|
•
|
proceeds from the issuance of unsecured notes, which totaled $248.2 million in 2012, with no comparable proceeds during 2013;
|
|
•
|
term loan borrowings of
$600.0 million
during the 2012 with no comparable borrowings during 2013;
|
|
•
|
proceeds received from the issuance of preferred shares of
$96.2 million
during 2012 with no comparable issuance in 2013, and;
|
|
•
|
distributions paid by the Parent Company to its shareholders and on non-controlling interests of
$98.5 million
during 2013 compared to
$97.5 million
during 2012.
|
Capitalization
Indebtedness
The table below summarizes our indebtedness under our mortgage notes payable, our unsecured notes and our unsecured credit facility at
December 31, 2013
and
December 31, 2012
:
|
December 31, 2013
|
December 31, 2012
|
||||||
|
|
(dollars in thousands)
|
||||||
|
Balance:
|
|
|
|||||
|
Fixed rate
|
$
|
2,499,465
|
|
$
|
2,302,895
|
|
|
|
Variable rate — unhedged
|
100,000
|
|
169,000
|
|
|||
|
Total
|
$
|
2,599,465
|
|
$
|
2,471,895
|
|
|
|
Percent of Total Debt:
|
|
|
|||||
|
Fixed rate
|
96.2
|
%
|
93.2
|
%
|
|||
|
Variable rate — unhedged
|
3.8
|
%
|
6.8
|
%
|
|||
|
Total
|
100
|
%
|
100
|
%
|
|||
|
Weighted-average interest rate at period end:
|
|
|
|||||
|
Fixed rate
|
5.2
|
%
|
5.3
|
%
|
|||
|
Variable rate — unhedged
|
1.9
|
%
|
1.9
|
%
|
|||
|
Total
|
5.0
|
%
|
5.1
|
%
|
|||
|
Weighted-average maturity in years:
|
|||||||
|
Fixed rate
|
5.6
|
|
6.6
|
|
|||
|
Variable rate — unhedged
|
2.1
|
|
3.1
|
|
|||
|
Total
|
5.5
|
|
6.4
|
|
|||
The variable rate debt shown above generally bear interest based on various spreads over a LIBOR term selected by us.
64
Scheduled principal payments and related weighted average annual effective interest rates for our debt as of December 31, 2013 are as follows (in thousands):
|
Period
|
Scheduled amortization
|
Principal maturities
|
Total
|
Weighted average interest rate of maturing debt
|
|||||||||||
|
2014
|
$
|
13,826
|
|
$
|
218,549
|
|
$
|
232,375
|
|
5.58
|
%
|
||||
|
2015
|
13,668
|
|
395,986
|
|
409,654
|
|
5.31
|
%
|
|||||||
|
2016
|
9,926
|
|
457,779
|
|
467,705
|
|
4.82
|
%
|
|||||||
|
2017
|
9,906
|
|
320,417
|
|
330,323
|
|
5.63
|
%
|
|||||||
|
2018
|
11,954
|
|
325,000
|
|
336,954
|
|
5.19
|
%
|
|||||||
|
2019
|
13,156
|
|
200,000
|
|
213,156
|
|
3.81
|
%
|
|||||||
|
2020
|
13,915
|
|
—
|
|
13,915
|
|
6.64
|
%
|
|||||||
|
2021
|
14,719
|
|
—
|
|
14,719
|
|
6.64
|
%
|
|||||||
|
2022
|
15,571
|
|
—
|
|
15,571
|
|
6.64
|
%
|
|||||||
|
2023
|
14,666
|
|
351,236
|
|
365,902
|
|
6.64
|
%
|
|||||||
|
Thereafter
|
120,581
|
|
78,610
|
|
199,191
|
|
4.27
|
%
|
|||||||
|
Totals
|
$
|
251,888
|
|
$
|
2,347,577
|
|
$
|
2,599,465
|
|
5.03
|
%
|
||||
Unsecured Credit Facility
We maintain a $600.0 million four-year unsecured revolving credit facility (the "Credit Facility") and three unsecured term loans in the aggregate amount of $450.0 million (collectively, the “Term Loans”), consisting of a $150.0 million three-year loan, a $100.0 million four-year loan and a $200.0 million seven-year loan.
We have the option to increase the amounts available to be advanced under the Credit Facility, the $150.0 million three-year term loan, and the $100.0 million four-year term loan by an aggregate of $200.0 million, subject to customary conditions and limitations, by obtaining additional commitments from the current lenders and other financial institutions. We also have the option to extend the maturity dates of each of the Credit Facility, the $150.0 million three-year term loan and the $100.0 million four-year term loan by one year, subject to payment of an extension fee and other customary conditions and limitations. We can prepay the $150.0 million three-year term and the $100.0 million four-year term loans at any time without penalty. The $200.0 million seven-year term loan is subject to a prepayment penalty of 1% through February 1, 2015 with no penalty thereafter.
The spread to LIBOR for LIBOR-based loans under the Credit Facility and Term Loans will depend on our unsecured senior debt credit rating. Based on our current credit rating, the spread for such loans will be 150, 175, 175 and 190 basis points under the Credit Facility, the $150.0 million three-year term loan, the $100.0 million four-year term loan and the $200.0 million seven-year term loan, respectively. At our option, advances under the New Credit Facility and New Term Loans may also bear interest at a per annum floating rate equal to the higher of the prime rate or the federal funds rate plus 0.50% per annum. The Credit Facility contains a competitive bid option that allows banks that are part of the lender consortium to bid to make loans to us at a reduced rate. We executed hedging transactions that fix the rate on the $200.0 million seven-year term loan at a 3.623% average for its full term, and the rate on the $150.0 million three-year term loan at a 2.596% average rate for periods of three to four years. All hedges commenced on February 1, 2012 and the rates are inclusive of the LIBOR spread based on our current investment grade rating.
The Credit Facility and Term Loans contain financial and operating covenants and restrictions, including covenants that relate to our incurrence of additional debt; granting liens; consummation of mergers and consolidations; the disposition of assets and interests in subsidiaries; the making of loans and investments; and the payment of dividends. The restriction on dividends permits us to pay dividends to the greater of (i) an amount required for us to retain our qualification as a REIT and (ii) 95% of our funds from operations. The Credit Facility and Term Loans include financial covenants that require us to maintain an interest coverage ratio, a fixed charge coverage ratio, an unsecured debt ratio and an unencumbered cash flow ratio above specified levels; to maintain a minimum net worth above an amount determined on a specified formula; and to maintain a leverage ratio and a secured debt ratio below certain maximum levels. Another financial covenant limits the ratio of our unsecured debt to the value of our unencumbered properties.
We were in compliance with all financial and non-financial covenants under the Credit Facility and our credit agreements as of December 31, 2013. We continuously monitor our compliance with all covenants. Certain covenants restrict our ability to obtain alternative sources of capital. While we believe that we will remain in compliance with our covenants, a slow-down in the economy and a decrease in availability of debt financing could result in non-compliance with covenants.
65
Unsecured Notes and Mortgage Notes
The Operating Partnership is the issuer of our unsecured notes which are fully and unconditionally guaranteed by the Parent Company. During the
year-ended December 31, 2013
, we repurchased
$29.3 million
of our outstanding unsecured notes in a series of transactions which are summarized in the table below (in thousands):
|
Notes
|
Principal
|
Repurchase
Amount
|
Loss on Early Extinguishment of Debt
|
Acceleration of Deferred Financing
Amortization
|
||||||||||||
|
2014 5.400% Notes
|
$
|
19,830
|
|
$
|
20,822
|
|
$
|
(1,020
|
)
|
$
|
16
|
|
||||
|
2015 7.500% Notes
|
8,910
|
|
9,902
|
|
(1,036
|
)
|
23
|
|
||||||||
|
2016 6.000% Notes
|
510
|
|
572
|
|
(63
|
)
|
1
|
|
||||||||
|
|
$
|
29,250
|
|
$
|
31,296
|
|
$
|
(2,119
|
)
|
$
|
40
|
|
||||
The indenture under which the Operating Partnership issued its unsecured notes contains financial covenants, including (i) a leverage ratio not to exceed 60%, (ii) a secured debt leverage ratio not to exceed 40%, (iii) a debt service coverage ratio of greater than 1.5 to 1.0 and (iv) an unencumbered asset value of not less than 150% of unsecured debt. The Operating Partnership is in compliance with all covenants as of
December 31, 2013
.
The Operating Partnership has mortgage loans that are collateralized by certain of its Properties. Payments on mortgage loans are generally due in monthly installments of principal and interest, or interest only. The Operating Partnership intends to refinance or repay its mortgage loans as they mature through the use of proceeds from selective Property sales and secured or unsecured borrowings. However, in the current and expected future economic environment one or more of these sources may not be available on attractive terms or at all.
The charter documents of the Parent Company and Operating Partnership do not limit the amount or form of indebtedness that the Operating Partnership may incur, and its policies on debt incurrence are solely within the discretion of the Parent Company’s Board of Trustees, subject to the financial covenants in the Credit Facility, indenture and other credit agreements.
Equity
In order to maintain is qualification as a REIT, the Parent Company is required to, among other things, pay dividends to its shareholders of at least 90% of its REIT taxable income. On
December 10, 2013
, the Parent Company declared a distribution of
$0.15
per common share, totaling
$23.9 million
, which it paid on
January 21, 2014
to its shareholders of record as of
January 6, 2014
. In addition, the Parent Company declared a distribution on its Series E Preferred Shares to holders of record as of December 30, 2013. These shares are entitled to a preferential return of 6.90% per annum on the $25.00 per share liquidation preference. Distributions paid on January 15, 2014 to holders of Series E Preferred Shares totaled $1.7 million. To fund this distribution, on
December 10, 2013
, the Operating Partnership declared distributions on its Series E-Linked Preferred Mirror Units to holders of record as of
December 30, 2013
. These units are entitled to a preferential return of
6.90%
per annum on the
$25.00
per unit liquidation preference. Distributions paid on
January 15, 2014
to holders of Series E-Linked Preferred Mirror Units totaled
$1.7 million
.
On
April 10, 2013
, the Parent Company completed a public offering of
12,650,000
common shares, inclusive of
1,650,000
common shares issued upon exercise by the underwriters of the option granted to them to purchase additional shares. The Parent Company contributed the net proceeds from the sale of shares, amounting to
$181.5 million
after deducting underwriting discounts and commissions and other offering expenses, to the Operating Partnership in exchange for partnership units of the Operating Partnership. The Operating Partnership continues to use the net proceeds for working capital, capital expenditures and other general corporate purposes, which may include acquisitions, developments and the repayment, repurchase and refinancing of debt.
The Parent Company maintains a share repurchase program under which its Board of Trustees has authorized the Parent Company to repurchase common shares from time to time in accordance with the limits set by the Board of Trustees. As of December 31, 2013, there were
539,200
shares available for repurchase under this program. The Parent Company’s Board of Trustees has not limited the duration of the program and the program may be terminated at any time.
The Parent Company did not repurchase any shares the fiscal year ended December 31, 2013 and accordingly, the Operating Partnership did not repurchase any units in connection with the Parent Company's share repurchase program.
66
The Parent Company also maintains a continuous offering program (the "Offering Program"), under which we may sell up to an aggregate amount of
16,000,000
common shares until November 5, 2016 in at the market offerings. This program was put in place on November 5, 2013 in replacement of a prior continuous equity offering program that expired on March 10, 2013 (the "Prior Offering Program"). During the year ended December 31, 2013 we did not sell any shares under either the Offering Program or the Prior Offering Program.
Inflation
A majority of our leases provide for tenant reimbursement of real estate taxes and operating expenses either on a triple net basis or over a base amount. In addition, many of our office leases provide for fixed base rent increases. We believe that inflationary increases in expenses will be partially offset by expense reimbursement and contractual rent increases.
Commitments and Contingencies
The following table outlines the timing of payment requirements related to our contractual commitments as of
December 31, 2013
:
|
|
Payments by Period (in thousands)
|
||||||||||||||||||
|
Total
|
Less than
1 Year
|
1-3 Years
|
3-5 Years
|
More than
5 Years
|
|||||||||||||||
|
Mortgage notes payable (a)
|
$
|
669,762
|
|
$
|
13,828
|
|
$
|
319,815
|
|
$
|
42,277
|
|
$
|
293,842
|
|
||||
|
Unsecured term loan
|
450,000
|
|
—
|
|
250,000
|
|
—
|
|
200,000
|
|
|||||||||
|
Unsecured debt (a)
|
1,479,703
|
|
218,549
|
|
307,544
|
|
625,000
|
|
328,610
|
|
|||||||||
|
Ground leases (b)
|
64,055
|
|
1,303
|
|
2,606
|
|
2,606
|
|
57,540
|
|
|||||||||
|
Development contracts (c)
|
13,590
|
|
13,590
|
|
—
|
|
—
|
|
—
|
|
|||||||||
|
Interest expense (d)
|
496,900
|
|
114,609
|
|
160,959
|
|
86,318
|
|
135,014
|
|
|||||||||
|
Other liabilities (e)
|
22,045
|
|
4,407
|
|
—
|
|
—
|
|
17,638
|
|
|||||||||
|
|
$
|
3,196,055
|
|
$
|
366,286
|
|
$
|
1,040,924
|
|
$
|
756,201
|
|
$
|
1,032,644
|
|
||||
|
(a)
|
Amounts do not include unamortized discounts and/or premiums.
|
|
(b)
|
Future minimum rental payments under the terms of all non-cancelable ground leases under which we are the lessee are expensed on a straight-line basis regardless of when payments are due. The table also does not include the future minimum rental payments related to two ground leases in Philadelphia, Pennsylvania. These ground leases are discussed below.
|
|
(c)
|
Represents contractual obligations for two development projects and does not contemplate all costs expected to be incurred for such developments. For information regarding real estate venture developments, see Item 1.
|
|
(d)
|
Variable rate debt future interest expense commitments are calculated using
December 31, 2013
interest rates.
|
|
(e)
|
Other liabilities consist of (i) our obligation to fund the remaining balance, as of December 31, 2013, of $4.4 million on our commitment to fund post-closing capital expenditures of
$5.2 million
on behalf of our Austin Venture (See Item 2 - “Properties”) and (ii) $17.6 million of deferred compensation liabilities and the interest accretion on the existing transfer tax liability on Two Logan Square in Philadelphia, Pennsylvania (see related discussion below), as of
December 31, 2013
.
|
The ground leases entered into in Philadelphia, Pennsylvania, which provide for contingent rent participation by the lessor in certain capital transactions and net operating cash flows of the properties after certain returns are achieved by the Company. Such amounts, if any, will be reflected as contingent rent when incurred. The leases also provide for payment by the Company of certain operating costs relating to the land, primarily real estate taxes. The above schedule of future minimum rental payments does not include any contingent rent amounts or any reimbursed expenses.
As part of the Operating Partnership’s September 2004 acquisition of a portfolio of properties from the Rubenstein Company (which we refer to as the “TRC acquisition”), the Operating Partnership acquired its interest in Two Logan Square, a
708,844
square foot office building in Philadelphia, primarily through its ownership of a second and third mortgage secured by this property. This property is consolidated as the borrower is a variable interest entity and the Operating Partnership, through its ownership of the second and third mortgages, is the primary beneficiary. The Operating Partnership currently does not expect to take title to Two Logan Square until, at the earliest, September 2019. If the Operating Partnership takes fee title to Two Logan Square upon a foreclosure of its mortgage, the Operating Partnership has agreed to pay an unaffiliated third party that holds a residual interest in the fee owner of this property an amount equal to
$2.9 million
. On the TRC acquisition date, the Operating Partnership recorded a liability of
$0.7 million
and this amount will accrete up to $2.9 million through September 2019. As of
December 31, 2013
, the Operating Partnership has a balance of
$1.6 million
for this liability on its consolidated balance sheet.
67
The Operating Partnership was audited by the IRS for its 2004 tax year. The audit concerned the tax treatment of the TRC acquisition in September 2004 in which the Operating Partnership acquired a portfolio of properties through the acquisition of a limited partnership. On December 17, 2010, the Operating Partnership received notice that the IRS proposed an adjustment to the allocation of recourse liabilities allocated to the contributor of the properties. The Operating Partnership appealed the proposed adjustment and during the second quarter of 2013 entered into a settlement agreement with the IRS which will not result in a material liability for the Operating Partnership for federal income taxes. The contributor of partnership interests in the 2004 transaction has agreed not to assert a claim against the Operating Partnership under the tax protection agreement entered into as part of the transaction.
As part our 2006 merger with Prentiss Properties Trust, our 2004 TRC acquisition and several of our other transactions, it agreed not to sell certain of the properties we acquired in transactions that would trigger taxable income to the former owners. In the case of the TRC acquisition, we agreed not to sell acquired properties for periods up to 15 years from the date of the TRC acquisition as follows at
December 31, 2013
: One Rodney Square and 130/150/170 Radnor Financial Center (January, 2015); and One Logan Square, Two Logan Square and Radnor Corporate Center (January, 2020). In the Prentiss acquisition, we assumed the obligation of Prentiss not to sell Concord Airport Plaza before March, 2018. Our agreements generally provide that we may dispose of the subject properties only in transactions that qualify as tax-free exchanges under Section 1031 of the Internal Revenue Code or in other tax deferred transactions. If we were to sell a restricted property before expiration of the restricted period in a non-exempt transaction, we would be required to make significant payments to the parties who sold the applicable property to us for tax liabilities attributed to them. Similarly, as part of our 2013 acquisition of substantially all of the equity interests in the partnerships that own One and Two Commerce Square, we agreed, for the benefit of affiliates of the holder of the 1% residual ownership interest in these properties, to not sell these two properties in certain taxable transactions prior to October 20, 2013 without the holder’s consent.
In connection with the development of the IRS Philadelphia Campus and the Cira South Garage, during 2008, the Operating Partnership entered into a historic tax credit and new markets tax credit arrangement, respectively. The Operating Partnership is required to be in compliance with various laws, regulations and contractual provisions that apply to its historic and new market tax credit arrangements. Non-compliance with applicable requirements could result in projected tax benefits not being realized and therefore, require a refund to US Bancorp or a reduction of investor capital contributions, which are reported as deferred income in the Operating Partnership’s consolidated balance sheet, until such time as its obligation to deliver tax benefits is relieved. The remaining compliance periods for its tax credit arrangements runs through 2015. The Operating Partnership does not anticipate that any material refunds or reductions of investor capital contributions will be required in connection with these arrangements.
We invest in properties and regularly incur capital expenditures in the ordinary course of business to maintain the properties. We believe that such expenditures enhance our competitiveness. We also enter into construction, utility and service contracts in the ordinary course of its business which may extend beyond one year. These contracts typically provide for cancellation with insignificant or no cancellation penalties.
Guarantees
As of
December 31, 2013
, we had provided guarantees on behalf of certain of the real estate ventures, consisting of (i) a
$24.7 million
payment guaranty on the construction loan for the project being undertaken by evo at Cira; (ii) a
$3.2 million
payment guarantee on the construction loan for a project being undertaken by TB-BDN Plymouth Apartments; and (iii) a
$0.5 million
payment guarantee on a loan provided to PJP VII. In addition, during construction undertaken by real estate ventures we have provided, and expect to continue to provide, cost overrun and completion guarantees, with rights of contribution among partners in ventures, as well as customary environmental indemnities and guarantees of customary exceptions to nonrecourse provisions in loan agreements.
As part of our acquisition of properties from time to time in tax-deferred transactions, we have agreed to provide certain of the prior owners of the acquired properties with the right to guarantee our indebtedness. If we were to seek to repay the indebtedness guaranteed by the prior owner before the expiration of the applicable agreement, we would be required to provide the prior owner an opportunity to guarantee qualifying replacement debt. These debt maintenance agreements may limit our ability to refinance indebtedness on terms that will be favorable to us. As part of our 2013 acquisition of substantially all of the equity interests in the partnerships that own One and Two Commerce Square, we agreed, for the benefit of affiliates of the holder of the 1% residual ownership interest in these properties, to maintain qualifying mortgage debt through October 20, 2021, in the amounts of not less than
$130.2 million
on One Commerce Square and
$107.9 million
on Two Commerce Square. Similarly, we have agreements in place with other contributors of assets to us that obligate us to maintain debt available for them to guaranty.
68
Interest Rate Risk and Sensitivity Analysis
The analysis below presents the sensitivity of the market value of the Operating Partnership’s financial instruments to selected changes in market rates. The range of changes chosen reflects its view of changes which are reasonably possible over a one-year period. Market values are the present value of projected future cash flows based on the market rates chosen.
Our financial instruments consist of both fixed and variable rate debt. As of
December 31, 2013
, our consolidated debt consisted of
$669.8 million
of mortgage loans and
$1,401.1 million
of unsecured notes, all of which are fixed rate borrowings. We also have variable rate debt consisting of
$78.6 million
in trust preferred securities and
$450.0 million
of unsecured term loans all of which are swapped to fixed rates, except for $100.0 million of unsecured term loans which bear interest at a variable rate. All financial instruments were entered into for other than trading purposes and the net market value of these financial instruments is referred to as the net financial position. Changes in interest rates have different impacts on the fixed and variable rate portions of our debt portfolio. A change in interest rates on the fixed portion of the debt portfolio impacts the net financial instrument position, but has no impact on interest incurred or cash flows. A change in interest rates on the variable portion of the debt portfolio impacts the interest incurred and cash flows, but does not impact the net financial instrument position.
If market rates of interest increase by 100 basis points, the fair value of our outstanding fixed-rate mortgage debt would decrease by approximately
$33.1 million
. If market rates of interest decrease by 100 basis points, the fair value of our outstanding fixed-rate mortgage debt would increase by approximately
$36.1 million
.
As of
December 31, 2013
, based on prevailing interest rates and credit spreads, the fair value of our
$1,401.1 million
of unsecured notes was
$1,471.0 million
. For sensitivity purposes, a 100 basis point change in the discount rate equates to a change in the total fair value of our debt of approximately
$14.0 million
at
December 31, 2013
.
From time to time or as the need arises, we use derivative instruments to manage interest rate risk exposures and not for speculative purposes. The total carrying value of our variable rate debt (including variable swapped to fixed) was approximately
$528.6 million
and
$597.6 million
at
December 31, 2013
and
December 31, 2012
, respectively. The total fair value of our debt was approximately
$526.7 million
and
$595.7 million
at
December 31, 2013
and
December 31, 2012
, respectively. For sensitivity purposes, if market rates of interest increase by 100 basis points the fair value of our variable rate debt would decrease by approximately
$7.1 million
at
December 31, 2013
. If market rates of interest decrease by 100 basis points the fair value of our outstanding variable rate debt would increase by approximately $3.4 million. A 100 basis point change in the market rate of interest equates to a change in the fair value of its debt of approximately
$1.7 million
at
December 31, 2012
.
At
December 31, 2013
, our outstanding variable rate debt based on LIBOR totaled approximately
$528.6 million
, of which $100.0 million remained variable, with the remaining $428.6 million being swapped to fixed. At
December 31, 2013
, the interest rate on our variable rate debt was approximately
1.9%
. If market interest rates on our variable rate debt were to change by 100 basis points, total interest expense would have changed by approximately
$0.3 million
for
year-ended December 31, 2013
.
These amounts were determined solely by considering the impact of hypothetical interest rates on our financial instruments. Due to the uncertainty of specific actions it may undertake to minimize possible effects of market interest rate increases, this analysis assumes no changes in our financial structure.
Funds from Operations (FFO)
Pursuant to the revised definition of FFO adopted by the Board of Governors of the National Association of Real Estate Investment Trusts (“NAREIT”), we calculate FFO by adjusting net income/(loss) attributable to common unit holders (computed in accordance with GAAP) for gains (or losses) from sales of properties, impairment losses on depreciable consolidated real estate, impairment losses on investments in unconsolidated joint ventures driven by a measurable decrease in the fair value of depreciable real estate held by the unconsolidated Real Estate Ventures, real estate related depreciation and amortization, and after similar adjustments for unconsolidated Real Estate Ventures. FFO is a non-GAAP financial measure. The Operating Partnership believes that the use of FFO combined with the required U.S. GAAP presentations, has been beneficial in improving the understanding of operating results of REITs among the investing public and making comparisons of REITs’ operating results more meaningful. The Operating Partnership considers FFO to be a useful measure for reviewing comparative operating and financial performance because, by excluding gains or losses related to sales of previously depreciated operating real estate assets and real estate depreciation and amortization, FFO can help the investing public compare the operating performance of a company’s real estate between periods or as compared to other companies. The Operating Partnership’s computation of FFO may not be comparable to FFO reported by other REITs or real estate companies that do not define the term in accordance with the current NAREIT definition or that interpret the current NAREIT definition differently.
69
The Operating Partnership considers net income, as defined by U.S. GAAP, to be the most comparable earnings measure to FFO. While FFO and FFO per unit are relevant and widely used measures of operating performance of REITs, FFO does not represent cash flow from operations or net income as defined by U.S. GAAP and should not be considered as alternatives to those measures in evaluating the Company’s liquidity or operating performance. The Operating Partnership believes that to further understand our performance, FFO should be compared with its reported net income/(loss) attributable to common unit holders and considered in addition to cash flows in accordance with GAAP, as presented in our consolidated financial statements.
The following table presents a reconciliation of net income (loss) attributable to common unit holders to FFO for the years ended
December 31, 2013
and 2012:
|
Year-ended
|
||||||||
|
December 31, 2013
|
December 31, 2012
|
|||||||
|
|
(amounts in thousands, except share information)
|
|||||||
|
Net income (loss) attributable to common unitholders
|
$
|
35,926
|
|
$
|
(8,304
|
)
|
||
|
Add (deduct):
|
||||||||
|
Amount allocated to unvested restricted unitholders
|
363
|
|
376
|
|
||||
|
Net (gain) loss on real estate venture transactions
|
(29,604
|
)
|
950
|
|
||||
|
Net gain on disposition of discontinued operations
|
(3,382
|
)
|
(34,774
|
)
|
||||
|
Net gain from remeasurement of investments in real estate ventures
|
(6,866
|
)
|
—
|
|
||||
|
Depreciation and amortization:
|
||||||||
|
Real property — continuing operations
|
160,665
|
|
148,871
|
|
||||
|
Leasing costs including acquired intangibles — continuing operations
|
36,217
|
|
38,983
|
|
||||
|
Real property — discontinued operations
|
1,922
|
|
10,208
|
|
||||
|
Leasing costs including acquired intangibles — discontinued operations
|
3
|
|
291
|
|
||||
|
Company’s share of unconsolidated real estate ventures
|
15,959
|
|
14,788
|
|
||||
|
Funds from operations
|
$
|
211,203
|
|
$
|
171,389
|
|
||
|
Funds from operations allocable to unvested restricted shareholders
|
(830
|
)
|
(856
|
)
|
||||
|
Funds from operations available to common share and unit holders (FFO)
|
$
|
210,373
|
|
$
|
170,533
|
|
||
|
Weighted-average shares/units outstanding — fully diluted
|
156,203,398
|
|
146,408,921
|
|
||||
|
Item 7A.
|
Quantitative and Qualitative Disclosures About Market Risk
|
See discussion in Management’s Discussion and Analysis of Financial Condition and Results of Operations included in Item 7 herein.
|
Item 8.
|
Financial Statements and Supplementary Data
|
The financial statements and supplementary financial data of the Parent Company and the Operating Partnership and the reports thereon of PricewaterhouseCoopers LLP, an independent registered public accounting firm, with respect thereto are listed under Items 15(a) and 15(b) and filed as part of this Annual Report on Form 10-K. See Item 15.
|
Item 9.
|
Changes in and Disagreements with Accountants on Accounting and Financial Disclosure
|
None
70
Controls and Procedures (Parent Company)
Conclusion Regarding the Effectiveness of Disclosure Controls and Procedures
Under the supervision and with the participation of the Parent Company’s management, including its principal executive officer and principal financial officer, the Parent Company’s management conducted an evaluation of its disclosure controls and procedures, as such term is defined under Rule 13a-15(e) promulgated under the Securities Exchange Act of 1934, as amended (the "Exchange Act"). Based on this evaluation, the principal executive officer and the principal financial officer of the Parent Company concluded that the Parent Company’s disclosure controls and procedures were effective as of the end of the period covered by this annual report.
Management’s Report on Internal Control Over Financial Reporting
The management of the Parent Company is responsible for establishing and maintaining adequate internal control over financial reporting, as such term is defined in Exchange Act Rule 13a-15(f).
Under the supervision and with the participation of the Parent Company’s management, including its principal executive officer and principal financial officer, the Parent Company’s management conducted an evaluation of the effectiveness of the Parent Company's internal control over financial reporting based on the framework in
Internal Control — Integrated Framework
issued by the Committee of Sponsoring Organizations of the Treadway Commission in 1992. Based on this evaluation under the framework in
Internal Control — Integrated Framework
, the Parent Company’s management concluded that the Parent Company's internal control over financial reporting was effective as of
December 31, 2013
.
The effectiveness of the Parent Company’s internal control over financial reporting as of
December 31, 2013
has been audited by PricewaterhouseCoopers LLP, an independent registered public accounting firm, as stated in its report which is included herein.
Changes in Internal Control over Financial Reporting
There have not been any changes in the Parent Company’s internal control over financial reporting (as such term is defined in Rules 13a-15(f) and 15d-15(f) under the Exchange Act) during the fourth fiscal quarter to which this report relates that have materially affected, or are reasonably likely to materially affect, the Parent Company’s internal control over financial reporting.
Controls and Procedures (Operating Partnership)
Conclusion Regarding the Effectiveness of Disclosure Controls and Procedures
Under the supervision and with the participation of the Operating Partnership’s management, including its principal executive officer and principal financial officer, the Operating Partnership’s management conducted an evaluation of its disclosure controls and procedures, as such term is defined under Rule 13a-15(e) promulgated under the Exchange Act. Based on this evaluation, the principal executive officer and the principal financial officer of Operating Partnership concluded that the Operating Partnership’s disclosure controls and procedures were effective as of the end of the period covered by this annual report.
Management’s Report on Internal Control Over Financial Reporting
The management of the Operating Partnership is responsible for establishing and maintaining adequate internal control over financial reporting, as such term is defined in Exchange Act Rule 13a-15(f).
Under the supervision and with the participation of the Operating Partnership’s management, including its principal executive officer and principal financial officer, the Operating Partnership’s management conducted an evaluation of the effectiveness of the Operating Partnership's internal control over financial reporting based on the framework in
Internal Control — Integrated Framework
issued by the Committee of Sponsoring Organizations of the Treadway Commission in 1992. Based on this evaluation under the framework in
Internal Control — Integrated Framework
, the Operating Partnership’s management concluded that the Operating Partnership's internal control over financial reporting was effective as of
December 31, 2013
.
The effectiveness of the Operating Partnership’s internal control over financial reporting as of
December 31, 2013
has been audited by PricewaterhouseCoopers LLP, an independent registered public accounting firm, as stated in its report which is included herein.
71
Changes in Internal Control over Financial Reporting.
There have not been any changes in the Operating Partnership’s internal control over financial reporting (as such term is defined in Rules 13a-15(f) and 15d-15(f) under the Exchange Act) during the fourth fiscal quarter to which this report relates that have materially affected, or are reasonably likely to materially affect, the Operating Partnership’s internal control over financial reporting.
None.
72
|
Item 10.
|
Directors, Executive Officers and Corporate Governance
|
Incorporated herein by reference to the Company’s definitive proxy statement to be filed with respect to its
2014
Annual Meeting of Shareholders.
|
Item 11.
|
Executive Compensation
|
Incorporated herein by reference to the Company’s definitive proxy statement to be filed with respect to its
2014
Annual Meeting of Shareholders.
|
Item 12.
|
Security Ownership of Certain Beneficial Owners and Management and Related Shareholder Matters
|
Incorporated herein by reference to the Company’s definitive proxy statement to be filed with respect to its
2014
Annual Meeting of Shareholders.
|
Item 13.
|
Certain Relationships and Related Transactions, and Director Independence
|
Incorporated herein by reference to the Company’s definitive proxy statement to be filed with respect to its
2014
Annual Meeting of Shareholders.
|
Item 14.
|
Principal Accountant Fees and Services
|
Incorporated herein by reference to the Company’s definitive proxy statement to be filed with respect to its
2014
Annual Meeting of Shareholders.
73
|
Item 15.
|
Exhibits and Financial Statement Schedules.
|
|
(a)
|
Financial Statements and Schedules of Brandywine Realty Trust
|
|
(b)
|
Financial Statements and Schedules of Brandywine Operating Partnership
|
The financial statements and schedules of the Parent Company and the Operating Partnership listed below are filed as part of this annual report on the pages indicated.
74
Index to Financial Statements and Schedule
|
|
Page
|
|
|
|
|
|
|
|
|
|
|
Financial Statements of Brandywine Realty Trust
|
|
|
|
|
|
|
|
|
|
|
|
|
|
|
|
|
|
|
|
|
Financial Statements of Brandywine Operating Partnership, L.P.
|
|
|
|
|
|
|
|
|
|
|
|
|
|
|
|
|
|
|
|
|
|
|
|
|
|
75
3.
Exhibits
|
Exhibits No.
|
|
Description
|
|
3.1.1
|
|
Amended and Restated Declaration of Trust of Brandywine Realty Trust (amended and restated as of May 12, 1997) (previously filed as an exhibit to Brandywine Realty Trust’s Form 8-K dated June 9, 1997 and incorporated herein by reference)
|
|
|
|
|
|
3.1.2
|
|
Articles of Amendment to Declaration of Trust of Brandywine Realty Trust (September 4, 1997) (previously filed as an exhibit to Brandywine Realty Trust’s Form 8-K dated September 10, 1997 and incorporated herein by reference)
|
|
|
|
|
|
3.1.3
|
|
Articles of Amendment to Declaration of Trust of Brandywine Realty Trust (previously filed as an exhibit to Brandywine Realty Trust’s Form 8-K dated June 3, 1998 and incorporated herein by reference)
|
|
|
|
|
|
3.1.4
|
|
Articles Supplementary to Declaration of Trust of Brandywine Realty Trust (September 28, 1998) (previously filed as an exhibit to Brandywine Realty Trust’s Form 8-K dated October 13, 1998 and incorporated herein by reference)
|
|
|
|
|
|
3.1.5
|
|
Articles of Amendment to Declaration of Trust of Brandywine Realty Trust (March 19, 1999) (previously filed as an exhibit to Brandywine Realty Trust’s Form 10-K for the fiscal year ended December 31, 1998 and incorporated herein by reference)
|
|
|
|
|
|
3.1.6
|
|
Articles Supplementary to Declaration of Trust of Brandywine Realty Trust (April 19, 1999) (previously filed as an exhibit to Brandywine Realty Trust’s Form 8-K dated April 26, 1999 and incorporated herein by reference)
|
|
|
|
|
|
3.1.7
|
|
Articles Supplementary to Declaration of Trust of Brandywine Realty Trust (December 30, 2003) (previously filed as an exhibit to Brandywine Realty Trust’s Form 8-A dated December 29, 2003 and incorporated herein by reference)
|
|
|
|
|
|
3.1.8
|
|
Articles Supplementary to Declaration of Trust of Brandywine Realty Trust (February 5, 2004) (previously filed as an exhibit to Brandywine Realty Trust’s Form 8-A dated February 5, 2004 and incorporated herein by reference)
|
|
|
|
|
|
3.1.9
|
|
Articles of Amendment to Declaration of Trust of Brandywine Realty Trust (October 3, 2005) (previously filed as an exhibit to Brandywine Realty Trust’s Form 8-K dated October 4, 2005 and incorporated herein by reference)
|
|
|
|
|
|
3.1.10
|
|
Articles Supplementary to Declaration of Trust of Brandywine Realty Trust (April 6, 2012) classifying and designating Series E Cumulative Redeemable Preferred Shares of Beneficial Interest, par value $0.01 per share and liquidation preference $25 per share, of Brandywine Realty Trust (previously filed as an exhibit to Brandywine Realty Trust's Form 8-A dated April 6, 2012 and incorporated herein by reference)
|
|
|
|
|
|
3.1.11
|
|
Amended and Restated Agreement of Limited Partnership of Brandywine Operating Partnership, L.P. (the “Operating Partnership”) (previously filed as an exhibit to Brandywine Realty Trust's Form 8-K dated December 17, 1997 and incorporated herein by reference)
|
|
|
|
|
|
3.1.12
|
|
First Amendment to Amended and Restated Agreement of Limited Partnership of Brandywine Operating Partnership, L.P. (previously filed as an exhibit to Brandywine Realty Trust's Form 8-K dated December 17, 1997 and incorporated herein by reference)
|
|
|
|
|
|
3.1.13
|
|
Second Amendment to the Amended and Restated Agreement of Limited Partnership Agreement of Brandywine Operating Partnership, L.P. (previously filed as an exhibit to Brandywine Realty Trust's Form 8-K dated April 13, 1998 and incorporated herein by reference)
|
|
|
|
|
76
|
3.1.14
|
|
Third Amendment to the Amended and Restated Agreement of Limited Partnership of Brandywine Operating Partnership, L.P. (previously filed as an exhibit to Brandywine Realty Trust's Form 8-K dated May 14, 1998 and incorporated herein by reference)
|
|
|
|
|
|
3.1.15
|
|
Fourth Amendment to the Amended and Restated Agreement of Limited Partnership of Brandywine Operating Partnership, L.P. (previously filed as an exhibit to Brandywine Realty Trust's Form 8-K dated October 13, 1998 and incorporated herein by reference)
|
|
3.1.16
|
Fifth Amendment to the Amended and Restated Agreement of Limited Partnership of Brandywine Operating Partnership, L.P. (previously filed as an exhibit to Brandywine Realty Trust's Form 8-K dated October 13, 1998 and incorporated herein by reference)
|
|
|
|
|
|
|
3.1.17
|
Sixth Amendment to the Amended and Restated Agreement of Limited Partnership of Brandywine Operating Partnership, L.P. (previously filed as an exhibit to Brandywine Realty Trust's Form 8-K dated October 13, 1998 and incorporated herein by reference)
|
|
|
|
|
|
|
3.1.18
|
Seventh Amendment to the Amended and Restated Agreement of Limited Partnership of Brandywine Operating Partnership, L.P. (previously filed as an exhibit to Brandywine Realty Trust's Form 10-K for the fiscal year ended December 31, 2003 and incorporated herein by reference)
|
|
|
|
|
|
|
3.1.19
|
Eighth Amendment to the Amended and Restated Agreement of Limited Partnership of Brandywine Operating Partnership, L.P. (previously filed as an exhibit to Brandywine Realty Trust's Form 10-K for the fiscal year ended December 31, 2003 and incorporated herein by reference)
|
|
|
|
|
|
|
3.1.20
|
Ninth Amendment to the Amended and Restated Agreement of Limited Partnership of Brandywine Operating Partnership, L.P. (previously filed as an exhibit to Brandywine Realty Trust's Form 10-K for the fiscal year ended December 31, 2003 and incorporated herein by reference)
|
|
|
|
|
|
|
3.1.21
|
Tenth Amendment to the Amended and Restated Agreement of Limited Partnership of Brandywine Operating Partnership, L.P. (previously filed as an exhibit to Brandywine Realty Trust's Form 10-K for the fiscal year ended December 31, 2003 and incorporated herein by reference)
|
|
|
|
|
|
|
3.1.22
|
Eleventh Amendment to the Amended and Restated Agreement of Limited Partnership of Brandywine Operating Partnership, L.P. (previously filed as an exhibit to Brandywine Realty Trust's Form 10-K for the fiscal year ended December 31, 2003 and incorporated herein by reference)
|
|
|
|
|
|
|
3.1.23
|
Twelfth Amendment to the Amended and Restated Agreement of Limited Partnership of Brandywine Operating Partnership, L.P. (previously filed as an exhibit to Brandywine Realty Trust's Form 10-K for the fiscal year ended December 31, 2003 and incorporated herein by reference)
|
|
|
|
|
|
|
3.1.24
|
Thirteenth Amendment to the Amended and Restated Agreement of Limited Partnership of Brandywine Operating Partnership, L.P. (previously filed as an exhibit to Brandywine Realty Trust's Form 8-K dated September 21, 2004 and incorporated herein by reference)
|
|
|
|
|
|
|
3.1.25
|
Fourteenth Amendment to the Amended and Restated Agreement of Limited Partnership of Brandywine Operating Partnership, L.P. (previously filed as an exhibit to Brandywine Realty Trust's Form 8-K dated January 10, 2006 and incorporated herein by reference)
|
|
|
|
|
|
|
3.1.26
|
Fifteenth Amendment to the Amended and Restated Agreement of Limited Partnership of Brandywine Operating Partnership, L.P. (previously filed as an exhibit to Brandywine Realty Trust's Form 8-K dated August 18, 2006 and incorporated herein by reference)
|
|
|
|
|
|
|
3.1.27
|
Sixteenth Amendment to the Amended and Restated Agreement of Limited Partnership of Brandywine Operating Partnership, L.P. (previously filed as an exhibit to Brandywine Realty Trust's Form 8-K dated August 9, 2010 and incorporated herein by reference)
|
|
|
|
|
|
77
|
3.1.28
|
Seventeenth Amendment to the Amended and Restated Agreement of Limited Partnership of Brandywine Operating Partnership, L.P. (previously filed as an exhibit to Brandywine Realty Trust's Form 8-K dated April 11, 2012 and incorporated herein by reference)
|
|
|
3.1.29
|
List of partners of Brandywine Operating Partnership, L.P.
|
|
|
3.2
|
Amended and Restated Bylaws of Brandywine Realty Trust (previously filed as an exhibit to Brandywine Realty Trust’s Form 8-K dated June 4, 2010 and incorporated herein by reference)
|
|
|
|
|
|
|
4.1
|
Form of 7.50% Series C Cumulative Redeemable Preferred Share Certificate (previously filed as an exhibit to Brandywine Realty Trust’s Form 8-A dated December 29, 2003 and incorporated herein by reference)
|
|
|
|
|
|
|
4.2
|
Form of 7.375% Series D Cumulative Redeemable Preferred Share Certificate (previously filed as an exhibit to Brandywine Realty Trust’s Form 8-A dated February 5, 2004 and incorporated herein by reference)
|
|
|
4.3
|
Form of 6.90% Series E Cumulative Redeemable Preferred Shares Certificate (previously filed as an exhibit to Brandywine Realty Trust's Form 8-A dated April 6, 2012 and incorporated herein by reference).
|
|
|
4.4.1
|
Indenture dated October 22, 2004 by and among Brandywine Operating Partnership, L.P., Brandywine Realty Trust, certain subsidiaries of Brandywine Operating Partnership, L.P. named therein and The Bank of New York Mellon, as Trustee (previously filed as an exhibit to Brandywine Realty Trust's Form 8-K dated October 22, 2004 and incorporated herein by reference)
|
|
|
4.4.2
|
First Supplemental Indenture dated as of May 25, 2005 by and among Brandywine Operating Partnership, L.P., Brandywine Realty Trust, certain subsidiaries of Brandywine Operating Partnership, L.P. named therein and The Bank of New York Mellon, as Trustee (previously filed as an exhibit to Brandywine Realty Trust's Form 8-K dated May 26, 2005 and incorporated herein by reference)
|
|
|
4.4.3
|
Second Supplemental Indenture dated as of October 4, 2006 by and among Brandywine Operating Partnership, L.P., Brandywine Realty Trust and The Bank of New York Mellon, as Trustee (previously filed as an exhibit to Brandywine Realty Trust's Form 8-K dated October 4, 2006 and incorporated herein by reference)
|
|
|
4.4.4
|
Third Supplemental Indenture dated as of April 5, 2011 by and among Brandywine Operating Partnership, L.P., Brandywine Realty Trust and The Bank of New York Mellon, as Trustee (previously filed as an exhibit to Brandywine Realty Trust's Form 8-K dated April 5, 2011 and incorporated herein by reference)
|
|
|
4.5
|
Form of $250,000,000 5.40% Guaranteed Note due 2014 (previously filed as an exhibit to Brandywine Realty Trust's Form 8-K dated October 22, 2004 and incorporated herein by reference)
|
|
|
|
|
|
|
4.6
|
Form of $250,000,000 aggregate principal amount of 6.00% Guaranteed Note due 2016 (previously filed as an exhibit to Brandywine Realty Trust's Form 8-K dated March 28, 2006 and incorporated herein by reference).
|
|
|
|
|
|
|
4.7
|
Form of $300,000,000 aggregate principal amount of 5.70% Guaranteed Notes due 2017 (previously filed as an exhibit to Brandywine Realty Trust's Form 8-K dated April 30, 2007 and incorporated herein by reference)
|
|
|
|
|
|
|
4.8
|
Form of $250,000,000 aggregate principal amount of 7.50% Guaranteed Notes due 2015 (previously filed as an exhibit to Brandywine Realty Trust's Form 8-K dated September 25, 2009 and incorporated herein by reference)
|
|
|
|
|
|
|
4.9
|
Form of $325,000,000 aggregate principal amount of 4.95% Guaranteed Notes due 2018 (previously filed as an exhibit to Brandywine Realty Trust's Form 8-K dated April 5, 2011 and incorporated herein by reference)
|
|
|
|
|
|
78
|
4.10
|
Form of $250,000,000 aggregate principal amount of 3.95% Guaranteed Notes due 2023 (previously filed as an exhibit to Brandywine Realty Trust's Form 8-K dated December 18, 2012 and incorporated herein by reference)
|
|
|
10.1
|
Third Amended and Restated Revolving Credit Agreement dated as of December 15, 2011 (previously filed as an exhibit to Brandywine Realty Trust's Form 10-K for the fiscal year ended December 31, 2011 and incorporated herein by reference)
|
|
|
|
|
|
|
10.2
|
Term Loan A Agreement dated as of December 15, 2011 (previously filed as an exhibit to Brandywine Realty Trust's Form 10-K for the fiscal year ended December 31, 2011 and incorporated herein by reference)
|
|
|
10.3
|
Term Loan B Agreement dated as of December 15, 2011 (previously filed as an exhibit to Brandywine Realty Trust's Form 10-K for the fiscal year ended December 31, 2011 and incorporated herein by reference)
|
|
|
|
|
|
|
10.4
|
Term Loan C Agreement dated as of December 15, 2011 (previously filed as an exhibit to Brandywine Realty Trust's Form 10-K for the fiscal year ended December 31, 2011 and incorporated herein by reference)
|
|
|
|
||
|
10.5
|
Contribution Agreement dated August 18, 2004 with TRC Realty, Inc.-GP, TRC-LB LLC and TRC Associates Limited Partnership (previously filed as an exhibit to Brandywine Realty Trust's Form 8-K dated August 19, 2004 and incorporated herein by reference)
|
|
|
10.6
|
Registration Rights Agreement (previously filed as an exhibit to Brandywine Realty Trust's Form 8-K dated September 21, 2004 and incorporated herein by reference)
|
|
|
10.7
|
Tax Protection Agreement (previously filed as an exhibit to Brandywine Realty Trust's Form 8-K dated September 21, 2004 and incorporated herein by reference)
|
|
|
10.8
|
Registration Rights Agreement dated as of October 3, 2005 (previously filed as an exhibit to Brandywine Realty Trust's Form 8-K dated October 4, 2005 and incorporated herein by reference)
|
|
|
10.9
|
Letter to Cohen & Steers Capital Management, Inc. relating to waiver of share ownership limit (previously filed as an exhibit to Brandywine Realty Trust's Form 10-Q for the quarter ended June 30, 2003 and incorporated herein by reference)
|
|
|
|
||
|
10.10
|
Letter to RREEF America LLC relating to waiver of share ownership limit (previously filed as an exhibit to Brandywine Realty Trust's Form 10-K for the fiscal year ended December 31, 2009 and incorporated herein by reference)
|
|
|
|
||
|
10.11
|
Amended and Restated Employment Agreement dated as of February 9, 2007 of Gerard H. Sweeney** (previously filed as an exhibit to Brandywine Realty Trust's Form 8-K dated February 14, 2007 and incorporated herein by reference)
|
|
|
|
|
|
|
10.12
|
Letter Agreement dated March 1, 2012 modifying Amended and Restated Employment Agreement of Gerard H. Sweeney** (previously filed as an exhibit to Brandywine Realty Trust's Form 8-K dated March 7, 2012 and incorporated herein by reference)
|
|
|
|
||
|
10.13
|
Amended and Restated 1997 Long-Term Incentive Plan (as amended effective June 2, 2010)** (previously filed as an exhibit to Brandywine Realty Trust's Registration Statement on Form S-8, File No. 333-167266 and incorporated herein by reference)
|
|
|
|
|
|
|
10.14
|
Amended and Restated Executive Deferred Compensation Plan dated January 1, 2013** (previously filed as an exhibit to Brandywine Realty Trust's Form 8-K dated December 11, 2012 and incorporated herein by reference)
|
|
|
|
|
|
79
|
10.15
|
2007 Non-Qualified Employee Share Purchase Plan** (previously filed as an exhibit to Brandywine Realty Trust's Form 10-Q for the quarter ended March 31, 2007 and incorporated herein by reference)
|
|
|
|
||
|
10.16
|
Summary of Trustee Compensation**
|
|
|
|
|
|
|
10.17
|
Form of Non-Qualified Share Option Agreement to the President and CEO and Executive Vice President and CFO** (previously filed as an exhibit to Brandywine Realty Trust's Form 8-K dated April 11, 2008 and incorporated herein by reference)
|
|
|
|
|
|
|
10.18
|
Form of Non-Qualified Share Option Agreement to the executive officers (other than the President and CEO and Executive Vice President and CFO)** (previously filed as an exhibit to Brandywine Realty Trust's Form 8-K dated April 11, 2008 and incorporated herein by reference)
|
|
|
|
||
|
10.19
|
Form of Incentive Stock Option Agreement to the President and CEO and Executive Vice President and CFO ** (previously filed as an exhibit to Brandywine Realty Trust's Form 8-K dated April 11, 2008 and incorporated herein by reference)
|
|
|
|
|
|
|
10.20
|
Form of Incentive Stock Option Agreement to the executive officers (other than the President and CEO and Executive Vice President and CFO)** (previously filed as an exhibit to Brandywine Realty Trust's Form 8-K dated April 11, 2008 and incorporated herein by reference)
|
|
|
|
|
|
|
10.21
|
Forms of Non-Qualified Share Option Agreement for Executive Officers** (previously filed as an exhibit to Brandywine Realty Trust's Form 8-K dated April 1, 2009 and incorporated herein by reference)
|
|
|
|
|
|
|
10.22
|
Forms of Incentive Stock Option Agreement for Executive Officers** (previously filed as an exhibit to Brandywine Realty Trust's Form 8-K dated April 1, 2009 and incorporated herein by reference)
|
|
|
|
||
|
10.23
|
Form of Amended and Restated Change of Control Agreement with Executive Officers** (previously filed as an exhibit to Brandywine Realty Trust's Form 8-K filed on February 4, 2010 and incorporated herein by reference)
|
|
|
|
|
|
|
10.24
|
Employment Agreement dated February 3, 2010 with Howard M. Sipzner** (previously filed as an exhibit to Brandywine Realty Trust's Form 8-K filed on February 4, 2010 and incorporated herein by reference)
|
|
|
|
|
|
|
10.25
|
Forms of Incentive Stock Option Agreement (March 2010) for Executive Officers** (previously filed as an exhibit to Brandywine Realty Trust's Form 8-K filed on March 8, 2010 and incorporated herein by reference)
|
|
|
|
|
|
|
10.26
|
Forms of Non-Qualified Share Option Agreement (March 2010) for Executive Officers** (previously filed as an exhibit to Brandywine Realty Trust's Form 8-K filed on March 8, 2010 and incorporated herein by reference)
|
|
|
|
|
|
|
10.27
|
Form of Restricted Share Award (March 2011) for Executive Officers** (previously filed as an exhibit to Brandywine Realty Trust's Form 8-K filed on March 8, 2011 and incorporated herein by reference)
|
|
|
|
||
|
10.28
|
Form of Restricted Performance Share Unit and Dividend Equivalent Rights Award Agreement (March 2011) for Executive Officers** (previously filed as an exhibit to Brandywine Realty Trust's Form 8-K filed on March 8, 2011 and incorporated herein by reference)
|
|
|
|
|
|
|
10.29
|
Forms of Incentive Share Option Agreement (March 2011) for Executive Officers** (previously filed as an exhibit to Brandywine Realty Trust's Form 8-K filed on March 8, 2011 and incorporated herein by reference)
|
|
|
|
|
|
|
10.30
|
Forms of Non-Qualified Share Option Agreement (March 2011) for Executive Officers** (previously filed as an exhibit to Brandywine Realty Trust's Form 8-K filed on March 8, 2011 and incorporated herein by reference)
|
|
|
|
|
|
80
|
10.31
|
2011-2013 Restricted Performance Share Unit Program** (previously filed as an exhibit to Brandywine Realty Trust's Form 8-K filed on March 8, 2011 and incorporated herein by reference)
|
|
|
|
|
|
|
10.32
|
Letter Agreement dated May 24, 2011 modifying options of President and Chief Executive Officer** (previously filed as an exhibit to Brandywine Realty Trust's Form 8-K filed on May 24, 2011 and incorporated herein by reference)
|
|
|
|
|
|
|
10.33
|
Form of Restricted Share Award (March 2012) for Executive Officers** (previously filed as an exhibit to Brandywine Realty Trust's Form 8-K filed on March 7, 2012 and incorporated herein by reference)
|
|
|
|
||
|
10.34
|
Form of Restricted Performance Share Unit and Dividend Equivalent Rights Award Agreement (March 2012) for Executive Officers** (previously filed as an exhibit to Brandywine Realty Trust's Form 8-K filed on March 7, 2012 and incorporated herein by reference)
|
|
|
|
|
|
|
10.35
|
2012-2014 Restricted Performance Share Unit Program** (previously filed as an exhibit to Brandywine Realty Trust's Form 8-K filed on March 7, 2012 and incorporated herein by reference)
|
|
|
10.36
|
Form of Performance Unit Award Agreement ** (previously filed as an exhibit to Brandywine Realty Trust's Form 8-K filed on March 1, 2013 and incorporated herein by reference)
|
|
|
10.37
|
Form of Restricted Share Award ** (previously filed as an exhibit to Brandywine Realty Trust's Form 8-K filed on March 1, 2013 and incorporated herein by reference)
|
|
|
10.38
|
2013 -2015 Performance Share Unit Program ** (previously filed as an exhibit to Brandywine Realty Trust's
Form 8-K filed on March 1, 2013 and incorporated herein by reference)
|
|
|
10.39
|
Form of Restricted Share Award Agreement for non-employee Trustees ** (previously filed as an exhibit to Brandywine Realty Trust’s Form 10-Q for the quarter ended June 30, 2013 and incorporated herein by reference)
|
|
|
10.40
|
Sales Agency Agreement dated November 5, 2013 among Brandywine Realty Trust, Brandywine Operating Partnership, L.P. and RBC Capital Markets (previously filed as an exhibit to Brandywine Realty Trust’s Form 8-K filed on November 5, 2013 and incorporated herein by reference)
|
|
|
10.41
|
Sales Agency Agreement dated November 5, 2013 among Brandywine Realty Trust, Brandywine Operating Partnership, L.P. and Barclays Capital Inc. (previously filed as an exhibit to Brandywine Realty Trust’s Form 8-K filed on November 5, 2013 and incorporated herein by reference)
|
|
|
10.42
|
Sales Agency Agreement dated November 5, 2013 among Brandywine Realty Trust, Brandywine Operating Partnership, L.P. and Jefferies LLC (previously filed as an exhibit to Brandywine Realty Trust’s Form 8-K filed on November 5, 2013 and incorporated herein by reference)
|
|
|
10.43
|
Sales Agency Agreement dated November 5, 2013 among Brandywine Realty Trust, Brandywine Operating Partnership, L.P. and BNY Mellon Capital Markets LLC (previously filed as an exhibit to Brandywine Realty Trust’s Form 8-K filed on November 5, 2013 and incorporated herein by reference)
|
|
|
|
|
|
|
12.1
|
Statement re Computation of Ratios of Brandywine Realty Trust
|
|
|
|
|
|
|
12.2
|
Statement re Computation of Ratios of Brandywine Operating Partnership, L.P
|
|
|
|
|
|
|
21
|
List of subsidiaries
|
|
|
|
|
|
|
23.1
|
Consent of PricewaterhouseCoopers LLP relating to financial statements of Brandywine Realty Trust
|
|
|
|
|
|
81
|
23.2
|
Consent of PricewaterhouseCoopers LLP relating to financial statements of Brandywine Operating Partnership, L.P.
|
|
|
31.1
|
Certification of the Chief Executive Officer of Brandywine Realty Trust pursuant to 13a-14 under the Securities Exchange Act of 1934
|
|
|
|
|
|
|
31.2
|
Certification of the Chief Financial Officer of Brandywine Realty Trust pursuant to 13a-14 under the Securities Exchange Act of 1934
|
|
|
|
|
|
|
31.3
|
Certification of the Chief Executive Officer of Brandywine Realty Trust, in its capacity as the general partner of Brandywine Operating Partnership, L.P., pursuant to 13a-14 under the Securities Exchange Act of 1934
|
|
|
|
|
|
|
31.4
|
Certification of the Chief Financial Officer of Brandywine Realty Trust, in its capacity as the general partner of Brandywine Operating Partnership, L.P., pursuant to 13a-14 under the Securities Exchange Act of 1934
|
|
|
|
|
|
|
32.1
|
Certification of the Chief Executive Officer of Brandywine Realty Trust pursuant to 18 U.S.C. Section 1350, as Adopted Pursuant to Section 906 of the Sarbanes-Oxley Act of 2002
|
|
|
|
|
|
|
32.2
|
Certification of the Chief Financial Officer of Brandywine Realty Trust pursuant to 18 U.S.C. Section 1350, as Adopted Pursuant to Section 906 of the Sarbanes-Oxley Act of 2002
|
|
|
|
|
|
|
32.3
|
Certification of the Chief Executive Officer of Brandywine Realty Trust, in its capacity as the general partner of Brandywine Operating Partnership, L.P., pursuant to 18 U.S.C. Section 1350, as Adopted Pursuant to Section 906 of the Sarbanes-Oxley Act of 2002
|
|
|
|
|
|
|
32.4
|
Certification of the Chief Financial Officer of Brandywine Realty Trust, in its capacity as the general partner of Brandywine Operating Partnership, L.P., pursuant to 18 U.S.C. Section 1350, as Adopted Pursuant to Section 906 of the Sarbanes-Oxley Act of 2002
|
|
|
|
|
|
|
99.1
|
Material Tax Consequences
|
|
|
**
|
Management contract or compensatory plan or arrangement
|
|
(c)
|
Financial Statement Schedule: See Item 15 (a) and (b) above
|
82
SIGNATURES
Pursuant to the requirements of Section 13 or 15(d) of the Securities Exchange Act of 1934, the registrant has duly caused this report to be signed on its behalf by the undersigned, thereunto duly authorized.
|
BRANDYWINE REALTY TRUST
|
||
|
By:
|
/s/ Gerard H. Sweeney
|
|
|
|
Gerard H. Sweeney
|
|
|
|
President and Chief Executive Officer
|
|
Date:
February 25, 2014
Pursuant to the requirements of the Securities Exchange Act of 1934, this report has been signed below by the following persons on behalf of the registrant and in the capacities and on the dates indicated.
|
Signature
|
|
Title
|
|
Date
|
|
|
|
|
|
|
|
/s/ Walter D’Alessio
|
|
Chairman of the Board and Trustee
|
|
February 25, 2014
|
|
Walter D’Alessio
|
||||
|
|
|
|
|
|
|
/s/ Gerard H. Sweeney
|
|
President, Chief Executive Officer and Trustee
|
|
February 25, 2014
|
|
Gerard H. Sweeney
|
(Principal Executive Officer)
|
|||
|
|
|
|
|
|
|
/s/ Howard M. Sipzner
|
|
Executive Vice President and Chief Financial Officer
|
|
February 25, 2014
|
|
Howard M. Sipzner
|
(Principal Financial Officer)
|
|||
|
|
|
|
|
|
|
/s/ Gabriel J. Mainardi
|
|
Vice President and Chief Accounting Officer (Principal
|
|
February 25, 2014
|
|
Gabriel J. Mainardi
|
Accounting Officer)
|
|||
|
|
|
|
|
|
|
/s/ Wyche Fowler
|
Trustee
|
February 25, 2014
|
||
|
Wyche Fowler
|
||||
|
/s/ James Diggs
|
|
Trustee
|
|
February 25, 2014
|
|
James Diggs
|
||||
|
|
|
|
|
|
|
/s/ Michael J. Joyce
|
|
Trustee
|
|
February 25, 2014
|
|
Michael J. Joyce
|
||||
|
|
|
|
|
|
|
/s/ Anthony A. Nichols, Sr.
|
|
Trustee
|
|
February 25, 2014
|
|
Anthony A. Nichols, Sr.
|
||||
|
|
|
|
|
|
|
/s/ Charles P. Pizzi
|
|
Trustee
|
|
February 25, 2014
|
|
Charles P. Pizzi
|
||||
83
SIGNATURES
Pursuant to the requirements of Section 13 or 15(d) of the Securities Exchange Act of 1934, the registrant has duly caused this report to be signed on its behalf by the undersigned, thereunto duly authorized.
|
BRANDYWINE OPERATING PARTNERSHIP, L.P.
|
||
|
By:
|
Brandywine Realty Trust, its General Partner
|
|
|
By:
|
/s/ Gerard H. Sweeney
|
|
|
|
Gerard H. Sweeney
|
|
|
|
President and Chief Executive Officer
|
|
Date:
February 25, 2014
Pursuant to the requirements of the Securities Exchange Act of 1934, this report has been signed below by the following persons on behalf of the registrant and in the capacities and on the dates indicated.
|
Signature
|
|
Title
|
|
Date
|
|
|
|
|
|
|
|
/s/ Walter D’Alessio
|
|
Chairman of the Board and Trustee
|
|
February 25, 2014
|
|
Walter D’Alessio
|
||||
|
|
|
|
|
|
|
/s/ Gerard H. Sweeney
|
|
President, Chief Executive Officer and Trustee
|
|
February 25, 2014
|
|
Gerard H. Sweeney
|
(Principal Executive Officer)
|
|||
|
|
|
|
|
|
|
/s/ Howard M. Sipzner
|
|
Executive Vice President and Chief Financial Officer
|
|
February 25, 2014
|
|
Howard M. Sipzner
|
(Principal Financial Officer)
|
|||
|
|
|
|
|
|
|
/s/ Gabriel J. Mainardi
|
|
Vice President and Chief Accounting Officer (Principal
|
|
February 25, 2014
|
|
Gabriel J. Mainardi
|
Accounting Officer)
|
|||
|
|
|
|
|
|
|
/s/ Wyche Fowler
|
Trustee
|
February 25, 2014
|
||
|
Wyche Fowler
|
||||
|
/s/ James Diggs
|
|
Trustee
|
|
February 25, 2014
|
|
James Diggs
|
||||
|
/s/ Michael J. Joyce
|
|
Trustee
|
|
February 25, 2014
|
|
Michael J. Joyce
|
||||
|
|
|
|
|
|
|
/s/ Anthony A. Nichols, Sr.
|
|
Trustee
|
|
February 25, 2014
|
|
Anthony A. Nichols, Sr.
|
||||
|
|
|
|
|
|
|
/s/ Charles P. Pizzi
|
|
Trustee
|
|
February 25, 2014
|
|
Charles P. Pizzi
|
||||
84
Report of Independent Registered Public Accounting Firm
To the Board of Trustees and Shareholders of Brandywine Realty Trust:
In our opinion, the consolidated financial statements listed in the index appearing under Item 15(a) present fairly, in all material respects, the financial position of Brandywine Realty Trust and its subsidiaries (the “Company”) at
December 31, 2013
and
2012
, and the results of their operations and their cash flows for each of the three years in the period ended
December 31, 2013
in conformity with accounting principles generally accepted in the United States of America. In addition, in our opinion, the financial statement schedules listed in the accompanying index appearing under Item 15(a) present fairly, in all material respects, the information set forth therein when read in conjunction with the related consolidated financial statements. Also in our opinion, the Company maintained, in all material respects, effective internal control over financial reporting as of
December 31, 2013
, based on criteria established in
Internal Control — Integrated Framework
issued by the Committee of Sponsoring Organizations of the Treadway Commission (COSO) in 1992. The Company’s management is responsible for these financial statements and financial statement schedules, for maintaining effective internal control over financial reporting and for its assessment of the effectiveness of internal control over financial reporting, included in Management’s Report on Internal Control over Financial Reporting appearing under Item 9A. Our responsibility is to express opinions on these financial statements, on the financial statement schedules and on the Company’s internal control over financial reporting based on our integrated audits. We conducted our audits in accordance with the standards of the Public Company Accounting Oversight Board (United States). Those standards require that we plan and perform the audits to obtain reasonable assurance about whether the financial statements are free of material misstatement and whether effective internal control over financial reporting was maintained in all material respects. Our audits of the financial statements included examining, on a test basis, evidence supporting the amounts and disclosures in the financial statements, assessing the accounting principles used and significant estimates made by management, and evaluating the overall financial statement presentation. Our audit of internal control over financial reporting included obtaining an understanding of internal control over financial reporting, assessing the risk that a material weakness exists, and testing and evaluating the design and operating effectiveness of internal control based on the assessed risk. Our audits also included performing such other procedures as we considered necessary in the circumstances. We believe that our audits provide a reasonable basis for our opinions.
A company’s internal control over financial reporting is a process designed to provide reasonable assurance regarding the reliability of financial reporting and the preparation of financial statements for external purposes in accordance with generally accepted accounting principles. A company’s internal control over financial reporting includes those policies and procedures that (i) pertain to the maintenance of records that, in reasonable detail, accurately and fairly reflect the transactions and dispositions of the assets of the company; (ii) provide reasonable assurance that transactions are recorded as necessary to permit preparation of financial statements in accordance with generally accepted accounting principles, and that receipts and expenditures of the company are being made only in accordance with authorizations of management and directors of the company; and (iii) provide reasonable assurance regarding prevention or timely detection of unauthorized acquisition, use, or disposition of the company’s assets that could have a material effect on the financial statements.
Because of its inherent limitations, internal control over financial reporting may not prevent or detect misstatements. Also, projections of any evaluation of effectiveness to future periods are subject to the risk that controls may become inadequate because of changes in conditions, or that the degree of compliance with the policies or procedures may deteriorate.
/s/ PricewaterhouseCoopers LLP
Philadelphia, Pennsylvania
February 25, 2014
F- 1
Report of Independent Registered Public Accounting Firm
To the Partners of Brandywine Operating Partnership, L.P.:
In our opinion, the consolidated financial statements listed in the index appearing under Item 15(b) present fairly, in all material respects, the financial position of Brandywine Operating Partnership, L.P. and its subsidiaries (the “Partnership”) at
December 31, 2013
and
2012
, and the results of their operations and their cash flows for each of the three years in the period ended
December 31, 2013
in conformity with accounting principles generally accepted in the United States of America. In addition, in our opinion, the financial statement schedules listed in the accompanying index appearing under Item 15(b) present fairly, in all material respects, the information set forth therein when read in conjunction with the related consolidated financial statements. Also in our opinion, the Partnership maintained, in all material respects, effective internal control over financial reporting as of
December 31, 2013
, based on criteria established in
Internal Control — Integrated Framework
issued by the Committee of Sponsoring Organizations of the Treadway Commission (COSO) in 1992. The Partnership’s management is responsible for these financial statements and financial statement schedules, for maintaining effective internal control over financial reporting and for its assessment of the effectiveness of internal control over financial reporting, included in Management’s Report on Internal Control over Financial Reporting appearing under Item 9A. Our responsibility is to express opinions on these financial statements, on the financial statement schedules and on the Partnership’s internal control over financial reporting based on our integrated audits. We conducted our audits in accordance with the standards of the Public Company Accounting Oversight Board (United States). Those standards require that we plan and perform the audits to obtain reasonable assurance about whether the financial statements are free of material misstatement and whether effective internal control over financial reporting was maintained in all material respects. Our audits of the financial statements included examining, on a test basis, evidence supporting the amounts and disclosures in the financial statements, assessing the accounting principles used and significant estimates made by management, and evaluating the overall financial statement presentation. Our audit of internal control over financial reporting included obtaining an understanding of internal control over financial reporting, assessing the risk that a material weakness exists, and testing and evaluating the design and operating effectiveness of internal control based on the assessed risk. Our audits also included performing such other procedures as we considered necessary in the circumstances. We believe that our audits provide a reasonable basis for our opinions.
A company’s internal control over financial reporting is a process designed to provide reasonable assurance regarding the reliability of financial reporting and the preparation of financial statements for external purposes in accordance with generally accepted accounting principles. A company’s internal control over financial reporting includes those policies and procedures that (i) pertain to the maintenance of records that, in reasonable detail, accurately and fairly reflect the transactions and dispositions of the assets of the company; (ii) provide reasonable assurance that transactions are recorded as necessary to permit preparation of financial statements in accordance with generally accepted accounting principles, and that receipts and expenditures of the company are being made only in accordance with authorizations of management and directors of the company; and (iii) provide reasonable assurance regarding prevention or timely detection of unauthorized acquisition, use, or disposition of the company’s assets that could have a material effect on the financial statements.
Because of its inherent limitations, internal control over financial reporting may not prevent or detect misstatements. Also, projections of any evaluation of effectiveness to future periods are subject to the risk that controls may become inadequate because of changes in conditions, or that the degree of compliance with the policies or procedures may deteriorate.
/s/ PricewaterhouseCoopers LLP
Philadelphia, Pennsylvania
February 25, 2014
F- 2
BRANDYWINE REALTY TRUST
CONSOLIDATED BALANCE SHEETS
(in thousands, except share and per share information)
|
December 31,
2013 |
December 31,
2012 |
||||||
|
|
|||||||
|
ASSETS
|
|
|
|||||
|
Real estate investments:
|
|
|
|||||
|
Operating properties
|
$
|
4,669,289
|
|
$
|
4,726,169
|
|
|
|
Accumulated depreciation
|
(983,808
|
)
|
(954,665
|
)
|
|||
|
Operating real estate investments, net
|
3,685,481
|
|
3,771,504
|
|
|||
|
Construction-in-progress
|
74,174
|
|
48,950
|
|
|||
|
Land inventory
|
93,351
|
|
102,439
|
|
|||
|
Total real estate investments, net
|
3,853,006
|
|
3,922,893
|
|
|||
|
Cash and cash equivalents
|
263,207
|
|
1,549
|
|
|||
|
Accounts receivable, net
|
17,389
|
|
13,232
|
|
|||
|
Accrued rent receivable, net
|
126,295
|
|
122,066
|
|
|||
|
Investment in real estate ventures, at equity
|
180,512
|
|
193,555
|
|
|||
|
Deferred costs, net
|
122,954
|
|
122,243
|
|
|||
|
Intangible assets, net
|
132,329
|
|
70,620
|
|
|||
|
Notes receivable
|
7,026
|
|
7,226
|
|
|||
|
Other assets
|
62,377
|
|
53,325
|
|
|||
|
Total assets
|
$
|
4,765,095
|
|
$
|
4,506,709
|
|
|
|
LIABILITIES AND BENEFICIARIES’ EQUITY
|
|
|
|||||
|
Mortgage notes payable
|
$
|
670,151
|
|
$
|
442,974
|
|
|
|
Unsecured credit facility
|
—
|
|
69,000
|
|
|||
|
Unsecured term loans
|
450,000
|
|
450,000
|
|
|||
|
Unsecured senior notes, net of discounts
|
1,475,230
|
|
1,503,356
|
|
|||
|
Accounts payable and accrued expenses
|
83,693
|
|
71,579
|
|
|||
|
Distributions payable
|
25,584
|
|
23,652
|
|
|||
|
Deferred income, gains and rent
|
71,635
|
|
82,947
|
|
|||
|
Acquired lease intangibles, net
|
34,444
|
|
33,859
|
|
|||
|
Other liabilities
|
32,923
|
|
55,826
|
|
|||
|
Total liabilities
|
2,843,660
|
|
2,733,193
|
|
|||
|
Commitments and contingencies (Note 20)
|
|
|
|||||
|
Brandywine Realty Trust’s equity:
|
|
|
|||||
|
Preferred Shares (shares authorized-20,000,000):
|
|
|
|||||
|
6.90% Series E Preferred Shares, $0.01 par value; issued and outstanding- 4,000,000 in 2013 and 2012
|
40
|
|
40
|
|
|||
|
Common Shares of Brandywine Realty Trust’s beneficial interest, $0.01 par value; shares authorized 200,000,000; 156,731,993 and 143,538,733 issued and outstanding in 2013 and 2012, respectively
|
1,566
|
|
1,434
|
|
|||
|
Additional paid-in capital
|
2,971,596
|
|
2,780,194
|
|
|||
|
Deferred compensation payable in common shares
|
5,407
|
|
5,352
|
|
|||
|
Common shares in grantor trust, 312,280 in 2013 and 290,745 in 2012
|
(5,407
|
)
|
(5,352
|
)
|
|||
|
Cumulative earnings
|
522,528
|
|
479,734
|
|
|||
|
Accumulated other comprehensive loss
|
(2,995
|
)
|
(15,918
|
)
|
|||
|
Cumulative distributions
|
(1,592,515
|
)
|
(1,493,206
|
)
|
|||
|
Total Brandywine Realty Trust’s equity
|
1,900,220
|
|
1,752,278
|
|
|||
|
Non-controlling interests
|
21,215
|
|
21,238
|
|
|||
|
Total beneficiaries' equity
|
1,921,435
|
|
1,773,516
|
|
|||
|
Total liabilities and beneficiaries' equity
|
$
|
4,765,095
|
|
$
|
4,506,709
|
|
|
The accompanying notes are an integral part of these consolidated financial statements.
F- 3
BRANDYWINE REALTY TRUST
(in thousands, except share and per share information
|
Years ended December 31,
|
|||||||||||
|
|
2013
|
2012
|
2011
|
||||||||
|
Revenue:
|
|
|
|||||||||
|
Rents
|
$
|
461,387
|
|
$
|
437,560
|
|
$
|
441,329
|
|
||
|
Tenant reimbursements
|
79,087
|
|
77,060
|
|
77,404
|
|
|||||
|
Termination fees
|
4,497
|
|
3,233
|
|
2,951
|
|
|||||
|
Third party management fees, labor reimbursement and leasing
|
13,053
|
|
12,116
|
|
11,536
|
|
|||||
|
Other
|
4,186
|
|
5,710
|
|
5,348
|
|
|||||
|
Total revenue
|
562,210
|
|
535,679
|
|
538,568
|
|
|||||
|
Operating Expenses:
|
|
|
|
||||||||
|
Property operating expenses
|
160,406
|
|
152,319
|
|
159,768
|
|
|||||
|
Real estate taxes
|
55,612
|
|
53,402
|
|
51,433
|
|
|||||
|
Third party management expenses
|
5,751
|
|
5,127
|
|
5,590
|
|
|||||
|
Depreciation and amortization
|
197,021
|
|
188,382
|
|
202,933
|
|
|||||
|
General and administrative expenses
|
27,628
|
|
25,413
|
|
24,602
|
|
|||||
|
Total operating expenses
|
446,418
|
|
424,643
|
|
444,326
|
|
|||||
|
Operating income
|
115,792
|
|
111,036
|
|
94,242
|
|
|||||
|
Other Income (Expense):
|
|
|
|||||||||
|
Interest income
|
1,044
|
|
3,008
|
|
1,810
|
|
|||||
|
Historic tax credit transaction income
|
11,853
|
|
11,840
|
|
12,026
|
|
|||||
|
Interest expense
|
(121,937
|
)
|
(132,939
|
)
|
(131,405
|
)
|
|||||
|
Interest expense — amortization of deferred financing costs
|
(4,676
|
)
|
(6,208
|
)
|
(4,991
|
)
|
|||||
|
Interest expense — financing obligation
|
(972
|
)
|
(850
|
)
|
—
|
|
|||||
|
Recognized hedge activity
|
—
|
|
(2,985
|
)
|
—
|
|
|||||
|
Equity in income of real estate ventures
|
3,664
|
|
2,741
|
|
3,775
|
|
|||||
|
Net gain from remeasurement of investments in real estate ventures
|
6,866
|
|
—
|
|
—
|
|
|||||
|
Net gain on sale of interests in real estate
|
—
|
|
—
|
|
2,985
|
|
|||||
|
Net loss on sale of undepreciated real estate
|
(137
|
)
|
—
|
|
—
|
|
|||||
|
Net gain (loss) on real estate venture transactions
|
29,604
|
|
(950
|
)
|
(222
|
)
|
|||||
|
Loss on early extinguishment of debt
|
(2,119
|
)
|
(22,002
|
)
|
(2,776
|
)
|
|||||
|
Income (loss) from continuing operations
|
38,982
|
|
(37,309
|
)
|
(24,556
|
)
|
|||||
|
Discontinued operations:
|
|
|
|||||||||
|
Income from discontinued operations
|
825
|
|
9,064
|
|
12,794
|
|
|||||
|
Net gain on disposition of discontinued operations
|
3,382
|
|
34,774
|
|
7,047
|
|
|||||
|
Total discontinued operations
|
4,207
|
|
43,838
|
|
19,841
|
|
|||||
|
Net income (loss)
|
43,189
|
|
6,529
|
|
(4,715
|
)
|
|||||
|
Net (income) from discontinued operations attributable to non-controlling interests — LP units
|
(55
|
)
|
(797
|
)
|
(778
|
)
|
|||||
|
Net (income) loss attributable to non-controlling interests — LP units
|
(357
|
)
|
863
|
|
994
|
|
|||||
|
Net (income) loss attributable to non-controlling interests
|
(412
|
)
|
66
|
|
216
|
|
|||||
|
Net income (loss) attributable to Brandywine Realty Trust
|
42,777
|
|
6,595
|
|
(4,499
|
)
|
|||||
|
Distribution to Preferred Shares
|
(6,900
|
)
|
(10,405
|
)
|
(7,992
|
)
|
|||||
|
Preferred share redemption charge
|
—
|
|
(4,052
|
)
|
—
|
|
|||||
|
Amount allocated to unvested restricted shareholders
|
(363
|
)
|
(376
|
)
|
(505
|
)
|
|||||
|
Net income (loss) attributable to Common Shareholders of Brandywine Realty Trust
|
$
|
35,514
|
|
$
|
(8,238
|
)
|
$
|
(12,996
|
)
|
||
|
Basic income (loss) per Common Share:
|
|
|
|||||||||
|
Continuing operations
|
$
|
0.20
|
|
$
|
(0.36
|
)
|
$
|
(0.24
|
)
|
||
|
Discontinued operations
|
0.03
|
|
0.30
|
|
0.14
|
|
|||||
|
|
$
|
0.23
|
|
$
|
(0.06
|
)
|
$
|
(0.10
|
)
|
||
|
Diluted income (loss) per Common Share:
|
|
|
|
||||||||
|
Continuing operations
|
$
|
0.20
|
|
$
|
(0.36
|
)
|
$
|
(0.24
|
)
|
||
|
Discontinued operations
|
0.03
|
|
0.30
|
|
0.14
|
|
|||||
|
|
$
|
0.23
|
|
$
|
(0.06
|
)
|
$
|
(0.10
|
)
|
||
|
Basic weighted average shares outstanding
|
153,140,458
|
|
143,257,097
|
|
135,444,424
|
|
|||||
|
Diluted weighted average shares outstanding
|
154,414,311
|
|
143,257,097
|
|
135,444,424
|
|
|||||
|
Net income (loss) attributable to Brandywine Realty Trust
|
|
|
|||||||||
|
Income (loss) from continuing operations
|
$
|
38,625
|
|
$
|
(36,446
|
)
|
$
|
(23,562
|
)
|
||
|
Income from discontinued operations
|
4,152
|
|
43,041
|
|
19,063
|
|
|||||
|
Net income (loss)
|
$
|
42,777
|
|
$
|
6,595
|
|
$
|
(4,499
|
)
|
||
The accompanying notes are an integral part of these consolidated financial statements.
F- 4
BRANDYWINE REALTY TRUST
CONSOLIDATED STATEMENTS OF COMPREHENSIVE INCOME
(in thousands)
|
Years ended December 31,
|
|||||||||||
|
|
2013
|
2012
|
2011
|
||||||||
|
Net income (loss)
|
$
|
43,189
|
|
$
|
6,529
|
|
$
|
(4,715
|
)
|
||
|
Comprehensive income (loss):
|
|
|
|
||||||||
|
Unrealized gain (loss) on derivative financial instruments
|
12,789
|
|
(7,338
|
)
|
(4,499
|
)
|
|||||
|
Settlement of interest rate swaps
|
—
|
|
(2,985
|
)
|
—
|
|
|||||
|
Reclassification of realized losses on derivative financial instruments to operations, net (1)
|
286
|
|
297
|
|
153
|
|
|||||
|
Total comprehensive income (loss)
|
13,075
|
|
(10,026
|
)
|
(4,346
|
)
|
|||||
|
Comprehensive income (loss)
|
56,264
|
|
(3,497
|
)
|
(9,061
|
)
|
|||||
|
Comprehensive income (loss) attributable to non-controlling interest
|
(564
|
)
|
261
|
|
427
|
|
|||||
|
Comprehensive income (loss) attributable to Brandywine Realty Trust
|
$
|
55,700
|
|
$
|
(3,236
|
)
|
$
|
(8,634
|
)
|
||
(1) Amounts reclassified from comprehensive income to interest expense within the Consolidated Statements of Operations.
The accompanying notes are an integral part of these consolidated financial statements.
F- 5
BRANDYWINE REALTY TRUST
CONSOLIDATED STATEMENTS OF BENEFICIARIES’ EQUITY
For the
Years ended December 31, 2013, 2012 and 2011
(in thousands, except number of shares)
December 31, 2011
|
Number of
Preferred Shares
|
Par Value of
Preferred
Shares
|
Number of Common
Shares
|
Number of
Treasury
Shares
|
Number of Rabbi
Trust/Deferred
Compensation
Shares
|
Common Shares of
Brandywine Realty
Trust’s beneficial
interest
|
Additional Paid-in
Capital
|
Common Shares
in Treasury
|
Deferred
Compensation
Payable in
Common Shares
|
Common Shares in
Grantor Trust
|
Cumulative
Earnings
|
Accumulated Other
Comprehensive
Income (Loss)
|
Cumulative
Distributions
|
Non-Controlling
Interests
|
Total
|
|||||||||||||||||||||||||||||||||||||||||
|
December 31, 2010
|
4,300,000
|
|
$
|
43
|
|
134,601,796
|
|
116,679
|
|
291,281
|
|
$
|
1,343
|
|
$
|
2,671,217
|
|
$
|
(3,074
|
)
|
$
|
5,774
|
|
$
|
(5,774
|
)
|
$
|
483,439
|
|
$
|
(1,945
|
)
|
$
|
(1,301,521
|
)
|
$
|
128,272
|
|
$
|
1,977,774
|
|
||||||||||||||
|
Net loss
|
|
|
|
|
|
|
|
|
|
|
(4,500
|
)
|
|
|
(215
|
)
|
(4,715
|
)
|
|||||||||||||||||||||||||||||||||||||
|
Comprehensive loss
|
|
|
|
|
|
|
|
|
|
|
|
(4,134
|
)
|
|
(212
|
)
|
(4,346
|
)
|
|||||||||||||||||||||||||||||||||||||
|
Issuance of Common Shares of Beneficial Interest
|
|
|
679,285
|
|
|
|
7
|
|
8,265
|
|
|
|
|
|
|
|
|
8,272
|
|
||||||||||||||||||||||||||||||||||||
|
Equity Issuance Costs
|
|
|
|
|
|
|
(345
|
)
|
|
|
|
|
|
|
(32
|
)
|
(377
|
)
|
|||||||||||||||||||||||||||||||||||||
|
Conversion of LP Units to Common Shares
|
|
|
7,204,104
|
|
|
|
72
|
|
85,966
|
|
|
|
|
|
|
|
(86,038
|
)
|
—
|
|
|||||||||||||||||||||||||||||||||||
|
Bonus Share Issuance
|
|
|
|
|
(463
|
)
|
463
|
|
|
|
|
|
12
|
|
6
|
|
(6
|
)
|
(6
|
)
|
|
|
|
|
6
|
|
|||||||||||||||||||||||||||||
|
Vesting of Restricted Shares
|
|
|
85,248
|
|
(116,216
|
)
|
9,043
|
|
1
|
|
(1,818
|
)
|
3,062
|
|
|
|
|
|
(1,595
|
)
|
|
|
|
(350
|
)
|
||||||||||||||||||||||||||||||
|
Restricted Share Amortization
|
|
|
|
|
|
|
|
|
|
|
2,937
|
|
|
|
|
|
|
|
|
|
|
2,937
|
|
||||||||||||||||||||||||||||||||
|
Restricted Performance Units Amortization
|
|
|
|
|
|
|
1,679
|
|
|
|
|
|
|
|
|
1,679
|
|
||||||||||||||||||||||||||||||||||||||
|
Exercise of Share Options
|
120,179
|
|
1
|
|
349
|
|
350
|
|
|||||||||||||||||||||||||||||||||||||||||||||||
|
Share Option Amortization
|
|
|
|
|
|
|
1,487
|
|
|
|
|
|
|
|
|
1,487
|
|
||||||||||||||||||||||||||||||||||||||
|
Outperformance Plan Amortization
|
|
|
|
|
|
|
|
|
123
|
|
|
|
|
|
|
|
|
123
|
|
||||||||||||||||||||||||||||||||||||
|
Share Issuance from/to Deferred Compensation Plan
|
|
|
(845
|
)
|
|
(8,141
|
)
|
|
(16
|
)
|
|
(149
|
)
|
149
|
|
|
|
(16
|
)
|
||||||||||||||||||||||||||||||||||||
|
Share Choice Plan Issuance
|
|
|
(1,684
|
)
|
|
|
|
(55
|
)
|
|
|
|
|
|
|
|
(55
|
)
|
|||||||||||||||||||||||||||||||||||||
|
Trustees Fees Paid in Shares
|
2,672
|
|
32
|
|
32
|
|
|||||||||||||||||||||||||||||||||||||||||||||||||
|
Adjustment to Non-controlling Interest
|
|
|
|
|
|
|
|
|
6,376
|
|
|
|
|
|
|
|
|
|
(6,376
|
)
|
—
|
|
|||||||||||||||||||||||||||||||||
|
Preferred Share distributions
|
|
|
|
|
|
|
|
|
|
|
|
|
|
|
(7,992
|
)
|
|
(7,992
|
)
|
||||||||||||||||||||||||||||||||||||
|
Distributions declared ($0.60 per share)
|
|
|
|
|
|
|
|
|
|
|
|
|
|
|
(82,819
|
)
|
(2,294
|
)
|
(85,113
|
)
|
|||||||||||||||||||||||||||||||||||
|
BALANCE, December 31, 2011
|
4,300,000
|
|
$
|
43
|
|
142,690,755
|
|
—
|
|
292,646
|
|
$
|
1,424
|
|
$
|
2,776,197
|
|
$
|
—
|
|
$
|
5,631
|
|
$
|
(5,631
|
)
|
$
|
477,338
|
|
$
|
(6,079
|
)
|
$
|
(1,392,332
|
)
|
$
|
33,105
|
|
$
|
1,889,696
|
|
||||||||||||||
The accompanying notes are an integral part of these consolidated financial statements.
F- 6
December 31, 2012
|
Number of
Preferred Shares
|
Par Value of
Preferred
Shares
|
Number of Common
Shares
|
Number of
Treasury
Shares
|
Number of Rabbi
Trust/Deferred
Compensation
Shares
|
Common Shares of
Brandywine Realty
Trust’s beneficial
interest
|
Additional Paid-in
Capital
|
Common Shares
in Treasury
|
Deferred
Compensation
Payable in
Common Shares
|
Common Shares in
Grantor Trust
|
Cumulative
Earnings
|
Accumulated Other
Comprehensive
Income (Loss)
|
Cumulative
Distributions
|
Non-Controlling
Interests
|
Total
|
|||||||||||||||||||||||||||||||||||||||||
|
BALANCE, December 31, 2011
|
4,300,000
|
|
$
|
43
|
|
142,690,755
|
|
—
|
|
292,646
|
|
$
|
1,424
|
|
$
|
2,776,197
|
|
$
|
—
|
|
$
|
5,631
|
|
$
|
(5,631
|
)
|
$
|
477,338
|
|
$
|
(6,079
|
)
|
$
|
(1,392,332
|
)
|
$
|
33,105
|
|
$
|
1,889,696
|
|
||||||||||||||
|
Net income
|
|
|
|
|
|
|
|
|
|
|
6,595
|
|
|
|
(66
|
)
|
6,529
|
|
|||||||||||||||||||||||||||||||||||||
|
Comprehensive loss
|
|
|
|
|
|
|
|
|
|
|
|
(9,839
|
)
|
|
(187
|
)
|
(10,026
|
)
|
|||||||||||||||||||||||||||||||||||||
|
Issuance of Preferred Shares
|
4,000,000
|
|
40
|
|
96,810
|
|
96,850
|
|
|||||||||||||||||||||||||||||||||||||||||||||||
|
Preferred Share Issuance Costs
|
|
|
|
|
(613
|
)
|
|
|
|
|
|
|
(613
|
)
|
|||||||||||||||||||||||||||||||||||||||||
|
Redemption of Preferred Shares
|
(4,300,000
|
)
|
(43
|
)
|
(103,405
|
)
|
(103,448
|
)
|
|||||||||||||||||||||||||||||||||||||||||||||||
|
Conversion of LP Units to Common Shares
|
|
|
20,464
|
|
|
|
1
|
|
149
|
|
|
|
|
(49
|
)
|
|
|
(268
|
)
|
(167
|
)
|
||||||||||||||||||||||||||||||||||
|
Conversion of LP Units to Cash
|
(4,185
|
)
|
(5,556
|
)
|
(9,741
|
)
|
|||||||||||||||||||||||||||||||||||||||||||||||||
|
Bonus Share Issuance
|
|
|
35,703
|
|
|
387
|
|
|
|
|
387
|
|
|||||||||||||||||||||||||||||||||||||||||||
|
Vesting of Restricted Shares
|
|
|
293,614
|
|
9,036
|
|
4
|
|
(1,389
|
)
|
|
|
|
|
|
(1,385
|
)
|
||||||||||||||||||||||||||||||||||||||
|
Restricted Share Amortization
|
|
|
|
|
|
|
3,271
|
|
|
|
|
|
|
|
|
3,271
|
|
||||||||||||||||||||||||||||||||||||||
|
Restricted Share Forfeitures
|
35
|
|
35
|
|
|||||||||||||||||||||||||||||||||||||||||||||||||||
|
Vesting of Restricted Performance Units
|
272,131
|
|
3
|
|
(1,498
|
)
|
(1,495
|
)
|
|||||||||||||||||||||||||||||||||||||||||||||||
|
Restricted Performance Units Amortization
|
|
|
|
|
|
3,379
|
|
|
|
|
|
|
|
|
3,379
|
|
|||||||||||||||||||||||||||||||||||||||
|
Exercise of Share Options
|
|
|
230,294
|
|
|
|
2
|
|
974
|
|
|
|
|
|
|
|
|
976
|
|
||||||||||||||||||||||||||||||||||||
|
Share Option Amortization
|
|
|
|
|
|
1,636
|
|
|
|
|
|
|
|
|
1,636
|
|
|||||||||||||||||||||||||||||||||||||||
|
Share Issuance from/to Deferred Compensation Plan
|
|
|
(5,564
|
)
|
|
(10,937
|
)
|
|
|
(279
|
)
|
279
|
|
|
|
|
|
—
|
|
||||||||||||||||||||||||||||||||||||
|
Trustee Fees Paid in Shares
|
|
|
1,336
|
|
|
|
|
15
|
|
|
|
|
|
|
|
|
15
|
|
|||||||||||||||||||||||||||||||||||||
|
Adjustment to Non-controlling Interest
|
|
|
|
|
|
|
4,281
|
|
|
|
|
|
|
|
(4,281
|
)
|
—
|
|
|||||||||||||||||||||||||||||||||||||
|
Preferred Share distributions
|
|
|
|
|
|
|
|
|
|
|
|
|
(10,405
|
)
|
|
(10,405
|
)
|
||||||||||||||||||||||||||||||||||||||
|
Preferred Share redemption charges
|
(4,052
|
)
|
(4,052
|
)
|
|||||||||||||||||||||||||||||||||||||||||||||||||||
|
Distributions declared ($0.60 per share)
|
|
|
|
|
|
|
|
|
|
|
|
|
(86,417
|
)
|
(1,509
|
)
|
(87,926
|
)
|
|||||||||||||||||||||||||||||||||||||
|
BALANCE, December 31, 2012
|
4,000,000
|
|
$
|
40
|
|
143,538,733
|
|
—
|
|
290,745
|
|
$
|
1,434
|
|
$
|
2,780,194
|
|
$
|
—
|
|
$
|
5,352
|
|
$
|
(5,352
|
)
|
$
|
479,734
|
|
$
|
(15,918
|
)
|
$
|
(1,493,206
|
)
|
$
|
21,238
|
|
$
|
1,773,516
|
|
||||||||||||||
The accompanying notes are an integral part of these consolidated financial statements.
F- 7
December 31, 2013
|
Number of
Preferred Shares
|
Par Value of
Preferred
Shares
|
Number of Common
Shares
|
Number of Rabbi
Trust/Deferred
Compensation
Shares
|
Common Shares of
Brandywine Realty
Trust’s beneficial
interest
|
Additional Paid-in
Capital
|
Deferred
Compensation
Payable in
Common Shares
|
Common Shares in
Grantor Trust
|
Cumulative
Earnings
|
Accumulated Other
Comprehensive
Income (Loss)
|
Cumulative
Distributions
|
Non-Controlling
Interests
|
Total
|
||||||||||||||||||||||||||||||||||||
|
BALANCE, December 31, 2012
|
4,000,000
|
|
$
|
40
|
|
143,538,733
|
|
290,745
|
|
$
|
1,434
|
|
$
|
2,780,194
|
|
$
|
5,352
|
|
$
|
(5,352
|
)
|
$
|
479,734
|
|
$
|
(15,918
|
)
|
$
|
(1,493,206
|
)
|
$
|
21,238
|
|
$
|
1,773,516
|
|
||||||||||||
|
Net income
|
|
|
|
|
|
|
|
|
42,777
|
|
|
|
412
|
|
43,189
|
|
||||||||||||||||||||||||||||||||
|
Comprehensive income
|
|
|
|
|
|
|
|
|
|
12,923
|
|
|
152
|
|
13,075
|
|
||||||||||||||||||||||||||||||||
|
Issuance of Common Shares of Beneficial Interest
|
|
|
12,650,000
|
|
|
127
|
|
181,907
|
|
|
|
|
|
|
|
182,034
|
|
|||||||||||||||||||||||||||||||
|
Issuance of Partnership Interest in Real Estate Venture
|
946
|
|
946
|
|
||||||||||||||||||||||||||||||||||||||||||||
|
Equity issuance costs
|
|
|
|
|
|
(744
|
)
|
|
|
|
|
|
(744
|
)
|
||||||||||||||||||||||||||||||||||
|
Conversion of LP Units to Common Shares
|
|
|
81,998
|
|
|
1
|
|
1,239
|
|
|
|
|
|
|
|
(1,240
|
)
|
—
|
|
|||||||||||||||||||||||||||||
|
Bonus Share Issuance
|
|
|
27,918
|
|
|
361
|
|
|
|
|
361
|
|
||||||||||||||||||||||||||||||||||||
|
Vesting of Restricted Shares
|
|
|
147,495
|
|
7,050
|
|
2
|
|
(904
|
)
|
|
|
|
|
|
(902
|
)
|
|||||||||||||||||||||||||||||||
|
Restricted Share Amortization
|
|
|
|
|
|
3,079
|
|
|
|
|
|
|
|
3,079
|
|
|||||||||||||||||||||||||||||||||
|
Vesting of Restricted Performance Units
|
53,134
|
|
27,067
|
|
1
|
|
(160
|
)
|
(159
|
)
|
||||||||||||||||||||||||||||||||||||||
|
Restricted Performance Units Amortization
|
4,333
|
|
4,333
|
|
||||||||||||||||||||||||||||||||||||||||||||
|
Restricted Share Forfeitures
|
|
|
|
|
|
|
17
|
|
|
|
|
17
|
|
|||||||||||||||||||||||||||||||||||
|
Exercise of Stock Options
|
|
|
236,318
|
|
|
1
|
|
2,379
|
|
|
|
|
|
|
|
2,380
|
|
|||||||||||||||||||||||||||||||
|
Stock Option Amortization
|
|
|
|
|
670
|
|
|
|
|
|
|
|
670
|
|
||||||||||||||||||||||||||||||||||
|
Share Issuance from/to Deferred Compensation Plan
|
|
|
(5,012
|
)
|
(12,583
|
)
|
|
55
|
|
(55
|
)
|
|
|
|
|
—
|
|
|||||||||||||||||||||||||||||||
|
Trustee Fees Paid in Shares
|
|
|
1,409
|
|
|
|
20
|
|
|
|
|
|
|
|
20
|
|
||||||||||||||||||||||||||||||||
|
Adjustment to Non-controlling Interest
|
|
|
|
|
|
(778
|
)
|
|
|
|
|
|
778
|
|
—
|
|
||||||||||||||||||||||||||||||||
|
Preferred Share distributions
|
|
|
|
|
|
|
|
|
|
|
(6,900
|
)
|
|
(6,900
|
)
|
|||||||||||||||||||||||||||||||||
|
Distributions declared ($0.60 per share)
|
|
|
|
|
|
|
|
|
|
|
(92,409
|
)
|
(1,071
|
)
|
(93,480
|
)
|
||||||||||||||||||||||||||||||||
|
BALANCE, December 31, 2013
|
4,000,000
|
|
$
|
40
|
|
156,731,993
|
|
312,279
|
|
$
|
1,566
|
|
$
|
2,971,596
|
|
$
|
5,407
|
|
$
|
(5,407
|
)
|
$
|
522,528
|
|
$
|
(2,995
|
)
|
$
|
(1,592,515
|
)
|
$
|
21,215
|
|
$
|
1,921,435
|
|
||||||||||||
The accompanying notes are an integral part of these consolidated financial statements.
F- 8
BRANDYWINE REALTY TRUST
(in thousands)
|
Years ended December 31,
|
|||||||||||
|
|
2013
|
2012
|
2011
|
||||||||
|
Cash flows from operating activities:
|
|
|
|||||||||
|
Net income (loss)
|
$
|
43,189
|
|
$
|
6,529
|
|
$
|
(4,715
|
)
|
||
|
Adjustments to reconcile net income (loss) to net cash from operating activities:
|
|
|
|||||||||
|
Depreciation and amortization
|
198,731
|
|
198,579
|
|
219,110
|
|
|||||
|
Amortization of deferred financing costs
|
4,676
|
|
6,208
|
|
4,991
|
|
|||||
|
Amortization of debt discount/(premium), net
|
2,480
|
|
1,760
|
|
1,567
|
|
|||||
|
Amortization of stock compensation costs
|
6,998
|
|
5,685
|
|
5,282
|
|
|||||
|
Shares used for employee taxes upon vesting of share awards
|
(1,062
|
)
|
(2,493
|
)
|
(1,012
|
)
|
|||||
|
Recognized hedge activity
|
—
|
|
2,985
|
|
—
|
|
|||||
|
Straight-line rent income
|
(20,136
|
)
|
(23,566
|
)
|
(20,298
|
)
|
|||||
|
Amortization of acquired above (below) market leases, net
|
(7,170
|
)
|
(6,084
|
)
|
(5,384
|
)
|
|||||
|
Straight-line ground rent expense
|
1,509
|
|
1,897
|
|
1,924
|
|
|||||
|
Provision for doubtful accounts
|
2,467
|
|
2,198
|
|
1,924
|
|
|||||
|
Net gain on sale of interests in real estate
|
(29,166
|
)
|
(34,774
|
)
|
(10,008
|
)
|
|||||
|
Loss on real estate venture formation
|
—
|
|
950
|
|
222
|
|
|||||
|
Net gain on real estate venture transaction
|
(3,683
|
)
|
—
|
|
—
|
|
|||||
|
Net gain from remeasurement of investment in a real estate venture
|
(6,866
|
)
|
—
|
|
—
|
|
|||||
|
Loss on early extinguishment of debt
|
2,119
|
|
22,002
|
|
2,776
|
|
|||||
|
Historic tax credit transaction income
|
(11,853
|
)
|
(11,840
|
)
|
(12,026
|
)
|
|||||
|
Real estate venture income in excess of distributions
|
(2,014
|
)
|
(1,517
|
)
|
(1,175
|
)
|
|||||
|
Cumulative interest accretion of repayments of unsecured notes
|
—
|
|
—
|
|
(4,005
|
)
|
|||||
|
Contributions from historic tax credit transaction, net of deferred costs
|
—
|
|
—
|
|
2,694
|
|
|||||
|
Deferred financing obligation
|
(974
|
)
|
(1,803
|
)
|
—
|
|
|||||
|
Changes in assets and liabilities:
|
|
||||||||||
|
Accounts receivable
|
(4,048
|
)
|
262
|
|
(856
|
)
|
|||||
|
Other assets
|
5,440
|
|
4,244
|
|
(3,851
|
)
|
|||||
|
Accounts payable and accrued expenses
|
(526
|
)
|
(8,355
|
)
|
7,732
|
|
|||||
|
Deferred income, gains and rent
|
3,758
|
|
(2,167
|
)
|
(7,220
|
)
|
|||||
|
Other liabilities
|
(385
|
)
|
(1,590
|
)
|
(425
|
)
|
|||||
|
Net cash from operating activities
|
183,484
|
|
159,110
|
|
177,247
|
|
|||||
|
Cash flows from investing activities:
|
|
|
|||||||||
|
Acquisition of properties
|
(161,604
|
)
|
(77,555
|
)
|
(40,674
|
)
|
|||||
|
Investments in available-for-sale securities
|
—
|
|
(105,250
|
)
|
—
|
|
|||||
|
Proceeds from the sale of available-for-sale securities
|
—
|
|
105,250
|
|
—
|
|
|||||
|
Sales of properties, net
|
423,480
|
|
170,918
|
|
155,956
|
|
|||||
|
Distribution of sales proceeds from real estate venture
|
16,963
|
|
—
|
|
—
|
|
|||||
|
Proceeds from repayment of mortgage notes receivable
|
200
|
|
23,364
|
|
—
|
|
|||||
|
Capital expenditures for tenant improvements
|
(109,357
|
)
|
(86,986
|
)
|
(130,482
|
)
|
|||||
|
Capital expenditures for redevelopments
|
(6,265
|
)
|
(11,964
|
)
|
(674
|
)
|
|||||
|
Capital expenditures for developments
|
(5,490
|
)
|
(162
|
)
|
—
|
|
|||||
|
Reimbursement from real estate venture for pre-formation development costs
|
1,976
|
|
—
|
|
—
|
|
|||||
|
Advances for purchase of tenant assets, net of repayments
|
(127
|
)
|
270
|
|
1,365
|
|
|||||
|
Loan proceeds received from an unconsolidated joint venture
|
—
|
|
566
|
|
1,388
|
|
|||||
|
Loan provided to an unconsolidated real estate venture partner
|
—
|
|
—
|
|
(1,122
|
)
|
|||||
|
Investment in unconsolidated Real Estate Ventures
|
(33,069
|
)
|
(65,354
|
)
|
(5,277
|
)
|
|||||
|
Escrowed cash
|
1,902
|
|
(1,827
|
)
|
1,502
|
|
|||||
|
Cash distributions from unconsolidated Real Estate Ventures in excess of cumulative equity income
|
7,496
|
|
5,109
|
|
10,316
|
|
|||||
|
Leasing costs
|
(31,397
|
)
|
(31,243
|
)
|
(38,461
|
)
|
|||||
|
Net cash from (used in) investing activities
|
104,708
|
|
(74,864
|
)
|
(46,163
|
)
|
|||||
|
Cash flows from financing activities:
|
|
|
|||||||||
|
Proceeds from Unsecured Term Loans
|
—
|
|
600,000
|
|
—
|
|
|||||
|
Proceeds from Credit Facility borrowings
|
186,000
|
|
90,500
|
|
706,002
|
|
|||||
|
Repayments of Credit Facility borrowings
|
(255,000
|
)
|
(297,000
|
)
|
(613,502
|
)
|
|||||
|
Repayments of mortgage notes payable
|
(11,268
|
)
|
(68,513
|
)
|
(221,856
|
)
|
|||||
F- 9
|
Proceeds from unsecured notes
|
—
|
|
248,183
|
|
321,448
|
|
|||||
|
Deferred financing obligation interest expense
|
—
|
|
935
|
|
—
|
|
|||||
|
Net proceeds from issuance of common shares
|
181,527
|
|
—
|
|
7,930
|
|
|||||
|
Net proceeds from issuance of preferred shares
|
—
|
|
96,237
|
|
—
|
|
|||||
|
Redemption of preferred shares
|
—
|
|
(108,536
|
)
|
—
|
|
|||||
|
Redemption of partnership units
|
—
|
|
(9,676
|
)
|
—
|
|
|||||
|
Repayments of unsecured notes
|
(31,369
|
)
|
(338,097
|
)
|
(105,381
|
)
|
|||||
|
Repayments of unsecured term loan
|
—
|
|
(190,485
|
)
|
(145,500
|
)
|
|||||
|
Net settlement of hedge transactions
|
—
|
|
—
|
|
(613
|
)
|
|||||
|
Debt financing costs
|
(355
|
)
|
(10,128
|
)
|
(4,249
|
)
|
|||||
|
Exercise of stock options
|
2,381
|
|
976
|
|
350
|
|
|||||
|
Distributions paid to shareholders
|
(97,367
|
)
|
(96,030
|
)
|
(89,559
|
)
|
|||||
|
Distributions to noncontrolling interest
|
(1,083
|
)
|
(1,473
|
)
|
(2,309
|
)
|
|||||
|
Net cash from (used in) financing activities
|
(26,534
|
)
|
(83,107
|
)
|
(147,239
|
)
|
|||||
|
Increase (decrease) in cash and cash equivalents
|
261,658
|
|
1,139
|
|
(16,155
|
)
|
|||||
|
Cash and cash equivalents at beginning of year
|
1,549
|
|
410
|
|
16,565
|
|
|||||
|
Cash and cash equivalents at end of year
|
$
|
263,207
|
|
$
|
1,549
|
|
$
|
410
|
|
||
|
Supplemental disclosure:
|
|
|
|||||||||
|
Cash paid for interest, net of capitalized interest during the years ended December 31, 2013, 2012, and 2011 of $3,137, $2,560, and $1,997, respectively
|
$
|
118,714
|
|
$
|
137,823
|
|
$
|
135,210
|
|
||
|
Supplemental disclosure of non-cash activity:
|
|
|
|
|
|||||||
|
—
|
|
—
|
|
||||||||
|
Change in operating real estate related to a non-cash acquisition of an operating property
|
(21,649
|
)
|
—
|
|
—
|
|
|||||
|
Change in intangible assets, net related to non-cash acquisition of an operating property
|
(3,517
|
)
|
—
|
|
—
|
|
|||||
|
Change in acquired lease intangibles, net related to non-cash acquisition of an operating property
|
462
|
|
—
|
|
—
|
|
|||||
|
Change in investments in joint venture related to non-cash acquisition of property
|
13,040
|
|
—
|
|
—
|
|
|||||
|
Change in investments in joint venture related to non-cash disposition of property
|
(17,628
|
)
|
—
|
|
—
|
|
|||||
|
Change in operating real estate related to non-cash adjustment to land
|
7,752
|
|
—
|
|
—
|
|
|||||
|
Change in mortgage notes payable related to acquisition of an operating property
|
238,082
|
|
—
|
|
—
|
|
|||||
|
Change in investments in joint venture related to a contribution of land at period end
|
(6,058
|
)
|
(15,222
|
)
|
—
|
|
|||||
|
Change in investments in joint venture related to a contribution of services
|
—
|
|
(711
|
)
|
—
|
|
|||||
|
Change in capital expenditures financed through accounts payable at period end
|
11,703
|
|
7,059
|
|
(3,896
|
)
|
|||||
|
Change in capital expenditures financed through retention payable at period end
|
(204
|
)
|
566
|
|
(6,213
|
)
|
|||||
|
Change in unfunded tenant allowance
|
(969
|
)
|
(1,089
|
)
|
(1,717
|
)
|
|||||
The accompanying notes are an integral part of these consolidated financial statements.
F- 10
BRANDYWINE OPERATING PARTNERSHIP, L.P.
CONSOLIDATED BALANCE SHEETS
(in thousands, except unit and per unit information)
|
December 31,
2013 |
December 31,
2012 |
||||||
|
|
|||||||
|
ASSETS
|
|
|
|||||
|
Real estate investments:
|
|
|
|||||
|
Operating properties
|
$
|
4,669,289
|
|
$
|
4,726,169
|
|
|
|
Accumulated depreciation
|
(983,808
|
)
|
(954,665
|
)
|
|||
|
Operating real estate investments, net
|
3,685,481
|
|
3,771,504
|
|
|||
|
Construction-in-progress
|
74,174
|
|
48,950
|
|
|||
|
Land inventory
|
93,351
|
|
102,439
|
|
|||
|
Total real estate investments, net
|
3,853,006
|
|
3,922,893
|
|
|||
|
Cash and cash equivalents
|
263,207
|
|
1,549
|
|
|||
|
Accounts receivable, net
|
17,389
|
|
13,232
|
|
|||
|
Accrued rent receivable, net
|
126,295
|
|
122,066
|
|
|||
|
Investment in real estate ventures, at equity
|
180,512
|
|
193,555
|
|
|||
|
Deferred costs, net
|
122,954
|
|
122,243
|
|
|||
|
Intangible assets, net
|
132,329
|
|
70,620
|
|
|||
|
Notes receivable
|
7,026
|
|
7,226
|
|
|||
|
Other assets
|
62,377
|
|
53,325
|
|
|||
|
Total assets
|
$
|
4,765,095
|
|
$
|
4,506,709
|
|
|
|
LIABILITIES AND PARTNERS' EQUITY
|
|
|
|||||
|
Mortgage notes payable
|
$
|
670,151
|
|
$
|
442,974
|
|
|
|
Unsecured credit facility
|
—
|
|
69,000
|
|
|||
|
Unsecured term loans
|
450,000
|
|
450,000
|
|
|||
|
Unsecured senior notes, net of discounts
|
1,475,230
|
|
1,503,356
|
|
|||
|
Accounts payable and accrued expenses
|
83,693
|
|
71,579
|
|
|||
|
Distributions payable
|
25,584
|
|
23,652
|
|
|||
|
Deferred income, gains and rent
|
71,635
|
|
82,947
|
|
|||
|
Acquired lease intangibles, net
|
34,444
|
|
33,859
|
|
|||
|
Other liabilities
|
32,923
|
|
55,826
|
|
|||
|
Total liabilities
|
2,843,660
|
|
2,733,193
|
|
|||
|
Commitments and contingencies (Note 20)
|
|
|
|||||
|
Redeemable limited partnership units at redemption value; 1,763,739 and 1,845,737 issued and outstanding in 2013 and 2012, respectively
|
26,486
|
|
26,777
|
|
|||
|
Brandywine Operating Partnership, L.P.’s equity:
|
|
|
|||||
|
6.90% Series E-Linked Preferred Mirror Units; issued and outstanding- 4,000,000 in 2013 and 2012
|
96,850
|
|
96,850
|
|
|||
|
General Partnership Capital, 156,731,993 and 143,538,733 units issued and outstanding in 2013 and 2012, respectively
|
1,800,530
|
|
1,666,341
|
|
|||
|
Accumulated other comprehensive loss
|
(3,377
|
)
|
(16,452
|
)
|
|||
|
Total Brandywine Operating Partnership, L.P.’s equity
|
1,894,003
|
|
1,746,739
|
|
|||
|
Non-controlling interest — consolidated real estate ventures
|
946
|
|
—
|
|
|||
|
Total parters' equity
|
1,894,949
|
|
1,746,739
|
|
|||
|
Total liabilities and partners’ equity
|
$
|
4,765,095
|
|
$
|
4,506,709
|
|
|
The accompanying notes are an integral part of these consolidated financial statements.
F- 11
BRANDYWINE OPERATING PARTNERSHIP, L.P.
CONSOLIDATED STATEMENTS OF OPERATIONS
(in thousands, except unit and per unit information)
|
Years ended December 31,
|
|||||||||||
|
|
2013
|
2012
|
2011
|
||||||||
|
Revenue:
|
|
||||||||||
|
Rents
|
$
|
461,387
|
|
$
|
437,560
|
|
$
|
441,329
|
|
||
|
Tenant reimbursements
|
79,087
|
|
77,060
|
|
77,404
|
|
|||||
|
Termination fees
|
4,497
|
|
3,233
|
|
2,951
|
|
|||||
|
Third party management fees, labor reimbursement and leasing
|
13,053
|
|
12,116
|
|
11,536
|
|
|||||
|
Other
|
4,186
|
|
5,710
|
|
5,348
|
|
|||||
|
Total revenue
|
562,210
|
|
535,679
|
|
538,568
|
|
|||||
|
Operating Expenses:
|
|
||||||||||
|
Property operating expenses
|
160,406
|
|
152,319
|
|
159,768
|
|
|||||
|
Real estate taxes
|
55,612
|
|
53,402
|
|
51,433
|
|
|||||
|
Third party management expenses
|
5,751
|
|
5,127
|
|
5,590
|
|
|||||
|
Depreciation and amortization
|
197,021
|
|
188,382
|
|
202,933
|
|
|||||
|
General & administrative expenses
|
27,628
|
|
25,413
|
|
24,602
|
|
|||||
|
Total operating expenses
|
446,418
|
|
424,643
|
|
444,326
|
|
|||||
|
Operating income
|
115,792
|
|
111,036
|
|
94,242
|
|
|||||
|
Other Income (Expense):
|
|
||||||||||
|
Interest income
|
1,044
|
|
3,008
|
|
1,810
|
|
|||||
|
Historic tax credit transaction income
|
11,853
|
|
11,840
|
|
12,026
|
|
|||||
|
Interest expense
|
(121,937
|
)
|
(132,939
|
)
|
(131,405
|
)
|
|||||
|
Interest expense — amortization of deferred financing costs
|
(4,676
|
)
|
(6,208
|
)
|
(4,991
|
)
|
|||||
|
Interest expense — financing obligation
|
(972
|
)
|
(850
|
)
|
—
|
|
|||||
|
Recognized hedge activity
|
—
|
|
(2,985
|
)
|
—
|
|
|||||
|
Equity in income of real estate ventures
|
3,664
|
|
2,741
|
|
3,775
|
|
|||||
|
Net gain from remeasurement of investments in real estate ventures
|
6,866
|
|
—
|
|
—
|
|
|||||
|
Net gain (loss) on sale of interests in real estate
|
—
|
|
—
|
|
2,985
|
|
|||||
|
Net loss on sale of undepreciated real estate
|
(137
|
)
|
—
|
|
—
|
|
|||||
|
Net gain (loss) on real estate venture transactions
|
29,604
|
|
(950
|
)
|
(222
|
)
|
|||||
|
Loss on early extinguishment of debt
|
(2,119
|
)
|
(22,002
|
)
|
(2,776
|
)
|
|||||
|
Income loss from continuing operations
|
38,982
|
|
(37,309
|
)
|
(24,556
|
)
|
|||||
|
Discontinued operations:
|
|
||||||||||
|
Income from discontinued operations
|
825
|
|
9,064
|
|
12,794
|
|
|||||
|
Net gain on disposition of discontinued operations
|
3,382
|
|
34,774
|
|
7,047
|
|
|||||
|
Total discontinued operations
|
4,207
|
|
43,838
|
|
19,841
|
|
|||||
|
Net income (loss)
|
43,189
|
|
6,529
|
|
(4,715
|
)
|
|||||
|
Distribution to Preferred Units
|
(6,900
|
)
|
(10,405
|
)
|
(7,992
|
)
|
|||||
|
Preferred unit redemption charge
|
—
|
|
(4,052
|
)
|
—
|
|
|||||
|
Amount allocated to unvested restricted unitholders
|
(363
|
)
|
(376
|
)
|
(505
|
)
|
|||||
|
Net income (loss )attributable to Common Partnership Unitholders of Brandywine Operating Partnership, L.P.
|
$
|
35,926
|
|
$
|
(8,304
|
)
|
$
|
(13,212
|
)
|
||
|
Basic income (loss) per Common Partnership Unit:
|
|
||||||||||
|
Continuing operations
|
$
|
0.20
|
|
$
|
(0.36
|
)
|
(0.23
|
)
|
|||
|
Discontinued operations
|
0.03
|
|
0.30
|
|
0.14
|
|
|||||
|
|
$
|
0.23
|
|
$
|
(0.06
|
)
|
$
|
(0.09
|
)
|
||
|
Diluted income (loss) per Common Partnership Unit:
|
|
||||||||||
|
Continuing operations
|
$
|
0.20
|
|
$
|
(0.36
|
)
|
$
|
(0.23
|
)
|
||
|
Discontinued operations
|
0.03
|
|
0.30
|
|
0.14
|
|
|||||
|
|
$
|
0.23
|
|
$
|
(0.06
|
)
|
$
|
(0.09
|
)
|
||
|
Basic weighted average common partnership units outstanding
|
154,929,545
|
|
145,883,217
|
|
145,118,841
|
|
|||||
|
Diluted weighted average common partnership units outstanding
|
156,203,398
|
|
145,883,217
|
|
145,118,841
|
|
|||||
|
Net income (loss) attributable to Brandywine Operating Partnership, L.P.
|
|
|
|||||||||
|
Loss from continuing operations
|
$
|
38,982
|
|
$
|
(37,309
|
)
|
$
|
(24,556
|
)
|
||
|
Income from discontinued operations
|
4,207
|
|
43,838
|
|
19,841
|
|
|||||
|
Net income (loss)
|
$
|
43,189
|
|
$
|
6,529
|
|
$
|
(4,715
|
)
|
||
The accompanying notes are an integral part of these consolidated financial statements.
F- 12
BRANDYWINE OPERATING PARTNERSHIP, L.P.
CONSOLIDATED STATEMENTS OF COMPREHENSIVE INCOME
(in thousands)
|
Years ended December 31,
|
|||||||||||
|
|
2013
|
2012
|
2011
|
||||||||
|
Net income (loss)
|
$
|
43,189
|
|
$
|
6,529
|
|
$
|
(4,715
|
)
|
||
|
Comprehensive income (loss):
|
|
|
|
||||||||
|
Unrealized income (loss) on derivative financial instruments
|
12,789
|
|
(7,338
|
)
|
(4,499
|
)
|
|||||
|
Settlement of interest rate swaps
|
—
|
|
(2,985
|
)
|
—
|
|
|||||
|
Reclassification of realized losses on derivative financial instruments to operations, net (1)
|
286
|
|
297
|
|
153
|
|
|||||
|
Total comprehensive income (loss)
|
13,075
|
|
(10,026
|
)
|
(4,346
|
)
|
|||||
|
Comprehensive income (loss) attributable to Brandywine Operating Partnership, L.P.
|
$
|
56,264
|
|
$
|
(3,497
|
)
|
$
|
(9,061
|
)
|
||
(1) Amounts reclassified from comprehensive income to interest expense within the Consolidated Statement of Operations.
The accompanying notes are an integral part of these consolidated financial statements.
F- 13
BRANDYWINE OPERATING PARTNERSHIP, L.P.
CONSOLIDATED STATEMENTS OF PARTNERS’ EQUITY
For the
Years ended December 31, 2013, 2012 and 2011
(in thousands, except Units)
|
|
Series D Preferred Mirror Units
|
Series E Preferred Mirror Units
|
Series E-Linked Preferred Mirror Units
|
General Partner Capital
|
Accumulated Other
Comprehensive Income
|
Non-controlling Interest
Consolidated Real
Estate Ventures
|
Total Partners’
Equity
|
||||||||||||||||||||||||||||||||
|
|
Units
|
Amount
|
Units
|
Amount
|
Units
|
Amount
|
Units
|
Amount
|
|||||||||||||||||||||||||||||||
|
BALANCE, December 31, 2010
|
2,000,000
|
|
47,912
|
|
2,300,000
|
|
55,538
|
|
—
|
|
—
|
|
134,485,117
|
|
1,743,549
|
|
(2,080
|
)
|
—
|
|
1,844,919
|
|
|||||||||||||||||
|
Net loss
|
—
|
|
—
|
|
—
|
|
—
|
|
—
|
|
—
|
|
—
|
|
(4,715
|
)
|
—
|
|
—
|
|
(4,715
|
)
|
|||||||||||||||||
|
Other comprehensive loss
|
—
|
|
—
|
|
—
|
|
—
|
|
—
|
|
—
|
|
—
|
|
—
|
|
(4,346
|
)
|
—
|
|
(4,346
|
)
|
|||||||||||||||||
|
Deferred compensation obligation
|
—
|
|
—
|
|
—
|
|
—
|
|
—
|
|
—
|
|
(845
|
)
|
(16
|
)
|
—
|
|
—
|
|
(16
|
)
|
|||||||||||||||||
|
Issuance of LP Units
|
—
|
|
—
|
|
—
|
|
—
|
|
—
|
|
—
|
|
679,285
|
|
8,272
|
|
—
|
|
—
|
|
8,272
|
|
|||||||||||||||||
|
Bonus share issuance
|
—
|
|
—
|
|
—
|
|
—
|
|
—
|
|
—
|
|
463
|
|
6
|
|
—
|
|
—
|
|
6
|
|
|||||||||||||||||
|
Conversion of LP Units to common shares
|
—
|
|
—
|
|
—
|
|
—
|
|
—
|
|
—
|
|
7,204,104
|
|
86,038
|
|
—
|
|
—
|
|
86,038
|
|
|||||||||||||||||
|
Share choice plan issuance
|
—
|
|
—
|
|
—
|
|
—
|
|
—
|
|
—
|
|
(1,684
|
)
|
(55
|
)
|
—
|
|
—
|
|
(55
|
)
|
|||||||||||||||||
|
Vesting of restricted units
|
—
|
|
—
|
|
—
|
|
—
|
|
—
|
|
—
|
|
201,464
|
|
(352
|
)
|
—
|
|
—
|
|
(352
|
)
|
|||||||||||||||||
|
Restricted stock amortization
|
—
|
|
—
|
|
—
|
|
—
|
|
—
|
|
—
|
|
—
|
|
2,937
|
|
—
|
|
—
|
|
2,937
|
|
|||||||||||||||||
|
Restricted performance units amortization
|
—
|
|
—
|
|
—
|
|
—
|
|
—
|
|
—
|
|
—
|
|
1,679
|
|
—
|
|
—
|
|
1,679
|
|
|||||||||||||||||
|
Outperformance plan amortization
|
—
|
|
—
|
|
—
|
|
—
|
|
—
|
|
—
|
|
—
|
|
123
|
|
—
|
|
—
|
|
123
|
|
|||||||||||||||||
|
Option amortization
|
—
|
|
—
|
|
—
|
|
—
|
|
—
|
|
—
|
|
—
|
|
1,487
|
|
—
|
|
—
|
|
1,487
|
|
|||||||||||||||||
|
Trustee fees paid in shares
|
—
|
|
—
|
|
—
|
|
—
|
|
—
|
|
—
|
|
2,672
|
|
32
|
|
—
|
|
—
|
|
32
|
|
|||||||||||||||||
|
Exercise of options
|
—
|
|
—
|
|
—
|
|
—
|
|
—
|
|
—
|
|
120,179
|
|
350
|
|
—
|
|
—
|
|
350
|
|
|||||||||||||||||
|
Adjustment of redeemable partnership units to liquidation value at period end
|
—
|
|
—
|
|
—
|
|
—
|
|
—
|
|
—
|
|
—
|
|
5,778
|
|
—
|
|
—
|
|
5,778
|
|
|||||||||||||||||
|
Distributions to Preferred Mirror Units
|
—
|
|
—
|
|
—
|
|
—
|
|
—
|
|
—
|
|
—
|
|
(7,992
|
)
|
—
|
|
—
|
|
(7,992
|
)
|
|||||||||||||||||
|
Distributions to general partnership unitholders
|
—
|
|
—
|
|
—
|
|
—
|
|
—
|
|
—
|
|
—
|
|
(82,819
|
)
|
—
|
|
—
|
|
(82,819
|
)
|
|||||||||||||||||
|
BALANCE, December 31, 2011
|
2,000,000
|
|
47,912
|
|
2,300,000
|
|
$
|
55,538
|
|
—
|
|
—
|
|
142,690,755
|
|
$
|
1,754,302
|
|
$
|
(6,426
|
)
|
$
|
—
|
|
$
|
1,851,326
|
|
||||||||||||
F- 14
|
|
Series D Preferred Mirror Units
|
Series E Preferred Mirror Units
|
Series E-Linked Preferred Mirror Units
|
General Partner Capital
|
Accumulated Other
Comprehensive Income
|
Non-controlling Interest
Consolidated Real
Estate Ventures
|
Total Partners’
Equity
|
||||||||||||||||||||||||||||||||
|
|
Units
|
Amount
|
Units
|
Amount
|
Units
|
Amount
|
Units
|
Amount
|
|||||||||||||||||||||||||||||||
|
Net income
|
—
|
|
—
|
|
—
|
|
—
|
|
—
|
|
—
|
|
—
|
|
6,529
|
|
—
|
|
—
|
|
6,529
|
|
|||||||||||||||||
|
Other comprehensive loss
|
—
|
|
—
|
|
—
|
|
—
|
|
—
|
|
—
|
|
—
|
|
—
|
|
(10,026
|
)
|
—
|
|
(10,026
|
)
|
|||||||||||||||||
|
Deferred compensation obligation
|
—
|
|
—
|
|
—
|
|
—
|
|
—
|
|
—
|
|
(5,564
|
)
|
—
|
|
—
|
|
—
|
|
—
|
|
|||||||||||||||||
|
Issuance of preferred units
|
—
|
|
—
|
|
—
|
|
—
|
|
4,000,000
|
|
96,850
|
|
—
|
|
—
|
|
—
|
|
—
|
|
96,850
|
|
|||||||||||||||||
|
Preferred unit issuance costs
|
—
|
|
—
|
|
—
|
|
—
|
|
—
|
|
—
|
|
—
|
|
(613
|
)
|
—
|
|
—
|
|
(613
|
)
|
|||||||||||||||||
|
Redemption of preferred units
|
(2,000,000
|
)
|
(47,912
|
)
|
(2,300,000
|
)
|
(55,538
|
)
|
—
|
|
—
|
|
—
|
|
—
|
|
—
|
|
—
|
|
(103,450
|
)
|
|||||||||||||||||
|
Bonus share issuance
|
—
|
|
—
|
|
—
|
|
—
|
|
—
|
|
—
|
|
35,703
|
|
387
|
|
—
|
|
—
|
|
387
|
|
|||||||||||||||||
|
Conversion of LP Units to common units
|
—
|
|
—
|
|
—
|
|
—
|
|
—
|
|
—
|
|
20,464
|
|
(49
|
)
|
—
|
|
—
|
|
(49
|
)
|
|||||||||||||||||
|
Conversion of LP Units to cash
|
—
|
|
—
|
|
—
|
|
—
|
|
—
|
|
—
|
|
—
|
|
(9,741
|
)
|
—
|
|
—
|
|
(9,741
|
)
|
|||||||||||||||||
|
Vesting of restricted units
|
—
|
|
—
|
|
—
|
|
—
|
|
—
|
|
—
|
|
293,614
|
|
(1,385
|
)
|
—
|
|
—
|
|
(1,385
|
)
|
|||||||||||||||||
|
Restricted stock amortization
|
—
|
|
—
|
|
—
|
|
—
|
|
—
|
|
—
|
|
—
|
|
3,271
|
|
—
|
|
—
|
|
3,271
|
|
|||||||||||||||||
|
Restricted stock forfeitures
|
—
|
|
—
|
|
—
|
|
—
|
|
—
|
|
—
|
|
—
|
|
35
|
|
—
|
|
—
|
|
35
|
|
|||||||||||||||||
|
Vesting of restricted performance units
|
—
|
|
—
|
|
—
|
|
—
|
|
—
|
|
—
|
|
272,131
|
|
(1,495
|
)
|
—
|
|
—
|
|
(1,495
|
)
|
|||||||||||||||||
|
Restricted performance units amortization
|
—
|
|
—
|
|
—
|
|
—
|
|
—
|
|
—
|
|
—
|
|
3,379
|
|
—
|
|
—
|
|
3,379
|
|
|||||||||||||||||
|
Option amortization
|
—
|
|
—
|
|
—
|
|
—
|
|
—
|
|
—
|
|
—
|
|
1,636
|
|
—
|
|
—
|
|
1,636
|
|
|||||||||||||||||
|
Trustee fees paid in shares
|
—
|
|
—
|
|
—
|
|
—
|
|
—
|
|
—
|
|
1,336
|
|
15
|
|
—
|
|
—
|
|
15
|
|
|||||||||||||||||
|
Exercise of options
|
—
|
|
—
|
|
—
|
|
—
|
|
—
|
|
—
|
|
230,294
|
|
976
|
|
—
|
|
—
|
|
976
|
|
|||||||||||||||||
|
Adjustment of redeemable partnership units to liquidation value at period end
|
—
|
|
—
|
|
—
|
|
—
|
|
—
|
|
—
|
|
—
|
|
9,968
|
|
—
|
|
—
|
|
9,968
|
|
|||||||||||||||||
|
Distributions to Preferred Mirror Units
|
—
|
|
—
|
|
—
|
|
—
|
|
—
|
|
—
|
|
—
|
|
(10,405
|
)
|
—
|
|
—
|
|
(10,405
|
)
|
|||||||||||||||||
|
Preferred Mirror Units redemption charges
|
—
|
|
—
|
|
—
|
|
—
|
|
—
|
|
—
|
|
—
|
|
(4,052
|
)
|
—
|
|
—
|
|
(4,052
|
)
|
|||||||||||||||||
|
Distributions to general partnership unitholders
|
—
|
|
—
|
|
—
|
|
—
|
|
—
|
|
—
|
|
—
|
|
(86,417
|
)
|
—
|
|
—
|
|
(86,417
|
)
|
|||||||||||||||||
|
BALANCE, December 31, 2012
|
—
|
|
$
|
—
|
|
—
|
|
$
|
—
|
|
4,000,000
|
|
$
|
96,850
|
|
143,538,733
|
|
$
|
1,666,341
|
|
$
|
(16,452
|
)
|
$
|
—
|
|
$
|
1,746,739
|
|
||||||||||
F- 15
|
|
Series D Preferred Mirror Units
|
Series E Preferred Mirror Units
|
Series E-Linked Preferred Mirror Units
|
General Partner Capital
|
Accumulated Other
Comprehensive Income
|
Non-controlling Interest
Consolidated Real
Estate Ventures
|
Total Partners’
Equity
|
||||||||||||||||||||||||||||||||
|
|
Units
|
Amount
|
Units
|
Amount
|
Units
|
Amount
|
Units
|
Amount
|
|||||||||||||||||||||||||||||||
|
Net income
|
—
|
|
—
|
|
—
|
|
—
|
|
—
|
|
—
|
|
—
|
|
43,189
|
|
—
|
|
—
|
|
43,189
|
|
|||||||||||||||||
|
Other comprehensive income
|
—
|
|
—
|
|
—
|
|
—
|
|
—
|
|
—
|
|
—
|
|
—
|
|
13,075
|
|
—
|
|
13,075
|
|
|||||||||||||||||
|
Deferred compensation obligation
|
—
|
|
—
|
|
—
|
|
—
|
|
—
|
|
—
|
|
(5,012
|
)
|
—
|
|
—
|
|
—
|
|
—
|
|
|||||||||||||||||
|
Issuance of LP Units
|
—
|
|
—
|
|
—
|
|
—
|
|
—
|
|
—
|
|
12,650,000
|
|
181,289
|
|
—
|
|
—
|
|
181,289
|
|
|||||||||||||||||
|
Issuance of partnership interest in joint venture
|
—
|
|
—
|
|
—
|
|
—
|
|
—
|
|
—
|
|
—
|
|
—
|
|
—
|
|
946
|
|
946
|
|
|||||||||||||||||
|
Bonus share issuance
|
—
|
|
—
|
|
—
|
|
—
|
|
—
|
|
—
|
|
27,918
|
|
361
|
|
—
|
|
—
|
|
361
|
|
|||||||||||||||||
|
Conversion of LP Units to common shares
|
—
|
|
—
|
|
—
|
|
—
|
|
—
|
|
—
|
|
81,998
|
|
1,240
|
|
—
|
|
—
|
|
1,240
|
|
|||||||||||||||||
|
Vesting of restricted units
|
—
|
|
—
|
|
—
|
|
—
|
|
—
|
|
—
|
|
147,495
|
|
(902
|
)
|
—
|
|
—
|
|
(902
|
)
|
|||||||||||||||||
|
Restricted stock amortization
|
—
|
|
—
|
|
—
|
|
—
|
|
—
|
|
—
|
|
—
|
|
3,079
|
|
—
|
|
—
|
|
3,079
|
|
|||||||||||||||||
|
Restricted stock forfeitures
|
—
|
|
—
|
|
—
|
|
—
|
|
—
|
|
—
|
|
—
|
|
17
|
|
—
|
|
—
|
|
17
|
|
|||||||||||||||||
|
Vesting of restricted performance units
|
—
|
|
—
|
|
—
|
|
—
|
|
—
|
|
—
|
|
53,134
|
|
(160
|
)
|
—
|
|
—
|
|
(160
|
)
|
|||||||||||||||||
|
Restricted performance units amortization
|
—
|
|
—
|
|
—
|
|
—
|
|
—
|
|
—
|
|
—
|
|
4,333
|
|
—
|
|
—
|
|
4,333
|
|
|||||||||||||||||
|
Outperformance plan amortization
|
—
|
|
—
|
|
—
|
|
—
|
|
—
|
|
—
|
|
—
|
|
—
|
|
—
|
|
—
|
|
—
|
|
|||||||||||||||||
|
Option amortization
|
—
|
|
—
|
|
—
|
|
—
|
|
—
|
|
—
|
|
—
|
|
670
|
|
—
|
|
—
|
|
670
|
|
|||||||||||||||||
|
Trustee fees paid in shares
|
—
|
|
—
|
|
—
|
|
—
|
|
—
|
|
—
|
|
1,409
|
|
20
|
|
—
|
|
—
|
|
20
|
|
|||||||||||||||||
|
Exercise of options
|
—
|
|
—
|
|
—
|
|
—
|
|
—
|
|
—
|
|
236,318
|
|
2,380
|
|
—
|
|
—
|
|
2,380
|
|
|||||||||||||||||
|
Adjustment of redeemable partnership units to liquidation value at period end
|
—
|
|
—
|
|
—
|
|
—
|
|
—
|
|
—
|
|
—
|
|
(778
|
)
|
—
|
|
—
|
|
(778
|
)
|
|||||||||||||||||
|
Redemption value of limited partnership units
|
—
|
|
—
|
|
—
|
|
—
|
|
—
|
|
—
|
|
—
|
|
(1,240
|
)
|
—
|
|
—
|
|
(1,240
|
)
|
|||||||||||||||||
|
Cumulative effect of accounting change for variable interest entities
|
—
|
|
—
|
|
—
|
|
—
|
|
—
|
|
—
|
|
—
|
|
—
|
|
—
|
|
—
|
|
—
|
|
|||||||||||||||||
|
Distributions to Preferred Mirror Units
|
—
|
|
—
|
|
—
|
|
—
|
|
—
|
|
—
|
|
—
|
|
(6,900
|
)
|
—
|
|
—
|
|
(6,900
|
)
|
|||||||||||||||||
|
Distributions to general partnership unitholders
|
—
|
|
—
|
|
—
|
|
—
|
|
—
|
|
—
|
|
—
|
|
(92,409
|
)
|
—
|
|
—
|
|
(92,409
|
)
|
|||||||||||||||||
|
BALANCE, December 31, 2013
|
—
|
|
$
|
—
|
|
—
|
|
$
|
—
|
|
4,000,000
|
|
$
|
96,850
|
|
156,731,993
|
|
$
|
1,800,530
|
|
$
|
(3,377
|
)
|
$
|
946
|
|
$
|
1,894,949
|
|
||||||||||
The accompanying notes are an integral part of these consolidated financial statements.
F- 16
BRANDYWINE OPERATING PARTNERSHIP L.P.
CONSOLIDATED STATEMENTS OF CASH FLOWS
(in thousands)
|
For the year ended December 31,
|
|||||||||||
|
|
2013
|
2012
|
2011
|
||||||||
|
Cash flows from operating activities:
|
|
|
|||||||||
|
Net income (loss)
|
$
|
43,189
|
|
$
|
6,529
|
|
$
|
(4,715
|
)
|
||
|
Adjustments to reconcile net income (loss) to net cash from operating activities:
|
|
|
|||||||||
|
Depreciation and amortization
|
198,731
|
|
198,579
|
|
219,110
|
|
|||||
|
Amortization of deferred financing costs
|
4,676
|
|
6,208
|
|
4,991
|
|
|||||
|
Amortization of debt discount/(premium), net
|
2,480
|
|
1,760
|
|
1,567
|
|
|||||
|
Amortization of stock compensation costs
|
6,998
|
|
5,685
|
|
5,282
|
|
|||||
|
Shares used for employee taxes upon vesting of share awards
|
(1,062
|
)
|
(2,493
|
)
|
(1,012
|
)
|
|||||
|
Recognized hedge activity
|
—
|
|
2,985
|
|
—
|
|
|||||
|
Straight-line rent income
|
(20,136
|
)
|
(23,566
|
)
|
(20,298
|
)
|
|||||
|
Amortization of acquired above (below) market leases, net
|
(7,170
|
)
|
(6,084
|
)
|
(5,384
|
)
|
|||||
|
Straight-line ground rent expense
|
1,509
|
|
1,897
|
|
1,924
|
|
|||||
|
Provision for doubtful accounts
|
2,467
|
|
2,198
|
|
1,924
|
|
|||||
|
Net gain on sale of interests in real estate
|
(29,166
|
)
|
(34,774
|
)
|
(10,008
|
)
|
|||||
|
Loss on real estate venture formation
|
—
|
|
950
|
|
222
|
|
|||||
|
Net gain on real estate venture transaction
|
(3,683
|
)
|
—
|
|
—
|
|
|||||
|
Gain from remeasurement of investment in a real estate venture
|
(6,866
|
)
|
—
|
|
—
|
|
|||||
|
Loss on early extinguishment of debt
|
2,119
|
|
22,002
|
|
2,776
|
|
|||||
|
Historic tax credit transaction income
|
(11,853
|
)
|
(11,840
|
)
|
(12,026
|
)
|
|||||
|
Real estate venture income in excess of distributions
|
(2,014
|
)
|
(1,517
|
)
|
(1,175
|
)
|
|||||
|
Cumulative interest accretion of repayments of unsecured notes
|
—
|
|
—
|
|
(4,005
|
)
|
|||||
|
Contributions from historic tax credit transaction, net of deferred costs
|
—
|
|
—
|
|
2,694
|
|
|||||
|
Deferred financing obligation
|
(974
|
)
|
(1,803
|
)
|
—
|
|
|||||
|
Changes in assets and liabilities:
|
|
||||||||||
|
Accounts receivable
|
(4,048
|
)
|
262
|
|
(856
|
)
|
|||||
|
Other assets
|
5,440
|
|
4,244
|
|
(3,851
|
)
|
|||||
|
Accounts payable and accrued expenses
|
(526
|
)
|
(8,355
|
)
|
7,732
|
|
|||||
|
Deferred income, gains and rent
|
3,758
|
|
(2,167
|
)
|
(7,220
|
)
|
|||||
|
Other liabilities
|
(385
|
)
|
(1,590
|
)
|
(425
|
)
|
|||||
|
Net cash from operating activities
|
183,484
|
|
159,110
|
|
177,247
|
|
|||||
|
Cash flows from investing activities:
|
|
|
|||||||||
|
Acquisition of properties
|
(161,604
|
)
|
(77,555
|
)
|
(40,674
|
)
|
|||||
|
Investments in available-for-sale securities
|
—
|
|
(105,250
|
)
|
—
|
|
|||||
|
Proceeds from sale of available-for-sale securities
|
—
|
|
105,250
|
|
—
|
|
|||||
|
Sales of properties, net
|
423,480
|
|
170,918
|
|
155,956
|
|
|||||
|
Distribution of sales proceeds from real estate venture
|
16,963
|
|
—
|
|
—
|
|
|||||
|
Proceeds from repayment of mortgage notes receivable
|
200
|
|
23,364
|
|
—
|
|
|||||
|
Capital expenditures for tenant improvements
|
(109,357
|
)
|
(86,986
|
)
|
(130,482
|
)
|
|||||
|
Capital expenditures for redevelopments
|
(6,265
|
)
|
(11,964
|
)
|
(674
|
)
|
|||||
|
Capital expenditures for developments
|
(5,490
|
)
|
(162
|
)
|
—
|
|
|||||
|
Reimbursement from real estate venture for pre-formation development costs
|
1,976
|
|
—
|
|
—
|
|
|||||
|
Advances for purchase of tenant assets, net of repayments
|
(127
|
)
|
270
|
|
1,365
|
|
|||||
|
Loan proceeds received from an unconsolidated joint venture
|
—
|
|
566
|
|
1,388
|
|
|||||
|
Loan provided to an unconsolidated real estate venture partner
|
—
|
|
—
|
|
(1,122
|
)
|
|||||
|
Investment in unconsolidated Real Estate Ventures
|
(33,069
|
)
|
(65,354
|
)
|
(5,277
|
)
|
|||||
|
Escrowed cash
|
1,902
|
|
(1,827
|
)
|
1,502
|
|
|||||
|
Cash distributions from unconsolidated Real Estate Ventures in excess of cumulative equity income
|
7,496
|
|
5,109
|
|
10,316
|
|
|||||
|
Leasing costs
|
(31,397
|
)
|
(31,243
|
)
|
(38,461
|
)
|
|||||
|
Net cash from (used in) investing activities
|
104,708
|
|
(74,864
|
)
|
(46,163
|
)
|
|||||
|
Cash flows from financing activities:
|
|
|
|||||||||
|
Proceeds from Unsecured Term Loans
|
—
|
|
600,000
|
|
—
|
|
|||||
|
Proceeds from Credit Facility borrowings
|
186,000
|
|
90,500
|
|
706,002
|
|
|||||
|
Repayments of Credit Facility borrowings
|
(255,000
|
)
|
(297,000
|
)
|
(613,502
|
)
|
|||||
|
Repayments of mortgage notes payable
|
(11,268
|
)
|
(68,513
|
)
|
(221,856
|
)
|
|||||
F- 17
|
Proceeds from unsecured notes
|
—
|
|
248,183
|
|
321,448
|
|
|||||
|
Deferred financing obligation interest expense
|
—
|
|
935
|
|
—
|
|
|||||
|
Net proceeds from issuance of common units
|
181,527
|
|
—
|
|
7,930
|
|
|||||
|
Net proceeds from issuance of preferred units
|
—
|
|
96,237
|
|
—
|
|
|||||
|
Redemption of preferred units
|
—
|
|
(108,536
|
)
|
—
|
|
|||||
|
Redemption of partnership units
|
—
|
|
(9,676
|
)
|
—
|
|
|||||
|
Repayments of unsecured notes
|
(31,369
|
)
|
(338,097
|
)
|
(105,381
|
)
|
|||||
|
Repayments of unsecured term loan
|
—
|
|
(190,485
|
)
|
(145,500
|
)
|
|||||
|
Net settlement of hedge transactions
|
—
|
|
—
|
|
(613
|
)
|
|||||
|
Debt financing costs
|
(355
|
)
|
(10,128
|
)
|
(4,249
|
)
|
|||||
|
Refund of deferred financing costs related to forward commitment
|
—
|
|
—
|
|
—
|
|
|||||
|
Exercise of unit options
|
2,381
|
|
976
|
|
350
|
|
|||||
|
Distributions paid to preferred and common partnership unitholders
|
(98,450
|
)
|
(97,503
|
)
|
(91,868
|
)
|
|||||
|
Net cash from (used in) financing activities
|
(26,534
|
)
|
(83,107
|
)
|
(147,239
|
)
|
|||||
|
Increase (decrease) in cash and cash equivalents
|
261,658
|
|
1,139
|
|
(16,155
|
)
|
|||||
|
Cash and cash equivalents at beginning of year
|
1,549
|
|
410
|
|
16,565
|
|
|||||
|
Cash and cash equivalents at end of year
|
$
|
263,207
|
|
$
|
1,549
|
|
$
|
410
|
|
||
|
Supplemental disclosure:
|
|
|
|||||||||
|
Cash paid for interest, net of capitalized interest during the years ended December 31, 2013, 2012, and 2011 of $3,137, $2,560, and $1,997, respectively
|
$
|
118,714
|
|
$
|
137,823
|
|
$
|
135,210
|
|
||
|
Supplemental disclosure of non-cash activity:
|
|
|
|||||||||
|
Change in operating real estate related to a non-cash acquisition of an operating property
|
(21,649
|
)
|
—
|
|
—
|
|
|||||
|
Change in intangible assets, net related to non-cash acquisition of an operating property
|
(3,517
|
)
|
—
|
|
—
|
|
|||||
|
Change in acquired lease intangibles, net related to non-cash acquisition of an operating property
|
462
|
|
—
|
|
—
|
|
|||||
|
Change in investments in joint venture related to non-cash acquisition of property
|
13,040
|
|
—
|
|
—
|
|
|||||
|
Change in investments in joint venture related to non-cash disposition of property
|
(17,628
|
)
|
—
|
|
—
|
|
|||||
|
Change in operating real estate related to non-cash adjustment to land
|
7,752
|
|
—
|
|
—
|
|
|||||
|
Change in mortgage notes payable related to acquisition of an operating property
|
238,082
|
|
—
|
|
—
|
|
|||||
|
Change in investments in joint venture related to a contribution of land at period end
|
(6,058
|
)
|
(15,222
|
)
|
—
|
|
|||||
|
Change in investments in joint venture related to a contribution of services
|
—
|
|
(711
|
)
|
—
|
|
|||||
|
Change in capital expenditures financed through accounts payable at period end
|
11,703
|
|
7,059
|
|
(3,896
|
)
|
|||||
|
Change in capital expenditures financed through retention payable at period end
|
(204
|
)
|
566
|
|
(6,213
|
)
|
|||||
|
Change in unfunded tenant allowance
|
(969
|
)
|
(1,089
|
)
|
(1,717
|
)
|
|||||
The accompanying notes are an integral part of these consolidated financial statements.
F- 18
NOTES TO CONSOLIDATED FINANCIAL STATEMENTS
DECEMBER 31, 2013, 2012, AND 2011
1. ORGANIZATION OF THE PARENT COMPANY AND THE OPERATING PARTNERSHIP
The Parent Company is a self-administered and self-managed real estate investment trust (“REIT”) that provides leasing, property management, development, redevelopment, acquisition and other tenant-related services for a portfolio of office and industrial properties. The Parent Company owns its assets and conducts its operations through the Operating Partnership and subsidiaries of the Operating Partnership. The Parent Company is the sole general partner of the Operating Partnership and, as of
December 31, 2013
, owned a
98.8%
interest in the Operating Partnership. The Parent Company’s common shares of beneficial interest are publicly traded on the New York Stock Exchange under the ticker symbol “BDN”.
As of
December 31, 2013
, the Company owned
204
properties, consisting of
176
office properties,
19
industrial facilities,
five
mixed-use properties,
one
development property,
two
redevelopment properties and
one
re-entitlement property (collectively, the “Properties”) containing an aggregate of approximately
24.8 million
net rentable square feet. In addition, as of
December 31, 2013
, the Company owned economic interests in
17
unconsolidated real estate ventures that contain approximately
5.7 million
net rentable square feet (collectively, the “Real Estate Ventures”). As of
December 31, 2013
, the Company also owned
432
acres of undeveloped land, and held options to purchase approximately
51
additional acres of undeveloped land. As of
December 31, 2013
, the total potential development that these land parcels could support, under current zoning, entitlements or combination thereof, amounted to
6.8 million
square feet. The Properties and the properties owned by the Real Estate Ventures are located in or near Philadelphia, Pennsylvania; Metropolitan Washington, D.C.; Southern New Jersey; Richmond, Virginia; Wilmington, Delaware; Austin, Texas and Oakland, Concord and Carlsbad, California. In addition to managing properties that the Company owns, as of
December 31, 2013
, the Company was managing approximately
7.9 million
net rentable square feet of office and industrial properties for third parties and the Real Estate Ventures.
All references to building square footage, acres, occupancy percentage and the number of buildings are unaudited.
The Company conducts its third-party real estate management services business primarily through six management companies (collectively, the “Management Companies”): Brandywine Realty Services Corporation (“BRSCO”), BTRS, Inc. (“BTRS”), Brandywine Properties I Limited, Inc. (“BPI”), BDN Brokerage, LLC (“BBL”), Brandywine Properties Management, L.P. (“BPM”) and Brandywine Brokerage Services, LLC (“BBS”). Each of BRSCO, BTRS and BPI is a taxable REIT subsidiary. As of
December 31, 2013
, the Operating Partnership owns, directly and indirectly,
100%
of each of BRSCO, BTRS, BPI, BBL, BPM and BBS. As of
December 31, 2013
, the Management Companies were managing properties containing an aggregate of approximately
32.7 million
net rentable square feet, of which approximately
24.8 million
net rentable square feet related to Properties owned by the Company and approximately
7.9 million
net rentable square feet related to properties owned by third parties and Real Estate Ventures.
2. SUMMARY OF SIGNIFICANT ACCOUNTING POLICIES
Reclassifications
Certain amounts have been reclassified in prior years to conform to the current year presentation. The reclassifications are related to the treatment of sold properties as discontinued operations on the statement of operations for all periods presented. In addition, capital expenditures included in investing activities were disaggregated on the statement of cash flows for all periods presented to the following; (i) capital expenditures for tenant improvements, (ii) capital expenditures for redevelopment projects and (iii) capital expenditures for development projects.
Principles of Consolidation
When the Company obtains an economic interest in an entity, the Company evaluates the entity to determine if the entity is deemed a variable interest entity (“VIE”), and if the Company is deemed to be the primary beneficiary, in accordance with the accounting standard for the consolidation of variable interest entities. The accounting standard for the consolidation of VIEs requires the Company to qualitatively assess if the Company was the primary beneficiary of the VIEs based on whether the Company had (i) the power to direct those matters that most significantly impacted the activities of the VIE and (ii) the obligation to absorb losses or the right to receive benefits of the VIE that could potentially be significant to the VIE. For entities determined to be VIEs, but for which the Company is not the primary beneficiary, the Company's maximum exposure to loss is the carrying amount of its investments. As of
December 31, 2013
, the Company has provided guarantees on behalf of certain real estate ventures, consisting of (i) a
$24.7 million
payment guaranty on the construction loan for the project being undertaken by evo at Cira; (ii) a
$3.2 million
F- 19
payment guarantee on the construction loan for a project being undertaken by TB-BDN Plymouth Apartments; and (iii) a
$0.5 million
payment guarantee on a loan provided to PJP VII.
When an entity is not deemed to be a VIE, the Company considers the provisions of the same accounting standard to determine whether a general partner/managing member, or the general partners/managing members as a group, controls a limited partnership or similar entity when the limited partners/non-managing members have certain rights. The Company consolidates (i) entities that are VIEs and of which the Company is deemed to be the primary beneficiary and (ii) entities that are non-VIEs and controlled by the Company and in which the limited partners neither have the ability to dissolve the entity or remove the Company without cause nor any substantive participating rights. Entities that the Company accounts for under the equity method (i.e., at cost, increased or decreased by the Company's share of earnings or losses, plus contributions, less distributions) include (i) entities that are VIEs and of which the Company is not deemed to be the primary beneficiary (ii) entities that are non-VIEs which the Company does not control, but over which the Company has the ability to exercise significant influence and (iii) entities that are non-VIEs for which the Company maintains an ownership interest through its general partner/managing member status, but the limited partners/non-managing members in the entity have the substantive ability to dissolve the entity or remove the Company without cause or have substantive participating rights. Currently there are no real estate ventures that a limited partner/non-managing member has the unilateral right to dissolve. The Company continuously assesses its determination of whether an entity is a VIE and who the primary beneficiary is, and whether or not the limited partners/non-managing members in an entity have substantive rights, more particularly if certain events occur that are likely to cause a change in the original determinations. The Company's assessment includes a review of applicable documents such as, but not limited to, applicable partnership agreements, LLC and other real estate venture agreements and management and leasing agreements to determine whether the Company has control to direct the business activities of the entities. The portion of the consolidated entities that is not owned by the Company is presented as non-controlling interest as of and during the periods consolidated. All intercompany accounts and transactions have been eliminated in consolidation.
Use of Estimates
The preparation of financial statements in conformity with accounting principles generally accepted in the United States of America requires management to make estimates and assumptions that affect the reported amounts of assets and liabilities and disclosure of contingent assets and liabilities at the date of the financial statements and the reported amounts of revenue and expenses during the reporting period. Actual results could differ from those estimates. Management makes significant estimates regarding revenue, valuation of real estate and related intangible assets and liabilities, impairment of long-lived assets, allowance for doubtful accounts and deferred costs.
Operating Properties
Operating properties are carried at historical cost less accumulated depreciation and impairment losses. The cost of operating properties reflects their purchase price or development cost. Acquisition costs related to business combinations are expensed as incurred, whereas the costs related to asset acquisitions are capitalized as incurred. Costs incurred for the renovation and betterment of an operating property are capitalized to the Company’s investment in that property. Ordinary repairs and maintenance are expensed as incurred; major replacements and betterments, which improve or extend the life of the asset, are capitalized and depreciated over their estimated useful lives. Fully-depreciated assets are removed from the accounts.
Purchase Price Allocation
The Company allocates the purchase price of properties considered to be business combinations to net tangible and identified intangible assets acquired based on fair values. Above-market and below-market in-place lease values for acquired properties are recorded based on the present value (using an interest rate which reflects the risks associated with the leases acquired) of the difference between (i) the contractual amounts to be paid pursuant to the in-place leases and (ii) the Company’s estimate of the fair market lease rates for the corresponding in-place leases, measured over a period equal to the remaining non-cancelable term of the lease (including the below market fixed renewal period, if applicable). Capitalized above-market lease values are amortized as a reduction of rental income over the remaining non-cancelable terms of the respective leases. Capitalized below-market lease values are amortized as an increase to rental income over the remaining non-cancelable terms of the respective leases, including any below market fixed-rate renewal periods.
Other intangible assets also include in-place leases based on the Company’s evaluation of the specific characteristics of each tenant’s lease and the Company’s overall relationship with the respective tenant. The Company estimates the cost to execute leases with terms similar to the remaining lease terms of the in-place leases, including leasing commissions, legal and other related expenses. This intangible asset is amortized to expense over the remaining term of the respective leases and any fixed-rate bargain renewal periods. Company estimates of value are made using methods similar to those used by independent appraisers or by using independent appraisals. Factors considered by the Company in this analysis include an estimate of the carrying costs during the
F- 20
expected lease-up periods considering current market conditions and costs to execute similar leases. In estimating carrying costs, the Company includes real estate taxes, insurance and other operating expenses and estimates of lost rentals at market rates during the expected lease-up periods, which primarily range from four to twelve months. The Company also considers information obtained about each property as a result of its pre-acquisition due diligence, marketing and leasing activities in estimating the fair value of the tangible and intangible assets acquired. The Company also uses the information obtained as a result of its pre-acquisition due diligence as part of its consideration of the accounting standard governing asset retirement obligations and when necessary, will record a conditional asset retirement obligation as part of its purchase price. Though the Company considers the value of tenant relationships, the amounts are determined on a tenant-specific basis. On certain of our acquisitions this intangible has been deemed immaterial. In these instances no related intangible value is assigned.
In the event that a tenant terminates its lease, the unamortized portion of each intangible, including in-place lease values and tenant relationship values, is charged to expense and market rate adjustments (above or below) are recorded to revenue.
Depreciation and Amortization
The costs of buildings and improvements are depreciated using the straight-line method based on the following useful lives: buildings and improvements (five to 55 years) and tenant improvements (the shorter of the lease term or the life of the asset).
The Company's 2011 consolidated statement of operations contained an out of period depreciation and amortization expense adjustment of
$4.7 million
relating to intangible assets representing tenant relationships and in-place leases that should have been written off in prior periods. This resulted in the overstatement of depreciation and amortization expense by
$4.7 million
in 2011. During the year ended December 31, 2010, depreciation and amortization expense was overstated by
$1.7 million
and was understated by
$1.4 million
,
$1.8 million
,
$1.7 million
and
$1.5 million
during the years ended December 31, 2009, 2008, 2007, and 2006, respectively. As management believes that this error was not material to prior years' consolidated financial statements and that the impact of recording the error during 2011 was not material to the Company's consolidated financial statements, the Company recorded the related adjustment during 2011.
Construction in Progress
Project costs directly associated with the development and construction of a real estate project are capitalized as construction in progress. Construction in progress also includes costs related to ongoing tenant improvement projects. In addition, interest, real estate taxes and other expenses that are directly associated with the Company’s development activities are capitalized until the property is placed in service. Internal direct costs are capitalized to projects in which qualifying expenditures are being incurred. Internal direct construction costs totaling
$3.7 million
in
2013
,
$4.7 million
in
2012
,
$4.0 million
in
2011
and interest totaling
$2.6 million
in
2013
,
$2.6 million
in
2012
, and
$2.0 million
in
2011
were capitalized related to development of certain properties and land holdings.
During the years ended
December 31, 2013
,
2012
and
2011
, the Company's internal direct construction costs are comprised entirely of capitalized salaries. The following table shows the amount of compensation costs (including bonuses and benefits) capitalized for the years presented (in thousands):
|
December 31,
|
|||||||||||
|
2013
|
2012
|
2011
|
|||||||||
|
Development
|
$
|
156
|
|
$
|
57
|
|
$
|
—
|
|
||
|
Redevelopment
|
194
|
|
353
|
|
—
|
|
|||||
|
Tenant Improvements
|
3,323
|
|
4,259
|
|
4,034
|
|
|||||
|
Total
|
$
|
3,673
|
|
$
|
4,669
|
|
$
|
4,034
|
|
||
Impairment or Disposal of Long-Lived Assets
The Company reviews its long-lived assets for impairment following the end of each quarter and when there is an event or change in circumstances that indicates an impairment in value. An impairment loss is recognized if the carrying amount of an asset is not recoverable and exceeds its fair value. In such case, an impairment loss is recognized in the amount of the excess of the carrying amount of the asset over its fair value. The evaluation of anticipated cash flows is highly subjective and is based in part on assumptions regarding future occupancy, rental rates and capital requirements that could differ materially from actual results in future periods. Since cash flows on properties considered to be “long-lived assets to be held and used” are considered on an undiscounted basis to determine whether an asset has been impaired, our established strategy of holding properties over the long term directly decreases the likelihood of recording an impairment loss. If our holding strategy were to change or if market conditions
F- 21
were to otherwise dictate an earlier sale date, then an impairment loss may be recognized and such loss could be material. If we determine that impairment has occurred, the affected assets must be reduced to their fair value.
The relevant accounting guidance for impairments requires that qualifying assets and liabilities and the results of operations that have been sold, or otherwise qualify as “held for sale,” be presented as discontinued operations in all periods presented if the property operations are expected to be eliminated and if we will not have significant continuing involvement following the sale. The components of the property’s net income that is reflected as discontinued operations include the net gain (or loss) upon the disposition of the property held for sale, operating results, depreciation and interest expense (if the property is subject to a secured loan). The Company generally consider assets to be “held for sale” when the transaction has been approved by our Board of Trustees, or by officers vested with authority to approve the transaction and there are no known significant contingencies relating to the sale of the property within one year of the consideration date and the consummation of the transaction is otherwise considered probable.
Following the classification of a property as “held for sale,” no further depreciation is recorded on the assets, and the asset is written down to the lower of carrying value or fair market value.
The Company determined during its impairment review of the
year-ended December 31,
2013
,
2012
and
2011
, that no impairment charges were necessary.
Cash and Cash Equivalents
Cash and cash equivalents are highly-liquid investments with original maturities of three months or less. The Company maintains cash equivalents in financial institutions in excess of insured limits, but believes this risk is mitigated by only investing in or through major financial institutions.
Restricted Cash
Restricted cash consists of cash held as collateral to provide credit enhancement for the Company’s mortgage debt, cash for property taxes, capital expenditures and tenant improvements.
Accounts Receivable and Accrued Rent Receivable
Leases with tenants are accounted for as operating leases. Minimum annual rentals under tenant leases are recognized on a straight-line basis over the term of the related lease. The cumulative difference between lease revenue recognized under the straight-line method and contractual lease payment terms is recorded as “accrued rent receivable, net” on the accompanying balance sheets. Included in current tenant receivables are tenant reimbursements which are comprised of amounts recoverable from tenants for common area maintenance expenses and certain other recoverable expenses that are recognized as revenue in the period in which the related expenses are incurred. As of
December 31, 2013
and
2012
, no tenant represented more than
10%
of accounts receivable and accrued rent receivable.
Tenant receivables and accrued rent receivables are carried net of the allowances for doubtful accounts of
$3.2 million
and
$13.0 million
in
2013
, respectively and
$3.1 million
and
$13.5 million
in
2012
, respectively. The allowance is an estimate based on two calculations that are combined to determine the total amount reserved. First, the Company evaluates specific accounts where it has determined that a tenant may have an inability to meet its financial obligations. In these situations, the Company uses its judgment, based on the facts and circumstances, and records a specific reserve for that tenant against amounts due to reduce the receivable to the amount that the Company expects to collect. These reserves are reevaluated and adjusted as additional information becomes available. Second, a reserve is established for all tenants based on a range of percentages applied to receivable aging categories for tenant receivables. For accrued rent receivables, the Company considers the results of the evaluation of specific accounts and also considers other factors including assigning risk factors to different industries based on its tenants SIC classification. Considering various factors including assigning a risk factor to different industries, these percentages are based on historical collection and write-off experience adjusted for current market conditions, which requires management’s judgments.
Investments in Unconsolidated Real Estate Ventures
The Company accounts for its investments in unconsolidated Real Estate Ventures under the equity method of accounting as it is not the primary beneficiary (for VIEs) and the Company exercises significant influence, but does not control these entities under the provisions of the entities’ governing agreements pursuant to the accounting standard for the consolidation of VIEs. When the Company determines that its investment in an unconsolidated Real Estate Venture does not constitute a VIE, the Company utilizes the voting interest model under the accounting standard for consolidation to determine whether to consolidate the venture.
F- 22
Under the equity method, investments in unconsolidated Real Estate Ventures are recorded initially at cost, as investments in Real Estate Ventures, and subsequently adjusted for equity in earnings, cash contributions, less distributions and impairments. On a periodic basis, management also assesses whether there are any indicators that the value of the Company’s investments in unconsolidated Real Estate Ventures may be other than temporarily impaired. An investment is impaired only if the value of the investment, as estimated by management, is less than the carrying value of the investment and the decline is other than temporary. To the extent that an impairment has occurred, the loss shall be measured as the excess of the carrying amount of the investment over the fair value of the investment, as estimated by management. The determination as to whether an impairment exists requires significant management judgment about the fair value of its ownership interest. Fair value is determined through various valuation techniques, including but not limited to, discounted cash flow models, quoted market values and third party appraisals.
When the Company acquires an interest in or contributes assets to a real estate venture project, the difference between the Company’s cost basis in the investment and the value of the real estate venture or asset contributed is amortized over the life of the related assets, intangibles and liabilities and such adjustment is included in the Company’s share of equity in income of unconsolidated Real Estate Ventures. For purposes of cash flow presentation, distributions from unconsolidated Real Estate Ventures are presented as part of operating activities when they are considered as return on investments. Distributions in excess of the Company’s share in the cumulative unconsolidated Real Estate Ventures’ earnings are considered as return of investments and are presented as part of investing activities in accordance with the accounting standard for cash flow presentation.
Deferred Costs
Costs incurred in connection with property leasing are capitalized as deferred leasing costs. Deferred leasing costs consist primarily of leasing commissions and internal leasing costs that are amortized using the straight-line method over the life of the respective lease which generally ranges from
one to 15 years
. Management re-evaluates the remaining useful lives of leasing costs as economic and market conditions change.
Costs incurred in connection with debt financing are capitalized as deferred financing costs and charged to interest expense over the terms of the related debt agreements. Deferred financing costs consist primarily of loan fees which are amortized over the related loan term on a basis that approximates the effective interest method. Deferred financing costs are accelerated, when debt is extinguished, as part of interest expense- amortization of deferred financing costs within the Company's consolidated statements of operations. Original issue discounts are recognized as part of the gain or loss on extinguishment of debt, as appropriate.
Notes Receivable
As of
December 31, 2013
and 2012, notes receivable included a purchase money mortgage with a
20
-year amortization period bearing interest at
8.5%
, which was valued at
$7.0 million
and
$7.2 million
, respectively. The borrower had previously defaulted on the note. As a result, a forbearance agreement dated October 2011, as amended by a second forbearance agreement dated July 9, 2013, was entered into between the Company and the borrower, outlining the repayment terms of the outstanding debt. The Company has determined that the loan modifications represent a troubled debt restructuring due to the fact that the borrower was considered to be in a financial difficulty when it defaulted on the mortgage debt, and that a concession was granted in the form of the forbearance agreements. In accordance with the accounting standard for loan receivables the Company performs, on an ongoing basis, a collectability assessment of the note using the expected cash flow information provided by the borrower. Based on settlements subsequent to the balance sheet date and future cash flow projections provided by the borrower, it is anticipated that the note will be fully paid during 2015. As of
December 31, 2013
, the present value of the expected cash flows of the note receivable exceeded the outstanding balance of the note and therefore the note is considered recoverable as of
December 31, 2013
.
During 2012, the
$23.5 million
seven year purchase money mortgage note receivable (balance as of the payment date, including accrued but unpaid interest), which related to the 2009 sale of
two
Trenton properties, was paid in full prior to its scheduled maturity of October 2016. The Company also recognized a
$12.9 million
deferred gain and
$1.0 million
of interest income at the time of payment, in accordance with the accounting standard for installment sales.
Revenue Recognition
Rental revenue is recognized on the straight-line basis, which averages minimum rents over the terms of the leases from the later of the date of the commencement of the lease or the date of acquisition of the property subject to existing leases. The straight-line rent adjustment increased revenue by approximately
$17.7 million
in
2013
,
$21.1 million
in
2012
and
$17.9 million
in
2011
. Deferred rents on the balance sheet represent rental revenue received prior to their due dates and amounts paid by the tenant for certain improvements considered to be landlord assets that will remain as the Company’s property at the end of the tenant’s lease term. The amortization of the amounts paid by the tenant for such improvements is calculated on a straight-line basis over the term of the tenant’s lease and is a component of straight-line rental income and increased revenue by
$2.4 million
in each of
2013
,
2012
and
2011
. Lease incentives, which are included as reductions of rental revenue in the accompanying consolidated statements
F- 23
of operations, are recognized on a straight-line basis over the term of the lease. Lease incentives decreased revenue by
$0.7 million
in
2013
,
$0.8 million
in
2012
, and
$1.6 million
in
2011
.
The Company's leases also typically provide for tenant reimbursement of a portion of common area maintenance expenses and other operating expenses to the extent that a tenant’s pro rata share of expenses exceeds a base year level set in the lease or to the extent that the tenant has a lease on a triple net basis. For certain leases, the Company makes significant assumptions and judgments in determining the lease term, including assumptions when the lease provides the tenant with an early termination option. The lease term impacts the period over which the Company determines and records minimum rents and also impacts the period over which the Company amortizes lease-related costs.
In addition, the Company's rental revenue is impacted by the Company's determination of whether improvements to the properties, whether made by the Company or by the tenant, are landlord assets. The determination of whether an improvement is a landlord asset requires judgment. In making this judgment, our primary consideration is whether the improvement would be utilizable by another tenant upon move out of the improved space by the then-existing tenant. If the Company has funded an improvement that it determines not to be landlord assets, then it treats the costs of the improvement as lease incentives. If the tenant has funded the improvement that the Company determines to be landlord assets, then the Company treats the costs of the improvement as deferred revenue and amortize this cost into revenue over the lease term.
Recoveries from tenants, consisting of amounts due from tenants for common area maintenance expenses, real estate taxes and other recoverable costs are recognized as revenue in the period during which the expenses are incurred.
Tenant reimbursements are recognized and presented in accordance with accounting guidance which requires that these reimbursements be recorded on a gross basis because the Company is generally the primary obligor with respect to the goods and services the purchase of which gives rise to the reimbursement obligation; because the Company has discretion in selecting the vendors and suppliers; and because the Company bears the credit risk in the event they do not reimburse the Company. The Company also receives payments from third parties for reimbursement of a portion of the payroll and payroll-related costs for certain of the Company's personnel allocated to perform services for these third parties and reflects these payments on a gross basis.
The Company recognizes gains on sales of real estate at times and in amounts determined in accordance with the accounting guidance for sales of real estate. The guidance takes into account the terms of the transaction and any continuing involvement, including in the form of management, leasing of space or financial assistance associated with the properties. If the sales criteria for the full accrual method are not met, then the Company defers some or all of the gain recognition and account for the continued operations of the property by applying the finance, leasing, profit sharing, deposit, installment or cost recovery method, as appropriate, until the sales criteria are met
The Company derives parking revenues from leases, monthly parking and transient parking. The Company recognizes parking revenue as earned.
The Company receives management and development fees from third parties.
Property management fees are recorded and earned based on a percentage of collected rents at the properties under management, and not on a straight-line basis, because such fees are contingent upon the collection of rents. The Company records development fees as earned taking into account the risk associated with each project. Profit on development fees earned from joint venture projects is recognized as revenue to the extent of the third party partners’ ownership interest.
No tenant represented greater than
10%
of the Company’s rental revenue in
2013
,
2012
or
2011
.
Income Taxes
Parent Company
The Parent Company has elected to be treated as a REIT under Sections 856 through 860 of the Internal Revenue Code of 1986, as amended (the “Code”). In order to continue to qualify as a REIT, the Parent Company is required to, among other things, distribute at least
90%
of its annual REIT taxable income to its shareholders and meet certain tests regarding the nature of its income and assets. As a REIT, the Parent Company is not subject to federal and state income taxes with respect to the portion of its income that meets certain criteria and is distributed annually to its shareholders. Accordingly, no provision for federal and state income taxes is included in the accompanying consolidated financial statements with respect to the operations of the Parent Company. The Parent Company intends to continue to operate in a manner that allows it to meet the requirements for taxation as a REIT. If the Parent Company fails to qualify as a REIT in any taxable year, it will be subject to federal and state income taxes and may not be able to qualify as a REIT for the four subsequent tax years. The Parent Company is subject to certain local income
F- 24
taxes. Provision for such taxes has been included in general and administrative expenses in the Parent Company’s Consolidated Statements of Operations and Comprehensive Income.
The tax basis of the Parent Company’s assets was
$4.0 billion
for each of the years ended
December 31, 2013
and 2012.
The Parent Company is subject to a
4%
federal excise tax if sufficient taxable income is not distributed within prescribed time limits. The excise tax equals
4%
of the annual amount, if any, by which the sum of (a)
85%
of the Parent Company’s ordinary income and (b)
95%
of the Parent Company’s net capital gain exceeds cash distributions and certain taxes paid by the Parent Company. No excise tax was incurred in
2013
,
2012
, or
2011
.
The Parent Company has elected to treat several of its subsidiaries as taxable REIT subsidiaries (each a “TRS”). A TRS is subject to federal, state and local income tax. In general, a TRS may perform non-customary services for tenants, hold assets that the Parent Company, as a REIT, cannot hold directly and generally may engage in any real estate or non-real estate related business. The Company’s taxable REIT subsidiaries did not have any tax provisions or deferred income tax items as of December 31, 2013 and 2012.
Operating Partnership
In general, the Operating Partnership is not subject to federal and state income taxes, and accordingly, no provision for income taxes has been made in the accompanying consolidated financial statements. The partners of the Operating Partnership are required to include their respective share of the Operating Partnership’s profits or losses in their respective tax returns. The Operating Partnership’s tax returns and the amount of allocable Partnership profits and losses are subject to examination by federal and state taxing authorities. If such examination results in changes to the Operating Partnership profits or losses, then the tax liability of the partners would be changed accordingly.
The tax basis of the Operating Partnership’s assets was
$4.0 billion
for each of the years ended
December 31, 2013
and 2012.
The Operating Partnership may elect to treat one or more of its subsidiaries as REITs under Sections 856 through 860 of the Code. Each subsidiary REIT has met the requirements for treatment as a REIT under Sections 856 through 860 of the Code, and, accordingly, no provision has been made for federal and state income taxes in the accompanying consolidated financial statements. If any subsidiary REIT fails to qualify as a REIT in any taxable year, that subsidiary REIT will be subject to federal and state income taxes and may not be able to qualify as a REIT for the four subsequent taxable years. Also, each subsidiary REIT may be subject to certain local income taxes.
The Operating Partnership has elected to treat several of its subsidiaries as TRSs, which are subject to federal, state and local income tax.
Earnings Per Share
Basic earnings per share ("EPS") is computed by dividing net income available to common shareholders, as adjusted for unallocated earnings, if any, of certain securities, by the weighted average number of shares of common stock outstanding during the year. Diluted EPS reflects the potential dilution that could occur from shares issuable in connection with awards under share-based compensation plans, including upon the exercise of stock options, and conversion of the noncontrolling interests in the Operating Partnership.
Earnings Per Unit
Basic EPS is computed by dividing net income available to common unitholders, as adjusted for unallocated earnings, if any, of certain securities issued by the Operating Partnership, by the weighted average number of common unit equivalents outstanding during the year. Diluted EPS reflects the potential dilution that could occur from shares issuable in connection with awards under share-based compensation plans, including upon the exercise of stock options.
Stock-Based Compensation Plans
The Parent Company maintains a shareholder-approved equity-incentive plan known as the Amended and Restated 1997 Long-Term Incentive Plan (the “1997 Plan”). The 1997 Plan is administered by the Compensation Committee of the Parent Company’s Board of Trustees. Under the 1997 Plan, the Compensation Committee is authorized to award equity and equity-based awards, including incentive stock options, non-qualified stock options, restricted shares and performance-based shares. On
June 2, 2010
, the Parent Company’s shareholders approved amendments to the 1997 Plan that, among other things, increased the number of common shares available for future awards under the 1997 Plan by
6,000,000
(of which
3,600,000
shares are available solely for options and share appreciation rights). As of
December 31, 2013
,
5,195,177
common shares remained available for future awards
F- 25
under the 1997 Plan (including
2,983,569
shares available solely for options and share appreciation rights). Through
December 31, 2013
all options awarded under the 1997 Plan had a
one to ten-year
term.
The Company incurred stock-based compensation expense of
$8.3 million
during
2013
, of which
$1.4 million
was capitalized as part of the Company’s review of employee salaries eligible for capitalization. The Company incurred stock-based compensation expense of
$8.6 million
and
$6.4 million
during
2012
and
2011
, of which
$2.6 million
and
$1.5 million
, respectively, were also capitalized. The expensed amounts are included in general and administrative expense on the Company’s consolidated income statement in the respective periods.
Comprehensive Income
Comprehensive income or loss is recorded in accordance with the provisions of the accounting standard for comprehensive income. The accounting standard establishes standards for reporting comprehensive income and its components in the financial statements. Comprehensive income includes the effective portions of changes in the fair value of derivatives.
Accounting for Derivative Instruments and Hedging Activities
The Company accounts for its derivative instruments and hedging activities in accordance with the accounting standard for derivative and hedging activities. The accounting standard requires the Company to measure every derivative instrument (including certain derivative instruments embedded in other contracts) at fair value and record them in the balance sheet as either an asset or liability. See disclosures below related to the accounting standard for fair value measurements and disclosures.
For derivatives designated as cash flow hedges, the effective portions of changes in the fair value of the derivative are reported in other comprehensive income while the ineffective portions are recognized in earnings.
The Company actively manages its ratio of fixed-to-floating rate debt. To manage its fixed and floating rate debt in a cost-effective manner, the Company, from time to time, enters into interest rate swap agreements as cash flow hedges, under which it agrees to exchange various combinations of fixed and/or variable interest rates based on agreed upon notional amounts.
Fair Value Measurements
The Company estimates the fair value of its derivatives in accordance with the accounting standard for fair value measurements and disclosures. The accounting standard defines fair value as the exchange price that would be received for an asset or paid to transfer a liability (an exit price) in the principal or most advantageous market for the asset or liability in an orderly transaction between market participants on the measurement date. It also establishes a fair value hierarchy which requires an entity to maximize the use of observable inputs and minimize the use of unobservable inputs when measuring fair value. The standard describes three levels of inputs that may be used to measure fair value. Financial assets and liabilities recorded on the Consolidated Balance Sheets are categorized based on the inputs to the valuation techniques as follows:
|
•
|
Level 1 inputs are quoted prices (unadjusted) in active markets for identical assets or liabilities that the Company has the ability to access;
|
|
•
|
Level 2 inputs are inputs other than quoted prices included in Level 1, that are observable for the asset or liability, either directly or indirectly. Level 2 inputs may include quoted prices for similar assets and liabilities in active markets, as well as inputs that are observable for the asset or liability (other than quoted prices), such as interest rates, foreign exchange rates, and yield curves that are observable at commonly quoted intervals; and
|
|
•
|
Level 3 inputs are unobservable inputs for the asset or liability, which is typically based on an entity’s own assumptions, as there is little, if any, related market activity or information.
|
In instances where the determination of the fair value measurement is based on inputs from different levels of the fair value hierarchy, the level in the fair value hierarchy within which the entire fair value measurement falls is based on the lowest level input that is significant to the fair value measurement in its entirety. The Company’s assessment of the significance of a particular input to the fair value measurement in its entirety requires judgment, and considers factors specific to the asset or liability.
F- 26
The following table sets forth the Company’s financial assets and liabilities that were accounted for at fair value on a recurring basis as of
December 31, 2013
(in thousands):
|
Fair Value Measurements at Reporting
Date Using:
|
|||||||||||||||
|
December 31,
|
Quoted Prices in
Active Markets for
Identical Assets
|
Significant Other
Observable Inputs
|
Unobservable
Inputs
|
||||||||||||
|
Description
|
2013
|
(Level 1)
|
(Level 2)
|
(Level 3)
|
|||||||||||
|
Recurring
|
|
|
|
|
|||||||||||
|
Assets:
|
|||||||||||||||
|
Interest Rate Swaps
|
$
|
767
|
|
$
|
—
|
|
$
|
767
|
|
$
|
—
|
|
|||
|
Liabilities:
|
|||||||||||||||
|
Interest Rate Swaps
|
$
|
2,188
|
|
$
|
—
|
|
$
|
2,188
|
|
$
|
—
|
|
|||
The following table sets forth the Company’s financial liabilities that were accounted for at fair value on a recurring basis as of
December 31, 2012
(in thousands):
|
Fair Value Measurements at Reporting
Date Using:
|
|||||||||||||||
|
December 31,
|
Quoted Prices in
Active Markets for
Identical Assets
|
Significant Other
Observable Inputs
|
Unobservable
Inputs
|
||||||||||||
|
Description
|
2012
|
(Level 1)
|
(Level 2)
|
(Level 3)
|
|||||||||||
|
Recurring
|
|
|
|
|
|||||||||||
|
Liabilities:
|
|||||||||||||||
|
Interest Rate Swaps
|
$
|
14,210
|
|
$
|
—
|
|
$
|
14,210
|
|
$
|
—
|
|
|||
We classify our interest rate swaps, shown above, within Level 2 as the valuation inputs are based on quoted prices and market observable data of similar instruments.
Non-financial assets and liabilities recorded at fair value on a non-recurring basis to which the Company would apply the accounting standard where a measurement was required under fair value would include:
|
•
|
Non-financial assets and liabilities initially measured at fair value in an acquisition or business combination that are not remeasured at least quarterly at fair value,
|
|
•
|
Long-lived assets measured at fair value due to an impairment in accordance with the accounting standard for the impairment or disposal of long-lived assets,
|
|
•
|
Equity and cost method investments measured at fair value due to an impairment in accordance with the accounting standard for investments,
|
|
•
|
Notes receivable adjusted for any impairment in its value in accordance with the accounting standard for loan receivables, and
|
|
•
|
Asset retirement obligations initially measured at fair value under the accounting standard for asset retirement obligations.
|
Other than the remeasurements of our equity method investments of Six Tower Bridge, One Commerce Square and Two Commerce Square (see Note 3), the formation of the Austin Venture (see Note 4) and the 2013 business combinations (see Note 3), there were no items that were accounted for at fair value on a non-recurring basis for the
twelve months ended December 31, 2013
.
F- 27
3. REAL ESTATE INVESTMENTS
As of
December 31, 2013
and
2012
the gross carrying value of the Company’s Properties was as follows (in thousands):
|
2013
|
2012
|
||||||
|
Land
|
$
|
680,513
|
|
$
|
662,107
|
|
|
|
Building and improvements
|
3,504,060
|
|
3,576,065
|
|
|||
|
Tenant improvements
|
484,716
|
|
487,997
|
|
|||
|
|
$
|
4,669,289
|
|
$
|
4,726,169
|
|
|
Acquisitions and Dispositions
2013
Acquisitions
One and Two Commerce Square
On
December 19, 2013
, the Company acquired
99%
of the common interests in the One and Two Common Square partnerships ("Commerce Square"), the entities which own two
41
-story Trophy-class office towers in Philadelphia, Pennsylvania, from Parkway Properties, Inc. The office towers contain
1,896,142
of net rentable square feet and were
86.7%
occupied as of
December 31, 2013
. The Company acquired Commerce Square for an aggregate purchase price of
$331.8 million
and funded the acquisition via assumption of
$237.1 million
of existing mortgage debt and a
$73.1 million
cash payment from available corporate funds.
The Company previously accounted for our non-controlling interest in Commerce Square under the equity method of accounting. As a result of acquiring a
99%
common interest in the partnerships we obtained control of Commerce Square and our existing investment balance was remeasured based on the fair value of the underlying properties acquired and the existing distribution provisions under the relevant partnership agreements. Accordingly, a loss on remeasurement of
$1.0 million
was recorded as a result of this transaction.
The Company has treated this transaction as a business combination and allocated the purchase price to the tangible and intangible assets and liabilities. As discussed in Note 2, the Company utilized a number of sources in making estimates of fair values for purposes of allocating the purchase price to tangible and intangibles assets acquired and intangible liabilities assumed. The purchase price is allocated as follows:
|
December 19, 2013
|
||||
|
Building, land and improvements
|
$
|
255,705
|
|
|
|
Intangible assets acquired
|
85,036
|
|
||
|
Below market lease liabilities assumed
|
(8,637
|
)
|
||
|
|
$
|
332,104
|
|
|
|
Mortgage debt assumed - at fair value (1)
|
(238,082
|
)
|
||
|
Return of existing equity method investment
|
(30,424
|
)
|
||
|
Net working capital assumed
|
10,423
|
|
||
|
Non-controlling interest
|
(946
|
)
|
||
|
Total cash payment at settlement
|
$
|
73,075
|
|
|
(1) Principal outstanding on assumed mortgage debt at December 19, 2013 was
$237.1 million
.
F- 28
Intangible assets acquired and intangible liabilities assumed consist of the following (in thousands):
|
December 19, 2013
|
Weighted Average Amortization Period (in years)
|
|||||
|
Intangible assets:
|
||||||
|
In-place lease value
|
$
|
80,916
|
|
7.9
|
||
|
Above market tenant leases acquired
|
4,120
|
|
6.9
|
|||
|
Total
|
$
|
85,036
|
|
|
||
|
Intangible liabilities:
|
||||||
|
Below market leases acquired
|
$
|
(8,637
|
)
|
6.5
|
||
The Commerce Square redemption agreement allows for a
60
day settlement period related to the net working capital assets related to the acquired partnership interests. As of December 31, 2013, the Company has a
$2.1 million
receivable balance from its former partner which is due under the terms of the redemption agreement.
In connection with the acquisition of One Commerce Square, we assumed a
$125.1 million
existing non-recourse first mortgage with a fixed interest rate of
5.67%
and a maturity date of
January 6, 2016
. In accordance with generally accepted accounting principles, the mortgage was recorded at
$130.2 million
to reflect the fair value.
In connection with the acquisition of Two Commerce Square, we assumed a
$112.0 million
existing non-recourse first mortgage with a fixed interest rate of
3.96%
and a maturity date of
April 5, 2023
. In accordance with generally accepted accounting principles, the mortgage was recorded at
$107.9 million
to reflect the fair value.
The Company recognized
$0.9 million
of acquisition related costs which are included as part of general and administrative expenses of the Company’s consolidated statement of operations.
Four Points Centre
On
December 19, 2013
, the Company acquired two
3
-story, Class A office buildings totaling
192,396
of net rentable square feet known as Four Points Centre, together with
22.3
acres of nearby parcels of land in Austin, Texas known for an aggregate
$47.3 million
. This property was
99.2%
occupied as of
December 31, 2013
. The Company funded the acquisition price with available corporate funds, while recognizing
$0.1 million
of acquisition related costs, which are included as part of general and administrative expenses in the Company's consolidated statements of operations. The acquisition has been treated as a business combination and the total purchase price was allocated as follows:
$36.0 million
to building,
$5.8 million
to land,
$6.5 million
to intangible assets and
$1.0 million
to below market lease liabilities assumed.
Six Tower Bridge
On
June 19, 2013
, the Company acquired the remaining ownership interest in the real estate venture known as "Six Tower Bridge" that it did not then already own. See Note 4 "Investments in Unconsolidated Real Estate Ventures" for further discussion.
F- 29
The unaudited pro forma information below summarizes the Company’s combined results of operations for the years ended
December 31, 2013
and
2012
as though the acquisition of One and Two Commerce Square, Four Points Centre and Six Tower Bridge were completed on January 1, 2012. The supplemental pro forma operating data is not necessarily indicative of what the actual results of operations would have been assuming the transaction had been completed as set forth above, nor do they purport to represent the Company’s results of operations for future periods (in thousands except for per share amounts).
|
December 31,
|
||||||||
|
2013
|
2012
|
|||||||
|
Pro forma revenue
|
$
|
610,979
|
|
$
|
592,753
|
|
||
|
Pro forma income (loss) from continuing operations
|
21,805
|
|
(60,011
|
)
|
||||
|
Pro forma net income (loss) available to common shareholders
|
25,957
|
|
(16,970
|
)
|
||||
|
Earnings per common share from continuing operations:
|
||||||||
|
Basic -- as reported
|
$
|
0.20
|
|
$
|
(0.36
|
)
|
||
|
Basic -- as pro forma
|
$
|
0.14
|
|
$
|
(0.42
|
)
|
||
|
Diluted -- as reported
|
$
|
0.20
|
|
$
|
(0.36
|
)
|
||
|
Diluted -- as pro forma
|
$
|
0.14
|
|
$
|
(0.42
|
)
|
||
|
Earnings per common share:
|
||||||||
|
Basic -- as reported
|
$
|
0.23
|
|
$
|
(0.06
|
)
|
||
|
Basic -- as pro forma
|
$
|
0.17
|
|
$
|
(0.12
|
)
|
||
|
Diluted -- as reported
|
$
|
0.23
|
|
$
|
(0.06
|
)
|
||
|
Diluted -- as pro forma
|
$
|
0.17
|
|
$
|
(0.12
|
)
|
||
Included in the consolidated statements of income for the year ended December 31, 2013 are total revenues of
$3.4 million
and a net loss attributable to common shareholders of
$0.2 million
from acquisitions made during 2013.
Cira Centre
On
November 19, 2013
, the Company acquired a
0.8
acre land parcel underlying Cira Centre in Philadelphia, Pennsylvania for
$24.6 million
. The purchase terminates a long term ground lease agreement entered into during the development of Cira Centre. The Company has accounted for the transaction as an asset acquisition. Prior to the acquisition date, the Company recorded ground rent expense on a straight-line basis, resulting in accrued rent liability of
$12.1 million
. The accounting guidance for leases requires that an asset purchased which was previously subject to an operating lease cannot result in a gain, accordingly, the basis of the acquired land was reduced by the accrued rent liability and no income was recognized at acquisition. The Company funded the cost of the acquisition with available corporate funds and capitalized
$1.4 million
of acquisition related costs as part of the basis in the operating land.
Three Logan Square
On
April 25, 2013
, the Company exercised its purchase option under the long term ground lease agreement it held through its acquisition of Three Logan Square on August 5, 2010 and acquired the
1.8
acre land parcel underlying Three Logan Square in
Philadelphia, Pennsylvania
for
$20.8 million
. The Company has accounted for the transaction as an asset acquisition. A portion of the original purchase price of Three Logan Square was allocated to a below market ground lease intangible asset. As the sum of the purchase price of the land plus the
$4.3 million
remaining unamortized balance for the intangible asset approximates the fair value of the land as unencumbered by the ground lease, the remaining intangible asset balance was reclassified to land upon exercise of the purchase option. The Company funded the cost of the acquisition with available corporate funds and capitalized
$0.1 million
of acquisition related costs as part of the basis in the operating land.
F- 30
Dispositions
On
December 19, 2013
, we sold a
50,000
net rentable square feet office property located in
King of Prussia, Pennsylvania
known as
875 First Avenue
, for a sales price of
$3.8 million
resulting in a
$0.1 million
gain on sale after closing and other transaction related costs.
On
October 17, 2013
, we sold a
39,330
net rentable square feet office property located in
West Chester, Pennsylvania
known as
1336 Enterprise Drive
, for a sales price of
$2.6 million
resulting in a
$0.2 million
gain on sale after closing and other transaction related costs.
On
October 16, 2013
the Austin portfolio was contributed to a newly formed real estate venture. For additional information, see Note 4 to our consolidated financial statements.
On
August 5, 2013
, the Company sold an
eight
-acre parcel of land located in
Richmond, Virginia
known as Dabney Land East, for a sales price of
$0.5 million
resulting in a
$0.1 million
loss on sale after closing and other transaction related costs. The land parcel was undeveloped as of the date of sale.
On
June 28, 2013
, the Company sold 16870 West Bernardo Drive, a
68,708
net rentable square feet office property located in
San Diego, California
, for a sales price of
$18.0 million
resulting in a
$0.9 million
loss on sale after closing and other transaction related costs.
On
June 28, 2013
, the Company sold 100 Arrandale Boulevard, a
34,931
net rentable square feet office property located in
Exton, Pennsylvania
, for a sales price of
$3.5 million
resulting in a
$0.4 million
loss on sale after closing and other transaction related costs.
On
June 19, 2013
, the Company sold 1700 Paoli Pike, a
28,000
net rentable square feet office property located in
Malvern, Pennsylvania
known as 100 Applebrook, for a sales price of
$2.7 million
resulting in a
$0.4 million
loss on sale after closing and other transaction related costs.
On
June 14, 2013
, the Company sold Pacific View Plaza, a
51,695
net rentable square feet office property located in
Carlsbad, California
, for a sales price of
$10.3 million
resulting in a
$0.5 million
loss on sale after closing and other transaction related costs.
On
February 25, 2013
, the Company sold a portfolio of
eight
office properties containing
800,546
square feet in
Lawrenceville, New Jersey
, known as "Princeton Pike Corporate Center," for an aggregate sales price of
$121.0 million
resulting in a
$5.3 million
gain on sale after closing and other transaction related costs.
The sales of these properties, with the exception of the Austin portfolio and Dabney Land East, are included in discontinued operations (see Note 10).
2012
Brandywine/Toll Brothers Venture Formation
On
September 5, 2012
, the Company formed a joint venture, TB-BDN Plymouth Apartments, L.P., (the "Venture"), with Toll Brothers, Inc. ("Toll Brothers"), a residential home builder. The Company and Toll Brothers each own a
50%
interest in the Venture. The Venture owns a
20
-acre parcel of land located in Plymouth Meeting, Pennsylvania, which the Company contributed to the Venture upon its formation. Concurrent with the Company's contribution of the aforementioned land parcel, Toll Brothers contributed
$15.5 million
of cash to the venture, equivalent to the fair value of the land parcel contributed by the Company. The Venture will use the cash contributed by Toll Brothers to fund predevelopment costs for construction of a
398
unit apartment complex.
Based on the facts and circumstances at the date of formation of the Venture, and in accordance with applicable accounting standards for the consolidation of variable interest entities, or VIEs, the Company determined that the Venture is not a VIE. Accordingly, the Company used the voting interest model under the accounting standards for consolidation to determine whether to consolidate the Venture. Under the joint venture agreement for the Venture, each of the Company and Toll Brothers has significant participating rights and the Company does not have exclusive control over the development or construction phases of the Venture's project. Because each partner has significant participating rights, the Company deconsolidated the land parcel that was contributed to the Venture, and the Company is accounting for the Venture under the equity method of accounting. As of
December 31, 2012
, the carrying amount of the Company's equity investment in the Venture equaled
$15.2 million
, with an associated
$0.3 million
permanent basis adjustment accounting for the difference between the fair value and carrying amount of the land parcel contributed
F- 31
by the Company. This basis adjustment will remain unamortized until the property is sold to a third party or until the Venture is dissolved, in accordance with the accounting standard for equity method investment.
Brandywine AI Venture - Station Square Acquisition
On
July 10, 2012
, the Company contributed
$26.1 million
to a joint venture, Brandywine AI Venture, that the Company formed in 2011 with an affiliate of Allstate Insurance. The Company's contribution funded its share of partner capital for the Venture's
$120.6 million
acquisition of
three
office properties containing
497,896
net rentable square feet in Silver Spring, Maryland.
Acquisitions
On
December 31, 2012
, the Company acquired a two-building office property totaling
136,075
of net rentable square feet in Austin, Texas known as
7000 West at Lantana
for
$32.1 million
. The Company funded the acquisition price with available corporate funds, while recognizing
$0.1 million
of acquisition related costs, which are included as part of general and administrative expenses in the Company's consolidated statements of operations. The acquisition was treated as a business combination and the total purchase price was allocated as follows:
$20.9 million
to building,
$4.7 million
to land,
$8.4 million
to intangible assets and
$1.9 million
to below market lease liabilities assumed.
On
December 11, 2012
, the Company acquired an office property containing
456,922
net rentable square feet in Philadelphia, Pennsylvania known as
1900 Market Street
for
$34.8 million
. The Company funded the acquisition price with available corporate funds, while recognizing
$0.1 million
of acquisition related costs, which are included as part of general and administrative expenses in the Company's consolidated statements of operations. The acquisition was treated as a business combination and the total purchase price was allocated as follows:
$17.3 million
to building,
$7.8 million
to land,
$13.5 million
to intangible assets and
$3.8 million
to below market lease liabilities assumed.
On
November 20, 2012
, the Company acquired a
ten
-acre parcel of land in Herndon, Virginia for
$2.1 million
. The Company funded the acquisition price with available corporate funds. The Company accounted for this transaction as an asset acquisition and capitalized a nominal amount of acquisition related and other costs as part of land inventory on its consolidated balance sheet.
On
January 6, 2012
, the Company acquired a vacant office property containing
154,392
net rentable square feet in Plymouth Meeting, Pennsylvania known as
660 West Germantown Pike
for
$9.1 million
. The Company is currently redeveloping this property. The Company funded the acquisition price with available corporate funds. The Company recognized
$0.1 million
of acquisition related costs that have been capitalized on our consolidated balance sheet.
Dispositions
On
July 18, 2012
, the Company sold a portfolio of
11
flex/office properties, totaling
466,719
square feet, in
Exton, Pennsylvania
, collectively known as "Oaklands Corporate Center," for a sales price of
$52.7 million
resulting in a
$9.9 million
gain on sale after closing and other transaction related costs.
On
June 22, 2012
, the Company sold
Pacific Ridge Corporate Center
, a
121,381
net rentable square feet, two-building office property located in Carlsbad, California, for a sales price of
$29.0 million
resulting in a
$2.8 million
loss on sale after closing and other transaction related costs.
On
March 22, 2012
, the Company sold
South Lake at Dulles Corner
, a
268,240
net rentable square feet office property located in Herndon, Virginia, for a sales price of
$91.1 million
resulting in a
$14.5 million
gain on sale after closing and other transaction related costs.
On
January 17, 2012
, the Company sold
304 Harper Drive
, a
32,978
net rentable square feet office property located in Moorestown, New Jersey, for a sales price of
$3.0 million
resulting in a
$0.2 million
gain on sale after closing and other transaction related costs.
Each of these sales is included in discontinued operations (see Note 10).
4. INVESTMENT IN UNCONSOLIDATED VENTURES
As of
December 31, 2013
, the Company had an aggregate investment of approximately
$180.5 million
in
17
unconsolidated Real Estate Ventures. The Company formed or acquired interests in these ventures with unaffiliated third parties to develop or manage office properties or to acquire land in anticipation of possible development of office or residential properties. As of
December 31, 2013
,
11
of the real estate ventures owned
55
office buildings that contain an aggregate of approximately
5.7 million
net rentable square feet;
two
real estate ventures owned
3.8
acres of undeveloped parcels of land;
three
real estate ventures owned
22.5
acres of land under active development and
one
real estate venture developed a hotel property that contains
137
rooms in Conshohocken, PA.
F- 32
The Company accounts for its unconsolidated interests in its Real Estate Ventures using the equity method. The Company’s unconsolidated interests range from
20%
to
65%
, subject to specified priority allocations of distributable cash in certain of the Real Estate Ventures.
The amounts reflected in the following tables (except for the Company’s share of equity and income) are based on the historical financial information of the individual Real Estate Ventures. The Company does not record operating losses of the Real Estate Ventures in excess of its investment balance unless the Company is liable for the obligations of the Real Estate Venture or is otherwise committed to provide financial support to the Real Estate Venture.
The Company’s investment in Real Estate Ventures as of
December 31, 2013
and the Company’s share of the Real Estate Ventures’ income (loss) for the year ended
December 31, 2013
was as follows (in thousands):
|
Ownership
Percentage (a)
|
Carrying
Amount
|
Company’s Share
of 2013 Real
Estate Venture
Income (Loss)
|
Real Estate
Venture
Debt at 100%
|
Current
Interest
Rate
|
Debt
Maturity
|
||||||||||||||
|
Broadmoor Austin Associates (f)
|
50
|
%
|
$
|
65,867
|
|
$
|
(52
|
)
|
$
|
56,616
|
|
7.04
|
%
|
Apr-23
|
|||||
|
Brandywine-AI Venture LLC
|
50
|
%
|
46,406
|
|
130
|
|
134,500
|
|
3.92
|
%
|
(b)
|
||||||||
|
DRA (G&I) Austin (f)
|
50
|
%
|
17,262
|
|
(434
|
)
|
230,600
|
|
3.39
|
%
|
(c)
|
||||||||
|
HSRE-Campus Crest IX, LLC (f)
|
30
|
%
|
13,761
|
|
—
|
|
966
|
|
L+2.20%
|
|
Jul-16
|
||||||||
|
4040 Wilson LLC
|
50
|
%
|
13,499
|
|
—
|
|
—
|
|
N/A
|
|
N/A
|
||||||||
|
TB-BDN Plymouth Apartments
|
50
|
%
|
12,402
|
|
5
|
|
—
|
|
L+1.70%
|
|
Dec-17
|
||||||||
|
Brandywine 1919 Ventures
|
50
|
%
|
6,214
|
|
—
|
|
—
|
|
N/A
|
|
N/A
|
||||||||
|
1000 Chesterbrook Blvd.
|
50
|
%
|
2,064
|
|
461
|
|
24,861
|
|
4.75
|
%
|
Dec-21
|
||||||||
|
Four Tower Bridge
|
65
|
%
|
1,617
|
|
320
|
|
10,535
|
|
5.20
|
%
|
Feb-21
|
||||||||
|
PJP VII
|
25
|
%
|
783
|
|
239
|
|
6,250
|
|
L+2.65%
|
|
Dec-19
|
||||||||
|
Residence Inn Tower Bridge
|
50
|
%
|
742
|
|
326
|
|
13,700
|
|
5.63
|
%
|
Feb-16
|
||||||||
|
Seven Tower Bridge
|
20
|
%
|
447
|
|
—
|
|
11,035
|
|
4.22
|
%
|
(d)
|
||||||||
|
PJP II
|
30
|
%
|
330
|
|
(87
|
)
|
3,765
|
|
6.12
|
%
|
Nov-23
|
||||||||
|
PJP V
|
25
|
%
|
175
|
|
158
|
|
5,437
|
|
6.47
|
%
|
Aug-19
|
||||||||
|
PJP VI
|
25
|
%
|
112
|
|
70
|
|
8,404
|
|
6.08
|
%
|
Apr-23
|
||||||||
|
BDN Beacon Venture LLC (i)
|
20
|
%
|
—
|
|
907
|
|
—
|
|
N/A
|
|
N/A
|
||||||||
|
Six Tower Bridge (g)
|
63
|
%
|
—
|
|
165
|
|
—
|
|
N/A
|
|
N/A
|
||||||||
|
One Commerce Square (h)
|
25
|
%
|
—
|
|
933
|
|
—
|
|
N/A
|
|
N/A
|
||||||||
|
Two Commerce Square (h)
|
25
|
%
|
—
|
|
614
|
|
—
|
|
N/A
|
|
N/A
|
||||||||
|
G&I Interchange Office LLC (DRA — N. PA) (e) (f)
|
20
|
%
|
—
|
|
(619
|
)
|
177,207
|
|
5.78
|
%
|
Jan-15
|
||||||||
|
Two Tower Bridge (i)
|
35
|
%
|
—
|
|
265
|
|
—
|
|
N/A
|
|
N/A
|
||||||||
|
Coppell Associates
|
50
|
%
|
(1,169
|
)
|
(78
|
)
|
15,984
|
|
5.75
|
%
|
Feb-16
|
||||||||
|
Eight Tower Bridge (i)
|
—
|
|
3
|
|
—
|
|
|||||||||||||
|
Invesco, L.P. (i)
|
—
|
|
338
|
|
—
|
|
|||||||||||||
|
$
|
180,512
|
|
$
|
3,664
|
|
$
|
699,860
|
|
|||||||||||
|
(a)
|
Ownership percentage represents the Company's entitlement to residual distributions after payments of priority returns, where applicable.
|
|
(b)
|
The debt for these properties is comprised of
three
fixed rate mortgages: (1)
$40.0 million
with a
4.40%
fixed interest rate due
January 1, 2019
, (2)
$28.0 million
with a
4.65%
fixed interest rate due
January 1, 2022
, and (3)
$66.5 million
with a
3.22%
fixed interest rate due
August 1, 2019
, resulting in a time and dollar weighted average rate of
3.92%
.
|
|
(c)
|
The debt for these properties is comprised of three mortgages: (1)
$34.0 million
with a
3.52%
interest rate due
November 1, 2018
, (2)
$56.0 million
with a
3.19%
interest rate due
October 15, 2018
, and (3)
$140.6 million
with a rate of
3.44%
fixed interest rate due
November 1, 2018
, resulting in a time and dollar weighted average rate of
3.39%
.
|
F- 33
|
(d)
|
Comprised of
two
fixed rate mortgages totaling
$8.0 million
that mature on
February 8, 2015
and accrue interest at a current rate of
6%
(increasing by
1%
annually through maturity), a
$1.0 million
3%
fixed rate loan with interest only through its September 1, 2025 maturity, and a
$2.0 million
4%
fixed rate loan with interest only through its February 7, 2016 maturity, resulting in a time and dollar weighted average rate of
4.22%
.
|
|
(e)
|
Proceeds received by the Company from the sale of an
80%
ownership stake in the properties exceeded the historical cost of those properties. No investment in the real estate venture was reflected on the balance sheet at formation.
|
|
(f)
|
The basis differences associated with these ventures are allocated between cost and the underlying equity in the net assets of the investee and is accounted for as if the entity were consolidated (i.e., allocated to the Company’s relative share of assets and liabilities with an adjustment to recognize equity in earnings for the appropriate depreciation/amortization).
|
|
(g)
|
On
June 19, 2013
, we acquired ownership of Six Tower Bridge. Real estate venture income reflects our previous partnership interest for the year to date period through June 18, 2013.
|
|
(h)
|
On
December 19, 2013
, we increased our ownership interest in One and Two Commerce Square. The real estate venture income reflects our previous partnership interest for the year to date period through December 18, 2013.
|
|
(i)
|
The ownership interest in these properties was disposed of prior to December 31, 2013. For further information on BDN Beacon LLC, see the section entitled BDN Beacon Venture below. For further information on Two Tower Bridge, see the section entitled Two and Six Tower Bridge Exchange Transaction below.
|
The following is a summary of the financial position of the Real Estate Ventures as of
December 31, 2013
and
December 31, 2012
(in thousands):
|
December 31,
2013 |
December 31,
2012 |
||||||
|
Net property
|
$
|
965,475
|
|
$
|
923,536
|
|
|
|
Other assets
|
164,152
|
|
174,677
|
|
|||
|
Other liabilities
|
49,442
|
|
53,645
|
|
|||
|
Debt
|
699,860
|
|
724,780
|
|
|||
|
Equity
|
380,325
|
|
319,788
|
|
|||
|
Company’s share of equity (Company’s basis)
|
180,512
|
|
193,555
|
|
|||
The following is a summary of results of operations of the Real Estate Ventures in which the Company had interests as of December 31,
2013, 2012 and 2011
(in thousands):
|
Years ended December 31,
|
|||||||||||
|
|
2013
|
2012
|
2011
|
||||||||
|
Revenue
|
$
|
102,919
|
|
$
|
164,013
|
|
$
|
145,867
|
|
||
|
Operating expenses
|
40,436
|
|
70,775
|
|
63,715
|
|
|||||
|
Interest expense, net
|
26,529
|
|
41,633
|
|
42,032
|
|
|||||
|
Depreciation and amortization
|
35,138
|
|
50,241
|
|
39,172
|
|
|||||
|
Net income
|
816
|
|
1,364
|
|
948
|
|
|||||
|
Company’s share of income (Company’s basis)
|
3,664
|
|
2,741
|
|
3,775
|
|
|||||
As of
December 31, 2013
, the aggregate principal payments of recourse and non-recourse debt payable to third-parties are as follows (in thousands):
|
2014
|
$
|
11,940
|
|
|
2015
|
191,304
|
|
|
|
2016
|
42,180
|
|
|
|
2017
|
13,937
|
|
|
|
2018
|
229,780
|
|
|
|
Thereafter
|
210,719
|
|
|
|
|
$
|
699,860
|
|
Austin Venture
On
October 16, 2013
, the Company contributed a portfolio of
seven
office properties containing an aggregate of
1,398,826
square feet located in Austin, Texas (the "Austin Properties") to a newly-formed joint venture (the "Austin Venture") with G&I VII Austin
F- 34
Office LLC (“DRA”). The Austin Properties and related assets represent the Company's entire remaining property portfolio within the Austin, Texas region, with the exception of the acquisition of Four Points Centre disclosed in Note 3. DRA and the Company, based on arm's-length negotiation, agreed to an aggregate gross sales price of
$330.0 million
subject to an obligation on the Company's part to fund the first
$5.2 million
of post-closing capital expenditures, of which
$0.8 million
had been funded by us through December 31, 2013.
DRA owns a
50%
interest in the Austin Venture and the Company owns a
50%
interest in the Austin Venture, subject to the Company's right to receive up to an additional
10%
of distributions.
At the closing the Austin Venture obtained third party debt financing of approximately
$230.6 million
secured by mortgages on the Austin Properties and used proceeds of this financing together with
$49.7 million
of cash contributions by DRA (less
$1.9 million
of closing costs and
$6.9 million
of closing prorations and lender holdbacks) to fund a
$271.5 million
distribution to the Company. The Company has agreed to fund the first
$5.2 million
of post-closing capital expenditures on behalf of the Austin Venture, resulting in net proceeds of
$266.3 million
after funding the Company's capital expenditure obligation. As part of the transaction, the Company's subsidiary management company executed an agreement with the Austin Venture to provide property management and leasing services to the Austin Venture in exchange for a market-based fee.
The Company and DRA, utilizing additional equity funding of up to
$100.0 million
per partner and to-be-determined third-party debt financing, intend to jointly pursue additional office opportunities in targeted Austin sub-markets and plan to co-invest in acquisitions that meet certain investment criteria.
Based upon the facts and circumstances at formation of the Austin Venture, the Company determined that the Austin Venture is not a VIE in accordance with the accounting standard for the consolidation of VIEs. As a result, the Company used the voting interest model under the accounting standard for consolidation in order to determine whether to consolidate the Austin Venture. Based upon each member's substantive participating rights over the activities of the Austin Venture under the operating and related agreements of the Austin Venture, it is not consolidated by the Company, and is accounted for under the equity method of accounting. As a result, the Company measured its equity interest at fair value based on the fair value of the Austin Properties and the distribution provisions of the real estate venture agreement. Since the Company retains a non-controlling interest in the Austin Properties and there are no other facts and circumstances that preclude the consummation of a sale, the contribution qualifies as a partial sale of real estate under the relevant guidance for sales of real estate. Accordingly, during the fourth quarter of 2013, the Company recorded a gain of approximately
$25.9 million
, which is reflected in "Net gain (loss) on real estate venture transactions" on the accompanying statement of operations.
The Company's continuing involvement with the properties through its interest in the Venture and its management and leasing activities represents a significant continuing involvement in the properties. Accordingly, under the accounting standard for reporting discontinued operations, the Company has determined that the gain on partial sale and the operations of the properties should not be included as part of discontinued operations in its consolidated statements of operations.
4040 Wilson Venture
On
July 31, 2013
, the Company formed 4040 Wilson LLC Venture ("4040 Wilson"), a joint venture between the Company and Ashton Park Associates LLC (“Ashton Park”), an unaffiliated third party. Each of the Company and Ashton Park owns a
50%
interest in 4040 Wilson. 4040 Wilson expects to construct a
426,900
square foot office representing the final phase of the eight building, mixed-use, Liberty Center complex developed by the parent company of Ashton Park in the Ballston submarket of Arlington, Virginia. 4040 Wilson expects to develop the office building on a
1.3
-acre land parcel contributed by Ashton Park to 4040 Wilson at an agreed upon value of
$36.0 million
. The total estimated project costs are
$194.1
million, which the Company expects will be financed through approximately
$72.0
million of partner capital contributions (consisting of land with a value of
$36.0 million
from Ashton Park and
$36.0 million
in cash from the Company, of which
$13.5 million
has been funded to date) and approximately
$125.1 million
of debt financing through a construction lender that has not yet been determined. As part of the 4040 Wilson venture, the Company has agreed to guarantee
100%
of any lender mandated recourse. As of
December 31, 2013
, the Company had not provided any guarantees in respect of 4040 Wilson.
Based upon the facts and circumstances at formation of 4040 Wilson, the Company determined that 4040 Wilson is a VIE in accordance with the accounting standard for the consolidation of VIEs. As a result, the Company used the variable interest model under the accounting standard for consolidation in order to determine whether to consolidate 4040 Wilson. Based upon each member's shared power over the activities of 4040 Wilson under the operating and related agreements of 4040 Wilson, and the Company's lack of control over the development and construction phases of the project, 4040 Wilson is not consolidated by the Company, and is accounted for under the equity method of accounting.
F- 35
Two and Six Tower Bridge Exchange Transaction
On June 19, 2013, the Company acquired, from an unaffiliated third party, the third party's ownership interest in the Six Tower Bridge real estate venture through a nonmonetary exchange for the Company's ownership interest in the Two Tower Bridge real estate venture. The Six Tower Bridge real estate venture owns an unencumbered office property in Conshohocken, PA. The Company previously accounted for its noncontrolling interest in Six Tower Bridge using the equity method. As a result of the exchange transaction, the Company obtained control of the Six Tower Bridge property and the Company's existing equity interest was remeasured at fair value based on the fair value of the underlying property and the distribution provisions of the real estate venture agreement. Accordingly, during 2013, the Company recorded a gain of approximately
$7.8 million
, which is reflected in "Net gain from remeasurement of investments in a real estate ventures" on the accompanying statement of operations. Following the acquisition, the Class A office property in Conshohocken, PA is wholly owned by the Company with an unencumbered fair value of
$24.5 million
. The Company accounted for this transaction as a business combination and allocated the fair value as follows:
$14.8 million
to building,
$6.9 million
to land,
$3.3 million
to intangible assets and
$0.5 million
to below market lease liabilities assumed.
As mentioned above, the Company exchanged its non-controlling interest in Two Tower Bridge real estate venture in a nonmonetary transaction with an unaffiliated third party for the third party's interest in the Six Tower Bridge real estate venture. The investment in Two Tower Bridge had a fair value of
$3.6 million
on the date of the exchange transaction based on the fair value of the venture's equity and the distribution provisions of the real estate venture agreement. Based on this fair value and the carrying value for the Company's investment of
$(0.1) million
, during 2013 the Company recognized a gain on exchange of
interests in real estate ventures
of
$3.7 million
, which is reflected in "Net gain (loss) on real estate venture transactions" on the accompanying statement of operations.
evo at Cira Centre South Venture (formerly the Grove Venture)
On
January 25, 2013
, the Company formed HSRE-Campus Crest IX Real Estate Venture ("evo at Cira"), a joint venture among the Company and two unaffiliated third parties: Campus Crest Properties, LLC ("Campus Crest") and HSRE-Campus Crest IXA, LLC ("HSRE"). evo at Cira has commenced construction of a
33
-story,
850
-bed student housing tower located in the University City submarket of Philadelphia, Pennsylvania. Each of the Company and Campus Crest owns a
30%
interest in evo at Cira and HSRE owns a
40%
interest. evo at Cira is developing the project on a
one
-acre land parcel held under a long-term ground lease with a third party lessor. The Company contributed to evo at Cira its tenancy rights under a long-term ground lease, together with associated development rights, at an agreed-upon value of
$8.5 million
. The total estimated project costs are
$158.5 million
, which will be financed through partner capital contributions totaling
$60.7 million
, with the remaining
$97.8 million
being financed through construction facilities provided by PNC Bank, Capital One and First Niagara Bank. As of December 31, 2013, we have funded 100% of our share of the equity contributions. Construction has already commenced, with a targeted project completion in 2014.
In connection with the development of evo at Cira, each of the Company and Campus Crest provided, in addition to customary non-recourse carve-out guarantees, a completion and cost overrun guaranty, as well as a payment guaranty, on the construction financing (with the Company's share of the payment guaranty being approximately
$24.7 million
).
The Company's historical cost basis in the development rights that it contributed to the evo at Cira was
$4.0 million
, thus creating a
$4.5 million
basis difference at December 31, 2013 between the Company's initial outside investment basis and its
$8.5 million
initial equity basis. As this basis difference is not related to a physical land parcel, but rather to development rights to construct evo at Cira, the Company will accrete the basis difference as a reduction of depreciation expense over the life of evo at Cira's assets.
Based upon the facts and circumstances at evo at Cira formation, the Company determined that evo at Cira is a VIE in accordance with the accounting standard for the consolidation of VIEs. As a result, the Company used the variable interest model under the accounting standard for consolidation in order to determine whether to consolidate the evo at Cira. Based upon each member's shared power over the activities of evo at Cira under the operating and related agreements of evo at Cira, and the Company's lack of exclusive control over the development and construction phases of the project, evo at Cira is not consolidated by the Company, and is accounted for under the equity method of accounting. Accordingly, the land parcel and associated development rights contributed by the Company to evo at Cira were deconsolidated by the Company upon formation of evo at Cira.
BDN Beacon Venture
On
March 26, 2013
, the Company sold its entire
20%
ownership interest in an unconsolidated real estate venture known as BDN Beacon Venture LLC (the "Beacon Venture"). The carrying amount of the Company's investment in the Beacon Venture amounted to
$17.0 million
at the sale date, with the Company's proceeds effectively matching the carrying amount.
F- 36
Guarantees
As of
December 31, 2013
, the Company has provided guarantees on behalf of certain real estate ventures, consisting of (i) a
$24.7 million
payment guaranty on the construction loan for the project being undertaken by evo at Cira; (ii) a
$3.2 million
payment guarantee on the construction loan for a project being undertaken by TB-BDN Plymouth Apartments; and (iii) a
$0.5 million
payment guarantee on a loan provided to PJP VII. In addition, during construction undertaken by real estate ventures the Company provided and expects to continue to provide cost overrun and completion guarantees, with rights of contribution among partners in the venture, as well as customary environmental indemnities and guarantees of customary exceptions to nonrecourse provisions in loan agreements.
5. DEFERRED COSTS
As of
December 31, 2013
and
2012
, the Company’s deferred costs were comprised of the following (in thousands):
|
|
December 31, 2013
|
||||||||||
|
Total Cost
|
Accumulated
Amortization
|
Deferred Costs,
net
|
|||||||||
|
Leasing Costs
|
$
|
155,885
|
|
$
|
(58,805
|
)
|
$
|
97,080
|
|
||
|
Financing Costs
|
40,317
|
|
(14,443
|
)
|
25,874
|
|
|||||
|
Total
|
$
|
196,202
|
|
$
|
(73,248
|
)
|
$
|
122,954
|
|
||
|
|
December 31, 2012
|
||||||||||
|
Total Cost
|
Accumulated
Amortization
|
Deferred Costs,
net
|
|||||||||
|
Leasing Costs
|
$
|
150,331
|
|
$
|
(58,343
|
)
|
$
|
91,988
|
|
||
|
Financing Costs
|
40,246
|
|
(9,991
|
)
|
30,255
|
|
|||||
|
Total
|
$
|
190,577
|
|
$
|
(68,334
|
)
|
$
|
122,243
|
|
||
During the years ended December 31, 2013, 2012 and 2011, the Company capitalized internal direct leasing costs of
$7.5 million
,
$7.5 million
, and
$6.6 million
, respectively, in accordance with the accounting standard for the capitalization of leasing costs.
6. INTANGIBLE ASSETS
As of
December 31, 2013
and
2012
, the Company’s intangible assets were comprised of the following (in thousands):
|
|
December 31, 2013
|
||||||||||
|
Total Cost
|
Accumulated
Amortization
|
Intangible Assets,
net
|
|||||||||
|
In-place lease value
|
$
|
150,782
|
|
$
|
(35,607
|
)
|
$
|
115,175
|
|
||
|
Tenant relationship value
|
38,692
|
|
(26,868
|
)
|
11,824
|
|
|||||
|
Above market leases acquired
|
6,673
|
|
(1,343
|
)
|
5,330
|
|
|||||
|
Total
|
$
|
196,147
|
|
$
|
(63,818
|
)
|
$
|
132,329
|
|
||
|
Below market leases acquired
|
$
|
81,991
|
|
$
|
(47,547
|
)
|
$
|
34,444
|
|
||
|
|
December 31, 2012
|
||||||||||
|
Total Cost
|
Accumulated
Amortization
|
Intangible Assets,
net
|
|||||||||
|
In-place lease value
|
$
|
87,909
|
|
$
|
(42,894
|
)
|
$
|
45,015
|
|
||
|
Tenant relationship value
|
56,137
|
|
(37,389
|
)
|
18,748
|
|
|||||
|
Above market leases acquired
|
8,565
|
|
(1,708
|
)
|
6,857
|
|
|||||
|
Total
|
$
|
152,611
|
|
$
|
(81,991
|
)
|
$
|
70,620
|
|
||
|
Below market leases acquired
|
$
|
77,083
|
|
$
|
(43,224
|
)
|
$
|
33,859
|
|
||
F- 37
For the years ended
December 31, 2013
,
2012
, and
2011
, the Company wrote-off through the acceleration of amortization approximately
$1.6 million
,
$1.4 million
and
$7.4 million
, respectively, of intangible assets as a result of tenant move-outs prior to the end of the associated lease term. For the years ended
December 31, 2013
and
December 31, 2012
, the Company accelerated amortization of a
nominal
amount of intangible liabilities as a result of tenant move-outs. For the year ended
December 31, 2011
, the Company accelerated amortization of
$0.2 million
of intangible liabilities as a result of tenant move-outs.
As of
December 31, 2013
, the Company’s annual amortization for its intangible assets/liabilities was as follows (in thousands, and assuming no early lease terminations):
|
Assets
|
Liabilities
|
||||||
|
2014
|
$
|
27,043
|
|
$
|
7,614
|
|
|
|
2015
|
23,314
|
|
5,455
|
|
|||
|
2016
|
18,573
|
|
3,486
|
|
|||
|
2017
|
16,573
|
|
2,890
|
|
|||
|
2018
|
12,161
|
|
2,353
|
|
|||
|
Thereafter
|
34,665
|
|
12,646
|
|
|||
|
Total
|
$
|
132,329
|
|
$
|
34,444
|
|
|
The following table sets forth information regarding the Company’s consolidated debt obligations outstanding at
December 31, 2013
and
2012
(in thousands):
|
Property / Location
|
December 31,
2013
|
December 31,
2012
|
Effective
Interest
Rate
|
|
Maturity
Date
|
|||||||||
|
MORTGAGE DEBT:
|
||||||||||||||
|
Tysons Corner
|
$
|
91,395
|
|
$
|
93,188
|
|
5.36
|
%
|
Aug-15
|
|||||
|
One Commerce Square
|
125,089
|
|
—
|
|
3.68
|
%
|
(a)
|
Jan-16
|
||||||
|
Two Logan Square
|
88,583
|
|
89,340
|
|
7.57
|
%
|
Apr-16
|
|||||||
|
Fairview Eleven Tower
|
21,630
|
|
22,000
|
|
4.25
|
%
|
(b)
|
Jan-17
|
||||||
|
Two Commerce Square
|
112,000
|
|
—
|
|
4.51
|
%
|
(a)
|
Apr-23
|
||||||
|
IRS Philadelphia Campus
|
190,964
|
|
197,111
|
|
7.00
|
%
|
Sep-30
|
|||||||
|
Cira South Garage
|
40,101
|
|
42,303
|
|
7.12
|
%
|
Sep-30
|
|||||||
|
Principal balance outstanding
|
669,762
|
|
443,942
|
|
|
|
|
|
||||||
|
Plus: fair market value premiums (discounts), net
|
389
|
|
(968
|
)
|
|
|
|
|
||||||
|
Total mortgage indebtedness
|
$
|
670,151
|
|
$
|
442,974
|
|
|
|
|
|
||||
|
UNSECURED DEBT:
|
|
|
|
|
|
|
||||||||
|
Credit Facility
|
—
|
|
69,000
|
|
LIBOR + 1.50%
|
|
Feb-16
|
|||||||
|
Three-Year Term Loan - Swapped to fixed
|
150,000
|
|
150,000
|
|
2.60
|
%
|
Feb-15
|
|||||||
|
Four-Year Term Loan
|
100,000
|
|
100,000
|
|
LIBOR + 1.75%
|
|
Feb-16
|
|||||||
|
Seven-Year Term Loan - Swapped to fixed
|
200,000
|
|
200,000
|
|
3.62
|
%
|
Feb-19
|
|||||||
|
$250.0M 5.400% Guaranteed Notes due 2014
|
218,549
|
|
238,379
|
|
5.53
|
%
|
Nov-14
|
|||||||
|
$250.0M 7.500% Guaranteed Notes due 2015
|
157,625
|
|
166,535
|
|
7.76
|
%
|
May-15
|
|||||||
|
$250.0M 6.000% Guaranteed Notes due 2016
|
149,919
|
|
150,429
|
|
5.95
|
%
|
Apr-16
|
|||||||
|
$300.0M 5.700% Guaranteed Notes due 2017
|
300,000
|
|
300,000
|
|
5.68
|
%
|
May-17
|
|||||||
|
$325.0M 4.950% Guaranteed Notes due 2018
|
325,000
|
|
325,000
|
|
5.13
|
%
|
Apr-18
|
|||||||
|
$250.0M 3.950% Guaranteed Notes due 2023
|
250,000
|
|
250,000
|
|
4.02
|
%
|
Feb-23
|
|||||||
|
Indenture IA (Preferred Trust I)
|
27,062
|
|
27,062
|
|
2.75
|
%
|
Mar-35
|
|||||||
|
Indenture IB (Preferred Trust I)
|
25,774
|
|
25,774
|
|
3.30
|
%
|
Apr-35
|
|||||||
|
Indenture II (Preferred Trust II)
|
25,774
|
|
25,774
|
|
3.09
|
%
|
Jul-35
|
|||||||
|
Principal balance outstanding
|
1,929,703
|
|
2,027,953
|
|
|
|
|
|
||||||
|
plus: original issue premium (discount), net
|
(4,473
|
)
|
(5,597
|
)
|
|
|
|
|
||||||
|
Total unsecured indebtedness
|
$
|
1,925,230
|
|
$
|
2,022,356
|
|
|
|
|
|
||||
|
Total Debt Obligations
|
$
|
2,595,381
|
|
$
|
2,465,330
|
|
|
|
|
|
||||
|
(a)
|
This loan was assumed upon acquisition of the related properties on December 19, 2013. The interest rate reflects the market rate at the time of acquisition.
|
F- 38
|
(b)
|
Represents the full debt amount of a property in a consolidated joint venture for which the Company maintains a
50%
interest.
|
During
2013
,
2012
, and
2011
, the Company’s weighted-average effective interest rate on its mortgage notes payable was
5.73%
,
6.65%
, and
6.72%
, respectively. As of December 31, 2013 and 2012, the net carrying value of the Company's Properties that are encumbered by mortgage indebtedness was
$669.8 million
and
$591.3 million
, respectively.
During the
year-ended December 31, 2013
, the Company repurchased
$29.3 million
of its outstanding unsecured Notes in a series of transactions that are summarized in the following table (in thousands):
|
Notes
|
Principal
|
Repurchase
Amount
|
Loss on Early Extinguishment of Debt
|
Acceleration of Deferred Financing
Amortization
|
|||||||||||
|
2014 5.400% Notes
|
$
|
19,830
|
|
$
|
20,822
|
|
$
|
(1,020
|
)
|
$
|
16
|
|
|||
|
2015 7.500% Notes
|
8,910
|
|
9,902
|
|
(1,036
|
)
|
23
|
|
|||||||
|
2016 6.000% Notes
|
510
|
|
572
|
|
(63
|
)
|
1
|
|
|||||||
|
|
$
|
29,250
|
|
$
|
31,296
|
|
$
|
(2,119
|
)
|
$
|
40
|
|
|||
The Parent Company unconditionally guarantees the unsecured debt obligations of the Operating Partnership (or is a co-borrower with the Operating Partnership) but does not by itself incur unsecured indebtedness. The Parent Company has no material assets other than its investment in the Operating Partnership.
The Company utilizes its unsecured revolving credit facility (the "Credit Facility") for general business purposes, including funding costs of acquisitions, developments and redevelopments and repayment of other debt. The scheduled maturity date of the Credit Facility in place at
December 31, 2013
is
February 1, 2016
. The per annum variable interest rate on the outstanding balances is LIBOR plus
1.50%
. The interest rate and facility fee are subject to adjustment upon a change in the Company’s unsecured debt ratings. During each of the
years ended December 31, 2013 and 2012
, the weighted-average interest rates associated with the Credit Facility was
0.29%
and
1.02%
, respectively. As of
December 31, 2013
, the Company did not have any outstanding borrowings on its Credit Facility, with
$1.3 million
in letters of credit outstanding, leaving
$598.7 million
of unused availability under the Credit Facility.
The Company has the option to increase the amounts available to be advanced under the Credit Facility, the
$150.0 million
three-year term loan, and the
$100.0 million
four-year term loan by an aggregate of
$200.0 million
, subject to customary conditions and limitations, by obtaining additional commitments from the current lenders and other financial institutions. The Company also has the option to extend the maturity dates of each of the Credit Facility, the
$150.0 million
three-year term loan and the
$100.0 million
four-year term loan by
one year
, subject to payment of an extension fee and other customary conditions and limitations. The Company may repay the
$150.0 million
three-year term and the
$100.0 million
four-year term loans at any time without penalty. The
$200.0 million
seven-year term loan is subject to a prepayment penalty of
1.00%
through February 1, 2015 with no penalty thereafter.
The spread to LIBOR for LIBOR-based loans under the Credit Facility and term loans depends on the Company's unsecured senior debt credit rating. Based on the Company's current credit rating, the spread for such loans will be
150
basis points under the Credit Facility,
175
basis points under both the
$150.0 million
three-year term loan and
$100.0 million
four-year term loan and
190
basis points under the
$200.0 million
seven-year term loan. At the Company's option, advances under the Credit Facility and term loans may also bear interest at a per annum floating rate equal to the higher of the prime rate or the
federal funds rate plus 0.50%
per annum. The Credit Facility contains a competitive bid option that allows banks that are part of the lender consortium to bid to make loans to the Company at a reduced rate. The Company executed hedging transactions that fix the rate on the
$200.0 million
seven-year term loan at a
3.623%
average rate for its full term, and the rate on the
$150.0 million
three-year term loan at a
2.596%
average rate for periods of
three
to
four
years. All hedges commenced on
February 1, 2012
and the rates are inclusive of the LIBOR spread based on our current investment grade rating. See Note 9 for details of the interest rate swaps entered into as of
December 31, 2013
.
The Credit Facility and term loans contain financial and operating covenants and restrictions. The Company was in compliance with all such restrictions and financial covenants as of
December 31, 2013
. In the event of a default related to the financing and operating covenants, the Company's dividend distributions are limited to the greater of 95% of funds from operations or the minimum amount necessary for the Company to maintain its status as a REIT.
F- 39
As of
December 31, 2013
, the Company’s aggregate scheduled principal payments of debt obligations, excluding amortization of discounts and premiums, were as follows (in thousands):
|
2014
|
$
|
232,375
|
|
|
2015
|
409,654
|
|
|
|
2016
|
467,705
|
|
|
|
2017
|
330,323
|
|
|
|
2018
|
336,954
|
|
|
|
Thereafter
|
822,454
|
|
|
|
Total principal payments
|
2,599,465
|
|
|
|
Net unamortized premiums/(discounts)
|
(4,084
|
)
|
|
|
Outstanding indebtedness
|
$
|
2,595,381
|
|
8. FAIR VALUE OF FINANCIAL INSTRUMENTS
The Company determined the fair values disclosed below using available market information and discounted cash flow analyses as of
December 31, 2013
and
2012
, respectively. The discount rate used in calculating fair value is the sum of the current risk free rate and the risk premium on the date of measurement of the instruments or obligations. Considerable judgment is necessary to interpret market data and to develop the related estimates of fair value. Accordingly, the estimates presented are not necessarily indicative of the amounts that the Company could realize upon disposition. The use of different estimation methodologies may have a material effect on the estimated fair value amounts shown. The Company believes that the carrying amounts reflected in the consolidated balance sheets at
December 31, 2013
and
2012
approximate the fair values for cash and cash equivalents, accounts receivable, other assets, accounts payable and accrued expenses.
The following are financial instruments for which the Company’s estimates of fair value differ from the carrying amounts (in thousands):
|
|
December 31, 2013
|
December 31, 2012
|
|||||||||||||
|
Carrying
Amount
|
Fair
Value
|
Carrying
Amount
|
Fair
Value
|
||||||||||||
|
Mortgage notes payable
|
$
|
669,762
|
|
|
$
|
715,244
|
|
$
|
443,942
|
|
|
$
|
486,412
|
|
|
|
Unsecured notes payable
|
$
|
1,401,093
|
|
|
$
|
1,471,041
|
|
$
|
1,430,343
|
|
|
$
|
1,553,123
|
|
|
|
Variable rate debt
|
$
|
528,610
|
|
|
$
|
526,693
|
|
$
|
597,610
|
|
|
$
|
595,693
|
|
|
|
Notes receivable
|
$
|
7,026
|
|
$
|
7,759
|
|
$
|
7,226
|
|
$
|
7,783
|
|
|||
The fair value of the Company's unsecured notes payable is categorized at a Level 2 basis (as provided by the accounting standard for Fair Value Measurements and Disclosures). This is because the Company valued these instruments using quoted market prices as of
December 31, 2013
and
2012
. For the fair value of the Company's unsecured notes, the Company uses a discount rate based on the indicative new issue pricing provided by lenders.
The fair value of the Company's mortgage notes payable, variable rate debt and notes receivable are all categorized at a Level 3 basis (as provided by the accounting standard for Fair Value Measurements and Disclosures). The fair value of the variable rate debt was estimated using a discounted cash flow analysis valuation on the borrowing rates currently available to the Company for loans with similar terms and maturities, as applicable. The fair value of the mortgage debt was determined by discounting the future contractual interest and principal payments by a blended market rate for loans with similar terms, maturities and loan-to-value. The fair value of the notes receivable was determined by using the expected cash flows of the notes receivable, and discounting those cash flows using the market rate of interest for mortgage notes with a comparable level of risk. These financial instruments have been categorized as Level 3 because the Company considers the rates used in the valuation techniques to be unobservable inputs.
For the Company's mortgage loans, the Company uses an estimate based on its knowledge of the mortgage market. The weighted average discount rate for the combined variable rate debt and mortgage loans used as of
December 31, 2013
was
4.534%
. An increase in the discount rate used in the discounted cash flow model would result in a decrease to the fair value of the Company's long-term debt. Conversely, a decrease in the discount rate used in the discounted cash flow model would result in an increase to the fair value of the Company's long-term debt.
F- 40
9. RISK MANAGEMENT AND USE OF FINANCIAL INSTRUMENTS
Risk Management
In the course of its ongoing business operations, the Company encounters economic risk. There are three main components of economic risk: interest rate risk, credit risk and market risk. The Company is subject to interest rate risk on its interest-bearing liabilities. Credit risk is primarily the risk of inability or unwillingness of tenants to make contractually required payments and of counterparties on derivatives contracts to fulfill their obligations. Market risk is the risk of declines in the value of Company properties due to changes in rental rates, interest rates, supply and demand of similar products and other market factors affecting the valuation of properties.
Risks and Uncertainties
The ongoing recovery in the global economy has been much slower than anticipated and continue to have an influence on the volume of real estate transactions in the market and created credit stresses on many businesses. If the economy again deteriorates, vacancy rates may increase through 2014 and possibly beyond as the current economic climate continues to negatively impact tenants. The current financial markets also have an adverse effect on the Company’s Real Estate Venture partners and contractual counter parties, including counter parties in derivative contracts.
The Company’s Credit Facility, term loans and the indenture governing its unsecured public debt securities (Note 7) contain restrictions, requirements and other limitations on the ability to incur indebtedness, including total debt to asset ratios, secured debt to total asset ratios, debt service coverage ratios and minimum ratios of unencumbered assets to unsecured debt which it must maintain. The ability to borrow under the Credit Facility is subject to compliance with such financial and other covenants. In the event that the Company fails to satisfy these covenants, it would be in default under the Credit Facility, the term loans and the indenture and may be required to repay such debt with capital from other sources. Under such circumstances, other sources of capital may not be available, or may be available only on unattractive terms.
Availability of borrowings under the Credit Facility is subject to a traditional material adverse effect clause. Each time the Company borrows it must represent to the lenders that there have been no events of a nature which would have a material adverse effect on the business, assets, operations, condition (financial or otherwise) or prospects of the Company taken as a whole or which could negatively affect the ability of the Company to perform its obligations under the Credit Facility. While the Company believes that there are currently no material adverse effect events, it is possible that such an event could arise which would limit the Company’s borrowings under the Credit Facility. If an event occurs which is considered to have a material adverse effect, the lenders could consider the Company in default under the terms of the Credit Facility and any borrowings under the Credit Facility would become unavailable. If the Company is unable to obtain a waiver, this would have a material adverse effect on the Company’s financial position and results of operations.
The Company was in compliance with all financial covenants as of
December 31, 2013
. Management continuously monitors the Company’s compliance with and anticipated compliance with the covenants. Certain of the covenants restrict management’s ability to obtain alternative sources of capital. While the Company currently believes it will remain in compliance with its covenants, in the event that the economy deteriorates in the future, the Company may not be able to remain in compliance with such covenants, in which case a default would result absent a lender waiver.
Use of Derivative Financial Instruments
The Company’s use of derivative instruments is limited to the utilization of interest rate agreements or other instruments to manage interest rate risk exposures and not for speculative purposes. The principal objective of such arrangements is to minimize the risks and/or costs associated with the Company’s operating and financial structure, as well as to hedge specific transactions. The counterparties to these arrangements are major financial institutions with which the Company and its affiliates may also have other financial relationships. The Company is potentially exposed to credit loss in the event of non-performance by these counterparties. However, because of the high credit ratings of the counterparties, the Company does not anticipate that any of the counterparties will fail to meet these obligations as they come due. The Company does not hedge credit or property value market risks through derivative financial instruments.
The Company formally assesses, both at inception of a hedge and on an on-going basis, whether each derivative is highly-effective in offsetting changes in cash flows of the hedged item. If management determines that a derivative is not highly-effective as a hedge or if a derivative ceases to be a highly-effective hedge, the Company will discontinue hedge accounting prospectively. The related ineffectiveness would be charged to the consolidated statement of operations.
F- 41
The valuation of these instruments is determined using widely accepted valuation techniques including discounted cash flow analysis on the expected cash flows of each derivative. This analysis reflects the contractual terms of the derivatives, including the period to maturity, and uses observable market-based inputs, including interest rate curves and implied volatilities. The fair values of interest rate swaps are determined using the market standard methodology of netting the discounted future fixed cash receipts (or payments) and the discounted expected variable cash payments (or receipts). The variable cash payments (or receipts) are based on an expectation of future interest rates (forward curves) derived from observable market interest rate curves.
To comply with the provisions of the accounting standard for fair value measurements and disclosures, the Company incorporates credit valuation adjustments to appropriately reflect both its own nonperformance risk and the respective counterparty’s nonperformance risk in the fair value measurements. In adjusting the fair value of its derivative contracts for the effect of nonperformance risk, the Company has considered the impact of netting and any applicable credit enhancements, such as collateral postings, thresholds, mutual puts, and guarantees.
The following table summarizes the terms and fair values of the Company's derivative financial instruments as of
December 31, 2013
and 2012. The notional amounts provide an indication of the extent of the Company's involvement in these instruments at that time, but do not represent exposure to credit, interest rate or market risks (amounts presented in thousands and included in other liabilities on the Company's consolidated balance sheets).
|
Hedge Product
|
Hedge Type
|
Designation
|
Notional Amount
|
Strike
|
Trade Date
|
Maturity Date
|
Fair value
|
||||||||||||||||||||
|
12/31/2013
|
12/31/2012
|
12/31/2013
|
12/31/2012
|
||||||||||||||||||||||||
|
Assets
|
|||||||||||||||||||||||||||
|
Swap
|
Interest Rate
|
Cash Flow
|
(a)
|
25,774
|
|
25,774
|
|
3.300
|
%
|
December 22, 2011
|
January 30, 2021
|
549
|
|
(1,262
|
)
|
||||||||||||
|
Swap
|
Interest Rate
|
Cash Flow
|
(a)
|
25,774
|
|
25,774
|
|
3.090
|
%
|
January 6, 2012
|
October 30, 2019
|
218
|
|
(1,129
|
)
|
||||||||||||
|
$
|
51,548
|
|
$
|
51,548
|
|
$
|
767
|
|
|
$
|
(2,391
|
)
|
|||||||||||||||
|
Liabilities
|
|||||||||||||||||||||||||||
|
Swap
|
Interest Rate
|
Cash Flow
|
(a)
|
$
|
200,000
|
|
$
|
200,000
|
|
3.623
|
%
|
December 6-13, 2011
|
February 1, 2019
|
$
|
(545
|
)
|
$
|
(8,859
|
)
|
||||||||
|
Swap
|
Interest Rate
|
Cash Flow
|
(a)
|
77,000
|
|
77,000
|
|
2.703
|
%
|
December 9-13, 2011
|
February 1, 2016
|
(887
|
)
|
(1,343
|
)
|
||||||||||||
|
Swap
|
Interest Rate
|
Cash Flow
|
(a)
|
50,000
|
|
50,000
|
|
2.470
|
%
|
December 13, 2011
|
February 1, 2015
|
(283
|
)
|
(458
|
)
|
||||||||||||
|
Swap
|
Interest Rate
|
Cash Flow
|
(a)
|
23,000
|
|
23,000
|
|
2.513
|
%
|
December 7-12, 2011
|
May 1, 2015
|
(162
|
)
|
(245
|
)
|
||||||||||||
|
Swap
|
Interest Rate
|
Cash Flow
|
(a)
|
27,062
|
|
27,062
|
|
2.750
|
%
|
December 21, 2011
|
September 30, 2017
|
(311
|
)
|
(914
|
)
|
||||||||||||
|
$
|
377,062
|
|
$
|
377,062
|
|
$
|
(2,188
|
)
|
$
|
(11,819
|
)
|
||||||||||||||||
(a) Hedging unsecured variable rate debt.
The Company measures its derivative instruments at fair value and records them in the balance sheet as either an asset or liability. As of
December 31, 2013
, two interest rate swaps held asset positions and were included in other assets on the Company's consolidated balance sheet. The remaining swaps are included in other liabilities on the Company's consolidated balance sheet.
Although the Company has determined that the majority of the inputs used to value its derivatives fall within Level 2 of the fair value hierarchy, the credit valuation adjustments associated with its derivatives utilize Level 3 inputs, such as estimates of current credit spreads to evaluate the likelihood of default by itself and its counterparties. The Company has assessed the significance of the impact of the credit valuation adjustments on the overall valuation of its derivative positions and has determined that the credit valuation adjustments are not significant to the overall valuation of its derivatives. As a result, the Company has determined that its derivative valuations in their entirety are classified in Level 2 of the fair value hierarchy.
Concentration of Credit Risk
Concentrations of credit risk arise for the Company when multiple tenants of the Company are engaged in similar business activities, or are located in the same geographic region, or have similar economic features that impact in a similar manner their ability to meet contractual obligations, including those to the Company. The Company regularly monitors its tenant base to assess potential concentrations of credit risk. Management believes the current credit risk portfolio is reasonably well diversified and does not contain an unusual concentration of credit risk. No tenant accounted for
10%
or more of the Company’s rents during
2013, 2012 and 2011
. Conditions in the general economy and the global credit markets have had a significant adverse effect on numerous
F- 42
industries. The Company has tenants concentrated in various industries that may be experiencing adverse effects from the current economic conditions and the Company could be adversely affected if such tenants were to default under their leases.
10. DISCONTINUED OPERATIONS
For the years ended December 31, 2013, 2012 and 2011, income from discontinued operations relates to an aggregate of
32
properties containing approximately
2.3 million
net rentable square feet that the Company has sold since January 1, 2011.
The following table summarizes revenue and expense information for the properties sold which qualify for discontinued operations reporting since January 1, 2011 (in thousands):
|
Years ended December 31,
|
|||||||||||
|
2013
|
2012
|
2011
|
|||||||||
|
Revenue:
|
|
|
|||||||||
|
Rents
|
$
|
4,754
|
|
$
|
28,678
|
|
$
|
43,050
|
|
||
|
Tenant reimbursements
|
355
|
|
2,353
|
|
5,030
|
|
|||||
|
Termination fees
|
—
|
|
11
|
|
75
|
|
|||||
|
Other
|
123
|
|
378
|
|
110
|
|
|||||
|
Total revenue
|
5,232
|
|
31,420
|
|
48,265
|
|
|||||
|
Expenses:
|
|
|
|||||||||
|
Property operating expenses
|
1,839
|
|
8,687
|
|
13,940
|
|
|||||
|
Real estate taxes
|
649
|
|
3,468
|
|
5,356
|
|
|||||
|
Depreciation and amortization
|
1,921
|
|
10,208
|
|
16,178
|
|
|||||
|
Total operating expenses
|
4,409
|
|
22,363
|
|
35,474
|
|
|||||
|
Other income:
|
|||||||||||
|
Interest income
|
2
|
|
7
|
|
3
|
|
|||||
|
Income from discontinued operations before gain on sale of interests in real estate
|
825
|
|
9,064
|
|
12,794
|
|
|||||
|
Net gain on disposition of discontinued operations
|
3,382
|
|
34,774
|
|
7,047
|
|
|||||
|
Income from discontinued operations
|
$
|
4,207
|
|
$
|
43,838
|
|
$
|
19,841
|
|
||
Discontinued operations have not been segregated in the consolidated statements of cash flows. Therefore, amounts for certain captions will not agree with respective data in the consolidated statements of operations.
11. NON-CONTROLLING INTERESTS IN THE PARENT COMPANY'S FINANCIAL STATEMENTS
Non-controlling interests in the Parent Company’s financial statements relate to redeemable common limited partnership interests in the Operating Partnership held by parties other than the Parent Company and properties which are consolidated but not wholly owned.
Operating Partnership
The aggregate book value of the non-controlling interests associated with the redeemable common limited partnership interests that were consolidated in the accompanying consolidated balance sheet of the Parent Company as of
December 31, 2013
and
December 31, 2012
, was
$20.3 million
and
$21.2 million
, respectively. The Parent Company believes that the aggregate settlement value of these interests (based on the number of units outstanding and the closing price of the common shares on the balance sheet date) was approximately
$24.8 million
and
$22.5 million
, respectively, as of
December 31, 2013
and
December 31, 2012
.
F- 43
12. BENEFICIARIES’ EQUITY OF THE PARENT COMPANY
Earnings per Share (EPS)
The following tables detail the number of shares and net income used to calculate basic and diluted earnings per share (in thousands, except share and per share amounts; results may not add due to rounding):
|
|
Year ended December 31,
|
||||||||||||||||||||||
|
|
2013
|
2012
|
2011
|
||||||||||||||||||||
|
|
Basic
|
Diluted
|
Basic
|
Diluted
|
Basic
|
Diluted
|
|||||||||||||||||
|
Numerator
|
|
|
|
|
|||||||||||||||||||
|
Income (loss) from continuing operations
|
$
|
38,982
|
|
$
|
38,982
|
|
$
|
(37,309
|
)
|
$
|
(37,309
|
)
|
$
|
(24,556
|
)
|
$
|
(24,556
|
)
|
|||||
|
Net (income) loss from continuing operations attributable to non-controlling interests
|
(357
|
)
|
(357
|
)
|
863
|
|
863
|
|
994
|
|
994
|
|
|||||||||||
|
Amount allocable to unvested restricted shareholders
|
(363
|
)
|
(363
|
)
|
(376
|
)
|
(376
|
)
|
(505
|
)
|
(505
|
)
|
|||||||||||
|
Preferred share dividends
|
(6,900
|
)
|
(6,900
|
)
|
(10,405
|
)
|
(10,405
|
)
|
(7,992
|
)
|
(7,992
|
)
|
|||||||||||
|
Preferred share redemption charge
|
—
|
|
—
|
|
(4,052
|
)
|
(4,052
|
)
|
—
|
|
—
|
|
|||||||||||
|
Income (loss) from continuing operations available to common shareholders
|
31,362
|
|
31,362
|
|
(51,279
|
)
|
(51,279
|
)
|
(32,059
|
)
|
(32,059
|
)
|
|||||||||||
|
Income from discontinued operations
|
4,207
|
|
4,207
|
|
43,838
|
|
43,838
|
|
19,841
|
|
19,841
|
|
|||||||||||
|
Discontinued operations attributable to non-controlling interests
|
(55
|
)
|
(55
|
)
|
(797
|
)
|
(797
|
)
|
(778
|
)
|
(778
|
)
|
|||||||||||
|
Discontinued operations attributable to common shareholders
|
4,152
|
|
4,152
|
|
43,041
|
|
43,041
|
|
19,063
|
|
19,063
|
|
|||||||||||
|
Net income (loss) attributable to common shareholders
|
$
|
35,514
|
|
$
|
35,514
|
|
$
|
(8,238
|
)
|
$
|
(8,238
|
)
|
$
|
(12,996
|
)
|
$
|
(12,996
|
)
|
|||||
|
Denominator
|
|
|
|
|
|||||||||||||||||||
|
Weighted-average shares outstanding
|
153,140,458
|
|
153,140,458
|
|
143,257,097
|
|
143,257,097
|
|
135,444,424
|
|
135,444,424
|
|
|||||||||||
|
Contingent securities/Share based compensation
|
—
|
|
1,273,853
|
|
—
|
|
—
|
|
—
|
|
—
|
|
|||||||||||
|
Total weighted-average shares outstanding
|
153,140,458
|
|
154,414,311
|
|
143,257,097
|
|
143,257,097
|
|
135,444,424
|
|
135,444,424
|
|
|||||||||||
|
Earnings per Common Share:
|
|
|
|
|
|||||||||||||||||||
|
Income (loss) from continuing operations attributable to common shareholders
|
$
|
0.20
|
|
$
|
0.20
|
|
$
|
(0.36
|
)
|
$
|
(0.36
|
)
|
$
|
(0.24
|
)
|
$
|
(0.24
|
)
|
|||||
|
Discontinued operations attributable to common shareholders
|
0.03
|
|
0.03
|
|
0.30
|
|
0.30
|
|
0.14
|
|
0.14
|
|
|||||||||||
|
Net income (loss) attributable to common shareholders
|
$
|
0.23
|
|
$
|
0.23
|
|
$
|
(0.06
|
)
|
$
|
(0.06
|
)
|
$
|
(0.10
|
)
|
$
|
(0.10
|
)
|
|||||
Redeemable common limited partnership units totaling
1,763,739
in 2013,
1,845,737
in 2012, and
2,698,647
in 2011 were excluded from the diluted earnings per share computations because they are not dilutive.
The contingent securities/share based compensation impact is calculated using the treasury stock method and relates to employee awards settled in shares of the Parent Company. The effect of these securities is anti-dilutive for periods that the Parent Company incurs a net loss from continuing operations available to common shareholders and therefore is excluded from the dilutive earnings per share calculation in such periods.
Unvested restricted shares are considered participating securities which require the use of the two-class method for the computation of basic and diluted earnings per share. For the years ended December 31,
2013, 2012 and 2011
, earnings representing nonforfeitable dividends were allocated to the unvested restricted shares issued to the Company’s executives and other employees under the 1997 Plan.
F- 44
Common and Preferred Shares
On
December 10, 2013
, the Parent Company declared a distribution of
$0.15
per common share, totaling
$23.9 million
, which was paid on
January 21, 2014
to shareholders of record as of
January 6, 2014
. On
December 10, 2013
, the Parent Company declared distributions on its Series E Preferred Shares to holders of record as of
December 30, 2013
. These shares are entitled to a preferential return of
6.90%
per annum on the
$25.00
per share liquidation preference. Distributions paid on
January 15, 2014
to holders of Series E Preferred Shares totaled
$1.7 million
.
On
November 5, 2013
, the Parent Company commenced a continuous equity offering program (the “Offering Program”), under which it may sell, in at-the-market offerings, up to an aggregate amount of
16,000,000
common shares until November 5, 2016. This Offering Program replaced a prior continuous equity offering program which expired on March 10, 2013. The Parent Company may sell common shares in amounts and at times to be determined by the Parent Company. Actual sales will depend on a variety of factors to be determined by the Parent Company, including, among others, market conditions, the trading price of the Company’s common shares of beneficial interest and determinations by the Parent Company of the appropriate sources of funding. In conjunction with the Offering Program, the Parent Company engages sales agents who receive compensation, in aggregate, of up to
2%
of the gross sales price per share sold. From inception of the Offering Program through December 31, 2013, the Parent Company has not sold any shares under the program, resulting in
16,000,000
remaining shares available for sale.
On
April 10, 2013
, the Parent Company closed a public offering of
12,650,000
common shares, inclusive of
1,650,000
common shares issued upon exercise by the underwriters of the option granted to them to purchase additional shares. The Parent Company contributed the net proceeds from the sale of shares, amounting to
$181.5 million
after deducting underwriting discounts and commissions and other offering expenses, to the Operating Partnership in exchange for partnership units of the Operating Partnership. The Operating Partnership continues to use the net proceeds for working capital, capital expenditures and other general corporate purposes, which may include acquisitions, developments and the repayment, repurchase and refinancing of debt.
Common Share Repurchases
The Parent Company maintains a share repurchase program under which it may repurchase its common shares from time to time in accordance with limits set by the Board of Trustees.
The Parent Company did not repurchase any shares under the share repurchase program during the
year-ended December 31, 2013
. As of
December 31, 2013
, the Parent Company may purchase an additional
539,200
shares under the program.
Repurchases may be made from time to time in the open market or in privately negotiated transactions, subject to market conditions and compliance with legal requirements. The share repurchase program does not contain any time limitation and does not obligate the Parent Company to repurchase any shares. The Parent Company may discontinue the program at any time.
F- 45
13. PARTNERS’ EQUITY OF THE OPERATING PARTNERSHIP
Earnings per Common Partnership Unit
The following tables detail the number of units and net income used to calculate basic and diluted earnings per common partnership unit (in thousands, except unit and per unit amounts; results may not add due to rounding):
|
|
Year ended December 31,
|
||||||||||||||||||||||
|
|
2013
|
2012
|
2011
|
||||||||||||||||||||
|
|
Basic
|
Diluted
|
Basic
|
Diluted
|
Basic
|
Diluted
|
|||||||||||||||||
|
Numerator
|
|
|
|
|
|||||||||||||||||||
|
Income (loss) from continuing operations
|
$
|
38,982
|
|
$
|
38,982
|
|
$
|
(37,309
|
)
|
$
|
(37,309
|
)
|
$
|
(24,556
|
)
|
$
|
(24,556
|
)
|
|||||
|
Amount allocable to unvested restricted unitholders
|
(363
|
)
|
(363
|
)
|
(376
|
)
|
(376
|
)
|
(505
|
)
|
(505
|
)
|
|||||||||||
|
Preferred unit dividends
|
(6,900
|
)
|
(6,900
|
)
|
(10,405
|
)
|
(10,405
|
)
|
(7,992
|
)
|
(7,992
|
)
|
|||||||||||
|
Preferred unit redemption charge
|
—
|
|
—
|
|
(4,052
|
)
|
(4,052
|
)
|
—
|
|
—
|
|
|||||||||||
|
Income (loss) from continuing operations available to common unitholders
|
31,719
|
|
31,719
|
|
(52,142
|
)
|
(52,142
|
)
|
(33,053
|
)
|
(33,053
|
)
|
|||||||||||
|
Discontinued operations attributable to common unitholders
|
4,207
|
|
4,207
|
|
43,838
|
|
43,838
|
|
19,841
|
|
19,841
|
|
|||||||||||
|
Net income (loss) attributable to common unitholders
|
$
|
35,926
|
|
$
|
35,926
|
|
$
|
(8,304
|
)
|
$
|
(8,304
|
)
|
$
|
(13,212
|
)
|
$
|
(13,212
|
)
|
|||||
|
Denominator
|
|
|
|
|
|||||||||||||||||||
|
Weighted-average units outstanding
|
154,929,545
|
|
154,929,545
|
|
145,883,217
|
|
145,883,217
|
|
145,118,841
|
|
145,118,841
|
|
|||||||||||
|
Contingent securities/Share based compensation
|
—
|
|
1,273,853
|
|
—
|
|
—
|
|
—
|
|
—
|
|
|||||||||||
|
Total weighted-average units outstanding
|
154,929,545
|
|
156,203,398
|
|
145,883,217
|
|
145,883,217
|
|
145,118,841
|
|
145,118,841
|
|
|||||||||||
|
Earnings per Common Partnership Unit:
|
|
|
|
|
|||||||||||||||||||
|
Income (loss) from continuing operations attributable to common unitholders
|
$
|
0.20
|
|
$
|
0.20
|
|
$
|
(0.36
|
)
|
$
|
(0.36
|
)
|
$
|
(0.23
|
)
|
$
|
(0.23
|
)
|
|||||
|
Discontinued operations attributable to common unitholders
|
0.03
|
|
0.03
|
|
0.30
|
|
0.30
|
|
0.14
|
|
0.14
|
|
|||||||||||
|
Net income (loss) attributable to common unitholders
|
$
|
0.23
|
|
$
|
0.23
|
|
$
|
(0.06
|
)
|
$
|
(0.06
|
)
|
$
|
(0.09
|
)
|
$
|
(0.09
|
)
|
|||||
Unvested restricted units are considered participating securities which require the use of the two-class method for the computation of basic and diluted earnings per share. For the years ended December 31,
2013, 2012 and 2011
, earnings representing nonforfeitable dividends were allocated to the unvested restricted units.
Common Partnership Units and Preferred Mirror Units
The Operating Partnership issues partnership units to the Parent Company in exchange for the contribution of the net proceeds of any equity security issuance by the Parent Company. The number and terms of such partnership units correspond to the number and terms of the related equity securities issued by the Parent Company. In addition, the Operating Partnership may also issue separate classes of partnership units. Historically, the Operating Partnership has had the following types of partnership units outstanding (i) Preferred Partnership Units which have been issued to parties other than the Parent Company (ii) Preferred Mirror Partnership Units which have been issued to the Parent Company and (iii) Common Partnership Units which include both interests held by the Parent Company and those held by other limited partners. Each of these interests is described in more detail below.
Preferred Mirror Partnership Units
In exchange for the proceeds received in corresponding offerings by the Parent Company of preferred shares of beneficial interest, the Operating Partnership has issued to the Parent Company a corresponding amount of Preferred Mirror Partnership Units with terms consistent with that of the preferred securities issued by the Parent Company.
F- 46
Common Partnership Units (Redeemable and General)
The Operating Partnership has two classes of Common Partnership Units: (i) Class A Limited Partnership Interest which are held by both the Parent Company and outside third parties and (ii) General Partnership Interests which are held by the Parent Company (collectively, the Class A Limited Partnership Interest, and General Partnership Interests are referred to as “Common Partnership Units”). The holders of the Common Partnership Units are entitled to share in cash distributions from, and in profits and losses of, the Operating Partnership, in proportion to their respective percentage interests, subject to preferential distributions on the preferred mirror units and the preferred units.
The Common Partnership Units held by the Parent Company (comprised of both General Partnership Units and Class A Limited Partnership Units) are presented as partner’s equity in the consolidated financial statements. Class A Limited Partnership Interest held by parties other than the Parent Company are redeemable at the option of the holder for a like number of common shares of the Parent Company, or cash, or a combination thereof, at the election of the Parent Company. Because the form of settlement of these redemption rights are not within the control of the Operating Partnership, these Common Partnership Units have been excluded from partner’s equity and are presented as redeemable limited partnership units measured at the potential cash redemption value as of the end of the periods presented based on the closing market price of the Parent Company’s common shares at December 31,
2013, 2012 and 2011
, which was
$14.09
,
$12.19
,
$9.50
, respectively. As of
December 31, 2013
and
2012
,
1,763,739
and
1,845,737
of Class A Units, respectively, were outstanding and owned by outside limited partners of the Operating Partnership.
On
December 10, 2013
, the Operating Partnership declared a distribution of
$0.15
per common partnership unit, totaling
$23.9 million
, which was paid on
January 21, 2014
to unitholders of record as of
January 6, 2014
.
On
December 10, 2013
, the Operating Partnership declared distributions on its Series E-Linked Preferred Mirror Units to holders of record as of
December 30, 2013
. These units are entitled to a preferential return of
6.90%
per annum on the
$25.00
per unit liquidation preference. Distributions paid on
January 15, 2014
to holders of Series E-Linked Preferred Mirror Units totaled
$1.7 million
.
On
November 5, 2013
, the Parent Company commenced a continuous equity offering program (the “Offering Program”), under which it may sell, in at-the-market offerings, up to an aggregate amount of
16,000,000
common shares until
November 5, 2013
. This Offering Program replaced a prior continuous equity offering program which expired on March 10, 2013. The Parent Company may sell common shares in amounts and at times to be determined by the Parent Company. Actual sales will depend on a variety of factors to be determined by the Parent Company, including, among others, market conditions, the trading price of the Company’s common shares of beneficial interest and determinations by the Parent Company of the appropriate sources of funding. In conjunction with the Offering Program, the Parent Company engages sales agents who receive compensation, in aggregate, of up to
2%
of the gross sales price per share sold. From inception of the Offering Program through December 31, 2013, the Parent Company has not sold any shares under the program, resulting in
16,000,000
remaining shares available for sale. Generally, the Parent Company contributes the net proceeds from the sales to the Operating Partnership, which the Operating Partnership in turn uses for general corporate purposes.
Common Unit Repurchases
The Parent Company did not repurchase any shares under its share repurchase program during the
year-ended December 31, 2013
and accordingly, during the
year-ended December 31, 2013
, the Operating Partnership did not repurchase any units in connection with the Parent Company’s share repurchase program.
14. SHARE BASED COMPENSATION, 401(k) PLAN AND DEFERRED COMPENSATION
Stock Options
At
December 31, 2013
, options exercisable for
2,983,569
common shares were outstanding under the Parent Company's shareholder approved equity incentive plan. There were
184,429
options unvested as of
December 31, 2013
and
$0.1 million
of unrecognized compensation expense associated with these options to be recognized over a weighted average of
0.2
years. During the years ended December 31,
2013, 2012 and 2011
the Company recognized compensation expense related to unvested options of
$0.7 million
,
$1.6 million
, and
$1.4 million
, respectively. During the years ended December 31,
2013, 2012 and 2011
, the Company also capitalized a
$0.1 million
,
$0.5 million
and
$0.4 million
, respectively, of compensation expense as part of the Company’s review of employee salaries eligible for capitalization.
F- 47
Option activity as of
December 31, 2013
and changes during the
year-ended December 31, 2013
were as follows:
|
Shares
|
Weighted
Average
Exercise Price
|
Weighted Average
Remaining Contractual
Term (in years)
|
Aggregate Intrinsic
Value
|
|||||||||
|
Outstanding at January 1, 2013
|
3,337,549
|
|
$
|
14.85
|
|
5.95
|
$
|
—
|
|
|||
|
Exercised
|
(236,318
|
)
|
$
|
9.86
|
|
|
||||||
|
Forfeited/Expired
|
(117,662
|
)
|
$
|
18.61
|
|
|||||||
|
Outstanding at December 31, 2013
|
2,983,569
|
|
$
|
15.50
|
|
5.15
|
$
|
—
|
|
|||
|
Vested/Exercisable at December 31, 2013
|
2,799,140
|
|
$
|
15.74
|
|
5.05
|
$
|
—
|
|
|||
401(k) Plan
The Company sponsors a 401(k) defined contribution plan for its employees. Each employee may contribute up to
100%
of annual compensation, subject to specific limitations under the Internal Revenue Code. At its discretion, the Company can make matching contributions equal to a percentage of the employee’s elective contribution and profit sharing contributions. Employees automatically vest in employer contributions. The Company contributions were
$0.4 million
in each of
2013
,
2012
and
2011
.
Restricted Share Awards
As of
December 31, 2013
,
563,713
restricted shares were outstanding under the 1997 Plan and vest over
three to seven years from the initial grant date
. The remaining compensation expense to be recognized at
December 31, 2013
was approximately
$1.9 million
, and is expected to be recognized over a weighted average remaining vesting period of
1.1
years. During 2013 the Company recognized compensation expense related to outstanding restricted shares of
$3.2 million
, of which
$0.6 million
was capitalized as part of the Company’s review of employee salaries eligible for capitalization. For the years ended
December 31, 2012
and
2011
, the Company recognized
$3.4 million
(of which
$0.9 million
was capitalized) and
$3.2 million
(of which
$0.7 million
was capitalized), respectively, of compensation expense included in general and administrative expense in the respective periods related to outstanding restricted shares.
The following table summarizes the Company’s restricted share activity during the
year-ended December 31, 2013
:
|
Shares
|
Weighted
Average Grant
Date Fair value
|
|||||
|
Non-vested at January 1, 2013
|
597,708
|
|
$
|
12.57
|
|
|
|
Granted
|
182,576
|
|
13.13
|
|
||
|
Vested
|
(208,306
|
)
|
13.13
|
|
||
|
Forfeited
|
(8,265
|
)
|
11.41
|
|
||
|
Non-vested at December 31, 2013
|
563,713
|
|
$
|
12.56
|
|
|
On
February 25, 2013
, the Compensation Committee of the Company’s Board of Trustees awarded
157,208
restricted shares to the Company’s executives. The restricted shares will cliff vest
after three years from the grant date
. The vesting of the restricted shares is also subject to acceleration upon a change in control or if the recipient of the award were to die, become disabled, or be terminated without cause or retire in a qualifying retirement. Qualifying retirement means the recipient’s voluntary termination of employment after reaching at least age
57
and accumulating at least
15
years of service with the Company. In accordance with the accounting standard for stock-based compensation, the Company amortizes stock-based compensation costs through the qualifying retirement dates for those executives who meet the conditions for qualifying retirement during the scheduled vesting period.
F- 48
Restricted Performance Share Units Plan
On each of
February 25, 2013
,
March 1, 2012
and
March 2, 2011
, the Compensation Committee of the Parent Company’s Board of Trustees awarded an aggregate of
231,093
,
242,122
, and
113,256
share-based awards, respectively, to its executives. These awards are referred to as Restricted Performance Share Units, or RPSUs. The RPSUs represent the right to earn common shares. The number of common shares, if any, deliverable to award recipients depends on the Company’s performance based on its total return to shareholders during the
three years
measurement period that commenced on
January 1, 2013
(in the case of the
February 25, 2013
awards),
January 1, 2012
(in the case of the
March 1, 2012
awards), and
January 1, 2011
(in the case of the
March 2, 2011
awards), and that ends on
December 31, 2015
,
December 31, 2014
or
December 31, 2013
(as applicable) or, if earlier, the date of a change of control. In the case of the awards made on
February 25, 2013
and
March 1, 2012
, the Company's performance is compared to the shareholder return of REITs within an index over the measurement period for 50% of the RPSUs awarded on that date, with the remaining 50% being compared to the total shareholder return of REITs within the Company's proxy peer group over such period. In the case of the awards made on
March 2, 2011
, the Company's performance is compared to the total shareholder return of REITs within an index over the performance period. The vesting of RPSUs is contingent upon the continued employment of the participants through the performance periods (with exceptions for death, disability and qualifying retirement). Dividends are deemed credited to the performance units accounts and are applied to “acquire” additional RPSUs for the account of the unit holder at the price per common share on the dividend payment date. If earned, RPSUs will be settled in common shares in an amount that reflects both the number of RPSUs in the holder’s account at the end of the applicable measurement period and the Company’s total return to shareholders during the applicable three year measurement period relative to the total shareholder returns of the REITs within the index or peer group, as applicable.
On the date of each grant, the RPSUs were valued using a Monte Carlo simulation. The fair values of the 2013, 2012 and 2011 awards on the grant dates were
$4.1 million
,
$4.1 million
and
$2.0 million
, respectively. The fair values of each award are being amortized over the
three
year cliff vesting period. The vesting of RPSUs is subject to acceleration upon a change in control or if the recipient of the award were to die, become disabled or retire in a qualifying retirement prior to the vesting date. In the case of
two
of the Company's executives who have employment agreements with the Company, the vesting of the restricted shares is also subject to acceleration if either executive were to be terminated without cause or resign for good reason. Qualifying retirement means the recipient’s voluntary termination of employment after reaching age
57
years and accumulating at least
15
years of service with the Company. In accordance with the accounting standard for stock-based compensation, the Company amortizes stock-based compensation costs through the qualifying retirement date for those executives who meet the conditions for qualifying retirement during the schedule vesting period.
For the
year-ended December 31, 2013
, the Company recognized total compensation expense for the 2013, 2012 and 2011 RPSU awards of
$4.4 million
of which
$0.8 million
was capitalized consistent with the Company’s policies for capitalizing eligible portions of employee compensation. For the
year-ended December 31, 2012
, the Company recognized total compensation expense for the 2012, 2011 and 2010 awards of
$3.5 million
related to this plan, of which
$1.2 million
was capitalized consistent with the Company’s policies for capitalizing eligible portions of employee compensation. During the year ended December 31, 2011, the Company recognized total compensation expense for the 2011, 2010, and 2009 awards of
$1.7 million
related to this plan, of which
$0.5 million
was capitalized as part of the Company’s policies for capitalizing eligible portions of employee compensation.
A total of
64,678
common shares vested on
December 31, 2012
(the end of the three-year measurement period for the linked RPSUs) and were delivered to holders of the RPSUs on
March 1, 2013
in settlement of the RPSUs. Holders of these RPSUs also received cash dividend equivalents to the cash dividends paid on common shares on
February 8, 2013
.
Employee Share Purchase Plan
The Parent Company’s shareholders approved the 2007 Non-Qualified Employee Share Purchase Plan (the “ESPP”), which is intended to provide eligible employees with a convenient means to purchase common shares of the Parent Company through payroll deductions and voluntary cash purchases at an amount equal to
85% of the average closing price per share for a specified period
. Under the plan document, the maximum participant contribution for the 2013 plan year is limited to the lesser of
20%
of compensation or
$50,000
. The ESPP allows the Parent Company to make open market purchases, which reflects all purchases made under the plan to date. In addition, the number of shares separately reserved for issuance under the ESPP is
1.25 million
. During the
year-ended December 31, 2013
, employees made purchases under the ESPP of
$0.3 million
and the Company recognized
$0.1 million
of compensation expense related to the ESPP. During the years-ended December 31, 2012 and 2011, employees made purchases of
$0.4 million
under the ESPP, and the Company recognized
$0.1 million
of compensation expense related to the ESPP. Compensation expense represents the
15%
discount on the purchase price. The Board of Trustees of the Parent Company may terminate the ESPP at its sole discretion at any time.
F- 49
Deferred Compensation
In
January 2005
, the Parent Company adopted a Deferred Compensation Plan (the “Plan”) that allows trustees and certain key employees to voluntarily defer compensation. Compensation expense is recorded for the deferred compensation and a related liability is recognized. Participants may elect designated benchmark investment options for the notional investment of their deferred compensation. The deferred compensation obligation is adjusted for deemed income or loss related to the investments selected. At the time the participants defer compensation, the Company records a liability, which is included in the Company’s consolidated balance sheet. The liability is adjusted for changes in the market value of the participant-selected investments at the end of each accounting period, and the impact of adjusting the liability is recorded as an increase or decrease to compensation cost.
The Company has purchased mutual funds which can be utilized as a funding source for the Company’s obligations under the Plan. Participants in the Plan have no interest in any assets set aside by the Company to meet its obligations under the Plan. For the years-ended December 31, 2013, 2012 and 2011 the Company recorded net increases in compensation costs of
$0.2 million
,
$0.3 million
and
$0.1 million
, respectively, net of investments in the company-owned policies and mutual funds.
Participants in the Plan may elect to have all or a portion of their deferred compensation invested in the Company’s common shares. The Company holds these shares in a rabbi trust, which is subject to the claims of the Company’s creditors in the event of the Company’s bankruptcy or insolvency. The Plan does not permit diversification of a participant’s deferral allocated to the Company common shares and deferrals allocated to Company common shares can only be settled with a fixed number of shares. In accordance with the accounting standard for deferred compensation arrangements where amounts earned are held in a rabbi trust and invested, the deferred compensation obligation associated with the Company’s common shares is classified as a component of shareholder’s equity and the related shares are treated as shares to be issued and are included in total shares outstanding. At
December 31, 2013
and 2012,
0.3 million
of such shares were included in total shares outstanding. Subsequent changes in the fair value of the common shares are not reflected in operations or shareholders’ equity of the Company.
15. DISTRIBUTIONS
|
|
Years ended December 31,
|
||||||||||
|
|
2013
|
2012
|
2011
|
||||||||
|
(in thousands, except per share amounts)
|
|||||||||||
|
Common Share Distributions:
|
|
|
|
||||||||
|
Ordinary income
|
$
|
0.52
|
|
$
|
0.39
|
|
$
|
0.37
|
|
||
|
Capital gain
|
—
|
|
—
|
|
—
|
|
|||||
|
Non-taxable distributions
|
0.08
|
|
0.21
|
|
0.23
|
|
|||||
|
Distributions per share
|
$
|
0.60
|
|
$
|
0.60
|
|
$
|
0.60
|
|
||
|
Percentage classified as ordinary income
|
87.00
|
%
|
65.00
|
%
|
61.67
|
%
|
|||||
|
Percentage classified as capital gain
|
—
|
%
|
—
|
%
|
—
|
%
|
|||||
|
Percentage classified as non-taxable distribution
|
13.00
|
%
|
35.00
|
%
|
38.33
|
%
|
|||||
|
Preferred Share Distributions:
|
|
|
|
||||||||
|
Total distributions declared
|
$
|
6,900
|
|
$
|
10,405
|
|
$
|
7,992
|
|
||
|
Percentage classified as ordinary income
|
100.00
|
%
|
100.00
|
%
|
100.00
|
%
|
|||||
16. TAX CREDIT TRANSACTIONS
Historic Tax Credit Transaction
On
November 17, 2008
, the Company closed a transaction with US Bancorp (“USB”) related to the historic rehabilitation of the IRS Philadelphia Campus, a
862,692
square foot office building that is
100%
leased to the IRS. On August 27, 2010, the Company completed the development of the IRS Philadelphia Campus and the IRS lease commenced. In connection with this completed development project, USB contributed to the Company
$64.1 million
of total project costs.
In exchange for its contributions to the development of the IRS Philadelphia Campus, USB is entitled to substantially all of the benefits derived from the tax rehabilitation credits available under section 47 of the Internal Revenue Code. USB does not have a material interest in the underlying economics of the property. This transaction includes a put/call provision whereby the Company may be obligated or entitled to repurchase USB’s interest in the IRS Philadelphia Campus. The Company believes the put will be exercised and the amount attributed to that puttable non-controlling interest obligation is included in other liabilities and is being accreted to the expected fixed put price.
F- 50
Based on the contractual arrangements that obligate the Company to deliver tax benefits and provide other guarantees to USB and that entitle the Company through fee arrangements to receive substantially all available cash flow from the IRS Philadelphia Campus, the Company concluded that the IRS Philadelphia Campus should be consolidated. The Company also concluded that capital contributions received from USB, in substance, are consideration that the Company receives in exchange for its obligation to deliver tax credits and other tax benefits to USB. These receipts other than the amounts allocated to the put obligation will be recognized as revenue in the consolidated financial statements beginning when the obligation to USB is relieved which occurs upon delivery of the expected tax benefits net of any associated costs. The tax credit is subject to
20%
recapture per year beginning one year after the completion of the IRS Philadelphia Campus. The total remaining USB contributions presented within the Company’s consolidated balance sheet amounted to
$26.8 million
as of
December 31, 2013
and
$39.1 million
as of
December 31, 2012
. The contributions were recorded net of the amount allocated to non-controlling interest as described above of
$2.8 million
and
$2.6 million
at the end of the years ended
December 31, 2013
and
December 31, 2012
, respectively, with the remaining balance being presented within deferred income. Beginning in
September 2011 to September 2015
, the Company recognized and will recognize the cash received as revenue net of allocated expenses
over the five year credit recapture period as defined in the Internal Revenue Code
within other income (expense) in its consolidated statements of operations. During the years-ended
December 31, 2013
and
2012
, the Company recognized
$11.9 million
of the cash received as revenue, net of
$0.5 million
of allocated expenses within other income (expense) in its consolidated statements of operations.
Direct and incremental costs incurred in structuring the transaction are deferred and will be recognized as expense in the consolidated financial statements upon the recognition of the related revenue as discussed above. The deferred cost at
December 31, 2013
and
December 31, 2012
is
$1.0 million
and
$1.6 million
, respectively, and are included in other assets in the Company’s consolidated balance sheet. Amounts included in interest expense related to the accretion of the non-controlling interest liability and the
2%
return expected to be paid to USB on its non-controlling interest aggregate to
$1.4 million
for
year-ended December 31, 2013
and
$1.3 million
for each of the years ended December 31, 2012 and 2011.
New Markets Tax Credit Transaction
On
December 30, 2008
, the Company entered into a transaction with USB related to the Cira South Garage in Philadelphia, Pennsylvania and expects to receive a net benefit of
$7.8 million
under a qualified New Markets Tax Credit Program (“NMTC”). The NMTC was provided for in the Community Renewal Tax Relief Act of 2000 (the “Act”) and is intended to induce investment capital in under-served and impoverished areas of the United States. The Act permits taxpayers (whether companies or individuals) to claim credits against their Federal income taxes for up to
39%
of qualified investments in qualified, active low-income businesses or ventures.
USB contributed
$13.3 million
into the development of the Cira South Garage and as such it is entitled to substantially all of the benefits derived from the tax credit, but it does not have a material interest in the underlying economics of the Cira South Garage. This transaction also includes a put/call provision whereby the Company may be obligated or entitled to repurchase USB’s interest. The Company believes the put will be exercised and an amount attributed to that obligation is included in other liabilities and is being accreted to the expected fixed put price. The said put price is insignificant.
Based on the contractual arrangements that obligate the Company to deliver tax benefits and provide various other guarantees to USB, the Company concluded that the investment entities established to facilitate the NMTC transaction should be consolidated. The USB contribution of
$13.3 million
is included in deferred income on the Company’s consolidated balance sheets at each of the years ended
December 31, 2013
and
December 31, 2012
. The USB contribution other than the amount allocated to the put obligation will be recognized as income in the consolidated financial statements when the tax benefits are delivered without risk of recapture to the tax credit investors and the Company’s obligation is relieved. The Company anticipates that it will recognize the net cash received as revenue within other income/expense in the year ended
December 31, 2015
. The NMTC is subject to
100%
recapture for a period of
seven
years as provided in the Internal Revenue Code. The Company expects that the put/call provision will be exercised in 2017.
Direct and incremental costs incurred in structuring the transaction are deferred and will be recognized as expense in the consolidated financial statements upon the recognition of the related revenue as discussed above. The deferred cost at each of the years ended
December 31, 2013
and
December 31, 2012
is
$5.3 million
, and is included in other assets in the Company’s consolidated balance sheet.
F- 51
17. ACCUMULATED OTHER COMPREHENSIVE INCOME (LOSS)
The following table details the components of accumulated other comprehensive income (loss) of the Parent Company and the Operating Partnership as of and for the three years ended
December 31, 2013
(in thousands):
|
Parent Company
|
Cash Flow
Hedges |
|||
|
Balance at January 1, 2011
|
$
|
(1,945
|
)
|
|
|
Change during year
|
(4,499
|
)
|
||
|
Non-controlling interest — consolidated real estate venture partner’s share of unrealized (gains)/losses on derivative financial instruments
|
212
|
|
||
|
Reclassification adjustments for (gains) losses reclassified into operations
|
153
|
|
||
|
Balance at December 31, 2011
|
$
|
(6,079
|
)
|
|
|
Change during year
|
(7,338
|
)
|
||
|
Non-controlling interest — consolidated real estate venture partner’s share of unrealized (gains)/losses on derivative financial instruments
|
187
|
|
||
|
Settlement of interest rate swaps
|
(2,985
|
)
|
||
|
Reclassification adjustments for (gains) losses reclassified into operations
|
297
|
|
||
|
Balance at December 31, 2012
|
$
|
(15,918
|
)
|
|
|
Change during year
|
12,789
|
|
||
|
Non-controlling interest — consolidated real estate venture partner’s share of unrealized (gains)/losses on derivative financial instruments
|
(152
|
)
|
||
|
Reclassification adjustments for (gains) losses reclassified into operations
|
286
|
|
||
|
Balance at December 31, 2013
|
$
|
(2,995
|
)
|
|
|
Operating Partnership
|
Cash Flow
Hedges |
|||
|
Balance at January 1, 2011
|
$
|
(2,080
|
)
|
|
|
Change during year
|
(4,499
|
)
|
||
|
Reclassification adjustments for (gains) losses reclassified into operations
|
153
|
|
||
|
Balance at December 31, 2011
|
$
|
(6,426
|
)
|
|
|
Change during year
|
(7,338
|
)
|
||
|
Settlement of interest rate swaps
|
(2,985
|
)
|
||
|
Reclassification adjustments for (gains) losses reclassified into operations
|
297
|
|
||
|
Balance at December 31, 2012
|
$
|
(16,452
|
)
|
|
|
Change during year
|
12,789
|
|
||
|
Reclassification adjustments for (gains) losses reclassified into operations
|
286
|
|
||
|
Balance at December 31, 2013
|
$
|
(3,377
|
)
|
|
Over time, the unrealized gains and losses held in Accumulated Other Comprehensive Income (“AOCI”) will be reclassified to interest expense when the related hedged items are recognized in earnings. The current balance held in AOCI is expected to be reclassified to interest expense for realized losses on forecasted debt transactions over the related term of the debt obligation, as applicable.
F- 52
18. SEGMENT INFORMATION
During the year ended
December 31, 2013
, the Company was managing its portfolio within
seven
segments: (1) Pennsylvania, (2) Philadelphia Central Business District (CBD), (3) Metropolitan Washington D.C., (4) New Jersey/Delaware, (5) Richmond, Virginia, (6) Austin, Texas and (7) California. The Pennsylvania segment includes properties in Chester, Delaware, and Montgomery counties in the Philadelphia suburbs. The Philadelphia CBD segment includes properties located in the City of Philadelphia in Pennsylvania. The Metropolitan Washington, D.C. segment includes properties in Northern Virginia and southern Maryland. The New Jersey/Delaware segment includes properties in Burlington and Camden counties in New Jersey and in New Castle county in the state of Delaware. The Richmond, Virginia segment includes properties primarily in Albemarle, Chesterfield, Goochland and Henrico counties and
one
property in Durham, North Carolina. The Austin, Texas segment includes properties in Austin. On October 16, 2013,
seven
properties within the Austin portfolio were contributed to a newly formed real estate venture. After contributing the properties, the Company wholly owns only one property in Austin, Texas (For additional information, see Note 4). The California segment includes properties in Oakland, Concord, and Carlsbad. The corporate group is responsible for cash and investment management, development of certain real estate properties during the construction period, and certain other general support functions. Land held for development and construction in progress are transferred to operating properties by region upon completion of the associated construction or project.
F- 53
Segment information for the three years ended December 31,
2013, 2012 and 2011
are as follows (in thousands):
|
Pennsylvania
Suburbs
|
Philadelphia
CBD
|
Metropolitan Washington, D.C.
|
New Jersey/Delaware
|
Richmond,
Virginia
|
Austin, Texas (a)
|
California
|
Corporate
|
Total
|
|||||||||||||||||||||||||||
|
2013
|
|
|
|
|
|
|
|
|
|
||||||||||||||||||||||||||
|
Real estate investments, at cost:
|
|
|
|
|
|
|
|
|
|
||||||||||||||||||||||||||
|
Operating properties
|
$
|
1,199,105
|
|
$
|
1,300,666
|
|
$
|
1,214,965
|
|
$
|
414,716
|
|
$
|
310,397
|
|
$
|
36,856
|
|
$
|
192,584
|
|
$
|
—
|
|
$
|
4,669,289
|
|
||||||||
|
Construction-in-progress
|
74,174
|
|
74,174
|
|
|||||||||||||||||||||||||||||||
|
Land inventory
|
93,351
|
|
93,351
|
|
|||||||||||||||||||||||||||||||
|
Total revenue
|
$
|
153,426
|
|
$
|
146,081
|
|
$
|
116,048
|
|
$
|
60,262
|
|
$
|
35,058
|
|
$
|
31,451
|
|
$
|
18,369
|
|
$
|
1,515
|
|
$
|
562,210
|
|
||||||||
|
Property operating expenses, real estate taxes and third party management expenses
|
54,506
|
|
55,702
|
|
42,641
|
|
29,981
|
|
14,916
|
|
13,298
|
|
9,411
|
|
1,314
|
|
221,769
|
|
|||||||||||||||||
|
Net operating income
|
$
|
98,920
|
|
$
|
90,379
|
|
$
|
73,407
|
|
$
|
30,281
|
|
$
|
20,142
|
|
$
|
18,153
|
|
$
|
8,958
|
|
$
|
201
|
|
$
|
340,441
|
|
||||||||
|
Investment in real estate ventures, at equity
|
$
|
17,272
|
|
$
|
19,975
|
|
$
|
59,905
|
|
$
|
—
|
|
$
|
1,400
|
|
$
|
81,960
|
|
$
|
—
|
|
$
|
—
|
|
$
|
180,512
|
|
||||||||
|
Equity in income of real estate ventures
|
$
|
925
|
|
$
|
1,547
|
|
$
|
130
|
|
$
|
1,245
|
|
$
|
381
|
|
$
|
(564
|
)
|
$
|
—
|
|
$
|
—
|
|
$
|
3,664
|
|
||||||||
|
2012
|
|
|
|
|
|
|
|
|
|
||||||||||||||||||||||||||
|
Real estate investments, at cost:
|
|
|
|
|
|
|
|
|
|
||||||||||||||||||||||||||
|
Operating properties
|
$
|
1,178,730
|
|
$
|
988,590
|
|
$
|
1,193,200
|
|
$
|
546,644
|
|
$
|
309,923
|
|
$
|
285,346
|
|
$
|
223,736
|
|
$
|
—
|
|
$
|
4,726,169
|
|
||||||||
|
Construction-in-progress
|
48,950
|
|
48,950
|
|
|||||||||||||||||||||||||||||||
|
Land inventory
|
102,439
|
|
102,439
|
|
|||||||||||||||||||||||||||||||
|
Total revenue
|
$
|
150,075
|
|
$
|
131,592
|
|
$
|
107,656
|
|
$
|
59,671
|
|
$
|
35,701
|
|
$
|
32,379
|
|
$
|
17,463
|
|
$
|
1,142
|
|
$
|
535,679
|
|
||||||||
|
Property operating expenses, real estate taxes and third party management expenses
|
52,657
|
|
50,787
|
|
41,485
|
|
28,506
|
|
14,484
|
|
13,951
|
|
9,043
|
|
(65
|
)
|
210,848
|
|
|||||||||||||||||
|
Net operating income
|
$
|
97,418
|
|
$
|
80,805
|
|
$
|
66,171
|
|
$
|
31,165
|
|
$
|
21,217
|
|
$
|
18,428
|
|
$
|
8,420
|
|
$
|
1,207
|
|
$
|
324,831
|
|
||||||||
|
Investment in real estate ventures, at equity
|
$
|
33,160
|
|
$
|
27,859
|
|
$
|
49,169
|
|
$
|
17,294
|
|
$
|
1,245
|
|
$
|
64,828
|
|
$
|
—
|
|
$
|
—
|
|
$
|
193,555
|
|
||||||||
|
Equity in income of real estate ventures
|
$
|
520
|
|
$
|
1,113
|
|
$
|
(648
|
)
|
$
|
1,803
|
|
$
|
269
|
|
$
|
(316
|
)
|
$
|
—
|
|
$
|
—
|
|
$
|
2,741
|
|
||||||||
|
2011
|
|||||||||||||||||||||||||||||||||||
|
Operating properties
|
$
|
1,218,071
|
|
$
|
953,870
|
|
$
|
1,255,803
|
|
$
|
545,657
|
|
$
|
307,698
|
|
$
|
257,694
|
|
$
|
254,287
|
|
$
|
—
|
|
$
|
4,793,080
|
|
||||||||
|
Construction-in-progress
|
25,083
|
|
25,083
|
|
|||||||||||||||||||||||||||||||
|
Land inventory
|
109,008
|
|
109,008
|
|
|||||||||||||||||||||||||||||||
|
Total revenue
|
$
|
148,887
|
|
$
|
125,366
|
|
$
|
119,255
|
|
$
|
58,960
|
|
$
|
36,789
|
|
$
|
30,894
|
|
$
|
16,692
|
|
$
|
1,725
|
|
$
|
538,568
|
|
||||||||
|
Property operating expenses, real estate taxes and third party management expenses
|
54,734
|
|
48,831
|
|
45,135
|
|
30,564
|
|
14,739
|
|
13,034
|
|
9,407
|
|
347
|
|
216,791
|
|
|||||||||||||||||
|
Net operating income
|
$
|
94,153
|
|
$
|
76,535
|
|
$
|
74,120
|
|
$
|
28,396
|
|
$
|
22,050
|
|
$
|
17,860
|
|
$
|
7,285
|
|
$
|
1,378
|
|
$
|
321,777
|
|
||||||||
|
Investment in real estate ventures, at equity
|
$
|
5,264
|
|
$
|
13,397
|
|
$
|
24,671
|
|
$
|
6,168
|
|
$
|
1,163
|
|
$
|
65,144
|
|
$
|
—
|
|
$
|
—
|
|
$
|
115,807
|
|
||||||||
|
Equity in income of real estate ventures
|
$
|
1,861
|
|
$
|
466
|
|
$
|
(277
|
)
|
$
|
1,157
|
|
$
|
510
|
|
$
|
58
|
|
$
|
—
|
|
$
|
—
|
|
$
|
3,775
|
|
||||||||
(a) On
October 16, 2013
seven
properties from the Austin portfolio were contributed to a newly formed real estate venture. Accordingly, the Company's
50%
interest in the financial results of these
seven
properties for the period subsequent to
October 16, 2013
is reported as a component of 'Equity in income of real estate ventures' in the Company's consolidated statements of operations and, as a result, no longer included as a component of net operating income. The Company acquired Four Points Centre in Austin, TX on December 19, 2013 and the financial results for this property are included in net operating income for the period owned. For additional information, see Notes 3 and 4 to our consolidated financial statements.
F- 54
Net operating income (“NOI”) is defined as total revenue less property operating expenses, real estate taxes and third party management expenses. Segment NOI includes revenue, real estate taxes and property operating expenses directly related to operation and management of the properties owned and managed within the respective geographical region. Segment NOI excludes property level depreciation and amortization, revenue and expenses directly associated with third party real estate management services, expenses associated with corporate administrative support services, and inter-company eliminations. NOI also does not reflect general and administrative expenses, interest expenses, real estate impairment losses, depreciation and amortization costs, capital expenditures and leasing costs. Trends in development and construction activities that could materially impact the Company’s results from operations are also not reflected in NOI. All companies may not calculate NOI in the same manner. NOI is the measure that is used by the Company to evaluate the operating performance of its real estate assets by segment. The Company also believes that NOI provides useful information to investors regarding its financial condition and results of operations because it reflects only those income and expenses recorded at the property level. The Company believes that net income, as defined by GAAP, is the most appropriate earnings measure. The following is a reconciliation of consolidated NOI to consolidated net income (loss), as defined by GAAP:
|
Years Ended December 31,
|
|||||||||||
|
|
2013
|
2012
|
2011
|
||||||||
|
|
|||||||||||
|
Consolidated net operating income
|
$
|
340,441
|
|
$
|
324,831
|
|
$
|
321,777
|
|
||
|
Less:
|
|
|
|
||||||||
|
Interest expense
|
(121,937
|
)
|
(132,939
|
)
|
(131,405
|
)
|
|||||
|
Interest expense - amortization of deferred financing costs
|
(4,676
|
)
|
(6,208
|
)
|
(4,991
|
)
|
|||||
|
Interest expense - financing obligation
|
(972
|
)
|
(850
|
)
|
—
|
|
|||||
|
Depreciation and amortization
|
(197,021
|
)
|
(188,382
|
)
|
(202,933
|
)
|
|||||
|
General and administrative expenses
|
(27,628
|
)
|
(25,413
|
)
|
(24,602
|
)
|
|||||
|
Plus:
|
|
|
|||||||||
|
Interest income
|
1,044
|
|
3,008
|
|
1,810
|
|
|||||
|
Historic tax credit transaction income
|
11,853
|
|
11,840
|
|
12,026
|
|
|||||
|
Recognized hedge activity
|
—
|
|
(2,985
|
)
|
—
|
|
|||||
|
Equity in income of real estate ventures
|
3,664
|
|
2,741
|
|
3,775
|
|
|||||
|
Net gain from remeasurement of investments in real estate ventures
|
6,866
|
|
—
|
|
—
|
|
|||||
|
Net gain on sales of interests in real estate
|
—
|
|
—
|
|
2,985
|
|
|||||
|
Net loss on sale of undepreciated real estate
|
(137
|
)
|
—
|
|
—
|
|
|||||
|
Net gain (loss) on real estate venture transactions
|
29,604
|
|
(950
|
)
|
(222
|
)
|
|||||
|
Loss on early extinguishment of debt
|
(2,119
|
)
|
(22,002
|
)
|
(2,776
|
)
|
|||||
|
Income (loss) from continuing operations
|
38,982
|
|
(37,309
|
)
|
(24,556
|
)
|
|||||
|
Income from discontinued operations
|
4,207
|
|
43,838
|
|
19,841
|
|
|||||
|
Net income (loss)
|
$
|
43,189
|
|
$
|
6,529
|
|
$
|
(4,715
|
)
|
||
F- 55
19. OPERATING LEASES
The Company leases properties to tenants under operating leases with various expiration dates extending to 2030. Minimum future rentals on non-cancelable leases at
December 31, 2013
are as follows (in thousands):
|
Year
|
Minimum Rent
|
||
|
2014
|
$
|
471,918
|
|
|
2015
|
457,315
|
|
|
|
2016
|
416,467
|
|
|
|
2017
|
358,368
|
|
|
|
2018
|
299,619
|
|
|
|
Thereafter
|
1,403,003
|
|
|
Total minimum future rentals presented above do not include amounts to be received as tenant reimbursements for operating costs
20. COMMITMENTS AND CONTINGENCIES
Legal Proceedings
The Company is involved from time to time in litigation on various matters, including disputes with tenants and disputes arising out of agreements to purchase or sell properties. Given the nature of the Company’s business activities, these lawsuits are considered routine to the conduct of its business. The result of any particular lawsuit cannot be predicted, because of the very nature of litigation, the litigation process and its adversarial nature, and the jury system. The Company will establish reserves for specific legal proceedings when we determine that the likelihood of an unfavorable outcome is probable and when the amount of loss is reasonably estimable. The Company does not expect that the liabilities, if any, that may ultimately result from such legal actions will have a material adverse effect on the consolidated financial position, results of operations or cash flows of the Company.
Letters-of-Credit
Under certain mortgages, the Company has funded required leasing and capital reserve accounts for the benefit of the mortgage lenders with letters-of-credit. There were no associated letters-of-credit at
December 31, 2013
and
December 31, 2012
. Certain of the tenant rents at properties that secure these mortgage loans are deposited into the loan servicer’s depository accounts, which are used to fund debt service, operating expenses, capital expenditures and the escrow and reserve accounts, as necessary. Any excess cash is included in cash and cash equivalents.
Environmental
As an owner of real estate, the Company is subject to various environmental laws of federal, state, and local governments. The Company’s compliance with existing laws has not had a material adverse effect on its financial condition and results of operations, and the Company does not believe it will have a material adverse effect in the future. However, the Company cannot predict the impact of unforeseen environmental contingencies or new or changed laws or regulations on its current Properties or on properties that the Company may acquire.
F- 56
Ground Rent
Future minimum rental payments under the terms of all non-cancellable ground leases under which the Company is the lessee are expensed on a straight-line basis regardless of when payments are due. The Company’s ground leases have remaining lease terms ranging from
15
to
75
years. Minimum future rental payments on non-cancelable leases at
December 31, 2013
are as follows (in thousands):
|
Year
|
Minimum Rent
|
||
|
2014
|
$
|
1,303
|
|
|
2015
|
1,303
|
|
|
|
2016
|
1,303
|
|
|
|
2017
|
1,303
|
|
|
|
2018
|
1,303
|
|
|
|
Thereafter
|
57,540
|
|
|
|
Total
|
64,055
|
|
|
The Company obtained ground tenancy rights related to two properties in Philadelphia, Pennsylvania, which provide for contingent rent participation by the lessor in certain capital transactions and net operating cash flows of the properties after certain returns are achieved by the Company. Such amounts, if any, will be reflected as contingent rent when incurred. The leases also provide for payment by the Company of certain operating costs relating to the land, primarily real estate taxes. The above schedule of future minimum rental payments does not include any contingent rent amounts or any reimbursed expenses.
Other Commitments or Contingencies
As part of the Company’s September 2004 acquisition of a portfolio of properties from The Rubenstein Company (which the Company refers to as the "TRC acquisition"), the Company acquired its interest in Two Logan Square, a
708,844
square foot office building in Philadelphia, primarily through its ownership of a second and third mortgage secured by this property. This property is consolidated, as the borrower is a variable interest entity and the Company, through its ownership of the second and third mortgages, is the primary beneficiary. The Company currently does not expect to take title to Two Logan Square until, at the earliest,
September 2019
. If the Company takes fee title to Two Logan Square upon a foreclosure of its mortgage, the Company has agreed to pay an unaffiliated third party that holds a residual interest in the fee owner of this property an amount equal to
$2.9 million
. On the TRC acquisition date, the Company recorded a liability of
$0.7 million
and this amount will accrete up to
$2.9 million
through
September 2019
. As of
December 31, 2013
, the Company had a balance of
$1.6 million
for this liability in its consolidated balance sheet.
The Company was audited by the Internal Revenue Service (the “IRS”) for its 2004 tax year. The audit concerned the tax treatment of the TRC acquisition in September 2004 in which the Company acquired a portfolio of properties through the acquisition of a limited partnership. On
December 17, 2010
, the Company received notice that the IRS proposed an adjustment to the allocation of recourse liabilities allocated to the contributor of the properties. The Company appealed the proposed adjustment and during the second quarter of 2013, the IRS finalized a settlement agreement which will not result in a material liability to the Company for federal income taxes. The contributor of partnership interests in the 2004 transaction has agreed not to assert a claim against the Company for federal income tax purposes under the tax protection agreement entered into as part of the transaction.
As part of the Company’s 2006 merger with Prentiss Properties Trust ("Prentiss"), the 2004 TRC acquisition and several of our other transactions, the Company agreed not to sell certain of the properties it acquired in transactions that would trigger taxable income to the former owners. In the case of the TRC acquisition, the Company agreed not to sell acquired properties in non-exempt transactions for periods up to
15
years from the date of the TRC acquisition as follows at
December 31, 2013
: One Rodney Square and 130/150/170 Radnor Financial Center (January, 2015); and One Logan Square, Two Logan Square and Radnor Corporate Center (January, 2020). In the Prentiss acquisition, the Company assumed the obligation of Prentiss not to sell Concord Airport Plaza before March, 2018. The Company’s agreements generally provide that it may dispose of the subject properties only in transactions that qualify as tax-free exchanges under Section 1031 of the Internal Revenue Code or in other tax deferred transactions. If the Company were to sell a restricted property before expiration of the restricted period in a non-exempt transaction, the Company may be required to make significant payments to the parties who sold the applicable property on account of tax liabilities attributed to them. Similarly, as part of our 2013 acquisition of substantially all of the equity interests in the partnerships that own One and Two Commerce Square, we agreed, for the benefit of affiliates of the holder of the
1%
residual ownership interest in these properties, to not sell these two properties in certain taxable transactions prior to October 20, 2013 without the holder’s consent.
F- 57
As part of the Company’s acquisition of properties from time to time in tax-deferred transactions, the Company has agreed to provide certain of the prior owners of the acquired properties with the right to guarantee the Company’s indebtedness. If the Company were to seek to repay the indebtedness guaranteed by the prior owner before the expiration of the applicable agreement, the Company would be required to provide the prior owner an opportunity to guaranty qualifying replacement debt. These debt maintenance agreements may limit the Company’s ability to refinance indebtedness on terms favorable to the Company. As part of our 2013 acquisition of substantially all of the equity interests in the partnerships that own One and Two Commerce Square, we agreed, for the benefit of affiliates of the holder of the
1%
residual ownership interest in these properties, to maintain qualifying mortgage debt through October 20, 2021, in the amounts of not less than
$130.0 million
on One Commerce Square and
$107.9 million
on Two Commerce Square. Similarly, we have agreements in place with other contributors of assets to us that obligate us to maintain debt available for then to guaranty.
During 2008, in connection with the development of the IRS Philadelphia Campus and the Cira South Garage, the Company entered into a historic tax credit and a new market tax credit arrangement, respectively. The Company is required to be in compliance with various laws, regulations and contractual provisions that apply to its historic and new market tax credit arrangements. Non-compliance with applicable requirements could result in projected tax benefits not being realized and require a refund to USB or reduction of investor capital contributions, which are reported as deferred income in the Company’s consolidated balance sheet, until such time as its obligation to deliver tax benefits is relieved. The compliance periods for the tax credit arrangements run through 2015. The Company does not anticipate that any material refunds or reductions of investor capital contributions will be required in connection with these arrangements.
The Company invests in its properties and regularly incurs capital expenditures in the ordinary course to maintain the properties. The Company believes that such expenditures enhance its competitiveness. The Company also enters into construction, utility and service contracts in the ordinary course of business which may extend beyond one year. These contracts typically provide for cancellation with insignificant or no cancellation penalties.
21. SUBSEQUENT EVENTS
The Company has evaluated subsequent events through the date the financial statements were issued.
22. SUMMARY OF QUARTERLY RESULTS (UNAUDITED)
The following is a summary of quarterly financial information as of and for the
years ended December 31, 2013 and 2012
(in thousands, except per share data):
|
1st
Quarter
|
2nd
Quarter
|
3rd
Quarter
|
4th
Quarter (a)
|
||||||||||||
|
2013
|
|
|
|
|
|||||||||||
|
Total revenue
|
$
|
139,554
|
|
$
|
140,644
|
|
$
|
143,354
|
|
$
|
138,658
|
|
|||
|
Net income (loss)
|
3,919
|
|
7,180
|
|
11,088
|
|
21,002
|
|
|||||||
|
Net income (loss) allocated to Common Shares
|
2,058
|
|
5,308
|
|
9,173
|
|
18,975
|
|
|||||||
|
Basic earnings (loss) per Common Share
|
$
|
0.01
|
|
$
|
0.03
|
|
$
|
0.06
|
|
$
|
0.12
|
|
|||
|
Diluted earnings (loss) per Common Share
|
$
|
0.01
|
|
$
|
0.03
|
|
$
|
0.06
|
|
$
|
0.12
|
|
|||
|
2012
|
|
|
|
|
|||||||||||
|
Total revenue
|
$
|
133,516
|
|
$
|
131,530
|
|
$
|
134,238
|
|
$
|
136,395
|
|
|||
|
Net income (loss)
|
9,336
|
|
6,802
|
|
17,089
|
|
(26,698
|
)
|
|||||||
|
Net income (loss) allocated to Common Shares
|
7,108
|
|
1,537
|
|
13,949
|
|
(30,832
|
)
|
|||||||
|
Basic earnings (loss) per Common Share
|
$
|
0.05
|
|
$
|
0.01
|
|
$
|
0.10
|
|
$
|
(0.21
|
)
|
|||
|
Diluted earnings (loss) per Common Share
|
$
|
0.05
|
|
$
|
0.01
|
|
$
|
0.10
|
|
$
|
(0.21
|
)
|
|||
(a) The consolidated statement of operations for the fourth quarter of
2012
also contained an out of period deferred compensation expense adjustment of
$0.6 million
relating to the acceleration of deferred compensation for certain of our executive personnel who reached qualifying retirement conditions that should have been expensed in prior periods (please see Note 14 for further discussion regarding the qualifying retirement conditions). This resulted in an overstatement of expense by
$0.6 million
in the fourth quarter of
2012
, and an understatement of expense by
$0.2 million
,
$0.3 million
, and a nominal amount in the third, second, and first quarters of
2012
, respectively, and
$0.1 million
in the
year-ended December 31, 2011
. As management believes that this error was not material to prior years' consolidated financial statements and that the impact of recording the error in the current year is not material to the Company's consolidated financial statements, the Company recorded the related adjustment in the current year.
F- 58
The summation of quarterly earnings per share amounts do not necessarily equal the full year amounts due to rounding. The above information was updated to reclassify amounts previously reported to reflect discontinued operations. See Note 2 and Note 10.
F- 59
Brandywine Realty Trust and Brandywine Operating Partnership, L.P.
Schedule II
Valuation and Qualifying Accounts
(in thousands)
|
Description
|
Balance at
Beginning
of Year
|
Additions
|
Deductions (1)
|
Balance
at End
of Year
|
||||||||||||
|
Allowance for doubtful accounts:
|
|
|
|
|
||||||||||||
|
Year-ended December 31, 2013
|
$
|
16,646
|
|
$
|
1,384
|
|
$
|
1,782
|
|
$
|
16,248
|
|
||||
|
Year-ended December 31, 2012
|
$
|
15,485
|
|
$
|
1,891
|
|
$
|
730
|
|
$
|
16,646
|
|
||||
|
Year-ended December 31, 2011
|
$
|
15,222
|
|
$
|
928
|
|
$
|
665
|
|
$
|
15,485
|
|
||||
|
(1)
|
Deductions represent amounts that the Company had fully reserved for in prior years and pursuit of collection of such amounts was ceased during the year.
|
F- 60
BRANDYWINE REALTY TRUST AND BRANDYWINE OPERATING PARTNERSHIP, L.P.
Schedule III
Real Estate and Accumulated Depreciation — December 31, 2013
(in thousands)
|
|
|
|
|
|
|
|
Gross Amount at Which Carried
|
|
|
|
||||||||||||||||||||||||
|
|
|
|
|
Initial Cost
|
December 31, 2013
|
|
|
|
||||||||||||||||||||||||||
|
Property Name
|
City
|
State
|
Encumberances at
December 31, 2013 (a) |
Land
|
Building and
Improvements
|
Net
Improvements (Retirements) Since
Acquisition
|
Land
|
Building and
Improvements
|
Total (b)
|
Accumulated
Depreciation at December 31,
2013 (c)
|
Year of
Construction
|
Year
Acquired
|
Depreciable
Life
|
|||||||||||||||||||||
|
PENNSYLVANIA SUBURBS
|
|
|
|
|
|
|
|
|
|
|
|
|
|
|||||||||||||||||||||
|
400 Berwyn Park
|
Berwyn
|
PA
|
—
|
|
2,657
|
|
4,462
|
|
13,711
|
|
2,657
|
|
18,172
|
|
20,829
|
|
5,478
|
|
1999
|
1999
|
40
|
|||||||||||||
|
300 Berwyn Park
|
Berwyn
|
PA
|
—
|
|
2,206
|
|
13,422
|
|
4,176
|
|
2,206
|
|
17,598
|
|
19,804
|
|
8,004
|
|
1989
|
1997
|
40
|
|||||||||||||
|
1050 Westlakes Drive
|
Berwyn
|
PA
|
—
|
|
2,611
|
|
10,445
|
|
5,046
|
|
2,611
|
|
15,490
|
|
18,101
|
|
7,264
|
|
1984
|
1999
|
40
|
|||||||||||||
|
1200 Swedesford Road
|
Berwyn
|
PA
|
—
|
|
2,595
|
|
11,809
|
|
3,533
|
|
2,595
|
|
15,341
|
|
17,936
|
|
5,464
|
|
1994
|
2001
|
40
|
|||||||||||||
|
200 Berwyn Park
|
Berwyn
|
PA
|
—
|
|
1,533
|
|
9,460
|
|
2,255
|
|
1,533
|
|
11,714
|
|
13,247
|
|
5,246
|
|
1987
|
1997
|
40
|
|||||||||||||
|
1180 Swedesford Road
|
Berwyn
|
PA
|
—
|
|
2,086
|
|
8,342
|
|
2,628
|
|
2,086
|
|
10,969
|
|
13,055
|
|
3,113
|
|
1987
|
2001
|
40
|
|||||||||||||
|
100 Berwyn Park
|
Berwyn
|
PA
|
—
|
|
1,180
|
|
7,290
|
|
2,173
|
|
1,180
|
|
9,462
|
|
10,642
|
|
4,241
|
|
1986
|
1997
|
40
|
|||||||||||||
|
1160 Swedesford Road
|
Berwyn
|
PA
|
—
|
|
1,781
|
|
7,124
|
|
1,412
|
|
2,088
|
|
8,228
|
|
10,316
|
|
2,491
|
|
1986
|
2001
|
40
|
|||||||||||||
|
1100 Cassett Road
|
Berwyn
|
PA
|
—
|
|
1,695
|
|
6,779
|
|
1,267
|
|
1,695
|
|
8,046
|
|
9,741
|
|
2,275
|
|
1997
|
2001
|
40
|
|||||||||||||
|
980 Harvest Drive
|
Blue Bell
|
PA
|
—
|
|
3,304
|
|
16,960
|
|
(110
|
)
|
3,303
|
|
16,850
|
|
20,153
|
|
6,542
|
|
1988
|
2002
|
40
|
|||||||||||||
|
925 Harvest Drive
|
Blue Bell
|
PA
|
—
|
|
1,671
|
|
6,606
|
|
759
|
|
1,671
|
|
7,364
|
|
9,035
|
|
3,265
|
|
1990
|
1998
|
40
|
|||||||||||||
|
920 Harvest Drive
|
Blue Bell
|
PA
|
—
|
|
1,209
|
|
6,595
|
|
(528
|
)
|
1,209
|
|
6,068
|
|
7,277
|
|
2,898
|
|
1990
|
1998
|
40
|
|||||||||||||
|
181 Washington Street
|
Conshohocken
|
PA
|
—
|
|
6,927
|
|
14,722
|
|
634
|
|
6,927
|
|
15,357
|
|
22,284
|
|
217
|
|
1999
|
2013
|
40
|
|||||||||||||
|
426 Lancaster Avenue
|
Devon
|
PA
|
—
|
|
1,689
|
|
6,756
|
|
395
|
|
1,689
|
|
7,152
|
|
8,841
|
|
3,259
|
|
1990
|
1998
|
40
|
|||||||||||||
|
52 Swedesford Square
|
East Whiteland Twp.
|
PA
|
—
|
|
4,241
|
|
16,579
|
|
2,630
|
|
4,241
|
|
19,209
|
|
23,450
|
|
7,560
|
|
1988
|
1998
|
40
|
|||||||||||||
|
One Progress Drive
|
Horsham
|
PA
|
—
|
|
1,399
|
|
5,629
|
|
5,214
|
|
1,399
|
|
10,843
|
|
12,242
|
|
3,818
|
|
1986
|
1996
|
40
|
|||||||||||||
|
500 Enterprise Drive
|
Horsham
|
PA
|
—
|
|
1,303
|
|
5,188
|
|
3,228
|
|
1,303
|
|
8,416
|
|
9,719
|
|
3,577
|
|
1990
|
1996
|
40
|
|||||||||||||
|
640 Freedom Business Center
|
King Of Prussia
|
PA
|
—
|
|
4,222
|
|
16,891
|
|
3,450
|
|
4,222
|
|
20,341
|
|
24,563
|
|
8,747
|
|
1991
|
1998
|
40
|
|||||||||||||
|
555 Croton Road
|
King of Prussia
|
PA
|
—
|
|
4,486
|
|
17,943
|
|
1,330
|
|
4,486
|
|
19,273
|
|
23,759
|
|
6,143
|
|
1999
|
2001
|
40
|
|||||||||||||
|
630 Allendale Road
|
King of Prussia
|
PA
|
—
|
|
2,836
|
|
4,028
|
|
12,223
|
|
2,636
|
|
16,450
|
|
19,086
|
|
5,264
|
|
2000
|
2000
|
40
|
|||||||||||||
|
620 Freedom Business Center
|
King Of Prussia
|
PA
|
—
|
|
2,770
|
|
11,014
|
|
3,755
|
|
2,770
|
|
14,770
|
|
17,540
|
|
7,286
|
|
1986
|
1998
|
40
|
|||||||||||||
|
1000 First Avenue
|
King Of Prussia
|
PA
|
—
|
|
2,772
|
|
10,936
|
|
2,787
|
|
2,772
|
|
13,723
|
|
16,495
|
|
5,949
|
|
1980
|
1998
|
40
|
|||||||||||||
|
1060 First Avenue
|
King Of Prussia
|
PA
|
—
|
|
2,712
|
|
10,953
|
|
2,728
|
|
2,712
|
|
13,681
|
|
16,393
|
|
6,016
|
|
1987
|
1998
|
40
|
|||||||||||||
|
630 Freedom Business Center
|
King Of Prussia
|
PA
|
—
|
|
2,773
|
|
11,144
|
|
1,971
|
|
2,773
|
|
13,115
|
|
15,888
|
|
5,856
|
|
1989
|
1998
|
40
|
|||||||||||||
|
1020 First Avenue
|
King Of Prussia
|
PA
|
—
|
|
2,168
|
|
8,576
|
|
4,522
|
|
2,168
|
|
13,098
|
|
15,266
|
|
5,999
|
|
1984
|
1998
|
40
|
|||||||||||||
|
1040 First Avenue
|
King Of Prussia
|
PA
|
—
|
|
2,860
|
|
11,282
|
|
586
|
|
2,860
|
|
11,868
|
|
14,728
|
|
4,859
|
|
1985
|
1998
|
40
|
|||||||||||||
|
610 Freedom Business Center
|
King Of Prussia
|
PA
|
—
|
|
2,017
|
|
8,070
|
|
2,369
|
|
2,017
|
|
10,440
|
|
12,457
|
|
4,388
|
|
1985
|
1998
|
40
|
|||||||||||||
|
650 Park Avenue
|
King Of Prussia
|
PA
|
—
|
|
1,916
|
|
4,378
|
|
1,771
|
|
1,916
|
|
6,149
|
|
8,065
|
|
2,722
|
|
1968
|
1998
|
40
|
|||||||||||||
|
500 North Gulph Road
|
King Of Prussia
|
PA
|
—
|
|
1,303
|
|
5,201
|
|
1,548
|
|
1,303
|
|
6,749
|
|
8,052
|
|
3,151
|
|
1979
|
1996
|
40
|
|||||||||||||
|
741 First Avenue
|
King Of Prussia
|
PA
|
—
|
|
1,287
|
|
5,151
|
|
11
|
|
1,287
|
|
5,162
|
|
6,449
|
|
2,242
|
|
1966
|
1998
|
40
|
|||||||||||||
|
751-761 Fifth Avenue
|
King Of Prussia
|
PA
|
—
|
|
1,097
|
|
4,391
|
|
31
|
|
1,097
|
|
4,422
|
|
5,519
|
|
1,917
|
|
1967
|
1998
|
40
|
|||||||||||||
|
620 Allendale Road
|
King Of Prussia
|
PA
|
—
|
|
1,020
|
|
3,839
|
|
654
|
|
1,020
|
|
4,493
|
|
5,513
|
|
1,869
|
|
1961
|
1998
|
40
|
|||||||||||||
|
600 Park Avenue
|
King Of Prussia
|
PA
|
—
|
|
1,012
|
|
4,048
|
|
385
|
|
1,012
|
|
4,433
|
|
5,445
|
|
1,925
|
|
1964
|
1998
|
40
|
|||||||||||||
F- 61
BRANDYWINE REALTY TRUST AND BRANDYWINE OPERATING PARTNERSHIP, L.P.
Schedule III
Real Estate and Accumulated Depreciation — December 31, 2013
(in thousands)
|
|
|
|
|
|
|
|
Gross Amount at Which Carried
|
|
|
|
||||||||||||||||||||||||
|
|
|
|
|
Initial Cost
|
December 31, 2013
|
|
|
|
||||||||||||||||||||||||||
|
Property Name
|
City
|
State
|
Encumberances at
December 31, 2013 (a) |
Land
|
Building and
Improvements
|
Net
Improvements (Retirements) Since
Acquisition
|
Land
|
Building and
Improvements
|
Total (b)
|
Accumulated
Depreciation at December 31, 2013 (c) |
Year of
Construction
|
Year
Acquired
|
Depreciable
Life
|
|||||||||||||||||||||
|
660 Allendale Road
|
King Of Prussia
|
PA
|
—
|
|
396
|
|
948
|
|
2,957
|
|
1,085
|
|
3,216
|
|
4,301
|
|
623
|
|
2011
|
1998
|
40
|
|||||||||||||
|
640 Allendale Road
|
King of Prussia
|
PA
|
—
|
|
439
|
|
432
|
|
1,579
|
|
439
|
|
2,012
|
|
2,451
|
|
722
|
|
2000
|
2000
|
40
|
|||||||||||||
|
101 Lindenwood Drive
|
Malvern
|
PA
|
—
|
|
4,152
|
|
16,606
|
|
3,722
|
|
4,152
|
|
20,329
|
|
24,481
|
|
6,569
|
|
1988
|
2001
|
40
|
|||||||||||||
|
301 Lindenwood Drive
|
Malvern
|
PA
|
—
|
|
2,729
|
|
10,915
|
|
2,667
|
|
2,729
|
|
13,582
|
|
16,311
|
|
4,424
|
|
1984
|
2001
|
40
|
|||||||||||||
|
300 Lindenwood Drive
|
Malvern
|
PA
|
—
|
|
848
|
|
3,394
|
|
1,265
|
|
848
|
|
4,659
|
|
5,507
|
|
1,889
|
|
1991
|
2001
|
40
|
|||||||||||||
|
100 Lindenwood Drive
|
Malvern
|
PA
|
—
|
|
473
|
|
1,892
|
|
208
|
|
473
|
|
2,100
|
|
2,573
|
|
729
|
|
1985
|
2001
|
40
|
|||||||||||||
|
200 Lindenwood Drive
|
Malvern
|
PA
|
—
|
|
324
|
|
1,295
|
|
339
|
|
324
|
|
1,634
|
|
1,958
|
|
557
|
|
1984
|
2001
|
40
|
|||||||||||||
|
14 Campus Boulevard
|
Newtown Square
|
PA
|
—
|
|
2,244
|
|
4,217
|
|
1,515
|
|
2,244
|
|
5,733
|
|
7,977
|
|
2,984
|
|
1998
|
1998
|
40
|
|||||||||||||
|
17 Campus Boulevard
|
Newtown Square
|
PA
|
—
|
|
1,108
|
|
5,155
|
|
(397
|
)
|
1,108
|
|
4,758
|
|
5,866
|
|
1,519
|
|
2001
|
1997
|
40
|
|||||||||||||
|
11 Campus Boulevard
|
Newtown Square
|
PA
|
—
|
|
1,112
|
|
4,067
|
|
672
|
|
1,112
|
|
4,739
|
|
5,851
|
|
1,812
|
|
1998
|
1999
|
40
|
|||||||||||||
|
15 Campus Boulevard
|
Newtown Square
|
PA
|
—
|
|
1,164
|
|
3,896
|
|
228
|
|
1,164
|
|
4,125
|
|
5,289
|
|
1,267
|
|
2002
|
2000
|
40
|
|||||||||||||
|
18 Campus Boulevard
|
Newtown Square
|
PA
|
—
|
|
787
|
|
3,312
|
|
(183
|
)
|
787
|
|
3,129
|
|
3,916
|
|
1,525
|
|
1990
|
1996
|
40
|
|||||||||||||
|
401 Plymouth Road
|
Plymouth Meeting
|
PA
|
—
|
|
6,198
|
|
16,131
|
|
17,096
|
|
6,198
|
|
33,226
|
|
39,424
|
|
10,394
|
|
2001
|
2000
|
40
|
|||||||||||||
|
4000 Chemical Road
|
Plymouth Meeting
|
PA
|
—
|
|
4,373
|
|
24,546
|
|
3,292
|
|
4,373
|
|
27,838
|
|
32,211
|
|
5,628
|
|
2006
|
2001
|
40
|
|||||||||||||
|
610 West Germantown Pike
|
Plymouth Meeting
|
PA
|
—
|
|
3,651
|
|
14,514
|
|
3,299
|
|
3,651
|
|
17,813
|
|
21,464
|
|
5,285
|
|
1987
|
2002
|
40
|
|||||||||||||
|
600 West Germantown Pike
|
Plymouth Meeting
|
PA
|
—
|
|
3,652
|
|
15,288
|
|
2,064
|
|
3,652
|
|
17,352
|
|
21,004
|
|
5,119
|
|
1986
|
2002
|
40
|
|||||||||||||
|
630 West Germantown Pike
|
Plymouth Meeting
|
PA
|
—
|
|
3,558
|
|
14,743
|
|
1,770
|
|
3,558
|
|
16,513
|
|
20,071
|
|
5,462
|
|
1988
|
2002
|
40
|
|||||||||||||
|
620 West Germantown Pike
|
Plymouth Meeting
|
PA
|
—
|
|
3,572
|
|
14,435
|
|
1,607
|
|
3,572
|
|
16,042
|
|
19,614
|
|
5,140
|
|
1990
|
2002
|
40
|
|||||||||||||
|
660 West Germantown Pike(d)
|
Plymouth Meeting
|
PA
|
—
|
|
—
|
|
—
|
|
17,488
|
|
—
|
|
17,488
|
|
17,488
|
|
688
|
|
1987
|
2012
|
30
|
|||||||||||||
|
2240/2250 Butler Pike
|
Plymouth Meeting
|
PA
|
—
|
|
1,104
|
|
4,627
|
|
1,333
|
|
1,104
|
|
5,960
|
|
7,064
|
|
3,324
|
|
1984
|
1996
|
40
|
|||||||||||||
|
2260 Butler Pike
|
Plymouth Meeting
|
PA
|
—
|
|
661
|
|
2,727
|
|
1,242
|
|
661
|
|
3,969
|
|
4,630
|
|
2,052
|
|
1984
|
1996
|
40
|
|||||||||||||
|
120 West Germantown Pike
|
Plymouth Meeting
|
PA
|
—
|
|
685
|
|
2,773
|
|
961
|
|
685
|
|
3,735
|
|
4,420
|
|
1,812
|
|
1984
|
1996
|
40
|
|||||||||||||
|
140 West Germantown Pike
|
Plymouth Meeting
|
PA
|
—
|
|
481
|
|
1,976
|
|
160
|
|
481
|
|
2,135
|
|
2,616
|
|
1,017
|
|
1984
|
1996
|
40
|
|||||||||||||
|
351 Plymouth Road
|
Plymouth Meeting
|
PA
|
—
|
|
1,043
|
|
555
|
|
—
|
|
1,043
|
|
555
|
|
1,598
|
|
121
|
|
N/A
|
2000
|
40
|
|||||||||||||
|
150 Radnor Chester Road
|
Radnor
|
PA
|
—
|
|
11,925
|
|
36,986
|
|
11,799
|
|
11,896
|
|
48,813
|
|
60,709
|
|
15,790
|
|
1983
|
2004
|
29
|
|||||||||||||
|
One Radnor Corporate Center
|
Radnor
|
PA
|
—
|
|
7,323
|
|
28,613
|
|
22,975
|
|
7,322
|
|
51,588
|
|
58,910
|
|
15,805
|
|
1998
|
2004
|
29
|
|||||||||||||
|
201 King of Prussia Road
|
Radnor
|
PA
|
—
|
|
8,956
|
|
29,811
|
|
5,214
|
|
8,948
|
|
35,032
|
|
43,980
|
|
13,938
|
|
2001
|
2004
|
25
|
|||||||||||||
|
555 Lancaster Avenue
|
Radnor
|
PA
|
—
|
|
8,014
|
|
16,508
|
|
18,993
|
|
8,609
|
|
34,906
|
|
43,515
|
|
12,970
|
|
1973
|
2004
|
24
|
|||||||||||||
|
Four Radnor Corporate Center
|
Radnor
|
PA
|
—
|
|
5,406
|
|
21,390
|
|
11,967
|
|
5,705
|
|
33,058
|
|
38,763
|
|
12,752
|
|
1995
|
2004
|
30
|
|||||||||||||
|
Five Radnor Corporate Center
|
Radnor
|
PA
|
—
|
|
6,506
|
|
25,525
|
|
5,124
|
|
6,578
|
|
30,577
|
|
37,155
|
|
6,918
|
|
1998
|
2004
|
38
|
|||||||||||||
|
Three Radnor Corporate Center
|
Radnor
|
PA
|
—
|
|
4,773
|
|
17,961
|
|
2,715
|
|
4,791
|
|
20,658
|
|
25,449
|
|
7,226
|
|
1998
|
2004
|
29
|
|||||||||||||
|
Two Radnor Corporate Center
|
Radnor
|
PA
|
—
|
|
3,937
|
|
15,484
|
|
3,872
|
|
3,942
|
|
19,350
|
|
23,292
|
|
6,031
|
|
1998
|
2004
|
29
|
|||||||||||||
|
130 Radnor Chester Road
|
Radnor
|
PA
|
—
|
|
2,573
|
|
8,338
|
|
3,491
|
|
2,567
|
|
11,834
|
|
14,401
|
|
3,825
|
|
1983
|
2004
|
25
|
|||||||||||||
|
170 Radnor Chester Road
|
Radnor
|
PA
|
—
|
|
2,514
|
|
8,147
|
|
1,678
|
|
2,509
|
|
9,831
|
|
12,340
|
|
3,316
|
|
1983
|
2004
|
25
|
|||||||||||||
|
200 Radnor Chester Road (d)
|
Radnor
|
PA
|
—
|
|
—
|
|
—
|
|
842
|
|
—
|
|
842
|
|
842
|
|
—
|
|
N/A
|
2005
|
N/A
|
|||||||||||||
F- 62
BRANDYWINE REALTY TRUST AND BRANDYWINE OPERATING PARTNERSHIP, L.P.
Schedule III
Real Estate and Accumulated Depreciation — December 31, 2013
(in thousands)
|
|
|
|
|
|
|
|
|
Gross Amount at Which Carried
|
|
|
|
|||||||||||||||||||||||
|
|
|
|
|
Initial Cost
|
December 31, 2013
|
|
|
|
||||||||||||||||||||||||||
|
Property Name
|
City
|
State
|
Encumberances at
December 31, 2013 (a) |
Land
|
Building and
Improvements
|
Net
Improvements (Retirements) Since
Acquisition
|
Land
|
Building and
Improvements
|
Total (b)
|
Accumulated
Depreciation at December 31,
2013 (c)
|
Year of
Construction
|
Year
Acquired
|
Depreciable
Life
|
|||||||||||||||||||||
|
101 West Elm Street
|
W. Conshohocken
|
PA
|
—
|
|
6,251
|
|
25,209
|
|
2,784
|
|
6,251
|
|
27,992
|
|
34,243
|
|
6,556
|
|
1999
|
2005
|
40
|
|||||||||||||
|
1 West Elm Street
|
W. Conshohocken
|
PA
|
—
|
|
3,557
|
|
14,249
|
|
1,115
|
|
3,557
|
|
15,364
|
|
18,921
|
|
3,626
|
|
1999
|
2005
|
40
|
|||||||||||||
|
595 East Swedesford Road
|
Wayne
|
PA
|
—
|
|
2,729
|
|
10,917
|
|
2,307
|
|
2,729
|
|
13,225
|
|
15,954
|
|
3,946
|
|
1998
|
2003
|
40
|
|||||||||||||
|
575 East Swedesford Road
|
Wayne
|
PA
|
—
|
|
2,178
|
|
8,712
|
|
1,681
|
|
2,178
|
|
10,393
|
|
12,571
|
|
3,255
|
|
1985
|
2003
|
40
|
|||||||||||||
|
565 East Swedesford Road
|
Wayne
|
PA
|
—
|
|
1,872
|
|
7,489
|
|
1,820
|
|
1,872
|
|
9,309
|
|
11,181
|
|
2,840
|
|
1984
|
2003
|
40
|
|||||||||||||
|
585 East Swedesford Road
|
Wayne
|
PA
|
—
|
|
1,350
|
|
5,401
|
|
116
|
|
1,350
|
|
5,517
|
|
6,867
|
|
1,397
|
|
1998
|
2003
|
40
|
|||||||||||||
|
PHILADELPHIA CBD
|
|
|
|
|
|
|
|
|
|
|
|
|
|
|||||||||||||||||||||
|
2970 Market Street
|
Philadelphia
|
PA
|
190,964
|
|
22,430
|
|
217,763
|
|
10,591
|
|
22,430
|
|
228,354
|
|
250,784
|
|
21,169
|
|
2010
|
2007
|
40
|
|||||||||||||
|
2929 Arch Street
|
Philadelphia
|
PA
|
—
|
|
—
|
|
208,570
|
|
29,291
|
|
12,482
|
|
225,380
|
|
237,862
|
|
74,828
|
|
2005
|
N/A
|
40
|
|||||||||||||
|
1717 Arch Street
|
Philadelphia
|
PA
|
—
|
|
—
|
|
98,188
|
|
52,953
|
|
25,195
|
|
125,946
|
|
151,141
|
|
12,294
|
|
1990
|
2010
|
40
|
|||||||||||||
|
2001 Market Street
|
Philadelphia
|
PA
|
112,000
|
|
15,323
|
|
120,842
|
|
(642
|
)
|
15,323
|
|
120,200
|
|
135,523
|
|
107
|
|
1992
|
2013
|
40
|
|||||||||||||
|
130 North 18th Street
|
Philadelphia
|
PA
|
—
|
|
14,496
|
|
107,736
|
|
11,782
|
|
14,473
|
|
119,541
|
|
134,014
|
|
37,538
|
|
1998
|
2004
|
34
|
|||||||||||||
|
100 North 18th Street
|
Philadelphia
|
PA
|
88,583
|
|
16,066
|
|
100,255
|
|
6,038
|
|
16,066
|
|
106,293
|
|
122,359
|
|
32,227
|
|
1988
|
2004
|
36
|
|||||||||||||
|
2005 Market Street
|
Philadelphia
|
PA
|
125,089
|
|
15,161
|
|
122,486
|
|
(17,465
|
)
|
15,161
|
|
105,021
|
|
120,182
|
|
94
|
|
1987
|
2013
|
40
|
|||||||||||||
|
2930 Chestnut Street
|
Philadelphia
|
PA
|
40,101
|
|
—
|
|
76,008
|
|
2,586
|
|
—
|
|
78,594
|
|
78,594
|
|
6,606
|
|
2010
|
N/A
|
40
|
|||||||||||||
|
1900 Market Street
|
Philadelphia
|
PA
|
—
|
|
7,768
|
|
17,263
|
|
64
|
|
7,768
|
|
17,327
|
|
25,095
|
|
629
|
|
1981
|
2012
|
30
|
|||||||||||||
|
3020 Market Street
|
Philadelphia
|
PA
|
—
|
|
—
|
|
21,417
|
|
3,010
|
|
—
|
|
24,427
|
|
24,427
|
|
2,144
|
|
1959
|
2011
|
26
|
|||||||||||||
|
101 - 103 Juniper Street
|
Philadelphia
|
PA
|
—
|
|
—
|
|
14,401
|
|
324
|
|
478
|
|
14,247
|
|
14,725
|
|
1,340
|
|
2010
|
2006
|
40
|
|||||||||||||
|
Philadelphia Marine Center
|
Philadelphia
|
PA
|
—
|
|
532
|
|
2,196
|
|
3,196
|
|
628
|
|
5,296
|
|
5,924
|
|
2,186
|
|
Various
|
1998
|
40
|
|||||||||||||
|
METROPOLITAN WASHINGTON, D.C.
|
||||||||||||||||||||||||||||||||||
|
11720 Beltsville Drive
|
Beltsville
|
MD
|
—
|
|
3,831
|
|
16,661
|
|
3,982
|
|
3,903
|
|
20,571
|
|
24,474
|
|
5,743
|
|
1987
|
2006
|
46
|
|||||||||||||
|
11700 Beltsville Drive
|
Beltsville
|
MD
|
—
|
|
2,808
|
|
12,081
|
|
292
|
|
2,863
|
|
12,319
|
|
15,182
|
|
2,415
|
|
1981
|
2006
|
46
|
|||||||||||||
|
11710 Beltsville Drive
|
Beltsville
|
MD
|
—
|
|
2,278
|
|
11,100
|
|
(814
|
)
|
2,321
|
|
10,243
|
|
12,564
|
|
2,096
|
|
1987
|
2006
|
46
|
|||||||||||||
|
6600 Rockledge Drive
|
Bethesda
|
MD
|
—
|
|
—
|
|
37,421
|
|
11,538
|
|
—
|
|
48,960
|
|
48,960
|
|
12,867
|
|
1981
|
2006
|
50
|
|||||||||||||
|
11740 Beltsville Drive
|
Bethesda
|
MD
|
—
|
|
198
|
|
870
|
|
42
|
|
202
|
|
908
|
|
1,110
|
|
189
|
|
1987
|
2006
|
46
|
|||||||||||||
|
12015 Lee Jackson Memorial Highway
|
Fairfax
|
VA
|
—
|
|
3,770
|
|
22,895
|
|
3,665
|
|
3,842
|
|
26,489
|
|
30,331
|
|
6,016
|
|
1985
|
2006
|
42
|
|||||||||||||
|
11781 Lee Jackson Memorial Highway
|
Fairfax
|
VA
|
—
|
|
3,246
|
|
19,836
|
|
24
|
|
3,307
|
|
19,800
|
|
23,107
|
|
4,092
|
|
1982
|
2006
|
40
|
|||||||||||||
|
4401 Fair Lakes Court
|
Fairfax
|
VA
|
—
|
|
1,569
|
|
11,982
|
|
237
|
|
1,599
|
|
12,190
|
|
13,789
|
|
2,202
|
|
1988
|
2006
|
52
|
|||||||||||||
|
3141 Fairview Park Drive (e)
|
Falls Church
|
VA
|
21,630
|
|
5,918
|
|
40,981
|
|
11,545
|
|
7,081
|
|
51,365
|
|
58,446
|
|
9,049
|
|
1988
|
2006
|
51
|
|||||||||||||
|
2340 Dulles Corner Boulevard
|
Herndon
|
VA
|
—
|
|
16,345
|
|
65,379
|
|
18,280
|
|
16,129
|
|
83,875
|
|
100,004
|
|
24,559
|
|
1987
|
2006
|
40
|
|||||||||||||
|
2291 Wood Oak Drive
|
Herndon
|
VA
|
—
|
|
8,243
|
|
52,413
|
|
13,499
|
|
8,782
|
|
65,373
|
|
74,155
|
|
11,311
|
|
1999
|
2006
|
55
|
|||||||||||||
|
196/198 Van Buren Street
|
Herndon
|
VA
|
—
|
|
7,931
|
|
43,812
|
|
8,709
|
|
8,348
|
|
52,104
|
|
60,452
|
|
8,594
|
|
1991
|
2006
|
53
|
|||||||||||||
|
2251 Corporate Park Drive
|
Herndon
|
VA
|
—
|
|
11,472
|
|
45,893
|
|
2,055
|
|
11,472
|
|
47,948
|
|
59,420
|
|
8,434
|
|
2000
|
2006
|
40
|
|||||||||||||
|
2355 Dulles Corner Boulevard
|
Herndon
|
VA
|
—
|
|
10,365
|
|
43,876
|
|
4,528
|
|
10,365
|
|
48,405
|
|
58,770
|
|
10,863
|
|
1988
|
2006
|
40
|
|||||||||||||
|
2411 Dulles Corner Park
|
Herndon
|
VA
|
—
|
|
7,279
|
|
46,340
|
|
3,508
|
|
7,417
|
|
49,710
|
|
57,127
|
|
10,475
|
|
1990
|
2006
|
50
|
|||||||||||||
|
13880 Dulles Corner Lane
|
Herndon
|
VA
|
—
|
|
7,236
|
|
39,213
|
|
2,498
|
|
7,373
|
|
41,574
|
|
48,947
|
|
6,634
|
|
1997
|
2006
|
55
|
|||||||||||||
F- 63
BRANDYWINE REALTY TRUST AND BRANDYWINE OPERATING PARTNERSHIP, L.P.
Schedule III
Real Estate and Accumulated Depreciation — December 31, 2013
(in thousands)
|
|
|
|
|
|
|
|
Gross Amount at Which Carried
|
|
|
|
||||||||||||||||||||||||
|
|
|
|
|
Initial Cost
|
December 31, 2013
|
|
|
|
||||||||||||||||||||||||||
|
Property Name
|
City
|
State
|
Encumberances at
December 31, 2013 (a) |
Land
|
Building and
Improvements |
Net
Improvements (Retirements) Since Acquisition |
Land
|
Building and
Improvements |
Total (b)
|
Accumulated
Depreciation at December 31, 2013 (c) |
Year of
Construction |
Year
Acquired |
Depreciable
Life |
|||||||||||||||||||||
|
2121 Cooperative Way
|
Herndon
|
VA
|
—
|
|
5,598
|
|
38,639
|
|
2,292
|
|
5,795
|
|
40,734
|
|
46,529
|
|
6,598
|
|
2000
|
2006
|
54
|
|||||||||||||
|
2201 Cooperative Way
|
Herndon
|
VA
|
—
|
|
4,809
|
|
34,093
|
|
2,349
|
|
4,809
|
|
36,442
|
|
41,251
|
|
5,921
|
|
1990
|
2006
|
54
|
|||||||||||||
|
13825 Sunrise Valley Drive
|
Herndon
|
VA
|
—
|
|
3,794
|
|
19,365
|
|
1,032
|
|
3,866
|
|
20,326
|
|
24,192
|
|
3,521
|
|
1989
|
2006
|
46
|
|||||||||||||
|
1676 International Drive
|
Mclean
|
VA
|
59,698
|
|
18,437
|
|
97,538
|
|
2,501
|
|
18,785
|
|
99,691
|
|
118,476
|
|
17,693
|
|
1999
|
2006
|
55
|
|||||||||||||
|
8260 Greensboro Drive
|
Mclean
|
VA
|
31,697
|
|
7,952
|
|
33,964
|
|
1,794
|
|
8,102
|
|
35,608
|
|
43,710
|
|
6,461
|
|
1980
|
2006
|
52
|
|||||||||||||
|
1880 Campus Commons Drive
|
Reston
|
VA
|
—
|
|
6,164
|
|
28,114
|
|
6,315
|
|
6,281
|
|
34,312
|
|
40,593
|
|
5,754
|
|
1985
|
2006
|
52
|
|||||||||||||
|
2273 Research Boulevard
|
Rockville
|
MD
|
—
|
|
5,167
|
|
31,110
|
|
3,589
|
|
5,237
|
|
34,628
|
|
39,865
|
|
8,658
|
|
1999
|
2006
|
45
|
|||||||||||||
|
2275 Research Boulevard
|
Rockville
|
MD
|
—
|
|
5,059
|
|
29,668
|
|
2,964
|
|
5,154
|
|
32,537
|
|
37,691
|
|
6,474
|
|
1990
|
2006
|
45
|
|||||||||||||
|
2277 Research Boulevard
|
Rockville
|
MD
|
—
|
|
4,649
|
|
26,952
|
|
695
|
|
4,733
|
|
27,563
|
|
32,296
|
|
5,014
|
|
1986
|
2006
|
45
|
|||||||||||||
|
1900 Gallows Road
|
Vienna
|
VA
|
—
|
|
7,797
|
|
47,817
|
|
9,619
|
|
7,944
|
|
57,288
|
|
65,232
|
|
9,483
|
|
1989
|
2006
|
52
|
|||||||||||||
|
8521 Leesburg Pike
|
Vienna
|
VA
|
—
|
|
4,316
|
|
30,885
|
|
3,198
|
|
4,397
|
|
34,002
|
|
38,399
|
|
5,192
|
|
1984
|
2006
|
51
|
|||||||||||||
|
NEW JERSEY/DELAWARE
|
|
|
|
|
|
|
|
|
|
|
|
|
|
|||||||||||||||||||||
|
457 Haddonfield Road
|
Cherry Hill
|
NJ
|
—
|
|
2,142
|
|
9,120
|
|
1,334
|
|
2,142
|
|
10,454
|
|
12,596
|
|
4,884
|
|
1990
|
1996
|
40
|
|||||||||||||
|
200 Lake Drive East
|
Cherry Hill
|
NJ
|
—
|
|
2,069
|
|
8,275
|
|
1,299
|
|
2,069
|
|
9,573
|
|
11,642
|
|
3,264
|
|
1989
|
2001
|
40
|
|||||||||||||
|
220 Lake Drive East
|
Cherry Hill
|
NJ
|
—
|
|
2,144
|
|
8,798
|
|
646
|
|
2,144
|
|
9,443
|
|
11,587
|
|
3,152
|
|
1988
|
2001
|
40
|
|||||||||||||
|
210 Lake Drive East
|
Cherry Hill
|
NJ
|
—
|
|
1,645
|
|
6,579
|
|
1,110
|
|
1,645
|
|
7,689
|
|
9,334
|
|
2,509
|
|
1986
|
2001
|
40
|
|||||||||||||
|
20 East Clementon Road
|
Gibbsboro
|
NJ
|
—
|
|
769
|
|
3,055
|
|
530
|
|
769
|
|
3,585
|
|
4,354
|
|
1,574
|
|
1986
|
1997
|
40
|
|||||||||||||
|
10 Foster Avenue
|
Gibbsboro
|
NJ
|
—
|
|
244
|
|
971
|
|
78
|
|
244
|
|
1,049
|
|
1,293
|
|
470
|
|
1983
|
1997
|
40
|
|||||||||||||
|
7 Foster Avenue
|
Gibbsboro
|
NJ
|
—
|
|
231
|
|
921
|
|
123
|
|
231
|
|
1,044
|
|
1,275
|
|
435
|
|
1983
|
1997
|
40
|
|||||||||||||
|
50 East Clementon Road
|
Gibbsboro
|
NJ
|
—
|
|
114
|
|
964
|
|
3
|
|
114
|
|
967
|
|
1,081
|
|
428
|
|
1986
|
1997
|
40
|
|||||||||||||
|
2 Foster Avenue
|
Gibbsboro
|
NJ
|
—
|
|
185
|
|
730
|
|
16
|
|
185
|
|
746
|
|
931
|
|
333
|
|
1974
|
1997
|
40
|
|||||||||||||
|
4 Foster Avenue
|
Gibbsboro
|
NJ
|
—
|
|
183
|
|
726
|
|
5
|
|
183
|
|
732
|
|
915
|
|
324
|
|
1974
|
1997
|
40
|
|||||||||||||
|
1 Foster Avenue
|
Gibbsboro
|
NJ
|
—
|
|
93
|
|
364
|
|
76
|
|
93
|
|
440
|
|
533
|
|
219
|
|
1972
|
1997
|
40
|
|||||||||||||
|
5 U.S. Avenue
|
Gibbsboro
|
NJ
|
—
|
|
21
|
|
81
|
|
3
|
|
21
|
|
84
|
|
105
|
|
37
|
|
1987
|
1997
|
40
|
|||||||||||||
|
5 Foster Avenue
|
Gibbsboro
|
NJ
|
—
|
|
9
|
|
32
|
|
26
|
|
9
|
|
58
|
|
67
|
|
27
|
|
1968
|
1997
|
40
|
|||||||||||||
|
1120 Executive Boulevard
|
Marlton
|
NJ
|
—
|
|
2,074
|
|
8,415
|
|
2,061
|
|
2,074
|
|
10,475
|
|
12,549
|
|
4,687
|
|
1987
|
1997
|
40
|
|||||||||||||
|
Two Eves Drive
|
Marlton
|
NJ
|
—
|
|
818
|
|
3,461
|
|
341
|
|
818
|
|
3,802
|
|
4,620
|
|
1,795
|
|
1987
|
1997
|
40
|
|||||||||||||
|
Five Eves Drive
|
Marlton
|
NJ
|
—
|
|
703
|
|
2,819
|
|
532
|
|
703
|
|
3,351
|
|
4,054
|
|
1,519
|
|
1986
|
1997
|
40
|
|||||||||||||
|
Four B Eves Drive
|
Marlton
|
NJ
|
—
|
|
588
|
|
2,369
|
|
420
|
|
588
|
|
2,789
|
|
3,377
|
|
1,328
|
|
1987
|
1997
|
40
|
|||||||||||||
|
Four A Eves Drive
|
Marlton
|
NJ
|
—
|
|
539
|
|
2,168
|
|
123
|
|
539
|
|
2,291
|
|
2,830
|
|
1,050
|
|
1987
|
1997
|
40
|
|||||||||||||
|
308 Harper Drive
|
Moorestown
|
NJ
|
—
|
|
1,643
|
|
6,663
|
|
929
|
|
1,643
|
|
7,592
|
|
9,235
|
|
3,155
|
|
1976
|
1998
|
40
|
|||||||||||||
|
10000 Midlantic Drive
|
Mt. Laurel
|
NJ
|
—
|
|
3,206
|
|
12,857
|
|
4,335
|
|
3,206
|
|
17,192
|
|
20,398
|
|
7,087
|
|
1990
|
1997
|
40
|
|||||||||||||
|
700 East Gate Drive
|
Mt. Laurel
|
NJ
|
—
|
|
3,569
|
|
14,436
|
|
2,094
|
|
3,569
|
|
16,530
|
|
20,099
|
|
7,269
|
|
1984
|
1998
|
40
|
|||||||||||||
|
15000 Midlantic Drive
|
Mt. Laurel
|
NJ
|
—
|
|
3,061
|
|
12,254
|
|
1,600
|
|
3,061
|
|
13,854
|
|
16,915
|
|
6,211
|
|
1991
|
1997
|
40
|
|||||||||||||
|
1000 Howard Boulevard
|
Mt. Laurel
|
NJ
|
—
|
|
2,297
|
|
9,288
|
|
3,922
|
|
2,297
|
|
13,210
|
|
15,507
|
|
5,277
|
|
1988
|
1997
|
40
|
|||||||||||||
|
1000 Atrium Way
|
Mt. Laurel
|
NJ
|
—
|
|
2,061
|
|
8,180
|
|
4,867
|
|
2,061
|
|
13,047
|
|
15,108
|
|
5,896
|
|
1989
|
1997
|
40
|
|||||||||||||
F- 64
BRANDYWINE REALTY TRUST AND BRANDYWINE OPERATING PARTNERSHIP, L.P.
Schedule III
Real Estate and Accumulated Depreciation — December 31, 2013
(in thousands)
|
|
|
|
|
|
|
|
Gross Amount at Which Carried
|
|
|
|
||||||||||||||||||||||||
|
|
|
|
|
Initial Cost
|
December 31, 2013
|
|
|
|
||||||||||||||||||||||||||
|
Property Name
|
City
|
State
|
Encumberances at
December 31, 2013 (a) |
Land
|
Building and
Improvements
|
Net
Improvements (Retirements) Since
Acquisition
|
Land
|
Building and
Improvements
|
Total (b)
|
Accumulated
Depreciation at December 31,
2013(c)
|
Year of
Construction
|
Year
Acquired
|
Depreciable
Life
|
|||||||||||||||||||||
|
2000 Midlantic Drive
|
Mt. Laurel
|
NJ
|
—
|
|
2,202
|
|
8,823
|
|
2,490
|
|
2,202
|
|
11,313
|
|
13,515
|
|
4,752
|
|
1989
|
1997
|
40
|
|||||||||||||
|
701 East Gate Drive
|
Mt. Laurel
|
NJ
|
—
|
|
1,736
|
|
6,877
|
|
1,780
|
|
1,736
|
|
8,657
|
|
10,393
|
|
3,452
|
|
1986
|
1998
|
40
|
|||||||||||||
|
9000 Midlantic Drive
|
Mt. Laurel
|
NJ
|
—
|
|
1,472
|
|
5,895
|
|
1,880
|
|
1,472
|
|
7,776
|
|
9,248
|
|
3,142
|
|
1989
|
1997
|
40
|
|||||||||||||
|
307 Fellowship Drive
|
Mt. Laurel
|
NJ
|
—
|
|
1,565
|
|
6,342
|
|
1,292
|
|
1,565
|
|
7,634
|
|
9,199
|
|
3,189
|
|
1981
|
1998
|
40
|
|||||||||||||
|
305 Fellowship Drive
|
Mt. Laurel
|
NJ
|
—
|
|
1,421
|
|
5,768
|
|
1,611
|
|
1,421
|
|
7,378
|
|
8,799
|
|
2,831
|
|
1980
|
1998
|
40
|
|||||||||||||
|
303 Fellowship Drive
|
Mt. Laurel
|
NJ
|
—
|
|
1,493
|
|
6,055
|
|
851
|
|
1,493
|
|
6,907
|
|
8,400
|
|
2,902
|
|
1979
|
1998
|
40
|
|||||||||||||
|
309 Fellowship Drive
|
Mt. Laurel
|
NJ
|
—
|
|
1,518
|
|
6,154
|
|
644
|
|
1,518
|
|
6,798
|
|
8,316
|
|
2,927
|
|
1982
|
1998
|
40
|
|||||||||||||
|
1000 Bishops Gate
|
Mt. Laurel
|
NJ
|
—
|
|
934
|
|
6,287
|
|
412
|
|
934
|
|
6,700
|
|
7,634
|
|
2,350
|
|
2005
|
2000
|
40
|
|||||||||||||
|
161 Gaither Drive
|
Mt. Laurel
|
NJ
|
—
|
|
1,016
|
|
4,064
|
|
679
|
|
1,016
|
|
4,743
|
|
5,759
|
|
1,719
|
|
1987
|
2001
|
40
|
|||||||||||||
|
815 East Gate Drive
|
Mt. Laurel
|
NJ
|
—
|
|
636
|
|
2,584
|
|
708
|
|
636
|
|
3,292
|
|
3,928
|
|
1,353
|
|
1986
|
1998
|
40
|
|||||||||||||
|
4000 Midlantic Drive
|
Mt. Laurel
|
NJ
|
—
|
|
714
|
|
5,085
|
|
(1,982
|
)
|
714
|
|
3,103
|
|
3,817
|
|
1,455
|
|
1998
|
1997
|
40
|
|||||||||||||
|
817 East Gate Drive
|
Mt. Laurel
|
NJ
|
—
|
|
611
|
|
2,426
|
|
152
|
|
611
|
|
2,578
|
|
3,189
|
|
1,088
|
|
1986
|
1998
|
40
|
|||||||||||||
|
400 Commerce Drive
|
Newark
|
DE
|
—
|
|
2,528
|
|
9,220
|
|
1,048
|
|
2,528
|
|
10,268
|
|
12,796
|
|
3,627
|
|
1997
|
2002
|
40
|
|||||||||||||
|
100 Commerce Drive
|
Newark
|
DE
|
—
|
|
1,160
|
|
4,633
|
|
857
|
|
1,160
|
|
5,490
|
|
6,650
|
|
2,381
|
|
1989
|
1997
|
40
|
|||||||||||||
|
200 Commerce Drive
|
Newark
|
DE
|
—
|
|
911
|
|
4,414
|
|
1,018
|
|
911
|
|
5,432
|
|
6,343
|
|
2,012
|
|
1998
|
2002
|
40
|
|||||||||||||
|
Main Street - Plaza 1000
|
Voorhees
|
NJ
|
—
|
|
2,732
|
|
10,942
|
|
3,074
|
|
2,732
|
|
14,016
|
|
16,748
|
|
9,611
|
|
1988
|
1997
|
40
|
|||||||||||||
|
Main Street - Piazza
|
Voorhees
|
NJ
|
—
|
|
696
|
|
2,802
|
|
2,529
|
|
696
|
|
5,332
|
|
6,028
|
|
1,415
|
|
1990
|
1997
|
40
|
|||||||||||||
|
Main Street - Promenade
|
Voorhees
|
NJ
|
—
|
|
531
|
|
2,052
|
|
445
|
|
531
|
|
2,496
|
|
3,027
|
|
1,097
|
|
1988
|
1997
|
40
|
|||||||||||||
|
920 North King Street
|
Wilmington
|
DE
|
—
|
|
6,141
|
|
21,140
|
|
2,485
|
|
6,141
|
|
23,625
|
|
29,766
|
|
6,854
|
|
1989
|
2004
|
30
|
|||||||||||||
|
300 Delaware Avenue
|
Wilmington
|
DE
|
—
|
|
6,368
|
|
13,739
|
|
2,546
|
|
6,368
|
|
16,285
|
|
22,653
|
|
5,836
|
|
1989
|
2004
|
23
|
|||||||||||||
|
Two Righter Parkway
|
Wilmington
|
DE
|
—
|
|
2,802
|
|
11,217
|
|
6,264
|
|
2,802
|
|
17,481
|
|
20,283
|
|
4,069
|
|
1987
|
2001
|
40
|
|||||||||||||
|
One Righter Parkway
|
Wilmington
|
DE
|
—
|
|
2,545
|
|
10,195
|
|
5,088
|
|
2,545
|
|
15,282
|
|
17,827
|
|
7,982
|
|
1989
|
1996
|
40
|
|||||||||||||
|
RICHMOND
|
||||||||||||||||||||||||||||||||||
|
4364 South Alston Avenue
|
Durham
|
NC
|
—
|
|
1,622
|
|
6,419
|
|
1,031
|
|
1,580
|
|
7,491
|
|
9,071
|
|
3,010
|
|
1985
|
1998
|
40
|
|||||||||||||
|
4805 Lake Brooke Drive
|
Glen Allen
|
VA
|
—
|
|
1,640
|
|
6,567
|
|
1,136
|
|
1,640
|
|
7,703
|
|
9,343
|
|
2,953
|
|
1996
|
1998
|
40
|
|||||||||||||
|
Overlook I
|
Glen Allen
|
VA
|
—
|
|
748
|
|
3,976
|
|
600
|
|
790
|
|
4,533
|
|
5,323
|
|
439
|
|
1998
|
2011
|
40
|
|||||||||||||
|
Overlook II
|
Glen Allen
|
VA
|
—
|
|
748
|
|
4,492
|
|
77
|
|
790
|
|
4,526
|
|
5,316
|
|
475
|
|
2000
|
2011
|
40
|
|||||||||||||
|
2812 Emerywood Parkway
|
Henrico
|
VA
|
—
|
|
1,069
|
|
4,281
|
|
505
|
|
1,069
|
|
4,786
|
|
5,855
|
|
2,017
|
|
1980
|
1998
|
40
|
|||||||||||||
|
300 Arboretum Place
|
Richmond
|
VA
|
—
|
|
5,450
|
|
21,892
|
|
3,457
|
|
5,450
|
|
25,349
|
|
30,799
|
|
10,047
|
|
1988
|
1998
|
40
|
|||||||||||||
|
7501 Boulders View Drive
|
Richmond
|
VA
|
—
|
|
4,669
|
|
19,699
|
|
2,112
|
|
4,925
|
|
21,555
|
|
26,480
|
|
4,030
|
|
1989
|
2007
|
40
|
|||||||||||||
|
7300 Beaufont Springs Drive
|
Richmond
|
VA
|
—
|
|
4,672
|
|
19,689
|
|
1,906
|
|
4,922
|
|
21,345
|
|
26,267
|
|
3,534
|
|
2000
|
2007
|
40
|
|||||||||||||
|
6800 Paragon Place
|
Richmond
|
VA
|
—
|
|
4,552
|
|
18,414
|
|
2,020
|
|
4,552
|
|
20,434
|
|
24,986
|
|
4,057
|
|
1987
|
2006
|
40
|
|||||||||||||
|
6802 Paragon Place
|
Richmond
|
VA
|
—
|
|
2,917
|
|
11,454
|
|
2,912
|
|
2,917
|
|
14,366
|
|
17,283
|
|
4,666
|
|
1989
|
2002
|
40
|
|||||||||||||
|
1025 Boulders Parkway
|
Richmond
|
VA
|
—
|
|
2,574
|
|
11,297
|
|
1,573
|
|
2,824
|
|
12,620
|
|
15,444
|
|
2,100
|
|
1994
|
2007
|
40
|
|||||||||||||
|
2100-2116 West Laburnam Avenue
|
Richmond
|
VA
|
—
|
|
2,482
|
|
8,846
|
|
2,707
|
|
2,482
|
|
11,553
|
|
14,035
|
|
4,917
|
|
1984
|
1998
|
40
|
|||||||||||||
|
7401 Beaufont Springs Drive
|
Richmond
|
VA
|
—
|
|
2,349
|
|
10,396
|
|
992
|
|
2,599
|
|
11,138
|
|
13,737
|
|
1,904
|
|
1998
|
2007
|
40
|
|||||||||||||
|
7325 Beaufont Springs Drive
|
Richmond
|
VA
|
—
|
|
2,344
|
|
10,377
|
|
503
|
|
2,594
|
|
10,629
|
|
13,223
|
|
1,753
|
|
1999
|
2007
|
40
|
|||||||||||||
F- 65
BRANDYWINE REALTY TRUST AND BRANDYWINE OPERATING PARTNERSHIP, L.P.
Schedule III
Real Estate and Accumulated Depreciation — December 31, 2013
(in thousands)
|
|
|
|
|
|
|
|
Gross Amount at Which Carried
|
|
|
|
||||||||||||||||||||||||
|
|
|
|
|
Initial Cost
|
December 31, 2013
|
|
|
|
||||||||||||||||||||||||||
|
Property Name
|
City
|
State
|
Encumberances at
December 31, 2013(a) |
Land
|
Building and
Improvements
|
Net
Improvements (Retirements) Since
Acquisition
|
Land
|
Building and
Improvements
|
Total (b)
|
Accumulated
Depreciation at December 31,
2013 (c)
|
Year of
Construction
|
Year
Acquired
|
Depreciable
Life
|
|||||||||||||||||||||
|
9011 Arboretum Parkway
|
Richmond
|
VA
|
—
|
|
1,857
|
|
7,702
|
|
906
|
|
1,857
|
|
8,609
|
|
10,466
|
|
3,571
|
|
1991
|
1998
|
40
|
|||||||||||||
|
6806 Paragon Place
|
Richmond
|
VA
|
—
|
|
—
|
|
10,288
|
|
(105
|
)
|
403
|
|
9,780
|
|
10,183
|
|
2,297
|
|
2007
|
2005
|
40
|
|||||||||||||
|
9100 Arboretum Parkway
|
Richmond
|
VA
|
—
|
|
1,362
|
|
5,489
|
|
761
|
|
1,362
|
|
6,250
|
|
7,612
|
|
2,591
|
|
1987
|
1998
|
40
|
|||||||||||||
|
2511 Brittons Hill Road
|
Richmond
|
VA
|
—
|
|
1,202
|
|
4,820
|
|
1,221
|
|
1,202
|
|
6,041
|
|
7,243
|
|
2,652
|
|
1987
|
1998
|
40
|
|||||||||||||
|
100 Gateway Centre Parkway
|
Richmond
|
VA
|
—
|
|
391
|
|
5,410
|
|
616
|
|
391
|
|
6,027
|
|
6,418
|
|
1,725
|
|
2001
|
1998
|
40
|
|||||||||||||
|
9200 Arboretum Parkway
|
Richmond
|
VA
|
—
|
|
985
|
|
3,973
|
|
1,225
|
|
985
|
|
5,198
|
|
6,183
|
|
2,136
|
|
1987
|
1998
|
40
|
|||||||||||||
|
9210 Arboretum Parkway
|
Richmond
|
VA
|
—
|
|
1,110
|
|
4,474
|
|
527
|
|
1,110
|
|
5,001
|
|
6,111
|
|
2,151
|
|
1988
|
1998
|
40
|
|||||||||||||
|
2201-2245 Tomlynn Street
|
Richmond
|
VA
|
—
|
|
1,020
|
|
4,067
|
|
793
|
|
1,020
|
|
4,860
|
|
5,880
|
|
1,944
|
|
1989
|
1998
|
40
|
|||||||||||||
|
9211 Arboretum Parkway
|
Richmond
|
VA
|
—
|
|
582
|
|
2,433
|
|
886
|
|
582
|
|
3,320
|
|
3,902
|
|
1,206
|
|
1991
|
1998
|
40
|
|||||||||||||
|
2221-2245 Dabney Road
|
Richmond
|
VA
|
—
|
|
530
|
|
2,123
|
|
349
|
|
530
|
|
2,472
|
|
3,002
|
|
889
|
|
1994
|
1998
|
40
|
|||||||||||||
|
2212-2224 Tomlynn Street
|
Richmond
|
VA
|
—
|
|
502
|
|
2,014
|
|
395
|
|
502
|
|
2,409
|
|
2,911
|
|
938
|
|
1985
|
1998
|
40
|
|||||||||||||
|
2244 Dabney Road
|
Richmond
|
VA
|
—
|
|
550
|
|
2,203
|
|
37
|
|
550
|
|
2,240
|
|
2,790
|
|
947
|
|
1993
|
1998
|
40
|
|||||||||||||
|
2277 Dabney Road
|
Richmond
|
VA
|
—
|
|
507
|
|
2,034
|
|
241
|
|
507
|
|
2,274
|
|
2,781
|
|
889
|
|
1986
|
1998
|
40
|
|||||||||||||
|
2248 Dabney Road
|
Richmond
|
VA
|
—
|
|
512
|
|
2,049
|
|
131
|
|
512
|
|
2,181
|
|
2,693
|
|
898
|
|
1989
|
1998
|
40
|
|||||||||||||
|
2161-2179 Tomlynn Street
|
Richmond
|
VA
|
—
|
|
423
|
|
1,695
|
|
315
|
|
423
|
|
2,010
|
|
2,433
|
|
764
|
|
1985
|
1998
|
40
|
|||||||||||||
|
2246 Dabney Road
|
Richmond
|
VA
|
—
|
|
455
|
|
1,822
|
|
18
|
|
455
|
|
1,840
|
|
2,295
|
|
770
|
|
1987
|
1998
|
40
|
|||||||||||||
|
2251 Dabney Road
|
Richmond
|
VA
|
—
|
|
387
|
|
1,552
|
|
110
|
|
387
|
|
1,662
|
|
2,049
|
|
703
|
|
1983
|
1998
|
40
|
|||||||||||||
|
2256 Dabney Road
|
Richmond
|
VA
|
—
|
|
356
|
|
1,427
|
|
235
|
|
356
|
|
1,662
|
|
2,018
|
|
746
|
|
1982
|
1998
|
40
|
|||||||||||||
|
2130-2146 Tomlynn Street
|
Richmond
|
VA
|
—
|
|
353
|
|
1,416
|
|
169
|
|
353
|
|
1,585
|
|
1,938
|
|
636
|
|
1988
|
1998
|
40
|
|||||||||||||
|
2120 Tomlynn Street
|
Richmond
|
VA
|
—
|
|
281
|
|
1,125
|
|
179
|
|
281
|
|
1,304
|
|
1,585
|
|
560
|
|
1984
|
1998
|
40
|
|||||||||||||
|
2240 Dabney Road
|
Richmond
|
VA
|
—
|
|
264
|
|
1,059
|
|
98
|
|
264
|
|
1,157
|
|
1,421
|
|
451
|
|
1984
|
1998
|
40
|
|||||||||||||
|
Boulders Land
|
Richmond
|
VA
|
—
|
|
1,256
|
|
—
|
|
28
|
|
1,259
|
|
25
|
|
1,284
|
|
—
|
|
N/A
|
2007
|
N/A
|
|||||||||||||
F- 66
BRANDYWINE REALTY TRUST AND BRANDYWINE OPERATING PARTNERSHIP, L.P.
Schedule III
Real Estate and Accumulated Depreciation — December 31, 2013
(in thousands)
|
|
|
|
|
|
|
|
Gross Amount at Which Carried
|
|
|
|
||||||||||||||||||||||||||||||||
|
|
|
|
|
Initial Cost
|
December 31, 2013
|
|
|
|
||||||||||||||||||||||||||||||||||
|
Property Name
|
City
|
State
|
Encumberances at
December 31, 2013 (a) |
Land
|
Building and
Improvements
|
Net
Improvements (Retirements) Since
Acquisition
|
Land
|
Building and
Improvements
|
Total (b)
|
Accumulated
Depreciation at December 31,
2013 (c)
|
Year of
Construction
|
Year
Acquired
|
Depreciable
Life
|
|||||||||||||||||||||||||||||
|
AUSTIN
|
||||||||||||||||||||||||||||||||||||||||||
|
11305 Four Points Drive
|
Austin
|
TX
|
—
|
|
962
|
|
35,894
|
|
36,856
|
|
962
|
|
35,894
|
|
36,856
|
|
—
|
|
2008
|
2013
|
40
|
|||||||||||||||||||||
|
CALIFORNIA
|
||||||||||||||||||||||||||||||||||||||||||
|
5900 & 5950 La Place Court
|
Carlsbad
|
CA
|
—
|
|
3,706
|
|
11,185
|
|
3,401
|
|
3,955
|
|
14,337
|
|
18,292
|
|
3,015
|
|
1988
|
2006
|
48
|
|||||||||||||||||||||
|
5963 La Place Court
|
Carlsbad
|
CA
|
—
|
|
2,824
|
|
9,413
|
|
2,197
|
|
2,999
|
|
11,435
|
|
14,434
|
|
2,164
|
|
1987
|
2006
|
55
|
|||||||||||||||||||||
|
2035 Corte Del Nogal
|
Carlsbad
|
CA
|
—
|
|
3,261
|
|
6,077
|
|
1,175
|
|
3,499
|
|
7,015
|
|
10,514
|
|
1,902
|
|
1991
|
2006
|
39
|
|||||||||||||||||||||
|
1200 Concord Avenue
|
Concord
|
CA
|
—
|
|
6,395
|
|
24,664
|
|
809
|
|
6,515
|
|
25,352
|
|
31,867
|
|
6,693
|
|
1984
|
2006
|
34
|
|||||||||||||||||||||
|
1220 Concord Avenue
|
Concord
|
CA
|
—
|
|
6,476
|
|
24,966
|
|
260
|
|
6,476
|
|
25,226
|
|
31,702
|
|
6,375
|
|
1984
|
2006
|
34
|
|||||||||||||||||||||
|
155 Grand Avenue
|
Oakland
|
CA
|
—
|
|
13,556
|
|
54,267
|
|
5,764
|
|
13,557
|
|
60,031
|
|
73,588
|
|
11,951
|
|
1990
|
2007
|
40
|
|||||||||||||||||||||
|
Two Kaiser Plaza
|
Oakland
|
CA
|
—
|
|
7,841
|
|
—
|
|
—
|
|
7,841
|
|
—
|
|
7,841
|
|
—
|
|
N/A
|
2006
|
N/A
|
|||||||||||||||||||||
|
Oakland Lot B
|
Oakland
|
CA
|
—
|
|
4,342
|
|
—
|
|
—
|
|
4,342
|
|
—
|
|
4,342
|
|
—
|
|
N/A
|
2006
|
N/A
|
|||||||||||||||||||||
|
|
Total:
|
|
$
|
669,762
|
|
$
|
634,189
|
|
$
|
3,454,900
|
|
$
|
617,057
|
|
$
|
680,513
|
|
$
|
3,988,776
|
|
$
|
4,669,289
|
|
$
|
983,808
|
|
|
|
|
|||||||||||||
|
(a)
|
Excludes the effect of any net interest premium/(discount).
|
|
(b)
|
Reconciliation of Real Estate:
|
The following table reconciles the real estate investments from
January 1, 2011
to
December 31, 2013
(in thousands):
|
2013
|
2012
|
2011
|
|||||||||
|
Balance at beginning of year
|
$
|
4,726,169
|
|
$
|
4,793,080
|
|
$
|
4,834,111
|
|
||
|
Additions:
|
|
|
|
||||||||
|
Acquisitions
|
347,510
|
|
50,579
|
|
31,454
|
|
|||||
|
Capital expenditures and assets placed into service
|
109,740
|
|
90,619
|
|
133,550
|
|
|||||
|
Less:
|
|
|
|
||||||||
|
Dispositions
|
(474,275
|
)
|
(168,408
|
)
|
(163,971
|
)
|
|||||
|
Retirements
|
(39,855
|
)
|
(39,701
|
)
|
(42,064
|
)
|
|||||
|
Balance at end of year
|
$
|
4,669,289
|
|
$
|
4,726,169
|
|
$
|
4,793,080
|
|
||
The aggregate cost for federal income tax purposes is
$4.0 billion
as of
December 31, 2013
.
F- 67
|
(c)
|
Reconciliation of Accumulated Depreciation:
|
The following table reconciles the accumulated depreciation on real estate investments from
January 1, 2011
to
December 31, 2013
(in thousands):
|
2013
|
2012
|
2011
|
|||||||||
|
Balance at beginning of year
|
$
|
954,665
|
|
$
|
865,710
|
|
$
|
776,078
|
|
||
|
Additions:
|
|
|
|
||||||||
|
Depreciation expense — continuing operations
|
150,236
|
|
154,095
|
|
157,691
|
|
|||||
|
Depreciation expense — discontinued operations
|
9,164
|
|
2,143
|
|
1,185
|
|
|||||
|
Less:
|
|
|
|
||||||||
|
Dispositions
|
(91,890
|
)
|
(28,270
|
)
|
(62,022
|
)
|
|||||
|
Retirements
|
$
|
(38,367
|
)
|
$
|
(39,013
|
)
|
$
|
(7,222
|
)
|
||
|
Balance at end of year
|
$
|
983,808
|
|
$
|
954,665
|
|
$
|
865,710
|
|
||
(d) Total net improvements since acquisition for these development properties do not include amounts allocated to construction-in-progress, as shown within the Company's consolidated balance sheet as of
December 31, 2013
.
(e) This property was contributed to an unconsolidated real estate venture, however, the Company will continue to consolidate this property due to its continuing involvement in this property resulting from its ongoing lease at this property and its
50%
ownership interest in the venture. Please see Note 3 to the consolidated financial statements for additional information.
F- 68
TABLE OF CONTENTS
Part IItem 1. BusinessItem 1A. Risk FactorsItem 1B. Unresolved Staff CommentsItem 2. PropertiesItem 3. Legal ProceedingsItem 4. Mine Safety DisclosuresPart IIItem 5. Market For Registrant S Common Equity, Related Shareholder Matters and Issuer Purchases Of Equity SecuritiesItem 6. Selected Financial DataItem 7. Management S Discussion and Analysis Of Financial Condition and Results Of OperationsItem 7A. Quantitative and Qualitative Disclosures About Market RiskItem 8. Financial Statements and Supplementary DataItem 9. Changes in and Disagreements with Accountants on Accounting and Financial DisclosureItem 9A. Controls and ProceduresItem 9B. Other InformationPart IIIItem 10. Directors, Executive Officers and Corporate GovernanceItem 11. Executive CompensationItem 12. Security Ownership Of Certain Beneficial Owners and Management and Related Shareholder MattersItem 13. Certain Relationships and Related Transactions, and Director IndependenceItem 14. Principal Accountant Fees and ServicesPart IVItem 15. Exhibits and Financial Statement Schedules