UNITED STATES
SECURITIES AND EXCHANGE COMMISSION
Washington, D.C. 20549
________________________________________________________________________
FORM 10-K
________________________________________________________________________
|
(Mark One)
|
|
|
þ
|
ANNUAL REPORT PURSUANT TO SECTION 13 OR 15(d) OF THE SECURITIES EXCHANGE ACT OF 1934
|
|
For the year ended: December 31, 2019
|
|
|
or
|
|
|
¨
|
TRANSITION REPORT PURSUANT TO SECTION 13 OR 15(d) OF THE SECURITIES EXCHANGE ACT OF 1934
|
|
For the transition period from ____________to ____________
|
|
Commission File Number 001-38598
________________________________________________________________________

BLOOM ENERGY CORPORATION
(Exact name of Registrant as specified in its charter)
________________________________________________________________________
|
Delaware
|
77-0565408
|
|
(Sate or other jurisdiction of incorporation or organization)
|
(I.R.S. Employer Identification Number)
|
|
4353 North First Street, San Jose, California
|
95134
|
|
(Address of principal executive offices)
|
(Zip Code)
|
|
(408) 543-1500
|
|
|
(Registrant’s telephone number, including area code)
|
|
|
Securities registered pursuant to Section 12(b) of the Securities Exchange Act
|
||
|
Title of Each Class
(1)
|
Trading Symbol
|
Name of each exchange on which registered
|
|
Class A Common Stock $0.0001 par value
|
BE
|
New York Stock Exchange
|
|
(1)
Our Class B Common Stock is not registered but is convertible into shares of Class A Common Stock at the election of the holder.
|
||
________________________________________________________________________
Indicate by check mark whether the registrant is a well-known seasoned issuer, as defined in Rule 405 of the Securities Act. Yes
¨
No
þ
Indicate by check mark if the registrant is not required to file reports pursuant to Section 13 or 15(d) of the Act. Yes
¨
No
þ
Indicate by check mark whether the registrant (1) has filed all reports required to be filed by Section 13 or 15(d) of the Securities Exchange Act of 1934 during the preceding 12 months (or for such shorter period that the registrant was required to file such reports), and (2) has been subject to such filing requirements for the past 90 days. Yes
þ
No
¨
Indicate by check mark whether the registrant has submitted electronically every Interactive Data File required to be submitted pursuant to Rule 405 of Regulation S-T (§232.405 of this chapter) during the preceding 12 months (or for such shorter period that the registrant was required to submit such files). Yes
þ
No
¨
Indicate by check mark whether the registrant is a large accelerated filer, an accelerated filer, a non-accelerated filer, a smaller reporting company or an emerging growth company. See the definitions of “large accelerated filer,” “accelerated filer,” “smaller reporting company” and “emerging growth company” in Rule 12b-2 of the Exchange Act.
Large accelerated filer
¨
Accelerated filer
þ
Non-accelerated filer
¨
Smaller reporting company
¨
Emerging growth company
þ
If an emerging growth company, indicate by check mark if the registrant has elected not to use the extended transition period for complying with any new or revised financial accounting standards provided pursuant to Section 13(a) of the Exchange Act.
¨
Indicate by check mark whether the registrant is a shell company (as defined in Rule 12b-2 of the Act). Yes
¨
No
þ
The aggregate market value of the registrant’s Class A common stock held by non-affiliates of the registrant was
$659.7 million
based upon the closing price of $12.27 per share of our Class A common stock on the New York Stock Exchange on June 28, 2019 (the last trading day of the registrant’s most recently completed second quarter). Shares of Class A common stock held by each executive officer, director and holder of 5% of more of the outstanding Class A common stock have been excluded in that such persons may be deemed to be affiliates. The determination of affiliate status if not necessarily a conclusive determination for other purposes.
The number of shares of the registrant’s common stock outstanding as of
March 16, 2020
was as follows:
Class A Common Stock $0.0001 par value
90,231,067 shares
Class B Common Stock $0.0001 par value
34,872,888 shares
________________________________________________________________________
DOCUMENTS INCORPORATED BY REFERENCE
Portions of the registrant’s proxy statement for the 2020 Annual Meeting of Stockholders (2020 Proxy Statement) are incorporated into Part III hereof. The 2020 Proxy Statement will be filed with the U.S. Securities and Exchange Commission within 120 days after the registrant’s year ended
December 31, 2019
.
Bloom Energy Corporation
Annual Report on Form 10-K
for the
Years Ended December 31, 2019
Table of Contents
|
|
Page
|
|
Part I
|
|
|
Part II
|
|
|
Consolidated Statements of Convertible Redeemable Preferred Stock,
Redeemable Noncontrolling Interest, Stockholders' Deficit and Noncontrolling Interest
|
|
|
Part III
|
|
|
Part IV
|
|
Unless the context otherwise requires, the terms "we," "us," "our," "Bloom Energy," and the "Company" each refer to Bloom Energy Corporation and all of its subsidiaries.
3
SPECIAL NOTE ABOUT FORWARD-LOOKING STATEMENTS
This
Annual Report on Form 10-K
contains forward-looking statements within the meaning of Section 27A of the Securities Act of 1933, as amended, and Section 21E of the Securities Exchange Act of 1934, as amended, . All statements contained in this
Annual Report on Form 10-K
other than statements of historical fact, including statements regarding our future operating results and financial position, our business strategy and plans and our objectives for future operations, are forward-looking statements. The words “believe,” “may,” “will,” “estimate,” “continue,” “anticipate,” “predict,” “project,” “potential,” ”seek,” “intend,” “could,” “would,” “should,” “expect,” “plan” and similar expressions are intended to identify forward-looking statements.
Forward-looking statements in this
Annual Report on Form 10-K
include, but are not limited to, our plans and expectations regarding future financial results, including the potential impact of our restatement, the impact of the COVID-19 pandemic, expected operating results, business strategies, the sufficiency of our cash and our liquidity, projected costs and cost reductions, development of new products and improvements to our existing products, the impact of recently adopted accounting pronouncements, our manufacturing capacity and manufacturing costs, the adequacy of our agreements with our suppliers, legislative actions and regulatory compliance, competitive position, management’s plans and objectives for future operations, our ability to obtain financing, our ability to comply with debt covenants or cure defaults, if any, our ability to repay our obligations as they come due, trends in average selling prices, the success of our power purchase agreement entities, expected capital expenditures, warranty matters, outcomes of litigation, our exposure to foreign exchange, interest and credit risk, general business and economic conditions in our markets, industry trends, the impact of changes in government incentives, risks related to privacy and data security, the likelihood of any impairment of project assets, long-lived assets and investments, trends in revenue, cost of revenue and gross profit (loss), trends in operating expenses including research and development expense, sales and marketing expense and general and administrative expense and expectations regarding these expenses as a percentage of revenue, future deployment of our Bloom Energy Servers, expansion into new markets, our ability to expand our business with our existing customers, our ability to increase efficiency of our product, our ability to decrease the cost of our product, our future operating results and financial position, our business strategy and plans and our objectives for future operations
.
You should not rely upon forward-looking statements as predictions of future events. We have based the forward-looking statements contained in this
Annual Report on Form 10-K
primarily on our current expectations and projections about future events and trends that we believe may affect our business, financial condition, operating results and prospects. The outcome of the events described in these forward-looking statements is subject to risks, uncertainties and other factors including those discussed in Item 1A -
Risk Factors
and elsewhere in this
Annual Report on Form 10-K
. Moreover, we operate in a very competitive and rapidly changing environment. New risks and uncertainties emerge from time to time and it is not possible for us to predict all risks and uncertainties or the extent to which any factor or combination of factors may cause actual results to differ materially from those contained in any forward-looking statements we may make in this
Annual Report on Form 10-K
. We cannot assure you that the results, events and circumstances reflected in the forward-looking statements will be achieved or occur. Actual results, events or circumstances could differ materially and adversely from those described or anticipated in the forward-looking statements.
The forward-looking statements made in this
Annual Report on Form 10-K
relate only to events as of the date on which the statements are made. We undertake no obligation to update any forward-looking statements made in this
Annual Report on Form 10-K
to reflect events or circumstances after the date of this
Annual Report on Form 10-K
or to reflect new information or the occurrence of unanticipated events, except as required by law. We may not actually achieve the plans, intentions or expectations disclosed in our forward-looking statements and you should not place undue reliance on our forward-looking statements.
Our actual results and timing of selected events may differ materially from those anticipated in these forward-looking statements as a result of many factors including those discussed under Item 1A -
Risk Factors
and elsewhere in this
Annual Report on Form 10-K
.
4
Explanatory Note
General
On February 11, 2020, our management, in consultation with the Audit Committee of our Board of Directors, determined that Bloom's previously issued consolidated financial statements as of and for the year ended December 31, 2018, as well as the unaudited interim financial statements for the three-month period ended March 31, 2019, the three- and six-month periods ended June 30, 2019 and 2018 and the three- and nine-month periods ended September 30, 2019 and 2018, should no longer be relied upon due to misstatements related to our Managed Services Agreements and similar arrangements, and we would restate such financial statements to make the necessary accounting corrections. The revenue for the Managed Services Agreements and similar transactions will now be recognized over the duration of the contract instead of upfront. In addition, management determined that the impact of these misstatements to periods prior to the three months ended June 30, 2018 was not material to warrant restatement of reported figures, however, our consolidated financial statements as of and for the year ended December 31, 2017, selected financial data as of and for the year ended December 31, 2016 and the relevant unaudited selected quarterly financial data for the three month period ended March 31, 2018 would be revised to correct these misstatements.
The misstatements are described in greater detail below.
Restatement Background
As described in our Current Report on Form 8-K filed with the Securities and Exchange Commission (“SEC”) on February 12, 2020, there were certain misstatements in prior periods financial statements relating to the accounting treatment for our Managed Services Agreements. Under our Managed Services program, we sell our equipment to a bank financing party under a sale-leaseback agreement, which pays us for the Energy Server and takes title to the Energy Server. We then enter into a service contract with an end customer, who pays the bank a fixed, monthly fee for its use of the Energy Server and pays us for our maintenance and operation of the Energy Server.
The majority of these Managed Services Agreements and similar transactions were originally recorded as sales, subject to an operating lease, in which revenues and associated costs were recognized at the time of installation and acceptance of the Bloom Energy Server at the customer site.
In December 2019, in the course of reviewing a Managed Services transaction that closed on November 27, 2019 under a Managed Services Agreements financing (as reported in our Current Report on Form 8-K filed with the SEC on December 5, 2019), an issue was identified related to the accounting for our Managed Services Agreements transactions. The issue primarily related to whether the terms of our Managed Services Agreements and similar arrangements, including the events of default provisions, satisfied the requirements for sales under the revenue accounting standards or instead required us to follow lease accounting standards (ASC 840). Subsequently, it was determined that the previous accounting for the Managed Services Agreements and similar transactions resulted in material misstatements, as the Managed Services Agreements and similar transactions should have been accounted for as financing transactions under lease accounting standards.
The impact of the correction of the misstatement is to recognize amounts received from the bank financing party as a financing obligation, and the Energy Server is recorded within property, plant and equipment, net on our consolidated balance sheets. In addition, payments received by the bank from the customer now cover amounts owed to the bank based on the power generated by the systems. We recognize revenue for the electricity generated by the systems, based on these payments, and the corresponding financing obligation to the bank is also amortized as payments are received from the customer, with interest thereon being calculated on an effective interest rate basis. Depreciation expense is also recognized over the estimated useful life of the Energy Server.
In addition, another error was identified related to stock-based compensation costs associated with manufacturing employees that were previously expensed, but should have been capitalized as a component of Energy Server manufacturing costs to inventory, deferred cost of revenues, construction-in-progress and property, plant and equipment as per ASC 330 and SEC Staff Accounting Bulletin Topic 14. These costs will now be expensed on consumption of the related inventory and over the economic useful life of the property, plant and equipment, as applicable.
Also, as part of a review of historical revenue agreements as a result of the issues above, it was noted that the Company failed to identify embedded derivatives in certain revenue agreements for an escalator price protection (“EPP”) feature given to its customers. As a result, the Company has recorded a derivative liability, with an offset to revenue, to account for the fair value of this feature at inception and will record the liability at its then fair value at each period end.
Finally, there were certain other immaterial misstatements identified or which had been previously identified which are also being corrected in connection with the restatement and/or revision of previously issued financial statements.
5
The correction of the misstatements resulted in a cumulative overstatement of revenue totaling
$192.1 million
through September 30, 2019, including
$178.8 million
relating to the cumulative period from April 1, 2018 through September 30, 2019 that is being restated in this Annual Report on Form 10-K, and
$13.3 million
relating to the cumulative period from January 1, 2016 through March 31, 2018 that is being revised in this Annual Report on Form 10-K. The corresponding cumulative overstatement of cost of revenue totaled
$166.1 million
through September 30, 2019, including
$149.4 million
relating to the cumulative period from April 1, 2018 through September 30, 2019 that is being restated in this Annual Report on Form 10-K, and additionally
$16.7 million
relating to the cumulative period from January 1, 2016 through March 31, 2018 that is being revised in this Annual Report on Form 10-K. We do not believe that the misstatements are material to any period prior to the three month period ended June 30, 2018.
Restatement, Revision and Recasting of Previously Issued Consolidated Financial Statements
This Annual Report on Form 10-K restates and revises previously filed amounts included in the 2018 Annual Report, including the consolidated financial statements as of December 31, 2018 and for the fiscal years ended December 31, 2018, 2017 and 2016.
The relevant unaudited Selected Quarterly Financial Data for the quarterly periods ended September 30, 2019, June 30, 2019, March 31, 2019, December 31, 2018, September 30, 2018, and June 30, 2018 has also been restated, and March 31, 2018 has been revised. Additionally, the 2019 unaudited Selected Quarterly Financial Data included in this Annual Report on Form 10-K have also been recast for the effects of ASC 606 which we adopted with effect from January 1, 2019, using the modified retrospective method.
See Note 2,
Restatement and Revision of Previously Issued Consolidated Financial Statements
, and Note 3,
Revenue Recognition,
and Note 18,
Unaudited Selected Quarterly Financial Data
, in Item 8,
Financial Statements and Supplementary Data
for additional information.
The restatement and revision resulted in the following impacts to our previously reported results
(in thousands, except per share data):
|
Nine Months Ended September 30,
|
Year Ended December 31,
|
|||||||||||
|
2019
|
2018
|
2017
|
||||||||||
|
Restatement Impact
|
Restatement Impact
|
Revision Impact
|
||||||||||
|
|
|
|||||||||||
|
Total revenues
|
$
|
(70,156
|
)
|
$
|
(109,390
|
)
|
$
|
(10,373
|
)
|
|||
|
Gross profit (loss)
|
(17,233
|
)
|
(11,320
|
)
|
1,733
|
|
||||||
|
Net loss available to common stockholders (increase)
|
(36,793
|
)
|
(31,787
|
)
|
(13,763
|
)
|
||||||
|
Basic and diluted loss per common share (increase)
|
(0.32
|
)
|
(0.60
|
)
|
(1.34
|
)
|
||||||
Internal Control Considerations
In connection with the restatement, our management has assessed the effectiveness of our internal control over financial reporting. Based on this assessment, management identified a material weakness in our internal control over financial reporting resulting in the conclusion by our Chief Executive Officer and Chief Financial Officer that our internal control over financial reporting and our disclosure controls and procedures were not effective as of December 31, 2019. Management is taking steps to remediate the material weakness in our internal control over financial reporting, as described in Item 9A.
See Item 9A,
Controls and Procedures
, for additional information related to the identified material weakness in internal control over financial reporting and the related remediation measures.
6
Part I
ITEM 1 - BUSINESS
Overview
Bloom Energy’s mission is to make clean, reliable, and affordable energy for everyone in the world. Our product, the Bloom Energy Server, is a stationary power generation platform built for the digital age and capable of delivering highly reliable, always-on, 24x7 constant power that is also clean and sustainable. The Bloom Energy Server converts standard low-pressure natural gas or biogas into electricity through an electrochemical process without combustion, resulting in very high conversion efficiencies and lower harmful emissions than conventional fossil fuel generation. A typical configuration produces 250 kilowatts of power in a footprint roughly equivalent to that of half of a standard thirty-foot shipping container, or approximately 125 times more space-efficient than solar power generation. 250 kilowatts of power is roughly equivalent to the constant power requirement of a typical big box retail store. Any number of these Energy Server systems can be clustered together in various configurations to form solutions from hundreds of kilowatts to many tens of megawatts. These solutions can also be configured as Bloom Energy AlwaysON Microgrids, providing the capability to power facilities independently of the main electrical grid indefinitely.
Our team has decades of experience in the various specialized disciplines and systems engineering concepts embedded in this technology. We had 240 issued patents in the United States and 124 issued patents internationally as of December 31, 2019.
Our solution is capable of addressing customer needs across a wide range of industry verticals. The industries we currently serve consist of banking and financial services, cloud services, technology and data centers, communications and media, consumer packaged goods and consumables, education, government, healthcare, hospitality, logistics, manufacturing, real estate, retail and utilities.
We currently have installations in eleven states in the United States (California, Connecticut, Delaware, Maryland, Massachusetts, North Carolina, New Jersey, New York, Pennsylvania, Utah and Virginia) as well as in Japan, India and the Republic of Korea.
The United States is our largest market and installed base of Bloom Energy Servers. Some of our largest customers in the U.S. include AT&T, Caltech, Delmarva Power & Light Company, Equinix, The Home Depot, Kaiser Permanente, and The Wonderful Company. We also work actively with U.S. financing partners such as Southern PowerSecure Holdings, Inc. ("The Southern Company"), Duke Energy One, Inc., Key Equipment Finance, a division of KeyBank National Association, and Assured Guaranty Municipal Corporation. These finance partners purchase our systems and deploy the systems at end-customers’ facilities in order to provide the electricity as a service.
South Korea is a world leader in the deployment of fuel cells for utility-scale electric power generation with approximately 300 megawatts ("MW") deployed. We entered this market with a first deployment of an 8.35 MW Bloom Energy Server solution for a Korean utility that began commercial operation in 2018 and it now represents our second largest market. SK Engineering and Construction, a subsidiary of the SK Group, serves as the distributor of our systems in South Korea. We are operating smaller deployments in India and Japan with commercial customers and these markets are still developing.
Our headquarters is located at 4353 North First Street, San Jose, California 95134 and our telephone number is (408) 543-1500. Our website address is www.bloomenergy.com. The information contained on any website referred to in this Annual Report on Form 10-K does not form any part of this Annual Report on Form 10-K and is not incorporated by reference herein unless expressly noted.
Our History
We were incorporated in the state of Delaware on January 18, 2001 as Ion America Corporation. On September 20, 2006, we changed our name to Bloom Energy Corporation.
Our most significant deployment milestones to date include:
|
•
|
Our first commercial deployment:
400 kilowatt deployment for a major internet company in August 2008;
|
|
•
|
Our first deployment under a PPA financing:
Completion of the first deployment that was financed pursuant to a PPA in October 2010;
|
|
•
|
The largest commercial customer deployment of fuel cell technology in the United States:
10 megawatt deployment at a major consumer technology company’s data center completed in December 2012;
|
7
|
•
|
The first large scale deployment of fuel cell technology to provide mission critical, primary power to a data center, without traditional backup power from diesel generators, batteries and UPS systems:
9.8 megawatt deployment in Utah in two phases completed in September 2013 and March 2015;
|
|
•
|
The largest utility scale deployment of fuel cell technology in the United States:
30 megawatt deployment in Delaware for Delmarva completed in November 2013;
|
|
•
|
The first international deployments:
First site deployed in Japan to provide uninterruptible power completed in June 2013; first site deployed in India in the second quarter of 2016; first site deployed in South Korea and first Power Tower deployment in the fourth quarter of 2018; and
|
|
•
|
Major cumulative deployment milestones:
Cumulative deployment of 50 megawatts by September 2012, cumulative deployment of 100 megawatts by September 2013, cumulative deployment of 200 megawatts by June 2016, cumulative deployment of 300 megawatts by March 2018, 85th microgrid installed in May 2019, and cumulative deployment of 380 megawatts by December 2019.
|
In July 2018, we completed an initial public offering of our common shares and sold 20,700,000 shares of our Class A common stock into the market.
Industry Background
According to Marketline, the market for electric power is one of the largest sectors of the global economy with total revenues of $2.5 trillion in 2017, and is projected to grow to $3.4 trillion in 2022.
There are numerous challenges facing producers of electricity. We believe these challenges will be the foundation of a transformation in how electricity is produced, delivered and consumed. We believe this transformation will be similar to the seismic shifts seen in the computer and telecommunications industries - similar to its centralized mainframe computing and landline telephone systems' shift to the ubiquitous and highly personalized distributed technologies seen today.
Increasing capital costs to maintain and operate the existing electric grid
.
The electric power grid has suffered from insufficient investment in critical infrastructure as a result of complexities surrounding the ownership, operation and regulation of grid infrastructure, compounded by the challenges of large capital costs and lack of adequate innovation. We believe that U.S. electric utilities will be required to make substantial capital expenditures simply to maintain the electrical grid infrastructure.
Inherent vulnerability of existing grid design.
The existing electric grid architecture features centralized, monolithic power plants and mostly above-ground transmission and distribution wires. The limits of this design, coupled with aging and underinvested infrastructure, leaves the grid vulnerable to natural disasters such as hurricanes, earthquakes, drought, wildfires, flooding and extreme temperature variations, which have increased in number and severity in recent years. In 2019, California’s major utilities shut off power to millions of people and businesses as part of their Public Power Safety Shutoff program to reduce the risk of their electric equipment sparking fires, which left some customers without power for nearly six days. These outages result in annual losses to American businesses of as much as $150 billion with weather-related disruptions costing the most per event. In addition to potential disruptions to the grid, there is also an increasing concern over the threat of cyber-attack and physical sabotage to the centralized grid infrastructure.
Intermittent generation sources such as wind and solar are negatively impacting grid stability
.
As the penetration of wind and solar resources increases, balancing real-time supply and demand becomes more challenging and costly. Due to these challenges, solutions are needed that provide constant base load 24x7 electric power that is reliable, clean and without the shortcomings of the existing grid infrastructure or intermittent sources such as wind and solar. This need is especially acute in the commercial and industrial customer segments, which represent 68% of global electricity consumption, according to Marketline, where cost and reliability can have a direct impact on profitability and business sustainability.
Increasing focus on reducing harmful emissions.
The electric power sector, which today produces more greenhouse gases than any other sector of the global economy, is under increasing pressure to do its part to reduce such emissions. Policy initiatives to reduce harmful emissions from power generation are widespread, including the adoption of renewable portfolio standards or mandated targets for low- or zero-carbon power generation.
Lack of access to affordable and reliable electricity in developing countries.
Building a centralized grid system, in addition to its inherent limitations, can also be infeasible in developing countries due to the lack of adequate capital for upfront investment. We believe these countries are likely to develop a hybrid solution consisting of both centralized and distributed electrical power infrastructure to accelerate the availability of power.
8
Our Solution
The Bloom Energy Server delivers reliable, resilient, clean and affordable energy, particularly in areas of high electricity costs, through its advanced distributed power generation system that is customizable, always-on and a source of primary base load power.
The Bloom Energy Server is based on our proprietary solid oxide fuel cell technology which converts fuel into electricity through an electrochemical process without combustion. The primary input to the system is standard low-pressure natural gas or biogas from local gas lines. The high-quality electrical output of our Energy Server is connected to the customer’s main electrical feed thereby avoiding the transmission and distribution losses associated with a centralized grid system. Each Bloom Energy Server is modular and composed of independent 50-kilowatt power modules. A typical configuration includes multiple power modules in a single Energy Server and can produce 250 kilowatts of power in a footprint roughly equivalent to that of half a standard 30 foot shipping container, or approximately 125 times more space-efficient than solar power generation. Any number of these Energy Server systems can be clustered together in various configurations to form solutions from hundreds of kilowatts to many tens of megawatts. The Bloom Energy Server is easily integrated into corporate environments due to its aesthetically attractive design, compact space requirement, and minimal noise profile.
Our Value Proposition
Our value proposition has five key elements which allow us to deliver a better electron: reliability, resiliency, cost savings and predictability, sustainability and personalization. We provide a complete, integrated “behind-the-meter” solution including installation, equipment, service, maintenance and, in some cases, bundled fuel. The five elements of our value proposition emphasize those areas where there is a strong customer need and where we believe we can deliver superior performance.
Reliability.
Our Energy Servers deliver always-on, 24x7 base load power with very high availability of power, mission-critical reliability and grid-independent capabilities. The Bloom Energy Server can be configured to eliminate the need for traditional backup power equipment such as diesel generators, batteries and uninterruptible power systems.
Resiliency.
Our Energy Servers avoid the vulnerabilities of conventional transmission and distribution lines by generating power on-site where the electricity is consumed. The system operates at very high availability due to its modular and fault-tolerant design which includes multiple independent power generation modules that can be hot-swapped. Importantly, our systems utilize the existing natural gas infrastructure which is a redundant underground mesh network.
Cost Predictability
. In contrast to the rising and unpredictable cost outlook for grid electricity, we offer our customers the ability to lock in cost for electric power (other than the price of natural gas) over the long-term. In the regions where the majority of our Energy Servers are deployed, our solution typically provides electricity to our customers at a cost that is competitive with traditional grid power prices. In addition, our solution provides greater cost predictability versus rising grid prices. Moreover, we provide customers with a solution that includes all of the fixed equipment and maintenance costs for the life of the contract.
Sustainability.
In operation, Bloom’s Energy Servers uniquely address both the causes and consequences of climate change. Our projects lower carbon emissions by displacing less efficient grid alternatives. We improve air quality, often in vulnerable communities, by generating electricity without combustion, and our microgrid deployments provide critical resilience from grid instability, driven increasingly by climate related extreme weather events. Our products achieve this all while using no water during operation and at very high power density, which optimizes land use.
We are focused on constant product innovation, including the continued reduction of carbon emissions from our products and are engaged in multiple efforts to align Bloom’s product roadmap with a zero emission trajectory. Already we are developing new applications and market opportunities in sectors with dirtier grids and higher marginal emissions displacement. We are focused on scaling use of renewable natural gas ("RNG") which is derived from biogas produced from decomposing organic waste from landfills, agricultural waste, and wastewater from treatment facilities, as fuel for our Energy Servers and building capacity within the market to further broader adoption. RNG is a biogas that has been upgraded to a quality similar to fossil natural gas and has a methane concentration of 90% or greater.
Additionally, we are pushing technology and business model boundaries to pioneer carbon emissions capture, utilization & storage ("CCUS") potential. Because carbon and nitrogen never mix in Bloom’s Servers, it is both feasible and cost effective to capture CO2 emissions, which can be stored in underground geologic formations or utilized in new products or processes. Finally, our research and development efforts continue to focus on preparing our Energy Servers to utilize renewable hydrogen fuel, a 100% clean fuel which is produced by breaking down water into hydrogen and oxygen using electrolysis. No new greenhouse gases would be produced when Energy Servers run on hydrogen, and using excess renewable capacity to create hydrogen would also help support further renewable adoption, compounding emissions benefits.
9
With our distributed, always-on, non-combustion process of generating clean electricity, Bloom works every day to reduce emissions, build resilience, and promote sustainable communities.
Personalization.
The Bloom Energy Server is designed as a platform which can be customized to the needs of each customer to deliver the level of reliability, resiliency, sustainability, and cost predictability. For example, our Energy Server can be enhanced with AlwaysON Microgrid components to deliver higher levels of reliability and grid independent operation.
Technology
The fuel cells in our Energy Servers convert fuel, such as natural gas or biogas, into electricity through an electrochemical reaction without burning the fuel. Each individual fuel cell is composed of three layers: an electrolyte sandwiched between a cathode and an anode. The electrolyte is a solid ceramic material, and the anode and cathode are made from inks that coat the electrolyte. Unlike other types of fuel cells, no precious metals, corrosive acids or molten materials are required. These fuel cells are the foundational building block of our Bloom Energy Server. We combine a number of the fuel cells into a stack, and then combine a number of the stacks to form 50 kilowatt power modules (depending upon the generation required by the customer). Any number of these Energy Server systems can be arranged in various configurations to form solutions from hundreds of kilowatts to many tens of megawatts. Regardless of the starting size of a solution, further scaling can be accomplished after the initial solution deployment, creating on-going flexibility and scalability for the customer.
In a primary power configuration, the Bloom Energy Server is interconnected to the customer’s electric grid connection. By regulation, the Bloom Energy Server must stop exporting power in case of a grid outage. However, Energy Servers can be upgraded to AlwaysON Microgrid solutions as add-on options at any point in time to enable continuous operation in the event of grid interruption. When in an always-on configuration, the Energy Server continually powers critical loads while the grid serves as a backup. Should there be a disruption to grid power, the critical load, which is already receiving primary power from the Energy Server, experiences no disruption. The combination of always-on power from our Energy Server, utilizing the natural gas infrastructure, and secondary feed from the independent electric grid results in a very highly available and reliable solution.
Research and Development
Our research and development organization has addressed complex applied materials, processing and packaging challenges through the invention of many proprietary advanced material science solutions. Over more than a decade, Bloom has built a world-class team of solid oxide fuel cell scientists and technology experts. Our team comprises technologists with degrees in Materials Science, Electrical Engineering, Chemical Engineering, Mechanical Engineering, Civil Engineering and Nuclear Engineering, and includes more than 46 PhDs. This team has continued to develop innovative technology improvements for our Energy Servers, achieving increased power density and electrical efficiency, reduced cost and improved reliability.
We have invested and will continue to invest a significant amount in research and development. See our discussion of research and development expenses in Item 7, Management’s Discussion and Analysis of Financial Condition and Results of Operations, of this Annual Report on Form 10-K for further information.
Competition
We primarily compete against the utility grid based on superior reliability, resiliency, cost savings, predictability and sustainability, all of which can be customized to the needs of individual customers. The customer has no single alternative solution that provides all of these important attributes in one platform. As we are able to drive our costs down, we expect our economic value proposition to continue to improve relative to grid power in additional markets.
Other sources of attributes competition include:
|
•
|
Intermittent solar power.
Solar power is intermittent and best suited for addressing peak power requirements, while Bloom provides stable base load generation. Storage technology is intended to address the intermittency of solar power, but the low power density and efficiency of solar technology makes the combined solution impractical for most commercial and industrial customers. As a point of comparison, our Energy Servers provide the same power output in 1/125th of the footprint of a solar installation, allowing us to serve far more of a customer’s energy requirements based on a customer’s available space.
|
|
•
|
Intermittent wind power.
Power from wind turbines is intermittent, similar to solar power. Typically wind power is deployed for utility-side, grid-scale applications in remote locations but not as a customer-side, distributed power alternative due to prohibitive space requirements and permitting issues. Remote wind farms feeding into the grid are dependent upon the vulnerable transmission and distribution infrastructure to transport power to the point of consumption.
|
10
|
•
|
Traditional co-generation systems.
These systems deliver a combination of electric power and heat. We believe that we compete favorably because of our superior electrical efficiencies, significantly less complex deployment (avoiding heating systems integration), better performance on emissions and noise, superior availability, aesthetic appeal and reliability.
|
|
•
|
Traditional backup equipment.
As our Energy Servers deliver always-on power, they can obviate the need for traditional backup equipment such as diesel generators. We generally compete by offering a better integrated, more reliable and cost-effective solution versus these grid-plus-backup systems.
|
|
•
|
Other commercially available fuel cells.
Basic fuel cell technology is over 100 years old. The Bloom Energy Server uses advanced solid oxide fuel cell technology which produces electricity directly from oxidizing a fuel. The solid oxide fuel cell that we compete against has a solid oxide or ceramic electrolyte. The advantages of our technology include higher efficiency, long-term stability, elimination of the need for an external fuel reformer, ability to use biogas or natural gas as a fuel, low emissions and relatively low cost. There are a variety of fuel cell technologies, characterized by their electrolyte material, including:
|
Proton exchange membrane fuel cells
("PEM")
.
PEM fuel cells typically are used in on-board transportation applications, such as powering forklifts, because of their compactness and ability for quick starts and stops. However, PEM technology requires an expensive platinum catalyst which is susceptible to poisoning by trace amounts of impurities in the fuel or exhaust products. These fuel cells require hydrogen as an input source of energy or an external fuel reformer, which adds to the cost, complexity and electrical inefficiency of the product. As a result, they are not an economically viable option for stationary base load power generation.
Molten carbonate fuel cells
("MCFC")
.
MCFCs are high-temperature fuel cells that use an electrolyte composed of a molten carbonate salt mixture suspended in a porous, chemically inert ceramic matrix of beta-alumina solid electrolyte. The primary disadvantages of current MCFC technology are durability and lower electrical efficiency compared to solid oxide fuel cells. Current versions of the product are built for 300 kilowatts systems, and they are monolithic. Smaller sizes are not economically viable. In many applications where the heat produced by these fuel cells is not commercially or internally useable continuously, mitigating the heat buildup also becomes a liability.
Phosphoric acid fuel cells
("PAFC")
.
PAFCs are a type of fuel cell that uses liquid phosphoric acid as an electrolyte. Developed in the mid-1960s and field-tested since the 1970s, they were the first fuel cells to be commercialized. PAFCs have been used for stationary power generators with output in the 100 kilowatt to 400 kilowatt range. PAFCs are best suited to combined heat and power output applications which require carefully matching and constant monitoring of power and heat requirements, often making the technology difficult to implement. Further disadvantages include low power density and poor system output stability.
Intellectual Property
Intellectual property is an essential differentiator for our business, and we seek protection for our intellectual property whenever possible. We rely upon a combination of patents, copyrights, trade secrets, and trademark laws, along with employee and third party non-disclosure agreements and other contractual restrictions to establish and protect our proprietary rights.
We have developed a significant patent portfolio to protect elements of our proprietary technology. As of December 31, 2019, we had 240 issued patents and 83 patent applications pending in the United States and we had an international patent portfolio comprised of 124 issued patents and 50 patent applications pending. Our U.S. patents are expected to expire between 2023 and 2036. While patents are an important element of our intellectual property strategy, our business as a whole is not dependent on any one patent or any single pending patent application.
We continually review our development efforts to assess the existence and patentability of new intellectual property. We pursue the registration of our domain names and trademarks and service marks in the United States and in some locations abroad. "Bloom Energy" and the "BE" logo are our registered trademarks in certain countries for use with Energy Servers and our other products. We also hold registered trademarks for, among others, “Bloom Box," "Bloom Electrons," "BloomConnect," and “Energy Server" in certain countries. In an effort to protect our brand, as of December 31, 2019, we had 8 registered trademarks in the United States, 34 registered trademarks in Australia, the European Union, United Kingdom, Japan, South Korea, and Taiwan, and 3 pending applications in China.
When appropriate, we enforce our intellectual property rights against other parties. For more information about risks related to our intellectual property, please see the risk factors set forth under the caption "Item 1A. Risk Factors" including the following risks disclosed under the heading "Risks Related to Our Intellectual Property":
"Our failure to protect our intellectual property rights may undermine our competitive position, and litigation to protect our intellectual property rights may be costly," "Our patent applications may not result in issued patents, and our issued patents may not provide adequate protection,
11
either of which may have a material adverse effect on our ability to prevent others from commercially exploiting products similar to ours,"
and "
We may need to defend ourselves against claims that we infringed, misappropriated, or otherwise violated the intellectual property rights of others, which may be time-consuming and would cause us to incur substantial costs."
Manufacturing Facilities
Our primary manufacturing facilities for the fuel cells and Energy Servers assembly are in Newark, Delaware and Sunnyvale, California. The
226,600
square foot manufacturing facility that we own in Newark is our first purpose-built Bloom Energy manufacturing center and was designed specifically for copy-exact duplication as we expand, which we believe will help us scale more efficiently. Additionally, we lease various manufacturing facilities in Sunnyvale and Mountain View, California. Our current lease for our Sunnyvale manufacturing facilities, entered into in April 2005, expires in 2020 and is in the process of being extended, and our current lease for our manufacturing facility in Mountain View, entered into in December 2011, expires in December 2020. Our California facilities comprise approximately
281,265
square feet of manufacturing space.
We believe our current manufacturing facilities are adequate to support our business for the next few years. Our Newark facility includes an additional 50 acres available for factory expansion and/or the co-location of supplier plants. Both of our two principal manufacturing facilities are powered by Bloom Energy Servers.
Supply Chain
Our supply chain has been developed, since our early days as a company, with a group of high quality suppliers that support automotive, semiconductor and other traditional manufacturing organizations. Many of the components that they produce for us are customized and have long lead time components. We have been working to mitigate these long lead times by developing second sources and have developed an active business continuity program. We, along with our suppliers, also purchase long lead items to assure component supply for continuity.
Services
We offer operations and maintenance services agreements for our Energy Servers which are renewable at the election of the customer on an annual basis. The customer agrees to pay an on-going service fee and in return Bloom monitors, maintains and operates the Bloom Energy Servers systems on the customer's behalf.
Our in-house service organization had
114
dedicated field service personnel in
17
locations as of December 31, 2019. Standard customer contracts include service covering all on-going system operation, maintenance, including the periodic refresh and replacement of power modules, and 24x7 remote monitoring and control.
Each Bloom Energy Server includes a secure connection to redundant Remote Monitoring and Control Center ("RMCC") facilities that are geographically well separated. There are two RMCC facilities which provide constant monitoring of over 500 system performance parameters and predictive factors. Using proprietary, internally developed software, the RMCC operators can optimize fleet performance remotely from either RMCC facility. As needed, operators can dispatch field services to the site to locally restore and enhance performance. The RMCC facilities communicate through a secure network and can operate together or independently to provide full services for the fleet.
We currently service and maintain all of our Energy Servers.
Customer Financing
We assist our customers by providing innovative financing options which, in addition to aiding in customer purchase, provides us an expanded addressable customer base. We have developed multiple options for our customers to acquire the power our Energy Servers produce. These offerings provide a range of options that include the purchase of our systems outright with operations and maintenance services contracts, or the purchase of electricity that our Energy Servers produce without any upfront costs through various financing vehicles including leases and power purchase agreements ("PPAs") that combine the cost of our systems, warranty and service, financing, and in some cases fuel into monthly payments based on the electricity produced.
Our largest PPA financing partner, through our Third-Party PPA Program, is the Southern Company, one of the largest utility companies in the United States. Other project financing partners include Key Bank, Wells Fargo, Credit Suisse, Duke Energy, and Constellation Energy (a subsidiary of Exelon Corporation).
12
Sales, Marketing and Partnerships
We market our Energy Servers primarily through a single direct sales organization supported by project finance, business development, government affairs and marketing teams. In addition to our internal resources, we work with multiple partners to generate customer leads and develop projects. In 2017, we announced our first distributorship agreement with SK Group, a company located in the Republic of Korea. Pursuant to this agreement, SK Engineering and Construction is a distributor of Bloom Energy Servers in the Republic of Korea.
Sustainability
Bloom Energy Servers reduce carbon emissions and save water compared to traditional coal power generation systems, and save water compared to traditional natural gas power generation systems. Thus, our primary sustainability goal is to maximize sales of Bloom Energy Servers and provide the longest and most economically sustainable life cycle possible for the fuel cells comprising our Bloom Energy Servers through reliability enhancement programs.
We seek to minimize our environmental footprint with research and development initiatives designed to extend system operating life while reducing consumption of new material in our Energy Servers. We have an end-to-end recycling approach to recover components from end-of-life units for reuse or recycling and we have dedicated facilities in our manufacturing locations in Delaware and California to inspect and dismantle components removed during scheduled maintenance. We have an audit program to identify improvement opportunities at suppliers and also work to reduce their one-way packaging to minimize materials going to landfills.
These initiatives in combination provide a robust and comprehensive sustainability strategy that focuses both externally on our impact on the wider environment and internally on responsible design, materials management and recycling.
Permits and Approvals
Each Bloom Energy Server installation must be designed, constructed and operated in compliance with applicable federal, state, international and local regulations, codes, standards, guidelines, policies and laws. To install and operate our systems, we, our customers and our partners are required to obtain applicable permits and approvals from local authorities for the installation of Bloom Energy Servers and for the interconnection systems with the local electrical utility.
Government Policies and Incentives
There are varying policy frameworks across the United States and abroad designed to support and accelerate the adoption of clean and/or reliable distributed power generation technologies such as Bloom Energy Servers. These policy initiatives come in the form of tax incentives, cash grants, performance incentives and/or specific gas or electric tariffs.
The U.S. federal government provided businesses with an Investment Tax Credit ("ITC") under Section 48 of the Internal Revenue Code, available to the owner of our Energy Server for systems purchased and placed into service. The credit was equal to 30% of expenditures for capital equipment and installation and the credit for fuel cells is capped at $1,500 per 0.5 kilowatt of capacity in 2019 and will decrease to 26% in 2020. For more information on the reinstated ITC, please see
Investment Tax Credits
in Note 1 of the Notes to the Consolidated Financial Statements
.
Our Energy Servers are currently installed at customer sites in
eleven
states in the United States, each of which has its own enabling policy framework. Some states have utility procurement programs and/or renewable portfolio standards for which our technology is eligible. Our Energy Servers currently qualify for tax exemptions, incentives or other customer incentives in many states including the states of California, New Jersey, Connecticut and New York. These policy provisions are subject to change.
Although we generally are not regulated as a utility, federal, state, international and local government statutes and regulations concerning electricity heavily influence the market for our product and services. These statutes and regulations often relate to electricity pricing, net metering, incentives, taxation, competition with utilities and the interconnection of customer-owned electricity generation. Federal, state, international and local governments continuously modify these statutes and regulations. Governments, often acting through state utility or public service commissions, change and adopt different rates for commercial customers on a regular basis. These changes can have a positive or negative impact on our ability to deliver cost savings to customers for the purchase of electricity.
To operate our systems, we obtain interconnection agreements from the applicable local primary electricity and gas utilities. In almost all cases, interconnection agreements are standard form agreements that have been pre-approved by the local public utility commission or other regulatory body with jurisdiction over interconnection agreements. As such, no additional regulatory approvals are typically required once interconnection agreements are signed.
13
Product safety standards for stationary fuel cell generators have been established by the American National Standards Institute ("ANSI"). These standards are known as ANSI/CSA FC-1. Our products are designed to meet this standard. Further, we utilize the Underwriters' Laboratory, or UL, to certify compliance with the standard. Energy Server installation guidance is provided by
NFPA 853: Standard for the Installation of Stationary Fuel Cell Power Systems
. Installations at sites are carried out to meet the requirements of this standard.
Government Regulations
Our business is subject to a changing patchwork of environmental laws and regulations that prevail at the federal, state, regional, and local level as well as in those foreign jurisdictions in which we operate. Most existing environmental laws and regulations preceded the introduction of our innovative fuel cell technology and were adopted to apply to technologies existing at the time, namely large coal, oil, or gas-fired power plants. Currently, there is generally little guidance from these agencies on how certain environmental laws and regulations may or may not be applied to our technology. These laws can give rise to liability for administrative oversight costs, cleanup costs, property damage, bodily injury, fines, and penalties. Capital and operating expenses needed to comply with environmental laws and regulations can be significant, and violations may result in substantial fines and penalties or third-party damages. In addition, ensuring we are in compliance with applicable environmental laws, such as the comprehensive Environmental Response, Compensation and Liability Act (“CERCLA”) in the United States, requires significant time and management resources.
At the federal level, the Federal Energy Regulatory Commission ("FERC") has authority to regulate under various federal energy regulatory laws, wholesale sales of electric energy, capacity, and ancillary services, and the delivery of natural gas in interstate commerce. Also, several of our power purchase agreement entities ("PPA Entities") are subject to regulation under FERC with respect to market-based sales of electricity, which requires us to file notices and make other periodic filings with FERC, which increases our costs and subjects us to additional regulatory oversight.
Several states in which we currently operate, including California, require permits for emissions of hazardous air pollutants based on the quantity of emissions, most of which require permits only for quantities of emissions that are higher than those observed from our Energy Servers. Other states in which we operate, including New York, New Jersey, and North Carolina, have specific exemptions for fuel cells. In addition, our project with Delmarva Power & Light Company is subject to laws and regulations relating to electricity generation, transmission, and sale in Delaware and at the federal level.
Although we generally are not regulated as a utility, federal, state, and local government statutes and regulations concerning electricity heavily influence the market for our product and services. These statutes and regulations often relate to electricity pricing, net metering, incentives, taxation, and the rules surrounding the interconnection of customer-owned electricity generation for specific technologies. In the United States, governments frequently modify these statutes and regulations. Governments, often acting through state utility or public service commissions, change and adopt different requirements for utilities and rates for commercial customers on a regular basis.
For more information about the regulations to which we are subject and the risks to our operations related thereto, please see the risk factors set forth under the caption "Item 1A -
Risk Factors
- “
Risks Related to Legal Matters and Regulations
.”
Backlog
The timing of delivery and installations of our products have a significant impact on the timing of the recognition of product revenue. Many factors can cause a lag between the time that a customer signs a purchase order and our recognition of product revenue. These factors include the number of Energy Servers installed per site, local permitting and utility requirements, environmental, health and safety requirements, weather, and customer facility construction schedules. Many of these factors are unpredictable and their resolution is often outside of our or our customers’ control. Customers may also ask us to delay an installation for reasons unrelated to the foregoing, including delays in their obtaining financing. Further, due to unexpected delays, deployments may require unanticipated expenses to expedite delivery of materials or labor to ensure the installation meets the timing objectives. These unexpected delays and expenses can be exacerbated in periods in which we deliver and install a larger number of smaller projects. In addition, if even relatively short delays occur, there may be a significant shortfall between the revenue we expect to generate in a particular period and the revenue that we are able to recognize. For our installations, revenue and cost of revenue can fluctuate significantly on a periodic basis depending on the timing of acceptance and the type of financing used by the customer.
See
Item 7, Management's Discussion & Analysis of Financial Condition and Results of Operations - Purchase Options -- Delivery and Installation
for additional information on backlog.
14
Legal Proceedings
From time to time, we are involved in various legal proceedings or subject to claims arising in the ordinary course of our business. Although the results of legal proceedings and claims cannot be predicted with certainty, we are not currently party to any legal proceedings the outcome of which, in the opinion of our management, if determined adversely to us, would individually or taken together have a material adverse effect on our business, operating results, financial condition or cash flows. For a discussion of legal proceedings, see "Legal Matters" under Note 14,
Commitments and Contingencies
, in the notes to our consolidated financial statements.
Employees
As of
December 31, 2019
, we had
1,518
employees and contractors. We had approximately 1,252 full-time employees worldwide, of which 979 were located in the United States, 256 were located in India and 17 were located in other countries. We have never experienced a work stoppage, and we believe our relations with our employees to be good.
Seasonal Trends and Economic Incentives
Our business and results of financial operations are not subject to industry-specific seasonal fluctuations. The desirability of our solution can be impacted by the availability and value of various governmental, regulatory and tax based incentives which may change over time.
Corporate Facilities
Our corporate headquarters and principal executive offices are located at 4353 North First Street, San Jose, CA 95134, and our telephone number is (408) 543-1500. We entered into the lease for our new corporate headquarters, consisting of
181,000
square feet of multi-floor office space, which commenced in January 2019 and expires in December 2028. Our headquarters is used for administration, research and development, and sales and marketing and also houses one of our RMCC facilities.
Please see Item 2 - "
Properties
" for additional information regarding our facilities.
Available Information
Our website address is www.bloomenergy.com and our investor relations website address is https://investor.bloomenergy.com. Information contained on our website is not a part of this Annual Report on Form 10-K. Through a link on our website, we make available the following filings as soon as reasonably practicable after they are electronically filed with or furnished to the SEC: our Annual Report on Form 10-K, Quarterly Reports on Form 10-Q, Current Reports on Form 8-K, and any amendments to those reports filed or furnished pursuant to Section 13(a) or 15(d) of the Securities Exchange Act of 1934, as amended, of the Exchange Act, as well as proxy statements and certain filings relating to beneficial ownership of our securities. The SEC also maintains a website at www.sec.gov that contains all reports that we file or furnish with the SEC electronically. All such filings, including those on our website, are available free of charge.
15
ITEM 1A - RISK FACTORS
Investing in our securities involves a high degree of risk. You should carefully consider the risks and uncertainties described below, as well as the other information in this
Annual Report on Form 10-K
, including our consolidated financial statements and the related notes and “Management’s Discussion and Analysis of Financial Condition and Results of Operations” before you decide to purchase our securities. Many of these risks and uncertainties are beyond our control, and the occurrence of any of the events or developments described below, or of additional risks and uncertainties not presently known to us or that we currently deem immaterial, could materially and adversely affect our business, financial condition, operating results and prospects. In such an event, the market price of our Class A common stock could decline and you could lose all or part of your investment.
This Risk Factor section is divided by topic for ease of reference as follows: Risks Relating to Our Business, Industry and Sales; Risks Related to Our Products and Manufacturing; Risks Relating to Government Incentive Programs; Risks Related to Legal Matters and Regulations; Risks Relating to Our Intellectual Property; Risks Relating to Our Financial Condition and Operating Results; Risks Related to Our Liquidity; Risks Related to Our Operations; and Risks Related to Ownership of Our Common Stock.
Risks Relating to Our Business, Industry and Sales
The distributed generation industry is an emerging market and distributed generation may not receive widespread market acceptance
.
The distributed generation industry is still relatively nascent in an otherwise mature and heavily regulated industry, and we cannot be sure that potential customers will accept distributed generation broadly, or our Energy Server products specifically. Enterprises may be unwilling to adopt our solution over traditional or competing power sources for any number of reasons including the perception that our technology is unproven, they lack confidence in our business model, the perceived unavailability of back-up service providers to operate and maintain the Energy Servers, and lack of awareness of our product or their perception of regulatory or political headwinds. Because this is an emerging industry, broad acceptance of our products and services is subject to a high level of uncertainty and risk. If the market develops more slowly than we anticipate, our business will be harmed.
Our limited operating history and our nascent industry make evaluating our business and future prospects difficult.
From our inception in 2001 through 2009, we were focused principally on research and development activities relating to our Energy Server technology. We did not deploy our first Energy Server and did not recognize any revenue until 2009. Since that initial deployment, our business has expanded significantly over a comparatively short time, given the characteristics of the electric power industry. As a result, we have a limited history operating our business at its current scale. Furthermore, our Energy Server is a new type of product in the nascent distributed energy industry. Consequently, predicting our future revenue and appropriately budgeting for our expenses is difficult, and we have limited insight into trends that may emerge and affect our business. If actual results differ from our estimates or if we adjust our estimates in future periods, our operating results and financial position could be materially and adversely affected.
Our products involve a lengthy sales and installation cycle and if we fail to close sales on a regular and timely basis, our business could be harmed.
Our sales cycle is typically 12 to 18 months but can vary considerably. In order to make a sale, we must typically provide a significant level of education to prospective customers regarding the use and benefits of our product and our technology. The period between initial discussions with a potential customer and the eventual sale of even a single product typically depends on a number of factors, including the potential customer’s budget and decision as to the type of financing it chooses to use as well as the arrangement of such financing. Prospective customers often undertake a significant evaluation process which may further extend the sales cycle. Once a customer makes a formal decision to purchase our product, the fulfillment of the sales order by us requires a substantial amount of time. Generally, the time between the entry into a sales contract with a customer and the installation of our Energy Servers can range from nine to twelve months or more. This lengthy sales and installation cycle is subject to a number of significant risks over which we have little or no control. Because of both the long sales and long installation cycles, we may expend significant resources without having certainty of generating a sale.
These lengthy sales and installation cycles increase the risk that an installation may be delayed and/or may not be completed. In some instances, a customer can cancel an order for a particular site prior to installation, and we may be unable to recover some or all of our costs in connection with design, permitting, installation and site preparations incurred prior to cancellation. Cancellation rates can be between 10% and 20% in any given period due to factors outside of our control including an inability to install an Energy Server at the customer’s chosen location because of permitting or other regulatory issues, delays or unanticipated costs in securing interconnection approvals or necessary utility infrastructure, unanticipated
16
changes in the cost, or other reasons unique to each customer. Our operating expenses are based on anticipated sales levels, and many of our expenses are fixed. If we are unsuccessful in closing sales after expending significant resources or if we experience delays or cancellations, our business could be materially and adversely affected. Since we do not recognize revenue on the sales of our products until installation and acceptance, a small fluctuation in the timing of the completion of our sales transactions could cause operating results to vary materially from period to period.
Our Energy Servers have significant upfront costs, and we will need to attract investors to help customers finance purchases.
Our Energy Servers have significant upfront costs. In order to assist our customers in obtaining financing for our products, we have traditional lease programs with two leasing partners who have prequalified our product and provide financing for customers through various leasing arrangements. In addition to the traditional lease model, we also offer Power Purchase Agreement Programs, including Third-Party PPAs, in which financing the cost of the Energy Server is provided by an entity that owns the Energy Servers (an "Operating Company") and funded by a subsidiary investment entity (an "Investment Company") which is financed by us and/or in combination with Equity Investors. We refer to the Operating Company and its subsidiary Investment Company collectively as a PPA Entity. In recent periods, the substantial majority of our end customers have elected to finance their purchases, typically through Third Party PPAs.
We will need to grow committed financing capacity with existing partners or attract additional partners to support our growth. Generally, at any point in time, the deployment of a portion of our backlog is contingent on securing available financing. Our ability to attract third-party financing depends on many factors that are outside of our control, including the investors’ ability to utilize tax credits and other government incentives, interest rate and/or currency exchange fluctuations, our perceived creditworthiness and the condition of credit markets generally. Our financing of customer purchases of our Energy Servers is subject to conditions such as the customer’s credit quality and the expected minimum internal rate of return on the customer engagement, and if these conditions are not satisfied, we may be unable to finance purchases of our Energy Servers, which would have an adverse effect on our revenue in a particular period. If we are unable to help our customers arrange financing for our Energy Servers generally, our business will be harmed. Additionally, the Managed Services and Traditional Lease options, as with all leases, are also limited by the customer’s willingness to commit to making fixed payments regardless of the performance of the Energy Servers or our performance of our obligations under the customer agreement.
Further, our sales process for transactions that require financing require that we make certain assumptions regarding the cost of financing capital. Actual financing costs may vary from our estimates due to factors outside of our control, including changes in customer creditworthiness, macroeconomic factors, the returns offered by other investment opportunities available to our financing partners, and other factors. If the cost of financing ultimately exceeds our estimates, we may be unable to proceed with some or all of the impacted projects or our revenue from such projects may be less than our estimates.
If we are unable to procure financing partners willing to finance such deployments or if the cost of such financing exceeds our estimates, our business would be negatively impacted.
The economic benefits of our Energy Servers to our customers depend on the cost of electricity available from alternative sources including local electric utility companies, which cost structure is subject to change.
We believe that a customer’s decision to purchase our Energy Servers is significantly influenced by the price, the price predictability of electricity generated by our Energy Servers in comparison to the retail price and the future price outlook of electricity from the local utility grid and other energy sources. The economic benefit of our Energy Servers to our customers includes, among other things, the benefit of reducing such customer’s payments to the local utility company. The rates at which electricity is available from a customer’s local electric utility company is subject to change and any changes in such rates may affect the relative benefits of our Energy Servers. Even in markets where we are competitive today, rates for electricity could decrease and render our Energy Servers uncompetitive. Several factors could lead to a reduction in the price or future price outlook for grid electricity, including the impact of energy conservation initiatives that reduce electricity consumption, construction of additional power generation plants (including nuclear, coal or natural gas) and technological developments by others in the electric power industry which could result in electricity being available at costs lower than those that can be achieved from our Energy Servers. If the retail price of grid electricity does not increase over time at the rate that we or our customers expect, it could reduce demand for our Energy Servers and harm our business.
Further, the local electric utility may impose “departing load,” “standby,” or other charges, including power factor charges, on our customers in connection with their acquisition of our Energy Servers, the amounts of which are outside of our control and which may have a material impact on the economic benefit of our Energy Servers to our customers. Changes in the rates offered by local electric utilities and/or in the applicability or amounts of charges and other fees imposed or incentives granted by such utilities on customers acquiring our Energy Servers could adversely affect the demand for our Energy Servers.
17
In some states and countries, the current low cost of grid electricity, even together with available subsidies, does not render our product economically attractive. If we are unable to reduce our costs to a level at which our Energy Servers would be competitive in such markets, or if we are unable to generate demand for our Energy Servers based on benefits other than electricity cost savings, such as reliability, resilience, or environmental benefits, our potential for growth may be limited.
Furthermore, an increase in the price of natural gas or curtailment of availability (e.g., as a consequence or physical limitations or adverse regulatory conditions for the delivery of production of natural gas) or the inability to obtain natural gas service could make our Energy Servers less economically attractive to potential customers and reduce demand.
We rely on interconnection requirements and net metering arrangements that are subject to change.
Because our Energy Servers are designed to operate at a constant output twenty-four hours a day, seven days a week, and our customers’ demand for electricity typically fluctuates over the course of the day or week, there are often periods when our Energy Servers are producing more electricity than a customer may require, and such excess electricity must be exported to the local electric utility. Many, but not all, local electric utilities provide compensation to our customers for such electricity under “net metering” programs. Utility tariffs and fees, interconnection agreements and net metering requirements are subject to changes in availability and terms and some jurisdictions do not allow interconnections or export at all. At times in the past, such changes have had the effect of significantly reducing or eliminating the benefits of such programs. Changes in the availability of, or benefits offered by, utility tariffs, the net metering requirements or interconnection agreements in place in the jurisdictions in which we operate on in which we anticipate expanding into in the future could adversely affect the demand for our Energy Servers.
We currently face and will continue to face significant competition.
We compete for customers, financing partners, and incentive dollars with other electric power providers. Many providers of electricity, such as traditional utilities and other companies offering distributed generation products, have longer operating histories, have customer incumbency advantages, have access to and influence with local and state governments, and have access to more capital resources than do we. Significant developments in alternative technologies, such as energy storage, wind, solar, or hydro power generation, or improvements in the efficiency or cost of traditional energy sources, including coal, oil, natural gas used in combustion, or nuclear power, may materially and adversely affect our business and prospects in ways we cannot anticipate. We may also face new competitors who are not currently in the market. If we fail to adapt to changing market conditions and to compete successfully with grid electricity or new competitors, our growth will be limited which would adversely affect our business results.
We derive a substantial portion of our revenue and backlog from a limited number of customers, and the loss of or a significant reduction in orders from a large customer could have a material adverse effect on our operating results and other key metrics.
In any particular period, a substantial amount of our total revenue could come from a relatively small number of customers. As an example, in the year ended
December 31, 2019
,
two
customers, The Southern Company and SK (Korea) accounted for approximately
34%
and
23%
of our total revenue, respectively. In the year ended December 31, 2018,
one
customer, The Southern Company accounted for approximately
51%
of our total revenue. A unit of The Southern Company wholly owns a Third-Party PPA, and that entity purchases Energy Servers which are then provided to various end customers under PPAs. The loss of any large customer order or any delays in installations of new Energy Servers with any large customer would materially and adversely affect our business results.
Risks Relating to Our Products and Manufacturing
Our business has been and will continue to be adversely affected by the COVID-19 pandemic.
We have been and will continue monitoring and adjusting as appropriate our operations in response to the COVID-19 pandemic. Although we have been able to maintain some of our operations as an “Essential Business” in California and Delaware, other operations have been delayed or suspended under applicable government orders and guidance. Our remaining operations could be delayed or suspended at any time in the event of changes to applicable government orders or the interpretation of existing orders.
Our headquarters and certain of our manufacturing facilities are located in Santa Clara County, California. On March 17, 2020, Santa Clara County became subject to a government mandated “shelter in place” order, which was superseded by an Executive Order issued by the Governor of California that extends indefinitely. Similarly, effective March 25, 2020, our manufacturing facilities in Newark, Delaware became subject to the Governor of Delaware’s Declaration of a State of Emergency Due to a Public Health Threat initially issued on March 12, 2020 and in effect until further notice. Additionally our installation activities in all areas, but especially New York, Connecticut, New Jersey, California and Massachusetts, are
18
adversely impacted by similar mandates in these jurisdictions. In response, we have closed our headquarters building and directed employees, unless they are directly supporting essential manufacturing production operations or maintenance activities, to work from their homes. This has caused and may continue to cause disruptions in certain of our operations, including our research and development, sales, marketing, installation and operations and maintenance activities. Although our affected manufacturing facilities continue to operate while these orders are in effect, we cannot provide assurances that the COVID-19 pandemic or additional governmental actions in response thereto will not further impact our operations (in California, Delaware or elsewhere). For example, if our management, employees, contractors, customers or affiliates, such as the third party general contractors with which we partner for installations, are affected by illness or by preventative measures such as social distancing, our operations, demand for our product, and installation, maintenance and oversight activities may be disrupted or we may be required to incur additional costs in order to maintain operations. In addition, to the extent that any of our employees separate from us in response to the pandemic or governmental responses to the pandemic, it may be difficult or impossible to replace them.
We are also experiencing delays from certain vendors and suppliers that have been affected more directly by COVID-19, which, in turn, could cause delays in the manufacturing and installation of our Energy Servers. It may not be possible to find replacement products or supplies, and ongoing delays could affect our business and growth. For example, our international operations, including in South Korea and India, have been disrupted by the COVID-19 pandemic and by governmental responses to the pandemic. In India, orders by the National Disaster Management Authority and the Ministry of Home Affairs issued March 24, 2020 have “prescribed a lockdown for containment of COVID-19 Epidemic in the country,” according to the Press Information Bureau of the Government of India. These orders have had the effect of disrupting the supply chain on which we rely for certain parts critical to our manufacturing and maintenance capabilities, which impacts both our sale and installation of new products and our operations and maintenance of previously-sold Energy Servers. For example, both the primary and secondary sources of a particular part on which we rely are in India. We are working on measures to address or mitigate the effect of these circumstances, but we cannot guarantee that we will succeed in finding alternate suppliers that are able to meet our needs.
Even if we are able to identify alternate suppliers that are able to meet our needs, the international air and sea logistics systems have been heavily impacted by the COVID-19 pandemic. Air carriers have significantly reduced their passenger and air freight capacity, and many ports are either temporarily closed or have reduced their hours of operation. Actions by government agencies may further restrict the operations of freight carriers, which would negatively impact our ability to receive the parts and supplies we need to manufacture our Energy Servers or to deliver them to our customers.
Our 5% Notes and 6% Notes mature in December 2020. We have actively been working on extending the maturity date of these Notes or securing refinancing, and our efforts have been negatively impacted by the COVID-19 pandemic, which has decreased the availability of credit. If we are unable to secure an extension or refinancing for the 5% Notes and/or 6% Notes before they mature, we may have insufficient cash to repay such Notes and our financial condition could be adversely impacted.
We also rely on third party financing for our customer’s purchases of our Energy Servers. If these financiers experience liquidity problems or elect to suspend or cancel investments in our projects, we may be unable to secure financing for our customer purchases, which in turn impacts our ability to deploy our Energy Servers and receive cash and recognize revenue. We have already experienced one delayed closing due to a financier’s inability to close in light of its own liquidity concerns, and we may experience more.
Our installation operations have also been adversely impacted by the COVID-19 pandemic, and these adverse impacts may increase in severity or continue indefinitely, including following the lifting of “shelter in place” orders. For example, our projects have experienced delays and may continue to experience delays relating to, among other things, shortages in available labor for design, installation and other work; the effects on the COVID-19 pandemic on our suppliers in general but especially our general contractors, their sub-contractors, medium-voltage electrical gear suppliers, and a wide range of engineering and construction related specialist suppliers on whom we rely for successful and timely installations; the completion of work required by gas and electric utilities on which we are critically dependent; necessary civil and utility inspections; and the review of our permit submissions and issuance of permits with multiple authorities that have jurisdiction over our activities. Additionally we have experienced delays and interruptions to our installation activities where customers have shut down or otherwise limited access to their facilities. This may continue to affect our ability to install our systems or increase in severity as the pandemic continues to affect key markets such as New York, Connecticut, New Jersey, Massachusetts and California.
We are not the only business impacted by these shortages and delays, which means that we may in the future face increased competition for scarce resources, which may result in continuing delays or increases in the cost of obtaining such services, including increased labor costs and/or fees to expedite permitting. Additionally, while construction activities have to date been deemed “essential business” and allowed to proceed in many jurisdictions, we have experienced interruptions and
19
delays caused by confusion related to exemptions for “essential business” amongst our suppliers and their sub-contractors. Future changes in applicable government orders or regulations, or changes in the interpretation of existing orders or regulations, could result in reductions in the scope of permitted construction activities or prohibitions on such activities. An inability to install our Energy Servers would negatively impact our acceptances, our cash and our revenue.
Additionally, our maintenance activities may be negatively impacted by COVID-19, including heightened health and safety protocols mandated by governmental orders or our customers that may increase our cost in performing such activities and/or delays or denials of access to customer sites to perform necessary maintenance activities on previously-sold Energy Servers. If we are delayed in, or unable to, performing scheduled or unscheduled maintenance, our previously-installed Energy Servers will likely experience adverse performance impacts including reduced output and/or efficiency, which could result in warranty and/or guaranty claims by our customers. Further, due to the nature of our Energy Servers, if we are unable to replace worn parts in accordance with our standard maintenance schedule, we may be subject to increased costs in the future.
We cannot predict at this time the full extent to which COVID-19 will impact our business, results and financial condition, which will depend on many factors. These include, among others, the extent of harm to public health, the willingness of our employees to travel and work in our manufacturing facilities and at installation sites even if permitted to do so, the disruption to the global economy and to our potential customer base, and impacts on liquidity and the availability of capital. We are staying in close communication with our manufacturing facilities, employees, customers, suppliers and partners, and acting to mitigate the impact of this dynamic and evolving situation, but there is no guarantee that we will be able to do so.
Our future success depends in part on our ability to increase our production capacity, and we may not be able to do so in a cost-effective manner.
To the extent we are successful in growing our business, we may need to increase our production capacity. Our ability to plan, construct, and equip additional manufacturing facilities is subject to significant risks and uncertainties, including the following:
|
•
|
The expansion or construction of any manufacturing facilities will be subject to the risks inherent in the development and construction of new facilities, including risks of delays and cost overruns as a result of factors outside our control such as delays in government approvals, burdensome permitting conditions, and delays in the delivery of manufacturing equipment and subsystems that we manufacture or obtain from suppliers.
|
|
•
|
In order for us to expand internationally, we have entered into joint venture agreements that have allowed us to add manufacturing capability outside of the United States. Adding manufacturing capacity in any international location will subject us to new laws and regulations including those pertaining to labor and employment, environmental and export import. In addition, it brings with it the risk of managing larger scale foreign operations.
|
|
•
|
We may be unable to achieve the production throughput necessary to achieve our target annualized production run rate at our current and future manufacturing facilities.
|
|
•
|
Manufacturing equipment may take longer and cost more to engineer and build than expected, and may not operate as required to meet our production plans.
|
|
•
|
We may depend on third-party relationships in the development and operation of additional production capacity, which may subject us to the risk that such third parties do not fulfill their obligations to us under our arrangements with them.
|
|
•
|
We may be unable to attract or retain qualified personnel.
|
If we are unable to expand our manufacturing facilities, we may be unable to further scale our business. If the demand for our Energy Servers or our production output decreases or does not rise as expected, we may not be able to spread a significant amount of our fixed costs over the production volume, resulting in a greater than expected per unit fixed cost, which would have a negative impact on our financial condition and our results of operations.
If we are not able to continue to reduce our cost structure in the future, our ability to become profitable may be impaired.
We must continue to reduce the manufacturing costs for our Energy Servers to expand our market. Additionally, certain of our existing service contracts were entered into based on projections regarding service costs reductions that assume continued advances in our manufacturing and services processes which we may be unable to realize. While we have been successful in reducing our manufacturing and services costs to date, the cost of components and raw materials, for example, could increase in the future. Any such increases could slow our growth and cause our financial results and operational metrics to suffer. In addition, we may face increases in our other expenses including increases in wages or other labor costs as well as installation, marketing, sales or related costs. We may continue to make significant investments to drive growth in the future. In
20
order to expand into new electricity markets (in which the price of electricity from the grid is lower) while still maintaining our current margins, we will need to continue to reduce our costs. Increases in any of these costs or our failure to achieve projected cost reductions could adversely affect our results of operations and financial condition and harm our business and prospects. If we are unable to reduce our cost structure in the future, we may not be able to achieve profitability, which could have a material adverse effect on our business and our prospects.
If our Energy Servers contain manufacturing defects, our business and financial results could be harmed.
Our Energy Servers are complex products and they may contain undetected or latent errors or defects. In the past, we have experienced latent defects only discovered once the Energy Server is deployed in the field. Changes in our supply chain or the failure of our suppliers to otherwise provide us with components or materials that meet our specifications could also introduce defects into our products. In addition, as we grow our manufacturing volume, the chance of manufacturing defects could increase. Any manufacturing defects or other failures of our Energy Servers to perform as expected could cause us to incur significant re-engineering costs, divert the attention of our engineering personnel from product development efforts, and significantly and adversely affect customer satisfaction, market acceptance, and our business reputation.
Furthermore, we may be unable to correct manufacturing defects or other failures of our Energy Servers in a manner satisfactory to our customers, which could adversely affect customer satisfaction, market acceptance, and our business reputation.
The performance of our Energy Servers may be affected by factors outside of our control, which could result in harm to our business and financial results
.
Field conditions, such as the quality of the natural gas supply and utility processes which vary by region and may be subject to seasonal fluctuations, have affected the performance of our Energy Servers and are not always possible to predict until the Energy Server is in operation. Although we believe we have designed new generations of Energy Servers to better withstand the variety of field conditions we have encountered, as we move into new geographies and deploy new service configurations, we may encounter new and unanticipated field conditions. Adverse impacts on performance may require us to incur significant re-engineering costs or divert the attention of our engineering personnel from product development efforts. Furthermore, we may be unable to adequately address the impacts of factors outside of our control in a manner satisfactory to our customers. Any of these circumstances could significantly and adversely affect customer satisfaction, market acceptance, and our business reputation.
If our estimates of the useful life for our Energy Servers are inaccurate or we do not meet service and performance warranties and guaranties, or is we fail to accrue adequate warranty and guaranty reserves, our business and financial results could be harmed.
We offer certain customers the opportunity to renew their operations and maintenance service agreements on an annual basis, for up to 30 years, at prices predetermined at the time of purchase of the Energy Server. We also provide performance warranties and guaranties covering the efficiency and output performance of our Energy Servers. Our pricing of these contracts and our reserves for warranty and replacement are based upon our estimates of the useful life of our Energy Servers and their components, including assumptions regarding improvements in power module life that may fail to materialize. We do not have a long history with a large number of field deployments, and our estimates may prove to be incorrect. Failure to meet these performance warranties and guaranty levels may require us to replace the Energy Servers at our expense or refund their cost to the customer, or require us to make cash payments to the customer based on actual performance, as compared to expected performance, capped at a percentage of the relevant equipment purchase prices. We accrue for product warranty costs and recognize losses on service or performance warranties when required by U.S. GAAP based on our estimates of costs that may be incurred and based on historical experience. However, as we expect our customers to renew their maintenance service agreements each year, the total liability over time may be more than the accrual. Actual warranty expenses have in the past been and may in the future be greater than we have assumed in our estimates, the accuracy of which may be hindered due to our limited history operating at our current scale.
As of
December 31, 2019
, we had a total of
35 megawatts
in total deployed early generation servers, including our first and second generation servers, out of our total installed base of
456 megawatts
. None of these early generation servers are recognized as our property, plant and equipment. We expect that our deployed early generation Energy Servers, if not upgraded with our more current generation power modules, may continue to perform at a lower output and efficiency level and, as a result, the maintenance costs may exceed the contracted prices that we expect to generate if our customers continue to renew their maintenance service agreements with respect to those servers. Further, the Energy Servers held on our consolidated financial statements, including those acquired through our Managed Services and PPA programs, could be impaired or have their useful life shortened in the future if adequate maintenance services are not performed or if a determination is made to upgrade the Energy Servers.
21
Our business is subject to risks associated with construction, utility interconnection, cost overruns and delays, including those related to obtaining government permits and other contingencies that may arise in the course of completing installations.
Because we generally do not recognize revenue on the sales of our Energy Servers until installation and acceptance except where a third party is responsible for installation (such as in our sales in the Republic of Korea), our financial results depend to a large extent on the timeliness of the installation of our Energy Servers. Furthermore, in some cases, the installation of our Energy Servers may be on a fixed price basis, which subjects us to the risk of cost overruns or other unforeseen expenses in the installation process.
The construction, installation, and operation of our Energy Servers at a particular site is also generally subject to oversight and regulation in accordance with national, state, and local laws and ordinances relating to building codes, safety, environmental protection, and related matters, and typically require various local and other governmental approvals and permits, including environmental approvals and permits, that vary by jurisdiction. In some cases, these approvals and permits require periodic renewal. It is difficult and costly to track the requirements of every individual authority having jurisdiction over our installations, to design our Energy Servers to comply with these varying standards, and to obtain all applicable approvals and permits. We cannot predict whether or when all permits required for a given project will be granted or whether the conditions associated with the permits will be achievable. The denial of a permit or utility connection essential to a project or the imposition of impractical conditions would impair our ability to develop the project. In addition, we cannot predict whether the permitting process will be lengthened due to complexities and appeals. Delay in the review and permitting process for a project can impair or delay our and our customers’ abilities to develop that project or may increase the cost so substantially that the project is no longer attractive to us or our customers. Furthermore, unforeseen delays in the review and permitting process could delay the timing of the installation of our Energy Servers and could therefore adversely affect the timing of the recognition of revenue related to the installation, which could harm our operating results in a particular period.
In addition, the completion of many of our installations depends on the availability of and timely connection to the natural gas grid and the local electric grid. In some jurisdictions, local utility companies or the municipality have denied our request for connection or have required us to reduce the size of certain projects. In addition, some municipalities have recently adopted restrictions that prohibit any new construction that allows for the use of natural gas. For more information regarding these restrictions, please see the risk factor entitled "
As a fossil fuel-based technology, we may be subject to a heightened risk of regulation, to a potential for the loss of certain incentives, and to changes in our customers’ energy procurement policies.
" Any delays in our ability to connect with utilities, delays in the performance of installation-related services, or poor performance of installation-related services by our general contractors or sub-contractors will have a material adverse effect on our results and could cause operating results to vary materially from period to period.
Furthermore, we rely on the ability of our third-party general contractors to install Energy Servers at our customers’ sites and to meet our installation requirements. We currently work with a limited number of general contractors, which has impacted and may continue to impact our ability to make installations as planned. Our work with contractors or their sub-contractors may have the effect of us being required to comply with additional rules (including rules unique to our customers), working conditions, site remediation, and other union requirements, which can add costs and complexity to an installation project. The timeliness, thoroughness, and quality of the installation-related services performed by some of our general contractors and their sub-contractors in the past have not always met our expectations or standards and may not meet our expectations and standards in the future.
Any significant disruption in the operations at our manufacturing facilities could delay the production of our Energy Servers, which would harm our business and results of operations.
We manufacture our Energy Servers in a limited number of manufacturing facilities, any of which could become unavailable either temporarily or permanently for any number of reasons, including equipment failure, material supply, public health emergencies or catastrophic weather or geologic events. For example, several of our manufacturing facilities are located in an area prone to earthquakes. In the event of a significant disruption to our manufacturing process, we may not be able to easily shift production to other facilities or to make up for lost production, which could result in harm to our reputation, increased costs, and lower revenues.
The failure of our suppliers to continue to deliver necessary raw materials or other components of our Energy Servers in a timely manner could prevent us from delivering our products within required time frames, and could cause installation delays, cancellations, penalty payments, and damage to our reputation.
We rely on a limited number of third-party suppliers for some of the raw materials and components for our Energy Servers, including certain rare earth materials and other materials that may be of limited supply. If our suppliers provide insufficient inventory at the level of quality required to meet customer demand or if our suppliers are unable or unwilling to
22
provide us with the contracted quantities (as we have limited or in some case no alternatives for supply), our results of operations could be materially and negatively impacted. If we fail to develop or maintain our relationships with our suppliers, or if there is otherwise a shortage or lack of availability of any required raw materials or components, we may be unable to manufacture our Energy Servers or our Energy Servers may be available only at a higher cost or after a long delay. Such delays could prevent us from delivering our Energy Servers to our customers within required time frames and cause order cancellations. We have had to create our own supply chain for some of the components and materials utilized in our fuel cells. We have made significant expenditures in the past to develop our supply chain. In many cases, we entered into contractual relationships with suppliers to jointly develop the components we needed. These activities are time and capital intensive. Accordingly, the number of suppliers we have for some of our components and materials is limited and, in some cases, sole sourced. Some of our suppliers use proprietary processes to manufacture components. We may be unable to obtain comparable components from alternative suppliers without considerable delay, expense, or at all, as replacing these suppliers could require us either to make significant investments to bring the capability in-house or to invest in a new supply chain partner. Some of our suppliers are smaller, private companies, heavily dependent on us as a customer. If our suppliers face difficulties obtaining the credit or capital necessary to expand their operations when needed, they could be unable to supply necessary raw materials and components needed to support our planned sales and services operations, which would negatively impact our sales volumes and cash flows.
Moreover, we have in the past and may in the future experience unanticipated disruptions to operations or other difficulties with our supply chain or internalized supply processes due to exchange rate fluctuations, volatility in regional markets from where materials are obtained (particularly China and Taiwan), changes in the general macroeconomic outlook, global trade disputes, political instability, expropriation or nationalization of property, public health emergencies such as the recent Covid-19 viral outbreak, civil strife, strikes, insurrections, acts of terrorism, acts of war, or natural disasters. The failure by us to obtain raw materials or components in a timely manner or to obtain raw materials or components that meet our quantity and cost requirements could impair our ability to manufacture our Energy Servers or increase their costs or service costs of our existing portfolio of Energy Servers under maintenance services agreements. If we cannot obtain substitute materials or components on a timely basis or on acceptable terms, we could be prevented from delivering our Energy Servers to our customers within required time frames, which could result in sales and installation delays, cancellations, penalty payments, or damage to our reputation, any of which could have a material adverse effect on our business and results of operations. In addition, we rely on our suppliers to meet quality standards, and the failure of our suppliers to meet or exceed those quality standards could cause delays in the delivery of our products, cause unanticipated servicing costs, and cause damage to our reputation.
Our ability to develop new products and enter into new markets could be negatively impacted if we are unable to identify suppliers to deliver new materials and components on a timely basis.
We continue to develop products for emerging markets and, as we move into those markets, must qualify new suppliers to manufacture and deliver the necessary components required to build and install those new products. Identifying new manufacturing partners is a lengthy process and is subject to significant risks and uncertainties. If we are unable to identify reliable manufacturing partners in a new market, our ability to expand our business could be limited and our financial conditions and results of operations could be harmed.
We have, in some instances, entered into long-term supply agreements that could result in insufficient inventory and negatively affect our results of operations.
We have entered into long-term supply agreements with certain suppliers. Some of these supply agreements provide for fixed or inflation-adjusted pricing, substantial prepayment obligations and in a few cases, supplier purchase commitments. These arrangements could mean that we end up paying for inventory that we did not need or that was at a higher price than the market. Further, we face significant specific counterparty risk under long-term supply agreements when dealing with suppliers without a long, stable production and financial history. Given the uniqueness of our product, many of our suppliers do not have a long operating history and are private companies that may not have substantial capital resources. In the event any such supplier experiences financial difficulties, it may be difficult or impossible, or may require substantial time and expense, for us to recover any or all of our prepayments. We do not know whether we will be able to maintain long-term supply relationships with our critical suppliers or whether we may secure new long-term supply agreements. Additionally, many of our parts and materials are procured from foreign suppliers, which exposes us to risks including unforeseen increases in costs or interruptions in supply arising from changes in applicable international trade regulations such as taxes, tariffs or quotas. Any of the foregoing could materially harm our financial condition and our results of operations.
23
We face supply chain competition, including competition from businesses in other industries, which could result in insufficient inventory and negatively affect our results of operations
.
Certain of our suppliers also supply parts and materials to other businesses including businesses engaged in the production of consumer electronics and other industries unrelated to fuel cells. As a relatively low-volume purchaser of certain of these parts and materials, we may be unable to procure a sufficient supply of the items in the event that our suppliers fail to produce sufficient quantities to satisfy the demands of all of their customers, which could materially harm our financial condition and our results of operations.
We, and some of our suppliers, obtain capital equipment used in our manufacturing process from sole suppliers and, if this equipment is damaged or otherwise unavailable, our ability to deliver our Energy Servers on time will suffer.
Some of the capital equipment used to manufacture our products and some of the capital equipment used by our suppliers have been developed and made specifically for us, are not readily available from multiple vendors, and would be difficult to repair or replace if they did not function properly. If any of these suppliers were to experience financial difficulties or go out of business or if there were any damage to or a breakdown of our manufacturing equipment and we could not obtain replacement equipment in a timely manner, our business would suffer. In addition, a supplier’s failure to supply this equipment in a timely manner with adequate quality and on terms acceptable to us could disrupt our production schedule or increase our costs of production and service.
Possible new tariffs could have a material adverse effect on our business.
Our business is dependent on the availability of raw materials and components for our Energy Servers, particularly electrical components common in the semiconductor industry, specialty steel products / processing and raw materials. Tariffs imposed on steel and aluminum imports have increased the cost of raw materials for our Energy Servers and decreased the available supply. Additional new tariffs or other trade protection measures which are proposed or threatened and the potential escalation of a trade war and retaliation measures could have a material adverse effect on our business, results of operations and financial condition.
To the extent practicable, given the limitations in supply chain previously discussed, although we currently maintain alternative sources for raw materials, our business is subject to the risk of price fluctuations and periodic delays in the delivery of certain raw materials, which tariffs may exacerbate. Disruptions in the supply of raw materials and components could temporarily impair our ability to manufacture our Energy Servers for our customers or require us to pay higher prices in order to obtain these raw materials or components from other sources, which could affect our business and our results of operations. While it is too early to predict how the recently enacted tariffs on imported steel will impact our business, the imposition of tariffs on items imported by us from China or other countries could increase our costs and could have a material adverse effect on our business and our results of operations.
A failure to properly comply (or to comply properly) with foreign trade zone laws and regulations could increase the cost of our duties and tariffs.
We have established two foreign trade zones, one in California and one in Delaware, through qualification with U.S. Customs, and are approved for "zone to zone" transfers between our California and Delaware facilities. Materials received in a foreign trade zone are not subject to certain U.S. duties or tariffs until the material enters U.S. commerce. We benefit from the adoption of foreign trade zones by reduced duties, deferral of certain duties and tariffs, and reduced processing fees, which help us realize a reduction in duty and tariff costs. However, the operation of our foreign trade zones requires compliance with applicable regulations and continued support of U.S. Customs with respect to the foreign trade zone program. If we are unable to maintain the qualification of our foreign trade zones, or if foreign trade zones are limited or unavailable to us in the future, our duty and tariff costs would increase, which could have an adverse effect on our business and results of operations.
Risks Relating to Government Incentive Programs
Our business currently depends on the availability of rebates, tax credits and other financial incentives, and the reduction, modification, or elimination of such benefits could cause our revenue to decline and harm our financial results.
The U.S. federal government and some state and local governments provide incentives to end users and purchasers of our Energy Servers in the form of rebates, tax credits, and other financial incentives, such as system performance payments and payments for renewable energy credits associated with renewable energy generation. In addition, some countries outside the U.S. also provide incentives to end users and purchasers of our Energy Servers. We currently have operations and sell our Energy Servers in Japan, China, India, and the Republic of Korea (collectively, our "Asia Pacific region"), where Renewable Portfolio Standards ("RPS") are in place to promote the adoption of renewable power generation, including fuel cells. Our Energy Servers have qualified for tax exemptions, incentives, or other customer incentives in many states including the states of
24
California, Connecticut, Massachusetts, New Jersey and New York. Some states have utility procurement programs and/or renewable portfolio standards for which our technology is eligible. Our Energy Servers are currently installed in
eleven
U.S. states, each of which may have its own enabling policy framework. We rely on these governmental rebates, tax credits, and other financial incentives to significantly lower the effective price of the Energy Servers to our customers in the U. S. and the Asia Pacific region. Our financing partners and Equity Investors in Bloom Electrons programs may also take advantage of these financial incentives, lowering the cost of capital and energy to our customers. However, these incentives or RPS may expire on a particular date, end when the allocated funding is exhausted, or be reduced or terminated as a matter of regulatory or legislative policy.
For example, the previous federal ITC, a federal tax incentive for fuel cell production, expired on December 31, 2016. Without the availability of the ITC benefit incentive, we lowered the price of our Energy Servers to ensure the economics to our customers would remain the same as it was prior to losing the ITC benefit, adversely affecting our gross profit. While the ITC was reinstated by the U.S Congress on February 9, 2018 and made retroactive to January 1, 2017, under current law it will phase out on December 31, 2022, as noted below:
|
•
|
the 30% ITC credit was reinstated retroactive to January 1, 2017;
|
|
•
|
installations that commence construction before January 1, 2020 are eligible for a 30% credit;
|
|
•
|
installations that commence construction in 2020 are eligible for a 26% credit;
|
|
•
|
installations that commence construction in 2021 are eligible for a 22% credit; and
|
|
•
|
installations have to be placed in service by January 1, 2024 or the installations become ineligible for the credit.
|
The ITC program has operational criteria that extend for five years. If the energy property is disposed or otherwise ceases to be qualified investment credit property before the close of the five year recapture period is fulfilled, it could result in a partial reduction of the incentives. In the case of Energy Servers purchased by PPA Entities, the PPA Entities bear the risk of repayment if the assets placed in service do not meet the ITC operational criteria in the future.
As another example, the California Self Generation Incentive Program ("SGIP") is a program administered by the California Public Utilities Commission ("CPUC") which provides incentives to investor-owned utility customers that install eligible distributed energy resources. In July 2016, the CPUC modified the SGIP to provide a smaller allocation of the incentives available to generating technologies such as our Energy Servers and a larger allocation to storage technologies. As modified, the SGIP will require all eligible power generation sources consuming natural gas to use a minimum 50% biogas to receive SGIP funds in 2019 and 100% in 2020. In addition, the CPUC provided a further limitation on the available allocation of funds that any one participant may claim under the SGIP. The SGIP has been extended until January 1, 2026. Our customer sites accepted benefiting from the SGIP represented approximately
3%
and
4%
of total sites accepted for the years ended
December 31, 2019
and
2018
, respectively.
Changes in federal, state, or local programs or the RPS in the Asia Pacific region could reduce demand for our Energy Servers, impair sales financing, and adversely impact our business results. The continuation of these programs depends upon political support which to date has been bipartisan and durable. Nevertheless, one set of political activists aggressively seeks to eliminate these programs while another set seeks to deny access to these programs for any technology that relies on natural gas, regardless of the technology’s positive contribution to reducing air pollution, reducing carbon emissions or enabling electric service to be more reliable and resilient.
We rely on tax equity financing arrangements to realize the benefits provided by investment tax credits and accelerated tax depreciation and in the event these programs are terminated, our financial results could be harmed.
We expect that any Energy Server deployments through financed transactions (including our Bloom Electrons programs, our leasing programs and any Third-Party PPA Programs) will receive capital from financing parties ("Equity Investors") who derive a significant portion of their economic returns through tax benefits. Equity Investors are generally entitled to substantially all of the project’s tax benefits, such as those provided by the ITC and Modified Accelerated Cost Recovery System ("MACRS") or bonus depreciation, until the Equity Investors achieve their respective agreed rates of return. The number of and available capital from potential Equity Investors is limited, we compete with other energy companies eligible for these tax benefits to access such investors, and the availability of capital from Equity Investors is subject to fluctuations based on factors outside of our control such as macroeconomic trends and changes in applicable taxation regimes. Concerns regarding our limited operating history, lack of profitability and that we are only the party who can perform operations and maintenance on our Energy Servers have made it difficult to attract investors in the past. Our ability to obtain additional financing in the future depends on the continued confidence of banks and other financing sources in our business model, the market for our Energy Servers, and the continued availability of tax benefits applicable to our Energy Servers. In addition, conditions in the general economy and financial and credit markets may result in the contraction of available tax equity financing. If we are unable to enter into tax equity financing agreements with attractive pricing terms, or at all, we may not be able to obtain the
25
capital needed to fund our financing programs or use the tax benefits provided by the ITC and MACRS depreciation, which could make it more difficult for customers to finance the purchase of our Energy Servers. Such circumstances could also require us to reduce the price at which we are able to sell our Energy Servers and therefore harm our business, our financial condition, and our results of operations.
Risks Related to Legal Matters and Regulations
We are subject to various environmental laws and regulations that could impose substantial costs upon us and cause delays in the delivery and installation of our Energy Servers.
We are subject to national, state, and local environmental laws and regulations as well as environmental laws in those foreign jurisdictions in which we operate. Environmental laws and regulations can be complex and may often change. These laws can give rise to liability for administrative oversight costs, cleanup costs, property damage, bodily injury, fines, and penalties. Capital and operating expenses needed to comply with environmental laws and regulations can be significant, and violations may result in substantial fines and penalties or third-party damages. In addition, ensuring we are in compliance with applicable environmental laws requires significant time and management resources and could cause delays in our ability to build out, equip and operate our facilities as well as service our fleet, which would adversely impact our business, our prospects, our financial condition, and our operating results. In addition, environmental laws and regulations such as the Comprehensive Environmental Response, Compensation and Liability Act in the United States impose liability on several grounds including for the investigation and cleanup of contaminated soil and ground water, for building contamination, for impacts to human health and for damages to natural resources. If contamination is discovered in the future at properties formerly owned or operated by us or currently owned or operated by us, or properties to which hazardous substances were sent by us, it could result in our liability under environmental laws and regulations. Many of our customers who purchase our Energy Servers have high sustainability standards, and any environmental noncompliance by us could harm our reputation and impact a current or potential customer’s buying decision. Additionally, in many cases we contractually commit to performing all necessary installation work on a fixed-price basis, and unanticipated costs associated with environmental remediation and/or compliance expenses may cause the cost of performing such work to exceed our revenue. The costs of complying with environmental laws, regulations, and customer requirements, and any claims concerning noncompliance or liability with respect to contamination in the future, could have a material adverse effect on our financial condition or our operating results.
The installation and operation of our Energy Servers are subject to environmental laws and regulations in various jurisdictions, and there is uncertainty with respect to the interpretation of certain environmental laws and regulations to our Energy Servers, especially as these regulations evolve over time.
Bloom is committed to compliance with applicable environmental laws and regulations including health and safety standards, and we continually review the operation of our Energy Servers for health, safety, and environmental compliance. Our Energy Servers, like other fuel cell technology-based products of which we are aware, produce small amounts of hazardous wastes and air pollutants, and we seek to ensure that these are handled in accordance with applicable regulatory standards.
Maintaining compliance with laws and regulations can be challenging given the changing patchwork of environmental laws and regulations that prevail at the federal, state, regional, and local level. Most existing environmental laws and regulations preceded the introduction of our innovative fuel cell technology and were adopted to apply to technologies existing at the time (i.e., large coal, oil, or gas-fired power plants). Currently, there is generally little guidance from these agencies on how certain environmental laws and regulations may or may not be applied to our technology.
For example, natural gas, which is the primary fuel used in our Energy Servers, contains benzene, which is classified as a hazardous waste if it exceeds 0.5 milligrams per liter. A small amount of benzene found in the public natural gas supply (equivalent to what is present in one gallon of gasoline in an automobile fuel tank which are exempt from federal regulation) is collected by the gas cleaning units contained in our Energy Servers which are typically replaced once every 18 to 24 months by us from customers’ sites. From 2010 to late 2016 and in the regular course of maintenance of the Energy Servers, we periodically replaced the units in our servers relying upon a federal environmental exemption that permitted the handling of such units without manifesting the contents as containing a hazardous waste. Although over the years and with the approval of two states, we believed that we operated under the exemption, the U.S. Environmental Protection Agency ("EPA") issued guidance for the first time in late 2016 that differed from our belief and conflicted with the state approvals we had obtained. We have complied with the new guidance and, given the comparatively small quantities of benzene produced, we do not anticipate significant additional costs or risks from our compliance with the revised 2016 guidance. However, the EPA has asked us to show cause why it should not collect approximately $1.0 million in fines from us for the prior period, which we are contesting. Additionally, we paid a nominal fine to an agency in a different state under that state’s environmental laws relating to the operation of our Energy Server under the exemption prior to the issuance of the revised EPA guidance.
26
Another example relates to the very small amounts of chromium in hexavalent form ("CR+6") which our Energy Servers emit at nanometer scale. This occurs any time a steel super alloy is exposed to high temperatures. CR+6 is found in small concentrations in the air generally. However, exposure to high or significant concentrations over prolonged periods of time can be carcinogenic. While the small amount of chromium emitted by our Energy Servers is initially in the hexavalent form, it converts to a non-toxic trivalent form, or CR+3, rapidly after it leaves the Energy Server. In tests we have conducted, air measurements taken 10 meters from an Energy Server show that the CR+6 is largely converted.
Our Energy Servers do not present any significant health hazard based on our modeling, testing methodology, and measurements. There are several supporting elements to this position including that the emissions from our Energy Servers are in very low concentrations, are emitted as nano-particles that convert to the non-hazardous form CR+3 rapidly, are quickly dispersed into the air, and are not emitted in close proximity to locations where people would be expected to have a prolonged exposure. Nevertheless, we have engineered a technology solution that we are deploying.
Several states in which we currently operate, including California, require permits for emissions of hazardous air pollutants based on the quantity of emissions, most of which require permits only for quantities of emissions that are higher than those observed from our Energy Servers. Other states in which we operate, including New York, New Jersey, and North Carolina, have specific exemptions for fuel cells. Some states in which we operate have CR+6 limits which are an order of magnitude over our operating range. Within California, the Bay Area Air Quality Management District ("BAAQMD") requires a permit for emissions that are more than 0.00051 lbs/year. Other California regulations require that levels of CR+6 be below 0.00005 µg/m³, which is the level required by Proposition 65 and which requires notification of the presence of CR+6 unless it can be shown to be at levels that do not pose a significant health risk. We have determined that the standards applicable in California in this regard are more stringent than those in any other state or foreign location in which we have installed Energy Servers to date, therefore, deployment of our solution has been focused on California's standards.
There are generally no relevant environmental testing methodology guidelines for a technology such as ours. The standard test method for analyzing emissions cannot be readily applied to our Energy Servers because it would require inserting a probe into an emission stack. Our servers do not have emission stacks; therefore, we have to construct an artificial stack on top of our server in order to conduct a test. If we used the testing methodology similar to what the air districts have used in other large scale industrial products, it would show that we would need to reduce the emissions of CR+6 from our Energy Servers to meet the most stringent requirements. However, we employed a modified test method that is designed to capture the actual operating conditions of our Energy Servers and its distinctly different design from legacy power plants and industrial equipment. Based on our modeling, measured results and analysis, we believe we are in compliance with State of California air regulations. However, it is possible that the California Air Districts will require us to abate or shut down the operations of certain of our existing Energy Servers on a temporary basis or will seek the imposition of monetary penalties.
While we seek to comply with air quality and emission standards in every region in which we operate, it is possible that certain customers in other regions may request that we provide the new technology solution for their Energy Servers to comply with the stricter standards imposed by California even though they are not applicable and even though we are under no contractual obligation to do so. We plan to satisfy these requests from customers. Failure or delay in attaining regulatory approval could result in our not being able to operate in a particular local jurisdiction.
These examples illustrate that our technology is moving faster than the regulatory process in many instances. It is possible that regulators could delay or prevent us from conducting our business in some way pending agreement on, and compliance with, shifting regulatory requirements. Such actions could delay the installation of Energy Servers, could result in penalties, could require modification or replacement or could trigger claims of performance warranties and defaults under customer contracts that could require us to repurchase their Energy Servers, any of which could adversely affect our business, our financial performance, and our reputation. In addition, new laws or regulations or new interpretations of existing laws or regulations could present marketing, political or regulatory challenges and could require us to upgrade or retrofit existing equipment, which could result in materially increased capital and operating expenses.
Furthermore, we have not yet determined whether our Energy Servers will satisfy regulatory requirements in the other states in the U.S. and in international locations in which we do not currently sell Energy Servers but may pursue in the future.
As a fossil fuel-based technology, we may be subject to a heightened risk of regulation, to a potential for the loss of certain incentives, and to changes in our customers’ energy procurement policies.
Although the current generation of Energy Servers running on natural gas produce nearly 50% less carbon emissions compared to the average of U.S. combustion power generation, the operation of our Energy Servers does produce carbon dioxide ("CO2"), which has been shown to be a contributing factor to global climate change. As such, we may be negatively impacted by CO2-related changes in applicable laws, regulations, ordinances, rules, or the requirements of the incentive programs on which we and our customers currently rely. Changes (or a lack of change to comprehensively recognize the risks
27
of climate change and recognize the benefit of our technology as one means to maintain reliable and resilient electric service with a lower greenhouse gas emission profile) in any of the laws, regulations, ordinances, or rules that apply to our installations and new technology could make it illegal or more costly for us or our customers to install and operate our Energy Servers on particular sites, thereby negatively affecting our ability to deliver cost savings to customers, or we could be prohibited from completing new installations or continuing to operate existing projects. Certain municipalities in California have already banned the use of distributed generation products that utilize fossil fuel. Additionally, our customers’ and potential customers’ energy procurement policies may prohibit or limit their willingness to procure our Energy Servers. Our business prospects may be negatively impacted if we are prevented from completing new installations or our installations become more costly as a result of laws, regulations, ordinances, or rules applicable to our Energy Servers, or by our customers’ and potential customers’ energy procurement policies.
Existing regulations and changes to such regulations impacting the electric power industry may create technical, regulatory, and economic barriers which could significantly reduce demand for our Energy Servers or affect the financial performance of current sites.
The market for electricity generation products is heavily influenced by U.S. federal, state, local, and foreign government regulations and policies as well as by internal policies and regulations of electric utility providers. These regulations and policies often relate to electricity pricing and technical interconnection of customer-owned electricity generation. These regulations and policies are often modified and could continue to change, which could result in a significant reduction in demand for our Energy Servers. For example, utility companies commonly charge fees to larger industrial customers for disconnecting from the electric grid or for having the capacity to use power from the electric grid for back-up purposes. These fees could change, thereby increasing the cost to our customers of using our Energy Servers and making them less economically attractive.
In addition, our project with Delmarva Power & Light Company ("the Delaware Project") is subject to laws and regulations relating to electricity generation, transmission, and sale in Delaware and at the federal level.
A law governing the sale of electricity from the Delaware Project was necessary to implement part of several incentives that Delaware offered to Bloom to build our major manufacturing facility ("Manufacturing Center") in Delaware. Those incentives have proven controversial in Delaware, in part because our Manufacturing Center, while a significant source of continuing manufacturing employment, has not expanded as quickly as projected. A citizen-antagonist continues to oppose the Delaware Project and seeks support from Delaware officials and others. In 2018, he unsuccessfully petitioned the Delaware Public Service Commission. Most recently, he unsuccessfully appealed a favorable Order of the Secretary of Delaware’s Department of Natural Resources and Environmental Control to Delaware’s Environmental Appeals Board (EAB), an administrative entity with authority to review the Secretary’s Orders. The Secretary’s Order at issue approved permits that enable the upgrade of the Delaware Project. As we expected, the EAB upheld the Secretary’s Order as the appeal was without merit and raised issues that were outside the scope of the permits and beyond the jurisdiction of the EAB. The Appeal and the opposition to the Delaware Project are examples of potentially material risks associated with electric power regulation.
At the federal level, FERC has authority to regulate under various federal energy regulatory laws, wholesale sales of electric energy, capacity, and ancillary services, and the delivery of natural gas in interstate commerce. Also, several of our PPA Entities are subject to regulation under FERC with respect to market-based sales of electricity, which requires us to file notices and make other periodic filings with FERC, which increases our costs and subjects us to additional regulatory oversight.
Although we generally are not regulated as a utility, federal, state, and local government statutes and regulations concerning electricity heavily influence the market for our product and services. These statutes and regulations often relate to electricity pricing, net metering, incentives, taxation, and the rules surrounding the interconnection of customer-owned electricity generation for specific technologies. In the United States, governments frequently modify these statutes and regulations. Governments, often acting through state utility or public service commissions, change and adopt different requirements for utilities and rates for commercial customers on a regular basis. Changes, or in some cases a lack of change, in any of the laws, regulations, ordinances, or other rules that apply to our installations and new technology could make it more costly for us or our customers to install and operate our Energy Servers on particular sites and, in turn, could negatively affect our ability to deliver cost savings to customers for the purchase of electricity.
We may become subject to product liability claims which could harm our financial condition and liquidity if we are not able to successfully defend or insure against such claims.
We may in the future become subject to product liability claims. Our Energy Servers are considered high energy systems because they use flammable fuels and may operate at 480 volts. Although our Energy Servers are certified to meet ANSI, IEEE, ASME, and NFPA design and safety standards, if an Energy Server is not properly handled in accordance with our servicing and handling standards and protocols, there could be a system failure and resulting liability. These claims could require us to
28
incur significant costs to defend. Furthermore, any successful product liability claim could require us to pay a substantial monetary award. Moreover, a product liability claim could generate substantial negative publicity about our Company and our Energy Servers, which could harm our brand, our business prospects, and our operating results. While we maintain product liability insurance, our insurance may not be sufficient to cover all potential product liability claims. Any lawsuit seeking significant monetary damages either in excess of our coverage or outside of our coverage may have a material adverse effect on our business and our financial condition.
Current or future litigation or administrative proceedings could have a material adverse effect on our business, our financial condition and our results of operations
.
We have been and continue to be involved in legal proceedings, administrative proceedings, claims, and other litigation that arise in the ordinary course of business. Purchases of our products have also been the subject of litigation. For information regarding pending legal proceedings, please see Item 3 in this Annual Report on Form 10-K captioned "Legal Proceedings" and footnote 14 to our consolidated financial statements entitled "Commitments and Contingencies." In addition, since our Energy Server is a new type of product in a nascent market, we have in the past needed and may in the future need to seek the amendment of existing regulations, or in some cases the development of new regulations, in order to operate our business in some jurisdictions. Such regulatory processes may require public hearings concerning our business, which could expose us to subsequent litigation.
Unfavorable outcomes or developments relating to proceedings to which we are a party or transactions involving our products such as judgments for monetary damages, injunctions, or denial or revocation of permits, could have a material adverse effect on our business, our financial condition, and our results of operations. In addition, settlement of claims could adversely affect our financial condition and our results of operations.
Risks Relating to Our Intellectual Property
Our failure to protect our intellectual property rights may undermine our competitive position, and litigation to protect our intellectual property rights may be costly.
Although we have taken many protective measures to protect our trade secrets including agreements, limited access, segregation of knowledge, password protections, and other measures, policing unauthorized use of proprietary technology can be difficult and expensive. For example, many of our engineers reside in California where it is not legally permissible to prevent them from working for a competitor if and when one should exist. Also, litigation may be necessary to enforce our intellectual property rights, to protect our trade secrets, or to determine the validity and scope of the proprietary rights of others. Such litigation may result in our intellectual property rights being challenged, limited in scope, or declared invalid or unenforceable. We cannot be certain that the outcome of any litigation will be in our favor, and an adverse determination in any such litigation could impair our intellectual property rights, our business, our prospects, and our reputation.
We rely primarily on patent, trade secret, and trademark laws and non-disclosure, confidentiality, and other types of contractual restrictions to establish, maintain, and enforce our intellectual property and proprietary rights. However, our rights under these laws and agreements afford us only limited protection and the actions we take to establish, maintain, and enforce our intellectual property rights may not be adequate. For example, our trade secrets and other confidential information could be disclosed in an unauthorized manner to third parties, our owned or licensed intellectual property rights could be challenged, invalidated, circumvented, infringed, or misappropriated or our intellectual property rights may not be sufficient to provide us with a competitive advantage, any of which could have a material adverse effect on our business, financial condition, or operating results. In addition, the laws of some countries do not protect proprietary rights as fully as do the laws of the United States. As a result, we may not be able to protect our proprietary rights adequately abroad.
Our patent applications may not result in issued patents, and our issued patents may not provide adequate protection, either of which may have a material adverse effect on our ability to prevent others from commercially exploiting products similar to ours.
We cannot be certain that our pending patent applications will result in issued patents or that any of our issued patents will afford protection against a competitor. The status of patents involves complex legal and factual questions, and the breadth of claims allowed is uncertain. As a result, we cannot be certain that the patent applications that we file will result in patents being issued or that our patents and any patents that may be issued to us in the future will afford protection against competitors with similar technology. In addition, patent applications filed in foreign countries are subject to laws, rules, and procedures that differ from those of the United States, and thus we cannot be certain that foreign patent applications related to issued U.S. patents will be issued in other regions. Furthermore, even if these patent applications are accepted and the associated patents issued, some foreign countries provide significantly less effective patent enforcement than in the United States.
29
In addition, patents issued to us may be infringed upon or designed around by others and others may obtain patents that we need to license or design around, either of which would increase costs and may adversely affect our business, our prospects, and our operating results.
We may need to defend ourselves against claims that we infringed, misappropriated, or otherwise violated the intellectual property rights of others, which may be time-consuming and would cause us to incur substantial costs.
Companies, organizations, or individuals, including our competitors, may hold or obtain patents, trademarks, or other proprietary rights that they may in the future believe are infringed by our products or services. Although we are not currently subject to any claims related to intellectual property, these companies holding patents or other intellectual property rights allegedly relating to our technologies could, in the future, make claims or bring suits alleging infringement, misappropriation, or other violations of such rights, or otherwise assert their rights and by seeking licenses or injunctions. Several of the proprietary components used in our Energy Servers have been subjected to infringement challenges in the past. We also generally indemnify our customers against claims that the products we supply infringe, misappropriate, or otherwise violate third party intellectual property rights, and we therefore may be required to defend our customers against such claims. If a claim is successfully brought in the future and we or our products are determined to have infringed, misappropriated, or otherwise violated a third party’s intellectual property rights, we may be required to do one or more of the following:
|
•
|
cease selling or using our products that incorporate the challenged intellectual property;
|
|
•
|
pay substantial damages (including treble damages and attorneys’ fees if our infringement is determined to be willful);
|
|
•
|
obtain a license from the holder of the intellectual property right, which may not be available on reasonable terms or at all; or
|
|
•
|
redesign our products or means of production, which may not be possible or cost-effective.
|
Any of the foregoing could adversely affect our business, prospects, operating results, and financial condition. In addition, any litigation or claims, whether or not valid, could harm our reputation, result in substantial costs and divert resources and management attention.
We also license technology from third parties and incorporate components supplied by third parties into our products. We may face claims that our use of such technology or components infringes or otherwise violates the rights of others, which would subject us to the risks described above. We may seek indemnification from our licensors or suppliers under our contracts with them, but our rights to indemnification or our suppliers’ resources may be unavailable or insufficient to cover our costs and losses.
Risks Relating to Our Financial Condition and Operating Results
We have incurred significant losses in the past and we may not be profitable for the foreseeable future.
Since our inception in 2001, we have incurred significant net losses and have used significant cash in our business. As of
December 31, 2019
, we had an accumulated deficit of
$2.9 billion
. We expect to continue to expand our operations, including by investing in manufacturing, sales and marketing, research and development, staffing systems, and infrastructure to support our growth. We anticipate that we will incur net losses for the foreseeable future. Our ability to achieve profitability in the future will depend on a number of factors, including:
|
•
|
growing our sales volume;
|
|
•
|
increasing sales to existing customers and attracting new customers;
|
|
•
|
expanding into new geographical markets and industry market sectors;
|
|
•
|
attracting and retaining financing partners who are willing to provide financing for sales on a timely basis and with attractive terms;
|
|
•
|
continuing to improve the useful life of our fuel cell technology and reducing our warranty servicing costs;
|
|
•
|
reducing the cost of producing our Energy Servers;
|
|
•
|
improving the efficiency and predictability of our installation process;
|
|
•
|
improving the effectiveness of our sales and marketing activities;
|
|
•
|
attracting and retaining key talent in a competitive marketplace; and
|
|
•
|
the amount of stock-based compensation recognized in the period.
|
30
Even if we do achieve profitability, we may be unable to sustain or increase our profitability in the future.
Our financial condition and results of operations and other key metrics are likely to fluctuate on a quarterly basis in future periods, which could cause our results for a particular period to fall below expectations, resulting in a severe decline in the price of our Class A common stock.
Our financial condition and results of operations and other key metrics have fluctuated significantly in the past and may continue to fluctuate in the future due to a variety of factors, many of which are beyond our control. For example, the amount of product revenue we recognize in a given period is materially dependent on the volume of installations of our Energy Servers in that period and the type of financing used by the customer.
In addition to the other risks described herein, the following factors could also cause our financial condition and results of operations to fluctuate on a quarterly basis:
|
•
|
the timing of installations, which may depend on many factors such as availability of inventory, product quality or performance issues, or local permitting requirements, utility requirements, environmental, health, and safety requirements, weather, and customer facility construction schedules;
|
|
•
|
size of particular installations and number of sites involved in any particular quarter;
|
|
•
|
the mix in the type of purchase or financing options used by customers in a period, the geographical mix of customer sales, and the rates of return required by financing parties in such period;
|
|
•
|
whether we are able to structure our sales agreements in a manner that would allow for the product and installation revenue to be recognized upfront at acceptance;
|
|
•
|
delays or cancellations of Energy Server installations;
|
|
•
|
fluctuations in our service costs, particularly due to unexpected costs of servicing and maintaining Energy Servers;
|
|
•
|
weaker than anticipated demand for our Energy Servers due to changes in government incentives and policies or due to other conditions;
|
|
•
|
fluctuations in our research and development expense, including periodic increases associated with the pre-production qualification of additional tools as we expand our production capacity;
|
|
•
|
interruptions in our supply chain;
|
|
•
|
the length of the sales and installation cycle for a particular customer;
|
|
•
|
the timing and level of additional purchases by existing customers;
|
|
•
|
unanticipated expenses or installation delays associated with changes in governmental regulations, permitting requirements by local authorities at particular sites, utility requirements and environmental, health, and safety requirements;
|
|
•
|
disruptions in our sales, production, service or other business activities resulting from disagreements with our labor force or our inability to attract and retain qualified personnel; and
|
|
•
|
unanticipated changes in federal, state, local, or foreign government incentive programs available for us, our customers, and tax equity financing parties.
|
Fluctuations in our operating results and cash flow could, among other things, give rise to short-term liquidity issues. In addition, our revenue, key operating metrics, and other operating results in future quarters may fall short of the expectations of investors and financial analysts, which could have an adverse effect on the price of our Class A common stock.
If we fail to manage our growth effectively, our business and operating results may suffer.
Our current growth and future growth plans may make it difficult for us to efficiently operate our business, challenging us to effectively manage our capital expenditures and control our costs while we expand our operations to increase our revenue. If we experience a significant growth in orders without improvements in automation and efficiency, we may need additional manufacturing capacity and we and some of our suppliers may need additional and capital intensive equipment. Any growth in manufacturing must include a scaling of quality control as the increase in production increases the possible impact of manufacturing defects. In addition, any growth in the volume of sales of our Energy Servers may outpace our ability to engage sufficient and experienced personnel to manage the higher number of installations and to engage contractors to complete installations on a timely basis and in accordance with our expectations and standards. Any failure to manage our growth
31
effectively could materially and adversely affect our business, our prospects, our operating results, and our financial condition. Our future operating results depend to a large extent on our ability to manage this expansion and growth successfully.
The accounting treatment related to our revenue-generating transactions is complex, and if we are unable to attract and retain highly qualified accounting personnel to evaluate the accounting implications of our complex or non-routine transactions, our ability to accurately report our financial results may be harmed.
Our revenue-generating transactions include traditional leases, Managed Services Agreements, sales to international channel partners and PPA transactions, all of which are accounted for differently in our financial statements. Many of the accounting rules related to our financing transactions are complex and require experienced and highly skilled personnel to review and interpret the proper accounting treatment with respect thereto. Competition for senior finance and accounting personnel in the San Francisco Bay Area who have public company reporting experience is intense, and if we are unable to recruit and retain personnel with the required level of expertise to evaluate and accurately classify our revenue-producing transactions, our ability to accurately report our financial results may be harmed.
We reached a determination to restate certain of our previously issued consolidated financial statements as a result of the identification of material misstatements in previously issued financial statements, which resulted in unanticipated costs and may affect investor confidence and raise reputational issues.
As discussed in the Explanatory Note, in Note 2,
Restatement and Revision of Previously Issued Financial Statements,
and in Note 18,
Unaudited Selected Quarterly Financial Data,
in this Annual Report on Form 10-K for the year ended December 31, 2019, we reached a determination to restate our consolidated financial statements and related disclosures for the periods disclosed in those notes after misstatements in our accounting treatment of some of our complex or non-routine transactions were identified. The restatement also included corrections for previously identified immaterial uncorrected misstatements in the impacted periods. As a result, we have incurred unanticipated costs for accounting and legal fees in connection with or related to the restatement, and have become subject to a number of additional risks and uncertainties, which may affect investor confidence in the accuracy of our financial disclosures and may raise reputational risks for our business, both of which could harm our business and financial results.
We recently identified a material weakness in our internal control over financial reporting related to the accounting for complex or non-routine transactions. If we do not effectively remediate the material weakness or if we otherwise fail to maintain effective internal control over financial reporting, our ability to report our financial results on a timely and an accurate basis may adversely affect the market price of our Class A common stock.
The Sarbanes-Oxley Act of 2002 ("Sarbanes-Oxley Act") requires, among other things, that public companies evaluate the effectiveness of their internal control over financial reporting and disclosure controls and procedures. As a recently public company and as an emerging growth company, we elected to delay adopting the requirements of the Sarbanes-Oxley Act as is our option under the Sarbanes-Oxley Act. While we have not yet adopted the requirements under Section 404B of the Sarbanes-Oxley Act, we did identify a material weakness in internal control over financial reporting at December 31, 2019, as we did not design and maintain an effective control environment with a sufficient complement of resources with an appropriate level of accounting knowledge, expertise and training to evaluate the accounting implications of complex or non-routine transactions commensurate with our financial reporting requirements. Please see Item 9A,
Controls and Procedures,
in this Annual Report on Form 10-K for additional information regarding the identified material weakness and our actions to date to remediate the material weakness. Subsequent testing by us or our independent registered public accounting firm, which has not yet performed an audit of our internal control over financial reporting, may reveal additional deficiencies in our internal control over financial reporting that are deemed to be material weaknesses.
To comply with Section 404B, we may incur substantial costs, expend significant management time on compliance-related issues, and hire additional accounting, financial, and internal audit staff with appropriate public company experience and technical accounting knowledge. Moreover, if we are not able to comply with the requirements of Section 404B in a timely manner or if we or our independent registered public accounting firm identify deficiencies in our internal control over financial reporting that are deemed to be material weaknesses, we could be subject to sanctions or investigations by the SEC or other regulatory authorities, which would require additional financial and management resources. Any failure to maintain effective disclosure controls and procedures or internal control over financial reporting could have a material adverse effect on our business and operating results and cause a decline in the price of our Class A common stock. For further discussion on Section 404 compliance, see our Risk Factor: "
We are an 'emerging growth company' and we cannot be certain if the reduced disclosure requirements applicable to emerging growth companies will make our Class A common stock less attractive to investors and may make it more difficult to compare our performance with other public companies
."
32
Our ability to use our deferred tax assets to offset future taxable income may be subject to limitations that could subject our business to higher tax liability.
We may be limited in the portion of net operating loss carryforwards that we can use in the future to offset taxable income for U.S. federal and state income tax purposes. Our net operating loss carryforwards ("NOLs") will expire, if unused,
beginning in 2022 and 2028, respectively. A lack of future taxable income would adversely affect our ability to utilize these NOLs. In addition, under Section 382 of the Internal Revenue Code of 1986, as amended (the "Code"), a corporation that undergoes an “ownership change” is subject to limitations on its ability to utilize its NOLs to offset future taxable income. Changes in our stock ownership as well as other changes that may be outside of our control could result in ownership changes under Section 382 of the Code, which could cause our NOLs to be subject to certain limitations. Our NOLs may also be impaired under similar provisions of state law. Our deferred tax assets, which are currently fully reserved with a valuation allowance, may expire unutilized or underutilized, which could prevent us from offsetting future taxable income.
Risks Relating to Our Liquidity
We must maintain customer confidence in our liquidity, including in our ability to timely service our debt obligations, and long-term business prospects in order to grow our business.
Currently, we are the only provider able to fully support and maintain our Energy Servers. If potential customers believe we do not have sufficient capital or liquidity to operate our business over the long-term or that we will be unable to maintain their Energy Servers and provide satisfactory support, customers may be less likely to purchase or lease our products, particularly in light of the significant financial commitment required. In addition, financing sources may be unwilling to provide financing on reasonable terms. Similarly, suppliers, financing partners, and other third parties may be less likely to invest time and resources in developing business relationships with us if they have concerns about the success of our business.
Accordingly, in order to grow our business, we must maintain confidence in our liquidity and long-term business prospects among customers, suppliers, financing partners, and other parties. This may be particularly complicated by factors such as:
|
•
|
our limited operating history at a large scale;
|
|
•
|
the size of our debt obligations;
|
|
•
|
our lack of profitability;
|
|
•
|
unfamiliarity with or uncertainty about our Energy Servers and the overall perception of the distributed generation market;
|
|
•
|
prices for electricity or natural gas in particular markets;
|
|
•
|
competition from alternate sources of energy;
|
|
•
|
warranty or unanticipated service issues we may experience;
|
|
•
|
the environmental consciousness and perceived value of environmental programs to our customers;
|
|
•
|
the size of our expansion plans in comparison to our existing capital base and the scope and history of operations;
|
|
•
|
the availability and amount of tax incentives, credits, subsidies or other incentive programs; and
|
|
•
|
the other factors set forth in this “Risk Factors” section.
|
Several of these factors are largely outside our control, and any negative perceptions about our liquidity or long-term business prospects, even if unfounded, would likely harm our business.
33
Our substantial indebtedness, and restrictions imposed by the agreements governing our and our PPA Entities’ outstanding indebtedness, may limit our financial and operating activities and may adversely affect our ability to incur additional debt to fund future needs
.
As of
December 31, 2019
, we and our subsidiaries had approximately
$636.8 million
of total consolidated indebtedness, of which an aggregate of
$401.4 million
represented indebtedness that is recourse to us, of which
$325.4 million
is classified as current and
$76.0 million
is classified as non-current. Of this
$401.4 million
debt,
$273.4 million
represented debt under our 6% Notes,
$90.0 million
represented debt under our 10% Notes, and
$36.5 million
represented debt under our 5% Notes. In addition, our PPA Entities’ outstanding indebtedness of
$235.4 million
represented indebtedness that is non-recourse to us. The agreements governing our and our PPA Entities’ outstanding indebtedness contain, and other future debt agreements may contain, covenants imposing operating and financial restrictions on our business that limit our flexibility including, among other things:
|
•
|
borrow money;
|
|
•
|
pay dividends or make other distributions;
|
|
•
|
incur liens;
|
|
•
|
make asset dispositions;
|
|
•
|
make loans or investments;
|
|
•
|
issue or sell share capital of our subsidiaries;
|
|
•
|
issue guaranties;
|
|
•
|
enter into transactions with affiliates;
|
|
•
|
merge, consolidate or sell, lease or transfer all or substantially all of our assets;
|
|
•
|
require us to dedicate a substantial portion of cash flow from operations to the payment of principal and interest on indebtedness, thereby reducing the funds available for other purposes such as working capital and capital expenditures;
|
|
•
|
make it more difficult for us to satisfy and comply with our obligations with respect to our indebtedness;
|
|
•
|
subject us to increased sensitivity to interest rate increases;
|
|
•
|
make us more vulnerable to economic downturns, adverse industry conditions, or catastrophic external events;
|
|
•
|
limit our ability to withstand competitive pressures;
|
|
•
|
limit our ability to invest in new business subsidiaries that are not PPA Entity-related;
|
|
•
|
reduce our flexibility in planning for or responding to changing business, industry, and economic conditions; and/or
|
|
•
|
place us at a competitive disadvantage to competitors that have relatively less debt than we have.
|
Our debt agreements and our PPA Entities’ debt agreements require the maintenance of financial ratios or the satisfaction of financial tests such as debt service coverage ratios and consolidated leverage ratios. Our and our PPA Entities’ ability to meet these financial ratios and tests may be affected by events beyond our control and, as a result, we cannot assure you that we will be able to meet these ratios and tests. Upon the occurrence of events such as a change in control of our Company, significant asset sales or mergers or similar transactions, the liquidation or dissolution of our Company or the cessation of our stock exchange listing, holders of our 6% Notes have the right to cause us to repurchase for cash any or all of such outstanding notes at a repurchase price in cash equal to 100% of the principal amount thereof, plus accrued and unpaid interest thereon. We cannot provide assurance that we would have sufficient liquidity to repurchase such notes. Furthermore, our financing and debt agreements, such as our 6% Notes and our 10% Notes, contain events of default. If an event of default were to occur, the trustee or the lenders could, among other things, terminate their commitments and declare outstanding amounts due and payable and our cash may become restricted. We cannot provide assurance that we would have sufficient liquidity to repay or refinance our indebtedness if such amounts were accelerated upon an event of default. Borrowings under other debt instruments that contain cross-acceleration or cross-default provisions may, as a result, be accelerated and become due and payable as a consequence. We may be unable to pay these debts in such circumstances. If we were unable to repay those amounts, lenders could proceed against the collateral granted to them to secure repayment of those amounts. We cannot assure you that the collateral will be sufficient to repay in full those amounts. We cannot provide assurance that the operating and financial restrictions and covenants in these agreements will not adversely affect our ability to finance our future operations or capital needs, or our ability to engage in other business activities that may be in our interest or our ability to react to adverse market developments.
34
As of
December 31, 2019
, we and our subsidiaries have approximately
$636.8 million
of total consolidated indebtedness, including
$337.6 million
in short-term debt and
$299.2 million
in long-term debt. In addition, our 10% Notes contain restrictions on our ability to issue additional debt and both the 6% Notes and 10% Notes limit our ability to provide collateral for any additional debt. Given our current level of indebtedness, the restrictions on additional indebtedness contained in the 10% Notes and the fact that most of our assets serve as collateral to secure existing debt, it may be difficult for us to secure additional debt financing at an attractive cost, which may in turn impact our ability to expand our operations and our product development activities and to remain competitive in the market.
In addition, our substantial level of indebtedness could limit our ability to obtain required additional financing on acceptable terms or at all for working capital, capital expenditures, and general corporate purposes. Any of these risks could impact our ability to fund our operations or limit our ability to expand our business, which could have a material adverse effect on our business, our financial condition, our liquidity, and our results of operations. Our liquidity needs could vary significantly and may be affected by general economic conditions, industry trends, performance, and many other factors not within our control.
We may not be able to generate sufficient cash to meet our debt service obligations.
Our ability to generate sufficient cash to make scheduled payments on our debt obligations will depend on our future financial performance, which will be affected by a range of economic, competitive, and business factors, many of which are outside of our control.
We finance a significant volume of Energy Servers and receive equity distributions from certain of the PPA Entities that purchase the Energy Servers and other project intangibles through a series of milestone payments. The milestone payments and equity distributions contribute to our cash flow. These PPA Entities are separate and distinct legal entities, do not guarantee our debt obligations, and have no obligation, contingent or otherwise, to pay amounts due under our debt obligations or to make any funds available to pay those amounts, whether by dividend, distribution, loan, or other payments. It is possible that the PPA Entities may not contribute significant cash to us.
If we do not generate sufficient cash to satisfy our debt obligations, including interest payments, or if we are unable to satisfy the requirement for the payment of principal at maturity or other payments that may be required from time to time under the terms of our debt instruments, we may have to undertake alternative financing plans such as refinancing or restructuring our debt, selling assets, reducing or delaying capital investments, or seeking to raise additional capital. We cannot provide assurance that any refinancing or restructuring would be possible, that any assets could be sold, or, if sold, of the timing of the sales and the amount of proceeds realized from those sales, that additional financing could be obtained on acceptable terms, if at all, or that additional financing would be available or permitted under the terms of our various debt instruments then in effect. Furthermore, the ability to refinance indebtedness would depend upon the condition of the finance and credit markets at the time which have in the past been, and may in the future be, volatile. Our inability to generate sufficient cash to satisfy our debt obligations or to refinance our obligations on commercially reasonable terms or on a timely basis would have an adverse effect on our business, our results of operations and our financial condition.
Certain of our outstanding convertible debt securities may be required to be settled in cash, which could have a material effect on our financial position.
Certain listing standards of The New York Stock Exchange limit the number of shares we may deliver upon conversion of our outstanding convertible notes that we amended in March of 2020 unless we first obtain the approval of our stockholders to issue shares in excess of that amount. We may never obtain such stockholder approval. To comply with these listing standards, the number of shares that we may issue upon conversion of our outstanding convertible notes will be limited to an amount that does not exceed these limitations, until we have obtained stockholder approval to issue additional shares. Any shares that would otherwise have been deliverable upon conversion in the absence of this limitation will instead be settled in cash based on the applicable daily conversion values during the relevant period. We may not have the funds available to settle such conversions in cash. Our inability to settle such conversions in cash by the required conversion date would be a default under the agreements that govern our convertible notes.
Under some circumstances, we may be required to or elect to make additional payments to our PPA Entities or the Power Purchase Agreement Program Equity Investors.
Three of our PPA Entities are structured in a manner such that, other than the amount of any equity investment we have made, we do not have any further primary liability for the debts or other obligations of the PPA Entities. All of our PPA Entities that operate Energy Servers for end customers have significant restrictions on their ability to incur increased operating costs, or could face events of default under debt or other investment agreements if end customers are not able to meet their payment
35
obligations under PPAs or if Energy Servers are not deployed in accordance with the project’s schedule. In three cases, if our PPA Entities experience unexpected, increased costs such as insurance costs, interest expense or taxes or as a result of the acceleration of repayment of outstanding indebtedness, or if end customers are unable or unwilling to continue to purchase power under their PPAs, there could be insufficient cash generated from the project to meet the debt service obligations of the PPA Entity or to meet any targeted rates of return of Equity Investors. If a PPA Entity fails to make required debt service payments, this could constitute an event of default and entitle the lender to foreclose on the collateral securing the debt or could trigger other payment obligations of the PPA Entity. To avoid this, we could choose to contribute additional capital to the applicable PPA Entity to enable such PPA Entity to make payments to avoid an event of default, which could adversely affect our business or our financial condition. Under PPA Company IV’s note purchase agreement, PPA Company IV is obligated to offer to repay all outstanding debt in the event that at any time we fail to own (directly or indirectly) at least 50.1% of the equity interest of PPA Company IV not owned by the Equity Investor(s). Upon receipt of such offer, the lenders may waive that obligation or elect to require PPA Company IV to prepay all remaining amounts owed under PPA Company IV’s project debt. The obligations under PPA Company IV have not been triggered as of
December 31, 2019
.
Risks Relating to Our Operations
We may have conflicts of interest with our PPA Entities.
In most of our PPA Entities, we act as the managing member and are responsible for the day-to-day administration of the project. However, we are also a major service provider for each PPA Entity in our capacity as the operator of the Energy Servers under an operations and maintenance agreement. Because we are both the administrator and the manager of our PPA Entities, as well as a major service provider, we face a potential conflict of interest in that we may be obligated to enforce contractual rights that a PPA Entity has against us in our capacity as a service provider. By way of example, the PPA Entity may have a right to payment from us under a warranty provided under the applicable operations and maintenance agreement, and we may be financially motivated to avoid or delay this liability by failing to promptly enforce this right on behalf of the PPA Entity. While we do not believe that we had any conflicts of interest with our PPA Entities as of
December 31, 2019
, conflicts of interest may arise in the future which cannot be foreseen at this time. In the event that prospective future Equity Investors and debt financing partners perceive there to exist any such conflicts, it could harm our ability to procure financing for our PPA Entities in the future, which could have a material adverse effect on our business.
If we are unable to attract and retain key employees and hire qualified management, technical, engineering, and sales personnel, our ability to compete and successfully grow our business could be harmed.
We believe that our success and our ability to reach our strategic objectives are highly dependent on the contributions of our key management, technical, engineering, and sales personnel. The loss of the services of any of our key employees could disrupt our operations, delay the development and introduction of our products and services and negatively impact our business, prospects, and operating results. In particular, we are highly dependent on the services of Dr. Sridhar, our Chairman and President and Chief Executive Officer, and other key employees. None of our key employees is bound by an employment agreement for any specific term. In addition, Randy Furr, our Chief Financial Officer, has announced his intention to retire effective March 31, 2020 and we have identified his successor who is expected to join us on April 1, 2020. We cannot assure you that we will be able to successfully attract and retain senior leadership necessary to grow our business. Furthermore, there is increasing competition for talented individuals in our field, and competition for qualified personnel is especially intense in the San Francisco Bay Area where our principal offices are located. Our failure to attract and retain our executive officers and other key management, technical, engineering, and sales personnel could adversely impact our business, our prospects, our financial condition, and our operating results. In addition, we do not have “key person” life insurance policies covering any of our officers or other key employees.
A breach or failure of our networks or computer or data management systems could damage our operations and our reputation.
Our business is dependent on the security and efficacy of our networks and computer and data management systems. For example, all of our Energy Servers are connected to and controlled and monitored by our centralized remote monitoring service, and we rely on our internal computer networks for many of the systems we use to operate our business generally. Although we take protective measures and endeavor to modify them as circumstances warrant, the security of our infrastructure, including the network that connects our Energy Servers to our remote monitoring service, may be vulnerable to breaches, unauthorized access, misuse, computer viruses, or other malicious code and cyber-attacks that could have a material adverse impact on our business and our Energy Servers in the field. A breach or failure of our networks or computer or data management systems due to intentional actions such as cyber-attacks, negligence, or other reasons could seriously disrupt our operations or could affect our ability to control or to assess the performance in the field of our Energy Servers and could result in disruption to our business and potentially legal liability.
In addition, if certain of our IT systems failed, our production line might be affected,
36
which could impact our business and operating results. These events, in addition to impacting our financial results, could result in significant costs or reputational consequences.
Our headquarters and other facilities are located in an active earthquake zone, and an earthquake or other types of natural disasters or resource shortages, including public safety power shut-offs that have occurred and will continue to occur in California, could disrupt and harm our results of operations
.
We conduct a majority of our operations in the San Francisco Bay area in an active earthquake zone, and certain of our facilities are located within known flood plains. The occurrence of a natural disaster such as an earthquake, drought, flood, fire, localized extended outages of critical utilities (such as California's public safety power shut-offs) or transportation systems, or any critical resource shortages could cause a significant interruption in our business, damage or destroy our facilities, our manufacturing equipment, or our inventory, and cause us to incur significant costs, any of which could harm our business, our financial condition, and our results of operations. The insurance we maintain against fires, earthquakes and other natural disasters may not be adequate to cover our losses in any particular case.
Expanding operations internationally could expose us to additional risks
.
Although we currently primarily operate in the United States, we will seek to expand our business internationally. We currently have operations in Japan, China, India, and the Republic of Korea (collectively, our "Asia Pacific region"). Managing any international expansion will require additional resources and controls including additional manufacturing and assembly facilities. Any expansion internationally could subject our business to risks associated with international operations, including:
|
•
|
conformity with applicable business customs, including translation into foreign languages and associated expenses;
|
|
•
|
lack of availability of government incentives and subsidies;
|
|
•
|
challenges in arranging, and availability of, financing for our customers;
|
|
•
|
potential changes to our established business model;
|
|
•
|
cost of alternative power sources, which could be meaningfully lower outside the United States;
|
|
•
|
availability and cost of natural gas;
|
|
•
|
difficulties in staffing and managing foreign operations in an environment of diverse culture, laws, and customers, and the increased travel, infrastructure, and legal and compliance costs associated with international operations;
|
|
•
|
installation challenges which we have not encountered before which may require the development of a unique model for each country;
|
|
•
|
compliance with multiple, potentially conflicting and changing governmental laws, regulations, and permitting processes including environmental, banking, employment, tax, privacy, and data protection laws and regulations such as the EU Data Privacy Directive;
|
|
•
|
compliance with U.S. and foreign anti-bribery laws including the Foreign Corrupt Practices Act and the U.K. Anti-Bribery Act;
|
|
•
|
difficulties in collecting payments in foreign currencies and associated foreign currency exposure;
|
|
•
|
restrictions on repatriation of earnings;
|
|
•
|
compliance with potentially conflicting and changing laws of taxing jurisdictions where we conduct business and compliance with applicable U.S. tax laws as they relate to international operations, the complexity and adverse consequences of such tax laws, and potentially adverse tax consequences due to changes in such tax laws; and
|
|
•
|
regional economic and political conditions.
|
As a result of these risks, any potential future international expansion efforts that we may undertake may not be successful.
We are an “emerging growth company” and we cannot be certain if the reduced disclosure requirements applicable to emerging growth companies will make our Class A common stock less attractive to investors and may make it more difficult to compare our performance with other public companies.
We are an emerging growth company ("EGC") as defined in the U.S. legislation Jumpstart Our Business Startups Act of 2012 (the "JOBS Act"), and we intend to take advantage of certain exemptions from various reporting requirements that are applicable to other public companies that are not EGC, including not being required to comply with the auditor attestation
37
requirements of Section 404 of the Sarbanes-Oxley Act, reduced disclosure obligations regarding executive compensation in our periodic reports and proxy statements, and exemptions from the requirements of holding a nonbinding advisory vote on executive compensation and stockholder approval of any golden parachute payments not previously approved. We may take advantage of these exemptions for so long as we are an EGC, which could be until December 31, 2023, the last day of the fiscal year following the fifth anniversary of our IPO. We cannot predict if investors will find our Class A common stock less attractive because we rely on these exemptions. If some investors find our Class A common stock less attractive as a result, there may be a less active trading market for our Class A common stock, and our stock price may be more volatile.
An EGC may elect to provide financial statements in conformance with the U.S. GAAP requirement for transition periods to comply with new or revised accounting standards. With our not making this election, Section 102(b)(2) of the JOBS Act allows us to delay our adoption of new or revised accounting standards until those standards apply to private companies. As a result, our financial statements may not be comparable to companies that comply with public company revised accounting standards effective dates.
Risks Relating to Ownership of Our Common Stock
The stock price of our Class A common stock has been and may continue to be volatile.
The market price of our Class A common stock has been and may continue to be volatile. In addition to factors discussed in this Risk Factors section, the market price of our Class A common stock may fluctuate significantly in response to numerous factors, many of which are beyond our control, including:
|
•
|
overall performance of the equity markets;
|
|
•
|
actual or anticipated fluctuations in our revenue and other operating results;
|
|
•
|
changes in the financial projections we may provide to the public or our failure to meet these projections;
|
|
•
|
failure of securities analysts to initiate or maintain coverage of us, changes in financial estimates by any securities analysts who follow our Company or our failure to meet these estimates or the expectations of investors;
|
|
•
|
the issuance of reports from short sellers that may negatively impact the trading price of our Class A common stock;
|
|
•
|
recruitment or departure of key personnel;
|
|
•
|
the economy as a whole and market conditions in our industry;
|
|
•
|
new laws, regulations, subsidies, or credits or new interpretations of them applicable to our business;
|
|
•
|
negative publicity related to problems in our manufacturing or the real or perceived quality of our products;
|
|
•
|
rumors and market speculation involving us or other companies in our industry;
|
|
•
|
announcements by us or our competitors of significant technical innovations, acquisitions, strategic partnerships, or capital commitments;
|
|
•
|
lawsuits threatened or filed against us;
|
|
•
|
other events or factors including those resulting from war, incidents of terrorism or responses to these events;
|
|
•
|
the expiration of contractual lock-up or market standoff agreements; and
|
|
•
|
sales or anticipated sales of shares of our Class A common stock by us or our stockholders.
|
In addition, the stock markets have experienced extreme price and volume fluctuations that have affected and continue to affect the market prices of equity securities of many companies. Stock prices of many companies have fluctuated in a manner unrelated or disproportionate to the operating performance of those companies. In the past, stockholders have instituted securities class action litigation following periods of market volatility. We are currently involved in securities litigation which may subject us to substantial costs, divert resources and the attention of management from our business, and adversely affect our business.
Sales of substantial amounts of our Class A common stock in the public markets, or the perception that they might occur, could cause the market price of our Class A common stock to decline.
The market price of our Class A common stock could decline as a result of sales of a large number of shares of our Class A common stock in the public market as and when our Class B common stock converts to Class A common stock. The perception that these sales might occur may also cause the market price of our common stock to decline. We had a total of
84,549,511
shares of our Class A common stock and
36,486,778
shares of our Class B common stock outstanding as of
38
December 31, 2019
. The lock up for our Class B shares expired on January 21, 2019 and these shares are now freely tradeable once converted into Class A shares, except for any shares purchased by our “affiliates” as defined in Rule 144 under the Securities Act of 1933, as amended ("Securities Act").
Further, as of
December 31, 2019
, we had an aggregate of
$289.3 million
in convertible debt, our 6% Notes, under which the outstanding principal and interest may be converted, at the option of the holders, into an aggregate of
25,715,496
shares of Class B common stock. Upon conversion into Class A common stock, these shares are freely tradeable, except to the extent these shares are held by our “affiliates” as defined in Rule 144 under the Securities Act.
In addition, as of
December 31, 2019
, we had options and RSUs outstanding that, if fully exercised or settled, would result in the issuance of
9,454,578
shares of Class A common stock and
18,495,004
shares of Class B common stock. We have filed a registration statement on Form S-8 to register shares reserved for future issuance under our equity compensation plans. Subject to the satisfaction of applicable vesting requirements, the shares issued upon exercise of outstanding stock options or settlement of outstanding RSUs will be available for immediate resale in the United States in the open market.
Moreover, certain holders of our common stock have rights, subject to some conditions, to require us to file registration statements for the public resale of such shares or to include such shares in registration statements that we may file for us or other stockholders.
The dual class structure of our common stock and the voting agreements among certain stockholders have the effect of concentrating voting control of our Company with KR Sridhar, our Chairman and Chief Executive Officer, and also with those stockholders who held our capital stock prior to the completion of our IPO including our directors, executive officers and significant stockholders, which limits or precludes your ability to influence corporate matters including the election of directors and the approval of any change of control transaction, and may adversely affect the trading price of our Class A common stock.
Our Class B common stock has ten votes per share, and our Class A common stock has one vote per share. As of
December 31, 2019
, and after giving effect to the voting agreements between KR Sridhar, our Chairman and Chief Executive Officer, and certain holders of Class B common stock, our directors, executive officers, significant stockholders of our common stock, and their respective affiliates collectively held a substantial majority of the voting power of our capital stock. Because of the ten-to-one voting ratio between our Class B and Class A common stock, the holders of our Class B common stock collectively will continue to control a majority of the combined voting power of our common stock and therefore are able to control all matters submitted to our stockholders for approval until the earliest to occur of (i) immediately prior to the close of business on July 27, 2023, (ii) immediately prior to the close of business on the date on which the outstanding shares of Class B common stock represent less than five percent (5%) of the aggregate number of shares of Class A common stock and Class B common stock then outstanding, (iii) the date and time or the occurrence of an event specified in a written conversion election delivered by KR Sridhar to our Secretary or Chairman of the Board to so convert all shares of Class B common stock, or (iv) immediately following the date of the death of KR Sridhar. This concentrated control limits or precludes Class A stockholders’ ability to influence corporate matters while the dual class structure remains in effect, including the election of directors, amendments of our organizational documents, and any merger, consolidation, sale of all or substantially all of our assets, or other major corporate transaction requiring stockholder approval. In addition, this may prevent or discourage unsolicited acquisition proposals or offers for our capital stock that Class A stockholders may feel are in their best interest as one of our stockholders.
Future transfers by holders of Class B common stock will generally result in those shares converting to Class A common stock, subject to limited exceptions such as certain transfers effected for estate planning purposes. The conversion of Class B common stock to Class A common stock will have the effect, over time, of increasing the relative voting power of those remaining holders of Class B common stock who retain their shares in the long-term.
The conversion of the 6% Convertible Promissory Note could result in a significant stockholder with substantial voting control.
The holders of the 6% Convertible Promissory Notes have the option to convert the outstanding principal and interest under the 6% Convertible Promissory Note to Class B common stock at a conversion price of
$11.25
per share at any time after the IPO and prior to maturity of the 6% Convertible Promissory Note in December 2020. As of
December 31, 2019
, an aggregate of
21,321,100
shares of Class B common stock is issuable to the Canada Pension Plan Investment Board (“CPPIB”) upon the conversion of the outstanding principal and interest under the 6% Convertible Promissory Note. This, along with
312,575
shares of Class B common stock which CPPIB acquired from the exercise of a warrant at IPO, would result, as of December 31, 2019, in CPPIB having approximately
32.50%
of the total voting power with respect to all shares of our Class A common stock (which has one vote per share) and Class B common stock (which has ten votes per share), voting as a single
39
class, and would provide CPPIB significant influence over matters presented to the stockholders for approval and may result in voting decisions by CPPIB that are not in the best interests of our stockholders generally.
The dual class structure of our common stock may adversely affect the trading market for our Class A common stock.
S&P Dow Jones and FTSE Russell have implemented changes to their eligibility criteria for inclusion of shares of public companies on certain indices, including the S&P 500, namely, to exclude companies with multiple classes of shares of common stock from being added to such indices. In addition, several shareholder advisory firms have announced their opposition to the use of multiple class structures. As a result, the dual class structure of our common stock may prevent the inclusion of our Class A common stock in such indices and may cause shareholder advisory firms to publish negative commentary about our corporate governance practices or otherwise seek to cause us to change our capital structure. Any such exclusion from indices could result in a less active trading market for our Class A common stock. Any actions or publications by shareholder advisory firms critical of our corporate governance practices or capital structure could also adversely affect the value of our Class A common stock.
If securities or industry analysts do not publish research or publish inaccurate or unfavorable research about our business, the market price of our Class A common stock and trading volume could decline.
The market price for our Class A common stock depends in part on the research and reports that securities or industry analysts publish about us or our business. If industry analysts cease coverage of us, the trading price for our Class A common stock would be negatively affected. In addition, if one or more of the analysts who cover us downgrade our Class A common stock or publish inaccurate or unfavorable research about our business, our Class A common stock price would likely decline. If one or more of these analysts cease coverage of us or fail to publish reports on us regularly, demand for our Class A common stock could decrease, which might cause our Class A common stock price and trading volume to decline. In addition, certain short sellers of our Class A common stock have published reports that we believe have negatively impacted the trading price of our Class A common stock.
We do not intend to pay dividends for the foreseeable future.
We have never declared or paid any cash dividends on our capital stock and do not intend to pay any cash dividends in the foreseeable future. We anticipate that we will retain all of our future earnings for use in the development of our business and for general corporate purposes. Any determination to pay dividends in the future will be at the discretion of our board of directors. Accordingly, investors must rely on sales of their Class A common stock after price appreciation, which may never occur, as the only way to realize any future gains on their investments.
Provisions in our charter documents and under Delaware law could make an acquisition of our Company more difficult, may limit attempts by our stockholders to replace or remove our current management, may limit our stockholders’ ability to obtain a favorable judicial forum for disputes with us or our directors, officers, or employees, and may limit the market price of our Class A common stock.
Provisions in our restated certificate of incorporation and amended and restated bylaws may have the effect of delaying or preventing a change of control or changes in our management. Our restated certificate of incorporation and amended and restated bylaws include provisions that:
|
•
|
require that our board of directors is classified into three classes of directors with staggered three year terms;
|
|
•
|
permit the board of directors to establish the number of directors and fill any vacancies and newly created directorships;
|
|
•
|
require super-majority voting to amend some provisions in our restated certificate of incorporation and amended and restated bylaws;
|
|
•
|
authorize the issuance of “blank check” preferred stock that our board of directors could use to implement a stockholder rights plan;
|
|
•
|
only the chairman of our board of directors, our chief executive officer, or a majority of our board of directors are authorized to call a special meeting of stockholders;
|
|
•
|
prohibit stockholder action by written consent, which thereby requires all stockholder actions be taken at a meeting of our stockholders;
|
|
•
|
establish a dual class common stock structure in which holders of our Class B common stock may have the ability to control the outcome of matters requiring stockholder approval even if they own significantly less than a majority of the outstanding shares of our common stock, including the election of directors and significant corporate transactions such
|
40
as a merger or other sale of our Company or substantially all of our assets;
|
•
|
expressly authorize the board of directors to make, alter, or repeal our bylaws; and
|
|
•
|
establish advance notice requirements for nominations for election to our board of directors or for proposing matters that can be acted upon by stockholders at annual stockholder meetings.
|
In addition, our restated certificate of incorporation and our amended and restated bylaws provide that the Court of Chancery of the State of Delaware will be the exclusive forum for: any derivative action or proceeding brought on our behalf; any action asserting a breach of fiduciary duty; any action asserting a claim against us arising pursuant to the Delaware General Corporation Law, our restated certificate of incorporation or our amended and restated bylaws; or any action asserting a claim against us that is governed by the internal affairs doctrine. Our restated certificate of incorporation and our amended and restated bylaws provide that unless we consent in writing to the selection of an alternative forum, the federal district courts of the United States of America shall be the exclusive forum for the resolution of any complaint asserting a cause of action arising under the Securities Act. These choice of forum provisions may limit a stockholder’s ability to bring a claim in a judicial forum that it finds favorable for disputes with us or any of our directors, officers, or other employees, which thereby may discourage lawsuits with respect to such claims. Alternatively, if a court were to find the choice of forum provision contained in our restated certificate of incorporation and our amended and restated bylaws to be inapplicable or unenforceable in an action, we may incur additional costs associated with resolving such action in other jurisdictions, which could harm our business, our operating results, and our financial condition.
Moreover, Section 203 of the Delaware General Corporation Law may discourage, delay, or prevent a change in control of our Company. Section 203 imposes certain restrictions on mergers, business combinations, and other transactions between us and holders of 15% or more of our common stock.
41
ITEM 1B - UNRESOLVED STAFF COMMENTS
None.
ITEM 2 - PROPERTIES
The table below presents details for each of our principal properties
3
:
|
Facility
|
Location
|
Approximate Square Footage
|
Held
|
Lease Term
|
|
|
Corporate headquarters
1
|
San Jose, CA
|
181,000
|
|
Leased
|
2028
|
|
Manufacturing
|
Sunnyvale, CA
|
192.975
|
|
Leased
|
2020
|
|
Manufacturing
|
Mountain View, CA
|
88,290
|
|
Leased
|
*
|
|
Manufacturing
|
Newark, DE
|
148,809
|
|
Leased
|
**
|
|
Manufacturing
2
|
Newark, DE
|
75,609
|
|
Owned
|
n/a
|
*
Month to month arrangement.
**
Lease terms expire over the period December 2021 through December 2026.
1
Our corporate headquarters is used for administration, research and development, and sales and marketing.
2
Our first purpose-built Bloom Energy manufacturing center for the fuel cells and Energy Servers assembly, and was designed specifically for copy-exact duplication as we expand, which we believe will help us scale more efficiently.
3
We lease additional office space as field offices in the United States and office and manufacturing space around the world including in India, the Republic of Korea, China and Taiwan.
We believe our office space and our manufacturing facilities are adequate to support our business for at least the next twelve months.
ITEM 3 - LEGAL PROCEEDINGS
For a discussion of legal proceedings, see "Legal Matters" under Note 14 -
Commitments and Contingencies
, in the notes to our consolidated financial statements.
We are, and from time to time we may become, involved in legal proceedings or be subject to claims arising in the ordinary course of our business. We are not presently a party to any other legal proceedings that in the opinion of our management and if determined adversely to us, would individually or taken together have a material adverse effect on our business, operating results, financial condition or cash flows.
ITEM 4 - MINE SAFETY DISCLOSURES
Not applicable.
42
Part II
ITEM 5 - MARKET FOR REGISTRANT'S COMMON EQUITY, RELATED STOCKHOLDER MATTERS AND ISSUER PURCHASE OF EQUITY SECURITIES
Our Class A common stock is listed on The New York Stock Exchange ("NYSE") under the symbol “BE”. There is no public trading market for our Class B common stock. On
March 16, 2020
, there were
637
registered holders of record of our Class A common stock and
363
registered holders of record of our Class B common stock, and the closing price of our Class A common stock was
$5.31
per share as reported on the NYSE.
We have not declared or paid any cash dividends on our capital stock and do not intend to pay any cash dividends in the foreseeable future.
For information about our stock-based compensation plans, see Note 12 -
Stock-Based Compensation and Employee Benefit Plans
of the financial statements contained in this
Annual Report on Form 10-K
.
ITEM 6 - SELECTED CONSOLIDATED FINANCIAL DATA
We derived the selected consolidated statements of operations data for
2019
,
2018
and
2017
and the selected consolidated balance sheet data as of
December 31, 2019
and
2018
from our audited consolidated financial statements included in this
Annual Report on Form 10-K
. Our historical results are not necessarily indicative of the results that may be expected in the future. You should read this data together with Item 7 -
Management's Discussion and Analysis of Financial Condition and Results of Operations
and Item 8 -
Financial Statements
and Supplementary Data included in this
Annual Report on Form 10-K
. The selected consolidated financial data in this section are not intended to replace the consolidated financial statements and are qualified in their entirety by the consolidated financial statements and related notes included in this
Annual Report on Form 10-K
.
The Selected Consolidated Financial Statements Data as of and for the year ended December 31, 2018 have been restated, and as of and for the years ended December 31, 2017 and 2016 have been revised for the correction of misstatements described in Note 2,
Restatement and Revision of Previously Issued Consolidated Financial Statements
in Item 8,
Financial Statements and Supplementary Data
. This information should be read in conjunction with the “
Explanatory Note
” immediately preceding Item 1 of this Annual Report on Form 10-K, and with Item 7,
Management's Discussion and Analysis of Financial Condition and Results of Operations.
Selected data from our consolidated statements of operations
1
for the years ended
December 31, 2019
,
2018
,
2017
and
2016
are as follows:
|
|
Years Ended December 31,
|
|||||||||||||||
|
|
2019
1
|
2018
|
2017
|
2016
|
||||||||||||
|
As Restated
2
|
As Revised
2
|
|||||||||||||||
|
|
(in thousands, except per share amounts)
|
|||||||||||||||
|
Total revenue
|
$
|
785,177
|
|
$
|
632,648
|
|
$
|
365,623
|
|
$
|
206,391
|
|
||||
|
Total cost of revenue
|
687,590
|
|
526,898
|
|
381,934
|
|
309,025
|
|
||||||||
|
Gross profit (loss)
|
97,587
|
|
105,750
|
|
(16,311
|
)
|
(102,634
|
)
|
||||||||
|
Operating expenses:
|
||||||||||||||||
|
Research and development
|
104,168
|
|
89,135
|
|
51,146
|
|
46,849
|
|
||||||||
|
Sales and marketing
|
73,573
|
|
62,807
|
|
31,926
|
|
28,547
|
|
||||||||
|
General and administrative
|
152,650
|
|
118,817
|
|
55,689
|
|
61,544
|
|
||||||||
|
Total operating expenses
|
330,391
|
|
270,759
|
|
138,761
|
|
136,940
|
|
||||||||
|
Loss from operations
|
$
|
(232,804
|
)
|
$
|
(165,009
|
)
|
$
|
(155,072
|
)
|
$
|
(239,574
|
)
|
||||
|
|
|
|
|
|
|
|
||||||||||
|
Net loss attributable to Class A and Class B common stockholders
|
$
|
(304,414
|
)
|
$
|
(273,540
|
)
|
$
|
(276,362
|
)
|
$
|
(285,843
|
)
|
||||
|
less: deemed dividend to noncontrolling interest
|
(2,454
|
)
|
—
|
|
—
|
|
—
|
|
||||||||
|
Net loss available to Class A and Class B common stockholders
|
$
|
(306,868
|
)
|
$
|
(273,540
|
)
|
$
|
(276,362
|
)
|
$
|
(285,843
|
)
|
||||
|
Net loss per share available to Class A and Class B common stockholders, basic and diluted
|
$
|
(2.67
|
)
|
$
|
(5.14
|
)
|
$
|
(26.97
|
)
|
$
|
(28.45
|
)
|
||||
43
1
We adopted ASC 606 in the year ended December 31, 2019 using the modified retrospective method. As a policy election, Topic ASC 606 was applied only to contracts that were not substantially completed as of the date of adoption. We recognized the cumulative effect of initially applying ASC 606 as an adjustment to the January 1, 2019 opening balance of accumulated deficit. The prior period consolidated financial statements have not been retrospectively adjusted and continue to be reported under the accounting standards in effect for those periods. See Note 1,
Nature of Business, Liquidity, Basis of Presentation and Summary of Significant Accounting Policies,
in Item 8,
Financial Statements and Supplementary Data
, for additional information.
2
We have restated previously disclosed consolidated financial data for the year ended December 31, 2018 and have revised previously disclosed consolidated financial data for the years ended December 31, 2017 and 2016 to correct misstatements principally related to managed services contracts with customers contracts and related arrangements, as well as other misstatements. See Note 2,
Restatement and Revision of Previously Issued Consolidated Financial Statements
, in Item 8,
Financial Statements and Supplementary Data
, for additional information.
Selected data from our consolidated balance sheets
1
as of
December 31, 2019
,
2018
,
2017
and
2016
are as follows:
|
|
December 31,
|
|||||||||||||||
|
|
2019
1
|
2018
|
2017
|
2016
|
||||||||||||
|
As Restated
2
|
As Revised
2
|
|||||||||||||||
|
|
(in thousands)
|
|||||||||||||||
|
Cash and cash equivalents
|
$
|
202,823
|
|
$
|
220,728
|
|
$
|
103,828
|
|
$
|
156,577
|
|
||||
|
Working capital (deficit)
|
(101,256
|
)
|
406,632
|
|
143,240
|
|
111,824
|
|
||||||||
|
Total assets
|
1,322,591
|
|
1,521,794
|
|
1,248,813
|
|
1,214,336
|
|
||||||||
|
Long-term portion of debt
|
299,229
|
|
711,433
|
|
921,205
|
|
773,346
|
|
||||||||
|
Total liabilities
|
1,490,451
|
|
1,482,033
|
|
1,769,367
|
|
1,479,602
|
|
||||||||
|
Convertible redeemable preferred stock
3
|
—
|
|
—
|
|
1,465,841
|
|
1,465,841
|
|
||||||||
|
Redeemable noncontrolling interest and noncontrolling interest
|
91,734
|
|
182,371
|
|
213,526
|
|
234,988
|
|
||||||||
|
Stockholders’ deficit
|
(259,594
|
)
|
(142,610
|
)
|
(2,199,921
|
)
|
(1,966,095
|
)
|
||||||||
1
We adopted ASC 606 in the year ended December 31, 2019 using the modified retrospective method. As a policy election, Topic ASC 606 was applied only to contracts that were not substantially completed as of the date of adoption. We recognized the cumulative effect of initially applying ASC 606 as an adjustment to the January 1, 2019 opening balance of accumulated deficit. The prior period consolidated financial statements have not been retrospectively adjusted and continue to be reported under the accounting standards in effect for those periods. See Note 1,
Nature of Business, Liquidity, Basis of Presentation and Summary of Significant Accounting Policies,
in Item 8,
Financial Statements and Supplementary Data
, for additional information.
2
We have restated previously disclosed consolidated financial data as of December 31, 2018 and have revised previously disclosed consolidated financial data as of December 31, 2017 and 2016 to correct misstatements principally related to managed services contracts with customers contracts and related arrangements, as well as other misstatements. See Note 2,
Restatement and Revision of Previously Issued Consolidated Financial Statements
, in Item 8,
Financial Statements and Supplementary Data
, for additional information.
3
All convertible redeemable preferred stock was converted into Class B common stock at the time of our IPO.
Selected Key Operating Metrics
Please see “Key Operating Metrics” included in Item 7 -
Management's Discussion and Analysis of Financial Condition and Results of Operations
for information regarding how we define our product accepted during the period, billings for product accepted in the period, billings for installation on product accepted in the period, billings for annual maintenance services agreements, product costs of product accepted, period costs of manufacturing related expenses not included in product costs and installation costs on product accepted in the period.
|
|
Years Ended
December 31, |
|||||||||||
|
|
2019
|
2018
|
2017
|
2016
|
||||||||
|
(in 100 kilowatt systems)
|
||||||||||||
|
Product accepted during the period
|
1,194
|
|
809
|
|
622
|
|
687
|
|
||||
44
|
|
Three Months Ended
|
|||||||||||||||||||||||||||||||
|
|
Dec. 31,
2019 |
Sept. 30,
2019 |
Jun. 30,
2019 |
Mar. 31,
2019 |
Dec. 31,
2018
|
Sept. 30,
2018 |
Jun. 30,
2018 |
Mar. 31,
2018 |
||||||||||||||||||||||||
|
(in thousands)
|
||||||||||||||||||||||||||||||||
|
Product costs of product accepted in the period (per kilowatt)
|
$
|
2,592
|
|
$
|
2,850
|
|
$
|
3,045
|
|
$
|
3,206
|
|
$
|
2,995
|
|
$
|
3,351
|
|
$
|
3,485
|
|
$
|
3,855
|
|
||||||||
|
Period costs of manufacturing related expenses not included in product costs
|
4,762
|
|
1,969
|
|
3,321
|
|
6,937
|
|
4,191
|
|
6,300
|
|
3,018
|
|
10,785
|
|
||||||||||||||||
|
Installation costs on product accepted in the period (per kilowatt)
|
568
|
|
733
|
|
627
|
|
676
|
|
653
|
|
1,713
|
|
1,967
|
|
526
|
|
||||||||||||||||
ITEM 7 - MANAGEMENT'S DISCUSSION AND ANALYSIS OF FINANCIAL CONDITION AND RESULTS OF
OPERATIONS
You should read the following discussion of our financial condition and results of operations in conjunction with the consolidated financial statements and the notes thereto included elsewhere in this
Annual Report on Form 10-K
. Some of the information contained in this discussion and analysis or set forth elsewhere in this
Annual Report on Form 10-K
, including information with respect to our plans and strategy for our business, includes forward-looking statements that involve risks and uncertainties as described under the heading Special Note Regarding Forward-Looking Statements following the
Table of Contents
of this
Annual Report on Form 10-K
. You should review the disclosure under Item 1A -
Risk Factors
in this
Annual Report on Form 10-K
for a discussion of important factors that could cause actual results to differ materially from the results described in or implied by the forward-looking statements contained in the following discussion and analysis.
Overview
The following discussion should be read in conjunction with the other sections of this Annual Report on Form 10-K, including the consolidated financial statements and related notes contained in Item 8
Financial Statements and Supplementary Data
.
Restatement and Revision of Previously Issued Consolidated Financial Statements
In this Annual Report on Form 10-K, we have restated our previously issued consolidated financial statements as of and for the year ended December 31, 2018 and revised our previously issued consolidated financial statements as of and for the year ended December 31, 2017. Refer to the “Explanatory Note” preceding Item 1,
Business
for background on the restatement and revision, the fiscal periods impacted, control considerations, and other information. As a result, we have also restated certain previously reported financial information as of and for the year ended December 31, 2018 and revised certain previously reported financial information as of and for the year ended December 31, 2017 in this Item 7,
Management’s Discussion and Analysis of Financial Condition and Results of Operations
, including but not limited to information within the Results of Operations and Liquidity and Capital Resources sections to conform the discussion with the appropriate restated and/or revised amounts. See Note 2,
Restatement and Revision of Previously Issued Consolidated Financial Statements
, in Item 8
Financial Statements and Supplementary Data
, for additional information related to the restatement and revision, including descriptions of the misstatements and the impacts on our consolidated financial statements.
Description of Bloom Energy
Our solution, the Bloom Energy Server, is a stationary power generation platform built for the digital age and capable of delivering highly reliable, uninterrupted, 24x7 constant power that is also clean and sustainable. The Bloom Energy Server converts standard low-pressure natural gas, biogas or hydrogen into electricity through an electrochemical process without combustion, resulting in very high conversion efficiencies and lower harmful emissions than conventional fossil fuel generation. A typical configuration produces 250 kilowatts of power in a footprint roughly equivalent to that of half of a standard thirty-foot shipping container, or approximately 125 times more space-efficient than solar power generation. 250 kilowatts of power is roughly equivalent to the constant power requirement of a typical big box retail store. Any number of our Energy Server systems can be clustered together in various configurations to form solutions from hundreds of kilowatts to many tens of megawatts. We currently primarily target commercial and industrial customers.
We market and sell our Energy Servers primarily through our direct sales organization in the United States, and also have direct and indirect sales channels internationally. Recognizing that deploying our solutions requires a material financial commitment, we have developed a number of financing options to support sales of our Energy Servers to customers who lack
45
the financial capability to purchase our Energy Servers directly, who prefer to finance the acquisition using third party financing or who prefer to contract for our services on a pay-as-you-go model.
Our typical target commercial or industrial customer has historically been either an investment-grade entity or a customer with investment-grade attributes such as size, assets and revenue, liquidity, geographically diverse operations and general financial stability. We have recently expanded our product and financing options to the below-investment-grade customers and have also expanded internationally to target customers with deployments on a wholesale grid. Given that our customers are typically large institutions with multi-level decision making processes, we generally experience a lengthy sales process.
Purchase and Lease Options
Initially, we only offered our Energy Servers on a direct purchase basis, in which the customer purchases the product directly from us. In order to expand our offerings to customers who lack the financial capability to purchase our Energy Servers directly (including customers who are unable to monetize the tax credits available to purchasers of our Energy Servers) and/or who prefer to lease the product or contract for our services on a pay-as-you-go model, we subsequently developed the traditional lease ("Traditional Lease"), Managed Services, and power purchase agreement programs ("PPA Programs").
Our capacity to offer our Energy Servers through any of these financed arrangements depends in large part on the ability of the financing party or parties involved to monetize the related investment tax credits, accelerated tax depreciation and other incentives. Interest rate fluctuations may also impact the attractiveness of any financing offerings for our customers, and currency exchange fluctuations may also impact the attractiveness of international offerings. The Traditional Lease, Managed Services and PPA Program options are limited by the creditworthiness of the customer. Additionally, the Managed Services and Traditional Lease options, as with all leases, are also limited by the customer’s willingness to commit to making fixed payments regardless of the performance of the Energy Servers or our performance of our obligations under the customer agreement.
In each of our purchase options, we typically perform the functions of a project developer, including identifying end customers and financiers, leading the negotiations of the customer agreements and financing agreements, securing all necessary permitting and interconnections approvals, and overseeing the design and construction of the project up to and including commissioning the Energy Servers.
Under each purchase option, we provide warranties and performance guaranties for the Energy Servers’ efficiency and output. We refer to a “warranty” as a commitment where the failure of the Energy Servers to satisfy the stated performance level obligates us to repair or replace the Energy Servers as necessary to improve performance. If we fail to complete such repair or replacement, or if repair or replacement is impossible, we may be obligated to repurchase the Energy Servers from the customer or financier. We refer to a “guaranty” as a commitment where the failure of the Energy Servers to satisfy the stated performance level obligates us to make a payment to compensate the beneficiary of such guaranty for the resulting increased cost or diminution in benefits resulting from such failure. Our obligation to make payments under the guaranty is always contractually capped and represents a contingency linked to our services obligation with no economic incentive for us to default and force an exercise of the payment obligation.
Under direct purchase and Traditional Lease, the warranties and guaranties are typically included in the price of our Energy Server for the first year. The warranties and guaranties may be renewed annually at the customer’s option, as an operations and maintenance services agreement, at predetermined prices for a period of up to 30 years. Historically, our customers and financiers have almost always exercised their option to renew the warranties and guaranties under these operations and maintenance services agreements.
Under the Managed Services Program, the warranties and guaranties are included for the fixed period specified in the customer agreement. This period is typically 10 years, which may be extended at the option of the parties for additional years.
Under the PPA Programs, we typically provide warranties and guaranties regarding our Energy Servers’ efficiency to the customer (i.e., the end user of the electricity generated by our Energy Servers, who is also responsible for the purchase of the fuel required for our Energy Servers’ operations), and we provide warranties and guaranties regarding our Energy Servers’ output to the financier(s) that purchases our Energy Servers. The warranties and guaranties are typically included in the price of our Energy Server for the first year and may be renewed annually at the financier’s option, as an operations and maintenance services agreement, at predetermined prices for a period of up to 30 years. Historically, our financiers have almost always exercised their option to renew the warranties and guaranties under these operations and maintenance services agreements. We also provide a fixed schedule of prices for each year of the term of our agreements with our Customers and none of our Customers have failed to renew our operations and maintenance agreements.
46
The substantial majority of bookings made in recent periods are pursuant to the PPA and the Managed Services Programs.
Each of our financing structures is described in further detail below.
Traditional Lease
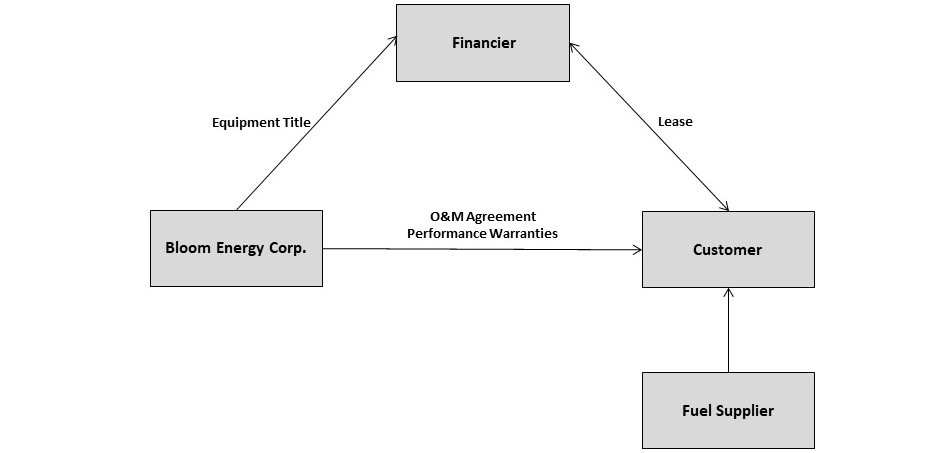
Under the Traditional Lease arrangement, the customer enters into a lease directly with a financier, which pays us for our Energy Servers purchased pursuant to a sales agreement (see the description of the Financing Agreement below). We recognize product and installation revenue upon acceptance. After the standard
one-year warranty
period, our customers have almost always exercised the option to enter into operations and maintenance services agreements with us, under which we receive annual service payments from the customer. The price for the annual operations and maintenance services is set at the time we enter into the Financing Agreement. The term of a lease in a Traditional Lease ranges from 5 to 8 years.
Under a Financing Agreement, we are generally paid the full price of our Energy Servers as if sold as a purchase by the customer based on four milestones. The four payment milestones are typically as follows: (i) 15% upon execution of the financier's entry into the lease with a customer, (ii) 25% on the day that is 180 days prior to delivery of the Energy Servers, (iii) 40% upon shipment of the Energy Servers, and (iv) 20% upon acceptance of the Energy Servers. The financier receives title to the Energy Servers upon installation at the customer site and the financier has risk of loss while our Energy Server is in operation on the customer’s site.
The Financing Agreement provides for the installation of our Energy Servers and includes a standard
one-year warranty
, to the financier, which includes the performance guaranties described below, with the warranty offered on an annually renewing basis at the discretion of, and to, the customer. The customer must provide fuel for the Bloom Energy Servers to operate.
Our direct lease deployments typically provide for warranties and guaranties of both the efficiency and output of our Energy Servers, all of which are written in favor of the customer and contained in the operations and maintenance services agreement. These warranties and guaranties may be measured on a monthly, annual, cumulative or other basis. As of December 31, 2019, we had incurred no liabilities due to failure to repair or replace our Energy Servers pursuant to these warranties. Our obligation to make payments for underperformance against the performance guaranties for Traditional Lease projects was capped contractually under the sales agreements between us and each customer at an aggregate total of approximately
$6.0 million
(including payments both for low output and for low efficiency), and, our aggregate remaining potential liability under this cap was approximately
$4.8 million
.
Remarketing at Termination of Lease
In the event the customer does not renew or purchase our Energy Servers to the end of any customer lease, we may remarket any such Energy Servers to a third party. Any proceeds of such sale would be allocated between us and the applicable financing partner as agreed between them at the time of such sale.
47
Managed Services Financing

In a Managed Services financing, we enter into a Managed Services Agreement with a customer, pursuant to which the customer is able to use the Energy Server for a certain term. Under the Managed Services Agreement, the customer makes a monthly payment for the use of the Energy Server. The customer payment typically has two components: (1) a fixed monthly capacity-based payment and (2) a performance-based payment based on the output of electricity that month from the Energy Server. The fixed capacity-based payments made by the customer under the Managed Services Agreement are applied toward our obligation to pay down our liability under the master lease with the financier. The performance payment is transferred to us as compensation for operations and maintenance services and recorded as services revenue within the consolidated statements of operations. In some cases, the customer’s monthly payment consists solely of the first component, a fixed monthly capacity-based payment.
Once a financier is identified and the Energy Server’s installation is complete, we sell the Energy Server contemplated by the Managed Services Agreement directly to a financier and the financier, as lessor, leases it back to us, as lessee, pursuant to a master lease in a sale-leaseback transaction. The proceeds from the sale are recorded as a financing obligation within the consolidated balance sheets. Any ongoing operations and maintenance service payments are scheduled in the Managed Services Agreement in the form of the performance-based payment described above. The financier typically pays the financing proceeds for the Energy Server contemplated by the Managed Services Agreement on or shortly after acceptance.
The fixed capacity payments made by the customer under the Managed Services Agreement are recognized as electricity revenue when billed and applied toward our obligation to pay the financing obligation under the master lease. Our Managed Services financings have historically shifted customer credit risk to the financier, as lessor, by providing in the master lease agreement that we have no liability for payment of rent except in certain enumerated circumstances, including in the event we are in breach of the Managed Services Agreement between us and the customer.
The duration of the master lease in a Managed Services financing is typically 10 years. The term of the master lease is typically the same as the term of the related Managed Services Agreement, but in some cases the term of the master lease is shorter than that of the Managed Services Agreement.
Our Managed Services deployments typically provide only for warranties of both the efficiency and output of the Energy Server(s), all of which are written in favor of the customer and contained in the operations and maintenance services agreement. These warranties may be measured on a monthly, annual, cumulative or other basis. Managed Services projects typically do not include guaranties above the warranty commitments, but in projects where the customer agreement includes a service payment for our operations and maintenance, that payment is typically proportionate to the output generated by the Energy Server(s) and our pricing assumes service revenues at the 95% output level. This means that our service revenues may be lower than expected if output is less than 95% and higher if output exceeds 95%. As of December 31, 2019, we had
48
incurred no liabilities due to failure to repair or replace our Energy Servers pursuant to these warranties and the fleet of our Energy Servers deployed pursuant to the Managed Services Program was performing at a lifetime average output of approximately
88%
.
Power Purchase Agreement Programs
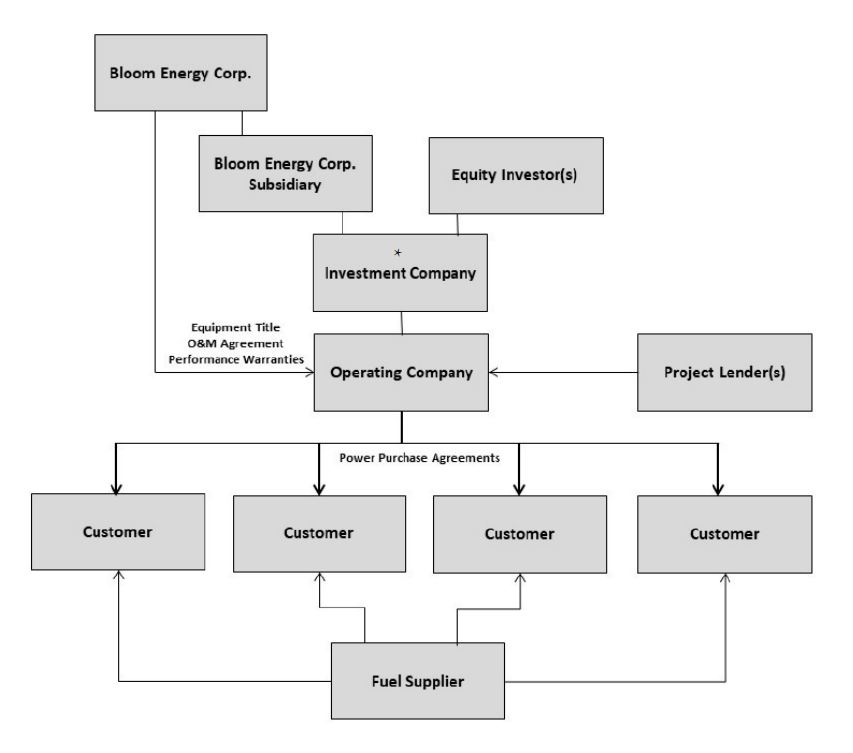
*Under the Third Party PPA arrangements, there is no link with an investment company, as we do not have an equity investment in these arrangements.
In each Power Purchase Agreement, we sell our Energy Servers to an Operating Company which sells the electricity generated by the Energy Servers to the ultimate end customers pursuant to a Power Purchase Agreement, energy services agreement, or similar contract. Because the end customer's payment is stated on a dollar-per-kilowatt-hour ("$/kWh") basis, we refer to these agreements as Power Purchase Agreements ("PPAs"). Currently, our offerings for PPA Programs primarily include our Third-Party PPA Programs pursuant to which we recognize revenue on acceptance. Through 2017, as part of our PPA Programs, we had also offered the Bloom Electrons Program which included an equity investment by us in the Operating Company and in which we recognized revenue as the electricity was produced. For further discussion on our Bloom Electrons Programs, see Note 13 of our Notes to Consolidated Financial Statements.
In our Power Purchase Agreement Program, we enter into an Energy Server sales, operations and maintenance agreement ("EPC and O&M Agreement") with the Operating Company that will own the Energy Servers. The Operating Company then enters into the PPA with the end customer which purchases electricity generated by the Energy Servers. The Operating Company receives all cash flows generated under the PPA(s), in addition to all investment tax credits, all accelerated tax depreciation benefits, and any other cash flows generated by the operation of the Energy Servers not allocated to the end customer under the PPA.
The sales of our Energy Servers to the Operating Company in connection with the various Power Purchase Agreement Programs have many of the same terms and conditions as a direct sale. Payment of the purchase price is generally broken down into multiple installments, which may include payments prior to shipment, upon shipment or delivery of the Energy Server, and upon acceptance of the Energy Server. Acceptance typically occurs when the Energy Server is installed and running at full power as defined in the applicable EPC and O&M Agreement. A one-year service warranty is provided with the initial sale. After the expiration of the initial standard
one-year warranty
, the Operating Company has the option to extend our operations and maintenance services under the EPC and O&M Agreement on an annual basis at a price determined at the time of purchase of our Energy Server, which may be renewed annually for each Energy Server for up to 30 years. After the
49
standard
one-year warranty
period, the Operating Company has almost always exercised the option to renew our operations and maintenance obligations under the EPC and O&M Agreement.
We typically provide output warranties and output guaranties to the Operating Company pursuant to the applicable EPC and O&M Agreement with the Operating Company. The end customer agreement between the Operating Company and the end customer also provides efficiency warranties and efficiency guaranties to the end user, and we provide a backstop of all of the Operating Company’s obligations under those agreements, including both the repair or replacement obligations pursuant to the warranties and any payment liabilities under the guaranties.
As of December 31, 2019, we had incurred no liabilities due to failure to repair or replace Energy Servers pursuant to these warranties. Our obligation to make payments for underperformance against the performance guaranties for Power Purchase Agreement projects was capped at an aggregate total of approximately
$75.0 million
(including payments both for low output and for low efficiency) and our aggregate remaining potential liability under this cap was approximately
$59.4 million
.
Obligations to Operating Companies
In addition to our obligations to the end customers, our Power Purchase Agreement Programs involve many obligations to the Operating Company that purchases our Energy Servers. These obligations are set forth in the applicable EPC and O&M Agreement(s), and may include some or all of the following obligations:
|
•
|
designing, manufacturing, and installing the Energy Servers, and selling such Energy Servers to the Operating Company,
|
|
•
|
obtaining all necessary permits and other governmental approvals necessary for the installation and operation of the Bloom Energy Servers, and maintaining such permits and approvals throughout the term of the EPC and O&M Agreements,
|
|
•
|
operating and maintaining the Bloom Energy Servers in compliance with all applicable laws, permits and regulations,
|
|
•
|
satisfying the efficiency and output warranties set forth in such EPC and O&M Agreements and the PPAs ("performance warranties"), and
|
|
•
|
complying with any specific requirements contained in the PPAs with individual end-customers.
|
The EPC and O&M Agreements obligate us to repurchase the Energy Servers in the event the Energy Servers fail to comply with the performance warranties and in the event we otherwise breach the terms of the applicable EPC and O&M Agreements and we fail to remedy such failure or breach after a cure period, or in the event that a PPA terminates as a result of any failure by us to comply with the applicable EPC and O&M Agreements. In some PPA Program projects, our obligation to repurchase Energy Servers extends to the entire fleet of Energy Servers sold pursuant to the applicable EPC and O&M Agreements in the event such failure affects more than a specified number of Energy Servers.
In some PPA Programs, we have also agreed to pay liquidated damages to the applicable Operating Company in the event of delays in the manufacture and installation of our Energy Servers, either in the form of a cash payment or a reduction in the purchase price for the applicable Energy Servers.
Both the upfront purchase price for the Energy Servers and the ongoing fees for our operations and maintenance are paid on a fixed dollar-per-kilowatt ($/kW) basis.
Indemnification of Performance Warranty Expenses Under PPAs -
In addition to the performance warranties and guaranties in the EPC and O&M Agreements, we also have agreed to indemnify certain Operating Companies for any expenses they incur to any of the end customers resulting from failures of the applicable Energy Servers to satisfy any of the performance warranties and guaranties set forth in the applicable PPAs.
Administration of Operating Companies -
In each of the Bloom Electrons programs, we perform certain administrative services on behalf of the applicable Operating Company, including invoicing the end customers for amounts owed under the PPAs, administering the cash receipts of the Operating Company in accordance with the requirements of the financing arrangements, interfacing with applicable regulatory agencies, and other similar obligations. We are compensated for these services on a fixed dollar-per-kilowatt ($/kW) basis.
The Operating Company in each of the Bloom Electrons Programs (other than PPA I) has incurred debt in order to finance the acquisition of Energy Servers. The lenders for these projects are a combination of banks and/or institutional investors. In each case, the debt is secured by all of the assets of the applicable Operating Company, such assets being primarily comprised of the Energy Servers and a collateral assignment of each of the contracts to which the Operating Company is a party, including the O&M Agreement entered into with us and the offtake agreements entered into with the Operating Company’s customers, and is senior to all other debt obligations of the Operating Company. As further collateral,
50
the lenders receive a security interest in 100% of the membership interest of the Operating Company. However, as is typical in structured finance transactions of this nature, although the project debt is secured by all of the Operating Company’s assets, the lenders have no recourse to us or to any of the other equity investors in the project. The applicable debt agreements include provisions that implement a customary “payment waterfall” that dictates the priority in which the Operating Company will use its available funds to satisfy its payment obligations to us, the lenders, the tax equity investors and other third parties.
We have determined that we are the primary beneficiary in the PPA Entities, subject to reassessments performed as a result of upgrade transactions (see Note 13,
Power Purchase Agreement Programs
). Accordingly, we consolidate 100% of the assets, liabilities and operating results of these entities, including the Energy Servers and lease income, in our consolidated financial statements. We recognize the tax equity investors’ share of the net assets of the investment entities as noncontrolling interests in subsidiaries in our consolidated balance sheet. We recognize the amounts that are contractually payable to these investors in each period as distributions to noncontrolling interests in our consolidated statements of convertible redeemable preferred stock, redeemable noncontrolling interest, stockholders' deficit and noncontrolling interest. Our consolidated statements of cash flows reflect cash received from these investors as proceeds from investments by noncontrolling interests in subsidiaries. Our consolidated statements of cash flows also reflect cash paid to these investors as distributions paid to noncontrolling interests in subsidiaries. We reflect any unpaid distributions to these investors as distributions payable to noncontrolling interests in subsidiaries on our consolidated balance sheets. However, the PPA Entities are separate and distinct legal entities, and Bloom Energy Corporation may not receive cash or other distributions from the PPA Entities except in certain limited circumstances and upon the satisfaction of certain conditions, such as compliance with applicable debt service coverage ratios and the achievement of a targeted internal rate of return to the tax equity investors, or otherwise.
For further information about our Power Purchase Agreement Programs, see Note 13,
Power Purchase Agreement Programs
, to our consolidated financial statements included in this
Annual Report on Form 10-K
.
Delivery and Installation
The timing of delivery and installations of our products have a significant impact on the timing of the recognition of product revenue. Many factors can cause a lag between the time that a customer signs a purchase order and our recognition of product revenue. These factors include the number of Energy Servers installed per site, local permitting and utility requirements, environmental, health and safety requirements, weather, and customer facility construction schedules. Many of these factors are unpredictable and their resolution is often outside of our or our customers’ control. Customers may also ask us to delay an installation for reasons unrelated to the foregoing, including delays in their obtaining financing. Further, due to unexpected delays, deployments may require unanticipated expenses to expedite delivery of materials or labor to ensure the installation meets the timing objectives. These unexpected delays and expenses can be exacerbated in periods in which we deliver and install a larger number of smaller projects. In addition, if even relatively short delays occur, there may be a significant shortfall between the revenue we expect to generate in a particular period and the revenue that we are able to recognize. For our installations, revenue and cost of revenue can fluctuate significantly on a periodic basis depending on the timing of acceptance and the type of financing used by the customer. As described in the Power Purchase Agreements section above, we offered the Bloom Electrons purchase program through the end of 2016 and no longer offer this financing structure to potential customers.
Our product sales backlog was
$1.1 billion
, equivalent to
1,983
systems, or
198
megawatts, as of
December 31, 2019
. Our product sales backlog was
$0.8 billion
, equivalent to
1,384
systems, or
138
megawatts, as of
December 31, 2018
.
We define product sales backlog as signed customer product sales orders received prior to the period end, but not yet accepted, excluding site cancellations. The timing of the deployment of our backlog depends on the factors described above. However, as a general matter, at any point in time, we expect at least 50% of our backlog to be deployed within the next 12 months. The portion of our backlog in the year ended
December 31, 2019
attributable to each payment option was as follows: Direct Purchase (including Third Party PPAs)
93%
and Managed Services
7%
. The portion of our backlog in the year ended
December 31, 2018
attributable to each payment option was as follows: Direct Purchase (including Third Party PPAs)
98%
and Managed Services
2%
.
International Channel Partners
Prior to 2018, we consummated a small number of sales outside the United States of America, including in India and Japan. In India, sales activities are currently conducted by Bloom Energy (India) Pvt. Ltd., our wholly-owned indirect subsidiary; however, we are currently evaluating the Indian market to determine whether the use of channel partners would be a beneficial go-to-market strategy to grow our India market sales.
Japan.
In Japan, sales are conducted pursuant to a Japanese joint venture established between us and subsidiaries of SoftBank Corp, called Bloom Energy Japan Limited ("Bloom Energy Japan"). Under this arrangement, we sell Energy Servers to Bloom Energy Japan and we recognize revenue once the Energy Servers leave the port of the U.S. as Bloom Energy Japan
51
enters into the contract with the end customer and performs all installation work as well as some of the operations and maintenance work.
South Korea.
In 2018, Bloom Energy Japan consummated a sale of Energy Servers in the Republic of Korea to Korea South-East Power Company. Following this sale, we entered into a Preferred Distributor Agreement with SK Engineering & Construction Co., Ltd. ("SK E&C") to enable us to sell directly into the Republic of Korea.
Under our agreement with SK E&C, SK E&C has a right of first refusal during the term of the agreement, with certain exceptions, to serve as distributor of Energy Servers for any fuel cell generation project in the Republic of Korea, and we have the right of first refusal to serve as SK E&C’s supplier of generation equipment for any Bloom Energy fuel cell project in the Republic of Korea. Under the terms of each purchase order, title, risk of loss and acceptance of the Energy Servers pass from us to SK E&C upon delivery at the named port of lading for shipment in the United States for the Energy Servers shipped in 2018 and thereafter upon delivery at the named port of unlading in the Republic of Korea, prior to unloading subject to final purchase order terms. The Preferred Distributor Agreement has an initial term expiring on December 31, 2021, and thereafter will automatically be renewed for three-year renewal terms unless either party terminates the Preferred Distributor Agreement by written notice under certain circumstances.
Under the terms of the Preferred Distributor Agreement, we (or our subsidiary) contract directly with the customer to provide operations and maintenance services for the Energy Servers. We have established a subsidiary in the Republic of Korea, Bloom Energy Korea, LLC, to which we subcontract such operations and maintenance services. The terms of the operations and maintenance are negotiated on a case-by-case basis with each customer, but are generally expected to provide the customer with the option to receive services for at least 10 years, and for up to the life of the Energy Servers, with terms specified below.
SK E&C Joint Venture Agreement.
In September 2019, we entered into a joint venture agreement with SK E&C to establish a light-assembly facility in South Korea for sales of certain portions of the Bloom Server for the stationary utility and commercial and industrial market in South Korea. The joint venture is majority controlled and managed by us. We expect the facility to be operational by mid-2020 subject to the completion of certain conditions precedent to the establishment of the joint venture company. Other than a nominal initial capital contribution by Bloom, the joint venture will be funded by SK E&C. SK E&C, who currently acts as a distributor for Bloom Servers for the stationary utility and commercial and industrial market in Korea, will be the primary customer for the products assembled by the joint venture.
Community Distributed Generation Programs
In July 2015, the state of New York introduced its Community Distributed Generation program, which extends New York’s net metering program in order to allow utility customers to receive net metering credits for electricity generated by distributed generation assets located on the utility’s grid but not physically connected to the customer’s facility. This program allows for the use of multiple generation technologies, including fuel cells.
In December 2019, we entered into fuel cell sales, installation, operations and maintenance agreements with two developers for the deployment of fuel cells pursuant to this Community Distributed Generation program. These agreements have many of the same terms and conditions as a direct sale. Payment of the purchase price is generally broken down into multiple installments, which may include payments prior to shipment, upon shipment or delivery of the Energy Server, and upon acceptance of the Energy Server. Acceptance typically occurs when the Energy Server is installed and running at full power as defined in each contract. A one-year service warranty is provided with the initial sale. After the expiration of the initial standard
one-year warranty
, the owner has the option to renew our operations and maintenance services for subsequent quarterly or annual periods for up to 30 years. We provide warranties and guaranties regarding both efficiency and output to the owners of the Energy Servers pursuant to the operations and maintenance services agreement with the Operating Company.
As of December 31, 2019, we had not yet completed the sale of any Energy Servers in connection with the New York Community Distributed Generation program.
Key Operating Metrics
In addition to the measures presented in the consolidated financial statements, we use the following key operating metrics to evaluate business activity, to measure performance, to develop financial forecasts and to make strategic decisions:
|
•
|
Product accepted
- the number of customer acceptances of our Energy Servers in any period. We recognize revenue when an acceptance is achieved. We use this metric to measure the volume of deployment activity. We measure each Energy Server manufactured, shipped and accepted in terms of 100 kilowatt equivalents.
|
|
•
|
Billings for product accepted in the period
- the total contracted dollar amount of the product component of all Energy Servers that are accepted in a period. We use this metric to gauge the dollar value of the product acceptances and to evaluate the change in dollar amount of acceptances between periods.
|
52
|
•
|
Billings for installation on product accepted in the period
- the total contracted dollar amount billable with respect to the installation component of all Energy Servers that are accepted. We use this metric to gauge the dollar value of the installations of our product acceptances and to evaluate the change in dollar value associated with the installation of our product acceptances between periods.
|
|
•
|
Billings for annual maintenance service agreements
- the dollar amount billable for one-year service contracts that have been initiated or renewed. We use this metric to measure the cumulative billings for all service contracts in any given period. As our installation base grows, we expect our billings for annual maintenance service agreements to grow, as well.
|
|
•
|
Product costs of product accepted in the period (per kilowatt)
- the average unit product cost for the Energy Servers that are accepted in a period. We use this metric to provide insight into the trajectory of product costs and, in particular, the effectiveness of cost reduction activities.
|
|
•
|
Period costs of manufacturing expenses not included in product costs
- the manufacturing and related operating costs that are incurred to procure parts and manufacture Energy Servers that are not included as part of product costs. We use this metric to measure any costs incurred to run our manufacturing operations that are not capitalized (i.e., absorbed, such as stock-based compensation) into inventory and therefore, expensed to our consolidated statement of operations in the period that they are incurred.
|
|
•
|
I
nstallation costs on product accepted (per kilowatt)
- the average unit installation cost for Energy Servers that are accepted in a given period. This metric is used to provide insight into the trajectory of install costs and, in particular, to evaluate whether our installation costs are in line with our installation billings.
|
Comparison of the
Years Ended
December 31, 2019
,
2018
and
2017
A discussion regarding our key operating metrics for fiscal 2019 compared to fiscal 2018 and fiscal 2018 compared to fiscal 2017 is presented below.
Acceptances
We use acceptances as a key operating metric to measure the volume of our completed Energy Server installation activity from period to period. We typically define an acceptance as when an Energy Server is installed and running at full power as defined in the customer contract or the financing agreements. For orders where a third party performs the installation, acceptances are generally achieved when the Energy Servers are shipped.
The product acceptances in the periods were as follows:
|
|
Years Ended
December 31, |
Change
|
||||||||||
|
|
2019
|
2018
|
Amount
|
%
|
||||||||
|
|
|
|
||||||||||
|
Product accepted during the period
(in 100 kilowatt systems)
|
1,194
|
|
809
|
|
385
|
|
47.6
|
%
|
||||
Product accepted
increase
d by approximately
385
systems, or
47.6%
, for
2019
compared to
2018
. Acceptance volume
increase
d as we installed more systems from backlog as demand increased for our Bloom Energy servers, in addition to enhancing our ability and capacity to install more energy servers with our installation team.
53
As discussed in the Purchase and Lease Programs above, our customers have several purchase options for our Energy Servers. The portion of acceptances attributable to each purchase option in the years ended December 31, 2019 and
2018
was as follows:
|
|
Years Ended
December 31, |
|||||
|
|
2019
|
2018
|
||||
|
|
||||||
|
Direct Purchase (including Third Party PPAs and International Channels)
|
93
|
%
|
89
|
%
|
||
|
Traditional Lease
|
—
|
%
|
1
|
%
|
||
|
Managed Services
|
7
|
%
|
10
|
%
|
||
|
100
|
%
|
100
|
%
|
|||
As discussed in the Purchase and Lease Programs above, our customers have several purchase options for our Energy Servers. The portion of total revenue attributable to each purchase option in the period was as follows:
|
|
Years Ended
December 31, |
|||||
|
|
2019
|
2018
|
||||
|
|
||||||
|
Direct Purchase (including Third Party PPAs and International Channels)
|
85
|
%
|
79
|
%
|
||
|
Traditional Lease
|
1
|
%
|
2
|
%
|
||
|
Managed Services
|
5
|
%
|
5
|
%
|
||
|
Bloom Electrons
|
9
|
%
|
14
|
%
|
||
|
100
|
%
|
100
|
%
|
|||
Billings Related to Our Products
|
|
Years Ended
December 31, |
Change
|
|||||||||||||
|
|
2019
|
2018
|
Amount
|
%
|
|||||||||||
|
|
(dollars in thousands)
|
||||||||||||||
|
Billings for product accepted in the period
|
$
|
681,034
|
|
$
|
458,290
|
|
$
|
222,744
|
|
48.6
|
%
|
||||
|
Billings for installation on product accepted in the period
|
61,270
|
|
78,927
|
|
(17,657
|
)
|
(22.4
|
)%
|
|||||||
|
Billings for annual maintenance services agreements
|
76,852
|
|
82,881
|
|
(6,029
|
)
|
(7.3
|
)%
|
|||||||
Billings for product accepted increased by approximately
$222.7 million
, or
48.6%
, for
2019
compared to
2018
. The increase was primarily driven by the increase in product accepted, including billings for product accepted under Managed Services agreements. Product accepted increased by approximately 385 systems, or 47.6%, for 2019 compared to 2018. Billings for installation on product accepted decreased
$17.7 million
for
2019
, as compared to
2018
. Although product acceptances in the period increased
48.6%
, billings for installation on product accepted decreased due to the change in mix in installation billings driven by international sales, where our partners perform the installation, as well as site complexity, site size, customer financing option, and customer option to complete the installation of our Energy Servers themselves. In general, when we do not perform the installation function for a customer, such as SK E&C in the Republic of Korea, we will not have any installation billings for those orders. Billings for annual maintenance service agreements decreased
$6.0 million
for
2019
compared to
2018
. This decrease was driven primarily by the relatively high number of PPA upgrades performed in 2019. When an upgrade occurs, new systems are installed and there are typically no billings for service during the first year after the upgrade as the first year period is covered under our standard warranty.
54
Costs Related to Our Products
|
|
Years Ended
December 31, |
Change
|
|||||||
|
2019
|
2018
|
Amount
|
%
|
||||||
|
|
|
|
|||||||
|
Product costs of product accepted in the period
|
$2,881/kW
|
$3,372/kW
|
$(491)/kW
|
(14.6
|
)%
|
||||
|
Period costs of manufacturing related expenses not included in product costs (in thousands)
|
$16,989
|
$24,294
|
$(7,305)
|
(30.1
|
)%
|
||||
|
Installation costs on product accepted in the period
|
$644/kW
|
$1,189/kW
|
$(545)/kW
|
(45.8
|
)%
|
||||
Product costs of product accepted
decrease
d by approximately
$491 per kilowatt
, or
14.6%
, for
2019
compared to
2018
. The product cost reduction was driven generally by our ongoing cost reduction efforts to reduce material costs in conjunction with our suppliers and our reduction in labor and overhead costs through improved processes and automation at our manufacturing facilities.
Period costs of manufacturing related expenses
decrease
d by approximately
$7.3 million
, or
30.1%
, for
2019
compared to
2018
. Our period costs of manufacturing related expenses
decrease
d primarily as a result of higher absorption of fixed manufacturing costs into product costs due to a larger volume of builds through our factory tied to our acceptance growth, which resulted in higher factory utilization.
Installation costs on product accepted
decrease
d by approximately
$545 per kilowatt
, or
45.8%
, for
2019
compared to
2018
. Each customer site is different and installation costs can vary due to a number of factors, including site complexity, size, location of gas, etc. As such, installation on a per kW basis can vary significantly from period-to-period. When we achieve international acceptances, our partners are responsible for the installation, and therefore we do not incur installation costs. When we achieve acceptances for upgrading customer sites to our latest technology, installation costs are minimal as most of the installation work and costs were incurred when the site was initially installed. The mix of international acceptances, the PPA II upgrade and the PPA IIIb upgrade of Energy Servers contributed to the lower installation cost for
2019
compared to
2018
.
Comparison of the Years Ended December 31, 2018 and
2017
Acceptances
|
|
Years Ended
December 31, |
Change
|
||||||||||
|
|
2018
|
2017
|
Amount
|
%
|
||||||||
|
|
|
|
||||||||||
|
Product accepted during the period
(in 100 kilowatt systems) |
809
|
|
622
|
|
187
|
|
30.1
|
%
|
||||
Product accepted increased by approximately
187
systems, or
30.1%
, for
2018
compared to
2017
. Acceptance volume increased as we installed more systems from backlog as demand increased for our Bloom Energy servers, in addition to enhancing our ability and capacity to install more energy servers with our installation team.
As discussed in the Purchase and Lease Programs above, our customers have several purchase options for our Energy Servers. The portion of acceptances attributable to each purchase option in the period was as follows:
|
|
Years Ended
December 31, |
|||||
|
|
2018
|
2017
|
||||
|
|
||||||
|
Direct Purchase (including Third Party PPAs and International Channels)
|
89
|
%
|
72
|
%
|
||
|
Traditional Lease
|
1
|
%
|
6
|
%
|
||
|
Managed Services
|
10
|
%
|
22
|
%
|
||
|
100
|
%
|
100
|
%
|
|||
55
The portion of total revenue attributable to each purchase option in the period was as follows:
|
|
Years Ended December 31,
|
|||||
|
|
2018
|
2017
|
||||
|
|
||||||
|
Direct Purchase (including Third Party PPAs and International Channels)
|
79
|
%
|
63
|
%
|
||
|
Traditional Lease
|
2
|
%
|
7
|
%
|
||
|
Managed Services
|
5
|
%
|
6
|
%
|
||
|
Bloom Electrons
|
14
|
%
|
24
|
%
|
||
|
100
|
%
|
100
|
%
|
|||
Billings Related to Our Products
|
|
Years Ended
December 31, |
Change
|
|||||||||||||
|
|
2018
|
2017
|
Amount
|
%
|
|||||||||||
|
|
(dollars in thousands)
|
||||||||||||||
|
Billings for product accepted in the period
|
$
|
458,290
|
|
$
|
248,102
|
|
$
|
210,188
|
|
84.7
|
%
|
||||
|
Billings for installation on product accepted in the period
|
78,927
|
|
96,452
|
|
(17,525
|
)
|
(18.2
|
)%
|
|||||||
|
Billings for annual maintenance services agreements
|
82,881
|
|
79,881
|
|
3,000
|
|
3.8
|
%
|
|||||||
Billings for product accepted increased by approximately
$210.2 million
, or
84.7%
, for
2018
as compared to
2017
. The increase was primarily due to three factors.
First, product accepted increased by approximately
187
systems, or
30.1%
, for
2018
compared to
2017
.
Second, ITC was reinstated on February 9, 2018. ITC was not available to the fuel cell industry in 2017, so our billings for product accepted for
2017
only included
$1.3 million
in benefit from ITC. Due to the reinstatement of ITC in 2018, billings for product accepted now includes the benefit of ITC. For
2018
, billings for product accepted included
$132.9 million
in benefits from ITC, of which
$45.1 million
was retroactive ITC for 2017 acceptances.
Third, the adoption of customer personalized applications, such as batteries and grid-independent solutions, increased in
2018
compared to
2017
. Products that incorporate these personalized applications have, on average, a higher billings rate than our standard platform products that do not incorporate these personalized applications.
Billings for installation on product accepted
decrease
d
$17.5 million
for
2018
, as compared to
2017
. Although product acceptances in the period increased
30.1%
, billings for installation on product accepted decreased due to the mix in installation billings driven by site complexity, size, customer purchase option and one large customer in particular in
2018
where the installation was performed by the customer and therefore, we did not have any installation billing for that customer. In general, when we do not perform the installation function for a customer, such as SK E&C in the Republic of Korea, we will not have any installation billings for those orders.
When we analyze changes between the years ended
2018
and
2017
, we take into account the impact of ITC that was available in 2018 as a result of the reinstatement of the ITC through December 2021. The effect of the reinstatement of ITC was higher billings in the periods eligible for ITC. For
2018
, the combined total for billings for product and installation accepted was $537.2 million, an increase of 55.9% from the billings for product and installation accepted combined of $344.6 million for 2017. The increase was significantly greater than the 30.1% increase in associated acceptances during the same periods due to the reinstatement of the ITC benefit, including the one-time fiscal 2017 retroactive ITC benefit recognized in 2018 that is included in the 2018 billings numbers.
56
Costs Related to Our Products
|
|
Years Ended
December 31, |
Change
|
|||||||
|
2018
|
2017
|
Amount
|
%
|
||||||
|
|
|
|
|||||||
|
Product costs of product accepted in the period
|
$3,372/kW
|
$3,292/kW
|
$80/kW
|
2.4
|
%
|
||||
|
Period costs of manufacturing related expenses not included in product costs (in thousands)
|
$24,294
|
$32,437
|
$(8,143)
|
(25.1
|
)%
|
||||
|
Installation costs on product accepted in the period
|
$1,189/kW
|
$1,271/kW
|
$(82)/kW
|
(6.5
|
)%
|
||||
Product costs of product accepted increased by approximately $80 per kilowatt, or 2.4%, for 2018 compared to 2017. This increase in cost is primarily related to the reinstatement of the ITC program in February 2018, in which we were required to repay certain suppliers for previously negotiated contractual discounts. This resulted in a one-time payment of $116 per kilowatt or $9.4 million, which was recorded to cost of product revenue.
Period costs of manufacturing related expenses decreased by approximately $8.1 million, or 25.1%, for 2018 as compared to 2017. Our period costs of manufacturing related expenses decreased primarily as a result of higher absorption of fixed manufacturing costs into product costs due to a larger volume of builds through our factory tied to our acceptance growth, which resulted in higher factory utilization.
Installation costs on product accepted decreased by approximately $82 per kilowatt, or 6.5%, for 2018 compared to 2017. Each customer site is different and installation costs can vary due to a number of factors, including site complexity, size, location of gas, etc. As such, installation on a per kW basis can vary significantly from period-to-period. In addition, some customers do their own installation, or, as is the case for SK E&C in the Republic of Korea orders, we have a partner who performs the installation. In those instances, we have little to no installation cost.
57
Critical Accounting Policies and Estimates
The consolidated financial statements have been prepared in accordance with generally accepted accounting principles as applied in the United States ("U.S. GAAP") The preparation of the consolidated financial statements requires us to make estimates and assumptions that affect the reported amounts of assets, liabilities, revenues, costs and expenses and related disclosures. Our discussion and analysis of our financial results under Results of Operations below are based on our audited results of operations, which we have prepared in accordance with U.S. GAAP. In preparing these financial statements, we make assumptions, judgments and estimates that can affect the reported amounts of assets, liabilities, revenues and expenses, and net income. On an ongoing basis, we base our estimates on historical experience, as appropriate, and on various other assumptions that we believe to be reasonable under the circumstances. Changes in the accounting estimates are reasonably likely to occur from period to period. Accordingly, actual results could differ significantly from the estimates made by our management. We evaluate our estimates and assumptions on an ongoing basis. To the extent that there are material differences between these estimates and actual results, our future financial statement presentation, financial condition, results of operations and cash flows will be affected. We believe that the following critical accounting policies involve a greater degree of judgment and complexity than our other accounting policies. Accordingly, these are the policies we believe are the most critical to understanding and evaluating the consolidated financial condition and results of operations.
The accounting policies that most frequently require us to make assumptions, judgments and estimates, and therefore are critical to understanding our results of operations, include:
Revenue Recognition
We primarily earn product and installation revenue from the sale and installation of our Energy Servers, service revenue by providing services under operations and maintenance services contracts and electricity revenue by selling electricity to customers under power purchase agreements. We offer our customers several ways to finance their use of a Bloom Energy Server. Customers, including some of our international channel providers and Third Party PPAs, may choose to purchase our Energy Servers outright. Customers may also lease our Energy Servers through one of our financing partners via our Managed Services Program or as a traditional lease. Finally, customers may purchase electricity through our Power Purchase Agreement Programs.
Prior to Adoption of ASC 606 Revenue from Contracts with Customers
Prior to the adoption of ASC 606
Revenue from Contracts with Customers
, we recognized revenue from contracts with customers for the sales of products, installation and services in accordance with ASC 605-25, Revenue Recognition for Multiple-Element Arrangements.
Revenue from the sale and installation of Energy Servers was recognized when all of the following criteria are met:
|
•
|
Persuasive evidence of an arrangement exists. We rely upon non-cancelable sales agreements and purchase orders to determine the existence of an arrangement.
|
|
•
|
Delivery and acceptance has occurred. We use shipping documents and confirmation from our installations team that the deployed systems are running at full power as defined in each contract to verify delivery and acceptance.
|
|
•
|
The fee is fixed or determinable. We assess whether the fee is fixed or determinable based on the payment terms associated with the transaction.
|
|
•
|
Collectability is reasonably assured. We assess collectability based on the customer’s credit analysis and payment history.
|
When these criteria are met, we allocate revenue to each element of the customer arrangement (product, installation and services) based on an estimated selling price at the arrangement inception. The estimated selling price for each element is based upon the following hierarchy: vendor-specific objective evidence ("VSOE") of selling price, if available; third-party evidence ("TPE") of selling price, if VSOE of selling price is not available; or best estimate of selling price ("BESP") if neither VSOE of selling price nor TPE of selling price are available. We limit the amount of revenue recognized for delivered elements to an amount that is not contingent upon future delivery of additional products or services or upon meeting any specified performance conditions.
We have not been able to obtain reliable evidence of the selling price of the standalone Energy Server. Given that we typically sell an Energy Server with a maintenance service agreement and have not provided maintenance services to a customer who does not have use of an Energy Server, we have no evidence of selling prices for either and virtually no customers have elected to cancel their maintenance service agreements while continuing to operate the Energy Servers. Our objective is to determine the price at which we would transact business if the items were being sold separately. As a result, our estimate of our selling price is driven primarily by our expected margin on both the Energy Server and installation based on
58
their respective costs or, in the case of maintenance service agreements, the estimated costs to be incurred during the expected service period.
Costs for Energy Servers include all direct and indirect manufacturing costs, applicable overhead costs and costs for normal production inefficiencies (i.e., variances). We then apply a margin to the Energy Servers and to expected installation costs to determine the selling price to be used in our BESP model. Costs for maintenance service arrangements are estimated over the expected life of the maintenance contracts and include estimated future service costs and future material costs. Material costs over the expected period of the service arrangement are impacted significantly by the longevity of the fuel cells themselves. After considering the total service costs, we apply a lower margin to our service costs than to our Energy Servers as it best reflects our long-term service margin expectations. As our business offerings and eligibility for the Investment Tax Credit ("ITC") evolve over time, we may be required to modify our estimated selling prices in subsequent periods and our revenue could be adversely affected.
Subsequent to adoption of ASC 606 Revenue from Contracts with Customers
We adopted
ASC 606 Revenue from Contracts with Customers
as of January 1, 2019 using the modified retrospective method and present the impacts for the first time in our Annual Report on Form 10-K for the fiscal year ended December 31, 2019.
In applying ASC 606, we frequently combine contracts governing the sale and installation of an Energy Server with the related maintenance service contracts and account for them as a single contract at contract inception to the extent the contracts are with the same customer. These contracts are not combined when the customer for the sale and installation of the Energy Server is different to the maintenance service contract customer. We also assess whether any contract terms including default provisions, put or call options result in components of our contracts being accounted for as financing or leasing transactions outside of the scope of ASC 606.
Most of our contracts contain performance obligations with a combination of our Energy Server product, installation and maintenance services. For these performance obligations, we allocate revenue to each performance obligation based on the total transaction price for each contract. Our maintenance service contracts are typically subject to renewal by customers on an annual basis. We assess these maintenance service renewal options at contract inception to determine whether they provide customers with material rights that give rise to a separate performance obligation.
The total transaction price is determined based on the total consideration specified in the contract, including variable consideration in the form of a production guarantee payment that represents potential amounts payable to customers. The expected value method is generally used when estimating variable consideration, which typically reduces the total transaction price due to the nature of the performance obligations to which the variable consideration relates. These estimates reflect our historical experience and current contractual requirements which cap the maximum amount that may be paid. The expected value method requires judgment and considers multiple factors that may vary over time depending upon the unique facts and circumstances related to each performance obligation. Depending on the facts and circumstances, a change in variable consideration estimate will either be accounted for at the contract level or using the portfolio method. We also consider the customers’ rights of return in determining the transaction price where applicable.
We exclude from the transaction price all taxes assessed by governmental authorities that are both (i) imposed on and concurrent with a specific revenue-producing transaction and (ii) collected from customers. Accordingly, such tax amounts are not included as a component of net sales or cost of sales. We allocate the transaction price to each performance obligation in an amount that depicts the amount of consideration to which we expect to be entitled in exchange for transferring and installing the Energy Server and providing associated maintenance services.
Given that we typically sell an Energy Server with a maintenance service agreement and have not provided maintenance services to a customer who does not have use of an Energy Server, standalone selling prices are estimated using a cost-plus approach. Costs relating to Energy Servers include all direct and indirect manufacturing costs, applicable overhead costs and costs for normal production inefficiencies (i.e., variances). We then apply a margin to the Energy Servers which may vary with the size of the customer, geographic region and the scale of the Energy Server deployment. As our business offerings and eligibility for the Investment Tax Credit ("ITC") evolve over time, we may be required to modify the expected margin in subsequent periods and our revenue could be adversely affected.
Costs relating to installation include all direct and indirect installation costs. The margin we apply reflects our profit objectives relating to installation. Costs for maintenance service arrangements are estimated over the life of the maintenance contracts and include estimated future service costs and future material costs. Material costs over the period of the service arrangement are impacted significantly by the longevity of the fuel cells themselves. After considering the total service costs, we apply a lower margin to our service costs than to our Energy Servers as it best reflects our long-term service margin expectations and comparable historical industry service margins.
59
As a result, our estimate of our selling price is driven primarily by our expected margin on both the Energy Server and the maintenance service agreements based on their respective costs or, in the case of maintenance service agreements, the estimated costs to be incurred. We recognize product and installation revenue at the point in time that the Customer obtains control of the Energy Server. We recognize service revenue, including revenue associated with any related customer material rights, over time as we perform service maintenance activities.
Amounts billed to customers for shipping and handling activities are considered contract fulfillment activities and not a separate performance obligation of the contract. Shipping and handling fees are recorded as revenue and the related cost is a cost to fulfill the contract that is recognized within costs of goods sold.
The following is a description of the principal activities from which we generate revenue. Our four revenue streams are classified as follows:
Product Revenue -
All of our product revenue is generated from the sale of our Energy Servers to direct purchase, including financing partners on Third-Party PPAs, international channel providers and traditional lease customers. We generally recognize product revenue from contracts with customers at the point that control is transferred to the customers. This occurs when we achieve customer acceptance which is when the system has been installed and is running at full power or, in the case of sales to our international channel providers, based upon shipment terms.
Under our traditional leases financing option, we sell our Energy Servers through a direct sale to a financing partner who, in turn, leases the Energy Servers to the customer under a lease agreement. With our sales to our international channel providers, our international channel providers typically sell the Energy Servers to, or sometimes provide a PPA to, an end customer. In both traditional lease and international channel providers transactions, we contract directly with the end customer to provide extended maintenance services after the end of the standard warranty period. As a result, since the customer that purchases the server is a different and unrelated party to the customer that purchases extended warranty services, the product and maintenance service contract are not combined.
Payments received from customers are recorded within deferred revenue and customer deposits in the consolidated balance sheets until the acceptance criteria as defined within the customer contract are met. The related cost of such product and installation is also deferred as a component of deferred cost in the consolidated balance sheets until acceptance.
Installation Revenue -
Nearly all of our installation revenue relates to the installation of Energy Servers sold to direct purchase, including financing partners on Third-Party PPAs and traditional lease customers. Generally, we recognize installation revenue when the system has been installed and is running at full power.
Service Revenue -
Service revenue is generated from maintenance services agreements. We typically provide to our customers a standard one-year warranty against manufacturing or performance defects in our Energy Servers. We also sell to these customers extended annual maintenance services that effectively extend the standard one-year warranty coverage at the customer’s option. These customers generally have an option to renew or cancel the extended maintenance services on an annual basis and nearly every customer has renewed historically. The contractual renewal price may be less than the standalone selling price of the maintenance services and consequently the contract renewal option may provide the customer with a material right.
Revenue is recognized over the term of the renewed one-year service period. Given our customers' renewal history, we anticipate that almost all of our customers will continue to renew their maintenance services agreements each year through their expected use of the Energy Server. As a result, we estimate the standalone selling price for customer renewal options that give rise to material rights using the practical alternative by reference to optional operations and maintenance services renewal periods expected to be provided and the corresponding expected consideration for these services. This reflects that our additional performance obligations in any contractual renewal period are consistent with the services provided under the initial maintenance service contract.
Payments from customers for the extended maintenance contracts are received at the beginning of each service year. Accordingly, the customer payment received is recorded as a customer deposit and revenue is recognized over the related period as the services are performed using a cost-to-cost basis that reflects the cost of providing these services.
Electricity Revenue -
We sell electricity produced by our Energy Servers owned directly by us or by our consolidated PPA entities. Our PPA Entities purchase Energy Servers from us and sell electricity produced by these systems to customers through long-term power purchase agreements ("PPAs"). Customers are required to purchase all of the electricity produced by those Energy Servers at agreed-upon rates over the course of the PPAs' contractual term.
60
In addition, in certain product sales, we are a party to master lease agreements that provide for the sale of our Energy Servers to third-parties and the simultaneous leaseback of the systems, which we then sublease to our customers. In sale-leaseback sublease arrangements ("Managed Services"), we first determine whether the Energy Servers under the sale-leaseback arrangement are “integral equipment”. As the Energy Servers are determined not to be integral equipment, we determine if the leaseback is classified as a capital lease or an operating lease.
Our managed services arrangements with the financing party are classified as capital leases and are recorded as financing transactions, while the sub-lease arrangements with the end customer are classified as operating leases. Payments received from the financier are recorded as financing leases. We then recognize revenue for the electricity generated by allocating the total proceeds based on the relative standalone selling prices to electricity revenue and to service revenue. Electricity revenue relating to power purchase agreements is typically accounted for in accordance with ASC 840
Leases
and service revenue in accordance with ASC 606.
We recognize revenue from the PPAs and Managed Services contracts as the electricity is provided over the term of the agreement.
Contract modifications are accounted for as separate contracts if the additional products and services are distinct and priced at standalone selling prices. If the additional products and services are distinct, but not priced at standalone selling prices, the modification is treated as a termination of the existing contract and the creation of a new contract. Lastly, if the additional products and services are not distinct within the context of the contract, the modification is combined with the original contract and either an increase or decrease in revenue is recognized on the modification date. During fiscal 2019, we did not recognize any material revenue for contracts modified during the period that had performance obligations satisfied in prior periods.
We recognize a contract liability (deferred revenue) when we have an obligation to transfer products or services to a customer in advance of us satisfying a performance obligation and the contract liability is reduced as performance obligations are satisfied and revenue is recognized. The related cost of such product is deferred as a component of deferred cost of goods sold in the consolidated balance sheets. Prior to shipment of the product or the commencement of performance of maintenance services, any prepayment made by the customer is recorded as a customer deposit.
Property, Plant and Equipment -
Property, plant and equipment, including leasehold improvements are stated at cost less accumulated depreciation. Energy Servers are depreciated to their residual values over their useful economic lives which reflect consideration of the terms of their related power purchase and tariff agreements. These useful lives are reassessed when there is an expected change in the use of the Energy Servers. Leasehold improvements are depreciated over the shorter of the lease term or their estimated depreciable lives. The carrying amounts of our long-lived assets are periodically reviewed for impairment whenever events or changes in circumstances indicate that the carrying value of these assets may not be recoverable or that the useful life is shorter than originally estimated.
Inventories -
Inventories consist principally of raw materials, work-in-process and finished goods and are stated on a first-in, first-out basis at the lower of cost or net realizable value.
We record inventory excess and obsolescence provisions for estimated obsolete or unsellable inventory, including inventory from purchase commitments, equal to the difference between the cost of inventory and estimated net realizable value based upon assumptions about market conditions and future demand for product generally expected to be utilized over the next 12 to 24 months, including product needed to fulfill our warranty obligations. If actual future demand for our products is less than currently forecasted, additional inventory provisions may be required. Once a provision is recorded, it is maintained until the product to which it relates to is sold or otherwise disposed.
Derivative Financial Instruments
We enter into derivative natural gas fixed price forward contracts to manage our exposure to the fluctuating price of natural gas under certain of our power purchase agreements entered in connection with the Bloom Electrons program. In addition, we enter into fixed forward interest rate swap arrangements to convert variable interest rates on debt to a fixed rate and on occasion have committed to certain utility grid price protection guarantees in sales agreements. We do not enter into derivative transactions for trading or speculative purposes.
We account for our derivative instruments as either an asset or a liability which are carried at fair value on the consolidated balance sheets. Changes in the fair value of the derivatives that are designated and qualify as cash flow hedges are recorded in accumulated other comprehensive income (loss) on the consolidated balance sheets and for those that do not qualify for hedge accounting or are not designated hedges are recorded through earnings in the consolidated statements of operations.
While we hedge certain of our natural gas purchase requirements under our power purchase agreements, we do not classify these natural gas fixed price forward contracts as designated hedges for accounting purposes. Therefore, we record the change in the fair value of our natural gas fixed price forward contracts in cost of revenue on the consolidated statements of
61
operations. The fair value of the natural gas fixed price forward contracts is recorded on the consolidated balance sheets as a component of accrued expenses and other current liabilities and as derivative liabilities. As these forward contracts are considered economic hedges, the changes in the fair value of these forward contracts are classified as operating activities within the statement of cash flows, which is consistent with the classification of the cash flows of the hedged item.
Our interest rate swap arrangements qualify as cash flow hedges for accounting purposes as they effectively convert variable rate obligations into fixed rate obligations. We evaluate and calculate the effectiveness of the hedge at each reporting date. The effective change is recorded in accumulated other comprehensive income (loss) and will be recognized as interest expense on settlement. As of January 1, 2019, we adopted Accounting Standards Update ("ASU") 2017-12 Derivatives and Hedging (Topic 815), Targeted Improvements to Accounting for Hedging Activities ("ASU 2017-12"). Per ASU 2017-12, ineffectiveness is no longer required to be measured or disclosed. If a cash flow hedge is discontinued due to changes in the forecasted hedged transactions, hedge accounting is discontinued prospectively and any unrealized gain or loss on the related derivative is recorded in accumulated other comprehensive income (loss) and is reclassified into earnings in the same period during which the hedged forecasted transaction affects earnings. The fair value of the swap arrangement is recorded on the consolidated balance sheets as a component of accrued expenses and other current liabilities and as derivative liabilities. The changes in fair value of swap agreement are classified as operating activities within the statement of cash flows, which is consistent with the classification of the cash flows of the hedged item.
Stock-based Compensation
We measure stock options and other stock-based awards such as restricted stock units, granted to employees and directors based on the fair value on the date of the grant and recognize compensation expense of those awards, net of estimated forfeitures, over the requisite service period, which is generally the vesting period of the respective award. Generally, we issue stock options with only service-based vesting conditions and record the expense for these awards using the straight-line method. The liability related to these awards is recognized over the period during which services are rendered until completed. The fair value of the stock-based compensation liability is estimated using the Black-Scholes option pricing model and are recorded in our consolidated statements of operations. The Black-Scholes option-pricing model uses as inputs the fair value of our common stock and assumptions we make for the volatility of our common stock, the expected term of the award, the risk-free interest rate for a period that approximates the expected term of our stock options and our expected dividend yield.
Principles of Consolidation
These consolidated financial statements reflect our accounts and operations and those of our subsidiaries in which we have a controlling financial interest. We use a qualitative approach in assessing the consolidation requirement for each of our variable interest entities ("VIE"), which we refer to as our power purchase agreement entities ("PPA Entities"). This approach focuses on determining whether we haves the power to direct those activities of the PPA Entities that most significantly affect their economic performance and whether we have the obligation to absorb losses, or the right to receive benefits, that could potentially be significant to the PPA Entities.
Noncontrolling Interests and Redeemable Noncontrolling Interests
We generally allocate profits and losses to noncontrolling interests under the hypothetical liquidation at book value ("HLBV") method. HLBV is a balance sheet-oriented approach for applying the equity method of accounting when there is a complex structure, such as the flip structure of the PPE Entities.
The determination of equity in earnings under the HLBV method requires management to determine how proceeds, upon a hypothetical liquidation of the entity at book value, would be allocated between our investors. The noncontrolling interest balance is presented as a component of permanent equity in the consolidated balance sheets.
Noncontrolling interests with redemption features, such as put options, that are not solely within our control are considered redeemable noncontrolling interests. Exercisability of put options are solely dependent upon the passage of time, and hence, such put options are considered to be probable of becoming exercisable. We elected to accrete changes in the redemption value over the period from the date it becomes probable that the instrument will become redeemable to the earliest redemption date of the instrument by using an interest method. The balance of redeemable noncontrolling interests on the balance sheets is reported at the greater of its carrying value or its maximum redemption value at each reporting date. The redeemable noncontrolling interests are classified as temporary equity and therefore are reported in the mezzanine section of the consolidated balance sheets as redeemable noncontrolling interests.
62
Emerging Growth Company Status
The Jumpstart Our Business Startups Act of 2012 ("JOBS Act") provides that an “emerging growth company” can take advantage of the extended transition period afforded by the JOBS Act for the implementation of new or revised accounting standards. However, we have elected not to “opt out” of such extended transition period, which means that when a standard is issued or revised and it has different application dates for public or private companies, we will adopt the new or revised standard at the time private companies adopt the new or revised standard, provided that we continue to be an emerging growth company.
Results of Operations
Revenue
We primarily recognize revenue from the sale and installation of Energy Servers, by providing services under maintenance contracts, and from electricity sales by our PPA Entities and from our Managed Services agreements.
Product Revenue
All of our product revenue is generated from the sale of our Energy Servers to direct purchase, Third-Party PPAs and traditional lease customers. We generally recognize product revenue from contracts with customers for the sales of our Energy Servers once we achieve acceptance; that is, generally when the system has been installed and is running at full power as defined in each contract or, for sales to some of our International Channel Partners, based upon shipment terms.
The amount of product revenue we recognize in a given period is materially dependent on the volume and size of installations of our Energy Servers and on the type of financing used by the customer.
Installation Revenue
The majority of our installation revenue is generated from the installation of our Energy Servers to direct purchase Third-Party PPAs and traditional lease customers. The amount of installation revenue we recognize in a given period is materially dependent on the volume and size of installations of our Energy Servers in a given period, whether the customer chooses to do the installation themselves, and on the type of financing used by the customer.
Service Revenue
Service revenue is generated from operations and maintenance services agreements to support and maintain the Energy Servers in the field. Customers of our direct purchase, Third Party PPA and lease programs can renew their operating and maintenance services agreements on an annual basis for the life of the contract at prices predetermined at the time of purchase of the Energy Server. We anticipate that almost all of our customers will continue to renew their operations and maintenance services agreements each year throughout their expected use of the Energy Server.
Electricity Revenue
Our PPA Entities and financiers in our Managed Services contracts purchase Energy Servers from us and sell the electricity produced by these systems to end customers. Customers are required to purchase all of the electricity produced by the Energy Servers at agreed-upon rates over the course of the contract term. We generally recognize revenue from such PPA Entities and managed services customers as the electricity is provided over the term of the agreement.
Cost of Revenue
Our total cost of revenue consists of cost of product revenue, cost of installation revenue, cost of service revenue and cost of electricity revenue. It includes personnel costs associated with our operations and global customer support organizations consisting of salaries, benefits, bonuses, stock-based compensation and allocated facilities costs.
Cost of Product Revenue
Cost of product revenue consists of costs of Energy Servers that we sell to direct, Third Party PPA and traditional lease customers, including costs of materials, personnel costs, allocated costs, shipping costs, provisions for excess and obsolete inventory and the depreciation costs of our equipment. We expect our cost of product revenue to increase in absolute dollars as we deliver and install more Energy Servers and our product revenue increases.
Cost of Installation Revenue
Cost of installation revenue consists of the costs to install the Energy Servers that we sell to direct, Third Party PPA and traditional lease customers, including costs of materials and service providers, personnel costs, and allocated costs. In our Asia Pacific region, the cost of the installations and resulting revenue is attributable to our channel partners. Notwithstanding the use of channel partners, for the next twelve months, we expect our cost of installation revenue to increase in absolute dollars as we deliver and install more Energy Servers, though it will be subject to variability as a result of the timing of installation and other factors.
63
Cost of Service Revenue
Cost of service revenue consists of costs incurred under maintenance service contracts for all customers including direct sales, Third Party PPA, traditional lease, managed services and PPA customers. Such costs include personnel costs for our customer support organization, allocated costs and extended maintenance-related product repair and replacement costs. We expect our cost of service revenue to increase in absolute dollars as our base of megawatts deployed grows, and we expect our cost of service revenue to fluctuate period by period depending on the timing of maintenance of Energy Servers.
Cost of Electricity Revenue
Cost of electricity revenue primarily consists of the depreciation of the cost of the Energy Servers owned by our PPA Entities and by us through our managed services agreements and the cost of gas purchased in connection with our first PPA Entity. The cost of depreciation of the Energy Servers is reduced by the amortization of any U.S. Treasury grant payment in lieu of the energy investment tax credit associated with these systems. We expect our cost of electricity revenue to be correlated in absolute dollars to our base of megawatts deployed by our PPA entities and by us through our managed services agreements.
Gross Profit (Loss)
Gross profit (loss) has been and will continue to be affected by a variety of factors, including the sales price of our products, manufacturing costs, the costs to install the products, the costs to maintain the systems in the field, the mix of financing options used and the mix of revenue between product, service and electricity. We expect our gross profit to fluctuate over time depending on the factors described above.
Operating Expenses
Research and Development
Research and development costs are expensed as incurred and consist primarily of personnel costs. Research and development expense also includes prototype related expenses and allocated facilities costs. We expect research and development expense to increase in absolute dollars as we continue to invest in our future products and services, and we expect our research and development expense to fluctuate as a percentage of total revenue.
Sales and Marketing
Sales and marketing expense consists primarily of personnel costs, including commissions. We expense commission costs as each performance obligation occurs over the duration of the contract. Sales and marketing expense also includes costs for market development programs, promotional and other marketing costs, travel costs, office equipment and software, depreciation, professional services and allocated facilities costs. We expect sales and marketing expense to continue to increase in absolute dollars as we increase the size of our sales and marketing organizations and as we expand our international presence, and we expect our sales and marketing expense to fluctuate as a percentage of total revenue.
General and Administrative
General and administrative expense consists of personnel costs, fees for professional services and allocated facilities costs. General and administrative personnel include our executive, finance, human resources, information technology, facilities, business development and legal organizations. We expect general and administrative expense to increase in absolute dollars due to additional legal fees and costs associated with accounting, insurance, investor relations, SEC and stock exchange compliance and other costs associated with being a public company, and we expect our general and administrative expense to fluctuate as a percentage of total revenue.
Stock-Based Compensation
We measure and recognize compensation costs for all stock-based awards, including stock options and purchase rights issued to employees based on the estimated fair value of the awards on the grant date. We use the Black-Scholes-Merton ("Black-Scholes") option pricing model to estimate the fair value of stock options and employee stock purchase plan ("ESPP") rights. The fair value of stock options is recognized as expense on a straight-line basis over the requisite service period, which is generally four years. The fair value of restricted stock units ("RSUs"), is measured using the fair value of our common stock on the date of the grant. The fair value of RSUs is recognized as expense on a straight-line basis over the requisite service period, which generally ranges from two to four years. For stock-based awards granted to employees with a performance condition, we recognize stock-based compensation costs using the accelerated attribution method over the requisite service period when management determines it is probable that the performance condition will be satisfied. For stock-based awards granted to employees with market conditions, we recognize stock-based compensation costs over the requisite service period and use the Monte Carlo simulation option pricing model to estimate the fair value of the awards at the time of grant. The fair value of the 2018 ESPP purchase rights is recognized as expense on the vesting period of each offering period. Stock-based compensation costs are recorded net of estimated forfeitures such that expense is recorded only for those stock-based awards that are expected to vest.
64
Stock-based compensation expense is recorded in the consolidated statements of operations based on the employees’ respective function. Additionally, stock-based compensation costs relating to manufacturing employees are capitalized as a component of Energy Server manufacturing costs to inventory, deferred cost of revenues, construction-in-progress and property, plant and equipment as per ASC 330 and SEC Staff Accounting Bulletin Topic 14. These costs are expensed on consumption of the related inventory and over the economic useful life of the property, plant and equipment, as applicable.
Interest Expense
Interest expense primarily consists of interest charges associated with our secured line of credit, long-term debt facilities, financing obligations and capital lease obligations.
Other Income (Expense), Net
Other income (expense), net primarily consists of gains or losses associated with foreign currency fluctuations, net and of income earned on our cash and cash equivalents holdings in interest-bearing accounts. We have historically invested our cash in money-market funds.
Gain (Loss) on Revaluation of Warrant Liabilities and Embedded Derivatives
Warrants issued to investors and lenders that allow them to acquire our convertible preferred stock have been classified as liability instruments on our balance sheet. Since the warrants issued were mandatorily convertible into common stock at the completion of our IPO, the liability related to these mandatorily converted warrants was reclassified to additional paid-in capital on the IPO date and total gains and losses for revaluation of warrant liabilities was recorded in the consolidated statement of operations. We estimate the fair value of embedded derivatives in certain sales contracts using a Monte Carlo simulation model which considers various potential natural gas forward curves over the sales contract term. We record any changes in the fair value of these instruments between reporting dates in our consolidated statements of operations.
Provision for Income Taxes
Provision for income taxes consists primarily of federal and state income taxes in the United States and income taxes in foreign jurisdictions in which we conduct business. We have provided a full valuation allowance on our U.S. deferred tax assets because we believe it is more likely than not that the deferred tax assets will not be realized. At
December 31, 2019
, we had federal and state net operating loss carryforwards of
$1.8 billion
and
$1.6 billion
, respectively, which will expire, if unused, beginning in
2022
and
2028
, respectively.
Net Income (Loss) Attributable to Noncontrolling Interests
We allocate profits and losses to the noncontrolling interests under the hypothetical liquidation at book value ("HLBV") method. HLBV is a balance sheet-oriented approach for applying the equity method of accounting when there is a complex structure, such as our PPA entities. Net income (loss) attributable to noncontrolling interests is deducted from our net income (loss) in determining our net income (loss) attributable to common stockholders.
Deemed Dividend to Noncontrolling Interests
We recognized a deemed dividend of $2.4 million on November 26, 2019 related to our buyout of the tax equity partner’s equity interest in PPA IIIb. The deemed dividend was recorded as a result of the buyout amount exceeding the hypothetical liquidation book value of the tax equity investor's equity interest in PPA IIIb on the date the buyout occurred. This charge impacted net income attributable to common stockholders and earnings per share in the year ended December 31, 2019.
A discussion regarding our financial condition and results of operations for fiscal 2019 as compared to fiscal 2018 and for fiscal 2018 compared to fiscal 2017 is presented below.
We adopted new revenue guidance, Accounting Standards Codification ("ASC") 606,
Revenue From Contracts With Customers ("
ASC 606"), which was effective from January 1, 2019 under the modified retrospective method which has limited the comparability of prior year results. The comparative information for periods prior to 2019 has not been recast for the impact of ASC 606. Additional comparative information is provided in Note 3 of the
Notes to Consolidated Financial Statements
for the adoption of ASC 606 and our proforma financial results under ASC 605,
Revenue Recognition
("ASC 605")
,
for fiscal 2019.
65
Comparison of the
Years Ended
December 31, 2019
and
2018
Revenue
|
|
Years Ended
December 31, |
Change
|
|||||||||||||
|
|
2019
|
2018
|
Amount
|
%
|
|||||||||||
|
As Restated
|
|||||||||||||||
|
|
(dollars in thousands)
|
||||||||||||||
|
Product
|
$
|
557,336
|
|
$
|
400,638
|
|
$
|
156,698
|
|
39.1
|
%
|
||||
|
Installation
|
60,826
|
|
68,195
|
|
(7,369
|
)
|
(10.8
|
)%
|
|||||||
|
Service
|
95,786
|
|
83,267
|
|
12,519
|
|
15.0
|
%
|
|||||||
|
Electricity
|
71,229
|
|
80,548
|
|
(9,319
|
)
|
(11.6
|
)%
|
|||||||
|
Total revenue
|
$
|
785,177
|
|
$
|
632,648
|
|
$
|
152,529
|
|
24.1
|
%
|
||||
Total Revenue
Total revenue
increase
d by approximately
$152.5 million
, or
24.1%
, for
2019
as compared to
2018
. Revenue in 2019 included a revenue recognition timing adjustment decrease of $34.6 million associated with the adoption of ASC 606. Excluding this adjustment in 2019, revenue would have increased in 2019 by approximately $187.1 million, or 29.6%.
Revenue in
2018
included a one-time benefit of $45.5 million associated with the 2017 retroactive ITC benefit recognized in the same period in 2018. In early 2018, the ITC law was retroactively reinstated, extending and phasing-out the ITC through 2021. Future application of ITC to new installations is subject to a phase-out schedule, see Note 14,
Commitments and Contingencies
-
Investment Tax Credits
for additional information.
Excluding this one-time retroactive ITC benefit in 2018 and the adjustment in connection with the adoption of ASC 606, revenue would have increased in
2019
by approximately $232.6 million, or 39.6%, as compared to
2018
. This increase was driven primarily by the increase in product acceptances of approximately
385
systems, or
47.6%
, for
2019
, as compared to
2018
.
Product Revenue
Product revenue
increase
d by approximately
$156.7 million
, or
39.1%
, for
2019
, as compared to
2018
. This
increase
was driven by the increase in acceptances of
385
systems. Product revenue in 2018 included a one-time benefit of $45.5 million associated with the 2017 retroactive ITC benefit recognized in the same period in 2018 and product revenue in 2019 included an adjustment in connection with the adoption of ASC 606 of $44.5 million. Excluding these adjustments in
2018
and 2019, revenue increased during
2019
by approximately $246.7 million, or 69.5%, as compared to
2018
, driven primarily by the increase in product acceptances of approximately
385
systems, or
47.6%
, for
2019
.
Installation Revenue
Installation revenue
decrease
d by approximately
$7.4 million
, or
10.8%
, for
2019
, as compared to
2018
. Installation revenue in 2019 included an adjustment in connection with the adoption of ASC 606 of $6.1 million. Excluding the adjustment in connection with the adoption of ASC 606, installation revenue would have decreased by approximately $13.5 million, or 19.8%. This decrease was generally driven by the higher mix of international acceptances, where we typically do not perform the installation service.
Service Revenue
Service revenue
increase
d by approximately
$12.5 million
, or
15.0%
for
2019
, as compared to
2018
. Service revenue in 2019 included an adjustment in connection with the adoption of ASC 606 of $3.8 million. Excluding the adjustment in connection with the adoption of ASC 606, service revenue would have increased by approximately $8.7 million, or 10.4%. This was primarily due to the
increase
in the number of annual maintenance contract renewals driven by our growing fleet of installed Energy Servers.
Electricity Revenue
Electricity revenue
decrease
d by approximately
$9.3 million
, or
11.6%
, for
2019
, as compared to
2018
, due to a reduction in electricity revenues resulting from the decommissioning and deconsolidation of the existing Energy Servers during the PPA II and PPA IIIb upgrades of Energy Servers. Electricity revenue is driven from our former Bloom Electrons program, which included PPA II and PPA IIIb. When these PPAs were decommissioned, we no longer recognized electricity revenue for them.
66
Cost of Revenue
|
|
Years Ended
December 31, |
Change
|
|||||||||||||
|
|
2019
|
2018
|
Amount
|
%
|
|||||||||||
|
As Restated
|
|||||||||||||||
|
|
(dollars in thousands)
|
||||||||||||||
|
Cost of revenue:
|
|||||||||||||||
|
Product
|
$
|
435,479
|
|
$
|
281,275
|
|
$
|
154,204
|
|
54.8
|
%
|
||||
|
Installation
|
76,487
|
|
95,306
|
|
(18,819
|
)
|
(19.7
|
)%
|
|||||||
|
Service
|
100,238
|
|
100,689
|
|
(451
|
)
|
(0.4
|
)%
|
|||||||
|
Electricity
|
75,386
|
|
49,628
|
|
25,758
|
|
51.9
|
%
|
|||||||
|
Total cost of revenue
|
$
|
687,590
|
|
$
|
526,898
|
|
$
|
160,692
|
|
30.5
|
%
|
||||
Total Cost of Revenue
Total cost of revenue
increase
d by approximately
$160.7 million
, or
30.5%
, for
2019
, as compared to
2018
. Total cost of revenue in 2019 included an adjustment in connection with the adoption of ASC 606 of $7.1 million. Excluding the adjustment in connection with the adoption of ASC 606, total cost of revenue increased by approximately
$167.8 million
, or 31.9%. Further, included as a component of total cost of revenue, stock-based compensation increased approximately
$15.7 million
for
2019
, as compared to
2018
. Total cost of revenue, excluding stock-based compensation, increased approximately
$144.9 million
, or
29.2%
, for
2019
, as compared to
2018
. Cost of revenue for
2019
included
$94.8 million
in expenses associated with the PPA II and PPA IIIb upgrades of Energy Servers transactions. See
Note 13, Power Purchase Agreement Programs
- PPA II Upgrade of Energy Servers
for further details. Cost of revenue for 2018 included a payment of $9.4 million driven by the reinstatement of the ITC program in February 2018 where we were required to repay certain suppliers for previously negotiated contractual discounts.
Total cost of revenue, excluding stock-based compensation, the adjustment in connection with the adoption of ASC 606, the expenses associated with the PPA upgrades and the ITC reinstatement, increased approximately 66.7 million, or 13.7%, to $554.5 million for
2019
, as compared to $487.8 million for
2018
, primarily driven by higher volume of product acceptances.
Cost of Product Revenue
Cost of product revenue
increase
d by approximately
$154.2 million
, or
54.8%
, for
2019
, as compared to
2018
. Included as a component of cost of product revenue, stock-based compensation increased approximately $14.6 million for
2019
, as compared to
2018
. Cost of product revenue, excluding stock-based compensation, increased approximately $139.6 million, or 53.4%, for
2019
, as compared to
2018
. This increase was driven primarily by the increase in product acceptances of approximately
385
systems, or
47.6%
, for
2019
, as compared to
2018
. There was also a $70.5 million write-off associated with the PPA upgrade projects in
2019
, partially offset by a payment of $9.4 million recorded to cost of product revenue in
2018
. This $9.4 million cost was driven by the reinstatement of the ITC program in February 2018 where we were required to repay certain suppliers for previously negotiated contractual discounts.
Cost of Installation Revenue
Cost of installation revenue
decrease
d by approximately
$18.8 million
, or
19.7%
, for
2019
, as compared to
2018
. This decrease was generally driven by the higher mix of international acceptances in
2019
where we do not perform the installation service and due to lower install cost associated with the PPA II and the PPA IIIb upgrades of Energy Servers.
Cost of Service Revenue
Cost of service revenue
decrease
d by approximately
$0.5 million
, or
0.4%
, for
2019
, as compared to
2018
. Cost of service revenue in 2019 included an adjustment in connection with the adoption of ASC 606 of $6.5 million. This adjustment is associated with performance guarantees to our customers and with the adoption of ASC 606, these costs are recorded as a reduction to service revenue. Excluding the adjustment in connection with the adoption of ASC 606, cost of service revenue increased by approximately $6.1 million, or 6.1%. This increase in service cost was primarily due to more power module replacements required in the fleet as our fleet of installed Energy Servers grows with acceptances and additional extended service contracts are executed and renewed.
67
Cost of Electricity Revenue
Cost of electricity revenue
increase
d by approximately
$25.8 million
, or
51.9%
, for
2019
, as compared to
2018
, mainly due to a $24.4 million charge related to the decommissioning and deconsolidation of Energy Servers associated with the PPA II and PPA IIIb upgrades of Energy Servers.
Gross Profit (Loss)
|
|
Years Ended
December 31, |
Change
|
||||||||||
|
|
2019
|
2018
|
||||||||||
|
As Restated
|
||||||||||||
|
|
(dollars in thousands)
|
|||||||||||
|
Gross Profit:
|
||||||||||||
|
Product
|
$
|
121,857
|
|
$
|
119,363
|
|
$
|
2,494
|
|
|||
|
Installation
|
(15,661
|
)
|
(27,111
|
)
|
11,450
|
|
||||||
|
Service
|
(4,452
|
)
|
(17,422
|
)
|
12,970
|
|
||||||
|
Electricity
|
(4,157
|
)
|
30,920
|
|
(35,077
|
)
|
||||||
|
Total Gross Profit
|
$
|
97,587
|
|
$
|
105,750
|
|
$
|
(8,163
|
)
|
|||
|
Gross Margin:
|
||||||||||||
|
Product
|
22
|
%
|
30
|
%
|
|
|
||||||
|
Installation
|
(26
|
)%
|
(40
|
)%
|
|
|
||||||
|
Service
|
(5
|
)%
|
(21
|
)%
|
|
|
||||||
|
Electricity
|
(6
|
)%
|
38
|
%
|
|
|
||||||
|
Total Gross Margin
|
12
|
%
|
17
|
%
|
|
|
||||||
Total Gross Profit
Gross profit
decrease
d
$8.2 million
in
2019
, as compared to
2018
. During
2018
, gross profit included a one-time benefit of $36.1 million associated with the 2017 retroactive ITC benefit and
2019
included an adjustment in connection with the adoption of ASC 606 of $27.4 million. Excluding the one-time retroactive ITC benefit in
2018
and the adjustment in connection with the adoption of ASC 606 in 2019, gross profit increased approximately $55.4 million, or 79.5% in
2019
, as compared to
2018
. This increase was generally due to the increase in product acceptances and lower product cost driven by ongoing cost reduction activities.
Product Gross Profit
Product gross profit
increase
d
$2.5 million
in
2019
, as compared to
2018
. Excluding the one-time retroactive ITC benefit of $36.1 million in
2018
and the adjustment in connection with the adoption of ASC 606 in 2019 of $43.9 million, gross profit increased approximately $82.5 million, or 99.1% in
2019
, as compared to
2018
. This increase was generally due to the increase in product acceptances and lower product cost driven by ongoing cost reduction activities.
Installation Gross Loss
Installation gross
loss
decreased
$11.5 million
in
2019
, as compared to
2018
. Excluding the adjustment in connection with the adoption of ASC 606 in 2019 of $6.1 million, installation gross loss decreased by $5.4 million, or 19.7%. This improvement was due to lower installation costs due to a higher mix of international customer sites accepted in
2019
, as compared to
2018
. Our installation costs are driven by the complexity of each site at which we are installing an Energy Server, including personalized applications, the size of each installation, which can cause variability in installation costs, and whether we or our international partners perform the installation.
Service Gross Loss
Service gross
loss
decreased
$13.0 million
in
2019
, as compared to
2018
. Excluding the adjustment in connection with the adoption of ASC 606 in 2019 of $10.4 million, service gross loss decreased by $2.6 million, or 14.8%. This
improvement
was primarily due to an increase in service revenue outpacing the increase in service cost required for maintaining the fleet of installed Energy Servers.
68
Electricity Gross Profit
Electricity gross profit decreased
$35.1 million
, or
113.4%
in
2019
, as compared to
2018
, mainly due to charges related to the decommissioning and deconsolidation of Energy Servers associated with the PPA II and PPA IIIb upgrades of Energy Servers.
Operating Expenses
|
|
Years Ended
December 31, |
Change
|
|||||||||||||
|
|
2019
|
2018
|
Amount
|
%
|
|||||||||||
|
As Restated
|
|||||||||||||||
|
|
(dollars in thousands)
|
||||||||||||||
|
Research and development
|
$
|
104,168
|
|
$
|
89,135
|
|
$
|
15,033
|
|
16.9
|
%
|
||||
|
Sales and marketing
|
73,573
|
|
62,807
|
|
10,766
|
|
17.1
|
%
|
|||||||
|
General and administrative
|
152,650
|
|
118,817
|
|
33,833
|
|
28.5
|
%
|
|||||||
|
Total operating expenses
|
$
|
330,391
|
|
$
|
270,759
|
|
$
|
59,632
|
|
22.0
|
%
|
||||
Total Operating Expenses
Total operating expenses
increase
d
$59.6 million
, or
22.0%
, in
2019
, as compared to
2018
. Included as a component of total operating expenses, stock-based compensation expenses
increase
d approximately
$12.1 million
for
2019
, as compared to
2018
. The increase in stock-based compensation expense is primarily attributable to a one-time employee grant of restricted stock units ("RSUs") awarded prior to IPO with a performance condition of an IPO of the Company's securities. These RSUs have a two-year vesting period starting on the day of IPO and were issued as an employee retention vehicle to bring our stock-based compensation in line with our peer group. In addition to the one-time grant, the stock-based compensation includes some previously granted RSUs with vesting beginning upon the completion of our IPO. Total operating expenses, excluding stock-based compensation,
increase
d approximately
$47.6 million
, or
36.1%
, in
2019
, as compared to
2018
. This
increase
was primarily due to compensation related expenses associated with hiring new employees, investments for next generation servers and customer personalized application technology development, expenses related to our demand generation functions, expenses related to our public company readiness and a $5.9 million debt payoff make-whole penalty associated with the PPA II upgrade of Energy Servers
.
Research and Development
Research and development expenses
increase
d by approximately
$15.0 million
, or
16.9%
, in
2019
, as compared to
2018
. Included as a component of research and development expenses, stock-based compensation expenses
increase
d by approximately
$1.9 million
for
2019
, as compared to
2018
. Total research and development expenses, excluding stock-based compensation,
increase
d by approximately
$13.1 million
, or
26.2%
, for
2019
, as compared to
2018
. This
increase
was primarily due to compensation-related expenses for hiring new employees and investments made for our next generation technology development, sustaining engineering projects for the current Energy Server platform, and investments made for customer personalized applications, such as microgrid and storage solutions, and new fuel solutions utilizing biogas.
Sales and Marketing
Sales and marketing expenses
increase
d by approximately
$10.8 million
, or
17.1%
, in
2019
, as compared to
2018
. Included as a component of sales and marketing expenses, stock-based compensation expenses
increase
d by approximately
$0.2 million
for
2019
, as compared to
2018
. Total sales and marketing expenses, excluding stock-based compensation,
increase
d by approximately
$10.6 million
, or
34.6%
, for
2019
, as compared to
2018
. This increase was primarily due to compensation expenses related to hiring new employees and expenses related to efforts to increase demand and raise market awareness of our Energy Server solutions, expanding outbound communications, as well as efforts to attract new customer financing partners.
69
General and Administrative
General and administrative expenses
increase
d by approximately
$33.8 million
, or
28.5%
, in
2019
, as compared to
2018
. Included as a component of general and administrative expenses, stock-based compensation expenses
increase
d by approximately
$9.9 million
for
2019
, as compared to
2018
. The majority of this increase was due to stock-based compensation expenses related to the RSU grants made at the time of our IPO. Total general and administrative expenses, excluding stock-based compensation,
increase
d by approximately
$23.9 million
, or
46.5%
for
2019
, as compared to
2018
. The
increase
in general and administrative expenses was due to an increase in compensation related expenses associated with hiring new employees to support public company readiness across accounting and legal functions, expenses related to becoming a public company and information technology related expenses for infrastructure and security support, as well as $5.9 million for a debt payoff make-whole penalty associated with the PPA II upgrade of Energy Servers and a production insurance write-off of $1.8 million associated with the PPA IIIb upgrade of Energy Servers.
Stock-Based Compensation
|
|
Years Ended
December 31, |
Change
|
|||||||||||||
|
|
2019
|
2018
|
Amount
|
%
|
|||||||||||
|
As Restated
|
|||||||||||||||
|
|
(dollars in thousands)
|
||||||||||||||
|
Cost of revenue
|
$
|
45,429
|
|
$
|
29,680
|
|
$
|
15,749
|
|
53.1
|
%
|
||||
|
Research and development
|
40,949
|
|
39,029
|
|
1,920
|
|
4.9
|
%
|
|||||||
|
Sales and marketing
|
32,478
|
|
32,284
|
|
194
|
|
0.6
|
%
|
|||||||
|
General and administrative
|
77,435
|
|
67,489
|
|
9,946
|
|
14.7
|
%
|
|||||||
|
Total stock-based compensation
|
$
|
196,291
|
|
$
|
168,482
|
|
$
|
27,809
|
|
16.5
|
%
|
||||
Total stock-based compensation
increase
d
$27.8 million
, or
16.5%
, in
2019
, as compared to
2018
. Of the
$196.3 million
in stock-based compensation for
2019
, approximately $91.3 million was related to one-time employee grants of RSUs that were issued at the time of our IPO and that have a two-year vesting period. These RSUs provided us an employee retention vehicle to bring our stock-based compensation in line with our peer group. In addition, the stock-based compensation included some previously granted RSUs that vested upon the completion of our IPO.
Other Income and Expense
|
|
Years Ended
December 31, |
Change
|
||||||||||
|
|
2019
|
2018
|
||||||||||
|
As Restated
|
||||||||||||
|
|
(in thousands)
|
|||||||||||
|
Interest income
|
$
|
5,661
|
|
$
|
4,322
|
|
$
|
1,339
|
|
|||
|
Interest expense
|
(87,480
|
)
|
(97,021
|
)
|
9,541
|
|
||||||
|
Interest expense, related parties
|
(6,756
|
)
|
(8,893
|
)
|
2,137
|
|
||||||
|
Other income (expense), net
|
706
|
|
(999
|
)
|
1,705
|
|
||||||
|
Loss on revaluation of warrant liabilities and embedded derivatives
|
(2,160
|
)
|
(22,139
|
)
|
19,979
|
|
||||||
|
Total
|
$
|
(90,029
|
)
|
$
|
(124,730
|
)
|
$
|
34,701
|
|
|||
Total Other Expense
Total other expense
decrease
d
$34.7 million
in
2019
, as compared to
2018
. This
decrease
was primarily due to the change in accounting for warrant liabilities and embedded derivatives that occurred at the time of the IPO removing the re-measurement requirement for these instruments, as well as due to a decrease in interest expense following the conversion of a portion of our debt into equity at the time of the IPO and the reduction of debt due to the PPA II and PPA IIIb upgrades.
Interest Income
Interest income increased
$1.3 million
in
2019
, as compared to
2018
. This increase was primarily due to the increase in interest on the cash and short-term investment balances which increased from proceeds from the IPO.
70
Interest Expense
Interest expense decreased
$9.5 million
in
2019
, as compared to
2018
. This decrease was primarily due to lower amortization expense of our debt derivatives and a decrease in interest expense with the debt buy-out due to the PPA II and PPA IIIb upgrades.
Interest Expense, Related Parties
Interest expense, related parties decreased
$2.1 million
due to the conversion of $40.1 million of our 8% Notes from related parties into equity at the time of the IPO.
Other Income (Expense), net
Other income (expense), net increased
$1.7 million
in
2019
, as compared to
2018
, due to changes in foreign currency translation expense.
Loss on Revaluation of Warrant Liabilities and Embedded Derivatives
Upon the IPO in
2018
, the final valuation of the embedded derivatives related to the 6% Notes was reclassified from a derivative liability to additional paid-in capital and as a result, we did not record any valuation adjustments in
2019
. In 2018, we recognized net loss of
$22.1 million
primarily due to an increase in the value of our derivatives of $31.2 million, which was partially offset by gains recognized from the revaluation of the preferred warrant liability of
$9.1 million
.
Provision for Income Taxes
|
|
Years Ended
December 31, |
Change
|
|||||||||||||
|
|
2019
|
2018
|
Amount
|
%
|
|||||||||||
|
|
(dollars in thousands)
|
||||||||||||||
|
Income tax provision
|
$
|
633
|
|
$
|
1,537
|
|
$
|
(904
|
)
|
(58.8
|
)%
|
||||
Income tax provision
decrease
d in
2019
, as compared to
2018
, and was primarily due to fluctuations in the effective tax rates on income earned by international entities.
Net Loss Attributable to Noncontrolling Interests and Redeemable Noncontrolling Interests
|
|
Years Ended
December 31, |
Change
|
|||||||||||||
|
|
2019
|
2018
|
Amount
|
%
|
|||||||||||
|
|
(dollars in thousands)
|
||||||||||||||
|
Less: net loss attributable to noncontrolling interests and redeemable noncontrolling interests
|
$
|
(19,052
|
)
|
$
|
(17,736
|
)
|
$
|
(1,316
|
)
|
(7.4
|
)%
|
||||
Total
loss
attributable to noncontrolling interests increased
$1.3 million
, or
7.4%
, in
2019
, as compared to
2018
. The net loss increased due to increased losses in our PPA Entities which are allocated to our noncontrolling interests.
71
Comparison of the Years Ended December 31, 2018 and 2017
Revenue
|
|
Years Ended
December 31, |
Change
|
|||||||||||||
|
|
2018
|
2017
|
Amount
|
%
|
|||||||||||
|
As Restated
|
As Revised
|
||||||||||||||
|
|
(dollars in thousands)
|
||||||||||||||
|
Product
|
$
|
400,638
|
|
$
|
157,192
|
|
$
|
243,446
|
|
154.9
|
%
|
||||
|
Installation
|
68,195
|
|
57,937
|
|
10,258
|
|
17.7
|
%
|
|||||||
|
Service
|
83,267
|
|
74,892
|
|
8,375
|
|
11.2
|
%
|
|||||||
|
Electricity
|
80,548
|
|
75,602
|
|
4,946
|
|
6.5
|
%
|
|||||||
|
Total revenue
|
$
|
632,648
|
|
$
|
365,623
|
|
$
|
267,025
|
|
73.0
|
%
|
||||
Total Revenue
Total revenue
increase
d by approximately
$267.0 million
, or
73.0%
, for
2018
, as compared to
2017
. There were four principal drivers of this revenue increase.
First, product acceptances
increase
d by approximately
187
systems, or
30.1%
, for
2018
, as compared to
2017
.
Second, we achieved a higher mix of orders from customers where revenue is recognized on acceptance compared to orders where revenue is recognized ratably over the term of the agreement. In
2018
, we recognized
89.6%
of our orders at acceptance, whereas only
77.4%
of total acceptances in
2017
were recognized at acceptance.
Third, the Federal Investment Tax Credit ("ITC") was reinstated on February 9, 2018. ITC was not available to the fuel cell industry in 2017, however, our revenue in
2018
includes the benefit of the reinstatement.
Lastly, the adoption of customer personalized applications, such as batteries and grid-independent solutions, increased in
2018
, as compared to
2017
. Customer orders that include these personalized applications generated, on average, higher revenue than our standard orders that do not include these personalized applications.
Product Revenue
Product revenue
increase
d by approximately
$243.4 million
, or
154.9%
, for
2018
, as compared to
2017
. This increase was driven by the increase in acceptances, higher mix of orders where revenue is recognized on acceptance, the ITC reinstatement, and an increase in the sales of customer personalized applications.
Installation Revenue
Installation revenue
increase
d by approximately
$10.3 million
, or
17.7%
, for
2018
, as compared to
2017
. This increase was driven by the increase in acceptances, higher mix of orders where revenue is recognized on acceptance, and an increase in the sales of customer personalized applications, partially offset by the lower installation revenue associated with one large customer in
2018
where the installation was performed by the customer and as a result, we did not have any installation revenue for that customer. In general, when a customer or, in the case of SK E&C in the Republic of Korea, a partner performs the installation service, we do not generate significant revenue for the installation.
Service Revenue
Service revenue
increase
d by approximately
$8.4 million
, or
11.2%
for
2018
, as compared to
2017
. This was primarily due to the increase in the number of annual maintenance contract renewals driven by our growing fleet of installed Energy Servers.
Electricity Revenue
Electricity revenue
increase
d by approximately
$4.9 million
, or
6.5%
, for
2018
, as compared to
2017
, due primarily to a growing fleet of installed Energy Servers related to our managed service customers where revenue is recognized over the term of the agreement, as well as Bloom Electrons customers whose contracts were initiated in 2017 and therefore only recognized revenue for a partial year versus a full year in 2018.
72
Cost of Revenue
|
|
Years Ended
December 31, |
Change
|
|||||||||||||
|
|
2018
|
2017
|
Amount
|
%
|
|||||||||||
|
As Restated
|
As Revised
|
||||||||||||||
|
|
(dollars in thousands)
|
||||||||||||||
|
Cost of revenue:
|
|||||||||||||||
|
Product
|
$
|
281,275
|
|
$
|
192,361
|
|
$
|
88,914
|
|
46.2
|
%
|
||||
|
Installation
|
95,306
|
|
54,970
|
|
40,336
|
|
73.4
|
%
|
|||||||
|
Service
|
100,689
|
|
85,128
|
|
15,561
|
|
18.3
|
%
|
|||||||
|
Electricity
|
49,628
|
|
49,475
|
|
153
|
|
0.3
|
%
|
|||||||
|
Total cost of revenue
|
$
|
526,898
|
|
$
|
381,934
|
|
$
|
144,964
|
|
38.0
|
%
|
||||
Total Cost of Revenue
Total cost of revenue
increase
d by approximately
$145.0 million
, or
38.0%
, for
2018
, as compared to
2017
. Included as a component of total cost of revenue, stock-based compensation increased approximately
$23.3 million
for
2018
, as compared to
2017
. Total cost of revenue, excluding stock-based compensation, increased approximately
$121.6 million
, or
32.4%
, to
$497.2 million
for
2018
, as compared to
$375.6 million
for
2017
. This increase in total cost of revenue was primarily attributable to higher product and install cost of revenue which was driven by an increase in the volume of product acceptances and a higher mix of orders with customers in which cost of revenue is recognized on acceptance, instead of ratably over the life of the agreement. Additionally there was an increase in the sales of customer personalized applications for
2018
. These applications generally have a cost associated with them and therefore cause an increase in the cost of revenue.
Cost of Product Revenue
Cost of product revenue
increase
d by approximately
$88.9 million
, or
46.2%
, for
2018
, as compared to
2017
. This increase was driven by the increase in acceptances, higher mix of orders where cost of revenue is recognized on acceptance, increased costs from the sales of customer personalized applications, and an increase in stock-based compensation. Additionally, as a result of the reinstatement of the ITC program in February
2018
, we were required to repay certain suppliers for previously negotiated contractual discounts. This payment of $9.4 million was recorded to cost of product revenue.
Cost of Installation Revenue
Cost of installation revenue
increase
d by approximately
$40.3 million
, or
73.4%
, for
2018
, as compared to
2017
. This increase was driven by the increase in acceptances, higher mix of orders where cost of revenue is recognized on acceptance, and increased costs from the sales of customer personalized applications where the installation is more complex, partially offset by the lower cost of installation associated with one large customer in
2018
where the installation was performed by the customer and as a result, we did not have any installation cost for that customer. In general, when we do not perform the installation function for a customer, such as in SK E&C in the Republic of Korea, we do not incur any significant installation costs on those orders.
Cost of Service Revenue
Cost of service revenue
increase
d by approximately
$15.6 million
, or
18.3%
, for
2018
, as compared to
2017
. This increase in service cost was primarily due to more power module replacements required in the fleet as a result of a larger fleet of installed Energy Servers, as well as replacing older generation power modules during the normal service process.
Cost of Electricity Revenue
Cost of electricity revenue
increase
d by approximately
$0.2 million
, or
0.3%
, for
2018
, as compared to
2017
, due to a growing fleet of installed Energy Servers related to our managed service customers where cost is recognized over the term of the agreement, as well as Bloom Electrons customers whose contracts were initiated in 2017 and therefore, we only recognized cost for a partial year versus a full year in 2018. These increases were offset by a gain recorded as a result of the fair value adjustment on our natural gas fixed price forward contract.
73
Gross Profit (Loss)
|
|
Years Ended
December 31, |
Change
|
||||||||||
|
|
2018
|
2017
|
||||||||||
|
As Restated
|
As Revised
|
|||||||||||
|
|
(dollars in thousands)
|
|||||||||||
|
Gross Profit (Loss):
|
||||||||||||
|
Product
|
$
|
119,363
|
|
$
|
(35,169
|
)
|
$
|
154,532
|
|
|||
|
Installation
|
(27,111
|
)
|
2,967
|
|
(30,078
|
)
|
||||||
|
Service
|
(17,422
|
)
|
(10,236
|
)
|
(7,186
|
)
|
||||||
|
Electricity
|
30,920
|
|
26,127
|
|
4,793
|
|
||||||
|
Total Gross Profit (Loss)
|
$
|
105,750
|
|
$
|
(16,311
|
)
|
$
|
122,061
|
|
|||
|
Gross Margin
|
||||||||||||
|
Product
|
30
|
%
|
(22
|
)%
|
||||||||
|
Installation
|
(40
|
)%
|
5
|
%
|
||||||||
|
Service
|
(21
|
)%
|
(14
|
)%
|
||||||||
|
Electricity
|
38
|
%
|
35
|
%
|
||||||||
|
Total Gross Margin
|
17
|
%
|
(4
|
)%
|
||||||||
Total Gross Profit
Gross profit
improve
d
$122.1 million
in
2018
, as compared to
2017
. This improvement was generally as a result of higher product margins due to the increase in product acceptances which drove higher volume, a higher mix of orders recognized at acceptance versus ratably over the life of the agreement, and the reinstatement of the ITC.
Product Gross Profit
Product gross profit
improve
d
$154.5 million
in
2018
, as compared to
2017
. This increase was due to the increase in product acceptances which drove higher volume, a higher mix of orders recognized at acceptance versus ratably over the life of the Bloom Electrons' or managed service contracts and the reinstatement of the ITC.
Installation Gross Loss
Installation gross amount worsened
$30.1 million
in
2018
, as compared to
2017
. This decrease from profit to a loss was due to higher installation costs associated with the initial installations for the new customer personalized applications. Our installation costs are driven by the complexity of each site at which we are installing an Energy Server, including personalized applications, as well as the size of each installation, which can cause variability in installation costs from year-to-year.
Service Gross Loss
Service gross loss worsened
$7.2 million
in
2018
, as compared to
2017
. This increased loss was primarily due to more power module replacements required in the fleet as a result of a larger fleet of installed Energy Servers, as well as replacing older power modules during the normal service process.
Electricity Gross Profit
Electricity gross profit
increase
d
$4.8 million
, or
18.3%
, in
2018
, as compared to
2017
due to a gain recorded as a result of the fair value adjustment on a natural gas fixed price forward contract and a growing fleet of installed Energy Servers related to our managed service customers.
74
Operating Expenses
|
|
Years Ended
December 31, |
Change
|
|||||||||||||
|
|
2018
|
2017
|
Amount
|
%
|
|||||||||||
|
As Restated
|
As Revised
|
||||||||||||||
|
|
(dollars in thousands)
|
||||||||||||||
|
Research and development
|
$
|
89,135
|
|
$
|
51,146
|
|
$
|
37,989
|
|
74.3
|
%
|
||||
|
Sales and marketing
|
62,807
|
|
31,926
|
|
30,881
|
|
96.7
|
%
|
|||||||
|
General and administrative
|
118,817
|
|
55,689
|
|
63,128
|
|
113.4
|
%
|
|||||||
|
Total operating expenses
|
$
|
270,759
|
|
$
|
138,761
|
|
$
|
131,998
|
|
95.1
|
%
|
||||
Total Operating Expenses
Total operating expenses increased
$132.0 million
, or
95.1%
, in
2018
, as compared to
2017
. Included as a component of total operating expenses, stock-based compensation expenses increased approximately
$116.1 million
for
2018
, as compared to
2017
, accounting for much of the year-over-year increase. The increase in stock-based compensation is primarily attributable to a one-time employee grant of restricted stock units ("RSUs") at the time of our IPO and that have a two-year vesting period. These RSUs provided us with a market equity employee retention vehicle to help us compete for talent across our peer group. Additionally, the stock-based compensation included some previously granted RSUs that vested upon the completion of our IPO. Total operating expenses, excluding stock-based compensation, increased approximately
$15.9 million
, or
13.7%
, in
2018
, as compared to
2017
. This increase was primarily due to compensation related expenses associated with hiring new employees, investments for next generation servers and customer personalized application technology development, and expenses related to our efforts to increase demand and raise market awareness of our Energy Server solutions, as well as to drive new customer financing partners.
Research and Development
Research and development expenses
increase
d by approximately
$38.0 million
, or
74.3%
, in
2018
, as compared to
2017
. Included as a component of research and development expenses, stock-based compensation expenses
increase
d by approximately
$33.5 million
for
2018
, as compared to
2017
. The majority of this increase was due to stock-based compensation expenses related to the RSU grants made at the time of our IPO. Total research and development expenses, excluding stock-based compensation,
increase
d by approximately
$4.5 million
, or
9.9%
, for
2018
, as compared to
2017
. This increase was primarily due to compensation-related expenses related to hiring new employees and investments made for customer personalized applications, such as a battery solution, sustaining engineering projects for the current Energy Server platform and investments made for our next generation technology development.
Sales and Marketing
Sales and marketing expenses increased by approximately
$30.9 million
, or
96.7%
, in
2018
, as compared to
2017
. Included as a component of sales and marketing expenses, stock-based compensation expenses
increase
d by approximately
$27.6 million
for
2018
, as compared to
2017
. The majority of this increase was due to stock-based compensation expenses related to the RSU grants made at the time of our IPO. Total sales and marketing expenses, excluding stock-based compensation,
increase
d by approximately
$3.3 million
, or
12.0%
, for
2018
, as compared to
2017
. This increase was primarily due to compensation expenses related to hiring new employees and expenses related to efforts to increase demand and raise market awareness of our Energy Server solutions, expanding outbound communications, as well as efforts to attract new customer financing partners.
General and Administrative
General and administrative expenses increased by approximately
$63.1 million
, or
113.4%
, in
2018
, as compared to
2017
. Included as a component of general and administrative expenses, stock-based compensation expenses
increase
d by approximately
$55.0 million
for
2018
, as compared to
2017
. The majority of this increase was due to stock-based compensation expenses related to the RSU grants made at the time of our IPO. Total general and administrative expenses, excluding stock-based compensation,
increase
d by approximately
$8.1 million
, or
18.8%
, for
2018
, as compared to
2017
. The increase in general and administrative expenses was due to an increase in compensation related expenses associated with hiring new employees to support public company readiness across accounting and legal functions, expenses related to becoming a public company and information technology related expenses for infrastructure and security support.
75
Stock-Based Compensation
|
|
Years Ended
December 31, |
Change
|
|||||||||||||
|
|
2018
|
2017
|
Amount
|
%
|
|||||||||||
|
As Restated
|
As Revised
|
||||||||||||||
|
|
(dollars in thousands)
|
||||||||||||||
|
Cost of revenue
|
$
|
29,680
|
|
$
|
6,355
|
|
$
|
23,325
|
|
367
|
%
|
||||
|
Research and development
|
39,029
|
|
5,560
|
|
33,469
|
|
602
|
%
|
|||||||
|
Sales and marketing
|
32,284
|
|
4,685
|
|
27,599
|
|
589
|
%
|
|||||||
|
General and administrative
|
67,489
|
|
12,501
|
|
54,988
|
|
440
|
%
|
|||||||
|
Total stock-based compensation
|
$
|
168,482
|
|
$
|
29,101
|
|
$
|
139,381
|
|
479
|
%
|
||||
Total stock-based compensation
increase
d
$139.4 million
, or
479%
, in
2018
, as compared to
2017
. Of the
$168.5 million
in stock-based compensation for
2018
, approximately $139.1 million was related to one-time employee grant of RSUs that were issued at the time of our IPO and that have a two-year vesting period. These RSUs provided us with a market equity employee retention vehicle necessary to compete for talent across our peer group. In addition, the stock-based compensation included some previously granted RSUs that vested upon completion of our IPO.
Other Income and Expense
|
|
Years Ended
December 31, |
Change
|
||||||||||
|
|
2018
|
2017
|
||||||||||
|
As Restated
|
As Revised
|
|||||||||||
|
|
(in thousands)
|
|||||||||||
|
Interest income
|
$
|
4,322
|
|
$
|
759
|
|
$
|
3,563
|
|
|||
|
Interest expense
|
(97,021
|
)
|
(112,039
|
)
|
15,018
|
|
||||||
|
Interest expense, related parties
|
(8,893)
|
|
(12,265
|
)
|
3,372
|
|
||||||
|
Other expense, net
|
(999
|
)
|
(491
|
)
|
(508
|
)
|
||||||
|
Loss on revaluation of warrant liabilities and embedded derivatives
|
(22,139
|
)
|
(15,284
|
)
|
(6,855
|
)
|
||||||
|
Total
|
$
|
(124,730
|
)
|
$
|
(139,320
|
)
|
$
|
14,590
|
|
|||
Total Other Expense
Total other expense decreased
$14.6 million
in
2018
, as compared to
2017
. This decrease was primarily due to the decrease in interest expense following the conversion of a portion of our debt into equity at the time of the IPO.
Interest Income
Interest income increased
$3.6 million
in
2018
, as compared to
2017
. This increase was primarily due to the increase in interest on the short-term investment balances which increased from proceeds from the IPO.
Interest Expense
Interest expense decreased
$15.0 million
in
2018
, as compared to
2017
. This decrease was primarily due to lower amortization expense of our debt derivatives and due to the conversion of a portion of our debt into equity at the time of the IPO.
Interest Expense, Related Parties
Interest expense, related parties decreased
$3.4 million
due to the conversion of $40.1 million of our 8% Notes from related parties into equity at the time of the IPO.
Other Income (Expense), net
Other expense decreased
$0.5 million
in
2018
, as compared to
2017
. This change was primarily due to an increase in interest income, partially offset by foreign currency translation.
76
Revaluation of Warrant Liabilities and Embedded Derivatives
For
2018
, we recognized net loss of
$22.1 million
primarily due to an increase in the value of our derivatives of $31.2 million, which was partially offset by gains recognized from the revaluation of the preferred warrant liability of
$9.1 million
. The loss on revaluation of warrant liabilities and embedded derivatives increased
$6.9 million
when compared to
2017
.
Provision for Income Taxes
|
|
Years Ended
December 31, |
Change
|
|||||||||||||
|
|
2018
|
2017
|
Amount
|
%
|
|||||||||||
|
|
(dollars in thousands)
|
||||||||||||||
|
Income tax provision
|
$
|
1,537
|
|
$
|
636
|
|
$
|
901
|
|
141.7
|
%
|
||||
Income tax provision
increase
d in
2018
, as compared to
2017
and was primarily due to fluctuations in the effective tax rates on income earned by international entities.
Net Loss Attributable to Noncontrolling Interests and Redeemable Noncontrolling Interests
|
|
Years Ended
December 31, |
Change
|
|||||||||||||
|
|
2018
|
2017
|
Amount
|
%
|
|||||||||||
|
|
(dollars in thousands)
|
||||||||||||||
|
Net loss attributable to noncontrolling interests and redeemable noncontrolling interests
|
$
|
(17,736
|
)
|
$
|
(18,666
|
)
|
$
|
930
|
|
5.0
|
%
|
||||
Total
loss
attributable to noncontrolling interests
decrease
d
$0.9 million
, or
5.0%
, in
2018
, as compared to
2017
. The net loss
decrease
d due to the allocation of our lower net loss using HLBV allocation methodology.
Liquidity and Capital Resources
As of
December 31, 2019
, we had an accumulated deficit of approximately
$2.9 billion
. We have financed our operations, including the costs of acquisition and installation of Energy Servers, mainly through a variety of financing arrangements and PPA Entities, credit facilities from banks, sales of our common stock, debt financings and cash generated from our operations. As of
December 31, 2019
, we had
$401.4 million
of total outstanding recourse debt,
$235.4 million
of non-recourse debt and
$28.0 million
other long term liabilities. See Note 7,
Outstanding Loans and Security Agreements
for a complete description of our outstanding debt. As of
December 31, 2019
and 2018, we had cash and cash equivalents and short-term investments of
$202.8 million
and
$325.1 million
, respectively.
In July 2018, we successfully completed an initial public offering ("IPO") of our securities with the sale of
20,700,000
shares of our Class A common stock at a price of
15.00
per share, resulting in cash proceeds of
$282.3 million
, net of underwriting discounts, commissions and estimated offering costs.
We believe that our existing cash and cash equivalents will be sufficient to meet our operating and capital cash flow requirements and other cash flow needs for at least the next 12 months from the date of this Annual Report on Form 10-K. As of December 31, 2019, the current portion of our total debt is $337.6 million, which would require cash payments of $353.5 million in the next 12 months. On March 31, 2020, we extended the maturity for all but $70.0 million of current debt as follows:
We entered into an Amendment Support Agreement (the “Amendment Support Agreement”) with the beneficial owners (the “Noteholders”) of our outstanding 6.0% Convertible Notes due 2020 (the “Convertible Notes”) pursuant to which such Noteholders have agreed, subject to certain conditions set forth therein, to consent to, among other things, certain amendments to the indenture (the “Proposed Amendments”) dated as of December 15, 2015, as supplemental by the First Supplemental Indenture dated as of September 20, 2016, the Second Supplemental Indenture dated as of June 29, 2017 and the Third Supplemental Indenture dated as of January 18, 2018, each among us, the guarantor party thereto and U.S. Bank National Association, as trustee and collateral agent (as so supplemented, the “Original Indenture”), pursuant to which the Convertible Notes were issued to extend the maturity date of the Convertible Notes to December 1, 2021.
In connection with the execution and delivery of the Amendment Documents, on March 31, 2020, we entered into an Amended and Restated Subordinated Secured Convertible Note Modification Agreement (the “Constellation Note Modification Agreement”) with Constellation NewEnergy, Inc. (“Constellation”) pursuant to which certain terms of our outstanding Amended and Restated Subordinated Secured Convertible Note issued to Constellation were modified to extend the maturity date to December 31, 2021.
Furthermore, on March 31, 2020, we entered into a note purchase agreement and convertible note purchase agreement, as follows:
We entered into a note purchase agreement (the “Note Purchase Agreement”) with certain investors pursuant to which such investors have agreed to purchase, and we have agreed to issue, $70.0 million of 10.25% Senior Secured Notes due 2027 (the “Senior Secured Notes”) in a private placement (the “Senior Secured Notes Private Placement”). The funding of the Note Purchase Agreement is subject to certain conditions including obtaining a rating from a rating agency.
We entered into a convertible note purchase agreement (the “Convertible Note Purchase Agreement”) with Foris Ventures, LLC and New Enterprise Associates 10, Limited Partnership (together, the “Purchasers”), pursuant to which such Purchasers were issued $30.0 million aggregate principal amount of additional Convertible Notes (the “Additional Convertible Notes”) under the Amended and Restated Indenture.
The combination of our existing cash and cash equivalents, the extension of the Convertible Notes and Constellation Note Modification to December 2021, the proceeds from the convertible note agreement and operating cash flows are expected to be sufficient to meet our operational and capital cash flow requirements and other cash flows for the next 12 months from the date of this Annual Report on Form 10-K, including the current portion of our total debt.
Our future cash flow requirements may vary materially from those currently planned and will depend on many factors, including our rate of revenue growth, the timing and extent of spending on research and development efforts and other business initiatives, the rate of growth in the volume of system builds, the expansion of sales and marketing activities, market acceptance of our products, the timing of receipt by us of distributions from our PPA Entities and overall economic conditions including the impact of COVID-19 on our future operations. We do not expect to receive significant cash distributions from our PPA Entities. During June 2019, we completed a transaction for the PPA II upgrade of Energy Servers and we repaid all the PPA II outstanding debt of
$76.8 million
. During November 2019, we
77
completed a transaction for the PPA IIIb upgrade of Energy Servers and we repaid all the PPA IIIb outstanding debt of
$23.9 million
. For additional information refer to
Note 13, Power Purchase Agreement Programs.
Cash Flows
A summary of our sources and uses of cash, cash equivalents and restricted cash is as follows (in thousands):
|
|
Years Ended
December 31, |
|||||||||||
|
|
2019
|
2018
|
2017
|
|||||||||
|
|
As Restated
|
As Revised
|
||||||||||
|
Net cash provided by (used in):
|
||||||||||||
|
Operating activities
|
$
|
163,770
|
|
$
|
(91,948
|
)
|
$
|
(91,966
|
)
|
|||
|
Investing activities
|
53,447
|
|
(125,375
|
)
|
(88,247
|
)
|
||||||
|
Financing activities
|
(120,314
|
)
|
317,196
|
|
142,910
|
|
||||||
Net cash
provided
by (used in) our variable interest entities (the PPA Entities) which are incorporated into the consolidated statements of cash flows for
December 31, 2019
,
2018
and 2017, is as follows (in thousands):
|
|
Years Ended
December 31, |
|||||||||||
|
|
2019
|
2018
|
2017
|
|||||||||
|
PPA Entities ¹
|
||||||||||||
|
Net cash provided by PPA operating activities
|
$
|
279,402
|
|
$
|
30,612
|
|
$
|
24,797
|
|
|||
|
Net cash used in PPA financing activities
|
(167,259
|
)
|
(38,813
|
)
|
(30,525
|
)
|
||||||
1
The PPA Entities' operating and financing cash flows are a subset of our consolidated cash flows and represents the stand-alone cash flows prepared in accordance with U.S. GAAP. Operating activities consist principally of cash used to run the operations of the PPA Entities, the purchase of Energy Servers from us and principal reductions in loan balances. Financing activities consist primarily of changes in debt carried by our PPAs, and payments from and distributions to noncontrollling partnership interests. We believe this presentation of net cash provided by (used in) PPA activities is useful to provide the reader with the impact to consolidated cash flows of the PPA Entities in which we have only a minority interest.
Operating Activities
Net cash provided by operating activities for the
twelve months ended
December 31, 2019
was
$163.8 million
and was primarily the result of net cash earnings of
$67.3 million
plus the net decrease in working capital of
$96.5 million
. Net cash earnings is primarily comprised of a net loss of
$323.5 million
, adjusted for non-cash benefit items including: (i) depreciation and amortization of
$78.6 million
; (ii) PPA II and PPA IIIb decommissioning costs of
$70.5 million
; (iii) write-off of property, plant and equipment net of
$3.1 million
; (iv) impairment of assets of
$11.3 million
; (v) a loss on revaluation of derivative contracts of
$2.8 million
; (vi) stock-based compensation of
$196.3 million
; (vii) amortization of debt issuance cost of
$22.1 million
, plus (viii) an expense reclass to financing activities related to a debt make-whole expense of
$5.9 million
. Net cash provided from changes in working capital consisted primarily of decreases in: (i) accounts receivable of
$52.0 million
; (ii) inventories of
$18.4 million
; (iii) customer financing receivable of
$5.5 million
; (iv) prepaid expenses and other current assets of
$8.6 million
; and (v) other long-term assets of
$3.6 million
; plus increases in: (vi) accrued expenses and other current liabilities of
$6.7 million
; and (vii) other long-term liabilities of
$4.4 million
, and (viii) deferred revenue and contract liabilities of
$37.1 million
. These sources of cash from working capital were partially offset by increases in: (i) deferred cost of revenue of
$22.0 million
; and (ii) decreases in: accounts payable of
$11.3 million
and (iii) accrued warranty of
$6.6 million
.
Net cash used in operating activities for the
twelve months ended
December 31, 2018
was
$91.9 million
and was the result of net cash loss of
$22.4 million
and the net increase in working capital of
$69.5 million
. Net cash loss is primarily comprised of a net loss of
$291.3 million
, adjusted for non-cash benefit items including: (i) depreciation and amortization of approximately
$53.9 million
; (ii) write-off of property, plant and equipment net of
$0.9 million
; (iii) a loss on revaluation of derivative contracts of
$29.0 million
; (iv) stock-based compensation of
$168.5 million
; and (v) amortization of debt issuance cost of
$25.4 million
; partially offset by (vi) a gain on revaluation of stock warrants of
$9.1 million
. Net cash used by changes in working capital consisted primarily of increases in: (i) accounts receivable of
$55.0 million
; (ii) inventory of
$37.0 million
; and (iii) prepaid expenses and other current assets of
$8.0 million
; plus a decrease in: (iv) accrued expenses and other current liabilities of
$6.0 million
; and (v) deferred revenue
78
and contract liabilities of
$21.8 million
. These uses of cash for working capital were partially offset by decreases in: (i) deferred cost of revenue of
$14.2 million
; and (ii) customer financing receivable and other of
$4.9 million
; plus increases in: (iv) accounts payable of
$18.3 million
; (v) accrued warranty of
$1.5 million
; and (vi) other long term liabilities of
$19.6 million
.
Net cash used in operating activities for the
twelve months ended
December 31, 2017
was
$92.0 million
and was the result of net cash loss of
$152.2 million
partially offset by the net increase in working capital of
$60.2 million
. Net cash loss is primarily comprised of a net loss of
$295.0 million
, adjusted for non-cash benefit items including: (i) depreciation and amortization of approximately
$54.4 million
; (ii) a loss on revaluation of derivative contracts of
$15.0 million
; (iii) stock-based compensation of
$29.1 million
; and (iv) amortization of debt issuance cost of
$47.3 million
; partially offset by (v) a gain on revaluation of stock warrants of
$3.0 million
. Net cash provided by changes in working capital consisted primarily of decreases in: (i) accounts receivable of
$3.2 million
; (ii) customer financing receivable and other of
$5.5 million
, and (iii) other long-term assets of
$0.8 million
; plus an increase in: (iv) accrued expenses and other current liabilities of
$8.0 million
; (v) deferred revenue and contract liabilities of
$48.3 million
; and (vi) other long term liabilities of
$37.6 million
. These sources of cash from working capital were partially offset by increases in: (i) inventory of
$10.6 million
; (ii) deferred cost of revenue of
$31.3 million
; and (iii) prepaid expenses and other current assets of
$1.0 million
; plus decrease in: (iv) accrued warranty of
$7.4 million
.
Investing Activities
Net cash provided by investing activities in the
twelve months ended
December 31, 2019
was
$53.4 million
which included proceeds from maturity of marketable securities of
$104.5 million
, partially offset by
$51.1 million
used for the purchase of long-lived assets. Our use of cash in the
twelve months ended
December 31, 2019
for the purchase of property, plant and equipment increased, as compared to the same period in 2018, due to completing a move to our new corporate headquarters which is used for administration, research and development, and sales and marketing.
Net cash used in investing activities in the
twelve months ended
December 31, 2018
was
$125.4 million
which was primarily the result of net purchase of marketable securities of
$76.9 million
, plus
$48.5 million
used for the purchase of long-lived assets.
Net cash used in investing activities in the
twelve months ended
December 31, 2017
was
$88.2 million
which was primarily the result of net purchase of marketable securities of
$26.8 million
, plus
$61.5 million
used for the purchase of long-lived assets.
Financing Activities
Net cash used in financing activities in the
twelve months ended
December 31, 2018
was
$120.3 million
which included payments to noncontrolling and redeemable noncontrolling interest of
$56.5 million
, distributions paid to our PPA Equity Investors of
$12.5 million
, repayments of debt of
$121.5 million
, and a debt make-whole payment of
$5.9 million
related to our PPA II upgrade of Energy Servers, partially offset by proceeds from issuance of common stock of
$12.7 million
.
Net cash provided by financing activities in the
twelve months ended
December 31, 2018
was
$317.2 million
resulted primarily from our initial public offering netting
$292.5 million
plus proceeds from the issuance of common stock of
$1.5 million
, partially offset by distributions paid to our PPA Equity Investors of
$15.3 million
, repayments of long-term debt of
$20.2 million
, and payments of initial public offering issuance costs of
$5.5 million
.
Net cash provided by financing activities in the
twelve months ended
December 31, 2017
was
$142.9 million
resulted from net proceeds from the issuance of debt of
$93.9 million
and net proceeds from noncontrolling and redeemable noncontrolling interests of
$13.7 million
, partially offset by distributions paid to our PPA Equity Investors of
$23.7 million
, repayments of long-term debt of
$21.4 million
, and costs related to our initial public offering of
$1.1 million
.
79
Outstanding Loans and Security Agreements
The following is a summary of our debt as of
December 31, 2019
(in thousands):
|
|
Unpaid
Principal Balance |
Net Carrying Value
|
Unused
Borrowing Capacity |
|||||||||||||||||
|
|
Current
|
Long-
Term |
Total
|
|||||||||||||||||
|
LIBOR + 4% term loan due November 2020
|
$
|
1,571
|
|
$
|
1,536
|
|
$
|
—
|
|
$
|
1,536
|
|
$
|
—
|
|
|||||
|
5% convertible promissory note due December 2020
|
33,104
|
|
36,482
|
|
—
|
|
36,482
|
|
—
|
|
||||||||||
|
6% convertible promissory notes due December 2020
|
289,299
|
|
273,410
|
|
—
|
|
273,410
|
|
—
|
|
||||||||||
|
10% notes due July 2024
|
93,000
|
|
14,000
|
|
75,962
|
|
89,962
|
|
—
|
|
||||||||||
|
Total recourse debt
|
416,974
|
|
325,428
|
|
75,962
|
|
401,390
|
|
—
|
|
||||||||||
|
7.5% term loan due September 2028
|
38,338
|
|
3,882
|
|
31,088
|
|
34,970
|
|
—
|
|
||||||||||
|
6.07% senior secured notes due March 2030
|
80,988
|
|
3,151
|
|
76,865
|
|
80,016
|
|
—
|
|
||||||||||
|
LIBOR + 2.5% term loan due December 2021
|
121,784
|
|
5,122
|
|
115,315
|
|
120,437
|
|
—
|
|
||||||||||
|
Available letters of credit, expires December 2021
|
—
|
|
—
|
|
—
|
|
—
|
|
1,220
|
|
||||||||||
|
Total non-recourse debt
|
241,110
|
|
12,155
|
|
223,268
|
|
235,423
|
|
1,220
|
|
||||||||||
|
Total debt
|
$
|
658,084
|
|
$
|
337,583
|
|
$
|
299,230
|
|
$
|
636,813
|
|
$
|
1,220
|
|
|||||
Recourse debt refers to debt that Bloom Energy Corporation has an obligation to pay. Non-recourse debt refers to debt that is recourse to only specified assets or our subsidiaries. The differences between the unpaid principal balances and the net carrying values are due to debt discounts and deferred financing costs. We were in compliance with all of our financial covenants as of
December 31, 2019
and
2018
.
Recourse Debt Facilities
LIBOR + 4% Term Loan due November 2020 -
In May 2013, we entered into a $5.0 million credit agreement and a $12.0 million financing agreement to help fund the building of a new facility in Newark, Delaware. The $5.0 million credit agreement expired in December 2016. The
$12.0 million
financing agreement has a term of
90 months
, payable monthly at a variable rate equal to one month LIBOR plus the applicable margin. The year-to-date weighted average interest rate as of
December 31, 2019
and
2018
was
6.3%
and
5.9%
, respectively. The loan requires monthly payments and is secured by the manufacturing facility. In addition, the credit agreement includes a cross-default provision which provides that the remaining balance of borrowing under the agreement will be due and payable immediately if a lien is placed on the Newark facility in the event we default on any indebtedness in excess of $100,000 individually or $300,000 in the aggregate. Under the terms of the financing agreement, we are required to comply with various restrictive covenants. As of
December 31, 2019
and
2018
, the debt outstanding was
$1.6 million
and
$3.3 million
, respectively.
5% Convertible Promissory Notes due 2020 (Originally 8% Convertible Promissory Notes due December 2018) -
Between December 2014 and June 2016, we issued $193.2 million of three-year convertible promissory notes ("
8% Notes
") to certain investors. The 8% Notes had a fixed interest rate of 8% compounded monthly, due at maturity or at the election of the investor with accrued interest due in December of each year.
On January 18, 2018, amendments were finalized to extend the maturity dates for all the
8% Notes
to December 2019. At the same time, the portion of the notes that was held by Constellation NewEnergy, Inc. ("Constellation") was extended to December 2020 and the interest rate decreased from
8%
to
5%
("
5% Notes
").
Investors held the right to convert the unpaid principal and accrued interest of both the
8% Notes
and
5% Notes
to Series G convertible preferred stock at any time at the price of
$38.64 per share
. In July 2018, upon our IPO, the
$221.6 million
of principal and accrued interest of outstanding
8% Notes
automatically converted into additional paid-in capital, the conversion of which included all the related-party noteholders. The
8% Notes
converted to shares of Series G convertible preferred stock and, concurrently, each such share of Series G convertible preferred stock converted automatically into one share of Class B common stock. Upon our IPO,
5,734,440.0
shares of Class B common stock were issued from conversions and the
8% Notes
were retired. Constellation, the holder of the
5% Notes
, has not elected to convert as of
December 31, 2019
. The outstanding unpaid principal and accrued interest debt balance of the
5% Notes
of
$36.5 million
was classified as current as of
December 31, 2019
, and the outstanding unpaid principal and accrued interest debt balance of the
5% Notes
of
$36.5 million
was classified as non-current as of
December 31, 2018
.
80
6% Convertible Promissory Notes due December 2020 -
Between December 2015 and September 2016, we issued
$260.0 million
convertible promissory notes due December 2020, ("
6% Notes
") to investors. The
6% Notes
bore a 5% fixed interest rate, payable monthly either in cash or in kind, at our election. We amended the terms of the
6% Notes
in June 2017 to reduce the collateral securing the notes and to increase the interest rate from 5% to 6%.
As of
December 31, 2019
and
2018
, the amount outstanding on the
6% Notes
, which includes interest paid in kind through the IPO date, was
$289.3 million
and
$296.2 million
, respectively. Upon the IPO, the debt was convertible at the option of the holders at the conversion price of $11.25 per share into common stock at any time through the maturity date. In January 2018, we amended the terms of the
6% Notes
to extend the convertible put option, which investors could elect only if the IPO did not occur prior to December 2019. After the IPO, we paid the interest in cash when due and no additional interest accrued on the consolidated balance sheet on the
6% Notes
. In November 2019, one note holder exchanged a portion of their
6% Notes
at the conversion price of $11.25 per share into
616,302
shares of common stock.
On or after July 27, 2020, we may redeem, at our option, all or part of the
6% Notes
if the last reported sale price of our common stock has been at least $22.50 for at least 20 trading days (whether or not consecutive) during a period of 30 consecutive trading days ending within the three trading days immediately preceding the date on which we provide written notice of redemption In certain circumstances, the
6% Notes
are also redeemable at our option in connection with a change of control.
Under the terms of the indenture governing the
6% Notes
, we are required to comply with various restrictive covenants, including meeting reporting requirements, such as the preparation and delivery of audited consolidated financial statements, and restrictions on investments. In addition, we are required to maintain collateral which secures the
6% Notes
in an amount equal to 200% of the principal amount of and accrued and unpaid interest on the outstanding notes. This minimum collateral test is not a negative covenant and does not result in a default if not met. However, the minimum collateral test does restrict us with respect to investing in non-PPA subsidiaries. If we do not meet the minimum collateral test, we cannot invest cash into any non-PPA subsidiary that is not a guarantor of the notes. The
6% Notes
also include a cross-acceleration provision which provides that the holders of at least 25% of the outstanding principal amount of the
6% Notes
may cause such notes to become immediately due and payable if we or any of our subsidiaries default on any indebtedness in excess of $15.0 million such that the repayment of such indebtedness is accelerated.
In connection with the issuance of the
6% Notes
, we agreed to issue to J.P. Morgan and CPPIB, upon the occurrence of certain conditions, warrants to purchase our common stock up to a maximum of
146,666
shares and
166,222
shares, respectively. On August 31, 2017, J.P. Morgan transferred its rights to CPPIB. Upon completion of the IPO, the
312,888
warrants were net exercised for
312,575
shares of Class B Common stock.
10% Notes due July 2024 -
In June 2017, we issued
$100.0 million
of senior secured notes ("
10% Notes
"). The
10% Notes
mature in 2024 and bear a 10.0% fixed rate of interest and with principal amortization started July 2019, payable semi-annually. The
10% Notes
have a continuing security interest in the cash flows payable to us as servicing, operations and maintenance fees and administrative fees from certain active power purchase agreements. Under the terms of the indenture governing the notes, we are required to comply with various restrictive covenants including, among other things, to maintain certain financial ratios such as debt service coverage ratios, to incur additional debt, issue guarantees, incur liens, make loans or investments, make asset dispositions, issue or sell share capital of our subsidiaries and pay dividends, meet reporting requirements, including the preparation and delivery of audited consolidated financial statements, or maintain certain restrictions on investments and requirements in incurring new debt. As of
December 31, 2019
, we were in compliance with all of such covenants. In addition, we are required to maintain collateral which secures the 10% Notes based on debt ratio analyses. This minimum collateral test is not a negative covenant and does not result in a default if not met. However, the minimum debt service coverage ratio test does restrict our access to the excess cash escrowed in a collection account which would otherwise be released to us on a bi-annual basis after principal amortization and interest payment. The outstanding unpaid principal and accrued interest debt balance of the
10% Notes
of
$14.0 million
and
$7.0 million
were classified as current as of
December 31, 2019
and 2018, respectively and the outstanding unpaid principal and accrued interest debt balances of the
10% Notes
of
$76.0 million
and
$88.6 million
were classified as non-current as of
December 31, 2019
and 2018, respectively.
Non-recourse Debt Facilities
5.22% Senior Secured Term Notes -
In March 2013, PPA Company II refinanced its existing debt by issuing
5.22%
Senior Secured Notes due March 30, 2025 (the "
5.22% Notes
"). During the year ended
December 31, 2019
, there was a decommissioning in PPA II, including the retirement of the
5.22% Notes
outstanding unpaid debt and interest of
$77.6 million
, which included the accumulated unpaid interest on the debt. See
Note 13, Power Purchase Agreement Programs - PPA II Upgrade of Energy Servers
for additional information.
81
7.5% Term Loan due September 2028 -
In December 2012 and later amended in August 2013, PPA IIIa entered into a
$46.8 million
credit agreement to help fund the purchase and installation of Energy Servers. The loan bears a fixed interest rate of
7.5%
payable quarterly. The loan requires quarterly principal payments which began in March 2014. The credit agreement requires us to maintain a debt service reserve for all funded systems, the balance of which was
$3.8 million
and
$3.7 million
as of
December 31, 2019
and
2018
, respectively, and which was included as part of long-term restricted cash in the consolidated balance sheets. The loan is secured by all assets of PPA IIIa.
LIBOR + 5.25% Term Loan due October 2020 -
In September 2013, PPA IIIb entered into a credit agreement to help fund the purchase and installation of Energy Servers. The aggregate amount of the debt facility was
$32.5 million
. During the year ended
December 31, 2019
, there was a decommissioning in PPA IIIb, including the retirement of this outstanding unpaid debt of
$24.2 million
, which included the accumulated unpaid interest on the debt. See
Note 13, Power Purchase Agreement Programs - PPA IIIb Upgrade of Energy Servers
for additional information.
6.07% Senior Secured Notes -
In July 2014, PPA IV issued senior secured notes amounting to
$99.0 million
to third parties to help fund the purchase and installation of Energy Servers. The notes bear a fixed interest rate of
6.07%
payable quarterly which began in December 2015 and ends in March 2030. The notes are secured by all the assets of the PPA IV. The Note Purchase Agreement requires us to maintain a debt service reserve, the balance of which was
$8.0
million as of
December 31, 2019
and
$6.5 million
as of
December 31, 2018
, and which was included as part of long-term restricted cash in the consolidated balance sheets.
LIBOR + 2.5% Term Loan due December 2021 -
In June 2015, PPA V entered into a
$131.2 million
credit agreement to fund the purchase and installation of Energy Servers. The lenders are a group of
five
financial institutions and the terms included commitments to a letter of credit (LC) facility (see below). The loan was initially advanced as a construction loan during the development of the PPA V Project and converted into a term loan on February 28, 2017 (the “Term Conversion Date”). As part of the term loan’s conversion, the LC facility commitments were adjusted.
In accordance with the credit agreement, PPA V was issued a floating rate debt based on LIBOR plus a margin, paid quarterly. The applicable margins used for calculating interest expense are
2.25%
for years 1-3 following the Term Conversion Date and
2.5%
thereafter. The loan is secured by all the assets of the PPA V and requires quarterly principal payments which began in March 2017. In connection with the floating-rate credit agreement, in July 2015 the PPA V entered into pay-fixed, receive-float interest rate swap agreements to convert its floating-rate loan into a fixed-rate loan.
Letters of credit due December 2021 -
In June 2015, PPA V entered into a
$131.2 million
term loan due December 2021. The agreement also included commitments to a letter of credit ("LC") facility, with the characteristics of a line of credit, with the aggregate principal amount of
$6.4 million
, later adjusted down to
$6.2 million
. The amount reserved under the letter of credit as of
December 31, 2019
and
2018
was
$5.0 million
. The unused capacity as of
December 31, 2019
and
2018
was
$1.2 million
.
82
Contractual Obligations and Other Commitments
The following table summarizes our contractual obligations and the debt of our consolidated PPA entities that is non-recourse to Bloom as of
December 31, 2019
:
|
Payments Due By Period
|
||||||||||||||||||||
|
Total
|
Less than
1 Year |
1-3 Years
|
3-5 Years
|
More than
5 Years |
||||||||||||||||
|
(in thousands)
|
||||||||||||||||||||
|
Contractual Obligations and Other Commitments:
|
||||||||||||||||||||
|
Recourse debt
1
|
$
|
416,974
|
|
$
|
337,974
|
|
$
|
34,000
|
|
$
|
45,000
|
|
$
|
—
|
|
|||||
|
Non-recourse debt
2
|
241,110
|
|
12,155
|
|
131,416
|
|
20,391
|
|
77,148
|
|
||||||||||
|
Operating leases
|
43,411
|
|
7,250
|
|
9,662
|
|
8,586
|
|
17,913
|
|
||||||||||
|
Service arrangements
|
3,255
|
|
1,397
|
|
1,858
|
|
—
|
|
—
|
|
||||||||||
|
Financing obligations
|
312,862
|
|
37,840
|
|
78,406
|
|
79,024
|
|
117,592
|
|
||||||||||
|
Natural gas fixed price forward contracts
|
6,968
|
|
4,052
|
|
2,916
|
|
—
|
|
—
|
|
||||||||||
|
Grant for Delaware facility
|
10,469
|
|
—
|
|
10,469
|
|
—
|
|
—
|
|
||||||||||
|
Interest rate swap
|
9,130
|
|
782
|
|
2,384
|
|
2,486
|
|
3,478
|
|
||||||||||
|
Supplier purchase commitments
|
2,324
|
|
1,225
|
|
1,099
|
|
—
|
|
—
|
|
||||||||||
|
Renewable energy credit obligations
|
1,109
|
|
761
|
|
348
|
|
—
|
|
—
|
|
||||||||||
|
Asset retirement obligations
|
500
|
|
500
|
|
—
|
|
—
|
|
—
|
|
||||||||||
|
Total
|
$
|
1,048,112
|
|
$
|
403,936
|
|
$
|
272,558
|
|
$
|
155,487
|
|
$
|
216,131
|
|
|||||
|
1
|
Our 6% Notes and our credit agreements related to the building of our facility in Newark, Delaware each contain cross-default or cross-acceleration provisions. See “Recourse Debt Facilities” above for more details.
|
|
2
|
Each of the debt facilities entered into by PPA IIIa, PPA IV and PPA V contain cross-default provisions. See “Non-recourse Debt Facilities” above for more details.
|
Off-Balance Sheet Arrangements
We include in our consolidated financial statements all assets and liabilities and results of operations of our PPA Entities that we have entered into and over which we have substantial control. For additional information, see Note 13,
Power Purchase Agreement Programs.
We have not entered into any other transactions that have generated relationships with unconsolidated entities or financial partnerships or special purpose entities. Accordingly, as of
December 31, 2019
and
2018
, we had no off-balance sheet arrangements.
83
ITEM 7A - QUANTITATIVE AND QUALITATIVE DISCLOSURES ABOUT MARKET RISK
We are exposed to market risks as part of our ongoing business operations, primarily by exposure to changes in interest rates, in commodity fuel prices and in foreign currency.
Interest Rate Risk
Our cash is maintained in interest-bearing accounts, our cash equivalents are invested in money market funds and our short-term investments are invested in
U.S. Treasury Bills
. Lower interest rates would have an adverse impact on our interest income. Due to the short-term investment nature of our cash, cash equivalents and short-term investments, we believe that we do not have material financial statement exposure to changes in fair value as a result of changes in interest rates. Since we believe we have the ability to liquidate substantially all of this portfolio, we do not expect our operating results or cash flows to be materially affected to any significant degree by a sudden change in market interest rates on our investment portfolio.
To provide a meaningful assessment of the interest rate risk associated with our cash, cash equivalents and short-term investments, we performed a sensitivity analysis to determine the impact a change in interest rates would have on income statement and in investment fair values assuming a 1% decline in yield. Based on investment positions in both
December 31, 2019
and
2018
, a hypothetical 1% decrease in interest rates across all maturities would result in a
$3.8 million
decline in interest income on an annualized basis. As these investments have maturities of less than twelve months, changes with respect to the portfolio fair value would be limited to these amounts and only be realized if we were to terminate the investments prior to maturity.
We are exposed to interest rate risk related to our indebtedness that bears interest based on a floating LIBOR rate. We generally hedge such interest rate risks with the use of hedging instruments, and for these loans, changes in interest rates are generally offset by interest rate derivative swap contracts. For our fixed-rate debt, interest rate changes do not affect our earnings or cash flows.
To provide a meaningful assessment of the interest rate risk for that portion of our outstanding loans associated with floating LIBOR and not covered by interest rate derivative swaps, we performed a sensitivity analysis to determine the impact a change in interest rates would have on our consolidated statements of operations assuming a 1% interest rate increase. Based on monthly floating-rate loan positions for the years ended
December 31, 2019
and
2018
, a hypothetical 1% increase in LIBOR would have resulted in a
$0.3 million
and a
$0.2 million
increase to our interest expense, respectively. These losses would be directly attributable to our PPA Entities.
Commodity Price Risk
We are subject to commodity price risk arising from price movements for natural gas that we supply to customers to operate our Energy Servers under certain power purchase agreements. While we entered into a natural gas fixed price forward contract with our gas supplier in 2011, the fuel forward contract meets the definition of a derivative under U.S. GAAP and accordingly, any changes in its fair value is recorded within cost of revenue in the statements of operations. The fair value of the contract is determined using a combination of factors including our credit rating and future natural gas prices.
To provide a meaningful assessment of the commodity price risk arising from price movements in the commodity futures contracts for natural gas, we performed a sensitivity analysis to determine the impact a change in natural gas commodity pricing would have on our consolidated statements of operations assuming a 10% change in the commodity contracts held. Based on monthly commodity positions for the years ended
December 31, 2019
and
2018
, a hypothetical 10% increase in the price of natural gas futures would have resulted in a
$0.6 million
and a
$1.0 million
adjustment to their balance sheet fair values, respectively.
Foreign Currency Risk
Our sales contracts are primarily denominated in U.S. dollars and, therefore, substantially all of our revenue is not subject to foreign currency market risk. Our supply contracts are primarily denominated in U.S. dollars and our corporate operations are domiciled in the U.S. However, we conduct some internationally domiciled field operations and therefore, find it necessary to transact in foreign currencies for limited operational purposes, necessitating that we hold foreign currency bank accounts.
To provide a meaningful assessment of the risk associated with our foreign currency holdings, we performed a sensitivity analysis to determine the impact a currency devaluation would have on our balance sheet assuming a 20% decline in the value of the U.S. dollar. Based on our foreign currency holdings as of
December 31, 2019
and
2018
, a hypothetical 20% devaluation of the U.S. dollar against foreign currencies would not be material to our reported cash position.
84
However, an increasing portion of our operating expenses are incurred outside the United States, are denominated in foreign currencies and are subject to such risk. Although not yet material, if we are not able to successfully hedge against the risks associated with currency fluctuations in our future activities, our financial condition and operating results could be adversely affected.
Actual future gains and losses associated with our investment portfolio, debt and derivative positions and foreign currency may differ materially from the sensitivity analyses performed as of
December 31, 2019
and
2018
due to the inherent limitations associated with predicting the timing and amount of changes in interest rates, foreign currency exchange rates and our actual commodity derivative exposures and positions.
85
ITEM 8 - FINANCIAL STATEMENTS AND SUPPLEMENTARY DATA
|
Index to Consolidated Financial Statements and Supplementary Data
|
|
|
Page
|
|
86
Report of Independent Registered Public Accounting Firm
To the Board of Directors and Stockholders of Bloom Energy Corporation
Opinion on the Financial Statements
We have audited the accompanying consolidated balance sheets of Bloom Energy Corporation and its subsidiaries (the “Company”) as of December 31, 2019 and 2018, and the related consolidated statements of operations, of comprehensive loss, of convertible redeemable preferred stock, redeemable noncontrolling interest, stockholders' deficit and noncontrolling interest and of cash flows for each of the three years in the period ended December 31, 2019, including the related notes (collectively referred to as the “consolidated financial statements”). In our opinion, the consolidated financial statements present fairly, in all material respects, the financial position of the Company as of December 31, 2019 and 2018, and the results of its operations and its cash flows for each of the three years in the period ended December 31, 2019 in conformity with accounting principles generally accepted in the United States of America.
Restatement of Previously Issued Financial Statements
As discussed in Note 2 to the consolidated financial statements, the Company has restated its consolidated financial statements as of and for the year ended December 31, 2018 to correct misstatements.
Change in Accounting Principle
As discussed in Note 1 to the consolidated financial statements, the Company changed the manner in which it accounts for revenue from contracts with customers in 2019.
Basis for Opinion
These consolidated financial statements are the responsibility of the Company’s management. Our responsibility is to express an opinion on the Company’s consolidated financial statements based on our audits. We are a public accounting firm registered with the Public Company Accounting Oversight Board (United States) (PCAOB) and are required to be independent with respect to the Company in accordance with the U.S. federal securities laws and the applicable rules and regulations of the Securities and Exchange Commission and the PCAOB.
We conducted our audits of these consolidated financial statements in accordance with the standards of the PCAOB. Those standards require that we plan and perform the audits to obtain reasonable assurance about whether the consolidated financial statements are free of material misstatement, whether due to error or fraud. The Company is not required to have, nor were we engaged to perform, an audit of its internal control over financial reporting. As part of our audits we are required to obtain an understanding of internal control over financial reporting but not for the purpose of expressing an opinion on the effectiveness of the Company's internal control over financial reporting. Accordingly, we express no such opinion.
Our audits included performing procedures to assess the risks of material misstatement of the consolidated financial statements, whether due to error or fraud, and performing procedures that respond to those risks. Such procedures included examining, on a test basis, evidence regarding the amounts and disclosures in the consolidated financial statements. Our audits also included evaluating the accounting principles used and significant estimates made by management, as well as evaluating the overall presentation of the consolidated financial statements. We believe that our audits provide a reasonable basis for our opinion.
/s/ PricewaterhouseCoopers LLP
San Jose, California
March 31, 2020
We have served as the Company’s auditor since 2009.
87
Bloom Energy Corporation
Consolidated Balance Sheets
(in thousands, except share and per share data)
|
December 31,
|
||||||||
|
|
2019
|
2018
|
||||||
|
|
As Restated
|
|||||||
|
Assets
|
||||||||
|
Current assets:
|
||||||||
|
Cash and cash equivalents
1
|
$
|
202,823
|
|
$
|
220,728
|
|
||
|
Restricted cash
1
|
30,804
|
|
28,657
|
|
||||
|
Short-term investments
|
—
|
|
104,350
|
|
||||
|
Accounts receivable
1
|
37,828
|
|
88,784
|
|
||||
|
Inventories
|
109,606
|
|
135,265
|
|
||||
|
Deferred cost of revenue
|
58,470
|
|
43,809
|
|
||||
|
Customer financing receivable
1
|
5,108
|
|
5,594
|
|
||||
|
Prepaid expenses and other current assets
1
|
28,068
|
|
36,747
|
|
||||
|
Total current assets
|
472,707
|
|
663,934
|
|
||||
|
Property, plant and equipment, net
1
|
607,059
|
|
716,751
|
|
||||
|
Customer financing receivable, non-current
1
|
50,747
|
|
67,082
|
|
||||
|
Restricted cash, non-current
1
|
143,761
|
|
31,100
|
|
||||
|
Deferred cost of revenue, non-current
|
6,665
|
|
45
|
|
||||
|
Other long-term assets
1
|
41,652
|
|
42,882
|
|
||||
|
Total assets
|
$
|
1,322,591
|
|
$
|
1,521,794
|
|
||
|
Liabilities, Redeemable Noncontrolling Interest, Stockholders’ Deficit and Noncontrolling Interest
|
||||||||
|
Current liabilities:
|
||||||||
|
Accounts payable
1
|
$
|
55,579
|
|
$
|
66,889
|
|
||
|
Accrued warranty
|
10,333
|
|
17,968
|
|
||||
|
Accrued expenses and other current liabilities
1
|
70,284
|
|
66,838
|
|
||||
|
Deferred revenue and customer deposits
1
|
89,192
|
|
67,632
|
|
||||
|
Financing obligations
|
10,993
|
|
8,128
|
|
||||
|
Current portion of recourse debt
|
304,627
|
|
8,686
|
|
||||
|
Current portion of non-recourse debt
1
|
8,273
|
|
18,962
|
|
||||
|
Current portion of recourse debt from related parties
|
20,801
|
|
—
|
|
||||
|
Current portion of non-recourse debt from related parties
1
|
3,882
|
|
2,200
|
|
||||
|
Total current liabilities
|
573,964
|
|
257,303
|
|
||||
|
Derivative liabilities
1
|
17,551
|
|
14,143
|
|
||||
|
Deferred revenue and customer deposits, net of current portion
1
|
125,529
|
|
87,308
|
|
||||
|
Financing obligations, non-current
|
446,165
|
|
385,650
|
|
||||
|
Long-term portion of recourse debt
|
75,962
|
|
360,339
|
|
||||
|
Long-term portion of non-recourse debt
1
|
192,180
|
|
289,241
|
|
||||
|
Long-term portion of recourse debt from related parties
|
—
|
|
27,734
|
|
||||
|
Long-term portion of non-recourse debt from related parties
1
|
31,087
|
|
34,119
|
|
||||
|
Other long-term liabilities
1
|
28,013
|
|
26,196
|
|
||||
|
Total liabilities
|
1,490,451
|
|
1,482,033
|
|
||||
|
Commitments and contingencies (Note 14)
|
|
|
|
|
||||
|
Redeemable noncontrolling interest
|
443
|
|
57,261
|
|
||||
|
Stockholders’ deficit:
|
||||||||
|
Common stock: $0.0001 par value; Class A shares, 600,000,000 shares authorized at both December 31, 2019 and 2018, and 84,549,511 shares and 20,868,286 shares issued and outstanding at December 31, 2019 and 2018, respectively; Class B shares, 600,000,000 shares authorized at both December 31, 2019 and 2018, and 36,486,778 shares and 88,552,897 shares issued and outstanding at December 31, 2019 and 2018, respectively.
|
12
|
|
11
|
|
||||
|
Additional paid-in capital
|
2,686,759
|
|
2,481,352
|
|
||||
|
Accumulated other comprehensive income
|
19
|
|
131
|
|
||||
|
Accumulated deficit
|
(2,946,384
|
)
|
(2,624,104
|
)
|
||||
|
Total stockholders’ deficit
|
(259,594
|
)
|
(142,610
|
)
|
||||
|
Noncontrolling interest
|
91,291
|
|
125,110
|
|
||||
|
Total liabilities, redeemable noncontrolling interest, stockholders' deficit and noncontrolling interest
|
$
|
1,322,591
|
|
$
|
1,521,794
|
|
||
1
We have variable interest entities which represent a portion of the consolidated balances are recorded within these financial statement line items in the Consolidated Balance Sheets (see
Note 13, Power Purchase Agreement Programs
).
The accompanying notes are an integral part of these consolidated financial statements.
88
Bloom Energy Corporation
Consolidated Statements of Operations
(in thousands, except per share data)
|
|
Years Ended December 31,
|
|||||||||||
|
|
2019
|
2018
|
2017
|
|||||||||
|
|
As Restated
|
As Revised
|
||||||||||
|
Revenue:
|
||||||||||||
|
Product
|
$
|
557,336
|
|
$
|
400,638
|
|
$
|
157,192
|
|
|||
|
Installation
|
60,826
|
|
68,195
|
|
57,937
|
|
||||||
|
Service
|
95,786
|
|
83,267
|
|
74,892
|
|
||||||
|
Electricity
|
71,229
|
|
80,548
|
|
75,602
|
|
||||||
|
Total revenue
|
785,177
|
|
632,648
|
|
365,623
|
|
||||||
|
Cost of revenue:
|
||||||||||||
|
Product
|
435,479
|
|
281,275
|
|
192,361
|
|
||||||
|
Installation
|
76,487
|
|
95,306
|
|
54,970
|
|
||||||
|
Service
|
100,238
|
|
100,689
|
|
85,128
|
|
||||||
|
Electricity
|
75,386
|
|
49,628
|
|
49,475
|
|
||||||
|
Total cost of revenue
|
687,590
|
|
526,898
|
|
381,934
|
|
||||||
|
Gross profit (loss)
|
97,587
|
|
105,750
|
|
(16,311
|
)
|
||||||
|
Operating expenses:
|
||||||||||||
|
Research and development
|
104,168
|
|
89,135
|
|
51,146
|
|
||||||
|
Sales and marketing
|
73,573
|
|
62,807
|
|
31,926
|
|
||||||
|
General and administrative
|
152,650
|
|
118,817
|
|
55,689
|
|
||||||
|
Total operating expenses
|
330,391
|
|
270,759
|
|
138,761
|
|
||||||
|
Loss from operations
|
(232,804
|
)
|
(165,009
|
)
|
(155,072
|
)
|
||||||
|
Interest income
|
5,661
|
|
4,322
|
|
759
|
|
||||||
|
Interest expense
|
(87,480
|
)
|
(97,021
|
)
|
(112,039
|
)
|
||||||
|
Interest expense to related parties
|
|
(6,756
|
)
|
|
(8,893
|
)
|
(12,265
|
)
|
||||
|
Other income (expense), net
|
706
|
|
(999
|
)
|
(491
|
)
|
||||||
|
Gain (loss) on revaluation of warrant liabilities and embedded derivatives
|
(2,160
|
)
|
(22,139
|
)
|
(15,284
|
)
|
||||||
|
Loss before income taxes
|
(322,833
|
)
|
(289,739
|
)
|
(294,392
|
)
|
||||||
|
Income tax provision
|
633
|
|
1,537
|
|
636
|
|
||||||
|
Net loss
|
(323,466
|
)
|
(291,276
|
)
|
(295,028
|
)
|
||||||
|
Less: net loss attributable to noncontrolling interests and redeemable noncontrolling interests
|
(19,052
|
)
|
(17,736
|
)
|
(18,666
|
)
|
||||||
|
Net loss attributable to Class A and Class B common stockholders
|
(304,414
|
)
|
(273,540
|
)
|
(276,362
|
)
|
||||||
|
Less: deemed dividend to noncontrolling interest
|
(2,454
|
)
|
—
|
|
—
|
|
||||||
|
Net loss available to Class A and Class B common stockholders
|
$
|
(306,868
|
)
|
$
|
(273,540
|
)
|
$
|
(276,362
|
)
|
|||
|
Net loss per share available to Class A and Class B common stockholders, basic and diluted
|
$
|
(2.67
|
)
|
$
|
(5.14
|
)
|
$
|
(26.97
|
)
|
|||
|
Weighted average shares used to compute net loss per share attributable to Class A and Class B common stockholders, basic and diluted
|
115,118
|
|
53,268
|
|
10,248
|
|
||||||
The accompanying notes are an integral part of these consolidated financial statements.
89
Bloom Energy Corporation
Consolidated Statements of Comprehensive Loss
(in thousands)
|
|
Years Ended December 31,
|
|||||||||||
|
|
2019
|
2018
|
2017
|
|||||||||
|
|
As Restated
|
As Revised
|
||||||||||
|
Net loss
|
$
|
(323,466
|
)
|
$
|
(291,276
|
)
|
$
|
(295,028
|
)
|
|||
|
Other comprehensive income (loss), net of taxes:
|
||||||||||||
|
Unrealized gain (loss) on available-for-sale securities
|
14
|
|
26
|
|
(13
|
)
|
||||||
|
Change in effective portion of interest rate swap
|
(295
|
)
|
267
|
|
393
|
|
||||||
|
Other comprehensive income
|
(281
|
)
|
293
|
|
380
|
|
||||||
|
Comprehensive loss
|
$
|
(323,747
|
)
|
$
|
(290,983
|
)
|
$
|
(294,648
|
)
|
|||
The accompanying notes are an integral part of these consolidated financial statements.
90
Bloom Energy Corporation
Consolidated Statements of Convertible Redeemable Preferred Stock, Redeemable Noncontrolling Interest, Stockholders' Deficit and Noncontrolling Interest
(in thousands, except shares)
|
Convertible Redeemable Preferred Stock
|
Redeemable
Noncontrolling Interest |
Class A and Class B
Common Stock ¹ |
Additional Paid-In Capital
|
Accumulated Other Comprehensive Income (Loss)
|
Accumulated
Deficit |
Total Stockholders' Deficit
|
Noncontrolling
Interest |
|||||||||||||||||||||||||||||||
|
Shares
|
Amount
|
Shares
|
Amount
|
|||||||||||||||||||||||||||||||||||
|
Balances at December 31, 2016 (as Reported)
|
71,740,162
|
|
$
|
1,465,841
|
|
$
|
59,320
|
|
10,132,220
|
|
$
|
1
|
|
$
|
108,647
|
|
$
|
(542
|
)
|
$
|
(2,068,048
|
)
|
$
|
(1,959,942
|
)
|
$
|
175,668
|
|
||||||||||
|
Adjustments to accumulated deficit and total stockholders' deficit
|
—
|
|
—
|
|
—
|
|
—
|
|
—
|
|
—
|
|
—
|
|
(6,154
|
)
|
(6,154
|
)
|
—
|
|
||||||||||||||||||
|
Balances at December 31, 2016 (as Revised)
|
71,740,162
|
|
1,465,841
|
|
59,320
|
|
10,132,220
|
|
1
|
|
108,647
|
|
(542
|
)
|
(2,074,202
|
)
|
(1,966,096
|
)
|
175,668
|
|
||||||||||||||||||
|
Contributions from noncontrolling interests
|
—
|
|
—
|
|
—
|
|
—
|
|
—
|
|
—
|
|
—
|
|
—
|
|
—
|
|
13,652
|
|
||||||||||||||||||
|
Issuance of common stock warrant
|
—
|
|
—
|
|
—
|
|
—
|
|
—
|
|
9,410
|
|
—
|
|
—
|
|
9,410
|
|
—
|
|
||||||||||||||||||
|
Issuance of common stock
|
—
|
|
—
|
|
—
|
|
64,000
|
|
—
|
|
1,981
|
|
—
|
|
—
|
|
1,981
|
|
—
|
|
||||||||||||||||||
|
Exercise of stock options
|
—
|
|
—
|
|
—
|
|
123,153
|
|
—
|
|
432
|
|
—
|
|
—
|
|
432
|
|
—
|
|
||||||||||||||||||
|
Issuance of restricted stock awards
|
—
|
|
—
|
|
—
|
|
33,896
|
|
—
|
|
1,254
|
|
—
|
|
—
|
|
1,254
|
|
—
|
|
||||||||||||||||||
|
Stock-based compensation
|
—
|
|
—
|
|
—
|
|
—
|
|
—
|
|
29,080
|
|
—
|
|
—
|
|
29,080
|
|
—
|
|
||||||||||||||||||
|
Unrealized gain on available-for-sale securities
|
—
|
|
—
|
|
—
|
|
—
|
|
—
|
|
—
|
|
(13
|
)
|
—
|
|
(13
|
)
|
—
|
|
||||||||||||||||||
|
Change in effective portion of interest rate swap agreement
|
—
|
|
—
|
|
1
|
|
—
|
|
—
|
|
—
|
|
393
|
|
—
|
|
393
|
|
500
|
|
||||||||||||||||||
|
Distributions to noncontrolling interests
|
—
|
|
—
|
|
(5,104
|
)
|
—
|
|
—
|
|
—
|
|
—
|
|
—
|
|
—
|
|
(11,845
|
)
|
||||||||||||||||||
|
Net income (loss) (as revised)
|
—
|
|
—
|
|
3,937
|
|
—
|
|
—
|
|
—
|
|
—
|
|
(276,362
|
)
|
(276,362
|
)
|
(22,603
|
)
|
||||||||||||||||||
|
Balances at December 31, 2017 (as Revised)
|
71,740,162
|
|
1,465,841
|
|
58,154
|
|
10,353,269
|
|
1
|
|
150,804
|
|
(162
|
)
|
(2,350,564
|
)
|
(2,199,921
|
)
|
155,372
|
|
||||||||||||||||||
|
Issuance of Class A common stock upon public offering, net
|
—
|
|
—
|
|
—
|
|
20,700,000
|
|
2
|
|
282,274
|
|
—
|
|
—
|
|
282,276
|
|
—
|
|
||||||||||||||||||
|
Issuance of Class B common stock on convertible notes
|
—
|
|
—
|
|
—
|
|
5,734,440
|
|
1
|
|
221,579
|
|
—
|
|
—
|
|
221,580
|
|
—
|
|
||||||||||||||||||
|
Issuance of Class A and B common stock upon exercise of warrants
|
—
|
|
—
|
|
—
|
|
312,575
|
|
—
|
|
—
|
|
—
|
|
—
|
|
—
|
|
—
|
|
||||||||||||||||||
|
Conversion of redeemable convertible preferred stock Series A-G
|
(71,740,162
|
)
|
(1,465,841
|
)
|
—
|
|
71,740,162
|
|
7
|
|
1,465,834
|
|
—
|
|
—
|
|
1,465,841
|
|
—
|
|
||||||||||||||||||
|
Reclassification of redeemable convertible preferred stock warrant liability to additional paid-in capital
|
—
|
|
—
|
|
—
|
|
—
|
|
—
|
|
882
|
|
—
|
|
—
|
|
882
|
|
—
|
|
||||||||||||||||||
|
Reclassification of derivative liability into additional paid-in capital (as restated)
|
—
|
|
—
|
|
—
|
|
—
|
|
—
|
|
177,963
|
|
—
|
|
—
|
|
177,963
|
|
—
|
|
||||||||||||||||||
|
Issuance of common stock
|
—
|
|
—
|
|
—
|
|
166,667
|
|
—
|
|
2,500
|
|
—
|
|
—
|
|
2,500
|
|
—
|
|
||||||||||||||||||
|
Issuance of restricted stock awards
|
—
|
|
—
|
|
—
|
|
17,793
|
|
—
|
|
349
|
|
—
|
|
—
|
|
349
|
|
—
|
|
||||||||||||||||||
|
Exercise of stock options
|
—
|
|
—
|
|
—
|
|
396,277
|
|
—
|
|
1,521
|
|
—
|
|
—
|
|
1,521
|
|
—
|
|
||||||||||||||||||
|
Stock-based compensation
|
—
|
|
—
|
|
—
|
|
—
|
|
—
|
|
177,646
|
|
—
|
|
—
|
|
177,646
|
|
—
|
|
||||||||||||||||||
|
Unrealized loss on available-for-sale securities
|
—
|
|
—
|
|
—
|
|
—
|
|
—
|
|
—
|
|
26
|
|
—
|
|
26
|
|
—
|
|
||||||||||||||||||
|
Change in effective portion of interest rate swap agreement
|
—
|
|
—
|
|
2
|
|
—
|
|
—
|
|
—
|
|
267
|
|
—
|
|
267
|
|
1,829
|
|
||||||||||||||||||
91
|
Convertible Redeemable Preferred Stock
|
Redeemable
Noncontrolling Interest |
Class A and Class B
Common Stock ¹ |
Additional Paid-In Capital
|
Accumulated Other Comprehensive Income (Loss)
|
Accumulated
Deficit |
Total Stockholders' Deficit
|
Noncontrolling
Interest |
|||||||||||||||||||||||||||||||
|
Shares
|
Amount
|
Shares
|
Amount
|
|||||||||||||||||||||||||||||||||||
|
Distributions to noncontrolling interests
|
—
|
|
—
|
|
(6,788
|
)
|
—
|
|
—
|
|
—
|
|
—
|
|
—
|
|
—
|
|
(8,462
|
)
|
||||||||||||||||||
|
Net loss (as restated)
|
—
|
|
—
|
|
5,893
|
|
—
|
|
—
|
|
—
|
|
—
|
|
(273,540
|
)
|
(273,540
|
)
|
(23,629
|
)
|
||||||||||||||||||
|
Balances at December 31, 2018 (as Restated)
|
—
|
|
—
|
|
57,261
|
|
109,421,183
|
|
11
|
|
2,481,352
|
|
131
|
|
(2,624,104
|
)
|
(142,610
|
)
|
125,110
|
|
||||||||||||||||||
|
Cumulative effect upon adoption of new accounting standard (Note 3)
|
—
|
|
—
|
|
—
|
|
—
|
|
—
|
|
—
|
|
—
|
|
(17,996
|
)
|
(17,996
|
)
|
—
|
|
||||||||||||||||||
|
Buyout of equity investors in PPA IIIb (Note 13)
|
—
|
|
—
|
|
—
|
|
—
|
|
—
|
|
(2,454
|
)
|
169
|
|
—
|
|
(2,285
|
)
|
—
|
|
||||||||||||||||||
|
Conversion of Notes
|
—
|
|
—
|
|
—
|
|
616,302
|
|
—
|
|
6,933
|
|
—
|
|
—
|
|
6,933
|
|
—
|
|
||||||||||||||||||
|
Issuance of restricted stock awards
|
—
|
|
—
|
|
—
|
|
8,921,807
|
|
1
|
|
—
|
|
—
|
|
—
|
|
1
|
|
—
|
|
||||||||||||||||||
|
ESPP purchase
|
—
|
|
—
|
|
—
|
|
1,718,433
|
|
—
|
|
11,183
|
|
—
|
|
—
|
|
11,183
|
|
—
|
|
||||||||||||||||||
|
Exercise of stock options
|
—
|
|
—
|
|
—
|
|
358,564
|
|
—
|
|
1,529
|
|
—
|
|
—
|
|
1,529
|
|
—
|
|
||||||||||||||||||
|
Stock-based compensation
|
—
|
|
—
|
|
—
|
|
—
|
|
—
|
|
188,114
|
|
—
|
|
—
|
|
188,114
|
|
—
|
|
||||||||||||||||||
|
Unrealized loss on available-for-sale securities
|
—
|
|
—
|
|
—
|
|
—
|
|
—
|
|
—
|
|
14
|
|
—
|
|
14
|
|
—
|
|
||||||||||||||||||
|
Change in effective portion of interest rate swap agreement
|
—
|
|
—
|
|
—
|
|
—
|
|
—
|
|
—
|
|
(295
|
)
|
—
|
|
(295
|
)
|
(5,790
|
)
|
||||||||||||||||||
|
Distributions to noncontrolling interests
|
—
|
|
—
|
|
(4,011
|
)
|
—
|
|
—
|
|
102
|
|
|
|
—
|
|
102
|
|
(5,970
|
)
|
||||||||||||||||||
|
Mandatory redemption of noncontrolling interests
|
—
|
|
—
|
|
(55,684
|
)
|
—
|
|
—
|
|
—
|
|
—
|
|
—
|
|
—
|
|
—
|
|
||||||||||||||||||
|
Cumulative effect of hedge accounting
|
—
|
|
—
|
|
—
|
|
—
|
|
—
|
|
—
|
|
|
|
130
|
|
130
|
|
(130
|
)
|
||||||||||||||||||
|
Net income (loss)
|
—
|
|
—
|
|
2,877
|
|
—
|
|
—
|
|
—
|
|
—
|
|
(304,414
|
)
|
(304,414
|
)
|
(21,929
|
)
|
||||||||||||||||||
|
Balances at December 31, 2019
|
—
|
|
—
|
|
$
|
443
|
|
121,036,289
|
|
$
|
12
|
|
$
|
2,686,759
|
|
$
|
19
|
|
$
|
(2,946,384
|
)
|
$
|
(259,594
|
)
|
$
|
91,291
|
|
|||||||||||
¹ Common Stock issued and converted to Class A Common and Class B Common effective July 2018.
² Amounts are less than $0.5 thousand and round down to zero.
The accompanying notes are an integral part of these consolidated financial statements.
92
Bloom Energy Corporation
Consolidated Statements of Cash Flows
(in thousands)
|
|
Years Ended December 31,
|
|||||||||||
|
|
2019
|
2018
|
2017
|
|||||||||
|
|
As Restated
|
As Revised
|
||||||||||
|
Cash flows from operating activities:
|
||||||||||||
|
Net loss
|
$
|
(323,466
|
)
|
$
|
(291,276
|
)
|
$
|
(295,028
|
)
|
|||
|
Adjustments to reconcile net loss to net cash used in operating activities:
|
||||||||||||
|
Depreciation and amortization
|
78,584
|
|
53,887
|
|
54,376
|
|
||||||
|
Write-off of property, plant and equipment, net
|
3,117
|
|
939
|
|
48
|
|
||||||
|
Write-off of customer financing receivable
|
11,302
|
|
—
|
|
—
|
|
||||||
|
Write-off of PPA II and PPA IIIb decommissioned assets
|
70,543
|
|
—
|
|
—
|
|
||||||
|
Debt make-whole expense
|
5,934
|
|
—
|
|
—
|
|
||||||
|
Revaluation of derivative contracts
|
2,779
|
|
29,021
|
|
15,042
|
|
||||||
|
Stock-based compensation
|
196,291
|
|
168,482
|
|
29,101
|
|
||||||
|
Loss (gain) on long-term REC purchase contract
|
53
|
|
200
|
|
(70
|
)
|
||||||
|
Revaluation of stock warrants
|
—
|
|
(9,108
|
)
|
(2,975
|
)
|
||||||
|
Amortization of debt issuance cost
|
22,130
|
|
25,437
|
|
47,312
|
|
||||||
|
Changes in operating assets and liabilities:
|
||||||||||||
|
Accounts receivable
|
51,952
|
|
(55,023
|
)
|
3,242
|
|
||||||
|
Inventories
|
18,425
|
|
(36,974
|
)
|
(10,636
|
)
|
||||||
|
Deferred cost of revenue
|
(21,992
|
)
|
14,223
|
|
(31,278
|
)
|
||||||
|
Customer financing receivable and other
|
5,520
|
|
4,878
|
|
5,459
|
|
||||||
|
Prepaid expenses and other current assets
|
8,643
|
|
(8,032
|
)
|
(982
|
)
|
||||||
|
Other long-term assets
|
3,618
|
|
(202
|
)
|
756
|
|
||||||
|
Accounts payable
|
(11,310
|
)
|
18,307
|
|
7,076
|
|
||||||
|
Accrued warranty
|
(6,603
|
)
|
1,498
|
|
(7,365
|
)
|
||||||
|
Accrued expenses and other current liabilities
|
6,728
|
|
(5,984
|
)
|
7,997
|
|
||||||
|
Deferred revenue and customer deposits
|
37,146
|
|
(21,774
|
)
|
48,322
|
|
||||||
|
Other long-term liabilities
|
4,376
|
|
19,553
|
|
37,637
|
|
||||||
|
Net cash provided by (used in) operating activities
|
163,770
|
|
(91,948
|
)
|
(91,966
|
)
|
||||||
|
Cash flows from investing activities:
|
||||||||||||
|
Purchase of property, plant and equipment
|
(51,053
|
)
|
(45,205
|
)
|
(61,454
|
)
|
||||||
|
Payments for acquisition of intangible assets
|
—
|
|
(3,256
|
)
|
—
|
|
||||||
|
Purchase of marketable securities
|
—
|
|
(103,914
|
)
|
(29,043
|
)
|
||||||
|
Proceeds from maturity of marketable securities
|
104,500
|
|
27,000
|
|
2,250
|
|
||||||
|
Net cash provided by (used in) investing activities
|
53,447
|
|
(125,375
|
)
|
(88,247
|
)
|
||||||
|
Cash flows from financing activities:
|
||||||||||||
|
Borrowings from issuance of debt
|
—
|
|
—
|
|
100,000
|
|
||||||
|
Repayment of debt
|
(119,277
|
)
|
(18,770
|
)
|
(20,507
|
)
|
||||||
|
Repayment of debt to related parties
|
(2,200
|
)
|
(1,390
|
)
|
(912
|
)
|
||||||
|
Debt make-whole payment
|
(5,934
|
)
|
—
|
|
—
|
|
||||||
|
Debt issuance costs
|
—
|
|
—
|
|
(6,108
|
)
|
||||||
|
Proceeds from financing obligations
|
72,334
|
|
70,265
|
|
84,314
|
|
||||||
|
Repayment of financing obligations
|
(8,954
|
)
|
(6,188
|
)
|
(3,210
|
)
|
||||||
|
Proceeds from noncontrolling and redeemable noncontrolling interests
|
—
|
|
—
|
|
13,652
|
|
||||||
|
Payments to noncontrolling and redeemable noncontrolling interests
|
(56,459
|
)
|
—
|
|
—
|
|
||||||
|
Distributions to noncontrolling and redeemable noncontrolling interests
|
(12,537
|
)
|
(15,250
|
)
|
(23,659
|
)
|
||||||
|
Proceeds from issuance of common stock
|
12,713
|
|
1,521
|
|
432
|
|
||||||
|
Proceeds from public offerings, net of underwriting discounts and commissions
|
—
|
|
292,529
|
|
—
|
|
||||||
|
Payments of initial public offering issuance costs
|
—
|
|
(5,521
|
)
|
(1,092
|
)
|
||||||
|
Net cash provided by (used in) financing activities
|
(120,314
|
)
|
317,196
|
|
142,910
|
|
||||||
|
Net increase (decrease) in cash, cash equivalents, and restricted cash
|
96,903
|
|
99,873
|
|
(37,303
|
)
|
||||||
|
Cash, cash equivalents, and restricted cash:
|
||||||||||||
|
Beginning of period
|
280,485
|
|
180,612
|
|
217,915
|
|
||||||
|
End of period
|
$
|
377,388
|
|
$
|
280,485
|
|
$
|
180,612
|
|
|||
|
Supplemental disclosure of cash flow information:
|
||||||||||||
|
Cash paid during the period for interest
|
$
|
69,851
|
|
$
|
59,549
|
|
$
|
37,628
|
|
|||
|
Cash paid during the period for taxes
|
860
|
|
1,748
|
|
616
|
|
||||||
|
Non-cash investing and financing activities:
|
||||||||||||
|
Liabilities recorded for property, plant and equipment
|
1,745
|
|
12,236
|
|
975
|
|
||||||
|
Liabilities recorded for intangible assets
|
—
|
|
3,180
|
|
2,138
|
|
||||||
|
Issuance of common stock warrant
|
—
|
|
—
|
|
9,410
|
|
||||||
|
Reclassification of redeemable convertible preferred stock warrant liability to additional paid-in capital
|
—
|
|
882
|
|
—
|
|
||||||
|
Conversion of redeemable convertible preferred stock into additional paid-in capital
|
—
|
|
1,465,841
|
|
—
|
|
||||||
|
Conversion of 8% convertible promissory notes into additional paid-in capital
|
—
|
|
181,469
|
|
—
|
|
||||||
|
Conversion of 6% and 8% convertible promissory notes into additional paid-in capital to related parties
|
6,933
|
|
40,110
|
|
—
|
|
||||||
|
Reclassification of derivative liability into additional paid-in capital
|
—
|
|
177,208
|
|
—
|
|
||||||
|
Reclassification of prior year prepaid initial public offering costs to additional paid-in capital
|
—
|
|
4,732
|
|
—
|
|
||||||
|
Issuance of common stock
|
—
|
|
—
|
|
1,981
|
|
||||||
|
Issuance of restricted stock
|
—
|
|
—
|
|
1,254
|
|
||||||
|
Accrued distributions to Equity Investors
|
373
|
|
576
|
|
576
|
|
||||||
|
Accrued interest for notes
|
1,812
|
|
19,041
|
|
29,705
|
|
||||||
|
Accrued interest for notes to related parties
|
—
|
|
2,733
|
|
4,368
|
|
||||||
The accompanying notes are an integral part of these consolidated financial statements.
93
Bloom Energy Corporation
Notes to Consolidated Financial Statements
1. Nature of Business, Liquidity, Basis of Presentation and Summary of Significant Accounting Policies
Nature of Business
We design, manufacture, sell and, in certain cases, install solid-oxide fuel cell systems ("Energy Servers") for on-site power generation. Our Energy Servers utilize an innovative fuel cell technology and provide efficient energy generation with reduced operating costs and lower greenhouse gas emissions as compared to conventional fossil fuel generation. By generating power where it is consumed, our energy producing systems offer increased electrical reliability and improved energy security while providing a path to energy independence. We were originally incorporated in Delaware under the name of Ion America Corporation on January 18, 2001 and on September 16, 2006, we changed our name to Bloom Energy Corporation.
Liquidity
We have incurred operating losses and negative cash flows from operations since our inception. Additionally, as disclosed in Note 17,
Subsequent Events
, the impact of COVID-19 on our ability to execute our business strategy and on our financial position and results of operations is uncertain. Additionally, as of December 31, 2019, the current portion of our total debt was
$337.6 million
, which would require cash payments of
$353.5 million
in the next 12 months. Cash and cash equivalents and other liquidity was insufficient to satisfy the above current debt obligations as well as operating cash flow requirements as of December 31, 2019. As a result, on March 31, 2020, we extended the maturity for our current debt as follows:
|
•
|
We entered into an Amendment Support Agreement (the “Amendment Support Agreement”) with the beneficial owners (the “Noteholders”) of its outstanding 6.0% Convertible Notes due 2020 (the “Convertible Notes”) pursuant to which such Noteholders have agreed, to extend the maturity date of the Convertible Notes to December 1, 2021. In connection with the extension, the interest rate was increased to
10%
and the strike price on the conversion feature was reduced to
$8
/share. The Amendment Support Agreement requires that we repay at least
$70.0 million
of the Convertible Notes on or before September 1, 2020.
|
|
•
|
On March 31, 2020, we entered into an Amended and Restated Subordinated Secured Convertible Note Modification Agreement (the “Constellation Note Modification Agreement”) with Constellation NewEnergy, Inc. (“Constellation”) pursuant to which certain terms of our outstanding Amended and Restated Subordinated Secured Convertible Note issued to Constellation were modified to extend the maturity date to December 31, 2021.
|
|
•
|
On March 31, 2020, we entered into a note purchase agreement pursuant to which certain investors have agreed to purchase, and we have agreed to issue,
$70.0 million
of
10.25%
Senior Secured Notes due 2027 (the “Senior Secured Notes”) in a private placement (the “Senior Secured Notes Private Placement”). The funding of the Note Purchase Agreement, which is expected to occur no later than May 29, 2020, is subject to certain conditions, including obtaining a rating from a rating agency which is dependent upon providing audited financial statements as of and for the year ended December 31, 2019. Upon funding by the purchasers,
100%
of any funds received is required to be utilized to pay one holder of the Convertible Notes discussed above. This payment will be used to extinguish the
$70.0 million
due as of September 1, 2020.
|
|
•
|
Also on March 31, 2020, we entered into a convertible note purchase agreement (the “Convertible Note Purchase Agreement”) with Foris Ventures, LLC and New Enterprise Associates 10, Limited Partnership (together, the “Purchasers”), pursuant to which such Purchasers were issued
$30.0 million
aggregate principal amount of additional Convertible Notes.
|
Our future cash flow requirements may vary materially from those currently planned and will depend on many factors, including our rate of revenue growth, the timing and extent of spending on research and development efforts and other business initiatives, the rate of growth in the volume of system builds, the expansion of sales and marketing activities, market acceptance of our products, the timing of receipt by us of distributions from our PPA Entities and overall economic conditions including the impact of COVID-19 on our future operations. However, in the opinion of management, the combination of our existing cash and cash equivalents, the extension of the Convertible Notes and Constellation Note Modification to December 2021, the proceeds from the convertible note agreement, and operating cash flows is expected to be sufficient to meet our operational and capital cash flow requirements and other cash flow needs for the next 12 months from the date of this Annual Report on Form 10-K.
94
For additional information on the terms of the amended Notes and the terms and provision of the new notes obtained, see Note 17,
Subsequent Events
.
Basis of Presentation
We have prepared the consolidated financial statements included herein pursuant to the rules and regulations of the U.S. Securities and Exchange Commission ("SEC").
The consolidated balance sheets as of
December 31, 2019
and
2018
, the consolidated statements of operations, the consolidated statements of comprehensive loss, the consolidated statements of convertible redeemable preferred stock, redeemable noncontrolling interest, stockholders' deficit and noncontrolling interest, and the consolidated statements of cash flows for the years ended
December 31, 2019
,
2018
and
2017
, as well as other information disclosed in the accompanying notes have been prepared in accordance with generally accepted accounting principles as applied in the United States ("U.S. GAAP").
Restatement and Revision of Previously Issued Consolidated Financial Statements
In this Annual Report on Form 10-K, we have restated our consolidated financial statements for the year ended December 31, 2018, as well as the unaudited financial statements for the three month period ended March 31, 2019, the three and six month periods ended June 30, 2019 and 2018 and the three and nine month periods ended September 30, 2019 and 2018, to correct misstatements in those prior periods primarily related to (i) misstatements identified in improperly applying accounting guidance on certain managed services and similar transactions and recognizing them as sales, rather than financing transactions, under the guidance of Accounting Standards Codification ("ASC") Topic 840 -
Leases
, (ii) misstatements relating to not capitalizing stock-based compensation expenses directly associated with the product manufacturing operations process and expensed when the capitalized asset is used in the normal course of the sales or services process under the provisions of SEC Staff Accounting Bulletin Topic 14, (iii) misstatements related to not recording derivative liabilities for embedded derivatives in certain revenue agreements for an escalator price protection (“EPP”) feature given to our customers, and (iv) certain other identified misstatements which were not material individually or in the aggregate.
In addition, management determined that the impact of these misstatements to periods prior to the three months ended June 30, 2018 was not material to warrant restatement of reported figures; however, our consolidated financial statements as of and for the year ended December 31, 2017 and the unaudited interim condensed consolidated financial information for the three month period ended March 31, 2018 are revised to correct these misstatements.
See Note 2,
Restatement and Revision of Previously Issued Consolidated Financial Statements
for additional information regarding the errors identified in this Annual Report on Form 10-K and the restatement and revision adjustments made to the Consolidated Financial Statements.
Principles of Consolidation
These consolidated financial statements reflect our accounts and operations and those of our subsidiaries in which we have a controlling financial interest. We use a qualitative approach in assessing the consolidation requirement for each of our variable interest entities ("VIE"), which we refer to as our power purchase agreement entities ("PPA Entities"). This approach focuses on determining whether we haves the power to direct those activities of the PPA Entities that most significantly affect their economic performance and whether we have the obligation to absorb losses, or the right to receive benefits, that could potentially be significant to the PPA Entities. For all periods presented, we have determined that we are the primary beneficiary in all of our operational PPA Entities other than with respect to the PPA II Entity, as discussed below.
We evaluate our relationships with the PPA Entities on an ongoing basis to ensure that we continue to be the primary beneficiary. All intercompany transactions and balances have been eliminated in consolidation. On June 14, 2019, we entered into a transaction with SP Diamond State Class B Holdings, LLC (“SPDS”), a wholly owned subsidiary of Southern Power Company, in which SPDS will purchase a majority interest in PPA II, which operates in Delaware providing alternative energy generation for state tariff rate payers (the "PPA II upgrade of Energy Servers"). PPA II will use the funds received to purchase current generation Bloom Energy Servers in connection with the upgrade of its energy generation assets fleet. In connection with the closing of this transaction, SPDS was admitted as a member of Diamond State Generation Partners, LLC ("DSGP"). DSGP, an operating company, is now owned by Diamond State Generation Holdings, LLC ("DSGH") and SPDS. As a result of the PPA II upgrade of Energy Servers, we determined that we no longer retain a controlling interest in PPA II and therefore DSGP was no longer consolidated as a VIE into our consolidated financial statements as of June 30, 2019. On November 27, 2019, we entered into a PPA IIIb upgrade of Energy Servers transaction such that the Project Company became indirectly wholly-owned by us and therefore, it was no longer a VIE.
For additional information, see
Note 13, Power Purchase Agreement Programs - PPA II Upgrade of Energy Servers
.
95
Use of Estimates
The preparation of consolidated financial statements in conformity with U.S. GAAP requires us to make estimates and assumptions that affect the amounts reported in the consolidated financial statements and the accompanying notes. The most significant estimates include the determination of the best estimate of selling price under ASC 605, and stand-alone selling price under ASC 606, including material rights estimates, inventory valuation, specifically excess and obsolescence provisions for obsolete or unsellable inventory and, in relation to property, plant and equipment (specifically Energy Servers), assumptions relating to economic useful lives and impairment assessments.
Other accounting estimates include variable consideration relating to product performance guaranties, assumptions to compute the fair value of lease and non-lease components and related financing obligations such as incremental borrowing rates, estimated output, efficiency and residual value of the Energy Servers, warranty, product performance guaranties and extended maintenance, derivative valuations, estimates for recapture of U.S. Treasury grants and similar grants, estimates relating to contractual indemnities provisions, estimates for income taxes and deferred tax asset valuation allowances, and stock-based compensation costs . Actual results could differ materially from these estimates under different assumptions and conditions.
Concentration of Risk
Geographic Risk -
The majority of our revenue and long-lived assets are attributable to operations in the United States for all periods presented. Additionally, we sell our Energy Servers in Japan, China, India, and the Republic of Korea (collectively, our "Asia Pacific region"). In the year ended
December 31, 2019
and
2018
, total revenue in the Asia Pacific region was
23%
and
14%
, respectively, of our total revenue.
Credit Risk -
At
December 31, 2019
, two customers, Costco Wholesale Corporation and The Kraft Group LLC accounted for approximately
19%
and
17%
, respectively, of accounts receivable. At December 31, 2018, SK (Korea) accounted for approximately
64%
of accounts receivable. At
December 31, 2019
and
2018
, we did not maintain any allowances for doubtful accounts as we deemed all of our receivables fully collectible. To date, we have neither provided an allowance for uncollectible accounts nor experienced any credit loss.
Customer Risk
- In the year ended
December 31, 2019
, revenue from two customers, The Southern Company and SK (Korea) accounted for approximately
34%
and
23%
, respectively, of our total revenue. In the year ended
December 31, 2018
, revenue from customer The Southern Company accounted for approximately
51%
of our total revenue. The Southern Company wholly owns a Third-Party PPA which purchases Energy Servers from us, however such purchases and resulting revenue are made on behalf of various customers of this Third-Party PPA.
Cybersecurity Risk
All of our installed Energy Servers are connected to and controlled and monitored by our centralized remote monitoring service. Additionally, we rely on internal computer networks for many of the systems used to operate the business generally. We may be vulnerable to breaches, unauthorized access, misuse, computer viruses or other malicious code and cyber-attacks. We take protective measures and endeavors to modify these internal systems as circumstances warrant to prevent unauthorized intrusions or disruptions.
Summary of Significant Accounting Policies
Revenue Recognition
We primarily earn product and installation revenue from the sale and installation of our Energy Servers, service revenue by providing services under operations and maintenance services contracts and electricity revenue by selling electricity to customers under power purchase agreements. We offer our customers several ways to finance their use of a Bloom Energy Server. Customers, including some of our international channel providers and Third Party PPAs, may choose to purchase our Energy Servers outright. Customers may also lease our Energy Servers through one of our financing partners via our Managed Services Program or as a traditional lease. Finally, customers may purchase electricity through our Power Purchase Agreement Programs.
Prior to Adoption of ASC 606 Revenue from Contracts with Customers
Prior to the adoption of ASC 606
Revenue from Contracts with Customers
, we recognized revenue from contracts with customers for the sales of products, installation and services in accordance with ASC 605-25,
Revenue Recognition for Multiple-Element Arrangements.
Revenue from the sale and installation of Energy Servers was recognized when all of the following criteria are met:
96
|
•
|
Persuasive evidence of an arrangement exists. We rely upon non-cancelable sales agreements and purchase orders to determine the existence of an arrangement.
|
|
•
|
Delivery and acceptance have occurred. We use shipping documents and confirmation from our installations team that the deployed systems are running at full power as defined in each contract to verify delivery and acceptance.
|
|
•
|
The fee is fixed or determinable. We assess whether the fee is fixed or determinable based on the payment terms associated with the transaction.
|
|
•
|
Collectability is reasonably assured. We assess collectability based on the customer’s credit analysis and payment history.
|
When these criteria are met, we allocate revenue to each element of the customer arrangement (product, installation and services) based on an estimated selling price at the arrangement inception. The estimated selling price for each element is based upon the following hierarchy: vendor-specific objective evidence ("VSOE") of selling price, if available; third-party evidence ("TPE") of selling price, if VSOE of selling price is not available; or best estimate of selling price ("BESP") if neither VSOE of selling price nor TPE of selling price are available. We limit the amount of revenue recognized for delivered elements to an amount that is not contingent upon future delivery of additional products or services or upon meeting any specified performance conditions.
We have not been able to obtain reliable evidence of the selling price of the standalone Energy Server. Given that we typically sell an Energy Server with a maintenance service agreement and have not provided maintenance services to a customer who does not have use of an Energy Server, we have no evidence of selling prices for either and virtually no customers have elected to cancel their maintenance service agreements while continuing to operate the Energy Servers. Our objective is to determine the price at which we would transact business if the items were being sold separately. As a result, our estimate of our selling price is driven primarily by our expected margin on both the Energy Server and installation based on their respective costs and, in the case of maintenance service agreements, the estimated costs to be incurred during the expected service period.
Costs for Energy Servers include all direct and indirect manufacturing costs, applicable overhead costs and costs for normal production inefficiencies (i.e., variances). We then apply a margin to the Energy Servers and to expected installation costs to determine the selling price to be used in our BESP model. Costs for maintenance service arrangements are estimated over the expected life of the maintenance contracts and include estimated future service costs and future material costs. Material costs over the expected period of the service arrangement are impacted significantly by the longevity of the fuel cells themselves. After considering the total service costs, we apply a lower margin to our service costs than to our Energy Servers as it best reflects our long-term service margin expectations. As our business offerings and eligibility for the Investment Tax Credit ("ITC") evolve over time, we may be required to modify our estimated selling prices in subsequent periods and our revenue could be adversely affected.
Subsequent to adoption of ASC 606 Revenue from Contracts with Customers
In May 2014, the Financial Accounting Standards Board "FASB" issued Accounting Standards Update "ASU" No. 2014-09,
"Revenue from Contracts with Customers
("ASU 2014-09")." This standard superseded most of the previous revenue recognition guidance under U.S. GAAP and is intended to improve and converge with international standards' related financial reporting requirements for revenue recognition. The core principle of the new guidance is that an entity should recognize revenue to depict the transfer of control of promised goods or services to customers in an amount that reflects the consideration to which the entity expects to be entitled in exchange for those goods or services. New disclosures about the nature, amount, timing and uncertainty of revenue and cash flows arising from contracts with customers are also required. Subsequently, the FASB issued several standards that clarified certain aspects of ASU 2014-09, but did not significantly change the original standard. We adopted ASU 2014-09 and its related amendments (collectively “ASC 606”) as of January 1, 2019 using the modified retrospective method. Under the modified retrospective method, results for reporting periods beginning after December 31, 2018 are presented under ASC 606 while prior period financial information is not adjusted and continues to be reported under prior guidance (“ASC 605”). See “
Accounting Guidance Implemented in Fiscal Year 2019
” below for additional information on the impact of adopting ASC 606.
In applying ASC 606, Revenue related to contracts with customers is recognized by following a five-step process:
|
•
|
Identify the contract(s) with a customer.
Evidence of a contract generally consists of a purchase order issued pursuant to the terms and conditions of a distributor, reseller, purchase, use and maintenance agreement, maintenance service agreements or energy supply agreement.
|
|
•
|
Identify the performance obligations in the contract.
Performance obligations are identified in our contracts and include transferring control of an Energy Server, installation of Energy Servers, providing maintenance services and maintenance service renewal options which provide customers with material rights.
|
97
|
•
|
Determine the transaction price.
The purchase price stated in an agreed upon purchase order or contract is generally representative of the transaction price. When determining the transaction price, we consider the effects of any variable consideration, which include performance penalties that may be payable to our customers.
|
|
•
|
Allocate the transaction price to the performance obligations in the contract.
The transaction price in a contract is allocated based upon the relative standalone selling price of each distinct performance obligation identified in the contract.
|
|
•
|
Recognize revenue when (or as) we satisfy a performance obligation.
We satisfy performance obligations either over time or at a point in time as discussed in further detail below. Revenue is recognized at the time the related performance obligation is satisfied by transferring control of the promised products or services to a customer.
|
We frequently combine contracts governing the sale and installation of an Energy Server with the related maintenance service contracts and account for them as a single contract at contract inception to the extent the contracts are with the same customer. These contracts are not combined when the customer for the sale and installation of the Energy Server is different to the maintenance service contract customer. We also assess whether any contract terms including default provisions, put or call options result in components of our contracts being accounted for as financing or leasing transactions outside of the scope of ASC 606.
Most of our contracts contain performance obligations with a combination of our Energy Server product, installation and maintenance services. For these performance obligations, we allocate revenue to each performance obligation based on the total transaction price for each contract. Our maintenance service contracts are typically subject to renewal by customers on an annual basis. We assess these maintenance service renewal options at contract inception to determine whether they provide customers with material rights that give rise to a separate performance obligation.
The total transaction price is determined based on the total consideration specified in the contract, including variable consideration in the form of a production guarantee payment that represents potential amounts payable to customers. The expected value method is generally used when estimating variable consideration, which typically reduces the total transaction price due to the nature of the performance obligations to which the variable consideration relates. These estimates reflect our historical experience and current contractual requirements which cap the maximum amount that may be paid. The expected value method requires judgment and considers multiple factors that may vary over time depending upon the unique facts and circumstances related to each performance obligation. Depending on the facts and circumstances, a change in variable consideration estimate will either be accounted for at the contract level or using the portfolio method. We also consider the customers’ rights of return in determining the transaction price where applicable.
We exclude from the transaction price all taxes assessed by governmental authorities that are both (i) imposed on and concurrent with a specific revenue-producing transaction and (ii) collected from customers. Accordingly, such tax amounts are not included as a component of net sales or cost of sales. We allocate the transaction price to each performance obligation in an amount that depicts the amount of consideration to which we expect to be entitled in exchange for transferring and installing the Energy Server and providing associated maintenance services.
Given that we typically sell an Energy Server with a maintenance service agreement and have not provided maintenance services to a customer who does not have use of an Energy Server, standalone selling prices are estimated using a cost-plus approach. Costs relating to Energy Servers include all direct and indirect manufacturing costs, applicable overhead costs and costs for normal production inefficiencies (i.e., variances). We then apply a margin to the Energy Servers which may vary with the size of the customer, geographic region and the scale of the Energy Server deployment. As our business offerings and eligibility for the Investment Tax Credit ("ITC") evolve over time, we may be required to modify the expected margin in subsequent periods and our revenue could be adversely affected.
Costs relating to installation include all direct and indirect installation costs. The margin we apply reflects our profit objectives relating to installation. Costs for maintenance service arrangements are estimated over the life of the maintenance contracts and include estimated future service costs and future material costs. Material costs over the period of the service arrangement are impacted significantly by the longevity of the fuel cells themselves. After considering the total service costs, we apply a lower margin to our service costs than to our Energy Servers as it best reflects our long-term service margin expectations and comparable historical industry service margins.
As a result, our estimate of our selling price is driven primarily by our expected margin on both the Energy Server and the maintenance service agreements based on their respective costs or, in the case of maintenance service agreements, the estimated costs to be incurred. We recognize product and installation revenue at the point in time that the Customer obtains control of the Energy Server. We recognize maintenance service revenue, including revenue associated with any related customer material rights, over time as we perform service maintenance activities.
98
Amounts billed to customers for shipping and handling activities are considered contract fulfillment activities and not a separate performance obligation of the contract. Shipping and handling fees are recorded as revenue and the related cost is a cost to fulfill the contract that is recognized within costs of goods sold.
The following is a description of the principal activities from which we generate revenue. Our four revenue streams are classified as follows:
Product Revenue -
All of our product revenue is generated from the sale of our Energy Servers to direct purchase, including financing partners on Third-Party PPAs, international channel providers and traditional lease customers. We generally recognize product revenue from contracts with customers at the point that control is transferred to the customers. This occurs when we achieve customer acceptance which is when the system has been installed and is running at full power or, in the case of sales to our international channel providers, based upon shipment terms.
Under our traditional leases financing option, we sell our Energy Servers through a direct sale to a financing partner who, in turn, leases the Energy Servers to the customer under a lease agreement. With our sales to our international channel providers, our international channel providers typically sell the Energy Servers to, or sometimes provide a PPA to, an end customer. In both traditional lease and international channel providers transactions, we contract directly with the end customer to provide extended maintenance services after the end of the standard warranty period. As a result, since the customer that purchases the server is a different and unrelated party to the customer that purchases extended warranty services, the product and maintenance service contract are not combined.
Payments received from customers are recorded within deferred revenue and customer deposits in the consolidated balance sheets until the acceptance criteria as defined within the customer contract are met. The related cost of such product and installation is also deferred as a component of deferred cost in the consolidated balance sheets until acceptance.
Installation Revenue -
Nearly all of our installation revenue relates to the installation of Energy Servers sold to direct purchase, including financing partners on Third-Party PPAs and traditional lease customers. Generally, we recognize installation revenue when the system has been installed and is running at full power.
Service Revenue -
Service revenue is generated from maintenance services agreements. We typically provide to our customers a standard
one-year warranty
, against manufacturing or performance defects in our Energy Servers. We also sell to these customers extended annual maintenance services that effectively extend the standard one-year warranty coverage at the customer’s option. These customers generally have an option to renew or cancel the extended maintenance services on an annual basis and nearly every customer has renewed historically. The contractual renewal price may be less than the standalone selling price of the maintenance services and consequently the contract renewal option may provide the customer with a material right.
Revenue is recognized over the term of the renewed one-year service period. Given our customers' renewal history, we anticipate that almost all of our customers will continue to renew their maintenance services agreements each year through their expected use of the Energy Server. As a result, we estimate the standalone selling price for customer renewal options that give rise to material rights using the practical alternative by reference to optional operations and maintenance services renewal periods expected to be provided and the corresponding expected consideration for these services. This reflects that our additional performance obligations in any contractual renewal period are consistent with the services provided under the initial maintenance service contract.
Payments from customers for the extended maintenance contracts are received at the beginning of each service year. Accordingly, the customer payment received is recorded as a customer deposit and revenue is recognized over the related service period as the services are performed using a cost-to-cost basis that reflects the cost of providing these services.
Electricity Revenue -
We sell electricity produced by our Energy Servers owned directly by us or by our consolidated PPA entities. Our PPA Entities purchase Energy Servers from us and sell electricity produced by these systems to customers through long-term power purchase agreements ("PPAs"). Customers are required to purchase all of the electricity produced by those Energy Servers at agreed-upon rates over the course of the PPAs' contractual term.
In addition, in certain product sales, we are a party to master lease agreements that provide for the sale of our Energy Servers to third-parties and the simultaneous leaseback of the systems, which we then sublease to our customers. In sale-leaseback sublease arrangements ("Managed Services"), we first determine whether the Energy Servers under the sale-leaseback arrangement are “integral equipment”. As the Energy Servers are determined not to be integral equipment, we determine if the leaseback is classified as a capital lease or an operating lease.
Our managed services arrangements with the financing party are classified as capital leases and are recorded as financing transactions, while the sub-lease arrangements with the end customer are classified as operating leases. Payments received from the financier are recorded as financing leases. We then recognize revenue for the electricity generated by allocating the total proceeds based on the relative standalone selling prices to electricity revenue and to service revenue. Electricity revenue
99
relating to power purchase agreements is typically accounted for in accordance with ASC 840
Leases
and service revenue in accordance with ASC 606.
We recognize revenue from the PPAs and Managed Services contracts as the electricity is provided over the term of the agreement.
Contract modifications are accounted for as separate contracts if the additional products and services are distinct and priced at standalone selling prices. If the additional products and services are distinct, but not priced at standalone selling prices, the modification is treated as a termination of the existing contract and the creation of a new contract. Lastly, if the additional products and services are not distinct within the context of the contract, the modification is combined with the original contract and either an increase or decrease in revenue is recognized on the modification date. During fiscal 2019, we did not recognize any material revenue for contracts modified during the period that had performance obligations satisfied in prior periods.
We recognize a contract liability (deferred revenue) when we have an obligation to transfer products or services to a customer in advance of us satisfying a performance obligation and the contract liability is reduced as performance obligations are satisfied and revenue is recognized. The related cost of such product is deferred as a component of deferred cost of goods sold in the consolidated balance sheets. Prior to shipment of the product or the commencement of performance of maintenance services, any prepayment made by the customer is recorded as a customer deposit.
A description of the principal activities from which we recognize cost of revenues associated with each of our revenue streams are classified as follows:
Cost of Product Revenue -
Cost of product revenue consists of costs of our Energy Servers that we sell to direct customers, including financing partners on Third-Party PPA, international channel providers and traditional lease customers. It includes costs paid to our materials suppliers, direct labor, manufacturing and other overhead costs, shipping costs, provisions for excess and obsolete inventory and the depreciation costs of our equipment. Estimated standard one-year warranty costs are also included in cost of product revenue for those contracts that do not contain material rights, see
Warranty Costs
below.
Cost of Installation Revenue -
Cost of installation revenue primarily consists of the costs to install our Energy Servers that we sell to direct, including financing partners on Third-Party PPAs and lease customers. It includes costs paid to our materials and service providers, personnel costs, shipping costs, and allocated costs.
Cost of Service Revenue -
Cost of service revenue consists of costs incurred under maintenance service contracts for all customers. It includes personnel costs for our customer support organization, certain allocated costs and extended maintenance-related product repair and replacement costs.
Cost of Electricity Revenue -
Cost of electricity revenue primarily consists of the depreciation of the cost of the Energy Servers owned by us or the consolidated PPA Entities and the cost of gas purchased in connection with our first PPA Entity. The cost of electricity revenue is generally recognized over the term of the Managed Services agreement or customer’s PPA contract. The cost of depreciation of the Energy Servers is reduced by the amortization of any U.S. Treasury Department grant payment in lieu of the energy investment tax credit associated with these systems.
Revenue Recognized from Power Purchase Agreement Programs
(See Note 13 -
Power Purchase Agreement Programs
)
In 2010, we began offering our Energy Servers through our Bloom Electrons financing program. This program is financed via a special purpose Investment Company and Operating Company, collectively referred to as a PPA Entity, and are owned partly by us and partly by third-party investors. The investors contribute cash to the PPA Entity in exchange for an equity interest, which then allows the PPA Entity to purchase our Energy Server from us. The cash contributions held are classified as short-term or long-term restricted cash according to the terms of each power purchase agreement. As we identify end customers, the PPA Entity enters into a PPA with the end customer pursuant to which the customer agrees to purchase the power generated by the Bloom Energy Server at a specified rate per kilowatt hour ("kWh") for a specified term, which can range from
10
to
21
years. The PPA Entity typically enters into a maintenance services agreement with us following the first year of service to extend the standard one-year warranty service and performance guaranties. This intercompany arrangement is eliminated in consolidation. Those power purchase agreements that qualify as leases are classified as either sales-type leases or operating leases and those that do not qualify as leases are classified as tariff agreements. For both operating leases and tariff agreements, income is recognized as contractual amounts are due when the electricity is generated and presented within electricity revenue on the consolidated statements of operations.
Sales-Type Leases -
Certain arrangements entered into by certain PPA entities, including Bloom Energy 2009 PPA Project Company, LLC ("PPA I"), 2012 ESA Project Company, LLC ("PPA IIIa") and 2013B ESA Project Company, LLC ("PPA IIIb"), qualify as sales-type leases in accordance with FASB ASC Topic 840,
Leases
("ASC 840"). We are responsible for
100
the installation, operation and maintenance of the Energy Servers at the customers' sites, including running the Energy Servers during the term of the PPA which ranges from
10
to
15
years. Based on the terms of the customer contracts, we may also be obligated to supply fuel for the Energy Servers. The amount billed for the delivery of the electricity to PPA I’s customers primarily consists of returns on the amounts financed including interest revenue, service revenue and fuel revenue for certain arrangements.
We are obligated to supply fuel to the Energy Servers that deliver electricity under the PPA I agreements. Based on the customer offtake agreements, the customers pay an all-inclusive rate per kWh of electricity produced by the Energy Servers. The consideration received under the PPA I agreements primarily consists of returns on the amounts financed including interest revenue, service revenue and fuel revenue on the consolidated statements of operations.
As the Power Purchase Agreement Programs contain a lease, the consideration received is allocated between the lease elements (lease of property and related executory costs) and non-lease elements (other products and services, excluding any derivatives) based on relative fair value. Lease elements include the leased system and the related executory costs (i.e. installation of the system, electricity generated by the system, maintenance costs). Non-lease elements include service, fuel and interest related to the leased systems.
Service revenue and fuel revenue are recognized over the term of the PPA as electricity is generated. The interest component related to the leased system is recognized as interest revenue over the life of the lease term. The customer has the option to purchase the Energy Servers at the then fair market value at the end of the PPA contract term.
Service revenue related to sales-type leases of
$2.9 million
,
$3.4 million
and
$4.0 million
for the years ended
December 31, 2019
,
2018
and
2017
, respectively, is included in electricity revenue in the consolidated statements of operations.
Product revenue associated with the sale of the Energy Servers under the PPAs that qualify as sales-type leases is recognized at the present value of the minimum lease payments, which approximates fair value, assuming all other conditions for revenue recognition noted above have also been met. A sale is typically recognized as revenue when an Energy Server begins generating electricity and has been accepted, which is consistent across all purchase options in that acceptance generally occurs after the Energy Server has been installed and is running at full power as defined in each contract. There was
no
product revenue recognized under sales-type leases for the years ended
December 31, 2019
,
2018
and
2017
.
Operating Leases -
Certain Power Purchase Agreement Program leases entered into by PPA IIIa, PPA IIIb, 2014 ESA Holdco, LLC ("PPA IV") and 2015 ESA Holdco, LLC ("PPAV") that are leases in substance, but do not meet the criteria of sales-type leases or direct financing leases in accordance with ASC 840, are accounted for as operating leases. Revenue under these arrangements is recognized as electricity sales and service revenue and is provided to the customer at rates specified under the contracts. During the years ended
December 31, 2019
,
2018
and
2017
, revenue from electricity sales from these PPA arrangements amounted to
$29.7 million
,
$30.9 million
and
$29.9 million
, respectively. During the years ended
December 31, 2019
,
2018
and
2017
, service revenue amounted to
$14.6 million
,
$15.2 million
and
$15.6 million
, respectively.
Financing Leases Under Managed Services Agreements
- Certain of our customers use managed services agreements to finance their lease of Bloom Energy Servers which are accounted for as operating leases with the end customer. As a result, revenue is recognized over the life of the managed service agreements as power is generated by the Energy Servers. The Managed Services Program is one of several financing vehicles we use to sell our Energy Servers. Under our Managed Services Program, we sell our equipment to a bank financing party, which pays us for the Energy Server and takes title to the Energy Server. We then enter into a sublease contract with an end customer, which pays us a fixed, monthly fee for its use of the Energy Server and pays us for our maintenance services on the Energy Server. The fees we receive for the maintenance services on the Energy Server is recognized as services revenue. In addition, the payments received from our customers under our Managed Services program for power generated by our Energy Servers are also recorded as services revenue, as well as electricity revenue over the term of the agreement using our standalone selling price model allocation.
The fixed, monthly fee for the use of the Energy Server is then paid to the bank to pay down the lease obligation, with interest thereon being calculated on an effective interest rate basis.
Incentives and Grants
Tariff Agreement -
PPA II entered into an agreement with Delmarva, PJM Interconnection (PJM), a regional transmission organization, and the State of Delaware under which PPA II provided the energy generated from its Energy Servers to PJM and received a tariff as collected by Delmarva.
Revenue at the tariff rate was recognized as electricity sales and service revenue as it was generated over the term of the arrangement until the final repowering in December 2019. Revenue relating to power generation at the Delmarva sites of
$11.3 million
,
$23.0 million
and
$23.3 million
for the years ended
December 31, 2019
,
2018
and
2017
, respectively, is included in electricity sales in the consolidated statements of operations. Revenue relating to power generation at the Delmarva sites of
$6.8
101
million
,
$13.7 million
and
$13.9 million
for the years ended
December 31, 2019
,
2018
and
2017
, respectively, is included in service revenue in the consolidated statements of operations.
Investment Tax Credits
("ITCs")
-
Through December 31, 2016, our Energy Servers were eligible for federal ITCs that accrued to eligible property under Internal Revenue Code Section 48. Under our Power Purchase Agreement Programs, ITCs are primarily passed through to Equity Investors with approximately
1%
to
10%
of incentives received by us. These incentives are accounted for by using the flow-through method. On February 9, 2018, the U.S. Congress passed legislation to extend the federal investment tax credits for fuel cell systems applicable retroactively to January 1, 2017. Due to this reinstatement of ITC in 2018, the benefit of ITC to total revenue was
$45.5 million
of revenue benefit related to the retroactive ITC for 2017 acceptances.
The ITC program has operational criteria for the first
five years
after the qualified equipment is placed in service. If the qualified energy property is disposed or otherwise ceases to be investment credit property before the close of the
five
-year recapture period is fulfilled, it could result in a partial reduction of the incentives.
No
ITC recapture has occurred during the years ended
December 31, 2019
,
2018
and
2017
.
Recapture of U.S. Treasury Grants and Similar Grants and Indemnifications
Our Energy Servers are eligible for federal ITCs that accrued to qualified property under Internal Revenue Code Section 48 when placed into service. However, the ITC program has operational criteria that extend for five years. If the energy property is disposed or otherwise ceases to be qualified investment credit property before the close of the five year recapture period is fulfilled, it could result in a partial reduction of the incentives. Our purchase of Energy Servers were by the PPA Entities and, therefore, the PPA Entities bear the risk of repayment if the assets placed in service do not meet the ITC operational criteria in the future. As part of our upgrade of Energy Servers during 2019, we have agreed to indemnify our customer for up to
$108.7 million
should benefits expected from anticipated ITC grants and established tariffs fail to occur. Based on outside expert guidance, we believe these events to be less than likely to occur and have not established financial reserves.
Warranty Costs
We generally warrant our products sold to our direct customers for
one
year following the date of acceptance of the products (the “
standard one-year warranty
”). To estimate the product warranty costs, we continuously monitor product returns for warranty failures and maintains the reserve for the related warranty expense based on various factors including historical warranty claims, field monitoring and results of lab testing. Our performance obligations under our standard product warranty and managed services agreements are generally in the form of product replacement, repair or reimbursement for higher customer electricity costs. The standard one-year warranty covers defects in materials and workmanship under normal use and service conditions and against manufacturing or performance defects. Prior to adoption of ASC 606
Revenue From Contracts With Customers
, our warranty accrual represents our best estimate of the amount necessary to settle future and existing claims during the warranty period as of the balance sheet date. We accrue for warranty costs based on estimated costs that may be incurred including material costs, labor costs and higher customer electricity costs should the units not work for extended periods.
With the adoption of ASC 606
Revenue From Contracts With Customers
for the year ended 2019, we only recognize warranty costs for those contracts that are considered to be assurance-type warranties and consequently do not give rise to performance obligations or for those maintenance service contracts that were previously in the scope of ASC 605-20-25,
Separately Priced Extended Warranty and Product Maintenance Contracts
.
As part of both our
standard one-year warranty
and managed services agreements obligations, we monitor the operations of the underlying systems and provide output and efficiency guaranties (collectively “product performance guaranties”). If the Energy Servers run at a lower efficiency or power output than we committed under our product performance guaranty, we will reimburse the customer for this underperformance. Our performance obligation includes ensuring the customer’s equipment operates at least at the efficiency and power output levels set forth in the customer agreement. Our aggregate reimbursement obligation for this performance guaranty for each customer is capped based on the purchase price of the underlying energy server. Product performance guaranty payments are accounted for as a reduction in service revenue. We accrue for product performance guaranties based on the estimated amounts reimbursable at each reporting period and recognize the costs as a reduction to revenue.
Shipping and Handling Costs
We record costs related to shipping and handling in cost of revenue, as they are incurred.
Sales and Utility Taxes
We recognize revenue on a net basis for taxes charged to our customers and collected on behalf of the taxing authorities.
102
Operating Expenses
Advertising and Promotion Costs -
Expenses related to advertising and promotion of products are charged to sales and marketing expense as incurred. We did not incur any material advertising or promotion expenses during the years ended
December 31, 2019
,
2018
and
2017
.
Research and Development -
We conduct internally funded research and development activities to improve anticipated product performance and reduce product life-cycle costs. Research and development costs are expensed as incurred and include salaries and expenses related to employees conducting research and development.
Stock-Based Compensation -
We account for stock options and restricted stock units ("RSUs") awarded to employees and non-employee directors under the provisions of Financial Accounting Standards Board Accounting Standards Codification Topic 718 -
Compensation-Stock Compensation
("ASC 718") using the Black-Scholes valuation model to estimate fair value. The Black-Scholes valuation model requires us to make estimates and assumptions regarding the underlying stock’s fair value, the expected life of the option and RSUs, the risk-free rate of return interest rate, the expected volatility of our common stock price and the expected dividend yield. In developing estimates used to calculate assumptions, we established the expected term for employee options and RSUs, as well as expected forfeiture rates, based on the historical settlement experience and after giving consideration to vesting schedules. Stock-based compensation costs are recorded net of estimated forfeitures such that expense is recorded only for those stock-based awards that are expected to vest. Previously recognized costs are reversed for the portion of awards forfeited prior to vesting as and when the forfeitures occurred. We typically record stock-based compensation costs under the straight-line attribution method over the vesting term, which is generally four years for options, and record stock-based compensation costs for performance-based awards using the graded-vesting method. Stock issued to grantees in our stock-based compensation is from authorized and previously unissued shares. Stock-based compensation expense is recorded in the consolidated statements of operations based on the employees’ respective function. Stock-based compensation costs directly associated with the product manufacturing operations process are capitalized into inventory and expensed when the capitalized asset is used in the normal course of the sales or services process.
Stock-based compensation cost for RSUs is measured based on the fair value of the underlying shares on the date of grant. Up to the date of our IPO, RSUs were subject to a time-based vesting condition and a performance-based vesting condition, both of which require satisfaction before the RSUs vest and settle for shares of common stock. The performance-based condition was tied to a liquidity event such as a sale event of Bloom or the completion of our IPO. The time-based conditions range between six months and four years from the end of the lock-up period after our IPO. Upon completion of our IPO in July 2018, the performance-based condition of our RSUs was satisfied and we began recognizing stock-based compensation over the remaining time-based vesting condition, which ranges from six months and up to four years from IPO.
We use the Black-Scholes valuation model to estimate the fair value of stock purchase rights under our 2018 ESPP. The fair value of the 2018 ESPP purchase rights is recognized as expense under the multiple options approach. Forfeitures are estimated at the time of grant and revised in subsequent periods, if necessary, if actual forfeitures differ from initial estimates. Stock-based compensation expense is recorded in the consolidated statements of operations based on the employees’ respective function.
For performance-based awards, stock-based compensation costs are recognized over the expected performance achievement period of individual's performance milestone(s) as the achievement of each individual performance milestone become probable. For performance-based awards with a vesting schedule, based entirely on the attainment of market conditions, stock-based compensation costs are recognized for performance and market conditions when the relevant market condition is considered probable of achievement. The fair value of such awards is estimated on the grant date using Monte Carlo simulations, see
Note 12, Stock-Based Compensation and Employee Benefit Plans
.
Compensation costs for equity instruments granted to non-employees is measured on the date of performance at the fair value of the consideration received or the fair value of the equity instruments issued, whichever is more reliably measured. The fair value of the equity instruments is expensed over the term of the non-employee's service period.
We record deferred tax assets for awards that result in deductions on our income tax returns, unless we cannot realize the deduction (i.e., we are in a net operating loss, or NOL, position), based on the amount of compensation cost recognized and our statutory tax rate. With our adoption of ASU 2016-09
Improvements to Employee Share-Based Payment Accounting (Topic 718)
("ASU 2016-09") in the first quarter of 2017 on a prospective basis, stock-based compensation excess tax benefits or deficiencies are reflected in the consolidated statements of operations as a component of the provision for income taxes. No tax benefit or expense for stock-based compensation has been recorded for the years ended
December 31, 2019
,
2018
and
2017
since we remain in an NOL position.
Determining the amount of stock-based compensation to be recorded requires us to develop estimates for the inputs used in the Black-Scholes valuation model to calculate the grant-date fair value of stock options. We use weighted-average assumptions in applying the Black-Scholes valuation model.
103
The risk-free interest rate for periods within the contractual life of the option is based on the U.S. Treasury zero-coupon issues in effect at the grant date for periods corresponding with the expected term of option. Our estimate of an expected term is calculated based on our historical share option exercise data. We have not and do not expect to pay dividends in the foreseeable future. The estimated stock price volatility is derived based on historical volatility of our peer group, which represents our best estimate of expected volatility.
The amount of stock-based compensation costs recognized during a period is based on the value of that portion of the awards that are ultimately expected to vest. Forfeitures are estimated at the time of grant and revised, if necessary, in subsequent periods if actual forfeitures differ from estimates. The term “forfeitures” is distinct from “cancellations” or “expirations” and represents only the unvested portion of the surrendered option. We review historical forfeiture data and determines the appropriate forfeiture rate based on that data. We reevaluate this analysis periodically and adjust the forfeiture rate as necessary and ultimately recognize the actual expense over the vesting period only for the shares that vest.
Refer to Note 12,
Stock-Based Compensation and Employee Benefit Plans
for further discussion of our stock-based compensation arrangements.
Income Taxes
We account for income taxes using the liability method under FASB ASC Topic 740 -
Income Taxes
("ASC 740"). Under this method, deferred tax assets and liabilities are determined based on net operating loss carryforwards, research and development credit carryforwards and temporary differences resulting from the different treatment of items for tax and financial reporting purposes. Deferred items are measured using the enacted tax rates and laws that are expected to be in effect when the differences reverse. Additionally, we must assess the likelihood that deferred tax assets will be recovered as deductions from future taxable income. We have provided a full valuation allowance on our domestic deferred tax assets because we believe it is more likely than not that our deferred tax assets will not be realized.
We follow the accounting guidance in ASC 740-10, which requires a more-likely-than-not threshold for financial statement recognition and measurement of tax positions taken or expected to be taken in a tax return. We record a liability for the difference between the benefit recognized and measured pursuant to ASC 740-10 and the tax position taken or expected to be taken on our tax return. To the extent that the assessment of such tax positions change, the change in estimate is recorded in the period in which the determination is made. We established reserves for tax-related uncertainties based on estimates of whether, and the extent to which, additional taxes will be due. These reserves are established when we believe that certain positions might be challenged despite our belief that the tax return positions are fully supportable. The reserves are adjusted in light of changing facts and circumstances such as the outcome of a tax audit. The provision for income taxes includes the impact of reserve provisions and changes to reserves that are considered appropriate. We recognize interest and penalties related to unrecognized tax benefits in income tax expense.
Refer to Note 10,
Income Taxes
for further discussion of our income tax expense.
Comprehensive Loss
Our comprehensive loss is comprised of net loss attributable to Class A and Class B common stock shareholders, unrealized gain (loss) on available-for-sale securities, change in the effective portion of our interest rate swap agreements and comprehensive (income) loss attributable to noncontrolling interest and redeemable noncontrolling interest.
Fair Value Measurement
FASB ASC Topic 820
- Fair Value Measurements and Disclosures
("ASC 820"), defines fair value, establishes a framework for measuring fair value under U.S. GAAP and enhances disclosures about fair value measurements. Fair value is defined under ASC 820 as the exchange price that would be received for an asset or paid to transfer a liability (an exit price) in the principle or most advantageous market for the asset or liability in an orderly transaction between market participants on the measurement date. Valuation techniques used to measure fair value under ASC 820 must maximize the use of observable inputs and minimize the use of unobservable inputs. The guidance describes a fair value hierarchy based on three levels of inputs, of which the first two are considered observable and the last unobservable, that may be used to measure fair value:
104
|
Level 1
|
Quoted prices in active markets for identical assets or liabilities. Financial assets utilizing Level 1 inputs typically include money market securities and U.S. Treasury securities.
|
|
|
Level 2
|
Inputs other than Level 1 that are observable, either directly or indirectly, such as quoted prices for similar assets or liabilities, quoted prices in markets that are not active or other inputs that are observable or can be corroborated by observable market data for substantially the full term of the assets or liabilities. Financial instruments utilizing Level 2 inputs include interest rate swaps.
|
|
|
Level 3
|
Unobservable inputs that are supported by little or no market activity and that are significant to the fair value of the assets or liabilities. Financial liabilities utilizing Level 3 inputs include natural gas fixed price forward contracts derivatives, warrants issued to purchase our preferred stock and embedded derivatives in sales contracts and bifurcated from convertible notes. Derivative liability valuations are performed based on a binomial lattice model and adjusted for illiquidity and/or non-transferability and such adjustments are generally based on available market evidence. Contract embedded derivatives valuations are performed using a Monte Carlo simulation model which considers various potential electricity price curves over the sales contracts terms.
|
|
Other Balance Sheet Components
Cash, Cash Equivalents, Short-Term Investments and Restricted Cash -
Cash equivalents consist of highly liquid short-term investments with maturities of 90 days or less at the date of purchase.
Short-term investments consist of highly liquid investments with maturities of greater than 90 days at the reporting period end date. Short-term investments are reported at fair value with unrealized gains or losses, net of tax, recorded in accumulated other comprehensive income (loss). Short-term investments are anticipated to be used for current operations and are, therefore, classified as available-for-sale in current assets even though their maturities may extend beyond one year. We periodically review short-term investments for impairment. In the event a decline in value is determined to be other-than-temporary, an impairment loss is recognized. When determining if a decline in value is other-than-temporary, we take into consideration the current market conditions and the duration and severity of and the reason for the decline as well as considering the likelihood that it would need to sell the security prior to a recovery of par value.
The specific identification method is used to determine the cost of any securities disposed with any realized gains or losses recognized as income or expense in the consolidated statements of operations.
As of
December 31, 2019
, we held
no
short-term investments. As of
December 31, 2018
, short-term investments consisted of
$104.4 million
of
U.S. Treasury Bills
. The cost of these securities approximated fair value and there was no material gross realized or unrealized gains or losses in the years ended
December 31, 2019
,
2018
and
2017
. There were also no impairments in the investments' value in the years ended
December 31, 2019
,
2018
and
2017
.
Restricted cash is held as collateral to provide financial assurance that we will fulfill obligations and commitments primarily related to our power purchase agreement financings, third party PPA and managed services arrangements. Restricted cash also includes debt service reserves, maintenance service reserves and facility lease agreements. Restricted cash that is expected to be used within one year of the balance sheet date is classified as a current asset, whereas restricted cash expected to be used more than one year from the balance sheet date is classified as a non-current asset.
Derivative Financial Instruments -
We enter into derivative natural gas fixed price forward contracts to manage our exposure to the fluctuating price of natural gas under certain of our power purchase agreements entered in connection with the Bloom Electrons program (refer to Note 13,
Power Purchase Agreement Programs
). In addition, we enter into fixed forward interest rate swap arrangements to convert variable interest rates on debt to a fixed rate and on occasion have committed to certain utility grid price protection guarantees in sales agreements. We also issued derivative financial instruments embedded in our
6%
Notes as a means by which to provide additional incentive to investors and to obtain a lower cost cash-source of funds.
Derivative transactions are governed by procedures covering areas such as authorization, counterparty exposure and hedging practices. Positions are monitored based on changes in the spot price in the commodity market and their impact on the market value of derivatives. Credit risk on derivatives arises from the potential for counterparties to default on their contractual obligations to us. We limit our credit risk by dealing with counterparties that are considered to be of high credit quality. We do not enter into derivative transactions for trading or speculative purposes.
We account for our derivative instruments as either an asset or a liability which are carried at fair value on the consolidated balance sheets. Changes in the fair value of the derivatives that are designated and qualify as cash flow hedges are recorded in accumulated other comprehensive income (loss) on the consolidated balance sheets and for those that do not qualify for hedge accounting or are not designated hedges are recorded through earnings in the consolidated statements of operations.
While we hedge certain of our natural gas purchase requirements under our power purchase agreements, we do not classify these natural gas fixed price forward contracts as designated hedges for accounting purposes. Therefore, we record the
105
change in the fair value of our natural gas fixed price forward contracts in cost of revenue on the consolidated statements of operations. The fair value of the natural gas fixed price forward contracts is recorded on the consolidated balance sheets as a component of accrued expenses and other current liabilities and as derivative liabilities. As these forward contracts are considered economic hedges, the changes in the fair value of these forward contracts are classified as operating activities within the statement of cash flows, which is consistent with the classification of the cash flows of the hedged item.
Our interest rate swap arrangements qualify as cash flow hedges for accounting purposes as they effectively convert variable rate obligations into fixed rate obligations. We evaluate and calculate the effectiveness of the hedge at each reporting date. The effective change is recorded in accumulated other comprehensive income (loss) and will be recognized as interest expense on settlement. As of January 1, 2019, we adopted Accounting Standards Update ("ASU") 2017-12 Derivatives and Hedging (Topic 815), Targeted Improvements to Accounting for Hedging Activities ("ASU 2017-12"). Per ASU 2017-12, ineffectiveness is no longer required to be measured or disclosed. If a cash flow hedge is discontinued due to changes in the forecasted hedged transactions, hedge accounting is discontinued prospectively and any unrealized gain or loss on the related derivative is recorded in accumulated other comprehensive income (loss) and is reclassified into earnings in the same period during which the hedged forecasted transaction affects earnings. The fair value of the swap arrangement is recorded on the consolidated balance sheets as a component of accrued expenses and other current liabilities and as derivative liabilities. The changes in fair value of swap agreement are classified as operating activities within the statement of cash flows, which is consistent with the classification of the cash flows of the hedged item.
We issued convertible notes with conversion features. These conversion features were evaluated under ASC topic 815-40, were determined to be embedded derivatives and were bifurcated from the debt and were classified prior to the IPO as liabilities on the consolidated balance sheets. We recorded these derivative liabilities at fair value and adjusted the carrying value to their estimated fair value at each reporting date with the increases or decreases in the fair value recorded as a gain (loss) on revaluation of warrant liabilities and embedded derivatives in the consolidated statements of operations. Upon the IPO, the final valuation of the embedded derivative was calculated as of the date of the IPO and was reclassified from a derivative liability to additional paid-in capital.
Customer Financing Receivables -
The contractual terms of our customer financing receivables are primarily contained within the PPA Entities' customer lease agreements. Leases are classified as either operating or sales-type leases in accordance with the relevant accounting guidelines and customer financing receivables are generated by Energy Servers leased to PPA Entities’ customers in leasing arrangements that qualify as sales-type leases. Customer financing receivables represents the gross minimum lease payments to be received from customers and the system’s estimated residual value, net of unearned income and allowance for estimated losses. Initial direct costs for sales-type leases are recognized as cost of revenue when the Energy Servers are placed in service.
We review our customer financing receivables by aging category to identify significant customer balances with known disputes or collection issues. In determining the allowance, we make judgments about the credit worthiness of a majority of our customers based on ongoing credit evaluations. We also consider our historical level of credit losses as well as current economic trends that might impact the level of future credit losses. We write off customer financing receivables when they are deemed uncollectible. We do not maintain an allowance for doubtful accounts to reserve for potentially uncollectible customer financing receivables as historically all of our receivables on the consolidated balance sheets have been collected in full.
Accounts Receivable -
Accounts receivable primarily represents trade receivables from sales to customers recorded at net realizable value. As we do for our customer financing receivables, we review our accounts receivable by aging category to identify significant customer balances with known disputes or collection issues. In determining the allowance, we make judgments about the creditworthiness of a majority of our customers based on ongoing credit evaluations. We also consider our historical level of credit losses as well as current economic trends that might impact the level of future credit losses. We write off accounts receivable when they are deemed uncollectible. We do not maintain an allowance for doubtful accounts to reserve for potentially uncollectible accounts receivable as historically all of our receivables on the consolidated balance sheets have been collected in full.
Inventories -
Inventories consist principally of raw materials, work-in-process and finished goods and are stated on a first-in, first-out basis at the lower of cost or net realizable value.
We record inventory excess and obsolescence provisions for estimated obsolete or unsellable inventory, including inventory from purchase commitments, equal to the difference between the cost of inventory and estimated net realizable value based upon assumptions about market conditions and future demand for product generally expected to be utilized over the next
12
to
24
months, including product needed to fulfill our warranty obligations. If actual future demand for our products is less than currently forecasted, additional inventory provisions may be required. Once a provision is recorded, it is maintained until the product to which it relates to is sold or otherwise disposed. The inventory reserves were
$14.6 million
and
$13.0 million
as of
December 31, 2019
and
2018
, respectively.
106
Property, Plant and Equipment -
Property, plant and equipment, including leasehold improvements are stated at cost less accumulated depreciation. Energy Servers are depreciated to their residual values over their useful economic lives which reflect consideration of the terms of their related power purchase and tariff agreements. These useful lives are reassessed when there is an expected change in the use of the Energy Servers. Leasehold improvements are depreciated over the shorter of the lease term or their estimated depreciable lives. Buildings are amortized over the shorter of the lease or property term or their estimated depreciable lives. Assets under construction are capitalized as costs are incurred and depreciation commences after the assets are put into service within their respective asset class.
Depreciation is calculated using the straight-line method over the estimated depreciable lives of the respective assets as follows:
|
|
|
Depreciable Lives
|
|
Energy Servers
|
|
15-21 years
|
|
Computers, software and hardware
|
|
3-5 years
|
|
Machinery and equipment
|
|
5-10 years
|
|
Furniture and fixtures
|
|
3-5 years
|
|
Leasehold improvements
|
|
1-10 years
|
|
Buildings
|
|
35 years
|
When assets are retired or disposed, the assets and related accumulated depreciation and amortization are removed from our general ledger and the resulting gain or loss is reflected in the consolidated statements of operations.
Foreign Currency Transactions -
The functional currency of our foreign subsidiaries is the U.S. dollar since they are considered financially and operationally integrated with their domestic parent. Foreign currency monetary assets and liabilities are remeasured into U.S. dollars at end-of-period exchange rates. Any currency transaction gains and losses are included as a component of other income (expense), net in our consolidated statements of operations and have not been significant for any period presented.
Preferred Stock Warrants -
We accounted for freestanding warrants to purchase shares of our convertible preferred stock as liabilities on the consolidated balance sheets at fair value upon issuance. In accordance with ASC 480 -
Distinguishing Liability from Equity
("ASC 480"), these warrants were classified within warrant liability in the consolidated balance sheets as the underlying shares of convertible preferred stock were contingently redeemable which, therefore, may have obligated us to transfer assets at some point in the future. These warrants were valued on the date of issuance, using the Probability-Weighted Expected Return Model ("PWERM"). The warrants were subject to remeasurement to fair value at each balance sheet date or immediately prior to exercise. Any change in fair value was recognized in the consolidated statements of operations. Our convertible preferred stock warrants were converted into common stock warrants upon the completion of our IPO in July 2018. At that time, the convertible preferred stock warrant liability was reclassified to additional paid-in capital.
Allocation of Profits and Losses of Consolidated Entities to Noncontrolling Interests -
We generally allocate profits and losses to noncontrolling interests under the hypothetical liquidation at book value ("HLBV") method. HLBV is a balance sheet-oriented approach for applying the equity method of accounting when there is a complex structure, such as the flip structure of the PPE Entities. Refer to Note 13,
Power Purchase Agreement Programs
for more information.
The determination of equity in earnings under the HLBV method requires management to determine how proceeds, upon a hypothetical liquidation of the entity at book value, would be allocated between our investors. The noncontrolling interest balance is presented as a component of permanent equity in the consolidated balance sheets.
Noncontrolling interests with redemption features, such as put options, that are not solely within our control are considered redeemable noncontrolling interests. Exercisability of put options are solely dependent upon the passage of time, and hence, such put options are considered to be probable of becoming exercisable. We elected to accrete changes in the redemption value over the period from the date it becomes probable that the instrument will become redeemable to the earliest redemption date of the instrument by using an interest method. The balance of redeemable noncontrolling interests on the balance sheets is reported at the greater of its carrying value or its maximum redemption value at each reporting date. The redeemable noncontrolling interests are classified as temporary equity and therefore are reported in the mezzanine section of the consolidated balance sheets as redeemable noncontrolling interests.
For income tax purposes, the Equity Investors of the PPA Entities receive a greater proportion of the share of losses and other income tax benefits. This includes the allocation of investment tax credits which are distributed to the Equity Investors through an Investment Company subsidiary of Bloom. Allocations are initially based on the terms specified in each respective partnership agreement until either a specific date or the Equity Investors' targeted rate of return specified in the partnership agreement is met (the "flip" of the flip structure) whereupon the allocations change. In some cases after the Equity Investors
107
receive their contractual rate of return, we receive substantially all of the remaining value attributable to the long-term recurring customer payments and the other incentives.
Recent Accounting Pronouncements
Other than the adoption of the accounting guidance mentioned below, there have been no other significant changes in our reported financial position or results of operations and cash flows resulting from the adoption of new accounting pronouncements.
Accounting Guidance Implemented in Fiscal Year 2019
Revenue Recognition -
In May 2014, the FASB issued ASU 2014-09,
Revenue From Contracts With Customers (Topic 606)
, as amended ("ASC 606"). The guidance provides principles for recognizing revenue for the transfer of promised goods or services to customers with the consideration to which the entity expects to be entitled in exchange for those goods or services, as well as guidance on the recognition of costs related to obtaining and fulfilling customer contracts. The guidance also requires expanded disclosures about the nature, amount, timing, and uncertainty of revenues and cash flows arising from customer contracts, including significant judgments and changes in judgments. ASC 606 is effective for our annual period beginning January 1, 2019, and for our interim periods beginning on January 1, 2020. ASC 606 can be adopted using either of two methods: (i) retrospective to each prior reporting period presented with the option to elect certain practical expedients as defined within the guidance (“full retrospective method”); or (ii) retrospective with the cumulative effect of initially applying the guidance recognized at the date of initial application and providing certain additional disclosures as defined per the guidance (“modified retrospective method”). We adopted ASC 606 in the year ended December 31, 2019 using the modified retrospective method. As a policy election, Topic ASC was applied only to contracts that were not complete as of the date of adoption. We recognized the cumulative effect of initially applying ASC 606 as an adjustment to the January 1, 2019 opening balance of accumulated deficit. The prior period consolidated financial statements have not been retrospectively adjusted and continue to be reported under the accounting standards in effect for those periods.
As part of our adoption of ASC 606, we elected to apply the following practical expedients:
|
•
|
We have not restated contracts that begin and are completed within the same annual reporting period;
|
|
•
|
For completed contracts that have variable consideration, we used the transaction price at the date upon which the contract was completed rather than estimating variable consideration amounts in the comparative reporting periods;
|
|
•
|
We have excluded disclosures of transaction prices allocated to remaining performance obligations and when we expect to recognize such revenue for all periods prior to the date of initial application;
|
|
•
|
We have not retrospectively restated our contracts to account for those modifications that were entered into before January 1, 2019, the earliest reporting period impacted by ASC 606;
|
See Note 3
Revenue Recognition
for additional information.
Statement of Cash Flows -
In August 2016, the FASB issued ASU 2016-15,
Classification of Certain Cash Receipts and Cash Payments (Topic 230) ("
ASU 2016-15"), which clarifies the classification of the activity in the consolidated statements of cash flows and how the predominant principle should be applied when cash receipts and cash payments have more than one class of cash flows. Adoption will be applied retrospectively to all periods presented. We adopted ASU 2016-15 on January 1, 2019. Adoption of ASU 2016-15 had no impact on our consolidated financial statements.
Hedging Activities
- As of January 1, 2019, we adopted Accounting Standards Update ("ASU") 2017-12
Derivatives and Hedging (Topic 815), Targeted Improvements to Accounting for Hedging Activities
("ASU 2017-12") to help entities recognize the economic results of their hedging strategies in the financial statements so that stakeholders can better interpret and understand the effect of hedge accounting on reported results. It is intended to more clearly disclose an entity’s risk exposures and how we manage those exposures through hedging, and it is expected to simplify the application of hedge accounting guidance. The new guidance is effective for annual periods beginning after December 15, 2018, with early adoption permitted. T
here was not a material impact to our consolidated financial statements upon adoption of ASU 2017-12.
Income Taxes -
As of January 1, 2019, we adopted ASU 2016-16,
Income Taxes-Intra-Entity Transfers of Assets Other Than Inventory (Topic 740) ("
ASU 2016-16"), which requires that entities recognize the income tax consequences of an intra-entity transfer of an asset, other than inventory, when the transfer occurs. ASU 2016-16 is effective for us in our Annual Report on Form 10-K for the year ended December 31, 2019 and is required to be applied on a modified retrospective basis through a cumulative-effect adjustment directly to retained earnings as of the beginning of the adoption period. Adoption of ASU 2016-16 had no impact on our consolidated financial statements.
Income Taxes -
As of January 1, 2019, we adopted ASU 2018-02
Income Statement-Reporting Comprehensive Income (Topic 220) Reclassification of Certain Tax Effects from Accumulated Other Comprehensive Income
, which permits reclassification of certain tax effects in Other Comprehensive Income ("OCI") caused by the U.S. tax reform enacted in
108
December 2017 to retained earnings. We do not have any tax effect (due to full valuation allowance) in our OCI account, thus this guidance has no impact on our consolidated financial statements.
Codification Improvements
- In April 2019, the FASB issued ASU 2019-04,
Codification Improvements to Topic 326, Financial Instruments-Credit Losses; Topic 815, Derivatives and Hedging; and Topic 825, Financial Instruments
("ASU 2019-04"), that clarifies and improves areas of guidance related to the recently issued standards on credit losses (ASU 2016-13), hedging (ASU 2017-12), and recognition and measurement of financial instruments (ASU 2016-01), respectively. The amendments generally have the same effective dates as their related standards. If already adopted, the amendments of ASU 2016-01 and ASU 2016-13 are effective for fiscal years beginning after December 15, 2019 and the amendments of ASU 2017-12 are effective as of the beginning of a company’s next annual reporting period. Early adoption is permitted. As discussed above, we adopted ASU 2017-12 on January 1, 2019 and the amendments of ASU 2019-04 did not have a material impact on our consolidated financial statements.
Cloud Computing
- In August 2018, the FASB issued ASU 2018-15,
Intangibles-Goodwill and Other-Internal-Use Software (Subtopic 350-40) Customer’s Accounting for Implementation Costs Incurred in a Cloud Computing Arrangement That Is a Service Contract
("ASU 2018-15")
,
to clarify the guidance on the costs of implementing a cloud computing hosting arrangement that is a service contract. Under ASU 2018-15, the entity is required to follow the guidance in Subtopic 350-40,
Internal-Use Software
, to determine which implementation costs under the service contract to be capitalized as an asset and which costs to expense. ASU 2018-15 is effective for us for the annual periods beginning in 2021 and the interim periods in 2022 on a retrospective or prospective basis and early adoption is permitted. We adopted ASU 2018-15 on a prospective basis in the fiscal year ended December 31, 2019 and ASU 2018-15 did not have a material impact on the consolidated financial statements and related disclosures.
Accounting Guidance Not Yet Adopted
Leases
- In February 2016, the FASB issued ASU 2016-02,
Leases
(Topic 842)
, as amended (“ASC 842”), which provides new authoritative guidance on lease accounting. Among its provisions, the standard changes the definition of a lease, requires lessees to recognize right-of-use assets and lease liabilities on the balance sheet for operating leases and also requires additional qualitative and quantitative disclosures about lease arrangements. All leases in scope will be classified as either operating or financing. Operating and financing leases will require the recognition of an asset and liability to be measured at the present value of the lease payments. ASC 842 also makes a distinction between operating and financing leases for purposes of reporting expenses on the income statement. We are the lessee under various agreements for facilities and equipment that are currently accounted for as operating leases and expect to continue to enter into new such leases. Additionally, we expect to continue to enter into Managed Services related financing leases in the future and are the lessor of Energy Servers that are subject to power purchase arrangements with customers under our PPA and Managed Services programs that are currently accounted for as leases.
We are currently evaluating the impact of the adoption of this update on our financial statements. We expect that the most significant impacts will be assessing whether new power purchase arrangements with customers meet the new definition of a lease and recognizing right of use assets and lease liabilities for arrangements currently accounted for as operating leases where we are the lessee. We expect to adopt this guidance on a prospective basis on January 1, 2021.
Financial Instruments -
In June 2016, the FASB issued ASU 2016-13,
Financial Instruments- Credit Losses (Topic 326)
. The pronouncement was issued to provide more decision-useful information about the expected credit losses on financial instruments and changes the loss impairment methodology. This pronouncement will be effective for us from fiscal year 2021. A prospective transition approach is required for debt securities for which an other than temporary impairment had been recognized before the effective date. We are currently evaluating the impact of the adoption of this update on our financial statements.
Stock Compensation
- In June 2018, the FASB issued ASU 2018-07,
Compensation - Stock Compensation: Improvements to Nonemployee Share-Based Payment Accounting
("ASU 2018-07") which aligns the accounting for share-based payment awards issued to employees and nonemployees. Measurement of equity-classified nonemployee awards will now be valued on the grant date and will no longer be remeasured through the performance completion date. ASU 2018-07 also changes the accounting for nonemployee awards with performance conditions to recognize compensation cost when achievement of the performance condition is probable, rather than upon achievement of the performance condition, as well as eliminating the requirement to reassess the equity or liability classification for nonemployee awards upon vesting, except for certain award types. ASU 2018-07 is effective for us for interim and annual reporting periods beginning after December 15, 2019. Early adoption is permitted. We plan to adopt ASU 2018-07 on a modified retrospective approach in January 2020. We do not expect the adoption of ASU 2018-07 to have a material effect on our financial statements and related disclosures.
Fair Value Measurement -
In August 2018, the FASB issued ASU 2018-13,
Fair Value Measurement Disclosure Framework - Changes to the Disclosure Requirements for Fair Value Measurement
("ASU 2018-13"). ASU 2018-13 has eliminated, amended and added disclosure requirements for fair value measurements. Entities will no longer be required to
109
disclose the amount of, and reasons for, transfers between Level 1 and Level 2 of the fair value hierarchy, the policy of timing of transfers between levels of the fair value hierarchy and the valuation processes for Level 3 fair value measurements. Companies will be required to disclose the range and weighted average used to develop significant unobservable inputs for Level 3 fair value measurements. ASU 2018-13 is effective for annual and interim periods beginning after December 15, 2019. Early adoption is permitted. ASU 2018-13 will have an impact on our disclosures. We are evaluating the effect on our financial statements and related disclosures.
2. Restatement and Revision of Previously Issued Consolidated Financial Statements
We have restated herein our consolidated financial statements as of and for the year ended December 31, 2018 and revised herein our consolidated financial statements as of and for the year ended December 31, 2017. We have also restated and revised related amounts within the accompanying footnotes to the consolidated financial statements to conform to the corrected amounts in the financial statements.
Restatement Background
On February 11, 2020, our management, in consultation with the Audit Committee of our Board of Directors, determined that Bloom's previously issued consolidated financial statements as of and for the year ended December 31, 2018, as well as financial statements for the three month period ended March 31, 2019, the three and six month periods ended June 30, 2019 and 2018 and the three and nine month periods ended September 30, 2019 and 2018 should no longer be relied upon due to misstatements related to our Managed Services Agreements and similar arrangements and we would restate such financial statements to make the necessary accounting corrections. The revenue for the Managed Services Agreements and similar transactions will now be recognized over the duration of the contract instead of upfront. In addition, management determined that the impact of these misstatements to periods prior to the three months ended June 30, 2018 was not material to warrant restatement of reported figures, however, our consolidated financial statements as of and for the year ended December 31, 2017 and the relevant unaudited selected quarterly financial data for the three month period ended March 31, 2018 would be revised to correct these misstatements. The restatement also includes corrections for additional identified immaterial misstatements in certain of the impacted periods.
The misstatements are described in greater detail below.
Description of Misstatements
Under our Managed Services program, we sell our equipment to a bank financing party under a sale-leaseback transaction, which pays us for the Energy Server and takes title to the Energy Server. We then enter into a service contract with an end customer, who pays the bank a fixed, monthly fee for its use of the Energy Server and pays us for our maintenance and operation of the Energy Server.
The majority of these Managed Services Agreements and similar transactions were originally recorded as sales, subject to an operating lease, in which revenues and associated costs were recognized at the time of installation and acceptance of the Bloom Energy Server at the customer site.
In December 2019, in the course of reviewing a Managed Services transaction that closed on November 27, 2019, an issue was identified related to the accounting for our Managed Services transactions. The issue primarily related to whether the terms of our Managed Services Agreements and similar arrangements, including the events of default provisions, satisfied the requirements for sales under the revenue accounting standards. Subsequently, it was determined that the previous accounting for the Managed Services Agreements and similar transactions was misstated, as the Managed Services Agreements and similar transactions should have been accounted for as financing transactions under lease accounting standards.
The impact of the correction of the misstatement is to recognize amounts received from the bank financing party as a financing obligations, and the Energy Server is recorded within property, plant and equipment, net on our consolidated balance sheets. We recognize revenue for the electricity generated by the systems, based on payments received by the bank from the customer, and the corresponding financing obligations to the bank is also amortized as these payments are received by the bank from the customer, with interest thereon being calculated on an effective interest rate basis. Depreciation expense is also recognized over the estimated useful life of the Energy Server.
In addition, it was determined that stock-based compensation costs relating to manufacturing employees that were previously expensed as incurred incorrectly, should have been capitalized as a component of Energy Server manufacturing costs to inventory, deferred cost of revenues, construction-in-progress and property, plant and equipment in accordance with SEC Staff Accounting Bulletin Topic 14. These costs will now be expensed on consumption of the related inventory and over the economic useful life of the property, plant and equipment, as applicable.
Also, as part of a review of historical revenue agreements as a result of the above errors, it was noted that the Company failed to identify embedded derivatives in certain revenue agreements for an escalator price protection (“EPP”) feature given to our customers. As a result, the Company has recorded a derivative liability, with an offset to revenue, to
110
account for the fair value of this feature at inception and will record the liability at its then fair value at each period end with any changes in fair value recognized in other income (expense).
Finally, there were certain other immaterial misstatements identified or which had been previously identified which are also being corrected in connection with the restatement and/or revision of previously issued financial statements.
Description of Restatement and Revision Reconciliation Tables
In the following tables, we have presented a reconciliation of our consolidated balance sheets, statement of operations and cash flows from our prior periods as previously reported to the restated and revised amounts as of and for the years ended December 31, 2018 and 2017, respectively. The Consolidated Statements of Comprehensive Loss and the Consolidated Statements of Convertible Redeemable Preferred Stock, Redeemable Noncontrolling Interest, Stockholders' Deficit and Noncontrolling Interest for the years ended December 31, 2018 and 2017 have been restated and revised, respectively, for the restatement and revision impacts to Net Loss and, for the latter statements, for the correction of an uncorrected misstatement within Additional Paid-In Capital for
$0.8 million
in 2018. See the statement of operations reconciliation tables below for additional information on the restatement and revision impacts to Net Loss. For the misstatements arising in periods commencing prior to 2017, the cumulative impact of all periods prior to January 1, 2017 has been reflected as an adjustment to opening accumulated deficit as of that date in the Consolidated Statements of Convertible Redeemable Preferred Stock, Redeemable Noncontrolling Interest, Stockholders’ Deficit and Noncontrolling Interest.
111
Bloom Energy Corporation
Consolidated Balance Sheet
(in thousands, except share and per share data)
|
December 31, 2018
|
||||||||||||||
|
|
As Previously Reported
|
Restatement Impacts
|
Restatement Reference
|
As Restated
|
||||||||||
|
|
||||||||||||||
|
Assets
|
||||||||||||||
|
Current assets:
|
||||||||||||||
|
Cash and cash equivalents
|
$
|
220,728
|
|
$
|
—
|
|
$
|
220,728
|
|
|||||
|
Restricted cash
|
28,657
|
|
—
|
|
28,657
|
|
||||||||
|
Short-term investments
|
104,350
|
|
—
|
|
104,350
|
|
||||||||
|
Accounts receivable
|
84,887
|
|
3,897
|
|
1
|
88,784
|
|
|||||||
|
Inventories
|
132,476
|
|
2,789
|
|
2
|
135,265
|
|
|||||||
|
Deferred cost of revenue
|
62,147
|
|
(18,338
|
)
|
3
|
43,809
|
|
|||||||
|
Customer financing receivable
|
5,594
|
|
—
|
|
5,594
|
|
||||||||
|
Prepaid expenses and other current assets
|
33,742
|
|
3,005
|
|
4
|
36,747
|
|
|||||||
|
Total current assets
|
672,581
|
|
(8,647
|
)
|
663,934
|
|
||||||||
|
Property, plant and equipment, net
|
481,414
|
|
235,337
|
|
5
|
716,751
|
|
|||||||
|
Customer financing receivable, non-current
|
67,082
|
|
—
|
|
67,082
|
|
||||||||
|
Restricted cash, non-current
|
31,100
|
|
—
|
|
31,100
|
|
||||||||
|
Deferred cost of revenue, non-current
|
102,699
|
|
(102,654
|
)
|
3
|
45
|
|
|||||||
|
Other long-term assets
|
34,792
|
|
8,090
|
|
6
|
42,882
|
|
|||||||
|
Total assets
|
$
|
1,389,668
|
|
$
|
132,126
|
|
$
|
1,521,794
|
|
|||||
|
Liabilities, Redeemable Noncontrolling Interest, Stockholders’ Deficit and Noncontrolling Interests
|
||||||||||||||
|
Current liabilities:
|
||||||||||||||
|
Accounts payable
|
$
|
66,889
|
|
$
|
—
|
|
$
|
66,889
|
|
|||||
|
Accrued warranty
|
19,236
|
|
(1,268
|
)
|
7
|
17,968
|
|
|||||||
|
Accrued expenses and other current liabilities
|
69,535
|
|
(2,697
|
)
|
8
|
66,838
|
|
|||||||
|
Financing obligations
|
—
|
|
8,128
|
|
9
|
8,128
|
|
|||||||
|
Deferred revenue and customer deposits
|
94,158
|
|
(26,526
|
)
|
10
|
67,632
|
|
|||||||
|
Current portion of recourse debt
|
8,686
|
|
—
|
|
8,686
|
|
||||||||
|
Current portion of non-recourse debt
|
18,962
|
|
—
|
|
18,962
|
|
||||||||
|
Current portion of non-recourse debt from related parties
|
2,200
|
|
—
|
|
2,200
|
|
||||||||
|
Total current liabilities
|
279,666
|
|
(22,363
|
)
|
257,303
|
|
||||||||
|
Derivative liabilities
|
10,128
|
|
4,015
|
|
11
|
14,143
|
|
|||||||
|
Deferred revenue and customer deposits, net of current portion
|
241,794
|
|
(154,486
|
)
|
10
|
87,308
|
|
|||||||
|
Financing obligations, non-current
|
—
|
|
385,650
|
|
9
|
385,650
|
|
|||||||
|
Long-term portion of recourse debt
|
360,339
|
|
—
|
|
360,339
|
|
||||||||
|
Long-term portion of non-recourse debt
|
289,241
|
|
—
|
|
289,241
|
|
||||||||
|
Long-term portion of recourse debt from related parties
|
27,734
|
|
—
|
|
27,734
|
|
||||||||
|
Long-term portion of non-recourse debt from related parties
|
34,119
|
|
—
|
|
34,119
|
|
||||||||
|
Other long-term liabilities
|
55,937
|
|
(29,741
|
)
|
8
|
26,196
|
|
|||||||
|
Total liabilities
|
1,298,958
|
|
183,075
|
|
1,482,033
|
|
||||||||
|
Redeemable noncontrolling interest
|
57,261
|
|
—
|
|
57,261
|
|
||||||||
|
Stockholders’ deficit:
|
||||||||||||||
|
Common stock
|
11
|
|
—
|
|
11
|
|
||||||||
|
Additional paid-in capital
|
2,480,597
|
|
755
|
|
12
|
2,481,352
|
|
|||||||
|
Accumulated other comprehensive income
|
131
|
|
—
|
|
131
|
|
||||||||
112
|
December 31, 2018
|
||||||||||||||
|
|
As Previously Reported
|
Restatement Impacts
|
Restatement Reference
|
As Restated
|
||||||||||
|
Accumulated deficit
|
(2,572,400
|
)
|
(51,704
|
)
|
(2,624,104
|
)
|
||||||||
|
Total stockholders’ deficit
|
(91,661
|
)
|
(50,949
|
)
|
(142,610
|
)
|
||||||||
|
Noncontrolling interest
|
125,110
|
|
—
|
|
125,110
|
|
||||||||
|
Total liabilities, redeemable noncontrolling interest, stockholders' deficit and noncontrolling interest
|
$
|
1,389,668
|
|
$
|
132,126
|
|
$
|
1,521,794
|
|
|||||
1
Accounts receivable — The correction of these misstatements resulted from the change of accounting for Managed Services Agreements, for which the amount recorded to accounts receivable represents amounts invoiced for capacity billings to end customers which have not yet been collected by the financing entity as of the period end.
2
Inventories — The correction of these misstatements resulted from the change of accounting for inventory, including net capitalization of stock-based compensation cost of
$8.1 million
, reclassification of inventories of
$6.0 million
held for shipments to customers under the Managed Services Program and similar arrangements to construction in progress within property, plant and equipment, net and an increase to inventory to correct a misstatement related to an in-transit shipment of
$0.7 million
.
3
Deferred cost of revenue, current and non-current — The correction of these misstatements resulted from reclassifying deferred cost of revenue to property, plant and equipment, net for the leased Energy Servers under the Managed Services Agreements and similar sale-leaseback arrangements of
$19.6 million
current and
$102.7 million
non-current, net capitalization of stock-based compensation costs of
$2.2 million
into current deferred cost of revenue together with the correction of an immaterial misstatements identified to reduce deferred cost of revenue of
$0.9 million
.
4
Prepaid expenses and other current assets — The correction of these misstatements resulted from the change of accounting for Managed Services Agreements and similar arrangements where prepaid property tax and insurance payments are now classified within prepaid expenses, rather than offset against deferred revenue.
5
Property, plant and equipment, net — The correction of these misstatements resulted from the change of accounting for Managed Services transactions and similar arrangements, whereby product and install cost of revenues are now recorded as property, plant and equipment, net in the cases where the risks of ownership have not completely transferred to the financing party of
$232.1 million
. This includes a net capitalization of stock-based compensation cost for these assets of
$3.2 million
.
6
Other long-term assets — The correction of these misstatements resulted from the change of accounting for Managed Services Agreements and similar arrangements whereby the timing difference of capacity billings to end customers and the payments received from the financing entity is recorded within long term receivables and prepaid property tax and insurance payments are now classified within other long-term assets, rather than offset against long-term deferred revenue.
7
Accrued warranty — The correction of these misstatements resulted from the change of accounting for accrued warranty which is now recorded on an as-incurred basis for our Managed Services Agreements and similar arrangements, reducing accrued warranty by
$0.5 million
and the change of accounting for the grid pricing escalation guarantees we provided in some of our sales arrangements, which are now recorded as derivative liabilities, reducing accrued warranty by
$0.7 million
.
8
Accrued expense and other current liabilities and other long-term liabilities — The correction of these misstatements resulted from the change of accounting for Managed Services Agreements, for which historical accrued liabilities recorded at inception of the agreements, as well as subsequent reductions of those liabilities, were reversed, and an increase to accrued liabilities to correct a misstatement related to an in-transit inventory shipment of
$0.7 million
.
9
Financing obligations, current and non-current — The correction of these misstatements resulted from the change of accounting for Managed Services Agreements and similar arrangements, whereby instead of recognizing the upfront proceeds received from the bank as revenue, the proceeds received are classified as financing obligations.
10
Deferred revenue and customer deposits, current and non-current — The correction of these misstatements resulted from the change of accounting for the recognition of product and installation revenue from upfront or ratable recognition to recognition of the capacity payments received from the end customer as power is generated by the Energy Servers as electricity revenue.
11
Derivative liabilities — The correction of these misstatements resulted from the change of accounting for embedded derivatives related to grid pricing escalation guarantees we provided in some of our sales arrangements. These are now recorded as derivative liabilities and were previously treated as an accrued liability.
12
APIC — Relates to the correction of an unadjusted misstatement in the valuation of our
6%
Notes derivative, resulting in a credit to additional paid-in capital and additional expense of
$0.8 million
.
113
Bloom Energy Corporation
Consolidated Statement of Operations
(in thousands, except per share data)
|
|
For the year ended December 31, 2018
|
|||||||||||||
|
|
As Previously Reported
|
Restatement Impacts
|
Restatement Reference
|
As Restated
|
||||||||||
|
|
||||||||||||||
|
Revenue:
|
||||||||||||||
|
Product
|
$
|
512,322
|
|
$
|
(111,684
|
)
|
a
|
$
|
400,638
|
|
||||
|
Installation
|
91,416
|
|
(23,221
|
)
|
a
|
68,195
|
|
|||||||
|
Service
|
82,385
|
|
882
|
|
a
|
83,267
|
|
|||||||
|
Electricity
|
55,915
|
|
24,633
|
|
a
|
80,548
|
|
|||||||
|
Total revenue
|
742,038
|
|
(109,390
|
)
|
632,648
|
|
||||||||
|
Cost of revenue:
|
||||||||||||||
|
Product
|
374,590
|
|
(93,315
|
)
|
c, d
|
281,275
|
|
|||||||
|
Installation
|
119,474
|
|
(24,168
|
)
|
c
|
95,306
|
|
|||||||
|
Service
|
94,639
|
|
6,050
|
|
b, d
|
100,689
|
|
|||||||
|
Electricity
|
36,265
|
|
13,363
|
|
c
|
49,628
|
|
|||||||
|
Total cost of revenue
|
624,968
|
|
(98,070
|
)
|
526,898
|
|
||||||||
|
Gross profit
|
117,070
|
|
(11,320
|
)
|
105,750
|
|
||||||||
|
Operating expenses:
|
||||||||||||||
|
Research and development
|
89,135
|
|
—
|
|
89,135
|
|
||||||||
|
Sales and marketing
|
62,975
|
|
(168
|
)
|
e
|
62,807
|
|
|||||||
|
General and administrative
|
118,817
|
|
—
|
|
118,817
|
|
||||||||
|
Total operating expenses
|
270,927
|
|
(168
|
)
|
270,759
|
|
||||||||
|
Loss from operations
|
(153,857
|
)
|
(11,152
|
)
|
(165,009
|
)
|
||||||||
|
Interest income
|
4,322
|
|
—
|
|
4,322
|
|
||||||||
|
Interest expense
|
(76,935
|
)
|
(20,086
|
)
|
f
|
(97,021
|
)
|
|||||||
|
Interest expense to related parties
|
(8,893
|
)
|
—
|
|
(8,893
|
)
|
||||||||
|
Other expense, net
|
(999
|
)
|
—
|
|
(999
|
)
|
||||||||
|
Loss on revaluation of warrant liabilities and embedded derivatives
|
(21,590
|
)
|
(549
|
)
|
g
|
(22,139
|
)
|
|||||||
|
Loss before income taxes
|
(257,952
|
)
|
(31,787
|
)
|
(289,739
|
)
|
||||||||
|
Income tax provision
|
1,537
|
|
—
|
|
1,537
|
|
||||||||
|
Net loss
|
(259,489
|
)
|
(31,787
|
)
|
(291,276
|
)
|
||||||||
|
Less: net loss attributable to noncontrolling interests and redeemable noncontrolling interests
|
(17,736
|
)
|
—
|
|
(17,736
|
)
|
||||||||
|
Net loss attributable to Class A and Class B common stockholders
|
$
|
(241,753
|
)
|
$
|
(31,787
|
)
|
$
|
(273,540
|
)
|
|||||
|
Net loss per share available to Class A and Class B common stockholders, basic and diluted
|
$
|
(4.54
|
)
|
$
|
(5.14
|
)
|
||||||||
a
Revenue impacted by Managed Services restatements — The correction of these misstatements resulted from the change from upfront recognition of product and installation revenue to recognition of the capacity payments received from the end customer as power is generated by the Energy Servers as electricity revenue over the term of our Managed Services Agreements and similar sale-leaseback arrangements, which also impacted our service revenue allocation.
b
Service cost of revenue impacted by grid pricing escalation guarantees — The correction of these misstatements resulted in a decrease in service cost of revenue of
$0.5 million
.
c Cost of revenue impacted by Managed Services restatements — The correction of these misstatements resulted from the change of from upfront recognition of product and installation cost of revenue to recognition of the depreciation expense on the capitalized Energy Servers over their useful life of
21
years for our Managed Services Agreements and similar sale-leaseback transactions, resulting in a decrease in product cost of revenue of
$75.0 million
and installation cost of revenue of
$25.1 million
, offset by an increase in electricity cost of revenue of
$13.3 million
, together with the correction of another immaterial misstatements identified to record installation cost of revenue of
$0.9 million
.
d Cost of revenue impacted by stock-based compensation allocation — The correction of these misstatements resulted from the capitalization of stock-based compensation costs, with a net benefit to product cost of revenue of
$18.3 million
and an increase in service cost of revenue of
$6.5 million
, due to the expensing of stock-based compensation related to field replacement units.
e
Sales and marketing — The correction of these misstatements resulted from the change of accounting for sales commission expense on an as earned basis, to accounting for the expense over the term of our Managed Services Agreements and similar sale-leaseback arrangements.
f
Interest expense — The correction of these misstatements resulted from the change of accounting for sales that should have been accounted for as financing transactions, in which the upfront consideration received from the financing party is accounted for as a financing obligations and interest expense is recognized over the term of the Managed Services Agreement using the effective interest method.
114
g
Gain (loss) on revaluation of warrant liabilities and embedded derivatives — The correction of these misstatements resulted from the change of accounting for the grid pricing escalation guarantees we provided in some of our sales arrangements which is now recorded as a derivative liability that needs to be fair valued each period end. The liability has reduced in value by
$0.2 million
in 2018, resulting in a credit to this line item. In addition, we corrected a misstatement in the valuation of our 6% Notes derivative, resulting in
$0.8 million
of additional expense in the period.
115
Bloom Energy Corporation
Consolidated Statement of Operations
(in thousands, except per share data)
|
|
For the year ended December 31, 2017
|
|||||||||||||
|
|
As Previously Reported
|
Revision Impacts
|
Revision Reference
|
As Revised
|
||||||||||
|
|
||||||||||||||
|
Revenue:
|
||||||||||||||
|
Product
|
$
|
179,768
|
|
$
|
(22,576
|
)
|
a
|
$
|
157,192
|
|
||||
|
Installation
|
63,226
|
|
(5,289
|
)
|
a
|
57,937
|
|
|||||||
|
Service
|
76,904
|
|
(2,012
|
)
|
a, b
|
74,892
|
|
|||||||
|
Electricity
|
56,098
|
|
19,504
|
|
a
|
75,602
|
|
|||||||
|
Total revenue
|
375,996
|
|
(10,373
|
)
|
|
365,623
|
|
|||||||
|
Cost of revenue:
|
||||||||||||||
|
Product
|
210,773
|
|
(18,412
|
)
|
c, d
|
192,361
|
|
|||||||
|
Installation
|
59,929
|
|
(4,959
|
)
|
c
|
54,970
|
|
|||||||
|
Service
|
83,597
|
|
1,531
|
|
b, d
|
85,128
|
|
|||||||
|
Electricity
|
39,741
|
|
9,734
|
|
c
|
49,475
|
|
|||||||
|
Total cost of revenue
|
394,040
|
|
(12,106
|
)
|
|
381,934
|
|
|||||||
|
Gross loss
|
(18,044
|
)
|
1,733
|
|
(16,311
|
)
|
||||||||
|
Operating expenses:
|
||||||||||||||
|
Research and development
|
51,146
|
|
—
|
|
51,146
|
|
||||||||
|
Sales and marketing
|
32,415
|
|
(489
|
)
|
e
|
31,926
|
|
|||||||
|
General and administrative
|
55,674
|
|
15
|
|
e
|
55,689
|
|
|||||||
|
Total operating expenses
|
139,235
|
|
(474
|
)
|
138,761
|
|
||||||||
|
Loss from operations
|
(157,279
|
)
|
2,207
|
|
(155,072
|
)
|
||||||||
|
Interest income
|
759
|
|
—
|
|
|
759
|
|
|||||||
|
Interest expense
|
(96,358
|
)
|
(15,681
|
)
|
f
|
(112,039
|
)
|
|||||||
|
Interest expense to related parties
|
(12,265
|
)
|
—
|
|
(12,265
|
)
|
||||||||
|
Other income (expense), net
|
(491
|
)
|
—
|
|
(491
|
)
|
||||||||
|
Loss on revaluation of warrant liabilities and embedded derivatives
|
(14,995
|
)
|
(289
|
)
|
g
|
(15,284
|
)
|
|||||||
|
Loss before income taxes
|
(280,629
|
)
|
(13,763
|
)
|
(294,392
|
)
|
||||||||
|
Income tax provision
|
636
|
|
—
|
|
636
|
|
||||||||
|
Net loss
|
(281,265
|
)
|
(13,763
|
)
|
(295,028
|
)
|
||||||||
|
Less: net loss attributable to noncontrolling interests and redeemable noncontrolling interests
|
(18,666
|
)
|
—
|
|
(18,666
|
)
|
||||||||
|
Net loss attributable to Class A and Class B common stockholders
|
$
|
(262,599
|
)
|
$
|
(13,763
|
)
|
$
|
(276,362
|
)
|
|||||
|
|
||||||||||||||
|
Net loss per share available to Class A and Class B common stockholders, basic and diluted
|
$
|
(25.62
|
)
|
$
|
(26.97
|
)
|
||||||||
a
Revenue impacted by Managed Services restatements — The correction of these misstatements resulted from the change from upfront recognition of product and installation revenue to recognition of the capacity payments received from the end customer as power is generated by the Energy Servers as electricity revenue over the term of our Managed Services Agreements and similar sale-leaseback arrangements, which also impacted our service revenue allocation by
$1.1 million
.
b
Service revenue and service cost of revenue impacted by grid pricing escalation guarantees — The correction of these misstatements resulted in a decrease in service cost of revenue of
$0.3 million
and a decrease of service revenue of
$3.1 million
.
c Cost of revenue impacted by Managed Services restatements — The correction of these misstatements resulted from the change from upfront recognition of product and installation cost of revenue to recognition of the depreciation expense on the capitalized Energy Servers over their useful life of 21 years for our Managed Services Agreements and similar sale-leaseback transactions, resulting in product cost of revenue of
$15.2 million
, installation cost of revenue of
$5.0 million
and electricity cost of revenue of
$9.7 million
.
d
Cost of revenue impacted by stock-based compensation allocation — The correction of these misstatements resulted from the capitalization of stock-based compensation costs, with a net benefit to product cost of revenue of
$3.2 million
and an increase in service cost of revenue of
$1.8 million
due to the expensing of stock-based compensation related to field replacement units.
e
Sales and marketing and general and administrative — The correction of these misstatements primarily resulted from the change of accounting for sales commission expense on an as earned basis, to accounting for the expense over the term of our Managed Services Agreements and similar sale-leaseback arrangements.
f
Interest expense — The correction of these misstatements resulted from the change of accounting for sales that should have been accounted for as financing transactions, in which the upfront consideration received from the financing party is accounted for as a financing obligations and interest expense is recognized over the term of the Managed Services Agreement using the effective interest method.
116
g
Gain (loss) on revaluation of warrant liabilities and embedded derivatives —The correction of these misstatements resulted from the change of accounting for the grid pricing escalation guarantees we provided in some of our sales arrangements which is now recorded as a derivative liability that needs to be fair valued each period end. The liability has increased in value by
$0.3 million
resulting in a loss on revaluation of embedded derivatives.
117
Bloom Energy Corporation
Consolidated Statements of Cash Flows
(in thousands)
|
|
For the year ended December 31, 2018
|
|||||||||||||
|
|
As Previously Reported
|
Restatement Impacts
|
Restatement Reference
|
As Restated
|
||||||||||
|
|
||||||||||||||
|
Cash flows from operating activities:
|
||||||||||||||
|
Net loss
|
$
|
(259,489
|
)
|
$
|
(31,787
|
)
|
$
|
(291,276
|
)
|
|||||
|
Adjustments to reconcile net loss to net cash used in operating activities:
|
||||||||||||||
|
Depreciation and amortization
|
43,459
|
|
10,428
|
|
A
|
53,887
|
|
|||||||
|
Write-off of property, plant and equipment, net
|
939
|
|
—
|
|
939
|
|
||||||||
|
Revaluation of derivative contracts
|
28,471
|
|
550
|
|
B
|
29,021
|
|
|||||||
|
Stock-based compensation
|
180,284
|
|
(11,802
|
)
|
C
|
168,482
|
|
|||||||
|
Loss on long-term REC purchase contract
|
200
|
|
—
|
|
200
|
|
||||||||
|
Revaluation of stock warrants
|
(9,108
|
)
|
—
|
|
(9,108
|
)
|
||||||||
|
Amortization of debt issuance cost
|
25,437
|
|
—
|
|
25,437
|
|
||||||||
|
Changes in operating assets and liabilities:
|
||||||||||||||
|
Accounts receivable
|
(54,570
|
)
|
(453
|
)
|
D
|
(55,023
|
)
|
|||||||
|
Inventories
|
(42,216
|
)
|
5,242
|
|
E
|
(36,974
|
)
|
|||||||
|
Deferred cost of revenue
|
88,324
|
|
(74,101
|
)
|
F
|
14,223
|
|
|||||||
|
Customer financing receivable and other
|
4,878
|
|
—
|
|
4,878
|
|
||||||||
|
Prepaid expenses and other current assets
|
(7,064
|
)
|
(968
|
)
|
G
|
(8,032
|
)
|
|||||||
|
Other long-term assets
|
1,897
|
|
(2,099
|
)
|
H
|
(202
|
)
|
|||||||
|
Accounts payable
|
18,307
|
|
—
|
|
18,307
|
|
||||||||
|
Accrued warranty
|
2,426
|
|
(928
|
)
|
I
|
1,498
|
|
|||||||
|
Accrued expense and other current liabilities
|
(6,800
|
)
|
816
|
|
J
|
(5,984
|
)
|
|||||||
|
Deferred revenue and customer deposits
|
(91,996
|
)
|
70,222
|
|
K
|
(21,774
|
)
|
|||||||
|
Other long-term liabilities
|
18,204
|
|
1,349
|
|
L
|
19,553
|
|
|||||||
|
Net cash used in operating activities
|
(58,417
|
)
|
(33,531
|
)
|
(91,948
|
)
|
||||||||
|
Cash flows from investing activities:
|
||||||||||||||
|
Purchase of property, plant and equipment
|
(14,659
|
)
|
(30,546
|
)
|
M
|
(45,205
|
)
|
|||||||
|
Payments for acquisition of intangible assets
|
(3,256
|
)
|
—
|
|
(3,256
|
)
|
||||||||
|
Purchase of marketable securities
|
(103,914
|
)
|
—
|
|
(103,914
|
)
|
||||||||
|
Proceeds from maturity of marketable securities
|
27,000
|
|
—
|
|
27,000
|
|
||||||||
|
Net cash used in investing activities
|
(94,829
|
)
|
(30,546
|
)
|
(125,375
|
)
|
||||||||
|
Cash flows from financing activities:
|
||||||||||||||
|
Repayment of debt
|
(18,770
|
)
|
—
|
|
(18,770
|
)
|
||||||||
|
Repayment of debt to related parties
|
(1,390
|
)
|
—
|
|
(1,390
|
)
|
||||||||
|
Proceeds from financing obligations
|
—
|
|
70,265
|
|
N
|
70,265
|
|
|||||||
|
Repayment of financing obligations
|
—
|
|
(6,188
|
)
|
N
|
(6,188
|
)
|
|||||||
|
Distributions to noncontrolling and redeemable noncontrolling interests
|
(15,250
|
)
|
—
|
|
(15,250
|
)
|
||||||||
|
Proceeds from issuance of common stock
|
1,521
|
|
—
|
|
1,521
|
|
||||||||
|
Proceeds from public offerings, net of underwriting discounts and commissions
|
292,529
|
|
—
|
|
292,529
|
|
||||||||
|
Payments of initial public offering issuance costs
|
(5,521
|
)
|
—
|
|
(5,521
|
)
|
||||||||
|
Net cash provided by financing activities
|
253,119
|
|
64,077
|
|
317,196
|
|
||||||||
|
Net increase in cash, cash equivalents, and restricted cash
|
99,873
|
|
—
|
|
99,873
|
|
||||||||
|
Cash, cash equivalents, and restricted cash:
|
||||||||||||||
|
Beginning of period
|
180,612
|
|
—
|
|
180,612
|
|
||||||||
|
End of period
|
$
|
280,485
|
|
$
|
—
|
|
$
|
280,485
|
|
|||||
|
Supplemental disclosure of cash flow information:
|
||||||||||||||
|
Cash paid during the period for interest
|
$
|
39,465
|
|
$
|
20,084
|
|
N
|
$
|
59,549
|
|
||||
|
Cash paid during the period for taxes
|
1,748
|
|
—
|
|
1,748
|
|
||||||||
118
A
Depreciation and amortization — The correction of these misstatements resulted from the change of accounting for Energy Servers under the Managed Services Program and similar arrangements that would have been product and install cost of revenue, but are now recorded as property, plant and equipment, and depreciated over their useful lives of 21 years.
B
Revaluation of derivative contracts — The correction of these misstatements resulted from the change of accounting for the grid pricing escalation guarantees we provided in some of our sales arrangements. These commitments were previously treated as a contingent liability and recorded as an accrued liability. We now consider the commitments a derivative liability, with the initial value recorded as a reduction in product revenue and then any changes in the value adjusted through other expense, net each period thereafter, resulting in a credit of
$0.2 million
, with
$0.8 million
of additional expense recorded to correct a misstatement in the valuation of our 6% Notes derivative.
C
Stock-based compensation — The correction of these misstatements resulted from the change of accounting for stock-based compensation, including net capitalization of stock-based compensation cost into inventory of
$10.3 million
. The correction of this misstatement also resulted in the capitalization of
$1.5 million
of stock-based compensation costs related to assets, under the Managed Services Program now recorded as construction in progress within property, plant and equipment, net.
D
Accounts receivable — The correction of these misstatements resulted from the change of accounting for Managed Services Agreements and similar arrangements where the timing difference of capacity billings to end customers and the payments received from the financing entity is recorded within accounts receivable.
E
Inventories — The correction of these misstatements resulted from the change of accounting for inventories, held for shipments planned to customers under the Managed Services Program and other similar arrangements now accounted for as construction in progress within property, plant and equipment, net.
F
Deferred cost of revenue, current and non-current — The correction of these misstatements resulted from the cumulative net change of accounting moving deferred cost of revenue to property, plant and equipment, net for the leased Energy Servers under the Managed Services Agreements and similar sale-leaseback arrangements of
$71.9 million
, and the net capitalization of stock-based compensation costs of
$2.2 million
in current deferred cost of revenue.
G
Prepaid expenses and other current assets — The correction of these misstatements resulted from the change of accounting for Managed Services Agreements and similar arrangements where prepaid property tax and insurance payments are now classified within prepaid expenses, rather than offset against deferred revenue.
H
Other long-term assets — The correction of these misstatements resulted from the change of accounting for Managed Services Agreements and similar arrangements, including the timing difference of capacity billings to end customers of
$0.1 million
, payments received from the financing entity now recorded within long term receivables of
$1.9 million
, and commission payments now classified within long term commission expenses of
$0.1 million
.
I
Accrued warranty — The correction of these misstatements resulted from the change of accounting for accrued warranty which is now recorded on an as-incurred basis on our Managed Services Agreements and similar arrangements. The correction of these misstatements resulted from the change of accounting for the grid pricing escalation guarantees we've provided in some of our sales arrangements. These commitments were previously treated as a contingent liability that was considered remote and therefore, no accrual was made. We now consider
$0.3 million
accrual has made, with the initial value of treated as a reduction in product revenue and then any changes in the value adjusted through other expense, net each period thereafter.
J
Accrued expense and other current liabilities and other long-term liabilities — The correction of these misstatements resulted from the change of accounting for Managed Services Agreements and similar arrangements where instead of recognizing the bank financing as revenue, the bank financing loan proceeds received and due are classified as lease loan liability.
K
Deferred revenue and customer deposits, current and non-current — The correction of these misstatements resulted from the change of accounting for the recognition of product and installation revenue from upfront or ratable recognition to the recognition of the capacity payments received from the end customer as power is generated by the Energy Servers as electricity revenue.
L
Other long-term liabilities — The correction of these misstatements resulted from the change of accounting for Managed Services Agreements and similar arrangements where instead of recognizing the bank financing as revenue, the bank financing loan proceeds received and due beyond the next twelve months are classified as lease loan liability.
M
Purchase of property, plant and equipment — The correction of these misstatements resulted from the change of accounting for Managed Services Agreements and similar arrangements, whereby costs previously recognized as product and install costs of goods sold are now recorded as property, plant and equipment, net in the cases where the risks of ownership have not completely transferred to the financing party.
N
Proceeds and repayments from financing obligations — The correction of these misstatements resulted from the change of accounting for Managed Services Agreements and similar arrangements where instead of recognizing the upfront proceeds received from the bank as revenue, the bank proceeds received and due are classified as proceeds from financing obligations and the capacity payments received from the end customer are classified as repayment of financing obligations and interest paid.
119
Bloom Energy Corporation
Consolidated Statements of Cash Flows
(in thousands)
|
|
For the year ended December 31, 2017
|
|||||||||||||
|
|
As Previously Reported
|
Revision Impacts
|
Revision Reference
|
As Revised
|
||||||||||
|
|
||||||||||||||
|
Cash flows from operating activities:
|
||||||||||||||
|
Net loss
|
$
|
(281,265
|
)
|
$
|
(13,763
|
)
|
$
|
(295,028
|
)
|
|||||
|
Adjustments to reconcile net loss to net cash used in operating activities:
|
||||||||||||||
|
Depreciation and amortization
|
46,105
|
|
8,271
|
|
A
|
54,376
|
|
|||||||
|
Write-off of property, plant and equipment, net
|
48
|
|
—
|
|
48
|
|
||||||||
|
Revaluation of derivative contracts
|
14,754
|
|
288
|
|
B
|
15,042
|
|
|||||||
|
Stock-based compensation
|
30,479
|
|
(1,378
|
)
|
C
|
29,101
|
|
|||||||
|
Gain on long-term REC purchase contract
|
(70
|
)
|
—
|
|
(70
|
)
|
||||||||
|
Revaluation of stock warrants
|
(2,975
|
)
|
—
|
|
(2,975
|
)
|
||||||||
|
Amortization of debt issuance cost
|
47,312
|
|
—
|
|
47,312
|
|
||||||||
|
Changes in operating assets and liabilities:
|
||||||||||||||
|
Accounts receivable
|
4,849
|
|
(1,607
|
)
|
D
|
3,242
|
|
|||||||
|
Inventories
|
(7,105
|
)
|
(3,531
|
)
|
E
|
(10,636
|
)
|
|||||||
|
Deferred cost of revenue
|
(70,979
|
)
|
39,701
|
|
F
|
(31,278
|
)
|
|||||||
|
Customer financing receivable and other
|
5,459
|
|
—
|
|
5,459
|
|
||||||||
|
Prepaid expenses and other current assets
|
(2,175
|
)
|
1,193
|
|
G
|
(982
|
)
|
|||||||
|
Other long-term assets
|
4,625
|
|
(3,869
|
)
|
H
|
756
|
|
|||||||
|
Accounts payable
|
7,076
|
|
—
|
|
7,076
|
|
||||||||
|
Accrued warranty
|
(7,045
|
)
|
(320
|
)
|
I
|
(7,365
|
)
|
|||||||
|
Accrued expense and other current liabilities
|
8,599
|
|
(602
|
)
|
J
|
7,997
|
|
|||||||
|
Deferred revenue and customer deposits
|
91,893
|
|
(43,571
|
)
|
K
|
48,322
|
|
|||||||
|
Other long-term liabilities
|
43,239
|
|
(5,602
|
)
|
L
|
37,637
|
|
|||||||
|
Net cash used in operating activities
|
(67,176
|
)
|
(24,790
|
)
|
(91,966
|
)
|
||||||||
|
Cash flows from investing activities:
|
||||||||||||||
|
Purchase of property, plant and equipment
|
(5,140
|
)
|
(56,314
|
)
|
M
|
(61,454
|
)
|
|||||||
|
Purchase of marketable securities
|
(29,043
|
)
|
—
|
|
(29,043
|
)
|
||||||||
|
Proceeds from maturity of marketable securities
|
2,250
|
|
—
|
|
2,250
|
|
||||||||
|
Net cash used in investing activities
|
(31,933
|
)
|
(56,314
|
)
|
(88,247
|
)
|
||||||||
|
Cash flows from financing activities:
|
||||||||||||||
|
Borrowings from issuance of debt
|
100,000
|
|
—
|
|
100,000
|
|
||||||||
|
Repayment of debt
|
(20,507
|
)
|
—
|
|
(20,507
|
)
|
||||||||
|
Repayment of debt to related parties
|
(912
|
)
|
—
|
|
(912
|
)
|
||||||||
|
Debt issuance costs
|
(6,108
|
)
|
—
|
|
(6,108
|
)
|
||||||||
|
Proceeds from financing obligations
|
—
|
|
84,314
|
|
N
|
84,314
|
|
|||||||
|
Repayment of financing obligations
|
—
|
|
(3,210
|
)
|
N
|
(3,210
|
)
|
|||||||
|
Proceeds from noncontrolling and redeemable noncontrolling interests
|
13,652
|
|
—
|
|
13,652
|
|
||||||||
|
Distributions to noncontrolling and redeemable noncontrolling interests
|
(23,659
|
)
|
—
|
|
(23,659
|
)
|
||||||||
|
Proceeds from issuance of common stock
|
432
|
|
—
|
|
432
|
|
||||||||
|
Payments of initial public offering issuance costs
|
(1,092
|
)
|
—
|
|
(1,092
|
)
|
||||||||
|
Net cash provided by financing activities
|
61,806
|
|
81,104
|
|
142,910
|
|
||||||||
|
Net decrease in cash, cash equivalents, and restricted cash
|
(37,303
|
)
|
—
|
|
(37,303
|
)
|
||||||||
|
Cash, cash equivalents, and restricted cash:
|
||||||||||||||
|
Beginning of period
|
217,915
|
|
—
|
|
217,915
|
|
||||||||
|
End of period
|
$
|
180,612
|
|
$
|
—
|
|
$
|
180,612
|
|
|||||
|
Supplemental disclosure of cash flow information:
|
||||||||||||||
|
Cash paid during the period for interest
|
$
|
21,948
|
|
$
|
15,680
|
|
N
|
$
|
37,628
|
|
||||
|
Cash paid during the period for taxes
|
616
|
|
—
|
|
616
|
|
||||||||
A
Depreciation and amortization — The correction of these misstatements resulted from the change of accounting for Energy Servers under the Managed Services Program and other similar arrangements that would have been product and install costs of goods sold, but are now recorded as property, plant and equipment, and depreciated over their useful lives of 21 years.
120
B
Revaluation of derivative contracts - The correction of these misstatements resulted from the change of accounting for the grid pricing escalation guarantees we provided in some of our sales arrangements. These commitments were previously treated as a contingent liability and recorded as an accrued liability. We now consider the commitments a derivative liability, with the initial value recorded as a reduction in product revenue and then any changes in the value adjusted through other expense, net each period thereafter.
C
Stock-based compensation — The correction of these misstatements resulted from the change of accounting for stock-based compensation, including net capitalization of stock-based compensation cost into inventory of
$0.6 million
. The correction of this misstatement also resulted in the capitalization of
$0.7 million
of stock-based compensation, cost related to assets, under the Managed Services Program now recorded as construction in progress within property, plant and equipment, net.
D
Accounts receivable — The correction of these misstatements resulted from the change of accounting for Managed Services Agreements and similar arrangements where the timing difference of capacity billings to end customers and the payments received from the financing entity is recorded within accounts receivable.
E
Inventories — The correction of these misstatements resulted from the change of accounting for inventories, held for shipments planned to customers under the Managed Services Program and other similar arrangements now accounted for as construction in progress within property, plant and equipment, net.
F
Deferred cost of revenue, current and non-current — The correction of these misstatements resulted from the change of accounting moving deferred cost of revenue to property, plant and equipment, net for the leased Energy Servers under the Managed Services Agreements and similar sale-leaseback arrangements of
$39.1 million
, and the net capitalization of stock-based compensation costs of
$0.6 million
in current deferred cost of revenue.
G
Prepaid expenses and other current assets — The correction of these misstatements resulted from the change of accounting for Managed Services Agreements and similar arrangements where prepaid property tax and insurance payments are now classified within prepaid expenses, rather than offset against deferred revenue.
H
Other long-term assets — The correction of these misstatements resulted from the change of accounting for Managed Services Agreements and similar arrangements, including the timing difference of capacity billings to end customers of
$1.7 million
, payments received from the financing entity now recorded within long term receivables of
$1.8 million
, and commission payments now classified within long term commission expenses of
$0.4 million
.
I
Accrued warranty — The correction of these misstatements resulted from the change of accounting for accrued warranty which is now recorded on an as-incurred basis on our Managed Services Agreements and similar arrangements. The correction of these misstatements resulted from the change of accounting for the grid pricing escalation guarantees we've provided in some of our sales arrangements. These commitments were previously treated as a contingent liability that was considered remote and therefore, no accrual was made. We now consider
$0.3 million
accrual has made, with the initial value of treated as a reduction in product revenue and then any changes in the value adjusted through other expense, net each period thereafter.
J
Accrued expense and other current liabilities and other long-term liabilities — The correction of these misstatements resulted from the change of accounting for Managed Services Agreements and similar arrangements where instead of recognizing the bank financing as revenue, the bank financing loan proceeds received and due are classified as lease loan liability.
K
Deferred revenue and customer deposits, current and non-current — The correction of these misstatements resulted from the change of accounting for the recognition of product and installation revenue from upfront or ratable recognition to the recognition of the capacity payments received from the end customer as power is generated by the Energy Servers as electricity revenue.
L
Other long-term liabilities — The correction of these misstatements resulted from the change of accounting for Managed Services Agreements and similar arrangements where instead of recognizing the bank financing as revenue, the bank financing loan proceeds received and due beyond the next twelve months are classified as lease loan liability.
M
Purchase of property, plant and equipment — The correction of these misstatements resulted from the change of accounting for Managed Services Agreements and similar arrangements, whereby costs previously recognized as product and install costs of goods sold are now recorded as property, plant and equipment, net in the cases where the risks of ownership have not completely transferred to the financing party.
N
Proceeds and repayments from financing obligations — The correction of these misstatements resulted from the change of accounting for Managed Services Agreements and similar arrangements where instead of recognizing the upfront proceeds received from the bank as revenue, the bank proceeds received and due are classified as proceeds from financing obligations and the capacity payments received from the end customer are classified as repayment of financing obligations and interest paid.
121
3. Revenue Recognition
Adoption of ASC 606
The cumulative effect of the changes made to our consolidated January 1, 2019 consolidated balance sheet for the adoption of ASC 606 was as follows (in thousands):
|
Balances at
December 31, 2018 |
Adjustments
from Adoption of ASC 606 |
Balances at
January 1, 2019 |
||||||||||
|
As Restated
|
As Recast
|
|||||||||||
|
Assets
|
||||||||||||
|
Current assets:
|
||||||||||||
|
Cash and cash equivalents
|
$
|
220,728
|
|
$
|
—
|
|
$
|
220,728
|
|
|||
|
Restricted cash
|
28,657
|
|
—
|
|
28,657
|
|
||||||
|
Short-term investments
|
104,350
|
|
—
|
|
104,350
|
|
||||||
|
Accounts receivable
|
88,784
|
|
995
|
|
89,779
|
|
||||||
|
Inventories
|
135,265
|
|
—
|
|
135,265
|
|
||||||
|
Deferred cost of revenue
|
43,809
|
|
—
|
|
43,809
|
|
||||||
|
Customer financing receivable
|
5,594
|
|
—
|
|
5,594
|
|
||||||
|
Prepaid expenses and other current assets
|
36,747
|
|
140
|
|
36,887
|
|
||||||
|
Total current assets
|
663,934
|
|
1,135
|
|
665,069
|
|
||||||
|
Property, plant and equipment, net
|
716,751
|
|
—
|
|
716,751
|
|
||||||
|
Customer financing receivable, non-current
|
67,082
|
|
—
|
|
67,082
|
|
||||||
|
Restricted cash (non-current)
|
31,100
|
|
—
|
|
31,100
|
|
||||||
|
Deferred cost of revenue, non-current
|
45
|
|
—
|
|
45
|
|
||||||
|
Other long-term assets
|
42,882
|
|
2,472
|
|
45,354
|
|
||||||
|
Total assets
|
$
|
1,521,794
|
|
$
|
3,607
|
|
$
|
1,525,401
|
|
|||
|
Liabilities, Redeemable Noncontrolling Interest, Stockholders’ Deficit and Noncontrolling Interest
|
||||||||||||
|
Current liabilities:
|
||||||||||||
|
Accounts payable
|
$
|
66,889
|
|
$
|
—
|
|
$
|
66,889
|
|
|||
|
Accrued warranty
|
17,968
|
|
(1,032
|
)
|
16,936
|
|
||||||
|
Accrued expenses and other current liabilities
|
66,838
|
|
—
|
|
66,838
|
|
||||||
|
Financing obligations
|
8,128
|
|
—
|
|
8,128
|
|
||||||
|
Deferred revenue and customer deposits
|
67,632
|
|
4,653
|
|
72,285
|
|
||||||
|
Current portion of recourse debt
|
8,686
|
|
—
|
|
8,686
|
|
||||||
|
Current portion of non-recourse debt
|
18,962
|
|
—
|
|
18,962
|
|
||||||
|
Current portion of non-recourse debt from related parties
|
2,200
|
|
—
|
|
2,200
|
|
||||||
|
Total current liabilities
|
257,303
|
|
3,621
|
|
260,924
|
|
||||||
|
Derivative liabilities
|
14,143
|
|
—
|
|
14,143
|
|
||||||
|
Deferred revenue and customer deposits, net of current portion
|
87,308
|
|
17,982
|
|
105,290
|
|
||||||
|
Financing obligations, non-current
|
385,650
|
|
—
|
|
385,650
|
|
||||||
|
Long-term portion of recourse debt
|
360,339
|
|
—
|
|
360,339
|
|
||||||
|
Long-term portion of non-recourse debt
|
289,241
|
|
—
|
|
289,241
|
|
||||||
|
Long-term portion of recourse debt from related parties
|
27,734
|
|
—
|
|
27,734
|
|
||||||
|
Long-term portion of non-recourse debt from related parties
|
34,119
|
|
—
|
|
34,119
|
|
||||||
|
Other long-term liabilities
|
26,196
|
|
—
|
|
26,196
|
|
||||||
|
Total liabilities
|
1,482,033
|
|
21,603
|
|
1,503,636
|
|
||||||
|
Redeemable noncontrolling interest
|
57,261
|
|
—
|
|
57,261
|
|
||||||
|
Stockholders’ deficit:
|
||||||||||||
|
Common stock: $0.0001 par value; Class A shares and, Class B shares
|
11
|
|
—
|
|
11
|
|
||||||
|
Additional paid-in capital
|
2,481,352
|
|
—
|
|
2,481,352
|
|
||||||
|
Accumulated other comprehensive income
|
131
|
|
—
|
|
131
|
|
||||||
|
Accumulated deficit
|
(2,624,104
|
)
|
(17,996
|
)
|
(2,642,100
|
)
|
||||||
|
Total stockholders’ deficit
|
(142,610
|
)
|
(17,996
|
)
|
(160,606
|
)
|
||||||
|
Noncontrolling interest
|
125,110
|
|
—
|
|
125,110
|
|
||||||
|
Total liabilities, redeemable noncontrolling interest, stockholders' deficit and noncontrolling interest
|
$
|
1,521,794
|
|
$
|
3,607
|
|
$
|
1,525,401
|
|
|||
122
In accordance with the ASC 606 requirements, the impact of adoption on our consolidated balance sheet was as follows as of December 31, 2019 (in thousands):
|
December 31, 2019
|
||||||||||||
|
As Reported
|
Balances Without
Adoption of ASC 606 |
Effect of Change
Higher / (Lower) |
||||||||||
|
Assets
|
||||||||||||
|
Current assets:
|
||||||||||||
|
Cash and cash equivalents
|
$
|
202,823
|
|
$
|
202,823
|
|
$
|
—
|
|
|||
|
Restricted cash
|
30,804
|
|
30,804
|
|
—
|
|
||||||
|
Accounts receivable
|
37,828
|
|
47,442
|
|
(9,614
|
)
|
||||||
|
Inventories
|
109,606
|
|
109,606
|
|
—
|
|
||||||
|
Deferred cost of revenue
|
58,470
|
|
58,470
|
|
—
|
|
||||||
|
Customer financing receivable
|
5,108
|
|
5,108
|
|
—
|
|
||||||
|
Prepaid expenses and other current assets
|
28,068
|
|
27,860
|
|
208
|
|
||||||
|
Total current assets
|
472,707
|
|
482,113
|
|
(9,406
|
)
|
||||||
|
Property, plant and equipment, net
|
607,059
|
|
607,059
|
|
—
|
|
||||||
|
Customer financing receivable, non-current
|
50,747
|
|
50,747
|
|
—
|
|
||||||
|
Restricted cash, non-current
|
143,761
|
|
143,761
|
|
—
|
|
||||||
|
Deferred cost of revenue, non-current
|
6,665
|
|
6,665
|
|
—
|
|
||||||
|
Other long-term assets
|
41,652
|
|
37,849
|
|
3,803
|
|
||||||
|
Total assets
|
$
|
1,322,591
|
|
$
|
1,328,194
|
|
$
|
(5,603
|
)
|
|||
|
Liabilities, Redeemable Noncontrolling Interest, Stockholders’ Deficit and Noncontrolling Interest
|
||||||||||||
|
Current liabilities:
|
||||||||||||
|
Accounts payable
|
$
|
55,579
|
|
$
|
55,579
|
|
$
|
—
|
|
|||
|
Accrued warranty
|
10,333
|
|
11,952
|
|
(1,619
|
)
|
||||||
|
Accrued expenses and other current liabilities
|
70,284
|
|
70,284
|
|
—
|
|
||||||
|
Financing obligations
|
10,993
|
|
10,993
|
|
—
|
|
||||||
|
Deferred revenue and customer deposits
|
89,192
|
|
90,075
|
|
(883
|
)
|
||||||
|
Current portion of recourse debt
|
304,627
|
|
304,627
|
|
—
|
|
||||||
|
Current portion of non-recourse debt
|
8,273
|
|
8,273
|
|
—
|
|
||||||
|
Current portion of recourse debt from related parties
|
20,801
|
|
20,801
|
|
—
|
|
||||||
|
Current portion of non-recourse debt from related parties
|
3,882
|
|
3,882
|
|
—
|
|
||||||
|
Total current liabilities
|
573,964
|
|
576,466
|
|
(2,502
|
)
|
||||||
|
Derivative liabilities
|
17,551
|
|
17,551
|
|
—
|
|
||||||
|
Deferred revenue and customer deposits, net of current portion
|
125,529
|
|
84,594
|
|
40,935
|
|
||||||
|
Financing obligations, non-current
|
446,165
|
|
446,165
|
|
—
|
|
||||||
|
Long-term portion of recourse debt
|
75,962
|
|
75,962
|
|
—
|
|
||||||
|
Long-term portion of non-recourse debt
|
192,180
|
|
192,180
|
|
—
|
|
||||||
|
Long-term portion of non-recourse debt from related parties
|
31,087
|
|
31,087
|
|
—
|
|
||||||
|
Other long-term liabilities
|
28,013
|
|
28,013
|
|
—
|
|
||||||
|
Total liabilities
|
1,490,451
|
|
1,452,018
|
|
38,433
|
|
||||||
|
Redeemable noncontrolling interest
|
443
|
|
443
|
|
—
|
|
||||||
|
Stockholders’ deficit:
|
||||||||||||
|
Common stock: $0.0001 par value; Class A shares and, Class B shares
|
12
|
|
12
|
|
—
|
|
||||||
|
Additional paid-in capital
|
2,686,759
|
|
2,686,759
|
|
—
|
|
||||||
123
|
December 31, 2019
|
||||||||||||
|
As Reported
|
Balances Without
Adoption of ASC 606 |
Effect of Change
Higher / (Lower) |
||||||||||
|
Accumulated other comprehensive income
|
19
|
|
19
|
|
—
|
|
||||||
|
Accumulated deficit
|
(2,946,384
|
)
|
(2,902,348
|
)
|
(44,036
|
)
|
||||||
|
Total stockholders’ deficit
|
(259,594
|
)
|
(215,558
|
)
|
(44,036
|
)
|
||||||
|
Noncontrolling interest
|
91,291
|
|
91,291
|
|
—
|
|
||||||
|
Total liabilities, redeemable noncontrolling interest, stockholders' deficit and noncontrolling interest
|
$
|
1,322,591
|
|
$
|
1,328,194
|
|
$
|
(5,603
|
)
|
|||
124
In accordance with ASC 606 requirements, the impact of adoption on our consolidated statement of operations for the year ended
December 31, 2019
was as follows (in thousands):
|
|
|
Year ended December 31, 2019
|
||||||||||
|
|
|
As Reported
|
Balances Without
Adoption of ASC 606 |
Effect of Change
Higher / (Lower) |
||||||||
|
Revenue:
|
|
|
|
|
|
|
|
|
|
|||
|
Product
|
|
$
|
557,336
|
|
|
$
|
601,857
|
|
|
$
|
(44,521
|
)
|
|
Installation
|
60,826
|
|
54,716
|
|
6,110
|
|
||||||
|
Service
|
|
95,786
|
|
|
91,944
|
|
|
3,842
|
|
|||
|
Electricity
|
|
71,229
|
|
|
71,229
|
|
|
—
|
|
|||
|
Total revenue
|
|
785,177
|
|
|
819,746
|
|
|
(34,569
|
)
|
|||
|
Cost of revenue:
|
|
|
|
|||||||||
|
Product
|
435,479
|
|
436,064
|
|
(585
|
)
|
||||||
|
Installation
|
76,487
|
|
76,487
|
|
—
|
|
||||||
|
Service
|
|
100,238
|
|
|
106,782
|
|
|
(6,544
|
)
|
|||
|
Electricity
|
|
75,386
|
|
|
75,386
|
|
|
—
|
|
|||
|
Total cost of revenue
|
687,590
|
|
694,719
|
|
(7,129
|
)
|
||||||
|
Gross profit
|
97,587
|
|
125,027
|
|
(27,440
|
)
|
||||||
|
Operating expenses:
|
||||||||||||
|
Research and development
|
104,168
|
|
104,168
|
|
—
|
|
||||||
|
Sales and marketing
|
73,573
|
|
74,973
|
|
(1,400
|
)
|
||||||
|
General and administrative
|
152,650
|
|
152,650
|
|
—
|
|
||||||
|
Total operating expenses
|
330,391
|
|
331,791
|
|
(1,400
|
)
|
||||||
|
Loss from operations
|
(232,804
|
)
|
(206,764
|
)
|
(26,040
|
)
|
||||||
|
Interest income
|
5,661
|
|
5,661
|
|
—
|
|
||||||
|
Interest expense
|
(87,480
|
)
|
(87,480
|
)
|
—
|
|
||||||
|
Interest expense to related parties
|
(6,756
|
)
|
(6,756
|
)
|
—
|
|
||||||
|
Other income (expense), net
|
706
|
|
706
|
|
—
|
|
||||||
|
Loss on revaluation of warrant liabilities and embedded derivatives
|
(2,160
|
)
|
(2,160
|
)
|
—
|
|
||||||
|
Loss before income taxes
|
(322,833
|
)
|
(296,793
|
)
|
(26,040
|
)
|
||||||
|
Income tax provision
|
633
|
|
633
|
|
—
|
|
||||||
|
Net loss
|
(323,466
|
)
|
(297,426
|
)
|
(26,040
|
)
|
||||||
|
Net loss attributable to noncontrolling interests and redeemable noncontrolling interests
|
(19,052
|
)
|
(19,052
|
)
|
—
|
|
||||||
|
Net loss attributable to Class A and Class B common stockholders
|
(304,414
|
)
|
(278,374
|
)
|
(26,040
|
)
|
||||||
|
Less: deemed dividend to noncontrolling interest
|
(2,454
|
)
|
(2,454
|
)
|
—
|
|
||||||
|
Net loss available to Class A and Class B common stockholders
|
$
|
(306,868
|
)
|
$
|
(280,828
|
)
|
$
|
(26,040
|
)
|
|||
|
Net loss per share available to Class A and Class B common stockholders, basic and diluted
|
$
|
(2.67
|
)
|
$
|
(2.44
|
)
|
$
|
(0.23
|
)
|
|||
The impact of the adoption of ASC 606 on our consolidated statement of cash flows for the year ended
December 31, 2019
, relating to cash flows from operating activities was an increase to net loss of
$26.0 million
which was offset by a decrease in accounts receivable of
$10.6 million
, increases in prepaid expenses and other current assets of
$0.1 million
, and increases in other long-term assets of
$1.3 million
. These sources of cash from changes in operating assets were partially offset by increases in deferred revenue and customer deposits of
$17.4 million
and a decrease in accrued warranty of
$0.6 million
. There is no net impact on operating activities and no impact in investing and financing activities.
125
Contract Liabilities
Deferred revenue and customer deposits activity related to the adoption of ASC 606 consisted of the following (in thousands):
|
|
|
Year ended 12/31/2018
(As Restated) |
Impacts of ASC606 Adoption
|
As of 1/1/2019
(As Recast) |
As of 12/31/2019
(As Recast) |
|||||||||||
|
Deferred revenue
|
|
$
|
(141,458
|
)
|
$
|
(8,154
|
)
|
$
|
(149,612
|
)
|
$
|
(175,619
|
)
|
|||
|
Customer deposits
|
|
(13,482
|
)
|
(14,481
|
)
|
(27,963
|
)
|
(39,101
|
)
|
|||||||
|
Deferred revenue and customer deposits
|
|
$
|
(154,940
|
)
|
$
|
(22,635
|
)
|
$
|
(177,575
|
)
|
$
|
(214,720
|
)
|
|||
Deferred revenue activity during the year ended December 31, 2019 after the ASC 606 adoption consisted of the following (in thousands):
|
Year Ended December 31, 2019
|
||||
|
As Reported
|
||||
|
Deferred revenue on January 1, 2019
|
$
|
149,612
|
|
|
|
Additions
|
709,843
|
|
||
|
Revenue recognized
|
(683,836
|
)
|
||
|
Deferred revenue on December 31, 2019
|
$
|
175,619
|
|
|
Deferred revenue is equivalent to the total transaction price allocated to the performance obligations that are unsatisfied, or partially unsatisfied, as of
December 31, 2019
. These performance obligations relate to the provision of maintenance services under current contracts and future renewal periods which provide customers with material rights over a period that we estimate will be largely commensurate with the period of their expected use of the associated Energy Server. As a result we expect to recognize these amounts as revenue over a period of up to
21 years
, predominantly on a cost-to-cost basis that reflects the cost of providing these services.
Revenue by source
We disaggregate revenue from contracts with customers into four revenue categories: (i) product, (ii) installation, (iii) services and (iv) electricity, as shown below (in thousands):
|
Years Ended December 31,
|
||||||||
|
2019
|
2018
|
|||||||
|
|
|
As Reported, With Adoption of ASC 606
|
|
As Reported, Under ASC 605
|
||||
|
Revenue from contracts with customers:
|
|
|||||||
|
Product revenue
|
|
$
|
557,336
|
|
$
|
400,638
|
|
|
|
Installation revenue
|
|
60,826
|
|
68,195
|
|
|||
|
Services revenue
|
|
95,786
|
|
83,267
|
|
|||
|
Electricity revenue
|
|
10,840
|
|
|
23,023
|
|
||
|
Total revenue from contract with customers
|
724,788
|
|
575,123
|
|
||||
|
Revenue from contracts accounted for as leases:
|
|
|
||||||
|
Electricity revenue
|
60,389
|
|
57,525
|
|
||||
|
Total revenue
|
$
|
785,177
|
|
$
|
632,648
|
|
||
For the year ended
December 31, 2019
, approximately
77%
of our revenues are from the United States and
23%
comes from the Asia Pacific region.
126
4. Financial Instruments
Cash, Cash Equivalents and Restricted Cash
The carrying value of cash and cash equivalents approximate fair value and are as follows (in thousands):
|
December 31,
|
||||||||
|
|
2019
|
2018
|
||||||
|
As Held:
|
||||||||
|
Cash
|
$
|
100,773
|
|
$
|
136,642
|
|
||
|
Money market funds
|
276,615
|
|
143,843
|
|
||||
|
$
|
377,388
|
|
$
|
280,485
|
|
|||
|
As Reported:
|
||||||||
|
Cash and cash equivalents
|
$
|
202,823
|
|
$
|
220,728
|
|
||
|
Restricted cash
|
174,565
|
|
59,757
|
|
||||
|
$
|
377,388
|
|
$
|
280,485
|
|
|||
Restricted cash consisted of the following (in thousands):
|
December 31,
|
||||||||
|
|
2019
|
2018
|
||||||
|
Current:
|
|
|
||||||
|
Restricted cash
|
$
|
28,494
|
|
$
|
25,740
|
|
||
|
Restricted cash related to PPA Entities
|
2,310
|
|
2,917
|
|
||||
|
Restricted cash, current
|
$
|
30,804
|
|
$
|
28,657
|
|
||
|
Non-current:
|
||||||||
|
Restricted cash
|
$
|
10
|
|
$
|
3,246
|
|
||
|
Restricted cash related to PPA Entities
1
|
143,751
|
|
27,854
|
|
||||
|
Restricted cash, non-current
|
143,761
|
|
31,100
|
|
||||
|
$
|
174,565
|
|
$
|
59,757
|
|
|||
1
We have variable interest entities which represent a portion of the consolidated balances are recorded within the "restricted cash," and other financial statement line items in the Consolidated Balance Sheets (see Note 13, Power Purchase Agreement Programs). This amount includes
$108.7 million
and
$20.0 million
of restricted cash non-current, held in PPA II and PPA IIIb entities, respectively. As of
December 31, 2019
, such entities are no longer considered variable interest entities.
Short-Term Investments
As of
December 31, 2019
, we had
no
short-term investments. As of December 31,
2018
, we had short-term investments in
U.S. Treasury Bills
of
$104.4 million
.
Derivative Instruments
We have derivative financial instruments related to natural gas fixed price forward contracts and interest rate swaps. See Note 8,
Derivative Financial Instruments
for a full description of our derivative financial instruments.
5. Fair Value
Financial Assets and Liabilities Measured at Fair Value on a Recurring Basis
The tables below set forth, by level, our financial assets that were accounted for at fair value for the respective periods. The table does not include assets and liabilities that are measured at historical cost or any basis other than fair value (in thousands):
|
|
Fair Value Measured at Reporting Date Using
|
|||||||||||||||
|
December 31, 2019
|
Level 1
|
Level 2
|
Level 3
|
Total
|
||||||||||||
|
Assets
|
||||||||||||||||
|
Cash equivalents:
|
||||||||||||||||
|
Money market funds
|
$
|
276,615
|
|
$
|
—
|
|
$
|
—
|
|
$
|
276,615
|
|
||||
|
Interest rate swap agreements
|
—
|
|
3
|
|
—
|
|
3
|
|
||||||||
|
$
|
276,615
|
|
$
|
3
|
|
$
|
—
|
|
$
|
276,618
|
|
|||||
|
Liabilities
|
||||||||||||||||
|
Accrued expenses and other current liabilities
|
$
|
996
|
|
$
|
—
|
|
$
|
—
|
|
$
|
996
|
|
||||
|
Derivatives:
|
||||||||||||||||
|
Natural gas fixed price forward contracts
|
—
|
|
—
|
|
6,968
|
|
6,968
|
|
||||||||
|
Embedded EPP derivatives
|
—
|
|
—
|
|
6,176
|
|
6,176
|
|
||||||||
|
Interest rate swap agreements
|
—
|
|
9,241
|
|
—
|
|
9,241
|
|
||||||||
|
$
|
996
|
|
$
|
9,241
|
|
$
|
13,144
|
|
$
|
23,381
|
|
|||||
|
|
Fair Value Measured at Reporting Date Using
|
|||||||||||||||
|
December 31, 2018
|
Level 1
|
Level 2
|
Level 3
|
Total
|
||||||||||||
|
Assets
|
||||||||||||||||
|
Cash equivalents:
|
||||||||||||||||
|
Money market funds
|
$
|
143,843
|
|
$
|
—
|
|
$
|
—
|
|
$
|
143,843
|
|
||||
|
Short-term investments
|
104,350
|
|
—
|
|
—
|
|
104,350
|
|
||||||||
|
Interest rate swap agreements
|
—
|
|
82
|
|
—
|
|
82
|
|
||||||||
|
$
|
248,193
|
|
$
|
82
|
|
$
|
—
|
|
$
|
248,275
|
|
|||||
|
Liabilities
|
||||||||||||||||
|
Accrued expenses and other current liabilities
|
$
|
1,331
|
|
$
|
—
|
|
$
|
—
|
|
$
|
1,331
|
|
||||
|
Derivatives:
|
||||||||||||||||
|
Natural gas fixed price forward contracts
|
—
|
|
—
|
|
9,729
|
|
9,729
|
|
||||||||
|
Embedded EPP derivatives
|
—
|
|
—
|
|
4,015
|
|
4,015
|
|
||||||||
|
Interest rate swap agreements
|
—
|
|
3,630
|
|
—
|
|
3,630
|
|
||||||||
|
$
|
1,331
|
|
$
|
3,630
|
|
$
|
13,744
|
|
$
|
18,705
|
|
|||||
Money Market Funds -
Money market funds are valued using quoted market prices for identical securities and are therefore classified as Level 1 financial assets.
Short-Term Investments -
Short-term investments, which are comprised of
U.S. Treasury Bills
with maturities of 12 months or less from the purchase date, are valued using quoted market prices for identical securities and are therefore classified as Level 1 financial assets.
Interest Rate Swap Agreements -
Interest rate swap agreements are valued using quoted prices for similar contracts and are therefore classified as Level 2 financial assets. Interest rate swaps are designed as hedging instruments and are recognized at fair value on our consolidated balance sheets. As of
December 31, 2019
,
$0.6 million
of the gain on the interest rate swaps accumulated in other comprehensive income (loss) is expected to be reclassified into earnings in the next twelve months.
127
Natural Gas Fixed Price Forward Contracts -
Natural gas fixed price forward contracts are valued using a combination of factors including the counterparty's credit rating and estimates of future natural gas prices and therefore, as no observable inputs to support market activity are available, are classified as Level 3 financial assets.
The following table provides the number and fair value of our natural gas fixed price forward contracts (in thousands):
|
December 31,
|
||||||||||||||
|
|
2019
|
2018
|
||||||||||||
|
|
Number of
Contracts
(MMBTU)
²
|
Fair
Value
|
Number of
Contracts (MMBTU)² |
Fair
Value
|
||||||||||
|
|
|
|
||||||||||||
|
Liabilities
¹
|
||||||||||||||
|
Natural gas fixed price forward contracts (not under hedging relationships)
|
1,991
|
|
$
|
6,968
|
|
3,096
|
|
$
|
9,729
|
|
||||
|
¹ Recorded in current liabilities and derivative liabilities in the consolidated balance sheets.
|
||||||||||||||
|
² One MMBTU is a traditional unit of energy used to describe the heat value (energy content) of fuels.
|
||||||||||||||
For the years ended
December 31, 2019
and
2018
, we marked-to-market the fair value of our natural gas fixed price forward contracts and recorded a
loss
of
$0.8 million
and a
gain
of
$2.2 million
, respectively, and recorded
gains
on the settlement of these contracts of
$3.6 million
and
$3.4 million
, respectively, in cost of revenue on our consolidated statement of operations.
Embedded Derivative on 6% Convertible Promissory Notes -
Between December 2015 and September 2016, we issued
$260.0 million
of
6%
Convertible Promissory Notes (
6%
Notes) that mature in December 2020. The
6%
Notes are convertible at the option of the holders at a conversion price of
$11.25
per share. The embedded redemption feature of the
6%
Notes was therefore classified as an embedded derivative.
The embedded redemption feature of the
6%
Notes was valued using the binomial lattice method, which utilizes significant inputs that are unobservable in the market. The fair value was determined by estimated event dates with probabilities of likely events under the scenario based upon facts existing through the date of our IPO. It was therefore classified as a Level 3 financial liability. Upon the expiration of embedded derivative features triggered by the IPO, we reclassified the fair value of the derivative liability into additional paid-in capital. The final valuation of the conversion feature was calculated as of the date of the IPO to be
$178.0 million
and was reclassified from derivative liability to additional paid-in capital on the balance sheet.
Embedded EPP Derivatives in Sales Contracts -
We estimated the fair value of the embedded EPP derivatives in certain sales contracts using a Monte Carlo simulation model which considers various potential electricity price curves over the sales contracts' terms. We use historical grid prices and available forecasts of future electricity prices to estimate future electricity prices. We have classified these derivatives as a Level 3 financial liability.
Preferred Stock Warrants -
We estimated the fair value of the preferred stock warrants using a probability-weighted expected return model which considers various potential liquidity outcomes and assigned probabilities to each to arrive at the weighted equity value. As there were no observable inputs supported by market activity, the preferred stock warrants were therefore classified as a Level 3 financial liability.
The preferred stock warrants were converted to common stock warrants effective with the IPO and reclassified to additional paid-in capital. The fair value of the preferred stock warrants was
zero
as of
December 31, 2019
and
2018
. The changes in fair value were recorded in gain (loss) on revaluation of warrant liabilities in our consolidated statements of operations.
128
There were no transfers between fair value measurement classifications during the years ended
December 31, 2019
and
2018
. The changes in the Level 3 financial assets were as follows (in thousands):
|
Natural
Gas
Fixed Price
Forward
Contracts
|
Preferred
Stock
Warrants
|
Embedded
Derivative
Liability
|
Embedded EPP Derivative
|
Total
|
||||||||||||||||
|
Balances at December 31, 2017
|
$
|
15,368
|
|
$
|
9,825
|
|
$
|
140,771
|
|
$
|
4,217
|
|
$
|
170,181
|
|
|||||
|
Settlement of natural gas fixed price forward contracts
|
(3,412
|
)
|
—
|
|
—
|
|
0
|
|
(3,412
|
)
|
||||||||||
|
Embedded derivative on notes and sales contracts
|
—
|
|
—
|
|
6,288
|
|
3
|
|
6,291
|
|
||||||||||
|
Changes in fair value
|
(2,227
|
)
|
(8,943
|
)
|
30,904
|
|
(205
|
)
|
19,529
|
|
||||||||||
|
Reclassification of preferred stock warrants liability to common stock warrants and derivative liability into additional paid-in-capital
|
—
|
|
(882
|
)
|
(177,963
|
)
|
—
|
|
(178,845
|
)
|
||||||||||
|
Balances at December 31, 2018
|
9,729
|
|
—
|
|
—
|
|
4,015
|
|
13,744
|
|
||||||||||
|
Settlement of natural gas fixed price forward contracts
|
(3,605
|
)
|
—
|
|
—
|
|
—
|
|
(3,605
|
)
|
||||||||||
|
Changes in fair value
|
844
|
|
—
|
|
—
|
|
2,161
|
|
3,005
|
|
||||||||||
|
Balances at December 31, 2019
|
$
|
6,968
|
|
$
|
—
|
|
$
|
—
|
|
$
|
6,176
|
|
$
|
13,144
|
|
|||||
Significant changes in any assumption input in isolation can result in a significant change in fair value measurement. Generally, an increase in the market price of our shares of common stock, an increase in natural gas prices, an increase in the volatility of our shares of common stock and an increase in the remaining term of the conversion feature would each result in a directionally similar change in the estimated fair value of our derivative liability. Increases in such assumption values would increase the associated liability while decreases in these assumption values would decrease the associated liability. An increase in the risk-free interest rate or a decrease in the market price of our shares of common stock would result in a decrease in the estimated fair value measurement and thus a decrease in the associated liability.
Financial Assets and Liabilities Not Measured at Fair Value on a Recurring Basis
Customer Receivables and Debt Instruments -
We estimate fair value for customer financing receivables, senior secured notes, term loans and convertible promissory notes based on rates currently offered for instruments with similar maturities and terms (Level 3). The following table presents the estimated fair values and carrying values of customer receivables and debt instruments (in thousands):
|
|
December 31, 2019
|
December 31, 2018
|
||||||||||||||
|
|
Net Carrying
Value
|
Fair Value
|
Net Carrying
Value
|
Fair Value
|
||||||||||||
|
|
|
|
||||||||||||||
|
Customer receivables:
|
||||||||||||||||
|
Customer financing receivables
|
$
|
55,855
|
|
$
|
44,002
|
|
$
|
72,676
|
|
$
|
51,541
|
|
||||
|
Debt instruments:
|
||||||||||||||||
|
Recourse
|
||||||||||||||||
|
LIBOR + 4% term loan due November 2020
|
1,536
|
|
1,590
|
|
3,214
|
|
3,311
|
|
||||||||
|
5% convertible promissory note due December 2020
|
36,482
|
|
32,070
|
|
34,706
|
|
31,546
|
|
||||||||
|
6% convertible promissory notes due December 2020
|
273,410
|
|
302,047
|
|
263,284
|
|
353,368
|
|
||||||||
|
10% notes due July 2024
|
89,962
|
|
97,512
|
|
95,555
|
|
99,260
|
|
||||||||
|
Non-recourse
|
||||||||||||||||
|
5.22% senior secured notes due March 2025
|
—
|
|
—
|
|
78,566
|
|
80,838
|
|
||||||||
|
7.5% term loan due September 2028
|
34,969
|
|
41,108
|
|
36,319
|
|
39,892
|
|
||||||||
|
LIBOR + 5.25% term loan due October 2020
|
—
|
|
—
|
|
23,916
|
|
25,441
|
|
||||||||
|
6.07% senior secured notes due March 2030
|
80,016
|
|
87,618
|
|
82,337
|
|
85,917
|
|
||||||||
|
LIBOR + 2.5% term loan due December 2021
|
120,436
|
|
120,510
|
|
123,384
|
|
123,040
|
|
||||||||
Long-Lived Assets
-
Our long-lived assets include property, plant and equipment and Energy Servers capitalized in connection with our Managed Services Program and other similar arrangements. The carrying amounts of our long-lived assets
129
are periodically reviewed for impairment whenever events or changes in circumstances indicate that the carrying value of these assets may not be recoverable or that the useful life is shorter than originally estimated. During the year ended December 31, 2019 we upgraded the
30 megawatts
of Energy Servers in PPA II and the
5.4 megawatts
of Energy Servers in PPA IIIb by decommissioning these systems and selling and installing new Energy Servers. As a result of these upgrades, the useful lives of all other remaining Energy Servers included within our long-lived assets were reassessed and we concluded that no change in the useful lives or impairment of these remaining Energy Servers was identified in the year ended
December 31, 2019
. See Note 13,
Purchase Power Agreement Programs
for further information.
6. Balance Sheet Components
Inventories
The components of inventory consisted of the following (in thousands):
|
December 31,
|
||||||||
|
|
2019
|
2018
|
||||||
|
As Restated
|
||||||||
|
Raw materials
|
$
|
67,829
|
|
$
|
50,856
|
|
||
|
Work-in-progress
|
21,207
|
|
18,676
|
|
||||
|
Finished goods
|
20,570
|
|
65,733
|
|
||||
|
$
|
109,606
|
|
$
|
135,265
|
|
|||
Prepaid Expenses and Other Current Assets
Prepaid expenses and other current assets consisted of the following (in thousands):
|
December 31,
|
||||||||
|
|
2019
|
2018
|
||||||
|
|
|
As Restated
|
||||||
|
Government incentives receivable
|
$
|
893
|
|
$
|
1,001
|
|
||
|
Prepaid HW & SW maintenance
|
3,763
|
|
1,464
|
|
||||
|
Receivables from employees
|
6,130
|
|
5,922
|
|
||||
|
Other prepaid expense and other current assets
|
17,282
|
|
28,360
|
|
||||
|
$
|
28,068
|
|
$
|
36,747
|
|
|||
Property, Plant and Equipment, Net
Property, plant and equipment, net consisted of the following (in thousands):
|
December 31,
|
||||||||
|
|
2019
|
2018
|
||||||
|
|
|
As Restated
|
||||||
|
Energy Servers
|
$
|
650,600
|
|
$
|
757,574
|
|
||
|
Computers, software and hardware
|
20,275
|
|
16,536
|
|
||||
|
Machinery and equipment
|
101,650
|
|
99,209
|
|
||||
|
Furniture and fixtures
|
8,339
|
|
4,337
|
|
||||
|
Leasehold improvements
|
35,694
|
|
18,629
|
|
||||
|
Building
|
40,512
|
|
40,512
|
|
||||
|
Construction in progress
|
12,611
|
|
41,180
|
|
||||
|
869,681
|
|
977,977
|
|
|||||
|
Less: Accumulated depreciation
|
(262,622
|
)
|
(261,226
|
)
|
||||
|
$
|
607,059
|
|
$
|
716,751
|
|
|||
130
Construction in progress decreased
$28.6 million
from 2018, primarily due to our move to our new corporate headquarters during the first quarter of 2019. After the move was completed,
$17.6 million
was reclassified to leasehold improvements within property, plant and equipment. In addition, the remaining decrease of
$11.0 million
was due to acceptances of Energy Servers under our Managed Services sale-leaseback program which are reclassified from construction in progress to Energy Servers within property, plant and equipment upon acceptance.
Depreciation expense related to property, plant and equipment was
$78.6 million
,
$53.1 million
and
$54.4 million
for the years ended
December 31, 2019
,
2018
and
2017
, respectively.
Property, plant and equipment under operating leases by the PPA Entities was
$371.4 million
and
$397.5 million
as of
December 31, 2019
and
2018
, respectively. The accumulated depreciation for these assets was
$95.5 million
and
$77.4 million
as of
December 31, 2019
and
2018
, respectively. Depreciation expense related to our property, plant and equipment under operating leases by the PPA Entities was
$27.1 million
,
$25.5 million
and
$25.5 million
for the years ended
December 31, 2019
,
2018
and
2017
respectively.
During the year ended
December 31, 2019
, there was a decommissioning in PPA II, including the replacement during 2019 of
30.0 megawatts
of installed Energy Servers with
27.5 megawatts
of new systems sold, resulting in product cost of goods sold due to
$52.5 million
for the write-off of Energy Servers and
$78.4 million
for the cost of new systems sold, and electricity cost of revenue of
$22.6 million
of accelerated depreciation charged.
During the year ended
December 31, 2019
, there was a d
ecommissioning in PPA IIIb,
including the replacement during 2019 of
5.0 megawatts
of installed Energy Servers, resulting in product cost of goods sold of
$18.0 million
for the write-off of Energy Servers, and electricity cost of revenue of
$1.7 million
of accelerated depreciation charged in fourth quarter of 2019 related to the revised expected lives of installed systems, which we recognized in our consolidated statement of operations
See
Note 13, Power Purchase Agreement Programs - PPA II Upgrade of Energy Servers
and
PPA IIIb Upgrade of Energy Servers
for additional information.
Customer Financing Receivable
The components of investment in sales-type financing leases consisted of the following (in thousands):
|
December 31,
|
||||||||
|
|
2019
|
2018
|
||||||
|
Total minimum lease payments to be received
|
$
|
76,886
|
|
$
|
100,816
|
|
||
|
Less: Amounts representing estimated executing costs
|
(19,931
|
)
|
(25,180
|
)
|
||||
|
Net present value of minimum lease payments to be received
|
56,955
|
|
75,636
|
|
||||
|
Estimated residual value of leased assets
|
890
|
|
1,051
|
|
||||
|
Less: Unearned income
|
(1,990
|
)
|
(4,011
|
)
|
||||
|
Net investment in sales-type financing leases
|
55,855
|
|
72,676
|
|
||||
|
Less: Current portion
|
(5,108
|
)
|
(5,594
|
)
|
||||
|
Non-current portion of investment in sales-type financing leases
|
$
|
50,747
|
|
$
|
67,082
|
|
||
The future scheduled customer payments from sales-type financing leases were as follows as of
December 31, 2019
(in thousands):
|
|
2020
|
2021
|
2022
|
2023
|
2024
|
Thereafter
|
||||||||||||||||||
|
Future minimum lease payments, less interest
|
$
|
5,108
|
|
$
|
5,428
|
|
$
|
5,784
|
|
$
|
6,155
|
|
$
|
6,567
|
|
$
|
25,923
|
|
||||||
131
Other Long-Term Assets
Other long-term assets consisted of the following (in thousands):
|
December 31,
|
||||||||
|
|
2019
|
2018
|
||||||
|
|
|
As Restated
|
||||||
|
Prepaid and other long-term assets
|
$
|
29,153
|
|
$
|
34,093
|
|
||
|
Deferred commissions
|
5,007
|
|
1,083
|
|
||||
|
Equity-method investments
|
5,733
|
|
6,046
|
|
||||
|
Long-term deposits
|
1,759
|
|
1,660
|
|
||||
|
$
|
41,652
|
|
$
|
42,882
|
|
|||
Accrued Warranty
Accrued warranty liabilities consisted of the following (in thousands):
|
December 31,
|
||||||||
|
|
2019
|
2018
|
||||||
|
|
|
As Restated
|
||||||
|
Product warranty
|
$
|
2,345
|
|
$
|
3,378
|
|
||
|
Product performance
|
7,536
|
|
6,290
|
|
||||
|
Maintenance services contracts
|
453
|
|
8,300
|
|
||||
|
$
|
10,334
|
|
$
|
17,968
|
|
|||
Changes in the product warranty and product performance liabilities were as follows (in thousands):
|
Balances at December 31, 2016 (As Revised)
|
$
|
8,082
|
|
|
Accrued warranty, net (As Revised)
|
5,979
|
|
|
|
Warranty expenditures during period (As Revised)
|
(6,740
|
)
|
|
|
Balances at December 31, 2017 (As Revised)
|
7,321
|
|
|
|
Accrued warranty, net (As Restated)
|
9,301
|
|
|
|
Warranty expenditures during period (As Restated)
|
(6,954
|
)
|
|
|
Balances at December 31, 2018 (As Restated)
|
9,668
|
|
|
|
Cumulative effect upon adoption of ASC 606
|
1,032
|
|
|
|
Accrued warranty, net
|
1,849
|
|
|
|
Warranty expenditures during period
|
(2,668
|
)
|
|
|
Balances at December 31, 2019
|
$
|
9,881
|
|
132
Accrued Expenses and Other Current Liabilities
Accrued expenses and other current liabilities consisted of the following (in thousands):
|
December 31,
|
||||||||
|
|
2019
|
2018
|
||||||
|
|
|
As Restated
|
||||||
|
Compensation and benefits
|
$
|
17,173
|
|
$
|
16,742
|
|
||
|
Current portion of derivative liabilities
|
4,834
|
|
3,232
|
|
||||
|
Sales related liabilities
|
416
|
|
1,421
|
|
||||
|
Accrued installation
|
10,348
|
|
6,859
|
|
||||
|
Sales tax liabilities
|
3,849
|
|
1,798
|
|
||||
|
Interest payable
|
3,875
|
|
4,675
|
|
||||
|
Other
|
29,789
|
|
32,111
|
|
||||
|
$
|
70,284
|
|
$
|
66,838
|
|
|||
Other Long-Term Liabilities
Other long-term liabilities consisted of the following (in thousands):
|
December 31,
|
||||||||
|
|
2019
|
2018
|
||||||
|
As Restated
|
||||||||
|
Delaware grant
|
$
|
10,469
|
|
$
|
10,469
|
|
||
|
Other
|
17,544
|
|
15,727
|
|
||||
|
$
|
28,013
|
|
$
|
26,196
|
|
|||
In March 2012, we entered into an agreement with the Delaware Economic Development Authority to provide a grant of
$16.5 million
to us as an incentive to establish a new manufacturing facility in Delaware and to provide employment for full time workers at the facility over a certain period of time. We have received
$12.0 million
of the grant which is contingent upon us meeting certain milestones related to the construction of the manufacturing facility and the employment of full-time workers at the facility through September 30, 2023. As of
December 31, 2019
, we have paid
$1.5 million
in October 2017 for recapture provisions and have recorded
$10.5 million
in other long-term liabilities for potential repayments. See Note 14,
Commitments and Contingencies
for a full description of the grant.
133
7. Outstanding Loans and Security Agreements
The following is a summary of our debt as of
December 31, 2019
(in thousands):
|
|
Unpaid
Principal Balance |
Net Carrying Value
|
Unused
Borrowing Capacity |
Interest
Rate |
Maturity Dates
|
Entity
|
Recourse
|
|||||||||||||||||||||
|
|
Current
|
Long-
Term |
Total
|
|||||||||||||||||||||||||
|
LIBOR + 4% term loan due November 2020
|
$
|
1,571
|
|
$
|
1,536
|
|
$
|
—
|
|
$
|
1,536
|
|
$
|
—
|
|
LIBOR
plus margin |
November 2020
|
Company
|
Yes
|
|||||||||
|
5% convertible promissory note due December 2020
|
33,104
|
|
36,482
|
|
—
|
|
36,482
|
|
—
|
|
5.0%
|
December 2020
|
Company
|
Yes
|
||||||||||||||
|
6% convertible promissory notes due December 2020
|
289,299
|
|
273,410
|
|
—
|
|
273,410
|
|
—
|
|
6.0%
|
December 2020
|
Company
|
Yes
|
||||||||||||||
|
10% notes due July 2024
|
93,000
|
|
14,000
|
|
75,962
|
|
89,962
|
|
—
|
|
10.0%
|
July 2024
|
Company
|
Yes
|
||||||||||||||
|
Total recourse debt
|
416,974
|
|
325,428
|
|
75,962
|
|
401,390
|
|
—
|
|
||||||||||||||||||
|
7.5% term loan due September 2028
|
38,337
|
|
3,882
|
|
31,087
|
|
34,969
|
|
—
|
|
7.5%
|
September 2028
|
PPA IIIa
|
No
|
||||||||||||||
|
6.07% senior secured notes due March 2030
|
80,988
|
|
3,151
|
|
76,865
|
|
80,016
|
|
—
|
|
6.1%
|
March 2030
|
PPA IV
|
No
|
||||||||||||||
|
LIBOR + 2.5% term loan due December 2021
|
121,784
|
|
5,122
|
|
115,315
|
|
120,437
|
|
—
|
|
LIBOR plus
margin |
December 2021
|
PPA V
|
No
|
||||||||||||||
|
Letters of Credit due December 2021
|
—
|
|
—
|
|
—
|
|
—
|
|
1,220
|
|
2.25%
|
December 2021
|
PPA V
|
No
|
||||||||||||||
|
Total non-recourse debt
|
241,109
|
|
12,155
|
|
223,267
|
|
235,422
|
|
1,220
|
|
||||||||||||||||||
|
Total debt
|
$
|
658,083
|
|
$
|
337,583
|
|
$
|
299,229
|
|
$
|
636,812
|
|
$
|
1,220
|
|
|||||||||||||
134
The following is a summary of our debt as of
December 31, 2018
(in thousands):
|
|
Unpaid
Principal
Balance
|
Net Carrying Value
|
Unused
Borrowing
Capacity
|
Interest
Rate
|
Maturity Dates
|
Entity
|
Recourse
|
|||||||||||||||||||||
|
|
Current
|
Long-
Term
|
Total
|
|||||||||||||||||||||||||
|
LIBOR + 4% term loan due November 2020
|
$
|
3,286
|
|
$
|
1,686
|
|
$
|
1,528
|
|
$
|
3,214
|
|
$
|
—
|
|
LIBOR
plus margin |
November 2020
|
Company
|
Yes
|
|||||||||
|
5% convertible promissory note due December 2020
|
33,104
|
|
—
|
|
34,706
|
|
34,706
|
|
—
|
|
8.0%
|
December 2020
|
Company
|
Yes
|
||||||||||||||
|
6% convertible promissory notes due December 2020
|
296,233
|
|
—
|
|
263,284
|
|
263,284
|
|
—
|
|
6.0%
|
December 2020
|
Company
|
Yes
|
||||||||||||||
|
10% notes due July 2024
|
100,000
|
|
7,000
|
|
88,555
|
|
95,555
|
|
—
|
|
10.0%
|
July 2024
|
Company
|
Yes
|
||||||||||||||
|
Total recourse debt
|
432,623
|
|
8,686
|
|
388,073
|
|
396,759
|
|
—
|
|
||||||||||||||||||
|
5.22% senior secured term notes due March 2025
|
79,698
|
|
11,994
|
|
66,572
|
|
78,566
|
|
—
|
|
5.2%
|
March 2025
|
PPA II
|
No
|
||||||||||||||
|
7.5% term loan due September 2028
|
40,538
|
|
2,200
|
|
34,119
|
|
36,319
|
|
—
|
|
7.5%
|
September 2028
|
PPA IIIa
|
No
|
||||||||||||||
|
LIBOR + 5.25% term loan due October 2020
|
24,723
|
|
827
|
|
23,089
|
|
23,916
|
|
—
|
|
LIBOR
plus margin |
October 2020
|
PPA IIIb
|
No
|
||||||||||||||
|
6.07% senior secured notes due March 2030
|
83,457
|
|
2,469
|
|
79,868
|
|
82,337
|
|
—
|
|
6.1%
|
March 2030
|
PPA IV
|
No
|
||||||||||||||
|
LIBOR + 2.5% term loan due December 2021
|
125,456
|
|
3,672
|
|
119,712
|
|
123,384
|
|
—
|
|
LIBOR plus
margin |
December 2021
|
PPA V
|
No
|
||||||||||||||
|
Letters of Credit due December 2021
|
—
|
|
—
|
|
—
|
|
—
|
|
1,220
|
|
2.25%
|
December 2021
|
PPA V
|
No
|
||||||||||||||
|
Total non-recourse debt
|
353,872
|
|
21,162
|
|
323,360
|
|
344,522
|
|
1,220
|
|
||||||||||||||||||
|
Total debt
|
$
|
786,495
|
|
$
|
29,848
|
|
$
|
711,433
|
|
$
|
741,281
|
|
$
|
1,220
|
|
|||||||||||||
Recourse debt refers to debt that Bloom Energy Corporation has an obligation to pay. Non-recourse debt refers to debt that is recourse to only specified assets or our subsidiaries. The differences between the unpaid principal balances and the net carrying values apply to debt discounts and deferred financing costs. We were in compliance with all financial covenants as of
December 31, 2019
and
2018
.
Recourse Debt Facilities
LIBOR +
4%
Term Loan due November 2020 -
In May 2013, we entered into a
$5.0 million
credit agreement and a
$12.0 million
financing agreement to help fund the building of a new facility in Newark, Delaware. The
$5.0 million
credit agreement expired in December 2016. The
$12.0 million
financing agreement has a term of
90 months
, payable monthly at a variable rate equal to one month LIBOR plus the applicable margin. The weighted average interest rate as of
December 31, 2019
and
2018
was
6.3%
and
5.9%
, respectively. The loan requires monthly payments and is secured by the manufacturing facility. In addition, the credit agreements also include a cross-default provision which provides that the remaining balance of borrowings under the agreements will be due and payable immediately if a lien is placed on the Newark facility in the event we default on any indebtedness in excess of
$100,000
individually or
$300,000
in the aggregate. Under the terms of these credit agreements, we are required to comply with various restrictive covenants. As of
December 31, 2019
and
2018
, the unpaid principal balance of debt outstanding was
$1.6 million
and
$3.3 million
, respectively.
5% Convertible Promissory Notes due 2020 (Originally 8% Convertible Promissory Notes due December 2018) -
Between December 2014 and June 2016, we issued
$193.2 million
of
three
-year convertible promissory notes ("
8% Notes
") to certain investors. The
8% Notes
had a fixed interest rate of
8%
compounded monthly, due at maturity or at the election of the investor with accrued interest due in December of each year.
On January 18, 2018, amendments were finalized to extend the maturity dates for all the
8% Notes
to December 2019. At the same time, the portion of the notes that was held by Constellation NewEnergy, Inc. ("Constellation") was extended to December 2020 and the interest rate decreased from
8%
to
5%
("
5% Notes
").
Investors held the right to convert the unpaid principal and accrued interest of both the
8% Notes
and
5% Notes
to Series G convertible preferred stock at any time at the price of
$38.64 per share
. In July 2018, upon our IPO, the
$221.6 million
of
135
principal and accrued interest of outstanding
8% Notes
automatically converted into additional paid-in capital, the conversion of which included all the related-party noteholders. The
8% Notes
converted to shares of Series G convertible preferred stock and, concurrently, each such share of Series G convertible preferred stock converted automatically into one share of Class B common stock. Upon our IPO, conversions of
5,734,440
shares of Class B common stock were issued and the
8% Notes
were retired. Constellation, the holder of the
5% Notes
, have not elected to convert as of
December 31, 2019
. The outstanding unpaid principal and accrued interest debt balance of the
5% Notes
of
$36.5 million
was classified as current as of
December 31, 2019
, and the outstanding unpaid principal and accrued interest debt balances of the
5% Notes
of
$34.7 million
was classified as non-current as of
December 31, 2018
.
6% Convertible Promissory Notes due December 2020 -
Between December 2015 and September 2016, we issued
$260.0 million
convertible promissory notes due December 2020, ("
6% Notes
") to certain investors. The
6% Notes
bore a
5.0%
fixed interest rate, payable monthly either in cash or in kind, at our election. We amended the terms of the
6% Notes
in June 2017 to increase the interest rate from
5%
to
6%
and to reduce the collateral securing the notes.
As of
December 31, 2019
and
2018
, the amount outstanding on the
6% Notes
, which includes interest paid in kind through the IPO date, was
$289.3 million
and
$296.2 million
, respectively. Upon our IPO, the debt is convertible at the option of the holders at the conversion price of
$11.25
per share into common stock at any time through the maturity date. In January 2018, we amended the terms of the
6% Notes
to extend the convertible put option, which investors could elect only if the IPO did not occur prior to December 2019. After the IPO, we paid the interest in cash when due and no additional interest accrued on the consolidated balance sheet on the
6% Notes
. In November 2019, one note holder exchanged a portion of their
6% Notes
at the conversion price of
$11.25
per share into
616,302
shares of common stock.
On or after July 27, 2020, we may redeem, at our option, all or part of the
6% Notes
if the last reported sale price of our common stock has been at least
$22.50
for at least
20
trading days (whether or not consecutive) during a period of
30
consecutive trading days ending within the
three
trading days immediately preceding the date on which we provide written notice of redemption In certain circumstances, the
6% Notes
are also redeemable at our option in connection with a change of control.
Under the terms of the indenture governing the
6% Notes
, we are required to comply with various restrictive covenants, including meeting reporting requirements, such as the preparation and delivery of audited consolidated financial statements, and restrictions on investments. In addition, we are required to maintain collateral which secures the
6% Notes
in an amount equal to
200%
of the principal amount of and accrued and unpaid interest on the outstanding notes. This minimum collateral test is not a negative covenant and does not result in a default if not met. However, the minimum collateral test does restrict us with respect to investing in non-PPA subsidiaries. If we do not meet the minimum collateral test, we cannot invest cash into any non-PPA subsidiary that is not a guarantor of the notes. The
6% Notes
also include a cross-acceleration provision which provides that the holders of at least
25%
of the outstanding principal amount of the
6% Notes
may cause such notes to become immediately due and payable if we or any of our subsidiaries default on any indebtedness in excess of
$15.0 million
such that the repayment of such indebtedness is accelerated.
10% Notes due July 2024 -
In June 2017, we issued
$100.0 million
of senior secured notes ("
10% Notes
"). The
10%
Notes mature in 2024 and bear a
10.0%
fixed rate of interest and with principal amortization started July 2019, payable semi-annually. The
10% Notes
have a continuing security interest in the cash flows payable to us as servicing, operations and maintenance fees and administrative fees from certain active power purchase agreements in our Bloom Electrons program. Under the terms of the indenture governing the notes, we are required to comply with various restrictive covenants including, among other things, to maintain certain financial ratios such as debt service coverage ratios, to incur additional debt, issue guarantees, incur liens, make loans or investments, make asset dispositions, issue or sell share capital of our subsidiaries and pay dividends, meet reporting requirements, including the preparation and delivery of audited consolidated financial statements, or maintain certain restrictions on investments and requirements in incurring new debt. In addition, we are required to maintain collateral which secures the
10% Notes
based on debt ratio analyses. This minimum collateral test is not a negative covenant and does not result in a default if not met. However, the minimum debt service coverage ratio test does restrict our access to the excess cash escrowed in a collection account which would otherwise be released to us on a bi-annual basis after principal amortization and interest payment. The outstanding unpaid principal and accrued interest debt balance of the
10% Notes
of
$14.0 million
and
$7.0 million
were classified as current as of
December 31, 2019
and 2018, respectively and the outstanding unpaid principal and accrued interest debt balances of the
10% Notes
of
$76.0 million
and
$88.6 million
were classified as non-current as of
December 31, 2019
and 2018, respectively.
136
Non-recourse Debt Facilities
5.22% Senior Secured Term Notes -
In March 2013, PPA Company II refinanced its existing debt by issuing
5.22%
Senior Secured Notes due March 30, 2025. The total amount of the loan proceeds was
$144.8 million
, including
$28.8 million
to repay outstanding principal of existing debt,
$21.7 million
for debt service reserves and transaction costs and
$94.3 million
to fund the remaining system purchases. In June 2019, as part of the PPA II upgrade of Energy Servers, we paid off the outstanding debt and interest of these notes for the outstanding amount of
$77.6 million
. The Note Purchase Agreement required us to maintain a debt service reserve, the balance of
$11.2 million
which was written off in June 2019 and was
$11.2 million
as of
December 31, 2018
, which was included as part of long-term restricted cash in the consolidated balance sheets.
7.5% Term Loan due September 2028 -
In December 2012 and later amended in August 2013, PPA IIIa entered into a
$46.8 million
credit agreement to help fund the purchase and installation of our Energy Servers. The loan bears a fixed interest rate of
7.5%
payable quarterly. The loan requires quarterly principal payments which began in March 2014. The credit agreement requires us to maintain a debt service reserve for all funded systems, the balance of which was
$3.8 million
and
$3.7 million
as of
December 31, 2019
and
2018
, respectively, and which was included as part of long-term restricted cash in the consolidated balance sheets. The loan is secured by all assets of PPA IIIa.
LIBOR + 5.25% Term Loan due October 2020 -
In September 2013, PPA IIIb entered into a credit agreement to help fund the purchase and installation of our Energy Servers. In accordance with that agreement, PPA IIIb issued floating rate debt based on LIBOR plus a margin of
5.2%
, paid quarterly. The aggregate amount of the debt facility was
$32.5 million
. In December 2019, as part of the PPA IIIa upgrade of Energy Servers, we paid off the outstanding debt and interest of these notes for the outstanding amount of
$24.2 million
. The credit agreement required us to maintain a debt service reserve for all funded systems, the balance of which was
$1.8 million
which was written off in December 2019 and was
$1.7 million
as of
December 31, 2018
and which was included as part of long-term restricted cash in the consolidated balance sheets.
6.07% Senior Secured Notes due March 2025 -
In July 2014, PPA IV issued senior secured notes amounting to
$99.0 million
to third parties to help fund the purchase and installation of our Energy Servers. The notes bear a fixed interest rate of
6.07%
payable quarterly which began in December 2015 and ends in March 2030. The notes are secured by all the assets of the PPA IV. The Note Purchase Agreement requires us to maintain a debt service reserve, the balance of which was
$8.0
million as of
December 31, 2019
and
$7.5 million
as of
December 31, 2018
, and which was included as part of long-term restricted cash in the consolidated balance sheets.
LIBOR + 2.5% Term Loan due December 2021 -
In June 2015, PPA V entered into a
$131.2 million
credit agreement to fund the purchase and installation of our Energy Servers. The lenders are a group of
five
financial institutions and the terms included commitments to a letter of credit ("LC") facility (see below). The loan was initially advanced as a construction loan during the development of the PPA V Project and converted into a term loan on February 28, 2017 (the “Term Conversion Date”). As part of the term loan’s conversion, the LC facility commitments were adjusted.
In accordance with the credit agreement, PPA V was issued a floating rate debt based on LIBOR plus a margin, paid quarterly. The applicable margins used for calculating interest expense are
2.25%
for years 1-3 following the Term Conversion Date and
2.5%
thereafter. For the Lenders’ commitments to the loan and the commitments to the LC loan, the PPA V also pays commitment fees at
0.50%
per annum over the outstanding commitments, paid quarterly. The loan is secured by all the assets of the PPA V and requires quarterly principal payments which began in March 2017. In connection with the floating-rate credit agreement, in July 2015 the PPA V entered into pay-fixed, receive-float interest rate swap agreements to convert its floating-rate loan into a fixed-rate loan.
Letters of Credit due December 2021 -
In June 2015, PPA V entered into a
$131.2 million
term loan due December 2021. The agreement also included commitments to a LC facility with the aggregate principal amount of
$6.4 million
, later adjusted down to
$6.2 million
. The amount reserved under the letter of credit as of
December 31, 2019
and
2018
was
$5.0 million
. The unused capacity as of
December 31, 2019
and
2018
was and
$1.2 million
and
$1.2 million
, respectively.
Related Party Debt
Portions of the above described recourse and non-recourse debt are held by various related parties. See Note 16,
Related Party Transactions
for a full description.
137
Repayment Schedule and Interest Expense
The following table presents detail of our entire outstanding loan principal repayment schedule as of
December 31, 2019
(in thousands):
|
2020
|
$
|
350,129
|
|
|
2021
|
139,370
|
|
|
|
2022
|
26,046
|
|
|
|
2023
|
29,450
|
|
|
|
2024
|
35,941
|
|
|
|
Thereafter
|
77,147
|
|
|
|
$
|
658,083
|
|
|
Interest expense of
$94.2 million
,
$105.9 million
and
$124.3 million
for the years ended
December 31, 2019
,
2018
and
2017
, respectively, was recorded in interest expense on the consolidated statements of operations.
8. Derivative Financial Instruments
Interest Rate Swaps
We use various financial instruments to minimize the impact of variable market conditions on our results of operations. We use interest rate swaps to minimize the impact of fluctuations of interest rate changes on our outstanding debt where LIBOR is applied. We do not enter into derivative contracts for trading or speculative purposes.
The fair values of the derivatives designated as cash flow hedges as of
December 31, 2019
and
2018
on our consolidated balance sheets were as follows (in thousands):
|
December 31,
|
||||||||
|
|
2019
|
2018
|
||||||
|
Assets
|
|
|||||||
|
Prepaid expenses and other current assets
|
$
|
3
|
|
$
|
42
|
|
||
|
Other long-term assets
|
—
|
|
40
|
|
||||
|
$
|
3
|
|
$
|
82
|
|
|||
|
Liabilities
|
||||||||
|
Accrued expenses and other current liabilities
|
$
|
782
|
|
$
|
4
|
|
||
|
Derivative liabilities
|
8,459
|
|
3,626
|
|
||||
|
$
|
9,241
|
|
$
|
3,630
|
|
|||
PPA Company IIIb -
In September 2013, PPA IIIb entered into an interest rate swap arrangement to convert a variable interest rate debt to a fixed rate. We designated and documented its interest rate swap arrangement as a cash flow hedge. The swap’s term ends on October 1, 2020, which is concurrent with the final maturity of the debt floating interest rates reset on a quarterly basis. We evaluate and calculate the effectiveness of the hedge at each reporting date. The effective change was recorded in accumulated other comprehensive income (loss) and was recognized as interest expense on settlement. The notional amounts of the swap were
zero
,
$24.7 million
and
$25.6 million
as of
December 31, 2019
,
2018
and
2017
respectively. We measure the swap at fair value on a recurring basis. Fair value is determined by discounting future cash flows using LIBOR rates with appropriate adjustment for credit risk.
We recorded a
loss
of
$82,000
, a
loss
of
$68,000
and a
loss
of
$64,000
during the years ended
December 31, 2019
,
2018
and
2017
, respectively, attributable to the change in swap’s fair value. These gains and losses were included in other income (expense), net in the consolidated statement of operations.
Pursuant to the PPA IIIb upgrade of Energy Servers, the debt was paid off along with any interest accrued and the interest swap was settled for
$0.2 million
in 2019 and recorded to interest expense in the consolidated statement of operations.
PPA Company V -
In July 2015, PPA Company V entered into
nine
interest rate swap agreements to convert a variable interest rate debt to a fixed rate. The loss on the swaps prior to designation was recorded in current-period earnings. In July 2015, we designated and documented its interest rate swap arrangements as cash flow hedges.
Three
of these swaps matured in 2016,
three
will mature on December 21, 2021 and the remaining
three
will mature on September 30, 2031. We evaluate and calculate the effectiveness of the hedge at each reporting date. The effective change was recorded in accumulated other
138
comprehensive income (loss) and was recognized as interest expense on settlement. The notional amounts of the swaps were
$184.2 million
,
$186.6 million
and
$188.5 million
as of
December 31, 2019
,
2018
and
2017
, respectively.
We measure the swaps at fair value on a recurring basis. Fair value is determined by discounting future cash flows using LIBOR rates with appropriate adjustment for credit risk. We recorded a
gain
of
$0.2 million
, a
gain
of
$0.1 million
and a gain of
$0.1 million
attributable to the change in valuation during the years ended
December 31, 2019
,
2018
and
2017
, respectively. These gains were included in other income (expense), net in the consolidated statement of operations.
The changes in fair value of the derivative contracts designated as cash flow hedges and the amounts recognized in accumulated other comprehensive income (loss) and in earnings were as follows (in thousands):
|
Year ended December 31,
|
||||||||
|
2019
|
2018
|
|||||||
|
Beginning balance
|
$
|
3,548
|
|
$
|
5,852
|
|
||
|
Loss (gain) recognized in other comprehensive loss
|
6,131
|
|
(1,729
|
)
|
||||
|
Amounts reclassified from other comprehensive loss to earnings
|
(216
|
)
|
(369
|
)
|
||||
|
Net loss (gain) recognized in other comprehensive income (loss)
|
5,915
|
|
(2,098
|
)
|
||||
|
Gain recognized in earnings
|
(225
|
)
|
(206
|
)
|
||||
|
Ending balance
|
$
|
9,238
|
|
$
|
3,548
|
|
||
Natural Gas Derivatives
On September 1, 2011, we entered into a natural gas fixed price forward contract with a gas supplier. This fuel forward contract is used as part of our program to manage the risk for controlling the overall cost of natural gas. Our PPA I is the only PPA Company for which natural gas was provided by us. This fuel forward contract meets the definition of a derivative under U.S. GAAP. We have not elected to designate this contract as a hedge and, accordingly, any changes in its fair value is recorded within cost of revenue in the statements of operations. The fair value of the contract is determined using a combination of factors including the counterparty’s credit rate and estimates of future natural gas prices.
For the years ended
December 31, 2019
,
2018
and
2017
, we marked-to-market the fair value of our natural gas fixed price forward contract and recorded a
loss
of
$0.8 million
, a
gain
of
$2.2 million
and a
loss
of
$1.0 million
, respectively. For the years ended
December 31, 2019
,
2018
and
2017
, we recorded
gains
of
$3.6 million
,
$3.4 million
and
$4.2 million
, respectively, on the settlement of these contracts. Gains and losses are recorded in cost of revenue on the consolidated statement of operations.
Embedded Derivatives
6%
Convertible Promissory Notes -
On December 15, 2015, January 29, 2016, and September 10, 2016, we issued
$160.0 million
,
$25.0 million
, and
$75.0 million
, respectively, of
6%
Convertible Promissory Notes ("
6%
Notes") that mature in December 2020. The
6%
Notes were contractually convertible at the option of the holders at a conversion price per share equal to the lower of
$20.61
or
75%
of the offering price of our common stock sold in an initial public offering. Upon the IPO, the options were convertible at the option of the holders at the conversion price of
$11.25
per share.
The valuation of this embedded put feature was recorded as a derivative liability in the consolidated balance sheet, measured each reporting period. Fair value was determined using the binomial lattice method. We recorded a
gain
of
$31.5 million
and a
loss
of
$18.2 million
attributable to the change in valuation for the years ended
December 31, 2018
and
2017
, respectively. These gains and losses were included within loss on revaluation of warrant liabilities and embedded derivatives in the consolidated statement of operations. Upon the IPO, the final valuation of the conversion feature was calculated as of the date of the IPO and was reclassified from a derivative liability to additional paid-in capital. The fair value of the embedded derivatives within the notes was
$178.0 million
upon reclassification.
Embedded EPP Derivatives in Sales Contracts -
We estimated the fair value of the embedded EPP derivatives in certain sales contracts using a Monte Carlo simulation model which considers various potential electricity price forward curves over the sales contracts' terms. We use historical grid prices and available forecasts of future electricity prices to estimate future electricity prices. The grid pricing Escalation Protection Plan ("EPP") guarantees that we provided in some of our sales arrangements represent an embedded derivative, with the initial value accounted for as a reduction in product revenue and any changes, reevaluated quarterly, in the fair market value of the derivative recorded in other income (expense), net. We recorded a loss of
$2.2 million
, a gain of
$0.2 million
and a loss of
$0.3 million
attributable to the change in fair value for the years ended
December 31, 2019
,
2018
and
2017
, respectively. These gains and losses were included within loss on revaluation of warrant
139
liabilities and embedded derivatives in the consolidated statements of operations. The fair value of these derivatives was
$6.2 million
,
$4.0 million
and
$4.2 million
as of
December 31, 2019
,
2018
and
2017
, respectively.
9. Common Stock Warrants
Common Stock Warrants
During 2018, all of the preferred and common stock warrants we issued in connection with loan agreements and a dispute settlement converted to warrants to purchase shares of Class B common stock. As of
December 31, 2019
, we had Class B common stock warrants outstanding to purchase
481,181
and
12,940
shares of Class B common stock at exercise prices of
$27.78
and
$38.64
, respectively. As of
December 31, 2018
, we had Class B common stock warrants outstanding to purchase
481,181
and
312,939
shares of Class B common stock at exercise prices of
$27.78
and
$38.64
, respectively.
10. Income Taxes
The components of income (loss) before the provision for income taxes are as follows (in thousands):
|
Years Ended
December 31, |
||||||||||||
|
2019
|
2018
|
2017
|
||||||||||
|
As Restated
|
As Revised
|
|||||||||||
|
United States
|
$
|
(324,467
|
)
|
$
|
(291,574
|
)
|
$
|
(297,473
|
)
|
|||
|
Foreign
|
1,634
|
|
1,835
|
|
3,081
|
|
||||||
|
Total
|
$
|
(322,833
|
)
|
$
|
(289,739
|
)
|
$
|
(294,392
|
)
|
|||
The provision for income taxes is comprised of the following (in thousands):
|
Years Ended
December 31, |
||||||||||||
|
2019
|
2018
|
2017
|
||||||||||
|
|
|
|||||||||||
|
Current:
|
||||||||||||
|
Federal
|
$
|
—
|
|
$
|
—
|
|
$
|
—
|
|
|||
|
State
|
26
|
|
191
|
|
25
|
|
||||||
|
Foreign
|
595
|
|
1,407
|
|
621
|
|
||||||
|
Total current
|
621
|
|
1,598
|
|
646
|
|
||||||
|
Deferred:
|
||||||||||||
|
Federal
|
—
|
|
—
|
|
—
|
|
||||||
|
State
|
—
|
|
—
|
|
—
|
|
||||||
|
Foreign
|
12
|
|
(61
|
)
|
(10
|
)
|
||||||
|
Total deferred
|
12
|
|
(61
|
)
|
(10
|
)
|
||||||
|
Total provision for income taxes
|
$
|
633
|
|
$
|
1,537
|
|
$
|
636
|
|
|||
140
A reconciliation of the U.S. federal statutory income tax rate to our effective tax rate is as follows (in thousands):
|
Years Ended
December 31, |
||||||||||||
|
2019
|
2018
|
2017
|
||||||||||
|
As Restated
|
As Revised
|
|||||||||||
|
Tax at federal statutory rate
|
$
|
(67,795
|
)
|
$
|
(60,845
|
)
|
$
|
(100,093
|
)
|
|||
|
State taxes, net of federal effect
|
26
|
|
191
|
|
25
|
|
||||||
|
Impact on noncontrolling interest
|
4,001
|
|
3,725
|
|
6,347
|
|
||||||
|
Non-U.S. tax effect
|
264
|
|
960
|
|
(437
|
)
|
||||||
|
Nondeductible expenses
|
144
|
|
6,796
|
|
5,698
|
|
||||||
|
Stock-based compensation
|
6,484
|
|
3,892
|
|
4,854
|
|
||||||
|
U.S. tax reform impact
|
—
|
|
—
|
|
239,117
|
|
||||||
|
U.S. tax on foreign earnings (GILTI)
|
221
|
|
127
|
|
|
—
|
|
|||||
|
Change in valuation allowance
|
57,288
|
|
46,691
|
|
(154,875
|
)
|
||||||
|
Provision for income taxes
|
$
|
633
|
|
$
|
1,537
|
|
$
|
636
|
|
|||
For the year ended December 31, 2019, we recorded
a provision
for income taxes of
$0.6 million
on
a pre-tax loss
of
$322.8 million
, for an effective tax rate of
(0.2)%
. For the year ended December 31, 2018, we recorded
a provision
for income taxes of
$1.5 million
on
a pre-tax loss
of
$289.7 million
, for an effective tax rate of
(0.5)%
. For the year ended December 31, 2017, we recorded
a provision
for income taxes of
$0.6 million
on
a pre-tax loss
of
$294.4 million
, for an effective tax rate of
(0.2)%
. The effective tax rate for 2019, 2018 and 2017 is lower than the statutory federal tax rate primarily due to a full valuation allowance against U.S. deferred tax assets.
Significant components of our deferred tax assets and liabilities consist of the following (in thousands):
|
December 31,
|
||||||||
|
2019
|
2018
|
|||||||
|
As Restated
|
||||||||
|
Tax credits and NOLs
|
$
|
494,084
|
|
$
|
468,402
|
|
||
|
Leased liabilities
|
122,145
|
|
108,113
|
|
||||
|
Depreciation and amortization
|
8,523
|
|
9,631
|
|
||||
|
Deferred revenue
|
6,688
|
|
457
|
|
||||
|
Accruals and reserves
|
5,874
|
|
4,462
|
|
||||
|
Stock-based compensation
|
61,808
|
|
62,793
|
|
||||
|
Other items - DTA
|
24,443
|
|
17,863
|
|
||||
|
Gross deferred tax assets
|
723,565
|
|
671,721
|
|
||||
|
Valuation allowance
|
(633,591
|
)
|
(571,277
|
)
|
||||
|
Net deferred tax assets
|
89,974
|
|
100,444
|
|
||||
|
Investment in PPA entities
|
(13,494
|
)
|
(21,587
|
)
|
||||
|
Debt issuance cost
|
(4,055
|
)
|
(8,586
|
)
|
||||
|
Leased assets
|
(65,978
|
)
|
(62,681
|
)
|
||||
|
Other items - DTL
|
(5,803
|
)
|
(6,817
|
)
|
||||
|
Gross deferred tax liabilities
|
(89,330
|
)
|
(99,671
|
)
|
||||
|
Net deferred tax asset
|
$
|
644
|
|
$
|
773
|
|
||
Income taxes are recorded using the asset and liability method. Deferred tax assets and liabilities are recognized for the future tax consequences attributable to differences between the financial statement carrying amounts of existing assets and liabilities and their respective tax bases and operating loss and tax credit carryforwards. Deferred tax assets and liabilities are measured using enacted tax rates expected to apply to taxable income (or loss) in the years in which those temporary differences are expected to be recovered or settled. The effect on deferred tax assets and liabilities of a change in tax rates is recognized in income in the period that includes the enactment date.
141
A valuation allowance is provided for the amount of deferred tax assets that, based on available evidence, is not more-likely-than-not to be realized. Management believes that, based on available evidence, both positive and negative, it is not more likely than not that the net U.S. deferred tax assets will be utilized. As a result, a full valuation allowance has been recorded.
The valuation allowance for deferred tax assets was
$633.6 million
and
$571.3 million
as of December 31, 2019 and 2018, respectively. The net change in the total valuation allowance for the years ended December 31, 2019 and 2018 was an increase of
$62.3 million
and an increase of
$24.0 million
, respectively.
At December 31, 2019, we had federal and state net operating loss carryforwards of
$1.8 billion
and
$1.6 billion
, respectively, to reduce future taxable income. Of the federal net operating loss carryforwards,
$1.7 billion
will begin to expire in
2022
and
$125.2 million
will carryforward indefinitely, while state net operating losses begin to expire in
2028
. In addition, we had approximately
$20.5 million
of federal research credit,
$6.6 million
of federal investment tax credit, and
$14.0 million
of state research credit carryforwards. The federal tax credit carryforwards begin to expire in
2022
.The state credit carryforwards may be carried forward indefinitely. We have not reflected deferred tax assets for the federal and state research credit carryforwards as the entire amount of the carryforwards represent unrecognized tax benefits.
Internal Revenue Code Section 382 (“Section 382”) limits the use of net operating loss and tax credit carryforwards in certain situations in which changes occur in our capital stock ownership. Any annual limitation may result in the expiration of net operating losses and credits before utilization. If we should have an ownership change, as defined by the tax law, utilization of the net operating loss and credit carryforwards could be significantly reduced. We completed a Section 382 analysis through December 31, 2019. Based on this analysis, Section 382 limitations will not have a material impact on our net operating loss and credit carryforwards related to any ownership changes which occurred during the period covered by the analysis.
During the year ended
December 31, 2019
, the amount of uncertain tax positions increased by
$4.2 million
. We have not recorded any uncertain tax liabilities associated with its tax positions.
A reconciliation of the beginning and ending amounts of unrecognized tax benefits were as follows (in thousands):
|
Years Ended
December 31, |
||||||||
|
2019
|
2018
|
|||||||
|
Unrecognized tax benefits beginning balance
|
$
|
30,311
|
|
$
|
28,331
|
|
||
|
Gross decrease for tax positions of prior year
|
(93
|
)
|
(468
|
)
|
||||
|
Gross increase for tax positions of prior year
|
615
|
|
353
|
|
||||
|
Gross increase for tax positions of current year
|
3,647
|
|
2,095
|
|
||||
|
Unrecognized tax benefits end balance
|
$
|
34,480
|
|
$
|
30,311
|
|
||
If fully recognized in the future, there would be
no
impact to the effective tax rate, and
$31.5 million
would result in adjustments to the valuation allowance. We do
not
have any tax positions that are expected to significantly increase or decrease within the next 12 months.
Interest and penalties, to the extent there are any, are included in income tax expense and there were
no
interest or penalties accrued during or for the years ended
December 31, 2019
and
2018
.
We are subject to taxation in the United States and various states and foreign jurisdictions. We currently do not have any income tax examinations in progress nor have we had any income tax examinations since our inception. All of our tax years will remain open for examination by federal and state authorities for three and four years from the date of utilization of any net operating losses and tax credits.
The Tax Cuts and Jobs Act of 2017 ("Tax Act") includes a provision referred to as Global Intangible Low-Taxed Income ("GILTI") which generally imposes a tax on foreign income in excess of a deemed return on tangible assets. FASB guidance issued in January 2018 allows companies to make an accounting policy election to either (i) account for GILTI as a component of tax expense in the period in which the tax is incurred ("period cost method"), or (ii) account for GILTI in the measurement of deferred taxes ("deferred method"). We elected to account for the tax effects of this provision using the period cost method.
Our accumulated undistributed foreign earnings as of December 31, 2019 have been subject to either the deemed one-time mandatory repatriation under the Tax Act or the current year income inclusion under GILTI regime for U.S. tax purposes. If we were to make actual distributions of some or all of these earnings, including earnings accumulated after December 31, 2017, we would generally incur no additional U.S. income tax but could incur U.S. state income tax and foreign withholding taxes. We have not accrued for these potential U.S. state income tax and foreign withholding taxes because we intend to permanently reinvest our foreign earnings in our international operations. However, any additional income tax associated with the distribution of these earnings would be immaterial.
142
11. Net Loss per Share Attributable to Common Stockholders
Net loss per share (basic) attributable to common stockholders is calculated by dividing net loss attributable to common stockholders by the weighted-average shares of common stock outstanding for the period. Net loss per share (diluted) is computed by using the "if-converted" method when calculating the potential dilutive effect, if any, of convertible shares whereby net loss attributable to common stockholders is adjusted by the effect of dilutive securities such as awards under equity compensation plans and inducement awards under separate restricted stock unit, or RSUs, award agreements. Net loss per share (diluted) attributable to common stockholders is then calculated by dividing the resulting adjusted net loss attributable to common stockholders by the combined weighted-average number of fully diluted common shares outstanding.
In
July 2018
, we completed an initial public offering of our common shares wherein
20,700,000
shares of Class A common stock were sold into the market. Added to existing shares of Class B common stock were shares mandatorily converted from various financial instruments as a result of the IPO. See Note 9,
Common Stock Warrants.
There were no adjustments to net loss attributable to common stockholders in determining net loss attributable to common stockholders (diluted). Equally, there were no adjustments to the weighted average number of outstanding shares of common stock (basic) in arriving at the weighted average number of outstanding shares (diluted), as such adjustments would have been antidilutive.
We recognized a deemed dividend of
$2.5 million
on November 26, 2019 related to our buyout of the tax equity partner’s equity interest in PPA IIIb. The deemed dividend was recorded as a result of the buyout amount exceeding the hypothetical liquidation book value of the tax equity investor's equity interest in PPA IIIb on the date the buyout occurred. This charge impacted net income attributable to common stockholders and earnings per share in the year ended December 31, 2019.
Net loss per share is the same for each class of common stock as they are entitled to the same liquidation and dividend rights with the exception of voting rights. As a result, net loss per share (basic) and net loss per share (diluted) attributed to common stockholders are the same for both Class A and Class B common stock and are combined for presentation. The following table sets forth the computation of our net loss per share (basic) and net loss per share (diluted) attributable to common stockholders (in thousands, except per share amounts):
|
Years Ended
December 31, |
||||||||||||
|
|
2019
|
2018
|
2017
|
|||||||||
|
|
As Restated
|
As Revised
|
||||||||||
|
Numerator:
|
||||||||||||
|
Net loss attributable to Class A and Class B common stockholders
|
$
|
(304,414
|
)
|
$
|
(273,540
|
)
|
$
|
(276,362
|
)
|
|||
|
Less: deemed dividend to noncontrolling interest
|
(2,454
|
)
|
—
|
|
—
|
|
||||||
|
Net loss available to Class A and Class B common stockholders
|
$
|
(306,868
|
)
|
$
|
(273,540
|
)
|
$
|
(276,362
|
)
|
|||
|
Denominator:
|
||||||||||||
|
Weighted average shares of common stock, basic and diluted
|
115,118
|
|
53,268
|
|
10,248
|
|
||||||
|
Net loss per share available to Class A and Class B common stockholders, basic and diluted
|
$
|
(2.67
|
)
|
$
|
(5.14
|
)
|
$
|
(26.97
|
)
|
|||
143
The following common stock equivalents (in thousands) were excluded from the computation of our net loss per share attributable to common stockholders (diluted) for the periods presented as their inclusion would have been antidilutive:
|
|
Years Ended
December 31, |
||||||||
|
|
2019
|
2018
|
2017
|
||||||
|
|
|||||||||
|
Convertible and non-convertible redeemable preferred stock and convertible notes
|
27,213
|
|
27,230
|
|
85,476
|
|
|||
|
Stock options to purchase common stock
|
4,631
|
|
4,962
|
|
2,950
|
|
|||
|
Convertible redeemable preferred stock warrants
|
—
|
|
—
|
|
60
|
|
|||
|
Convertible redeemable common stock warrants
|
—
|
|
—
|
|
312
|
|
|||
|
31,844
|
|
32,192
|
|
88,798
|
|
||||
12. Stock-Based Compensation and Employee Benefit Plans
2002 Stock Plan
Our 2002 Stock Plan (the "2002 Plan") was approved in April 2002 and amended in June 2011. In August 2012 and in connection with the adoption of the 2012 Plan, shares authorized for issuance under the 2002 Plan were cancelled, except for those shares reserved for issuance upon exercise of outstanding stock options. Any outstanding stock options granted under the 2002 Plan remain outstanding, subject to the terms of the 2002 Plan, until such shares are issued under those awards (by exercise of stock options) or until the awards terminate or expire by terms.
Grants under the 2002 Plan generally vest ratably over a
four
-year period from the vesting commencement date and expire ten years from grant date. Original grants under the 2002 Plan were for "common stock". Pursuant to the Twelfth Amended and Restated Articles of Incorporation authorized in July 2018, all such shares automatically converted to Class B shares of common stock.
As of
December 31, 2019
, options to purchase
1,856,154
shares of Class B common stock were outstanding with a weighted average exercise price of
$23.21
per share.
2012 Equity Incentive Plan
Our 2012 Equity Incentive Plan (the "2012 Plan") was approved in August 2012. The 2012 Plan provided for the grant of incentive stock options, non-statutory stock options, stock appreciation rights and restricted stock awards ("RSUs"), all of which may be granted to employees, including officers, and to non-employee directors and consultants except we may grant incentive stock options only to employees.
Grants under the 2012 Plan generally vest ratably over a
four
-year period from the vesting commencement date and expire ten years from grant date. Original grants under the 2012 Plan were for "common stock". Pursuant to the Twelfth Amended and Restated Articles of Incorporation authorized in July 2018, all such shares automatically converted to Class B shares of common stock. As of
December 31, 2019
, options to purchase
9,982,756
shares of Class B common stock were outstanding with a weighted average exercise price of
$27.12
per share and no shares were available for future grant. As of
December 31, 2019
, we had outstanding RSUs that may be settled for
6,656,094
shares of Class B common stock under the plan.
2018 Equity Incentive Plan
The 2018 Equity Incentive Plan (the "2018 Plan") was approved in April 2018. The 2018 Plan became effective upon the IPO and will serve as the successor to the 2012 Plan. We have reserved
20,278,268
shares of Class A common stock under the 2018 Plan and no more than
26,666,667
shares of Class A common stock will be issued pursuant to the exercise of incentive stock options.
The 2018 Plan authorizes the award of stock options, restricted stock awards, stock appreciation rights, RSUs, performance awards and stock bonuses. The 2018 Plan provides for the grant of awards to employees, directors, consultants, independent contractors and advisors provided the consultants, independent contractors, directors and advisors render services not in connection with the offer and sale of securities in a capital-raising transaction. The exercise price of stock options is at least equal to the fair market value of Class A common stock on the date of grant. Grants under the 2018 Plan generally vest ratably over a
four
-year period from the vesting commencement date and expire ten years from grant date.
144
As of
December 31, 2019
, options to purchase
5,998,406
shares of Class A common stock were outstanding with a weighted average exercise price of
$9.42
per share and
3,456,172
shares of outstanding RSUs that may be settled for Class A common stock which were granted pursuant to the plan. As of
December 31, 2019
, we had
17,233,144
shares of Class A common stock available for future grant.
Stock-Based Compensation Expense
We used the following weighted-average assumptions in applying the Black-Scholes valuation model:
|
|
Years Ended
December 31, |
|||||
|
|
2019
|
2018
|
2017
|
|||
|
|
||||||
|
Risk-free interest rate
|
1.7% - 2.6%
|
2.5% - 3.1%
|
2.0% - 2.1%
|
|||
|
Expected term (years)
|
6.4 - 6.7
|
6.2 - 6.7
|
6.1 - 6.6
|
|||
|
Expected dividend yield
|
—
|
—
|
—
|
|||
|
Expected volatility
|
45.7% - 50.2%
|
52.4% - 56.1%
|
55.6% - 61.0%
|
|||
The following table summarizes the components of stock-based compensation expense in the consolidated statements of operations (in thousands):
|
|
Years Ended
December 31, |
|||||||||||
|
|
2019
|
2018
|
2017
|
|||||||||
|
As Restated
|
As Revised
|
|||||||||||
|
|
||||||||||||
|
Cost of revenue
|
$
|
45,429
|
|
$
|
29,680
|
|
$
|
6,355
|
|
|||
|
Research and development
|
40,949
|
|
39,029
|
|
5,560
|
|
||||||
|
Sales and marketing
|
32,478
|
|
32,284
|
|
4,685
|
|
||||||
|
General and administrative
|
77,435
|
|
67,489
|
|
12,501
|
|
||||||
|
$
|
196,291
|
|
$
|
168,482
|
|
$
|
29,101
|
|
||||
Stock-based Compensation -
During the years ended
December 31, 2019
,
2018
and
2017
, we recognized
$196.3 million
,
$168.5 million
and
$29.1 million
of total stock-based compensation costs, respectively. As of
December 31, 2019
,
2018
and
2017
, we capitalized
$7.3 million
,
$13.6 million
and
$1.8 million
of stock-based compensation cost, respectively, into inventory and property, plant and equipment.
145
Stock Option and RSU Activity
The following table summarizes the stock option activity under our stock plans during the reporting period (in thousands), except per share amounts:
|
|
Outstanding Options
|
||||||||||||
|
|
Number of
Shares |
Weighted
Average Exercise Price |
Remaining
Contractual Life (Years) |
Aggregate
Intrinsic Value |
|||||||||
|
|
|
|
(in thousands)
|
||||||||||
|
Balances at December 31, 2017
|
11,604,403
|
|
$
|
26.42
|
|
6.01
|
$
|
52,682
|
|
||||
|
Granted
|
4,202,284
|
|
19.79
|
|
|||||||||
|
Exercised
|
(398,704
|
)
|
3.98
|
|
|||||||||
|
Cancelled
|
(849,563
|
)
|
12.51
|
|
|||||||||
|
Balances at December 31, 2018
|
14,558,420
|
|
25.93
|
|
6.78
|
3,084
|
|
||||||
|
Granted
|
4,956,064
|
|
5.6
|
|
|||||||||
|
Exercised
|
(358,564
|
)
|
4.26
|
|
|||||||||
|
Cancelled
|
(1,318,604
|
)
|
25.33
|
|
|||||||||
|
Balances at December 31, 2019
|
17,837,316
|
|
20.76
|
|
6.94
|
14,964
|
|
||||||
|
Vested and expected to vest at December 31, 2019
|
17,159,824
|
|
21.17
|
|
6.85
|
13,471
|
|
||||||
|
Exercisable at December 31, 2019
|
9,161,918
|
|
28.82
|
|
4.89
|
500
|
|
||||||
Stock Options -
During the years ended
December 31, 2019
,
2018
and
2017
, we recognized
$36.2 million
,
$33.3 million
and
$29.2 million
of stock-based compensation costs for stock options, respectively.
During the years ended
December 31, 2019
,
2018
and
2017
, the intrinsic value of stock options exercised was
$2.6 million
,
$9.2 million
and
$3.4 million
, respectively.
We granted
4,956,064
options for Class A common stock during the year ended
December 31, 2019
and
4,202,284
options for Class A and Class B common stock during the year ended
December 31, 2018
. The weighted-average grant-date fair value of the awards was
$5.60
and $
19.79
, respectively.
As of
December 31, 2019
and
2018
, we had unrecognized compensation costs related to unvested stock options of
$41.9 million
and
$70.4 million
, respectively. This cost is expected to be recognized over the remaining weighted-average period of
2.8 years
and
2.8 years
, respectively. We had
no
excess tax benefits in the years ended
December 31, 2019
and
2018
. Cash received from stock options exercised totaled
$1.5 million
and
$1.6 million
for the years ended
December 31, 2019
and
2018
, respectively.
146
A summary of our RSUs activity and related information is as follows:
|
Number of
Awards
Outstanding
|
Weighted
Average Grant
Date Fair
Value
|
||||||
|
Unvested Balance at December 31, 2017
|
3,140,578
|
|
$
|
30.95
|
|
||
|
Granted
|
13,873,506
|
|
16.02
|
|
|||
|
Vested
|
(17,793
|
)
|
19.67
|
|
|||
|
Forfeited
|
(211,491
|
)
|
21.22
|
|
|||
|
Unvested Balance at December 31, 2018
|
16,784,800
|
|
18.74
|
|
|||
|
Granted
|
3,219,959
|
|
11.81
|
|
|||
|
Vested
|
(8,921,807
|
)
|
18.03
|
|
|||
|
Forfeited
|
(970,686
|
)
|
17.34
|
|
|||
|
Unvested Balance at December 31, 2019
|
10,112,266
|
|
17.29
|
|
|||
Restricted Stock Units (RSUs) -
The estimated fair value of RSU awards is based on the fair value of our common stock on the date of grant. The total weighted-average grant-date fair value of RSUs granted during the years ended
December 31, 2019
,
2018
and
2017
, was
$11.81
,
$16.02
and
$30.96
, respectively.
During the years ended
December 31, 2019
,
2018
and
2017
, we recognized
$141.3 million
,
$142.4 million
and
$1.3 million
of stock-based compensation costs for RSUs, respectively.
As of
December 31, 2019
, we had
$52.0 million
of unrecognized stock-based compensation cost related to unvested RSUs. This cost is expected to be recognized over a weighted average period of
1.1 years
. As of
December 31, 2018
, we had
$163.8 million
of unrecognized stock-based compensation cost related to unvested RSUs. This expense was expected to be recognized over a weighted average period of
0.8 years
.
The following table presents the stock activity and the total number of shares available for grant under our stock plans as of December 31, 2019:
|
|
Plan Shares Available
for Grant |
||
|
|
|
||
|
Balances at December 31, 2017
|
1,037,616
|
|
|
|
Added to plan
|
40,924,861
|
|
|
|
Granted
|
(18,075,790
|
)
|
|
|
Cancelled
|
1,061,054
|
|
|
|
Expired
|
(7,489,894
|
)
|
|
|
Balances at December 31, 2018
|
17,457,847
|
|
|
|
Added to plan
|
7,585,422
|
|
|
|
Granted
|
(8,176,023
|
)
|
|
|
Cancelled
|
2,289,290
|
|
|
|
Expired
|
(1,923,392
|
)
|
|
|
Balances at December 31, 2019
|
17,233,144
|
|
|
147
2018 Employee Stock Purchase Plan
In April 2018, we adopted the 2018 Employee Stock Purchase Plan ("ESPP"). The ESPP became effective upon our IPO
in July 2018
. The ESPP is intended to qualify under Section 423 of the Internal Revenue Code. The aggregate number of our shares that may be issued over the term of our ESPP is
33,333,333
Class A common stock. A total of
3,333,333 shares
of our Class A common stock were initially reserved for issuance under the plan. The number of shares reserved for issuance under our ESPP will increase automatically on the 1st day of January of each of the first
nine years
following the first offering date by the number of shares equal to
1%
of the total outstanding shares of our common stock and common stock equivalents as of the immediately preceding December 31 (rounded to the nearest whole share). For the year ended December 31, 2019, we added
1,415,507 shares
to the ESPP under these provisions.
The ESPP allows eligible employees to purchase shares, subject to purchase limits of
2,500
shares during each
six
month period or
$25,000
worth of stock for each calendar year, of our Class A common stock through payroll deductions at a price per share equal to
85%
of the lesser of the fair market value of our Class A common stock (i) on the first trading day of the applicable offering date and (ii) the last trading day of each purchase date.
During the years ended
December 31, 2019
and
2018
, we recognized
$10.3 million
and
$4.6 million
of stock-based compensation costs for the ESPP, respectively. We issued
1,718,433
shares in 2019 and there were
3,030,407
shares available for issuance under the ESPP as of December 31, 2019.
We use the Black-Scholes option pricing model to determine the fair value of shares purchased under the 2018 ESPP with the following weighted average assumptions on the date of grant:
|
|
Year Ended
December 31, |
||||
|
|
2019
|
2018
|
|||
|
|
|||||
|
Risk-free interest rate
|
1.5% - 2.6%
|
2.2% - 2.7%
|
|||
|
Expected term (years)
|
0.5 - 2.0
|
0.6 - 2.0
|
|||
|
Expected dividend yield
|
—
|
—
|
|||
|
Expected volatility
|
45.9% - 54.0%
|
47.0% - 52.7%
|
|||
2019 Executive Awards
In November 2019, the Board of Directors approved stock option awards ("2019 Executive Awards") to certain executive staff. The 2019 Executive Awards consist of three vesting tranches with a vesting schedule based on the attainment of market conditions and assuming continued employment and service through each vesting date.
Stock-based compensation costs associated with the 2019 Executive Awards is recognized over the service period, even though no tranches of the 2019 Performance Awards vest unless a market condition is achieved. The grant date fair value of the options is determined using a Monte Carlo simulation.
Employee Benefit Plan
We maintain a tax-qualified 401(k) retirement plan for all employees who satisfy certain eligibility requirements including requirements relating to age. Under the 401(k) plan, employees may elect to defer up to
60%
of eligible compensation, subject to applicable annual IRS Code limits. We do not match any contributions made by employees, including executives, but have the discretion to do so. Therefore, the costs of the plan were immaterial for the years ended December 31, 2019 and 2018. We intend for the 401(k) plan to qualify under Section 401(a) and 501(a) of the Internal Revenue Code so that contributions and income earned on contributions are not taxable to employees until withdrawn from the plan.
148
13. Power Purchase Agreement Programs
Overview
In mid-2010, we began offering our Energy Servers through our Bloom Electrons program, which we denote as Power Purchase Agreement Programs, financed via investment entities. Under these arrangements, an operating entity is created (the "Operating Company") which purchases our Energy Servers from us. The end customer then enters into a power purchase agreement ("PPA") with the Operating Company to purchase the power generated by our Energy Servers at a specified rate per kilowatt hour for a specified term which can range from
10
to
21
years. In some cases, similar to direct purchases and leases, the standard
one-year warranty
and performance guaranties are included in the price of the product. The Operating Company also enters into a master services agreement with us following the first year of service to extend the warranty services and guaranties over the term of the PPA. In other cases, the master services agreements including warranties and guaranties are billed on a quarterly basis starting in the first quarter following the placed-in-service date of the Energy Server(s) and continuing over the term of the PPA. The first of such arrangements was considered a sales-type lease and the product revenue from that agreement was recognized upfront in the same manner as direct purchase and lease transactions. Substantially all of our subsequent PPAs have been accounted for as operating leases with the related revenue under those agreements recognized ratably over the PPA term as electricity revenue. We recognize the cost of revenue, primarily product costs and maintenance service costs, over the shorter of the estimated useful life of the Energy Server or the term of the PPA.
We and our third-party equity investors (together "Equity Investors") contribute funds into a limited liability investment entity ("Investment Company") that owns and is parent to the Operating Company (together, the "PPA Entities"). These PPA Entities constitute variable investment entities ("VIEs") under U.S. GAAP. We have considered the provisions within the contractual agreements which grant us power to manage and make decisions affecting the operations of these VIEs. We consider that the rights granted to the Equity Investors under the contractual agreements are more protective in nature rather than participating. Therefore, we have determined under the power and benefits criterion of ASC 810 -
Consolidations
that
we are the primary beneficiary of these VIEs. As the primary beneficiary of these VIEs, we consolidate in our financial statements the financial position, results of operations and cash flows of the PPA Entities, and all intercompany balances and transactions between us and the PPA Entities are eliminated in the consolidated financial statements.
On June 14, 2019, we entered into a PPA II upgrade of Energy Servers transaction, and as a result we determined that we no longer retained a controlling interest in the Operating Company in PPA II and therefore, the Operating Company was no longer consolidated as a VIE into our consolidated financial statements as of June 30, 2019. See further discussion below. On November 27, 2019, we entered into a PPA IIIb upgrade of Energy Servers transaction where we bought out the equity interest of the third-party investor, decommissioned the Energy Servers in the Operating Company and sold new Energy Servers deployed at customer sites through our managed services financing option. The PPA IIIb Investment Company and Operating Company became wholly-owned by us but no longer met the definition of a VIE. However, we continue consolidating PPA IIIb in our consolidated financial statements. See further discussion below.
In accordance with our Power Purchase Agreement Programs, the Operating Company acquires Energy Servers from us for cash payments that are made on a similar schedule as if the Operating Company were a customer purchasing an Energy Server from us outright. In the consolidated financial statements, the sale of Energy Servers by us to the Operating Company are treated as intercompany transactions and as a result eliminated in consolidation. The acquisition of Energy Servers by the Operating Company is accounted for as a non-cash reclassification from inventory to Energy Servers within property, plant and equipment, net on our consolidated balance sheets. In arrangements qualifying for sales-type leases, we reduce these recorded assets by amounts received from U.S. Treasury Department cash grants and from similar state incentive rebates.
The Operating Company sells the electricity to end customers under PPAs. Cash generated by the electricity sales, as well as receipts from any applicable government incentive program, is used to pay operating expenses (including the management and services we provide to maintain the Energy Servers over the term of the PPA) and to service the non-recourse debt with the remaining cash flows distributed to the Equity Investors. In transactions accounted for as sales-type leases, we recognize subsequent customer billings as electricity revenue over the term of the PPA and amortize any applicable government incentive program grants as a reduction to depreciation expense of the Energy Server over the term of the PPA. In transactions accounted for as operating leases, we recognize subsequent customer payments and any applicable government incentive program grants as electricity revenue and service revenue over the term of the PPA.
Upon sale or liquidation of a PPA Entity, distributions would occur in the order of priority specified in the contractual agreements.
We have established
six
different PPA Entities to date. The contributed funds are restricted for use by the Operating Company to the purchase of our Energy Servers manufactured by us in our normal course of operations. All
six
PPA Entities utilized their entire available financing capacity and have completed the purchase of their Energy Servers. Any debt incurred by
149
the Operating Companies is non-recourse to us. Under these structures, each Investment Company is treated as a partnership for U.S. federal income tax purposes. Equity Investors receive investment tax credits and accelerated tax depreciation benefits. In 2016, we purchased the tax equity investor’s interest in PPA I, which resulted in a change in our ownership interest in PPA I while we continued to hold the controlling financial interest in this company. In 2019, we bought out the tax equity investors' interest in DSGH, the PPA II Investment Company, and admitted two new equity investors as a member of the PPA II Operating Company, retaining only a minor contingent future equity interest in the Operating Company. One of the new equity investors became the managing member which resulted in a change in our ownership interest in the Operating Company and discontinued our controlling financial interest in the PPA II Operating Company. In December 2019, we purchased the tax equity investors' interest in PPA IIIb, which resulted in a change in the ownership structure from a variable interest entity to a wholly owned subsidiary indirectly owned by the Company.
PPA II Upgrade of Energy Servers
Original Transaction
A wholly-owned subsidiary of Bloom and a wholly-owned subsidiary of Credit Suisse Group AG (“Mehetia”) jointly owned Diamond State Generation Holdings, LLC (“Class A Holdco”). Class A Holdco owned 100% of the membership interests in Diamond State Generation Partners, LLC ("DSGP"). Pursuant to an earlier transaction, DSGP owned and operated
30 megawatts
of Energy Servers across two sites in Delaware that achieved operations in 2012 and 2013 and provided alternative energy generation for state tariff rate payers (the “Original Project”). The Original Project had been financed in part by the issuance of non-recourse promissory notes to DSGP (the “Project Debt”).
Overall Upgrade
We upgraded the existing
30 megawatts
of Energy Servers used in the Original Project by replacing them with
27.5 megawatts
of new Energy Servers. To effect the full upgrade we repurchased all of existing Energy Servers, the proceeds of which were used by DSGP to pay down the Project Debt and to enable Class A Holdco to buy out Mehetia’s interests. To finance the new Energy Servers used in the upgrade, DSGP raised capital from two new members: SP Diamond State Class B Holdings, LLC (“Class B Holdco”), a wholly owned subsidiary of Southern Power Company (“Southern”) and Assured Guaranty Municipal Corporation (“Class C Holdco”). The existing Energy Servers were removed after we repurchased them from DSGP, prior to selling and installing the new Energy Servers. The upgrade was done across two phases.
First Upgrade
On
June 14, 2019
, the Company entered into an agreement committing to repurchase
30 megawatts
of existing Energy Servers. The repurchases happened over time in installments, in each case immediately prior to the installation of corresponding new Energy Servers. Mehetia’s equity interests were redeemed in part in connection with each repurchase. The Project Debt was repaid in connection with the first repurchase installment.
19 megawatts
of existing Energy Servers were repurchased during the second and third quarter of 2019.
At the same time that Bloom entered into the repurchase agreement, Class B Holdco committed to acquire a majority interest in DSGP. DSGP entered into an agreement governing the engineering, procurement, construction and sale of the new Energy Servers (the “EPC Agreement”). DSGP used the funds contributed by Class B Holdco to purchase
17.7 megawatts
of new Energy Servers from the Company in accordance with the EPC Agreement (the “First Upgrade”).
Second Upgrade
On
December 23, 2019
, we repurchased and removed the remaining
11 megawatts
of the existing older generation Energy Servers from DSGP. The proceeds of the repurchase were used to redeem Mehetia’s remaining equity interest in Class A Holdco. After the repurchase, the remaining existing Energy Servers were removed.
At the same time, to finance the purchase of
9.8 megawatts
of new Energy Servers, Class C Holdco was admitted to DSGP as a member of DSGP and DSGP entered into another EPC Agreement with the Company for the installation of the new Energy Servers. DSGP used the funds contributed by Class C Holdco to purchase the new Energy Servers from Bloom under the EPC Agreement (the “Second Upgrade”).
As of
December 31, 2019
, there are three members of DSGP: Class B Holdco which financed the First Upgrade, Class C Holdco, which financed the Second Upgrade, and Class A Holdco, an indirectly wholly owned subsidiary of the Company, which retains a de minimis contingent future equity interest in DSGP.
As of
December 31, 2019
,
27.5 megawatts
of new Energy Servers in Delaware were commissioned.
150
Commercial Documents
The Company also entered into an operations and maintenance agreement for the ongoing care of all of the new Energy Servers (the “O&M Agreement”). The operations and maintenance fees under the O&M Agreement are paid on a fixed dollar per kilowatt basis.
The terms and conditions of the EPC Agreement and the O&M Agreement, including the suite of guaranties and warranties provided with respect to the performance of the Energy Servers are customary for our transactions of this type. The performance related guaranty and warranty were provided for each investor’s Energy Servers, while the efficiency guaranties and warranties were measured across the entire
27.5 megawatts
of Energy Servers.
Credit Support
In the First Upgrade, in addition to standard indemnifications, we agreed to indemnify Class B Holdco for (i) losses incurred in the event of certain regulatory, legal, or legislative developments in connection with the Tariff capped at an aggregate amount of
$97.2 million
, which cap steps down each year until it is an amount equal to
zero
after June 30, 2025 and (ii) for the loss of certain federal tax benefits, up to
$7.5 million
. We posted letters of credit as credit support for both indemnities (“Class B Credit Support”).
In the Second Upgrade, in addition to standard indemnifications, we agreed to indemnify Class C Holdco for (i) losses incurred in the event of certain regulatory, legal, or legislative developments in connection with the Tariff capped at an aggregate amount of
$45 million
, which cap steps down each year until it is an amount equal to
zero
after December, 2025. We also indemnified Class C Holdco for the loss of certain federal tax benefits, losses incurred as a result of certain environmental risks and certain failures under the O&M Agreement with respect to the Energy Servers it financed. We amended the initial Class B Credit Support letter of credits and reissued a single letter of credit for the benefit of DSGP (“DSGP Credit Support”) in an amount of
$108.7 million
which amount will decrease over time. The DSGP Credit Support partially collateralizes our indemnity obligations to Class B Holdco and Class C Holdco. We expect the DSGP Credit Support to be extinguished by 2025.
At the time of the First Upgrade and the Second Upgrade, and as of December 31, 2019, we believe the events giving rise to these indemnifications to be remote and, therefore, no liability has been recorded in our consolidated financial statements with respect thereto.
Impact of First Upgrade and Second Upgrade of Energy Servers on Consolidated Financial Statements
As a result of the First Upgrade, we reconsidered whether we should continue to consolidate DSGP. We use a qualitative approach in assessing the consolidation requirement for each of our PPA Entities. This approach focuses on determining whether we have the power to direct those activities of the PPA Entities that most significantly affect their economic performance and whether we have the obligation to absorb losses, or the right to receive benefits, that could potentially be significant to the PPA Entities. We determined that we no longer retain a controlling interest in DSGP and therefore it will no longer be consolidated as a variable interest entity into our consolidated financial statements as of June 30, 2019. The First Upgrade and Second Upgrade resulted in the following impacts on our consolidated balance sheet as of
December 31, 2019
: (i) cash, cash equivalents and restricted cash increased by
$113.9 million
, of which
$108.7 million
is included in restricted cash. The increase is comprised of approximately
$253.9 million
cash receipts for the sale of
27.5 megawatts
new systems to DSGP, offset by
$83.5 million
used for the repayment of project debt including
$77.6 million
of outstanding principal and interest, as well as a make-whole payment fee of
$5.9 million
, and
$56.5 million
distribution to Mehetia related to the redemption of noncontrolling interest; (ii) property, plant and equipment, net decreased by
$75.1 million
due to the depreciation and write-off of
30 megawatts
of existing Energy Servers; (iii) noncontrolling interest in Mehetia went down by
$56.5 million
related to the First Upgrade and Second Upgrade.
Impacts on our consolidated statement of operations for the year ended
December 31, 2019
are summarized as follows: (i) net product and installation revenue recognized of
$223.9 million
, as the result of selling
27.5 megawatts
of new Energy Servers to DSGP; (ii) cost of revenue of
$153.5 million
including both the write-off of decommissioned Energy Systems
$52.5 million
, accelerated depreciation of
$22.6 million
of the Energy Servers prior to decommissioning, and the cost of new Energy Servers of
$78.4 million
; (iii)
$5.9 million
of administrative costs due to debt payoff make-whole expense; and (iv)
$1.2 million
of interest expense due to write-off of debt issuance cost.
Impacts on our consolidated statements of cash flows for the year ended
December 31, 2019
are summarized as follows: net cash used by financing activities increased
$139.2 million
due to the repayment of debt of
$76.8 million
, a debt make-whole payment of
$5.9 million
, and payments to noncontrolling and redeemable noncontrolling interests of
$56.5 million
.
151
PPA IIIb Upgrade of Energy Servers
Transaction Overview
As part of the PPA IIIb project established in 2013, the Company, through a special purpose subsidiary (the “Project Company”), had previously entered into certain agreements for the purpose of developing, financing, owning, operating, maintaining and managing a portfolio of
5.4 megawatts
of Energy Servers.
On November 27, 2019, the Company entered into certain agreements through a wholly-owned subsidiary to (i) buy out the existing debt and equity investors in Project Company such that Project Company became indirectly wholly-owned by the Company, and (ii) upgrade
5.4 megawatts
of the existing Energy Servers owned and managed by Project Company by selling and installing new Energy Servers.
Immediately following the buyout, Project Company repaid all outstanding loans and indebtedness to Project Company’s lenders in the approximate amount of
$24.2 million
plus swap breakage costs estimated at approximately
$0.2 million
, and terminated its agreements, including related liens on Project Company assets, with such lenders. Project Company subsequently entered into a sale-leaseback transaction under our Managed Services Program with Key Equipment Finance, a division of KeyBank National Association, a national banking association (“KeyBank”), to finance the upgrade of the PPA IIIb project Energy Servers, pursuant to which KeyBank will own the assets and Bloom will service them. The sale-leaseback transaction is subject to Bloom’s standard warranties and guaranties.
Previously, the Company had financed multiple Energy Servers with KeyBank by entering into sale-leaseback transactions. As of
December 31, 2019
, KeyBank has financed approximately
39.9 megawatts
of Energy Servers.
$20.0 million
of the proceeds from the current upgrade financing has been pledged for a seven-year period to secure the Company's operations and maintenance obligations with respect to the totality of the Company's obligations to KeyBank. All or a portion of such funds would be released if we meets certain credit rating and/or market capitalization milestones prior to the end of the pledge period. If the Company does not meet the required criteria within a five-year period, the funds would be released over the following two years as long as the Energy Servers continue to perform in compliance with their warranties.
As of
December 31, 2019
,
5 megawatts
of the PPA IIIb project have been decommissioned and written-off by us, with the remaining
0.4 megawatts
located at one site decommissioned during the first quarter of 2020. As of December 31, 2019, we have sold and deployed
5 megawatts
of new Energy Servers to the PPA IIIb project, bought out the original PPA IIIb investor, and have paid off the outstanding debt related to the original PPA IIIb project.
Obligations to the PPA IIIb Financiers
We have restricted cash of
$20.0 million
of the proceeds from the phase two upgrade financing which has been pledged for a seven-year period to secure our operations and maintenance obligations with respect to the totality of our obligations to KeyBank. All or a portion of such funds would be released if we meet certain credit rating and/or market capitalization milestones prior to the end of the pledge period. If we do not meet the required criteria within a five-year period, the funds would be released to us over the following two years as long as the Energy Servers continue to perform in compliance with their warranties.
Impact of PPA IIIb Upgrade of Energy Servers on Consolidated Financial Statements
The PPA IIIb upgrade was executed and mostly completed during December 2019, resulting in the following summarized impacts on our consolidated balance sheet as of
December 31, 2019
: (i) cash, cash equivalents and restricted cash increased by
$25.2 million
, mainly due to
$52.0 million
received from the financing of new Energy Servers, offset by debt and interest settlement of
$24.4 million
, and equity buyout of
$2.4 million
; (ii) other assets decreased
$14.6 million
primarily due to customer financing lease receivable write-off of
$11.3 million
associated with
1.6 megawatts
of old Energy Servers and decommissioning and write-off costs of
$18.0 million
associated with
3.4 megawatts
of old Energy Servers, offset by
$14.7 million
increase in property, plant and equipment due to
5 megawatts
of new Energy Servers; (iii) liabilities increased by
$28 million
due to
$51.9 million
lease liability for new Energy Servers of the Managed Services Program, offset by
$23.9 million
decrease due to the settlement of all outstanding debt; and (iv) the payment of a deemed dividend to the investor of
$2.4 million
.
Impacts on our consolidated statement of operations for the year ended
December 31, 2019
are summarized as follows: (i)
$11.3 million
decrease in revenue due to the write-off of the customer financing lease receivable; (ii) an increase in cost of revenue of
$19.7 million
primarily due to the write-off of decommissioned operating lease Energy Servers of
$18.0 million
and
152
accelerated depreciation of
$1.7 million
; and (iii) administrative costs of
$1.8 million
primarily due to the write-off of production insurance expense on the decommissioned Energy Servers.
Impacts on our consolidated statement of cash flows for the year ended
December 31, 2019
are summarized as follows: net cash used by financing activities increased
$26.3 million
due to the repayment of debt principal of
$23.9 million
and the payment of a deemed dividend to the investor of
$2.4 million
.
PPA Entities' Activities Summary
The table below shows the details of the five Investment Companies' VIEs that were active during 2019 and their cumulative activities from inception to the periods indicated (dollars in thousands):
|
PPA II
|
PPA IIIa
|
PPA IIIb
|
PPA IV
|
PPA V
|
||||||||||||||||
|
Overview:
|
||||||||||||||||||||
|
Maximum size of installation (in megawatts)
|
30
|
10
|
6
|
21
|
40
|
|||||||||||||||
|
Installed size (in megawatts)
1
|
—
|
10
|
—
|
19
|
37
|
|||||||||||||||
|
Term of power purchase agreements (in years)
|
21
|
15
|
15
|
15
|
15
|
|||||||||||||||
|
First system installed
|
Jun-12
|
Feb-13
|
Aug-13
|
Sep-14
|
Jun-15
|
|||||||||||||||
|
Last system installed
|
Nov-13
|
Jun-14
|
Jun-15
|
Mar-16
|
Dec-16
|
|||||||||||||||
|
Income (loss) and tax benefits allocation to Equity Investor
|
99%
|
99%
|
99%
|
90%
|
99%
|
|||||||||||||||
|
Cash allocation to Equity Investor
|
99%
|
99%
|
99%
|
90%
|
90%
|
|||||||||||||||
|
Income (loss), tax and cash allocations to Equity Investor after the flip date
|
5%
|
5%
|
5%
|
No flip
|
No flip
|
|||||||||||||||
|
Variable Investment Entity termination
|
June
2019
|
N/A
|
November 2019
|
N/A
|
N/A
|
|||||||||||||||
|
Equity Investor
2
|
N/A
|
US Bank
|
N/A
|
Exelon Corporation
|
Exelon Corporation
|
|||||||||||||||
|
Put option date
3
|
N/A
|
1st anniversary of flip point
|
N/A
|
N/A
|
N/A
|
|||||||||||||||
|
Company cash contributions
|
$
|
22,442
|
|
$
|
32,223
|
|
$
|
22,658
|
|
$
|
11,669
|
|
$
|
27,932
|
|
|||||
|
Company non-cash contributions
4
|
$
|
—
|
|
$
|
8,655
|
|
$
|
2,082
|
|
$
|
—
|
|
$
|
—
|
|
|||||
|
Equity Investor cash contributions
|
$
|
139,993
|
|
$
|
36,967
|
|
$
|
20,152
|
|
$
|
84,782
|
|
$
|
227,344
|
|
|||||
|
Debt financing
|
$
|
144,813
|
|
$
|
44,968
|
|
$
|
28,676
|
|
$
|
99,000
|
|
$
|
131,237
|
|
|||||
|
Activity as of December 31, 2019:
|
||||||||||||||||||||
|
Distributions to Equity Investor
|
$
|
176,364
|
|
$
|
4,803
|
|
$
|
4,462
|
|
$
|
6,692
|
|
$
|
70,591
|
|
|||||
|
Debt repayment—principal
|
$
|
144,813
|
|
$
|
6,631
|
|
$
|
28,676
|
|
$
|
18,012
|
|
$
|
9,453
|
|
|||||
|
Activity as of December 31, 2018:
|
||||||||||||||||||||
|
Distributions to Equity Investor
|
$
|
116,942
|
|
$
|
4,063
|
|
$
|
1,807
|
|
$
|
4,568
|
|
$
|
66,745
|
|
|||||
|
Debt repayment—principal
|
$
|
65,114
|
|
$
|
4,431
|
|
$
|
3,953
|
|
$
|
15,543
|
|
$
|
5,780
|
|
|||||
|
Activity as of December 31, 2017:
|
||||||||||||||||||||
|
Distributions to Equity Investor
|
$
|
111,296
|
|
$
|
3,324
|
|
$
|
1,404
|
|
$
|
2,565
|
|
$
|
60,286
|
|
|||||
|
Debt repayment—principal
|
$
|
53,726
|
|
$
|
3,041
|
|
$
|
3,077
|
|
$
|
13,697
|
|
$
|
2,834
|
|
|||||
|
1
Installed base decreased from December 31, 2018 due to the repurchase of 36 megawatts of our Energy Servers during 2019 under the PPA II and PPA IIIb upgrade of Energy Servers. See disclosures above.
|
||||||||||||||||||||
|
2
Investor name represents ultimate parent of subsidiary financing the project.
|
||||||||||||||||||||
|
3
Investor right on the certain date, upon giving us advance written notice, to sell the membership interests to us or resign or withdraw from the investment partnership.
|
||||||||||||||||||||
|
4
Non-cash contributions consisted of warrants that were issued by us to respective lenders to each PPA Entity, as required by such entity’s credit agreements. The corresponding values are amortized using the effective interest method over the debt term.
|
||||||||||||||||||||
Some of our PPA Entities contain structured provisions whereby the allocation of income and equity to the Equity Investors changes at some point in time after the formation of the PPA Entity. The change in allocations to Equity Investors (or the "flip") occurs based either on a specified future date or once the Equity Investors reaches its targeted rate of return. For PPA Entities with a specified future date for the flip, the flip occurs January 1 of the calendar year immediately following the year that includes the fifth anniversary of the date the last site achieves commercial operation.
The noncontrolling interests in PPA IIIa are redeemable as a result of the put option held by the Equity Investors as of
December 31, 2019
. The noncontrolling interests in PPA II, IIIa and PPA IIIb were redeemable as a result of the put option held
153
by the Equity Investors as of December 31, 2018. The redemption value is the put amount. At
December 31, 2019
, and
2018
, the carrying value of redeemable noncontrolling interests of
$0.4 million
and
$57.3 million
, respectively, exceeded the maximum redemption value.
PPA Entities’ Aggregate Assets and Liabilities
Generally, Operating Company assets can be used to settle only the Operating Company obligations and Operating Company creditors do not have recourse to us. The aggregate carrying values of our VIEs for their assets and liabilities in our consolidated balance sheets, after eliminations of intercompany transactions and balances, were as follows (in thousands):
|
December 31,
|
||||||||
|
|
2019
1
|
2018
2
|
||||||
|
|
|
|
||||||
|
Assets
|
||||||||
|
Current assets:
|
||||||||
|
Cash and cash equivalents
|
$
|
1,894
|
|
$
|
5,295
|
|
||
|
Restricted cash
|
2,244
|
|
2,917
|
|
||||
|
Accounts receivable
|
4,194
|
|
7,516
|
|
||||
|
Customer financing receivable
|
5,108
|
|
5,594
|
|
||||
|
Prepaid expenses and other current assets
|
3,587
|
|
4,909
|
|
||||
|
Total current assets
|
17,027
|
|
26,231
|
|
||||
|
Property and equipment, net
|
275,481
|
|
399,060
|
|
||||
|
Customer financing receivable, non-current
|
50,747
|
|
67,082
|
|
||||
|
Restricted cash
|
15,045
|
|
27,854
|
|
||||
|
Other long-term assets
|
607
|
|
2,692
|
|
||||
|
Total assets
|
$
|
358,907
|
|
$
|
522,919
|
|
||
|
Liabilities
|
||||||||
|
Current liabilities:
|
||||||||
|
Accounts payable
|
$
|
—
|
|
$
|
724
|
|
||
|
Accrued expenses and other current liabilities
|
1,391
|
|
1,442
|
|
||||
|
Deferred revenue and customer deposits
|
662
|
|
786
|
|
||||
|
Current portion of debt
|
12,155
|
|
21,162
|
|
||||
|
Total current liabilities
|
14,208
|
|
24,114
|
|
||||
|
Derivative liabilities
|
8,459
|
|
3,626
|
|
||||
|
Deferred revenue
|
6,735
|
|
8,696
|
|
||||
|
Long-term portion of debt
|
223,267
|
|
323,360
|
|
||||
|
Other long-term liabilities
|
2,355
|
|
1,798
|
|
||||
|
Total liabilities
|
$
|
255,024
|
|
$
|
361,594
|
|
||
1
These amounts include our VIEs: PPA IIIa, PPA IV and PPA V.
2
These amounts include our VIEs: PPA II, PPA IIIa, PPA IIIb, PPA IV and PPA V.
As stated above, we are a minority shareholder in the PPA Entities for the administration of our Bloom Electrons program. PPA Entities contain debt that is non-recourse to us. The PPA Entities also own Energy Server assets for which we do not have title. Although we will continue to have Power Purchase Agreement Program entities in the future and offer customers the ability to purchase electricity without the purchase of our Energy Servers, we do not intend to be a minority investor in any new Power Purchase Agreement Program entities.
154
We believe that by presenting assets and liabilities separate from the PPA Entities, we provide a better view of the true operations of our core business. The table below provides detail into the assets and liabilities of Bloom Energy separate from the PPA Entities. The following table shows Bloom Energy's stand-alone, the PPA Entities combined and these consolidated balances as of
December 31, 2019
, and
December 31, 2018
(in thousands):
|
|
December 31, 2019
|
December 31, 2018
|
||||||||||||||||||||||
|
|
Bloom Energy
|
PPA Entities
|
Consolidated
|
Bloom Energy
|
PPA Entities
|
Consolidated
|
||||||||||||||||||
|
As Restated
|
As Restated
|
|||||||||||||||||||||||
|
Assets
|
||||||||||||||||||||||||
|
Current assets
|
$
|
455,680
|
|
$
|
17,027
|
|
$
|
472,707
|
|
$
|
637,703
|
|
$
|
26,231
|
|
$
|
663,934
|
|
||||||
|
Long-term assets
|
508,004
|
|
341,880
|
|
849,884
|
|
361,172
|
|
496,688
|
|
857,860
|
|
||||||||||||
|
Total assets
|
$
|
963,684
|
|
$
|
358,907
|
|
$
|
1,322,591
|
|
$
|
998,875
|
|
$
|
522,919
|
|
$
|
1,521,794
|
|
||||||
|
Liabilities
|
||||||||||||||||||||||||
|
Current liabilities
|
$
|
234,328
|
|
$
|
2,053
|
|
$
|
236,381
|
|
$
|
224,503
|
|
$
|
2,952
|
|
$
|
227,455
|
|
||||||
|
Current portion of debt
|
325,428
|
|
12,155
|
|
337,583
|
|
8,686
|
|
21,162
|
|
29,848
|
|
||||||||||||
|
Long-term liabilities
|
599,709
|
|
17,549
|
|
617,258
|
|
499,177
|
|
14,120
|
|
513,297
|
|
||||||||||||
|
Long-term portion of debt
|
75,962
|
|
223,267
|
|
299,229
|
|
388,073
|
|
323,360
|
|
711,433
|
|
||||||||||||
|
Total liabilities
|
$
|
1,235,427
|
|
$
|
255,024
|
|
$
|
1,490,451
|
|
$
|
1,120,439
|
|
$
|
361,594
|
|
$
|
1,482,033
|
|
||||||
14. Commitments and Contingencies
Commitments
Facilities Leases
We lease most of our facilities, office buildings and equipment under operating leases that expire at various dates through December 2028. Our lease for our former corporate offices in Sunnyvale, California expired in December 2018. We entered into a lease for our corporate headquarters located in San Jose, California, for
181,000
square feet of office space commencing January 2019 and expiring in December 2028. Our headquarters is used for administration, research and development and sales and marketing.
Additionally, we lease various manufacturing facilities in Sunnyvale, California and Mountain View, California. Our current lease for our Sunnyvale manufacturing facilities, entered into in April 2005, expires in 2020. Our current lease for our manufacturing facilities at Mountain View, entered into in December 2011, expired in December 2019 and is extended on a month to month arrangement. These plants together comprise approximately
281,265
square feet of space. We lease additional office space as field offices in the United States and around the world including in India, the Republic of Korea, China and Taiwan.
During the years ended
December 31, 2019
,
2018
and
2017
, rent expense for all occupied facilities was
$7.8 million
,
$6.3 million
and
$5.2 million
, respectively.
Equipment Leases
Beginning in December 2015, we are a party to master lease agreements that provide for the sale of our Energy Servers to third parties and the simultaneous leaseback of the systems which we then sublease to customers. The lease agreements expire on various dates through 2025 and there was no recorded rent expense for the years ended
December 31, 2019
,
2018
and
2017
.
155
At
December 31, 2019
, future minimum lease payments under operating leases and financing obligations were as follows (in thousands):
|
Operating Leases Obligations
|
Financing Obligations
|
Sublease Payments
1
|
|||||||||
|
2020
|
$
|
7,250
|
|
$
|
37,840
|
|
$
|
(37,840
|
)
|
||
|
2021
|
5,495
|
|
38,726
|
|
(38,726
|
)
|
|||||
|
2022
|
4,168
|
|
39,680
|
|
(39,680
|
)
|
|||||
|
2023
|
4,230
|
|
40,582
|
|
(40,582
|
)
|
|||||
|
2024
|
4,357
|
|
38,442
|
|
(38,442
|
)
|
|||||
|
Thereafter
|
17,913
|
|
117,592
|
|
(117,592
|
)
|
|||||
|
Total lease payments
|
$
|
43,413
|
|
312,862
|
|
$
|
(312,862
|
)
|
|||
|
Less: imputed interest
|
(184,184
|
)
|
|
||||||||
|
Total lease obligations
|
128,678
|
|
|
||||||||
|
Less: current obligations
|
(10,993
|
)
|
|
||||||||
|
Long-term lease obligations
|
$
|
117,685
|
|
|
|||||||
1
Sublease Payments primarily represents the fees received by the bank from our end customer for the electricity generated by our Energy Servers leased under our Managed Services and other similar arrangements, which also pay down our financing obligation to the bank.
Managed Services Financing Obligations -
Our managed services arrangements are classified as capital leases and are recorded as financing transactions, while the sublease arrangements with the end customer are classified as operating leases. Payments received from the financier are recorded as financing obligations. These obligations are included in each agreements' contract value and are recorded as short-term or long-term liabilities based on the estimated payment dates. The long-term financing obligations were
$446.2 million
and
$385.6 million
as of
December 31, 2019
and
2018
, respectively. The difference between these obligations and the principal obligations in the table above will be offset against the carrying value of the related Energy Servers at the end of the lease and the remainder recognized as a gain at that point. We recognize revenue for the electricity generated by allocating the total proceeds of the sublease payments based on the relative standalone selling prices to electricity revenue and to service revenue.
Purchase Commitments with Suppliers and Contract Manufacturers -
In order to reduce manufacturing lead-times and to ensure an adequate supply of inventories, we have agreements with our component suppliers and contract manufacturers to allow long lead-time component inventory procurement based on a rolling production forecast. We are contractually obligated to purchase long lead-time component inventory procured by certain manufacturers in accordance with its forecasts. We can generally give notice of order cancellation at least 90 days prior to the delivery date. However, we issue purchase orders to our component suppliers and third-party manufacturers that may not be cancelable. As of
December 31, 2019
and
2018
, we had no material open purchase orders with our component suppliers and third-party manufacturers that are not cancelable.
Power Purchase Agreement Program -
Under the terms of the Bloom Electrons program (see Note 13,
Power Purchase Agreement Programs
), customers agree to purchase power from our Energy Servers at negotiated rates, generally for periods of up to twenty-one years. We are responsible for all operating costs necessary to maintain, monitor and repair the Energy Servers, including the fuel necessary to operate the systems under certain PPA contracts. The risk associated with the future market price of fuel purchase obligations is mitigated with commodity contract futures.
The PPA Entities guarantee the performance of Energy Servers at certain levels of output and efficiency to its customers over the contractual term. The PPA Entities monitor the need for any accruals arising from such guaranties, which are calculated as the difference between committed and actual power output or between natural gas consumption at warranted efficiency levels and actual consumption, multiplied by the contractual rates with the customer. Amounts payable under these guaranties are accrued in periods when the guaranties are not met and are recorded in cost of service revenue in the consolidated statements of operations. We paid
$3.5 million
,
$0.9 million
and
$3.7 million
for the years ended
December 31, 2019
,
2018
and
2017
, respectively.
In June 2015, PPA V entered into a
$131.2 million
credit agreement to fund the purchase and installation of our Energy Servers. The lenders have commitments to a letter of credit ("LC") facility with the aggregate principal amount of
$6.2 million
. The LC facility is to fund the Debt Service Reserve Account. The amount reserved under the LC as of
December 31, 2019
and
2018
was
$5.0 million
and
$5.0 million
, respectively.
156
In 2019, pursuant to the PPA II upgrade of Energy Servers, we agreed to indemnify SPDS for losses that may be incurred in the event of certain regulatory, legal or legislative development and established a cash-collateralized letter of credit for this purpose. As of
December 31, 2019
, the balance of this cash-collateralized letter of credit was
$108.7 million
.
In 2019, pursuant to the PPA IIIb upgrade of Energy Servers, we have restricted cash of
$20.0 million
which has been pledged for a seven-year period to secure our operations and maintenance obligations with respect to the totality of our obligations to the financier. All or a portion of such funds would be released if we meet certain credit rating and/or market capitalization milestones prior to the end of the pledge period. If we do not meet the required criteria within the first five-year period, the funds would still be released to us over the following two years as long as the Energy Servers continue to perform in compliance with our warranty obligations.
Contingencies
Indemnification Agreements -
We enter into standard indemnification agreements with our customers and certain other business partners in the ordinary course of business. Our exposure under these agreements is unknown because it involves future claims that may be made against us but have not yet been made. To date, we have not paid any claims or been required to defend any action related to our indemnification obligations. However, we may record charges in the future as a result of these indemnification obligations.
Delaware Economic Development Authority -
In March 2012, we entered into an agreement with the Delaware Economic Development Authority to provide a grant of
$16.5 million
as an incentive to establish a new manufacturing facility in Delaware and to provide employment for full time workers at the facility over a certain period of time. The grant contains two types of milestones that we must complete to retain the entire amount of the grant proceeds. The first milestone was to provide employment for
900
full time workers in Delaware by the end of the first recapture period of
September 30, 2017
. The second milestone was to pay these full-time workers a cumulative total of
$108.0 million
in compensation by
September 30, 2017
. There are two additional recapture periods at which time we must continue to employ
900
full time workers and the cumulative total compensation paid by us is required to be at least
$324.0 million
by
September 30, 2023
. As of
December 31, 2019
, we had
323
full time workers in Delaware and paid
$120.1 million
in cumulative compensation. As of
December 31, 2018
, we had
335
full time workers in Delaware and paid
$92.0 million
in cumulative compensation. We have so far received
$12.0 million
of the grant which is contingent upon meeting the milestones through
September 30, 2023
. In the event that we do not meet the milestones, we may have to repay the Delaware Economic Development Authority, including up to
$3.1 million
on
September 30, 2021
and up to an additional
$2.5 million
on
September 30, 2023
. As of
December 31, 2019
, we paid
$1.5 million
for recapture provisions and have recorded
$10.5 million
in other long-term liabilities for potential recapture.
Self-Generation Incentive Program
("SGIP")
-
Our PPA Entities’ customers receive payments under the SGIP which is a program specific to the State of California that provides financial incentives for the installation of qualifying new self-generation equipment that we own. The SGIP program issues
50%
of the fully anticipated amount in the first year the equipment is placed into service. The remaining incentive is then paid based on the size of the equipment (i.e., nameplate kilowatt capacity) over the subsequent
five years
.
The SGIP program has operational criteria primarily related to fuel mixture and minimum output for the first five years after the qualified equipment is placed in service. If the operational criteria are not fulfilled, it could result in a partial refund of funds received. However, for certain PPA Entities, we make SGIP reservations on behalf of the PPA Entity and, therefore, the PPA Entity bears the risk of loss if these funds are not paid.
Investment Tax Credits
("ITCs")
-
Our Energy Servers are eligible for federal ITCs that accrued to qualified property under Internal Revenue Code Section 48 when placed into service. However, the ITC program has operational criteria that extend for five years. If the energy property is disposed or otherwise ceases to be qualified investment credit property before the close of the five year recapture period is fulfilled, it could result in a partial reduction of the incentives. Ours purchase of Energy Servers were by the PPA Entities and, therefore, the PPA Entities bear the risk of repayment if the assets placed in service do not meet the ITC operational criteria in the future.
Legal Matters -
From time to time, we are involved in disputes, claims, litigation, investigations, proceedings and/or other legal actions consisting of commercial, securities and employment matters that arise in the ordinary course of business. We review all legal matters at least quarterly and assesses whether an accrual for loss contingencies needs to be recorded. The assessment reflects the impact of negotiations, settlements, rulings, advice of legal counsel and other information and events pertaining to a particular situation. We record an accrual for loss contingencies when management believes that it is both probable that a liability has been incurred and the amount of the loss can be reasonably estimated. Legal matters are subject to uncertainties and are inherently unpredictable, so the actual liability in any such matters may be materially different from our estimates. If an unfavorable resolution were to occur, there exists the possibility of a material adverse impact on our consolidated financial condition, results of operations or cash flows for the period in which the resolution occurs or on future periods.
157
In July 2018, two former executives of Advanced Equities, Inc., Keith Daubenspeck and Dwight Badger, filed a Statement of Claim with the American Arbitration Association in Santa Clara, CA, against us, Kleiner Perkins, Caufield & Byers, LLC (“KPCB”), New Enterprise Associates, LLC (“NEA”) and affiliated entities of both KPCB and NEA seeking to compel arbitration and alleging a breach of a confidential agreement executed between the parties on June 27, 2014 (the “Confidential Agreement”). On May 7, 2019, KPCB and NEA were dismissed with prejudice. On June 15, 2019, a Second Amended Statement of Claim was filed against us alleging securities fraud, fraudulent inducement, a breach of the Confidential Agreement, and violation of the California unfair competition law. On July 16, 2019, we filed our Answering Statement and Affirmative Defenses. On September 27, 2019, we filed a motion to dismiss the Statement of Claim. On March 24, 2020, the Tribunal denied our motion to dismiss in part, and ordered that Claimant’s relief is limited to rescission of the Confidential Agreement or remedies consistent with rescission, and not expectation damages. We do not believe Claimant’s claims supporting rescission have merit nor that Claimants can remit to us the monetary benefits they already obtained under the Confidential Agreement. We have recorded no loss contingency related to this claim.
In June 2019, Messrs. Daubenspeck and Badger filed a complaint against our CEO, our CFO and our former CFO in the United States District Court for the Northern District of Illinois, Case No. 1:19-cv-04305, asserting nearly identical claims as those in the pending arbitration discussed above. The lawsuit has been stayed pending the outcome of the arbitration. We believe the complaint to be without merit and, as a result, we have recorded no loss contingency related to this claim.
In March 2019, the Lincolnshire Police Pension Fund filed a class action complaint in the Superior Court of the State of California, County of Santa Clara, against us, certain members of our senior management, certain of our directors and the underwriters in our initial public offering alleging violations under Sections 11 and 15 of the Securities Act of 1933, as amended, for alleged misleading statements or omissions in our Form S-1 Registration Statement filed with the Securities and Exchange Commission in connection with our July 25, 2018 initial public offering. Two related class action cases were subsequently filed in the Santa Clara County Superior Court against the same defendants containing the same allegations; Rodriquez vs Bloom Energy et al. was filed on April 22, 2019 and Evans vs Bloom Energy et al. was filed on May 7, 2019. These cases have been consolidated. Plaintiffs' Consolidated Amended Complaint was filed with the court on September 12, 2019. On October 4, 2019, defendants moved to stay the lawsuit pending the federal district court action discussed below. On December 7, 2019, the Superior Court issued an order staying the action through resolution of the parallel federal litigation mentioned below. We believe the complaint to be without merit and we intend to vigorously defend.
In May 2019, Elissa Roberts filed a class action complaint in the federal district court for the Northern District of California against us, certain members of our senior management team, and certain of our directors alleging violations under Section 11 and 15 of the Securities Act of 1933, as amended, for alleged misleading statements or omissions in our Form S-1 Registration Statement filed with the Securities and Exchange Commission in connection with our July 25, 2018 initial public offering. On September 3, 2019, James Hunt was appointed as lead plaintiff and Levi & Korsinsky was appointed as plaintiff’s counsel. On November 4, 2019, plaintiffs filed an amended complaint adding the underwriters in our initial public offering, claims under Sections 10b and 20a of the Securities Exchange Act of 1934 and extending the class period to September 16, 2019. We believe the complaint to be without merit and we intend to vigorously defend.
In November 2019, Michael Bolouri filed a class action complaint in the federal district court for the Northern District of California against us, certain members of our senior management, certain of our directors and the underwriters in our initial public offering, alleging violations under Section 11 and 15 of the Securities Act of 1933, as amended, and violations under Sections 10b and 20a of the Securities Exchange Act of 1934 for alleged misleading statements or omissions in our Form S-1 Registration Statement filed with the Securities and Exchange Commission in connection with our July 25, 2018 initial public offering and continuing through September 16, 2019. On December 11, 2019, a notice of voluntary dismissal was filed by the plaintiff and the case has now been dismissed.
I
n September 2019, we received a books and records demand from purported Company stockholder Dennis Jacob (“Jacob Demand”). The Jacob Demand cites allegations from the September 17, 2019 report prepared by admitted short seller Hindenburg Research. In November 2019, we received a substantially similar books and records demand from the same law firm on behalf of purported Company stockholder Michael Bolouri (“Bolouri Demand” and, together with the Jacob Demand, the “Demands”). On January 13, 2020, Messrs. Jacob and Bolouri filed a complaint in the Delaware Court of Chancery to enforce the Demands in the matter styled
Jacob v. Bloom Energy Corp.
, C.A. No. 2020-0023-JRS. On March 9, 2020, Messrs. Jacob and Bolouri filed an amended complaint in the Delaware Court of Chancery to add allegations regarding the restatement.
In March 2020, Francisco Sanchez filed a class action complaint in Santa Clara County Superior Court against us alleging certain wage and hour violations under the California Labor Code and Industrial Welfare Commission Wage Orders and that we engaged in unfair business practices under the California Business and Professions Code. We are still investigating the allegations but believe the complaint to be without merit and, as a result, we have recorded no loss contingency related to this claim.
158
15. Segment Information
Segment and the Chief Operating Decision Maker
Our chief operating decision makers ("CODMs"), our Chief Executive Officer and the Chief Financial Officer, review financial information presented on a consolidated basis for purposes of allocating resources and evaluating financial performance. The CODMs allocate resources and make operational decisions based on direct involvement with our operations and product development efforts. We are managed under a functionally-based organizational structure with the head of each function reporting to the Chief Executive Officer. The CODMs assess performance, including incentive compensation, based upon consolidated operations performance and financial results on a consolidated basis. As such, we have a single operating unit structure and are a single reporting segment.
Concentration of Geographic Risk
Geographic Risk -
The majority of our revenue and long-lived assets are attributable to operations in the United States for all periods presented. Additionally, we sell our Energy Servers in Japan, China, India, and the Republic of Korea (collectively, our "Asia Pacific region"). In the year ended
December 31, 2019
and
2018
, total revenue in the Asia Pacific region was
23%
and
14%
, respectively, of our total revenue.
16. Related Party Transactions
Our operations included the following related party transactions (in thousands):
|
|
Years Ended
December 31, |
|||||||||||
|
|
2019
|
2018
|
2017
|
|||||||||
|
Total revenue from related parties
|
$
|
228,100
|
|
$
|
32,381
|
|
$
|
2,176
|
|
|||
|
Interest expense to related parties
|
6,756
|
|
8,893
|
|
12,265
|
|
||||||
|
Consulting expenses paid to related parties
1
(included in general and administrative expense)
|
—
|
|
125
|
|
206
|
|
||||||
|
1
As of July 2019, we no longer have a consultant considered to be a related party.
|
||||||||||||
As of
December 31, 2019
and
2018
, we had
$55.8 million
and
$64.1 million
, respectively, in debt and convertible notes from investors considered to be related parties.
Bloom Energy Japan Limited
In May 2013, we entered into a joint venture with Softbank Corp., which is accounted for as an equity method investment. Under this arrangement, we sell Energy Servers and provide maintenance services to the joint venture. For the year ended
December 31, 2019
and
2018
, we recognized related party total revenue of
$4.2 million
and
$32.4 million
, respectively. Accounts receivable from this joint venture was
$2.4 million
as of
December 31, 2019
and
$3.3 million
as of
December 31, 2018
.
Diamond State Generation Partners, LLC
On June 14, 2019, we entered into a transaction with SP Diamond State Class B Holdings (SPDS) for the PPA II upgrade of Energy Servers. In connection with the closing of this transaction, SPDS was admitted as a member of Diamond State Generation Partners, LLC ("DSGP"). DSGP, an operating company was a wholly owned subsidiary of DSGH prior to June 14, 2019. As a result of the PPA II upgrade of Energy Servers transaction, we determined that we no longer retain a controlling interest in DSGP and therefore it will no longer be consolidated as a variable interest entity, or VIE, into our consolidated financial statements as of June 30, 2019. DSGP is considered to be a related party as, through our interest in DSGH, we held an interest in DSGP through December 23, 2019. As a result of the PPA II Upgrade, we recognized related party revenue of approximately
$223.9 million
, comprised of product revenue of approximately
$216.9 million
and installation revenue of
$7.0 million
, for the year ended
December 31, 2019
. See Note 13,
Power Purchase Agreement Programs - PPA II Upgrade of Energy Servers
. We had no accounts receivable from DSGP as of
December 31, 2019
.
159
Consulting Arrangement
In January 2009, we entered into a consulting agreement with General Colin L. Powell, a member of our board of directors, pursuant to which General Powell performs certain strategic planning and advisory services for us. In 2018, General Powell's compensation was revised to
$125,000.0
per year, plus reimbursement for reasonable expenses. In July 2019, the consulting agreement was amended to further reduce the compensation payable to General Powell such that he is no longer designated as a related party for reporting purposes.
Debt to Related Parties
The following is a summary of our debt and convertible notes from investors considered to be related parties as of
December 31, 2019
(in thousands):
|
|
Unpaid
Principal Balance |
Net Carrying Value
|
||||||||||||||
|
|
Current
|
Long-
Term |
Total
|
|||||||||||||
|
Recourse debt from related parties:
|
||||||||||||||||
|
6% convertible promissory notes due December 2020 from related parties
|
$
|
20,801
|
|
$
|
20,801
|
|
$
|
—
|
|
$
|
20,801
|
|
||||
|
Non-recourse debt from related parties:
|
||||||||||||||||
|
7.5% term loan due September 2028 from related parties
|
38,337
|
|
3,882
|
|
31,088
|
|
34,970
|
|
||||||||
|
Total debt from related parties
|
$
|
59,138
|
|
$
|
24,683
|
|
$
|
31,088
|
|
$
|
55,771
|
|
||||
The following is a summary of our debt and convertible notes from investors considered to be related parties as of
December 31, 2018
(in thousands):
|
|
Unpaid
Principal Balance |
Net Carrying Value
|
||||||||||||||
|
|
Current
|
Long-
Term |
Total
|
|||||||||||||
|
Recourse debt from related parties:
|
||||||||||||||||
|
6% convertible promissory notes due December 2020 from related parties
|
$
|
27,734
|
|
$
|
—
|
|
$
|
27,734
|
|
$
|
27,734
|
|
||||
|
Non-recourse debt from related parties:
|
||||||||||||||||
|
7.5% term loan due September 2028 from related parties
|
40,538
|
|
2,200
|
|
34,119
|
|
36,319
|
|
||||||||
|
Total debt from related parties
|
$
|
68,272
|
|
$
|
2,200
|
|
$
|
61,853
|
|
$
|
64,053
|
|
||||
In November 2019, one related party note holder exchanged
$6.9 million
of their
6% Notes
at the conversion price of
$11.25
per share into
616,302
shares of common stock. We repaid
$2.2 million
and
$1.4 million
of the non-recourse 7.5% term loan principal balance in the years
December 31, 2019
and
2018
, respectively, and we paid
$3.0 million
and
$3.1 million
of interest in the years
December 31, 2019
and
2018
, respectively. See
Note 7, Outstanding Loans and Security Agreements
for additional information on our debt facilities.
17. Subsequent Events
Senior Secured Notes Private Placement
On March 31, 2020, we entered into a note purchase agreement (the “Note Purchase Agreement”) with certain investors pursuant to which such investors have agreed to purchase, and we have agreed to issue,
$70.0 million
of
10.25%
Senior Secured Notes due 2027 (the “Senior Secured Notes”) in a private placement (the “Senior Secured Notes Private Placement”). The Senior Secured Notes will be governed by an indenture (the “Senior Secured Notes Indenture”) entered into among us, the guarantors party thereto and U.S. Bank National Association, in its capacity as trustee and collateral agent. The Senior Secured Notes are secured by certain of our operations and maintenance agreements.
The Note Purchase Agreement contains customary representations, warranties and covenants of the parties. Pursuant to the Note Purchase Agreement, the issuance of the Senior Secured Notes and related funding is expected to be consummated no later than May 29, 2020, and is conditioned upon the satisfaction of certain closing conditions set forth in the Note Purchase Agreement, including the release of certain collateral by the
6%
Convertible Noteholders, a satisfactory rating by a rating agency and receipt by the Purchasers of customary certificates, legal opinions and other documents.
Interest on the Notes will be payable on March 31, June 30, September 30 and December 31 of each year, commencing June 30, 2020. The Indenture will contain customary events of default and covenants relating to, among other things, the incurrence of debt, affiliate transactions, liens and restricted payments. On or after March 27, 2022, we may redeem all of the Notes at a price equal to
108.00%
of the principal amount of the Notes plus accrued and unpaid interest, with such optional redemption prices decreasing to
104.00%
on and after March 27, 2023,
102.00%
on and after March 27, 2024 and
100.00%
on and after March 27, 2026. Before March 27, 2022, we may redeem the Notes upon repayment of a make-whole premium. If we experience a change of control, we must offer to purchase for cash all or any part of each holder’s Notes at a purchase price equal to
101%
of the principal amount of the Notes, plus accrued and unpaid interest.
Amendment of Convertible Notes
Amendment Support Agreement
On March 31, 2020, we entered into an Amendment Support Agreement (the “Amendment Support Agreement”) with the beneficial owners (the “Noteholders”) of our outstanding 6.0% Convertible Notes due 2020 (the “Convertible Notes”) pursuant to which such Noteholders have agreed to consent to, among other things, certain amendments to the indenture (the “Proposed Amendments”).
The Proposed Amendments will, among other things:
|
•
|
Increase the interest rate of the Convertible Notes to
10%
per annum,
|
|
•
|
Extend the maturity date of the Convertible Notes to December 1, 2021, except that
$70.0 million
will remain due and payable on September 1, 2020;
|
|
•
|
Amend the conversion price applicable to the Convertible Notes to
$8.00
, representing an initial conversion rate of
125.0000
shares of Class B Common Stock per $1,000 principal amount of Notes (subject to customary adjustments);
|
|
•
|
Add covenants relating to, among other things, the redemption of the Convertible Notes with the proceeds of certain transactions (including equity and debt financings or sales of intellectual property), repayment of outstanding indebtedness and restricted payments and a provision requiring KR Sridhar to remain as CEO of Bloom Energy unless caused by illness, incapacity or death;
|
|
•
|
Release certain collateral securing the Convertible Notes that will secure the Senior Secured Notes; and
|
|
•
|
Require that we repay at least
$70.0 million
of the Convertible Notes on or before September 1, 2020.
|
Pursuant to the Amendment Support Agreement, the Proposed Amendments were implemented by (i) amending and restating the Original Indenture (as so amended and restated, the “Amended and Restated Indenture”), (ii) amending and restating the Convertible Notes in the form to be attached to the Amended and Restated Indenture, and (iii) executing and delivering an amendment to the security agreement governing the collateral securing the Convertible Notes (the “Security Agreement Amendment” and together with the Amended and Restated Indenture and the Security Agreement Amendment, the “Amendment Documents”), and (iv) executing and delivering certain other documents, instruments, certificates and agreements in connection with and/or as required by the foregoing, in each case on or prior to April 20, 2020 and subject to the satisfaction
160
of certain customary and other conditions set forth in the Amendment Support Agreement, including the payment of expenses and the delivery of customary certificates, legal opinions and other documents.
On March 31, 2020, we also entered into a Support Agreement (the “Stockholder Support Agreement”) with KR Sridhar, the Chief Executive Officer of the Company (in such capacity, the “Stockholder”) and the beneficial owner of a majority of the voting power of the Company, pursuant to which the Stockholder has agreed to vote in favor of permitting us to settle all conversions of Convertible Notes in shares of our Class A Common Stock or Class B Common Stock, as applicable, in compliance with all applicable rules of the New York Stock Exchange (the “Stockholder Approval”).
Convertible Note Purchase Agreement
In connection with the execution and delivery of the Amendment Documents, on March 31, 2020, we entered into a convertible note purchase agreement (the “Convertible Note Purchase Agreement”) with Foris Ventures, LLC and New Enterprise Associates 10, Limited Partnership (together, the “Purchasers”), both affiliates of ours, pursuant to which such Purchasers were issued
$30 million
aggregate principal amount of additional Convertible Notes (the “Additional Convertible Notes”) under the Amended and Restated Indenture. The issuance of the Additional Convertible Notes is expected to occur substantially concurrently with the execution and delivery of the Amendment Documents.
Constellation Note Modification Agreement
In connection with the execution and delivery of the Amendment Documents, on March 31, 2020, we entered into an Amended and Restated Subordinated Secured Convertible Note Modification Agreement (the “Constellation Note Modification Agreement”) with Constellation NewEnergy, Inc. (“Constellation”) pursuant to which certain terms of our outstanding Amended and Restated Subordinated Secured Convertible Note issued to Constellation were modified to be no less favorable than the corresponding terms of the Convertible Notes as amended by the Amended and Restated Indenture.
COVID-19 Pandemic
The recent outbreak of the novel coronavirus COVID-19, which was declared a pandemic by the World Health Organization on March 11, 2020, has led to adverse impacts on the U.S. and global economies and created uncertainty regarding potential impacts to our supply chain, operations, and customer demand. Although we have been able to maintain certain of our operations as an “Essential Business” in California and Delaware, other operations have been delayed or suspended under applicable government orders and guidance.
Our headquarters and certain of our manufacturing facilities are located in Santa Clara County, California. On March 17, 2020, Santa Clara County became subject to a government mandated “shelter in place” order, which was superseded by an Executive Order issued by the Governor of California that extends indefinitely. Similarly, effective March 25, 2020, our manufacturing facilities in Newark, Delaware became subject to the Governor of Delaware’s Declaration of a State of Emergency Due to a Public Health Threat initially issued on March 12, 2020 and in effect until further notice. As our manufacturing operations have been designated as “Essential Businesses”, both manufacturing facilities are continuing to operate. However, our installation activities in all areas, but especially New York, Connecticut, New Jersey, California and Massachusetts, are adversely impacted by similar mandates in these jurisdictions, as well as where certain of our customers have shut down or otherwise limited access to their facilities. Additionally, while construction activities have to date been deemed “Essential Businesses” and allowed to proceed in many jurisdictions, we have experienced interruptions and delays caused by confusion related to exemptions for “Essential Businesses” amongst our suppliers and their sub-contractors.
In response, we have closed our headquarters building and directed employees, unless they are directly supporting essential manufacturing production operations or maintenance activities, to work from their homes. This has caused disruptions in certain of our operations, including our research and development, sales, marketing, installation and operations and maintenance activities.
We are also experiencing delays from certain vendors and suppliers that have been affected more directly by COVID-19. Our international operations, including in South Korea and India, have been disrupted by the COVID-19 pandemic and by governmental responses to the pandemic. In India, orders by the National Disaster Management Authority and the Ministry of Home Affairs issued March 24, 2020 have “prescribed a lockdown for containment of COVID-19 Epidemic in the country,” according to the Press Information Bureau of the Government of India. These orders have had the effect of disrupting the supply chain on which we rely for certain parts critical to our manufacturing and maintenance capabilities, which impacts both our sale and installation of new products and our operations and maintenance of previously-sold Energy Servers. Both the primary and secondary sources of a particular part on which we rely are in India. As of the filing of this Form 10-K, we have identified an alternative supplier based in China which is expected to be able to provide the necessary parts by the end of April
161
2020. Relative to South Korea, we have not seen significant impacts to date in orders and as we do not perform installation services in South Korea, our risks in South Korea are further limited.
We also rely on third party financing for our customer’s purchases of our Energy Servers. We have already experienced one delayed closing due to a financier’s inability to close in light of its own liquidity concerns.
We have also experienced delays and interruptions to our installation activities where customers have shut down or otherwise limited access to their facilities. Additionally, while construction activities have to date been deemed “essential business” and allowed to proceed in many jurisdictions, we have experienced interruptions and delays caused by confusion related to exemptions for “Essential Businesses” amongst our suppliers and their sub-contractors.
The COVID-19 pandemic is expected to negatively impact our results of operations, financial position, and liquidity, but we cannot reasonably estimate the future impact at this time.
Other Events
There have been no other subsequent events that occurred during the period subsequent to the date of these financial statements that would require adjustment to our disclosure in the financial statements as presented.
162
18. Unaudited Selected Quarterly Financial Data
The consolidated statements of operations data, presented on a quarterly basis for the years ended
December 31, 2019
and
2018
, are unaudited. These data have been prepared in accordance with U.S. GAAP for interim financial information and, in the opinion of management, reflect all adjustments, which include only normal recurring adjustments, necessary for a fair statement of the results of operations for the periods presented.
We have restated herein our previously issued unaudited selected quarterly financial data for the quarters ended March 31, 2019, June 30, 2019 and 2018, September 30, 2019 and 2018, and December 31, 2018 and revised our unaudited selected quarterly financial data for the quarter ended March 31, 2018. See Note 2,
Restatement and Revision of Previously Issued Consolidated Financial Statements
, for further information.
In addition, our unaudited selected quarterly financial data for the quarters ended March 31, 2019, June 30, 2019 and September 30, 2019, as previously reported, did not originally reflect the adoption of ASU 2014-09 related to the presentation of ASC 606
Revenue From Contracts With Customers
. ASC 606 was adopted in the fourth quarter of 2019 and was applied on the modified retrospective method for periods commencing January 1, 2019. Our condensed consolidated statements of operations data for the interim periods within fiscal year 2019 have been recast accordingly. See Note 1,
Accounting Guidance Implemented in Fiscal Year 2019
,
Revenue Recognition
, for additional information related to our adoption of ASU 2014-09.
163
The following presents our consolidated statements of operations by quarter (in thousands) (unaudited):
|
|
2019
|
2018
|
||||||||||||||||||||||||||||||
|
Three Months Ended
|
||||||||||||||||||||||||||||||||
|
|
Dec. 31
|
Sept. 30
|
June 30
|
March 31
|
Dec. 31
|
Sept. 30
|
June 30
|
March 31
|
||||||||||||||||||||||||
|
As Restated and Recast
|
As Restated
|
As Revised
|
||||||||||||||||||||||||||||||
|
Revenue:
|
||||||||||||||||||||||||||||||||
|
Product
|
$
|
158,427
|
|
$
|
163,902
|
|
$
|
144,081
|
|
$
|
90,926
|
|
$
|
103,937
|
|
$
|
102,433
|
|
$
|
78,497
|
|
$
|
115,771
|
|
||||||||
|
Installation
|
14,429
|
|
21,102
|
|
13,076
|
|
12,219
|
|
11,066
|
|
24,691
|
|
19,643
|
|
12,795
|
|
||||||||||||||||
|
Service
|
25,628
|
|
23,665
|
|
23,026
|
|
23,467
|
|
21,778
|
|
21,056
|
|
20,299
|
|
20,134
|
|
||||||||||||||||
|
Electricity
|
15,059
|
|
15,638
|
|
20,143
|
|
20,389
|
|
20,364
|
|
20,439
|
|
19,863
|
|
19,882
|
|
||||||||||||||||
|
Total revenue
|
213,543
|
|
224,307
|
|
200,326
|
|
147,001
|
|
157,145
|
|
168,619
|
|
138,302
|
|
168,582
|
|
||||||||||||||||
|
Cost of revenue:
|
||||||||||||||||||||||||||||||||
|
Product
|
141,782
|
|
91,697
|
|
113,228
|
|
88,772
|
|
86,154
|
|
69,053
|
|
49,603
|
|
76,465
|
|
||||||||||||||||
|
Installation
|
16,901
|
|
26,141
|
|
17,685
|
|
15,760
|
|
20,651
|
|
35,506
|
|
29,951
|
|
9,198
|
|
||||||||||||||||
|
Service
|
17,127
|
|
36,427
|
|
18,763
|
|
27,921
|
|
31,818
|
|
24,470
|
|
19,702
|
|
24,699
|
|
||||||||||||||||
|
Electricity
|
12,785
|
|
27,317
|
|
22,300
|
|
12,984
|
|
11,601
|
|
12,180
|
|
12,062
|
|
13,785
|
|
||||||||||||||||
|
Total cost of revenue
|
188,595
|
|
181,582
|
|
171,976
|
|
145,437
|
|
150,224
|
|
141,209
|
|
111,318
|
|
124,147
|
|
||||||||||||||||
|
Gross profit
|
24,948
|
|
42,725
|
|
28,350
|
|
1,564
|
|
6,921
|
|
27,410
|
|
26,984
|
|
44,435
|
|
||||||||||||||||
|
Operating expenses:
|
||||||||||||||||||||||||||||||||
|
Research and development
|
22,148
|
|
23,389
|
|
29,772
|
|
28,859
|
|
32,970
|
|
27,021
|
|
14,413
|
|
14,731
|
|
||||||||||||||||
|
Sales and marketing
|
17,357
|
|
17,649
|
|
18,194
|
|
20,373
|
|
24,951
|
|
21,396
|
|
8,167
|
|
8,293
|
|
||||||||||||||||
|
General and administrative
|
33,315
|
|
36,599
|
|
43,662
|
|
39,074
|
|
47,471
|
|
40,999
|
|
15,359
|
|
14,988
|
|
||||||||||||||||
|
Total operating expenses
|
72,820
|
|
77,637
|
|
91,628
|
|
88,306
|
|
105,392
|
|
89,416
|
|
37,939
|
|
38,012
|
|
||||||||||||||||
|
Income (loss) from operations
|
(47,872
|
)
|
(34,912
|
)
|
(63,278
|
)
|
(86,742
|
)
|
(98,471
|
)
|
(62,006
|
)
|
(10,955
|
)
|
6,423
|
|
||||||||||||||||
|
Interest income
|
862
|
|
1,214
|
|
1,700
|
|
1,885
|
|
1,996
|
|
1,467
|
|
444
|
|
415
|
|
||||||||||||||||
|
Interest expense
|
(21,635
|
)
|
(21,323
|
)
|
(22,722
|
)
|
(21,800
|
)
|
(21,757
|
)
|
(22,125
|
)
|
(27,147
|
)
|
(25,992
|
)
|
||||||||||||||||
|
Interest expense to related parties
|
(1,933
|
)
|
(1,605
|
)
|
(1,606
|
)
|
(1,612
|
)
|
(1,628
|
)
|
(1,966
|
)
|
(2,672
|
)
|
(2,627
|
)
|
||||||||||||||||
|
Other income (expense), net
|
138
|
|
525
|
|
(222
|
)
|
265
|
|
636
|
|
(705
|
)
|
(855
|
)
|
(75
|
)
|
||||||||||||||||
|
Gain (loss) on revaluation of warrant liabilities and embedded derivatives
|
(540
|
)
|
(540
|
)
|
(540
|
)
|
(540
|
)
|
192
|
|
900
|
|
(19,197
|
)
|
(4,034
|
)
|
||||||||||||||||
|
Loss before income taxes
|
(70,980
|
)
|
(56,641
|
)
|
(86,668
|
)
|
(108,544
|
)
|
(119,032
|
)
|
(84,435
|
)
|
(60,382
|
)
|
(25,890
|
)
|
||||||||||||||||
|
Income tax provision (benefit)
|
31
|
|
136
|
|
258
|
|
208
|
|
1,079
|
|
(3
|
)
|
128
|
|
333
|
|
||||||||||||||||
|
Net loss
|
(71,011
|
)
|
(56,777
|
)
|
(86,926
|
)
|
(108,752
|
)
|
(120,111
|
)
|
(84,432
|
)
|
(60,510
|
)
|
(26,223
|
)
|
||||||||||||||||
|
Less: net loss attributable to noncontrolling interests and redeemable noncontrolling interests
|
(5,178
|
)
|
(5,027
|
)
|
(5,015
|
)
|
(3,832
|
)
|
(4,662
|
)
|
(3,930
|
)
|
(4,512
|
)
|
(4,632
|
)
|
||||||||||||||||
|
Net loss attributable to Class A and Class B common stockholders
|
(65,833
|
)
|
(51,750
|
)
|
(81,911
|
)
|
(104,920
|
)
|
(115,449
|
)
|
(80,502
|
)
|
(55,998
|
)
|
(21,591
|
)
|
||||||||||||||||
|
Less: deemed dividend to noncontrolling interest
|
(2,454
|
)
|
—
|
|
—
|
|
—
|
|
—
|
|
—
|
|
—
|
|
—
|
|
||||||||||||||||
|
Net loss available to Class A and Class B common stockholders
|
$
|
(68,287
|
)
|
$
|
(51,750
|
)
|
$
|
(81,911
|
)
|
$
|
(104,920
|
)
|
$
|
(115,449
|
)
|
$
|
(80,502
|
)
|
$
|
(55,998
|
)
|
$
|
(21,591
|
)
|
||||||||
|
Net loss per share attributable to Class A and Class B common stockholders, basic and diluted
|
$
|
(0.58
|
)
|
$
|
(0.44
|
)
|
$
|
(0.72
|
)
|
$
|
(0.94
|
)
|
$
|
(1.06
|
)
|
$
|
(0.99
|
)
|
$
|
(5.31
|
)
|
$
|
(2.08
|
)
|
||||||||
|
Weighted average shares used to compute net loss per share attributable to Class A and Class B common stockholders, basic and diluted
|
118,588
|
|
116,330
|
|
113,624
|
|
111,842
|
|
109,416
|
|
81,321
|
|
10,536
|
|
10,404
|
|
||||||||||||||||
164
Restatement and Recasting and Revision of Previously Issued Unaudited Financial Data
Following are the restatement and recasting of previously reported condensed consolidated balance sheets for the quarters ended March 31, 2019, June 30, 2019, and September 30, 2019, restatement of previously reported condensed consolidated balance sheets for the quarters ended June 30, 2018 and September 30, 2018, and revision of previously reported condensed consolidated balance sheet for the quarter ended March 31, 2018.
|
March 31, 2019
|
||||||||||||||||||||
|
|
|
As Previously Reported
|
Restatement Impacts
|
As Restated
|
ASC 606 Adoption Impacts
|
As Restated & Recast
|
||||||||||||||
|
Assets
|
|
|
|
|
|
|
||||||||||||||
|
Current assets:
|
|
|||||||||||||||||||
|
Cash and cash equivalents
|
|
$
|
320,414
|
|
$
|
—
|
|
$
|
320,414
|
|
$
|
—
|
|
$
|
320,414
|
|
||||
|
Restricted cash
|
|
18,419
|
|
—
|
|
18,419
|
|
—
|
|
18,419
|
|
|||||||||
|
Accounts receivable
|
|
84,070
|
|
3,995
|
|
1
|
88,065
|
|
(2,418
|
)
|
85,647
|
|
||||||||
|
Inventories
|
|
116,544
|
|
3,327
|
|
2
|
119,871
|
|
—
|
|
119,871
|
|
||||||||
|
Deferred cost of revenue
|
|
66,316
|
|
(13,405
|
)
|
3
|
52,911
|
|
—
|
|
52,911
|
|
||||||||
|
Customer financing receivable
|
|
5,717
|
|
—
|
|
5,717
|
|
—
|
|
5,717
|
|
|||||||||
|
Prepaid expenses and other current assets
|
|
28,362
|
|
1,582
|
|
4
|
29,944
|
|
129
|
|
30,073
|
|
||||||||
|
Total current assets
|
|
639,842
|
|
(4,501
|
)
|
635,341
|
|
(2,289
|
)
|
633,052
|
|
|||||||||
|
Property, plant and equipment, net
|
|
475,385
|
|
236,246
|
|
5
|
711,631
|
|
—
|
|
711,631
|
|
||||||||
|
Customer financing receivable, non-current
|
|
65,620
|
|
—
|
|
65,620
|
|
—
|
|
65,620
|
|
|||||||||
|
Restricted cash (noncurrent)
|
|
31,101
|
|
—
|
|
31,101
|
|
—
|
|
31,101
|
|
|||||||||
|
Deferred cost of revenue, non-current
|
|
72,516
|
|
(70,583
|
)
|
3
|
1,933
|
|
—
|
|
1,933
|
|
||||||||
|
Other long-term assets
|
|
34,386
|
|
8,486
|
|
6
|
42,872
|
|
2,575
|
|
45,447
|
|
||||||||
|
Total assets
|
|
$
|
1,318,850
|
|
$
|
169,648
|
|
$
|
1,488,498
|
|
$
|
286
|
|
$
|
1,488,784
|
|
||||
|
Liabilities, Redeemable Noncontrolling Interest, Stockholders’ Deficit and Noncontrolling Interest
|
|
|||||||||||||||||||
|
Current liabilities:
|
||||||||||||||||||||
|
Accounts payable
|
$
|
64,425
|
|
$
|
—
|
|
$
|
64,425
|
|
$
|
—
|
|
$
|
64,425
|
|
|||||
|
Accrued warranty
|
16,736
|
|
(1,219
|
)
|
7
|
15,517
|
|
(1,280
|
)
|
14,237
|
|
|||||||||
|
Accrued expenses and other current liabilities
|
67,966
|
|
(3,893
|
)
|
8
|
64,073
|
|
—
|
|
64,073
|
|
|||||||||
|
Financing obligations
|
—
|
|
8,819
|
|
10
|
8,819
|
|
—
|
|
8,819
|
|
|||||||||
|
Deferred revenue and customer deposits
|
89,557
|
|
(16,153
|
)
|
11
|
73,404
|
|
1,665
|
|
75,069
|
|
|||||||||
|
Current portion of recourse debt
|
15,683
|
|
—
|
|
15,683
|
|
—
|
|
15,683
|
|
||||||||||
|
Current portion of non-recourse debt
|
19,486
|
|
—
|
|
19,486
|
|
—
|
|
19,486
|
|
||||||||||
|
Current portion of non-recourse debt from related parties
|
2,341
|
|
—
|
|
2,341
|
|
—
|
|
2,341
|
|
||||||||||
|
Total current liabilities
|
276,194
|
|
(12,446
|
)
|
263,748
|
|
385
|
|
264,133
|
|
||||||||||
|
Derivative liabilities
|
11,166
|
|
4,556
|
|
15,722
|
|
—
|
|
15,722
|
|
||||||||||
|
Deferred revenue and customer deposits, net of current portion
|
201,863
|
|
(115,432
|
)
|
11
|
86,431
|
|
17,320
|
|
103,751
|
|
|||||||||
|
Financing obligations, non-current
|
—
|
|
394,037
|
|
10
|
394,037
|
|
—
|
|
394,037
|
|
|||||||||
|
Long-term portion of recourse debt
|
357,876
|
|
—
|
|
357,876
|
|
—
|
|
357,876
|
|
||||||||||
|
Long-term portion of non-recourse debt
|
284,541
|
|
—
|
|
284,541
|
|
—
|
|
284,541
|
|
||||||||||
|
Long-term portion of recourse debt from related parties
|
27,734
|
|
—
|
|
27,734
|
|
—
|
|
27,734
|
|
||||||||||
|
Long-term portion of non-recourse debt from related parties
|
33,417
|
|
—
|
|
33,417
|
|
—
|
|
33,417
|
|
||||||||||
165
|
March 31, 2019
|
||||||||||||||||||||
|
|
|
As Previously Reported
|
Restatement Impacts
|
As Restated
|
ASC 606 Adoption Impacts
|
As Restated & Recast
|
||||||||||||||
|
Other long-term liabilities
|
58,032
|
|
(29,062
|
)
|
8
|
28,970
|
|
—
|
|
28,970
|
|
|||||||||
|
Total liabilities
|
1,250,823
|
|
241,653
|
|
1,492,476
|
|
17,705
|
|
1,510,181
|
|
||||||||||
|
|
||||||||||||||||||||
|
Redeemable noncontrolling interest
|
58,802
|
|
—
|
|
58,802
|
|
—
|
|
58,802
|
|
||||||||||
|
Stockholders’ deficit:
|
||||||||||||||||||||
|
Common stock
|
11
|
|
—
|
|
11
|
|
—
|
|
11
|
|
||||||||||
|
Additional paid-in capital
|
2,551,256
|
|
755
|
|
12
|
2,552,011
|
|
—
|
|
2,552,011
|
|
|||||||||
|
Accumulated other comprehensive income
|
5
|
|
—
|
|
5
|
|
—
|
|
5
|
|
||||||||||
|
Accumulated deficit
|
(2,656,711
|
)
|
(72,760
|
)
|
(2,729,471
|
)
|
(17,419
|
)
|
(2,746,890
|
)
|
||||||||||
|
Total stockholders’ deficit
|
(105,439
|
)
|
(72,005
|
)
|
(177,444
|
)
|
(17,419
|
)
|
(194,863
|
)
|
||||||||||
|
Noncontrolling interest
|
114,664
|
|
—
|
|
114,664
|
|
—
|
|
114,664
|
|
||||||||||
|
Total liabilities, redeemable noncontrolling interest, stockholders' deficit and noncontrolling interest
|
$
|
1,318,850
|
|
$
|
169,648
|
|
$
|
1,488,498
|
|
$
|
286
|
|
$
|
1,488,784
|
|
|||||
1
Accounts receivable — The correction of these misstatements resulted from the change of accounting for Managed Services Agreements, for which the amount recorded to accounts receivable represents amounts invoiced for capacity billings to end customers which have not yet been collected by the financing entity as of the period end.
2
Inventories — The correction of these misstatements resulted from the change of accounting for inventory, including net capitalization of stock-based compensation cost of
$3.8 million
and reclassification of inventories of
$0.5 million
held for shipments to customers under the Managed Services Program and similar arrangements to construction in progress within property, plant and equipment, net.
3
Deferred cost of revenue, current and non-current — The correction of these misstatements resulted from reclassifying deferred cost of revenue to property, plant and equipment, net for the leased Energy Servers under the Managed Services Agreements and similar sale-leaseback arrangements of
$13.9 million
(short-term) and
$70.6 million
(long-term), net capitalization of stock-based compensation costs of
$2.1 million
into current deferred cost of revenue, and the correction of certain other immaterial misstatements identified to relieve installation deferred cost of revenue of
$1.7 million
.
4
Prepaid expenses and other current assets — The correction of these misstatements resulted from the change of accounting for Managed Services Agreements and similar arrangements prepaid property tax and insurance payments are now classified within prepaid expenses, rather than offset against deferred revenue.
5
Property, plant and equipment, net — The correction of these misstatements resulted from the change of accounting for Managed Services transactions and similar arrangements, whereby product and install costs of goods sold are now recorded as property, plant and equipment, net in the cases where the risks of ownership have not completely transferred to the financing party of
$232.6 million
. This includes a net capitalization of stock-based compensation cost for these assets of
$3.6 million
.
6
Other long-term assets — The correction of these misstatements resulted from the change of accounting for Managed Services Agreements and similar arrangements whereby the timing difference of capacity billings to end customers and the payments received from the financing entity is recorded within long term receivables and prepaid property tax and insurance payments are now classified within other long-term assets, rather than offset against long-term deferred revenue.
7
Accrued warranty — The correction of these misstatements resulted from the change of accounting for accrued warranty which is now recorded on an as-incurred basis for our Managed Services Agreements and similar arrangements, reducing accrued warranty by
$0.4 million
and the change of accounting for the grid pricing escalation guarantees we provided in some of our sales arrangements, which are now recorded as derivative liabilities, reducing accrued warranty by
$0.8 million
.
8
Accrued expense and other current liabilities and other long-term liabilities — The correction of these misstatements resulted from the change of accounting for Managed Services Agreements, for which historical accrued liabilities recorded at inception of the agreements, as well as subsequent reductions of those liabilities, were reversed.
9
Financing obligations, current and non-current — The correction of these misstatements resulted from the change of accounting for Managed Services Agreements and similar arrangements, whereby instead of recognizing the upfront proceeds received from the bank as revenue, the proceeds received are classified as financing obligations.
10
Deferred revenue and customer deposits, current and non-current — The correction of these misstatements resulted from the change of accounting for the recognition of product and installation revenue from upfront or ratable recognition to recognition of the capacity payments received from the end customer as power is generated by the Energy Servers as electricity revenue.
11
Derivative liabilities — The correction of these misstatements resulted from the change of accounting for embedded derivatives related to grid pricing escalation guarantees we provided in some of our sales arrangements. These are now recorded as derivative liabilities and were previously treated as an accrued liability.
12
Additional paid-in capital — Relates to the correction of an unadjusted misstatement in the valuation of our 6% Notes derivative, resulting in a credit to additional paid-in capital and additional expense of
$0.8 million
recorded within other expense, net.
166
|
June 30, 2019
|
||||||||||||||||||||
|
|
|
As Previously Reported
|
Restatement Impacts
|
As Restated
|
ASC 606 Adoption Impacts
|
As Restated & Recast
|
||||||||||||||
|
Assets
|
|
|||||||||||||||||||
|
Current assets:
|
|
|||||||||||||||||||
|
Cash and cash equivalents
|
|
$
|
308,009
|
|
$
|
—
|
|
$
|
308,009
|
|
$
|
—
|
|
$
|
308,009
|
|
||||
|
Restricted cash
|
|
23,706
|
|
—
|
|
23,706
|
|
—
|
|
23,706
|
|
|||||||||
|
Accounts receivable
|
|
38,296
|
|
4,172
|
|
1
|
42,468
|
|
(2,430
|
)
|
40,038
|
|
||||||||
|
Inventories
|
|
104,934
|
|
1,955
|
|
2
|
106,889
|
|
—
|
|
106,889
|
|
||||||||
|
Deferred cost of revenue
|
|
86,434
|
|
(6,127
|
)
|
3
|
80,307
|
|
—
|
|
80,307
|
|
||||||||
|
Customer financing receivable
|
|
5,817
|
|
—
|
|
5,817
|
|
—
|
|
5,817
|
|
|||||||||
|
Prepaid expenses and other current assets
|
|
25,088
|
|
1,252
|
|
4
|
26,340
|
|
143
|
|
26,483
|
|
||||||||
|
Total current assets
|
|
592,284
|
|
1,252
|
|
593,536
|
|
(2,287
|
)
|
591,249
|
|
|||||||||
|
Property, plant and equipment, net
|
|
406,610
|
|
234,649
|
|
5
|
641,259
|
|
—
|
|
641,259
|
|
||||||||
|
Customer financing receivable, non-current
|
|
64,146
|
|
—
|
|
64,146
|
|
—
|
|
64,146
|
|
|||||||||
|
Restricted cash (noncurrent)
|
|
39,351
|
|
—
|
|
39,351
|
|
—
|
|
39,351
|
|
|||||||||
|
Deferred cost of revenue, non-current
|
|
59,213
|
|
(55,367
|
)
|
3
|
3,846
|
|
—
|
|
3,846
|
|
||||||||
|
Other long-term assets
|
|
60,975
|
|
9,118
|
|
6
|
70,093
|
|
2,743
|
|
72,836
|
|
||||||||
|
Total assets
|
|
$
|
1,222,579
|
|
$
|
189,652
|
|
$
|
1,412,231
|
|
$
|
456
|
|
$
|
1,412,687
|
|
||||
|
Liabilities, Redeemable Noncontrolling Interest, Stockholders’ Deficit and Noncontrolling Interest
|
|
|||||||||||||||||||
|
Current liabilities:
|
||||||||||||||||||||
|
Accounts payable
|
61,427
|
|
—
|
|
61,427
|
|
—
|
|
61,427
|
|
||||||||||
|
Accrued warranty
|
12,393
|
|
(1,154
|
)
|
7
|
11,239
|
|
(999
|
)
|
10,240
|
|
|||||||||
|
Accrued expenses and other current liabilities
|
109,722
|
|
(4,329
|
)
|
8
|
105,393
|
|
—
|
|
105,393
|
|
|||||||||
|
Financing obligations
|
—
|
|
10,027
|
|
10
|
10,027
|
|
—
|
|
10,027
|
|
|||||||||
|
Deferred revenue and customer deposits
|
129,321
|
|
(13,847
|
)
|
11
|
115,474
|
|
3,264
|
|
118,738
|
|
|||||||||
|
Current portion of recourse debt
|
15,681
|
|
—
|
|
15,681
|
|
—
|
|
15,681
|
|
||||||||||
|
Current portion of non-recourse debt
|
7,654
|
|
—
|
|
7,654
|
|
—
|
|
7,654
|
|
||||||||||
|
Current portion of non-recourse debt from related parties
|
2,889
|
|
—
|
|
2,889
|
|
—
|
|
2,889
|
|
||||||||||
|
Total current liabilities
|
339,087
|
|
(9,303
|
)
|
329,784
|
|
2,265
|
|
332,049
|
|
||||||||||
|
Derivative liabilities
|
13,079
|
|
5,096
|
|
18,175
|
|
—
|
|
18,175
|
|
||||||||||
|
Deferred revenue and customer deposits, net of current portion
|
181,221
|
|
(95,840
|
)
|
11
|
85,381
|
|
25,369
|
|
110,750
|
|
|||||||||
|
Financing obligations, non-current
|
—
|
|
400,078
|
|
10
|
400,078
|
|
—
|
|
400,078
|
|
|||||||||
|
Long-term portion of recourse debt
|
362,424
|
|
—
|
|
362,424
|
|
—
|
|
362,424
|
|
||||||||||
|
Long-term portion of non-recourse debt
|
219,182
|
|
—
|
|
219,182
|
|
—
|
|
219,182
|
|
||||||||||
|
Long-term portion of recourse debt from related parties
|
27,734
|
|
—
|
|
27,734
|
|
—
|
|
27,734
|
|
||||||||||
|
Long-term portion of non-recourse debt from related parties
|
32,643
|
|
—
|
|
32,643
|
|
—
|
|
32,643
|
|
||||||||||
|
Other long-term liabilities
|
58,417
|
|
(28,438
|
)
|
8
|
29,979
|
|
—
|
|
29,979
|
|
|||||||||
|
Total liabilities
|
1,233,787
|
|
271,593
|
|
1,505,380
|
|
27,634
|
|
1,533,014
|
|
||||||||||
|
Redeemable noncontrolling interest
|
505
|
|
—
|
|
505
|
|
—
|
|
505
|
|
||||||||||
|
Stockholders’ deficit:
|
||||||||||||||||||||
167
|
June 30, 2019
|
||||||||||||||||||||
|
|
|
As Previously Reported
|
Restatement Impacts
|
As Restated
|
ASC 606 Adoption Impacts
|
As Restated & Recast
|
||||||||||||||
|
Common stock
|
11
|
|
—
|
|
11
|
|
—
|
|
11
|
|
||||||||||
|
Additional paid-in capital
|
2,603,279
|
|
755
|
|
12
|
2,604,034
|
|
—
|
|
2,604,034
|
|
|||||||||
|
Accumulated other comprehensive loss
|
(148
|
)
|
—
|
|
(148
|
)
|
—
|
|
(148
|
)
|
||||||||||
|
Accumulated deficit
|
(2,718,927
|
)
|
(82,696
|
)
|
(2,801,623
|
)
|
(27,178
|
)
|
(2,828,801
|
)
|
||||||||||
|
Total stockholders’ deficit
|
(115,785
|
)
|
(81,941
|
)
|
(197,726
|
)
|
(27,178
|
)
|
(224,904
|
)
|
||||||||||
|
Noncontrolling interest
|
104,072
|
|
—
|
|
104,072
|
|
—
|
|
104,072
|
|
||||||||||
|
Total liabilities, redeemable noncontrolling interest, stockholders' deficit and noncontrolling interest
|
$
|
1,222,579
|
|
$
|
189,652
|
|
$
|
1,412,231
|
|
$
|
456
|
|
$
|
1,412,687
|
|
|||||
1
Accounts receivable — The correction of these misstatements resulted from the change of accounting for Managed Services Agreements, for which the amount recorded to accounts receivable represents amounts invoiced for capacity billings to end customers which have not yet been collected by the financing entity as of the period end.
2
Inventories — The correction of these misstatements resulted from the change of accounting for inventory, including net capitalization of stock-based compensation costs of
$2.0 million
.
3
Deferred cost of revenue, current and non-current — The correction of these misstatements resulted from reclassifying deferred cost of revenue to property, plant and equipment, net for the leased Energy Servers under the Managed Services Agreements and similar sale-leaseback arrangements of
$7.4 million
(short-term) and
$55.4 million
(long-term), and net capitalization of stock-based compensation costs of
$3.7 million
into current deferred cost of revenue, and the correction of certain other immaterial misstatements identified to relieve installation deferred cost of revenue of
$2.5 million
.
4
Prepaid expenses and other current assets — The correction of these misstatements resulted from the change of accounting for Managed Services Agreements and similar arrangements whereby prepaid property tax and insurance payments are now classified within prepaid expenses, rather than offset against deferred revenue.
5
Property, plant and equipment, net — The correction of these misstatements resulted from the change of accounting for Managed Services transactions and similar arrangements, whereby product and install cost of revenue are now recorded as property, plant and equipment, net in the cases where the risks of ownership have not completely transferred to the financing party of
$230.9 million
. This includes a net capitalization of stock-based compensation costs for these assets of
$3.7 million
.
6
Other long-term assets — The correction of these misstatements resulted from the change of accounting for Managed Services Agreements and similar arrangements whereby the timing difference of capacity billings to end customers and the payments received from the financing entity is recorded within long term receivables and prepaid property tax and insurance payments are now classified within other long-term assets, rather than offset against long-term deferred revenue.
7
Accrued warranty — The correction of these misstatements resulted from the change of accounting for accrued warranty which is now recorded on an as-incurred basis for our Managed Services Agreements and similar arrangements, reducing accrued warranty by
$0.2 million
and the change of accounting for the grid pricing escalation guarantees we provided in some of our sales arrangements, which are now recorded as derivative liabilities, reducing accrued warranty by
$0.9 million
.
8
Accrued expenses and other current liabilities and other long-term liabilities — The correction of these misstatements resulted from the change of accounting for Managed Services Agreements, for which historical accrued liabilities recorded at inception of the agreements, as well as subsequent reductions of those liabilities, were reversed.
9
Financing obligations, current and non-current — The correction of these misstatements resulted from the change of accounting for Managed Services Agreements and similar arrangements, whereby instead of recognizing the upfront proceeds received from the bank as revenue, the proceeds received are classified as financing obligations.
10
Deferred revenue and customer deposits, current and non-current — The correction of these misstatements resulted from the change of accounting for the recognition of product and installation revenue from upfront or ratable recognition to recognition of the capacity payments received from the end customer as power is generated by the Energy Servers as electricity revenue.
11
Derivative liabilities — The correction of these misstatements resulted from the change of accounting for embedded derivatives related to grid pricing escalation guarantees we provided in some of our sales arrangements. These are now recorded as derivative liabilities and were previously treated as an accrued liability.
12
Additional paid-in capital — Relates to the correction of an unadjusted misstatement in the valuation of our 6% Notes derivative, resulting in a credit to additional paid-in capital and additional expense of
$0.8 million
recorded within other expense, net.
168
|
September 30, 2019
|
||||||||||||||||||||
|
|
As Previously Reported
|
Restatement Impacts
|
As Restated
|
ASC 606 Adoption Impacts
|
As Restated & Recast
|
|||||||||||||||
|
Assets
|
||||||||||||||||||||
|
Current assets:
|
||||||||||||||||||||
|
Cash and cash equivalents
|
$
|
226,499
|
|
$
|
—
|
|
$
|
226,499
|
|
$
|
—
|
|
$
|
226,499
|
|
|||||
|
Restricted cash
|
14,486
|
|
—
|
|
14,486
|
|
—
|
|
14,486
|
|
||||||||||
|
Accounts receivable
|
26,737
|
|
4,216
|
|
1
|
30,953
|
|
(4,600
|
)
|
26,353
|
|
|||||||||
|
Inventories
|
140,372
|
|
(7,765
|
)
|
2
|
132,607
|
|
—
|
|
132,607
|
|
|||||||||
|
Deferred cost of revenue
|
50,707
|
|
(9,665
|
)
|
3
|
41,042
|
|
—
|
|
41,042
|
|
|||||||||
|
Customer financing receivable
|
5,919
|
|
—
|
|
5,919
|
|
—
|
|
5,919
|
|
||||||||||
|
Prepaid expenses and other current assets
|
25,639
|
|
2,830
|
|
4
|
28,469
|
|
173
|
|
28,642
|
|
|||||||||
|
Total current assets
|
490,359
|
|
(10,384
|
)
|
479,975
|
|
(4,427
|
)
|
475,548
|
|
||||||||||
|
Property, plant and equipment, net
|
384,377
|
|
243,008
|
|
5
|
627,385
|
|
—
|
|
627,385
|
|
|||||||||
|
Customer financing receivable, non-current
|
62,615
|
|
—
|
|
62,615
|
|
—
|
|
62,615
|
|
||||||||||
|
Restricted cash (noncurrent)
|
116,890
|
|
—
|
|
116,890
|
|
—
|
|
116,890
|
|
||||||||||
|
Deferred cost of revenue, non-current
|
57,286
|
|
(53,562
|
)
|
3
|
3,724
|
|
—
|
|
3,724
|
|
|||||||||
|
Other long-term assets
|
58,400
|
|
9,319
|
|
6
|
67,719
|
|
3,232
|
|
70,951
|
|
|||||||||
|
Total assets
|
$
|
1,169,927
|
|
$
|
188,381
|
|
$
|
1,358,308
|
|
$
|
(1,195
|
)
|
$
|
1,357,113
|
|
|||||
|
Liabilities, Redeemable Noncontrolling Interest, Stockholders’ Deficit and Noncontrolling Interest
|
||||||||||||||||||||
|
Current liabilities:
|
||||||||||||||||||||
|
Accounts payable
|
$
|
81,060
|
|
$
|
—
|
|
$
|
81,060
|
|
$
|
—
|
|
$
|
81,060
|
|
|||||
|
Accrued warranty
|
15,295
|
|
(1,159
|
)
|
7
|
14,136
|
|
(1,274
|
)
|
12,862
|
|
|||||||||
|
Accrued expense and other current liabilities
|
82,150
|
|
(2,534
|
)
|
8
|
79,616
|
|
—
|
|
79,616
|
|
|||||||||
|
Financing obligations
|
—
|
|
10,420
|
|
10
|
10,420
|
|
—
|
|
10,420
|
|
|||||||||
|
Deferred revenue and customer deposits
|
88,060
|
|
(13,856
|
)
|
11
|
74,204
|
|
3,347
|
|
77,551
|
|
|||||||||
|
Current portion of recourse debt
|
15,678
|
|
—
|
|
15,678
|
|
—
|
|
15,678
|
|
||||||||||
|
Current portion of non-recourse debt
|
7,983
|
|
—
|
|
7,983
|
|
—
|
|
7,983
|
|
||||||||||
|
Current portion of non-recourse debt from related parties
|
3,500
|
|
—
|
|
3,500
|
|
—
|
|
3,500
|
|
||||||||||
|
Total current liabilities
|
293,726
|
|
(7,129
|
)
|
286,597
|
|
2,073
|
|
288,670
|
|
||||||||||
|
Derivative liabilities
|
14,648
|
|
5,636
|
|
20,284
|
|
—
|
|
20,284
|
|
||||||||||
|
Deferred revenue and customer deposits, net of current portion
|
179,712
|
|
(92,390
|
)
|
11
|
87,322
|
|
34,954
|
|
122,276
|
|
|||||||||
|
Financing obligations, non-current
|
—
|
|
397,272
|
|
10
|
397,272
|
|
—
|
|
397,272
|
|
|||||||||
|
Long-term portion of recourse debt
|
359,959
|
|
—
|
|
359,959
|
|
—
|
|
359,959
|
|
||||||||||
|
Long-term portion of non-recourse debt
|
217,334
|
|
—
|
|
217,334
|
|
—
|
|
217,334
|
|
||||||||||
|
Long-term portion of recourse debt from related parties
|
27,734
|
|
—
|
|
27,734
|
|
—
|
|
27,734
|
|
||||||||||
|
Long-term portion of non-recourse debt from related parties
|
31,781
|
|
—
|
|
31,781
|
|
—
|
|
31,781
|
|
||||||||||
|
Other long-term liabilities
|
56,117
|
|
(27,264
|
)
|
8
|
28,853
|
|
(1
|
)
|
28,852
|
|
|||||||||
|
Total liabilities
|
1,181,011
|
|
276,125
|
|
1,457,136
|
|
37,026
|
|
1,494,162
|
|
||||||||||
|
Redeemable noncontrolling interest
|
557
|
|
—
|
|
557
|
|
—
|
|
557
|
|
||||||||||
169
|
September 30, 2019
|
||||||||||||||||||||
|
|
As Previously Reported
|
Restatement Impacts
|
As Restated
|
ASC 606 Adoption Impacts
|
As Restated & Recast
|
|||||||||||||||
|
Stockholders’ deficit:
|
||||||||||||||||||||
|
Common stock
|
12
|
|
—
|
|
12
|
|
—
|
|
12
|
|
||||||||||
|
Additional paid-in capital
|
2,647,118
|
|
756
|
|
12
|
2,647,874
|
|
—
|
|
2,647,874
|
|
|||||||||
|
Accumulated other comprehensive loss
|
(147
|
)
|
—
|
|
(147
|
)
|
—
|
|
(147
|
)
|
||||||||||
|
Accumulated deficit
|
(2,753,830
|
)
|
(88,500
|
)
|
(2,842,330
|
)
|
(38,221
|
)
|
(2,880,551
|
)
|
||||||||||
|
Total stockholders’ deficit
|
(106,847
|
)
|
(87,744
|
)
|
(194,591
|
)
|
(38,221
|
)
|
(232,812
|
)
|
||||||||||
|
Noncontrolling interest
|
95,206
|
|
—
|
|
95,206
|
|
—
|
|
95,206
|
|
||||||||||
|
Total liabilities, redeemable noncontrolling interest, stockholders' deficit and noncontrolling interest
|
$
|
1,169,927
|
|
$
|
188,381
|
|
$
|
1,358,308
|
|
$
|
(1,195
|
)
|
$
|
1,357,113
|
|
|||||
1
Accounts receivable — The correction of these misstatements resulted from the change of accounting for Managed Services Agreements, for which the amount recorded to accounts receivable represents amounts invoiced for capacity billings to end customers which have not yet been collected by the financing entity as of the period end.
2
Inventories — The correction of these misstatements resulted from the change of accounting for inventory, including net capitalization of stock-based compensation costs of
$3.7 million
, and reclassification of inventories of
$11.5 million
on held for shipments to customers under the Managed Services Program and similar arrangements to construction in progress within property, plant and equipment, net.
3
Deferred cost of revenue, current and non-current — The correction of these misstatements resulted from reclassifying deferred cost of revenue to property, plant and equipment, net for the leased Energy Servers under the Managed Services Agreements and similar sale-leaseback arrangements of
$7.4 million
(short-term) and
$53.6 million
(long-term), and net capitalization of stock-based compensation costs of
$0.8 million
into current deferred cost of revenue, and
the correction of certain other immaterial misstatements identified to relieve installation deferred cost of revenue of
$3.1 million
.
4
Prepaid expenses and other current assets — The correction of these misstatements resulted from the change of accounting for Managed Services Agreements and similar arrangements where prepaid property tax and insurance payments are now classified within prepaid expenses, rather than offset against deferred revenue.
5
Property, plant and equipment, net — The correction of these misstatements resulted from the change of accounting for Managed Services transactions and similar arrangements, whereby product and install costs of goods sold are now recorded as property, plant and equipment, net in the cases where the risks of ownership have not completely transferred to the financing party of
$239.3 million
. This includes a net capitalization of stock-based compensation costs for these assets of
$3.7 million
.
6
Other long-term assets — The correction of these misstatements resulted from the change of accounting for Managed Services Agreements and similar arrangements whereby the timing difference of capacity billings to end customers and the payments received from the financing entity is recorded within long term receivables and prepaid property tax and insurance payments are now classified within other long-term assets, rather than offset against long-term deferred revenue.
7
Accrued warranty — The correction of these misstatements resulted from the change of accounting for accrued warranty which is now recorded on an as-incurred basis for our Managed Services Agreements and similar arrangements, reducing accrued warranty by
$0.1 million
and the change of accounting for the grid pricing escalation guarantees we provided in some of our sales arrangements, which are now recorded as derivative liabilities, reducing accrued warranty by
$1.1 million
.
8
Accrued expense and other current liabilities and other long-term liabilities — The correction of these misstatements resulted from the change of accounting for Managed Services Agreements, for which historical accrued liabilities recorded at inception of the agreements, as well as subsequent reductions of those liabilities, were reversed.
9
Financing obligations, current and non-current — The correction of these misstatements resulted from the change of accounting for Managed Services Agreements and similar arrangements, whereby instead of recognizing the upfront proceeds received from the bank as revenue, the proceeds received are classified as financing obligations.
10
Deferred revenue and customer deposits, current and non-current — The correction of these misstatements resulted from the change of accounting for the recognition of product and installation revenue from upfront or ratable recognition to recognition of the capacity payments received from the end customer as power is generated by the Energy Servers as electricity revenue.
11
Derivative liabilities — The correction of these misstatements resulted from the change of accounting for embedded derivatives related to grid pricing escalation guarantees we provided in some of our sales arrangements. These are now recorded as derivative liabilities and were previously treated as an accrued liability.
12
Additional paid-in capital — Relates to the correction of an unadjusted misstatement in the valuation of our 6% Notes derivative, resulting in a credit to additional paid-in capital and additional expense of
$0.8 million
recorded within other expense, net.
170
|
March 31, 2018
|
||||||||||||
|
|
|
As Previously Reported
|
Revision Impacts
|
As Revised
|
||||||||
|
Assets
|
|
|
|
|
|
|
||||||
|
Current assets:
|
|
|
|
|
|
|
||||||
|
Cash and cash equivalents
|
|
$
|
88,227
|
|
$
|
—
|
|
$
|
88,227
|
|
||
|
Restricted cash
|
|
22,998
|
|
—
|
|
22,998
|
|
|||||
|
Short-term investments
|
|
20,138
|
|
—
|
|
20,138
|
|
|||||
|
Accounts receivable
|
|
58,520
|
|
3,476
|
|
1
|
61,996
|
|
||||
|
Inventories
|
|
97,079
|
|
(3,047
|
)
|
2
|
94,032
|
|
||||
|
Deferred cost of revenue
|
|
81,229
|
|
(37,814
|
)
|
3
|
43,415
|
|
||||
|
Customer financing receivable
|
|
5,303
|
|
—
|
|
5,303
|
|
|||||
|
Prepaid expenses and other current assets
|
|
27,836
|
|
1,108
|
|
4
|
28,944
|
|
||||
|
Total current assets
|
|
401,330
|
|
(36,277
|
)
|
365,053
|
|
|||||
|
Property, plant and equipment, net
|
|
487,169
|
|
215,059
|
|
5
|
702,228
|
|
||||
|
Customer financing receivable, non-current
|
|
71,337
|
|
—
|
|
71,337
|
|
|||||
|
Restricted cash (noncurrent)
|
|
32,367
|
|
—
|
|
32,367
|
|
|||||
|
Deferred cost of revenue, non-current
|
|
155,658
|
|
(155,605
|
)
|
3
|
53
|
|
||||
|
Other long-term assets
|
|
36,773
|
|
6,406
|
|
6
|
43,179
|
|
||||
|
Total assets
|
|
$
|
1,184,634
|
|
$
|
29,583
|
|
$
|
1,214,217
|
|
||
|
Liabilities, Convertible Redeemable Preferred Stock, Redeemable Noncontrolling Interest, Stockholders’ Deficit and Noncontrolling Interest
|
|
|||||||||||
|
Current liabilities:
|
||||||||||||
|
Accounts payable
|
$
|
47,755
|
|
$
|
—
|
|
$
|
47,755
|
|
|||
|
Accrued warranty
|
16,723
|
|
(329
|
)
|
7
|
16,394
|
|
|||||
|
Accrued expenses and other current liabilities
|
57,683
|
|
(4,029
|
)
|
8
|
53,654
|
|
|||||
|
Financing obligations
|
—
|
|
6,556
|
|
10
|
6,556
|
|
|||||
|
Deferred revenue and customer deposits
|
99,449
|
|
(27,963
|
)
|
11
|
71,486
|
|
|||||
|
Current portion of recourse debt
|
6,017
|
|
—
|
|
6,017
|
|
||||||
|
Current portion of non-recourse debt
|
17,583
|
|
—
|
|
17,583
|
|
||||||
|
Current portion of non-recourse debt from related parties
|
1,525
|
|
—
|
|
1,525
|
|
||||||
|
Total current liabilities
|
246,735
|
|
(25,765
|
)
|
220,970
|
|
||||||
|
Preferred stock warrant liabilities
|
6,554
|
|
—
|
|
6,554
|
|
||||||
|
Derivative liabilities
|
163,854
|
|
4,217
|
|
168,071
|
|
||||||
|
Deferred revenue and customer deposits, net of current portion
|
306,153
|
|
(216,652
|
)
|
11
|
89,501
|
|
|||||
|
Financing obligations, non-current
|
—
|
|
321,682
|
|
10
|
321,682
|
|
|||||
|
Long-term portion of recourse debt
|
517,483
|
|
—
|
|
517,483
|
|
||||||
|
Long-term portion of non-recourse debt
|
302,345
|
|
—
|
|
302,345
|
|
||||||
|
Long-term portion of recourse debt from related parties
|
70,202
|
|
—
|
|
70,202
|
|
||||||
|
Long-term portion of non-recourse debt from related parties
|
35,312
|
|
—
|
|
35,312
|
|
||||||
|
Other long-term liabilities
|
51,860
|
|
(30,107
|
)
|
8
|
21,753
|
|
|||||
|
Total liabilities
|
1,700,498
|
|
53,375
|
|
1,753,873
|
|
||||||
|
|
||||||||||||
171
|
March 31, 2018
|
||||||||||||
|
|
|
As Previously Reported
|
Revision Impacts
|
As Revised
|
||||||||
|
Redeemable noncontrolling interest
|
58,176
|
|
—
|
|
58,176
|
|
||||||
|
Convertible redeemable preferred stock
|
1,465,841
|
|
—
|
|
1,465,841
|
|
||||||
|
Stockholders’ deficit:
|
||||||||||||
|
Common stock
|
1
|
|
—
|
|
1
|
|
||||||
|
Additional paid-in capital
|
158,605
|
|
—
|
|
158,605
|
|
||||||
|
Accumulated other comprehensive income
|
117
|
|
—
|
|
117
|
|
||||||
|
Accumulated deficit
|
(2,348,363
|
)
|
(23,792
|
)
|
(2,372,155
|
)
|
||||||
|
Total stockholders’ deficit
|
(2,189,640
|
)
|
(23,792
|
)
|
(2,213,432
|
)
|
||||||
|
Noncontrolling interest
|
149,759
|
|
—
|
|
149,759
|
|
||||||
|
Total liabilities, redeemable noncontrolling interest, convertible redeemable preferred stock, stockholders' deficit and noncontrolling interest
|
$
|
1,184,634
|
|
$
|
29,583
|
|
$
|
1,214,217
|
|
|||
1
Accounts receivable — The correction of these misstatements resulted from the change of accounting for Managed Services Agreements, for which the amount recorded to accounts receivable represents amounts invoiced for capacity billings to end customers which have not yet been collected by the financing entity as of the period end.
2
Inventories — The correction of these misstatements resulted from the change of accounting for inventory, including net capitalization of stock-based compensation costs of
$0.3 million
, and reclassification of inventories of
$3.4 million
held for shipments to customers under the Managed Services Program and similar arrangements to construction in progress within property, plant and equipment, net.
3
Deferred cost of revenue, current and non-current — The correction of these misstatements resulted from reclassifying deferred cost of revenue to property, plant and equipment, net for the leased Energy Servers under the Managed Services Agreements and similar sale-leaseback arrangements of
$38.2 million
(short-term) and
$155.6 million
(long-term), and net capitalization of stock-based compensation costs of
$0.3 million
into current deferred cost of revenue.
4
Prepaid expenses and other current assets — The correction of these misstatements resulted from the change of accounting for Managed Services Agreements and similar arrangements where prepaid property tax and insurance payments are now classified within prepaid expenses, rather than offset against deferred revenue.
5
Property, plant and equipment, net — The correction of these misstatements resulted from the change of accounting for Managed Services transactions and similar arrangements, whereby product and install costs of goods sold are now recorded as property, plant and equipment, net in the cases where the risks of ownership have not completely transferred to the financing party of
$214.1 million
. This includes a net capitalization of stock-based compensation costs for these assets of
$0.9 million
.
6
Other long-term assets — The correction of these misstatements resulted from the change of accounting for Managed Services Agreements and similar arrangements whereby the timing difference of capacity billings to end customers and the payments received from the financing entity is recorded within long term receivables and prepaid property tax and insurance payments are now classified within other long-term assets, rather than offset against long-term deferred revenue.
7
Accrued warranty — The correction of these misstatements resulted from the change of accounting for the grid pricing escalation guarantees we provided in some of our sales arrangements, which are now recorded as derivative liabilities of
$0.3 million
.
8
Accrued expense and other current liabilities and other long-term liabilities — The correction of these misstatements resulted from the change of accounting for Managed Services Agreements, for which historical accrued liabilities recorded at inception of the agreements, as well as subsequent reductions of those liabilities, were reversed.
9
Financing obligations, current and non-current — The correction of these misstatements resulted from the change of accounting for Managed Services Agreements and similar arrangements, whereby instead of recognizing the upfront proceeds received from the bank as revenue, the proceeds received are classified as financing obligations.
10
Deferred revenue and customer deposits, current and non-current — The correction of these misstatements resulted from the change of accounting for the recognition of product and installation revenue from upfront or ratable recognition to recognition of the capacity payments received from the end customer as power is generated by the Energy Servers as electricity revenue.
11
Derivative liabilities — The correction of these misstatements resulted from the change of accounting for embedded derivatives related to grid pricing escalation guarantees we provided in some of our sales arrangements. These are now recorded as derivative liabilities and were previously treated as an accrued liability.
172
|
June 30, 2018
|
||||||||||||
|
|
|
As Previously Reported
|
Restatement Impacts
|
As Restated
|
||||||||
|
Assets
|
|
|||||||||||
|
Current assets:
|
|
|||||||||||
|
Cash and cash equivalents
|
|
$
|
91,596
|
|
$
|
—
|
|
$
|
91,596
|
|
||
|
Restricted cash
|
|
25,860
|
|
—
|
|
25,860
|
|
|||||
|
Short-term investments
|
|
15,703
|
|
—
|
|
15,703
|
|
|||||
|
Accounts receivable
|
|
36,804
|
|
3,638
|
|
1
|
40,442
|
|
||||
|
Inventories
|
|
136,433
|
|
(7,149
|
)
|
2
|
129,284
|
|
||||
|
Deferred cost of revenue
|
|
55,476
|
|
(19,822
|
)
|
3
|
35,654
|
|
||||
|
Customer financing receivable
|
|
5,398
|
|
—
|
|
5,398
|
|
|||||
|
Prepaid expenses and other current assets
|
|
23,003
|
|
1,817
|
|
4
|
24,820
|
|
||||
|
Total current assets
|
|
390,273
|
|
(21,516
|
)
|
368,757
|
|
|||||
|
Property, plant and equipment, net
|
|
477,765
|
|
219,579
|
|
5
|
697,344
|
|
||||
|
Customer financing receivable, non-current
|
|
69,963
|
|
—
|
|
69,963
|
|
|||||
|
Restricted cash (noncurrent)
|
|
32,416
|
|
—
|
|
32,416
|
|
|||||
|
Deferred cost of revenue, non-current
|
|
148,934
|
|
(148,874
|
)
|
3
|
60
|
|
||||
|
Other long-term assets
|
|
38,386
|
|
6,855
|
|
6
|
45,241
|
|
||||
|
Total assets
|
|
$
|
1,157,737
|
|
$
|
56,044
|
|
$
|
1,213,781
|
|
||
|
Liabilities, Redeemable Noncontrolling Interest, convertible redeemable preferred stock, Stockholders’ Deficit and Noncontrolling Interest
|
|
|||||||||||
|
Current liabilities:
|
||||||||||||
|
Accounts payable
|
$
|
53,798
|
|
$
|
—
|
|
$
|
53,798
|
|
|||
|
Accrued warranty
|
14,928
|
|
(641
|
)
|
7
|
14,287
|
|
|||||
|
Accrued expenses and other current liabilities
|
54,832
|
|
(4,900
|
)
|
8
|
49,932
|
|
|||||
|
Financing obligations
|
—
|
|
6,792
|
|
10
|
6,792
|
|
|||||
|
Deferred revenue and customer deposits
|
94,582
|
|
(28,528
|
)
|
11
|
66,054
|
|
|||||
|
Current portion of recourse debt
|
10,351
|
|
—
|
|
10,351
|
|
||||||
|
Current portion of non-recourse debt
|
18,025
|
|
—
|
|
18,025
|
|
||||||
|
Current portion of non-recourse debt from related parties
|
1,630
|
|
—
|
|
1,630
|
|
||||||
|
Total current liabilities
|
248,146
|
|
(27,277
|
)
|
220,869
|
|
||||||
|
Preferred stock warrant liabilities
|
2,369
|
|
—
|
|
2,369
|
|
||||||
|
Derivative liabilities
|
188,199
|
|
4,217
|
|
192,416
|
|
||||||
|
Deferred revenue and customer deposits, net of current portion
|
301,550
|
|
(212,920
|
)
|
11
|
88,630
|
|
|||||
|
Financing obligations, non-current
|
—
|
|
356,727
|
|
10
|
356,727
|
|
|||||
|
Long-term portion of recourse debt
|
524,934
|
|
—
|
|
524,934
|
|
||||||
|
Long-term portion of non-recourse debt
|
298,048
|
|
—
|
|
298,048
|
|
||||||
|
Long-term portion of recourse debt from related parties
|
72,087
|
|
—
|
|
72,087
|
|
||||||
|
Long-term portion of non-recourse debt from related parties
|
35,054
|
|
—
|
|
35,054
|
|
||||||
|
Other long-term liabilities
|
52,153
|
|
(30,589
|
)
|
8
|
21,564
|
|
|||||
|
Total liabilities
|
1,722,540
|
|
90,158
|
|
1,812,698
|
|
||||||
173
|
June 30, 2018
|
||||||||||||
|
|
|
As Previously Reported
|
Restatement Impacts
|
As Restated
|
||||||||
|
Redeemable noncontrolling interest
|
54,940
|
|
—
|
|
54,940
|
|
||||||
|
Convertible redeemable preferred stock
|
1,465,841
|
|
—
|
|
1,465,841
|
|
||||||
|
Stockholders’ deficit:
|
||||||||||||
|
Common stock
|
1
|
|
—
|
|
1
|
|
||||||
|
Additional paid-in capital
|
166,805
|
|
—
|
|
166,805
|
|
||||||
|
Accumulated other comprehensive income
|
217
|
|
—
|
|
217
|
|
||||||
|
Accumulated deficit
|
(2,394,040
|
)
|
(34,114
|
)
|
(2,428,154
|
)
|
||||||
|
Total stockholders’ deficit
|
(2,227,017
|
)
|
(34,114
|
)
|
(2,261,131
|
)
|
||||||
|
Noncontrolling interest
|
141,433
|
|
—
|
|
141,433
|
|
||||||
|
Total liabilities, redeemable noncontrolling interest, convertible redeemable preferred stock, stockholders' deficit and noncontrolling interest
|
$
|
1,157,737
|
|
$
|
56,044
|
|
$
|
1,213,781
|
|
|||
1
Accounts receivable — The correction of these misstatements resulted from the change of accounting for Managed Services Agreements, for which the amount recorded to accounts receivable represents amounts invoiced for capacity billings to end customers which have not yet been collected by the financing entity as of the period end.
2
Inventories — The correction of these misstatements resulted from the change of accounting for inventory, including net capitalization of stock-based compensation expenses of
$0.9 million
, and reclassification of inventories of
$8.0 million
held for shipments planned to customers under the Managed Services Program and similar arrangements now accounted for as construction in progress within property, plant and equipment, net.
3
Deferred cost of revenue, current and non-current — The correction of these misstatements resulted from the cumulative net change of accounting moving deferred cost of revenue to property, plant and equipment, net, a decrease for the leased Energy Servers under the Managed Services Agreements and similar sale-leaseback arrangements of
$20.1 million
(short-term) and
$148.9 million
(long-term), and the cumulative net absorption in current deferred cost of revenue for overhead in related to stock-based compensation expenses of
$0.3 million
.
4
Prepaid expenses and other current assets — The correction of these misstatements resulted from the cumulative net change of accounting for Managed Services Agreements and similar arrangements where prepaid property tax and insurance payments are now classified within prepaid expenses.
5
Property, plant and equipment, net — The correction of these misstatements resulted from the change of accounting for Managed Services transactions and similar arrangements, whereby product and install costs of goods sold are now recorded as property, plant and equipment, net in the cases where the risks of ownership have not completely transferred to the financing party of
$218.6 million
. This includes a net capitalization of stock-based compensation costs for these assets of
$1.0 million
.
6
Other long-term assets — The correction of these misstatements resulted from the cumulative net change of accounting for Managed Services Agreements and similar arrangements whereby the timing difference of capacity billings to end customers and the payments received from the financing entity is recorded within long term receivables and prepaid property tax and insurance payments are now classified within long term prepaid expenses, rather than offset against long-term deferred revenue.
7
Accrued warranty — The correction of these misstatements resulted from the change of accounting for accrued warranty which is now recorded on an as-incurred basis on our Managed Services Agreements and similar arrangements of
$0.4 million
and also includes the cumulative net change of accounting for the change of accounting for the grid pricing escalation guarantees we provided in some of our sales arrangements of
$0.3 million
.
8
Accrued expense and other current liabilities and other long-term liabilities — The correction of these misstatements resulted from the change of accounting for Managed Services Agreements, for which historical accrued liabilities recorded at inception of the agreements, as well as subsequent reductions of those liabilities, were reversed.
9
Financing obligations, current and non-current — The correction of these misstatements resulted from the change of accounting for Managed Services Agreements and similar arrangements, whereby instead of recognizing the upfront proceeds received from the bank as revenue, the proceeds received are classified as financing obligations.
10
Deferred revenue and customer deposits, current and non-current — The correction of these misstatements resulted from the cumulative change of accounting for the recognition of product and installation revenue from upfront or ratable recognition to recognition of the capacity payments received from the end customer as power is generated by the Energy Servers as electricity revenue.
11
Derivative liabilities — The correction of these misstatements resulted from the cumulative net change of accounting for embedded derivatives related to grid pricing escalation guarantees we provided in some of our sales arrangements. These commitments were previously treated as an accrued liability.
174
|
September 30, 2018
|
||||||||||||
|
|
|
As Previously Reported
|
Restatement Impacts
|
As Restated
|
||||||||
|
Assets
|
|
|||||||||||
|
Current assets:
|
|
|||||||||||
|
Cash and cash equivalents
|
|
$
|
395,516
|
|
$
|
—
|
|
$
|
395,516
|
|
||
|
Restricted cash
|
|
17,931
|
|
—
|
|
17,931
|
|
|||||
|
Short-term investments
|
|
4,494
|
|
—
|
|
4,494
|
|
|||||
|
Accounts receivable
|
|
41,485
|
|
3,776
|
|
1
|
45,261
|
|
||||
|
Inventories
|
|
134,725
|
|
3,053
|
|
2
|
137,778
|
|
||||
|
Deferred cost of revenue
|
|
66,009
|
|
(20,826
|
)
|
3
|
45,183
|
|
||||
|
Customer financing receivable
|
|
5,496
|
|
—
|
|
5,496
|
|
|||||
|
Prepaid expenses and other current assets
|
|
32,876
|
|
3,623
|
|
4
|
36,499
|
|
||||
|
Total current assets
|
|
698,532
|
|
(10,374
|
)
|
688,158
|
|
|||||
|
Property, plant and equipment, net
|
|
471,074
|
|
227,049
|
|
5
|
698,123
|
|
||||
|
Customer financing receivable, non-current
|
|
68,535
|
|
—
|
|
68,535
|
|
|||||
|
Restricted cash (noncurrent)
|
|
30,779
|
|
—
|
|
30,779
|
|
|||||
|
Deferred cost of revenue, non-current
|
|
139,217
|
|
(139,172
|
)
|
3
|
45
|
|
||||
|
Other long-term assets
|
|
37,008
|
|
7,389
|
|
6
|
44,397
|
|
||||
|
Total assets
|
|
$
|
1,445,145
|
|
$
|
84,892
|
|
$
|
1,530,037
|
|
||
|
Liabilities, Redeemable Noncontrolling Interest, Stockholders’ Deficit and Noncontrolling Interest
|
|
|||||||||||
|
Current liabilities:
|
||||||||||||
|
Accounts payable
|
$
|
59,818
|
|
$
|
—
|
|
$
|
59,818
|
|
|||
|
Accrued warranty
|
17,975
|
|
(663
|
)
|
7
|
17,312
|
|
|||||
|
Accrued expenses and other current liabilities
|
66,873
|
|
(2,887
|
)
|
8
|
63,986
|
|
|||||
|
Financing obligations
|
—
|
|
7,780
|
|
10
|
7,780
|
|
|||||
|
Deferred revenue and customer deposits
|
105,265
|
|
(32,527
|
)
|
11
|
72,738
|
|
|||||
|
Current portion of recourse debt
|
1,686
|
|
—
|
|
1,686
|
|
||||||
|
Current portion of non-recourse debt
|
18,499
|
|
—
|
|
18,499
|
|
||||||
|
Current portion of non-recourse debt from related parties
|
1,737
|
|
—
|
|
1,737
|
|
||||||
|
Total current liabilities
|
271,853
|
|
(28,297
|
)
|
243,556
|
|
||||||
|
Derivative liabilities
|
9,441
|
|
4,217
|
|
13,658
|
|
||||||
|
Deferred revenue and customer deposits, net of current portion
|
290,481
|
|
(201,277
|
)
|
11
|
89,204
|
|
|||||
|
Financing obligations, non-current
|
—
|
|
375,254
|
|
10
|
375,254
|
|
|||||
|
Long-term portion of recourse debt
|
358,363
|
|
—
|
|
358,363
|
|
||||||
|
Long-term portion of non-recourse debt
|
293,593
|
|
—
|
|
293,593
|
|
||||||
|
Long-term portion of recourse debt from related parties
|
32,168
|
|
—
|
|
32,168
|
|
||||||
|
Long-term portion of non-recourse debt from related parties
|
34,765
|
|
—
|
|
34,765
|
|
||||||
|
Other long-term liabilities
|
48,161
|
|
(29,724
|
)
|
8
|
18,437
|
|
|||||
|
Total liabilities
|
1,338,825
|
|
120,173
|
|
1,458,998
|
|
||||||
175
|
September 30, 2018
|
||||||||||||
|
|
|
As Previously Reported
|
Restatement Impacts
|
As Restated
|
||||||||
|
Redeemable noncontrolling interest
|
56,446
|
|
—
|
|
56,446
|
|
||||||
|
Stockholders’ deficit:
|
||||||||||||
|
Common stock
|
11
|
|
—
|
|
11
|
|
||||||
|
Additional paid-in capital
|
2,387,361
|
|
755
|
|
12
|
2,388,116
|
|
|||||
|
Accumulated other comprehensive income
|
272
|
|
—
|
|
272
|
|
||||||
|
Accumulated deficit
|
(2,472,619
|
)
|
(36,036
|
)
|
(2,508,655
|
)
|
||||||
|
Total stockholders’ deficit
|
(84,975
|
)
|
(35,281
|
)
|
(120,256
|
)
|
||||||
|
Noncontrolling interest
|
134,849
|
|
—
|
|
134,849
|
|
||||||
|
Total liabilities, redeemable noncontrolling interest, stockholders' deficit and noncontrolling interest
|
$
|
1,445,145
|
|
$
|
84,892
|
|
$
|
1,530,037
|
|
|||
1
Accounts receivable — The correction of these misstatements resulted from the change of accounting for Managed Services Agreements, for which the amount recorded to accounts receivable represents amounts invoiced for capacity billings to end customers which have not yet been collected by the financing entity as of the period end.
2
Inventories — The correction of these misstatements resulted from the change of accounting for inventory, including net capitalization of stock-based compensation costs of
$7.2 million
, and reclassification of inventories of
$4.1 million
held for shipments to customers under the Managed Services Program and similar arrangements to construction in progress within property, plant and equipment, net.
3
Deferred cost of revenue, current and non-current — The correction of these misstatements resulted from reclassifying deferred cost of revenue to property, plant and equipment, net for the leased Energy Servers under the Managed Services Agreements and similar sale-leaseback arrangements of
$23.8 million
(short-term) and
$139.2 million
(long-term), and net capitalization of stock-based compensation costs of
$3.0 million
into current deferred cost of revenue.
4
Prepaid expenses and other current assets — The correction of these misstatements resulted from the change of accounting for Managed Services Agreements and similar arrangements whereby prepaid property tax and insurance payments are now classified within prepaid expenses, rather than offset against deferred revenue.
5
Property, plant and equipment, net — The correction of these misstatements resulted from the change of accounting for Managed Services transactions and similar arrangements, whereby product and install costs of goods sold are now recorded as property, plant and equipment, net in the cases where the risks of ownership have not completely transferred to the financing party of
$224.6 million
. This includes a net capitalization of stock-based compensation costs for these assets of
$2.4 million
.
6
Other long-term assets — The correction of these misstatements resulted from the change of accounting for Managed Services Agreements and similar arrangements where the timing difference of capacity billings to end customers and the payments received from the financing entity is recorded within long term receivables and where prepaid property tax and insurance payments are now classified within other long-term assets, rather than offset against long-term deferred revenue.
7
Accrued warranty — The correction of these misstatements resulted from the change of accounting for accrued warranty which is now recorded on an as-incurred basis for our Managed Services Agreements and similar arrangements, reducing accrued warranty by
$0.4 million
and the change of accounting for the grid pricing escalation guarantees we provided in some of our sales arrangements, which are now recorded as derivative liabilities of
$0.3 million
.
8
Accrued expense and other current liabilities and other long-term liabilities — The correction of these misstatements resulted from the change of accounting for Managed Services Agreements, for which historical accrued liabilities recorded at inception of the agreements, as well as subsequent reductions of those liabilities, were reversed.
9
Financing obligations, current and non-current — The correction of these misstatements resulted from the change of accounting for Managed Services Agreements and similar arrangements, whereby instead of recognizing the upfront proceeds received from the bank as revenue, the proceeds received are classified as financing obligations.
10
Deferred revenue and customer deposits, current and non-current — The correction of these misstatements resulted from the change of accounting for the recognition of product and installation revenue from upfront or ratable recognition to recognition of the capacity payments received from the end customer as power is generated by the Energy Servers as electricity revenue.
11
Derivative liabilities — The correction of these misstatements resulted from the change of accounting for embedded derivatives related to grid pricing escalation guarantees we provided in some of our sales arrangements. These are now recorded as derivative liabilities and were previously treated as an accrued liability.
12
Additional paid-in capital — Relates to the correction of an unadjusted misstatement in the valuation of our 6% Notes derivative, resulting in a credit to additional paid-in capital and additional expense of
$0.8 million
recorded within other expense, net.
.
176
The following tables contain the restatement and recasting of previously reported unaudited condensed consolidated statements of operations for the three-month period ended March 31, 2019, the three- and six-month periods ended June 30, 2019 and the three- and nine-month periods ended September 30, 2019, the restatement of previously reported unaudited condensed consolidated statements of operations for the three- and six-month periods ended June 30, 2018 and the three- and nine-month periods ended September 30, 2018 and the revision of the previously reported unaudited condensed consolidated statement of operations for the three-month period ended March 31, 2018. Reconciliation to the previously reported unaudited condensed consolidated statements of comprehensive loss is not provided, as there is no change to those statements for any period, with the exception of the change to net loss, described in the tables below. Reconciliation to the previously reported unaudited condensed consolidated statements of convertible redeemable preferred stock, redeemable noncontrolling interest, stockholders' deficit and noncontrolling is not provided, as there is no change to those statements for any period, with the exception of the correction of an uncorrected misstatement within additional paid-in capital for
$0.8 million
in the three months ended September 30, 2018.
|
|
|
Three Months Ended March 31, 2019
|
||||||||||||||||||
|
|
|
As Previously Reported
|
Restatement Impacts
|
As Restated
|
ASC 606 Adoption Impacts
|
As Restated & Recast
|
||||||||||||||
|
Revenue:
|
|
|
|
|
|
|
||||||||||||||
|
Product
|
|
$
|
141,734
|
|
$
|
(48,171
|
)
|
a
|
$
|
93,563
|
|
$
|
(2,637
|
)
|
$
|
90,926
|
|
|||
|
Installation
|
22,258
|
|
(11,195
|
)
|
a
|
11,063
|
|
1,156
|
|
12,219
|
|
|||||||||
|
Service
|
|
23,290
|
|
(574
|
)
|
a
|
22,716
|
|
751
|
|
23,467
|
|
||||||||
|
Electricity
|
|
13,425
|
|
6,964
|
|
a
|
20,389
|
|
—
|
|
20,389
|
|
||||||||
|
Total revenue
|
|
200,707
|
|
(52,976
|
)
|
|
147,731
|
|
(730
|
)
|
147,001
|
|
||||||||
|
Cost of revenue:
|
|
|||||||||||||||||||
|
Product
|
124,000
|
|
(34,980
|
)
|
c, d
|
89,020
|
|
(248
|
)
|
88,772
|
|
|||||||||
|
Installation
|
24,166
|
|
(8,406
|
)
|
c
|
15,760
|
|
—
|
|
15,760
|
|
|||||||||
|
Service
|
|
27,557
|
|
1,331
|
|
b, d
|
28,888
|
|
(967
|
)
|
27,921
|
|
||||||||
|
Electricity
|
|
9,229
|
|
3,755
|
|
c
|
12,984
|
|
—
|
|
12,984
|
|
||||||||
|
Total cost of revenue
|
184,952
|
|
(38,300
|
)
|
|
146,652
|
|
(1,215
|
)
|
145,437
|
|
|||||||||
|
Gross profit
|
15,755
|
|
(14,676
|
)
|
1,079
|
|
485
|
|
1,564
|
|
||||||||||
|
Operating expenses:
|
||||||||||||||||||||
|
Research and development
|
28,859
|
|
—
|
|
28,859
|
|
—
|
|
28,859
|
|
||||||||||
|
Sales and marketing
|
20,463
|
|
2
|
|
e
|
20,465
|
|
(92
|
)
|
20,373
|
|
|||||||||
|
General and administrative
|
39,074
|
|
—
|
|
39,074
|
|
—
|
|
39,074
|
|
||||||||||
|
Total operating expenses
|
88,396
|
|
2
|
|
88,398
|
|
(92
|
)
|
88,306
|
|
||||||||||
|
Income (loss) from operations
|
(72,641
|
)
|
(14,678
|
)
|
(87,319
|
)
|
577
|
|
(86,742
|
)
|
||||||||||
|
Interest income
|
1,885
|
|
—
|
|
|
1,885
|
|
—
|
|
1,885
|
|
|||||||||
|
Interest expense
|
(15,962
|
)
|
(5,838
|
)
|
f
|
(21,800
|
)
|
—
|
|
(21,800
|
)
|
|||||||||
|
Interest expense to related parties
|
(1,612
|
)
|
—
|
|
(1,612
|
)
|
—
|
|
(1,612
|
)
|
||||||||||
|
Other income (expense), net
|
265
|
|
—
|
|
265
|
|
—
|
|
265
|
|
||||||||||
|
Loss on revaluation of warrant liabilities and embedded derivatives
|
—
|
|
(540
|
)
|
g
|
(540
|
)
|
—
|
|
(540
|
)
|
|||||||||
|
Loss before income taxes
|
(88,065
|
)
|
(21,056
|
)
|
(109,121
|
)
|
577
|
|
(108,544
|
)
|
||||||||||
|
Income tax provision
|
208
|
|
—
|
|
208
|
|
—
|
|
208
|
|
||||||||||
|
Net loss
|
(88,273
|
)
|
(21,056
|
)
|
(109,329
|
)
|
577
|
|
(108,752
|
)
|
||||||||||
|
Net loss attributable to noncontrolling interests and redeemable noncontrolling interests
|
(3,832
|
)
|
—
|
|
(3,832
|
)
|
—
|
|
(3,832
|
)
|
||||||||||
|
Net loss attributable to Class A and Class B common stockholders
|
$
|
(84,441
|
)
|
$
|
(21,056
|
)
|
$
|
(105,497
|
)
|
$
|
577
|
|
$
|
(104,920
|
)
|
|||||
177
a
Revenue impacted by Managed Services restatements — The correction of these misstatements resulted from the change from upfront recognition of product and installation revenue to recognition of the capacity payments received from the end customer as power is generated by the Energy Servers as electricity revenue over the term of our Managed Services Agreements and similar sale-leaseback arrangements, which also impacted our service revenue allocation.
b
Service cost of revenue impacted by grid pricing escalation guarantees — The correction of these misstatements resulted in a change in the accounting for our grid escalation guarantees that resulted in a decrease in service cost of revenue of
$0.1 million
.
c Cost of revenue impacted by Managed Services restatements — The correction of these misstatements resulted from the change from upfront recognition of product and installation cost of revenue to recognition of the depreciation expense on the capitalized Energy Servers over their useful life of 21 years for our Managed Services Agreements and similar sale-leaseback transactions, resulting in a decrease in product cost of revenue of
$37.5 million
and installation cost of revenue of
$9.2 million
, offset by an increase in electricity cost of revenue of
$3.7 million
, together with the correction of certain other immaterial misstatements identified to record installation cost of revenue of
$0.8 million
.
d
Cost of revenue impacted by stock-based compensation allocation — The correction of these misstatements resulted from the capitalization of stock-based compensation costs, with a net increase to product cost of revenue of
$2.5 million
and an increase in service cost of revenue of
$1.4 million
due to the expensing of stock-based compensation related to field replacement units.
e
Sales and marketing and general and administrative expenses — The correction of these misstatements primarily resulted from the change of accounting for sales commission expense on an as earned basis, to accounting for the expense over the term of our Managed Services Agreements and similar sale-leaseback arrangements.
f
Interest expense — The correction of these misstatements resulted from the change of accounting for sales that should have been accounted for as financing transactions, in which the upfront consideration received from the financing party is accounted for as a financing obligation and interest expense is recognized over the term of the Managed Services Agreement using the effective interest method.
g
Gain (loss) on revaluation of warrant liabilities and embedded derivatives — The correction of these misstatements resulted from the change of accounting for the grid pricing escalation guarantees we provided in some of our sales arrangements which is now recorded as a derivative liability that needs to be fair valued each period end. The fair value increased resulting in a loss of
$0.5 million
.
178
|
|
|
Three Months Ended June 30, 2019
|
||||||||||||||||||
|
|
|
As Previously Reported
|
Restatement Impacts
|
As Restated
|
ASC 606 Adoption Impacts
|
As Restated & Recast
|
||||||||||||||
|
Revenue:
|
|
|
|
|
|
|
||||||||||||||
|
Product
|
|
$
|
179,899
|
|
$
|
(22,757
|
)
|
a
|
$
|
157,142
|
|
$
|
(13,061
|
)
|
$
|
144,081
|
|
|||
|
Installation
|
17,285
|
|
(5,900
|
)
|
a
|
11,385
|
|
1,691
|
|
13,076
|
|
|||||||||
|
Service
|
|
23,659
|
|
(586
|
)
|
a
|
23,073
|
|
(47
|
)
|
23,026
|
|
||||||||
|
Electricity
|
|
12,939
|
|
7,204
|
|
a
|
20,143
|
|
—
|
|
20,143
|
|
||||||||
|
Total revenue
|
|
233,782
|
|
(22,039
|
)
|
|
211,743
|
|
(11,417
|
)
|
200,326
|
|
||||||||
|
Cost of revenue:
|
|
|||||||||||||||||||
|
Product
|
131,952
|
|
(19,005
|
)
|
c, d
|
112,947
|
|
281
|
|
113,228
|
|
|||||||||
|
Installation
|
22,116
|
|
(4,431
|
)
|
c
|
17,685
|
|
—
|
|
17,685
|
|
|||||||||
|
Service
|
|
19,599
|
|
920
|
|
b, d
|
20,519
|
|
(1,756
|
)
|
18,763
|
|
||||||||
|
Electricity
|
|
18,442
|
|
3,858
|
|
c
|
22,300
|
|
—
|
|
22,300
|
|
||||||||
|
Total cost of revenue
|
192,109
|
|
(18,658
|
)
|
|
173,451
|
|
(1,475
|
)
|
171,976
|
|
|||||||||
|
Gross profit
|
41,673
|
|
(3,381
|
)
|
38,292
|
|
(9,942
|
)
|
28,350
|
|
||||||||||
|
Operating expenses:
|
||||||||||||||||||||
|
Research and development
|
29,772
|
|
—
|
|
29,772
|
|
—
|
|
29,772
|
|
||||||||||
|
Sales and marketing
|
18,359
|
|
17
|
|
e
|
18,376
|
|
(182
|
)
|
18,194
|
|
|||||||||
|
General and administrative
|
43,662
|
|
—
|
|
43,662
|
|
—
|
|
43,662
|
|
||||||||||
|
Total operating expenses
|
91,793
|
|
17
|
|
91,810
|
|
(182
|
)
|
91,628
|
|
||||||||||
|
Loss from operations
|
(50,120
|
)
|
(3,398
|
)
|
(53,518
|
)
|
(9,760
|
)
|
(63,278
|
)
|
||||||||||
|
Interest income
|
1,700
|
|
—
|
|
|
1,700
|
|
—
|
|
1,700
|
|
|||||||||
|
Interest expense
|
(16,725
|
)
|
(5,997
|
)
|
f
|
(22,722
|
)
|
—
|
|
(22,722
|
)
|
|||||||||
|
Interest expense to related parties
|
(1,606
|
)
|
—
|
|
(1,606
|
)
|
—
|
|
(1,606
|
)
|
||||||||||
|
Other income (expense), net
|
(222
|
)
|
—
|
|
(222
|
)
|
—
|
|
(222
|
)
|
||||||||||
|
Loss on revaluation of warrant liabilities and embedded derivatives
|
—
|
|
(540
|
)
|
g
|
(540
|
)
|
—
|
|
(540
|
)
|
|||||||||
|
Loss before income taxes
|
(66,973
|
)
|
(9,935
|
)
|
(76,908
|
)
|
(9,760
|
)
|
(86,668
|
)
|
||||||||||
|
Income tax provision
|
258
|
|
—
|
|
258
|
|
—
|
|
258
|
|
||||||||||
|
Net loss
|
(67,231
|
)
|
(9,935
|
)
|
(77,166
|
)
|
(9,760
|
)
|
(86,926
|
)
|
||||||||||
|
Net loss attributable to noncontrolling interests and redeemable noncontrolling interests
|
(5,015
|
)
|
—
|
|
(5,015
|
)
|
—
|
|
(5,015
|
)
|
||||||||||
|
Net loss attributable to Class A and Class B common stockholders
|
$
|
(62,216
|
)
|
$
|
(9,935
|
)
|
$
|
(72,151
|
)
|
$
|
(9,760
|
)
|
$
|
(81,911
|
)
|
|||||
a
Revenue impacted by Managed Services restatements — The correction of these misstatements resulted from the change from upfront recognition of product and installation revenue to recognition of the capacity payments received from the end customer as power is generated by the Energy Servers as electricity revenue over the term of our Managed Services Agreements and similar sale-leaseback arrangements, which also impacted our service revenue allocation.
b
Service cost of revenue impacted by grid pricing escalation guarantees — The correction of these misstatements resulted in a change in accounting for our grid escalation guarantees that resulted in a decrease in service cost of revenue of
$0.1 million
.
c Cost of revenue impacted by Managed Services restatements — The correction of these misstatements resulted from the change from upfront recognition of product and installation cost of revenue to recognition of the depreciation expense on the capitalized Energy Servers over their useful life of 21 years for our Managed Services Agreements and similar sale-leaseback transactions, resulting in a decrease in product cost of revenue of
$18.1 million
and installation cost of revenue of
$5.2 million
, offset by an increase in electricity cost of revenue of
$3.8 million
, together with the correction of certain other immaterial misstatements identified to record installation cost of revenue of
$0.8 million
.
d
Cost of revenue impacted by stock-based compensation allocation — The correction of these misstatements resulted from the capitalization of stock-based compensation costs, with a net benefit to product cost of revenue of
$0.9 million
and an increase in service cost of revenue of
$1.0 million
due to the expensing of stock-based compensation related to field replacement units.
e
Sales and marketing and general and administrative expenses — The correction of these misstatements primarily resulted from the change of accounting for sales commission expense on an as earned basis, to accounting for the expense over the term of our Managed Services Agreements and similar sale-leaseback arrangements.
179
f
Interest expense — The correction of these misstatements resulted from the change of accounting for sales that should have been accounted for as financing transactions, in which the upfront consideration received from the financing party is accounted for as a financing obligation and interest expense is recognized over the term of the Managed Services Agreement using the effective interest method.
g
Gain (loss) on revaluation of warrant liabilities and embedded derivatives — The correction of these misstatements resulted from the change of accounting for the grid pricing escalation guarantees we provided in some of our sales arrangements which is now recorded as a derivative liability that needs to be fair valued each period end. The fair value increased resulting in a loss of
$0.5 million
.
180
|
|
|
Three Months Ended September 30, 2019
|
||||||||||||||||||
|
|
|
As Previously Reported
|
Restatement Impacts
|
As Restated
|
ASC 606 Adoption Impacts
|
As Restated & Recast
|
||||||||||||||
|
Revenue:
|
|
|
|
|
|
|
||||||||||||||
|
Product
|
|
$
|
182,616
|
|
$
|
(1,292
|
)
|
a
|
$
|
181,324
|
|
$
|
(17,422
|
)
|
$
|
163,902
|
|
|||
|
Installation
|
19,010
|
|
(460
|
)
|
a
|
18,550
|
|
2,552
|
|
21,102
|
|
|||||||||
|
Service
|
|
23,597
|
|
(779
|
)
|
a
|
22,818
|
|
847
|
|
23,665
|
|
||||||||
|
Electricity
|
|
8,248
|
|
7,390
|
|
a
|
15,638
|
|
—
|
|
15,638
|
|
||||||||
|
Total revenue
|
|
233,471
|
|
4,859
|
|
|
238,330
|
|
(14,023
|
)
|
224,307
|
|
||||||||
|
Cost of revenue:
|
|
|||||||||||||||||||
|
Product
|
94,056
|
|
(2,085
|
)
|
c, d
|
91,971
|
|
(274
|
)
|
91,697
|
|
|||||||||
|
Installation
|
26,162
|
|
(21
|
)
|
c
|
26,141
|
|
—
|
|
26,141
|
|
|||||||||
|
Service
|
|
36,539
|
|
2,073
|
|
b, d
|
38,612
|
|
(2,185
|
)
|
36,427
|
|
||||||||
|
Electricity
|
|
23,249
|
|
4,068
|
|
c
|
27,317
|
|
—
|
|
27,317
|
|
||||||||
|
Total cost of revenue
|
180,006
|
|
4,035
|
|
|
184,041
|
|
(2,459
|
)
|
181,582
|
|
|||||||||
|
Gross profit
|
53,465
|
|
824
|
|
54,289
|
|
(11,564
|
)
|
42,725
|
|
||||||||||
|
Operating expenses:
|
||||||||||||||||||||
|
Research and development
|
23,389
|
|
—
|
|
23,389
|
|
—
|
|
23,389
|
|
||||||||||
|
Sales and marketing
|
18,125
|
|
43
|
|
e
|
18,168
|
|
(519
|
)
|
17,649
|
|
|||||||||
|
General and administrative
|
36,599
|
|
—
|
|
36,599
|
|
—
|
|
36,599
|
|
||||||||||
|
Total operating expenses
|
78,113
|
|
43
|
|
78,156
|
|
(519
|
)
|
77,637
|
|
||||||||||
|
Income (loss) from operations
|
(24,648
|
)
|
781
|
|
(23,867
|
)
|
(11,045
|
)
|
(34,912
|
)
|
||||||||||
|
Interest income
|
1,214
|
|
—
|
|
|
1,214
|
|
—
|
|
1,214
|
|
|||||||||
|
Interest expense
|
(15,280
|
)
|
(6,043
|
)
|
f
|
(21,323
|
)
|
—
|
|
(21,323
|
)
|
|||||||||
|
Interest expense to related parties
|
(1,605
|
)
|
—
|
|
(1,605
|
)
|
—
|
|
(1,605
|
)
|
||||||||||
|
Other income, net
|
525
|
|
—
|
|
525
|
|
—
|
|
525
|
|
||||||||||
|
Loss on revaluation of warrant liabilities and embedded derivatives
|
—
|
|
(540
|
)
|
g
|
(540
|
)
|
—
|
|
(540
|
)
|
|||||||||
|
Loss before income taxes
|
(39,794
|
)
|
(5,802
|
)
|
(45,596
|
)
|
(11,045
|
)
|
(56,641
|
)
|
||||||||||
|
Income tax provision
|
136
|
|
—
|
|
136
|
|
—
|
|
136
|
|
||||||||||
|
Net loss
|
(39,930
|
)
|
(5,802
|
)
|
(45,732
|
)
|
(11,045
|
)
|
(56,777
|
)
|
||||||||||
|
Net loss attributable to noncontrolling interests and redeemable noncontrolling interests
|
(5,027
|
)
|
—
|
|
(5,027
|
)
|
—
|
|
(5,027
|
)
|
||||||||||
|
Net loss attributable to Class A and Class B common stockholders
|
$
|
(34,903
|
)
|
$
|
(5,802
|
)
|
$
|
(40,705
|
)
|
$
|
(11,045
|
)
|
$
|
(51,750
|
)
|
|||||
a
Revenue impacted by Managed Services restatements — The correction of these misstatements resulted from the change from upfront recognition of product and installation revenue to recognition of the capacity payments received from the end customer as power is generated by the Energy Servers as electricity revenue over the term of our Managed Services Agreements and similar sale-leaseback arrangements, which also impacted our service revenue allocation.
b
Service cost of revenue impacted by grid pricing escalation guarantees — The correction of these misstatements resulted in a change in accounting for our grid escalation guarantees that resulted in a decrease in service cost of revenue of
$0.1 million
.
c Cost of revenue impacted by Managed Services restatements — The correction of these misstatements resulted from the change from upfront recognition of product and installation cost of revenue to recognition of the depreciation expense on the capitalized Energy Servers over their useful life of 21 years for our Managed Services Agreements and similar sale-leaseback transactions, resulting in a decrease in product cost of revenue of
$1.1 million
, a decrease of installation cost of revenue of
$0.6 million
, offset by an increase in electricity cost of revenue of
$4.0 million
together with the correction of certain other immaterial misstatements identified to record installation cost of revenue of
$0.6 million
.
d
Cost of revenue impacted by stock-based compensation allocation — The correction of these misstatements resulted from the capitalization of stock-based compensation costs, with a net benefit to product cost of revenue of
$1.0 million
and an increase in service cost of revenue of
$2.2 million
due to the expensing of stock-based compensation related to field replacement units.
e
Sales and marketing and general and administrative expenses — The correction of these misstatements primarily resulted from the change of accounting for sales commission expense on an as earned basis, to accounting for the expense over the term of our Managed Services Agreements and similar sale-leaseback arrangements.
181
f
Interest expense — The correction of these misstatements resulted from the change of accounting for sales that should have been accounted for as financing transactions, in which the upfront consideration received from the financing party is accounted for as a financing obligation and interest expense is recognized over the term of the Managed Services Agreement using the effective interest method.
g
Gain (loss) on revaluation of warrant liabilities and embedded derivatives — The correction of these misstatements resulted from the change of accounting for the grid pricing escalation guarantees we provided in some of our sales arrangements which is now recorded as a derivative liability that needs to be fair valued each period end. The fair value increased resulting in a loss of
$0.5 million
.
182
|
|
|
Six Months Ended June 30, 2019
|
||||||||||||||||||
|
|
|
As Previously Reported
|
Restatement Impacts
|
As Restated
|
ASC 606 Adoption Impacts
|
As Restated & Recast
|
||||||||||||||
|
Revenue:
|
|
|
|
|
|
|
||||||||||||||
|
Product
|
|
$
|
321,633
|
|
$
|
(70,928
|
)
|
a
|
$
|
250,705
|
|
$
|
(15,698
|
)
|
$
|
235,007
|
|
|||
|
Installation
|
39,543
|
|
(17,095
|
)
|
a
|
22,448
|
|
2,847
|
|
25,295
|
|
|||||||||
|
Service
|
|
46,949
|
|
(1,160
|
)
|
a
|
45,789
|
|
704
|
|
46,493
|
|
||||||||
|
Electricity
|
|
26,364
|
|
14,168
|
|
a
|
40,532
|
|
—
|
|
40,532
|
|
||||||||
|
Total revenue
|
|
434,489
|
|
(75,015
|
)
|
|
359,474
|
|
(12,147
|
)
|
347,327
|
|
||||||||
|
Cost of revenue:
|
|
|||||||||||||||||||
|
Product
|
255,952
|
|
(53,985
|
)
|
c, d
|
201,967
|
|
33
|
|
202,000
|
|
|||||||||
|
Installation
|
46,282
|
|
(12,837
|
)
|
c
|
33,445
|
|
—
|
|
33,445
|
|
|||||||||
|
Service
|
|
47,156
|
|
2,251
|
|
b, d
|
49,407
|
|
(2,723
|
)
|
46,684
|
|
||||||||
|
Electricity
|
|
27,671
|
|
7,613
|
|
c
|
35,284
|
|
—
|
|
35,284
|
|
||||||||
|
Total cost of revenue
|
377,061
|
|
(56,958
|
)
|
|
320,103
|
|
(2,690
|
)
|
317,413
|
|
|||||||||
|
Gross profit
|
57,428
|
|
(18,057
|
)
|
39,371
|
|
(9,457
|
)
|
29,914
|
|
||||||||||
|
Operating expenses:
|
||||||||||||||||||||
|
Research and development
|
58,631
|
|
—
|
|
58,631
|
|
—
|
|
58,631
|
|
||||||||||
|
Sales and marketing
|
38,822
|
|
19
|
|
e
|
38,841
|
|
(274
|
)
|
38,567
|
|
|||||||||
|
General and administrative
|
82,736
|
|
—
|
|
82,736
|
|
—
|
|
82,736
|
|
||||||||||
|
Total operating expenses
|
180,189
|
|
19
|
|
180,208
|
|
(274
|
)
|
179,934
|
|
||||||||||
|
Loss from operations
|
(122,761
|
)
|
(18,076
|
)
|
(140,837
|
)
|
(9,183
|
)
|
(150,020
|
)
|
||||||||||
|
Interest income
|
3,585
|
|
—
|
|
|
3,585
|
|
—
|
|
3,585
|
|
|||||||||
|
Interest expense
|
(32,687
|
)
|
(11,835
|
)
|
f
|
(44,522
|
)
|
—
|
|
(44,522
|
)
|
|||||||||
|
Interest expense to related parties
|
(3,218
|
)
|
—
|
|
(3,218
|
)
|
—
|
|
(3,218
|
)
|
||||||||||
|
Other income, net
|
43
|
|
—
|
|
43
|
|
—
|
|
43
|
|
||||||||||
|
Loss on revaluation of warrant liabilities and embedded derivatives
|
—
|
|
(1,080
|
)
|
g
|
(1,080
|
)
|
—
|
|
(1,080
|
)
|
|||||||||
|
Loss before income taxes
|
(155,038
|
)
|
(30,991
|
)
|
(186,029
|
)
|
(9,183
|
)
|
(195,212
|
)
|
||||||||||
|
Income tax provision
|
466
|
|
—
|
|
466
|
|
—
|
|
466
|
|
||||||||||
|
Net loss
|
(155,504
|
)
|
(30,991
|
)
|
(186,495
|
)
|
(9,183
|
)
|
(195,678
|
)
|
||||||||||
|
Net loss attributable to noncontrolling interests and redeemable noncontrolling interests
|
(8,847
|
)
|
—
|
|
(8,847
|
)
|
—
|
|
(8,847
|
)
|
||||||||||
|
Net loss attributable to Class A and Class B common stockholders
|
$
|
(146,657
|
)
|
$
|
(30,991
|
)
|
$
|
(177,648
|
)
|
$
|
(9,183
|
)
|
$
|
(186,831
|
)
|
|||||
a
Revenue impacted by Managed Services restatements — The correction of these misstatements resulted from the change from upfront recognition of product and installation revenue to recognition of the capacity payments received from the end customer as power is generated by the Energy Servers as electricity revenue over the term of our Managed Services Agreements and similar sale-leaseback arrangements, which also impacted our service revenue allocation.
b
Service cost of revenue impacted by grid pricing escalation guarantees — The correction of these misstatements resulted in a change in accounting for our grid escalation guarantees that resulted in a decrease in service cost of revenue of
$0.2 million
.
c Cost of revenue impacted by Managed Services restatements — The correction of these misstatements resulted from the change from upfront recognition of product and installation cost of revenue to recognition of the depreciation expense on the capitalized Energy Servers over their useful life of 21 years for our Managed Services Agreements and similar sale-leaseback transactions, resulting in a decrease in product cost of revenue of
$55.6 million
and installation cost of revenue of
$14.4 million
, offset by an increase in electricity cost of revenue of
$7.5 million
, together with the correction of certain other immaterial misstatements identified to record installation cost of revenue of
$1.6 million
.
d
Cost of revenue impacted by stock-based compensation allocation — The correction of these misstatements resulted from the capitalization of stock-based compensation costs, with a net increase to product cost of revenue of
$1.6 million
, and an increase in service cost of revenue of
$2.4 million
due to the expensing of stock-based compensation related to field replacement units.
e
Sales and marketing and general and administrative expenses — The correction of these misstatements primarily resulted from the change of accounting for sales commission expense on an as earned basis, to accounting for the expense over the term of our Managed Services Agreements and similar sale-leaseback arrangements.
183
f
Interest expense — The correction of these misstatements resulted from the change of accounting for sales that should have been accounted for as financing transactions, in which the upfront consideration received from the financing party is accounted for as a financing obligation and interest expense is recognized over the term of the Managed Services Agreement using the effective interest method.
g
Gain (loss) on revaluation of warrant liabilities and embedded derivatives — The correction of these misstatements resulted from the change of accounting for the grid pricing escalation guarantees we provided in some of our sales arrangements which is now recorded as a derivative liability that needs to be fair valued each period end. The fair value increased resulting in a loss of
$1.1 million
.
184
|
|
|
Nine Months Ended September 30, 2019
|
||||||||||||||||||
|
|
|
As Previously Reported
|
Restatement Impacts
|
As Restated
|
ASC 606 Adoption Impacts
|
As Restated & Recast
|
||||||||||||||
|
Revenue:
|
|
|
|
|
|
|
||||||||||||||
|
Product
|
|
$
|
504,249
|
|
$
|
(72,220
|
)
|
a
|
$
|
432,029
|
|
$
|
(33,120
|
)
|
$
|
398,909
|
|
|||
|
Installation
|
58,553
|
|
(17,555
|
)
|
a
|
40,998
|
|
5,399
|
|
46,397
|
|
|||||||||
|
Service
|
|
70,546
|
|
(1,939
|
)
|
a
|
68,607
|
|
1,551
|
|
70,158
|
|
||||||||
|
Electricity
|
|
34,612
|
|
21,558
|
|
a
|
56,170
|
|
—
|
|
56,170
|
|
||||||||
|
Total revenue
|
|
667,960
|
|
(70,156
|
)
|
|
597,804
|
|
(26,170
|
)
|
571,634
|
|
||||||||
|
Cost of revenue:
|
|
|||||||||||||||||||
|
Product
|
350,008
|
|
(56,070
|
)
|
c, d
|
293,938
|
|
(241
|
)
|
293,697
|
|
|||||||||
|
Installation
|
72,444
|
|
(12,858
|
)
|
c
|
59,586
|
|
—
|
|
59,586
|
|
|||||||||
|
Service
|
|
83,695
|
|
4,324
|
|
b, d
|
88,019
|
|
(4,908
|
)
|
83,111
|
|
||||||||
|
Electricity
|
|
50,920
|
|
11,681
|
|
c
|
62,601
|
|
—
|
|
62,601
|
|
||||||||
|
Total cost of revenue
|
557,067
|
|
(52,923
|
)
|
|
504,144
|
|
(5,149
|
)
|
498,995
|
|
|||||||||
|
Gross profit
|
110,893
|
|
(17,233
|
)
|
93,660
|
|
(21,021
|
)
|
72,639
|
|
||||||||||
|
Operating expenses:
|
||||||||||||||||||||
|
Research and development
|
82,020
|
|
—
|
|
82,020
|
|
—
|
|
82,020
|
|
||||||||||
|
Sales and marketing
|
56,947
|
|
62
|
|
e
|
57,009
|
|
(793
|
)
|
56,216
|
|
|||||||||
|
General and administrative
|
119,335
|
|
—
|
|
119,335
|
|
—
|
|
119,335
|
|
||||||||||
|
Total operating expenses
|
258,302
|
|
62
|
|
258,364
|
|
(793
|
)
|
257,571
|
|
||||||||||
|
Loss from operations
|
(147,409
|
)
|
(17,295
|
)
|
(164,704
|
)
|
(20,228
|
)
|
(184,932
|
)
|
||||||||||
|
Interest income
|
4,799
|
|
—
|
|
|
4,799
|
|
—
|
|
4,799
|
|
|||||||||
|
Interest expense
|
(47,967
|
)
|
(17,878
|
)
|
f
|
(65,845
|
)
|
—
|
|
(65,845
|
)
|
|||||||||
|
Interest expense to related parties
|
(4,823
|
)
|
—
|
|
(4,823
|
)
|
—
|
|
(4,823
|
)
|
||||||||||
|
Other income, net
|
568
|
|
—
|
|
568
|
|
—
|
|
568
|
|
||||||||||
|
Loss on revaluation of warrant liabilities and embedded derivatives
|
—
|
|
(1,620
|
)
|
g
|
(1,620
|
)
|
—
|
|
(1,620
|
)
|
|||||||||
|
Loss before income taxes
|
(194,832
|
)
|
(36,793
|
)
|
(231,625
|
)
|
(20,228
|
)
|
(251,853
|
)
|
||||||||||
|
Income tax provision
|
602
|
|
—
|
|
602
|
|
—
|
|
602
|
|
||||||||||
|
Net loss
|
(195,434
|
)
|
(36,793
|
)
|
(232,227
|
)
|
(20,228
|
)
|
(252,455
|
)
|
||||||||||
|
Net loss attributable to noncontrolling interests and redeemable noncontrolling interests
|
(13,874
|
)
|
—
|
|
(13,874
|
)
|
—
|
|
(13,874
|
)
|
||||||||||
|
Net loss attributable to Class A and Class B common stockholders
|
$
|
(181,560
|
)
|
$
|
(36,793
|
)
|
$
|
(218,353
|
)
|
$
|
(20,228
|
)
|
$
|
(238,581
|
)
|
|||||
a
Revenue impacted by Managed Services restatements — The correction of these misstatements resulted from the change from upfront recognition of product and installation revenue to recognition of the capacity payments received from the end customer as power is generated by the Energy Servers as electricity revenue over the term of our Managed Services Agreements and similar sale-leaseback arrangements, which also impacted our service revenue allocation.
b
Service cost of revenue impacted by grid pricing escalation guarantees — The correction of these misstatements resulted in a change in accounting for our grid escalation guarantees that resulted in a decrease in service cost of revenue of
$0.3 million
.
c Cost of revenue impacted by Managed Services restatements — The correction of these misstatements resulted from the change from upfront recognition of product and installation cost of revenue to recognition of the depreciation expense on the capitalized Energy Servers over their useful life of 21 years for our Managed Services Agreements and similar sale-leaseback transactions, resulting in a decrease in product cost of revenue of
$56.7 million
and installation cost of revenue of
$15.0 million
, offset by an increase in electricity cost of revenue of
$11.6 million
, together with the correction of certain other immaterial misstatements identified to record installation cost of revenue of
$2.1 million
d
Cost of revenue impacted by stock-based compensation allocation — The correction of these misstatements resulted from the capitalization of stock-based compensation costs, with a net increase to product cost of revenue of
$0.6 million
and an increase in service cost of revenue of
$4.6 million
due to the expensing of stock-based compensation related to field replacement units.
e
Sales and marketing and general and administrative expenses — The correction of these misstatements primarily resulted from the change of accounting for sales commission expense on an as earned basis, to accounting for the expense over the term of our Managed Services Agreements and similar sale-leaseback arrangements.
185
f
Interest expense — The correction of these misstatements resulted from the change of accounting for sales that should have been accounted for as financing transactions, in which the upfront consideration received from the financing party is accounted for as a financing obligation and interest expense is recognized over the term of the Managed Services Agreement using the effective interest method.
g
Gain (loss) on revaluation of warrant liabilities and embedded derivatives — The correction of these misstatements resulted from the change of accounting for the grid pricing escalation guarantees we provided in some of our sales arrangements which is now recorded as a derivative liability that needs to be fair valued each period end. The fair value increased resulting in a loss of
$1.6 million
.
186
|
|
|
Three Months Ended March 31, 2018
|
||||||||||
|
|
|
As Previously Reported
|
Revision Impacts
|
As Revised
|
||||||||
|
Revenue:
|
|
|
|
|
|
|
||||||
|
Product
|
|
$
|
121,307
|
|
$
|
(5,536
|
)
|
a
|
$
|
115,771
|
|
|
|
Installation
|
14,118
|
|
(1,323
|
)
|
a
|
12,795
|
|
|||||
|
Service
|
|
19,907
|
|
227
|
|
a
|
20,134
|
|
||||
|
Electricity
|
|
14,029
|
|
5,853
|
|
a
|
19,882
|
|
||||
|
Total revenue
|
|
169,361
|
|
(779
|
)
|
|
168,582
|
|
||||
|
Cost of revenue:
|
|
|||||||||||
|
Product
|
80,355
|
|
(3,890
|
)
|
c, d
|
76,465
|
|
|||||
|
Installation
|
10,438
|
|
(1,240
|
)
|
c
|
9,198
|
|
|||||
|
Service
|
|
24,253
|
|
446
|
|
d
|
24,699
|
|
||||
|
Electricity
|
|
10,649
|
|
3,136
|
|
c
|
13,785
|
|
||||
|
Total cost of revenue
|
125,695
|
|
(1,548
|
)
|
|
124,147
|
|
|||||
|
Gross profit
|
43,666
|
|
769
|
|
44,435
|
|
||||||
|
Operating expenses:
|
||||||||||||
|
Research and development
|
14,731
|
|
—
|
|
14,731
|
|
||||||
|
Sales and marketing
|
8,262
|
|
31
|
|
e
|
8,293
|
|
|||||
|
General and administrative
|
14,988
|
|
—
|
|
14,988
|
|
||||||
|
Total operating expenses
|
37,981
|
|
31
|
|
38,012
|
|
||||||
|
Income from operations
|
5,685
|
|
738
|
|
6,423
|
|
||||||
|
Interest income
|
415
|
|
—
|
|
|
415
|
|
|||||
|
Interest expense
|
(21,379
|
)
|
(4,613
|
)
|
f
|
(25,992
|
)
|
|||||
|
Interest expense to related parties
|
(2,627
|
)
|
—
|
|
(2,627
|
)
|
||||||
|
Other expense, net
|
(75
|
)
|
—
|
|
(75
|
)
|
||||||
|
Loss on revaluation of warrant liabilities and embedded derivatives
|
(4,034
|
)
|
—
|
|
(4,034
|
)
|
||||||
|
Loss before income taxes
|
(22,015
|
)
|
(3,875
|
)
|
(25,890
|
)
|
||||||
|
Income tax provision
|
333
|
|
—
|
|
333
|
|
||||||
|
Net loss
|
(22,348
|
)
|
(3,875
|
)
|
(26,223
|
)
|
||||||
|
Net loss attributable to noncontrolling interests and redeemable noncontrolling interests
|
(4,632
|
)
|
—
|
|
(4,632
|
)
|
||||||
|
Net loss attributable to Class A and Class B common stockholders
|
$
|
(17,716
|
)
|
$
|
(3,875
|
)
|
$
|
(21,591
|
)
|
|||
a
Revenue impacted by Managed Services restatements — The correction of these misstatements resulted from the change from upfront recognition of product and installation revenue to recognition of the capacity payments received from the end customer as power is generated by the Energy Servers as electricity revenue over the term of our Managed Services Agreements and similar sale-leaseback arrangements, which also impacted our service revenue allocation.
b Not used.
c Cost of revenue impacted by Managed Services restatements — The correction of these misstatements resulted from the change from upfront recognition of product and installation cost of revenue to recognition of the depreciation expense on the capitalized Energy Servers over their useful life of 21 years for our Managed Services Agreements and similar sale-leaseback transactions, resulting in a decrease in product cost of revenue of
$3.6 million
and installation cost of revenue of
$1.2 million
, offset by an increase in electricity cost of revenue of
$3.1 million
.
d
Cost of revenue impacted by stock-based compensation allocation — The correction of these misstatements resulted from the capitalization of stock-based compensation costs, with a net benefit to product cost of revenue of
$0.3 million
and an increase in service cost of revenue of
$0.4 million
due to the expensing of stock-based compensation related to field replacement units.
e
Sales and marketing and general and administrative expenses — The correction of these misstatements primarily resulted from the change of accounting for sales commission expense on an as earned basis, to accounting for the expense over the term of our Managed Services Agreements and similar sale-leaseback arrangements.
187
f
Interest expense — The correction of these misstatements resulted from the change of accounting for sales that should have been accounted for as financing transactions, in which the upfront consideration received from the financing party is accounted for as a financing obligation and interest expense is recognized over the term of the Managed Services Agreement using the effective interest method.
188
|
|
|
Three Months Ended June 30, 2018
|
||||||||||
|
|
|
As Previously Reported
|
Restatement Impacts
|
As Restated
|
||||||||
|
Revenue:
|
|
|
|
|
|
|
||||||
|
Product
|
|
$
|
108,654
|
|
$
|
(30,157
|
)
|
a
|
$
|
78,497
|
|
|
|
Installation
|
26,245
|
|
(6,602
|
)
|
a
|
19,643
|
|
|||||
|
Service
|
|
19,975
|
|
324
|
|
a
|
20,299
|
|
||||
|
Electricity
|
|
14,007
|
|
5,856
|
|
a
|
19,863
|
|
||||
|
Total revenue
|
|
168,881
|
|
(30,579
|
)
|
|
138,302
|
|
||||
|
Cost of revenue:
|
|
|||||||||||
|
Product
|
70,802
|
|
(21,199
|
)
|
c, d
|
49,603
|
|
|||||
|
Installation
|
37,099
|
|
(7,148
|
)
|
c
|
29,951
|
|
|||||
|
Service
|
|
19,260
|
|
442
|
|
d
|
19,702
|
|
||||
|
Electricity
|
|
8,949
|
|
3,113
|
|
c
|
12,062
|
|
||||
|
Total cost of revenue
|
136,110
|
|
(24,792
|
)
|
|
111,318
|
|
|||||
|
Gross profit
|
32,771
|
|
(5,787
|
)
|
26,984
|
|
||||||
|
Operating expenses:
|
||||||||||||
|
Research and development
|
14,413
|
|
—
|
|
14,413
|
|
||||||
|
Sales and marketing
|
8,254
|
|
(87
|
)
|
e
|
8,167
|
|
|||||
|
General and administrative
|
15,359
|
|
—
|
|
15,359
|
|
||||||
|
Total operating expenses
|
38,026
|
|
(87
|
)
|
37,939
|
|
||||||
|
Loss from operations
|
(5,255
|
)
|
(5,700
|
)
|
(10,955
|
)
|
||||||
|
Interest income
|
444
|
|
—
|
|
|
444
|
|
|||||
|
Interest expense
|
(22,525
|
)
|
(4,622
|
)
|
f
|
(27,147
|
)
|
|||||
|
Interest expense to related parties
|
(2,672
|
)
|
—
|
|
(2,672
|
)
|
||||||
|
Other expense, net
|
(855
|
)
|
—
|
|
(855
|
)
|
||||||
|
Loss on revaluation of warrant liabilities and embedded derivatives
|
(19,197
|
)
|
—
|
|
(19,197
|
)
|
||||||
|
Loss before income taxes
|
(50,060
|
)
|
(10,322
|
)
|
(60,382
|
)
|
||||||
|
Income tax provision
|
128
|
|
—
|
|
128
|
|
||||||
|
Net loss
|
(50,188
|
)
|
(10,322
|
)
|
(60,510
|
)
|
||||||
|
Net loss attributable to noncontrolling interests and redeemable noncontrolling interests
|
(4,512
|
)
|
—
|
|
(4,512
|
)
|
||||||
|
Net loss attributable to Class A and Class B common stockholders
|
$
|
(45,676
|
)
|
$
|
(10,322
|
)
|
$
|
(55,998
|
)
|
|||
a
Revenue impacted by Managed Services restatements — The correction of these misstatements resulted from the change from upfront recognition of product and installation revenue to recognition of the capacity payments received from the end customer as power is generated by the Energy Servers as electricity revenue over the term of our Managed Services Agreements and similar sale-leaseback arrangements, which impacted our service revenue allocation.
b Not used.
c Cost of revenue impacted by Managed Services restatements — The correction of these misstatements resulted from the change from upfront recognition of product and installation costs of revenue to recognition of the depreciation expense on the capitalized Energy Servers over their useful life of 21 years for our Managed Services Agreements and similar sale-leaseback transactions, resulting in a decrease in product cost of revenue of
$20.3 million
and installation cost of revenue of
$7.1 million
, offset by an increase in electricity cost of revenue of
$3.1 million
.
d
Cost of revenue impacted by stock-based compensation allocation — The correction of these misstatements resulted from the capitalization of stock-based compensation costs, with a net benefit to product cost of revenue of
$0.9 million
and an increase in service cost of revenue of
$0.4 million
due to the expensing of stock-based compensation related to field replacement units.
e
Sales and marketing and general and administrative expenses — The correction of these misstatements primarily resulted from the change of accounting for sales commission expense on an as earned basis, to accounting for the expense over the term of our Managed Services Agreements and similar sale-leaseback arrangements.
189
f
Interest expense — The correction of these misstatements resulted from the change of accounting for sales that should have been accounted for as financing transactions, in which the upfront consideration received from the financing party is accounted for as a financing obligation and interest expense is recognized over the term of the Managed Services Agreement using the effective interest method.
190
|
|
|
Three Months Ended September 30, 2018
|
||||||||||
|
|
|
As Previously Reported
|
Restatement Impacts
|
As Restated
|
||||||||
|
Revenue:
|
|
|
|
|
|
|
||||||
|
Product
|
|
$
|
125,690
|
|
$
|
(23,257
|
)
|
a
|
$
|
102,433
|
|
|
|
Installation
|
29,690
|
|
(4,999
|
)
|
a
|
24,691
|
|
|||||
|
Service
|
|
20,751
|
|
305
|
|
a
|
21,056
|
|
||||
|
Electricity
|
|
14,059
|
|
6,380
|
|
a
|
20,439
|
|
||||
|
Total revenue
|
|
190,190
|
|
(21,571
|
)
|
|
168,619
|
|
||||
|
Cost of revenue:
|
|
|||||||||||
|
Product
|
95,357
|
|
(26,304
|
)
|
c, d
|
69,053
|
|
|||||
|
Installation
|
40,118
|
|
(4,612
|
)
|
c
|
35,506
|
|
|||||
|
Service
|
|
22,651
|
|
1,819
|
|
d
|
24,470
|
|
||||
|
Electricity
|
|
8,679
|
|
3,501
|
|
c
|
12,180
|
|
||||
|
Total cost of revenue
|
166,805
|
|
(25,596
|
)
|
|
141,209
|
|
|||||
|
Gross profit
|
23,385
|
|
4,025
|
|
27,410
|
|
||||||
|
Operating expenses:
|
||||||||||||
|
Research and development
|
27,021
|
|
—
|
|
27,021
|
|
||||||
|
Sales and marketing
|
21,476
|
|
(80
|
)
|
e
|
21,396
|
|
|||||
|
General and administrative
|
40,999
|
|
—
|
|
40,999
|
|
||||||
|
Total operating expenses
|
89,496
|
|
(80
|
)
|
89,416
|
|
||||||
|
Loss from operations
|
(66,111
|
)
|
4,105
|
|
(62,006
|
)
|
||||||
|
Interest income
|
1,467
|
|
—
|
|
|
1,467
|
|
|||||
|
Interest expense
|
(16,853
|
)
|
(5,272
|
)
|
f
|
(22,125
|
)
|
|||||
|
Interest expense to related parties
|
(1,966
|
)
|
—
|
|
(1,966
|
)
|
||||||
|
Other expense, net
|
(705
|
)
|
—
|
|
(705
|
)
|
||||||
|
Loss on revaluation of warrant liabilities and embedded derivatives
|
1,655
|
|
(755
|
)
|
g
|
900
|
|
|||||
|
Loss before income taxes
|
(82,513
|
)
|
(1,922
|
)
|
(84,435
|
)
|
||||||
|
Income tax provision
|
(3
|
)
|
—
|
|
(3
|
)
|
||||||
|
Net loss
|
(82,510
|
)
|
(1,922
|
)
|
(84,432
|
)
|
||||||
|
Net loss attributable to noncontrolling interests and redeemable noncontrolling interests
|
(3,930
|
)
|
—
|
|
(3,930
|
)
|
||||||
|
Net loss attributable to Class A and Class B common stockholders
|
$
|
(78,580
|
)
|
$
|
(1,922
|
)
|
$
|
(80,502
|
)
|
|||
a
Revenue impacted by Managed Services restatements — The correction of these misstatements resulted from the change from upfront recognition of product and installation revenue to recognition of the capacity payments received from the end customer as power is generated by the Energy Servers as electricity revenue over the term of our Managed Services Agreements and similar sale-leaseback arrangements, which also impacted our service revenue allocation.
b Not used.
c Cost of revenue impacted by Managed Services restatements — The correction of these misstatements resulted from the change from upfront recognition of product and installation cost of revenue to recognition of the depreciation expense on the capitalized Energy Servers over their useful life of 21 years for our Managed Services Agreements and similar sale-leaseback transactions, resulting in a decrease in product cost of revenue of
$14.0 million
and installation cost of revenue of
$4.6 million
, offset by an increase in electricity cost of revenue of
$3.5 million
.
d
Cost of revenue impacted by stock-based compensation allocation — The correction of these misstatements resulted from the capitalization of stock-based compensation costs, with a net benefit to product cost of revenue of
$12.3 million
and an increase in service cost revenue of
$1.8 million
due to the expensing of stock-based compensation related to field replacement units.
e
Sales and marketing and general and administrative expenses — The correction of these misstatements primarily resulted from the change of accounting for sales commission expense on an as earned basis, to accounting for the expense over the term of our Managed Services Agreements and similar sale-leaseback arrangements.
191
f
Interest expense — The correction of these misstatements resulted from the change of accounting for sales that should have been accounted for as financing transactions, in which the upfront consideration received from the financing party is accounted for as a financing obligation and interest expense is recognized over the term of the Managed Services Agreement using the effective interest method.
g
Gain (loss) on revaluation of warrant liabilities and embedded derivatives — The correction of these misstatements resulted from the correction of a misstatement in the valuation of our 6% Notes derivative, resulting in
$0.8 million
of additional loss in the period.
192
|
|
|
Three Months Ended December 31, 2018
|
||||||||||
|
|
|
As Previously Reported
|
Restatement Impacts
|
As Restated
|
||||||||
|
Revenue:
|
|
|
|
|
|
|
||||||
|
Product
|
|
$
|
156,671
|
|
$
|
(52,734
|
)
|
a
|
$
|
103,937
|
|
|
|
Installation
|
21,363
|
|
(10,297
|
)
|
a
|
11,066
|
|
|||||
|
Service
|
|
21,752
|
|
26
|
|
a
|
21,778
|
|
||||
|
Electricity
|
|
13,820
|
|
6,544
|
|
a
|
20,364
|
|
||||
|
Total revenue
|
|
213,606
|
|
(56,461
|
)
|
|
157,145
|
|
||||
|
Cost of revenue:
|
|
|||||||||||
|
Product
|
128,076
|
|
(41,922
|
)
|
c, d
|
86,154
|
|
|||||
|
Installation
|
31,819
|
|
(11,168
|
)
|
c
|
20,651
|
|
|||||
|
Service
|
|
28,475
|
|
3,343
|
|
b, d
|
31,818
|
|
||||
|
Electricity
|
|
7,988
|
|
3,613
|
|
c
|
11,601
|
|
||||
|
Total cost of revenue
|
196,358
|
|
(46,134
|
)
|
|
150,224
|
|
|||||
|
Gross profit
|
17,248
|
|
(10,327
|
)
|
6,921
|
|
||||||
|
Operating expenses:
|
||||||||||||
|
Research and development
|
32,970
|
|
—
|
|
32,970
|
|
||||||
|
Sales and marketing
|
24,983
|
|
(32
|
)
|
e
|
24,951
|
|
|||||
|
General and administrative
|
47,471
|
|
—
|
|
e
|
47,471
|
|
|||||
|
Total operating expenses
|
105,424
|
|
(32
|
)
|
105,392
|
|
||||||
|
Loss from operations
|
(88,176
|
)
|
(10,295
|
)
|
(98,471
|
)
|
||||||
|
Interest income
|
1,996
|
|
—
|
|
|
1,996
|
|
|||||
|
Interest expense
|
(16,178
|
)
|
(5,579
|
)
|
f
|
(21,757
|
)
|
|||||
|
Interest expense to related parties
|
(1,628
|
)
|
—
|
|
(1,628
|
)
|
||||||
|
Other expense, net
|
636
|
|
—
|
|
636
|
|
||||||
|
Gain (loss) on revaluation of warrant liabilities and embedded derivatives
|
(14
|
)
|
206
|
|
g
|
192
|
|
|||||
|
Loss before income taxes
|
(103,364
|
)
|
(15,668
|
)
|
(119,032
|
)
|
||||||
|
Income tax provision
|
1,079
|
|
—
|
|
1,079
|
|
||||||
|
Net loss
|
(104,443
|
)
|
(15,668
|
)
|
(120,111
|
)
|
||||||
|
Net loss attributable to noncontrolling interests and redeemable noncontrolling interests
|
(4,662
|
)
|
—
|
|
(4,662
|
)
|
||||||
|
Net loss attributable to Class A and Class B common stockholders
|
$
|
(99,781
|
)
|
$
|
(15,668
|
)
|
$
|
(115,449
|
)
|
|||
a
Revenue impacted by Managed Services restatements — The correction of these misstatements resulted from the change from upfront recognition of product and installation revenue to recognition of the capacity payments received from the end customer as power is generated by the Energy Servers as electricity revenue over the term of our Managed Services Agreements and similar sale-leaseback arrangements, which also impacted our service revenue allocation.
b Service cost of revenue impacted by grid pricing escalation guarantees — The correction of these misstatements resulted in a change in accounting for our grid escalation guarantees that resulted in a decrease of service cost of revenue of
$0.5 million
.
c Cost of revenue impacted by Managed Services restatements — The correction of these misstatements resulted from the change from upfront recognition of product and installation cost of revenue to recognition of the depreciation expense on the capitalized Energy Servers over their useful life of 21 years for our Managed Services Agreements and similar sale-leaseback transactions, resulting in a decrease in product cost of revenue of
$37.1 million
and installation cost of revenue of
$12.1 million
, offset by an increase in electricity cost of revenue
$3.6 million
, together with the correction of certain other immaterial misstatements identified to record installation cost of revenue of
$0.9 million
.
d
Cost of revenue impacted by stock-based compensation allocation — The correction of these misstatements resulted from the capitalization of stock-based compensation costs, with a net benefit to product cost of revenue of
$4.8 million
and an increase in service cost of
$3.8 million
due to the expensing of stock-based compensation related to field replacement units.
e
Sales and marketing and general and administrative expenses — The correction of these misstatements primarily resulted from the change of accounting for sales commission expense on an as earned basis, to accounting for the expense over the term of our Managed Services Agreements and similar sale-leaseback arrangements.
193
f
Interest expense — The correction of these misstatements resulted from the change of accounting for sales that should have been accounted for as financing transactions, in which the upfront consideration received from the financing party is accounted for as a financing obligation and interest expense is recognized over the term of the Managed Services Agreement using the effective interest method.
g
Gain (loss) on revaluation of warrant liabilities and embedded derivatives —The correction of these misstatements resulted from the change of accounting for the grid pricing escalation guarantees we provided in some of our sales arrangements which is now recorded as a derivative liability that needs to be fair valued each period end. The fair value of the liability decreased resulting in a gain of
$0.2 million
.
194
|
|
|
Six Months Ended June 30, 2018
|
||||||||||
|
|
|
As Previously Reported
|
Restatement Impacts
|
As Restated
|
||||||||
|
Revenue:
|
|
|
||||||||||
|
Product
|
|
$
|
229,961
|
|
$
|
(35,693
|
)
|
a
|
$
|
194,268
|
|
|
|
Installation
|
40,363
|
|
(7,925
|
)
|
a
|
32,438
|
|
|||||
|
Service
|
|
39,882
|
|
551
|
|
a
|
40,433
|
|
||||
|
Electricity
|
|
28,036
|
|
11,709
|
|
a
|
39,745
|
|
||||
|
Total revenue
|
|
338,242
|
|
(31,358
|
)
|
|
306,884
|
|
||||
|
Cost of revenue:
|
|
|||||||||||
|
Product
|
151,157
|
|
(25,089
|
)
|
c, d
|
126,068
|
|
|||||
|
Installation
|
47,537
|
|
(8,388
|
)
|
c
|
39,149
|
|
|||||
|
Service
|
|
43,513
|
|
888
|
|
d
|
44,401
|
|
||||
|
Electricity
|
|
19,598
|
|
6,249
|
|
c
|
25,847
|
|
||||
|
Total cost of revenue
|
261,805
|
|
(26,340
|
)
|
|
235,465
|
|
|||||
|
Gross profit
|
76,437
|
|
(5,018
|
)
|
71,419
|
|
||||||
|
Operating expenses:
|
||||||||||||
|
Research and development
|
29,144
|
|
—
|
|
29,144
|
|
||||||
|
Sales and marketing
|
16,516
|
|
(56
|
)
|
e
|
16,460
|
|
|||||
|
General and administrative
|
30,347
|
|
—
|
|
30,347
|
|
||||||
|
Total operating expenses
|
76,007
|
|
(56
|
)
|
75,951
|
|
||||||
|
Loss from operations
|
430
|
|
(4,962
|
)
|
(4,532
|
)
|
||||||
|
Interest income
|
859
|
|
—
|
|
|
859
|
|
|||||
|
Interest expense
|
(43,904
|
)
|
(9,235
|
)
|
f
|
(53,139
|
)
|
|||||
|
Interest expense to related parties
|
(5,299
|
)
|
—
|
|
(5,299
|
)
|
||||||
|
Other expense, net
|
(930
|
)
|
—
|
|
(930
|
)
|
||||||
|
Loss on revaluation of warrant liabilities and embedded derivatives
|
(23,231
|
)
|
—
|
|
(23,231
|
)
|
||||||
|
Loss before income taxes
|
(72,075
|
)
|
(14,197
|
)
|
(86,272
|
)
|
||||||
|
Income tax provision
|
461
|
|
—
|
|
461
|
|
||||||
|
Net loss
|
(72,536
|
)
|
(14,197
|
)
|
(86,733
|
)
|
||||||
|
Net loss attributable to noncontrolling interests and redeemable noncontrolling interests
|
(9,144
|
)
|
—
|
|
(9,144
|
)
|
||||||
|
Net loss attributable to Class A and Class B common stockholders
|
$
|
(63,392
|
)
|
$
|
(14,197
|
)
|
$
|
(77,589
|
)
|
|||
a
Revenue impacted by Managed Services restatements — The correction of these misstatements resulted from the change from upfront recognition of product and installation revenue to recognition of the capacity payments received from the end customer as power is generated by the Energy Servers as electricity revenue over the term of our Managed Services Agreements and similar sale-leaseback arrangements, which impacted our service revenue allocation.
b .Not used.
c Cost of revenue impacted by Managed Services restatements — The correction of these misstatements resulted from the change from upfront recognition of product and installation cost of revenue to recognition of the depreciation expense on the capitalized Energy Servers over their useful life of 21 years for our Managed Services Agreements and similar sale-leaseback transactions, resulting in decreases in product cost of revenue of
$23.9 million
and installation cost of revenue of
$8.4 million
, offset by an increase in electricity cost of revenue of
$6.2 million
.
d
Cost of revenue impacted by stock-based compensation allocation — The correction of these misstatements resulted from the capitalization of stock-based compensation costs, with a net benefit to product cost of revenue of
$1.2 million
and an increase in service cost of revenue of
$0.9 million
due to the expensing of stock-based compensation related to field replacement units.
e
Sales and marketing and general and administrative expenses — The correction of these misstatements primarily resulted from the change of accounting for sales commission expense on an as earned basis, to accounting for the expense over the term of our Managed Services Agreements and similar sale-leaseback arrangements.
195
f
Interest expense — The correction of these misstatements resulted from the change of accounting for sales that should have been accounted for as financing transactions, in which the upfront consideration received from the financing party is accounted for as a financing obligation and interest expense is recognized over the term of the Managed Services Agreement using the effective interest method.
196
|
|
|
Nine Months Ended September 30, 2018
|
||||||||||
|
|
|
As Previously Reported
|
Restatement Impacts
|
As Restated
|
||||||||
|
Revenue:
|
|
|
||||||||||
|
Product
|
|
$
|
355,651
|
|
$
|
(58,950
|
)
|
a
|
$
|
296,701
|
|
|
|
Installation
|
70,053
|
|
(12,924
|
)
|
a
|
57,129
|
|
|||||
|
Service
|
|
60,633
|
|
856
|
|
a
|
61,489
|
|
||||
|
Electricity
|
|
42,095
|
|
18,089
|
|
a
|
60,184
|
|
||||
|
Total revenue
|
|
528,432
|
|
(52,929
|
)
|
|
475,503
|
|
||||
|
Cost of revenue:
|
|
|||||||||||
|
Product
|
246,514
|
|
(51,393
|
)
|
c, d
|
195,121
|
|
|||||
|
Installation
|
87,655
|
|
(13,000
|
)
|
c
|
74,655
|
|
|||||
|
Service
|
|
66,164
|
|
2,707
|
|
d
|
68,871
|
|
||||
|
Electricity
|
|
28,277
|
|
9,750
|
|
c
|
38,027
|
|
||||
|
Total cost of revenue
|
428,610
|
|
(51,936
|
)
|
|
376,674
|
|
|||||
|
Gross profit
|
99,822
|
|
(993
|
)
|
98,829
|
|
||||||
|
Operating expenses:
|
||||||||||||
|
Research and development
|
56,165
|
|
—
|
|
56,165
|
|
||||||
|
Sales and marketing
|
37,992
|
|
(136
|
)
|
e
|
37,856
|
|
|||||
|
General and administrative
|
71,346
|
|
—
|
|
e
|
71,346
|
|
|||||
|
Total operating expenses
|
165,503
|
|
(136
|
)
|
165,367
|
|
||||||
|
Loss from operations
|
(65,681
|
)
|
(857
|
)
|
(66,538
|
)
|
||||||
|
Interest income
|
2,326
|
|
—
|
|
|
2,326
|
|
|||||
|
Interest expense
|
(60,757
|
)
|
(14,507
|
)
|
f
|
(75,264
|
)
|
|||||
|
Interest expense to related parties
|
(7,265
|
)
|
—
|
|
(7,265
|
)
|
||||||
|
Other expense, net
|
(1,635
|
)
|
—
|
|
(1,635
|
)
|
||||||
|
Loss on revaluation of warrant liabilities and embedded derivatives
|
(21,576
|
)
|
(755
|
)
|
g
|
(22,331
|
)
|
|||||
|
Loss before income taxes
|
(154,588
|
)
|
(16,119
|
)
|
(170,707
|
)
|
||||||
|
Income tax provision
|
458
|
|
—
|
|
458
|
|
||||||
|
Net loss
|
(155,046
|
)
|
(16,119
|
)
|
(171,165
|
)
|
||||||
|
Net loss attributable to noncontrolling interests and redeemable noncontrolling interests
|
(13,074
|
)
|
—
|
|
(13,074
|
)
|
||||||
|
Net loss attributable to Class A and Class B common stockholders
|
$
|
(141,972
|
)
|
$
|
(16,119
|
)
|
$
|
(158,091
|
)
|
|||
a
Revenue impacted by Managed Services restatements — The correction of these misstatements resulted from the change from upfront recognition of product and installation revenue to recognition of the capacity payments received from the end customer as power is generated by the Energy Servers as electricity revenue over the term of our Managed Services Agreements and similar sale-leaseback arrangements, which also impacted our service revenue allocation.
b Not used.
c Cost of revenue impacted by Managed Services restatements — The correction of these misstatements resulted from the change from upfront recognition of product and installation cost of revenue to recognition of the depreciation expense on the capitalized Energy Servers over their useful life of 21 years for our Managed Services Agreements and similar sale-leaseback transactions, resulting in a decrease in product cost of revenue of
$37.9 million
and installation cost of revenue of
$13.0 million
, offset by an increase in electricity cost of revenue of
$9.7 million
.
d
Cost of revenue impacted by stock-based compensation allocation — The correction of these misstatements resulted from the capitalization of stock-based compensation costs, with a net benefit to product cost of revenue of
$13.5 million
and an increase in service cost of revenue of
$2.7 million
due to the expensing of stock-based compensation related to field replacement units.
e
Sales and marketing and general and administrative expenses — The correction of these misstatements primarily resulted from the change of accounting for sales commission expense on an as earned basis, to accounting for the expense over the term of our Managed Services Agreements and similar sale-leaseback arrangements.
197
f
Interest expense — The correction of these misstatements resulted from the change of accounting for sales that should have been accounted for as financing transactions, in which the upfront consideration received from the financing party is accounted for as a financing obligation and interest expense is recognized over the term of the Managed Services Agreement using the effective interest method.
g Gain (loss) on revaluation of warrant liabilities and embedded derivatives — The correction of these misstatements resulted from the correction of a misstatement in the valuation of our 6% Notes derivative, resulting in
$0.8 million
of additional expense in the period.
198
The following tables contain the restatement and recasting of previously reported unaudited condensed consolidated statements of cash flows for the three-month period ended March 31, 2019, the six-month periods ended June 30, 2019 and the nine-month period ended September 30, 2019, the restatement of previously reported unaudited condensed consolidated statements of cash flows for the six-month period ended June 30, 2018 and the nine-month period ended September 30, 2018 and the revision of the previously reported unaudited condensed consolidated statement of cash flows for the three-month period ended March 31, 2018.
|
|
|
Three Months Ended March 31, 2019
|
||||||||||||||||||
|
|
|
As Previously Reported
|
Restatement Impacts
|
As Restated
|
ASC 606 Adoption Impacts
|
As Restated & Recast
|
||||||||||||||
|
Cash flows from operating activities:
|
|
|
|
|
|
|
||||||||||||||
|
Net loss
|
|
$
|
(88,273
|
)
|
$
|
(21,056
|
)
|
$
|
(109,329
|
)
|
$
|
577
|
|
$
|
(108,752
|
)
|
||||
|
Adjustments to reconcile net loss to net cash used in operating activities:
|
||||||||||||||||||||
|
Depreciation and amortization
|
|
11,271
|
|
2,954
|
|
A
|
14,225
|
|
—
|
|
14,225
|
|
||||||||
|
Write-off of property, plant and equipment, net
|
|
1
|
|
—
|
|
1
|
|
—
|
|
1
|
|
|||||||||
|
Revaluation of derivative contracts
|
|
(453
|
)
|
540
|
|
B
|
87
|
|
—
|
|
87
|
|
||||||||
|
Stock-based compensation
|
|
63,882
|
|
3,940
|
|
C
|
67,822
|
|
—
|
|
67,822
|
|
||||||||
|
Loss on long-term REC purchase contract
|
59
|
|
—
|
|
59
|
|
—
|
|
59
|
|
||||||||||
|
Amortization of debt issuance cost
|
5,152
|
|
—
|
|
5,152
|
|
—
|
|
5,152
|
|
||||||||||
|
Changes in operating assets and liabilities:
|
||||||||||||||||||||
|
Accounts receivable
|
816
|
|
(98
|
)
|
D
|
718
|
|
3,413
|
|
4,131
|
|
|||||||||
|
Inventories
|
15,932
|
|
(4,845
|
)
|
E
|
11,087
|
|
—
|
|
11,087
|
|
|||||||||
|
Deferred cost of revenue
|
26,014
|
|
(37,098
|
)
|
F
|
(11,084
|
)
|
—
|
|
(11,084
|
)
|
|||||||||
|
Customer financing receivable and other
|
1,339
|
|
—
|
|
1,339
|
|
—
|
|
1,339
|
|
||||||||||
|
Prepaid expenses and other current assets
|
5,194
|
|
1,423
|
|
G
|
6,617
|
|
11
|
|
6,628
|
|
|||||||||
|
Other long-term assets
|
83
|
|
(396
|
)
|
H
|
(313
|
)
|
(103
|
)
|
(416
|
)
|
|||||||||
|
Accounts payable
|
(2,464
|
)
|
—
|
|
(2,464
|
)
|
—
|
|
(2,464
|
)
|
||||||||||
|
Accrued warranty
|
(2,500
|
)
|
50
|
|
I
|
(2,450
|
)
|
(247
|
)
|
(2,697
|
)
|
|||||||||
|
Accrued expenses and other current liabilities
|
823
|
|
(1,196
|
)
|
J
|
(373
|
)
|
—
|
|
(373
|
)
|
|||||||||
|
Deferred revenue and customer deposits
|
(44,533
|
)
|
49,428
|
|
K
|
4,895
|
|
(3,651
|
)
|
1,244
|
|
|||||||||
|
Other long-term liabilities
|
3,487
|
|
679
|
|
L
|
4,166
|
|
—
|
|
4,166
|
|
|||||||||
|
Net cash used in operating activities
|
|
(4,170
|
)
|
(5,675
|
)
|
(9,845
|
)
|
—
|
|
(9,845
|
)
|
|||||||||
|
Cash flows from investing activities:
|
|
|
|
|
|
|
|
|
||||||||||||
|
Purchase of property, plant and equipment
|
(8,543
|
)
|
(3,403
|
)
|
M
|
(11,946
|
)
|
—
|
|
(11,946
|
)
|
|||||||||
|
Payments for acquisition of intangible assets
|
(848
|
)
|
—
|
|
(848
|
)
|
—
|
|
(848
|
)
|
||||||||||
|
Proceeds from maturity of marketable securities
|
104,500
|
|
—
|
|
104,500
|
|
—
|
|
104,500
|
|
||||||||||
|
Net cash provided by investing activities
|
95,109
|
|
(3,403
|
)
|
91,706
|
|
—
|
|
91,706
|
|
||||||||||
|
Cash flows from financing activities:
|
||||||||||||||||||||
|
Repayment of debt
|
(5,016
|
)
|
—
|
|
(5,016
|
)
|
—
|
|
(5,016
|
)
|
||||||||||
|
Repayment of debt to related parties
|
(778
|
)
|
—
|
|
(778
|
)
|
—
|
|
(778
|
)
|
||||||||||
|
Proceeds from financing obligations
|
—
|
|
10,961
|
|
N
|
10,961
|
|
—
|
|
10,961
|
|
|||||||||
|
Repayment of financing obligations
|
—
|
|
(1,883
|
)
|
N
|
(1,883
|
)
|
—
|
|
(1,883
|
)
|
|||||||||
|
Distributions to noncontrolling and redeemable noncontrolling interests
|
(3,189
|
)
|
—
|
|
(3,189
|
)
|
—
|
|
(3,189
|
)
|
||||||||||
|
Proceeds from issuance of common stock
|
7,493
|
|
—
|
|
7,493
|
|
—
|
|
7,493
|
|
||||||||||
199
|
|
|
Three Months Ended March 31, 2019
|
||||||||||||||||||
|
|
|
As Previously Reported
|
Restatement Impacts
|
As Restated
|
ASC 606 Adoption Impacts
|
As Restated & Recast
|
||||||||||||||
|
Net cash provided by (used in) financing activities
|
(1,490
|
)
|
9,078
|
|
7,588
|
|
—
|
|
7,588
|
|
||||||||||
|
Net increase in cash, cash equivalents, and restricted cash
|
89,449
|
|
—
|
|
89,449
|
|
—
|
|
89,449
|
|
||||||||||
|
Cash, cash equivalents, and restricted cash:
|
||||||||||||||||||||
|
Beginning of period
|
280,485
|
|
—
|
|
280,485
|
|
—
|
|
280,485
|
|
||||||||||
|
End of period
|
$
|
369,934
|
|
$
|
—
|
|
$
|
369,934
|
|
$
|
—
|
|
$
|
369,934
|
|
|||||
|
Supplemental disclosure of cash flow information:
|
||||||||||||||||||||
|
Cash paid during the period for interest
|
$
|
14,545
|
|
$
|
5,838
|
|
N
|
$
|
20,383
|
|
$
|
—
|
|
$
|
20,383
|
|
||||
|
Cash paid during the period for taxes
|
222
|
|
—
|
|
222
|
|
—
|
|
222
|
|
||||||||||
A
Depreciation and amortization — The correction of these misstatements resulted from the change of accounting for Energy Servers under the Managed Services Program and similar arrangements that would have been product and install cost of revenue, but are now recorded as property, plant and equipment, net and depreciated over their useful lives of 21 years.
B
Revaluation of derivative contracts — The correction of these misstatements resulted from the change of accounting for the grid pricing escalation guarantees we provided in some of our sales arrangements. These commitments were previously treated as a contingent liability that was considered remote. We now consider the commitments a derivative liability, with the initial value of recorded as a reduction in product revenue and then any changes in the value adjusted through other expense, net each period thereafter.
C
Stock-based compensation — The correction of these misstatements resulted from the change of accounting for stock-based compensation, including net capitalization of stock-based compensation cost into inventory of
$4.4 million
. The correction of this misstatement also resulted in the capitalization of
$0.5 million
of stock-based compensation costs related to assets under the Managed Services Programs now recorded as construction in progress within property, plant and equipment, net.
D
Accounts receivable — The correction of these misstatements resulted from the change of accounting for Managed Services Agreements, for which the amount recorded to accounts receivable represents amounts invoiced for capacity billings to end customers which have not yet been collected by the financing entity as of the period end.
E
Inventories — The correction of these misstatements resulted from the change of accounting for inventories held for shipments planned to customers under the Managed Services Program and similar arrangements now accounted for as construction in progress within property, plant and equipment, net.
F
Deferred cost of revenue, current and non-current — The correction of these misstatements resulted from the cumulative net change of accounting moving deferred cost of revenue to property, plant and equipment, net for the leased Energy Servers under the Managed Services Agreements and similar sale-leaseback arrangements of
$37.2 million
, and the net capitalization of stock-based compensation expenses of
$0.1 million
.
G
Prepaid expenses and other current assets — The correction of these misstatements resulted from the change of accounting for Managed Services Agreements and similar arrangements where prepaid property tax and insurance payments are now classified within prepaid expenses.
H
Other long-term assets — The correction of these misstatements resulted from the change of accounting for Managed Services Agreements and similar arrangements where the timing difference of capacity billings to end customers and the payments received from the financing entity is recorded within long term receivables and whereby prepaid property tax and insurance payments are now classified within other long-term assets, rather than offset against long-term deferred revenue.
I
Accrued warranty — The correction of these misstatements resulted from the change of accounting for accrued warranty which is now recorded on an as-incurred basis on our Managed Services Agreements and similar arrangements. The correction of these misstatements resulted from the change of accounting for the grid pricing escalation guarantees we provided in some of our sales arrangements. These commitments were previously treated as a contingent liability that was considered remote and therefore, no accrual was made. We now have a
$0.1 million
accrual, with the initial value of treated as a reduction in product revenue and then any changes in the value adjusted through other expense, net each period thereafter.
J
Accrued expense and other current liabilities and other long-term liabilities — The correction of these misstatements resulted from the change of accounting for Managed Services Agreements and similar arrangements whereby instead of recognizing the bank financing as revenue, the bank financing loan proceeds received and due are classified as a lease loan liability.
K
Deferred revenue and customer deposits, current and non-current — The correction of these misstatements resulted from the change of accounting for the recognition of product and installation revenue from upfront or ratable recognition to the recognition of the capacity payments received from the end customer as power is generated by the Energy Servers as electricity revenue.
L
Other long-term liabilities — The correction of these misstatements resulted from the change of accounting for Managed Services Agreements and similar arrangements whereby instead of recognizing the bank financing as revenue, the bank financing loan proceeds received and due beyond the next twelve months are classified as a lease loan liability.
200
M
Purchase of property, plant and equipment — The correction of these misstatements resulted from the change of accounting for Managed Services Agreements and similar arrangements, whereby costs previously recognized as product and installation cost of revenue are now recorded as property, plant and equipment, net in the cases where the risks of ownership have not completely transferred to the financing party.
N
Proceeds and repayments from financing obligations — The correction of these misstatements resulted from the change of accounting for Managed Services Agreements and similar arrangements where instead of recognizing the upfront proceeds received from the bank as revenue, the proceeds received and due are classified as proceeds from financing obligations and the capacity payments received from the end customer are classified as repayment of financing obligations and interest paid.
201
|
|
|
Six Months Ended June 30, 2019
|
||||||||||||||||||
|
|
|
As Previously Reported
|
Restatement Impacts
|
As Restated
|
ASC 606 Adoption Impacts
|
As Restated & Recast
|
||||||||||||||
|
Cash flows from operating activities:
|
|
|
|
|
|
|
||||||||||||||
|
Net loss
|
|
$
|
(155,504
|
)
|
$
|
(30,991
|
)
|
$
|
(186,495
|
)
|
$
|
(9,183
|
)
|
$
|
(195,678
|
)
|
||||
|
Adjustments to reconcile net loss to net cash used in operating activities:
|
||||||||||||||||||||
|
Depreciation and amortization
|
|
31,023
|
|
6,011
|
|
A
|
37,034
|
|
—
|
|
37,034
|
|
||||||||
|
Write-off of property, plant and equipment, net
|
|
2,704
|
|
—
|
|
2,704
|
|
—
|
|
2,704
|
|
|||||||||
|
Write-off of PPA II and PPA IIIb decommissioned assets
|
|
25,613
|
|
—
|
|
25,613
|
|
—
|
|
25,613
|
|
|||||||||
|
Debt make-whole expense
|
5,934
|
|
—
|
|
5,934
|
|
—
|
|
5,934
|
|
||||||||||
|
Revaluation of derivative contracts
|
|
555
|
|
1,081
|
|
B
|
1,636
|
|
—
|
|
1,636
|
|
||||||||
|
Stock-based compensation
|
|
115,100
|
|
4,086
|
|
C
|
119,186
|
|
—
|
|
119,186
|
|
||||||||
|
Loss on long-term REC purchase contract
|
60
|
|
—
|
|
60
|
|
—
|
|
60
|
|
||||||||||
|
Amortization of debt issuance cost
|
11,255
|
|
—
|
|
11,255
|
|
—
|
|
11,255
|
|
||||||||||
|
Changes in operating assets and liabilities:
|
||||||||||||||||||||
|
Accounts receivable
|
46,591
|
|
(274
|
)
|
D
|
46,317
|
|
3,424
|
|
49,741
|
|
|||||||||
|
Inventories
|
27,542
|
|
(5,345
|
)
|
E
|
22,197
|
|
—
|
|
22,197
|
|
|||||||||
|
Deferred cost of revenue
|
19,198
|
|
(57,991
|
)
|
F
|
(38,793
|
)
|
—
|
|
(38,793
|
)
|
|||||||||
|
Customer financing receivable and other
|
2,713
|
|
—
|
|
2,713
|
|
—
|
|
2,713
|
|
||||||||||
|
Prepaid expenses and other current assets
|
8,477
|
|
1,752
|
|
G
|
10,229
|
|
(2
|
)
|
10,227
|
|
|||||||||
|
Other long-term assets
|
1,028
|
|
(1,029
|
)
|
H
|
(1
|
)
|
(271
|
)
|
(272
|
)
|
|||||||||
|
Accounts payable
|
(5,461
|
)
|
—
|
|
(5,461
|
)
|
—
|
|
(5,461
|
)
|
||||||||||
|
Accrued warranty
|
(6,843
|
)
|
114
|
|
I
|
(6,729
|
)
|
33
|
|
(6,696
|
)
|
|||||||||
|
Accrued expenses and other current liabilities
|
7,213
|
|
(1,632
|
)
|
J
|
5,581
|
|
—
|
|
5,581
|
|
|||||||||
|
Deferred revenue and customer deposits
|
(25,411
|
)
|
71,325
|
|
K
|
45,914
|
|
5,999
|
|
51,913
|
|
|||||||||
|
Other long-term liabilities
|
3,419
|
|
1,303
|
|
L
|
4,722
|
|
—
|
|
4,722
|
|
|||||||||
|
Net cash provided by operating activities
|
|
115,206
|
|
(11,590
|
)
|
103,616
|
|
—
|
|
103,616
|
|
|||||||||
|
Cash flows from investing activities:
|
|
|||||||||||||||||||
|
Purchase of property, plant and equipment
|
(18,882
|
)
|
(4,737
|
)
|
M
|
(23,619
|
)
|
—
|
|
(23,619
|
)
|
|||||||||
|
Payments for acquisition of intangible assets
|
(970
|
)
|
—
|
|
(970
|
)
|
—
|
|
(970
|
)
|
||||||||||
|
Proceeds from maturity of marketable securities
|
104,500
|
|
—
|
|
104,500
|
|
—
|
|
104,500
|
|
||||||||||
|
Net cash provided by investing activities
|
84,648
|
|
(4,737
|
)
|
79,911
|
|
—
|
|
79,911
|
|
||||||||||
|
Cash flows from financing activities:
|
||||||||||||||||||||
|
Repayment of debt
|
(83,997
|
)
|
—
|
|
(83,997
|
)
|
—
|
|
(83,997
|
)
|
||||||||||
|
Repayment of debt to related parties
|
(1,220
|
)
|
—
|
|
(1,220
|
)
|
—
|
|
(1,220
|
)
|
||||||||||
|
Debt make-whole payment
|
(5,934
|
)
|
—
|
|
(5,934
|
)
|
—
|
|
(5,934
|
)
|
||||||||||
|
Proceeds from financing obligations
|
—
|
|
20,333
|
|
N
|
20,333
|
|
—
|
|
20,333
|
|
|||||||||
|
Repayment of financing obligations
|
—
|
|
(4,006
|
)
|
N
|
(4,006
|
)
|
—
|
|
(4,006
|
)
|
|||||||||
|
Payments to noncontrolling and redeemable noncontrolling interests
|
(18,690
|
)
|
—
|
|
(18,690
|
)
|
—
|
|
(18,690
|
)
|
||||||||||
|
Distributions to noncontrolling and redeemable noncontrolling interests
|
(7,753
|
)
|
—
|
|
(7,753
|
)
|
—
|
|
(7,753
|
)
|
||||||||||
|
Proceeds from issuance of common stock
|
8,321
|
|
—
|
|
8,321
|
|
—
|
|
8,321
|
|
||||||||||
|
Net cash used in financing activities
|
(109,273
|
)
|
16,327
|
|
(92,946
|
)
|
—
|
|
(92,946
|
)
|
||||||||||
|
Net increase in cash, cash equivalents, and restricted cash
|
90,581
|
|
—
|
|
90,581
|
|
—
|
|
90,581
|
|
||||||||||
202
|
|
|
Six Months Ended June 30, 2019
|
||||||||||||||||||
|
|
|
As Previously Reported
|
Restatement Impacts
|
As Restated
|
ASC 606 Adoption Impacts
|
As Restated & Recast
|
||||||||||||||
|
Cash, cash equivalents, and restricted cash:
|
||||||||||||||||||||
|
Beginning of period
|
280,485
|
|
—
|
|
280,485
|
|
—
|
|
280,485
|
|
||||||||||
|
End of period
|
$
|
371,066
|
|
$
|
—
|
|
$
|
371,066
|
|
$
|
—
|
|
$
|
371,066
|
|
|||||
|
Supplemental disclosure of cash flow information:
|
||||||||||||||||||||
|
Cash paid during the period for interest
|
$
|
23,867
|
|
$
|
11,835
|
|
N
|
$
|
35,702
|
|
$
|
—
|
|
$
|
35,702
|
|
||||
|
Cash paid during the period for taxes
|
497
|
|
—
|
|
497
|
|
—
|
|
497
|
|
||||||||||
A
Depreciation and amortization — The correction of these misstatements resulted from the change of accounting for Energy Servers under the Managed Services Program and similar arrangements that would have been product and install cost of revenue, but are now recorded as property, plant and equipment, net and depreciated over their useful lives of 21 years.
B
Revaluation of derivative contracts — The correction of these misstatements resulted from the change of accounting for the grid pricing escalation guarantees we provided in some of our sales arrangements. These commitments were previously treated as a contingent liability that was considered remote. We now consider the commitments a derivative liability, with the initial value recorded as a reduction in product revenue and then any changes in the value adjusted through other expense, net each period thereafter.
C
Stock-based compensation — The correction of these misstatements resulted from the change of accounting for stock-based compensation, including net capitalization of stock-based compensation costs into inventory of
$4.7 million
. The correction of this misstatement resulted in the capitalization of
$0.6 million
of stock-based compensation costs related to assets under the Managed Services Programs now recorded as construction in progress within property, plant and equipment, net.
D
Accounts receivable — The correction of these misstatements resulted from the change of accounting for Managed Services Agreements, for which the amount recorded to accounts receivable represents amounts invoiced for capacity billings to end customers which have not yet been collected by the financing entity as of the period end.
E
Inventories — The correction of these misstatements resulted from the change of accounting for inventories held for shipments planned to customers under the Managed Services Program and similar arrangements now accounted for as construction in progress within property, plant and equipment, net.
F
Deferred cost of revenue, current and non-current — The correction of these misstatements resulted from the cumulative net change of accounting moving deferred cost of revenue to property, plant and equipment, net for the leased Energy Servers under the Managed Services Agreements and similar sale-leaseback arrangements of
$56.5 million
, and the net capitalization of stock-based compensation costs of
$1.5 million
.
G
Prepaid expenses and other current assets — The correction of these misstatements resulted from the change of accounting for Managed Services Agreements and similar arrangements whereby prepaid property tax and insurance payments are now classified within prepaid expenses, rather than offset against deferred revenue.
H
Other long-term assets — The correction of these misstatements resulted from the change of accounting for Managed Services Agreements and similar arrangements, including the timing difference of capacity billings to end customers and the payments received from the financing entity, is recorded within long term receivables and whereby prepaid property tax and insurance payments are now classified within other long-term assets, rather than offset against long-term deferred revenue.
I
Accrued warranty — The correction of these misstatements resulted from the change of accounting for accrued warranty which is now recorded on an as-incurred basis for our Managed Services Agreements and similar arrangements. The correction of these misstatements resulted from the change of accounting for the grid pricing escalation guarantees we've provided in some of our sales arrangements. These commitments were previously treated as a contingent liability that was considered remote. We now maintain a
$0.3 million
accrual, with the initial value of treated as a reduction in product revenue and then any changes in the value adjusted through other expense, net each period thereafter.
J
Accrued expense and other current liabilities and other long-term liabilities — The correction of these misstatements resulted from the change of accounting for Managed Services Agreements and similar arrangements whereby instead of recognizing the bank financing as revenue, the bank financing loan proceeds received and due are classified as a lease loan liability.
K
Deferred revenue and customer deposits, current and non-current — The correction of these misstatements resulted from the change of accounting for the recognition of product and installation revenue from upfront or ratable recognition to the recognition of the capacity payments received from the end customer as power is generated by the Energy Servers as electricity revenue.
L
Other long-term liabilities — The correction of these misstatements resulted from the change of accounting for Managed Services Agreements and similar arrangements whereby instead of recognizing the bank financing as revenue, the bank financing loan proceeds received and due beyond the next twelve months are classified as a lease loan liability.
M
Purchase of property, plant and equipment — The correction of these misstatements resulted from the change of accounting for Managed Services Agreements and similar arrangements, whereby costs previously recognized as product and installation cost of revenue are now recorded as property, plant and equipment, net in the cases where the risks of ownership have not completely transferred to the financing party.
N
Proceeds and repayments from financing obligations — The correction of these misstatements resulted from the change of accounting for Managed Services Agreements and similar arrangements, whereby instead of recognizing the upfront proceeds received from the bank as revenue, the bank proceeds received are classified as proceeds from financing obligations and the capacity payments received from the end customer are classified as repayment of financing obligations and interest paid.
203
|
|
|
Nine Months Ended September 30, 2019
|
||||||||||||||||||
|
|
|
As Previously Reported
|
Restatement Impacts
|
As Restated
|
ASC 606 Adoption Impacts
|
As Restated & Recast
|
||||||||||||||
|
Cash flows from operating activities:
|
|
|
|
|
|
|||||||||||||||
|
Net loss
|
$
|
(195,434
|
)
|
$
|
(36,793
|
)
|
$
|
(232,227
|
)
|
$
|
(20,228
|
)
|
$
|
(252,455
|
)
|
|||||
|
Adjustments to reconcile net loss to net cash used in operating activities:
|
||||||||||||||||||||
|
Depreciation and amortization
|
55,816
|
|
9,132
|
|
A
|
64,948
|
|
—
|
|
64,948
|
|
|||||||||
|
Write-off of property, plant and equipment, net
|
2,987
|
|
—
|
|
2,987
|
|
—
|
|
2,987
|
|
||||||||||
|
Write-off of PPA II and PPA IIIb decommissioned assets
|
25,613
|
|
—
|
|
25,613
|
|
—
|
|
25,613
|
|
||||||||||
|
Debt make-whole expense
|
5,934
|
|
—
|
|
5,934
|
|
—
|
|
5,934
|
|
||||||||||
|
PPA I decommissioning, net
|
—
|
|
—
|
|
—
|
|
—
|
|
—
|
|
||||||||||
|
Revaluation of derivative contracts
|
1,335
|
|
1,620
|
|
B
|
2,955
|
|
—
|
|
2,955
|
|
|||||||||
|
Stock-based compensation
|
154,955
|
|
5,278
|
|
C
|
160,233
|
|
—
|
|
160,233
|
|
|||||||||
|
Loss on long-term REC purchase contract
|
61
|
|
—
|
|
61
|
|
—
|
|
61
|
|
||||||||||
|
Amortization of debt issuance cost
|
16,295
|
|
—
|
|
16,295
|
|
—
|
|
16,295
|
|
||||||||||
|
Changes in operating assets and liabilities:
|
||||||||||||||||||||
|
Accounts receivable
|
58,150
|
|
(318
|
)
|
D
|
57,832
|
|
5,594
|
|
63,426
|
|
|||||||||
|
Inventories
|
(7,896
|
)
|
6,121
|
|
E
|
(1,775
|
)
|
—
|
|
(1,775
|
)
|
|||||||||
|
Deferred cost of revenue
|
56,854
|
|
(59,198
|
)
|
F
|
(2,344
|
)
|
—
|
|
(2,344
|
)
|
|||||||||
|
Customer financing receivable and other
|
4,142
|
|
—
|
|
4,142
|
|
—
|
|
4,142
|
|
||||||||||
|
Prepaid expenses and other current assets
|
7,928
|
|
176
|
|
G
|
8,104
|
|
(33
|
)
|
8,071
|
|
|||||||||
|
Other long-term assets
|
3,281
|
|
(1,229
|
)
|
H
|
2,052
|
|
(758
|
)
|
1,294
|
|
|||||||||
|
Accounts payable
|
14,171
|
|
—
|
|
14,171
|
|
—
|
|
14,171
|
|
||||||||||
|
Accrued warranty
|
(3,941
|
)
|
109
|
|
I
|
(3,832
|
)
|
(242
|
)
|
(4,074
|
)
|
|||||||||
|
Accrued expenses and other current liabilities
|
5,029
|
|
162
|
|
J
|
5,191
|
|
—
|
|
5,191
|
|
|||||||||
|
Deferred managed services revenue
|
—
|
|
—
|
|
—
|
|
—
|
|
—
|
|
||||||||||
|
Deferred revenue and customer deposits
|
(68,180
|
)
|
74,765
|
|
K
|
6,585
|
|
15,667
|
|
22,252
|
|
|||||||||
|
Other long-term liabilities
|
2,083
|
|
2,477
|
|
L
|
4,560
|
|
—
|
|
4,560
|
|
|||||||||
|
Net cash provided by operating activities
|
139,183
|
|
2,302
|
|
141,485
|
|
—
|
|
141,485
|
|
||||||||||
|
Cash flows from investing activities:
|
||||||||||||||||||||
|
Purchase of property, plant and equipment
|
(23,474
|
)
|
(16,216
|
)
|
M
|
(39,690
|
)
|
—
|
|
(39,690
|
)
|
|||||||||
|
Payments for acquisition of intangible assets
|
(1,478
|
)
|
—
|
|
(1,478
|
)
|
—
|
|
(1,478
|
)
|
||||||||||
|
Proceeds from maturity of marketable securities
|
104,500
|
|
—
|
|
104,500
|
|
—
|
|
104,500
|
|
||||||||||
|
Net cash provided by investing activities
|
79,548
|
|
(16,216
|
)
|
63,332
|
|
—
|
|
63,332
|
|
||||||||||
|
Cash flows from financing activities:
|
||||||||||||||||||||
|
Repayment of debt
|
(93,263
|
)
|
—
|
|
(93,263
|
)
|
—
|
|
(93,263
|
)
|
||||||||||
|
Repayment of debt to related parties
|
(1,691
|
)
|
—
|
|
(1,691
|
)
|
—
|
|
(1,691
|
)
|
||||||||||
|
Debt make-whole payment
|
(5,934
|
)
|
—
|
|
(5,934
|
)
|
—
|
|
(5,934
|
)
|
||||||||||
|
Proceeds from financing obligations
|
—
|
|
20,333
|
|
N
|
20,333
|
|
—
|
|
20,333
|
|
|||||||||
|
Repayment of financing obligations
|
—
|
|
(6,419
|
)
|
N
|
(6,419
|
)
|
—
|
|
(6,419
|
)
|
|||||||||
|
Payments to noncontrolling and redeemable noncontrolling interests
|
(43,713
|
)
|
—
|
|
(43,713
|
)
|
—
|
|
(43,713
|
)
|
||||||||||
|
Distributions to noncontrolling and redeemable noncontrolling interests
|
(9,363
|
)
|
—
|
|
(9,363
|
)
|
—
|
|
(9,363
|
)
|
||||||||||
|
Proceeds from issuance of common stock
|
12,623
|
|
—
|
|
12,623
|
|
—
|
|
12,623
|
|
||||||||||
204
|
|
|
Nine Months Ended September 30, 2019
|
||||||||||||||||||
|
|
|
As Previously Reported
|
Restatement Impacts
|
As Restated
|
ASC 606 Adoption Impacts
|
As Restated & Recast
|
||||||||||||||
|
Net cash used in financing activities
|
(141,341
|
)
|
13,914
|
|
(127,427
|
)
|
—
|
|
(127,427
|
)
|
||||||||||
|
Net increase in cash, cash equivalents, and restricted cash
|
77,390
|
|
—
|
|
77,390
|
|
—
|
|
77,390
|
|
||||||||||
|
Cash, cash equivalents, and restricted cash:
|
||||||||||||||||||||
|
Beginning of period
|
280,485
|
|
—
|
|
280,485
|
|
—
|
|
280,485
|
|
||||||||||
|
End of period
|
$
|
357,875
|
|
$
|
—
|
|
$
|
357,875
|
|
$
|
—
|
|
$
|
357,875
|
|
|||||
|
Supplemental disclosure of cash flow information:
|
||||||||||||||||||||
|
Cash paid during the period for interest
|
$
|
35,894
|
|
$
|
17,878
|
|
N
|
$
|
53,772
|
|
$
|
—
|
|
$
|
53,772
|
|
||||
|
Cash paid during the period for taxes
|
715
|
|
—
|
|
715
|
|
—
|
|
715
|
|
||||||||||
A
Depreciation and amortization — The correction of these misstatements resulted from the change of accounting for Energy Servers under the Managed Services Program and similar arrangements that would have been product and install cost of revenue, but are now recorded as property, plant and equipment, net and depreciated over their useful lives of 21 years.
B
Revaluation of derivative contracts — The correction of these misstatements resulted from the change of accounting for the grid pricing escalation guarantees we provided in some of our sales arrangements. These commitments were previously treated as a contingent liability that was considered remote. We now consider the commitments a derivative liability, with the initial value of recorded as a reduction in product revenue and then any changes in the value adjusted through other expense, net each period thereafter.
C
Stock-based compensation — The correction of these misstatements resulted from the change of accounting for stock-based compensation, including net capitalization of stock-based compensation costs into inventory of
$5.9 million
. The correction of this misstatement also resulted in the capitalization of
$0.6 million
of stock-based compensation costs related to assets under the Managed Services Programs now recorded as construction in progress within property, plant and equipment, net.
D
Accounts receivable — The correction of these misstatements resulted from the change of accounting for Managed Services Agreements, for which the amount recorded to accounts receivable represents amounts invoiced for capacity billings to end customers which have not yet been collected by the financing entity as of the period end.
E
Inventories — The correction of these misstatements resulted from the change of accounting for inventories held for shipments planned to customers under the Managed Services Program and similar arrangements now accounted for as construction in progress within property, plant and equipment, net.
F
Deferred cost of revenue, current and non-current — The correction of these misstatements resulted from the cumulative net change of accounting moving deferred cost of revenue to property, plant and equipment, net for the leased Energy Servers under the Managed Services Agreements and similar sale-leaseback arrangements of
$60.6 million
and the net capitalization of stock-based compensation expenses of
$1.4 million
.
G
Prepaid expenses and other current assets — The correction of these misstatements resulted from the change of accounting for Managed Services Agreements and similar arrangements whereby prepaid property tax and insurance payments are now classified within prepaid expenses, rather than offset against deferred revenue.
H
Other long-term assets — The correction of these misstatements resulted from the change of accounting for Managed Services Agreements and similar arrangements, whereby the timing difference of capacity billings to end customers and the payments received from the financing entity is recorded within long term receivables and whereby prepaid property tax and insurance payments are now classified within other long-term assets, rather than offset against long-term deferred revenue.
I
Accrued warranty — The correction of these misstatements resulted from the change of accounting for accrued warranty which is now recorded on an as-incurred basis for our Managed Services Agreements and similar arrangements. The correction of these misstatements resulted from the change of accounting for the grid pricing escalation guarantees we provided in some of our sales arrangements. These commitments were previously treated as a contingent liability that was considered remote. We now maintain a
$0.4 million
accrual, with the initial value treated as a reduction in product revenue and then any changes in the value adjusted through other expense, net each period thereafter.
J
Accrued expense and other current liabilities and other long-term liabilities — The correction of these misstatements resulted from the change of accounting for Managed Services Agreements and similar arrangements whereby instead of recognizing the bank financing as revenue, the bank financing loan proceeds received and due are classified as a lease loan liability.
K
Deferred revenue and customer deposits, current and non-current — The correction of these misstatements resulted from the change of accounting for the recognition of product and installation revenue from upfront or ratable recognition to recognition of the capacity payments received from the end customer as power is generated by the Energy Servers as electricity revenue.
L
Other long-term liabilities — The correction of these misstatements resulted from the change of accounting for Managed Services Agreements and similar arrangements whereby instead of recognizing the bank financing as revenue, the bank financing loan proceeds received and due beyond the next twelve months are classified as a lease loan liability.
M
Purchase of property, plant and equipment — The correction of these misstatements resulted from the change of accounting for Managed Services Agreements and similar arrangements, whereby costs previously recognized as product and installation cost of revenue are now recorded as property, plant and equipment, net in the cases where the risks of ownership have not completely transferred to the financing party.
205
N
Proceeds and repayments from financing obligations — The correction of these misstatements resulted from the change of accounting for Managed Services Agreements and similar arrangements, whereby instead of recognizing the upfront proceeds received from the bank as revenue, the bank proceeds received are classified as proceeds from financing obligations and the capacity payments received from the end customer are classified as repayment of financing obligations and interest paid.
206
|
Three Months Ended March 31, 2018
|
||||||||||||
|
|
|
As Previously Reported
|
Revision Impacts
|
As Revised
|
||||||||
|
Cash flows from operating activities:
|
|
|
|
|
|
|
||||||
|
Net loss
|
|
$
|
(22,348
|
)
|
$
|
(3,875
|
)
|
$
|
(26,223
|
)
|
||
|
Adjustments to reconcile net loss to net cash used in operating activities:
|
|
|||||||||||
|
Depreciation and amortization
|
|
10,847
|
|
2,457
|
|
A
|
13,304
|
|
||||
|
Revaluation of derivative contracts
|
|
7,157
|
|
—
|
|
7,157
|
|
|||||
|
Stock-based compensation
|
|
7,956
|
|
191
|
|
B
|
8,147
|
|
||||
|
Loss on long-term REC purchase contract
|
|
12
|
|
—
|
|
12
|
|
|||||
|
Revaluation of preferred stock warrants
|
|
(3,271
|
)
|
—
|
|
(3,271
|
)
|
|||||
|
Common stock warrant valuation
|
|
(100
|
)
|
—
|
|
(100
|
)
|
|||||
|
Amortization of debt issuance cost
|
|
7,168
|
|
—
|
|
7,168
|
|
|||||
|
Changes in operating assets and liabilities:
|
|
|||||||||||
|
Accounts receivable
|
|
(28,203
|
)
|
(32
|
)
|
C
|
(28,235
|
)
|
||||
|
Inventories
|
(6,818
|
)
|
3,291
|
|
D
|
(3,527
|
)
|
|||||
|
Deferred cost of revenue
|
16,282
|
|
(3,541
|
)
|
E
|
12,741
|
|
|||||
|
Customer financing receivable and other
|
1,306
|
|
—
|
|
1,306
|
|
||||||
|
Prepaid expenses and other current assets
|
(446
|
)
|
929
|
|
F
|
483
|
|
|||||
|
Other long-term assets
|
1,266
|
|
(418
|
)
|
G
|
848
|
|
|||||
|
Accounts payable
|
(827
|
)
|
—
|
|
(827
|
)
|
||||||
|
Accrued warranty
|
(87
|
)
|
10
|
|
H
|
(77
|
)
|
|||||
|
Accrued expenses and other current liabilities
|
(10,083
|
)
|
(515
|
)
|
I
|
(10,598
|
)
|
|||||
|
Deferred revenue and customer deposits
|
(22,347
|
)
|
6,620
|
|
J
|
(15,727
|
)
|
|||||
|
Other long-term liabilities
|
8,049
|
|
981
|
|
K
|
9,030
|
|
|||||
|
Net cash used in operating activities
|
(34,487
|
)
|
6,098
|
|
(28,389
|
)
|
||||||
|
Cash flows from investing activities:
|
||||||||||||
|
Purchase of property, plant and equipment
|
(223
|
)
|
(4,635
|
)
|
L
|
(4,858
|
)
|
|||||
|
Purchase of marketable securities
|
(8,991
|
)
|
—
|
|
(8,991
|
)
|
||||||
|
Proceeds from maturity of marketable securities
|
15,750
|
|
—
|
|
15,750
|
|
||||||
|
Net cash provided by investing activities
|
6,536
|
|
(4,635
|
)
|
1,901
|
|
||||||
|
Cash flows from financing activities:
|
||||||||||||
|
Repayment of debt
|
(4,489
|
)
|
—
|
|
(4,489
|
)
|
||||||
|
Repayment of debt to related parties
|
(290
|
)
|
—
|
|
(290
|
)
|
||||||
|
Repayment of financing obligations
|
—
|
|
(1,463
|
)
|
M
|
(1,463
|
)
|
|||||
|
Distributions to noncontrolling and redeemable noncontrolling interests
|
(3,832
|
)
|
—
|
|
(3,832
|
)
|
||||||
|
Proceeds from issuance of common stock
|
120
|
|
—
|
|
120
|
|
||||||
|
Payments of initial public offering issuance costs
|
(578
|
)
|
—
|
|
(578
|
)
|
||||||
|
Net cash used in financing activities
|
(9,069
|
)
|
(1,463
|
)
|
(10,532
|
)
|
||||||
|
Net decrease in cash, cash equivalents, and restricted cash
|
(37,020
|
)
|
—
|
|
(37,020
|
)
|
||||||
|
Cash, cash equivalents, and restricted cash:
|
||||||||||||
|
Beginning of period
|
180,612
|
|
—
|
|
180,612
|
|
||||||
207
|
Three Months Ended March 31, 2018
|
||||||||||||
|
|
|
As Previously Reported
|
Revision Impacts
|
As Revised
|
||||||||
|
End of period
|
$
|
143,592
|
|
$
|
—
|
|
$
|
143,592
|
|
|||
|
Supplemental disclosure of cash flow information:
|
||||||||||||
|
Cash paid during the period for interest
|
11,216
|
|
4,613
|
|
M
|
15,829
|
|
|||||
|
Cash paid during the period for taxes
|
401
|
|
—
|
|
401
|
|
||||||
A
Depreciation and amortization — The correction of these misstatements resulted from the change of accounting for Energy Servers under the Managed Services Program and similar arrangements that would have been product and install cost of revenue, but are now recorded as property, plant and equipment, net and depreciated over their useful lives of 21 years.
B
Stock-based compensation — The correction of these misstatements resulted from the change of accounting for stock-based compensation, including net capitalization of stock-based compensation costs into inventory of
$0.6 million
. The correction of this misstatement also resulted in the capitalization of costs of
$0.8 million
related to assets under the Managed Services Program now recorded as construction in progress within property, plant and equipment, net.
C
Accounts receivable — The correction of these misstatements resulted from the change of accounting for Managed Services Agreements, for which the amount recorded to accounts receivable represents amounts invoiced for capacity billings to end customers which have not yet been collected by the financing entity as of the period end.
D
Inventories — The correction of these misstatements resulted from the change of accounting for inventories held for shipments planned to customers under the Managed Services Program and similar arrangements now accounted for as construction in progress within property, plant and equipment, net.
E
Deferred cost of revenue, current and non-current — The correction of these misstatements resulted from the cumulative net change of accounting moving deferred cost of revenue to property, plant and equipment, net for the leased Energy Servers under the Managed Services Agreements and similar sale-leaseback arrangements of
$3.2 million
and the net capitalization of stock-based compensation expenses of
$0.3 million
.
F
Prepaid expenses and other current assets — The correction of these misstatements resulted from the change of accounting for Managed Services Agreements and similar arrangements whereby prepaid property tax and insurance payments are now classified within prepaid expenses, rather than offset against deferred revenue.
G
Other long-term assets —The correction of these misstatements resulted from the change of accounting for Managed Services Agreements and similar arrangements, including the timing difference of capacity billings to end customers and the payments received from the financing entity is recorded within long term receivables and whereby prepaid property tax and insurance payments are now classified within other long-term assets, rather than offset against long-term deferred revenue.
H
Accrued warranty — The correction of these misstatements resulted from the change of accounting for accrued warranty which is now recorded on an as-incurred basis on our Managed Services Agreements and similar arrangements.
I
Accrued expense and other current liabilities and other long-term liabilities — The correction of these misstatements resulted from the change of accounting for Managed Services Agreements and similar arrangements whereby instead of recognizing the bank financing as revenue, the bank financing loan proceeds received and due are classified as a lease loan liability.
J
Deferred revenue and customer deposits, current and non-current — The correction of these misstatements resulted from the change of accounting for the recognition of product and installation revenue from upfront or ratable recognition to the recognition of the capacity payments received from the end customer as power is generated by the Energy Servers as electricity revenue.
K
Other long-term liabilities — The correction of these misstatements resulted from the change of accounting for Managed Services Agreements and similar arrangements whereby instead of recognizing the bank financing as revenue, the bank financing loan proceeds received and due beyond the next twelve months are classified as a lease loan liability.
L
Purchase of property, plant and equipment — The correction of these misstatements resulted from the change of accounting for Managed Services Agreements and similar arrangements, whereby costs previously recognized as product and installation cost of revenue are now recorded as property, plant and equipment, net in the cases where the risks of ownership have not completely transferred to the financing party.
M
Proceeds and repayments from financing obligations — The correction of these misstatements resulted from the change of accounting for Managed Services Agreements and similar arrangements whereby instead of recognizing the upfront proceeds received from the bank as revenue, the proceeds received and due are classified as proceeds from financing obligations and the capacity payments received from the end customer are classified as repayment of financing obligations and interest paid.
208
.
|
Six Months Ended June 30, 2018
|
||||||||||||
|
|
|
As Previously Reported
|
Restatement Impacts
|
As Restated
|
||||||||
|
Cash flows from operating activities:
|
|
|||||||||||
|
Net loss
|
|
$
|
(72,536
|
)
|
$
|
(14,197
|
)
|
$
|
(86,733
|
)
|
||
|
Adjustments to reconcile net loss to net cash used in operating activities:
|
|
|||||||||||
|
Depreciation and amortization
|
|
21,554
|
|
4,912
|
|
A
|
26,466
|
|
||||
|
Write-off of property, plant and equipment, net
|
|
661
|
|
—
|
|
661
|
|
|||||
|
Revaluation of derivative contracts
|
|
28,611
|
|
—
|
|
28,611
|
|
|||||
|
Stock-based compensation
|
|
15,773
|
|
(292
|
)
|
B
|
15,481
|
|
||||
|
Loss on long-term REC purchase contract
|
|
100
|
|
—
|
|
100
|
|
|||||
|
Revaluation of stock warrants
|
|
(7,456
|
)
|
—
|
|
(7,456
|
)
|
|||||
|
Revaluation of preferred stock warrants
|
|
(166
|
)
|
—
|
|
(166
|
)
|
|||||
|
Amortization of debt issuance cost
|
|
14,420
|
|
—
|
|
14,420
|
|
|||||
|
Changes in operating assets and liabilities:
|
|
|||||||||||
|
Accounts receivable
|
|
(6,486
|
)
|
(195
|
)
|
C
|
(6,681
|
)
|
||||
|
Inventories
|
(46,172
|
)
|
7,915
|
|
D
|
(38,257
|
)
|
|||||
|
Deferred cost of revenue
|
48,760
|
|
(28,362
|
)
|
E
|
20,398
|
|
|||||
|
Customer financing receivable and other
|
2,439
|
|
—
|
|
2,439
|
|
||||||
|
Prepaid expenses and other current assets
|
4,544
|
|
220
|
|
F
|
4,764
|
|
|||||
|
Other long-term assets
|
15
|
|
(866
|
)
|
G
|
(851
|
)
|
|||||
|
Accounts payable
|
5,217
|
|
—
|
|
5,217
|
|
||||||
|
Accrued warranty
|
(1,883
|
)
|
(300
|
)
|
H
|
(2,183
|
)
|
|||||
|
Accrued expenses and other current liabilities
|
(12,815
|
)
|
(1,386
|
)
|
I
|
(14,201
|
)
|
|||||
|
Deferred revenue and customer deposits
|
(31,817
|
)
|
9,787
|
|
J
|
(22,030
|
)
|
|||||
|
Other long-term liabilities
|
18,652
|
|
497
|
|
K
|
19,149
|
|
|||||
|
Net cash used in operating activities
|
(18,585
|
)
|
(22,267
|
)
|
(40,852
|
)
|
||||||
|
Cash flows from investing activities:
|
||||||||||||
|
Purchase of property, plant and equipment
|
(1,595
|
)
|
(11,550
|
)
|
L
|
(13,145
|
)
|
|||||
|
Purchase of marketable securities
|
(15,732
|
)
|
—
|
|
(15,732
|
)
|
||||||
|
Proceeds from maturity of marketable securities
|
27,000
|
|
—
|
|
27,000
|
|
||||||
|
Net cash provided by (used in) investing activities
|
9,673
|
|
(11,550
|
)
|
(1,877
|
)
|
||||||
|
Cash flows from financing activities:
|
||||||||||||
|
Repayment of debt
|
(9,201
|
)
|
—
|
|
(9,201
|
)
|
||||||
|
Repayment of debt to related parties
|
(627
|
)
|
—
|
|
(627
|
)
|
||||||
|
Proceeds from financing obligations
|
—
|
|
36,799
|
|
M
|
36,799
|
|
|||||
|
Repayment of financing obligations
|
—
|
|
(2,982
|
)
|
M
|
(2,982
|
)
|
|||||
|
Distributions to noncontrolling and redeemable noncontrolling interests
|
(11,582
|
)
|
—
|
|
(11,582
|
)
|
||||||
|
Proceeds from issuance of common stock
|
742
|
|
—
|
|
742
|
|
||||||
|
Payments of initial public offering issuance costs
|
(1,160
|
)
|
—
|
|
(1,160
|
)
|
||||||
|
Net cash provided by (used in) financing activities
|
(21,828
|
)
|
33,817
|
|
11,989
|
|
||||||
|
Net decrease in cash, cash equivalents, and restricted cash
|
(30,740
|
)
|
—
|
|
(30,740
|
)
|
||||||
|
Cash, cash equivalents, and restricted cash:
|
||||||||||||
209
|
Six Months Ended June 30, 2018
|
||||||||||||
|
|
|
As Previously Reported
|
Restatement Impacts
|
As Restated
|
||||||||
|
Beginning of period
|
180,612
|
|
—
|
|
180,612
|
|
||||||
|
End of period
|
$
|
149,872
|
|
$
|
—
|
|
$
|
149,872
|
|
|||
|
Supplemental disclosure of cash flow information:
|
||||||||||||
|
Cash paid during the period for interest
|
$
|
16,540
|
|
$
|
9,233
|
|
M
|
$
|
25,773
|
|
||
|
Cash paid during the period for taxes
|
625
|
|
—
|
625
|
|
|||||||
A
Depreciation and amortization — The correction of these misstatements resulted from the change of accounting for Energy Servers under the Managed Services Program and similar arrangements that would have been product and install cost of revenue, but are now recorded as property, plant and equipment, net and depreciated over their useful lives of 21 years.
B
Stock-based compensation — The correction of these misstatements resulted from the change of accounting for stock-based compensation, including net capitalization of stock-based compensation costs into inventory of
$1.0 million
. The correction of this misstatement also resulted in the capitalization of
$0.7 million
of stock-based compensation costs related to assets under the Managed Services Programs now recorded as construction in progress within property, plant and equipment, net.
C
Accounts receivable — The correction of these misstatements resulted from the change of accounting for Managed Services Agreements for which the amount recorded to accounts receivable represents amounts invoiced for capacity billings to end customers which have not yet been collected by the financing entity as of the period end.
D
Inventories — The correction of these misstatements resulted from the change of accounting for inventories held for shipments planned to customers under the Managed Services Program and similar arrangements now accounted for as construction in progress within property, plant and equipment, net.
E
Deferred cost of revenue, current and non-current — The correction of these misstatements resulted from the cumulative net change of accounting moving deferred cost of revenue to property, plant and equipment, net for the leased Energy Servers under the Managed Services Agreements and similar sale-leaseback arrangements of
$28.1 million
and the net capitalization of stock-based compensation costs of
$0.3 million
.
F
Prepaid expenses and other current assets — The correction of these misstatements resulted from the change of accounting for Managed Services Agreements and similar arrangements whereby prepaid property tax and insurance payments are now classified within prepaid expenses, rather than offset against deferred revenue.
G
Other long-term assets — The correction of these misstatements resulted from the change of accounting for Managed Services Agreements and similar arrangements, including the timing difference of capacity billings to end customers and the payments received from the financing entity is recorded within long term receivables and whereby prepaid property tax and insurance payments are now classified within other long-term assets, rather than offset against long-term deferred revenue.
H
Accrued warranty — The correction of these misstatements resulted from the change of accounting for accrued warranty which is now recorded on an as-incurred basis for our Managed Services Agreements and similar arrangements.
I
Accrued expense and other current liabilities and other long-term liabilities — The correction of these misstatements resulted from the change of accounting for Managed Services Agreements and similar arrangements whereby instead of recognizing the bank financing as revenue, the bank financing loan proceeds received and due are classified as a lease loan liability.
J
Deferred revenue and customer deposits, current and non-current — The correction of these misstatements resulted from the change of accounting for the recognition of product and installation revenue from upfront or ratable recognition to the recognition of the capacity payments received from the end customer as power is generated by the Energy Servers as electricity revenue.
K
Other long-term liabilities — The correction of these misstatements resulted from the change of accounting for Managed Services Agreements and similar arrangements where instead of recognizing the bank financing as revenue, the bank financing loan proceeds received and due beyond the next twelve months are classified as a lease loan liability.
L
Purchase of property, plant and equipment — The correction of these misstatements resulted from the change of accounting for Managed Services Agreements and similar arrangements, whereby costs previously recognized as product and installation cost of revenue are now recorded as property, plant and equipment, net in the cases where the risks of ownership have not completely transferred to the financing party.
M
Proceeds and repayments from financing obligations — The correction of these misstatements resulted from the change of accounting for Managed Services Agreements and similar arrangements whereby instead of recognizing the upfront proceeds received from the bank as revenue, the proceeds received and due are classified as proceeds from financing obligations and the capacity payments received from the end customer are classified as repayment of financing obligations and interest paid.
210
|
Nine Months Ended September 30, 2018
|
||||||||||||
|
|
|
As Previously Reported
|
Restatement Impacts
|
As Restated
|
||||||||
|
Cash flows from operating activities:
|
|
|||||||||||
|
Net loss
|
|
$
|
(155,046
|
)
|
$
|
(16,119
|
)
|
$
|
(171,165
|
)
|
||
|
Adjustments to reconcile net loss to net cash used in operating activities:
|
|
|||||||||||
|
Depreciation and amortization
|
|
32,141
|
|
7,616
|
|
A
|
39,757
|
|
||||
|
Write-off of property, plant and equipment, net
|
|
901
|
|
—
|
|
901
|
|
|||||
|
Revaluation of derivative contracts
|
|
26,761
|
|
755
|
|
B
|
27,516
|
|
||||
|
Stock-based compensation
|
|
87,451
|
|
(10,777
|
)
|
C
|
76,674
|
|
||||
|
Loss on long-term REC purchase contract
|
|
150
|
|
—
|
|
150
|
|
|||||
|
Revaluation of stock warrants
|
|
(9,109
|
)
|
—
|
|
(9,109
|
)
|
|||||
|
Amortization of debt issuance cost
|
|
20,279
|
|
—
|
|
20,279
|
|
|||||
|
Changes in operating assets and liabilities:
|
|
|||||||||||
|
Accounts receivable
|
|
(11,168
|
)
|
(332
|
)
|
D
|
(11,500
|
)
|
||||
|
Inventories
|
(44,465
|
)
|
4,037
|
|
E
|
(40,428
|
)
|
|||||
|
Deferred cost of revenue
|
47,945
|
|
(34,343
|
)
|
F
|
13,602
|
|
|||||
|
Customer financing receivable and other
|
3,736
|
|
—
|
|
3,736
|
|
||||||
|
Prepaid expenses and other current assets
|
(6,514
|
)
|
(1,585
|
)
|
G
|
(8,099
|
)
|
|||||
|
Other long-term assets
|
1,052
|
|
(1,398
|
)
|
H
|
(346
|
)
|
|||||
|
Accounts payable
|
11,236
|
|
—
|
|
11,236
|
|
||||||
|
Accrued warranty
|
1,164
|
|
(324
|
)
|
I
|
840
|
|
|||||
|
Accrued expenses and other current liabilities
|
1,885
|
|
626
|
|
J
|
2,511
|
|
|||||
|
Deferred revenue and customer deposits
|
(32,203
|
)
|
17,431
|
|
K
|
(14,772
|
)
|
|||||
|
Other long-term liabilities
|
10,156
|
|
1,362
|
|
L
|
11,518
|
|
|||||
|
Net cash used in operating activities
|
(13,648
|
)
|
(33,051
|
)
|
(46,699
|
)
|
||||||
|
Cash flows from investing activities:
|
||||||||||||
|
Purchase of property, plant and equipment
|
(4,333
|
)
|
(20,283
|
)
|
M
|
(24,616
|
)
|
|||||
|
Payments for acquisition of intangible assets
|
(2,762
|
)
|
—
|
|
(2,762
|
)
|
||||||
|
Purchase of marketable securities
|
(15,732
|
)
|
—
|
|
(15,732
|
)
|
||||||
|
Proceeds from maturity of marketable securities
|
38,250
|
|
—
|
|
38,250
|
|
||||||
|
Net cash provided by (used in) investing activities
|
15,423
|
|
(20,283
|
)
|
(4,860
|
)
|
||||||
|
Cash flows from financing activities:
|
||||||||||||
|
Repayment of debt
|
(14,036
|
)
|
—
|
|
(14,036
|
)
|
||||||
|
Repayment of debt to related parties
|
(990
|
)
|
—
|
|
(990
|
)
|
||||||
|
Proceeds from financing obligations
|
—
|
|
57,897
|
|
N
|
57,897
|
|
|||||
|
Repayment of financing obligations
|
—
|
|
(4,563
|
)
|
N
|
(4,563
|
)
|
|||||
|
Distributions to noncontrolling and redeemable noncontrolling interests
|
(14,192
|
)
|
—
|
|
(14,192
|
)
|
||||||
|
Proceeds from issuance of common stock
|
1,456
|
|
—
|
|
1,456
|
|
||||||
|
Proceeds from public offerings, net of underwriting discounts and commissions
|
292,529
|
|
—
|
|
292,529
|
|
||||||
|
Payments of initial public offering issuance costs
|
(2,928
|
)
|
—
|
|
(2,928
|
)
|
||||||
|
Net cash provided by financing activities
|
261,839
|
|
53,334
|
|
315,173
|
|
||||||
|
Net increase in cash, cash equivalents, and restricted cash
|
263,614
|
|
—
|
|
263,614
|
|
||||||
211
|
Nine Months Ended September 30, 2018
|
||||||||||||
|
|
|
As Previously Reported
|
Restatement Impacts
|
As Restated
|
||||||||
|
Cash, cash equivalents, and restricted cash:
|
||||||||||||
|
Beginning of period
|
180,612
|
|
—
|
|
180,612
|
|
||||||
|
End of period
|
$
|
444,226
|
|
$
|
—
|
|
$
|
444,226
|
|
|||
|
Supplemental disclosure of cash flow information:
|
||||||||||||
|
Cash paid during the period for interest
|
$
|
30,601
|
|
$
|
14,505
|
|
N
|
$
|
45,106
|
|
||
|
Cash paid during the period for taxes
|
1,052
|
|
—
|
|
1,052
|
|
||||||
A
Depreciation and amortization — The correction of these misstatements resulted from the change of accounting for Energy Servers under the Managed Services Program and similar arrangements that would have been product and install cost of revenue, but are now recorded as property, plant and equipment, net and depreciated over their useful lives of 21 years.
B
Revaluation of derivative contracts — The correction of this misstatement resulted from the cumulative net change in the valuation of our embedded derivatives in our 6% Notes. The change in the valuation was recorded in loss on revaluation of embedded derivatives.
C
Stock-based compensation — The correction of these misstatements resulted from the change of accounting for stock-based compensation, including net capitalization of stock-based compensation cost into inventory of
$10.1 million
. The correction of this misstatement also resulted in the capitalization of
$0.7 million
of stock-based compensation costs related to assets under the Managed Services Programs now recorded as construction in progress within property, plant and equipment, net.
D
Accounts receivable — The correction of these misstatements resulted from the change of accounting for Managed Services Agreements, for which the amount recorded to accounts receivable represents amounts invoiced for capacity billings to end customers which have not yet been collected by the financing entity as of the period end.
E
Inventories — The correction of these misstatements resulted from the change of accounting for inventories held for shipments planned to customers under the Managed Services Program and similar arrangements now accounted for as construction in progress within property, plant and equipment, net.
F
Deferred cost of revenue, current and non-current — The correction of these misstatements resulted from the cumulative net change of accounting moving deferred cost of revenue to property, plant and equipment, net for the leased Energy Servers under the Managed Services Agreements and similar sale-leaseback arrangements of
$31.4 million
and the net capitalization of stock-based compensation expenses of
$3.0 million
.
G
Prepaid expenses and other current assets — The correction of these misstatements resulted from the change of accounting for Managed Services Agreements and similar arrangements whereby prepaid property tax and insurance payments are now classified within prepaid expenses.
H
Other long-term assets — The correction of these misstatements resulted from the change of accounting for Managed Services Agreements and similar arrangements whereby the timing difference of capacity billings to end customers and payments received from the financing entity is recorded within long term receivables and commission payments are now classified within long term prepaid commissions.
I
Accrued warranty — The correction of these misstatements resulted from the change of accounting for accrued warranty which is now recorded on an as-incurred basis for our Managed Services Agreements and similar arrangements.
J
Accrued expense and other current liabilities and other long-term liabilities — The correction of these misstatements resulted from the change of accounting for Managed Services Agreements and similar arrangements whereby instead of recognizing the bank financing as revenue, the bank financing loan proceeds received and due are classified as a lease loan liability.
K
Deferred revenue and customer deposits, current and non-current — The correction of these misstatements resulted from the change of accounting for the recognition of product and installation revenue from upfront or ratable recognition to recognition of the capacity payments received from the end customer as power is generated by the Energy Servers as electricity revenue.
L
Other long-term liabilities — The correction of these misstatements resulted from the change of accounting for Managed Services Agreements and similar arrangements whereby the timing difference of capacity billings to end customers and the payments received from the financing entity is recorded within long term receivables and whereby prepaid property tax and insurance payments are now classified within other long-term assets, rather than offset against long-term deferred revenue.
M
Purchase of property, plant and equipment — The correction of these misstatements resulted from the change of accounting for Managed Services Agreements and similar arrangements, whereby costs previously recognized as product and installation cost of revenue are now recorded as property, plant and equipment, net in the cases where the risks of ownership have not completely transferred to the financing party.
N
Proceeds and repayments from financing obligations — The correction of these misstatements resulted from the change of accounting for Managed Services Agreements and similar arrangements whereby instead of recognizing the upfront proceeds received from the bank as revenue, the proceeds received and due are classified as proceeds from financing obligations and the capacity payments received from the end customer are classified as repayment of financing obligations and interest paid.
212
ITEM 9 - CHANGES IN AND DISAGREEMENTS WITH ACCOUNTANTS ON ACCOUNTING AND FINANCIAL DISCLOSURE
None.
ITEM 9A - CONTROLS AND PROCEDURES
Evaluation of Disclosure Controls and Procedures
We maintain disclosure controls and procedures that are designed to ensure that information required to be disclosed in our reports that we file or submit under the Securities Exchange Act of 1934, as amended (Exchange Act), is recorded, processed, summarized and reported within the time periods specified in SEC rules and forms, and that such information is accumulated and communicated to our management, including our Chief Executive Officer (our principal executive officer) and Chief Financial Officer (our principal financial officer) as appropriate, to allow for timely decisions regarding required disclosure.
Our management, with the participation of our Chief Executive Officer and Chief Financial Officer, has evaluated the effectiveness of our disclosure controls and procedures (as defined in Rules 13a-15(e) and 15d-15(e) under the Exchange Act), as of
December 31, 2019
. Based on such evaluation, our Chief Executive Officer and Chief Financial Officer have concluded that as of
December 31, 2019
, our disclosure controls and procedures were not effective because of the material weakness described below.
Management’s Report on Internal Control over Financial Reporting
Our management is responsible for establishing and maintaining adequate internal control over financial reporting (as defined in Rules 13a-15(f) and 15d-15(f) under the Exchange Act). Our internal control over financial reporting includes policies and procedures designed to provide reasonable assurance regarding the reliability of financial reporting and the preparation of financial statements for external reporting purposes in accordance with generally accepted accounting principles.
Under the supervision and with the participation of our Chief Executive Officer and Chief Financial Officer, our management conducted an evaluation of the effectiveness of our internal control over financial reporting as of December 31, 2019, based on the criteria established in Internal Control -- Integrated Framework (2013) issued by the Committee of Sponsoring Organizations of the Treadway Commission. Based on such evaluation, our management has concluded that, as of December 31, 2019, our internal control over financial reporting was not effective because of the material weakness described below.
A material weakness is a deficiency, or a combination of deficiencies, in internal control over financial reporting such that there is a reasonable possibility that a material misstatement of our annual or interim financial statements will not be prevented or detected on a timely basis. We identified a material weakness, whereby we did not design and maintain an effective control environment with a sufficient complement of resources with an appropriate level of accounting knowledge, expertise and training to evaluate the accounting implications of complex or non-routine transactions commensurate with our financial reporting requirements.
This material weakness resulted in errors in the accounting for certain transactions, which resulted in a restatement of
our consolidated financial statements as of and for the year ended December 31, 2018, as of and for the three month period ended March 31, 2019, as of and for the three and six month periods ended June 30, 2019 and 2018 and as of and for the three and nine month periods ended September 30, 2019 and 2018, and revisions to our consolidated financial statements as of and for the year ended December 31, 2017 and as of and for the three month period ended March 31, 2018. Additionally, this material weakness could result in a misstatement of substantially all account balances or disclosures that would result in a material misstatement to the annual or interim consolidated financial statements that would not be prevented or detected.
Remediation Activities
We are currently in the process of remediating the material weakness and have taken and continue to take steps that we believe will address the underlying causes of the material weakness which resulted from an insufficient complement of resources with an appropriate level of accounting knowledge, expertise and training to evaluate the accounting implications of complex or non-routine transactions commensurate with our financial reporting requirements. Steps we are taking include increasing the use of qualified internal or third-party technical resources with accounting expertise on complex or non-routine transactions who will provide accounting interpretation guidance to assist us in identifying and addressing any issues that affect our consolidated financial statements.
213
Changes in Internal Control Over Financial Reporting
There were no changes in our internal control over financial reporting during the quarter ended December 31, 2019 that materially affected, or are reasonably likely to materially affect, our internal control over financial reporting.
ITEM 9B - OTHER INFORMATION
None.
214
Part III
ITEM 10 - DIRECTORS, EXECUTIVE OFFICERS AND CORPORATE GOVERNANCE
The information required by this Item 10 of
Annual Report on Form 10-K
is incorporated by reference herein to our Proxy Statement for the
2020
Annual Meeting of Stockholders to be filed with the Securities and Exchange Commission within 120 days of the year ended
December 31, 2019
.
ITEM 11 - EXECUTIVE COMPENSATION
The information required by this Item 11 of
Annual Report on Form 10-K
is incorporated by reference herein to our Proxy Statement for the
2020
Annual Meeting of Stockholders to be filed with the Securities and Exchange Commission within 120 days of the year ended
December 31, 2019
.
ITEM 12 - SECURITY OWNERSHIP OF CERTAIN BENEFICIAL OWNERS AND MANAGEMENT AND RELATED STOCKHOLDER MATTERS
The information required by Item 403 of Regulation S-K is incorporated by reference herein to the information set forth under the caption “Security Ownership of Certain Beneficial Owners and Management” in our 2020 Proxy Statement to be filed with the Securities and Exchange Commission within 120 days of the year ended December 31, 2019.
Securities Authorized for Issuance under Equity Compensation Plans
|
Plan Category
|
Number of Securities to Be Issued Upon Exercise of Outstanding Options, Warrants and Rights
|
Weighted Average Exercise Price of Outstanding Options, Warrants and Rights
1
|
Number of Securities Remaining Available for Future Issuance Under Equity Compensation Plans
2
|
|||||||
|
Equity compensation plans approved by stockholders
3
|
28,443,704
|
|
20.96
|
|
20,263,551
|
|
4
|
|||
|
Equity compensation plans not approved by stockholders
|
—
|
|
—
|
|
—
|
|
||||
|
Totals
|
28,443,704
|
|
20,263,551
|
|
||||||
1
The weighted average exercise price does not take into account outstanding restricted stock units (RSUs) since those units vest without any cash consideration or other payment required for such shares.
2
Included in this amount are 3,030,407 shares available for future issuance under the 2018 Employee Stock Purchase Plan ("2018 ESPP").
3
Includes our 2002 Plan, 2012 Plan, 2018 EIP and our 2018 ESPP.
4
The number of shares of Class A common stock available for grant and issuance under the 2018 EIP shall be increased on January 1, of each of 2019 through 2028, by the lesser of (a) four percent (4%) of the number of the Company's Class A common stock, the Company’s Class B common stock and common stock equivalents (including options, RSUs, warrants and preferred stock on an as-converted basis) issued and outstanding on each December 31 immediately prior to the date of increase and (b) such number Class A common shares determined by the Board. On each January 1 of each calendar year, the aggregate
number of shares of Class A common stock reserved for issuance under the 2018 ESPP shall be increased automatically by the number of shares equal to one percent (1%) of the total number of outstanding shares of Class A common stock, Class B common stock of the Company, and common stock equivalents (including options, restricted stock units, warrants and preferred stock on an as converted basis) outstanding on the immediately preceding December 31 (rounded down to the nearest whole share); provided, that the Board or its Compensation Committee may in its sole discretion reduce the amount of the increase in any particular year.
ITEM 13 - CERTAIN RELATIONSHIPS AND RELATED TRANSACTIONS AND DIRECTOR INDEPENDENCE
The information required by this Item 13 of
Annual Report on Form 10-K
is incorporated by reference herein to our Proxy Statement for the
2020
Annual Meeting of Stockholders to be filed with the Securities and Exchange Commission within 120 days of the year ended
December 31, 2019
.
ITEM 14 - PRINCIPAL ACCOUNTANT FEES AND SERVICES
The information required by this Item 14 of
Annual Report on Form 10-K
is incorporated by reference herein to our Proxy Statement for the
2020
Annual Meeting of Stockholders to be filed with the Securities and Exchange Commission within 120 days of the year ended
December 31, 2019
.
215
Part IV
ITEM 15 - EXHIBITS AND FINANCIAL STATEMENTS SCHEDULES
(a) The following documents are filed as part of this report:
1. Financial Statements
See "Index to Consolidated Financial Statements and Supplementary Data" within the Consolidated Financial Statements herein.
2. Financial Statement Schedules
All financial statement schedules have been omitted since the required information was not applicable or was not present in amounts sufficient to require submission of the schedules, or because the information required is included in the consolidated financial statements or the accompanying notes.
3. Exhibits
See the following Index to Exhibits.
Index to Exhibits
The exhibits listed below are filed or incorporated by reference as part of this Annual Report on Form 10-K.
|
Incorporated by Reference
|
||||||
|
Exhibit Number
|
Description
|
Form
|
File No.
|
Exhibit
|
Filing Date
|
|
|
Restated Certificate of Incorporation.
|
10-Q
|
001-38598
|
3.1
|
9/7/2018
|
||
|
Amended and Restated Bylaws, effective August 8, 2019
|
10-Q
|
001-38598
|
3.2
|
8/14/2019
|
||
|
Form of Common Stock Certificate of the Registrant
|
S-1/A
|
333-225571
|
4.1
|
7/9/2018
|
||
|
Indenture by and among the Registrant, certain guarantors party thereto and U.S. Bank National Association, as trustee, dated as of December 15, 2015
|
S-1
|
333-225571
|
4.4
|
6/12/2018
|
||
|
Form of 5% Convertible Senior Secured PIK Note due 2020 (included in Exhibit 4.2)
|
S-1
|
333-225571
|
4.4
|
6/12/2018
|
||
|
Security Agreement by and among the Registrant, certain guarantors party thereto and U.S. Bank National Association, as collateral agent, dated as of December 15, 2015
|
S-1
|
333-225571
|
4.6
|
6/12/2018
|
||
|
Plain English Warrant Agreement by and between Triplepoint Capital LLC, a Delaware limited liability company, and the Registrant, dated December 31, 2010
|
S-1
|
333-225571
|
4.9
|
6/12/2018
|
||
|
Amended and Restated Plain English Warrant Agreement by and between Triplepoint Capital LLC, a Delaware limited liability company, and the Registrant, dated December 15, 2011
|
S-1
|
333-225571
|
4.10
|
6/12/2018
|
||
|
Agreement and Warrant to Purchase Series F Preferred Stock by and between PE12GVVC (US Direct) Ltd. and the Registrant, dated July 1, 2014
|
S-1
|
333-225571
|
4.11
|
6/12/2018
|
||
|
Agreement and Warrant to Purchase Series F Preferred Stock by and between PE12PXVC (US Direct) Ltd. and the Registrant, dated July 1, 2014
|
S-1
|
333-225571
|
4.12
|
6/12/2018
|
||
216
|
Warrant to Purchase Preferred Stock by and between Atel Ventures, Inc., in its capacity as Trustee for its assignee affiliated funds, and the Registrant, dated December 31, 2012
|
S-1
|
333-225571
|
4.13
|
6/12/2018
|
||
|
Agreement and Warrant to Purchase Series G Preferred Stock by and between Keith Daubenspeck and the Registrant, dated June 27, 2014
|
S-1
|
333-225571
|
4.15
|
6/12/2018
|
||
|
Agreement and Warrant to Purchase Series G Preferred Stock by and between Dwight Badger and the Registrant, dated June 27, 2014
|
S-1
|
333-225571
|
4.16
|
6/12/2018
|
||
|
First Supplemental Indenture by and among Registrant, certain guarantor party thereto and U.S. Bank National Association, as trustee, dated as of September 20, 2016
|
S-1
|
333-225571
|
4.19
|
6/12/2018
|
||
|
Indenture by and among the Registrant, certain guarantors party thereto and U.S. Bank National Association, as trustee, dated as of June 29, 2017
|
S-1
|
333-225571
|
4.20
|
6/12/2018
|
||
|
Form of 10% Senior Secured Note due 2024 (included in Exhibit 4.15)
|
S-1
|
333-225571
|
4.20
|
6/12/2018
|
||
|
Security Agreement by and among the Registrant, U.S. Bank National Association, as trustee and U.S. Bank National Association, as collateral agent, dated as of June 29, 2017
|
S-1
|
333-225571
|
4.22
|
6/12/2018
|
||
|
Second Supplemental Indenture, Omnibus Amendment to Notes and Limited Waiver by and among the Registrant, certain guarantors party thereto and U.S. Bank National Association, as trustee, dated as of June 29, 2017
|
S-1
|
333-225571
|
4.24
|
6/12/2018
|
||
|
Third Supplemental Indenture and Omnibus Amendment to Notes by and among the Registrant, certain guarantors party thereto and U.S. Bank National Association, as trustee, dated as of January 18, 2018
|
S-1
|
333-225571
|
4.25
|
6/12/2018
|
||
|
Form of Holder Voting Agreement, between KR Sridhar and certain parties thereto
|
S-1/A
|
333-225571
|
4.26
|
7/9/2018
|
||
|
Amended and Restated Subordinated Secured Convertible Promissory Note by and between the Registrant and Constellation NewEnergy, Inc., dated as of January 18, 2018
|
S-1
|
333-225571
|
4.28
|
6/12/2018
|
||
|
Description of Company's securities registered pursuant to Section 12 of the Securities Exchange Act of 1934, as amended
|
Filed herewith
|
|||||
|
^
|
2002 Equity Incentive Plan and form of agreements used thereunder
|
S-1
|
333-225571
|
10.2
|
6/12/2018
|
|
|
^
|
2012 Equity Incentive Plan and form of agreements used thereunder
|
S-1
|
333-225571
|
10.3
|
6/12/2018
|
|
|
^
|
2018 Equity Incentive Plan and form of agreements used thereunder
|
S-1
|
333-225571
|
10.4
|
7/9/2018
|
|
|
^
|
2018 Employee Stock Purchase Plan and form of agreements used thereunder
|
S-1/A
|
333-225571
|
10.5
|
7/9/2018
|
|
|
Standard Industrial Lease dated April 5, 2005 by and between the Registrant and The Realty Associates Fund III, L.P., as amended as of April 22, 2005, January 12, 2010, April 30, 2015 and December 7, 2015
|
S-1
|
333-225571
|
10.7
|
6/12/2018
|
||
|
Ground Lease by and between 1743 Holdings, LLC and the Registrant dated as of March 2012
|
S-1
|
333-225571
|
10.8
|
6/12/2018
|
||
|
^
|
Offer Letter by and between the Registrant and Randy Furr, dated April 9, 2015
|
S-1
|
333-225571
|
10.10
|
6/12/2018
|
|
217
|
†
|
Guaranty by the Registrant, dated as of March 16, 2012 (PPA II)
|
S-1
|
333-225571
|
10.13
|
6/12/2018
|
|
|
Equity Contribution Agreement by and among the Registrant, Diamond State Generation Partners, LLC, and Deutsche Bank Trust Company Americas, dated as of March 20, 2013 (PPA II)
|
S-1
|
333-225571
|
10.15
|
6/12/2018
|
||
|
†
|
Master Energy Server Purchase Agreement between the Registrant and Diamond State Generation Partners, LLC, dated as of April 13, 2012 (PPA II)
|
S-1
|
333-225571
|
10.17
|
6/12/2018
|
|
|
Omnibus First Amendment to MESPA, MOMA and ASA by and among the Registrant, Diamond State Generation Partners, LLC and Diamond State Generation Holdings, LLC, dated as of March 20, 2013 (PPA II)
|
S-1
|
333-225571
|
10.18
|
6/12/2018
|
||
|
Net Lease Agreement, dated as of April 4, 2018, by and between the Registrant and 237 North First Street Holdings, LLC
|
S-1
|
333-225571
|
10.29
|
6/12/2018
|
||
|
^
|
Consulting Agreement between the Registrant and Colin L. Powell, dated as of January 29, 2009
|
S-1
|
333-225571
|
10.31
|
6/12/2018
|
|
|
^
|
Amendment to Consulting Agreement between the Registrant and Colin L. Powell, dated as of July 31, 2019
|
Filed herewith
|
||||
|
Grant Agreement by and between the Delaware Economic Development Authority and the Registrant, dated March 1, 2012
|
S-1
|
333-225571
|
99.1
|
6/12/2018
|
||
|
^
|
Form of Indemnification Agreement
|
10-Q
|
001-38598
|
10.1
|
9/7/2018
|
|
|
^
|
Form of Offer Letter
|
10-K
|
001-38598
|
10.27
|
3/22/2019
|
|
|
†
|
Preferred Distributor Agreement by and between Registrant and SK Engineering & Construction Co., Ltd dated November 14, 2018
|
10-K
|
001-38598
|
10.28
|
3/22/2019
|
|
|
†
|
Third Amended and Restated Purchase, Use and Maintenance Agreement between Registrant and 2016 ESA Project Company, LLC, dated as of September 26, 2018
|
10-K
|
001-38598
|
10.29
|
3/22/2019
|
|
|
Amendment No.1 to Third Amended and Restated Purchase, Use and Maintenance Agreement by and between Registrant and 2016 ESA Project Company, LLC dated as of September 28, 2018
|
10-K
|
001-38598
|
10.30
|
3/22/2019
|
||
|
Amendment No.2 to Third Amended and Restated Purchase, Use and Maintenance Agreement by and between Registrant and 2016 ESA Project Company, LLC dated as of December 19, 2018
|
10-K
|
001-38598
|
10.31
|
3/22/2019
|
||
|
x
|
Equity Capital Contribution Agreement between the Company, SP Diamond State Class B Holdings, LLC, Diamond State Generation Partners, LLC, and Diamond State Generation Holdings, LLC, dated June 14, 2019
|
10-Q
|
001-38598
|
10.1
|
8/14/2019
|
|
|
x
|
Third Amended and Restated Limited Liability Company Agreement of Diamond State Generation Partners LLC dated June 14, 2019
|
10-Q
|
001-38598
|
10.2
|
8/14/2019
|
|
|
x
|
Fuel Cell System Supply and Installation Agreement between the Company and Diamond State Generation Partners LLC, dated June 14, 2019
|
10-Q
|
001-38598
|
10.3
|
8/14/2019
|
|
|
x
|
Amended and Restated Master Operations and Maintenance Agreement between the Company and Diamond State Generation Partners LLC, dated June 14, 2019
|
10-Q
|
001-38598
|
10.4
|
8/14/2019
|
|
|
x
|
Repurchase Agreement between the Company and Diamond State Generation Partners LLC, dated June 14, 2019
|
10-Q
|
001-38598
|
10.5
|
8/14/2019
|
|
218
|
x
|
Third Amended and Restated Limited Liability Company Agreement of Diamond State Generation Holdings, LLC dated June 14, 2019
|
10-Q
|
001-38598
|
10.6
|
8/14/2019
|
|
|
x
|
Annex 1 (Definitions) to Equity Capital Contribution Agreement (Ex 10.1) and Limited Liability Agreements (Exs. 10.2 and 10.6)
|
10-Q
|
001-38598
|
10.7
|
8/14/2019
|
|
|
x
|
Purchase, Use and Maintenance Agreement between the Company and 2018 ESA Project Company, LLC dated June 28, 2019
|
10-Q
|
001-38598
|
10.8
|
8/14/2019
|
|
|
x
|
Annexes to Purchase, Use and Maintenance Agreement between the Company and 2018 ESA Project Company, LLC dated June 28, 2019
|
10-Q
|
001-38598
|
10.9
|
8/14/2019
|
|
|
^
|
Bloom Energy Corporation 2020 Non-Employee Director Deferred Compensation Plan
|
Filed herewith
|
||||
|
x
|
Fourth Amended and Restated Limited Liability Company Agreement of Diamond State Generation Partners, LLC dated as of December 23, 2019
|
Filed herewith
|
||||
|
x
|
Fuel Cell System Supply and Installation Agreement between Bloom Energy Corporation and Diamond State Generation Partners, LLC dated as of December 23, 2019
|
Filed herewith
|
||||
|
x
|
Second Amended and Restated Administrative Services Agreement by and between Bloom Energy Corporation and Diamond State Generation Partners, LLC dated as of December 23, 2019
|
Filed herewith
|
||||
|
x
|
Equity Capital Contribution Agreement with respect to Diamond State Generation Partners, LLC by and among Bloom Energy Corporation, Diamond State Generation Holdings, LLC, SP Diamond State Class B Holdings LLC, Assured Guaranty Municipal Corp. and Diamond State Generation Partners LLC, dated as of December 23, 2019
|
Filed herewith
|
||||
|
x
|
Second Amended and Restated Master Operations and Maintenance Agreement between Bloom Energy Corporation as Operator and Diamond State Generation Partners, LLC dated as of December 23, 2019
|
Filed herewith
|
||||
|
First Amendment to Repurchase Agreement between the Company and Diamond State Generation Partners LLC, dated June 14, 2019
|
Filed herewith
|
|||||
|
^
|
Offer Letter between the Company and Chris White, dated April 16, 2019
|
Filed herewith
|
||||
|
^
|
Change of Control and Severance Agreement between the Company and Chris White dated April 16, 2019
|
Filed herewith
|
||||
|
^
|
Offer Letter between the Company and Hari Pillai dated December 3, 2018.
|
Filed herewith
|
||||
|
^
|
Change of Control and Severance Agreement between the Company and Hari Pillai dated December 3, 2018.
|
Filed herewith
|
||||
|
List of Subsidiaries
|
Filed herewith
|
|||||
|
Consent of Independent Registered Public Accounting Firm, PricewaterhouseCoopers LLP
|
Filed herewith
|
|||||
|
Certification of Chief Executive Officer pursuant to Rule 13a-14(a) and 15d-14(a) of the Securities and Exchange Act of 1934, as amended, as adopted pursuant to Section 302 of the Sarbanes-Oxley Act of 2002
|
Filed herewith
|
|||||
219
|
Certification of Chief Executive Officer pursuant to Rule 13a-14(a) and 15d-14(a) of the Securities and Exchange Act of 1934, as amended, as adopted pursuant to Section 302 of the Sarbanes-Oxley Act of 2002
|
Filed herewith
|
|||||
|
**
|
Certification of the Chief Executive Officer and Chief Financial Officer pursuant to 18 U.S.C. Section 1350, as adopted pursuant to Section 906 of the Sarbanes-Oxley Act of 2002
|
Filed herewith
|
||||
|
101.INS
|
XBRL Instance Document
|
Filed herewith
|
||||
|
101.SCH
|
XBRL Taxonomy Extension Schema Document
|
Filed herewith
|
||||
|
101.CAL
|
XBRL Taxonomy Extension Calculation Linkbase Document
|
Filed herewith
|
||||
|
101.DEF
|
XBRL Taxonomy Extension Definition Linkbase Document
|
Filed herewith
|
||||
|
101.LAB
|
XBRL Taxonomy Extension Label Linkbase Document
|
Filed herewith
|
||||
|
101.PRE
|
XBRL Taxonomy Extension Presentation Linkbase Document
|
Filed herewith
|
||||
|
^
|
Management contracts or compensation plans or arrangements in which directors or executive officers are eligible to participate.
|
|
**
|
The certifications furnished in Exhibit 32.1 hereto are deemed to accompany this Annual Report on Form 10-K and will not be deemed "filed" for purposes of Section 18 of the Securities Exchange Act of 1934, as amended, or otherwise subject to the liability of that section, nor shall it be deemed incorporated by reference into any filing under the Securities Act of 1933, as amended, or the Securities Exchange Act of 1934, as amended.
|
|
†
|
Confidential treatment requested with respect to portions of this exhibit.
|
|
x
|
Portions of this exhibit are redacted as permitted under Regulation S-K, Rule 601.
|
220
ITEM 16 - FORM 10-K SUMMARY
Not applicable.
SIGNATURES
Pursuant to the requirements of the Securities Exchange Act of 1934, the registrant has duly caused this report to be signed on its behalf by the undersigned thereunto duly authorized.
|
BLOOM ENERGY CORPORATION
|
||||
|
Date:
|
March 31, 2020
|
By:
|
/s/ KR Sridhar
|
|
|
KR Sridhar
|
||||
|
Founder, President, Chief Executive Officer and Director
|
||||
|
(Principal Executive Officer)
|
||||
|
Date:
|
March 31, 2020
|
By:
|
/s/ Randy Furr
|
|
|
Randy Furr
|
||||
|
Executive Vice President and
|
||||
|
Chief Financial Officer
|
||||
|
(Principal Financial and Accounting Officer)
|
||||
POWER OF ATTORNEY
KNOW ALL PERSONS BY THESE PRESENTS, that each person whose signature appears below constitutes and appoints KR Sridhar and Randy Furr, and each of them individually, as his or her attorney-in-fact, each with full power of substitution, for him or her in any and all capacities, to sign any and all amendments to this Annual Report on Form 10-K, and to file the same, with exhibits thereto and all other documents in connection therewith, with the Securities and Exchange Commission, hereby ratifying and confirming all that said attorney-in-fact, or his substitute or substitutes, may do or cause to be done by virtue hereof. Pursuant to the requirements of the Securities Exchange Act of 1934, this report has been signed by the following persons on behalf of the registrant in the capacities and on the dates indicated.
221
|
Date:
|
March 31, 2020
|
/s/ KR Sridhar
|
||
|
KR Sridhar
|
||||
|
Founder, President, Chief Executive Officer and Director
|
||||
|
(Principal Executive Officer)
|
||||
|
Date:
|
March 31, 2020
|
/s/ Randy Furr
|
||
|
Randy Furr
|
||||
|
Executive Vice President and
|
||||
|
Chief Financial Officer
|
||||
|
(Principal Financial and Accounting Officer)
|
||||
|
Date:
|
March 31, 2020
|
/s/ Michael Boskin
|
||
|
Michael Boskin
|
||||
|
Director
|
||||
|
Date:
|
March 31, 2020
|
/s/ Mary K. Bush
|
||
|
Mary K. Bush
|
||||
|
Director
|
||||
|
Date:
|
March 31, 2020
|
/s/ John T. Chambers
|
||
|
John T. Chambers
|
||||
|
Director
|
||||
|
Date:
|
March 31, 2020
|
/s/ L. John Doerr
|
||
|
L. John Doerr
|
||||
|
Director
|
||||
|
Date:
|
March 31, 2020
|
/s/ Jeffrey Immelt
|
||
|
Jeffrey Immelt
|
||||
|
Director
|
||||
|
Date:
|
March 31, 2020
|
/s/ Colin L. Powell
|
||
|
Colin L. Powell
|
||||
|
Director
|
||||
|
Date:
|
March 31, 2020
|
/s/ Scott Sandell
|
||
|
Scott Sandell
|
||||
|
Director
|
||||
|
Date:
|
March 31, 2020
|
/s/ Peter Teti
|
||
|
Peter Teti
|
||||
|
Director
|
||||
|
Date:
|
March 31, 2020
|
/s/ Eddy Zervigon
|
||
|
Eddy Zervigon
|
||||
|
Director
|
||||
222
TABLE OF CONTENTS
Part IItem 1 - BusinessItem 1A - Risk FactorsItem 1B - Unresolved Staff CommentsItem 2 - PropertiesItem 3 - Legal ProceedingsItem 4 - Mine Safety DisclosuresPart IIItem 5 - Market For Registrant's Common Equity, Related Stockholder Matters and Issuer Purchase Of Equity SecuritiesItem 6 - Selected Consolidated Financial DataItem 7 - Management's Discussion and Analysis Of Financial Condition and Results OfNote 13, Power Purchase Agreement ProgramsNote 13, Power Purchase Agreement Programs - Ppa II Upgrade Of Energy ServersNote 13, Power Purchase Agreement Programs - Ppa Iiib Upgrade Of Energy ServersItem 7A - Quantitative and Qualitative Disclosures About Market RiskItem 8 - Financial Statements and Supplementary DataNote 12, Stock-based Compensation and Employee Benefit PlansNote 7, Outstanding Loans and Security AgreementsItem 9 - Changes in and Disagreements with Accountants on Accounting and Financial DisclosureItem 9A - Controls and ProceduresItem 9B - Other InformationPart IIIItem 10 - Directors, Executive Officers and Corporate GovernanceItem 11 - Executive CompensationItem 12 - Security Ownership Of Certain Beneficial Owners and Management and Related Stockholder MattersItem 13 - Certain Relationships and Related Transactions and Director IndependenceItem 14 - Principal Accountant Fees and ServicesPart IVItem 15 - Exhibits and Financial Statements SchedulesItem 16 - Form 10-k Summary