UNITED STATES
SECURITIES AND EXCHANGE COMMISSION
Washington, D.C. 20549
FORM 10-K
ý
ANNUAL REPORT PURSUANT TO SECTION 13 OR 15(d) OF THE SECURITIES EXCHANGE ACT OF 1934
For the fiscal year ended
December 31, 2017
OR
o
TRANSITION REPORT PURSUANT TO SECTION 13 OR 15(d) OF THE SECURITIES EXCHANGE ACT OF 1934
For the transition period from _______ to _______
Commission file number: 000-55039
(Exact name of registrant as specified in its charter)
|
DELAWARE
(State or other jurisdiction of
incorporation or organization)
|
46-2568498
(I.R.S. Employer
Identification No.)
|
|
|
1000 Cedar Hollow Road #102
Malvern, Pennsylvania
(Address of principal executive offices)
|
19355
(Zip Code)
|
|
(610) 729-7000
(Registrant’s telephone number, including area code)
(Former name, former address and former fiscal year, if changed since last report)
Securities registered pursuant to Section 12(b) of the Act:
|
Title of each class
|
Name of each exchange on which registered
|
|
|
Common Stock, $0.001 par value
|
NASDAQ Global Select Market
|
|
Securities registered pursuant to Section 12(g) of the Act:
None
Indicate by check mark if the registrant is a well-known seasoned issuer, as defined in Rule 405 of the Securities Act. Yes
ý
No
o
Indicate by check mark if the registrant is not required to file reports pursuant to Section 13 or Section 15(d) of the Exchange Act. Yes
o
No
ý
Indicate by check mark whether the registrant (1) has filed all reports required to be filed by Section 13 or 15(d) of the Securities Exchange Act of 1934 during the preceding 12 months (or for such shorter period that the registrant was required to file such reports), and (2) has been subject to such filing requirements for the past 90 days. Yes
ý
No
o
Indicate by check mark whether the registrant has submitted electronically and posted on its corporate Web site, if any, every Interactive Data File required to be submitted and posted pursuant to Rule 405 of Regulation S-T (§ 232.405 of this chapter) during the preceding 12 months (or for such shorter period that the registrant was required to submit and post such files). Yes
ý
No
o
Indicate by check mark if disclosure of delinquent filers pursuant to Item 405 of Regulation S-K is not contained herein, and will not be contained, to the best of registrant’s knowledge, in definitive proxy or information statements incorporated by reference in Part III of this Form 10-K or any amendment to this Form 10-K.
ý
Indicate by check mark whether the registrant is a large accelerated filer, an accelerated filer, a non-accelerated filer, or a smaller reporting company. See the definitions of “large accelerated filer,” “accelerated filer,” and “smaller reporting company” in Rule 12b-2 of the Exchange Act. (Check one):
|
Large accelerated filer
ý
|
Accelerated filer
o
|
Non-accelerated filer
o
(Do not check if a
smaller reporting company)
|
Smaller reporting company
o
|
Emerging growth company
o
|
||||
Indicate by check mark whether the registrant is a shell company (as defined in Rule 12b-2 of the Exchange Act). Yes
o
No
ý
If an emerging growth company, indicate by check mark if the registrant has elected not to use the extended transition period for complying with any new or revised financial accounting standards provided pursuant to Section 13(a) of the Exchange Act.
o
The aggregate market value of the registrant’s common stock held by non-affiliates of the registrant was
$931.4 million
based on the closing sale price of the registrant’s common stock as reported by the NASDAQ Global Select Market on
June 30, 2017
, the last business day of the registrant’s most recently completed second fiscal quarter.
As of
February 15, 2018
,
32,531,365
shares of the registrant’s common stock were outstanding.
DOCUMENTS INCORPORATED BY REFERENCE
Portions of the registrant’s definitive proxy statement for its
2018
annual meeting of stockholders, which proxy statement will be filed no later than 120 days after the close of the registrant’s fiscal year ended
December 31, 2017
, are incorporated by reference into Part III of this Annual Report on Form 10-K to the extent stated herein.
BioTelemetry, Inc.
Annual Report on Form 10-K
For The Fiscal Year Ended
December 31, 2017
TABLE OF CONTENTS
|
Page
|
||
|
Item 16.
|
Form 10-K Summary
|
|
2
Unless the context otherwise indicates or requires, the terms “we,” “our,” “us,” “BioTelemetry” and the “Company,” as used in this Annual Report on Form 10-K, refer to BioTelemetry, Inc. and its directly and indirectly owned subsidiaries as a combined entity, except where otherwise stated or where it is clear that the terms mean only BioTelemetry, Inc. exclusive of its subsidiaries. We do not use the ® or ™ symbol in each instance in which one of our registered or common law trademarks appears in this Annual Report on Form 10-K, but this should not be construed as any indication that we will not assert our rights thereto to the fullest extent permissible under applicable law.
CAUTIONARY NOTE REGARDING FORWARD-LOOKING STATEMENTS
This document includes certain forward-looking statements within the meaning of the “Safe Harbor” provisions of the Private Securities Litigation Reform Act of 1995 regarding, among other things, our growth prospects, the prospects for our products and our confidence in our future. These statements may be identified by words such as “expect,” “anticipate,” “estimate,” “intend,” “plan,” “believe,” “promises” and other words and terms of similar meaning. Examples of forward-looking statements include statements we make regarding our ability to increase demand for our products and services, to leverage our Mobile Cardiac Outpatient Telemetry platform to expand into new markets to grow our market share, our expectations regarding revenue trends in our segments and the achievement of cost efficiencies through process improvement and gross margin improvements. Such forward-looking statements are based on current expectations and involve inherent risks and uncertainties, including important factors that could delay, divert or change any of these expectations, and could cause actual outcomes and results to differ materially from current expectations. These factors include, among other things:
|
•
|
our ability to identify acquisition candidates, acquire them on attractive terms and integrate their operations into our business, including our recent acquisition of LifeWatch AG (“LifeWatch”);
|
|
•
|
our ability to educate physicians and continue to obtain prescriptions for our products and services;
|
|
•
|
changes to insurance coverage and reimbursement levels by Medicare and commercial payors for our products and services;
|
|
•
|
our ability to attract and retain talented executive management and sales personnel;
|
|
•
|
the commercialization of new competitive products;
|
|
•
|
our ability to obtain and maintain required regulatory approvals for our products, services and manufacturing facilities;
|
|
•
|
changes in governmental regulations and legislation;
|
|
•
|
our ability to obtain and maintain adequate protection of our intellectual property;
|
|
•
|
acceptance of our new products and services;
|
|
•
|
adverse regulatory action;
|
|
•
|
interruptions or delays in the telecommunications systems that we use;
|
|
•
|
our ability to successfully resolve outstanding legal proceedings; and
|
|
•
|
the other factors that are described in
“Part I; Item 1A. Risk Factors”
of this Annual Report on
Form 10-K
.
|
3
We undertake no obligation to publicly update any forward-looking statement, whether as a result of new information, future events, or otherwise, except as may be required by law.
Overview
BioTelemetry, Inc. provides monitoring services and digital population health management for healthcare providers, medical device manufacturing and centralized core laboratory services for clinical research. Since we became focused on cardiac monitoring in 1999, we have developed a proprietary integrated patient management platform that incorporates a wireless data transmission network, U.S. Food and Drug Administration (“FDA”) cleared algorithms, medical devices and 24-hour monitoring service centers.
In July 2017, we acquired LifeWatch, a supplier of mobile cardiac monitoring solutions, headquartered in Zug, Switzerland with U.S. operations based in Rosemont, IL. We believe the integration of LifeWatch will create one of the most comprehensive connected healthcare platforms in the world, by continuing to develop innovative remote cardiac monitoring solutions and delivering those solutions to meet today’s healthcare challenges. See
“Part II; Item 7. Management’s Discussion and Analysis of Financial Condition and Results of Operations; Recent Developments”
and
“Part II; Item 8. Financial Statements and Supplementary Data; Notes to Consolidated Financial Statements; Note 3. Acquisitions”
below for further discussions related to this transaction.
BioTelemetry operates under three reportable segments: (1) Healthcare, (2) Research and (3) Technology. The Healthcare segment, which generated
81%
of our revenue in
2017
, is focused on the diagnosis and monitoring of cardiac arrhythmias or heart rhythm disorders. We offer cardiologists and electrophysiologists, neurologists and primary care physicians a full spectrum of solutions which provides them with a single source of cardiac monitoring services. These services range from the differentiated mobile cardiac telemetry service (“MCT”), to event, traditional Holter, extended-wear Holter, Pacemaker and International Normalized Ratio (“INR”) monitoring. The Research segment, which generated
14%
of our revenue in
2017
, is engaged in central core laboratory services providing cardiac monitoring, imaging services, scientific consulting and data management services for drug and medical device trials. The Technology segment, which generated
5%
of our revenue in
2017
, focuses on the development, manufacturing, testing and marketing of cardiovascular and blood glucose monitoring devices to medical companies, clinics and hospitals. See
“Part II; Item 8. Financial Statements and Supplementary Data; Notes to Consolidated Financial Statements; Note 17. Segment Information”
below for further discussions related to segments.
As of July 31, 2013, we reorganized to create a holding company structure. CardioNet, Inc., which was previously the public company, became a wholly owned subsidiary of a newly formed entity, BioTelemetry, Inc., a Delaware corporation, and all the outstanding shares of CardioNet, Inc. were exchanged, on a one-for-one basis, for shares of BioTelemetry, Inc. Our new holding company began trading on August 1, 2013 on the NASDAQ Global Select Market under our same symbol “BEAT.”
4
Business Strategy
Our goals are to solidify our position as the leading provider of outpatient cardiac monitoring services, expand our presence in the research market and leverage our monitoring platform in new markets. The key elements of the business strategy by which we intend to achieve these goals include:
|
•
|
Increase Demand for Our Comprehensive Cardiac Monitoring Solutions.
We believe that we can increase demand for our comprehensive portfolio of outpatient cardiac monitoring solutions by educating cardiologists, electrophysiologists and neurologists on the benefits of using mobile cardiac telemetry to meet their arrhythmia monitoring needs, stressing the increased diagnostic yield and their ability to use the clinically significant data to make timely interventions and guide more effective treatments.
|
|
•
|
Expand Our Presence in the Research Market.
In December 2010, we entered the core lab services business through our acquisition of Agility Centralized Research. We later were able to expand our presence in clinical research with our acquisition of Cardiocore Lab, LLC (“Cardiocore”) in August 2012 and our purchase of the assets of RadCore Lab, LLC (“RadCore”) in June 2014. In 2016, we further expanded our core lab capabilities with the acquisition of VirtualScopics, Inc. (“VirtualScopics”), a leading provider of clinical trial imaging solutions. We continue to focus our efforts on increasing our presence in the research market and on becoming a preferred global provider as it provides us with the ability to diversify our service offerings.
|
|
•
|
Leverage Our Core Competencies to New Market Opportunities.
We believe our core competencies can be leveraged for applications in multiple markets. While our initial focus has been on arrhythmia diagnosis and monitoring, we intend to expand into new market areas that require outpatient or ambulatory monitoring and management. In line with this goal, we acquired Telcare, the first company to receive FDA clearance for a cellular-enabled Blood Glucose Monitoring (“BGM”) system, increasing our presence in the large and rapidly growing digital population health management market.
|
Healthcare
The Healthcare segment, or BioTel Heart, operating under the legal entities of CardioNet, LLC (“CardioNet”), LifeWatch and Heartcare Corporation of America, Inc. (“Heartcare”), is focused on the diagnosis and monitoring of cardiac arrhythmias, or heart rhythm disorders. We provide cardiologists, electrophysiologists, neurologists and primary care physicians who prefer to use a single source of cardiac monitoring services with a full spectrum of solutions, ranging from our differentiated MCT services to event to extended wear and Holter monitoring and traditional Holter monitoring. We also provide Pacemaker and INR monitoring.
Our MCT services incorporate a lightweight patient-worn sensor attached to electrodes that capture two-channel electrocardiogram (“ECG”) data, measuring electrical activity of the heart, on a compact wireless handheld monitor. The monitor analyzes incoming heartbeat-by-heartbeat information from the sensor on a real-time basis by applying proprietary algorithms designed to detect arrhythmias. The monitor can detect an arrhythmic event even in the absence of symptoms noticed by the patient. When the monitor detects an arrhythmic event, it automatically transmits the ECG to our monitoring centers. At our monitoring centers, which operate 24/7, experienced certified cardiac monitoring specialists analyze the sent data, respond to urgent events and report results in the manner prescribed by the physician. The MCT devices employ two-way wireless communications, enabling continuous transmission of patient data to the
5
monitoring centers and permitting physicians to remotely adjust monitoring parameters and request previous ECG data from the memory stored in the monitor. The MCT devices have the capability of storing 30 days of continuous ECG data, in contrast to a maximum of 10 minutes for a typical event monitor and a maximum of 24 hours for a typical Holter monitor. In 2016, we obtained FDA approval of our next generation MCT in a patch form factor. The MCT patch is a four-lead, two-channel system which provides the same best in class technology as the current MCT, in a more convenient form factor. The MCT patch was commercially launched in limited accounts during 2017, with a full launch expected in the first quarter of 2018.
Our event monitoring services provide physicians with the flexibility to prescribe wireless event monitors, digital loop event monitors, memory loop event monitors and non-loop event monitors. Event data is transmitted, either through automatic transmission of event data with wireless event monitors or through telephonic transmission of stored event data with our traditional event monitors, to one of our monitoring centers where our trained cardiac technicians analyze the data.
Traditional Holter and extended-wear Holter monitors store an image of the electrical impulses of every heartbeat or irregularity in digital format on a compact memory card. The memory card is mailed or the data is sent electronically through a secure web transfer to one of our Holter labs, where our trained cardiac technicians analyze the data. Our next generation Holter monitor, the CardioKey™ and ePatch™ are small, lightweight cardiac monitors, which can continuously store up to 7-14 days of cardiac images.
We market our services throughout the United States and receive reimbursement for the monitoring provided to patients from Medicare and other third-party commercial payors.
Research
The Research segment, or BioTel Research, operating under the legal entities of Cardiocore and VirtualScopics, is engaged in central core laboratory services that provide cardiac monitoring, imaging services, scientific consulting and data management services for drug, medical treatment and device trials. We entered the research field through the acquisition of Agility Centralized Research in December 2010, and later expanded our presence with the asset acquisition of Cardiocore in August 2012 and RadCore in June 2014. The centralized services include ECG, Holter monitoring, ambulatory blood pressure monitoring, echocardiography, multigated acquisition scan (“MUGA”), a full range of imaging services, protocol development, expert reporting and statistical analysis. Our imaging services offerings were bolstered by our 2016 acquisition of VirtualScopics, a leading provider of clinical trial imaging solutions and services in the cardiovascular, oncology, musculoskeletal and neurologic therapeutic areas. Through these acquisitions, we gained global experience in central core laboratory services, which includes experience in Phase I-IV and Thorough QT Trials. We also provide a full range of support services that include project coordination, setup and management, equipment rental, data transfer, processing, analysis and 24/7 customer support and site training. Our data management systems enable complete customization for sponsors’ preferred data specifications, and our web service, CardioPortal™, provides access to rich data from any web browser, without client-side plug-ins. Our primary customers are pharmaceutical companies and contract research organizations. We operate locations domestically, which support both domestic and international operations.
6
Technology
The Technology segment, operating under the legal entities of Braemar Manufacturing, LLC (“Braemar”), Telcare (“Telcare”) and to a lesser extent, LifeWatch, focuses on the manufacturing, engineering and development of non-invasive cardiac monitors for leading healthcare companies worldwide. We have been able to build successful customer relationships by providing reliable, quality products and engineering services. We offer contract manufacturing services, developing and producing devices to the specific requirements set by customers.
Braemar manufactures various devices including, but not limited to, cardiac event monitors, digital Holter monitors and MCT monitors utilized by our Healthcare segment. Our facilities located in San Diego, CA and Eagan, MN are responsible for research and product development under FDA guidelines. Manufacturing of devices is performed in our Eagan, MN facility. We believe that our manufacturing facilities will be sufficient to meet our manufacturing needs for the foreseeable future.
In addition, in December 2016, we acquired Telcare, the first company to receive FDA clearance for a cellular-enabled BGM system. This wireless BGM system transmits real-time results to a cloud-based analytical engine, which synthesizes the data, monitors trends and provides caregivers with critical information about the patients’ health status and the potential need to intervene.
We believe our manufacturing operations are in compliance with regulations mandated by the applicable governing bodies. We are subject to unannounced inspections by the FDA and we successfully completed routine inspections by the FDA in October 2017 (Eagan, MN), May 2016 (Rosemont, IL) and February 2016 (Concord, MA), with no significant findings noted or warnings issued. Our Eagan, MN, San Diego, CA and Concord, MA facilities are ISO 13485 certified and registered with the FDA. ISO 13485 is a quality system standard used by medical companies providing design, development, manufacturing, installation and servicing, and is the basis for acquiring European Conformity Marking (“CE Marking”) for medical device product distribution in the European Union. Many of our devices also carry a CE Marking.
There are a number of critical components and sub-assemblies in the devices. The vendors for these materials are qualified through stringent evaluation and testing of their performance. We implement a strict no-change policy with our contract manufacturers to ensure that no components are changed without our approval.
Research and Development
For the years ended
December 31, 2017
,
2016
and
2015
, we spent
$11.1 million
,
$8.4 million
and
$7.1 million
, respectively, on research and development activities focused on developing new products and enhancements to our existing products. We intend to continue to develop proof of superiority of our technology through clinical data. The three primary sources of clinical data that we have used to date to illustrate the clinical value of MCT include: (i) a randomized 300-patient clinical study; (ii) our cumulative actual monitoring experience from our databases; and (iii) numerous other published studies.
We sponsored and completed a 17-center, 300-patient randomized clinical trial in March 2007. We believe this study, at that time, represented the largest randomized study comparing two non-invasive arrhythmia monitoring methods. The study was designed to evaluate patients who were suspected to have an arrhythmic cause underlying their symptoms but who were a diagnostic challenge given that they had already had a non-diagnostic 24-hour Holter monitoring session or four hours of telemetry monitoring within 45 days prior to enrollment. Patients were randomized to either MCT or to a loop event monitor
7
for up to 30 days. Of the 300 patients who were randomized, 266 patients who completed a minimum of 25 days of monitoring were analyzed (134 patients using MCT and 132 patients using loop event monitors).
The study specifically compared the success of MCT against loop event monitors in detecting patients with clinically significant arrhythmias and demonstrated the superiority of MCT for confirming the diagnosis of these types of arrhythmias. The study also demonstrated the advantage of using MCT compared to the loop event monitor in the detection of asymptomatic atrial fibrillation or flutter. Diagnosis and treatment of atrial fibrillation is important because it can lead to many other medical problems, including stroke. The study concluded that MCT provided a significantly higher diagnostic yield, in detecting an arrhythmic event in patients with symptoms of cardiac arrhythmia, compared to traditional loop event monitoring, including such monitoring designed to automatically detect certain arrhythmias.
In addition to the aforementioned 300-patient randomized clinical trial, MCT has been cited and referenced in over 40 publications and abstracts, which lends support to its clinical efficacy.
Sales and Marketing
We market our cardiac monitoring solutions through a direct sales force primarily to cardiologists, electrophysiologists and neurologists who are the physician specialists who most commonly diagnose and manage patients with arrhythmias. We sponsor peer-to-peer educational events and participate in targeted public relations opportunities. We are a leading member of the Remote Cardiac Service Provider Group. We market our research services to pharmaceutical companies, medical device companies, contract research organizations and academic research organizations. Cardiocore is a founding member and the first cardiac core lab to join the Cardiac Safety Research Consortium (“CSRC”). Through the CSRC, we are able to network with representatives of major pharmaceutical companies, as well as discuss key cardiac safety issues during the drug development process. Through the 2016 acquisition of VirtualScopics, we have broadened our research service offerings, allowing us to more favorably compete for research studies requiring a wider range of research services. We market our manufactured products to physicians, hospitals and other cardiac monitoring providers.
We attend trade shows and medical conferences to promote our various product and service offerings. The trade shows and conferences we attend are related to organizations such as: the Heart Rhythm Society, American College of Cardiology, Society of Thoracic Surgeons, European Society of Cardiology, American Heart Association and the American Telemedicine Association. We also attend the Medica, DIA and Partnerships in Clinical Trials trade shows as well as the annual Boston Atrial Fibrillation Conference.
Healthcare Reimbursement
In the Healthcare segment, services are billed to government and commercial payors using specific codes describing the services. Those codes are part of the Commercial Procedural Terminology (“CPT”) coding system which was established by the American Medical Association (“AMA”) to describe services provided by physicians and other suppliers. Physicians select the code that best describes the medical services being prescribed. Approximately
34%
of our total revenue is subject to reimbursement from the Medicare program, a federal government health insurance program administered by the Centers for Medicare and Medicaid Services (“CMS”), at rates that are set nationally and adjusted for certain regional indices.
In addition to receiving reimbursement from Medicare, we enter into contracts with commercial payors to receive reimbursement at specified rates for our technical services. Such contracts typically provide for an initial term of between one and three years and provide for automatic renewal thereafter.
8
Either party can typically terminate these contracts by providing between 60 and 120 days’ prior notice to the other party at any time following the end of the initial term of the agreement. The contracts provide for an agreed upon reimbursement rate, which in some instances is tied to the rate of reimbursement we receive from Medicare.
In addition to receiving reimbursement from government and commercial payors, we have direct arrangements with physicians who may purchase our monitoring services and then submit claims for these services directly to commercial and government payors. In some cases, patients pay for their service out-of-pocket.
Competition
Although we believe that we have a leading market share in the mobile cardiac monitoring industry, the market in which our Healthcare segment operates is fragmented and characterized by a large number of smaller regional service providers. Additionally, several larger healthcare companies offer certain cardiac monitoring solutions, primarily Holter monitors. We believe that the principal competitive factors that impact the success of our cardiac monitoring solutions include some or all of the following:
|
•
|
quality of our algorithms used to detect symptoms;
|
|
•
|
quality of clinical data;
|
|
•
|
ease of use and reliability of cardiac monitoring solutions for patients and physicians;
|
|
•
|
technology performance, innovation, flexibility and range of application;
|
|
•
|
timeliness and clinical relevance of new product introductions;
|
|
•
|
quality and availability of customer support services;
|
|
•
|
size, experience, knowledge and training of sales and marketing staff;
|
|
•
|
reputation;
|
|
•
|
relationships with referring physicians, hospitals, managed care organizations and other third-party payors;
|
|
•
|
reporting capabilities;
|
|
•
|
spectrum of solutions, ranging from our differentiated MCT services to event and Holter monitoring, making us a single source for cardiac monitoring services; and
|
|
•
|
perceived value.
|
We believe that we compete favorably based on the factors described above. However, our industry is evolving rapidly and is becoming increasingly competitive, and the basis on which we compete may change over time. In addition, if companies with substantially greater resources than ours enter our market, we will face increased competition.
Our Research segment competes directly with other core labs as well as contract research organizations that offer core lab services. We believe that we compete favorably based on our comprehensive cardiac and imaging service offerings, the scale of our operation and our ability to support the entire life cycle of new drug development.
9
Our Technology segment competes directly with other original equipment manufacturers. We believe that we compete favorably based on our suite of quality products and innovative solutions, our superior customer service and our extensive industry experience.
Intellectual Property
We rely on a combination of intellectual property laws, non-disclosure agreements and other measures to protect our proprietary rights. We attempt to protect our intellectual property rights by filing patent applications for new features and products we develop. In addition, we also seek to maintain certain intellectual property and proprietary know-how as trade secrets, and generally require our partners to execute non-disclosure agreements prior to any substantive discussions or disclosures of our technology or business plans. Our business and competitive positions are dependent in part upon our ability to protect our proprietary technology and our ability to avoid infringing the patents or proprietary rights of others.
We hold patents in the United States as well as many international jurisdictions on our products, processes and related technologies. In furtherance of our overall global intellectual property strategy, we also have patent applications currently on file in the United States and internationally. While we have several patents expiring between 2018 and 2032, including patents that relate, in part, to our key products, we do not believe such expirations will have a material impact on our ability to compete in the short term since our technology is typically covered by several patents, creating a system of protected technology.
Our trademarks, certain of which are material to our business, are registered or otherwise legally protected in the United States and in certain foreign countries and include, among others, the registered trademarks CardioNet®, BioTelemetry® and LifeWatch® and the unregistered trademarks Mobile Cardiac Outpatient Telemetry™, MCOT™, CardioPortal™, BioTel Heart™, BioTel Care™, BioTel Research™ and BioTel Technology™. We also have a significant amount of copyright-protected materials.
Government Regulation
The health care industry is highly regulated, with no guarantee that the regulatory environment in which we operate will not change significantly and adversely in the future. We believe that health care legislation, rules, regulations and interpretations will change, and we expect to modify our agreements and operations in response to these changes.
U.S. Food and Drug Administration.
The medical devices that we use to provide patient monitoring services are regulated by the FDA under the Federal Food, Drug, and Cosmetic Act. The basic regulatory requirements that manufacturers of medical devices distributed in the United Sates must comply with are Premarket Notification 510(k), unless exempt, or Premarket Approval, establishment registration, medical device listing, quality system regulation, labeling requirements and medical device reporting.
The algorithms we use in the MCT service maintain FDA 510(k) clearance as a Class II device (“510(k) Clearance”). On October 28, 2003, the FDA issued a guidance document entitled: “Class II Special Controls Guidance Document: Arrhythmia Detector and Alarm.” In addition to conforming to the general requirements of the Federal Food, Drug, and Cosmetic Act, including the Premarket Notification requirements described above, all of our cardiac related 510(k) submissions address the specific issues covered in this special controls guidance document. The algorithms we use in the BGM service also maintain FDA 510(k) Clearance as a Class II device.
Failure to comply with applicable regulatory requirements can result in enforcement action by the FDA, which may include certain sanctions, such as fines, injunctions and civil penalties; recall or seizure of our devices and intellectual property; operating restrictions; partial suspension or total shutdown of
10
production; withdrawal of 510(k) Clearance of new components or algorithms; withdrawal of 510(k) Clearance already granted to one or more of our existing components or algorithms; and criminal prosecution.
CE Marking.
Medical devices distributed within the European Economic Area require a CE Marking. ISO 13485 is a quality system standard used by medical companies providing design, development, manufacturing, installation and servicing, and is the basis for acquiring CE Marking for medical device product distribution in the European Union. Failure to maintain appropriate CE Marking could have an adverse effect on our ability to sell our devices within the European Union.
Health Care Fraud and Abuse.
In the United States, there are state and federal anti-kickback laws that generally prohibit the payment or receipt of kickbacks, bribes or other remuneration in exchange for the referral of patients or other health care-related business. In addition, federal law (e.g., the “Stark” law) and some state laws prohibit the existence of certain financial relationships between referring physicians and health care providers and suppliers unless those relationships meet the requirements of specific exceptions to the law. Anti-kickback laws constrain our sales, marketing and promotional activities by limiting the kinds of financial arrangements we may have with physicians, medical centers and others in a position to purchase, recommend or refer patients for our cardiac monitoring services or other products or services we may develop and commercialize. Due to the breadth of some of these laws, it is possible that some of our current or future practices might be challenged under one or more of these laws.
Furthermore, federal and state false claims laws prohibit anyone from presenting, or causing to be presented, claims for payment to third-party payors that are false or fraudulent. Violations may result in substantial civil penalties, including treble damages, and criminal penalties, including imprisonment, fines and exclusion from participation in federal health care programs. The Federal False Claims Act also contains “whistleblower” or “qui tam” provisions that allow private individuals to bring actions on behalf of the government alleging that the defendant has defrauded the government. Various states have enacted laws modeled after the Federal False Claims Act, including “qui tam” provisions, and some of these laws apply to claims filed with commercial insurers. Any violations of anti-kickback and false claims laws could have a material adverse effect on our business, financial condition and results of operations.
The Patient Protection and Affordable Care Act.
On March 23, 2010, the Patient Protection and Affordable Care Act was signed into law, and on March 30, 2010, the Health Care and Education Reconciliation Act of 2010 was signed into law. Together, the two measures, collectively known as the Affordable Care Act, make the most sweeping and fundamental changes to the United States health care system since the creation of Medicare and Medicaid. The Affordable Care Act expanded Medicaid eligibility, required most individuals have health insurance or pay a penalty, imposed new requirements for health plans and insurance policy standards, established health insurance exchanges, changed Medicare payment systems to encourage more cost-effective care and new expanded tools to address fraud and abuse and required manufacturers of medical devices and other products reimbursed by Medicare to report annually to the government certain payments to physicians and teaching hospitals.
As a result of the passage of the Affordable Care Act, manufacturers of certain medical devices are subject to an excise tax, applicable to sales of taxable medical devices beginning January 1, 2013. Several devices that are manufactured by our Technology segment are subject to these taxes. The tax equals 2.3% of the sale price of the applicable medical device. As a manufacturer, we are responsible for remitting these taxes to the federal government. The Consolidated Appropriations Act of 2016, enacted on December 18, 2015, included a moratorium on the medical devices tax commencing on January 1, 2016 and ending on
11
December 31, 2017. Budget legislation signed in January 2018 extended that moratorium through December 31, 2019.
Health Insurance Portability and Accountability Act of 1996.
The Health Insurance Portability and Accountability Act (“HIPAA”) was enacted by the United States Congress in 1996. Numerous state and federal laws govern the collection, dissemination, use and confidentiality of patient and other health information, including the administrative simplification and privacy provisions of HIPAA. Historically, state law has governed confidentiality issues, and HIPAA preserves these laws to the extent they are more protective of a patient’s privacy or provide the patient with greater access to his or her health information. As a result of the implementation of the HIPAA regulations, many states are considering revisions to their existing laws and regulations that may or may not be more stringent or burdensome than the federal HIPAA provisions. HIPAA applies directly to covered entities, which include health plans, health care clearinghouses and many health care providers. The HIPAA statute, as amended by the Health Information Technology for Economic and Clinical Health (“HITECH”) Act in 2009, and its implementation rules are concerned primarily with the privacy of protected health information when it is used and/or disclosed; the confidentiality, integrity and availability of electronic health information; notifying federal regulators and impacted patients in the event of a breach of unsecured protected health information; and the content and format of certain identified electronic health care transactions. The laws governing health care information privacy and security impose civil and criminal penalties for their violation and can require substantial expenditures of financial and other resources for information technology system modifications and for ongoing operational compliance.
Medicare.
Medicare is a federal program administered by CMS and its Medicare administrative contractors. The Medicare program provides qualified persons with health care benefits that cover the major costs of medical care within prescribed limits, subject to certain deductibles and co-payments. The Medicare program has established guidelines for local and national coverage determinations and reimbursement of certain equipment, supplies and services, which are subject to change. The methodology for determining coverage status and the basis and amount of Medicare reimbursement varies based upon, among other factors, the setting in which a Medicare beneficiary receives health care items and services.
The Medicare program is subject to statutory and regulatory changes, retroactive and prospective rate adjustments, administrative rulings, interpretations of policy, Medicare administrative contractor determinations and government funding restrictions. All of these policies may materially increase or decrease the rate of program payments to health care facilities and other health care suppliers and practitioners, including those paid for our cardiac monitoring services. Any changes in federal legislation, regulations or other policies affecting Medicare coverage or reimbursement relative to our cardiac monitoring services could have an adverse effect on our performance.
Certain of our facilities are enrolled in Medicare as Independent Diagnostic Testing Facilities (“IDTFs”). An IDTF is defined by CMS as an entity independent of a hospital or physician’s office in which diagnostic tests are performed by licensed or certified non-physician personnel under appropriate physician supervision. Medicare has set very detailed performance standards that every IDTF must meet in order to obtain or maintain its billing privileges, including requirements to, among other things, operate in compliance with all applicable federal and state licensure and regulatory requirements for the health and safety of patients; maintain a physical facility on an appropriate site meeting specific criteria; have a comprehensive liability insurance policy of at least $0.3 million per location; disclose certain ownership information; have its testing equipment calibrated and maintained in accordance with specific standards; have technical staff on duty with the appropriate credentials to perform tests; and permit on-site inspections.
12
These requirements are subject to change. We believe that our facilities are in compliance with the IDTF standards.
Environmental Regulation.
We use materials and products regulated under environmental laws, primarily in the manufacturing and sterilization processes. While it is difficult to quantify, we believe the ongoing cost of compliance with environmental protection laws and regulations will not have a material impact on our business, financial position or results of operations.
Supply Chain Diligence and Transparency
Section 1502 of the Dodd Frank Wall Street Reform and Consumer Protection Act was adopted to further the humanitarian goal of ending the violent conflict and human rights abuses in the Democratic Republic of the Congo and adjoining countries (“DRC”). This conflict has been partially financed by the exploitation and trade of tantalum, tin, tungsten and gold (so called “conflict minerals”) that originate from mines or smelters in the region. United States Securities and Exchange Commission (“SEC”) rules adopted in August 2012 under Section 1502 require reporting companies to disclose annually on Form SD whether any such minerals that are necessary to the functionality or production of products they manufactured, or for which they contracted the manufacture, during the prior calendar year did, in fact, originate in the DRC and, if so, if the related revenue was used to support the conflict and/or abuses.
Some of the products we manufacture may contain tantalum, tin, tungsten and/or gold. Consequently, in compliance with SEC rules, we have adopted a policy on conflict minerals, which can be found on our website, and have implemented a supply chain due diligence and risk mitigation process with reference to the Organization for Economic Cooperation and Development (“OECD”) guidance approved by the SEC to assess and report annually whether our products are “conflict free.”
We support efforts to end the violence and human rights abuses in the mining of certain minerals in the DRC. We expect our suppliers to comply with the OECD guidance and industry standards and to ensure that their supply chain conforms to our policy and the OECD guidance. We will mitigate identified risks by working directly with our suppliers; however, we may need to alter our sources of supply or modify our product design if circumstances require. We may incur certain costs in order to comply with these disclosure requirements, including for due diligence to determine the source of the subject minerals used in our products and other potential changes to products, processes or sources of supply as a consequence of such verification activities. In addition, these rules could adversely affect the sourcing, supply and pricing of materials used in our products throughout the supply chain beyond our control, whether or not the subject minerals are “conflict free.”
Product Liability and Insurance
The design, manufacture and marketing of medical devices and services of the types we produce entail an inherent risk of product liability claims. In addition, we provide information to health care providers and payors upon which determinations affecting medical care are made, and claims may be made against us resulting from adverse medical consequences to patients resulting from the information we provide. To protect ourselves from product liability claims, we maintain professional liability and general liability insurance on a “claims made” basis. Insurance coverage under such policies is contingent upon a policy being in effect when a claim is made, regardless of when the events which caused the claim occurred. While, as of the date of this Annual Report on Form 10-K, a material product liability claim has never been made against us and we believe our insurance policies are adequate in amount and coverage for our current operations, there can be no assurance that the coverage maintained by us is sufficient to cover all future
13
claims. In addition, there can be no assurance that we will be able to obtain such insurance on commercially reasonable terms in the future.
Employees
As of
December 31, 2017
, we employed approximately
1,600
employees. None of our employees are represented by a collective bargaining agreement. We consider our relationship with our employees to be good.
Available Information
We file electronically with the SEC our annual reports on Form 10-K, quarterly reports on Form 10-Q, current reports on Form 8-K and amendments to those reports filed or furnished pursuant to Section 13(a) or 15(d) of the Securities Exchange Act of 1934 (“Exchange Act”). We make these reports available on our website at
www.gobio.com
, free of charge. Copies of these reports are made available as soon as reasonably practicable after we electronically file such material with, or furnish it to, the SEC. Further copies of these reports are located at the SEC’s Public Reference Room at 100 F Street, NE, Washington, D.C. 20549. Information on the operation of the Public Reference Room can be obtained by calling the SEC at 1-800-SEC-0330. The SEC maintains a website that contains reports, proxy and information statements, and other information regarding our filings, at
www.sec.gov
.
The factors discussed below are cautionary statements that identify important factors and risks that could cause actual results to differ materially from those anticipated by the forward-looking statements contained in this Annual Report on Form 10-K. For more information regarding the forward-looking statements contained in this report, see the Table of Contents of this Annual Report on Form 10-K. You should carefully consider the risks and uncertainties described below, together with all of the other information included in this Annual Report on Form 10-K, in considering our business and prospects. The risks and uncertainties described below are not the only ones facing BioTelemetry. Additional risks and uncertainties not presently known to us may also impair our business operations. The occurrence of any of the following risks could affect our business, liquidity, results of operations, financial condition or cash flows.
Our businesses and those of many of our clients have been and continue to be subject to increased legislation and regulatory scrutiny, and we face the risk of changes to this regulatory environment and business in the future.
U.S. income tax reform efforts could have a material impact on our business. On December 22, 2017, the Tax Cuts and Jobs Act (“TCJA”) was signed into law. The TCJA enacts broad changes to the existing U.S. federal income tax code, including reducing the federal corporate income tax rate from 35% to 21% beginning in 2018, amongst many other complex provisions. The ultimate impact of such tax reforms may differ from our current estimates due to changes in interpretations and assumptions made by us as well as the issuance of any further regulations or guidance that may alter the operation of the U.S. federal income tax code. Various uncertainties also exist in terms of how U.S. states and any foreign countries within which we operate will react to these U.S. federal income tax reforms, which could have additional impacts on our business.
14
Reimbursement by Medicare is highly regulated and subject to change and our failure to comply with applicable regulations could decrease our revenue, subject us to penalties or adversely affect our results of operations.
The Medicare program is administered by CMS, which imposes extensive and detailed requirements on medical product and services providers, including, but not limited to, rules that govern how we structure our relationships with physicians, how and when we submit reimbursement claims, how we operate our monitoring centers and how and where we provide our arrhythmia monitoring solutions. Our failure to comply with applicable Medicare rules could result in the discontinuation of our reimbursement under the Medicare payment program, a requirement to return funds already paid to us, civil monetary penalties, criminal penalties and/or exclusion from the Medicare program.
Changes in the reimbursement rate that commercial payors and Medicare will pay for our products and services could adversely affect our revenue.
We receive reimbursement for our products and services from commercial payors and from Medicare administrative contractors with jurisdiction in the state where the services are performed. In addition, our prescribing physicians receive reimbursement for professional interpretation of the information provided by our products and services from commercial payors or Medicare. Average commercial reimbursement rates have declined over a three and five year period. When commercial payors combine their operations, the combined company may elect to reimburse for our products and services at the lowest rate paid by any of the participants in the consolidation. If one of the payors participating in the consolidation does not reimburse for one of our products or services, the combined company may elect not to reimburse for such product or service. Additionally, commercial payors can typically terminate these contracts by providing between 60 and 120 days’ prior notice at any time following the end of the initial term of the agreement. In addition, CMS may reduce the reimbursement rate for our services, as it has in the past. CMS updates the reimbursement rate via the Medicare physician fee schedule annually. Furthermore, CMS has adopted a complex new system for reimbursing Medicare physician services as required by the Medicare Access and CHIP Reauthorization Act of 2015. Under the new program, which began January 1, 2017, physicians will either report under the Merit-based Incentive Payment System or an Advanced Alternative Payment Model, and their 2017 performance will impact 2019 rates. CMS published a final rule on November 16, 2017, modifying program requirements for performance year 2018. The rule designates use of certain patient-generated health data with an active feedback loop as a “high” weighted activity for purposes of the Advancing Care Information bonus. We cannot predict the impact of this new framework on reimbursement for our services. A decrease in Medicare or commercial reimbursement rates or termination of commercial payor contracts would adversely affect our financial results.
The operation of our monitoring centers is subject to rules and regulations governing IDTFs and state licensure requirements; failure to comply with these rules could prevent us from receiving reimbursement from Medicare and some commercial payors.
We have several monitoring centers throughout the United States that analyze the data obtained from cardiac monitors and report the results to physicians. In order for us to receive reimbursement from Medicare and some commercial payors, our monitoring centers must be certified as IDTFs. Certification as an IDTF requires that we follow strict regulations governing how our monitoring centers operate, such as requirements regarding the experience and certifications of the technicians who review data transmitted from our monitors. These rules and regulations vary from location to location and are subject to change. If they change, we may have to change the operating procedures at our monitoring centers, which could increase our costs significantly. If we fail to obtain and maintain IDTF certification, our services may no
15
longer be reimbursed by Medicare and some commercial payors, which could have a material adverse impact on our business.
Our failure to maintain accreditation could impact our DMEPOS operations.
Accreditation is required by most of our managed care payors and became a mandatory requirement for all Medicare durable medical equipment, prosthetics, orthotics and supplies (“DMEPOS”) providers effective October 1, 2009. In 2016, we acquired Telcare, a diabetes care management company. In 2017, Telcare completed a nationwide accreditation renewal process conducted by the Healthcare Quality Association on Accreditation, which renewed our accreditation for another three years. The Company will undergo the next survey cycle in 2020. If we lose accreditation, our failure to maintain accreditation could have an adverse effect on our business, financial condition, results of operations, cash flow, capital resources and liquidity.
Failure to appropriately track and report certain payments to physicians and teaching hospitals may violate certain federal reporting laws and subject us to fines and penalties.
Section 6002 of the Affordable Care Act requires certain medical device manufacturers that produce devices covered by the Medicare and Medicaid programs to report annually to the government certain payments to physicians and teaching hospitals. If we fail to appropriately track and report such payments to the government, we could be subject to civil fines and penalties, which could adversely affect the results of our operations.
Audits or denials of our claims by government agencies and private payors could reduce our revenue and have an adverse effect on our results of operations.
As part of our business operations, we submit claims on behalf of patients directly to, and receive payments from, Medicare, Medicaid and other third-party payors. We are subject to extensive government regulation, including requirements for submitting reimbursement claims under appropriate codes and maintaining certain documentation to support our claims. Medicare contractors and Medicaid agencies periodically conduct pre-and post-payment reviews and other audits of claims and are under increasing pressure to more closely scrutinize health care claims and supporting documentation. We have previously been subject to pre-and post-payment reviews as well as audits of claims under CMS’ Recovery Audit Program and may experience such reviews and audits of claims in the future. Such reviews and similar audits of our claims could result in material delays in payment, as well as material recoupments or denials, which would reduce our net sales and profitability, or result in our exclusion from participation in the Medicare or Medicaid programs. We are also subject to similar review and audits from private payors, which may result in material delays in payment and material recoupments and denials. In addition, state agencies may conduct investigations or submit requests for information relating to claims data submitted to private payors.
We have a concentrated number of payors and losing one of them would reduce our sales and adversely affect our business and operating results.
Medicare, our largest payor, represents a significant percentage of our revenue. For the year ended
December 31, 2017
, Medicare accounted for approximately
34%
of our total revenue. No other payor accounted for more than
4%
of total revenue. Our agreements with commercial payors typically allow either party to the contract to terminate the contract by providing between 60 and 120 days’ prior written notice to the other party at any time following the end of the initial term of the contract. Our commercial payors may elect to terminate or not to renew their contracts with us for any reason and, in some instances,
16
can unilaterally change the reimbursement rates they pay. A commercial payor who terminates or does not renew their contract with us may, or may not, alter their coverage of our services. In the event any of our key commercial payors terminate their agreements with us, elect not to renew or enter into new agreements with us upon expiration of their current agreements, or do not renew or establish new agreements on terms as favorable as are currently contracted, our business, operating results and prospects would be adversely affected.
Violation of federal and state laws regarding privacy and security of patient information may adversely affect our business, financial condition or operations.
The use and disclosure of certain health care information by health care providers and their business associates have come under increased public scrutiny. Federal standards under HIPAA establish rules concerning how individually-identifiable health information may be used, disclosed and protected. Historically, state law had governed confidentiality issues, and HIPAA preserves these laws to the extent they are more protective of a patient’s privacy or provide the patient with more access to his or her health information. Additionally, HITECH and associated changes to HIPAA impose additional requirements relating to the privacy, security and transmission of individually identifiable health information. We must operate our business in a manner that complies with all applicable laws, both federal and state, and that does not jeopardize the ability of our customers to comply with all applicable laws. We believe that our operations are consistent with these legal standards. Nevertheless, these laws and regulations present risks for health care providers and their business associates that provide services to patients in multiple states. As we continue to see how government regulators and courts interpret and enforce HIPAA’s requirements, we may need to adjust our interpretations of these laws and regulations over time. If a challenge to our activities is successful, it could have an adverse effect on our operations, may require us to forego relationships with customers in certain states and may restrict the territory available to us to expand our business. In addition, even if our interpretations of HIPAA and other federal and state laws and regulations are correct, we could be held liable for unauthorized uses or disclosures of patient information as a result of inadequate systems and controls to protect this information or as a result of the theft of information by unauthorized computer programmers who penetrate our network security.
Violation of these laws against us could have a material adverse effect on our business, financial condition and results of operations. For example, in 2011, we experienced the theft of two unencrypted laptop computers and, as a result, were required to provide notices under the HIPAA Breach Notification Rule and were subsequently investigated by the United States Department of Health and Human Services' Office for Civil Rights (“OCR”). Although we have been in compliance with our obligations stemming from these incidents, and believe that our operations are consistent with these legal standards imposed by HIPAA, to avoid the uncertainty of administrative enforcement proceedings or protracted litigation, we elected to settle the investigation by OCR in April 2017 by paying
$2.5 million
and entering into a 3-year corrective action plan. This settlement did not contain any admission of liability by the Company.
The FDA may recommend a different approach to measuring the cardiac impact and safety of drugs as part of the approval process. Such changes could make the systems and processes of our research segment obsolete and adversely affect revenue and profitability.
As part of its approval process, the FDA has provided guidance reinforcing the need for cardiac safety testing of all compounds entering the blood stream. The requirements vary based on the type and history of each compound. This testing is accomplished by different methods, including cardiac imaging such as MUGA and ECG analysis, which involves measuring the QT/QTc interval for prolongation. We function as a core lab and have developed proprietary systems and processes to receive cardiac imaging
17
studies and ECGs for analysis. It is possible that, in the future, the FDA may recommend a different approach for evaluating the cardiac impact and safety of compounds which may diminish the need for a core lab. This would considerably reduce the value of our existing systems and processes and would substantially decrease our revenue and profitability in our Research segment.
In December 2015, the FDA published a report which called into question the need for certain QT studies. In a series of public meetings throughout 2016 discussing the report, FDA speakers indicated that certain studies were no longer mandatory and that future regulations will include some combination of traditional study types along with early phase Exposure Response modeling. Further guidance around the performance of QT studies from the FDA is expected. We cannot assess the impact of this expected guidance at this time, but it may substantially decrease our revenue and profitability in our Research segment.
We are subject to numerous FDA regulations and decisions and it may be costly to comply with these regulations and decisions and to develop compliant products and processes.
The devices that we manufacture are classified as medical devices and are subject to extensive regulation by the FDA. Further, we maintain establishment registration with the FDA as a distributor of medical devices. FDA regulations govern manufacturing, labeling, promotion, distribution, importing, exporting, shipping and sale of these devices. Our devices and our arrhythmia detection algorithms have 510(k) Clearance status from the FDA. Modifications to our devices or our algorithms that could significantly affect safety or effectiveness, or that could constitute a significant change in intended use, would require a new clearance from the FDA. If in the future we make changes to our devices or our algorithms, the FDA could determine that such modifications require new FDA clearance, and we may not be able to obtain such FDA clearances timely, or at all.
We are subject to continuing regulation by the FDA, including quality regulations applicable to the manufacture of our devices and various reporting regulations, as well as regulations that govern the promotion and advertising of medical devices. The FDA could find that we have failed to comply with one of these requirements, which could result in a wide variety of enforcement actions, ranging from a warning letter to one or more severe sanctions. These sanctions could include fines, injunctions and civil penalties; recall or seizure of devices; operating restrictions, partial suspension or total shutdown of production; refusal to grant 510(k) Clearance of new components or algorithms; withdrawing 510(k) Clearance already granted to one or more of our existing components or algorithms; and criminal prosecution. Any of these enforcement actions could be costly and significantly harm our business, financial condition and results of operations.
Our operations and our interactions with our physicians and patients are subject to regulation aimed at preventing health care fraud and abuse and, if we are unable to fully comply with such laws, we could face substantial penalties.
Our operations may be directly or indirectly affected by various broad state and federal health care fraud and abuse laws, including the Federal Healthcare Programs’ Anti-Kickback Statute and the Federal False Claims Act. For some of our services, we directly bill physicians or other health care entities, that, in turn, bill payors. Although we believe such payments and practices are proper and in compliance with laws and regulations, we may be subject to claims asserting that we have violated these laws and regulations. If our past or present operations are found to be in violation of these laws, we or our officers may be subject to civil or criminal penalties, including large monetary penalties, damages, fines, imprisonment and exclusion from Medicare and Medicaid program participation. Furthermore, if we knowingly file, or “cause” the filing of, false claims for reimbursement with government programs such as Medicare and Medicaid, we may be subject to substantial civil penalties, including treble damages. The Federal False
18
Claims Act also contains “whistleblower” or “qui tam” provisions that allow private individuals to bring actions on behalf of the government alleging that the defendant has defrauded the government. In recent years, the number of suits brought in the medical industry by private individuals has increased dramatically. Various states have enacted laws modeled after the Federal False Claims Act, including “qui tam” provisions, and some of these laws apply to claims filed with commercial insurers. Even if we are not found to have violated any of these federal or state anti-fraud or false claims acts, the costs of defending these claims could adversely affect our results of operations.
The medical device industry is the subject of numerous governmental investigations into marketing and other business practices. These investigations could result in the commencement of civil and/or criminal proceedings, substantial fines, penalties, and/or administrative remedies, divert the attention of our management, and have an adverse effect on our financial condition and results of operations.
As mentioned above, we are subject to rigorous regulation by the FDA and numerous other federal, state and foreign governmental authorities. These authorities have been increasing their scrutiny of our industry. We occasionally receive subpoenas or other requests for information from state and federal governmental agencies, including, among others, the United States Department of Justice and the Office of Inspector General of the U.S. Department of Health and Human Services. These investigations typically relate primarily to financial arrangements with health care providers, regulatory compliance and product promotional practices.
We cooperate with these investigations and respond to such requests. However, when an investigation begins, we cannot predict when it will be resolved, the outcome of the investigation or its impact on us. An adverse outcome in one or more of these investigations could include the commencement of civil and/or criminal proceedings, substantial fines, penalties and/or administrative remedies, including exclusion from government reimbursement programs and entry into Corporate Integrity Agreements with governmental agencies. In addition, resolution of any of these matters could involve the imposition of additional and costly compliance obligations. Finally, if these investigations continue over a long period of time, they could divert the attention of management from the day-to-day operations of our business and impose significant administrative burdens, including cost, on us. These potential consequences, as well as any adverse outcome from these investigations or other investigations initiated by the government at any time, could have a material adverse effect on our financial condition and results of operations.
Our business is subject to the risks of international operations.
Compliance with applicable United States and foreign laws and regulations, such as import and export requirements, anti-corruption laws, tax laws, foreign exchange controls and cash repatriation restrictions, data privacy requirements, environmental laws, labor laws and anti-competition regulations, increases the costs of doing business in foreign jurisdictions. Although we have implemented policies and procedures to comply with these laws and regulations, a violation by our employees, contractors or agents could nevertheless occur. In some cases, compliance with the laws and regulations of one country could violate the laws and regulations of another country. Violations of these laws and regulations could materially adversely affect our brand, international growth efforts and business.
We also could be affected by other risks associated with international activities including, but not limited to, economic and labor conditions, increased duties, taxes (including taxes related to our international operations) and other costs and political instability. Margins on sales of our products in foreign countries, and on sales of products that include components obtained from foreign suppliers, could be materially adversely affected by international trade regulations, including duties, tariffs and antidumping penalties. For the year ended
December 31, 2017
, our international operations comprised less than 1% of our total
19
revenue. We are also exposed to credit and collectability risk on our trade receivables with customers in certain international markets. There can be no assurance that we can effectively limit its credit risk and avoid losses.
If we do not obtain and maintain adequate protection for our intellectual property, it may adversely affect the value of our technology and devices and future revenue and operating income.
Our business and competitive positions are in part dependent upon our ability to protect our proprietary technology. To protect our proprietary rights, we rely on a combination of trademark, copyright, patent, trade secret and other intellectual property laws, employment, confidentiality and invention assignment agreements with our employees and contractors, and confidentiality agreements and protective contractual provisions with other third parties. We attempt to protect our intellectual property position by filing trademark applications and United States and international patent applications related to our proprietary technology, inventions and improvements that are important to the development of our business.
We do not believe that any single patent, trademark or other intellectual property right of ours, or combination of our intellectual property rights, is likely to prevent others from competing with us using a similar business model. There are many issued patents and patent applications held by others in our industry and the electronics field. Our competitors may independently develop technologies that are substantially similar or superior to our technologies, or design around our patents or other intellectual property to avoid infringement. In addition, we may not apply for a patent relating to products or processes that are patentable, we may fail to receive any patent for which we apply or have applied, and any patent owned by us or issued to us could be circumvented, challenged, invalidated, or held to be unenforceable or rights granted thereunder may not adequately protect our technology or provide a competitive advantage to us. If a third-party challenges the validity of any patents or proprietary rights of ours, we may become involved in intellectual property disputes and litigation that would be costly and time-consuming. All of our patents will eventually expire. Some of our patents, including patents protecting significant elements of our technology, will expire between 2018 and 2032, at which point we can no longer enforce these against third parties to prevent them from making, using, selling, offering to sell or importing our current clinical device. While we have several patents expiring between 2018 and 2032, including patents that relate, in part, to our key products, our technology is typically covered by several patents, creating a system of protected technology. The expiration of our patents could expose us to more competition and have an adverse impact on our business.
Although third parties may infringe on our patents and other intellectual property rights, we may not be aware of any such infringement, or we may be aware of potential infringement but elect not to seek to prevent such infringement or pursue any claim of infringement, and the third-party may continue its potentially infringing activities. Any decision whether or not to take further action in response to potential infringement of our patent or other intellectual property rights may be based on a variety of factors, such as the potential costs and benefits of taking such action, and business and legal issues and circumstances. Litigation of claims of infringement of a patent or other intellectual property rights may be costly and time-consuming, may divert the attention of key management personnel and may not be successful or result in any significant recovery of compensation for any infringement or enjoining of any infringing activity. Litigation or licensing discussions may also involve or lead to counterclaims that could be brought by a potential infringer to challenge the validity or enforceability of our patents and other intellectual property.
To protect our trade secrets and other proprietary information, we generally require our employees, consultants, contractors and outside collaborators to enter into written non-disclosure agreements. These agreements, however, may not provide adequate protection to prevent any unauthorized use, misappropriation or disclosure of our trade secrets, know-how or other proprietary information. These
20
agreements may be breached, and we may not become aware of, or have adequate remedies in the event of, any such breach. Also, others may independently develop the same or substantially equivalent proprietary information and techniques or otherwise gain access to our trade secrets.
Our ability to innovate or market our products may be impaired by the intellectual property rights of third parties.
Our success is dependent, in part, upon our ability to avoid infringing the patents or proprietary rights of others. The cardiac monitoring industry is characterized by a large number of patents and patent filings. Competitors may have filed applications for, or have been issued, patents and may obtain additional patents and proprietary rights related to devices, services or processes that we use to compete. We may not be aware of all of the patents or patent applications potentially adverse to our interests that may have been filed or issued to others.
United States patent applications may be kept confidential while pending in the Patent and Trademark Office. If other companies have or obtain patents relating to our products or services, we may be required to obtain licenses to those patents or to develop or obtain alternative technology. We may not be able to obtain any such licenses on acceptable terms, or at all. Any failure to obtain such licenses could impair or foreclose our ability to make, use, market or sell our products and services.
Based on the fact that we may pose a competitive threat to some companies who own or control various patents, it is possible that one or more third parties may assert a patent infringement claim seeking damages and to enjoin the manufacture, use, sale and marketing of our products and services. If a third-party asserts that we have infringed on its patent or proprietary rights, we may become involved in intellectual property disputes and litigation that would be costly and time-consuming and could impair or foreclose our ability to make, use, market or sell our products and services. Lawsuits may have already been filed against us without our knowledge. Additionally, we may receive notices from other third parties suggesting or asserting that we are infringing their patents and inviting us to license such patents. We do not believe that we are infringing on any other party’s patents or that a license to any such patents is necessary. Should litigation over such patents arise, we intend to vigorously defend against any allegation of infringement.
If we are found to infringe on the patents or intellectual property rights of others, we may be required to pay damages, stop the infringing activity or obtain licenses or rights to the patents or other intellectual property in order to use, manufacture, market or sell our products and services. Any required license may not be available to us on acceptable terms, or at all. If we succeed in obtaining such licenses, payments under such licenses would reduce any earnings from our products. In addition, licenses may be non-exclusive and, accordingly, our competitors may have access to the same technology as that which may be licensed to us. If we fail to obtain a required license or are unable to alter the design of our product candidates to make a license unnecessary, we may be unable to manufacture, use, market or sell our products and services, which could significantly affect our ability to achieve, sustain or grow our commercial business.
If we are unable to successfully integrate acquired companies and technology, we may not realize the benefits anticipated and our future growth may be adversely affected.
We have grown through acquisitions of companies and technology, including our acquisitions of the assets of the ePatch Division of DELTA in April 2016, VirtualScopics in May 2016, Telcare in December 2016 and LifeWatch in July 2017. Acquisitions involve risks associated with our assumption of the liabilities of an acquired company, which may be liabilities that we were or are unaware of at the time of the acquisition, potential write-offs of acquired assets and potential loss of the acquired company’s key employees or customers. Physician, patient and customer satisfaction or performance problems with an acquired business,
21
technology, service or device could also have a material adverse effect on our reputation. Additionally, potential disputes with the seller of an acquired business or its employees, suppliers or customers could adversely affect our business, operating results and financial condition. If we fail to properly evaluate and execute acquisitions, our business may be disrupted and our operating results and prospects may be harmed.
Furthermore, integrating acquired companies or new technologies into our business may prove more difficult than we anticipate. We may encounter difficulties in successfully integrating our operations, technologies, services and personnel with that of the acquired company, and our financial and management resources may be diverted from our existing operations. Offices in multiple states create a strain on our ability to effectively manage our operations and key personnel. If we elect to consolidate our facilities, we may lose key personnel unwilling to relocate to the consolidated facility, may have difficulty hiring appropriate personnel at the consolidated facility and may have difficulty providing continuity of service through the consolidation.
The success of our business is partially dependent on our ability to raise capital, and failure to raise the necessary capital may adversely affect our results of operations, financial condition and stock price.
We believe that our existing cash and cash equivalents, together with our term loan and revolving credit facility pursuant to our Credit Agreement with SunTrust Bank and Lenders named therein, will be sufficient to meet our anticipated cash requirements for the foreseeable future. However, our future funding requirements will depend on many factors, including:
|
•
|
the results of our operations;
|
|
•
|
the reimbursement rates associated with our products and services;
|
|
•
|
our ability to secure contracts with additional commercial payors providing for the reimbursement of our services;
|
|
•
|
the costs associated with manufacturing and building our inventory of our current and future generation monitors;
|
|
•
|
the costs of hiring additional personnel and investing in infrastructure to support future growth;
|
|
•
|
the costs of undertaking future strategic initiatives, such as acquisitions or joint ventures;
|
|
•
|
the emergence of competing technologies and products and other adverse market developments;
|
|
•
|
the costs of preparing, filing, prosecuting, maintaining and enforcing patent claims and other intellectual property rights or defending against claims of infringement by others; and
|
|
•
|
actions taken by the FDA, CMS and other regulatory authorities affecting cardiac monitoring devices and competitive products.
|
If we decide to raise additional capital in the future, such capital may not be available on reasonable terms, or at all. If we raise additional funds by issuing equity securities, dilution to existing stockholders would result. If we raise additional funds by incurring debt financing, the terms of the debt may involve significant cash payment obligations as well as covenants and financial ratios that may restrict our ability to operate our business.
22
We have outstanding debt, and may incur other debt in the future, which could adversely affect our financial condition, liquidity and results of operations.
As of
December 31, 2017
, we had outstanding term loan pursuant to our Credit Agreement with SunTrust Bank and Lenders named therein of
$199.4 million
, net of
$5.6 million
of deferred financing costs. We may borrow additional amounts in the future and use the proceeds from any future borrowing for general corporate purposes, future acquisitions or expansion of our business.
Our incurrence of this debt, and any increases in our levels of debt, may adversely affect our operating results and financial condition by, among other things:
|
•
|
requiring a portion of our cash flow from operations to make payments on this debt; or
|
|
•
|
limiting our flexibility in planning for, or reacting to, changes in our business and the industry.
|
Our current credit facility imposes restrictions on us, including restrictions on our ability to create liens on our assets, incur additional indebtedness, make acquisitions or dispose of assets, and also requires us to maintain compliance with specified financial ratios. Our ability to comply with these ratios may be affected by events beyond our control. If we breach any of the covenants and do not obtain a waiver from our lender, then, subject to applicable cure periods, our outstanding indebtedness could be declared immediately due and payable.
Our business depends on our ability to attract and retain talented employees.
Our business is based on successfully attracting and retaining talented employees, including our executive team. The market for highly-skilled workers and leaders in our industry is extremely competitive. If we are less successful in our recruiting efforts, or if we are unable to retain key employees, our ability to develop and deliver successful products and services may be adversely affected.
Our cardiac monitoring and INR testing businesses are dependent upon physicians prescribing our services and failure to obtain those prescriptions may adversely affect our revenue.
The success of our cardiac monitoring and INR testing businesses are dependent upon physicians prescribing our services. Our success in obtaining prescriptions will be directly influenced by a number of factors, including:
|
•
|
the ability of the physicians with whom we work to obtain sufficient reimbursement and be paid in a timely manner for the professional services they provide in connection with the use of our cardiac monitoring solutions;
|
|
•
|
our ability to continue to establish ourselves as a comprehensive cardiac monitoring and INR services provider;
|
|
•
|
our ability to educate physicians regarding the benefits of our services over alternative diagnostic monitoring solutions; and
|
|
•
|
the clinical efficacy of our devices.
|
If we are unable to educate physicians regarding the benefits of our products and obtain sufficient prescriptions for our services, revenue from the provision of our cardiac monitoring and INR solutions could potentially decrease.
23
We may experience difficulty in obtaining reimbursement for our services from commercial payors that consider our technology to be experimental and investigational, which would adversely affect our revenue and operating results.
Many commercial payors refuse to enter into contracts to reimburse the fees associated with medical devices or services that such payors determine to be “experimental and investigational.” Commercial payors typically label medical devices or services as “experimental and investigational” until such devices or services have demonstrated product superiority evidenced by a randomized clinical trial. We completed a clinical trial in March 2007 that showed that MCT provided higher diagnostic yield than traditional loop event monitoring. Prior to our clinical trial, MCT was labeled “experimental and investigational” by numerous commercial payors. Since the trial was published in March 2007, we have obtained contracts with most of these commercial payors that previously labeled MCT as “experimental and investigational.” We have not obtained contracts with certain remaining commercial payors however, and these payors have informed us that they do not believe the data from this trial justifies the removal of the experimental designation. As a result, these commercial payors may refuse to reimburse the technical and professional fees associated with MCT.
If commercial payors decide not to reimburse our products or services or the related services provided by physicians, or the rates of such reimbursement change, or if we fail to properly administer claims, our revenue could be adversely affected.
We have a concentration of risk related to the accounts receivable from Medicare and failure to fully collect outstanding balances from this customer, or a combination of other customers, may adversely affect our results of operations.
As of
December 31, 2017
, we have balances owed to us from one customer, Medicare, representing approximately
21%
of our total gross accounts receivable. We maintain an allowance for doubtful accounts based on the collections history and aging of outstanding receivables, as well as for any specific instances we become aware of that may preclude us from reasonably assuring collection on outstanding balances. Determining the allowance for doubtful accounts is judgmental in nature and often involves the use of significant estimates. A determination that requires a change in our estimates could have a materially adverse effect on our financial condition and operating results.
If we do not have enough equipment or experience delays in manufacturing, we may be unable to fill prescriptions for cardiac and diabetic monitoring in a timely manner, physicians may elect not to prescribe our services, and our revenue and growth prospects may be adversely affected.
When a physician prescribes cardiac monitoring to a patient, our customer service department begins the patient set-up process. While our goal is to provide each patient with the appropriate device in a timely manner, we have experienced, and may in the future experience, delays due to the availability of devices, primarily when converting to a new generation of device or in connection with the increase in prescriptions following potential acquisitions of other companies.
We may also experience shortages of devices due to manufacturing difficulties. Multiple suppliers provide the components used in our devices, but our Minnesota and Massachusetts facilities are registered and approved by the FDA as the manufacturer of record of our devices. Our manufacturing operations could be disrupted by fire, earthquake or other natural disaster, a labor-related disruption, failure in supply or other logistical channels, electrical outages or other reasons. If there were a disruption to our facilities in Minnesota or Massachusetts, we would be unable to manufacture devices until we have restored and re-qualified our manufacturing capability or developed alternative manufacturing facilities.
24
Our success in obtaining future cardiac monitor prescriptions from physicians is dependent upon our ability to promptly deliver devices to our patients, and a failure in this regard would have an adverse effect on our revenue and growth prospects.
Interruptions or delays in telecommunications systems could impair the delivery of our MCT, BGM and wireless event services.
The success of our MCT, BGM and wireless event services is dependent upon our ability to transmit and process data. Our MCT, BGM and wireless event devices rely on third-party wireless carriers to transmit data over their data networks. We are dependent upon these third-party wireless carriers to provide data transmission services to us through our various agreements. If we fail to maintain these relationships, or if we lose wireless carrier services, we would be forced to seek alternative providers of data transmission services, which might not be available on commercially reasonable terms, or at all.
As we expand our commercial activities, an increased burden will be placed upon our data processing systems and the equipment upon which they rely. Interruptions of our data networks, or the data networks of our wireless carriers for any extended length of time, loss of stored data or other computer problems could have a material adverse effect on our business and operating results. Frequent or persistent interruptions in our cardiac monitoring services could cause permanent harm to our reputation and could cause current or potential users of our remote monitoring services or prescribing physicians to believe that our systems are unreliable, leading them to switch to our competitors. Such interruptions could result in liability claims and litigation against us for damages or injuries resulting from the disruption in service.
Our business may be impacted by political events, war, terrorism, public health issues, natural disasters and other business interruptions.
War, terrorism, geopolitical uncertainties, public health issues and other business interruptions have caused and could cause damage or disruption to commerce and the economy, and thus could have a material adverse effect on us, our suppliers, logistics providers and customers. Our business operations are subject to interruption by, among others, natural disasters, whether as a result of climate change or otherwise, fire, power shortages, nuclear power plant accidents and other industrial accidents, terrorist attacks and other hostile acts, labor disputes, public health issues and other events beyond our control. Such events could decrease demand for our products, make it difficult or impossible for us to make and deliver products to our customers or to receive components from its suppliers, and create delays and inefficiencies in our supply chain. Our potential customers and monitoring centers could be impacted by natural disasters such as hurricanes, tornados and earthquakes. In the event of a natural disaster, we could incur significant losses, require substantial recovery time and experience significant expenditures in order to resume operations.
New products and technological advances by our competitors may negatively affect our market share, commercial opportunities and results of operations.
The market for cardiac monitoring solutions is evolving rapidly and becoming increasingly competitive. Our industry is highly fragmented and characterized by a small number of large providers and a large number of smaller regional service providers. These third parties compete with us in marketing to payors and prescribing physicians, recruiting and retaining qualified personnel, acquiring technology and developing solutions complementary to our programs. In addition, as companies with substantially greater resources than ours enter our market, we will face increased competition. If our competitors are better able to develop and patent cardiac monitoring solutions than us, or develop more effective or less expensive cardiac monitoring solutions that render our solutions obsolete or non-competitive, or deploy
25
larger or more effective marketing and sales resources than ours, our business would be harmed and our commercial opportunities would be reduced or eliminated.
We operate in an intensely competitive industry, and our failure to respond quickly to technological developments and incorporate new features into our products could harm our ability to compete.
We operate in an intensely competitive industry that experiences rapid technological developments, changes in industry standards, changes in patient requirements and frequent new product introductions and improvements. If we are unable to respond quickly and successfully to these developments, we may lose our competitive position, and our products or technologies may become uncompetitive or obsolete. To compete successfully, we must maintain a successful research and development effort, develop new products and production processes and improve our existing products and processes at the same pace or ahead of our competitors. Our research and development efforts are aimed at solving increasingly complex problems, as well as creating new technologies, and we do not expect that all of our projects will be successful. If our research and development efforts are unsuccessful, our future results of operations could be materially affected.
We are increasingly dependent on sophisticated information technology systems to operate our business, and if we fail to properly maintain the integrity of our data or if our products do not operate as intended or we experience a cyber-attack or other breach of these systems, our business could be materially affected.
We are increasingly dependent on sophisticated information technology for our products and infrastructure. We rely on information technology systems to process, transmit and store electronic information in our day-to-day operations. The size and complexity of our information technology systems makes them vulnerable to increasingly sophisticated cyber-attacks, malicious intrusion, breakdown, destruction, loss of data privacy or other significant disruption. Our information systems require an ongoing commitment of significant resources to maintain, protect and enhance existing systems and develop new systems to keep pace with continuing changes in information processing technology, evolving systems and regulatory standards, the increasing need to protect patient and customer information and changing customer patterns. As a result of technology initiatives, recently enacted regulations, changes in our system platforms and integration of new business acquisitions, we have been consolidating and integrating the number of systems we operate and have upgraded and expanded our information systems capabilities.
In addition, third parties may attempt to hack into our products or systems and may obtain data relating to patients with our products or our proprietary information. If we fail to maintain or protect our information systems and data integrity effectively, we could lose existing customers, have difficulty attracting new customers, have problems in determining product cost estimates and establishing appropriate pricing, have difficulty preventing, detecting and controlling fraud, have disputes with customers, physicians and other health care professionals, have regulatory sanctions or penalties imposed, have increases in operating expenses, incur expenses or lose revenue as a result of a data privacy breach or suffer other adverse consequences. There can be no assurance that our process of consolidating the number of systems we operate, upgrading and expanding our information systems capabilities, protecting and enhancing our systems and developing new systems to keep pace with continuing changes in information processing technology will be successful or that additional systems issues will not arise in the future. Any significant breakdown, intrusion, interruption, corruption or destruction of these systems, as well as any data breaches, could have a material adverse effect on our business.
26
Changes in the health care industry or tort reform could reduce the number of cardiac monitoring solutions ordered by physicians, which could result in a decline in the demand for our solutions, pricing pressure and decreased revenue.
Changes in the health care industry directed at controlling health care costs or perceived over-utilization of cardiac monitoring solutions could reduce the volume of services ordered by physicians. If more health care cost controls are broadly instituted throughout the health care industry, the volume of cardiac monitoring solutions could decrease, resulting in pricing pressure and declining demand for our services, which could harm our operating results. In addition, it has been suggested that some physicians order cardiac monitoring solutions, even when the services may have limited clinical utility, primarily to establish a record for defense in the event of a claim of medical malpractice against the physician. Legal changes increasing the difficulty of initiating medical malpractice cases, known as tort reform, could reduce the number of our services prescribed as physicians respond to reduced risks of litigation, which could harm our operating results.
Legislation and policy changes reforming the United States health care system may have a material adverse effect on our operating results and financial condition.
The Affordable Care Act makes the most sweeping and fundamental changes to the United States health care system since the creation of Medicare and Medicaid. The Affordable Care Act includes a large number of health-related provisions expanding Medicaid eligibility, requiring most individuals to have health insurance, establishing new regulations on health plans, establishing health insurance exchanges, requiring manufacturers to report payments or other transfers of value made to physicians and teaching hospitals and modifying certain payment systems to encourage more cost-effective care.
Several provisions of the Affordable Care Act specifically affect the medical equipment industry. In addition to changes in Medicare DMEPOS reimbursement and an expansion of the DMEPOS competitive bidding program, the Affordable Care Act provides that for sales on or after January 1, 2013, manufacturers, producers and importers of taxable medical devices must pay an annual excise tax of 2.3% of the price for which the devices are sold. Subsequent legislation, the Consolidated Appropriations Act of 2016, includes a two-year moratorium on the medical device excise tax commencing on January 1, 2016 and ending on December 31, 2017. Budget legislation signed in January 2018 extended that moratorium through December 31, 2019.
The Affordable Care Act also establishes enhanced Medicare and Medicaid program integrity provisions, including expanded documentation requirements for Medicare DMEPOS orders, more stringent procedures for screening Medicare and Medicaid DMEPOS suppliers, and new disclosure requirements regarding manufacturer payments to physicians and teaching hospitals, along with broader expansion of federal fraud and abuse authorities. Subsequent legislation made additional changes to the DMEPOS reimbursement policy. For instance, the Consolidated Appropriations Act of 2016 caps Medicaid durable medical equipment reimbursement rates at Medicare fee-for-service rates applicable in the state, including applicable competitive bidding rates, beginning January 1, 2019, and the 21st Century Cures Act moved up implementation of this provision to January 1, 2018. There can be no assurances that future legislation will not adversely impact reimbursement for our products and services.
In addition, various health care reform proposals have also emerged at the state level. We cannot predict the full effect that these laws or any future legislation or regulation will have on us. However, the implementation of new legislation and regulation may lower reimbursements for our products, reduce medical prescriptions for our services and adversely affect our business.
27
If we or our suppliers fail to achieve or maintain regulatory approval of manufacturing facilities, our growth could be limited and our business could be adversely affected.
We currently assemble and manufacture our cardiac monitoring and BGM devices. We purchase INR monitoring devices from third parties. In order to maintain compliance with FDA and other regulatory requirements, our manufacturing facilities must be periodically reevaluated and qualified under a quality system to ensure they meet production and quality standards. Suppliers of components and products used to manufacture MCT, BGM, event, and Holter devices and the manufacturers of the monitors used in INR services must also comply with FDA regulatory requirements, which often require significant resources and subject us and our suppliers to potential regulatory inspections and stoppages. If we or our suppliers do not maintain regulatory approval for our manufacturing operations, our business could be adversely affected.
If we fail to meet Medicare accreditation and surety bond requirements or DMEPOS supplier standards, it could negatively affect our business operations.
Medicare DMEPOS suppliers (other than certain exempted professionals) must be accredited by an approved accreditation organization as meeting DMEPOS quality standards adopted by CMS. Medicare suppliers also are required to meet surety bond requirements. In addition, Medicare DMEPOS suppliers must comply with Medicare supplier standards in order to obtain and retain billing privileges, including meeting all applicable federal and state licensure and regulatory requirements. Furthermore, many of our managed care contracts for the provision of diabetes services require that we qualify as an accredited DMEPOS supplier. CMS periodically expands or otherwise clarifies the Medicare DMEPOS supplier standards. We believe we are in compliance with these requirements. If we fail to maintain our Medicare accreditation status and/or do not comply with Medicare surety bond or supplier standard requirements in the future, or if these requirements are changed or expanded, it could adversely affect our profits and results of operations.
Our dependence on a limited number of suppliers may prevent us from delivering our devices on a timely basis.
We currently rely on a limited number of suppliers of components for the devices that we manufacture. If these suppliers became unable to provide components in the volumes needed or at an acceptable price, we would have to identify and qualify acceptable replacements from alternative sources of supply. The process of qualifying suppliers is lengthy. Delays or interruptions in the supply of our required components could limit or stop our ability to provide sufficient quantities of devices on a timely basis and meet demand for our services, which could have a material adverse effect on our business, financial condition and results of operations.
We could be subject to medical liability or product liability claims, which may not be covered by insurance and which would adversely affect our business and results of operations.
The design, manufacture and marketing of services of the types we provide entail an inherent risk of product liability claims. Any such claims against us may require us to incur significant defense costs, irrespective of whether such claims have merit. In addition, we provide information to health care providers and payors upon which determinations affecting medical care are made, and claims may be made against us resulting from adverse medical consequences to patients resulting from the information we provide. In addition, we may become subject to liability in the event that the devices we use fail to correctly record or transfer patient information or if we provide incorrect information to patients or health care providers using our services.
28
Our liability insurance is subject to deductibles and coverage limitations. In addition, our current insurance may not continue to be available to us on acceptable terms, if at all, and, if available, the coverage may not be adequate to protect us against any future claims. If we are unable to obtain insurance at an acceptable cost or on acceptable terms with adequate coverage or otherwise protect against any claims against us, we would be exposed to significant liabilities, which may adversely affect our business and results of operations.
Regulations related to conflict minerals may adversely impact our business.
The Dodd Frank Wall Street Reform and Consumer Protection Act contains provisions to improve transparency and accountability concerning the supply of certain minerals, known as conflict minerals, originating from the DRC. Due to the materials used in certain of the products manufactured by our subsidiaries, we must comply with annual disclosure and reporting rules adopted by the SEC by assessing whether the subject minerals contained in our products originated in the DRC. Our supply chain is complex since we do not source our minerals directly from the original mine or smelter. Consequently, we incur costs in complying with these disclosure requirements, including for due diligence to determine the source of the subject minerals used in our products and other potential changes to products, processes or sources of supply as a consequence of such verification activities. The rules may adversely affect the sourcing, supply and pricing of materials used in our products throughout the supply chain beyond our control, whether or not the subject minerals are “conflict free.” Also, we may face reputational challenges if we determine that certain of our products contain minerals not determined to be conflict free or if we are unable to sufficiently verify the origins for all subject minerals used in our products through our diligence process.
We are reliant on the outsourcing of clinical research by pharmaceutical, clinical research and biotechnology companies.
We are reliant on the ability and willingness of pharmaceutical, clinical research and biotechnology companies to continue to outsource the types of research services that we provide. As such, we are impacted and subject to risks, uncertainties and trends that affect companies in these industries. Any downturn in these industries or reduction in spending or outsourcing could adversely affect our business.
Future sales of our common stock may depress our stock price.
Future issuance in connection with acquisitions and sales of a substantial number of shares of our common stock in the public market could occur at any time. These sales, or the perception in the market that the holders of a large number of shares intend to sell shares, could reduce the market price of our common stock. As of
December 31, 2017
, we had
32,460,668
outstanding shares of common stock. In addition, we had
3,574,439
stock options and
467,129
restricted stock units (“RSUs”) outstanding to purchase shares of our common stock that will become exercisable over the next four years or vest over the next three years. Further, we had
150,000
performance stock options that are exercisable. If exercised, vested or earned, additional shares would become available for sale.
Anti-takeover provisions in our charter documents and Delaware law might deter acquisition bids for us that our stockholders might consider favorable.
Our amended and restated certificate of incorporation and bylaws contain provisions that may make the acquisition of our Company more difficult without the approval of our Board of Directors. These provisions:
|
•
|
establish a classified Board of Directors so that not all members of the board are elected at one time;
|
29
|
•
|
authorize the issuance of undesignated preferred stock, the terms of which may be established and shares of which may be issued without stockholder approval, and which may include rights superior to the rights of the holders of common stock;
|
|
•
|
prohibit stockholder action by written consent, which requires all stockholder actions to be taken at a meeting of our stockholders;
|
|
•
|
provide that the Board of Directors is expressly authorized to make, alter or repeal our bylaws; and
|
|
•
|
establish advance notice requirements for nominations for elections to our Board of Directors or for proposing matters that can be acted upon by stockholders at stockholder meetings.
|
In addition, because we are incorporated in Delaware, we are subject to Section 203 of the Delaware General Corporation Law which, subject to certain exceptions, prohibits stockholders owning in excess of 15% of our outstanding voting stock from merging or combining with us. These anti-takeover provisions and other provisions under Delaware law could discourage, delay or prevent a transaction involving a change of control of our Company, even if doing so would benefit our stockholders. These provisions could also discourage proxy contests and make it more difficult for our stockholders to elect directors of their choosing and cause us to take other corporate actions such stockholders desire.
We have a history of net losses and future profitability is uncertain.
We previously incurred net losses for each annual period from our inception through December 31, 2014. For the years ended
December 31, 2016
and 2015, we achieved net income attributable to the Company of
$53.4 million
and
$7.4 million
, respectively; for the year ended
December 31, 2017
we realized a net loss attributable to the Company of
$16.0 million
. We may not be able to sustain or increase profitability on a quarterly or annual basis. As of
December 31, 2017
, we had a total accumulated deficit of approximately
$158.7 million
.
We may not be able to realize our net operating loss carryforwards.
We have deferred tax assets that include net operating loss carryforwards that can be used to offset taxable income in future periods and reduce income taxes payable in those future periods. The ultimate realization of deferred tax assets is dependent upon the generation of future taxable income during the periods in which those temporary differences are deductible. The timing and manner in which we can utilize our net operating loss carryforward and future income tax deductions in any year may be limited by provisions of the Internal Revenue Code (“IRC”) regarding the change in ownership of corporations. Such limitation may have an impact on the ultimate realization of our carryforwards and future tax deductions. Section 382 of the IRC (“Section 382”) imposes limitations on a corporation’s ability to utilize net operating losses if it experiences an “ownership change.” In general terms, an ownership change may result from transactions increasing the ownership of certain stockholders in the stock of a corporation by more than 50 percentage points over a three-year period. Any unused annual limitation may be carried over to later years, and the amount of the limitation may under certain circumstances be increased by the built-in gains in assets held by us at the time of the change that are recognized in the five-year period after the change. Currently, a portion of our loss carryforwards is limited under Section 382.
30
Resolution of income tax matters may impact our financial condition, results of operations and cash flows.
We are subject to income taxes in many U.S. and certain foreign jurisdictions, which requires significant judgment in determining our effective income tax rate and in evaluating tax positions, particularly those related to uncertain tax positions. We have provided for uncertain tax positions when such tax positions do not meet the recognition thresholds or measurement standards prescribed by the accounting standard for uncertain tax positions. Changes in uncertain tax positions or other adjustments resulting from tax audits and settlements with taxing authorities, including related interest and penalties, impact our effective tax rate. When particular tax matters arise, a number of years could elapse before such matters are audited and finally resolved. We believe our positions are appropriate, however, federal, state, or foreign tax authorities could disagree. If the settlement of any unrecognized tax reserves is different than accrued, it would impact our effective rate in the year of resolution. Any resolution of a tax matter may require the adjustment of tax assets or tax liabilities and/or the use of cash in the year of resolution.
None.
As of
December 31, 2017
, we operate the following leased facilities:
|
Location
|
Use
|
Segment(s)
|
Square feet
|
Lease expiry
|
|
|
Malvern, PA
|
Corporate shared services, operations and monitoring
|
C, H
|
61,000
|
|
2021
|
|
Rosemont, IL
|
Customer support center, distribution, and administrative
|
H, T
|
56,000
|
|
2019
|
|
Ewing, NJ
|
Monitoring
|
H
|
28,000
|
|
2018
|
|
Eagan, MN
|
Monitoring and manufacturing
|
H, T
|
24,000
|
|
2022
|
|
Rochester, NY
|
Research
|
R
|
22,000
|
|
2028
|
|
San Francisco, CA
|
Monitoring
|
H
|
17,000
|
|
2019
|
|
Rehovot, Israel
|
Research, development and manufacturing
|
H
|
17,000
|
|
2018
|
|
Chester, PA
|
Distribution center
|
H
|
16,000
|
|
2020
|
|
Rockville, MD
|
Research
|
R
|
16,000
|
|
2026
|
|
Phoenix, AZ
|
Distribution center
|
H
|
11,000
|
|
2020
|
|
San Diego, CA
|
Research, development and engineering
|
T
|
8,000
|
|
2020
|
|
Concord, MA
|
Research and development and distribution
|
T
|
7,000
|
|
2018
|
|
Norfolk, VA
|
Monitoring
|
H
|
5,000
|
|
2018
|
C = Corporate, H = Healthcare, R = Research, T = Technology
We believe that all of our existing facilities are adequate to meet our current needs and that suitable additional alternative spaces will be available in the future on commercially reasonable terms.
From time to time, in the ordinary course of business and like others in the industry, we receive requests for information from government agencies in connection with their regulatory or investigational authority or are involved in traditional employment or business litigation. We review such requests and notices and take appropriate action.
31
The final outcome of any current or future litigation or governmental or internal investigations cannot be accurately predicted, nor can we predict any resulting penalties, fines or other sanctions that may be imposed at the discretion of federal or state regulatory authorities. We record accruals for such contingencies to the extent that we conclude it is probable that a liability has been incurred and the amount of the loss can be estimated.
For further details on the material legal proceedings to which we are currently a party, which is incorporated herein by reference, please refer to
“Part II; Item 8. Financial Statements and Supplementary Data; Notes to Consolidated Financial Statements; Note 18. Legal Proceedings”
below.
Not Applicable.
32
|
Item 5.
|
Market for Registrant’s Common Equity, Related Stockholder Matters and Issuer Purchases of Equity Securities
|
Unregistered Sales of Equity Securities
In connection with the tender offer and subsequent acquisition of LifeWatch, from the acquisition date through
December 31, 2017
we issued
3,635,646
shares of BioTelemetry Common Stock. The tender offer was subject to a Tier I exemption pursuant to Rule 14d-1(c) of the Securities Exchange Act of 1934, as amended, and the issuance of BioTelemetry Common Stock in connection therewith was exempt from registration under the Securities Act of 1933, as amended, pursuant to Rule 802 thereof, because Life Watch is a foreign private issuer and U.S. holders held less than 10% of the LifeWatch Shares that were the subject of the tender offer.
Subsequent to
December 31, 2017
, in accordance with the squeeze-out procedures under Swiss Law, we issued
58,786
shares to the remaining LifeWatch stockholders.
Market Information for Common Stock
Our common stock is traded on the NASDAQ Global Select Market under the symbol, “BEAT.” The following table sets forth the range of high and low sale prices of our common stock for the periods indicated:
|
2017
|
2016
|
||||||||||||||
|
Quarter Ended
|
High
|
Low
|
High
|
Low
|
|||||||||||
|
March 31
|
$
|
29.50
|
|
$
|
21.05
|
|
$
|
13.35
|
|
$
|
8.74
|
|
|||
|
June 30
|
34.00
|
|
26.45
|
|
17.68
|
|
10.96
|
|
|||||||
|
September 30
|
39.20
|
|
28.80
|
|
21.42
|
|
15.86
|
|
|||||||
|
December 31
|
34.70
|
|
23.30
|
|
24.10
|
|
15.25
|
|
|||||||
As of
February 15, 2018
, there were
32,531,365
shares of our common stock outstanding. Also as of that date, we had
55
holders of record (this does not include persons whose stock is in nominee or “street name” accounts through brokers).
Dividends
We have never declared or paid any cash dividends on our capital stock. We currently intend to retain all available funds and any future earnings to support our operations and finance the growth and development of our business. We do not intend to pay cash dividends on our common stock for the foreseeable future. Any future determination related to dividend policy will be made at the discretion of our Board of Directors.
Stock Performance Graph
The graph below compares the total stockholder return of an investment of $100 on December 31,
2012
through
December 31, 2017
for (i) our common stock (ii) The NASDAQ Health Care Index and (iii) The Russell 2000 Index. Each of the three measures of cumulative total return assumes reinvestment of dividends, if any. The stock price performance shown on the graph below is based on historical data and is not indicative of future stock price performance.
33
Comparison of 5 Year Cumulative Total Return
Among BioTelemetry, Inc., The NASDAQ Health Care Index
and The Russell 2000 Index
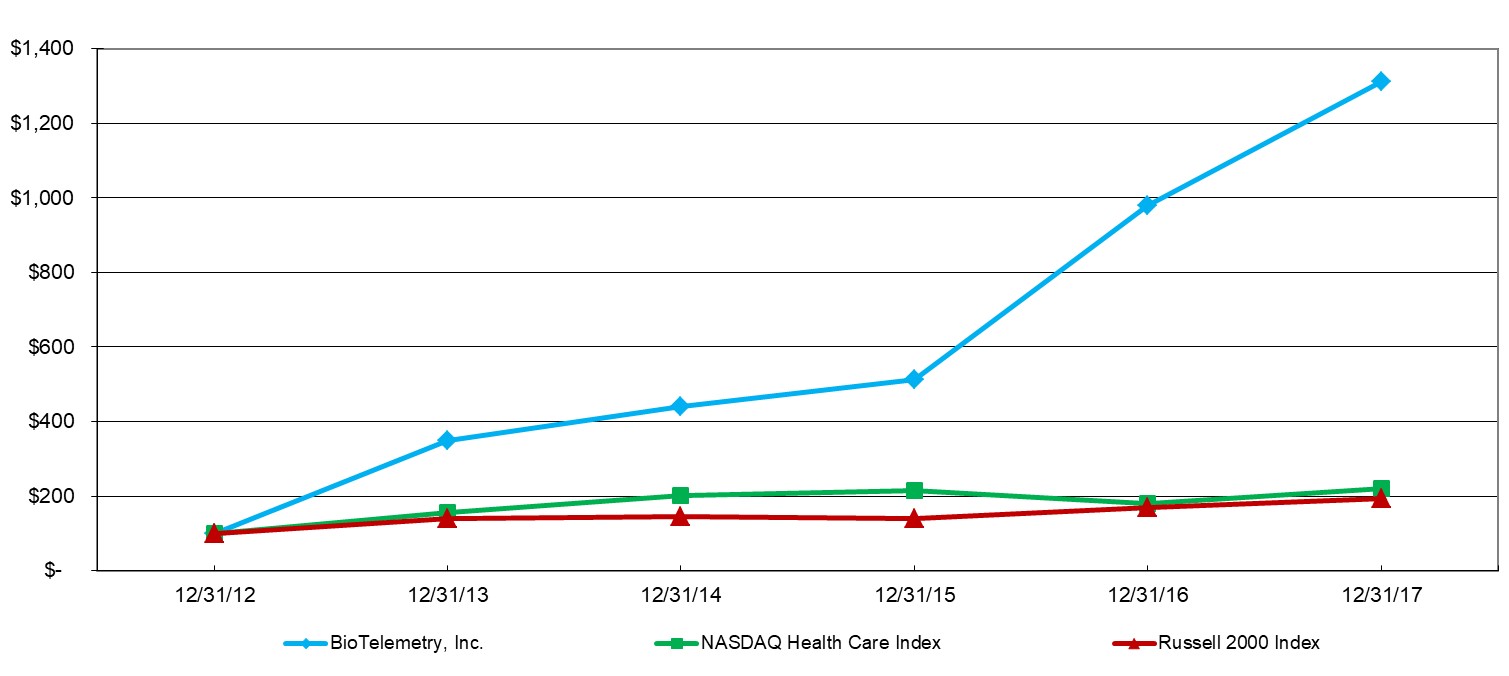
|
Company/Index
|
Base Period Dec 31,
2012 |
Dec 31,
2013 |
Dec 31,
2014 |
Dec 31,
2015 |
Dec 31,
2016 |
Dec 31,
2017 |
||||||||||||
|
BioTelemetry, Inc.
|
100.00
|
|
348.25
|
|
439.91
|
|
512.28
|
|
980.26
|
|
1,311.40
|
|
||||||
|
NASDAQ Health Care Index
|
100.00
|
|
157.04
|
|
201.75
|
|
215.59
|
|
180.19
|
|
219.87
|
|
||||||
|
Russell 2000 Index
|
100.00
|
|
138.82
|
|
145.62
|
|
139.19
|
|
168.85
|
|
193.58
|
|
||||||
The foregoing graph and chart shall not be deemed incorporated by reference by any general statement incorporating by reference this Annual Report on Form 10-K into any filing under the Securities Act of 1933, as amended, or under the Securities Exchange Act of 1934, as amended, except to the extent we specifically incorporate this information by reference, and shall not otherwise be deemed filed under those acts.
Information regarding our equity compensation plans is incorporated by reference from our Proxy Statement, unless our Proxy Statement is not filed on or before
May 1, 2018
, in which case we will amend this Form 10-K to provide the omitted information in accordance with the requirements of Instruction G to Form 10-K.
The selected financial data set forth below are derived from our consolidated financial statements. The statement of operations data for the years ended
December 31, 2017
,
2016
and
2015
, and the balance sheet data at
December 31, 2017
and
2016
are derived from our audited consolidated financial statements included elsewhere in this Annual Report on Form 10-K. The statement of operations data for the years ended
December 31, 2014
and
2013
and the balance sheet data at December
2015
,
2014
and
2013
are derived from our audited consolidated financial statements, which are not included herein. Certain reclassifications have been made below to prior period statements to conform to the current period presentation.
34
The following selected financial data should be read in conjunction with
“Item 7. Management’s Discussion and Analysis of Financial Condition and Results of Operations”
and
“Item 8. Financial Statements and Supplementary Data”
included in this Annual Report on Form 10-K.
|
Statement of Operations Data:
|
Year ended December 31,
|
||||||||||||||||||
|
(in thousands, except per share data)
|
2017
|
2016
|
2015
|
2014
|
2013
|
||||||||||||||
|
Revenue:
|
|||||||||||||||||||
|
Healthcare
|
$
|
234,385
|
|
$
|
165,664
|
|
$
|
145,963
|
|
$
|
133,178
|
|
$
|
100,386
|
|
||||
|
Research
|
38,790
|
|
32,565
|
|
21,853
|
|
19,744
|
|
20,329
|
|
|||||||||
|
Technology
|
13,601
|
|
10,103
|
|
10,697
|
|
13,656
|
|
8,786
|
|
|||||||||
|
Total revenue
|
286,776
|
|
208,332
|
|
178,513
|
|
166,578
|
|
129,501
|
|
|||||||||
|
Cost of revenue:
|
|||||||||||||||||||
|
Healthcare
|
81,356
|
|
53,559
|
|
51,693
|
|
54,942
|
|
35,177
|
|
|||||||||
|
Research
|
22,881
|
|
18,395
|
|
12,728
|
|
10,646
|
|
11,317
|
|
|||||||||
|
Technology
|
10,169
|
|
6,928
|
|
7,535
|
|
7,526
|
|
3,937
|
|
|||||||||
|
Total cost of revenue
|
114,406
|
|
78,882
|
|
71,956
|
|
73,114
|
|
50,431
|
|
|||||||||
|
Gross profit
|
172,370
|
|
129,450
|
|
106,557
|
|
93,464
|
|
79,070
|
|
|||||||||
|
Operating expenses:
|
|||||||||||||||||||
|
General and administrative
|
82,983
|
|
55,877
|
|
47,882
|
|
45,131
|
|
36,569
|
|
|||||||||
|
Sales and marketing
|
35,322
|
|
28,636
|
|
27,936
|
|
28,805
|
|
26,275
|
|
|||||||||
|
Bad debt expense
|
13,291
|
|
9,931
|
|
8,047
|
|
9,347
|
|
7,787
|
|
|||||||||
|
Research and development
|
11,101
|
|
8,355
|
|
7,111
|
|
7,396
|
|
7,338
|
|
|||||||||
|
Other charges
|
31,436
|
|
8,639
|
|
6,063
|
|
7,098
|
|
7,982
|
|
|||||||||
|
Total operating expenses
|
174,133
|
|
111,438
|
|
97,039
|
|
97,777
|
|
85,951
|
|
|||||||||
|
Income/(loss) from operations
|
(1,763
|
)
|
18,012
|
|
9,518
|
|
(4,313
|
)
|
(6,881
|
)
|
|||||||||
|
Other expense:
|
|||||||||||||||||||
|
Interest expense
|
(4,897
|
)
|
(1,830
|
)
|
(1,534
|
)
|
(713
|
)
|
(88
|
)
|
|||||||||
|
Loss on extinguishment of debt
|
(543
|
)
|
—
|
|
—
|
|
(372
|
)
|
—
|
|
|||||||||
|
Loss on equity method investment
|
(384
|
)
|
(287
|
)
|
—
|
|
—
|
|
—
|
|
|||||||||
|
Other non-operating expense, net
|
(2,809
|
)
|
(125
|
)
|
(88
|
)
|
(6,708
|
)
|
(135
|
)
|
|||||||||
|
Total other expense
|
(8,633
|
)
|
(2,242
|
)
|
(1,622
|
)
|
(7,793
|
)
|
(223
|
)
|
|||||||||
|
Income/(loss) before income taxes
|
(10,396
|
)
|
15,770
|
|
7,896
|
|
(12,106
|
)
|
(7,104
|
)
|
|||||||||
|
Benefit from/(provision for) income taxes
|
(6,747
|
)
|
37,667
|
|
(468
|
)
|
2,313
|
|
(215
|
)
|
|||||||||
|
Net income/(loss)
|
(17,143
|
)
|
53,437
|
|
7,428
|
|
(9,793
|
)
|
(7,319
|
)
|
|||||||||
|
Net loss attributable to noncontrolling interests
|
(1,187
|
)
|
—
|
|
—
|
|
—
|
|
—
|
|
|||||||||
|
Net income/(loss) attributable to BioTelemetry, Inc.
|
$
|
(15,956
|
)
|
$
|
53,437
|
|
$
|
7,428
|
|
$
|
(9,793
|
)
|
$
|
(7,319
|
)
|
||||
|
Net income/(loss) per common share attributable to BioTelemetry, Inc.:
|
|||||||||||||||||||
|
Basic
|
$
|
(0.53
|
)
|
$
|
1.91
|
|
$
|
0.27
|
|
$
|
(0.37
|
)
|
$
|
(0.29
|
)
|
||||
|
Diluted
|
$
|
(0.53
|
)
|
$
|
1.75
|
|
$
|
0.26
|
|
$
|
(0.37
|
)
|
$
|
(0.29
|
)
|
||||
|
Weighted average number of shares outstanding:
|
|||||||||||||||||||
|
Basic
|
30,386
|
|
27,920
|
|
27,116
|
|
26,445
|
|
25,544
|
|
|||||||||
|
Diluted
|
30,386
|
|
30,489
|
|
29,089
|
|
26,445
|
|
25,544
|
|
|||||||||
35
|
Balance Sheet Data:
|
December 31,
|
||||||||||||||||||
|
(in thousands)
|
2017
|
2016
|
2015
|
2014
|
2013
|
||||||||||||||
|
Cash and cash equivalents
|
$
|
36,022
|
|
$
|
23,052
|
|
$
|
18,986
|
|
$
|
20,007
|
|
$
|
22,151
|
|
||||
|
Working capital
|
39,153
|
|
28,053
|
|
23,157
|
|
13,879
|
|
25,215
|
|
|||||||||
|
Total assets
|
524,562
|
|
198,984
|
|
124,143
|
|
124,372
|
|
87,546
|
|
|||||||||
|
Total debt
|
199,356
|
|
25,161
|
|
23,194
|
|
23,873
|
|
—
|
|
|||||||||
|
Total BioTelemetry, Inc.’s stockholders’ equity
|
250,757
|
|
138,914
|
|
75,926
|
|
63,676
|
|
66,829
|
|
|||||||||
|
Noncontrolling interests
|
(1,054
|
)
|
—
|
|
—
|
|
—
|
|
—
|
|
|||||||||
|
Total equity
|
$
|
249,703
|
|
$
|
138,914
|
|
$
|
75,926
|
|
$
|
63,676
|
|
$
|
66,829
|
|
||||
36
You should read the following discussion and analysis of our financial condition and results of our operations in conjunction with our consolidated financial statements and the related notes to those statements included elsewhere in this Annual Report on Form 10-K. This discussion contains forward-looking statements reflecting our current expectations that involve risks and uncertainties. Our actual results and the timing of events may differ materially from those contained in these forward-looking statements due to a number of factors—see
“Cautionary Note Regarding Forward-Looking Statements”
and
“Part I; Item 1A; Risk Factors.”
We report on a calendar year end, and except where otherwise indicated below, “
2017
” refers to the year ended
December 31, 2017
, “
2016
” refers to the year ended
December 31, 2016
and “
2015
” refers to the year ended
December 31, 2015
.
Overview
Company Background
We provide monitoring services and digital population health management for healthcare providers, medical device manufacturing and centralized core laboratory services for clinical research. We operate under three reportable segments: (1) Healthcare, (2) Research and (3) Technology. The Healthcare segment is focused on the diagnosis and monitoring of cardiac arrhythmias or heart rhythm disorders. We offer cardiologists and electrophysiologists, neurologists and primary care physicians a full spectrum of solutions which provides them with a single source of cardiac monitoring services. These services range from the differentiated MCT to event, Holter, extended wear Holter, Pacemaker and INR monitoring. The Research segment is engaged in central core laboratory services providing cardiac monitoring, imaging services, scientific consulting and data management services for drug and medical device trials. The Technology segment focuses on the development, manufacturing, testing and marketing of cardiovascular and blood glucose monitoring devices to medical companies, clinics and hospitals.
Recent Developments
Acquisitions
On July 12, 2017, we acquired, through our wholly owned subsidiary Cardiac Monitoring Holding Company, LLC, approximately
97%
of the outstanding shares of LifeWatch AG (“LifeWatch”) for aggregate consideration of
3,615,840
shares of BioTelemetry common stock with a fair value of
$116.8 million
and cash in the amount of
$165.8 million
. On that date, we acquired control of LifeWatch AG and began consolidating its financial statements. In September 2017, we purchased
343,525
additional shares of LifeWatch for cash consideration of
$4.8 million
and the issuance of
19,806
of our shares with a fair value of
$0.6 million
. We completed the acquisition of the remaining shares in December 2017, for aggregate consideration of
$2.9 million
in cash and
58,786
shares with a fair market value of
$2.0 million
which was settled in early January 2018. LifeWatch is included in the Healthcare segment.
On December 1, 2016, we entered into a Share and Asset Purchase Agreement (“Agreement”) with Telcare, Inc. (“Telcare”) pursuant to which we acquired the stock of Telcare Medical Supply, Inc. and certain assets of Telcare. The total consideration paid at closing amounted to
$7.0 million
in cash, with the potential for a performance-based earn out up to
$5.0 million
upon reaching certain milestones, as defined in the Agreement. The fair value of the total consideration transferred in the acquisition, including contingent consideration, was
$9.7 million
at the acquisition date. Telcare is included in the Technology segment.
On May 11, 2016, we completed the acquisition of VirtualScopics, Inc. (“VirtualScopics”), a leading provider of clinical trial imaging solutions. The all cash Tender Offer commenced on April 8, 2016 and
37
ended on May 9, 2016, pursuant to which we acquired the business and operations of VirtualScopics. The total consideration paid at closing amounted to
$15.0 million
, net of cash acquired of
$0.8 million
. VirtualScopics is included in the Research segment.
On April 1, 2016, we entered into an Asset Purchase Agreement (“APA”) with DELTA Danish Electronics, Light, and Acoustics (“DELTA”), pursuant to which we acquired substantially all of the assets of the ePatch division of DELTA, inclusive of all products and indications currently under development. The total consideration paid at closing amounted to
$3.0 million
in cash and
244,519
shares of our common stock valued at
$2.9 million
. In addition, there is the potential for a performance-based earn out up to
$3.0 million
upon reaching certain milestones, as defined in the APA. The fair value of the total consideration transferred in the acquisition, including contingent consideration, was
$6.5 million
at the acquisition date. ePatch is included in the Technology segment.
U.S. Tax Cuts and Jobs Act
On December 22, 2017, the Tax Cuts and Jobs Act was signed into law. The TCJA reduced the U.S. corporate income tax rate from 35% to 21% effective January 1, 2018. We are required to revalue our U.S. deferred tax assets and liabilities at the new federal corporate income tax rate as of the date of enactment of the TCJA and to include the rate change effect in the tax provision for the period ended December 31, 2017. As a result, we recognized a
$8.0 million
deferred tax expense based on a reasonable estimate of the re-measurement of our deferred tax assets and liabilities as of December 22, 2017. This significantly increased the effective tax rate for the period ended December 31, 2017 in comparison to the effective tax rates for the last two comparable periods. As part of U.S. international tax reform, the TCJA imposes a transition tax on certain accumulated foreign earnings aggregated across all non-U.S. subsidiaries, net of foreign deficits. As we are in an aggregate net foreign deficit position for U.S. tax purposes, we are not liable for the transition tax.
Critical Accounting Policies and Estimates
The discussion and analysis of our financial condition and results of operations are based on our financial statements, which we have prepared in accordance with generally accepted accounting principles. The preparation of these financial statements requires us to make estimates and assumptions that affect the reported amount of assets and liabilities, revenues and expenses and related disclosures. We base our estimates and judgments on historical experience and on various other factors that we believe to be reasonable under the circumstances; however, actual results may differ from these estimates. We review our estimates and judgments on an ongoing basis.
We believe that the following accounting policies and estimates are most critical to a full understanding and evaluation of our reported financial results. Our significant accounting policies are more fully described in
“Part II; Item 8. Financial Statements and Supplementary Data; Notes to Consolidated Financial Statements; Note 2. Summary of Significant Accounting Policies”
below.
Revenue Recognition
Healthcare
Healthcare revenue includes revenue from MCT, event, Holter, Pacemaker and INR monitoring services. We receive a significant portion of our revenue from third-party commercial insurance organizations and governmental entities. We also receive reimbursement directly from patients through co-pays, deductibles and self-pay arrangements. Billings for services reimbursed by contracted third-party payors, including Medicare, are recorded as revenue net of contractual allowances. If we do not have
38
consistent historical information regarding collectability from a given payor to support revenue recognition at the time of service, revenue is recognized when cash is received. Adjustments to the estimated receipts for non-contractual revenue, based on final settlement with the third-party payors, are recorded upon settlement. Unearned amounts are appropriately deferred until the service has been completed. Medicare accounts for a significant portion of our Healthcare and total revenue.
Research
Research revenue includes revenue for core laboratory services. Our Research revenue is provided on a fee-for-service basis, and revenue is recognized as the related services are performed. We also provide consulting services on a time and materials basis, and this revenue is recognized as the services are performed. Our site support revenue, consisting of equipment rentals and sales along with related supplies and logistics management, are recognized at the time of sale or over the rental period. Under a typical contract, customers pay us a portion of our fee for these services upon contract execution as an upfront deposit. Unearned revenue, including upfront deposits, is deferred, and then recognized as the services are performed.
For arrangements with multiple deliverables, the revenue is allocated to each element (both delivered and undelivered items) based on their relative selling prices or management’s best estimate of their selling prices, when vendor-specific or third-party evidence is unavailable.
We record reimbursements received for out-of-pocket expenses, including freight, as revenue in the accompanying consolidated statements of operations and comprehensive income (loss).
Technology
Technology revenue includes revenue received from the sale of products, product repairs and supplies to medical companies, clinics and hospitals. Our Technology revenue is recognized when products are shipped, or as services are completed.
Accounts Receivable
Healthcare accounts receivable are related to the Healthcare segment and are recorded at the time revenue is recognized, net of contractual allowances, and are presented on the consolidated balance sheet net of allowance for doubtful accounts. The ultimate collection of accounts receivable may not be known for several months after services have been provided and billed. We record an allowance for doubtful accounts based on the aging of receivables using historical data. The percentages and amounts used to record bad debt expense and the allowance for doubtful accounts are supported by various methods and analyses, including current and historical cash collections and the aging of receivables by payor. Because of continuing changes in the health care industry and third-party reimbursement, it is possible that our estimates could change, which could have a material impact on our operations and cash flows.
Other accounts receivable are related to the Technology and Research segments and are recorded at the time revenue is recognized, or when products are shipped or services are performed. We estimate the allowance for doubtful accounts on a specific account basis, and consider several factors in our analysis including customer specific information and the aging of the account.
We will write off receivables when the likelihood for collection is remote and when we believe collection efforts have been fully exhausted and we do not intend to devote additional resources in attempting to collect. We perform write-offs on a monthly basis. In the Healthcare segment, we wrote off
$8.8 million
and
$8.4 million
of receivables for the years ended
December 31, 2017
and
2016
, respectively. The impact
39
was a reduction of gross receivables and a reduction in the allowance for doubtful accounts. There were no material write-offs in the Technology and Research segments. We recorded bad debt expense of
$13.3 million
,
$9.9 million
and
$8.0 million
, respectively, for the years ended
December 31, 2017
,
2016
and
2015
, respectively.
Stock-Based Compensation
ASC 718,
Compensation—Stock Compensation
(“ASC 718”), addresses the accounting for share-based payment transactions in which an enterprise receives employee services in exchange for (i) equity instruments of the enterprise or (ii) liabilities that are based on the fair value of the enterprise’s equity instruments or that may be settled by the issuance of such equity instruments. ASC 718 requires that an entity measure the cost of equity-based service awards based on the grant-date fair value of the award and recognize the cost of such awards over the period during which the employee is required to provide service in exchange for the award (the vesting period). ASC 718 requires that an entity measure the cost of liability-based service awards based on current fair value that is remeasured subsequently at each reporting date through the settlement date. We also use the provisions of ASC 505-50,
Equity Based Payments to Non-Employees
(“ASC 505-50”), to account for stock-based compensation awards issued to non-employees for services. Such awards for services are recorded at either the fair value of the services rendered or the instruments issued in exchange for such services, whichever is more readily determinable, using the measurement date guidelines enumerated in ASC 505-50.
Stock-based compensation expense is only recognized for outstanding performance stock units (“PSUs”) where the performance conditions are deemed probable for achievement. For PSUs deemed probable for achievement, stock-based compensation expense is recognized ratably over the expected vesting period. Performance stock options (“PSOs”) are valued and stock-based compensation expense is only recognized once the performance conditions of the outstanding PSOs have been met.
We have historically recorded stock-based compensation expense based on the number of options or restricted stock units we expect to vest using our historical forfeiture experience and periodically update those forfeiture rates to apply to new grants. While we early adopted ASU 2016-09 in the year ended
December 31, 2016
, we have elected to continue to estimate forfeitures under the true-up provision of ASC 718. ASC 718 requires forfeitures to be estimated at the time of grant and revised, if necessary, in subsequent periods if actual forfeitures differ from estimates. Forfeitures are estimated based on our historical experience.
We estimate the fair value of our stock options to employees and directors using the Black-Scholes option valuation model. The Black-Scholes option valuation model requires the use of certain subjective assumptions. The most significant of these assumptions are the estimates of the expected volatility of the market price of our stock and the expected term of the award. We base our estimates of expected volatility on the historical volatility of our stock price. The expected term represents the period of time that stock-based awards granted are expected to be outstanding. Other assumptions used in the Black-Scholes option valuation model include the risk-free interest rate and expected dividend yield. The risk-free interest rate for periods pertaining to the contractual life of each option is based on the United States Treasury yield of a similar duration in effect at the time of grant. We have never paid, and do not expect to pay, dividends in the foreseeable future.
Goodwill and Acquired Intangible Assets
Goodwill is the excess of the purchase price of an acquired business over the amounts assigned to assets acquired and liabilities assumed in a business combination. In accordance with ASC 350
, Intangibles
40
—Goodwill and Other
(“ASC 350”), goodwill is reviewed for impairment annually, or when events arise that could indicate that an impairment exists. Initially, we qualitatively assess whether it is more-likely-than-not that an impairment exists for each reporting unit. Such qualitative factors can include, among others, industry and market conditions, present and anticipated sales and cost factors, overall financial performance and relevant entity-specific events. If we conclude based on our qualitative assessment that it is more-likely-than-not that the fair value of a reporting unit is less than its carrying value, we perform an impairment test in accordance with ASC 350. We compare the fair value of our reporting units to their carrying value. If the reporting unit’s carrying value exceeds its fair value, an impairment loss equal to the difference is recognized. The loss recognized shall not exceed the total amount of goodwill allocated to the reporting unit, and the income tax effects from any deductible goodwill on the carrying value of the reporting unit when measuring the goodwill impairment loss, if any, are considered.
For the purpose of performing our goodwill impairment analysis, we consider our business to be composed of three reporting units: Healthcare, Technology and Research. When performing a quantitative analysis, we calculate the fair value of the reporting units utilizing a weighting of the income and market approaches. The income approach is based on a discounted cash flow methodology that includes assumptions for, among other things, forecasted income, cash flow, growth rates, income tax rates, expected tax benefits and long-term discount rates, all of which require significant judgment. The market approach utilizes our market data as well as market data from publicly-traded companies that are similar to us. There are inherent uncertainties related to these factors and the judgment applied in the analysis. We believe that the combination of an income and a market approach provides a reasonable basis to estimate the fair value of our reporting units.
Acquired intangible assets are recorded at fair value on the acquisition date. The estimated fair values and useful lives of intangible assets are determined by assessing many factors, including estimates of future operating performance and cash flows of the acquired business, the characteristics of the intangible assets and the experience of the acquired business. Independent appraisal firms may assist with the valuation of acquired assets. The impairment test for indefinite-lived intangible assets other than goodwill consists of a comparison of the fair value of the indefinite-lived intangible asset to the carrying value of the asset. We estimate the fair value of the indefinite-lived intangibles using the relief from royalty method.
We performed an impairment analysis of goodwill and indefinite-lived intangible assets for the years ended
December 31, 2017
,
2016
and
2015
. There was no goodwill impairment recorded as a result of these analyses.
During our impairment testing of our intangible assets for the year ended
December 31, 2017
, considering the LifeWatch integration and forward-looking integration plans, we determined that certain trade names and internally developed software costs ceased being used and were no longer going to be used and were therefore impaired, resulting in
$11.0 million
of intangible asset impairment charges included within the Corporate and Other segment as a component of other costs within the other charges line in our consolidated statements of operations and comprehensive income/(loss). There were no other intangible asset impairments for the year ended
December 31, 2017
.
At
December 31, 2016
and
2015
, we performed our required annual impairment test of indefinite-lived intangible assets. Based on these impairment tests, we determined that there was
no
impairment.
Income Taxes
We account for income taxes under the liability method, as described in ASC 740,
Income Taxes
(“ASC 740”). Deferred income taxes are recognized for the tax consequences of temporary differences
41
between the tax and financial statement reporting bases of assets and liabilities. When we determine that we will not be able to realize our deferred tax assets, we adjust the carrying value of the deferred tax asset through the valuation allowance.
We record uncertain tax positions in accordance with ASC 740 on the basis of a two-step process in which (i) we determine whether it is more likely than not that the tax positions will be sustained on the basis of the technical merits of the position and (ii) for those tax positions that meet the more-likely-than-not recognition threshold, we recognize the largest amount of tax benefit that is more than 50 percent likely to be realized upon ultimate settlement with the related tax authority.
Revenue
The vast majority of our revenue is derived from cardiac monitoring services in our Healthcare segment. The amount of Healthcare revenue generated is based on the number of patients enrolled through physician prescriptions and the rates reimbursed to us by commercial payors, physicians, patients and Medicare. MCT Medicare pricing was down slightly in 2017 and will be flat for 2018. Over time, we expect the price to remain relatively stable. We expect volumes to grow in the long-term as the market grows and we continue to gain market share.
Revenue is generated in the Research segment through various study and consulting services, which include activities such as core lab services, project management, data management, equipment rental and customer support. Research revenue is driven by our ability to enter into service contracts at various phases of the pharmaceutical drug development life cycle. We expect volume to increase as a result of our growing capabilities as a multi-service provider. Negotiated pricing for service contracts is subject to market pressures, and as a result has decreased slightly over the last few years. We expect revenue from the Research segment to increase over the long-term as we continue to increase our study volume.
Revenue is generated in the Technology segment from the sale of cardiac and blood glucose monitoring products to third-party distributors and service providers in our Technology segment. Technology revenue is driven by the number of the units purchased by our customers and the relative per unit pricing for various products. The sales volume for our Technology segment has increased in the current year with integration of Telcare. We expect our Technology segment revenue to increase over the long-term as we grow our new products.
Gross Profit
Gross profit consists of revenue less the cost of revenue.
Cost of revenue for the Healthcare segment includes:
|
•
|
salaries and benefits for personnel providing various services and customer support to physicians and patients including customer service, monitoring services, distribution services (scheduling, packaging and delivery of the devices to the patients and practices), device repair and maintenance and quality assurance;
|
|
•
|
cost of patient-related services provided by third-party subcontractors including device transportation to and from the patients and practices and wireless communication charges related to transmission of data to the monitoring centers;
|
|
•
|
consumable supplies sent to patients along with the durable components of our devices; and
|
42
|
•
|
depreciation of our medical devices.
|
Cost of revenue for the Research segment includes:
|
•
|
cost of internal and third-party medical specialists and technicians;
|
|
•
|
salaries and benefits of personnel providing various services to customers including consulting, customer support, project management and certain information technology support;
|
|
•
|
depreciation of our medical devices; and
|
|
•
|
cost of materials and transportation related to the shipment of products and supplies.
|
Cost of revenue for the Technology segment includes the cost of materials and labor related to the manufacture of our products and product repair services.
We expect multiple factors to influence our gross profit margins in the foreseeable future. Changes in reimbursement and payor mix are two such factors. While we expect reimbursement to be stable, payor mix is unpredictable and dependent on the insurance coverage of patients that are prescribed our services. We have a history of lowering the average cost of revenues as we increase volume. We expect to continue to achieve efficiencies in cost of revenue through process improvements, as well as from a reduction in the cost of our devices. We also expect to realize synergies from our LifeWatch acquisition. These factors will have a favorable impact on our gross profit margins. While these factors could be offsetting, it is difficult to predict how they will influence our gross profit margins.
We expect to achieve some efficiencies in our Research segment cost of revenue through process improvements, and expect a favorable impact on gross margins due to the leveraging of the relatively fixed cost infrastructure. If we experience service contract pricing or volume declines in our Research segment, it would have an adverse effect on our gross profit margin.
If we experience volume or selling price declines in our Technology segment, or service contract pricing, it would have an adverse effect on our gross profit margin. We expect the cost of products sold and repairs to remain relatively consistent.
General and Administrative
General and administrative expense consists primarily of salaries and benefits related to general and administrative personnel, management bonuses, professional fees primarily related to legal and audit fees, amortization related to intangible assets, facilities expenses and the related overhead.
Sales and Marketing
Sales and marketing expense consists primarily of salaries, benefits and commissions related to sales, travel and entertainment costs, marketing and contracting personnel. Also included are marketing programs such as trade shows and advertising campaigns.
Research and Development
Research and development expense consists primarily of salaries and benefits of personnel, as well as subcontractors who work on new product development and sustaining engineering of our existing products.
43
Other Charges
We account for expenses associated with our acquisitions and certain litigation as other charges as incurred. These expenses were primarily a result of legal fees related to activities surrounding our acquisitions, including integration activities subsequent to our acquisitions and patent litigation in which we are the plaintiff. Other charges, including intangible and fixed asset impairments, are costs that are not considered necessary to the ongoing business operations.
Interest Expense
Interest expense consists primarily of the interest accrued related to our term loan, capital leases and where applicable, our revolving credit agreement, along with the amortization of deferred debt acquisition costs.
Loss on extinguishment of debt consists primarily of the costs incurred related to the write off of the unamortized debt issuance costs when we settled our prior credit agreements.
Loss on Equity Method Investment
Loss on equity method investment represents our portion of the results of operations of our equity method investee.
Other Non-Operating Expense, net
Other non-operating expense, net represents other infrequently occurring non-operating items including settlement charges and foreign exchange gains/(losses).
Net Loss Attributable to Noncontrolling Interests
Net loss attributable to noncontrolling interests consists of the post-acquisition activity of the portion of LifeWatch that we had not yet acquired during the period from July 12, 2017 through
December 31, 2017
as well as the 45% of LifeWatch Turkey that we do not own over that same period.
Results of Operations
Years Ended
December 31, 2017
and
2016
Revenue
|
Year Ended
|
Change
|
|||||||||||||
|
(In thousands, except percentages)
|
December 31, 2017
|
December 31, 2016
|
$
|
%
|
||||||||||
|
Healthcare
|
$
|
234,385
|
|
$
|
165,664
|
|
$
|
68,721
|
|
41.5
|
%
|
|||
|
Research
|
38,790
|
|
32,565
|
|
6,225
|
|
19.1
|
%
|
||||||
|
Technology
|
13,601
|
|
10,103
|
|
3,498
|
|
34.6
|
%
|
||||||
|
Total revenue
|
$
|
286,776
|
|
$
|
208,332
|
|
$
|
78,444
|
|
37.7
|
%
|
|||
Total revenue for the year ended
December 31, 2017
increased due primarily to the Healthcare segment, which was affected by the acquisition of LifeWatch, along with increased patient volumes as well as a favorable service mix. While overall pricing was stable, we saw a decline in our Medicare rates. Research revenue increased due to the full year impact of the acquisition of our imaging business, VirtualScopics, which was acquired in May 2016, partially offset by lower cardiac study volumes.
44
Technology revenue also increased due to the full year impact of Telcare, which was acquired in December 2016.
Gross Profit
|
Year Ended
|
Change
|
|||||||||||||
|
(In thousands, except percentages)
|
December 31, 2017
|
December 31, 2016
|
$
|
%
|
||||||||||
|
Gross profit
|
$
|
172,370
|
|
$
|
129,450
|
|
$
|
42,920
|
|
33.2
|
%
|
|||
|
Percentage of revenue
|
60.1
|
%
|
62.1
|
%
|
||||||||||
Gross profit for the year ended
December 31, 2017
increased due primarily to our recent acquisitions, organic growth, and realized synergies from our acquisitions, partially offset by the impact of the decrease in Medicare rates. The decrease in gross margin percentage was due to the impact of our recent acquisitions, whose revenues carry lower profit margins than our existing business.
General and Administrative Expense
|
Year Ended
|
Change
|
|||||||||||||
|
(In thousands, except percentages)
|
December 31, 2017
|
December 31, 2016
|
$
|
%
|
||||||||||
|
General and administrative expense
|
$
|
82,983
|
|
$
|
55,877
|
|
$
|
27,106
|
|
48.5
|
%
|
|||
|
Percentage of revenue
|
28.9
|
%
|
26.8
|
%
|
||||||||||
General and administrative expense increased for the year ended
December 31, 2017
due primarily to the
$19.9 million
impact from our recent acquisitions, primarily LifeWatch, a
$6.0 million
impact from intangible asset amortization attributed to LifeWatch, as well as a
$2.2 million
increase in technology costs, offset partially by
$0.7 million
in headcount related savings. The increase in the general and administrative expense as a percent of revenue was the result of the intangible asset amortization recorded stemming from the LifeWatch acquisition.
Sales and Marketing Expense
|
Year Ended
|
Change
|
|||||||||||||
|
(In thousands, except percentages)
|
December 31, 2017
|
December 31, 2016
|
$
|
%
|
||||||||||
|
Sales and marketing expense
|
$
|
35,322
|
|
$
|
28,636
|
|
$
|
6,686
|
|
23.3
|
%
|
|||
|
Percentage of revenue
|
12.3
|
%
|
13.7
|
%
|
||||||||||
The increase to sales and marketing expense for the year ended
December 31, 2017
was due primarily to the
$10.7 million
impact from our recent acquisitions, primarily LifeWatch, and
$2.2 million
in added employee related costs exclusive of our recent acquisitions, partially offset by approximately
$5.0 million
of synergies obtained from the recent acquisitions and
$1.1 million
due to lower sales meetings costs. Sales and marketing expense decreased as a percentage of revenue due to the leverage and synergies obtained from our acquired businesses.
45
Bad Debt Expense
|
Year Ended
|
Change
|
|||||||||||||
|
(In thousands, except percentages)
|
December 31, 2017
|
December 31, 2016
|
$
|
%
|
||||||||||
|
Bad debt expense
|
$
|
13,291
|
|
$
|
9,931
|
|
$
|
3,360
|
|
33.8
|
%
|
|||
|
Percentage of revenue
|
4.6
|
%
|
4.8
|
%
|
||||||||||
The increase in bad debt expense for the year ended
December 31, 2017
was due to increased revenue from our recently acquired business and the timing of revenue and collections. Substantially all of our bad debt expense relates to the Healthcare segment. Bad debt expense in the Research segments was minimal and is recorded on a specific account basis.
Research and Development Expense
|
Year Ended
|
Change
|
|||||||||||||
|
(In thousands, except percentages)
|
December 31, 2017
|
December 31, 2016
|
$
|
%
|
||||||||||
|
Research and development expense
|
$
|
11,101
|
|
$
|
8,355
|
|
$
|
2,746
|
|
32.9
|
%
|
|||
|
Percentage of revenue
|
3.9
|
%
|
4.0
|
%
|
||||||||||
Research and development expense for the year ended
December 31, 2017
increased due primarily to the
$5.2 million
impact from our recent acquisitions, primarily LifeWatch, offset partially by
$2.7 million
of synergies obtained from the recent acquisitions and other cost savings.
Other Charges
|
Year Ended
|
Change
|
|||||||||||||
|
(In thousands, except percentages)
|
December 31, 2017
|
December 31, 2016
|
$
|
%
|
||||||||||
|
Other charges
|
$
|
31,436
|
|
$
|
8,639
|
|
$
|
22,797
|
|
263.9
|
%
|
|||
|
Percentage of revenue
|
11.0
|
%
|
4.1
|
%
|
||||||||||
The increase in other charges for the year ended
December 31, 2017
was primarily related to
$12.0 million
of asset impairment charges,
$4.9 million
in additional professional fees,
$4.1 million
of severance and employee related costs, and
$1.5 million
of legal fees, primarily related to the acquisition of LifeWatch. These charges were partially offset by a
$2.6 million
decrease in the fair value of acquisition-related consideration recognized for previous acquisitions.
46
Other Expense
|
Year Ended
|
Change
|
|||||||||||||
|
(In thousands, except percentages)
|
December 31, 2017
|
December 31, 2016
|
$
|
%
|
||||||||||
|
Interest expense
|
$
|
(4,897
|
)
|
$
|
(1,830
|
)
|
$
|
(3,067
|
)
|
167.6
|
%
|
|||
|
Loss on extinguishment of debt
|
(543
|
)
|
—
|
|
(543
|
)
|
n/a
|
|||||||
|
Loss on equity method investment
|
(384
|
)
|
(287
|
)
|
(97
|
)
|
33.8
|
%
|
||||||
|
Other non-operating expense, net
|
(2,809
|
)
|
(125
|
)
|
(2,684
|
)
|
2,147.2
|
%
|
||||||
|
Total Other expense
|
$
|
(8,633
|
)
|
$
|
(2,242
|
)
|
$
|
(6,391
|
)
|
285.1
|
%
|
|||
|
Percentage of revenue
|
3.0
|
%
|
1.1
|
%
|
||||||||||
Total other expense for the year ended
December 31, 2017
increased due primarily to
$3.1 million
of interest expense resulting from our new credit agreement entered into concurrent with our LifeWatch acquisition and a
$2.5 million
non-operating charge for our settlement with the Office of Civil Rights related to the theft of two unencrypted laptop computers in 2011. Additionally, we incurred a
$1.3 million
non-operating charge related to the derivative instrument premium for the acquisition of LifeWatch, and a
$0.5 million
loss on the extinguishment of our previous credit agreement with Healthcare Financial Solutions, LLC, offset partially by a non-operating gain of approximately
$1.3 million
related to the favorable settlement with the former owner of Mednet.
Income Taxes
|
Year Ended
|
Change
|
|||||||||||||
|
(In thousands, except percentages)
|
December 31, 2017
|
December 31, 2016
|
$
|
%
|
||||||||||
|
Benefit from/(provision for) income taxes
|
$
|
(6,747
|
)
|
$
|
37,667
|
|
$
|
(44,414
|
)
|
(117.9
|
)%
|
|||
|
Effective tax benefit/(provision) rate
|
(64.9
|
)%
|
238.9
|
%
|
||||||||||
For the year ended December 31, 2017, we recognized a net tax provision primarily due to the re-measurement of our deferred tax assets and liabilities at the new federal corporate rate of 21 percent, which total
$8.0 million
.
For the year ended December 31, 2016, we recognized a net tax benefit due primarily to a
$51.6 million
benefit related to the release of our valuation allowance. The release of our valuation allowance was partially offset by adjustments to deferred taxes and state taxes levied on fiscal 2016 taxable income.
47
Years Ended
December 31, 2016
and
2015
Revenue
|
Year Ended
|
Change
|
|||||||||||||
|
(In thousands, except percentages)
|
December 31, 2016
|
December 31, 2015
|
$
|
%
|
||||||||||
|
Healthcare
|
$
|
165,664
|
|
$
|
145,963
|
|
$
|
19,701
|
|
13.5
|
%
|
|||
|
Research
|
32,565
|
|
21,853
|
|
10,712
|
|
49.0
|
%
|
||||||
|
Technology
|
10,103
|
|
10,697
|
|
(594
|
)
|
(5.6
|
)%
|
||||||
|
Total revenue
|
$
|
208,332
|
|
$
|
178,513
|
|
$
|
29,819
|
|
16.7
|
%
|
|||
Healthcare revenue increased for the year ended
December 31, 2016
due to increased patient volumes as well as higher MCT Medicare pricing. In addition, Research revenue increased due to the acquisition of VirtualScopics. These increases were partially offset by a decrease in Technology revenue due to lower sales volume resulting from customers delaying purchases as they await the release of upgraded devices, partially offset by increases due to current year acquisitions.
Gross Profit
|
Year Ended
|
Change
|
|||||||||||||
|
(In thousands, except percentages)
|
December 31, 2016
|
December 31, 2015
|
$
|
%
|
||||||||||
|
Gross profit
|
$
|
129,450
|
|
$
|
106,557
|
|
$
|
22,893
|
|
21.5
|
%
|
|||
|
Percentage of revenue
|
62.1
|
%
|
59.7
|
%
|
||||||||||
The increase in gross margin percentage for the year ended
December 31, 2016
was due to Healthcare volume efficiencies and higher Healthcare pricing, as well as reduced costs related to shipping and device communication. These increases were slightly offset by the impact of our acquisitions, which carry lower profit margins than our existing business.
General and Administrative Expense
|
Year Ended
|
Change
|
|||||||||||||
|
(In thousands, except percentages)
|
December 31, 2016
|
December 31, 2015
|
$
|
%
|
||||||||||
|
General and administrative expense
|
$
|
55,877
|
|
$
|
47,882
|
|
$
|
7,995
|
|
16.7
|
%
|
|||
|
Percentage of revenue
|
26.8
|
%
|
26.8
|
%
|
||||||||||
General and administrative expense for the year ended
December 31, 2016
increased due to the addition of
$3.8 million
from our acquired businesses, as well as a
$2.6 million
increase in employee related costs and a
$1.6 million
increase in stock compensation expense.
$1.3 million
of the increase in stock compensation expense related to a performance bonus awarded to a third‑party.
48
Sales and Marketing Expense
|
Year Ended
|
Change
|
|||||||||||||
|
(In thousands, except percentages)
|
December 31, 2016
|
December 31, 2015
|
$
|
%
|
||||||||||
|
Sales and marketing expense
|
$
|
28,636
|
|
$
|
27,936
|
|
$
|
700
|
|
2.5
|
%
|
|||
|
Percentage of revenue
|
13.7
|
%
|
15.6
|
%
|
||||||||||
Sales and marketing expense for the year ended
December 31, 2016
increased due to the addition
of
$0.9 million
from our acquired businesses, partially offset by a
$0.2 million
decrease in employee related costs.
Bad Debt Expense
|
Year Ended
|
Change
|
|||||||||||||
|
(In thousands, except percentages)
|
December 31, 2016
|
December 31, 2015
|
$
|
%
|
||||||||||
|
Bad debt expense
|
$
|
9,931
|
|
$
|
8,047
|
|
$
|
1,884
|
|
23.4
|
%
|
|||
|
Percentage of revenue
|
4.8
|
%
|
4.5
|
%
|
||||||||||
Bad debt expense for the year ended
December 31, 2016
increased due to the timing of revenue and collections. Substantially all of our bad debt expense relates to the Healthcare segment. Bad debt expense in the Technology and Research segments was minimal and is recorded on a specific account basis.
Research and Development Expense
|
Year Ended
|
Change
|
|||||||||||||
|
(In thousands, except percentages)
|
December 31, 2016
|
December 31, 2015
|
$
|
%
|
||||||||||
|
Research and development expense
|
$
|
8,355
|
|
$
|
7,111
|
|
$
|
1,244
|
|
17.5
|
%
|
|||
|
Percentage of revenue
|
4.0
|
%
|
4.0
|
%
|
||||||||||
Research and development expense for the year ended
December 31, 2016
increased due to the addition of
$1.0 million
from our acquired businesses as well as a
$0.2 million
increase in consulting costs and a
$0.1 million
increase in employee related expenses.
Other Charges
|
Year Ended
|
Change
|
|||||||||||||
|
(In thousands, except percentages)
|
December 31, 2016
|
December 31, 2015
|
$
|
%
|
||||||||||
|
Other charges
|
$
|
8,639
|
|
$
|
6,063
|
|
$
|
2,576
|
|
42.5
|
%
|
|||
|
Percentage of revenue
|
4.1
|
%
|
3.4
|
%
|
||||||||||
Other charges for the year ended
December 31, 2016
consisted of legal charges of
$7.2 million
related primarily to patent litigation cases in which we are the plaintiff, professional fees of
$0.7 million
,
severance and employee related costs of
$0.6 million
and
$0.1 million
of other acquisition related costs
from our 2016 acquisitions.
49
Other charges for the year ended
December 31, 2015
consisted of legal charges of
$5.8 million
related primarily to patent litigation and severance and employee related costs of
$0.3 million
associated
with activities surrounding our 2014 acquisitions.
Other Expense
|
Year Ended
|
Change
|
|||||||||||||
|
(In thousands, except percentages)
|
December 31, 2016
|
December 31, 2015
|
$
|
%
|
||||||||||
|
Interest expense
|
$
|
(1,830
|
)
|
$
|
(1,534
|
)
|
$
|
(296
|
)
|
19.3
|
%
|
|||
|
Loss on equity method investment
|
(287
|
)
|
—
|
|
(287
|
)
|
n/a
|
|||||||
|
Other non-operating expense, net
|
(125
|
)
|
(88
|
)
|
(37
|
)
|
42.0
|
%
|
||||||
|
Total Other expense
|
$
|
(2,242
|
)
|
$
|
(1,622
|
)
|
$
|
(620
|
)
|
38.2
|
%
|
|||
|
Percentage of revenue
|
1.1
|
%
|
0.9
|
%
|
||||||||||
Total other expense for the year ended
December 31, 2016
increased due primarily to increased interest expense related to our borrowings under our Revolving Loans as well as due to recognizing our share of our equity method investee’s loss.
Income Taxes
|
Year Ended
|
Change
|
|||||||||||||
|
(In thousands, except percentages)
|
December 31, 2016
|
December 31, 2015
|
$
|
%
|
||||||||||
|
Benefit from/(provision for) income taxes
|
$
|
37,667
|
|
$
|
(468
|
)
|
$
|
38,135
|
|
8,148.5
|
%
|
|||
|
Effective tax benefit/(provision) rate
|
238.9
|
%
|
(5.9
|
)%
|
||||||||||
For the year ended
December 31, 2016
, we recognized a net tax benefit due primarily to a
$51.6 million
benefit related to the release of our valuation allowance. The release of our valuation allowance was partially offset by adjustments to deferred taxes and state taxes levied on fiscal 2016 taxable income.
For the year ended
December 31, 2015
,
we recognized a tax provision due primarily to Alternative Minimum Tax (“AMT”) levied on fiscal 2015 taxable income net of allowable AMT net operating loss carryovers, as well as an increase in the deferred tax liability created by the book to tax differences on indefinite‑lived assets.
50
Liquidity and Capital Resources
The following table highlights certain information related to our liquidity and capital resources:
|
Year Ended
|
|||||||
|
(In thousands, except ratios)
|
December 31, 2017
|
December 31, 2016
|
|||||
|
Cash and cash equivalents
|
$
|
36,022
|
|
$
|
23,052
|
|
|
|
Healthcare accounts receivable, net of allowance for doubtful accounts
|
25,190
|
|
14,594
|
|
|||
|
Other accounts receivable, net of allowance for doubtful accounts
|
13,296
|
|
12,261
|
|
|||
|
Availability under revolving credit facility
|
50,000
|
|
12,000
|
|
|||
|
Working capital
|
$
|
39,153
|
|
$
|
28,053
|
|
|
|
Current ratio
|
1.8
|
|
1.9
|
|
|||
|
Total capital lease obligations
|
$
|
5,509
|
|
$
|
288
|
|
|
|
Total debt
|
$
|
199,356
|
|
$
|
25,161
|
|
|
The following table highlights certain cash flow activities:
|
Year Ended
|
|||||||
|
(In thousands)
|
December 31, 2017
|
December 31, 2016
|
|||||
|
Net income/(loss)
|
$
|
(17,143
|
)
|
$
|
53,437
|
|
|
|
Non-cash adjustments to net income
|
66,193
|
|
(6,765
|
)
|
|||
|
Cash used for working capital
|
(25,268
|
)
|
(7,821
|
)
|
|||
|
Cash provided by operating activities
|
23,782
|
|
38,851
|
|
|||
|
Cash used for acquisitions of businesses, net of cash acquired
|
(161,479
|
)
|
(24,970
|
)
|
|||
|
Purchases of property, equipment and investment in internally developed software
|
(13,697
|
)
|
(10,899
|
)
|
|||
|
Cash used in investing activities
|
(177,188
|
)
|
(36,181
|
)
|
|||
|
Cash provided by financing activities
|
$
|
166,457
|
|
$
|
1,427
|
|
|
Non-cash adjustments to income primarily relate to bad debt, depreciation, amortization and stock compensation expense offset by any non-cash tax benefit. For the year ended
December 31, 2016
, we released a
$51.6 million
tax valuation allowance on the basis of management’s reassessment of the amount of deferred income tax assets that are more‑likely‑than‑not to be realized, which was a component of the non-cash adjustments recognized.
During the year ended
December 31, 2017
we acquired LifeWatch for
$161.5 million
cash along with
$117.4 million
in common stock. During the year ended
December 31, 2016
, we acquired Telcare for
$7.0 million
cash, VirtualScopics for approximately
$15.0 million
, and the ePatch division of DELTA for
$3.0 million
cash along with
$2.9 million
in common stock.
In conjunction with the LifeWatch acquisition, we established a new Credit Agreement with SunTrust Bank and Lenders named therein in the amount of
$205.0 million
and extinguished the previous
51
Healthcare Financial Solutions Credit Agreement. For further details regarding the Credit Agreements, please see
“Part II; Item 8. Financial Statements and Supplementary Data; Notes to Consolidated Financial Statements; Note 10. Credit Agreement”
below.
Contractual Obligations and Commitments
The following table describes our long-term contractual obligations and commitments as of
December 31, 2017
:
|
Payments due by period
|
||||||||||||||||||||
|
(in thousands)
|
Total
|
Less than 1 year
|
1-3 Years
|
3-5 Years
|
More than 5 Years
|
|||||||||||||||
|
Operating lease obligations
|
$
|
23,655
|
|
$
|
5,871
|
|
$
|
8,008
|
|
$
|
4,261
|
|
$
|
5,515
|
|
|||||
|
Capital lease obligations
|
5,509
|
|
4,023
|
|
1,486
|
|
—
|
|
—
|
|
||||||||||
|
Debt and interest obligations
(1)
|
236,083
|
|
8,197
|
|
34,776
|
|
193,110
|
|
—
|
|
||||||||||
|
Purchase obligations
|
2,184
|
|
2,184
|
|
—
|
|
—
|
|
—
|
|
||||||||||
|
Total
(2)(3)
|
$
|
267,431
|
|
$
|
20,275
|
|
$
|
44,270
|
|
$
|
197,371
|
|
$
|
5,515
|
|
|||||
________________
|
(1)
|
Our debt bears a variable interest rate, at the election of the Company, with an applicable margin determined by the credit agreement. The amounts above assume the rate and margin as of December 31, 2017 throughout the term. The rate and margin may fluctuate, as may our election of LIBOR or Base Rate pricing, throughout the term of the loan. Excluded from the amounts in the table is the
0.3%
commitment fee payable on the unused portion of our line of credit.
|
|
(2)
|
In connection with certain acquisitions completed in 2016, we have contingent consideration obligations payable to the sellers in these transactions upon the achievement of certain milestones. The maximum aggregate undiscounted amounts potentially payable not included in the table above total
$5.0 million
.
|
|
(3)
|
Our other long-term liabilities in our consolidated balance sheets consist primarily of reserves for uncertain tax positions, pension obligations and contingent consideration. As of
December 31, 2017
, we are unable to make reasonably reliable estimates of both the timing of tax audit outcomes and if unfavorable, the timing of payments; therefore, such amounts are not included in the above contractual obligation table. See
“Part II; Item 8. Financial Statements and Supplementary Data; Notes to Consolidated Financial Statements; Note 16. Income Taxes”
for further discussion related to uncertain tax positions.
|
As of
December 31, 2017
, we were bound under facility leases and several office equipment leases that are included in the table above. Our debt bears a variable interest rate of LIBOR plus the applicable margin, or the prime rate plus the applicable margin. If LIBOR rates increase, obligations will increase above the amounts disclosed above.
Recent Accounting Pronouncements
For further details on recently issued accounting pronouncements, please refer to “
Part II; Item 8. Financial Statements and Supplementary Data; Notes to Consolidated Financial Statements; Note 2. Summary of Significant Accounting Policies; (t) Recent Accounting Pronouncements
.”
Off-Balance Sheet Arrangements
As of
December 31, 2017
and
2016
, we did not have any relationships with unconsolidated entities or financial partnerships, such as entities referred to as structured finance or special purpose entities, which would have been established for the purpose of facilitating off-balance sheet arrangements or other contractually narrow or limited purposes.
52
Our cash and cash equivalents as of
December 31, 2017
were
$36.0 million
. We do not invest in any short-term or long-term securities, nor do we hold any derivative financial instruments for trading or speculative purposes.
At
December 31, 2017
, we had
$199.4 million
of variable rate debt, inclusive of debt discounts and deferred charges, at a rate of LIBOR plus the applicable margin, or the prime rate plus the applicable margin. A 1.0% change in either the LIBOR rate, prime rate, or the applicable margin would result in a change in interest expense of approximately
$2.1 million
. For further details regarding the debt, rates or applicable margin, please refer to
“Part II; Item 8. Financial Statements and Supplementary Data; Notes to Consolidated Financial Statements; Note 10. Credit Agreement”
included in this Annual Report on Form 10-K.
53
Report of Independent Registered Public Accounting Firm
To the Stockholders and the Board of Directors of BioTelemetry, Inc.
Opinion on the Financial Statements
We have audited the accompanying consolidated balance sheets of BioTelemetry, Inc. (the Company) as of December 31, 2017 and 2016, and the related consolidated statements of operations and comprehensive income/(loss), cash flows and equity for each of the three years in the period ended December 31, 2017, and the related notes and the financial statement schedule listed in the Index at Item 15(a) (collectively referred to as the “financial statements”). In our opinion, the financial statements present fairly, in all material respects, the financial position of the Company at December 31, 2017 and 2016, and the results of its operations and its cash flows for each of the three years in the period ended December 31, 2017, in conformity with U.S. generally accepted accounting principles.
We also have audited, in accordance with the standards of the Public Company Accounting Oversight Board (United States) (PCAOB), the Company’s internal control over financial reporting as of December 31, 2017, based on criteria established in Internal Control-Integrated Framework issued by the Committee of Sponsoring Organizations of the Treadway Commission (2013 framework) and our report dated
February 26, 2018
expressed an unqualified opinion thereon.
Adoption of New Accounting Standard
As discussed in Note 2 to the consolidated financial statements, the Company changed its method of accounting for share-based payments to employees as a result of the adoption of the amendments to the FASB Accounting Standards Codification resulting from Accounting Standards Update No. 2016-09, “Improvements to Employee Share-Based Payment Accounting,” in 2016 and 2017.
Basis for Opinion
These financial statements are the responsibility of the Company’s management. Our responsibility is to express an opinion on the Company’s financial statements based on our audits. We are a public accounting firm registered with the PCAOB and are required to be independent with respect to the Company in accordance with U.S. federal securities laws and the applicable rules and regulations of the Securities and Exchange Commission and the PCAOB.
We conducted our audits in accordance with the standards of the PCAOB. Those standards require that we plan and perform the audit to obtain reasonable assurance about whether the financial statements are free of material misstatement, whether due to error or fraud. Our audits included performing procedures to assess the risks of material misstatement of the financial statements, whether due to error or fraud, and performing procedures to respond to those risks. Such procedures included examining, on a test basis, evidence regarding the amounts and disclosures in the financial statements. Our audits also included evaluating the accounting principles used and significant estimates made by management, as well as evaluating the overall presentation of the financial statements. We believe that our audits provide a reasonable basis for our opinion.
54
|
/s/ ERNST & YOUNG LLP
|
|
|
We have served as BioTelemetry Inc.’s auditors since 2004.
|
|
|
Philadelphia, Pennsylvania
|
|
|
February 26, 2018
|
|
55
|
December 31,
|
|||||||
|
(In thousands, except shares and par value)
|
2017
|
2016
|
|||||
|
Assets
|
|||||||
|
Current assets:
|
|||||||
|
Cash and cash equivalents
|
$
|
36,022
|
|
$
|
23,052
|
|
|
|
Healthcare accounts receivable, net of allowance for doubtful accounts of $15,556 and $12,198 at December 31, 2017 and 2016, respectively
|
25,190
|
|
14,594
|
|
|||
|
Other accounts receivable, net of allowance for doubtful accounts of $1,425 and $665 at December 31, 2017 and 2016, respectively
|
13,296
|
|
12,261
|
|
|||
|
Inventory
|
5,332
|
|
5,176
|
|
|||
|
Prepaid expenses and other current assets
|
10,268
|
|
4,477
|
|
|||
|
Total current assets
|
90,108
|
|
59,560
|
|
|||
|
Property and equipment, net
|
49,194
|
|
25,823
|
|
|||
|
Intangible assets, net
|
141,707
|
|
33,472
|
|
|||
|
Goodwill
|
223,105
|
|
41,068
|
|
|||
|
Deferred tax asset
|
17,681
|
|
36,636
|
|
|||
|
Other assets
|
2,767
|
|
2,425
|
|
|||
|
Total assets
|
$
|
524,562
|
|
$
|
198,984
|
|
|
|
Liabilities and Equity
|
|||||||
|
Current liabilities:
|
|||||||
|
Accounts payable
|
13,227
|
|
12,425
|
|
|||
|
Accrued liabilities
|
27,357
|
|
13,698
|
|
|||
|
Current portion of capital leases obligations
|
4,023
|
|
162
|
|
|||
|
Current portion of long-term debt
|
2,050
|
|
1,250
|
|
|||
|
Deferred revenue
|
4,298
|
|
3,972
|
|
|||
|
Total current liabilities
|
50,955
|
|
31,507
|
|
|||
|
Long-term portion of capital lease obligations
|
1,486
|
|
126
|
|
|||
|
Long-term debt
|
197,306
|
|
23,911
|
|
|||
|
Other long-term liabilities
|
25,112
|
|
4,526
|
|
|||
|
Total liabilities
|
274,859
|
|
60,070
|
|
|||
|
Stockholders’ equity:
|
|||||||
|
Common stock—$.001 par value as of December 31, 2017 and 2016; 200,000,000 shares authorized as of December 31, 2017 and 2016; 32,460,668 and 28,261,503 shares issued and outstanding at December 31, 2017 and 2016, respectively
|
32
|
|
28
|
|
|||
|
Paid-in capital
|
409,517
|
|
281,642
|
|
|||
|
Accumulated other comprehensive loss
|
(114
|
)
|
(34
|
)
|
|||
|
Accumulated deficit
|
(158,678
|
)
|
(142,722
|
)
|
|||
|
Total BioTelemetry, Inc.’s stockholders’ equity
|
250,757
|
|
138,914
|
|
|||
|
Noncontrolling interests
|
(1,054
|
)
|
—
|
|
|||
|
Total equity
|
249,703
|
|
138,914
|
|
|||
|
Total liabilities and equity
|
$
|
524,562
|
|
$
|
198,984
|
|
|
See accompanying Notes to Consolidated Financial Statements.
56
BIOTELEMETRY, INC.
CONSOLIDATED STATEMENTS OF OPERATIONS AND COMPREHENSIVE INCOME/(LOSS)
|
Year Ended December 31,
|
|||||||||||
|
(In thousands, except per share amounts)
|
2017
|
2016
|
2015
|
||||||||
|
Revenue:
|
|||||||||||
|
Healthcare
|
$
|
234,385
|
|
$
|
165,664
|
|
$
|
145,963
|
|
||
|
Research
|
38,790
|
|
32,565
|
|
21,853
|
|
|||||
|
Technology
|
13,601
|
|
10,103
|
|
10,697
|
|
|||||
|
Total revenue
|
286,776
|
|
208,332
|
|
178,513
|
|
|||||
|
Cost of revenue:
|
|||||||||||
|
Healthcare
|
81,356
|
|
53,559
|
|
51,693
|
|
|||||
|
Research
|
22,881
|
|
18,395
|
|
12,728
|
|
|||||
|
Technology
|
10,169
|
|
6,928
|
|
7,535
|
|
|||||
|
Total cost of revenue
|
114,406
|
|
78,882
|
|
71,956
|
|
|||||
|
Gross profit
|
172,370
|
|
129,450
|
|
106,557
|
|
|||||
|
Operating expenses:
|
|||||||||||
|
General and administrative
|
82,983
|
|
55,877
|
|
47,882
|
|
|||||
|
Sales and marketing
|
35,322
|
|
28,636
|
|
27,936
|
|
|||||
|
Bad debt expense
|
13,291
|
|
9,931
|
|
8,047
|
|
|||||
|
Research and development
|
11,101
|
|
8,355
|
|
7,111
|
|
|||||
|
Other charges
|
31,436
|
|
8,639
|
|
6,063
|
|
|||||
|
Total operating expenses
|
174,133
|
|
111,438
|
|
97,039
|
|
|||||
|
Income/(loss) from operations
|
(1,763
|
)
|
18,012
|
|
9,518
|
|
|||||
|
Other expense:
|
|||||||||||
|
Interest expense
|
(4,897
|
)
|
(1,830
|
)
|
(1,534
|
)
|
|||||
|
Loss on extinguishment of debt
|
(543
|
)
|
—
|
|
—
|
|
|||||
|
Loss on equity method investment
|
(384
|
)
|
(287
|
)
|
—
|
|
|||||
|
Other non-operating expense, net
|
(2,809
|
)
|
(125
|
)
|
(88
|
)
|
|||||
|
Total other expense
|
(8,633
|
)
|
(2,242
|
)
|
(1,622
|
)
|
|||||
|
Income/(loss) before income taxes
|
(10,396
|
)
|
15,770
|
|
7,896
|
|
|||||
|
(Provision for)/benefit from income taxes
|
(6,747
|
)
|
37,667
|
|
(468
|
)
|
|||||
|
Net income/(loss)
|
(17,143
|
)
|
53,437
|
|
7,428
|
|
|||||
|
Net loss attributable to noncontrolling interests
|
(1,187
|
)
|
—
|
|
—
|
|
|||||
|
Net income/(loss) attributable to BioTelemetry, Inc.
|
$
|
(15,956
|
)
|
$
|
53,437
|
|
$
|
7,428
|
|
||
|
Other comprehensive income/(loss):
|
|||||||||||
|
Foreign currency translation loss
|
(80
|
)
|
(22
|
)
|
(12
|
)
|
|||||
|
Comprehensive income/(loss) attributable to BioTelemetry, Inc.
|
$
|
(16,036
|
)
|
$
|
53,415
|
|
$
|
7,416
|
|
||
|
Net income/(loss) per common share attributable to BioTelemetry, Inc.:
|
|||||||||||
|
Basic
|
$
|
(0.53
|
)
|
$
|
1.91
|
|
$
|
0.27
|
|
||
|
Diluted
|
$
|
(0.53
|
)
|
$
|
1.75
|
|
$
|
0.26
|
|
||
|
Weighted average number of common shares outstanding:
|
|||||||||||
|
Basic
|
30,386
|
|
27,920
|
|
27,116
|
|
|||||
|
Dilutive stock options and restricted stock units
|
—
|
|
2,569
|
|
1,973
|
|
|||||
|
Diluted
|
30,386
|
|
30,489
|
|
29,089
|
|
|||||
|
Anti-dilutive stock options and restricted stock units excluded from weighted average calculation
|
463
|
|
380
|
|
1,103
|
|
|||||
See accompanying Notes to Consolidated Financial Statements.
57
|
Year Ended December 31,
|
|||||||||||
|
(in thousands)
|
2017
|
2016
|
2015
|
||||||||
|
Operating activities
|
|||||||||||
|
Net income/(loss)
|
$
|
(17,143
|
)
|
$
|
53,437
|
|
$
|
7,428
|
|
||
|
Adjustments to reconcile net income/(loss) to net cash provided by operating activities:
|
|||||||||||
|
Bad debt expense
|
13,291
|
|
9,931
|
|
8,047
|
|
|||||
|
Depreciation
|
18,337
|
|
10,547
|
|
8,987
|
|
|||||
|
Amortization of intangibles
|
10,224
|
|
3,722
|
|
3,501
|
|
|||||
|
Impairment charge
|
12,045
|
|
—
|
|
—
|
|
|||||
|
Stock-based compensation
|
7,680
|
|
6,502
|
|
4,952
|
|
|||||
|
Equity method investment loss
|
384
|
|
287
|
|
—
|
|
|||||
|
Change in fair value of acquisition-related contingent consideration
|
(2,605
|
)
|
—
|
|
—
|
|
|||||
|
Write off of derivative premium
|
1,322
|
|
—
|
|
—
|
|
|||||
|
Accretion of debt discount and amortization of deferred charges
|
678
|
|
217
|
|
259
|
|
|||||
|
Loss on extinguishment of debt
|
543
|
|
—
|
|
—
|
|
|||||
|
Non-cash gain on legal settlement
|
(1,333
|
)
|
—
|
|
—
|
|
|||||
|
Non-cash lease (income)/expense
|
(423
|
)
|
170
|
|
(14
|
)
|
|||||
|
Non-cash tax (benefit)/expense
|
6,050
|
|
(38,141
|
)
|
245
|
|
|||||
|
Changes in operating assets and liabilities:
|
|||||||||||
|
Healthcare and other accounts receivable
|
(15,455
|
)
|
(8,707
|
)
|
(7,677
|
)
|
|||||
|
Inventory
|
665
|
|
(753
|
)
|
188
|
|
|||||
|
Prepaid expenses and other assets
|
(694
|
)
|
(1,050
|
)
|
(3
|
)
|
|||||
|
Accounts payable
|
(9,622
|
)
|
3,145
|
|
(4,699
|
)
|
|||||
|
Accrued and other liabilities
|
(162
|
)
|
(456
|
)
|
(464
|
)
|
|||||
|
Liability associated with the Civil Investigative Demand
|
—
|
|
—
|
|
(6,400
|
)
|
|||||
|
Net cash provided by operating activities
|
23,782
|
|
38,851
|
|
14,350
|
|
|||||
|
Investing activities
|
|||||||||||
|
Acquisition of businesses, net of cash acquired
|
(161,479
|
)
|
(24,970
|
)
|
—
|
|
|||||
|
Purchases of property and equipment and investment in internally developed software
|
(13,697
|
)
|
(10,899
|
)
|
(13,600
|
)
|
|||||
|
Purchase of derivative instrument
|
(1,322
|
)
|
—
|
|
—
|
|
|||||
|
Investment in equity method investee
|
(690
|
)
|
(312
|
)
|
—
|
|
|||||
|
Net cash used in investing activities
|
(177,188
|
)
|
(36,181
|
)
|
(13,600
|
)
|
|||||
|
Financing activities
|
|||||||||||
|
Proceeds related to the exercising of stock options and employee stock purchase plan
|
6,071
|
|
2,519
|
|
1,222
|
|
|||||
|
Tax payments related to the vesting of shares
|
(1,933
|
)
|
(2,333
|
)
|
(1,575
|
)
|
|||||
|
Issuance of long-term debt
|
205,000
|
|
—
|
|
—
|
|
|||||
|
Borrowings under revolving loans
|
—
|
|
14,500
|
|
—
|
|
|||||
|
Principal payments on revolving loans
|
(3,000
|
)
|
(11,500
|
)
|
—
|
|
|||||
|
Payment of debt issuance costs
|
(6,213
|
)
|
—
|
|
—
|
|
|||||
|
Principal payments on long-term debt
|
(25,840
|
)
|
(1,438
|
)
|
(938
|
)
|
|||||
|
Principal payments on capital lease obligations
|
(2,863
|
)
|
(321
|
)
|
(480
|
)
|
|||||
|
Acquisition of noncontrolling interests
|
(4,765
|
)
|
—
|
|
—
|
|
|||||
|
Net cash provided by/(used in) financing activities
|
166,457
|
|
1,427
|
|
(1,771
|
)
|
|||||
|
Effect of exchange rate changes on cash
|
(81
|
)
|
(31
|
)
|
—
|
|
|||||
|
Net increase/(decrease) in cash and cash equivalents
|
12,970
|
|
4,066
|
|
(1,021
|
)
|
|||||
|
Cash and cash equivalents—beginning of period
|
23,052
|
|
18,986
|
|
20,007
|
|
|||||
|
Cash and cash equivalents—end of period
|
$
|
36,022
|
|
$
|
23,052
|
|
$
|
18,986
|
|
||
|
Supplemental disclosure of cash flow information
|
|||||||||||
|
Non-cash purchases of property and equipment
|
$
|
498
|
|
$
|
—
|
|
$
|
—
|
|
||
|
Non-cash fair value of common stock returned in legal settlement
|
2,753
|
|
—
|
|
—
|
|
|||||
|
Non-cash fair value of equity issued for acquisition of business
|
117,440
|
|
2,885
|
|
—
|
|
|||||
|
Cash paid for interest
|
3,888
|
|
1,273
|
|
1,044
|
|
|||||
|
Cash paid for taxes
|
$
|
1,648
|
|
$
|
359
|
|
$
|
384
|
|
||
See accompanying Notes to Consolidated Financial Statements.
58
|
BioTelemetry, Inc. Equity
|
||||||||||||||||||||||||||
|
Accumulated
Other
Comprehensive
Income/(Loss)
|
||||||||||||||||||||||||||
|
Common Stock
|
Paid-in
Capital
|
Accumulated
Deficit
|
Noncontrolling Interests
|
Total
Equity
|
||||||||||||||||||||||
|
(in thousands, except shares)
|
Shares
|
Amount
|
||||||||||||||||||||||||
|
Balance December 31, 2014
|
26,693,248
|
|
$
|
27
|
|
$
|
267,236
|
|
$
|
—
|
|
$
|
(203,587
|
)
|
$
|
—
|
|
$
|
63,676
|
|
||||||
|
Share issuances related to stock compensation plans
|
719,564
|
|
—
|
|
1,222
|
|
—
|
|
—
|
|
—
|
|
1,222
|
|
||||||||||||
|
Stock-based compensation
|
—
|
|
—
|
|
4,952
|
|
—
|
|
—
|
|
—
|
|
4,952
|
|
||||||||||||
|
Shares withheld to cover taxes on vesting of share based awards
|
(167,090
|
)
|
—
|
|
(1,575
|
)
|
—
|
|
—
|
|
—
|
|
(1,575
|
)
|
||||||||||||
|
Issuance of stock related to business combinations
|
32,217
|
|
—
|
|
235
|
|
—
|
|
—
|
|
—
|
|
235
|
|
||||||||||||
|
Currency translation adjustment
|
—
|
|
—
|
|
—
|
|
(12
|
)
|
—
|
|
—
|
|
(12
|
)
|
||||||||||||
|
Net income
|
—
|
|
—
|
|
—
|
|
—
|
|
7,428
|
|
—
|
|
7,428
|
|
||||||||||||
|
Balance December 31, 2015
|
27,277,939
|
|
27
|
|
272,070
|
|
(12
|
)
|
(196,159
|
)
|
—
|
|
75,926
|
|
||||||||||||
|
Share issuances related to stock compensation plans
|
917,912
|
|
1
|
|
2,518
|
|
—
|
|
—
|
|
—
|
|
2,519
|
|
||||||||||||
|
Stock-based compensation
|
—
|
|
—
|
|
6,502
|
|
—
|
|
—
|
|
—
|
|
6,502
|
|
||||||||||||
|
Shares withheld to cover taxes on vesting of share based awards
|
(178,867
|
)
|
—
|
|
(2,333
|
)
|
—
|
|
—
|
|
—
|
|
(2,333
|
)
|
||||||||||||
|
Issuance of stock related to 2014 business combination
|
244,519
|
|
—
|
|
2,885
|
|
—
|
|
—
|
|
—
|
|
2,885
|
|
||||||||||||
|
Currency translation adjustment
|
—
|
|
—
|
|
—
|
|
(22
|
)
|
—
|
|
—
|
|
(22
|
)
|
||||||||||||
|
Net income
|
—
|
|
—
|
|
—
|
|
—
|
|
53,437
|
|
—
|
|
53,437
|
|
||||||||||||
|
Balance December 31, 2016
|
28,261,503
|
|
28
|
|
281,642
|
|
(34
|
)
|
(142,722
|
)
|
—
|
|
138,914
|
|
||||||||||||
|
Share issuances related to stock compensation plans
|
722,441
|
|
—
|
|
6,071
|
|
—
|
|
—
|
|
—
|
|
6,071
|
|
||||||||||||
|
Stock-based compensation
|
—
|
|
—
|
|
7,680
|
|
—
|
|
—
|
|
—
|
|
7,680
|
|
||||||||||||
|
Shares withheld to cover taxes on vesting of share based awards
|
(79,589
|
)
|
—
|
|
(1,933
|
)
|
—
|
|
—
|
|
—
|
|
(1,933
|
)
|
||||||||||||
|
Issuance of stock related to business combination
|
3,615,840
|
|
4
|
|
116,788
|
|
—
|
|
—
|
|
11,224
|
|
128,016
|
|
||||||||||||
|
Acquisition of noncontrolling interest
|
19,806
|
|
—
|
|
2,022
|
|
—
|
|
—
|
|
(11,091
|
)
|
(9,069
|
)
|
||||||||||||
|
Common stock returned in legal settlement
|
(79,333
|
)
|
—
|
|
(2,753
|
)
|
—
|
|
—
|
|
—
|
|
(2,753
|
)
|
||||||||||||
|
Currency translation adjustment
|
—
|
|
—
|
|
—
|
|
(80
|
)
|
—
|
|
—
|
|
(80
|
)
|
||||||||||||
|
Net loss
|
—
|
|
—
|
|
—
|
|
—
|
|
(15,956
|
)
|
(1,187
|
)
|
(17,143
|
)
|
||||||||||||
|
Balance December 31, 2017
|
32,460,668
|
|
$
|
32
|
|
$
|
409,517
|
|
$
|
(114
|
)
|
$
|
(158,678
|
)
|
$
|
(1,054
|
)
|
$
|
249,703
|
|
||||||
See accompanying Notes to Consolidated Financial Statements.
59
1. Organization and Description of Business
BioTelemetry, Inc. (“BioTelemetry,” “Company,” “we,” “our” or “us”), a Delaware corporation, provides monitoring services and digital population health management for healthcare providers, medical device manufacturing and centralized core laboratory services for clinical research.
We operate under
three
reportable segments: (1) Healthcare, (2) Research and (3) Technology. The Healthcare segment is focused on the diagnosis and monitoring of cardiac arrhythmias, or heart rhythm disorders. We offer cardiologists and electrophysiologists, neurologists and primary care physicians a full spectrum of solutions which provides them with a single source of cardiac monitoring services. These services range from the differentiated mobile cardiac telemetry service (“MCT”), to event, traditional Holter, extended-wear Holter, Pacemaker and International Normalized Ratio (“INR”) monitoring. Since we became focused on cardiac monitoring in 1999, we have developed a proprietary integrated patient management platform that incorporates a wireless data transmission network, U.S. Food and Drug Administration (“FDA”) cleared algorithms, medical devices and 24-hour monitoring service centers. The Research segment is engaged in central core laboratory services providing cardiac monitoring, imaging services, scientific consulting and data management services for drug and medical device trials. The Technology segment focuses on the development, manufacturing, testing and marketing of cardiovascular and blood glucose monitoring devices to medical companies, clinics and hospitals.
We have grown both organically and through recent acquisitions:
|
•
|
On July 12, 2017, we acquired approximately
97%
of the outstanding shares of LifeWatch AG (“LifeWatch”). On that date, we acquired control of LifeWatch and began consolidating its financial statements. In September 2017, we purchased
343,525
additional shares of LifeWatch for cash consideration of
$4.8 million
and the issuance of
19,806
of our shares with a fair value of
$0.6 million
. We completed the acquisition of the remaining shares in December 2017, for aggregate consideration of
$2.9 million
in cash and
58,786
shares with a fair market value of
$2.0 million
which was settled in early January 2018. LifeWatch is included in the Healthcare segment.
|
|
•
|
On December 1, 2016, we acquired the stock of Telcare Medical Supply, Inc. and certain assets of Telcare Inc. (collectively, “Telcare”). Telcare is included in the Technology segment.
|
|
•
|
On May 11, 2016, we acquired VirtualScopics, Inc. (“VirtualScopics”), a leading provider of clinical trial imaging solutions. VirtualScopics is included in the Research segment.
|
|
•
|
On April 1, 2016, we acquired substantially all of the assets of the ePatch division (“ePatch”) of DELTA Danish Electronics, Light, and Acoustics (“DELTA”), inclusive of all products and indications under development. ePatch is included in the Technology segment.
|
For further details related to our recent acquisitions, please see
“Note 3. Acquisitions”
below.
Our common stock is traded on the NASDAQ Global Select Market under our symbol “BEAT.”
60
2. Summary of Significant Accounting Policies
a) Principles of Consolidation & Reclassifications
The accompanying consolidated financial statements have been prepared in accordance with U.S. generally accepted accounting principles (“U.S. GAAP”) and include the accounts of BioTelemetry and its wholly owned subsidiaries. All intercompany transactions and balances have been eliminated in consolidation.
Certain reclassifications have been made to prior period statements to conform to the current period presentation. These consist of:
|
•
|
disaggregating the components of other expense in the consolidated statements of operations,
|
|
•
|
disaggregating the equity method investment loss from the change in prepaid expenses and other assets in the consolidated statements of cash flows,
|
|
•
|
reclassifying research and development costs from the Corporate and Other segment to the Healthcare segment in our segment information disclosures.
|
The reclassifications had no impact on previously reported consolidated net income/(loss), cash flows or accumulated deficit.
b) Use of Estimates
The preparation of consolidated financial statements in conformity with U.S. GAAP requires that management make estimates and assumptions that affect the reported amounts of assets and liabilities and disclosures of contingent assets and liabilities at the date of the consolidated financial statements and the reported amounts of revenue and expenses during the reporting period. Actual results may differ from those estimates.
c) Fair Value of Financial Instruments
Fair value is defined as the exit price, the price that would be received to sell an asset or transfer a liability in an orderly transaction between market participants at the measurement date. The fair value hierarchy prioritizes the inputs to valuation techniques used to measure fair value into three broad levels, as defined below. Observable inputs are inputs a market participant would use in valuing an asset or liability based on market data obtained from sources independent of us. Unobservable inputs are inputs that reflect our own assumptions about the factors a market participant would use in valuing an asset or liability developed using the best information available in the circumstances. The classification of an asset’s or liability’s level within the fair value hierarchy is determined based on the lowest level input that is significant to the fair value measurement.
|
Level 1 -
|
Quoted prices in active markets for an identical asset or liability.
|
|
Level 2 -
|
Inputs that are observable for the asset or liability, either directly or indirectly through market corroboration, for substantially the full term of the asset or liability.
|
|
Level 3 -
|
Inputs that are unobservable for the asset or liability, based on our own assumptions about the assumptions a market participant would use in pricing the asset or liability.
|
61
Our financial instruments consist primarily of cash and cash equivalents, Healthcare accounts receivable, other accounts receivable, accounts payable, contingent consideration, short-term debt and long-term debt. With the exception of the contingent consideration and long-term debt, the carrying value of these financial instruments approximates their fair value because of their short-term nature (classified as Level 1).
Our long-term debt (classified as Level 2) is measured using market prices for similar instruments, inputs such as the borrowing rates currently available, benchmark yields, actual trade data, broker/dealer quotes and other similar data obtained from quoted market prices or independent pricing vendors.
The fair value of contingent consideration (classified as Level 3) is measured on a recurring basis using unobservable inputs such as projected payment dates, probabilities of meeting specified milestones and other such variables resulting in payment amounts which are discounted back to present value using a probability-weighted discounted cash flow model. Adjustments to contingent consideration are recorded in other charges in the consolidated statements of operations and comprehensive income/(loss).
In addition to the recurring fair value measurements, the fair value of certain assets acquired and liabilities assumed in connection with a business combination are recorded at fair value primarily, using a discounted cash flow model (classified as Level 3). This valuation technique requires us to make certain assumptions, including, but not limited to, future operating performance and cash flows, royalty rate and other such variables which are discounted to present value using a discount rate that reflects the risk factors associated with future cash flow, the characteristics of the assets acquired and liabilities assumed and the experience of the acquired business. Non-financial assets such as goodwill, intangible assets, and property, plant, and equipment are subsequently measured at fair value when there is an indicator of impairment and recorded at fair value only when an impairment is recognized. We assess the impairment of intangible assets annually or whenever events or changes in circumstances indicate that the carrying amount of an intangible asset may not be recoverable.
d) Cash and Cash Equivalents
Cash and cash equivalents are held in financial institutions or in custodial accounts with financial institutions. Cash equivalents are defined as liquid investments and money market funds with maturity from date of purchase of 90 days or less that are readily convertible into cash and have minimal interest rate risk.
e) Accounts Receivable and Allowance for Doubtful Accounts
Healthcare accounts receivable is related to the Healthcare segment and is recorded at the time revenue is recognized, net of contractual allowances, and is presented on the consolidated balance sheet net of an allowance for doubtful accounts. The ultimate collection of accounts receivable may not be known for several months after services have been provided and billed. The percentages and amounts used to record bad debt expense and the allowance for doubtful accounts are supported by various methods and analyses, including current and historical cash collections and the aging of receivables by payor. Because of continuing changes in the health care industry and third-party reimbursement, it is possible that our estimates of collectability could change, which could have a material impact on our operations and cash flows.
Other accounts receivable is related to the Technology and Research segments and is recorded at the time revenue is recognized, or when products are shipped or services are performed. We estimate an
62
allowance for doubtful accounts on a specific account basis, and consider several factors in our analysis including customer specific information and the aging of the account.
We write-off receivables when the likelihood for collection is remote and when we believe collection efforts have been fully exhausted and we do not intend to devote additional resources in attempting to collect. We perform write-offs on a monthly basis. In the Healthcare segment, we wrote-off
$8.8 million
and
$8.4 million
of receivables for the years ended
December 31, 2017
and
2016
, respectively. The impact was a reduction of gross accounts receivable and a reduction in the allowance for doubtful accounts. There were
no
material write-offs in the Technology and Research segments. Additionally, we recorded bad debt expense of
$13.3 million
,
$9.9 million
and
$8.0 million
for the years ended
December 31, 2017
,
2016
and
2015
, respectively.
f) Concentrations of Credit Risk
Financial instruments that potentially subject us to concentrations of credit risk consist primarily of cash, cash equivalents, Healthcare accounts receivables and other accounts receivables. We maintain our cash and cash equivalents with high quality financial institutions to mitigate this risk. We perform ongoing credit evaluations of our customers and generally do not require collateral. We record an allowance for doubtful accounts in accordance with the procedures described above. Past-due amounts are written-off against the allowance for doubtful accounts when collections are believed to be unlikely and all collection efforts have ceased.
At
December 31, 2017
,
2016
and
2015
,
one
payor, Medicare, accounted for
21%
,
11%
and
13%
, respectively, of our gross accounts receivable.
g) Inventory
Inventory is valued at the lower of cost (using first-in, first-out cost method) or market (net realizable value or replacement cost). Management reviews inventory for specific future usage, and estimates of impairment of individual inventory items are recorded to reduce inventory to the lower of cost or market.
h) Property and Equipment
Property and equipment is recorded at cost, except for assets acquired in business combinations, which are recorded at fair value as of the acquisition date. Depreciation is recorded over the estimated useful life of each class of depreciable assets, and is computed using the straight-line method. Leasehold improvements are amortized over the shorter of the estimated asset life or term of the lease. Repairs and maintenance costs are charged to expense as incurred. Costs of additions and improvements are capitalized.
i) Impairment of Long-Lived Assets
The carrying value of long-lived assets, other than goodwill and indefinite-lived intangible assets, is evaluated when events or changes in circumstances indicate the carrying value may not be recoverable or the useful life has changed. We consider historical performance and anticipated future results in our evaluation of potential impairment. Accordingly, when indicators of impairment are present, we evaluate the carrying value of these assets in relation to the operating performance of the business and the undiscounted cash flows expected to result from the use of these assets. If the carrying amount of a long-lived asset exceeds its expected undiscounted cash flows, an impairment charge is recognized to the extent the carrying amount exceeds its fair value.
63
j) Derivative Instruments
During the second quarter of 2017, we purchased a foreign currency option with a notional value of
$194.2 million
to mitigate the foreign exchange risk related to the Swiss Franc denominated purchase price of LifeWatch. This derivative instrument was not designated as a hedge for accounting purposes. We did not exercise this option and the contract expired during the third quarter of 2017, resulting in a charge of
$1.3 million
, which was recorded as a component of other non-operating income/(expense), net in the consolidated statements of operations and comprehensive income/(loss).
k) Equity Method Investments
We account for investments using the equity method of accounting if the investment provides us the ability to exercise significant influence, but not control, over the investee. Significant influence is generally deemed to exist if our ownership interest in the voting stock of the investee ranges between 20% and 50%, although other factors, such as representation on the investee’s board of directors, are considered in determining whether the equity method of accounting is appropriate. Under the equity method of accounting, the investment is recorded at cost in the consolidated balance sheets under other assets and is periodically adjusted for capital contributions, dividends received and our share of the investee’s earnings or losses together with other-than-temporary impairments which are recorded through loss on equity method investment in the consolidated statements of operations and comprehensive income/(loss).
l) Noncontrolling Interest
The consolidated financial statements reflect the application of ASC 810, Consolidations, which establishes accounting and reporting standards that require: (i) the ownership interest in subsidiaries held by parties other than the parent to be clearly identified and presented in the consolidated balance sheet within stockholder’s equity, but separate from the parent’s equity; (ii) the amount of consolidated net income attributable to the parent and the noncontrolling interest to be clearly identified and presented on the face of the consolidated statements of income; and (iii) changes in a parent’s ownership interest while the parent retains its controlling financial interest in its subsidiary to be accounted for consistently.
We acquired approximately
97%
of LifeWatch on July 12, 2017. On that date, we acquired control of LifeWatch and began consolidating its financial statements. As of
December 31, 2017
, we owned
100%
of LifeWatch.
LifeWatch owns
55%
of LifeWatch Turkey Holding AG (“LifeWatch Turkey,” domiciled in Switzerland), with their partner, IKSIR TEKNOLOJI SAGLIK VE KIMYA SAN. ve TIC. A.S., a company located in Ankara, Turkey, to provide digital health solutions to the Turkish market. Concurrent with our acquisition of LifeWatch, we acquired control of LifeWatch Turkey and began consolidating their financial statements. As of
December 31, 2017
, LifeWatch Turkey’s net assets were
$3.6 million
and their loss since July 12, 2017 was
$2.3 million
.
Amounts pertaining to the noncontrolling ownership interest of LifeWatch Turkey held by third parties in our operating results are combined and reported as noncontrolling interests in the accompanying consolidated financial statements.
m) Goodwill and Acquired Intangible Assets
Goodwill is the excess of the purchase price of an acquired business over the amounts assigned to assets acquired and liabilities assumed in a business combination. In accordance with
ASC 350, Intangibles
64
— Goodwill and Other
(“ASC 350”), goodwill is reviewed for impairment annually, or when events arise that could indicate that an impairment exists. Initially, we qualitatively assess whether it is more-likely-than-not that an impairment exists for each of our reporting units. Such qualitative factors can include, among others, industry and market conditions, present and anticipated sales and cost factors, overall financial performance and relevant entity-specific events. If we conclude based on our qualitative assessment that it is more-likely-than-not that the fair value of a reporting unit is less than its carrying value, we perform an impairment test in accordance with ASC 350. We compare the fair value of our reporting units to their carrying value. If the reporting unit’s carrying value exceeds its fair value, an impairment loss equal to the difference is recognized. The loss recognized shall not exceed the total amount of goodwill allocated to the reporting unit, and the income tax effects from any deductible goodwill on the carrying value of the reporting unit when measuring the goodwill impairment loss, if any, are considered.
For the purpose of performing our goodwill impairment analysis, we consider our business to be composed of
three
reporting units: Healthcare, Technology and Research. When performing a quantitative analysis, we calculate the fair value of the reporting units utilizing a weighting of the income and market approaches. The income approach is based on a discounted cash flow methodology that includes assumptions for, among other things, forecasted income, cash flow, growth rates, income tax rates, expected tax benefits and long-term discount rates, all of which require significant judgment. The market approach utilizes our market data as well as market data from publicly-traded companies that are similar to us. There are inherent uncertainties related to these factors and the judgment applied in the analysis. We believe that the combination of an income and a market approach provides a reasonable basis to estimate the fair value of our reporting units.
Acquired intangible assets are recorded at fair value on the acquisition date. The estimated fair values and useful lives of intangible assets are determined by assessing many factors including estimates of future operating performance and cash flows of the acquired business, the characteristics of the intangible assets and the experience of the acquired business. Independent appraisal firms may assist with the valuation of acquired assets. The impairment test for indefinite-lived intangible assets other than goodwill consists of a comparison of the fair value of the indefinite-lived intangible asset to the carrying value of the asset. We used a qualitative approach to determine impairment for our indefinite-lived as well as for our amortizable intangible assets.
n) Revenue Recognition
We recognize approximately
81%
of our total revenue from patient monitoring services in our Healthcare segment. We receive a significant portion of this revenue from third-party commercial payors and governmental entities. We also receive reimbursement directly from patients through co-pays, deductibles and self-pay arrangements. Revenue from the Medicare program is based on reimbursement rates set by CMS. For the years ended
December 31, 2017
,
2016
and
2015
, revenue from Medicare as a percentage of total revenue was
34%
,
33%
and
34%
, respectively. Revenue from contracted commercial payors is recorded at the negotiated contractual rate. Revenue from non-contracted commercial payors is recorded at net realizable value based on historical payment patterns. Adjustments to the estimated net realizable value, based on final settlement with the third-party payors, are recorded upon settlement. If we do not have consistent historical information regarding collectability from a given payor, revenue is recognized when cash is received. Unearned amounts are appropriately deferred until service has been completed. For the years ended
December 31, 2017
and
2016
, deferred revenues related to the Healthcare segment were
$2.4 million
and
$1.1 million
, respectively; none of these deferred revenues were refundable.
65
Research revenue includes revenue for core laboratory services. Our Research revenue is provided on a fee-for-service basis, and revenue is recognized as the related services are performed. We also provide consulting services on a time and materials basis and recognize revenue as we perform the services. Our site support revenue, consisting of equipment rentals and sales along with related supplies and logistics management, are recognized at the time of sale or over the rental period. Under a typical contract, customers pay us a portion of our fee for these services upon contract execution as an upfront deposit. Unearned revenue, including upfront deposits, are deferred, and then recognized as the services are performed. For the years ended
December 31, 2017
and
2016
, deferred revenues related to the Research segment were
$4.2 million
and
$2.7 million
, respectively; these deferred revenues were refundable.
Revenue in our Technology segment is received from the sale of products, product repair and supplies which are recognized when shipped, or as service is completed. Deferred revenues related to our Technology segment were immaterial for the years ended
December 31, 2017
and
2016
.
For arrangements with multiple deliverables, the revenue is allocated to each element (both delivered and undelivered items) based on their relative selling prices or management’s best estimate of their selling prices, when vendor-specific or third-party evidence is unavailable.
We record reimbursements received for out-of-pocket expenses, including freight, incurred as revenue in the accompanying consolidated statements of operations and comprehensive income (loss). Revenue generally is recognized net of any taxes collected from customers and subsequently remitted to government authorities.
o) Stock-Based Compensation
ASC 718,
Compensation—Stock Compensation
(“ASC 718”), addresses the accounting for share-based payment transactions in which an enterprise receives employee services in exchange for: (i) equity instruments of the enterprise or (ii) liabilities that are based on the fair value of the enterprise’s equity instruments or that may be settled by the issuance of such equity instruments. ASC 718 requires that an entity measures the cost of equity-based service awards based on the grant-date fair value of the award and recognizes the cost of such awards over the requisite service period (generally, the vesting period of the award). ASC 718 requires that an entity measure the cost of liability-based service awards based on current fair value that is remeasured subsequently at each reporting date through the settlement date. The compensation expense associated with performance stock units is recognized over the period between when the performance conditions are deemed probable of achievement and when the awards are vested. We account for equity awards issued to non-employees in accordance with ASC 505-50,
Equity-Based Payments to Non-Employees
.
Stock-based compensation expense is only recognized for outstanding performance stock units (“PSUs”) where the performance conditions are deemed probable for achievement. For PSUs deemed probable for achievement, stock-based compensation expense is recognized ratably over the expected vesting period. Performance stock options (“PSOs”) are valued and stock-based compensation expense is only recognized once the performance conditions of the outstanding PSOs have been met.
We have historically recorded stock-based compensation expense based on the number of options or restricted stock units (“RSUs”) we expect to vest using our historical forfeiture experience and periodically update those forfeiture rates to apply to new grants. While we early adopted ASU 2016-09 in the year ended
December 31, 2016
, we have elected to continue to estimate forfeitures under the true-up
66
provision of ASC 718. We record additional expense if the actual forfeiture rate is lower than estimated, and record a recovery of prior expense if the actual forfeiture rate is higher than estimated.
We estimate the fair value of our options using the Black‑Scholes option valuation model. The Black‑Scholes option valuation model requires the use of certain subjective assumptions. The most significant of these assumptions are the estimates of the expected volatility of the market price of our stock and the expected term of the award. We base our estimates of expected volatility on the historical average of our stock price. The expected term represents the period of time that share‑based awards granted are expected to be outstanding. Other assumptions used in the Black‑Scholes option valuation model include the risk‑free interest rate and expected dividend yield. The risk‑free interest rate for periods pertaining to the contractual life of each option is based on the U.S. Treasury yield of a similar duration in effect at the time of grant. We have never paid, and do not expect to pay, dividends in the foreseeable future.
p) Research and Development Costs
Research and development costs are charged to expense as incurred.
q) Income Taxes
We account for income taxes under the liability method, as described in ASC 740, Income Taxes(“ASC 740”). Deferred income taxes are recognized for the tax consequences of temporary differences between the tax and financial statement reporting bases of assets and liabilities. When we determine that we will not be able to realize our deferred tax assets, we adjust the carrying value of the deferred tax asset through the valuation allowance.
We record uncertain tax positions in accordance with ASC 740 on the basis of a two-step process in which (i) we determine whether it is more likely than not that the tax positions will be sustained on the basis of the technical merits of the position and (ii) for those tax positions that meet the more-likely-than-not recognition threshold, we recognize the largest amount of tax benefit that is more than 50 percent likely to be realized upon ultimate settlement with the related tax authority.
On December 22, 2017, the Tax Cuts and Jobs Act (the “TCJA”) was enacted in the United States. The TCJA represents sweeping changes in U.S. tax law. Under ASC 740, the effects of changes in tax rates and laws on deferred tax balances are recognized in the period in which the new legislation is enacted. The total effect of tax law changes on deferred tax balances is recorded as a component of income tax expense.
In response to the TCJA, the Staff of the U.S. Securities and Exchange Commission issued Staff Accounting Bulletin No. 118 (“SAB 118”) to provide guidance to registrants in applying ASC 740 in connection with the TCJA. SAB 118 provides that in the period of enactment, the income tax effects of the TCJA may be reported as a provisional amount based on a reasonable estimate (to the extent a reasonable estimate can be determined), which would be subject to adjustment during a “measurement period.” The measurement period begins in the reporting period of the TCJA’s enactment and ends when a registrant has obtained, prepared, and analyzed the information that was needed in order to complete the accounting requirements under ASC 740. SAB 118 also describes supplemental disclosures that should accompany the provisional amounts. We have applied the guidance in SAB 118 to account for the financial accounting impacts of the TCJA as of December 31, 2017, and have provided the applicable supplemental disclosures in
“Note 16. Income Taxes”
below.
67
r) Net Income/(Loss) Per Share
We compute net income/(loss) per share in accordance with ASC 260, Earnings Per Share. Basic net income/(loss) per share is computed by dividing net income/(loss) by the weighted average number of common shares outstanding during the period. Diluted net income/(loss) per share is computed by giving effect to all potential dilutive common shares, including stock options and restricted stock units (“RSUs”), using the treasury stock method. Potentially dilutive common shares are not included in the weighted-average shares outstanding for determining net loss per share, as the result would be anti-dilutive.
Certain stock options, which are priced higher than the market price of our shares as of
December 31, 2017
,
2016
and
2015
would be anti-dilutive and therefore have been excluded from the weighted average shares used in computing diluted net income per share. These options could become dilutive in future periods. Similarly, certain recently granted RSUs are also excluded using the treasury stock method as their impact would be anti-dilutive.
s) Segment Information
ASC 280,
Segment Reporting
, establishes standards for reporting information regarding operating segments in annual financial statements. Operating segments are identified as components of an enterprise for which separate discrete financial information is available for evaluation by the chief operating decision maker, or decision-making group in making decisions on how to allocate resources and assess performance.
We report our business under
three
segments: Healthcare, Research and Technology. The Healthcare segment is focused on the monitoring of cardiac arrhythmias or heart rhythm disorders in a health care setting. The Research segment provides central core laboratory services in a research environment, which includes certain equipment rental and device sales. The Technology segment focuses on the development, manufacturing, testing and marketing of medical devices to medical companies, clinics and hospitals.
t) Recent Accounting Pronouncements
Accounting Pronouncements Recently Adopted
In March 2016, the Financial Accounting Standards Board (“FASB”) issued Accounting Standards Update (“ASU”) 2016-09,
Improvements to Employee Share-Based Payment Accounting
. The standard revises the accounting for certain aspects of share-based compensation arrangements and requires any excess tax benefits or tax deficiencies to be recorded directly in the income statement when such awards vest or settle. In addition, the cash flows related to any excess tax benefits will no longer be separately classified as a financing activity, but will rather be classified as an operating activity, along with all other income tax cash flows. The standard also makes certain changes to the way the treasury stock method is applied when calculating diluted net income per share, as well as allows for a policy election to account for forfeitures as they occur, rather than using the estimation method currently prescribed by ASC 718,
Compensation — Stock Compensation
(“ASC 718”). The standard is effective for annual and interim periods beginning after December 15, 2016, with early adoption permitted.
We elected to early adopt the standard during the fourth quarter of 2016. The standard requires the recognition of any pre-adoption date net operating loss (“NOL”) carryforwards from share-based compensation arrangements to be recognized on a modified retrospective basis, through an opening retained earnings adjustment on January 1, 2016. Any income tax effects from share-based compensation
68
arrangements arising after January 1, 2016 will be recognized prospectively in the income statement during the period of adoption.
Upon adoption, we recognized all previously unrecognized tax benefits which resulted in a cumulative-effect adjustment of
$1.8 million
to our accumulated deficit. These previously unrecognized tax benefits were recorded as a deferred tax asset, which was fully offset by a valuation allowance on January 1, 2016, thus there was no net impact from the adoption of ASU 2016-9 as of the same date. In addition, we recognized excess tax benefits as an adjustment to our previously reported benefit from/(provision for) income taxes of
$0.1 million
,
$0.4 million
and
$0.1 million
for the quarters ended March 31, 2016, June 30, 2016 and September 30, 2016, respectively. The weighted average number of common shares outstanding for calculating diluted net income per share increased by
340,000
to
550,000
for each quarter of 2016. Basic and diluted net income per share increased by
$0.01
for the three months ended June 30, 2016. Net income per share for the three months ended March 30, 2016 and September 30, 2016 were not changed by the adoption of ASU 2016-9. Recast quarterly net income and basic and diluted net income per share for the first three quarters of 2016 is disclosed in
“Note 19. Quarterly Financial Data”
below.
Our adoption of the standard did not have any impact to our consolidated statements of cash flows as no NOL carryforwards from share-based compensation arrangements were recognized prior to January 1, 2016, due to our use of the “with and without” method of accounting for equity-generated NOL carryforwards. We have elected to continue to estimate forfeitures under the true-up provision of ASC 718. The adoption of this standard decreased our effective tax rate by
11.1%
for the year ended December 31, 2016.
In July 2015, the FASB issued ASU 2015-11,
Simplifying the Measurement of Inventory
. The standard requires inventory to be measured at the lower of cost or net realizable value. The guidance will not apply to inventories for which cost is determined using the last-in, first-out method or the retail inventory method. Our adoption of this standard in the first quarter of 2017 did not have a material impact on our consolidated financial statements.
In January 2017, the FASB issued ASU 2017-04,
Simplifying the Test for Goodwill Impairment
. The standard eliminates step two in the current two-step impairment test under ASC 350. Under the new standard, a goodwill impairment is recorded for any excess of a reporting unit’s carrying value over its fair value. A prospective transition approach is required. The standard is effective for annual and interim reporting periods beginning after December 15, 2019 with early adoption permitted for annual and interim goodwill impairment testing dates after January 1, 2017. Our adoption of this standard in the fourth quarter of 2017 did not have a material impact on our consolidated financial statements.
Accounting Pronouncements Not Yet Adopted
In May 2017, the FASB released ASU 2017-09,
Scope of Modification Accounting
, which clarifies the changes to terms or conditions of a share based payment award that requires application of modification accounting under Topic 718. A change to an award should be accounted for as a modification unless the fair value of the modified award is the same as the original award, the vesting conditions do not change and the classification as an equity or liability instrument does not change. This update is effective for annual reporting periods, and interim periods within those annual periods, beginning after December 15, 2017. Early application is permitted and prospective application is required for awards modified on or
69
after the adoption date. We will adopt this standard effective January 1, 2018, and this standard will not have a material impact on our financial position, results of operations or disclosures.
In January 2017, the FASB released ASU 2017-01,
Business Combinations: Clarifying the Definition of a Business
, which clarifies the definition of a business with the objective of adding guidance to assist entities with evaluating whether transactions should be accounted for as acquisitions or disposals of assets or businesses. The amendments in this ASU should be applied prospectively and are effective for fiscal years beginning after December 15, 2017, including interim periods within those fiscal years, with early adoption permitted. No disclosures are required at transition. We will adopt this standard effective January 1, 2018 and do not expect the standard to have a material impact on our consolidated financial statements.
In February 2016, the FASB issued ASU 2016-02,
Leases
. The standard will require lessees to recognize most leases on their balance sheet and makes selected changes to lessor accounting. The standard is effective for annual and interim reporting periods beginning after December 15, 2018. A modified retrospective transition approach is required, with certain practical expedients available. We are currently evaluating the impact the adoption of this standard will have on our consolidated financial statements.
In May 2014, the FASB issued ASU 2014-09,
Revenue from Contracts with Customers
(“ASU 2014-09), which has been updated through several revisions and clarifications since its original issuance (collectively, the “Standard”). The Standard will require revenue recognized to represent the transfer of promised goods or services to customers at an amount that reflects the consideration which a company expects to receive in exchange for those goods or services. The Standard also requires new, expanded disclosures regarding revenue recognition. The Standard is effective January 1, 2018.
We completed the detailed review of our contract portfolio and revenue streams to identify potential differences in accounting resulting from adopting the Standard.
We implemented the following controls with respect to assessing the potential impact of adopting the Standard:
|
•
|
Created an implementation working group, which includes internal and third-party resources;
|
|
•
|
Adopted implementation controls that will allow us to properly adopt the Standard;
|
|
•
|
Developed a detailed project plan with key milestone dates;
|
|
•
|
Outlined our revenue generating activities that fall within the scope of ASU 2014-09; and
|
|
•
|
Monitored and assessed the impact of changes to ASU 2014-09 and its interpretations.
|
We have determined the following pertaining to the impact of adopting ASU 2014-09:
|
•
|
Healthcare Revenue
- We determined that contracts within our Healthcare segment meet the definition of a contract under the Standard. We have elected to apply the portfolio approach practical expedient to our contracts in the Healthcare segment and account for the contracts within each portfolio as a collective group, rather than individual contracts. Based on our history with these portfolios and the homogenous nature and characteristics of the patient accounts within each portfolio, we have concluded that the financial statement effects are not expected to be materially different than if accounting for revenue based on individual contracts. If the Company has historical experience of collecting substantially all of the negotiated contractual
|
70
rates and the Company has determined, at contract inception, that customers have the intention and ability to pay the promised consideration, the Company has concluded that it has not provided an implicit price concession but, rather, that it has chosen to accept the risk of default by the patient and adjustments to the transaction price would be presented as bad debts. For our non-contracted portfolio, we have determined that we are providing an implicit price concession (a form of variable consideration), resulting in the need to continually estimate our transaction price based on historical cash collections, utilizing the expected value method. Subsequent adjustments to the transaction price will be recorded as an adjustment to Healthcare revenue and not as bad debt expense. Our current accounting policy is such that revenue is recognized upon agreed upon reimbursement rates. If we do not have agreed upon reimbursement rates, we recognize revenue based on historical experience, or if no historical experience, when cash is received. Adjustments to the estimated net realizable value, based on final settlement with the third-party payors, are recorded upon settlement.
|
•
|
Research Revenue
- We have concluded that our arrangements with customers meet the definition of a contract under the Standard. We are in the process of finalizing our assessment of whether our material promises within our contracts will represent a single or multiple performance obligations, as well as allocation of the transaction price to the performance obligation(s). We have determined that the legally enforceable term of our research contracts are predominately thirty days due to termination for convenience clauses which are held by the customer. Our current accounting policy dictates that Research revenue is recognized as the related services are performed. Our revenue is allocated to each element (both delivered and undelivered items) based on their relative selling prices as determined by our best estimate of our selling prices.
|
|
•
|
Technology Revenue
- We determined that contracts within our Technology segment meet the definition of a contract under the Standard and that contracts are predominantly short-term in nature (i.e., approximately 30 days from receipt of purchase order to shipment). We determined that the promised goods and services within our Technology segment revenue streams are broadly grouped into three categories: (1) the sale of goods produced by the Company (2) constructing, manufacturing, or developing an asset on behalf of a customer and (3) performing an agreed-upon service for a customer. We have determined the following: (1) That all of the transaction price with respect to our customer contracts consists of fixed consideration, (2) that our individual contracts consist of one performance obligation and thus, the allocation of contract consideration to separate performance obligations is not applicable and (3) that we will continue recognizing revenue at a point in time in the Technology segment when control transfers as dictated by the transfer of title on the underlying good sold or as services are rendered.
|
|
•
|
Transition Method - We will be adopting ASU 2014-09 using the modified retrospective approach.
|
In addition, the remaining significant implementation matters to be addressed prior to fully adopting ASU 2014-09 include finalizing the transition adjustment analysis on our consolidated financial statements, and finalizing updates to our business processes, systems and controls to comply with ASU 2014-09.
We expect to complete our assessment of the full financial impact of ASU 2014-09 before filing our 10-Q for the three months ended March 31, 2018 which will include the required financial reporting disclosures under ASU 2014-09.
71
3. Acquisitions
LifeWatch AG
On July 12, 2017, the Company, through its wholly owned subsidiary Cardiac Monitoring Holding Company, LLC, acquired approximately
97.0%
of the outstanding shares of LifeWatch AG for aggregate consideration of
3,615,840
shares of BioTelemetry common stock with a fair value of
$116.8 million
and cash in the amount of
$165.8 million
. On that date, we acquired control of LifeWatch and began consolidating its financial statements.
Through
December 31, 2017
, we purchased
343,525
additional shares of LifeWatch for cash consideration of
$4.8 million
and the issuance of
19,806
shares with a fair value of
$0.6 million
. We acquired the remaining untendered LifeWatch shares pursuant to a squeeze-out procedure in accordance with Swiss law and takeover regulation related to the offering occurring in early January 2018, with the settlement of
$2.9 million
cash, which was recorded as a component of accrued liabilities in our consolidated balance sheets, and
58,786
shares with a fair market value of
$2.0 million
, which was recorded as a component of paid-in capital in our consolidated balance sheets, both as of
December 31, 2017
. As of
December 31, 2017
, we owned
100%
of LifeWatch.
Also on July 12, 2017, in connection with the closing of the acquisition of LifeWatch, and refinancing of its existing debt, we entered into a Credit Agreement pursuant to which the Company obtained loans as follows; (i) a term loan (funded on July 12, 2017) in an aggregate principal amount equal to
$205.0 million
, the proceeds of which were used to (a) pay our existing General Electric Credit Agreement of
$24.9 million
and acquired LifeWatch debt of
$3.0 million
, (b) pay a portion of the cash consideration for the acquisition of LifeWatch, and (c) pay related transaction fees and expenses of the acquisition of LifeWatch; and (ii) a
$50.0 million
revolving credit facility for ongoing working capital purposes, which remains undrawn. The term loan will be repaid in quarterly installments beginning January 1, 2018, with the remaining principal balance repaid on or before July 12, 2022.
The acquisition of LifeWatch strengthens our position as the leader in wireless medicine, creating the foremost connected health platform, significantly enhancing our ability to improve quality of life and reduce cost of care. We accounted for the transaction as a business combination, and as such, all assets acquired and liabilities assumed were recorded at their estimated fair values. The excess of the fair value of the purchase price over the fair value of the net assets acquired has been recognized as goodwill, which represents the expected future benefits arising from the assembled workforce and other synergies attributable to cost savings opportunities. We recognized
$183.5 million
of goodwill as a result of the acquisition, all of which has been assigned to the Healthcare segment.
None
of this goodwill will be deductible for tax purposes.
The amounts below represent our preliminary fair value estimates as of
December 31, 2017
and are subject to subsequent adjustment as additional information is obtained during the applicable measurement period. Measurement period adjustments recorded during the fourth quarter of 2017 consisted primarily of increasing customer relationships by
$17.5 million
, increasing acquired technology by
$0.9 million
, increasing other long-term liabilities by
$21.7 million
, decreasing deferred tax liabilities by
$7.5 million
and decreasing fixed assets by
$2.0 million
. The primary areas of these preliminary estimates that are not yet finalized related to certain tangible assets acquired and liabilities assumed, including deferred taxes, unrecorded tax provisions and identifiable intangible assets. We expect to finalize all accounting for the acquisition of LifeWatch within one year of the acquisition date.
72
|
(in thousands, except lives)
|
Amount
|
Weighted
Average Life
(Years)
|
|||
|
Fair value of assets acquired:
|
|||||
|
Cash and cash equivalents
|
$
|
4,303
|
|
||
|
Healthcare accounts receivable
|
9,467
|
|
|||
|
Inventory
|
1,136
|
|
|||
|
Prepaid expenses and other current assets
|
4,392
|
|
|||
|
Property and equipment
|
28,241
|
|
|||
|
Other assets
|
713
|
|
|||
|
Identifiable intangible assets:
|
|||||
|
Customer relationships
|
126,900
|
|
10
|
||
|
Technology
|
3,005
|
|
3
|
||
|
Total identifiable intangible assets
|
129,905
|
|
|||
|
Total assets acquired
|
178,157
|
|
|||
|
Fair value of liabilities assumed:
|
|||||
|
Accounts payable
|
10,424
|
|
|||
|
Accrued liabilities
|
9,747
|
|
|||
|
Current portion of capital lease obligations
|
4,664
|
|
|||
|
Current portion of long-term debt
|
3,027
|
|
|||
|
Long-term capital lease obligations
|
3,420
|
|
|||
|
Deferred tax liabilities
|
14,454
|
|
|||
|
Other long-term liabilities
|
23,435
|
|
|||
|
Total liabilities assumed
|
69,171
|
|
|||
|
Total identifiable net assets
|
108,986
|
|
|||
|
Fair value of noncontrolling interest
|
(9,961
|
)
|
|||
|
Goodwill
|
183,549
|
|
|||
|
Net assets acquired
|
$
|
282,574
|
|
||
We have integrated the operations of LifeWatch which are included as components of our Healthcare segment. As a result of this integration, it is impracticable to disclose the amount of revenue and earnings/(loss) attributable to LifeWatch for the period from July 12, 2017 to
December 31, 2017
.
We incurred
$31.0 million
of acquisition related costs related to LifeWatch for the year ended
December 31, 2017
. These costs were included in other charges in our consolidated statements of operations and comprehensive income/(loss).
The following unaudited pro forma financial information has been prepared using historical financial results of BioTelemetry and LifeWatch as if the acquisition had occurred as of January 1, 2016. Certain adjustments related to the elimination of transaction costs, as well as the addition of depreciation and amortization related to fair value adjustments on the tangible and identifiable intangible assets acquired, have been reflected for the purposes of the unaudited pro forma financial information presented below. We
73
believe the assumptions used in preparing the unaudited pro forma financial information are reasonable, but not necessarily indicative of actual results should the acquisition have occurred on January 1, 2016.
Pro forma financial information for the periods presented is summarized as follows:
|
Year Ended December 31,
|
||||||||
|
(pro forma, unaudited, in thousands, except share and per share amounts)
|
2017
|
2016
|
||||||
|
Revenue
|
$
|
349,900
|
|
$
|
322,200
|
|
||
|
Net income/(loss)
|
(1,800
|
)
|
23,400
|
|
||||
|
Net income/(loss) per common share:
|
||||||||
|
Basic
|
$
|
(0.05
|
)
|
$
|
0.74
|
|
||
|
Diluted
|
$
|
(0.05
|
)
|
$
|
0.69
|
|
||
|
Weighted average number of common shares outstanding:
|
||||||||
|
Basic
|
34,022
|
|
31,556
|
|
||||
|
Diluted
|
34,022
|
|
34,125
|
|
||||
Telcare, Inc.
On December 1, 2016, the Company, through its wholly owned subsidiary BioTelemetry Care Management, LLC, entered into the Agreement with Telcare pursuant to which the Company acquired the stock of Telcare Medical Supply, Inc. and certain assets of Telcare Inc. The total consideration paid at closing amounted to
$7.0 million
in cash, with the potential for a performance-based earn out up to
$5.0 million
upon reaching certain revenue milestones. The fair value of the total consideration transferred in the acquisition, including the fair value of the contingent consideration, was
$9.7 million
at the acquisition date.
The acquisition of Telcare provides us the opportunity to apply our expertise in remote monitoring to the diabetes market and increases our presence in the digital population health management market. We accounted for the transaction as a business combination, and as such, all assets acquired and liabilities assumed were recorded at their estimated fair values. The excess of the fair value of the purchase price over the fair value of the net assets acquired has been recognized as goodwill, which represents the expected future benefits arising from the assembled workforce and other synergies attributable to cost savings opportunities. We recognized
$2.2 million
of goodwill as a result of the acquisition, all of which has been assigned to the Technology segment. We expect
$0.3 million
of this goodwill will be deductible for tax purposes.
The amounts below represent our final fair value estimates, which were completed in the fourth quarter ending
December 31, 2017
. Measurement period adjustments reducing the valuation of inventory of
$0.3 million
and
$0.1 million
were recorded in the second and third quarters of 2017, respectively, and a
$1.5 million
adjustment, increasing deferred tax assets and reducing deferred revenue, prior to completing our valuation during the fourth quarter of 2017.
74
The total consideration and related allocation for Telcare is summarized as follows:
|
(in thousands, except lives)
|
Amount
|
Weighted
Average Life
(Years)
|
|||
|
Fair value of assets acquired:
|
|||||
|
Other accounts receivable
|
$
|
235
|
|
||
|
Inventory
|
1,417
|
|
|||
|
Prepaid expenses and other current assets
|
1,261
|
|
|||
|
Property and equipment
|
55
|
|
|||
|
Other assets
|
933
|
|
|||
|
Deferred tax assets
|
1,463
|
|
|||
|
Identifiable intangible assets:
|
|||||
|
Customer relationships
|
400
|
|
5
|
||
|
Technology
|
2,000
|
|
5
|
||
|
Tradename
|
400
|
|
Indefinite
|
||
|
Total identifiable intangible assets
|
2,800
|
|
|||
|
Total assets acquired
|
8,164
|
|
|||
|
Fair value of liabilities assumed:
|
|||||
|
Accounts payable
|
459
|
|
|||
|
Accrued liabilities
|
206
|
|
|||
|
Total liabilities assumed
|
665
|
|
|||
|
Total identifiable net assets
|
7,499
|
|
|||
|
Goodwill
|
2,201
|
|
|||
|
Net assets acquired
|
$
|
9,700
|
|
||
The acquisition has been included within the consolidated results of operations and financial condition from the date of the acquisition.
The following unaudited pro forma financial information has been prepared using historical financial results of BioTelemetry and Telcare as if the acquisition had occurred as of January 1, 2015. Certain adjustments related to the elimination of transaction costs, as well as the addition of depreciation and amortization related to fair value adjustments on the tangible and identifiable intangible assets acquired, have been reflected for the purposes of the unaudited pro forma financial information presented below. We believe the assumptions used in preparing the unaudited pro forma financial information are reasonable, but not necessarily indicative of actual results should the acquisition have occurred on January 1, 2015.
75
Pro forma financial information for the periods presented is summarized as follows:
|
(pro forma, unaudited, in thousands, except per share amounts)
|
Year Ended December 31,
2016 |
Year Ended December 31,
2015 |
||||||
|
Revenue
|
$
|
212,538
|
|
$
|
182,755
|
|
||
|
Net income
|
50,693
|
|
948
|
|
||||
|
Net income per common share:
|
||||||||
|
Basic
|
$
|
1.82
|
|
$
|
0.03
|
|
||
|
Diluted
|
$
|
1.66
|
|
$
|
0.03
|
|
||
The Agreement includes the potential for a performance-based earn out up to
$5.0 million
upon reaching certain milestones. The fair value of the contingent consideration associated with the Telcare acquisition was
$2.7 million
as of the acquisition date and was included as a component of other liabilities in the accompanying consolidated balance sheets. For further details regarding contingent consideration, refer to “
Note 5. Fair Value Measurements”
below.
VirtualScopics, Inc
.
On March 25, 2016, the Company, through its wholly owned subsidiary BioTelemetry Research Acquisition Corporation, entered into a definitive Agreement and Plan of Merger (“Merger Agreement”) with VirtualScopics, Inc. (“VirtualScopics”), a leading provider of clinical trial imaging solutions. Under the terms of the Merger Agreement, we purchased: (i) any and all outstanding shares of VirtualScopics’
$0.001
par value common stock for
$4.05
per share; (ii) any and all outstanding shares of VirtualScopics’
$0.001
par value Series A and Series B Convertible Preferred Stock for
$336.30
per share; and (iii) any and all outstanding shares of VirtualScopics’
$0.001
par value Series C-1 Convertible Preferred Stock for
$920.00
per share. The all cash acquisition of VirtualScopics was completed on May 11, 2016. The total consideration paid at closing amounted to
$15.0 million
, net of cash acquired of
$0.8 million
.
The acquisition of VirtualScopics expands our existing clinical research offerings and gives us further access to established customer relationships. We accounted for the transaction as a business combination, and as such, all assets acquired and liabilities assumed were recorded at their estimated fair values. The excess of the consideration paid over the fair value of the net assets acquired has been recognized as goodwill, which represents the expected future benefits arising from the assembled workforce and other synergies attributable to cost savings opportunities. We recognized
$4.3 million
of goodwill as a result of the acquisition, all of which has been assigned to the Research segment.
None
of this goodwill will be deductible for tax purposes.
The amounts below represent our final fair value estimates, which were completed in the second quarter of 2017. Measurement period adjustments were recorded in the fourth quarter of 2016 related to the recognition of a
$0.3 million
deferred tax liability, and in the second quarter of 2017 primarily to recognize
$0.3 million
of deferred tax assets resulting from state net operating losses.
76
The total consideration and related allocation for VirtualScopics is summarized as follows:
|
(in thousands, except lives)
|
Amount
|
Weighted
Average Life
(Years)
|
|||
|
Fair value of assets acquired:
|
|||||
|
Cash and cash equivalents
|
$
|
849
|
|
||
|
Other accounts receivable
|
3,679
|
|
|||
|
Inventory
|
111
|
|
|||
|
Prepaid expenses and other current assets
|
396
|
|
|||
|
Property and equipment
|
500
|
|
|||
|
Deferred taxes
|
20
|
|
|||
|
Identifiable intangible assets:
|
|||||
|
Customer relationships
|
5,200
|
|
12
|
||
|
Technology
|
2,000
|
|
10
|
||
|
Backlog
|
3,100
|
|
4
|
||
|
Total identifiable intangible assets
|
10,300
|
|
|||
|
Total assets acquired
|
15,855
|
|
|||
|
Fair value of liabilities assumed:
|
|||||
|
Accounts payable
|
325
|
|
|||
|
Accrued liabilities
|
2,945
|
|
|||
|
Current portion of capital lease obligations
|
59
|
|
|||
|
Current portion of long-term debt
|
91
|
|
|||
|
Deferred revenue
|
700
|
|
|||
|
Long-term capital lease obligations
|
162
|
|
|||
|
Long-term debt
|
97
|
|
|||
|
Total liabilities assumed
|
4,379
|
|
|||
|
Total identifiable net assets
|
11,476
|
|
|||
|
Goodwill
|
4,343
|
|
|||
|
Net assets acquired
|
$
|
15,819
|
|
||
The acquisition has been included within the consolidated results of operations and financial condition from the date of the acquisition. For the period from May 11, 2016 to December 31, 2016, VirtualScopics contributed revenue of approximately
$12.3 million
and net income of approximately
$1.4 million
to our consolidated results of operations.
The following unaudited pro forma financial information has been prepared using historical financial results of BioTelemetry and VirtualScopics as if the acquisition had occurred as of January 1, 2015. Certain adjustments related to the elimination of transaction costs and acquisition-related indebtedness, as well as the addition of depreciation and amortization related to fair value adjustments on the tangible and identifiable intangible assets acquired, have been reflected for the purposes of the unaudited pro forma financial information presented below. No adjustments for synergies or certain other expected benefits of the acquisition have been included. We believe the assumptions used in preparing the unaudited pro forma
77
financial information are reasonable, but not necessarily indicative of actual results should the acquisition have occurred on January 1, 2015.
Pro forma financial information for the periods presented is summarized as follows:
|
(pro forma, unaudited, in thousands, except per share amounts)
|
Year Ended December 31,
2016 |
Year Ended December 31,
2015 |
|||||
|
Revenue
|
$
|
214,271
|
|
$
|
191,230
|
|
|
|
Net income
|
55,413
|
|
7,232
|
|
|||
|
Net income per common share:
|
|||||||
|
Basic
|
$
|
1.98
|
|
$
|
0.27
|
|
|
|
Diluted
|
$
|
1.82
|
|
$
|
0.25
|
|
|
ePatch Division of DELTA Danish Electronics, Light, and Acoustics
On April 1, 2016, we, through our wholly owned subsidiary BioTelemetry Technology ApS, entered into an Asset Purchase Agreement (“APA”) with DELTA, pursuant to which we acquired substantially all of the assets of the ePatch division of DELTA, inclusive of all products and indications currently under development. The total consideration paid at closing amounted to
$3.0 million
in cash and
244,519
shares of our common stock valued at
$2.9 million
. In addition, there is the potential for a performance-based earn out up to
$3.0 million
upon reaching certain regulatory and revenue milestones, as defined in the APA. The fair value of the total consideration transferred in the ePatch acquisition, including the fair value of the contingent consideration, was
$6.5 million
at the acquisition date.
The ePatch acquisition is expected to generate future cost savings for us and will provide control over proprietary components for our next generation MCT device. We accounted for the transaction as a business combination, and as such, all assets acquired and liabilities assumed were recorded at their estimated fair values. The excess of the fair value of the purchase price over the fair value of the net assets acquired has been recognized as goodwill, which represents the expected future benefits arising from the assembled workforce and other synergies attributable to cost savings opportunities. We recognized
$3.2 million
of goodwill as a result of the acquisition, all of which has been assigned to the Technology segment, and we expect all of this goodwill to be deductible for tax purposes.
The amounts below represent our final fair value estimates, which we completed in the first quarter of 2017. During the fourth quarter of 2016, we reduced the allocation to the technology intangible asset by
$0.2 million
as a result of additional information obtained during the measurement period.
78
The total consideration and related allocation for the ePatch acquisition is summarized as follows:
|
(in thousands, except lives)
|
Amount
|
Weighted
Average Life
(Years)
|
|||
|
Fair value of assets acquired:
|
|||||
|
Inventory
|
$
|
100
|
|
||
|
Property and equipment
|
175
|
|
|||
|
Identifiable intangible assets:
|
|||||
|
Customer relationships
|
400
|
|
10
|
||
|
Technology
|
2,800
|
|
10
|
||
|
Trade names
|
100
|
|
Indefinite
|
||
|
Total identifiable intangible assets
|
3,300
|
|
|||
|
Total assets acquired
|
3,575
|
|
|||
|
Fair value of liabilities assumed:
|
|||||
|
Accrued liabilities
|
266
|
|
|||
|
Total liabilities assumed
|
266
|
|
|||
|
Total identifiable net assets
|
3,309
|
|
|||
|
Goodwill
|
3,181
|
|
|||
|
Net assets acquired
|
$
|
6,490
|
|
||
While the ePatch acquisition provides control over proprietary components of our next generation cardiac monitoring device, the acquisition did not have a material effect on our consolidated results of operations.
The APA includes the potential for a performance-based earn out up to
$3.0 million
upon reaching certain regulatory and revenue milestones. The fair value of the contingent consideration associated with the ePatch acquisition was
$0.6 million
as of the acquisition date and was included as a component of other liabilities in the accompanying consolidated balance sheets. For further details regarding contingent consideration, refer to
“Note 5. Fair Value Measurements”
below.
4. Inventory
Inventory consists of the following:
|
December 31,
|
|||||||
|
(In thousands)
|
2017
|
2016
|
|||||
|
Raw materials and supplies
|
$
|
3,128
|
|
$
|
2,866
|
|
|
|
Finished goods
|
2,204
|
|
2,310
|
|
|||
|
Total inventory
|
$
|
5,332
|
|
$
|
5,176
|
|
|
Inventory, which includes purchased parts, materials, direct labor and applied manufacturing overhead, is stated at the lower of cost or net realizable value, with cost determined by use of the first-in, first-out method.
79
5. Fair Value Measurements
The fair value of our liabilities measured at fair value on a recurring basis is summarized as follows:
|
(in thousands)
|
Balance at December 31,
2017 |
Level 1
|
Level 2
|
Level 3
|
|||||||||
|
Liabilities
|
|||||||||||||
|
Contingent consideration
|
$
|
700
|
|
—
|
|
—
|
|
$
|
700
|
|
|||
|
(in thousands)
|
Balance at December 31,
2016 |
Level 1
|
Level 2
|
Level 3
|
|||||||||
|
Liabilities
|
|||||||||||||
|
Contingent consideration
|
$
|
3,305
|
|
—
|
|
—
|
|
$
|
3,305
|
|
|||
We have determined that our long term debt, classified as Level 2, has a fair value consistent with its carry value, exclusive of debt discount and deferred charges, of
$199.4 million
and
$25.2 million
as of
December 31, 2017
and
2016
, respectively.
Contingent consideration represents our contingent milestone payment obligations related to our acquisitions and is measured at fair value, based on significant inputs not observable in the market, which represents a Level 3 measurement within the fair value hierarchy. The valuation of contingent consideration uses assumptions we believe would be made by a market participant. We assess these estimates on an ongoing basis as additional data impacting the assumptions is obtained. The balances of the fair value of contingent consideration are recognized within other long-term liabilities on our consolidated balance sheets. Adjustments to contingent consideration are recorded in other charges in the consolidated statements of operations and comprehensive income/(loss).
The following table provides a reconciliation of the beginning and ending balances of contingent payments associated with acquisitions during the years ended
December 31, 2017
and
December 31, 2016
:
|
Year ended
|
|||||||
|
(in thousands)
|
December 31,
2017 |
December 31,
2016 |
|||||
|
Beginning balance
|
$
|
3,305
|
|
$
|
—
|
|
|
|
Purchase price contingent consideration
|
—
|
|
3,305
|
|
|||
|
Changes in fair value of contingent consideration
|
(2,605
|
)
|
—
|
|
|||
|
Ending balance
|
$
|
700
|
|
$
|
3,305
|
|
|
During the year ended
December 31, 2017
, the fair value of the contingent consideration related to the ePatch acquisition decreased
$0.6 million
as it is no longer probable that any of the contingencies will be met. Additionally during the year, the fair value of the contingent consideration related to the Telcare acquisition was reduced by
$2.0 million
as a result of reducing the probability of attaining all the revenue contingencies.
80
6. Property and Equipment
Property and equipment consists of the following:
|
Estimated
Useful Life
(Years)
|
December 31,
|
||||||||
|
(In thousands, except years)
|
2017
|
2016
|
|||||||
|
Cardiac monitoring devices, device parts and components
|
3 - 5
|
$
|
76,039
|
|
$
|
55,825
|
|
||
|
Computers and purchased software
|
3 - 5
|
22,357
|
|
18,027
|
|
||||
|
Equipment, tools and molds
|
3 - 5
|
7,857
|
|
6,666
|
|
||||
|
Furniture, fixtures and other
|
5 - 7
|
2,104
|
|
1,467
|
|
||||
|
Leasehold improvements
|
*
|
5,434
|
|
3,171
|
|
||||
|
Capital leases
|
3 - 7
|
7,305
|
|
737
|
|
||||
|
Total property and equipment, at cost
|
121,096
|
|
85,893
|
|
|||||
|
Less accumulated depreciation
|
(71,902
|
)
|
(60,070
|
)
|
|||||
|
Total property and equipment, net
|
$
|
49,194
|
|
$
|
25,823
|
|
|||
|
* shorter of useful life or term of lease
|
|||||||||
Depreciation expense associated with property and equipment, inclusive of amortization of assets recorded under capital leases, was
$18.3 million
,
$10.5 million
and
$9.0 million
, for the years ended
December 31, 2017
,
2016
and
2015
, respectively.
During the year ended
December 31, 2017
, considering the LifeWatch integration and forward-looking integration plans, we determined that certain software ceased being used and was no longer going to be used and was therefore impaired, resulting in
$1.1 million
of impairment charges included within the Corporate and Other segment as a component of other costs within the other charges line in our consolidated statements of operations and comprehensive income/(loss). There were
no
fixed asset impairments for the year ended
December 31, 2016
.
7. Goodwill and Intangible Assets
Goodwill was recognized at the time of our acquisitions. The following table presents the carrying amount of goodwill allocated to our reportable segments, as well as the changes to goodwill during the years ended
December 31, 2017
and
2016
:
|
Reporting Segment
|
|||||||||||||||
|
(in thousands)
|
Healthcare
|
Research
|
Technology
|
Total
|
|||||||||||
|
Balance at December 31, 2015
|
$
|
14,724
|
|
$
|
11,950
|
|
$
|
3,157
|
|
$
|
29,831
|
|
|||
|
Initial goodwill acquired
|
—
|
|
4,633
|
|
6,171
|
|
10,804
|
|
|||||||
|
Measurement period adjustments
|
—
|
|
60
|
|
373
|
|
433
|
|
|||||||
|
Balance at December 31, 2016
|
14,724
|
|
16,643
|
|
9,701
|
|
41,068
|
|
|||||||
|
Initial goodwill acquired
|
186,456
|
|
—
|
|
—
|
|
186,456
|
|
|||||||
|
Measurement period adjustments
|
(2,907
|
)
|
(350
|
)
|
(1,162
|
)
|
(4,419
|
)
|
|||||||
|
Balance at December 31, 2017
|
$
|
198,273
|
|
$
|
16,293
|
|
$
|
8,539
|
|
$
|
223,105
|
|
|||
81
The goodwill acquired in the Healthcare segment is due to the LifeWatch acquisition; Research relates to the VirtualScopics acquisition; Technology represents our ePatch and Telcare acquisitions. Refer to
“Note 3. Acquisitions”
above for details related to the measurement period adjustments.
At
December 31, 2017
,
2016
and
2015
, we performed our required annual impairment test of goodwill. Based on these impairment tests, we determined that there was
no
goodwill impairment. The carrying amount of our goodwill as of
December 31, 2017
and
2016
was
$223.1 million
and
$41.1 million
, respectively.
The gross carrying amounts and accumulated amortization of our intangible assets as of
December 31, 2017
and
2016
are as follows:
|
Estimated
Useful Life
(Years)
|
December 31,
|
||||||||
|
(In thousands, except years)
|
2017
|
2016
|
|||||||
|
Customer relationships
|
5 - 15
|
$
|
143,174
|
|
$
|
16,700
|
|
||
|
Technology including internally developed software
|
3 - 10
|
15,953
|
|
21,135
|
|
||||
|
Backlog
|
1 - 4
|
6,860
|
|
6,860
|
|
||||
|
Covenants not to compete
|
5 - 7
|
1,040
|
|
1,040
|
|
||||
|
Total intangible assets, gross
|
167,027
|
|
45,735
|
|
|||||
|
Customer relationships
|
(10,868
|
)
|
(3,809
|
)
|
|||||
|
Technology including internally developed software
|
(8,573
|
)
|
(6,588
|
)
|
|||||
|
Backlog
|
(5,052
|
)
|
(4,176
|
)
|
|||||
|
Covenants not to compete
|
(827
|
)
|
(690
|
)
|
|||||
|
Total accumulated amortization
|
(25,320
|
)
|
(15,263
|
)
|
|||||
|
Indefinite-lived trade names
|
—
|
|
3,000
|
|
|||||
|
Total intangible assets, net
|
$
|
141,707
|
|
$
|
33,472
|
|
|||
During our intangible asset impairment testing for the year ended
December 31, 2017
, considering the LifeWatch integration and forward-looking integration plans, we determined that certain trade names and internally developed software costs ceased being used and were no longer going to be used and were therefore impaired, resulting in
$11.0 million
of intangible asset impairment charges included within the Corporate and Other segment as a component of other costs within the other charges line in our consolidated statements of operations and comprehensive income/(loss). There were
no
other intangible asset impairments for the year ended
December 31, 2017
.
At
December 31, 2016
and
2015
, we performed our required annual impairment test of indefinite-lived intangible assets. Based on these impairment tests, we determined that there was
no
impairment.
82
The estimated amortization expense for finite-lived intangible assets for the next five years and thereafter is summarized as follows at
December 31, 2017
:
|
(in thousands)
|
||||
|
Fiscal Year
|
||||
|
2018
|
$
|
16,718
|
|
|
|
2019
|
16,231
|
|
||
|
2020
|
15,420
|
|
||
|
2021
|
14,687
|
|
||
|
2022
|
14,238
|
|
||
|
Thereafter
|
64,413
|
|
||
|
Total estimated amortization
|
$
|
141,707
|
|
|
Amortization expense for the years ended
December 31, 2017
,
2016
and
2015
was
$10.2 million
,
$3.7 million
and
$3.5 million
, respectively. The 2017 amortization expense excludes impairment charges of
$3.0 million
related to indefinite-lived trade names and
$8.0 million
related to developed technology and customer relationships. See
“Note. 12 Other Charges”
below.
8. Equity Method Investment
In December 2015, we acquired an ownership interest in Well Bridge Health, Inc. (“WellBridge”) through the conversion of an outstanding note receivable and the related accrued interest. The investment is accounted for under the equity method. In December 2015, the equity method basis difference of
$0.9 million
was allocated to equity method goodwill. Our Chief Executive Officer sits on Wellbridge’s Board of Directors, and therefore WellBridge is considered a related party. Except for our continued investment in WellBridge through capital contributions, there were no related party transactions.
As of
December 31, 2017
, our investment in WellBridge represented
32.1%
of its outstanding stock. A summary of our investment in Wellbridge is as follows:
|
Year ended December 31,
|
|||||||
|
(in thousands)
|
2017
|
2016
|
|||||
|
Beginning balance
|
$
|
1,125
|
|
$
|
1,100
|
|
|
|
Capital contributions
|
690
|
|
312
|
|
|||
|
Loss in equity method investment
|
(384
|
)
|
(287
|
)
|
|||
|
Ending balance
|
$
|
1,431
|
|
$
|
1,125
|
|
|
83
9. Accrued Liabilities
Accrued liabilities consists of the following:
|
December 31,
|
|||||||
|
(in thousands)
|
2017
|
2016
|
|||||
|
Accrued compensation
|
$
|
13,086
|
|
$
|
7,831
|
|
|
|
Accrued professional fees
|
1,587
|
|
2,841
|
|
|||
|
Accrued squeeze-out
|
2,885
|
|
—
|
|
|||
|
Accrued restructuring
|
1,605
|
|
—
|
|
|||
|
Accrued non-income taxes
|
588
|
|
250
|
|
|||
|
Accrued interest
|
306
|
|
330
|
|
|||
|
Other
|
7,300
|
|
2,446
|
|
|||
|
Total
|
$
|
27,357
|
|
$
|
13,698
|
|
|
10. Credit Agreement
Credit Agreements
Concurrent with the acquisition of LifeWatch, as discussed in
“Note 3. Acquisitions”
above, we entered into a credit agreement with SunTrust Bank, as a lender and an agent for the lenders (the “Lenders”) (together, the “SunTrust Credit Agreement”). Pursuant to the credit agreement, the Lenders agreed to make loans to the Company as follows; (i) a term loan in an aggregate principal amount equal to
$205.0 million
; and (ii) a
$50.0 million
revolving credit facility for ongoing working capital purposes. The proceeds of the loans were used to pay our existing GE Credit Agreement of
$24.9 million
and acquired LifeWatch debt of
$3.0 million
, pay a portion of the consideration for the acquisition of LifeWatch and pay related transaction fees and expenses of the acquisition of LifeWatch.
The loans bear interest at an annual rate, at the election of the Company, of (i) with respect to LIBOR rate loans,
LIBOR
plus the applicable margin and (ii) with respect to base rate loans, the Base Rate (the “
prime
rate” as published in the Wall Street Journal plus the applicable margin). The applicable margin for both LIBOR and Base Rate loans is determined by reference to the Company’s Consolidated Total Net Leverage Ratio, as defined in the credit agreement. As of
December 31, 2017
, the applicable margin is
2.00%
for LIBOR loans and
1.00%
for base rate loans.
The outstanding principal of the loan will be paid as follows:
|
•
|
Beginning January 1, 2018, the principal amount of the term loan will be repaid, on a quarterly basis, in installments of approximately
$0.5 million
, plus accrued interest;
|
|
•
|
Beginning January 1, 2019, the principal amount of the term loan will be repaid, on a quarterly basis, in installments of approximately
$1.3 million
, plus accrued interest;
|
|
•
|
B
eginning January 1, 2020, the principal amount of the term loan will be repaid, on a quarterly basis, in installments of approximately
$3.8 million
, plus accrued interest;
|
|
•
|
Beginning January 1, 2021, the principal amount of the term loan will be repaid, on a quarterly basis, in installments of approximately
$5.1 million
, plus accrued interest;
|
84
|
•
|
The remaining principal balance will be repaid on or before July 12, 2022 (or such earlier date upon an acceleration of the loans by Lenders upon an event of default or termination by the Company).
|
The loans are secured by substantially all of the assets of the Company and by a pledge of the capital stock of the Company’s U.S. based subsidiaries as well as a pledge of
65%
of the capital stock of its first tier material foreign subsidiaries, including
65%
of the capital stock the Company owns of LifeWatch.
The carrying amount of the term loan was
$199.4 million
as of
December 31, 2017
, which is the principal amount outstanding, net of
$5.6 million
of unamortized deferred financing costs to be amortized over the remaining term of the credit facility. The revolving credit facility is subject to an unused commitment fee, which is determined by reference to the our Consolidated Total Net Leverage Ratio, as defined in the credit agreement. Our unused commitment fee as of
December 31, 2017
was
0.3%
and the revolving credit facility remains undrawn as of that date.
On December 30, 2014, we entered into a Credit Agreement with Healthcare Financial Solutions, LLC, (“HFS”), previously The General Electric Capital Corporation (“GE Capital”), as agent for the lenders (“Lenders”), and as a lender and swingline lender (the “General Electric Credit Agreement”). Pursuant to the General Electric Credit Agreement, the Lenders agreed to make loans to us as follows: (i) Term Loans in an amount of
$25.0 million
as of the closing date with an uncommitted ability to increase such Term Loans up to an amount not to exceed
$10.0 million
and (ii) Revolving Loans up to
$15.0 million
. As of
December 31, 2016
,
$3.0 million
was drawn on the Revolving Loans. The loan, inclusive of Term Loans and Revolving Loans, was recorded on our consolidated balance sheet as of
December 31, 2016
in the amount of
$25.2 million
, which is net of a debt discount and deferred charges of
$0.7 million
.
The loans bore interest at an annual rate of
LIBOR
plus
4.0%
, subject to a LIBOR floor of
1.0%
. The outstanding principal of the Term Loans was to be paid as follows:
|
•
|
beginning April 1, 2015, the principal amount of the Term Loans were repaid, on a quarterly basis, in installments of
$0.3 million
, plus accrued interest;
|
The loan was secured by substantially all of our assets and by a pledge of the capital stock of our U.S. based subsidiaries as well as a pledge of
65%
of the capital stock of our foreign subsidiaries. As noted above, this agreement was paid off with the proceeds of the SunTrust Credit Agreement in 2017.
Covenants
The SunTrust Credit Agreement contains affirmative and financial covenants regarding the operations of our business and certain negative covenants that, among other things, limit our ability to incur additional indebtedness, grant certain liens, make certain investments, merge or consolidate, make certain restricted payments and engage in certain asset dispositions, including a sale of all, or substantially all, of our property. As of
December 31, 2017
, we were in compliance with our covenants.
Debt Extinguishment
In connection with the SunTrust Credit Agreement, we paid the
$24.9 million
outstanding indebtedness under the Credit Agreement between the Company and Healthcare Financial Solutions, LLC, previously the General Electric Capital Corporation, as agent for the lenders, and as a lender, and we terminated the General Electric Credit Agreement. We wrote‑off the unamortized deferred financing fees
85
related to the existing debt of
$0.5 million
, which is included in loss on extinguishment of debt in our consolidated statements of operations and comprehensive income/(loss).
11. Leases
We lease our principal administrative and service facilities as well as office equipment under non-cancelable operating leases expiring at various dates through 2028. The terms of the leases are renewable at the end of the lease term. Payments made under operating leases are charged to operations on a straight-line basis over the period of the lease. Differences between straight-line expense and cash payments are recorded as deferred rent. Rent expense was
$5.8 million
,
$4.2 million
and
$3.8 million
for the years ended
December 31, 2017
,
2016
and
2015
, respectively.
We have entered into and acquired capital leases with various expiration dates through 2020 which were used to finance equipment, furniture and monitoring devices.
Future minimum lease payments under non-cancelable operating and capital leases are summarized as follows at
December 31, 2017
:
|
(in thousands)
|
Operating
Leases
|
Capital
Leases
|
|||||
|
2018
|
$
|
5,871
|
|
$
|
4,023
|
|
|
|
2019
|
4,240
|
|
1,358
|
|
|||
|
2020
|
3,768
|
|
128
|
|
|||
|
2021
|
2,535
|
|
—
|
|
|||
|
2022
|
1,726
|
|
—
|
|
|||
|
Thereafter
|
5,515
|
|
—
|
|
|||
|
Total minimum lease payments
|
$
|
23,655
|
|
$
|
5,509
|
|
|
12. Other Charges
We account for expenses associated with exit or disposal activities in accordance with ASC 420,
Exit or Disposal Cost Obligations,
and record the expenses in other charges in our consolidated statements of operations and comprehensive income/(loss), and record the related accrual in the accrued expenses line of our consolidated balance sheets.
We account for expenses associated with our acquisitions and certain litigation as other charges as incurred. These expenses were primarily a result of legal fees related to patent litigation in which we are the plaintiff and activities surrounding our acquisitions. Other charges are costs that are not considered necessary to the ongoing business operations. A summary of these expenses is as follows:
86
|
Year ended December 31,
|
|||||||||||
|
(in thousands)
|
2017
|
2016
|
2015
|
||||||||
|
Asset impairment charges
|
$
|
12,045
|
|
$
|
—
|
|
$
|
—
|
|
||
|
Legal fees
|
8,689
|
|
7,177
|
|
5,764
|
|
|||||
|
Professional fees
|
5,614
|
|
719
|
|
50
|
|
|||||
|
Severance and employee related costs
|
4,747
|
|
645
|
|
249
|
|
|||||
|
Change in fair value of contingent consideration
|
(2,605
|
)
|
—
|
|
—
|
|
|||||
|
Other costs
|
2,946
|
|
98
|
|
—
|
|
|||||
|
Total
|
$
|
31,436
|
|
$
|
8,639
|
|
$
|
6,063
|
|
||
During the year ended
December 31, 2017
, in conjunction with the LifeWatch integration and forward-looking integration plans, we determined that certain trade names and software costs ceased being used and were no longer going to be used and were therefore impaired. We recognized impairment charges within the Corporate and Other segment of
$1.1 million
related to purchased software,
$3.0 million
related to indefinite-lived trade names and
$8.0 million
related to certain developed technology and customer relationships. Professional fees, severance and employee related costs increased primarily due to integration activities related to the LifeWatch acquisition. The change in fair value of contingent consideration is partially the result of the contingent consideration related to the ePatch acquisition being written off as it is no longer probable that any of the contingencies will be met. Additionally during the year, the fair value of the contingent consideration related to the Telcare acquisition was reduced as a result of reducing the probability of attaining all the revenue contingencies.
13. Equity
Common Stock
As of
December 31, 2017
and
2016
, we were authorized to issue
200,000,000
shares of common stock. As of
December 31, 2017
and
2016
, we had
32,460,668
and
28,261,503
shares issued and outstanding, respectively. Subsequent to
December 31, 2017
, in accordance with the squeeze-out procedures under Swiss Law, we issued
58,786
shares to the remaining stockholders of LifeWatch. See
“Note 3. Acquisitions”
above for further details related to the LifeWatch acquisition.
Preferred Stock
As of
December 31, 2017
, we were authorized to issue
10,000,000
shares of preferred stock. As of
December 31, 2016
, we maintained an unregistered blank check preferred stock class, and
no
shares were authorized. As of
December 31, 2017
and
2016
, there were
no
shares of preferred stock issued or outstanding.
Noncontrolling Interest
As of
December 31, 2017
, the noncontrolling interest of
$1.1 million
on our consolidated balance sheet represents our partner’s share of the accumulated deficit recorded within LifeWatch Turkey. See
“Note 1. Summary of Significant Accounting Policies; l) Noncontrolling Interests”
above for further details.
87
14. Stock-Based Compensation
We have
three
stock plans: our 2017 Omnibus Incentive Plan (“OIP”), our 2008 Equity Incentive Plan (the “2008 Plan”) and our 2003 Equity Incentive Plan (the “2003 Plan”). The OIP is the only remaining stock plan actively granting new stock options or units. The purpose of these stock plans was, and the OIP is, to grant incentive stock options to employees and non-qualified stock options, RSUs, performance stock and other stock-based incentive awards to officers, directors, employees and consultants. The Plans are administered by our Board of Directors (the “Board”) or its delegates. The number, type, exercise price, and vesting terms of awards are determined by the Board or its delegates in accordance with the terms of the Plans. The options granted expire on a date specified by the Board, but generally not more than
ten years
from the grant date. Stock option grants to employees generally vest over
four years
while RSUs generally vest over
three years
.
2017 Omnibus Incentive Plan
In May 2017, the stockholders and Board approved the OIP, which replaces the 2008 Plan. Stock options, RSUs, PSUs and PSOs are granted under the OIP. At
December 31, 2017
,
2,753,252
shares remain available for grant under the OIP.
2008 Equity Incentive Plan
Our 2008 Plan became effective on March 18, 2008 and replaced our 2003 Plan. Under the terms of the 2008 Plan, all available shares in the 2003 Plan share reserve automatically rolled into the 2008 Plan. Any cancellations or forfeitures of granted options under the 2003 Plan also automatically roll into the 2008 Plan. Beginning on January 1, 2009, and each year thereafter, the number of options available to be granted under the plan increased by the lesser of
4%
of the total number of common shares outstanding or
1,500,000
shares. The 2008 Plan had
2,637,019
shares available for grant as of
December 31, 2016
; there are no shares available to grant under the 2008 Plan subsequent to the approval of the OIP.
88
Stock option activity is summarized for the years ended
December 31, 2017
,
2016
and
2015
as follows:
|
Stock Options
|
Performance Stock Options
|
||||||||||||
|
Number of
Shares
|
Weighted
Average
Exercise Price
|
Number of
Shares
|
Weighted
Average
Exercise Price
|
||||||||||
|
Outstanding as of December 31, 2014
|
3,250,852
|
|
$
|
6.40
|
|
—
|
|
—
|
|
||||
|
Granted
|
427,786
|
|
10.39
|
|
200,000
|
|
$
|
19.89
|
|
||||
|
Forfeited
|
(181,777
|
)
|
11.32
|
|
—
|
|
—
|
|
|||||
|
Exercised
|
(76,342
|
)
|
3.82
|
|
—
|
|
—
|
|
|||||
|
Outstanding as of December 31, 2015
|
3,420,519
|
|
$
|
6.69
|
|
200,000
|
|
$
|
19.89
|
|
|||
|
Granted
|
519,770
|
|
13.44
|
|
—
|
|
—
|
|
|||||
|
Forfeited
|
(49,709
|
)
|
9.97
|
|
—
|
|
—
|
|
|||||
|
Exercised
|
(322,146
|
)
|
4.56
|
|
—
|
|
—
|
|
|||||
|
Outstanding as of December 31, 2016
|
3,568,434
|
|
$
|
7.82
|
|
200,000
|
|
$
|
19.89
|
|
|||
|
Granted
|
543,881
|
|
31.12
|
|
—
|
|
—
|
|
|||||
|
Forfeited
|
(154,510
|
)
|
16.22
|
|
—
|
|
—
|
|
|||||
|
Exercised
|
(383,366
|
)
|
9.91
|
|
(50,000
|
)
|
18.33
|
|
|||||
|
Outstanding as of December 31, 2017
|
3,574,439
|
|
$
|
10.78
|
|
150,000
|
|
$
|
20.41
|
|
|||
The PSOs met their performance criteria, vested, and were priced as follows:
|
Performance Achievement Date
|
Number of
Shares
|
Weighted
Average
Exercise Price
|
|||||
|
October 4, 2016
|
100,000
|
|
$
|
18.33
|
|
||
|
January 13, 2017
|
100,000
|
|
$
|
21.45
|
|
||
A summary of total outstanding stock options as of
December 31, 2017
is as follows:
|
Options Outstanding
|
Options Exercisable
|
|||||||||||||||||
|
Range of Exercise Prices
|
Number
Outstanding
|
Weighted
Average
Remaining
Contractual
Life (in Years)
|
Weighted
Average
Exercise Price
|
Number
Exercisable
|
Weighted
Average
Remaining
Contractual
Life (in Years)
|
Weighted
Average
Exercise Price
|
||||||||||||
|
$1.93 - $6.50
|
1,296,231
|
|
4.2
|
$
|
3.17
|
|
1,296,231
|
|
4.2
|
$
|
3.17
|
|
||||||
|
$6.51 - $10.00
|
1,136,472
|
|
4.8
|
7.88
|
|
952,756
|
|
4.3
|
7.62
|
|
||||||||
|
$10.01 - $20.00
|
606,190
|
|
6.5
|
14.02
|
|
407,990
|
|
5.8
|
13.79
|
|
||||||||
|
$20.01 - $30.00
|
375,546
|
|
8.2
|
23.57
|
|
174,068
|
|
7.0
|
21.93
|
|
||||||||
|
$30.01 - $37.15
|
310,000
|
|
9.2
|
36.10
|
|
15,000
|
|
0.6
|
30.98
|
|
||||||||
|
$1.93 - $37.15
|
3,724,439
|
|
5.6
|
$
|
11.17
|
|
2,846,045
|
|
4.6
|
$
|
7.48
|
|
||||||
89
The table below summarizes certain additional information with respect to our options:
|
Year Ended December 31,
|
||||||||||||
|
(In thousands, except per share amounts)
|
2017
|
2016
|
2015
|
|||||||||
|
Aggregate intrinsic value of options outstanding at year-end
|
$
|
71,680
|
|
$
|
52,671
|
|
$
|
19,436
|
|
|||
|
Aggregate intrinsic value of options exercisable at year-end
|
63,834
|
|
43,750
|
|
16,124
|
|
||||||
|
Aggregate intrinsic value of options exercised during the year
|
7,562
|
|
3,546
|
|
662
|
|
||||||
|
Cash received from the exercise of stock options
|
4,714
|
|
1,470
|
|
291
|
|
||||||
|
Weighted average grant date fair value per option
|
$
|
18.05
|
|
$
|
9.47
|
|
$
|
6.58
|
|
|||
The total compensation cost of options granted but not yet vested at
December 31, 2017
was
$11.0 million
, which is expected to be recognized over a weighted average period of approximately
three
years.
The fair value of stock options was estimated at the date of grant using the following weighted average assumptions:
|
Year Ended December 31,
|
||||||||
|
2017
|
2016
|
2015
|
||||||
|
Expected volatility
|
59.2
|
%
|
64.4
|
%
|
66.5
|
%
|
||
|
Expected term (in years)
|
7.3
|
|
8.0
|
|
6.7
|
|
||
|
Weighted average risk-free interest rate
|
2.08
|
%
|
1.61
|
%
|
1.68
|
%
|
||
|
Expected dividends
|
0.0
|
%
|
0.0
|
%
|
0.0
|
%
|
||
90
RSU activity is summarized for the years ended
December 31, 2017
,
2016
and
2015
as follows:
|
Restricted Stock Units
|
Performance Stock Units
|
||||||||||||
|
Number
of Shares
|
Weighted Average
Grant Date Fair
Value
|
Number
of Shares
|
Weighted Average
Grant Date Fair
Value
|
||||||||||
|
Units outstanding as of December 31, 2014
|
864,634
|
|
$
|
4.23
|
|
284,423
|
|
$
|
8.68
|
|
|||
|
Granted
|
328,060
|
|
9.70
|
|
—
|
|
—
|
|
|||||
|
Forfeited
|
(50,642
|
)
|
6.90
|
|
(18,433
|
)
|
8.68
|
|
|||||
|
Vested
|
(451,116
|
)
|
3.89
|
|
—
|
|
—
|
|
|||||
|
Units outstanding as of December 31, 2015
|
690,936
|
|
6.85
|
|
265,990
|
|
8.68
|
|
|||||
|
Granted
|
225,198
|
|
11.06
|
|
—
|
|
—
|
|
|||||
|
Forfeited
|
(11,905
|
)
|
9.50
|
|
—
|
|
—
|
|
|||||
|
Vested
|
(311,880
|
)
|
4.08
|
|
(132,998
|
)
|
8.68
|
|
|||||
|
Units outstanding as of December 31, 2016
|
592,349
|
|
9.86
|
|
132,992
|
|
8.68
|
|
|||||
|
Granted
|
117,614
|
|
25.98
|
|
—
|
|
—
|
|
|||||
|
Forfeited
|
(48,974
|
)
|
13.57
|
|
(132,992
|
)
|
8.68
|
|
|||||
|
Vested
|
(193,860
|
)
|
9.31
|
|
—
|
|
—
|
|
|||||
|
Units outstanding as of December 31, 2017
|
467,129
|
|
$
|
13.76
|
|
—
|
|
$
|
—
|
|
|||
In addition, a summary of total outstanding RSUs as of
December 31, 2017
is as follows:
|
Range of Grant Date Fair Value
|
RSUs
Outstanding
|
||
|
$8.93 - $9.75
|
154,335
|
|
|
|
$9.76 - $10.36
|
184,395
|
|
|
|
$10.37 - $33.05
|
128,399
|
|
|
|
$8.93 - $33.05
|
467,129
|
|
|
Additional information about our RSUs and PSUs is summarized as follows:
|
Year Ended December 31,
|
||||||||||||
|
(In thousands)
|
2017
|
2016
|
2015
|
|||||||||
|
Aggregate market value of RSUs vested during the year
|
$
|
4,768
|
|
$
|
3,826
|
|
$
|
4,460
|
|
|||
|
Aggregate market value of PSUs vested during the year
|
—
|
|
2,093
|
|
—
|
|
||||||
The total compensation cost of RSUs granted but not yet vested at
December 31, 2017
was
$3.2 million
, which is expected to be recognized over a weighted average period of approximately
one
year.
91
Employee Stock Purchase Plan
In July 2008, we made available an Employee Stock Purchase Plan (“2008 ESPP”) in which substantially all of our full-time employees became eligible to participate effective March 18, 2008. Under the 2008 ESPP, employees may contribute through payroll deductions up to
15%
of their compensation toward the purchase of our common stock, or
$21,500
, whichever is lower. The price per share is equal to the lower of
85%
of the fair market price on the first day of the offering period, or
85%
of the fair market price on the day of purchase. Proceeds received from the issuance of shares are credited to stockholders’ equity in the period that the shares are issued. In May 2017, the Board of Directors and stockholders approved the BioTelemetry, Inc. 2017 Employee Stock Purchase Plan (“2017 ESPP”), with
500,000
shares reserved for issuance under the 2017 ESPP, which will replace the 2008 ESPP. The contribution limits, price discount and the offering periods remain the same under the 2017 ESPP. In
2017
, an aggregate of
95,215
shares were purchased in accordance with the Plans. Net proceeds from the issuance of shares of common stock under the Plans for the year ended
December 31, 2017
were
$1.4 million
. At
December 31, 2017
,
452,751
shares remain available for purchase under the 2017 ESPP.
Our aggregate stock-based compensation expense is summarized as follows:
|
Year Ended December 31,
|
|||||||||||
|
(In thousands)
|
2017
|
2016
|
2015
|
||||||||
|
Stock options
|
$
|
3,183
|
|
$
|
2,030
|
|
$
|
1,782
|
|
||
|
Performance stock options
|
1,534
|
|
1,297
|
|
—
|
|
|||||
|
Restricted stock units
|
2,273
|
|
2,211
|
|
2,039
|
|
|||||
|
Performance stock units
|
—
|
|
444
|
|
711
|
|
|||||
|
Employee stock purchase plan
|
690
|
|
520
|
|
420
|
|
|||||
|
Total stock-based compensation expense
|
$
|
7,680
|
|
$
|
6,502
|
|
$
|
4,952
|
|
||
For the years ended
December 31, 2017
, and
2016
, we recognized
$1.5 million
and
$1.7 million
of tax benefit from stock options exercised during the period as a component of our income tax provision/(benefit).
15. Employee Benefit Plan
We sponsor a 401(k) Retirement Savings Plan (the “Plan”) for all eligible employees who meet certain requirements. Participants may contribute, on a pre-tax basis, up to the maximum allowable amount pursuant to Section 401(k) of the Internal Revenue Code (“IRC”). The plan also includes a Roth feature, allowing after-tax contributions, up to the maximum allowable amount pursuant to Section 401(k) of the IRC. We are not required to contribute to the Plan. In January 2014, we adopted an amendment to the Plan that allowed for an employer matching contribution of
100%
of the first
3%
of the employees’ salary, and
50%
of the next
2%
of the employees’ salary. For the years ended
December 31, 2017
,
2016
and
2015
, we contributed
$2.6 million
,
$2.1 million
and
$1.8 million
, respectively. Employer contributions vest immediately. Additionally, we sponsor an immaterial pension plan for five participants in Switzerland.
92
16. Income Taxes
The components of our provision for/(benefit from) income taxes are summarized as follows:
|
Year Ended
December 31,
|
|||||||||||
|
(in thousands)
|
2017
|
2016
|
2015
|
||||||||
|
Current:
|
|||||||||||
|
Federal
|
$
|
273
|
|
$
|
321
|
|
$
|
173
|
|
||
|
State
|
424
|
|
153
|
|
50
|
|
|||||
|
Total provision for income taxes
|
697
|
|
474
|
|
223
|
|
|||||
|
Deferred:
|
|||||||||||
|
Federal
|
6,201
|
|
(32,484
|
)
|
220
|
|
|||||
|
State
|
(151
|
)
|
(5,657
|
)
|
25
|
|
|||||
|
Total deferred provision for/(benefit from) income taxes
|
6,050
|
|
(38,141
|
)
|
245
|
|
|||||
|
Total provision for/(benefit from) income taxes
|
$
|
6,747
|
|
$
|
(37,667
|
)
|
$
|
468
|
|
||
Reconciliations between expected income taxes computed at the federal rate of
35%
for each of the years ended
December 31, 2017
,
2016
and
2015
, and the provision for/(benefit from) income taxes is as follows:
|
Years ended December 31,
|
|||||||||||
|
(in thousands)
|
2017
|
2016
|
2015
|
||||||||
|
Income tax (benefit)/provision at statutory rate
|
$
|
(3,638
|
)
|
$
|
5,520
|
|
$
|
2,763
|
|
||
|
State income tax, net of federal benefit
|
177
|
|
259
|
|
(239
|
)
|
|||||
|
Research and development
|
—
|
|
—
|
|
634
|
|
|||||
|
Permanent difference
|
(392
|
)
|
—
|
|
—
|
|
|||||
|
Deferred tax asset adjustments
|
485
|
|
4,336
|
|
—
|
|
|||||
|
Tax Reform impact
|
8,048
|
|
—
|
|
—
|
|
|||||
|
Unrecognized tax benefit
|
—
|
|
3,559
|
|
—
|
|
|||||
|
Foreign rate differential
|
1,107
|
|
—
|
|
—
|
|
|||||
|
Other
|
(16
|
)
|
289
|
|
549
|
|
|||||
|
Increase/(decrease) in valuation allowance
|
976
|
|
(51,630
|
)
|
(3,239
|
)
|
|||||
|
Provision for/(benefit from) income taxes
|
$
|
6,747
|
|
$
|
(37,667
|
)
|
$
|
468
|
|
||
At
December 31, 2017
, we had federal net operating loss carryforwards of approximately
$140.4 million
to offset future federal taxable income expiring in various years starting in
2023
through
2037
. At
December 31, 2017
, we had state net operating loss carryforwards of
$83.5 million
, which expire in various years starting in
2018
through
2037
. We also had
$121.2 million
of foreign net operating loss carryforwards, for which we have recorded a valuation allowance against most of the net operating loss balance and expire in various years starting in
2018
through
2024
.
The timing and manner in which we can utilize our net operating loss carryforwards and future income tax deductions in any year may be limited by provisions of the IRC. Section 382 of the IRC imposes limitations on a corporation’s ability to utilize net operating losses if it experiences an “ownership change.”
93
Section 383 of the IRC imposes similar limitations on other tax attributes such as research and development credits. Currently, a portion of our loss carryforwards is limited under Section 382 and therefore, is not included in the total net operating losses disclosed above.
The U.S. Internal Revenue Service concluded its examination of our U.S. federal tax returns for all years through 2011. Because of net operating losses, our U.S. federal tax returns statutes for those years will remain subject to examination until the losses are utilized. Additionally, state tax return statutes generally remain open due to operating losses.
We have deferred income tax assets totaling
$57.7 million
at
December 31, 2017
, consisting primarily of federal and state net operating loss and credit carryforwards, stock-based compensation, non-deductible accruals and allowance for doubtful accounts. Our provision from income taxes for
2017
of
$6.7 million
primarily relates to the re-measurement of our deferred tax assets and liabilities at the new federal corporate rate of 21 percent.
Deferred taxes result from temporary differences between the carrying amounts of assets and liabilities used for financial reporting purposes and the amounts used for income tax purposes. As of
December 31, 2017
, our deferred income tax assets were primarily the result of federal and state net operating losses, stock-based compensation, non-deductible accruals and allowance for doubtful accounts. A valuation allowance of
$6.0 million
and
$0.1 million
was recorded against our deferred income tax asset balance as of
December 31, 2017
and
2016
, respectively.
As of each reporting date, our management considers new evidence, both positive and negative, that could impact management’s view with regard to future realization of deferred income tax assets.
94
The significant components of our deferred taxes are as follows:
|
December 31,
|
|||||||
|
(in thousands)
|
2017
|
2016
|
|||||
|
Deferred tax assets:
|
|||||||
|
Net operating loss carryforwards
|
$
|
38,245
|
|
$
|
33,404
|
|
|
|
Research and development and AMT credit carryforwards
|
1,198
|
|
912
|
|
|||
|
Stock option grants
|
4,300
|
|
5,602
|
|
|||
|
Property and equipment
|
690
|
|
—
|
|
|||
|
Non-deductible accruals
|
4,471
|
|
—
|
|
|||
|
Transaction costs
|
2,361
|
|
—
|
|
|||
|
Allowance for doubtful accounts
|
5,324
|
|
4,965
|
|
|||
|
Deferred revenue
|
937
|
|
885
|
|
|||
|
Other, net
|
158
|
|
1,868
|
|
|||
|
Total deferred tax assets
|
57,684
|
|
47,636
|
|
|||
|
Less valuation allowance
|
(6,032
|
)
|
(95
|
)
|
|||
|
Net deferred tax assets
|
51,652
|
|
47,541
|
|
|||
|
Deferred tax liabilities:
|
|||||||
|
Property and equipment
|
—
|
|
(3,604
|
)
|
|||
|
Intangible assets
|
(33,854
|
)
|
(7,124
|
)
|
|||
|
Prepaid insurance
|
(117
|
)
|
(177
|
)
|
|||
|
Total deferred tax liabilities
|
(33,971
|
)
|
(10,905
|
)
|
|||
|
Net deferred tax asset/(liability)
|
$
|
17,681
|
|
$
|
36,636
|
|
|
On December 22, 2017, the U.S. government enacted comprehensive tax legislation commonly referred to as the Tax Cuts and Jobs Act (the “TCJA”). The TCJA makes broad and complex changes to the U.S. tax code, including, but not limited to, (1) reducing the U.S. federal corporate tax rate from 35 percent to 21 percent; (2) requiring companies to pay a one-time transition tax on certain unrepatriated earnings of foreign subsidiaries; (3) generally eliminating U.S. federal income taxes on dividends from foreign subsidiaries; (4) requiring a current inclusion in U.S. federal taxable income of certain earnings of controlled foreign corporations; (5) eliminating the corporate alternative minimum tax (AMT) and changing how existing AMT credits can be realized; (6) creating the base erosion anti-abuse tax (BEAT), a new minimum tax; (7) creating a new limitation on deductible interest expense; and (8) changing rules related to uses and limitations of net operating loss carryforwards created in tax years beginning after December 31, 2017.
The SEC staff issued SAB 118, which provides guidance on accounting for the tax effects of the TCJA. SAB 118 provides a measurement period that should not extend beyond one year from the TCJA enactment date for companies to complete the accounting under ASC 740. In accordance with SAB 118, a company must reflect the income tax effects of those aspects of the TCJA for which the accounting under ASC 740 is complete. To the extent that a company’s accounting for certain income tax effects of the TCJA is incomplete but it is able to determine a reasonable estimate, it must record a provisional estimate in the financial statements. If a company cannot determine a provisional estimate to be included in the financial statements, it should continue to apply ASC 740 on the basis of the provisions of the tax laws that were in effect immediately before the enactment of the TCJA.
95
Our accounting for the following elements of the TCJA is incomplete. However, we were able to make reasonable estimates of certain effects and, therefore, recorded provisional adjustments as follows:
Reduction of US federal corporate tax rate:
The TCJA reduces the corporate tax rate to 21 percent, effective January 1, 2018. For certain of our DTAs and DTLs, we have recorded a provisional net decrease of
$8.0 million
, with a corresponding net adjustment to deferred income tax expense for the year ended December 31, 2017. While we are able to make a reasonable estimate of the impact of the reduced corporate rate, it may be affected by other analyses related to the TCJA, including, but not limited to, our calculation of deemed repatriation of deferred foreign income and the state tax effect of adjustments made to federal temporary differences.
Deemed Repatriation Transition Tax:
As part of U.S. international tax reform, the TCJA imposes a transition tax on certain accumulated foreign earnings aggregated across all non-U.S. subsidiaries, net of foreign deficits. As we are in an aggregate net foreign deficit position for U.S. tax purposes, we are not liable for the transition tax. However, we are continuing to gather additional information to more precisely compute our aggregate net foreign deficit position.
Cost recovery:
While we have not yet completed all of the computations necessary or completed an inventory of our 2017 expenditures that qualify for immediate expensing, we have recorded a provisional benefit of
$1.1 million
based on our current intent to fully expense all qualifying expenditures.
Global intangible low-taxed income:
The TJCA subjects a U.S. shareholder to current tax on global intangible low-taxed income (“GILTI”) earned by certain foreign subsidiaries. The FASB Staff Q&A, Topic 740 No. 5,
Accounting for Global Intangible Low-Taxed Income
, states that an entity can make an accounting policy election to either recognize deferred taxes for temporary differences expected to reverse as GILTI in future years or provide for the tax expense related to GILTI in the year the tax is incurred. We have elected to recognize the tax on GILTI as a period expense in the period the tax is incurred.
During
2017
, in connection with our acquisitions, we identified uncertain tax positions for periods prior to our ownership related to items recorded through purchase accounting. The following summarizes the changes in our unrecognized tax benefit:
|
Year ended
|
|||||||
|
(in thousands)
|
December 31,
2017 |
December 31,
2016 |
|||||
|
Unrecognized tax benefit at the beginning of the year
|
$
|
3,899
|
|
$
|
—
|
|
|
|
Additions to uncertain tax positions related to current year
|
35,811
|
|
—
|
|
|||
|
Additions to uncertain tax positions related to prior years
|
—
|
|
3,899
|
|
|||
|
Unrecognized tax benefit at the end of the year
|
$
|
39,710
|
|
$
|
3,899
|
|
|
The balance of unrecognized tax benefits, if recognized, would affect the effective tax rate. As of
December 31, 2017
, we have recorded a net reserve of
$22.0 million
for uncertain tax positions as a component of other long-term liabilities within our consolidated balance sheets. The unrecognized tax benefit, or a portion of an unrecognized tax benefit, is presented in the financial statements as a reduction to a deferred tax asset for a net operating loss carryforward, a similar tax loss, or a tax credit carryforward.
96
We recognize interest and penalties related to unrecognized tax benefits on the income tax expense line in the accompanying consolidated statements of operations and comprehensive income/(loss). As of
December 31, 2017
, we have
no
t recorded any interest and penalties on our uncertain tax positions.
It is reasonably possible that a portion of these unrecognized tax benefits could be resolved within the next twelve months that may result in a decrease in our effective tax rate.
17. Segment Information
We operate under
three
reportable segments: Healthcare, Research and Technology. The Healthcare segment is focused on the diagnosis and monitoring of cardiac arrhythmias or heart rhythm disorders. We offer cardiologists and electrophysiologists, neurologists and primary care physicians a full spectrum of solutions which provides them with a single source of cardiac monitoring services. The Research segment is engaged in central core laboratory services providing cardiac monitoring, imaging services, scientific consulting and data management services for drug and medical device trials. The Technology segment focuses on the development, manufacturing, testing and marketing of cardiovascular and blood glucose monitoring devices to medical companies, clinics and hospitals. Intercompany revenue relating to the manufacturing of devices by the Technology segment for the other segments is included on the intersegment revenue line.
Expenses that can be specifically identified with a segment have been included as deductions in determining pre-tax segment income. Any remaining expenses including integration, restructuring and other charges, as well as the elimination of costs associated with intercompany revenue are included in Corporate and Other. Also included in Corporate and Other is our net interest expense and other financing expenses. We do not allocate assets to the individual segments.
During the year ended
December 31, 2017
we reclassified research and development costs not utilized by our Research segment from the Corporate and Other segment to the Healthcare segment to synchronize our external reporting with the way our chief operating decision maker reviews the segment performance and makes decisions about the reportable segments.
|
(in thousands)
|
Healthcare
|
Research
|
Technology
|
Corporate
and Other
|
Consolidated
|
||||||||||||||
|
2017
|
|||||||||||||||||||
|
Revenue
|
$
|
234,385
|
|
$
|
38,790
|
|
$
|
13,601
|
|
$
|
—
|
|
$
|
286,776
|
|
||||
|
Intersegment revenue
|
—
|
|
—
|
|
14,793
|
|
(14,793
|
)
|
—
|
|
|||||||||
|
Income/(loss) before income taxes
|
52,054
|
|
1,214
|
|
3,807
|
|
(67,471
|
)
|
(10,396
|
)
|
|||||||||
|
Depreciation and amortization
|
29,255
|
|
4,148
|
|
1,045
|
|
(5,887
|
)
|
28,561
|
|
|||||||||
|
Capital expenditures
|
12,542
|
|
1,274
|
|
749
|
|
(868
|
)
|
13,697
|
|
|||||||||
97
|
(reclassified, in thousands)
|
Healthcare
|
Research
|
Technology
|
Corporate
and Other
|
Consolidated
|
||||||||||||||
|
2016
|
|||||||||||||||||||
|
Revenue
|
$
|
165,664
|
|
$
|
32,565
|
|
$
|
10,103
|
|
$
|
—
|
|
$
|
208,332
|
|
||||
|
Intersegment revenue
|
—
|
|
—
|
|
11,456
|
|
(11,456
|
)
|
—
|
|
|||||||||
|
Income/(loss) before income taxes
|
53,025
|
|
2,229
|
|
3,862
|
|
(43,346
|
)
|
15,770
|
|
|||||||||
|
Depreciation and amortization
|
10,216
|
|
3,837
|
|
517
|
|
(301
|
)
|
14,269
|
|
|||||||||
|
Capital expenditures
|
8,885
|
|
1,941
|
|
73
|
|
—
|
|
10,899
|
|
|||||||||
|
(reclassified, in thousands)
|
Healthcare
|
Research
|
Technology
|
Corporate
and Other
|
Consolidated
|
||||||||||||||
|
2015
|
|||||||||||||||||||
|
Revenue
|
$
|
145,963
|
|
$
|
21,853
|
|
$
|
10,697
|
|
$
|
—
|
|
$
|
178,513
|
|
||||
|
Intersegment revenue
|
7
|
|
—
|
|
10,224
|
|
(10,231
|
)
|
—
|
|
|||||||||
|
Income/(loss) before income taxes
|
38,322
|
|
540
|
|
4,390
|
|
(35,356
|
)
|
7,896
|
|
|||||||||
|
Depreciation and amortization
|
7,790
|
|
3,676
|
|
371
|
|
651
|
|
12,488
|
|
|||||||||
|
Capital expenditures
|
9,155
|
|
4,373
|
|
72
|
|
—
|
|
13,600
|
|
|||||||||
18. Legal Proceedings
The final outcome of any current or future litigation or governmental or internal investigations cannot be accurately predicted, nor can we predict any resulting penalties, fines or other sanctions that may be imposed at the discretion of federal or state regulatory authorities. We record accruals for such contingencies to the extent that we conclude it is probable that a liability has been incurred and the amount of the loss can be estimated.
Mednet Settlement
In the third quarter of 2017, a settlement was reached with the selling stockholder of Mednet Healthcare Technologies, Inc., Heartcare Corporation of America, Inc., Universal Medical, Inc., and Universal Medical Laboratory, Inc. (together, “Mednet”), whereby
79,333
shares of BioTelemetry common stock with a fair value of
$2.8 million
were returned to the Company. These shares were part of the consideration paid in the acquisition of Mednet and had been subject to certain terms and conditions set forth in the Stock Purchase Agreement (the “Agreement”). In accordance with the terms of the Agreement, we sought indemnification for alleged breaches of certain representations and warranties. Accordingly, in 2016 we recorded a
$1.4 million
indemnification asset. However, as a result of the settlement’s fair value exceeding the indemnification asset recorded, a gain of
$1.3 million
was recorded as a component of other non-operating expense, net in the consolidated statements of operations for the year ended December 31, 2017.
United States Department of Health and Human Services’ Office for Civil Rights Settlement
In 2011, we experienced the theft of
two
unencrypted laptop computers and, as a result, were required to provide notices under the HIPAA Breach Notification Rule to the United States Department of Health and Human Services’ Office for Civil Rights (“OCR”). During the first quarter of 2017, the OCR concluded its investigation into the matter and reached a settlement agreement with us. Per the agreement, we paid
98
the OCR
$2.5 million
and agreed to submit a two-year corrective action plan. We did not admit any liability or wrongdoing. As a result of the settlement, we recorded a non-operating charge of
$2.5 million
to other non-operating expense, net in the consolidated statements of operations and comprehensive income/(loss) for the year ended December 31, 2017.
ZTech, Inc., Biorita LLC, and the Cleveland Clinic Foundation Arbitration
In January 2017, ZTech, Inc., Biorita LLC, and the Cleveland Clinic Foundation (the “Claimants”) filed an arbitration demand against LifeWatch with the American Arbitration Association. Claimants alleging that LifeWatch violated the 2015 Stock Purchase Agreement for the purchase of FlexLife Health, Inc., a remote international normalized ratio monitoring business. The demand alleges LifeWatch did not make commercially reasonable efforts to achieve certain conditions precedent and did not have a reasonable basis for terminating the business line. Claimants seek liquidated damages and attorneys’ fees. We are vigorously defending against these claims and are seeking recovery of attorneys’ fees related to our defense. The arbitration hearing was held in February 2018, and we are awaiting a decision. While we believe that the risk of loss in this arbitration is improbable, we cannot determine, nor can we estimate, the range of potential loss. Accordingly, as we do not believe that a loss is probable, in accordance with authoritative guidance on the evaluation of loss contingencies, we have not recorded an accrual related to this matter.
ScottCare Litigation
In May 2012, CardioNet, Inc. (“CardioNet”) filed suit against The ScottCare Corporation and Ambucor Health Solutions, Inc. (“ScottCare”) in the U.S. District Court for the Eastern District of Pennsylvania for patent infringement. We are seeking an injunction against each defendant, as well as monetary damages. ScottCare has asserted counterclaims alleging the patents in the suit are invalid and not infringed. The trial court heard argument on motions for summary judgment and motions to limit expert testimony in June 2015, but has not yet issued rulings on these motions. ScottCare has dropped all invalidity challenges with respect to one of the patents in the suit. The parties are awaiting a trial date. We are vigorously pursuing our claims and defending against the counterclaims. The probable outcome of this matter cannot be determined, nor can we estimate a range of potential loss. Therefore, in accordance with authoritative guidance on the evaluation of loss contingencies, we have not recorded an accrual related to this matter.
InfoBionic Litigation
CardioNet, LLC and Braemar Manufacturing, LLC filed a patent infringement lawsuit against InfoBionic, Inc. (“InfoBionic”) in May 2015, in the U.S. District Court for the District of Massachusetts, and filed an amended complaint in March 2016. We are seeking an injunction and enhanced damages for willful infringement because InfoBionic had prior knowledge of some or all of the asserted patents. We are also asserting claims for unfair competition and misappropriation of trade secrets due to its discovery that InfoBionic is in unauthorized possession of confidential and proprietary materials of ours, including source code. A trial date has not been set.
In March 2017, we filed a second infringement action in the same District Court asserting infringement of one additional patent seeking an injunction and enhanced damages for willful infringement. InfoBionic moved to dismiss the complaint in this action in June 2017, and the parties are awaiting a ruling from the Court.
99
We also initiated an arbitration proceeding against InfoBionic with the American Arbitration Association in July 2017 asserting claims of misappropriation of trade secrets, unfair competition, and unjust enrichment as a result of our discovery that InfoBionic is in unauthorized possession of our confidential and proprietary materials, including source code. We are seeking monetary and injunctive relief.
In response to our infringement assertion, InfoBionic filed several petitions at the United States Patent and Trademark Office (“USPTO”) for Inter Partes review (“IPR”) of certain of our patents. The USPTO denied institution of IPR regarding certain patents and found certain of our claims in our patents to be unpatentable. In July 2017 we filed an appeal with the Federal Circuit challenging the unpatentability findings.
100
19. Quarterly Financial Data (Unaudited)
The following tables summarize the unaudited quarterly financial data for the last two fiscal years. Net Income, basic net income per share and diluted net income per share for the first three quarters of 2016 have been recast in accordance with the adoption of ASU 2016-09.
|
(in thousands, except per share amounts)
|
First
Quarter
|
Second
Quarter
|
Third
Quarter
|
Fourth
Quarter
|
|||||||||||
|
2017
|
|||||||||||||||
|
Total revenue
|
$
|
55,881
|
|
$
|
58,129
|
|
$
|
81,023
|
|
$
|
91,743
|
|
|||
|
Gross profit
|
32,909
|
|
35,967
|
|
49,069
|
|
54,425
|
|
|||||||
|
Net income/(loss)
|
196
|
|
1,726
|
|
(2,564
|
)
|
(16,501
|
)
|
|||||||
|
Net income/(loss) attributable to BioTelementry, Inc.
|
196
|
|
1,726
|
|
(2,285
|
)
|
(15,593
|
)
|
|||||||
|
Basic net income/(loss) per share attributable to BioTelemetry, Inc.
|
$
|
0.01
|
|
$
|
0.06
|
|
$
|
(0.07
|
)
|
$
|
(0.48
|
)
|
|||
|
Diluted net income/(loss) per share attributable to BioTelemetry, Inc.
|
$
|
0.01
|
|
$
|
0.05
|
|
$
|
(0.07
|
)
|
$
|
(0.48
|
)
|
|||
|
2016
|
|||||||||||||||
|
Total revenue
|
$
|
48,640
|
|
$
|
52,680
|
|
$
|
53,055
|
|
$
|
53,957
|
|
|||
|
Gross profit
|
30,627
|
|
32,921
|
|
32,866
|
|
33,036
|
|
|||||||
|
Net income
|
4,097
|
|
4,697
|
|
4,195
|
|
40,448
|
|
|||||||
|
Net income attributable to BioTelementry, Inc.
|
4,097
|
|
4,697
|
|
4,195
|
|
40,448
|
|
|||||||
|
Basic net income per share attributable to BioTelemetry, Inc.
|
$
|
0.15
|
|
$
|
0.17
|
|
$
|
0.15
|
|
$
|
1.43
|
|
|||
|
Diluted net income per share attributable to BioTelemetry, Inc.
|
$
|
0.14
|
|
$
|
0.15
|
|
$
|
0.14
|
|
$
|
1.30
|
|
|||
101
None.
Evaluation of Disclosure Controls and Procedures
Prior to the filing of this Annual Report on Form 10-K, an evaluation was performed under the supervision of and with the participation of our management, including the Chief Executive Officer (“CEO”) and Chief Financial Officer (“CFO”), of the effectiveness of our disclosure controls and procedures. Based on the evaluation, the CEO and CFO have concluded that, as of
December 31, 2017
, our disclosure controls and procedures are effective to ensure that information required to be disclosed in reports that it files or submits under the Exchange Act, is recorded, processed, summarized and reported within the time periods specified in SEC rules and forms, and is accumulated and communicated to our management, as appropriate, to allow timely decisions regarding required disclosure. It should be noted that the design of any system of controls is based in part upon certain assumptions about the likelihood of future events, and there can be no assurance that any design will succeed in achieving its stated goals under all potential future conditions, regardless of how remote.
Changes in Internal Control over Financial Reporting
On July 12, 2017, we completed the acquisition of LifeWatch. We are in the process of integrating the acquired LifeWatch entities and our management is in the process of evaluating any related changes to our internal control over financial reporting as a result of this integration. Except for any changes relating to this integration, there has been no change in our internal control over financial reporting (as defined in Rules 13a-15(f) and 15d-15(f) under the Exchange Act) for the year ended
December 31, 2017
, that materially affected or are reasonably likely to materially affect our internal control over financial reporting.
102
MANAGEMENT’S REPORT ON INTERNAL CONTROL OVER FINANCIAL REPORTING
Management is responsible for establishing and maintaining adequate internal control over financial reporting as defined in Rules 13a-15(f) and 15d-15(f) under the Exchange Act. Our internal control over financial reporting is designed to provide reasonable assurance regarding the reliability of financial reporting and the preparation of financial statements for external purposes in accordance with generally accepted accounting principles. Our internal control over financial reporting includes those policies and procedures that:
|
(i)
|
pertain to the maintenance of records that, in reasonable detail, accurately and fairly reflect the transactions and dispositions of our assets;
|
|
(ii)
|
provide reasonable assurance that transactions are recorded as necessary to permit preparation of financial statements in accordance with U.S. generally accepted accounting principles, and that our receipts and expenditures are being made only in accordance with authorizations of management and directors; and
|
|
(iii)
|
provide reasonable assurance regarding prevention or timely detection of unauthorized acquisition, use or disposition of our assets that could have a material effect on the financial statements.
|
Because of inherent limitations, internal control over financial reporting may not prevent or detect misstatements. Also, projections of any evaluation of effectiveness to future periods are subject to the risk that controls may become inadequate because of changes in conditions, or that the degree of compliance with the policies or procedures may deteriorate.
The effectiveness of our internal control over financial reporting did not include the internal controls of LifeWatch, which were included in our consolidated financial statements for the year ended
December 31, 2017
, due to the timing of the acquisitions. LifeWatch comprised
19%
of total assets and
40%
of net assets as of
December 31, 2017
.
Our management assessed the effectiveness of our internal control over financial reporting as of
December 31, 2017
. In making this assessment, management used the criteria set forth by the Committee of Sponsoring Organizations of the Treadway Commission (“COSO”) in Internal Control—Integrated Framework (2013). Based on management’s assessment and those criteria, management has concluded that our internal control over financial reporting was effective as of
December 31, 2017
.
The effectiveness of our internal control over financial reporting as of
December 31, 2017
has been audited by Ernst & Young LLP, an independent registered public accounting firm, as stated in their report included in this Annual Report on Form 10-K.
103
Report of Independent Registered Public Accounting Firm
The Stockholders and the Board of Directors of BioTelemetry, Inc.
Opinion on Internal Control over Financial Reporting
We have audited BioTelemetry, Inc.’s internal control over financial reporting as of December 31, 2017, based on criteria established in Internal Control-Integrated Framework issued by the Committee of Sponsoring Organizations of the Treadway Commission (2013 framework) (the COSO criteria). In our opinion, BioTelemetry, Inc. (the Company) maintained, in all material respects, effective internal control over financial reporting as of December 31, 2017, based on the COSO criteria.
As indicated in the accompanying Management’s Report on Internal Control over Financial Reporting, management’s assessment of and conclusion on the effectiveness of internal control over financial reporting did not include the internal controls of Lifewatch AG, which is included in the 2017 consolidated financial statements of the Company and constituted
19%
and
40%
of total and net assets, respectively, as of December 31, 2017. Our audit of internal control over financial reporting of the Company also did not include an evaluation of the internal control over financial reporting of Lifewatch AG.
We also have audited, in accordance with the standards of the Public Company Accounting Oversight Board (United States) (PCAOB), the consolidated balance sheets of the Company as of December 31, 2017 and 2016, the related consolidated statements of operations and comprehensive income/(loss), cash flows and equity for each of the three years in the period ended December 31, 2017, and the related notes and schedule listed in the Index at Item 15(a) of the Company and our report dated
February 26, 2018
expressed an unqualified opinion thereon.
Basis for Opinion
The Company’s management is responsible for maintaining effective internal control over financial reporting and for its assessment of the effectiveness of internal control over financial reporting included in the accompanying Management’s Report on Internal Control over Financial Reporting. Our responsibility is to express an opinion on the Company’s internal control over financial reporting based on our audit. We are a public accounting firm registered with the PCAOB and are required to be independent with respect to the Company in accordance with the U.S. federal securities laws and the applicable rules and regulations of the Securities and Exchange Commission and the PCAOB.
We conducted our audit in accordance with the standards of the PCAOB. Those standards require that we plan and perform the audit to obtain reasonable assurance about whether effective internal control over financial reporting was maintained in all material respects.
Our audit included obtaining an understanding of internal control over financial reporting, assessing the risk that a material weakness exists, testing and evaluating the design and operating effectiveness of internal control based on the assessed risk, and performing such other procedures as we considered necessary in the circumstances. We believe that our audit provides a reasonable basis for our opinion.
104
Definition and Limitations of Internal Control Over Financial Reporting
A company’s internal control over financial reporting is a process designed to provide reasonable assurance regarding the reliability of financial reporting and the preparation of financial statements for external purposes in accordance with generally accepted accounting principles. A company’s internal control over financial reporting includes those policies and procedures that (1) pertain to the maintenance of records that, in reasonable detail, accurately and fairly reflect the transactions and dispositions of the assets of the company; (2) provide reasonable assurance that transactions are recorded as necessary to permit preparation of financial statements in accordance with generally accepted accounting principles, and that receipts and expenditures of the company are being made only in accordance with authorizations of management and directors of the company; and (3) provide reasonable assurance regarding prevention or timely detection of unauthorized acquisition, use, or disposition of the company’s assets that could have a material effect on the financial statements.
Because of its inherent limitations, internal control over financial reporting may not prevent or detect misstatements. Also, projections of any evaluation of effectiveness to future periods are subject to the risk that controls may become inadequate because of changes in conditions, or that the degree of compliance with the policies or procedures may deteriorate.
|
/s/ ERNST & YOUNG LLP
|
|
|
Philadelphia, Pennsylvania
|
|
|
February 26, 2018
|
|
105
None.
106
Information with respect to this Item is incorporated by reference from our definitive proxy statement in connection with the
2018
Annual Meeting of Stockholders, or the Proxy Statement, unless the Proxy Statement is not filed by
May 1, 2018
, in which case we will amend this Form 10-K to provide the omitted information in accordance with the requirements of Instruction G to Form 10-K.
BioTelemetry emphasizes the importance of professional business conduct and ethics through its corporate governance initiatives. Our Board of Directors has adopted a code of business conduct and ethics that applies to all employees, directors and officers, including our principal executive officer and principal financial officer. Our corporate governance information and materials, including our Code of Business Conduct and Ethics, are posted under “Corporate Governance” in the Investors section of our website at
www.gobio.com
. Our Board of Directors regularly reviews corporate governance developments and modifies these materials and practices as warranted. To the extent we make amendments to or grant waivers from our Code of Business Conduct and Ethics in the future, we intend to disclose the amendments and waivers on our website.
Information required by this Item is incorporated by reference from the Proxy Statement unless the Proxy Statement is not filed on or before
May 1, 2018
, in which case we will amend this Form 10-K to provide the omitted information in accordance with the requirements of Instruction G to Form 10-K.
|
Item 12
|
Security Ownership of Certain Beneficial Owners and Management and Related Stockholder Matters
|
Information required by this Item is incorporated by reference from the Proxy Statement unless the Proxy Statement is not filed on or before
May 1, 2018
, in which case we will amend this Form 10-K to provide the omitted information in accordance with the requirements of Instruction G to Form 10-K.
Information required by this Item is incorporated by reference from the Proxy Statement unless the Proxy Statement is not filed on or before
May 1, 2018
, in which case we will amend this Form 10-K to provide the omitted information in accordance with the requirements of Instruction G to Form 10-K.
Information required by this Item is incorporated by reference from the Proxy Statement unless the Proxy Statement is not filed on or before
May 1, 2018
, in which case we will amend this Form 10-K to provide the omitted information in accordance with the requirements of Instruction G to Form 10-K.
107
|
(a)
|
The following financial statements, schedules and exhibits are filed as part of this Annual Report on Form 10-K
|
|
1.
|
Financial Statements
—The Financial Statements required by this item are listed on the Index to Financial Statements in Part II, Item 8 of this Annual Report on Form 10-K.
|
|
2.
|
Financial Statement Schedules
|
|
•
|
Schedule II—Valuation and Qualifying Accounts and Reserves; and
|
|
•
|
Other financial statement schedules are not included because they are not required or the information is otherwise shown in the financial statements or notes thereto.
|
|
3.
|
Exhibits
—The exhibits listed on the accompanying Exhibit Index are filed as part of, or are incorporated by reference into, this Annual Report on Form 10-K.
|
|
(b)
|
See Item 15(a)(3) above.
|
|
(c)
|
See Item 15(a)(2) above.
|
108
None.
SCHEDULE II
|
(in thousands)
|
Beginning
Balance
|
Additions
|
Deductions
|
Ending
Balance
|
|||||||||||
|
Allowance for Doubtful Accounts
|
|||||||||||||||
|
Year ended December 31, 2017
|
$
|
12,863
|
|
$
|
13,291
|
|
$
|
(9,173
|
)
|
$
|
16,981
|
|
|||
|
Year ended December 31, 2016
|
$
|
11,601
|
|
$
|
9,931
|
|
$
|
(8,669
|
)
|
$
|
12,863
|
|
|||
|
Year ended December 31, 2015
|
$
|
10,662
|
|
$
|
8,047
|
|
$
|
(7,108
|
)
|
$
|
11,601
|
|
|||
|
(in thousands)
|
Beginning
Balance
|
Additions
|
Deductions
|
Ending
Balance
|
|||||||||||
|
Tax Valuation Allowance
|
|||||||||||||||
|
Year ended December 31, 2017
|
$
|
95
|
|
$
|
5,937
|
|
$
|
—
|
|
$
|
6,032
|
|
|||
|
Year ended December 31, 2016
|
$
|
49,759
|
|
$
|
1,966
|
|
$
|
(51,630
|
)
|
$
|
95
|
|
|||
|
Year ended December 31, 2015
|
$
|
52,998
|
|
$
|
1,734
|
|
$
|
(4,973
|
)
|
$
|
49,759
|
|
|||
109
EXHIBIT INDEX
|
Incorporated by Reference
|
||||||||||||
|
Exhibit
Number
|
Description
|
Form
|
File No.
|
Exhibit
|
Filing Date
|
Filed Herewith
|
||||||
|
2.3
|
10-K
|
000-55039
|
2.3
|
February 22, 2017
|
||||||||
|
2.4
|
10-Q
|
000-55039
|
2.1
|
November 7, 2017
|
||||||||
|
3.1
|
10-Q
|
000-55039
|
3.1
|
August 8, 2017
|
||||||||
|
3.2
|
10-Q
|
000-55039
|
3.2
|
August 8, 2017
|
||||||||
|
10.1
|
S-1
|
333-145547
|
10.1
|
August 17, 2007
|
||||||||
|
10.2*
|
S-8
|
333-218228
|
10.1
|
May 25, 2017
|
||||||||
|
10.3*
|
S-1
|
333-145547
|
10.4
|
February 28, 2008
|
||||||||
|
10.4*
|
S-8
|
333-218228
|
10.2
|
May 25, 2017
|
||||||||
|
10.5*
|
8-K
|
001-33993
|
10.2
|
October 28, 2008
|
||||||||
|
10.6*
|
8-K
|
001-33993
|
99.5
|
January 28, 2009
|
||||||||
|
10.7*
|
8-K
|
001-33993
|
99.2
|
June 18, 2010
|
||||||||
|
10.8*
|
10-K
|
001-33993
|
10.36
|
February 23, 2010
|
||||||||
|
10.9*
|
10-K
|
001-33993
|
10.38
|
February 25, 2011
|
||||||||
|
10.10*
|
10-Q
|
001-33993
|
10.1
|
May 6, 2011
|
||||||||
|
10.11*
|
10-K
|
001-33993
|
10.26
|
February 22, 2013
|
||||||||
|
10.12
|
10-Q
|
000-55039
|
10.1
|
November 7, 2017
|
||||||||
|
21
|
†
|
|||||||||||
|
23
|
†
|
|||||||||||
110
|
Incorporated by Reference
|
||||||||||||
|
Exhibit
Number
|
Description
|
Form
|
File No.
|
Exhibit
|
Filing Date
|
Filed Herewith
|
||||||
|
31.1
|
†
|
|||||||||||
|
31.2
|
†
|
|||||||||||
|
32
|
†
|
|||||||||||
|
101.INS
|
XBRL Instance Document.
|
|||||||||||
|
101.DEF
|
XBRL Taxonomy Extension Definition Linkbase Document.
|
|||||||||||
|
101.SCH
|
XBRL Taxonomy Extension Schema Document.
|
|||||||||||
|
101.CAL
|
XBRL Taxonomy Extension Calculation Linkbase Document.
|
|||||||||||
|
101.LAB
|
XBRL Taxonomy Extension Label Linkbase Document.
|
|||||||||||
|
101.PRE
|
XBRL Taxonomy Extension Presentation Linkbase Document.
|
|||||||||||
|
*
|
Indicates a management plan or compensatory plan or arrangement.
|
111
SIGNATURES
Pursuant to the requirements of Section 13 or 15(d) of the Securities Exchange Act of 1934, the registrant has duly caused this report to be signed on its behalf by the undersigned, thereunto duly authorized.
|
Date:
|
February 26, 2018
|
BioTelemetry, Inc.
|
||
|
By:
|
/s/ JOSEPH H. CAPPER
|
|||
|
Joseph H. Capper
President and Chief Executive Officer
|
||||
Pursuant to the requirements of the Securities Exchange Act of 1934, this report has been signed below by the following persons on behalf of the registrant and in the capacities and on the dates indicated.
|
Signature
|
Title
|
Date
|
||
|
/s/ JOSEPH H. CAPPER
|
President and Chief Executive Officer (Principal Executive Officer)
|
February 26, 2018
|
||
|
Joseph H. Capper
|
||||
|
/s/ HEATHER C. GETZ
|
Executive Vice President and Chief Financial Officer (Principal Financial and Accounting Officer)
|
February 26, 2018
|
||
|
Heather C. Getz, CPA
|
||||
|
/s/ KIRK E. GORMAN
|
Chairman and Director
|
February 26, 2018
|
||
|
Kirk E. Gorman
|
||||
|
/s/ ANTHONY J. CONTI
|
Director
|
February 26, 2018
|
||
|
Anthony J. Conti
|
||||
|
/s/ JOSEPH A. FRICK
|
Director
|
February 26, 2018
|
||
|
Joseph A. Frick
|
||||
|
/s/ COLIN HILL
|
Director
|
February 26, 2018
|
||
|
Colin Hill
|
||||
|
/s/ REBECCA RIMEL
|
Director
|
February 26, 2018
|
||
|
Rebecca Rimel
|
||||
|
/s/ ROBERT J. RUBIN
|
Director
|
February 26, 2018
|
||
|
Robert J. Rubin, M.D.
|
||||
112
TABLE OF CONTENTS
Part IItem 1. BusinessItem 1A. Risk FactorsItem 1B. Unresolved Staff CommentsItem 2. PropertiesItem 3. Legal ProceedingsItem 4. Mine Safety DisclosuresPart IIItem 5. Market For Registrant S Common Equity, Related Stockholder Matters and Issuer Purchases Of Equity SecuritiesItem 6. Selected Financial DataItem 7. Management S Discussion and Analysis Of Financial Condition and Results Of OperationsItem 7A Quantitative and Qualitative Disclosures About Market RiskItem 8. Financial Statements and Supplementary DataNote 5. Fair Value MeasurementsItem 9. Changes in and Disagreements with Accountants on Accounting and Financial DisclosureItem 9A Controls and ProceduresItem 9B. Other InformationPart IIIItem 10. Directors, Executive Officers and Corporate GovernanceItem 11. Executive CompensationItem 12 Security Ownership Of Certain Beneficial Owners and Management and Related Stockholder MattersItem 13. Certain Relationships and Related Transactions, and Director IndependenceItem 14. Principal Accountant Fees and ServicesPart IVItem 15. Exhibits and Financial Statement SchedulesItem 16. Form 10-k Summary