BRIGHT HORIZONS FAMILY SOLUTIONS INC.
10-Ks and 10-Qs
|
|
|
|
|
|
|
|
|
|
|
|
|
|
|
|
|
|
|
|
|
|
|
|
|
|
|
|
|
|
|
|
|
|
|
|
|
|
|
|
|
|
|
|
UNITED STATES
SECURITIES AND EXCHANGE COMMISSION
Washington, D.C. 20549
FORM 10-K
|
x
|
ANNUAL REPORT PURSUANT TO SECTION 13 OR 15(d) OF THE SECURITIES EXCHANGE ACT OF 1934
|
|
For the fiscal year ended December 31, 2016
|
|
OR
|
¨
|
TRANSITION REPORT PURSUANT TO SECTION 13 OR 15(d) OF THE SECURITIES EXCHANGE ACT OF 1934
|
For the transition period from
to
.
Commission File Number: 001-35780
BRIGHT HORIZONS FAMILY SOLUTIONS INC.
(Exact name of registrant as specified in its charter)
|
DELAWARE
|
80-0188269
|
|
|
(State or other jurisdiction of
incorporation or organization)
|
(IRS Employer
Identification No.)
|
|
200 Talcott Avenue South
Watertown, MA 02472
(Address of principal executive offices and zip code)
(617) 673-8000
(Registrant’s telephone number, including area code)
Securities registered pursuant to Section 12(b) of the Act:
|
Title of each class
|
Name of exchange on which registered
|
|
|
Common Stock, $0.001 par value per share
|
New York Stock Exchange
|
|
Securities registered pursuant to Section 12(g) of the Act: None
Indicate by check mark if the registrant is a well-known seasoned issuer, as defined in Rule 405 of the Securities Act. Yes
x
No
¨
Indicate by check mark if the registrant is not required to file reports pursuant to Section 13 or Section 15(d) of the Act. Yes
¨
No
x
Indicate by check mark whether the registrant (1) has filed all reports required to be filed by Section 13 or 15(d) of the Securities Exchange Act of 1934 during the preceding 12 months (or for such shorter period that the registrant was required to file such reports), and (2) has been subject to such filing requirements for the past 90 days. Yes
x
No
¨
Indicate by check mark whether the registrant has submitted electronically and posted on its corporate Web site, if any, every Interactive Data File required to be submitted and posted pursuant to Rule 405 of Regulation S-T (§232.405 of this chapter) during the preceding 12 months (or for such shorter period that the registrant was required to submit and post such files). Yes
x
No
¨
Indicate by check mark if disclosure of delinquent filers pursuant to Item 405 of Regulation S-K (§229.405 of this chapter) is not contained herein, and will not be contained, to the best of the registrant’s knowledge, in definitive proxy or information statements incorporated by reference in Part III of this Form 10-K or any amendment to this Form 10-K.
¨
Indicate by check mark whether the registrant is a large accelerated filer, an accelerated filer, a non-accelerated filer, or a smaller reporting company. See definitions of “large accelerated filer,” “accelerated filer”, and “smaller reporting company” in Rule 12b-2 of the Exchange Act.:
|
Large accelerated filer
|
x
|
Accelerated filer
|
¨
|
|
Non-accelerated filer
|
¨
(Do not check if a smaller reporting company)
|
Smaller reporting company
|
¨
|
Indicate by check mark whether the registrant is a shell company (as defined in Rule 12b-2 of the Act). Yes
¨
No
x
The aggregate market value of the shares of common stock of the registrant held by non-affiliates of Bright Horizons Family Solutions Inc. computed by reference to the closing price of the registrant’s common stock on the New York Stock Exchange as of June 30,
2016
was approximately
$2.9 billion
.
As of
February 10, 2017
, there were
59,511,773
outstanding shares of the registrant’s common stock, $0.001 par value per share, which is the only outstanding capital stock of the registrant.
DOCUMENTS INCORPORATED BY REFERENCE
Portions of the registrant’s definitive Proxy Statement for the
2017
Annual Meeting of Stockholders to be filed with the Securities and Exchange Commission pursuant to Regulation 14A not later than 120 days after the end of the fiscal year covered by this Annual Report on Form 10-K, are incorporated by reference in Part III, Items 10-14 of this Annual Report on Form 10-K.
BRIGHT HORIZONS FAMILY SOLUTIONS INC.
TABLE OF CONTENTS
|
Page
|
||
|
Part I.
|
||
|
Item 1.
|
||
|
Item 1A.
|
||
|
Item 1B.
|
||
|
Item 2.
|
||
|
Item 3.
|
||
|
Item 4.
|
||
|
Part II.
|
||
|
Item 5.
|
||
|
Item 6.
|
||
|
Item 7.
|
||
|
Item 7A.
|
||
|
Item 8.
|
||
|
Item 9.
|
||
|
Item 9A.
|
||
|
Item 9B.
|
||
|
Part III.
|
||
|
Item 10.
|
||
|
Item 11.
|
||
|
Item 12.
|
||
|
Item 13.
|
||
|
Item 14.
|
||
|
Part IV.
|
||
|
Item 15.
|
||
3
CAUTIONARY NOTE REGARDING FORWARD-LOOKING STATEMENTS
This Annual Report on Form 10-K includes statements that express our opinions, expectations, beliefs, plans, objectives, assumptions or projections regarding future events or future results and therefore are, or may be deemed to be, “forward-looking statements” within the meaning of the Private Securities Litigation Reform Act of 1995 (the “Act”). The following cautionary statements are being made pursuant to the provisions of the Act and with the intention of obtaining the benefits of the “safe harbor” provisions of the Act. These forward-looking statements can generally be identified by the use of forward-looking terminology, including the terms “believes,” “expects,” “may,” “will,” “should,” “seeks,” “projects,” “approximately,” “intends,” “plans,” “estimates” or “anticipates,” or, in each case, their negatives or other variations or comparable terminology. These forward-looking statements include all matters that are not historical facts. They appear in a number of places throughout this Annual Report and include statements regarding our intentions, beliefs or current expectations concerning, among other things, our results of operations, financial condition, liquidity, prospects, the industries in which we and our partners operate, industry and demographic trends, market and leadership position, performance and growth factors, demand for services, competitive strengths and differentiators, growth strategy and opportunities for expansion, acquisitions and integration, utilization rates, marketing strategies, intellectual property, regulatory compliance, employee relationships, ability to attract new clients, debt and indebtedness, ability to obtain financing, ability to attract key employees, dividend policy, impact of the macroeconomic environment, properties, outcome of litigation and legal proceedings, new center openings, center closings, future interest payments, amortization expense, cash flow and use of cash, operating and capital expenditures, cash from operations, fixed asset expenditures, exchange rates, impact of tax benefits, tax rates, tax audits and settlements, credit risk, impact of new accounting pronouncements, share repurchases, repatriation of earnings, and insurance and worker's compensation claims.
By their nature, forward-looking statements involve risks and uncertainties because they relate to events and depend on circumstances that may or may not occur in the future. We believe that these risks and uncertainties include, but are not limited to, those described under “Risk Factors” and elsewhere in this Annual Report and in our other public filings with the Securities and Exchange Commission.
Although we base these forward-looking statements on assumptions that we believe are reasonable when made, we caution you that forward-looking statements are not guarantees of future performance and that our actual results of operations, financial condition and liquidity, and the development of the industry in which we operate may differ materially from those made in or suggested by the forward-looking statements contained in this Annual Report. In addition, even if our results of operations, financial condition and liquidity, and the development of the industry in which we operate, are consistent with the forward-looking statements contained in this Annual Report, those results or developments may not be indicative of results or developments in subsequent periods.
Given these risks and uncertainties, you are cautioned not to place undue reliance on these forward-looking statements. Any forward-looking statement that we make in this Annual Report speaks only as of the date of such statement, and we undertake no obligation to update any forward-looking statements or to publicly announce the results of any revisions to any of those statements to reflect future events or developments, except as required by law.
4
Our Company
We are a leading provider of high-quality child care, early education, back-up dependent care and educational advisory services that help employers and families better address the challenges of work and family life. We provide services primarily under multi-year contracts with employers who offer child care and other dependent care solutions, as well as other educational advisory services, as part of their employee benefits packages to improve employee engagement, productivity, recruitment and retention. As of
December 31, 2016
, we had more than
1,100
client relationships with employers across a diverse array of industries, including
150
Fortune 500 companies and more than
80
of
Working Mother
magazine’s
2016
“100 Best Companies for Working Mothers.” Our service offerings include:
|
•
|
Center-based full service child care and early education (approximately
84%
of our revenue in
2016
);
|
|
•
|
Back-up dependent care (approximately
13%
of our revenue in
2016
); and
|
|
•
|
Educational advisory services (approximately
3%
of our revenue in
2016
).
|
As of
December 31, 2016
, we operated a total of
1,035
child care and early education centers across a wide range of customer industries with the capacity to serve approximately
115,000
children in the United States, as well as in the United Kingdom, the Netherlands, Ireland, Canada and India. We have achieved satisfaction ratings of approximately
95%
among respondents in our employer and parent satisfaction surveys over each of the past
seven
years and an annual client retention rate of
96%
for employer-sponsored centers over each of the past
10
years.
Our History
Since 1986, we have operated child care and early education centers for employers and working families. In 1998, we transformed our business through the merger of Bright Horizons, Inc. and Corporate Family Solutions, Inc., both then Nasdaq-listed companies that were founded in 1986 and 1987, respectively. We were listed on Nasdaq from 1998 to May 2008, when we were acquired by investment funds affiliated with Bain Capital Partners LLC (collectively, the “Sponsor”). We refer to this as our “going private transaction.” On January 30, 2013, we completed our initial public offering (the “Offering”) and our common stock is listed on the New York Stock Exchange (“NYSE”) under the symbol “BFAM.”
Throughout our history, we have continued to grow through challenging economic times while investing in our future. We have grown our international footprint to become a leading provider in the center-based child care market in the United Kingdom and have expanded into the Netherlands, Ireland, Canada and India as a platform for further international expansion. In the United States, we have grown our partnerships with employer clients by expanding and enhancing our back-up dependent care services and by developing and growing our educational advisory services. We have invested in new technologies to better support our full suite of services and expanded our marketing efforts with additional focus on maximizing occupancy levels in centers where we can improve our economics with increased enrollment.
Industry Overview
We compete in the global market for child care and early education services as well as the market for work/life services offered by employers as benefits to employees. The child care industry can generally be subdivided into center-based and home-based child care. We operate in the center-based market, which is highly fragmented.
The center-based child care market includes both retail and employer-sponsored centers and can be further divided into full-service centers and back-up centers. The employer-sponsored model, which has been central to our business since we were founded in 1986, is characterized by a single employer or consortium of employers entering into a long-term contract for the provision of child care at a center located at or near the employer sponsor’s worksite. The employer sponsor generally funds the development as well as ongoing maintenance and repair of a child care center at or near its worksite and subsidizes the provision of child care services to make them more affordable for its employees.
Additionally, we compete in the growing markets for back-up dependent care and educational advisory services, and we believe we are the largest and one of the only multi-national providers of back-up dependent care services.
Industry Trends
We believe that the following key factors contribute to growth in the markets for employer-sponsored child care and for back-up dependent care and educational advisory services.
Increasing Participation by Women and Two Working Parent Families in the Workforce
. A significant percentage of mothers currently participate in the workforce. In 2015, 64% of mothers with children under the age of 6 participated in the workforce in the United States, according to the Bureau of Labor Statistics. In 2014, women earned 52% of all doctorate
5
degrees and 58% of masters degrees in the United States, according to a 2015 report by the National Center for Education Statistics. We expect that the number of working mothers and two working parent families will continue to increase over time, resulting in an increase in the need for child care and other work/life services.
Greater Demand for High-Quality Center-Based Child Care and Early Education.
We believe that recognition of the importance of early education and consistent quality child care has led to increased demand for higher-quality center-based care. In 2007, the number of children aged three to six enrolled in center-based child care was 55%, compared to approximately 61% of such children in 2012, according to data gathered by the Federal Interagency Forum on Child and Family Statistics.
With the shift towards center-based care, there is an increased focus on the establishment of objective, standards-based methods of defining and measuring the quality of child care, such as accreditation. In a highly fragmented market comprised largely of center operators lacking scale, we believe this trend will favor larger industry participants with the size and capital resources to achieve quality standards on a consistent basis.
Recognized Return on Investment to Employers.
Based on studies we have conducted through our Horizons Workforce Consulting practice, we believe that employer sponsors of center-based child care and back-up dependent care services realize strong returns on their investments from reduced turnover and increased productivity. We estimate that users of our back-up dependent care services have been able to work, on average, six days annually that they otherwise would have missed due to breakdowns in child care arrangements. Additionally, according to a 2015 survey of our clients, 92% of respondents reported that access to dependable back-up dependent care helps them to focus on work and be more productive. We believe that this return on investment for employers will result in additional growth in employer-sponsored back-up dependent care services.
Growing Global Demand for Child Care and Early Education Services
. We expect that a long-term shift to service-based economies and an increasing emphasis on education by government and families will contribute to further growth in the global child care and early education market as well as the developing markets for back-up dependent care and educational advisory services. In addition, in certain countries in which we operate, public policy decisions have facilitated increased demand for child care and early education services. In 2006, the United Kingdom instituted a 10 year plan to make child care more accessible and more affordable for all parents. In the Netherlands, a 2005 child care law increased the demand for child care and early education services by making child care more affordable for working families and thereby encouraging women to return to the workforce.
Labor Shortage and Skills Gap
. Employers are facing potentially significant labor shortages and skills gaps as roughly 3.5 million baby boomers per year are now approaching retirement as they begin to reach the age of 65. As a result, there is a renewed focus on the importance of recruiting and retention, as well as the continued education and training of the existing workforce, including through alignment of learning and development goals with tuition reimbursement program funding. A recent survey found that 92% of executives believe there is a serious gap in workforce skills, and nearly 50% are struggling to fill jobs. This problem will be further compounded by an increase in retirements and a shrinking workforce, according to a 2014 report by the U.S. Chamber of Commerce Foundation. We believe this potential need will encourage employers to invest in center-based full service child care, back-up dependent care services and educational advisory services as a means to bolster recruitment and retention.
Our Competitive Strengths
Market Leading Service Provider
We believe we are the leader in the markets for employer-sponsored center-based child care and back-up dependent care, and that the breadth, depth and quality of our service offerings—developed over a successful 30-year history—represent significant competitive advantages. We have approximately six times more employer-sponsored centers in the United States than our closest competitor, according to Child Care Information Exchange’s
2010 Employer Child Care Trend Report
. We believe the broad geographic reach of our child care centers, with targeted clusters in areas where we believe demand is generally higher and where income demographics are attractive, provides us with an effective platform to market our services to current and new clients.
Collaborative, Long-term Relationships with Diverse Customer Base
We have more than
1,100
client relationships with employers across a diverse array of industries, including
150
of the Fortune 500 companies, with our largest client contributing less than
2%
of our revenue in fiscal
2016
and our largest 10 clients representing less than
9%
of our revenue in the same year. Our business model emphasizes multi-year employer sponsorship contracts where our clients typically fund the development of new child care centers at or near to their worksites and frequently support the ongoing operations of these centers.
Our multiple service points with both employers and employees give us unique insight into the corporate culture of our clients. This enables us to identify and provide innovative and tailored solutions to address our clients’ specific work/life needs.
6
In addition to full service center-based care, we provide access to a multi-national back-up dependent care network and educational advisory support, allowing us to offer various combinations of services to best meet the needs of specific clients or specific locations for a single client. We believe our tailored, collaborative approach to employer-sponsored child care has resulted in an annual client retention rate for employer-sponsored centers of approximately
96%
over each of the past ten years.
Commitment to Quality
Our business is anchored in our commitment to consistently provide high-quality service offerings to employers and families. We have therefore designed our child care centers to meet or exceed applicable accreditation and rating standards in all of our key markets, including in the United States through the National Academy of Early Childhood Programs, a division of the National Association for the Education of Young Children, and in the United Kingdom through the ratings of the Office of Standards in Education. We believe that our voluntary commitment to achieving accreditation standards offers a competitive advantage in securing employer sponsorship opportunities and in attracting and retaining families, because an increasing number of potential and existing employer clients require adherence to accreditation criteria.
We maintain our proprietary curriculum at the forefront of early education practices by introducing elements that respond to the changing expectations and views of society and new information and theories about the ways in which children learn and grow. We also believe that strong adult-to-child ratios are a critical factor in delivering our curriculum effectively as well as helping to facilitate more focused care. Our programs often provide adult-to-child ratios that are more stringent than many state licensing standards.
Market Leading People Practices
Our ability to deliver consistently high-quality care, education and other services is directly related to our ability to attract, retain and motivate our highly skilled workforce. We have consistently been named as a top employer by third-party sources in the United States, the United Kingdom and the Netherlands, including being named as one of the “100 Best Places to Work in America” by
Fortune Magazine
16
times, as well as a great place to work in the United Kingdom, Netherlands, and Scotland by the Great Place to Work Institute. We have also been named the #1 Best Place to Work by the Boston Globe multiple times, including most recently in 2016.
We believe the education and experience of our center leaders and teachers exceed the industry average. In addition to recurring in-center training and partial tuition reimbursement for continuing education, we have developed a training program that establishes standards for our teachers as well as an in-house online training academy, which allows our employees to earn nationally-recognized child development credentials.
Capital Efficient Operating Model Provides Platform for Growth with Attractive Economics
We have achieved uninterrupted year-over-year revenue and adjusted EBITDA growth for each of the last 15 years despite broader macro-economic fluctuations. With employer sponsors funding the majority of the capital required for new centers developed on their behalf, we have been able to grow our business with limited capital investment, which has contributed to strong cash flows from operations.
Proven Acquisition Track Record
We have an established acquisition team to pursue potential targets using a proven framework to effectively evaluate potential transactions with the goal of maximizing our return on investment while minimizing risk. Since 2006, and as of
December 31, 2016
, we have completed acquisitions of
402
child care centers in the United States, the United Kingdom and the Netherlands, as well as providers of back-up dependent care services and educational advisory services in the United States.
Our Growth Strategy
We believe that there are significant opportunities to continue to grow our business globally and expand our leadership position by continuing to execute on the following strategies.
Grow Our Client Relationships
|
•
|
Secure Relationships with New Employer Clients.
Our addressable market includes approximately
15,000
employers, each with at least
1,000
employees, within the industries that we currently service in the United States and the United Kingdom. Our dedicated sales force focuses on establishing new client relationships and is supported by our Horizons Workforce Consulting practice, which helps potential clients to identify the precise work/life offerings that will best meet their strategic goals.
|
|
•
|
Cross-Sell and Expand Services to Existing Employer Clients.
We believe there is a significant opportunity to increase the number of our clients that use more than one of our services, and to expand the services we provide to existing clients.
|
7
|
•
|
Continue to Expand Through the Assumption of Management of Existing Sponsored Child Care Centers.
We occasionally assume the management of existing centers from the incumbent management team, which enables us to develop new client relationships, typically with no capital investment and no purchase price payment.
|
Sustain Annual Price Increases to Enable Continued Investments in Quality
We look for opportunities to invest in quality as a way to enhance our reputation with our clients and their employees. By developing a strong reputation for high-quality services and facilities, we have been able to support consistent price increases that have kept pace with our cost increases. Over our history, these price increases have contributed to our revenue growth and have enabled us to drive margin expansion.
Increase Utilization at Existing Centers
In addition to continuing to increase enrollment levels in our more recently opened profit and loss centers, we believe that our mature profit and loss centers (centers that have been open for more than three years, as more fully described below) are currently operating at utilization levels below our target run rate, in part due to a general deterioration in economic condition from 2008 to 2010. Utilization rates at our mature profit and loss centers stabilized in 2010 and have grown since. We expect to further close the gap between current utilization rates and our target run rate over the next few years.
Selectively Add New Lease/Consortium Centers and Expand Through Selective Acquisitions
We have typically added approximately fifteen new lease/consortium centers (as more fully described below) annually for the past four years, focusing on urban or city surrounding markets where demand is generally higher and where income demographics are generally more supportive of a new center. In addition, we have a long track record of successfully completing and integrating selective acquisitions. The domestic and international markets for child care and other family support services remain highly fragmented. We will therefore continue to seek attractive opportunities both for center acquisitions and the acquisition of complementary service offerings.
Our Operations
Our primary reporting and operating segments are full-service center-based child care services and back-up dependent care services. Full-service center-based child care includes traditional center-based child care, preschool and elementary education. Back-up dependent care includes center-based back-up child care, in-home well child care, in-home mildly-ill child care and adult/elder care. Our remaining operations are included in other educational advisory services.
The following table sets forth our segment information as of the dates and for the periods indicated. Additional segment information is included in Note 15, “Segment and Geographic Information,” included in the notes to the consolidated financial statements appearing elsewhere in this Annual Report on Form 10-K.
|
Full Service
Center-Based Child Care Services |
Back-up
Dependent Care Services |
Other
Educational Advisory Services |
Total
|
||||||||||||
|
(In thousands, except percentages)
|
|||||||||||||||
|
Year ended December 31, 2016
|
|||||||||||||||
|
Revenue
|
$
|
1,321,699
|
|
$
|
200,106
|
|
$
|
48,036
|
|
$
|
1,569,841
|
|
|||
|
As a percentage of total revenue
|
84
|
%
|
13
|
%
|
3
|
%
|
100
|
%
|
|||||||
|
Income from operations
|
$
|
129,693
|
|
$
|
57,620
|
|
$
|
9,925
|
|
$
|
197,238
|
|
|||
|
As a percentage of total income from operations
|
66
|
%
|
29
|
%
|
5
|
%
|
100
|
%
|
|||||||
|
Year ended December 31, 2015
|
|||||||||||||||
|
Revenue
|
$
|
1,236,762
|
|
$
|
181,574
|
|
$
|
40,109
|
|
$
|
1,458,445
|
|
|||
|
As a percentage of total revenue
|
85
|
%
|
12
|
%
|
3
|
%
|
100
|
%
|
|||||||
|
Income from operations
|
$
|
115,149
|
|
$
|
56,891
|
|
$
|
9,562
|
|
$
|
181,602
|
|
|||
|
As a percentage of total income from operations
|
64
|
%
|
31
|
%
|
5
|
%
|
100
|
%
|
|||||||
|
Year ended December 31, 2014
|
|||||||||||||||
|
Revenue
|
$
|
1,156,661
|
|
$
|
162,886
|
|
$
|
33,452
|
|
$
|
1,352,999
|
|
|||
|
As a percentage of total revenue
|
86
|
%
|
12
|
%
|
2
|
%
|
100
|
%
|
|||||||
|
Income from operations
|
$
|
92,229
|
|
$
|
49,317
|
|
$
|
5,374
|
|
$
|
146,920
|
|
|||
|
As a percentage of total income from operations
|
63
|
%
|
33
|
%
|
4
|
%
|
100
|
%
|
|||||||
8
Full-Service Center-Based Child Care Services
We provide our center-based child care services under two general business models: a profit and loss (“P&L”) model, where we assume the financial risk of operating a child care center; and a cost-plus model, where we are paid a fee by an employer client for managing a child care center on a cost-plus basis. The P&L model is further classified into two subcategories:
|
•
|
a sponsor model, where we provide child care and early education services on either an exclusive or priority enrollment basis for the employees of a specific employer sponsor; and
|
|
•
|
a lease/consortium model, where we provide child care and early education services to the employees of multiple employers located within a specific real estate development (for example, an office building or office park), as well as to families in the surrounding community.
|
In both our cost-plus and sponsor P&L models, the development of a new child care center, as well as ongoing maintenance and repair, is typically funded by an employer sponsor with whom we enter into a multi-year contractual relationship. In addition, employer sponsors typically provide subsidies for the ongoing provision of child care services for their employees.
Our full-service center operations are organized into geographic divisions led by a Division Vice President of Center Operations who, in turn, reports to a Senior Vice President of Center Operations. Each division is further divided into regions, each supervised by a Regional Manager who oversees the operational performance of approximately six to eight centers and is responsible for supervising the program quality, financial performance and client relationships. A typical center is managed by a small administrative team under the leadership of a Center Director. A Center Director has day-to-day operating responsibility for the center, including training, management of staff, licensing compliance, implementation of curricula, conducting child assessments and enrollment. Our corporate offices provide centralized administrative support for accounting, finance, information systems, legal, payroll, risk management, marketing and human resources functions. We follow this underlying operational structure for center operations in each country in which we operate.
Center hours of operation are designed to match the schedules of employer sponsors and working families. Most of our centers are open 10 to 12 hours a day with typical hours of operation from 7:00 a.m. to 6:00 p.m., Monday through Friday. We offer a variety of enrollment options, ranging from full-time to part-time scheduling.
Tuition paid by families varies depending on the age of the child, the child's attendance schedule, the geographic location and the extent to which an employer sponsor subsidizes tuition. Based on a sample of
365
of our child care and early education centers in the United States, the average tuition rate at our centers is
$1,780
per month for infants (typically ages three to sixteen months),
$1,630
per month for toddlers (typically ages sixteen months to three years) and
$1,350
per month for preschoolers (typically ages 3 to 5 years). Tuition at most of our child care and early education centers is payable in advance and is due either monthly or weekly. In most cases, families pay tuition through payroll deductions or through Automated Clearing House withdrawals.
Revenue per center typically averages between $
1.5 million
and
$1.8 million
at our centers in North America, and averages between
$0.9 million
and
$1.2 million
at our centers in Europe, primarily due to the larger average size of our centers in North America. Gross margin at our centers typically averages between
20%
and
25%
, with our cost-plus model centers typically at the lower end of that range and our lease/consortium centers at the higher end.
Cost of services consists of direct expenses associated with the operation of child care and early education centers primarily comprised of payroll and benefits for personnel, food costs, program supplies and materials, parent marketing and facilities costs, which include depreciation. Personnel costs are the largest component of a center’s operating costs and comprise approximately
70%
of a center’s operating expenses. In a P&L model center, we are often responsible for additional costs that are typically paid or provided directly by a client in centers operating under the cost-plus model, such as facilities costs. As a result, personnel costs in centers operating under P&L models will often represent a smaller percentage of overall costs when compared to centers operating under cost-plus models.
Selling, general and administrative expenses (“SGA”) relating to full-service care consist primarily of salaries, payroll taxes and benefits (including stock-based compensation costs) for non-center personnel, which includes corporate, regional and business development personnel, accounting and legal, information technology, occupancy costs for corporate and regional personnel, management/advisory fees and other general corporate expenses.
Back-Up Dependent Care Services
We provide back-up dependent care services through our full-service centers, our dedicated back-up centers, as well as through our Back-Up Care Advantage (“BUCA”) program. BUCA offers access to a contracted network of approximately 3,000 in-home care agencies and center-based providers in locations where we do not otherwise have centers with available capacity.
9
Our back-up dependent care division is led by our Executive Vice President of Operations, with a Senior Vice President leading the BUCA program and a Divisional Vice President leading back-up center operations. The dedicated back-up centers that we operate are organized in a similar structure to full-service centers, with Regional Managers overseeing approximately six to eight centers each and with center-based administrative teams that mirror the administrative teams in full-service centers. The dedicated back-up centers are either exclusive to a single employer or are consortium centers that have multiple employer sponsors and are part of our BUCA program.
Care is arranged through a 24 hours-a-day contact center, online or via our mobile application, allowing employees to reserve care in advance or at the last minute. We operate our own contact center in Broomfield, Colorado, which is overseen by the Senior Vice President responsible for BUCA, and we contract with additional contact centers located in Durham, North Carolina, and Chicago, Illinois, to complement our ability to handle demand fluctuations and to provide seamless service 24 hours a day.
Back-up dependent care revenue is comprised of fees or subsidies paid by employer sponsors, as well as co-payments collected from users at the point of service. Cost of services consist of fees paid to providers for care delivered as part of their contractual relationships with us, personnel and related direct service costs of the contact centers and any other expenses related to the coordination or delivery of care and service. For our dedicated back-up centers, cost of services also includes all direct expenses associated with the operation of the centers. SGA related to back-up dependent care is similar to SGA for full-service care, with additional expenses related to the information technology necessary to operate this service, the ongoing development and maintenance of the provider network and additional personnel needed as a result of more significant client management and reporting requirements.
Educational Advisory Services
Our educational advisory services consist of our EdAssist and College Coach services. Educational advisory services revenue is comprised of fees or subsidies paid by employer clients, network school partners, as well as retail fees collected from users at the point of service. Cost of services consist of personnel and direct service costs of the contact centers, and other expenses related to the coordination and delivery of outsourced tuition reimbursement program management, advisory and counseling services. SGA related to educational advisory services is similar to SGA for back-up dependent care.
EdAssist.
EdAssist provides tuition reimbursement program management services for corporate clients. Administration services are provided through a proprietary software system for processing and data analytics, as well as a team of compliance professionals who audit employee's applications for tuition reimbursement and enforce our corporate client's policies. We also provide educational advising to client employees on a one-on-one basis through our team of advisors, who help employees make better decisions regarding their education. Customer service is also provided through the contact center in Broomfield, Colorado. The EdAssist services derive revenue directly from fees paid by employers under contracts that are typically three years in length. The EdAssist division is managed by a Senior Vice President who has responsibility for the growth and profitability of this division.
College Coach.
College Coach provides college advisory services through our team of experts, all of whom have experience working at senior levels in admissions or financial aid at colleges and universities. We work with employer clients who offer these services as a benefit to their employees, and we also provide these services directly to families on a retail basis. We have
10
College Coach offices in the United States, located primarily in metropolitan areas, where we believe the demand for these services is greatest. College Coach derives revenue mainly from employer clients who contract with us for a specified number of workshops, access to our proprietary online learning center and individual counseling. The College Coach division is managed by a Senior Vice President who has responsibility for the growth and profitability of this division.
Seasonality
Our business is subject to seasonal and quarterly fluctuations. Demand for child care and early education and elementary school services has historically decreased during the summer months when school is not in session, at which time families are often on vacation or have alternative child care arrangements. In addition, our enrollment declines as older children transition to elementary schools. Demand for our services generally increases in September and October coinciding with the beginning of the new school year and remains relatively stable throughout the rest of the school year. In addition, use of our back-up dependent care services tends to be higher when schools are not in session and during holiday periods, which can increase the operating costs of the program and impact the results of operations. Results of operations may also fluctuate from quarter to quarter as a result of, among other things, the performance of existing centers, including enrollment and staffing fluctuations, the number and timing of new center openings, acquisitions and management transitions, the length of time required for new centers to achieve profitability, center closings, refurbishment or relocation, the contract model mix (P&L versus cost-plus) of new and existing centers, the timing and level of sponsorship payments, competitive factors and general economic conditions.
10
Geography
We operate in two primary regions: North America, which includes the United States, Canada and Puerto Rico, and Europe, which we define to include the United Kingdom, the Netherlands, Ireland and India. The following table sets forth certain financial data for these geographic regions for the periods indicated.
|
North America
|
Europe and Other
|
Total
|
|||||||||
|
(In thousands, except percentages)
|
|||||||||||
|
Year ended December 31, 2016
|
|||||||||||
|
Revenue
|
$
|
1,277,165
|
|
$
|
292,676
|
|
$
|
1,569,841
|
|
||
|
As a percentage of total revenue
|
81
|
%
|
19
|
%
|
100
|
%
|
|||||
|
Long-lived assets, net
|
$
|
322,267
|
|
$
|
207,165
|
|
$
|
529,432
|
|
||
|
As a percentage of total fixed assets, net
|
61
|
%
|
39
|
%
|
100
|
%
|
|||||
|
Year ended December 31, 2015
|
|||||||||||
|
Revenue
|
$
|
1,182,629
|
|
$
|
275,816
|
|
$
|
1,458,445
|
|
||
|
As a percentage of total revenue
|
81
|
%
|
19
|
%
|
100
|
%
|
|||||
|
Long-lived assets, net
|
$
|
308,469
|
|
$
|
121,267
|
|
$
|
429,736
|
|
||
|
As a percentage of total fixed assets, net
|
72
|
%
|
28
|
%
|
100
|
%
|
|||||
|
Year ended December 31, 2014
|
|||||||||||
|
Revenue
|
$
|
1,074,951
|
|
$
|
278,048
|
|
$
|
1,352,999
|
|
||
|
As a percentage of total revenue
|
79
|
%
|
21
|
%
|
100
|
%
|
|||||
|
Long-lived assets, net
|
$
|
277,971
|
|
$
|
120,976
|
|
$
|
398,947
|
|
||
|
As a percentage of total fixed assets, net
|
70
|
%
|
30
|
%
|
100
|
%
|
|||||
Our international business primarily consists of child care centers throughout the United Kingdom and the Netherlands and is overseen by a Senior Vice President. As of
December 31, 2016
, we had a total of
340
centers in Europe and
695
centers in North America.
Marketing
We market our services to prospective employer sponsors, current clients and their employees, and to parents. Our sales force is organized on both a centralized and regional basis and is responsible for identifying potential employer sponsors, targeting real estate development opportunities, identifying potential acquisitions and managing the overall sales process. We reach out to employers via word of mouth, direct mail campaigns, digital outreach and advertising, conference networking, webinars and social media. In addition, as a result of our visibility among human resources professionals as a high-quality dependent care service provider, potential employer sponsors regularly contact us requesting proposals, and we often compete for employer-sponsorship opportunities through a request for proposal process. Our management team is involved at the national level with education, work/life and children’s advocacy, and we believe that their prominence and involvement in such issues also helps us attract new business. We communicate regularly with existing clients to increase awareness of the full suite of services that we provide for key life stages and to explore opportunities to enhance current partnerships.
We also have a direct-to-consumer (parent) marketing department that supports parent enrollment efforts through the development of marketing programs, including the preparation of promotional materials. The parent marketing team is organized on both a centralized and regional basis and works with center directors and our contact centers to build enrollment. New enrollment is generated by word of mouth, print advertising, direct mail campaigns, digital marketing, parent referral programs and business outreach. Individual centers may receive assistance from employer sponsors, who often provide access to channels of internal communication, such as e-mail, websites, intranets, mailing lists and internal publications. In addition, many employer sponsors promote the child care and early education center as an important employee benefit.
Competition
We believe that we are a leading provider in the markets for employer-sponsored center-based child care and back-up dependent care. We maintain approximately six times more market share in the United States than our closest competitors who provide employer-sponsored center-based child care. The market for child care and early education services is highly fragmented, and we compete for enrollment and for sponsorship of child care and early education centers with a variety of other businesses including large community-based child care companies, regional child care providers, family day care (operated out of the caregiver’s home), nannies, for-profit and not-for-profit full- and part-time nursery schools, private schools and public elementary schools, and not-for-profit and government-funded providers of center-based child care. Our principal
11
competitors for employer-sponsored centers include KinderCare Education and New Horizons Academy in the United States and Childbase and Busy Bees in the United Kingdom. Competition for back-up dependent care and educational advising comes from some of these same competitors in addition to employee assistance programs, payment processors and smaller work/life companies. In addition, we compete for enrollment on a center-by-center basis with some of the providers named above, along with many local and national providers, such as Learning Care Group, Goddard Schools, Primrose Preschools, The Co-operative Childcare, Smallsteps, and Partou in the United States, the United Kingdom and the Netherlands.
We believe that the key factors in the competition for enrollment are quality of care, site convenience and cost. We believe that many center-based child care providers are able to offer care at lower prices than we do by utilizing less intensive adult-to-child ratios and offering their staff lower compensation and limited or less affordable benefits. While our tuition levels are generally higher than our competitors, we compete primarily based on the convenience of a work-site location and a higher level of program quality. In addition, many of our competitors may have access to greater financial resources (such as access to government funding or other subsidies), or may benefit from broader name recognition (such as established regional providers) or comply, or are required to comply, with fewer or less costly health, safety, and operational regulations than those with which we comply (such as the more limited health, safety and operational regulatory requirements typically applicable to family day care operations in caregivers’ homes). We believe that our primary focus on employer clients and track record for achieving and maintaining high-quality standards distinguishes us from our competitors. We believe we are well-positioned to continue attracting new employer sponsors due to our extensive service offerings, established reputation, position as a quality leader and track record of serving major employer sponsors for 30 years.
Intellectual Property
We believe that our name and logo have significant value and are important to our operations. We own and use various registered and unregistered trademarks covering the names Bright Horizons and Bright Horizons Family Solutions, our logo and a number of other names, slogans and designs. We frequently license the use of our registered trademarks to our clients in connection with the use of our services, subject to customary restrictions. We actively protect our trademarks by registering the marks in a variety of countries and geographic areas, including North America, Asia, the Pacific Rim, Europe and Australia. These registrations are subject to varying terms and renewal options. However, not all of the trademarks or service marks have been registered in all of the countries in which we do business, and we are aware of persons using similar marks in certain countries in which we currently do not do business. Meanwhile, we monitor our trademarks and vigorously oppose the infringement of any of our marks. We do not hold any patents, and we hold copyright registrations for certain materials that are important to the operation of our business. We generally rely on common law protection for those copyrighted works, which are not critical to the operation of our business. We also license some intellectual property from third parties for use in our business. Such licenses are not individually or in the aggregate material to our business.
Regulatory Matters
We are subject to various federal, state and local laws affecting the operation of our business, including various licensing, health, fire and safety requirements and standards. In most jurisdictions in which we operate, our child care centers are required by law to meet a variety of operational requirements, including minimum qualifications and background checks for our teachers and other center personnel. State and local regulations may also impact the design and furnishing of our centers.
Internationally, we are subject to national and local laws and regulations that often are similar to those affecting us in the United States, including laws and regulations concerning various licensing, health, fire and safety requirements and standards. We believe that our centers comply in all material respects with all applicable laws and regulations in these countries.
Health and Safety
The safety and well-being of children and our employees is paramount for us. We employ a variety of security measures at our child care and early education centers, which typically include secure electronic access systems as well as sign-in and sign-out procedures for children, among other site-specific security measures. In addition, our trained teachers and open center designs help ensure the health and safety of children. Our child care and early education centers are designed to minimize the risk of injury to children by incorporating such features as child-sized amenities, rounded corners on furniture and fixtures, age-appropriate toys and equipment and cushioned fall zones surrounding play structures.
Each center is further guided by policies and procedures that address protocols for safe and appropriate care of children and center administration. These policies and procedures establish center protocols in areas including the safe handling of medications, managing child illness or health emergencies and a variety of other critical aspects of care to ensure that centers meet or exceed all mandated licensing standards. These policies and procedures are reviewed and updated continuously by a team of internal experts, and center personnel are trained on center practices using these policies and procedures. Our proprietary
We Care
system supports proper supervision of children and documents the transitions of children to and from the care of teachers and parents or from one classroom to another during the day.
12
Environmental
Our operations, including the selection and development of the properties that we lease and any construction or improvements that we make at those locations, are subject to a variety of federal, state and local laws and regulations, including environmental, zoning and land use requirements. In addition, we have a practice of conducting site evaluations on each freestanding or newly constructed or renovated property that we own or lease. Although we have no known material environmental liabilities, environmental laws may require owners or operators of contaminated property to remediate that property, regardless of fault.
Employees
As of
December 31, 2016
, we had approximately
31,200
employees (including part-time and substitute teachers), of whom approximately
1,700
were employed at our corporate, divisional and regional offices, and the remainders of whom were employed at our child care and early education centers. Child care and early education center employees include teachers and support personnel. The total number of employees includes approximately
10,300
employees working outside of the United States, which increased from the prior year in large part due to the acquisition of approximately 2,600 employees that joined us through the acquisition of Conchord Limited (Asquith). We conduct annual surveys to assess employee satisfaction and can adjust programs, benefits offerings, trainings, communications and other support to meet employee needs and enhance retention. We have a long track record of being named a “Best Place to Work” by
Fortune Magazine
in the United States and more recently in the United Kingdom, Ireland and the Netherlands based largely upon employee responses to surveys. None of our employees are represented by a labor union and we believe our relationships with our employees are good.
Facilities
Our child care and early education centers are primarily operated at work-site locations and vary in design and capacity in accordance with employer sponsor needs and state and local regulatory requirements. Our North American child care and early education centers typically have an average capacity of
127
children. Our locations in Europe have an average capacity of
80
children. As of
December 31, 2016
, our child care and early education centers had a total licensed capacity of approximately
115,000
children, with the smallest center having a capacity of
12
children and the largest having a capacity of approximately
572
children.
We believe that attractive, spacious and child-friendly facilities with warm, nurturing and welcoming atmospheres are an important element in fostering a high-quality learning environment for children. Our centers are designed to be open and bright and to maximize supervision visibility. We devote considerable resources to equipping our centers with child-sized amenities, indoor and outdoor play areas comprised of age-appropriate materials and design, family hospitality areas and computer centers. Commercial kitchens are typically only present in those centers where regulations require that hot meals be prepared on site.
Available Information
The Company files or furnishes reports and other information with the Securities and Exchange Commission (“SEC”). We make available, free of charge, on our corporate website
www.brighthorizons.com
, our annual reports on Form 10-K, quarterly reports on Form 10-Q, current reports on Form 8-K, and all amendments to those reports filed or furnished pursuant to Section 13(a) or 15(d) of the Securities Exchange Act of 1934, as amended (the “Exchange Act”), as soon as reasonably practicable after such material is electronically filed with or furnished to the SEC. The public may read and copy any materials we file with the SEC at the SEC’s Public Reference Room at 100 F Street, N.E., Washington, D.C. 20549. The public may obtain information on the operation of the Public Reference Room by calling the SEC at 1-800-SEC-0330. Information filed with the SEC is also available at
www.sec.gov
. References to these websites do not constitute incorporation by reference of the information contained therein and should not be considered part of this document.
Risks Related to Our Business and Industry
Changes in the demand for child care and other dependent care services, which may be negatively affected by economic conditions, may affect our operating results.
Our business strategy depends on employers recognizing the value in providing employees with child care and other dependent care services as an employee benefit. The number of employers that view such services as cost-effective or beneficial to their workforces may not continue to grow or may diminish. In addition, demographic trends, including the number of two working parent or working single parent families in the workforce, may not continue to lead to increased demand for our services. Such changes could materially and adversely affect our business and operating results.
Even among employers that recognize the value of our services, demand may be adversely affected by general economic conditions. For example, during the 2008-2010 recession, we believe sustained uncertainty in U.S. and global economic
13
conditions and persistently high unemployment domestically resulted in reduced enrollment levels at our mature P&L centers. Should the economy experience additional or prolonged weakness, employer clients may reduce or eliminate their sponsorship of work and family services, and prospective clients may not commit resources to such services. In addition, a reduction in the size of an employer’s workforce could negatively impact the demand for our services and result in reduced enrollment or failure of our employer clients to renew their contracts. A deterioration of general economic conditions may adversely impact the need for our services because out-of-work parents may decrease or discontinue the use of child care services, or be unwilling to pay tuition for high-quality services. Additionally, we may not be able to increase tuition at a rate consistent with increases in our operating costs. If demand for our services were to decrease, it could disrupt our operations and have a material adverse effect on our business and operating results.
Our business depends largely on our ability to hire and retain qualified teachers.
State laws require our teachers and other staff members to meet certain educational and other minimum requirements, and we often require that teachers and staff at our centers have additional qualifications. We are also required by state laws to maintain certain prescribed minimum adult-to-child ratios. If we are unable to hire and retain qualified teachers at a center, we could be required to reduce enrollment or be prevented from accepting additional enrollment in order to comply with such mandated ratios. In certain markets, we may experience labor issues or difficulty in attracting, hiring and retaining qualified teachers, which may require us to offer increased salaries and enhanced benefits in these more competitive markets. This could result in increased costs at centers located in these markets. Difficulties in hiring and retaining qualified personnel may also affect our ability to meet growth objectives in certain geographies and to take advantage of additional enrollment opportunities at our child care and early education centers in these markets.
Our substantial indebtedness could adversely affect our financial condition.
We have a significant amount of indebtedness from the issuance of our term loans and borrowings under our revolving credit facility. Information on our debt is included in “Management's Discussion and Analysis” in Item 7 of Part II of this Annual Report and Note 9 in our consolidated financial statements in Item 8 of Part II of this Annual Report. Our high level of debt could have important consequences, including:
|
•
|
limiting our ability to obtain additional financing to fund future working capital, capital expenditures, acquisitions or other general corporate requirements and increasing our cost of borrowing;
|
|
•
|
requiring a substantial portion of our cash flow to be dedicated to debt service payments instead of other purposes, thereby reducing the amount of cash flow available for working capital, capital expenditures, acquisitions and other general corporate purposes;
|
|
•
|
exposing us to the risk of increased interest rates as certain of our borrowings are at variable rates of interest;
|
|
•
|
limiting our flexibility in planning for and reacting to changes in the industry in which we compete; and
|
|
•
|
placing us at a disadvantage compared to other, less leveraged competitors or competitors with comparable debt at more favorable interest rates.
|
In addition, the borrowings under our senior secured credit facilities bear interest at variable rates. If market interest rates increase, variable rate debt will create higher debt service requirements, which could adversely affect our cash flow. Assuming all amounts under our senior secured credit facilities are fully drawn, a 100 basis point change in interest rates would result in a
$13.0 million
change in annual interest expense on our indebtedness under our senior secured credit facilities (subject to our base rate and Eurocurrency rate, as applicable). While we may in the future enter into agreements limiting our exposure to higher interest rates, any such agreements may not offer complete protection from this risk.
The terms of our indebtedness restrict our current and future operations, particularly our ability to respond to changes or to take certain actions.
The credit agreement governing our senior secured credit facilities contains a number of restrictive covenants that impose significant operating and financial restrictions on us and may limit our ability to engage in acts that may be in our long-term best interest, including restrictions on our ability to incur certain liens, make investments and acquisitions, incur or guarantee additional indebtedness, pay dividends or make other distributions in respect of, or repurchase or redeem, capital stock, or enter into certain other types of contractual arrangements affecting our subsidiaries or indebtedness. In addition, the restrictive covenants in the credit agreement governing our senior secured credit facilities require us to maintain specified financial ratios and satisfy other financial condition tests, and we expect that the agreements governing any new senior secured credit facilities will contain similar requirements to satisfy financial condition tests and, with respect to any new revolving credit facility, maintain specified financial ratios, subject to certain conditions. Our ability to meet those financial ratios and tests can be affected by events beyond our control.
14
A breach of the covenants under the credit agreement governing our senior secured credit facilities, or any replacement facility, could result in an event of default unless we obtain a waiver to avoid such default. If we are unable to obtain a waiver, we may suffer adverse effects on our operations, business and financial condition, and such a default may allow the creditors to accelerate the related debt and may result in the acceleration of or default under any other debt to which a cross-acceleration or cross-default provision applies. In the event our lenders accelerate the repayment of our borrowings, we and our subsidiaries may not have sufficient assets to repay that indebtedness.
Acquisitions may disrupt our operations or expose us to additional risk.
Acquisitions are an integral part of our growth strategy. Acquisitions involve numerous risks, including potential difficulties in the integration of acquired operations, such as bringing new centers through the re-licensing or accreditation processes, successfully implementing our curriculum programs, not meeting financial objectives, increased costs, undisclosed liabilities not covered by insurance or by the terms of the acquisition, diversion of management’s attention and resources in connection with an acquisition, loss of key employees of the acquired operation, failure of acquired operations to effectively and timely adopt our internal control processes and other policies, and write-offs or impairment charges relating to goodwill and other intangible assets. We may not have success in identifying, executing and integrating acquisitions in the future.
The growth of our business may be adversely affected if we do not implement our growth strategies successfully.
Our ability to grow in the future will depend upon a number of factors, including the ability to develop and expand new and existing client relationships, to continue to provide and expand the high-quality services we offer and to hire and train qualified personnel. Achieving and sustaining growth increases requires the successful execution of our growth strategies, which may require the implementation of enhancements to operational and financial systems, expanded sales and marketing capacity and additional or new organizational resources. We may be unable to manage our expanding operations effectively, or we may be unable to maintain or accelerate our growth.
Because our success depends substantially on the value of our brands and reputation as a provider of choice, adverse publicity could impact the demand for our services.
Adverse publicity concerning reported incidents or allegations of physical or sexual abuse or other harm to a child at any child care center, whether or not directly relating to or involving Bright Horizons, could result in decreased enrollment at our child care centers, termination of existing corporate relationships or inability to attract new corporate relationships, or increased insurance costs, all of which could adversely affect our operations. Brand value and our reputation can be severely damaged even by isolated incidents, particularly if the incidents receive considerable negative publicity or result in substantial litigation. These incidents may arise from events that are beyond our ability to control and may damage our brands and reputation, such as instances of physical or sexual abuse or actions taken (or not taken) by one or more center managers or teachers relating to the health, safety or welfare of children in our care. In addition, from time to time, customers and others make claims and take legal action against us. Whether or not customer claims or legal action have merit, they may adversely affect our reputation and the demand for our services. Demand for our services could diminish significantly if any such incidents or other matters erode consumer confidence in us or our services, which would likely result in lower sales, and could materially and adversely affect our business and operating results. Any reputational damage could have a material adverse effect on our brand value and our business, which, in turn, could have a material adverse effect on our financial condition and results of operations.
The success of our operations in international markets is highly dependent on the expertise of local management and operating staff, as well as the political, social, legal and economic operating conditions of each country in which we operate.
The success of our business depends on the actions of our employees. In international markets that are newer to our business, we are highly dependent on our current local management and operating staff to operate our centers in these markets in accordance with local law and best practices. If the local management or operating staff were to leave our employment, we would have to expend significant time and resources building up our management or operational expertise in these markets. Such a transition could adversely affect our reputation in these markets and could materially and adversely affect our business and operating results.
If the international markets in which we compete are affected by changes in political, social, legal, economic or other factors, our business and operating results may be materially and adversely affected. As of
December 31, 2016
, we had
342
centers located in five foreign countries; therefore, we are subject to inherent risks attributed to operating in a global economy. Our international operations may subject us to additional risks that differ in each country in which we operate, and such risks may negatively affect our results. The factors impacting the international markets in which we operate may include changes in laws and regulations affecting the operation of child care centers, the imposition of restrictions on currency conversion or the transfer of funds or increases in the taxes paid and other changes in applicable tax laws.
In addition, instability in European financial markets or other events could cause fluctuations in exchange rates that may affect our revenues. Most of our revenues, costs and debts are denominated in U.S. dollars. However, revenues and costs from our operations outside of the United States are denominated in the currency of the country in which the center is located, and
15
these currencies could become less valuable as a result of exchange rate fluctuations. The current economic challenges in Europe and uncertainties surrounding the pending exit of the United Kingdom from the European Union may cause the value of the European currencies, including the British pound and the Euro, to further deteriorate. Market perceptions concerning this and related issues could adversely affect the value of our Euro- and British pound-denominated assets. Unfavorable currency fluctuations as a result of this and other market forces could result in a reduction in our revenues and net earnings, which in turn could materially and adversely affect our business and operating results.
Our business activities subject us to litigation risks that may lead to significant reputational damage, money damages and other remedies and increase our litigation expense.
Because of the nature of our business, we may be subject to claims and litigation alleging negligence, inadequate supervision or other grounds for liability arising from injuries or other harm to the people we serve, primarily children. We may also be subject to employee claims based on, among other things, discrimination, harassment or wrongful termination. In addition, claimants may seek damages from us for physical or sexual abuse, and other acts allegedly committed by our employees or agents. We face the risk that additional lawsuits may be filed which could result in damages and other costs that our insurance may be inadequate to cover. In addition to diverting our management resources, such allegations may result in publicity that may materially and adversely affect us and our brands, regardless of whether such allegations are valid. Any such claim or the publicity resulting from it may have a material adverse effect on our business, reputation, results of operations and financial condition including, without limitation, adverse effects caused by increased cost or decreased availability of insurance and decreased demand for our services from employer sponsors and families.
Our international operations may be subject to additional risks related to litigation, including difficulties enforcing contractual obligations governed by foreign law due to differing interpretations of rights and obligations, limitations on the availability of insurance coverage and limits, compliance with multiple and potentially conflicting laws, new and potentially untested laws and judicial systems and reduced or diminished protection of intellectual property. A substantial judgment against us or one of our subsidiaries could materially and adversely affect our business and operating results.
Our continued profitability depends on our ability to pass on our increased costs to our customers.
Hiring and retaining key employees and qualified personnel, including teachers, is critical to our business. Because we are primarily a services business, inflationary factors such as wage and benefits cost increases result in significant increases in the costs of running our business. Although we expect to pay employees at rates above the minimum wage, increases in the statutory minimum wage rates could result in a corresponding increase in the wages we pay to our employees. In addition, increased competition for teachers in certain markets could result in significant increases in the costs of running our business. Any employee organizing efforts could also increase our payroll and benefits expenses. Our success depends on our ability to continue to pass along these costs to our customers. In the event that we cannot increase the cost of our services to cover these higher wage and benefit costs without reducing customer demand for our services, our revenues could be adversely affected, which could have a material adverse effect on our financial condition and results of operations, as well as our growth.
Changes in our relationships with employer sponsors may affect our operating results.
We derive a significant portion of our business from child care and early education centers associated with employer sponsors for whom we provide these services at single or multiple sites pursuant to contractual arrangements. Our contracts with employers for full service center-based care typically have terms of three to ten years, and our contracts related to back-up dependent care typically have terms of one to three years. While we have a history of consistent contract renewals, we may not experience a similar renewal rate in the future. The termination or non-renewal of a significant number of contracts or the termination of a multiple-site client relationship could have a material adverse effect on our business, results of operations, financial condition or cash flows.
Significant increases in the costs of insurance or of insurance claims or our deductibles may negatively affect our profitability.
We currently maintain the following major types of commercial insurance policies: workers’ compensation, commercial general liability (including coverage for sexual and physical abuse), professional liability, automobile liability, excess and “umbrella” liability, commercial property coverage, student accident coverage, employment practices liability, commercial crime coverage, fiduciary liability, privacy breach/cyber liability and directors’ and officers’ liability. These policies are subject to various limitations, exclusions and deductibles. To date, we have been able to obtain insurance in amounts we believe to be appropriate. Such insurance, particularly coverage for sexual and physical abuse, may not continue to be readily available to us in the form or amounts we have been able to obtain in the past, or our insurance premiums could materially increase in the future as a consequence of conditions in the insurance business or in the child care industry.
16
We depend on key management and key employees to manage our business.
Our success depends on the efforts, abilities and continued services of our executive officers and other key employees. We believe future success will depend upon our ability to continue to attract, motivate and retain highly-skilled managerial, sales and marketing, divisional, regional and child care and early education center director personnel. Failure to retain our leadership team and attract and retain other important personnel could lead to disruptions in management and operations, which could affect our business and operating results.
Our operating results are subject to seasonal fluctuations.
Our revenue and results of operations fluctuate with the seasonal demands for child care and the other services we provide. Revenue in our child care centers that have mature operating levels typically declines during the third quarter due to decreased enrollments over the summer months as families withdraw children for vacations and older children transition into elementary schools. In addition, use of our back-up services tends to be higher when school is not in session and during holiday periods, which can increase the operating costs of the program and impact results of operations. We may be unable to adjust our expenses on a short-term basis to minimize the effect of these fluctuations in revenue. Our quarterly results of operations may also fluctuate based upon the number and timing of child care center openings and/or closings, acquisitions, the performance of new and existing child care and early education centers, the contractual arrangements under which child care centers are operated, the change in the mix of such contractual arrangements, competitive factors and general economic conditions. The inability of existing child care centers to maintain their current enrollment levels and profitability, the failure of newly opened child care centers to contribute to profitability and the failure to maintain and grow our other services could result in additional fluctuations in our future operating results on a quarterly or annual basis.
Significant competition in our industry could adversely affect our results of operations.
We compete for enrollment and sponsorship of our child care and early education centers in a highly-fragmented market. For enrollment, we compete with family child care (operated out of the caregiver’s home) and center-based child care (such as residential and work-site child care centers, full- and part-time nursery schools, private and public elementary schools and church-affiliated and other not-for-profit providers). In addition, substitutes for organized child care, such as relatives and nannies caring for children, can represent lower cost alternatives to our services. For sponsorship, we compete primarily with large community-based child care companies with divisions focused on employer sponsorship and with regional child care providers who target employer sponsorship. We believe that our ability to compete successfully depends on a number of factors, including quality of care, site convenience and cost. We often face a price disadvantage to our competition, which may have access to greater financial resources, greater name recognition or lower operating or compliance costs. In addition, certain competitors may be able to operate with little or no rental expense and sometimes do not comply or are not required to comply with the same health, safety and operational regulations with which we comply. Therefore, we may be unable to continue to compete successfully against current and future competitors.
Breaches in data security could adversely affect our financial condition and operating results.
For various operational needs, we collect and store certain personal information from our clients, the families and children we serve, and our employees, including credit card information, which may expose us to increased risk of privacy and/or security breaches. We utilize third-party vendors and electronic payment methods to process and store some of this information. While we have policies and practices that protect our data, failure of these systems to operate effectively or a compromise in the security of our systems that results in unauthorized persons or entities obtaining personal information could materially and adversely affect our reputation and our operations, operating results, and financial condition. In addition, breaches in our data security, that of our affiliates or other third-parties, could expose us to risks of data loss or inappropriate disclosure of confidential or proprietary information, litigation or the imposition of penalties against us, liability, and could result in a disruption of our operations. Any relating negative publicity could significantly harm our reputation and could materially and adversely affect our business and operating results.
Changes in laws and regulations could impact the way we conduct business.
Our child care and early education centers are subject to numerous national, state and local regulations and licensing requirements. Although these regulations vary greatly from jurisdiction to jurisdiction, government agencies generally review, among other issues, the adequacy of buildings and equipment, licensed capacity, the ratio of adults to children, educational qualifications and training of staff, record keeping, dietary program, daily curriculum, hiring practices and compliance with health and safety standards. Failure of a child care or early education center to comply with applicable regulations and requirements could subject it to governmental sanctions, which can include fines, corrective orders, placement on probation or, in more serious cases, suspension or revocation of one or more of our child care centers’ licenses to operate, and require significant expenditures to bring those centers into compliance.
17
Governmental universal child care benefit programs could reduce the demand for our services.
National, state or local child care benefit programs comprised primarily of subsidies in the form of tax credits or other direct government financial aid provide us opportunities for expansion in additional markets. However, a universal benefit with governmentally mandated or provided child care could reduce the demand for early care services at our existing child care and early education centers due to the availability of lower cost care alternatives or could place downward pressure on the tuition and fees we charge, which could adversely affect our revenues and results of operations.
Our tax rate is dependent on a number of factors, a change in any of which could impact our future tax rates and net income.
As a global company, our future tax rates may be adversely affected by a number of factors, including changes in tax laws or the interpretation of such tax laws in the various jurisdictions in which we operate; changes in the estimated realization of our net deferred tax assets; the jurisdictions in which profits are determined to be earned and taxed; the repatriation of non-U.S. earnings for which we have not previously provided taxes; adjustments to estimated taxes upon finalization of various tax returns; increases in expenses that are not deductible for tax purposes, including impairment of goodwill in connection with acquisitions; changes in available tax credits; and the resolution of issues arising from tax audits with various tax authorities. Losses for which no tax benefits can be recorded could materially impact our tax rate and its volatility from one quarter to another. Any significant change in our jurisdictional earnings mix or in the tax laws in those jurisdictions could impact our future tax rates and net income in those periods.
A regional or global health pandemic or other catastrophic event could severely disrupt our business.
A regional or global health pandemic, depending upon its duration and severity, could severely affect our business. Enrollment in our child care centers could experience sharp declines as families might avoid taking their children out in public in the event of a health pandemic, and local, regional or national governments might limit or ban public interactions to halt or delay the spread of diseases causing business disruptions and the temporary closure of our centers. Additionally, a health pandemic could also impair our ability to hire and retain an adequate level of staff. A health pandemic may have a disproportionate impact on our business compared to other companies that depend less on the performance of services by employees.
Other unforeseen events, including war, terrorism and other international, regional or local instability or conflicts (including labor issues), embargos, natural disasters such as earthquakes, tsunamis, hurricanes, or other adverse weather and climate conditions, whether occurring in the United States or abroad, could disrupt our operations or result in political or economic instability. Enrollment in our child care centers could experience sharp declines as families might avoid taking their children out in public as a result of one or more of these events.
Risks Related to Our Common Stock
Our stock price could be extremely volatile, and, as a result, you may not be able to resell your shares at or above the price you paid for them.
Since our initial public offering in January 2013, the price of our common stock, as reported on the New York Stock Exchange, has ranged from a low of $27.50 on January 25, 2013 to a high of $72.80 on November 14, 2016. In addition, the stock market in general has been highly volatile. As a result, the market price of our common stock is likely to be similarly volatile, and investors in our common stock may experience a decrease, which could be substantial, in the value of their stock, including decreases unrelated to our operating performance or prospects, and could lose part or all of their investment. The price of our common stock could be subject to wide fluctuations in response to a number of factors, including those described elsewhere herein and others such as:
|
•
|
variations in our operating performance and the performance of our competitors;
|
|
•
|
actual or anticipated fluctuations in our quarterly or annual operating results;
|
|
•
|
publication of research reports by securities analysts about us or our competitors or our industry;
|
|
•
|
our failure or the failure of our competitors to meet analysts’ projections or guidance that we or our competitors may give to the market;
|
|
•
|
additions and departures of key personnel;
|
|
•
|
strategic decisions by us or our competitors, such as acquisitions, divestitures, spin-offs, joint ventures, strategic investments or changes in business strategy;
|
|
•
|
the passage of legislation or other regulatory developments affecting us or our industry;
|
|
•
|
speculation in the press or investment community;
|
18
|
•
|
changes in accounting principles;
|
|
•
|
terrorist acts, acts of war or periods of widespread civil unrest;
|
|
•
|
natural disasters and other calamities; and
|
|
•
|
changes in general market and economic conditions.
|
In the past, securities class action litigation has often been initiated against companies following periods of volatility in their stock price. This type of litigation could result in substantial costs and divert our management’s attention and resources, and could also require us to make substantial payments to satisfy judgments or to settle litigation.
Your percentage ownership in us may be diluted by future issuances of capital stock, which could reduce your influence over matters on which stockholders vote.
Pursuant to our restated bylaws, our board of directors has the authority, without action or vote of our stockholders, to issue all or any part of our authorized but unissued shares of common stock, including shares issuable upon the exercise of options, or shares of our authorized but unissued preferred stock. Issuances of common stock or voting preferred stock would reduce your influence over matters on which our stockholders vote and, in the case of issuances of preferred stock, would likely result in your interest in us being subject to the prior rights of holders of that preferred stock.
There may be sales of a substantial amount of our common stock by our current stockholders, and these sales could cause the price of our common stock to fall.
As of
February 10, 2017
, there were
59,511,773
shares of common stock outstanding. Approximately
21.8%
of our outstanding common stock is beneficially owned by investment funds affiliated with the Sponsor and our officers and directors. Sales of substantial amounts of our common stock in the public market, or the perception that such sales will occur, could adversely affect the market price of our common stock.
In addition, certain holders of shares of our common stock may require us to register their shares for resale under the federal securities laws, and holders of additional shares of our common stock would be entitled to have their shares included in any such registration statement, all subject to reduction upon the request of the underwriter(s) of the offering, if any. Registration of those shares would allow the holders to immediately resell their shares in the public market. Any such sales or anticipation thereof could cause the market price of our common stock to decline.
In addition, we have registered
5 million
shares of common stock that are reserved for issuance under our 2012 Omnibus Long-Term Incentive Plan. As of
December 31,
2016
, there were approximately
2.3 million
shares of common stock available for grant.
Provisions in our charter documents and Delaware law may deter takeover efforts that could be beneficial to stockholder value.
In addition to the Sponsor’s beneficial ownership of a substantial percentage of our common stock, our certificate of incorporation and restated by-laws and Delaware law contain provisions that could make it harder for a third party to acquire us, even if doing so might be beneficial to our stockholders. These provisions include a classified board of directors and limitations on actions by our stockholders, including the need for super majority approval to amend, alter, change or repeal specified provisions of our certificate of incorporation and bylaws, a prohibition on the ability of our stockholders to act by written consent and certain limitations on the ability of our stockholders to call a special meeting. In addition, our board of directors has the right to issue preferred stock without stockholder approval that could be used to dilute a potential hostile acquiror. Our certificate of incorporation also imposes some restrictions on mergers and other business combinations between us and any holder of 15% or more of our outstanding common stock other than the Sponsor. As a result, you may lose your ability to sell your stock for a price in excess of the prevailing market price due to these protective measures, and efforts by stockholders to change the direction or management of the Company may be unsuccessful.
Our certificate of incorporation designates the Court of Chancery of the State of Delaware as the sole and exclusive forum for certain types of actions and proceedings that may be initiated by our stockholders, which could limit our stockholders’ ability to obtain a favorable judicial forum for disputes with us or our directors, officers or employees.
Our certificate of incorporation provides that, subject to limited exceptions, the Court of Chancery of the State of Delaware will be the sole and exclusive forum for (i) any derivative action or proceeding brought on our behalf, (ii) any action asserting a claim of breach of a fiduciary duty owed by any of our directors, officers or other employees to us or our stockholders, (iii) any action asserting a claim against us arising pursuant to any provision of the Delaware General Corporation Law, our certificate of incorporation or our by-laws, or (iv) any other action asserting a claim against us that is governed by the internal affairs doctrine. Any person or entity purchasing or otherwise acquiring any interest in shares of our capital stock shall be deemed to have notice of and to have consented to the provisions of our certificate of incorporation described above. This choice of forum provision may limit a stockholder’s ability to bring a claim in a judicial forum that it finds favorable for
19
disputes with us or our directors, officers or other employees, which may discourage such lawsuits against us and our directors, officers and employees. Alternatively, if a court were to find these provisions of our certificate of incorporation inapplicable to, or unenforceable in respect of, one or more of the specified types of actions or proceedings, we may incur additional costs associated with resolving such matters in other jurisdictions, which could adversely affect our business and financial condition.
The Sponsor continues to have significant influence over us which could limit your ability to influence the outcome of key transactions, including a change of control.
As of
February 10, 2017
, investment funds affiliated with the Sponsor beneficially owned approximately
21%
of our outstanding common stock. For as long as the Sponsor continues to control a substantial percentage of the voting power of our common stock, it will be able to influence the election of the members of our board of directors and could also have some influence over our business and affairs, including any determinations with respect to mergers or other business combinations, the acquisition or disposition of assets, the incurrence of indebtedness, the issuance of any additional common stock or other equity securities, the repurchase or redemption of common stock and the payment of dividends.
Additionally, the Sponsor is in the business of making investments in companies and may acquire and hold interests in businesses that compete directly or indirectly with us. The Sponsor may also pursue acquisition opportunities that may be complementary to our business, and, as a result, those acquisition opportunities may not be available to us.
Because we have no current plans to pay cash dividends on our common stock for the foreseeable future, you may not receive any return on investment unless you sell your common stock for a price greater than that which you paid for it.
We may retain future earnings, if any, for future operations, expansion and debt repayment and have no current plans to pay any cash dividends for the foreseeable future. Any decision to declare and pay dividends in the future will be made at the discretion of our board of directors and will depend on, among other things, our results of operations, financial condition, cash requirements, contractual restrictions and other factors that our board of directors may deem relevant. In addition, our ability to pay dividends may be limited by covenants of any existing and future outstanding indebtedness we or our subsidiaries incur, including our senior secured credit facilities. As a result, you may not receive any return on an investment in our common stock unless you sell our common stock for a price greater than that which you paid for it.
None.
We lease approximately
86,000
square feet of office space for our corporate headquarters in Watertown, Massachusetts under an operating lease that expires in
2020
, with
two
10
year renewal options. We also lease approximately
50,000
square feet for our contact center in Broomfield, Colorado, as well as spaces for regional administrative offices including locations in Rushden and London in the United Kingdom, and Amsterdam, in the Netherlands.
As of
December 31, 2016
, we operated
1,035
child care and early education centers in
41
U.S. states and the District of Columbia, Puerto Rico, the United Kingdom, Canada, Ireland, the Netherlands and India, of which
121
were owned, with the remaining centers being operated under leases or operating agreements. The leases typically have initial terms ranging from
10
to
15
years with various expiration dates, often with renewal options. The following table summarizes the locations of our child care and early education centers as of
December 31, 2016
:
|
Location
|
Number of
Centers |
|
|
United States:
|
||
|
Alabama
|
2
|
|
|
Alaska
|
1
|
|
|
Arizona
|
9
|
|
|
California
|
75
|
|
|
Colorado
|
15
|
|
|
Connecticut
|
18
|
|
|
Delaware
|
5
|
|
|
District of Columbia
|
20
|
|
|
Florida
|
34
|
|
|
Georgia
|
25
|
|
|
Illinois
|
48
|
|
20
|
Location
|
Number of
Centers |
|
|
Indiana
|
7
|
|
|
Iowa
|
8
|
|
|
Kentucky
|
6
|
|
|
Louisiana
|
3
|
|
|
Maine
|
1
|
|
|
Maryland
|
13
|
|
|
Massachusetts
|
64
|
|
|
Michigan
|
13
|
|
|
Minnesota
|
8
|
|
|
Mississippi
|
1
|
|
|
Missouri
|
8
|
|
|
Montana
|
2
|
|
|
Nebraska
|
4
|
|
|
Nevada
|
4
|
|
|
New Hampshire
|
3
|
|
|
New Jersey
|
49
|
|
|
New York
|
51
|
|
|
North Carolina
|
19
|
|
|
Ohio
|
7
|
|
|
Oklahoma
|
3
|
|
|
Pennsylvania
|
58
|
|
|
Puerto Rico
|
1
|
|
|
Rhode Island
|
1
|
|
|
South Carolina
|
4
|
|
|
South Dakota
|
2
|
|
|
Tennessee
|
5
|
|
|
Texas
|
35
|
|
|
Utah
|
2
|
|
|
Virginia
|
23
|
|
|
Washington
|
26
|
|
|
West Virginia
|
1
|
|
|
Wisconsin
|
9
|
|
|
Total number of centers in the United States
|
693
|
|
|
Canada
|
2
|
|
|
Ireland
|
4
|
|
|
United Kingdom
|
304
|
|
|
Netherlands
|
30
|
|
|
India
|
2
|
|
|
Total number of centers
|
1,035
|
|
We believe that our properties are generally in good condition, are adequate for our operations, and meet or exceed the regulatory requirements for health, safety and child care licensing established by the governments where they are located.
We are, from time to time, subject to claims and suits arising in the ordinary course of business. Such claims have in the past generally been covered by insurance. We believe the outcome of such pending legal matters will not have a material adverse effect on our financial position, results of operations or cash flows, although we cannot predict the ultimate outcome of any such actions. Furthermore, there can be no assurance that our insurance will be adequate to cover all liabilities that may arise out of claims brought against us.
21
None.
Executive Officers of the Registrant
Set forth below is certain information about our executive officers. Ages are as of
December 31, 2016
.
David H. Lissy,
age 51, has served as a director of the Company since 2001 and as Chief Executive Officer of the Company since January 2002. Mr. Lissy served as Chief Development Officer of the Company from 1998 until January 2002. He also served as Executive Vice President from June 2000 to January 2002. He joined Bright Horizons in August 1997 and served as Vice President of Development until the merger with CorporateFamily Solutions, Inc. in July 1998. Prior to joining Bright Horizons, Mr. Lissy served as senior vice president/general manager at Aetna U.S. Healthcare in the New England region. Prior to that Mr. Lissy held a similar role at US Healthcare, Inc. prior to that company’s acquisition by Aetna. Mr. Lissy currently serves on the boards of Altegra Health, Jumpstart and Ithaca College.
Mandy Berman,
age 46, has served as the Executive Vice President and Chief Administrative Officer of the Company since January 2016. From January 2014 until December 2015, Ms. Berman served as Executive Vice President, Back-up and Global Operations and, from September 2005 to December 2013, she served as Vice President, Back-up Care Operations and then Senior Vice President, Back-up Care Operations. Ms. Berman joined Bright Horizons through the acquisition of ChildrenFirst, Inc. in 2005 and as Vice President of Special Projects. Prior to joining Bright Horizons, Ms. Berman was part of the founding team for Project Achieve, a provider of management information systems for charter and public schools, and was a management consultant for the Parthenon Group.
Elizabeth J. Boland,
age 57, has served as Chief Financial Officer of the Company since June 1999. Ms. Boland joined Bright Horizons in September 1997 and served as Chief Financial Officer and, subsequent to the merger between Bright Horizons and CorporateFamily Solutions, Inc. in July 1998, served as Senior Vice President of Finance for the Company until June 1999. From 1994 to 1997, Ms. Boland was chief financial officer of The Visionaries, Inc., an independent television production company. From 1990 to 1994, Ms. Boland served as vice president-finance for Olsten Corporation, a publicly traded provider of home-health care and temporary staffing services. From 1981 to 1990, she worked on the audit staff at Price Waterhouse, LLP in Boston, completing her tenure as a senior audit manager.
Mary Lou Burke Afonso,
age 52, has served as Chief Operating Officer, North America Center Operations of the Company since January 2016 and is a 20-year veteran of the Company. Ms. Burke Afonso served as the Company’s Executive Vice President of North America Center Operations from January 2014 until December 2015 and, from January 2005 to December 2013, she served as Senior Vice President, Client Relations. Prior to that she has served as in a variety of leadership positions in Finance, Center Operations, Business Operations, Client Relations, and College Coach. Prior to joining Bright Horizons in 1995, Ms. Burke Afonso served as the controller for BOSE Corporation in France and controller of their retail division in the U.S. She also worked on the audit staff at Price Waterhouse, LLP in Boston.
Stephen I. Dreier,
age 74, has served as Executive Vice President and Secretary of the Company since January 2016. He joined Bright Horizons as Vice President and Chief Financial Officer in August 1988 and became its Secretary in November 1988 and Treasurer in September 1994. Mr. Dreier served as Bright Horizons’ Chief Financial Officer and Treasurer until September 1997, at which time he was appointed to the position of Chief Administrative Officer. Mr. Dreier served as Chief Administrative Officer of the Company from 1997 until December 2015. From 1976 to 1988, Mr. Dreier was Senior Vice President of Finance and Administration for the John S. Cheever/Paperama Company.
Stephen H. Kramer
, age 46, has served as President of the Company since January 2016. Mr. Kramer served as the Chief Development Officer from January 2014 until December 2015 and as Senior Vice President, Strategic Growth & Global Operations from January 2010 until December 2013. He served as Managing Director, Europe based in the United Kingdom from January 2008 until December 2009. He joined Bright Horizons in September 2006 through the acquisition of College Coach, which he cofounded and led for eight years. Previously he was an Associate at Fidelity Ventures, the venture capital arm of Fidelity Investments and a consultant with Arthur D. Little.
22
Principal Market
Our common stock has been listed on the NYSE under the symbol “BFAM” since January 25, 2013. Prior to that time, there was no public market for our common stock. The following tables set forth the high and low sales prices of our common stock for each of the fiscal quarters ended March 31, June 30, September 30 and December 31 for the past two fiscal years as reported on the NYSE.
|
2016:
|
High
|
Low
|
|||||
|
First quarter
|
$
|
70.59
|
|
$
|
60.18
|
|
|
|
Second quarter
|
$
|
67.44
|
|
$
|
63.15
|
|
|
|
Third quarter
|
$
|
69.95
|
|
$
|
63.40
|
|
|
|
Fourth quarter
|
$
|
72.80
|
|
$
|
59.00
|
|
|
|
2015:
|
High
|
Low
|
|||||
|
First quarter
|
$
|
53.19
|
|
$
|
43.77
|
|
|
|
Second quarter
|
$
|
60.00
|
|
$
|
48.89
|
|
|
|
Third quarter
|
$
|
66.52
|
|
$
|
56.76
|
|
|
|
Fourth quarter
|
$
|
69.09
|
|
$
|
59.85
|
|
|
As of
February 10, 2017
, there were
23
holders of record of our common stock.
Dividend Policy
There were no cash dividends paid on our common stock during the past two fiscal years. Our board of directors does not currently intend to pay regular dividends on our common stock. However, we expect to reevaluate our dividend policy on a regular basis and may, subject to compliance with the covenants contained in our senior secured credit facilities and other considerations, determine to pay dividends in the future.
Issuer Purchases of Equity Securities
The following table sets forth information regarding purchases of our common stock during the three months ended
December 31, 2016
:
|
Period
|
Total Number of Shares Purchased
|
Average Price Paid per Share
|
Total Number of Shares Purchased as Part of Publicly Announced Plans or Programs (1)
|
Approximate Dollar Value of Shares that May Yet Be Purchased Under the Plans or Programs (In thousands) (1)
|
|||||||
|
October 1, 2016 to October 31, 2016
|
84,166
|
|
$
|
65.49
|
|
84,166
|
|
$
|
294,311
|
|
|
|
November 1, 2016 to November 30, 2016
|
124,512
|
|
$
|
63.12
|
|
124,512
|
|
$
|
286,452
|
|
|
|
December 1, 2016 to December 31, 2016
|
53,736
|
|
$
|
68.08
|
|
53,736
|
|
$
|
282,793
|
|
|
|
262,414
|
|
262,414
|
|
||||||||
|
(1)
|
On August 2, 2016, the board of directors of the Company authorized a share repurchase program of up to $300.0 million of our common stock, effective August 5, 2016. The share repurchase program, which has no expiration date, replaced the prior
February 4, 2015
authorization. All repurchased shares have been retired.
|
23
Equity Compensation Plans
The following table provides information as of
December 31, 2016
with respect to shares of our common stock that may be issued under existing equity compensation plans.
|
Plan Category
|
Number of
Securities to be Issued Upon Exercise of Outstanding Options, Warrants and Rights (1) (a) |
Weighted
Average Exercise Price of Outstanding Options, Warrants and Rights (1) (b) |
Number of Securities Remaining Available For Future Issuance under Equity Compensation Plans (excluding securities reflected in column (a))
(c) |
|||||||
|
Equity compensation plans approved by security holders
|
4,048,738
|
|
$
|
31.06
|
|
2,300,765
|
|
|||
|
Equity compensation plans not approved by security holders
|
—
|
|
—
|
|
—
|
|
||||
|
Total
|
4,048.738
|
|
$
|
31.06
|
|
2,300.765
|
|
|||
|
(1)
|
The number of securities includes
26,066
shares that may be issued upon the settlement of restricted stock units. The restricted stock units are excluded from the weighted average exercise price calculation.
|
Performance Graph
The following performance graph and related information shall not be deemed to be
“
soliciting material
”
or to be
“
filed
”
with the SEC, nor shall such information be incorporated by reference into any future filing under the Securities Act of 1933, as amended, or the Exchange Act, except to the extent that the Company specifically incorporates it by reference into such filing.
The following graph compares the total return to stockholders on our common stock from January 25, 2013, the date our stock became listed on the NYSE, through
December 31, 2016
, relative to the total return of the following:
|
•
|
the New York Stock Exchange Composite Index;
|
|
•
|
a new peer group that we selected in good faith, consisting of five other companies in the education and contracted outsourced/business services sector: The Advisory Board Company, The Corporate Executive Board Company, Healthways, Wageworks, and Nord Anglia Education, Inc. (the “New Peer Group”); and,
|
|
•
|
the old peer group that was selected in good faith, and consisted of seven other companies in the contracted outsourced/business services sector: The Advisory Board Company, The Corporate Executive Board Company, Healthways, IHS Inc., Iron Mountain Inc., Towers Watson and Wageworks (the “Old Peer Group”). Bright Horizons modified its self-constructed peer index for the year ended December 31, 2016, due to merger and acquisition activity and business model changes in certain underlying companies included in the Old Peer Group that were no longer deemed adequate comparables.
|
24
The graph assumes that
$100
was invested in our common stock, and in the index and peer groups noted above, and that all dividends, if any, were reinvested. No dividends have been declared or paid on our common stock since January 25, 2013.
The stock price performance shown in the graph is not necessarily indicative of future performance.
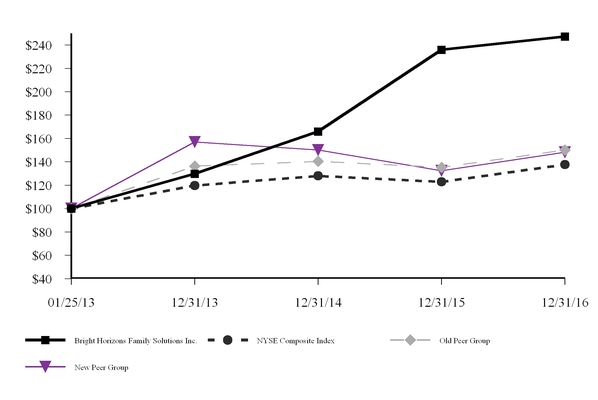
|
January 25, 2013
|
December 31, 2013
|
December 31, 2014
|
December 31, 2015
|
December 31, 2016
|
|||||||||||
|
Bright Horizons Family Solutions Inc.
|
$
|
100.00
|
|
$
|
129.73
|
|
$
|
166.00
|
|
$
|
235.88
|
|
$
|
247.25
|
|
|
NYSE Composite Index
|
$
|
100.00
|
|
$
|
119.71
|
|
$
|
127.92
|
|
$
|
122.82
|
|
$
|
137.65
|
|
|
New Peer Group
|
$
|
100.00
|
|
$
|
156.97
|
|
$
|
150.21
|
|
$
|
132.44
|
|
$
|
148.18
|
|
|
Old Peer Group
|
$
|
100.00
|
|
$
|
136.30
|
|
$
|
140.42
|
|
$
|
135.25
|
|
$
|
150.05
|
|
The following table sets forth our selected historical consolidated financial data for the periods indicated, and should be read in conjunction with “Management’s Discussion and Analysis of Financial Condition and Results of Operations” and the consolidated financial statements and the related notes thereto appearing in Part II, Item 8 of this Annual Report on Form 10-K. The selected historical financial data has been derived from our audited consolidated financial statements. Historical results are not necessarily indicative of the results to be expected for future periods.
25
|
Years Ended December 31,
|
|||||||||||||||||||
|
2016
|
2015
|
2014
|
2013
|
2012
|
|||||||||||||||
|
(In thousands, except share data)
|
|||||||||||||||||||
|
Consolidated Statement of Income Data:
|
|||||||||||||||||||
|
Revenue
|
$
|
1,569,841
|
|
$
|
1,458,445
|
|
$
|
1,352,999
|
|
$
|
1,218,776
|
|
$
|
1,070,938
|
|
||||
|
Cost of services
|
1,178,994
|
|
1,100,690
|
|
1,039,397
|
|
937,840
|
|
825,168
|
|
|||||||||
|
Gross profit
|
390,847
|
|
357,755
|
|
313,602
|
|
280,936
|
|
245,770
|
|
|||||||||
|
Selling, general and administrative expenses
|
163,967
|
|
148,164
|
|
137,683
|
|
141,827
|
|
123,373
|
|
|||||||||
|
Amortization of intangible assets
|
29,642
|
|
27,989
|
|
28,999
|
|
30,075
|
|
26,933
|
|
|||||||||
|
Income from operations
|
197,238
|
|
181,602
|
|
146,920
|
|
109,034
|
|
95,464
|
|
|||||||||
|
Loss on extinguishment of debt (1)
|
(11,117
|
)
|
—
|
|
—
|
|
(63,682
|
)
|
—
|
|
|||||||||
|
Interest income
|
81
|
|
163
|
|
103
|
|
85
|
|
152
|
|
|||||||||
|
Interest expense
|
(43,005
|
)
|
(41,609
|
)
|
(34,709
|
)
|
(40,626
|
)
|
(83,864
|
)
|
|||||||||
|
Net interest expense and other
|
(54,041
|
)
|
(41,446
|
)
|
(34,606
|
)
|
(104,223
|
)
|
(83,712
|
)
|
|||||||||
|
Income before income taxes
|
143,197
|
|
140,156
|
|
112,314
|
|
4,811
|
|
11,752
|
|
|||||||||
|
Income tax (expense) benefit
|
(48,437
|
)
|
(46,229
|
)
|
(40,279
|
)
|
7,533
|
|
(3,243
|
)
|
|||||||||
|
Net income
|
94,760
|
|
93,927
|
|
72,035
|
|
12,344
|
|
8,509
|
|
|||||||||
|
Net (loss) income attributable to non-controlling interest
|
—
|
|
—
|
|
—
|
|
(279
|
)
|
347
|
|
|||||||||
|
Net income attributable to Bright Horizons Family Solutions Inc.
|
$
|
94,760
|
|
$
|
93,927
|
|
$
|
72,035
|
|
$
|
12,623
|
|
$
|
8,162
|
|
||||
|
Accretion of Class L preference
|
—
|
|
—
|
|
—
|
|
—
|
|
79,211
|
|
|||||||||
|
Accretion of Class L preference for vested options
|
—
|
|
—
|
|
—
|
|
—
|
|
5,436
|
|
|||||||||
|
Net income (loss) available to common stockholders
|
$
|
94,760
|
|
$
|
93,927
|
|
$
|
72,035
|
|
$
|
12,623
|
|
$
|
(76,485
|
)
|
||||
|
Allocation of net income (loss) to common stockholders:
|
|||||||||||||||||||
|
Class L—basic and diluted
|
$
|
—
|
|
$
|
—
|
|
$
|
—
|
|
$
|
—
|
|
$
|
79,211
|
|
||||
|
Common stock—basic
|
$
|
93,919
|
|
$
|
93,287
|
|
$
|
71,755
|
|
$
|
12,623
|
|
$
|
(76,485
|
)
|
||||
|
Common stock—diluted
|
$
|
93,938
|
|
$
|
93,303
|
|
$
|
71,761
|
|
$
|
12,623
|
|
$
|
(76,485
|
)
|
||||
|
Earnings (loss) per share:
|
|||||||||||||||||||
|
Class L—basic and diluted
|
$
|
—
|
|
$
|
—
|
|
$
|
—
|
|
$
|
—
|
|
$
|
59.73
|
|
||||
|
Common stock—basic
|
$
|
1.59
|
|
$
|
1.53
|
|
$
|
1.09
|
|
$
|
0.20
|
|
$
|
(12.62
|
)
|
||||
|
Common stock—diluted
|
$
|
1.55
|
|
$
|
1.50
|
|
$
|
1.07
|
|
$
|
0.20
|
|
$
|
(12.62
|
)
|
||||
|
Weighted average shares outstanding: (2)
|
|||||||||||||||||||
|
Class L—basic and diluted
|
—
|
|
—
|
|
—
|
|
—
|
|
1,326,206
|
|
|||||||||
|
Common stock—basic
|
59,229,069
|
|
60,835,574
|
|
65,612,572
|
|
62,659,264
|
|
6,058,512
|
|
|||||||||
|
Common stock—diluted
|
60,594,895
|
|
62,360,778
|
|
67,244,172
|
|
64,509,036
|
|
6,058,512
|
|
|||||||||
|
Consolidated Balance Sheet Data (at period end):
|
|||||||||||||||||||
|
Total cash and cash equivalents
|
$
|
14,633
|
|
$
|
11,539
|
|
$
|
87,886
|
|
$
|
29,585
|
|
$
|
34,109
|
|
||||
|
Total assets (3)
|
2,359,017
|
|
2,150,541
|
|
2,141,076
|
|
2,102,670
|
|
1,916,108
|
|
|||||||||
|
Total liabilities, excluding debt (3)
|
530,391
|
|
483,722
|
|
468,940
|
|
449,310
|
|
401,125
|
|
|||||||||
|
Total debt, including current maturities (4)
|
1,140,759
|
|
939,211
|
|
921,177
|
|
764,223
|
|
906,643
|
|
|||||||||
|
Total redeemable non-controlling interest
|
—
|
|
—
|
|
—
|
|
—
|
|
8,126
|
|
|||||||||
|
Class L common stock
|
—
|
|
—
|
|
—
|
|
—
|
|
854,101
|
|
|||||||||
|
Total stockholders’ equity (deficit)
|
687,867
|
|
727,608
|
|
750,959
|
|
889,137
|
|
(253,887
|
)
|
|||||||||
|
(1)
|
The Company recognized a loss on the extinguishment of debt in the years ended December 31, 2016 and 2013 in relation to its debt refinancing on November 2016 and January 2013, respectively.
|
26
|
(2)
|
On January 11, 2013, we effected a 1–for–1.9704 reverse split of our Class A common stock. All previously reported Class A per share and Class A share amounts in the table above and in the consolidated financial statements included elsewhere herein have been retroactively adjusted to reflect the reverse stock split. In addition, we converted each share of our Class L common stock into 35.1955 shares of Class A common stock, and, immediately following the conversion of our Class L common stock, reclassified the Class A common stock into common stock, which was recorded in the first quarter of 2013.
|
|
(3)
|
The Balance Sheet Data table above reflects the early adoption of ASU 2015-17,
Balance Sheet Classification of Deferred Taxes.
The Company adopted ASU 2015-17 in 2015 prospectively, which resulted in all current deferred tax assets and current deferred tax liabilities being reported as non-current, while prior period deferred tax assets and deferred tax liabilities were not adjusted.
|
|
(4)
|
Total debt includes amounts outstanding under our senior secured credit facilities, including our term loans and revolving credit facility.
|
The following discussion of our financial condition and results of operations should be read in conjunction with the “Selected Financial Data” and the audited consolidated financial statements and related notes appearing elsewhere in this Annual Report on Form 10-K. This discussion contains forward-looking statements and involves numerous risks and uncertainties. Forward-looking statements can be identified by the fact that they do not relate strictly to historical or current facts and generally contain words such as “believes,” expects,” “may,” “will,” “should,” “seeks,” “approximately,” “intends,” “plans,” “estimates,” “anticipates” or similar expressions. Our forward-looking statements are subject to risks and uncertainties, which may cause actual results to differ materially from those projected or implied by the forward-looking statement. Forward-looking statements are based on current expectations and assumptions and currently available data and are neither predictions nor guarantees of future events or performance. You should not place undue reliance on forward-looking statements, which speak only as of the date hereof. See “Risk Factors” and “Cautionary Note Regarding Forward-Looking Statements” for a discussion of factors that could cause our actual results to differ from those expressed or implied by forward-looking statements.
Overview
We are a leading provider of high-quality child care and early education as well as other services that are designed to help employers and families better address the challenges of work and family life. We provide services primarily under multi-year contracts with employers who offer child care and other dependent care solutions, as well as other educational advisory services, as part of their employee benefits packages to improve employee engagement, productivity, recruitment and retention. As of
December 31, 2016
, we had more than
1,100
client relationships with employers across a diverse array of industries, including
150
Fortune 500 companies and more than
80
of
Working Mother
magazine’s
2016
“100 Best Companies for Working Mothers.”
At
December 31, 2016
, we operated
1,035
child care and early education centers, consisting of
695
centers in North America and
340
centers in Europe. We have the capacity to serve approximately
115,000
children in
41
states, the District of Columbia, Puerto Rico, Canada, the United Kingdom, Ireland, the Netherlands and India. We seek to cluster centers in geographic areas to enhance operating efficiencies and to create a leading market presence. Our North American child care and early education centers have an average capacity of
127
children per location, while the centers in Europe have an average capacity of
80
children per location.
27
We operate centers for a diverse group of clients. At
December 31, 2016
, we managed child care centers on behalf of single employers in the following industries and also managed lease/consortium locations in approximately the following proportions:
|
Percentage of Centers
|
|||||
|
Classification
|
North America
|
Europe and Other
|
|||
|
Single employer locations:
|
|||||
|
Consumer
|
7.5
|
%
|
—
|
%
|
|
|
Financial Services
|
7.5
|
|
2.5
|
|
|
|
Government and Higher Education
|
17.5
|
|
5.0
|
|
|
|
Healthcare and Pharmaceuticals
|
20.0
|
|
2.5
|
|
|
|
Industrial/Manufacturing
|
2.5
|
|
2.5
|
|
|
|
Professional Services and Other
|
7.5
|
|
—
|
|
|
|
Technology
|
5.0
|
|
2.5
|
|
|
|
67.5
|
|
15.0
|
|
||
|
Lease/consortium locations
|
32.5
|
|
85.0
|
|
|
|
100.0
|
%
|
100.0
|
%
|
||
Segments
Our primary reporting segments are full service center-based care services and back-up dependent care services. Full service center-based care includes center-based child care, preschool and elementary education. Back-up dependent care includes center-based back-up child care, in-home well child care, in-home mildly-ill child care and adult/elder care. Our remaining business services are included in the other educational advisory services segment, which includes our college preparation and admissions advisory services as well as our tuition reimbursement program management and educational advising services.
Center Models
We operate our centers under two principal business models, which we refer to as profit & loss (“P&L”) and cost-plus. Approximately
75%
of our centers operate under the P&L model. Under this model, we retain the financial risk for the child care and early education centers and are therefore subject to variability in financial performance due to fluctuation in enrollment levels. The P&L model is further classified into two subcategories: (i) a sponsor model and (ii) a lease/consortium model. Under the sponsor model, we provide child care and early education services on a priority enrollment basis for employees of an employer sponsor, and the employer sponsor generally funds the development of the facility, pre-opening and start-up capital equipment, and maintenance costs. Our operating contracts typically have initial terms ranging from
three
to
ten
years. Under the lease/consortium model, the child care center is typically located in an office building or office park in a property that we lease, and we provide these services to the employees of multiple employers, as well as to families in the surrounding community. We typically negotiate initial lease terms of
10
to
15
years for these centers, often with renewal options.
When we open a new P&L center, it generally takes
two
to
three
years for the center to ramp up to a steady state level of enrollment, as a center will typically enroll younger children at the outset and children age into the older (preschool) classrooms over time. We refer to centers that have been open for three years or less as “ramping centers.” A center will typically achieve breakeven operating performance between
12
to
24
months and will typically achieve a steady state level of enrollment that supports our average center operating profit by the end of
three
years, although the period needed to reach a steady state level of enrollment may be longer or shorter. Centers that have been open more than
three
years are referred to as “mature centers.”
Approximately
25%
of our centers operate under the cost-plus business model. Under this model, we receive a management fee from the employer sponsor and an additional operating subsidy from the employer to supplement tuition paid by parents of children in the center. Under this model, the employer sponsor typically funds the development of the facility, pre-opening and start-up capital equipment, and maintenance costs, and the center is profitable from the outset. Our cost-plus contracts typically have initial terms ranging from
three
to
five
years. For additional information about the way we operate our centers, see “Business—Our Operations” in Part I, Item 1 of this Annual Report.
Performance and Growth Factors
We believe that
2016
was a successful year for the Company. We grew our income from operations by
8.6%
, from
$181.6 million
in
2015
to
$197.2 million
in
2016
, and increased net income from
$93.9 million
in 2015 to
$94.8 million
in
2016
. In addition, we ended
2016
with the capacity to serve approximately
115,000
children and families in our full service
28
and back-up child care centers, and we added
128
child care and early education centers and closed
25
centers, resulting in a net
increase
of
103
centers for the year. We expect to add approximately
30
net new centers in
2017
.
Our year-over-year improvement in operating income can be attributed to enrollment gains in ramping and mature centers, disciplined pricing strategies aimed at covering anticipated cost increases with tuition increases, contributions from new mature child care centers added through acquisitions or transitions of management, and expanded back-up dependent care and educational advisory services.
General economic conditions and the business climate in which individual clients operate remain some of the largest variables in terms of our future performance. These variables impact client capital and operating spending budgets, industry specific sales leads and the overall sales cycle, enrollment levels, as well as labor markets and wage rates as competition for human capital fluctuates.
Our ability to increase operating income will depend upon our ability to sustain the following characteristics of our business:
|
•
|
maintenance and incremental growth of enrollment in our mature and ramping centers, and cost management in response to changes in enrollment in our centers,
|
|
•
|
effective pricing strategies, including typical annual tuition increases of
3%
to
4%
, correlated with expected annual increases in personnel costs, including wages and benefits,
|
|
•
|
additional growth in expanded service offerings to clients,
|
|
•
|
successful integration of acquisitions and transitions of management of centers, and
|
|
•
|
successful management and improvement of underperforming centers.
|
Cost Factors
Our most significant expense is cost of services. Cost of services consists of direct expenses associated with the operation of our centers, direct expenses to provide back-up dependent care services (including fees to back-up dependent care providers) and direct expenses to provide educational advisory services. Direct expenses consist primarily of staff salaries, taxes and benefits, food costs, program supplies and materials, parent marketing and facilities costs, including occupancy costs and depreciation. Personnel costs are the largest component of a center’s operating costs, and, on a weighted average basis, comprise approximately
70%
of a center’s operating expenses. We are typically responsible for additional costs in a P&L model center as compared to a cost-plus model center. As a result, personnel costs in centers operating under the P&L model will typically represent a smaller proportion of overall costs when compared to the centers operating under the cost-plus model.
As of
December 31, 2016
, our consolidated total debt was
$1.1 billion
, and a portion of our cash flows from operations has been used to make interest payments on our indebtedness. Interest payments were
$37.1 million
in
2016
, slightly lower than interest payments of
$38.1 million
in
2015
, due to the timing of the November 2016 debt refinancing. Based on current applicable interest rates, we expect our interest payments to approximate $40 million in
2017
.
Seasonality
Our business is subject to seasonal and quarterly fluctuations. Demand for child care and early education and elementary school services has historically decreased during the summer months when school is not in session, at which time families are often on vacation or have alternative child care arrangements. In addition, our enrollment declines as older children transition to elementary schools. Demand for our services generally increases in September and October coinciding with the beginning of the new school year and remains relatively stable throughout the rest of the school year. In addition, use of our back-up dependent care services tends to be higher when schools are not in session and during holiday periods, which can increase the operating costs of the program and impact the results of operations. Results of operations may also fluctuate from quarter to quarter as a result of, among other things, the performance of existing centers, including enrollment and staffing fluctuations, the number and timing of new center openings, acquisitions and management transitions, the length of time required for new centers to achieve profitability, center closings, refurbishment or relocation, the contract model mix (P&L versus cost-plus) of new and existing centers, the timing and level of sponsorship payments, competitive factors and general economic conditions.
29
The following table sets forth statement of income data as a percentage of revenue for the three years ended
December 31, 2016
, (in thousands, except percentages):
|
Years Ended December 31,
|
||||||||||||||||||||
|
2016
|
2015
|
2014
|
||||||||||||||||||
|
Revenue
|
$
|
1,569,841
|
|
100.0
|
%
|
$
|
1,458,445
|
|
100.0
|
%
|
$
|
1,352,999
|
|
100.0
|
%
|
|||||
|
Cost of services (1)
|
1,178,994
|
|
75.1
|
%
|
1,100,690
|
|
75.5
|
%
|
1,039,397
|
|
76.8
|
%
|
||||||||
|
Gross profit
|
390,847
|
|
24.9
|
%
|
357,755
|
|
24.5
|
%
|
313,602
|
|
23.2
|
%
|
||||||||
|
Selling, general and administrative
expenses (2)
|
163,967
|
|
10.4
|
%
|
148,164
|
|
10.2
|
%
|
137,683
|
|
10.2
|
%
|
||||||||
|
Amortization of intangible assets
|
29,642
|
|
1.9
|
%
|
27,989
|
|
1.9
|
%
|
28,999
|
|
2.1
|
%
|
||||||||
|
Income from operations
|
197,238
|
|
12.6
|
%
|
181,602
|
|
12.4
|
%
|
146,920
|
|
10.9
|
%
|
||||||||
|
Loss on extinguishment of debt
|
(11,117
|
)
|
(0.7
|
)%
|
—
|
|
—
|
%
|
—
|
|
—
|
%
|
||||||||
|
Net interest expense and other
|
(42,924
|
)
|
(2.7
|
)%
|
(41,446
|
)
|
(2.8
|
)%
|
(34,606
|
)
|
(2.6
|
)%
|
||||||||
|
Income before tax
|
143,197
|
|
9.2
|
%
|
140,156
|
|
9.6
|
%
|
112,314
|
|
8.3
|
%
|
||||||||
|
Income tax expense
|
(48,437
|
)
|
(3.1
|
)%
|
(46,229
|
)
|
(3.2
|
)%
|
(40,279
|
)
|
(3.0
|
)%
|
||||||||
|
Net income
|
$
|
94,760
|
|
6.1
|
%
|
$
|
93,927
|
|
6.4
|
%
|
$
|
72,035
|
|
5.3
|
%
|
|||||
|
Adjusted EBITDA (3)
|
$
|
299,215
|
|
19.1
|
%
|
$
|
273,069
|
|
18.7
|
%
|
$
|
238,081
|
|
17.6
|
%
|
|||||
|
Adjusted income from operations (3)
|
$
|
199,723
|
|
12.7
|
%
|
$
|
182,467
|
|
12.5
|
%
|
$
|
149,620
|
|
11.1
|
%
|
|||||
|
Adjusted net income (3)
|
$
|
130,737
|
|
8.3
|
%
|
$
|
115,391
|
|
7.9
|
%
|
$
|
97,238
|
|
7.2
|
%
|
|||||
|
(1)
|
Cost of services consists of direct expenses associated with the operation of child care centers, and direct expenses to provide back-up dependent care services, including fees to back-up care providers, and educational advisory services. Direct expenses consist primarily of salaries, payroll taxes and benefits for personnel, food costs, program supplies and materials, and parent marketing and facilities costs, which include occupancy costs and depreciation.
|
|
(2)
|
Selling, general and administrative (“SGA”) expenses consist primarily of salaries, payroll taxes and benefits (including stock-based compensation costs) for corporate, regional and business development personnel. Other overhead costs include information technology, occupancy costs for corporate and regional personnel, professional services fees, including accounting and legal services, and other general corporate expenses.
|
|
(3)
|
Adjusted EBITDA, adjusted income from operations and adjusted net income are non-GAAP measures, which are reconciled to net income below under “Non-GAAP Financial Measures and Reconciliations.”
|
Year Ended
December 31, 2016
Compared to the Year Ended
December 31, 2015
Revenue.
Revenue
increased
$111.4 million
, or
8%
, to
$1.6 billion
for the year ended
December 31, 2016
from
$1.5 billion
for the prior year. Revenue growth is primarily attributable to contributions from new and ramping child care and early education centers, expanded sales of our back-up dependent care services and educational advisory services, and typical annual tuition increases of
3%
to
4%
. Revenue generated by full service center-based care services for the year ended
December 31, 2016
increased
by
$84.9 million
, or
7%
, when compared to the prior year, due in part to overall enrollment increases of
7%
, partially offset by the effect of lower foreign currency exchange rates for our United Kingdom operations which reduced revenue growth in the full service segment by approximately 2% during the year. Our acquisitions of Hildebrandt Learning Centers, LLC, an operator of
40
centers in the United States on May 19, 2015, Active Learning Childcare Limited, an operator of
nine
centers in the United Kingdom on July 15, 2015, and Conchord Limited (
“
Asquith
”
), an operator of 90 centers and programs in the United Kingdom on November 10, 2016, contributed approximately $34.9 million of incremental revenue in the year ended
December 31, 2016
. At
December 31, 2016
, we operated
1,035
child care and early education centers compared to
932
centers at December 31,
2015
.
Revenue generated by back-up dependent care services in the year ended
December 31, 2016
increased
by
$18.5 million
, or
10%
, when compared to the prior year. Additionally, revenue generated by other educational advisory services in the year ended
December 31, 2016
increased
by
$7.9 million
, or
20%
, when compared to the prior year.
Cost of Services.
Cost of services
increased
$78.3 million
, or
7%
, to
$1.2 billion
for the year ended
December 31, 2016
when compared to the prior year. Cost of services in the full service center-based care services segment increased
$57.1 million
, or
6%
, to
$1.0 billion
in
2016
when compared to the prior year. Personnel costs increased
7%
as a result of the increase in overall enrollment, routine wage and benefit cost increases, and labor costs associated with centers added since
December 31, 2015
that are in the ramping stage. In addition, program supplies, materials, food and facilities costs, which
30
comprise approximately 30% of total cost of services for this segment, increased
4%
in connection with the enrollment growth and the incremental occupancy costs associated with centers added since
December 31, 2015
. Cost of services in the back-up dependent care segment increased
$16.1 million
, or
16%
, to
$115.9 million
for the year ended
December 31, 2016
, primarily for investments in information technology and personnel, and increased care provider fees associated with the higher levels of back-up services provided. Cost of services in the other educational advisory services segment increased by
$5.1 million
, or
28%
, to
$23.5 million
for the year ended
December 31, 2016
due to personnel and technology costs related to the incremental sales of these services.
Gross Profit.
Gross profit
increased
$33.1 million
, or
9%
, to
$390.8 million
for the year ended
December 31, 2016
when compared to the prior year. Gross profit margin was
25%
of revenue for the year ended
December 31, 2016
, which is consistent with the year ended
December 31, 2015
. The increase in gross profit is primarily due to contributions from new and acquired centers, increased enrollment in our mature and ramping P&L centers, effective operating cost management, and expanded back-up dependent care and other educational advisory services.
Selling, General and Administrative Expenses.
SGA
increased
$15.8 million
, or
11%
, to
$164.0 million
for the year ended
December 31, 2016
compared to
$148.2 million
for the prior year, and was
10%
of revenue for the year ended
December 31, 2016
consistent with the prior year. Results for the year ended
December 31, 2016
, included
$2.5 million
of costs associated with the completion of secondary offerings, costs associated with amending our credit agreement and refinancing our debt, and completed acquisitions. Results for the year ended December 31,
2015
, included
$0.9 million
of costs associated with secondary offerings and completed acquisitions. After taking these respective charges into account, SGA increased over the comparable
2015
period due primarily to increases in personnel costs, including annual wage increases, continued investments in technology and routine increases in SGA costs.
Amortization of Intangible Assets.
Amortization expense on intangible assets was
$29.6 million
for the year ended
December 31, 2016
, compared to
$28.0 million
for the prior year. The increase in amortization expense is due to the acquisitions completed in 2015 and 2016 offset by decreases from certain intangible assets becoming fully amortized during the period. In connection with the offsetting effects of incremental amortization expense related to acquisitions completed in
2016
and decreases from certain intangible assets that we expect to become fully amortized in
2017
, we do not expect any significant change in amortization expense in
2017
.
Income from Operations.
Income from operations
increased
by
$15.6 million
, or
9%
, to
$197.2 million
for the year ended
December 31, 2016
when compared to the prior year. Income from operations was
13%
of revenue for the year ended
December 31, 2016
, compared to
12%
in the prior year.
|
•
|
In the full service center-based care segment, income from operations
increased
$14.5 million
for the year ended
December 31, 2016
, when compared to the same period in
2015
. Results for the year ended
December 31, 2016
included
$2.5 million
for the costs associated with the completion of secondary offerings, costs associated with amending our credit agreement and refinancing our debt, and completed acquisitions. Results for the year ended
December 31, 2015
included
$0.9 million
for the costs associated with the completion of secondary offerings and completed acquisitions. After taking these charges into account, income from operations increased
$16.2 million
in
2016
primarily due to the tuition increases, enrollment gains over the prior year, contributions from new and acquired centers that have been added since
December 31, 2015
, and effective cost management, partially offset by the costs incurred during the ramp-up of certain new lease/consortium centers opened during
2015
and
2016
.
|
|
•
|
Income from operations for the back-up dependent care segment
increased
$0.7 million
for the year ended
December 31, 2016
, compared to the same period in
2015
due to the expanding revenue base.
|
|
•
|
Income from operations in the other educational advisory services segment
increased
$0.4 million
for the year ended
December 31, 2016
, compared to the same period in
2015
due to the expanding revenue base.
|
Extinguishment of Debt, Net Interest Expense and Other.
A loss on the extinguishment of debt of $11.1 million was recorded in the year ended
December 31, 2016
, related to the write off of unamortized original issue cost and deferred financing fees in connection with the November 2016 debt refinancing. Net interest expense and other
increased
to
$42.9 million
for the year ended
December 31, 2016
from
$41.4 million
in
2015
due to the increase in debt from the issuance of $150.0 million in additional term loans in November 2016 and increased borrowings on our line of credit in 2016 when compared to the same period in
2015
.
Income Tax Expense.
We recorded income tax
expense
of
$48.4 million
during the year ended
December 31, 2016
, compared to income tax
expense
of
$46.2 million
during the prior year. The effective rate increased to
34%
for
2016
from
33%
for
2015
. The difference between the effective income tax rates and the statutory rates for
2016
and
2015
was due primarily to the treatment of certain permanent items, decrease in tax rates, and differences resulting from filing tax returns.
Adjusted EBITDA and Adjusted Income from Operations.
Adjusted EBITDA and adjusted income from operations increased
$26.1 million
, or
10%
, and
$17.3 million
, or
10%
, respectively, for the year ended
December 31, 2016
over the
31
comparable period in
2015
primarily as a result of the increase in gross profit due to additional contributions from full-service centers, including the impact of acquired centers, as well as the growth in back-up dependent care services.
Adjusted Net Income.
Adjusted net income
increased
$15.3 million
, or
13%
, for the year ended
December 31, 2016
when compared to the same period in
2015
primarily due to the incremental gross profit described above.
Year Ended
December 31, 2015
Compared to the Year Ended
December 31, 2014
Revenue.
Revenue increased $105.4 million, or 8%, to $1.5 billion for the year ended December 31, 2015 from $1.4 billion for the prior year. Revenue growth is primarily attributable to contributions from new and ramping child care and early education centers, expanded sales of our back-up dependent care services and educational advisory services, and typical annual tuition increases of 3% to 4%, partially offset by the effects of foreign currency translation on our European operations. Revenue generated by full service center-based care services for the year ended December 31, 2015 increased by $80.1 million, or 7%, when compared to the prior year. Our acquisition on May 19, 2015 of Hildebrandt Learning Centers, LLC, an operator of 40 centers in the United States, and on July 15, 2015 of Active Learning Childcare Limited, an operator of nine centers in the United Kingdom, contributed approximately $29.6 million of incremental revenue in the year ended December 31, 2015. At December 31, 2015, we operated 932 child care and early education centers compared to 884 centers at December 31, 2014.
Revenue generated by back-up dependent care services in the year ended December 31, 2015 increased by $18.7 million, or 12%, when compared to the prior year. Additionally, revenue generated by other educational advisory services in the year ended December 31, 2015 increased by $6.6 million, or 20%, when compared to the prior year.
Cost of Services.
Cost of services increased $61.3 million, or 6%, to $1.1 billion for the year ended December 31, 2015 when compared to the prior year. Cost of services in the full service center-based care services segment increased $51.4 million, or 6%, to $982.5 million in 2015 when compared to the prior year. Personnel costs increased 5% as a result of an 8% increase in overall enrollment, routine wage and benefit cost increases, and labor costs associated with centers added since December 31, 2014 that are in the ramping stage. In addition, program supplies, materials, food and facilities costs, which comprise approximately 30% of total cost of services for this segment, increased 7% in connection with the enrollment growth and the incremental occupancy costs associated with centers added since December 31, 2014. Cost of services in the back-up dependent care segment increased $8.9 million, or 10%, to $99.8 million for the year ended December 31, 2015, primarily for personnel costs and for increased care provider fees associated with the higher levels of back-up services provided. Cost of services in the other educational advisory services segment increased by $1.0 million, or 6%, to $18.4 million for the year ended December 31, 2015 due to personnel and technology costs related to the incremental sales of these services.
Gross Profit.
Gross profit increased $44.2 million, or 14%, to $357.8 million for the year ended December 31, 2015 when compared to the prior year. Gross profit margin was 25% of revenue for the year ended December 31, 2015 compared to 23% for the year ended December 31, 2014. The increase in gross profit is primarily due to contributions from new and acquired centers, increased enrollment in our mature and ramping P&L centers, effective operating cost management, and expanded back-up dependent care and other educational advisory services revenue with proportionately lower direct costs.
Selling, General and Administrative Expenses.
SGA increased $10.5 million, or 8%, to $148.2 million for the year ended December 31, 2015 compared to $137.7 million for the prior year, and was 10% of revenue for the year ended December 31, 2015 consistent with the prior year. Results for the year ended December 31, 2015, included $0.9 million of costs associated with secondary offerings and completed acquisitions. Results for the year ended December 31, 2014, included $2.7 million of costs associated with secondary offerings and costs associated with amending our credit agreement. After taking these respective charges into account, SGA increased over the comparable 2014 period due primarily to increases in personnel costs, including annual wage increases, continued investments in technology and routine increases in SGA costs.
Amortization of Intangible Assets.
Amortization expense on intangible assets totaled $28.0 million for the year ended December 31, 2015, compared to $29.0 million for the prior year due primarily to certain intangible assets becoming fully amortized during the 2015 period.
Income from Operations.
Income from operations increased by $34.7 million, or 24%, to $181.6 million for the year ended December 31, 2015 when compared to 2014. Income from operations was 12% of revenue for the year ended December 31, 2015, compared to 11% in the prior year.
|
•
|
In the full service center-based care segment, income from operations increased $22.9 million for the year ended December 31, 2015, compared to the same period in 2014. Results for the year ended December 31, 2015 included $0.9 million for the costs associated with the completion of secondary offerings of our common shares and completed acquisitions. Results for the year ended December 31, 2014 included a proportionate charge of $2.4 million for the costs associated with the completion of secondary offerings and costs associated with amending our credit agreement. After taking these charges into account, income from operations increased $21.4 million in 2015 primarily due to the tuition increases, enrollment gains over the prior year, contributions from new and acquired centers, and effective cost
|
32
management, partially offset by the costs incurred during the ramp-up of certain new lease/consortium centers opened during 2014 and 2015 and the effects of foreign currency translation on our European business.
|
•
|
Income from operations for the back-up dependent care segment increased $7.6 million for the year ended December 31, 2015, compared to the same period in 2014 due to the expanding revenue base.
|
|
•
|
Income from operations in the other educational advisory services segment increased $4.2 million for the year ended December 31, 2015, compared to the same period in 2014 due to the expanding revenue base.
|
Net Interest Expense and Other.
Net interest expense and other increased to $41.4 million for the year ended December 31, 2015 from $34.6 million in 2014 due to the increase in debt from the issuance of $165.0 million in additional term loans in December 2014 and borrowings on our line of credit in 2015.
Income Tax Expense.
We recorded an income tax expense of $46.2 million during the year ended December 31, 2015, compared to an income tax expense of $40.3 million during the prior year. The effective rate decreased to 33% for 2015 from 36% for 2014. The difference between the effective income tax rate and the statutory rate for 2015 was due primarily to the treatment of certain permanent and temporary items adjusted in the first quarter of 2015 by a $1.3 million benefit, and differences resulting from filing tax returns. The difference between the effective income tax and the statutory rate for 2014 was due primarily to the recognition of unrecognized tax benefits of approximately $1.5 million due to the completion of tax examinations, a lapse of the statute of limitations in certain jurisdictions in the fourth quarter of 2014 and differences resulting from filing tax returns.
Adjusted EBITDA and Adjusted Income from Operations.
Adjusted EBITDA and adjusted income from operations increased $35.0 million, or 15%, and $32.8 million, or 22%, respectively, for the year ended December 31, 2015 over the comparable period in 2014 primarily as a result of the increase in gross profit due to additional contributions from full-service centers, including the impact of acquired centers, as well as the growth in the back-up dependent care and other educational advisory segments, offset by increases in SGA spending.
Adjusted Net Income.
Adjusted net income increased $18.2 million, or 19%, for the year ended December 31, 2015 when compared to the same period in 2014 primarily due to the incremental gross profit described above, which was offset by increases in SGA spending to support the growth and increases in interest expense.
33
Non-GAAP Financial Measures and Reconciliation
In our quarterly and annual reports, earnings press releases and conference calls, we discuss key financial measures that are not calculated in accordance with generally accepted accounting principles in the United States (“GAAP
”
or “U.S. GAAP
”
) to supplement our consolidated financial statements presented on a GAAP basis. These non-GAAP financial measures are not in accordance with GAAP and a reconciliation of the non-GAAP measures of adjusted EBITDA, adjusted income from operations, adjusted net income and diluted adjusted earnings per common share are as follows (in thousands, except share data):
|
Years Ended December 31,
|
|||||||||||
|
2016
|
2015
|
2014
|
|||||||||
|
Net income
|
$
|
94,760
|
|
$
|
93,927
|
|
$
|
72,035
|
|
||
|
Interest expense, net
|
42,924
|
|
41,446
|
|
34,606
|
|
|||||
|
Income tax expense
|
48,437
|
|
46,229
|
|
40,279
|
|
|||||
|
Depreciation
|
55,642
|
|
50,677
|
|
48,448
|
|
|||||
|
Amortization of intangible assets (a)
|
29,642
|
|
27,989
|
|
28,999
|
|
|||||
|
EBITDA
|
271,405
|
|
260,268
|
|
224,367
|
|
|||||
|
Additional adjustments:
|
|||||||||||
|
Loss on extinguishment of debt (b)
|
11,117
|
|
—
|
|
—
|
|
|||||
|
Deferred rent (c)
|
2,562
|
|
2,736
|
|
3,092
|
|
|||||
|
Stock-based compensation expense
|
11,646
|
|
9,200
|
|
7,922
|
|
|||||
|
Expenses related to Credit Agreement amendments, stock offerings, and completed acquisitions (d)
|
2,485
|
|
865
|
|
2,700
|
|
|||||
|
Total adjustments
|
27,810
|
|
12,801
|
|
13,714
|
|
|||||
|
Adjusted EBITDA
|
$
|
299,215
|
|
$
|
273,069
|
|
$
|
238,081
|
|
||
|
Income from operations
|
$
|
197,238
|
|
$
|
181,602
|
|
$
|
146,920
|
|
||
|
Expenses related to Credit Agreement amendments, stock offerings, and completed acquisitions (d)
|
2,485
|
|
865
|
|
2,700
|
|
|||||
|
Adjusted income from operations
|
$
|
199,723
|
|
$
|
182,467
|
|
$
|
149,620
|
|
||
|
Net income
|
$
|
94,760
|
|
$
|
93,927
|
|
$
|
72,035
|
|
||
|
Income tax expense
|
48,437
|
|
46,229
|
|
40,279
|
|
|||||
|
Income before tax
|
143,197
|
|
140,156
|
|
112,314
|
|
|||||
|
Stock-based compensation expense
|
11,646
|
|
9,200
|
|
7,922
|
|
|||||
|
Amortization of intangible assets (a)
|
29,642
|
|
27,989
|
|
28,999
|
|
|||||
|
Loss on extinguishment of debt (b)
|
11,117
|
|
—
|
|
—
|
|
|||||
|
Expenses related to Credit Agreement amendments, stock offerings, and completed acquisitions (d)
|
2,485
|
|
865
|
|
2,700
|
|
|||||
|
Adjusted income before tax
|
198,087
|
|
178,210
|
|
151,935
|
|
|||||
|
Adjusted income tax expense (e)
|
(67,350
|
)
|
(62,819
|
)
|
(54,697
|
)
|
|||||
|
Adjusted net income
|
$
|
130,737
|
|
$
|
115,391
|
|
$
|
97,238
|
|
||
|
Weighted average number of common shares-diluted
|
60,594,895
|
|
62,360,778
|
|
67,244,172
|
|
|||||
|
Diluted adjusted earnings per common share
|
$
|
2.16
|
|
$
|
1.85
|
|
$
|
1.45
|
|
||
|
(a)
|
Represents amortization of intangible assets, including approximately
$18.1 million
,
$18.0 million
and
$19.0 million
for the years ended
December 31,
2016
,
2015
and 2014, respectively, associated with intangible assets recorded in connection with our going private transaction in May 2008.
|
|
(b)
|
Represents the write-off of unamortized deferred financing costs and original issue discount associated with indebtedness that was repaid in connection with a debt refinancing.
|
|
(c)
|
Represents rent expense in excess of cash paid for rent, recognized on a straight line basis over the life of the lease in accordance with Accounting Standards Codification Topic 840,
Leases
.
|
|
(d)
|
Represents costs incurred in connection with completed acquisitions, secondary offerings, and the November 2014, January 2016, and November 2016 amendments to the Credit Agreement.
|
34
|
(e)
|
Represents income tax expense calculated on adjusted income before tax at the effective rate of approximately
34%
,
35%
and
36%
in
2016
,
2015
, and 2014 respectively.
|
Adjusted EBITDA, adjusted income from operations, adjusted net income and diluted adjusted earnings per common share are not presentations made in accordance with GAAP, and the use of the terms adjusted EBITDA, adjusted income from operations, adjusted net income and diluted adjusted earnings per common share may differ from similar measures reported by other companies. We believe that adjusted EBITDA, adjusted income from operations, adjusted net income and diluted adjusted earnings per common share provide investors with useful information with respect to our historical operations. We present adjusted EBITDA, adjusted income from operations, adjusted net income and diluted adjusted earnings per common share as supplemental performance measures because we believe they facilitate a comparative assessment of our operating performance relative to our performance based on our results under GAAP, while isolating the effects of some items that vary from period to period. Specifically, adjusted EBITDA allows for an assessment of our operating performance and of our ability to service or incur indebtedness without the effect of non-cash charges, such as depreciation, amortization, the excess of rent expense over cash rent expense and stock-based compensation expense, as well as the expenses related to secondary offerings, debt financing transaction expenses, and acquisitions. In addition, adjusted income from operations, adjusted net income and diluted adjusted earnings per common share allow us to assess our performance without the impact of the specifically identified items that we believe do not directly reflect our core operations. These non-GAAP measures also function as key performance indicators used to evaluate our operating performance internally, and they are used in connection with the determination of incentive compensation for management, including executive officers. Adjusted EBITDA is also used in connection with the determination of certain ratio requirements under our credit agreement. Adjusted EBITDA, adjusted income from operations, adjusted net income and diluted adjusted earnings per common share are not measurements of our financial performance under GAAP and should not be considered in isolation or as an alternative to income before taxes, net income, diluted earnings per common share, net cash provided by operating, investing or financing activities or any other financial statement data presented as indicators of financial performance or liquidity, each as presented in accordance with GAAP. Consequently, our non-GAAP financial measures should not be evaluated in isolation or supplant comparable GAAP measures, but, rather, should be considered together with our consolidated financial statements, which are prepared in accordance with GAAP and included in Part II, Item 8, of this Annual Report on Form 10-K. The Company understands that although adjusted EBITDA, adjusted income from operations, adjusted net income and diluted adjusted earnings per common share are frequently used by securities analysts, lenders and others in their evaluation of companies, they have limitations as analytical tools, and you should not consider them in isolation, or as a substitute for analysis of our results as reported under GAAP. Some of these limitations are:
|
•
|
adjusted EBITDA, adjusted income from operations and adjusted net income do not fully reflect the Company’s cash expenditures, future requirements for capital expenditures or contractual commitments;
|
|
•
|
adjusted EBITDA, adjusted income from operations and adjusted net income do not reflect changes in, or cash requirements for, the Company’s working capital needs;
|
|
•
|
adjusted EBITDA does not reflect the significant interest expense, or the cash requirements necessary to service interest or principal payments, on debt;
|
|
•
|
although depreciation and amortization are non-cash charges, the assets being depreciated and amortized will often have to be replaced in the future; and adjusted EBITDA, adjusted income from operations and adjusted net income do not reflect any cash requirements for such replacements.
|
Because of these limitations, adjusted EBITDA, adjusted income from operations, and adjusted net income should not be considered as discretionary cash available to us to reinvest in the growth of our business or as measures of cash that will be available to us to meet our obligations.
Liquidity and Capital Resources
Our primary cash requirements are for the ongoing operations of our existing child care centers, back-up dependent care and other educational advisory services, the addition of new centers through development or acquisition and debt financing obligations. Our primary sources of liquidity are our cash flows from operations and borrowings available under our revolving credit facility. Borrowings outstanding on our revolving credit facility at
December 31, 2016
and
2015
were
$76.0 million
and
$24.0 million
, respectively. Borrowings outstanding on our revolving credit facility during the year ended
December 31, 2016
and
2015
averaged $30.0 million and $11.9 million, respectively.
The net impact on our liquidity from changes in foreign currency exchange rates was not material for the years ended
December 31, 2016
and
2015
. We had
$14.6 million
in cash at
December 31, 2016
, of which $11.5 million was held in foreign jurisdictions, and we had
$11.5 million
in cash at December 31,
2015
, of which $7.8 million was held in foreign jurisdictions. Additionally, operations outside of North America accounted for
18.6%
and
18.9%
of the Company's consolidated revenue for the years ended
December 31, 2016
and
2015
.
35
We had a working capital deficit of
$233.2 million
and
$152.6 million
at
December 31, 2016
and
2015
, respectively. Our working capital deficit has arisen from using cash generated from operations to make long-term investments in fixed assets and acquisitions and from share repurchases. We anticipate that we will continue to generate positive cash flows from operating activities and that the cash generated will be used principally to fund ongoing operations of our new and existing full service child care centers and expanded operations in the back-up dependent care and other educational advisory segments, as well as to make scheduled principal and interest payments and to repurchase shares.
The Company's
$1.3 billion
senior secured credit facilities consist of
$1.1 billion
in secured term loan facilities and a
$225.0 million
revolving credit facility. In January 2016, the Company amended its then existing credit agreement to increase the revolving credit facility from
$100.0 million
to
$225.0 million
. In November 2016, the Company modified its existing credit facilities and refinanced all of its outstanding term loans into a new seven year term loan facility, which resulted in the issuance of
$1.1 billion
in new term loans, a portion of which were used to repay
$922.5 million
in outstanding term loans under the previous credit facility, and $150.0 million of which was used to fund the acquisition of a business. A loss on the extinguishment of debt of $11.1 million was recorded in the year ended
December 31, 2016
, related to the write off of unamortized original issue cost and deferred financing fees in connection with the November 2016 debt refinancing. These amendments are further discussed below under “Debt.
”
On August 2, 2016, the board of directors of the Company authorized a share repurchase program of up to
$300.0 million
of the Company’s outstanding common stock, effective August 5, 2016. The share repurchase program, which has no expiration date, replaces the prior
$250.0 million
authorization announced on
February 4, 2015
, of which $26.3 million remained available at the date the program was replaced. The shares may be repurchased from time to time in open market transactions at prevailing market prices, in privately negotiated transactions, under Rule 10b5-1 plans, or by other means in accordance with federal securities laws. At
December 31,
2016
,
$282.8 million
remained outstanding under the repurchase program. During the year ended
December 31,
2016, the Company repurchased
1.7 million
shares for
$112.8 million
, including a total of
1.0 million
shares that were purchased from investment funds affiliated with the Sponsor in a secondary offering. During the year ended
December 31,
2015, the Company repurchased
2.2 million
shares for
$128.1 million
, including a total of
2.1 million
shares that were purchased from investment funds affiliated with the Sponsor in secondary offerings.
We believe that funds provided by operations, our existing cash and cash equivalent balances and borrowings available under our revolving credit facility will be adequate to meet planned operating and capital expenditures for at least the next 12 months under current operating conditions. However, if we were to undertake any significant acquisitions or investments in the purchase of facilities for new or existing child care and early education centers, which requires financing beyond our existing borrowing capacity, it may be necessary for us to obtain additional debt or equity financing. We may not be able to obtain such financing on reasonable terms, or at all.
Cash Flows
|
Years Ended December 31,
|
|||||||||||
|
2016
|
2015
|
2014
|
|||||||||
|
(In thousands)
|
|||||||||||
|
Net cash provided by operating activities
|
$
|
213,297
|
|
$
|
170,056
|
|
$
|
174,297
|
|
||
|
Net cash used in investing activities
|
$
|
(302,837
|
)
|
$
|
(155,354
|
)
|
$
|
(78,001
|
)
|
||
|
Net cash provided by (used in) financing activities
|
$
|
93,755
|
|
$
|
(90,581
|
)
|
$
|
(36,420
|
)
|
||
|
Cash and cash equivalents (beginning of period)
|
$
|
11,539
|
|
$
|
87,886
|
|
$
|
29,585
|
|
||
|
Cash and cash equivalents (end of period)
|
$
|
14,633
|
|
$
|
11,539
|
|
$
|
87,886
|
|
||
Cash Provided by Operating Activities
Cash provided by operating activities was
$213.3 million
for the year ended
December 31, 2016
, compared to $
170.1 million
in
2015
. The increase in cash provided by operating activities resulted from changes in working capital arising from an increase in collections due to timing and growth, lower cash tax payments in the period, the timing of other routine operating expenses, and the timing of routine tenant improvement allowances.
Cash provided by operating activities was $
170.1 million
for the year ended
December 31, 2015
, compared to $
174.3 million
in
2014
. The increase in net income from
2014
to
2015
of
$21.9 million
was largely offset by changes in non-cash items and working capital arising primarily from the timing of payments for income taxes and other routine operating expenses, as well as the timing of billings and collections when compared to the prior year.
We expect to generate approximately $225 million in cash from operations in
2017
.
36
Cash Used in Investing Activities
Cash used in investing activities was $
302.8 million
for the year ended
December 31, 2016
compared to $
155.4 million
for the same period in
2015
and was related to acquisitions, as well as fixed asset additions for new child care centers, maintenance and refurbishments in our existing centers, and continued investments in technology, equipment and furnishings. During the year ended
December 31, 2016
, the Company used
$228.7 million
to acquire 102 centers, as well as a provider of back-up care in the United States, compared to 57 centers acquired in
2015
for
$77.6 million
, which is the primary driver to the increase in cash used in investing activities.
Cash used in investing activities was
$155.4 million
for the year ended
December 31, 2015
compared to $
78.0 million
for the same period in
2014
and was related to fixed asset additions for new child care centers, maintenance and refurbishments in our existing centers, and continued investments in technology, equipment and furnishings, as well as investments in acquisitions. The Company acquired 57 centers in
2015
for
$77.6 million
compared to five centers in
2014
for
$13.2 million
, which was the primary driver to the increase in cash used in investing activities. Cash used in investing activities in
2014
related primarily to fixed asset additions. The investment in fixed asset additions in
2015
increased
$11.6 million
to
$77.8 million
from
$66.2 million
in the prior year due to investments in new child care centers.
We estimate that we will spend approximately $90 to $100 million in
2017
on fixed asset additions related to new child care centers, maintenance and refurbishments in our existing centers and continued investments in technology and equipment. As part of our growth strategy, we also expect to continue to make selective acquisitions, which may vary in size and which are less predictable in terms of the timing and amount of the capital requirements.
Cash Used in Financing Activities
Cash provided by financing activities amounted to
$93.8 million
for the year ended
December 31, 2016
compared to cash used in financing activities of
$90.6 million
in
2015
. The increase in cash provided by financing activities was due primarily to the November 2016 debt refinancing, which resulted in net proceeds of
$143.1 million
from the issuance of term loans of
$150.0 million
, net of debt issuance costs. Cash used by financing activities in
2016
related principally to stock repurchases of
$112.8 million
, taxes paid related to net share settlement of stock awards of
$7.7 million
and principal payments of
$7.2 million
on our debt, offset by net proceeds of
$52.0 million
from borrowings under the revolving credit facility, tax benefit on stock-based compensation of
$12.9 million
, proceeds from the exercise of stock options of
$11.7 million
, and proceeds from the issuance and sale of restricted stock of
$3.7 million
. Cash used by financing activities in
2015
related principally to stock repurchases of
$128.1 million
and principal payments of
$9.6 million
on our debt, offset by net proceeds of
$24.0 million
from borrowings under the revolving credit facility, proceeds from the exercise of stock options of
$9.8 million
, tax benefit on stock-based compensation of
$9.4 million
, and proceeds from the issuance and sale of restricted stock of
$3.9 million
.
Cash used in financing activities amounted to
$90.6 million
for the year ended
December 31, 2015
compared to
$36.4 million
in
2014
. The
2015
increase in cash used in financing activities was due primarily to a decrease in proceeds from net borrowings and the exercise of stock options. Cash used by financing activities in
2015
related to stock repurchases of
$128.1 million
and principal payments of
$9.6 million
on our debt, offset by net proceeds of
$24.0 million
from borrowings under the revolving credit facility, and proceeds from the exercise of stock options of
$9.8 million
, compared to stock repurchases of
$221.6 million
and principal payments of
$7.9 million
on our debt, offset by net proceeds of
$161.8 million
from the issuance of term loans, and proceeds from the exercise of stock options of
$17.4 million
.
Debt
On November 7, 2016, the Company modified its existing senior secured credit facilities by entering into an incremental and amendment and restatement agreement, which amended and restated the credit agreement and refinanced all of its outstanding term loans into a new seven year term loan facility. As of December 31, 2016, the Company's
$1.3 billion
senior secured credit facilities consisted of
$1.1 billion
in secured term loans and a
$225.0 million
revolving credit facility. The term loans mature on
November 7, 2023
and require quarterly principal payments of
$2.7 million
, with the remaining principal balance due on
November 7, 2023
. Prior to the November 2016 debt refinancing, the Company's senior secured credit facilities consisted of
955.0 million
in secured term loans and a
$225.0 million
revolving credit facility.
37
Outstanding term loan borrowings were as follows at
December 31, 2016
and
2015
(in thousands):
|
December 31,
|
|||||||
|
2016
|
2015
|
||||||
|
Term loans
|
$
|
1,075,000
|
|
$
|
929,650
|
|
|
|
Deferred financing costs and original issue discount
|
(10,241
|
)
|
(14,439
|
)
|
|||
|
Total debt
|
1,064,759
|
|
915,211
|
|
|||
|
Less current maturities
|
10,750
|
|
9,550
|
|
|||
|
Long-term debt
|
$
|
1,054,009
|
|
$
|
905,661
|
|
|
On January 26, 2016, the Company amended its then existing credit agreement to increase the revolving credit facility from
$100.0 million
to
$225.0 million
, to extend the maturity date on the revolving credit facility from
January 30, 2018
to
July 31, 2019
, and to modify the interest rate applicable to borrowings. The terms, interest rate, and availability of the revolving credit facility were not modified in the November 2016 debt refinancing. At
December 31, 2016
, there were borrowings outstanding of
$76.0 million
, with
$149.0 million
of the revolving credit facility available for borrowings, and at
December 31, 2015
, there were borrowings outstanding of
$24.0 million
, with
$76.0 million
of the revolving credit facility available for borrowings.
All borrowings under the credit agreement are subject to variable interest rates. Borrowings under the term loan facility bear interest at a rate per annum ranging from
1.5%
to
1.75%
over the Base Rate or
2.5%
to
2.75%
over the Eurocurrency Rate (each as defined in the credit agreement). The Base Rate is subject to an interest rate floor of
1.75%
and the Eurocurrency Rate is subject to an interest rate floor of
0.75%
, but only with respect to the term loan facility. Borrowings under the revolving credit facility bear interest at a rate per annum ranging from
1.25%
to
1.75%
over the Base Rate, or
2.25%
to
2.75%
over the Eurocurrency Rate.
All obligations under the senior secured credit facilities are secured by substantially all the assets of the Company’s U.S.-based subsidiaries. The senior secured credit facilities contain a number of covenants that, among other things and subject to certain exceptions, may restrict the ability of Bright Horizons Family Solutions LLC, our wholly-owned subsidiary, and its restricted subsidiaries, to: incur certain liens; make investments, loans, advances and acquisitions; incur additional indebtedness or guarantees; pay dividends on capital stock or redeem, repurchase or retire capital stock or subordinated indebtedness; engage in transactions with affiliates; sell assets, including capital stock of our subsidiaries; alter the business conducted; enter into agreements restricting our subsidiaries’ ability to pay dividends; and consolidate or merge.
In addition, the credit agreement governing the senior secured credit facilities requires Bright Horizons Capital Corp., our direct subsidiary, to be a passive holding company, subject to certain exceptions. The revolving credit facility requires Bright Horizons Family Solutions LLC, the borrower, and its restricted subsidiaries to comply with a maximum senior secured first lien net leverage ratio financial maintenance covenant, to be tested only if, on the last day of each fiscal quarter, revolving loans and/or swing-line loans in excess of a specified percentage of the revolving commitments on such date are outstanding under the revolving credit facility. The breach of this covenant is subject to certain equity cure rights.
The credit agreement governing the senior secured credit facilities contains certain customary affirmative covenants and events of default. We were in compliance with our financial covenants at
December 31, 2016
.
Contractual Obligations
The following table sets forth our contractual obligations as of
December 31, 2016
(in thousands):
|
2017
|
2018
|
2019
|
2020
|
2021
|
Thereafter
|
Total
|
|||||||||||||||||||||
|
Term loans (1)
|
$
|
10,750
|
|
$
|
10,750
|
|
$
|
10,750
|
|
$
|
10,750
|
|
$
|
10,750
|
|
$
|
1,021,250
|
|
$
|
1,075,000
|
|
||||||
|
Interest on long-term debt (2)
|
38,234
|
|
37,857
|
|
37,059
|
|
36,261
|
|
35,885
|
|
70,641
|
|
255,937
|
|
|||||||||||||
|
Operating leases
|
98,982
|
|
95,258
|
|
89,422
|
|
82,048
|
|
71,017
|
|
462,565
|
|
899,292
|
|
|||||||||||||
|
Total (3)
|
$
|
147,966
|
|
$
|
143,865
|
|
$
|
137,231
|
|
$
|
129,059
|
|
$
|
117,652
|
|
$
|
1,554,456
|
|
$
|
2,230,229
|
|
||||||
|
(1)
|
Scheduled principal payments on our term loans.
|
|
(2)
|
Interest on the outstanding principal balance of long-term debt was calculated using the weighted average interest rate for the year ended
December 31, 2016
of
3.9%
, including commitment fees on the unused line of credit.
|
|
(3)
|
Borrowings on our $225.0 million revolving credit facility are not included in the table above, of which there were borrowings outstanding of $76.0 million at December 31, 2016.
|
38
Overdraft Facility
Our subsidiaries in the United Kingdom maintain an overdraft facility with a United Kingdom bank (“U.K. bank”) to support local short-term working capital requirements. The overdraft facility is repayable upon demand from the U.K. bank. The facility provides maximum borrowings of
£0.3 million
(approximately
$0.4 million
at
December 31, 2016
) and is secured by a cross guarantee by and among our subsidiaries in the United Kingdom and a right of offset against all accounts maintained by the subsidiaries at the lending bank. The overdraft facility bears interest at the U.K. bank’s base rate plus
2.15%
. At
December 31, 2016
and
2015
, there were
no
amounts outstanding under the overdraft facility.
The Company has
25
letters of credit outstanding used to guarantee certain rent payments for up to
$1.0 million
. These letters of credit are guaranteed by cash deposits.
No
amounts have been drawn against these letters of credit.
Off-Balance Sheet Arrangements
We have no off-balance sheet arrangements.
Critical Accounting Policies
We prepare our consolidated financial statements in accordance with U.S. GAAP. Preparation of the consolidated financial statements requires us to make estimates and assumptions that affect the reported amounts of assets and liabilities and the disclosure of contingent assets and liabilities at the date of the consolidated financial statements, as well as the reported amounts of revenue and expenses during the reporting period. Actual results could differ from these estimates. The accounting policies we believe are critical in the preparation of our consolidated financial statements relate to revenue recognition and goodwill and other intangibles. We have other significant accounting policies that are more fully described under the heading “Organization and Significant Accounting Policies” in Note 1 to our consolidated financial statements appearing elsewhere in this Annual Report on Form 10-K. Both our critical and significant policies are important to an understanding of the consolidated financial statements.
Revenue Recognition
—We recognize revenue when persuasive evidence of an arrangement exists, delivery has occurred or services have been rendered, the fee is fixed and determinable and collectability is reasonably assured. We recognize revenue as services are performed.
Center-based care revenues consist primarily of tuition, which is comprised of amounts paid by parents, supplemented in some cases by payments from employer sponsors and, to a lesser extent, by payments from government agencies. Revenue may also include management fees, operating subsidies paid either in lieu of or to supplement parent tuition and fees for other services.
We enter into contracts with employer sponsors to manage and operate their child care centers and to provide back-up dependent care services and educational advisory services under various terms. Our contracts to operate child care and early education centers are generally three to ten years in length with varying renewal options. Our contracts for back-up dependent care arrangements and for educational advisory services are generally one to three years in length with varying renewal options.
We record deferred revenue for prepaid tuition and management fees and amounts received from consulting projects in advance of services being performed. We are also a party to certain agreements where the performance of services extends beyond an annual operating cycle. In these circumstances, we record a long-term obligation and recognize revenue over the period of the agreement as the services are rendered.
Goodwill and Intangible Assets
—Goodwill is recorded when the consideration for an acquisition exceeds the fair value of the net tangible and identifiable intangible assets acquired. Our intangible assets principally consist of various customer relationships and trade names. Identified intangible assets that have determinable useful lives are valued separately from goodwill and are amortized over the estimated period during which we derive a benefit. Intangible assets related to customer relationships include relationships with employer clients and relationships with parents. Customer relationships with parents are amortized using an accelerated method over their useful lives. All other intangible assets are amortized on a straight line basis over their useful lives.
In valuing the customer relationships and trade names, we utilize variations of the income approach, which relies on historical financial and qualitative information, as well as assumptions and estimates for projected financial information. We consider the income approach the most appropriate valuation technique because the inherent value of these assets is their ability to generate current and future income. Projected financial information is subject to risk if our estimates are incorrect. The most significant estimate relates to our projected revenues and profitability. If we do not meet the projected revenues and profitability used in the valuation calculations, then the intangible assets could be impaired. In determining the value of contractual rights and customer relationships, we reviewed historical customer attrition rates and determined a rate of approximately 30% per year for relationships with parents, and approximately 3.5% to 5.0% for employer client relationships. Our multi-year contracts with client customers typically result in low annual turnover, and our long-term relationships with clients make it difficult for competitors to displace us. The value of our customer relationships intangible assets could become
39
impaired if future results differ significantly from any of the underlying assumptions, including a higher customer attrition rate. Customer relationships are considered to be finite-lived assets, with estimated lives ranging from four to seventeen years. Certain trade names acquired as part of our strategy to expand by completing strategic acquisitions are considered to be finite-lived assets, with estimated lives ranging from five to ten years. The estimated lives were determined by calculating the number of years necessary to obtain 95% of the value of the discounted cash flows of the respective intangible asset.
Goodwill and certain trade names are considered indefinite-lived assets. Our trade names identify us and differentiate us from competitors, and, therefore, competition does not limit the useful life of these assets. Additionally, we believe that our primary trade names will continue to generate sales for an indefinite period. Goodwill and intangible assets with indefinite lives are not subject to amortization, but are tested annually for impairment or more frequently if there are indicators of impairment. Indefinite lived intangible assets are also subject to an annual evaluation to determine whether events and circumstances continue to support an indefinite useful life.
Goodwill impairment assessments are performed at the reporting unit level. The goodwill test involves a two-step process. The first step of the goodwill impairment test compares the fair value of the reporting unit with its carrying amount, including goodwill. Fair value for each reporting unit is determined by estimating the present value of expected future cash flows, which are forecasted for each of the next
ten
years, applying a long-term growth rate to the final year, discounted using the Company’s estimated discount rate. If the fair value of the Company’s reporting unit exceeds its carrying amount, the goodwill of the reporting unit is considered not impaired. If the carrying amount of the Company’s reporting unit exceeds its fair value, the second step of the goodwill impairment test is performed to measure the amount of impairment loss, if any. The second step of the goodwill impairment test, used to measure the amount of impairment loss, compares the implied fair value of the affected reporting unit’s goodwill with the carrying value. In applying the goodwill impairment test, the Company may first assess qualitative factors to determine whether it is more likely than not that the fair value of a reporting unit is less than the carrying value. Qualitative factors may include, but are not limited to, macroeconomic conditions, industry conditions, the competitive environment, changes in the market for the Company’s services, regulatory developments, cost factors, and entity specific factors such as overall financial performance. If, after assessing these qualitative factors, the Company determines that it is not more likely than not that that the carrying value exceeds the estimated fair value, then performing the two-step impairment test is not necessary. We performed a qualitative assessment during the annual impairment review as of October 1, 2016 and concluded that it is more likely than not that the fair value of the Company’s reporting units continues to exceed their carrying amount. Therefore, the two-step goodwill impairment test was not necessary in 2016.
No
goodwill impairment losses were recorded in the years ended December 31,
2016
,
2015
, or
2014
.
For certain trademarks that are included in our indefinite-lived intangible assets, we estimate the fair value first by estimating the total revenue attributable to each trademark and then by applying the royalty rate determined by an analysis of empirical, market-derived royalty rates for guideline intangible assets, consistent with the initial valuation of the intangibles, or 1% to 2%, and then comparing the estimated fair value of the trademarks with their carrying value. The forecasts of revenue and profitability growth for use in our long-range plan and the discount rate were the key assumptions in our intangible fair value analysis. We identified no impairments in the years ended December 31,
2016
,
2015
, and
2014
.
Definite-lived intangible assets are reviewed for impairment when events or circumstances indicate that the carrying amount of the asset may not be recovered. Definite-lived intangible assets are considered to be impaired if the carrying amount of the asset exceeds the undiscounted future cash flows expected to be generated by the asset over its remaining useful life. If an asset is considered to be impaired, the impairment is measured by the amount by which the carrying amount of the asset exceeds its fair value and is charged to results of operations at that time. We identified no impairments in the years ended December 31,
2016
,
2015
and
2014
.
Our primary market risk exposures relate to foreign currency exchange rate risk and interest rate risk.
Foreign Currency Risk
Our exposure to fluctuations in foreign currency exchange rates is primarily the result of foreign subsidiaries domiciled in the United Kingdom, Ireland, the Netherlands, India and Canada. We have not used financial derivative instruments to hedge foreign currency exchange rate risks associated with our foreign subsidiaries.
The assets and liabilities of our British, Irish, Dutch, Indian and Canadian subsidiaries, whose functional currencies are the British pound, Euro, Indian rupee and Canadian dollar, respectively, are translated into U.S. dollars at exchange rates in effect at the balance sheet date. Income and expense items are translated at the average exchange rates prevailing during the period. The cumulative translation effects for subsidiaries using a functional currency other than the U.S. dollar are included in accumulated other comprehensive loss as a separate component of stockholders’ equity. We estimate that had the exchange rate in each country unfavorably changed by 10% relative to the U.S. dollar, our consolidated earnings before taxes would have decreased by approximately
$3.0 million
for
2016
.
40
Interest Rate Risk
Interest rate exposure relates primarily to the effect of interest rate changes on borrowings outstanding under our revolving credit facility and term loans. At
December 31, 2016
, we had borrowings outstanding of
$76.0 million
under our revolving credit facility, which were subject to a weighted average interest rate of
4.2%
during the year then ended, and we had borrowings outstanding of
$1.1 billion
under our term loan facility, which were subject to a weighted average interest rate of
3.9%
during the year then ended. Based on the borrowings outstanding under the senior secured credit facilities during
2016
, we estimate that had the average interest rate on our borrowings increased by 100 basis points in
2016
, our interest expense for the year would have increased by approximately
$9.9 million
. This estimate assumes the interest rate of each borrowing is raised by 100 basis points. The impact on future interest expense as a result of future changes in interest rates will depend largely on the gross amount of our borrowings at that time.
41
REPORT OF INDEPENDENT REGISTERED PUBLIC ACCOUNTING FIRM
To the Board of Directors and Stockholders of
Bright Horizons Family Solutions Inc.
Watertown, Massachusetts
We have audited the accompanying consolidated balance sheets of Bright Horizons Family Solutions Inc. and subsidiaries (the “Company”) as of
December 31, 2016
and
2015
, and the related consolidated statements of income, comprehensive income, changes in stockholders' equity, and cash flows for each of the three years in the period ended
December 31, 2016
. These consolidated financial statements are the responsibility of the Company's management. Our responsibility is to express an opinion on these financial statements based on our audits.
We conducted our audits in accordance with the standards of the Public Company Accounting Oversight Board (United States). Those standards require that we plan and perform the audit to obtain reasonable assurance about whether the financial statements are free of material misstatement. An audit includes examining, on a test basis, evidence supporting the amounts and disclosures in the financial statements. An audit also includes assessing the accounting principles used and significant estimates made by management, as well as evaluating the overall financial statement presentation. We believe that our audits provide a reasonable basis for our opinion.
In our opinion, such consolidated financial statements present fairly, in all material respects, the financial position of Bright Horizons Family Solutions Inc. and subsidiaries as of
December 31, 2016
and
2015
, and the results of their operations and their cash flows for each of the three years in the period ended
December 31, 2016
, in conformity with accounting principles generally accepted in the United States of America.
We have also audited, in accordance with the standards of the Public Company Accounting Oversight Board (United States), the Company’s internal control over financial reporting as of
December 31, 2016
, based on criteria established in
Internal Control - Integrated Framework (2013)
issued by the Committee of Sponsoring Organizations of the Treadway Commission and our report dated
March 1, 2017
expressed an unqualified opinion on the Company’s internal control over financial reporting.
/s/ DELOITTE & TOUCHE LLP
Boston, Massachusetts
March 1, 2017
42
BRIGHT HORIZONS FAMILY SOLUTIONS INC.
(In thousands, except share data)
|
December 31,
|
|||||||
|
2016
|
2015
|
||||||
|
ASSETS
|
|||||||
|
Current assets:
|
|||||||
|
Cash and cash equivalents
|
$
|
14,633
|
|
$
|
11,539
|
|
|
|
Accounts receivable—net
|
97,212
|
|
97,295
|
|
|||
|
Prepaid expenses and other current assets
|
42,554
|
|
43,879
|
|
|||
|
Total current assets
|
154,399
|
|
152,713
|
|
|||
|
Fixed assets—net
|
529,432
|
|
429,736
|
|
|||
|
Goodwill
|
1,267,705
|
|
1,147,809
|
|
|||
|
Other intangibles—net
|
374,566
|
|
389,331
|
|
|||
|
Other assets
|
32,915
|
|
30,952
|
|
|||
|
Total assets
|
$
|
2,359,017
|
|
$
|
2,150,541
|
|
|
|
LIABILITIES AND STOCKHOLDERS’ EQUITY
|
|||||||
|
Current liabilities:
|
|||||||
|
Current portion of long-term debt
|
$
|
10,750
|
|
$
|
9,550
|
|
|
|
Borrowings on revolving credit facility
|
76,000
|
|
24,000
|
|
|||
|
Accounts payable and accrued expenses
|
125,400
|
|
114,776
|
|
|||
|
Deferred revenue
|
146,692
|
|
137,283
|
|
|||
|
Other current liabilities
|
28,738
|
|
19,734
|
|
|||
|
Total current liabilities
|
387,580
|
|
305,343
|
|
|||
|
Long-term debt—net
|
1,054,009
|
|
905,661
|
|
|||
|
Deferred rent and related obligations
|
59,518
|
|
50,039
|
|
|||
|
Other long-term liabilities
|
52,048
|
|
44,182
|
|
|||
|
Deferred revenue
|
6,284
|
|
4,608
|
|
|||
|
Deferred income taxes
|
111,711
|
|
113,100
|
|
|||
|
Total liabilities
|
1,671,150
|
|
1,422,933
|
|
|||
|
Commitments and contingencies (Note 13)
|
|
|
|||||
|
Stockholders’ equity:
|
|||||||
|
Preferred stock, $0.001 par value; 25,000,000 shares authorized and no shares issued or outstanding at December 31, 2016 and 2015
|
—
|
|
—
|
|
|||
|
Common stock, $0.001 par value; 475,000,000 shares authorized; 58,910,282 and 60,008,136 shares issued and outstanding at December 31, 2016 and 2015, respectively
|
59
|
|
60
|
|
|||
|
Additional paid-in capital
|
899,076
|
|
983,398
|
|
|||
|
Accumulated other comprehensive loss
|
(89,448
|
)
|
(39,270
|
)
|
|||
|
Accumulated deficit
|
(121,820
|
)
|
(216,580
|
)
|
|||
|
Total stockholders’ equity
|
687,867
|
|
727,608
|
|
|||
|
Total liabilities and stockholders’ equity
|
$
|
2,359,017
|
|
$
|
2,150,541
|
|
|
See notes to consolidated financial statements.
43
BRIGHT HORIZONS FAMILY SOLUTIONS INC.
(In thousands, except share data)
|
Years ended December 31,
|
|||||||||||
|
2016
|
2015
|
2014
|
|||||||||
|
Revenue
|
$
|
1,569,841
|
|
$
|
1,458,445
|
|
$
|
1,352,999
|
|
||
|
Cost of services
|
1,178,994
|
|
1,100,690
|
|
1,039,397
|
|
|||||
|
Gross profit
|
390,847
|
|
357,755
|
|
313,602
|
|
|||||
|
Selling, general and administrative expenses
|
163,967
|
|
148,164
|
|
137,683
|
|
|||||
|
Amortization of intangible assets
|
29,642
|
|
27,989
|
|
28,999
|
|
|||||
|
Income from operations
|
197,238
|
|
181,602
|
|
146,920
|
|
|||||
|
Loss on extinguishment of debt
|
(11,117
|
)
|
—
|
|
—
|
|
|||||
|
Interest income
|
81
|
|
163
|
|
103
|
|
|||||
|
Interest expense
|
(43,005
|
)
|
(41,609
|
)
|
(34,709
|
)
|
|||||
|
Income before income taxes
|
143,197
|
|
140,156
|
|
112,314
|
|
|||||
|
Income tax expense
|
(48,437
|
)
|
(46,229
|
)
|
(40,279
|
)
|
|||||
|
Net income
|
$
|
94,760
|
|
$
|
93,927
|
|
$
|
72,035
|
|
||
|
Allocation of net income to common stockholders:
|
|||||||||||
|
Common stock—basic
|
$
|
93,919
|
|
$
|
93,287
|
|
$
|
71,755
|
|
||
|
Common stock—diluted
|
$
|
93,938
|
|
$
|
93,303
|
|
$
|
71,761
|
|
||
|
Earnings per common share:
|
|||||||||||
|
Common stock—basic
|
$
|
1.59
|
|
$
|
1.53
|
|
$
|
1.09
|
|
||
|
Common stock—diluted
|
$
|
1.55
|
|
$
|
1.50
|
|
$
|
1.07
|
|
||
|
Weighted average number of common shares outstanding:
|
|||||||||||
|
Common stock—basic
|
59,229,069
|
|
60,835,574
|
|
65,612,572
|
|
|||||
|
Common stock—diluted
|
60,594,895
|
|
62,360,778
|
|
67,244,172
|
|
|||||
See notes to consolidated financial statements.
44
BRIGHT HORIZONS FAMILY SOLUTIONS INC.
CONSOLIDATED STATEMENTS OF COMPREHENSIVE INCOME
(In thousands)
|
Years ended December 31,
|
|||||||||||
|
2016
|
2015
|
2014
|
|||||||||
|
Net income
|
$
|
94,760
|
|
$
|
93,927
|
|
$
|
72,035
|
|
||
|
Other comprehensive loss:
|
|||||||||||
|
Foreign currency translation adjustments
|
(50,178
|
)
|
(17,583
|
)
|
(23,103
|
)
|
|||||
|
Total other comprehensive loss
|
(50,178
|
)
|
(17,583
|
)
|
(23,103
|
)
|
|||||
|
Comprehensive income
|
$
|
44,582
|
|
$
|
76,344
|
|
$
|
48,932
|
|
||
See notes to consolidated financial statements.
45
BRIGHT HORIZONS FAMILY SOLUTIONS INC.
CONSOLIDATED STATEMENTS OF CHANGES IN STOCKHOLDERS’ EQUITY
(In thousands, except share data)
|
Common Stock
|
Additional
Paid In
Capital
|
Treasury
Stock,
at Cost
|
Accumulated
Other
Comprehensive
Loss
|
Accumulated
Deficit
|
Total
Stockholders’
Equity
|
|||||||||||||||||||||
|
Shares
|
Amount
|
|||||||||||||||||||||||||
|
Balance at January 1, 2014
|
65,302,814
|
|
$
|
65
|
|
$
|
1,270,198
|
|
$
|
—
|
|
$
|
1,416
|
|
$
|
(382,542
|
)
|
$
|
889,137
|
|
||||||
|
Stock-based compensation
|
7,922
|
|
7,922
|
|
||||||||||||||||||||||
|
Exercise of stock options
|
1,212,458
|
|
2
|
|
17,420
|
|
17,422
|
|
||||||||||||||||||
|
Excess tax benefits from stock option exercises
|
9,123
|
|
9,123
|
|
||||||||||||||||||||||
|
Purchase of treasury stock
|
|
(221,577
|
)
|
|
|
(221,577
|
)
|
|||||||||||||||||||
|
Retirement of treasury stock
|
(4,980,470
|
)
|
(5
|
)
|
(221,572
|
)
|
221,577
|
|
—
|
|
||||||||||||||||
|
Translation adjustments
|
(23,103
|
)
|
(23,103
|
)
|
||||||||||||||||||||||
|
Net income
|
72,035
|
|
72,035
|
|
||||||||||||||||||||||
|
Balance at December 31, 2014
|
61,534,802
|
|
62
|
|
1,083,091
|
|
—
|
|
(21,687
|
)
|
(310,507
|
)
|
750,959
|
|
||||||||||||
|
Stock-based compensation
|
9,200
|
|
9,200
|
|
||||||||||||||||||||||
|
Exercise of stock options
|
694,381
|
|
—
|
|
9,811
|
|
9,811
|
|
||||||||||||||||||
|
Excess tax benefits from stock option exercises
|
9,397
|
|
9,397
|
|
||||||||||||||||||||||
|
Purchase of treasury stock
|
(128,103
|
)
|
(128,103
|
)
|
||||||||||||||||||||||
|
Retirement of treasury stock
|
(2,221,047
|
)
|
(2
|
)
|
(128,101
|
)
|
128,103
|
|
—
|
|
||||||||||||||||
|
Translation adjustments
|
(17,583
|
)
|
(17,583
|
)
|
||||||||||||||||||||||
|
Net income
|
93,927
|
|
93,927
|
|
||||||||||||||||||||||
|
Balance at December 31, 2015
|
60,008,136
|
|
60
|
|
983,398
|
|
—
|
|
(39,270
|
)
|
(216,580
|
)
|
727,608
|
|
||||||||||||
|
Stock-based compensation
|
11,646
|
|
11,646
|
|
||||||||||||||||||||||
|
Exercise of stock options
|
761,452
|
|
1
|
|
11,678
|
|
11,679
|
|
||||||||||||||||||
|
Excess tax benefits from stock option exercises
|
12,891
|
|
12,891
|
|
||||||||||||||||||||||
|
Options received in net share settlement of stock options exercises
|
(113,801
|
)
|
—
|
|
(7,747
|
)
|
(7,747
|
)
|
||||||||||||||||||
|
Purchase of treasury stock
|
(112,792
|
)
|
(112,792
|
)
|
||||||||||||||||||||||
|
Retirement of treasury stock
|
(1,745,505
|
)
|
(2
|
)
|
(112,790
|
)
|
112,792
|
|
—
|
|
||||||||||||||||
|
Translation adjustments
|
(50,178
|
)
|
(50,178
|
)
|
||||||||||||||||||||||
|
Net income
|
94,760
|
|
94,760
|
|
||||||||||||||||||||||
|
Balance at December 31, 2016
|
58,910,282
|
|
$
|
59
|
|
$
|
899,076
|
|
$
|
—
|
|
$
|
(89,448
|
)
|
$
|
(121,820
|
)
|
$
|
687,867
|
|
||||||
See notes to consolidated financial statements.
46
BRIGHT HORIZONS FAMILY SOLUTIONS INC.
(In thousands)
|
Years ended December 31,
|
|||||||||||
|
2016
|
2015
|
2014
|
|||||||||
|
CASH FLOWS FROM OPERATING ACTIVITIES:
|
|||||||||||
|
Net income
|
$
|
94,760
|
|
$
|
93,927
|
|
$
|
72,035
|
|
||
|
Adjustments to reconcile net income to net cash provided by operating activities:
|
|||||||||||
|
Depreciation and amortization
|
85,284
|
|
78,666
|
|
77,447
|
|
|||||
|
Loss on extinguishment of debt
|
11,117
|
|
—
|
|
—
|
|
|||||
|
Amortization of original issue discount and deferred financing costs
|
3,474
|
|
3,583
|
|
3,052
|
|
|||||
|
Non-cash revenue and other
|
(49
|
)
|
191
|
|
(149
|
)
|
|||||
|
Impairment losses on long-lived assets
|
92
|
|
41
|
|
206
|
|
|||||
|
(Gain) loss on disposal of fixed assets
|
(143
|
)
|
351
|
|
667
|
|
|||||
|
Stock-based compensation
|
11,646
|
|
9,200
|
|
7,922
|
|
|||||
|
Deferred income taxes
|
(12,121
|
)
|
(758
|
)
|
(13,376
|
)
|
|||||
|
Deferred rent
|
2,562
|
|
2,736
|
|
3,092
|
|
|||||
|
Changes in assets and liabilities:
|
|||||||||||
|
Accounts receivable
|
(78
|
)
|
(13,340
|
)
|
(4,604
|
)
|
|||||
|
Prepaid expenses and other current assets
|
(7,289
|
)
|
3,825
|
|
2,174
|
|
|||||
|
Income taxes
|
12,773
|
|
(12,073
|
)
|
3,505
|
|
|||||
|
Accounts payable and accrued expenses
|
(6,858
|
)
|
(6,448
|
)
|
9,589
|
|
|||||
|
Deferred revenue
|
7,750
|
|
2,955
|
|
14,259
|
|
|||||
|
Accrued rent and related obligations
|
7,517
|
|
4,642
|
|
3,222
|
|
|||||
|
Other assets
|
(319
|
)
|
(14,296
|
)
|
(1,672
|
)
|
|||||
|
Other current and long-term liabilities
|
3,179
|
|
16,854
|
|
(3,072
|
)
|
|||||
|
Net cash provided by operating activities
|
213,297
|
|
170,056
|
|
174,297
|
|
|||||
|
CASH FLOWS FROM INVESTING ACTIVITIES:
|
|||||||||||
|
Purchases of fixed assets
|
(75,334
|
)
|
(77,785
|
)
|
(66,194
|
)
|
|||||
|
Proceeds from the disposal of fixed assets
|
1,234
|
|
50
|
|
385
|
|
|||||
|
Settlement of purchase price for prior year acquisitions
|
10
|
|
23
|
|
1,030
|
|
|||||
|
Payments for acquisitions—net of cash acquired
|
(228,747
|
)
|
(77,642
|
)
|
(13,222
|
)
|
|||||
|
Net cash used in investing activities
|
(302,837
|
)
|
(155,354
|
)
|
(78,001
|
)
|
|||||
|
CASH FLOWS FROM FINANCING ACTIVITIES:
|
|||||||||||
|
Borrowings of long-term debt, net of issuance costs of $9.4 million in 2016 and $3.2 million in 2014
|
1,065,610
|
|
—
|
|
161,803
|
|
|||||
|
Extinguishment of long-term debt
|
(922,488
|
)
|
—
|
|
—
|
|
|||||
|
Payments of contingent consideration for acquisitions
|
(915
|
)
|
—
|
|
—
|
|
|||||
|
Payments for debt issuance costs
|
(1,002
|
)
|
—
|
|
—
|
|
|||||
|
Borrowings under revolving credit facility
|
445,868
|
|
267,300
|
|
—
|
|
|||||
|
Payments under revolving credit facility
|
(393,868
|
)
|
(243,300
|
)
|
—
|
|
|||||
|
Principal payments of long-term debt
|
(7,163
|
)
|
(9,550
|
)
|
(7,900
|
)
|
|||||
|
Taxes paid related to the net share settlement of stock options
|
(7,747
|
)
|
—
|
|
—
|
|
|||||
|
Purchase of treasury stock
|
(112,792
|
)
|
(128,103
|
)
|
(221,577
|
)
|
|||||
|
Proceeds from issuance of common stock upon exercise of options
|
11,679
|
|
9,811
|
|
17,422
|
|
|||||
|
Proceeds from issuance of restricted stock
|
3,682
|
|
3,864
|
|
4,709
|
|
|||||
|
Tax benefits from stock-based compensation
|
12,891
|
|
9,397
|
|
9,123
|
|
|||||
|
Net cash provided by (used in) financing activities
|
93,755
|
|
(90,581
|
)
|
(36,420
|
)
|
|||||
|
Effect of exchange rates on cash and cash equivalents
|
(1,121
|
)
|
(468
|
)
|
(1,575
|
)
|
|||||
|
Net increase (decrease) in cash and cash equivalents
|
3,094
|
|
(76,347
|
)
|
58,301
|
|
|||||
|
Cash and cash equivalents—beginning of period
|
11,539
|
|
87,886
|
|
29,585
|
|
|||||
|
Cash and cash equivalents—end of period
|
$
|
14,633
|
|
$
|
11,539
|
|
$
|
87,886
|
|
||
47
|
Years ended December 31,
|
|||||||||||
|
2016
|
2015
|
2014
|
|||||||||
|
SUPPLEMENTAL CASH FLOW INFORMATION:
|
|||||||||||
|
Cash payments of interest
|
$
|
37,090
|
|
$
|
38,110
|
|
$
|
32,473
|
|
||
|
Cash payments of income taxes
|
$
|
34,670
|
|
$
|
49,819
|
|
$
|
41,713
|
|
||
|
NON-CASH TRANSACTION:
|
|||||||||||
|
Fixed asset purchases recorded in accounts payable and accrued expenses
|
$
|
3,000
|
|
$
|
2,000
|
|
$
|
3,000
|
|
||
See notes to consolidated financial statements.
48
BRIGHT HORIZONS FAMILY SOLUTIONS INC.
NOTES TO CONSOLIDATED FINANCIAL STATEMENTS
1. ORGANIZATION AND SIGNIFICANT ACCOUNTING POLICIES
Organization
—Bright Horizons Family Solutions Inc. (“Bright Horizons” or the “Company”) provides workplace services for employers and families throughout the United States and the United Kingdom, and also in Puerto Rico, Canada, Ireland, the Netherlands, and India. Workplace services include center-based child care, education and enrichment programs, elementary school education, back-up dependent care (for children and elders), before and after school care, college preparation and admissions counseling, tuition reimbursement program management services, and other family support services.
The Company provides its center-based child care services under two general business models: a profit and loss (“P&L”) model, where the Company assumes the financial risk of operating a child care center; and a cost-plus model, where the Company is paid a fee by an employer client for managing a child care center on a cost-plus basis. The P&L model is further classified into two subcategories: (i) a sponsor model, where Bright Horizons provides child care and early education services on either an exclusive or priority enrollment basis for the employees of a specific employer sponsor; and (ii) a lease/consortium model, where the Company provides child care and early education services to the employees of multiple employers located within a specific real estate development (for example, an office building or office park), as well as to families in the surrounding community. In both the cost-plus and sponsor P&L models, the development of a new child care center, as well as ongoing maintenance and repair, is typically funded by an employer sponsor with whom the Company enters into a multi-year contractual relationship. In addition, employer sponsors typically provide subsidies for the ongoing provision of child care services for their employees. Under each model type, the Company retains responsibility for all aspects of operating the child care and early education center, including the hiring and paying of employees, contracting with vendors, purchasing supplies, and collecting tuition and related accounts receivable.
The Company provides back-up dependent care services through its own centers and through our Back-Up Care Advantage (“BUCA”) program, which offers access to a contracted network of in-home care agencies and center-based providers in locations where the Company does not otherwise have centers with available capacity.
Basis of Presentation
—Bright Horizons was acquired by investment funds affiliated with Bain Capital Partners LLC (the “Sponsor”) as a result of a transaction in 2008, pursuant to which a wholly owned merger subsidiary was merged with and into Bright Horizons Family Solutions, Inc. (the “Predecessor”). As part of the transaction, a new basis of accounting was established and the purchase price was allocated to the assets acquired and liabilities assumed based on their fair values. In July 2012, Bright Horizons Family Solutions Inc. changed its name from Bright Horizons Solutions Corp.
Stock Offerings
—On
January 30, 2013
, the Company completed an initial public offering (the “Offering”) and issued a total of
11.6 million
shares of common stock in exchange for
$233.3 million
, net of offering costs including
$1.6 million
expensed in 2012. The Company used the proceeds of the Offering, as well as certain amounts from a 2013 debt refinancing, to repay the principal and accumulated interest under its senior notes outstanding on January 30, 2013. The Company also authorized
25 million
shares of undesignated preferred stock for issuance.
Subsequent to the Offering, certain of the Company's stockholders have sold a total of
39.5 million
shares of the Company’s common stock in secondary offerings (“secondary offerings”), including
4.1 million
,
9.7 million
, and
15.9 million
shares in the years ended
December 31, 2016
,
2015
, and
2014
, respectively. The Company did not receive proceeds from the sale of shares in the secondary offerings. The Company incurred
$0.5 million
,
$0.6 million
, and
$1.0 million
in the years ended
December 31, 2016
,
2015
, and
2014
, respectively, in offering costs related to the secondary offerings, which are included in selling, general and administrative expenses. The Company purchased
1.0 million
,
2.1 million
, and
4.5 million
of the shares sold in the secondary offerings in
2016
,
2015
, and
2014
, respectively, from investment funds affiliated with the Sponsor at the same price per share paid by the underwriter to the selling stockholders.
Principles of Consolidation
—The consolidated financial statements include the accounts of the Company and its subsidiaries. Intercompany balances and transactions have been eliminated in consolidation.
Use of Estimates
—The preparation of the consolidated financial statements in conformity with accounting principles generally accepted in the United States of America requires management to make estimates and assumptions that affect the reported amounts of assets and liabilities and the disclosure of contingent assets and liabilities at the date of the consolidated financial statements, as well as the reported amounts of revenue and expenses during the reporting period. The Company’s significant accounting estimates in the preparation of the consolidated financial statements relate to the valuation of goodwill and other intangibles, and income taxes. Actual results may differ from management’s estimates.
49
Foreign Operations
—The functional currency of the Company’s foreign subsidiaries is their local currency. The assets and liabilities of the Company’s foreign subsidiaries are translated into U.S. dollars at exchange rates in effect at the balance sheet date. Income and expense items are translated at the average exchange rates prevailing during the period. The cumulative translation effect for subsidiaries using a functional currency other than the U.S. dollar is included in accumulated other comprehensive income or loss as a separate component of stockholders’ equity.
The Company’s intercompany accounts are denominated in the functional currency of the foreign subsidiary. Gains and losses resulting from the remeasurement of intercompany receivables that the Company considers to be of a long-term investment nature are recorded as a cumulative translation adjustment in accumulated other comprehensive income or loss as a separate component of stockholders’ equity, while gains and losses resulting from the remeasurement of intercompany receivables from those foreign subsidiaries for which the Company anticipates settlement in the foreseeable future are recorded in the consolidated statement of income. The net gains and losses recorded in the consolidated statements of income for the years ended December 31,
2016
,
2015
and
2014
were not significant.
Fair Value of Financial Instruments
—The Company defines fair value as the price that would be received to sell an asset or be paid to transfer a liability in an orderly transaction between market participants at the measurement date and applies the following fair value hierarchy, which prioritizes the inputs used to measure fair value into three levels and bases the categorization within the hierarchy upon the lowest level of input that is available and significant to the fair value measurement. The hierarchy gives the highest priority to observable inputs such as unadjusted quoted prices in active markets for identical assets or liabilities (Level 1 measurements) and the lowest priority to unobservable inputs (Level 3 measurements). The Company uses observable inputs where relevant and whenever possible.
Level 1—Quoted prices are available in active markets for identical investments as of the reporting date.
Level 2—Quoted prices for similar instruments in active markets; quoted prices for identical or similar instruments in markets that are not active; and model-derived valuations in which all significant inputs and significant value drivers are observable in active markets.
Level 3—Valuations derived from valuation techniques in which one or more significant inputs or significant value drivers are unobservable.
The Company’s financial instruments consist primarily of cash and cash equivalents, accounts receivable, accounts payable, borrowings on the revolving credit facility, and long-term debt. The fair value of the Company’s financial instruments, other than long-term debt, approximates their carrying value.
The carrying value and estimated fair value of long-term debt as of December 31,
2016
and
2015
were as follows (in thousands):
|
December 31, 2016
|
December 31, 2015
|
||||||||||||||||
|
Financial liabilities
|
Carrying value
|
Estimated Fair Value
|
Carrying value
|
Estimated Fair Value
|
|||||||||||||
|
Term loans
|
$
|
1,075,000
|
|
$
|
1,084,400
|
|
$
|
929,650
|
|
$
|
924,700
|
|
|||||
The estimated fair value of the Company's long-term debt is based on current bid prices for our long-term debt. As such, our long-term debt is classified as Level 1, as defined under U.S. GAAP.
Concentrations of Credit Risk
—Financial instruments that potentially expose the Company to concentrations of credit risk consist mainly of cash and cash equivalents and accounts receivable. The Company mitigates its exposure by maintaining its cash and cash equivalents in financial institutions of high credit standing. The Company’s accounts receivable, which are derived primarily from the services it provides, are dispersed across many clients in various industries with
no
single client accounting for more than
10%
of the Company’s net revenue or accounts receivable. The Company believes that
no
significant credit risk exists at December 31,
2016
and
2015
.
Cash and Cash Equivalents
—The Company considers all highly liquid investments with maturities, when purchased, of three months or less to be cash equivalents. Cash equivalents consist primarily of institutional money market accounts. There were
no
cash equivalent investments at December 31,
2016
and
2015
.
The Company’s cash management system provides for the funding of the main bank disbursement accounts on a daily basis as checks are presented for payment. Under this system, outstanding checks may be in excess of the cash balances at certain banks, creating book overdrafts. There were
$11.0 million
and
$10.6 million
in book overdrafts at December 31,
2016
and
2015
, respectively, included in accounts payable on the consolidated balance sheet.
Accounts Receivable
—The Company generates accounts receivable from fees charged to parents and employer sponsors and, to a lesser degree, government agencies. The Company monitors collections and payments and maintains a provision for
50
estimated losses based on historical trends, in addition to provisions established for specific collection issues that have been identified. Accounts receivable are stated net of this allowance for doubtful accounts.
Activity in the allowance for doubtful accounts is as follows (in thousands):
|
Years ended December 31,
|
|||||||||||
|
2016
|
2015
|
2014
|
|||||||||
|
Beginning balance
|
$
|
1,556
|
|
$
|
1,235
|
|
$
|
1,173
|
|
||
|
Provision
|
839
|
|
1,322
|
|
551
|
|
|||||
|
Write offs and recoveries
|
(1,341
|
)
|
(1,001
|
)
|
(489
|
)
|
|||||
|
Ending balance
|
$
|
1,054
|
|
$
|
1,556
|
|
$
|
1,235
|
|
||
Fixed Assets
—Property and equipment, including leasehold improvements, are carried at cost less accumulated depreciation or amortization. Depreciation is calculated on a straight-line basis over the estimated useful lives of the assets. Leasehold improvements are amortized on a straight-line basis over the shorter of the lease term or their estimated useful lives. The cost and accumulated depreciation of assets sold or otherwise disposed of are removed from the consolidated balance sheet and the resulting gain or loss is reflected in the consolidated statement of income. Expenditures for maintenance and repairs are expensed as incurred, whereas expenditures for improvements and replacements are capitalized. Depreciation is included in cost of services and selling, general and administrative expenses depending on the nature of the expenditure.
Business Combinations
—Business combinations are accounted for at fair value. Acquisition costs are expensed as incurred and recorded in selling, general and administrative expenses; integration costs associated with a business combination are expensed subsequent to the acquisition date; and changes in deferred tax asset valuation allowances and income tax uncertainties after the acquisition date affect income tax expense. The accounting for business combinations requires estimates and judgment as to expectations for future cash flows of the acquired business, the allocation of those cash flows to identifiable intangible assets, and in determining the estimated fair value for assets acquired and liabilities assumed. The fair values assigned to tangible and intangible assets acquired and liabilities assumed are based on management’s estimates and assumptions, as well as other information compiled by management, including valuations that utilize customary valuation procedures and techniques. If the actual results differ from these estimates, the amounts recorded in the financial statements could result in a possible impairment of the intangible assets and goodwill, or require acceleration of the amortization expense of finite-lived intangible assets.
Goodwill and Intangible Assets
—Goodwill is recorded when the consideration for an acquisition exceeds the fair value of the net tangible and identifiable intangible assets acquired. The Company’s intangible assets principally consist of various customer relationships and trade names. Goodwill and intangible assets with indefinite lives are not subject to amortization, but are tested annually for impairment or more frequently if there are indicators of impairment. Indefinite lived intangible assets are also subject to an annual evaluation to determine whether events and circumstances continue to support an indefinite useful life.
Goodwill impairment assessments are performed at the reporting unit level. The goodwill test involves a two-step process. The first step of the goodwill impairment test compares the fair value of the reporting unit with its carrying amount, including goodwill. Fair value for each reporting unit is determined by estimating the present value of expected future cash flows, which are forecasted for each of the next
ten
years, applying a long-term growth rate to the final year, discounted using the Company’s estimated discount rate. If the fair value of the Company’s reporting unit exceeds its carrying amount, the goodwill of the reporting unit is considered not impaired. If the carrying amount of the Company’s reporting unit exceeds its fair value, the second step of the goodwill impairment test is performed to measure the amount of impairment loss, if any. The second step of the goodwill impairment test, used to measure the amount of impairment loss, compares the implied fair value of the affected reporting unit’s goodwill with the carrying value. In applying the goodwill impairment test, the Company may first assess qualitative factors to determine whether it is more likely than not that the fair value of a reporting unit is less than the carrying value. Qualitative factors may include, but are not limited to, macroeconomic conditions, industry conditions, the competitive environment, changes in the market for the Company’s services, regulatory developments, cost factors, and entity specific factors such as overall financial performance. If, after assessing these qualitative factors, the Company determines that it is not more likely than not that that the carrying value exceeds the estimated fair value, then performing the two-step impairment test is not necessary. The Company performed a qualitative assessment during the annual impairment review as of October 1, 2016 and concluded that it is not more likely than not that the fair value of the Company’s reporting units are less than their carrying amount. Therefore, the two-step goodwill impairment test was not necessary in 2016.
No
goodwill impairment losses were recorded in the years ended December 31,
2016
,
2015
, or
2014
.
We test certain trademarks that are included in our indefinite-lived intangible assets by comparing the fair value of the trademarks with their carrying value. We estimate the fair value first by estimating the total revenue attributable to the
51
trademarks and then by applying a royalty rate determined by an analysis of empirical, market-derived royalty rates for guideline intangible assets, consistent with the initial valuation of the intangibles, and then comparing the estimated fair value of our trademarks with the carrying value. This approach takes into effect Level 3 and unobservable inputs.
No
impairment losses were recorded in the years ended December 31,
2016
,
2015
or
2014
in relation to intangible assets.
Intangible assets that are separable from goodwill and have determinable useful lives are valued separately and are amortized over the estimated period benefited, ranging from
one
to
seventeen
years. Intangible assets related to parent relationships are amortized using the double declining balance method over their useful lives. All other intangible assets are amortized on a straight line basis over their useful lives.
Impairment of Long-Lived Assets
—The Company reviews long-lived assets for possible impairment whenever events or changes in circumstances indicate that the carrying amount of such assets may not be recoverable. Impairment is assessed by comparing the carrying amount of the asset to the estimated undiscounted future cash flows over the asset’s remaining life. If the estimated cash flows are less than the carrying amount of the asset, an impairment loss is recognized to reduce the carrying amount of the asset to its estimated fair value less any disposal costs. Fair value can be determined using discounted cash flows and quoted market prices based on Level 3 inputs. The Company recorded fixed asset impairment losses of less than
$0.1 million
in the years ended December 31,
2016
and
2015
, and
$0.2 million
in the year ended December 31,
2014
, which have been included in cost of services.
Other Long-Term Assets
—Other long-term assets includes a cost basis investment of
$2.1 million
in a private company, which we review for impairment whenever events or changes in circumstances indicate that the carrying amount of such asset may not be recoverable.
Deferred Revenue
—The Company records deferred revenue for prepaid tuition and management fees and amounts received from consulting projects in advance of services being performed. The Company is also a party to agreements where the performance of services extends beyond one year. In these circumstances, the Company records a long-term obligation and recognizes revenue over the period of the agreement as the services are rendered.
Leases and Deferred Rent
—The Company leases space for certain of its centers and corporate offices. Leases are evaluated and classified as operating or capital for financial reporting purposes. The Company recognizes rent expense from operating leases with periods of free rent, tenant allowances and scheduled rent increases on a straight-line basis over the applicable lease term. The difference between rents paid and straight-line rent expense is recorded as deferred rent.
Deferred Financing Costs
—Deferred financing costs are recorded as a reduction of long-term debt and are amortized over the life of the related debt instrument in accordance with the effective interest method. Amortization of this expense is included in interest expense in the consolidated statement of income.
Other Long-Term Liabilities
—Other long-term liabilities consist primarily of amounts payable to clients, pursuant to terms of operating agreements or for deposits held by the Company, liabilities for workers compensation claims, and obligations for uncertain tax positions.
Income Taxes
—The Company accounts for income taxes using the asset and liability method. Under the asset and liability method, deferred tax assets and liabilities are recognized for the future tax consequences attributable to temporary differences between the financial statement carrying amounts of existing assets and liabilities and their respective tax bases and for tax carryforwards, such as net operating losses. Deferred tax assets and liabilities are measured using enacted tax rates expected to apply to taxable income in the years in which those temporary differences are expected to be recovered or settled. The effect on deferred tax assets and liabilities of a change in tax rates is recognized in the provision for income taxes in the period that includes the enactment date. The Company records a valuation allowance to reduce the carrying amount of deferred tax assets if it is more likely than not that such asset will not be realized. Additional income tax expense is recognized as a result of recording valuation allowances. The Company does not recognize a tax benefit on losses in foreign operations where it does not have a history of profitability. The Company records penalties and interest on income tax related items as a component of tax expense.
Obligations for uncertain tax positions are recorded based on an assessment of whether the position is more likely than not to be sustained by the taxing authorities. The Company recognizes accrued interest and penalties related to unrecognized tax benefits in income tax expense.
Revenue Recognition
—The Company recognizes revenue when persuasive evidence of an arrangement exists, delivery has occurred or services have been rendered, the fee is fixed and determinable, and collectability is reasonably assured.
52
Center-based care revenues consist primarily of tuition, which consists of amounts paid by parents, supplemented in some cases by payments from employer sponsors and, to a lesser extent, by payments from government agencies. Revenue may also include management fees, operating subsidies paid either in lieu of or to supplement parent tuition, and fees for other services. Revenue for center-based care is recognized as the services are performed.
The Company enters into contracts with its employer sponsors to manage and operate their child care and early education centers and/or for the provision of back-up dependent care and other educational advisory services under various terms. The Company’s contracts to operate child care and early education centers are generally
three
to
ten
years in length with varying renewal options. The Company’s contracts for back-up dependent care and other educational advisory services are generally
one
to
three
years in length with varying renewal options. Revenue for these services is recognized as they are performed.
Stock-Based Compensation
—The Company accounts for stock-based compensation using a fair value method. Stock-based compensation expense is recognized in the consolidated financial statements based on the grant-date fair value of the awards that are expected to vest. This expense is recognized on a straight-line basis over the requisite service period, which generally represents the vesting period, of each separately vesting tranche. The Company calculates the fair value of stock options using the Black-Scholes option-pricing model.
Comprehensive Income or Loss
—Comprehensive income or loss is comprised of net income or loss and foreign currency translation adjustments. The Company does not provide for U.S. income taxes on the portion of undistributed earnings of foreign subsidiaries that are intended to be permanently reinvested. Therefore, taxes are not provided for the related currency translation adjustments.
Earnings or Loss Per Share
—Net earnings or loss per share is calculated using the
two-class
method, which is an earnings allocation formula that determines net income or loss per share for the holders of the Company’s common stock and unvested participating shares. Unvested participating shares are unvested share-based payment awards of restricted stock that participate in dividends with common stock. Net income available to stockholders is allocated on a pro rata basis to each share as if all of the earnings for the period had been distributed. Diluted net income or loss per share is calculated using the more dilutive of (1) the
treasury stock
method, or (2) the
two-class
method for all outstanding stock options.
New Accounting Pronouncements
—In March 2016, the Financial Accounting Standards Board (“FASB”) issued Accounting Standards Update (“ASU”) No. 2016-09:
Compensation - Stock Compensation (Topic 718): Improvements to Employee Share-Based Payment Accounting
. The amendments in this update simplify several aspects of the accounting for employee share-based payment transactions, including the accounting for income taxes, forfeitures and statutory tax withholding requirements, as well as classification in the statement of cash flows. Under this guidance, a company recognizes all excess tax benefits and tax deficiencies as income tax benefits or expenses on the income statement. The update is effective for annual reporting periods beginning after December 15, 2016, including interim periods within those annual reporting periods with early adoption permitted. This update can be applied either prospectively, retrospectively or using a modified retrospective transition method, depending on the area covered. The Company will adopt this ASU on its effective date. The adoption of this guidance will impact the Company's income tax expense, effective tax rate, and weighted average shares outstanding. However, the impact of this update on the Company's consolidated financial statements is dependent on the timing and volume of stock option exercises, which is not in the Company's control and is inherently difficult to predict. Had the Company adopted this ASU on January 1, 2016, tax benefits from stock option exercises of
$12.9 million
, currently recorded to additional paid in capital, would have decreased tax expense and increased net income, and weighted average diluted common shares would have increased under the new methodology. Additionally, tax benefits from stock option exercises would have been presented as cash flows from operating activities rather than as cash flows from investing activities as currently presented.
In February 2016, FASB issued ASU 2016-02,
Leases (Topic 842)
. This standard amends the existing guidance and requires lessees to recognize on the balance sheet assets and liabilities for the rights and obligations created by those leases with lease terms longer than twelve months. The guidance is effective for interim and annual reporting periods beginning after December 15, 2018. Early adoption is permitted. The Company anticipates that the adoption of this standard will have a material impact on the Company's consolidated financial statements, as all long-term leases will be capitalized on the consolidated balance sheet.
In May 2014, the FASB issued ASU 2014-09,
Revenue from Contracts with Customers (Topic 606)
, which provides a single comprehensive model for revenue recognition. The FASB has subsequently issued various ASUs which amend or clarify specific areas of the guidance. The standard's core principle is that a company will recognize revenue when it transfers promised goods or services to customers in an amount that reflects the consideration to which the company expects to be entitled in exchange for those goods or services. In doing so, companies will need to use more judgment and make more estimates than under current guidance. These may include identifying performance obligations in the contract, estimating the amount of variable consideration included in the transaction price and allocating the transaction price to each separate performance obligation. This new guidance is effective for the Company beginning January 1, 2018 and can be adopted using
53
either a full retrospective or modified approach. The Company is currently in the process of evaluating the impact of adoption of this ASU on the Company's consolidated financial statements, but does not currently anticipate it will have a material impact on the Company's consolidated results of operations.
2. ACQUISITIONS
As part of the Company’s growth strategy to expand through strategic and synergistic acquisitions, the Company has made the following acquisitions in the years ended
December 31, 2016
,
2015
, and
2014
. The goodwill resulting from these acquisitions arises largely from synergies expected from combining the operations of the businesses acquired with our existing operations, as well as from benefits derived from gaining the related assembled workforce.
2016
Acquisitions
Conchord Limited (“Asquith”)
On
November 10, 2016
, the Company acquired all of the outstanding shares of Conchord Limited, which operates Asquith Day Nurseries & Pre-Schools (“Asquith
”
), a group of
90
child care centers and programs throughout the United Kingdom, for cash consideration of
$206.1 million
, which was accounted for as a business combination. The purchase price was financed with available cash on hand, funds available under the Company’s revolving credit facility, and term loans. The Company incurred transaction costs of approximately
$1.4 million
for this transaction, which are included in selling, general and administrative expenses.
The purchase price for this acquisition has been allocated based on preliminary estimates of the fair values of the acquired assets and assumed liabilities at the date of acquisition as follows (in thousands):
|
At acquisition date
As reported
December 31, 2016
|
|||
|
Cash
|
$
|
5,210
|
|
|
Prepaid expenses and other assets
|
5,700
|
|
|
|
Fixed assets
|
96,868
|
|
|
|
Intangible assets
|
10,540
|
|
|
|
Goodwill
|
122,714
|
|
|
|
Total assets acquired
|
241,032
|
|
|
|
Accounts payable and accrued expenses
|
(18,696
|
)
|
|
|
Deferred revenue and parent deposits
|
(5,394
|
)
|
|
|
Deferred tax liabilities
|
(7,793
|
)
|
|
|
Other long-term liabilities
|
(3,048
|
)
|
|
|
Total liabilities assumed
|
(34,931
|
)
|
|
|
Purchase price
|
$
|
206,101
|
|
The Company acquired fixed assets of
$96.9 million
, including
39
properties. The Company recorded goodwill of
$122.7 million
, which will not be deductible for tax purposes. Goodwill related to this acquisition is reported within the full service center-based care segment. Intangible assets consist of
$8.0 million
of customer relationships that will be amortized over
five
years and
$2.5 million
of trademarks that will be amortized over
six
years.
The allocation of purchase price consideration is based on preliminary estimates of fair value; such estimates and assumptions are subject to change within the measurement period (up to one year from the acquisition date). As of
December 31, 2016
, the purchase price allocation for Asquith remains open as the Company gathers additional information regarding the assets acquired and the liabilities assumed, primarily in relation to the valuation of properties, intangibles and leases, and the Company's assessment of tax related items.
The operating results for Asquith are included in the consolidated results of operations from the date of acquisition. The following table presents consolidated pro forma information as if the acquisition of Asquith had occurred on January 1, 2015 (in thousands):
|
Pro forma (Unaudited)
|
|||||||
|
Years ended December 31,
|
|||||||
|
2016
|
2015
|
||||||
|
Revenue
|
$
|
1,649,665
|
|
$
|
1,548,560
|
|
|
|
Net income
|
$
|
96,033
|
|
$
|
89,404
|
|
|
54
The unaudited pro forma results reflect certain adjustments related to the acquisition, such as increased amortization expense related to the acquired intangible assets as well as financing costs. The pro forma results for the year ended
December 31, 2015
include nonrecurring transaction costs that were incurred by the Company and the acquired business in relation to the acquisition, totaling
$4.3 million
, which were excluded from the pro forma results for the year ended
December 31, 2016
.
Asquith contributed total revenue of
$11.3 million
in the year ended
December 31, 2016
. The Company has determined that the presentation of net income, from the date of acquisition, is impracticable due to the integration of the operations upon acquisition.
Other
2016
Acquisitions
During the year ended
December 31, 2016
, the Company also acquired
four
centers in the United States and
eight
centers in the United Kingdom in
four
separate business acquisitions, which were each accounted for as business combinations. The centers were acquired for cash consideration of
$18.0 million
and contingent consideration of
$1.1 million
. The Company recorded goodwill of
$16.8 million
related to the full service center-based care segment, a portion of which will be deductible for tax purposes. Intangible assets of
$3.4 million
, consisting primarily of customer relationships that will be amortized over
five years
, and a working capital deficit of
$1.6 million
, including cash of
$0.3 million
, were also recorded in relation to these acquisitions.
During the year ended
December 31, 2016
, the Company acquired all of the outstanding shares of a provider of back-up care in the United States, which was accounted for as a business combination. The business was acquired for cash consideration of
$10.4 million
and contingent consideration of
$3.8 million
. The Company recorded goodwill of
$9.2 million
related to the back-up care segment, which will not be deductible for tax purposes. Intangible assets of
$4.9 million
, consisting primarily of the provider network that will be amortized over
five years
, technology of
$2.6 million
, and working capital of
$0.4 million
, including cash of
$0.3 million
, were also recorded in relation to this acquisition.
The allocation of purchase price consideration is based on preliminary estimates of fair value; such estimates and assumptions are subject to change within the measurement period (up to one year from the acquisition date). As of
December 31, 2016
, the purchase price allocations for the
2016
acquisitions remain open as the Company gathers additional information regarding the assets acquired and the liabilities assumed. The operating results for the acquired businesses are included in the consolidated results of operations from the dates of acquisition, which were not material to the Company's financial results.
2015
Acquisitions
On May 19, 2015, the Company acquired Hildebrandt Learning Centers, LLC, an operator of
40
centers in the United States, for cash consideration of
$19.2 million
and contingent consideration of
$0.5 million
, which was accounted for as a business combination. The Company recorded goodwill of
$13.2 million
related to the full service center-based care segment, which will be deductible for tax purposes, and intangible assets of
$5.7 million
, consisting of customer relationships that will be amortized over
12
years. The Company also acquired working capital of
$0.3 million
, including cash of
$1.5 million
, and fixed assets of
$0.5 million
.
On July 15, 2015, the Company acquired Active Learning Childcare Limited, an operator of
nine
centers in the United Kingdom, for cash consideration of
$42.2 million
, which was accounted for as a business combination. The Company recorded goodwill of
$31.1 million
related to the full service center-based care segment, which will not be deductible for tax purposes, and intangible assets of
$3.8 million
, consisting primarily of customer relationships that will be amortized over
five
years. The Company also acquired a working capital deficit of
$1.8 million
, including cash of
$2.8 million
, fixed assets of
$9.8 million
, and deferred tax liabilities of
$0.7 million
.
Our acquisitions of Hildebrandt Learning Centers, LLC and Active Learning Childcare Limited contributed approximately $
29.6 million
of incremental revenue in the year ended
December 31, 2015
.
During the year ended
December 31, 2015
, the Company also acquired
four
additional centers in the United States and
four
additional centers in the United Kingdom, in
six
separate business acquisitions which were each accounted for as business combinations. The centers were acquired for cash consideration of
$20.5 million
and contingent consideration of
$0.8 million
, net of cash acquired of
$0.3 million
. The Contingent consideration of
$0.8 million
was paid during the year ended
December 31, 2016
. The company recorded goodwill of
$18.5 million
related to the full service center-based care segment, a portion of which will be deductible for tax purposes. Intangible assets of
$2.7 million
, consisting primarily of customer relationships that will be amortized over
five
years, were also recorded in relation to these acquisitions.
2014
Acquisitions
During the year ended
December 31, 2014
, the Company acquired
two
businesses that operate
five
centers in the United States for cash consideration of
$13.2 million
, which were accounted for as business combinations. The Company recorded
55
goodwill of
$11.1 million
related to the full service center-based care segment, which will be deductible for tax purposes. Intangible assets of
$2.1 million
, consisting primarily of customer relationships, fixed assets of
$0.9 million
, and a working capital deficit of
$0.9 million
were also recorded in relation to these acquisitions.
3. GOODWILL AND INTANGIBLE ASSETS
The changes in the carrying amount of goodwill are as follows (in thousands):
|
Full service
center-based care |
Back-up
dependent care |
Other educational
advisory services |
Total
|
||||||||||||
|
Balance at December 31, 2014
|
$
|
913,043
|
|
$
|
158,894
|
|
$
|
23,801
|
|
$
|
1,095,738
|
|
|||
|
Additions from acquisitions
|
62,838
|
|
—
|
|
—
|
|
62,838
|
|
|||||||
|
Adjustments to prior year acquisitions
|
(15
|
)
|
—
|
|
—
|
|
(15
|
)
|
|||||||
|
Effect of foreign currency translation
|
(10,752
|
)
|
—
|
|
—
|
|
(10,752
|
)
|
|||||||
|
Balance at December 31, 2015
|
965,114
|
|
158,894
|
|
23,801
|
|
1,147,809
|
|
|||||||
|
Additions from acquisitions
|
139,539
|
|
9,214
|
|
—
|
|
148,753
|
|
|||||||
|
Adjustments to prior year acquisitions
|
73
|
|
—
|
|
—
|
|
73
|
|
|||||||
|
Effect of foreign currency translation
|
(28,930
|
)
|
—
|
|
—
|
|
(28,930
|
)
|
|||||||
|
Balance at December 31, 2016
|
$
|
1,075,796
|
|
$
|
168,108
|
|
$
|
23,801
|
|
$
|
1,267,705
|
|
|||
The Company also has intangible assets, which consist of the following at
December 31, 2016
and
2015
(in thousands):
|
December 31, 2016:
|
Weighted average amortization
period |
Cost
|
Accumulated
amortization |
Net carrying
amount |
|||||||||
|
Definite-lived intangibles:
|
|||||||||||||
|
Customer relationships
|
15 years
|
$
|
392,820
|
|
$
|
(205,342
|
)
|
$
|
187,478
|
|
|||
|
Trade names
|
7 years
|
8,283
|
|
(2,961
|
)
|
5,322
|
|
||||||
|
Non-compete agreements
|
N/A
|
49
|
|
(49
|
)
|
—
|
|
||||||
|
401,152
|
|
(208,352
|
)
|
192,800
|
|
||||||||
|
Indefinite-lived intangibles:
|
|||||||||||||
|
Trade names
|
N/A
|
181,766
|
|
—
|
|
181,766
|
|
||||||
|
$
|
582,918
|
|
$
|
(208,352
|
)
|
$
|
374,566
|
|
|||||
|
December 31, 2015:
|
Weighted average amortization
period |
Cost
|
Accumulated
amortization |
Net carrying
amount |
|||||||||
|
Definite-lived intangibles:
|
|||||||||||||
|
Customer relationships
|
14 years
|
$
|
410,205
|
|
$
|
(207,257
|
)
|
$
|
202,948
|
|
|||
|
Trade names
|
8 years
|
6,046
|
|
(2,748
|
)
|
3,298
|
|
||||||
|
Non-compete agreements
|
5 years
|
53
|
|
(48
|
)
|
5
|
|
||||||
|
416,304
|
|
(210,053
|
)
|
206,251
|
|
||||||||
|
Indefinite-lived intangibles:
|
|||||||||||||
|
Trade names
|
N/A
|
183,080
|
|
—
|
|
183,080
|
|
||||||
|
$
|
599,384
|
|
$
|
(210,053
|
)
|
$
|
389,331
|
|
|||||
The Company recorded amortization expense of
$29.6 million
,
$28.0 million
and
$29.0 million
in the years ended December 31,
2016
,
2015
, and
2014
, respectively.
56
The Company estimates that it will record amortization expense related to intangible assets existing as of
December 31, 2016
as follows over the next five years (in thousands):
|
Estimated amortization expense
|
|||
|
2017
|
$
|
30,749
|
|
|
2018
|
$
|
28,107
|
|
|
2019
|
$
|
26,380
|
|
|
2020
|
$
|
25,719
|
|
|
2021
|
$
|
24,514
|
|
4. PREPAID EXPENSES AND OTHER CURRENT ASSETS
Prepaid expenses and other current assets consist of the following (in thousands):
|
December 31,
|
|||||||
|
2016
|
2015
|
||||||
|
Prepaid rent and other occupancy costs
|
$
|
13,932
|
|
$
|
12,165
|
|
|
|
Prepaid income taxes
|
649
|
|
12,569
|
|
|||
|
Prepaid workers compensation claims
|
4,609
|
|
5,385
|
|
|||
|
Reimbursable costs
|
6,101
|
|
2,450
|
|
|||
|
Prepaid insurance
|
3,134
|
|
2,097
|
|
|||
|
Other prepaid expenses and current assets
|
14,129
|
|
9,213
|
|
|||
|
$
|
42,554
|
|
$
|
43,879
|
|
||
Under the terms of the Company’s workers compensation policy, the Company is required to make advances to its insurance carrier pertaining to estimated claims for all open plan years.
Other prepaid expenses and current assets include deposits of
$3.1 million
at December 31, 2016, for the acquisition of
three
full service center-based care centers in 2017. There were
no
acquisition related deposits at December 31, 2015.
5. FIXED ASSETS
Fixed assets consist of the following (dollars in thousands):
|
Estimated useful lives
|
December 31,
|
||||||||
|
2016
|
2015
|
||||||||
|
(Years)
|
|||||||||
|
Buildings
|
20 – 40
|
$
|
174,168
|
|
$
|
140,177
|
|
||
|
Furniture, equipment and software
|
3 – 10
|
178,872
|
|
159,433
|
|
||||
|
Leasehold improvements
|
Shorter of the lease term
or the estimated useful life |
365,707
|
|
318,852
|
|
||||
|
Land
|
—
|
92,666
|
|
53,050
|
|
||||
|
Total fixed assets
|
811,413
|
|
671,512
|
|
|||||
|
Accumulated depreciation
|
(281,981
|
)
|
(241,776
|
)
|
|||||
|
Fixed assets, net
|
$
|
529,432
|
|
$
|
429,736
|
|
|||
Fixed assets include construction in progress of
$26.4 million
and
$17.8 million
at December 31,
2016
and
2015
, respectively, which was primarily comprised of leasehold improvements. The Company acquired a total of
$96.9 million
in fixed assets in its acquisition of Asquith in November 2016 resulting in the increase in fixed assets from the prior year. The Company recorded depreciation expense of
$55.6 million
,
$50.7 million
and
$48.4 million
for the years ended December 31,
2016
,
2015
, and
2014
, respectively.
57
6. ACCOUNTS PAYABLE AND ACCRUED EXPENSES
Accounts payable and accrued expenses consist of the following (in thousands):
|
December 31,
|
|||||||
|
2016
|
2015
|
||||||
|
Accounts payable
|
$
|
26,171
|
|
$
|
26,944
|
|
|
|
Accrued payroll and employee benefits
|
59,258
|
|
46,705
|
|
|||
|
Accrued insurance
|
5,718
|
|
6,819
|
|
|||
|
Accrued occupancy costs
|
3,102
|
|
3,541
|
|
|||
|
Accrued professional fees
|
2,376
|
|
2,575
|
|
|||
|
Accrued interest
|
2,985
|
|
869
|
|
|||
|
Other accrued expenses
|
25,790
|
|
27,323
|
|
|||
|
$
|
125,400
|
|
$
|
114,776
|
|
||
7. OTHER CURRENT LIABILITIES
Other current liabilities consist of the following (in thousands):
|
December 31,
|
|||||||
|
2016
|
2015
|
||||||
|
Customer amounts on deposit
|
$
|
14,688
|
|
$
|
12,395
|
|
|
|
Deferred rent and other occupancy costs
|
4,796
|
|
4,214
|
|
|||
|
Income taxes payable
|
3,081
|
|
1,916
|
|
|||
|
Liability for unvested restricted stock
|
4,733
|
|
—
|
|
|||
|
Other liabilities
|
1,440
|
|
1,209
|
|
|||
|
$
|
28,738
|
|
$
|
19,734
|
|
||
8. OTHER LONG-TERM LIABILITIES
Other long-term liabilities consist of the following (in thousands):
|
December 31,
|
|||||||
|
2016
|
2015
|
||||||
|
Liabilities for workers compensation claims
|
$
|
16,572
|
|
$
|
18,363
|
|
|
|
Customer amounts on deposit
|
14,353
|
|
12,071
|
|
|||
|
Liability for unvested restricted stock
|
7,546
|
|
8,573
|
|
|||
|
Deferred compensation
|
2,793
|
|
1,172
|
|
|||
|
Liability for uncertain tax positions
|
1,096
|
|
545
|
|
|||
|
Asset retirement obligations
|
3,733
|
|
2,064
|
|
|||
|
Other liabilities
|
5,955
|
|
1,394
|
|
|||
|
$
|
52,048
|
|
$
|
44,182
|
|
||
9
.
CREDIT ARRANGEMENTS AND DEBT OBLIGATIONS
On
November 7, 2016
, the Company modified its existing senior secured credit facilities by entering into an incremental and amendment and restatement agreement, which amended and restated the credit agreement and refinanced all of its outstanding term loans into a new
seven
year term loan facility. As of
December 31, 2016
, the Company's
$1.3 billion
senior secured credit facilities consisted of
$1.1 billion
in secured term loans and a
$225.0 million
revolving credit facility. The term loans mature on
November 7, 2023
and require quarterly principal payments of
$2.7 million
, with the remaining principal balance due on
November 7, 2023
. Prior to the November 2016 debt refinancing, the Company's senior secured credit facilities consisted of
$955.0 million
in secured term loans and a
$225.0 million
revolving credit facility.
58
Outstanding term loan borrowings were as follows at
December 31, 2016
and
2015
(in thousands):
|
December 31,
|
|||||||
|
2016
|
2015
|
||||||
|
Term loans
|
$
|
1,075,000
|
|
$
|
929,650
|
|
|
|
Deferred financing costs and original issue discount
|
(10,241
|
)
|
(14,439
|
)
|
|||
|
Total debt
|
1,064,759
|
|
915,211
|
|
|||
|
Less current maturities
|
10,750
|
|
9,550
|
|
|||
|
Long-term debt
|
$
|
1,054,009
|
|
$
|
905,661
|
|
|
On January 26, 2016, the Company amended its then existing credit agreement to increase the revolving credit facility from
$100.0 million
to
$225.0 million
, to extend the maturity date on the revolving credit facility (the “Revolver
”
) from
January 30, 2018
to
July 31, 2019
, and to modify the interest rate applicable to borrowings. The terms, interest rate, and availability of the Revolver were not modified in the November 2016 debt refinancing. At
December 31, 2016
, there were borrowings outstanding of
$76.0 million
, with
$149.0 million
of the Revolver available for borrowings, and at
December 31, 2015
, there were borrowings outstanding of
$24.0 million
, with
$76.0 million
of the Revolver available for borrowings.
All borrowings under the credit agreement are subject to variable interest rates. Borrowings under the term loan facility bear interest at a rate per annum ranging from
1.5%
to
1.75%
over the Base Rate or
2.5%
to
2.75%
over the Eurocurrency Rate (each as defined in the credit agreement). The Base Rate is subject to an interest rate floor of
1.75%
and the Eurocurrency Rate is subject to an interest rate floor of
0.75%
, but only with respect to the term loan facility. Prior to the November 2016 debt refinancing, borrowings under the term loan facility bore interest at a rate per annum ranging from
1.75%
to
2.5%
over the Base Rate or
2.75%
to
3.5%
over the Eurocurrency Rate (each as defined in the agreement). The Base Rate was subject to an interest rate floor of
2.0%
and the Eurocurrency Rate was subject to an interest rate floor of
1.0%
, but only with respect to the term loan facility. Borrowings under the Revolver bear interest at a rate per annum ranging from
1.25%
to
1.75%
over the Base Rate, or
2.25%
to
2.75%
over the Eurocurrency Rate. As of
December 31, 2015
, borrowings under the Revolver bore interest at a rate per annum equal to
1.75%
over the Base Rate or
2.75%
over the Eurocurrency Rate.
The effective interest rate for the term loans was
3.5%
,
4.1%
, and
3.8%
at
December 31, 2016
,
2015
, and
2014
, respectively, and the weighted average interest rate for the years ended
December 31, 2016
,
2015
, and
2014
was
3.9%
,
4.1%
, and
3.9%
, respectively. The effective interest rate for the revolving credit facility was
5.5%
,
5.25%
, and
5.0%
at
December 31, 2016
,
2015
, and
2014
, respectively, and the weighted average interest rate was
4.2%
,
3.8%
, and
5.0%
, respectively, for the years ended
December 31, 2016
and
2015
, and
2014
, respectively.
All obligations under the senior secured credit facilities are secured by substantially all the assets of the Company’s U.S.-based subsidiaries. The senior secured credit facilities contains a number of covenants that, among other things and subject to certain exceptions, may restrict the ability of Bright Horizons Family Solutions LLC, our wholly-owned subsidiary, and its restricted subsidiaries, to: incur certain liens; make investments, loans, advances and acquisitions; incur additional indebtedness or guarantees; pay dividends on capital stock or redeem, repurchase or retire capital stock or subordinated indebtedness; engage in transactions with affiliates; sell assets, including capital stock of our subsidiaries; alter the business conducted; enter into agreements restricting our subsidiaries’ ability to pay dividends; and consolidate or merge.
In addition, the credit agreement governing the senior secured credit facilities requires Bright Horizons Capital Corp., our direct subsidiary, to be a passive holding company, subject to certain exceptions. The revolving credit facility requires Bright Horizons Family Solutions LLC, the borrower, and its restricted subsidiaries to comply with a maximum senior secured first lien net leverage ratio financial maintenance covenant, to be tested only if, on the last day of each fiscal quarter, revolving loans and/or swing-line loans in excess of a specified percentage of the revolving commitments on such date are outstanding under the revolving credit facility. The breach of this covenant is subject to certain equity cure rights.
The Company incurred financing fees of
$6.7 million
and original issue discount costs of
$2.7 million
in connection with the November 2016 debt refinancing. These fees are being amortized over the terms of the related debt instruments and amortization expense is included in interest expense. A loss on the extinguishment of debt of
$11.1 million
was recorded in the year ended
December 31, 2016
, related to the write off of unamortized original issue cost and deferred financing fees in connection with the November 2016 debt refinancing. Amortization expense of deferred financing costs was
$2.2 million
,
$2.2 million
, and
$1.9 million
in the years ended
December 31, 2016
,
2015
, and
2014
, respectively. Amortization expense of original issuance discount costs was
$1.3 million
,
$1.4 million
, and
$1.1 million
in the years ended
December 31, 2016
,
2015
, and
2014
, respectively.
59
10. INCOME TAXES
Income before income taxes consists of the following (in thousands):
|
Years ended December 31,
|
|||||||||||
|
2016
|
2015
|
2014
|
|||||||||
|
United States
|
$
|
132,846
|
|
$
|
134,611
|
|
$
|
110,585
|
|
||
|
Foreign
|
10,351
|
|
5,545
|
|
1,729
|
|
|||||
|
Total
|
$
|
143,197
|
|
$
|
140,156
|
|
$
|
112,314
|
|
||
Income tax expense consists of the following (in thousands):
|
Years ended December 31,
|
|||||||||||
|
2016
|
2015
|
2014
|
|||||||||
|
Current tax expense (benefit)
|
|||||||||||
|
Federal
|
$
|
42,691
|
|
$
|
29,236
|
|
$
|
45,628
|
|
||
|
State
|
10,752
|
|
8,723
|
|
8,753
|
|
|||||
|
Foreign
|
7,115
|
|
9,028
|
|
(726
|
)
|
|||||
|
60,558
|
|
46,987
|
|
53,655
|
|
||||||
|
Deferred tax (benefit) expense
|
|||||||||||
|
Federal
|
(6,463
|
)
|
(11,014
|
)
|
(10,497
|
)
|
|||||
|
State
|
(2,069
|
)
|
6,776
|
|
(948
|
)
|
|||||
|
Foreign
|
(3,589
|
)
|
3,480
|
|
(1,931
|
)
|
|||||
|
(12,121
|
)
|
(758
|
)
|
(13,376
|
)
|
||||||
|
Income tax expense
|
$
|
48,437
|
|
$
|
46,229
|
|
$
|
40,279
|
|
||
The following is a reconciliation of the U.S. Federal statutory rate to the effective rate on pretax income (in thousands):
|
Years ended December 31,
|
|||||||||||
|
2016
|
2015
|
2014
|
|||||||||
|
Federal tax expense computed at statutory rate
|
$
|
50,119
|
|
$
|
49,055
|
|
$
|
39,310
|
|
||
|
State tax expense, net of federal tax
|
6,374
|
|
5,849
|
|
5,121
|
|
|||||
|
Valuation allowance, net
|
(107
|
)
|
(185
|
)
|
245
|
|
|||||
|
Intercompany interest
|
(6,953
|
)
|
(6,919
|
)
|
—
|
|
|||||
|
Permanent differences and other, net
|
(389
|
)
|
(901
|
)
|
277
|
|
|||||
|
Change in tax rate
|
(96
|
)
|
319
|
|
(134
|
)
|
|||||
|
Change to uncertain tax positions, net
|
432
|
|
(333
|
)
|
(1,523
|
)
|
|||||
|
Foreign rate differential
|
(943
|
)
|
(656
|
)
|
(3,017
|
)
|
|||||
|
Income tax expense
|
$
|
48,437
|
|
$
|
46,229
|
|
$
|
40,279
|
|
||
60
Significant components of the Company’s net deferred tax liability are as follows (in thousands):
|
December 31,
|
|||||||
|
2016
|
2015
|
||||||
|
Deferred tax assets:
|
|||||||
|
Reserve on assets
|
$
|
342
|
|
$
|
566
|
|
|
|
Net operating loss and credit carryforwards
|
1,347
|
|
1,281
|
|
|||
|
Liabilities not yet deductible
|
39,401
|
|
33,438
|
|
|||
|
Deferred revenue
|
3,370
|
|
2,418
|
|
|||
|
Stock-based compensation
|
13,855
|
|
12,277
|
|
|||
|
Depreciation
|
118
|
|
53
|
|
|||
|
Other
|
1,620
|
|
934
|
|
|||
|
60,053
|
|
50,967
|
|
||||
|
Valuation allowance
|
(1,028
|
)
|
(1,111
|
)
|
|||
|
Total deferred tax assets
|
59,025
|
|
49,856
|
|
|||
|
Deferred tax liabilities:
|
|||||||
|
Intangible assets
|
(143,806
|
)
|
(144,402
|
)
|
|||
|
Depreciation
|
(26,930
|
)
|
(18,554
|
)
|
|||
|
Total deferred tax liabilities
|
(170,736
|
)
|
(162,956
|
)
|
|||
|
Net deferred tax liability
|
$
|
(111,711
|
)
|
$
|
(113,100
|
)
|
|
During
2016
, the overall deferred tax liability
decreased
slightly, primarily due to the book to tax difference in the treatment of amortization of intangible assets, depreciation and stock-based compensation.
The Company has foreign net operating losses of
$8.2 million
and has recorded an associated deferred tax asset totaling
$1.3 million
. Deferred tax assets associated with federal and state net operating losses total
$0.1 million
. The net operating losses in certain foreign jurisdictions will begin to expire in
2024
, while others can be carried forward indefinitely. The net operating losses in the United States have expiration dates through
2028
. In jurisdictions in which the Company has not had a history of profitability, the Company has recorded a valuation allowance of
$1.0 million
associated with foreign net deferred tax assets. During 2016, the valuation allowance decreased
$0.1 million
.
The Company considers the earnings of certain non-U.S. subsidiaries to be indefinitely invested outside the United States on the basis of estimates that future domestic cash generation will be sufficient to meet future domestic cash needs and our specific plans for reinvestment of those subsidiary earnings. The Company has not recorded a deferred tax liability of approximately
$3.9 million
related to the U.S. federal and state income taxes and foreign withholding taxes on approximately
$31.2 million
of cumulative undistributed earnings of foreign subsidiaries indefinitely invested outside the United States. Should the Company decide to repatriate the foreign earnings, the income tax provision would need to be adjusted in the period it is determined that the earnings will no longer be indefinitely invested outside the United States.
Uncertain Tax Positions
The Company follows the authoritative guidance relating to the accounting for uncertainty in income taxes. The Company may recognize the tax benefit from an uncertain tax position only if it is more likely than not that the tax position will be sustained on examination by the taxing authorities, based on the technical merits of the position. The tax benefits recognized in the consolidated financial statements from such a position should be measured based on the largest benefit that has a greater than
fifty
percent likelihood of being realized upon ultimate settlement.
61
A reconciliation of the beginning and ending amounts of unrecognized tax benefits is as follows (in thousands):
|
Years ended December 31,
|
|||||||||||
|
2016
|
2015
|
2014
|
|||||||||
|
Beginning balance
|
$
|
706
|
|
$
|
713
|
|
$
|
2,034
|
|
||
|
Additions for tax positions of prior years
|
—
|
|
353
|
|
—
|
|
|||||
|
Additions for tax positions of current year
|
443
|
|
353
|
|
—
|
|
|||||
|
Settlements
|
—
|
|
(50
|
)
|
—
|
|
|||||
|
Reductions for tax positions of prior years
|
(27
|
)
|
—
|
|
(490
|
)
|
|||||
|
Lapses of statutes of limitations
|
—
|
|
(663
|
)
|
(831
|
)
|
|||||
|
Effect of foreign currency adjustments
|
(26
|
)
|
—
|
|
—
|
|
|||||
|
Ending balance
|
$
|
1,096
|
|
$
|
706
|
|
$
|
713
|
|
||
The Company recognizes accrued interest and penalties related to unrecognized tax benefits in income tax expense. The Company’s current provision for income tax expense for the years ended December 31,
2016
and
2015
included
no
interest and penalties. There was
no
liability for total interest and penalties at
December 31, 2016
and
2015
. During
2016
, the Company recorded an unrecognized tax benefit for a foreign subsidiary's tax position. Reductions also were recorded due to the reduction for tax positions of prior years.
The total amount of unrecognized tax benefits that if recognized would affect the Company’s effective tax rate is
$1.1 million
. The Company expects the unrecognized tax benefits to change over the next 12 months if certain tax matters ultimately settle with the applicable taxing jurisdiction during this time frame, or if applicable statutes of limitations lapse. The impact of the amount of such changes to previously recorded uncertain tax positions could range from
zero
to
$1.1 million
.
The Company and its domestic subsidiaries are subject to U.S. federal income tax as well as multiple state jurisdictions. U.S. federal income tax returns are typically subject to examination by the Internal Revenue Service (IRS) and the statute of limitations for Federal income tax returns is
three
years. The Company’s filings for
2013
through
2015
are subject to audit based upon the Federal statute of limitations.
State income tax returns are generally subject to examination for a period of
three
to
five
years after filing of the respective return. The state impact of any federal changes remains subject to examination by various states for a period of up to
one
year after formal notification to the states. There were
no
significant settlements of state audits during the
year
. As of
December 31, 2016
, there were
no
income tax audits in process and the tax years from
2011
to
2015
are subject to audit.
The Company is also subject to corporate income tax at its subsidiaries located in the United Kingdom, the Netherlands, India, Canada, Ireland, and Puerto Rico. The tax returns for the Company’s subsidiaries located in foreign jurisdictions are subject to examination for periods ranging from
one
to
seven
years.
11. STOCKHOLDERS’ EQUITY AND STOCK-BASED COMPENSATION
Preferred Stock
The Company authorized
25 million
shares of undesignated preferred stock in 2013 for issuance, of which
none
have been issued. The Company’s board of directors has the authority, without further action by stockholders, to issue up to
25 million
shares of preferred stock in one or more series. The Company’s board of directors may designate the rights, preferences, privileges, and restrictions of the preferred stock, including dividend rights, conversion rights, voting rights, terms of redemption, liquidation preference, and number of shares constituting any series or the designation of any series. The issuance of preferred stock could have the effect of restricting dividends on the Company’s common stock, diluting the voting power of its common stock, impairing the liquidation rights of its common stock, or delaying or preventing a change in control. The ability to issue preferred stock could delay or impede a change in control. As of
December 31,
2016
and
2015
,
no
shares of preferred stock were outstanding.
Treasury Stock
On August 2, 2016, the board of directors of the Company authorized a share repurchase program of up to
$300.0 million
of the Company’s outstanding common stock, effective
August 5, 2016
. The share repurchase program, which has no expiration date, replaces the prior 2015 authorization, of which
$26.3 million
remained available at the date the program was replaced. The shares may be repurchased from time to time in open market transactions at prevailing market prices, in privately negotiated transactions, under Rule 10b5-1 plans, or by other means in accordance with federal securities laws. During the year ended
December 31,
2016
, the Company repurchased
1.7 million
shares for
$112.8 million
, including a total of
1.0 million
shares that were purchased from investment funds affiliated with the Sponsor in secondary offerings. At
December 31,
2016
,
$282.8 million
remained outstanding under the repurchase program.
62
On
February 4, 2015
, the board of directors of the Company authorized a share repurchase program of up to
$250.0 million
of its common stock. During the year ended
December 31,
2015, the Company repurchased
2.2 million
shares for
$128.1 million
, including a total of
2.1 million
shares that were purchased from investment funds affiliated with the Sponsor in secondary offerings.
On
March 28, 2014
, the board of directors of the Company authorized the repurchase of up to
$225.0 million
of its common stock. Under this authorization, the Company repurchased a total of
5.0 million
shares for
$221.6 million
in the year ended
December 31, 2014
, including
4.5 million
shares that were purchased from investment funds affiliated with the Sponsor in secondary offerings.
Equity Incentive Plan
The Company has the 2012 Omnibus Long-Term Incentive Plan (the “Plan”), which became effective on
January 24, 2013
, and allows for the issuance of equity awards of up to
5 million
shares of common stock. As of
December 31,
2016
, there were approximately
2.3 million
shares of common stock available for grant. Stock options granted under the Plan are subject to a service condition and expire in
seven
years from date of grant or termination of the holder’s employment with the Company, unless such termination was due to death, disability or retirement, unless otherwise determined by the administrator of the Plan. The majority of the options have a requisite service period of
five
years, with
60%
of the options vesting on the third anniversary of the date of grant and
20%
vesting on each of the fourth and fifth anniversaries.
The Company also had an incentive compensation plan (the “2008 Equity Incentive Plan”) which, as amended in March 2012, was authorized to issue
150,000
shares of Class L common stock and
1.5 million
shares of Class A common stock. No additional options will be granted under the 2008 Equity Incentive Plan. However, all outstanding options continue to be governed by their existing terms.
Stock-Based Compensation
The Company recognized the impact of stock-based compensation in its consolidated statements of income for the years ended
December 31, 2016
,
2015
, and
2014
and did not capitalize any amounts on the consolidated balance sheets. In the years ended
December 31, 2016
,
2015
, and
2014
the Company recorded stock-based compensation expense of
$11.6 million
,
$9.2 million
, and
$7.9 million
, respectively, of which
$11.0 million
,
$8.7 million
, and
$7.3 million
were recorded in selling, general and administrative expenses, respectively, and
$0.6 million
,
$0.5 million
, and
$0.6 million
in cost of services, respectively, in the consolidated statements of income in relation to all awards granted under the equity incentive plans. Stock-based compensation expense generated an income tax benefit of
$4.6 million
,
$3.7 million
, and
$3.2 million
in the years ended
December 31, 2016
,
2015
, and
2014
, respectively.
There were
no
share-based liabilities paid during the period. As of
December 31, 2016
, there was
$14.7 million
of total unrecognized compensation expense related to unvested share-based compensation arrangements granted under the Plan. That expense is expected to be recognized over the remaining requisite service period. The weighted average remaining requisite service period was approximately
two
years at
December 31, 2016
.
Stock Options
The fair value of each stock option of common stock granted was estimated on the date of grant using the Black-Scholes option pricing model using the following weighted average assumptions:
|
Years ended December 31,
|
|||||
|
2016
|
2015
|
2014
|
|||
|
Expected dividend yield
|
0.0%
|
0.0%
|
0.0%
|
||
|
Expected stock price volatility
|
30.0%
|
30.0%
|
30.0%
|
||
|
Risk free interest rate
|
1.4%
|
1.5%
|
1.8%
|
||
|
Expected life of options (years)
|
5.3
|
5.3
|
5.3
|
||
|
Weighted average fair value per share of options granted during the period
|
$19.35
|
$15.37
|
$11.36
|
||
The expected dividend yield was based on the Company’s expectation of not paying dividends in the foreseeable future. Since the Company completed its initial public offering in January 2013, it does not have sufficient history as a publicly traded company to evaluate its volatility factor. As such, the expected stock price volatility is based upon the historical volatility of the stock price over the expected life of the options of the Company and that of peer companies that are publicly traded. The risk free interest rate was based on the U.S. Treasury rates for U.S. Treasury zero-coupon bonds with maturities similar to those of the expected term of the awards being valued. For grants issued during the years ended
December 31, 2016
,
2015
, and
2014
, the expected life of the options was calculated using the simplified method. The simplified method defines the life as the
63
average of the contractual term of the options and the weighted average vesting period for all option tranches. This methodology was utilized due to the short length of time our common stock has been publicly traded.
The table below reflects stock option activity under the Company’s equity plan for the year ended
December 31, 2016
.
|
Weighted
Average
Remaining
Contractual
Life in
Years
|
||||||||||||
|
Number
of
Options
|
Weighted
Average
Exercise
Price
|
Aggregate
Intrinsic
Value
(In millions)
|
||||||||||
|
Outstanding at January 1, 2016
|
4.9
|
3,818,578
|
|
$
|
24.68
|
|
||||||
|
Granted
|
559,025
|
|
65.05
|
|
||||||||
|
Exercised
|
(761,452
|
)
|
15.34
|
|
||||||||
|
Forfeited
|
(132,274
|
)
|
47.12
|
|
||||||||
|
Outstanding at December 31, 2016
|
4.5
|
3,483,877
|
|
$
|
32.34
|
|
$
|
131.3
|
|
|||
|
Exercisable at December 31, 2016
|
3.8
|
1,582,711
|
|
$
|
16.12
|
|
$
|
85.3
|
|
|||
|
Vested and expected to vest at December 31, 2016
|
4.4
|
3,348,894
|
|
$
|
31.43
|
|
$
|
129.2
|
|
|||
The fair value (pre-tax) of options that vested during the years ended
December 31, 2016
,
2015
, and
2014
were
$5.1 million
,
$2.3 million
, and
$3.9 million
, respectively. The intrinsic value of options exercised during the years ended
December 31, 2016
,
2015
, and
2014
were
$39.4 million
,
$28.9 million
, and
$32.3 million
, respectively.
Cash received by the Company from the exercise of stock options for the years ended
December 31, 2016
,
2015
, and
2014
was
$11.7 million
,
$9.8 million
, and
$17.4 million
, respectively. Income tax benefits realized from the exercise of stock options in the years ended
December 31, 2016
,
2015
, and
2014
were
$15.8 million
,
$11.6 million
, and
$12.9 million
, respectively, inclusive of the excess tax benefits realized of
$12.9 million
,
$9.4 million
, and
$9.1 million
in the years ended
December 31, 2016
,
2015
, and
2014
, respectively.
Restricted Stock and Restricted Stock Units
Restricted stock awards are granted to certain senior managers at the discretion of the board of directors as allowed under the Plan. Restricted stock awards typically vest on the earliest of the third anniversary of the grant date, a change of control of the Company, or the termination of employment by reason of death or disability, and are accounted for as nonvested stock. Restricted stock is sold for a price equal to
50%
of the fair value of the stock at the date of grant. Proceeds from the issuance of restricted stock are recorded as other liabilities in the consolidated balance sheet until the earlier of vesting or forfeiture of the awards. The unvested shares of restricted stock participate equally in dividends with common stock. Restricted stock is considered legally issued at the date of grant but is not considered common stock issued and outstanding in accordance with accounting guidance until the requisite service period is fulfilled. All outstanding shares of restricted stock are expected to vest. Cash proceeds from the issuance of restricted stock for the years ended
December 31, 2016
,
2015
, and
2014
were
$3.7 million
,
$3.9 million
, and
$4.7 million
, respectively.
Stock-based compensation expense for restricted stock awards is calculated based on the fair value of the award on the date of grant, which is recognized on a straight line basis over the requisite service period. The Company's stock-based compensation expense recorded in selling, general and administrative expenses in the consolidated statements of income for the years ended
December 31, 2016
,
2015
, and
2014
included
$4.1 million
,
$2.9 million
, and
$1.6 million
, respectively, for restricted stock awards. As of
December 31, 2016
, total unrecognized compensation expense included
$3.6 million
related to unvested restricted stock, which is expected to be recognized over the weighted average remaining requisite service period of approximately
two
years.
The table below reflects restricted stock activity under the Company’s equity plan for the year ended
December 31, 2016
.
|
Number of Shares
|
Weighted Average Grant Date Fair Value
|
Aggregate Intrinsic Value (In millions)
|
|||||||||
|
Nonvested restricted stock shares at January 1, 2016
|
422,725
|
|
$
|
20.28
|
|
$
|
19.7
|
|
|||
|
Granted
|
116,070
|
|
31.72
|
|
|
||||||
|
Vested
|
—
|
|
—
|
|
|
||||||
|
Forfeited
|
—
|
|
—
|
|
|
||||||
|
Nonvested restricted stock shares at December 31, 2016
|
538,795
|
|
$
|
22.75
|
|
$
|
25.5
|
|
|||
Restricted stock units are awarded to members of the board of directors as allowed under the Plan. The awards allow for the issuance of a share of the Company's common stock for each vested unit upon the earliest of termination of service as a
64
member of the board of directors or
five
years after the date of the award. During the year ended
December 31, 2016
,
11,000
restricted stock units were awarded at a weighted average fair value of
$65.75
. At
December 31, 2016
, there were
26,066
restricted stock units outstanding, with an intrinsic value of
$1.8 million
, which vested upon award.
12. EARNINGS PER SHARE
Basic earnings per share is calculated by dividing net income by the weighted-average common shares outstanding. Diluted earnings per share is calculated by dividing net income by the weighted-average common shares and potentially dilutive securities outstanding during the period.
Earnings per share is calculated using the two-class method, which requires the allocation of earnings to each class of common stock outstanding and to unvested share-based payment awards that participate in dividends with common stock, also referred to herein as unvested participating shares.
The Company's unvested stock-based payment awards include unvested shares awarded as restricted stock awards at the discretion of the Company’s board of directors. The restricted stock awards generally vest at the end of
three years
. The unvested shares participate equally in dividends. See Note 11 for a discussion of the current year unvested stock awards and issuances.
Earnings per Share - Basic
The following table sets forth the computation of earnings per share using the two-class method (in thousands, except share and per share amounts):
|
Years ended December 31,
|
|||||||||||
|
2016
|
2015
|
2014
|
|||||||||
|
Basic earnings per share:
|
|||||||||||
|
Net income
|
$
|
94,760
|
|
$
|
93,927
|
|
$
|
72,035
|
|
||
|
Allocation of net income to common stockholders:
|
|||||||||||
|
Common stock
|
$
|
93,919
|
|
$
|
93,287
|
|
$
|
71,755
|
|
||
|
Unvested participating shares
|
841
|
|
640
|
|
280
|
|
|||||
|
$
|
94,760
|
|
$
|
93,927
|
|
$
|
72,035
|
|
|||
|
Weighted average number of common shares:
|
|||||||||||
|
Common stock
|
59,229,069
|
|
60,835,574
|
|
65,612,572
|
|
|||||
|
Unvested participating shares
|
531,364
|
|
417,285
|
|
255,920
|
|
|||||
|
Earnings per common share:
|
|||||||||||
|
Common stock
|
$
|
1.59
|
|
$
|
1.53
|
|
|
$
|
1.09
|
|
|
Earnings per Share - Diluted
The Company calculates diluted earnings per share for common stock using the more dilutive of (1) the treasury stock method, or (2) the two-class method. The following table sets forth the computation of diluted earnings per share using the two-class method (in thousands, except share and per share amounts):
|
Years ended December 31,
|
|||||||||||
|
2016
|
2015
|
2014
|
|||||||||
|
Diluted earnings per share:
|
|||||||||||
|
Earnings allocated to common stock
|
$
|
93,919
|
|
$
|
93,287
|
|
$
|
71,755
|
|
||
|
Plus earnings allocated to unvested participating shares
|
841
|
|
640
|
|
280
|
|
|||||
|
Less adjusted earnings allocated to unvested participating shares
|
(822
|
)
|
(624
|
)
|
(274
|
)
|
|||||
|
Earnings allocated to common stock
|
$
|
93,938
|
|
$
|
93,303
|
|
$
|
71,761
|
|
||
|
Weighted average number of common shares:
|
|||||||||||
|
Common stock
|
59,229,069
|
|
60,835,574
|
|
65,612,572
|
|
|||||
|
Effect of dilutive securities
|
1,365,826
|
|
1,525,204
|
|
1,631,600
|
|
|||||
|
60,594,895
|
|
62,360,778
|
|
67,244,172
|
|
||||||
|
Earnings per common share:
|
|||||||||||
|
Common stock
|
$
|
1.55
|
|
$
|
1.50
|
|
$
|
1.07
|
|
||
65
Options outstanding to purchase
0.5 million
,
0.2 million
and
0.7 million
shares of common stock were excluded from diluted earnings per share for the years ended
December 31,
2016
,
2015
, and
2014
, respectively, since their effect was anti-dilutive, which may be dilutive in the future.
13. COMMITMENTS AND CONTINGENCIES
Leases
The Company leases various office equipment, child care and early education center facilities and office space under non-cancelable operating leases. Most of the leases expire within
10
and
15
years and many contain renewal options for various periods. Rent expense for the years ended December 31,
2016
,
2015
, and
2014
totaled
$103.1 million
,
$97.3 million
and
$88.7 million
, respectively.
Future minimum payments under non-cancelable operating leases as of
December 31, 2016
are as follows for the years ending December 31 (in thousands):
|
2017
|
$
|
98,982
|
|
|
2018
|
95,258
|
|
|
|
2019
|
89,422
|
|
|
|
2020
|
82,048
|
|
|
|
2021
|
71,017
|
|
|
|
Thereafter
|
462,565
|
|
|
|
Total future minimum lease payments
|
$
|
899,292
|
|
Long-Term Debt
Future minimum payments of long-term debt are as follows for the years ending December 31 (in thousands):
|
2017
|
$
|
10,750
|
|
|
2018
|
10,750
|
|
|
|
2019
|
10,750
|
|
|
|
2020
|
10,750
|
|
|
|
2021
|
10,750
|
|
|
|
Thereafter
|
1,021,250
|
|
|
|
Total future principal payments
|
$
|
1,075,000
|
|
Overdraft Facilities
The Company’s subsidiaries in the United Kingdom maintain an overdraft facility with a U.K. bank to support local short-term working capital requirements. The overdraft facility is repayable upon demand from the U.K. bank. The facility provides maximum borrowings of
£0.3 million
(approximately
$0.4 million
at
December 31, 2016
) and is secured by a cross guarantee by and among the Company’s subsidiaries in the United Kingdom and a right of offset against all accounts maintained by the subsidiaries at the lending bank. The overdraft facility bears interest at the U.K. bank’s base rate plus
2.15%
. At
December 31, 2016
and
2015
, there were no amounts outstanding under the overdraft facility.
Letters of Credit
The Company has
25
letters of credit outstanding used to guarantee certain rent payments for up to
$1.0 million
. These letters of credit are guaranteed by cash deposits. No amounts have been drawn against these letters of credit.
Litigation
The Company is a defendant in certain legal matters in the ordinary course of business. Management believes the resolution of such pending legal matters will not have a material effect on the Company’s financial condition, results of operations or cash flows, although we cannot predict the ultimate outcome of any such actions.
Insurance and Regulatory
The Company self-insures a portion of its medical insurance plans and has a high deductible workers’ compensation plan. Management believes that the amounts accrued for these obligations are sufficient and that ultimate settlement of such claims or costs associated with claims made under these plans will not have a material adverse effect on the Company’s financial position, results of operations or cash flows.
66
The Company’s child care and early education centers are subject to numerous federal, state and local regulations and licensing requirements. Failure of a center to comply with applicable regulations can subject it to governmental sanctions, which could require expenditures by the Company to bring its child care and early education centers into compliance.
14. EMPLOYEE BENEFIT PLANS
The Company maintains a 401(k) Retirement Savings Plan (the “401(k) Plan”) for all eligible employees. To be eligible for the 401(k) Plan, an employee must be at least
20.5
years of age and have completed their eligibility period of
60
days and
160
hours of service from date of hire. If they do not meet the
160
hours of service requirement, they may be eligible at
12 months
provided they have reached 1,000 hours of service from date of hire. The 401(k) Plan is funded by elective employee contributions of up to
50%
of their compensation, subject to certain limitations. Under the 401(k) Plan, the Company matches
25%
of employee contributions for each participant up to
8%
of the employee’s compensation after one year of service. Expense under the plan, consisting of Company contributions and plan administrative expenses paid by the Company, totaled approximately
$2.7 million
,
$2.5 million
and
$2.3 million
for the years ended December 31,
2016
,
2015
and
2014
, respectively.
The Company maintains a Nonqualified Deferred Compensation Plan (the “NQDC Plan”) for all eligible employees. Eligible employees are employees who have capped contribution levels in our existing 401(k) Plan due to the thresholds dictated by the IRS definition of “highly compensated” employees, as well as other employees at the discretion of the Bright Horizons Family Solutions Nonqualified Deferred Compensation Plan Committee. The NQDC Plan is funded by elective employee contributions of up to
50%
of their compensation. Under the NQDC Plan, the Company matches
25%
of employee contributions for each participant up to
$2,500
. The Company records an asset and a corresponding liability on the consolidated balance sheet for the deferred compensation plan that were
$2.7 million
and
$2.8 million
at December 31,
2016
, respectively. The deferred compensation plan asset and liability were
$1.1 million
and
$1.2 million
at December 31,
2015
, respectively.
15. SEGMENT AND GEOGRAPHIC INFORMATION
Bright Horizons work/life services are comprised of full service center-based child care, back-up dependent care, and other educational advisory services. Full service center-based care includes the traditional center-based child care, preschool, and elementary education, which have similar operating characteristics and meet the criteria for aggregation. Full service center-based care derives its revenues primarily from contractual arrangements with corporate clients and from tuition. The Company’s back-up dependent care services consist of center-based back-up child care, in-home care, mildly ill care, and adult/elder care. The Company’s other educational advisory services consist of college preparation and admissions counseling, tuition reimbursement program management, and related consulting services, which have similar operating characteristics and meet the criteria for aggregation. The Company and its chief operating decision makers evaluate performance based on revenues and income from operations.
The assets and liabilities of the Company are managed centrally and are reported internally in the same manner as the consolidated financial statements; therefore, no additional information is produced or included herein.
|
Full service
center-based care
|
Back-up
dependent care
|
Other educational
advisory services
|
Total
|
||||||||||||
|
(In thousands)
|
|||||||||||||||
|
Year ended December 31, 2016
|
|||||||||||||||
|
Revenue
|
$
|
1,321,699
|
|
$
|
200,106
|
|
$
|
48,036
|
|
$
|
1,569,841
|
|
|||
|
Amortization of intangible assets
|
27,862
|
|
1,204
|
|
576
|
|
29,642
|
|
|||||||
|
Income from operations (1)
|
129,693
|
|
57,620
|
|
9,925
|
|
197,238
|
|
|||||||
|
Year ended December 31, 2015
|
|||||||||||||||
|
Revenue
|
$
|
1,236,762
|
|
$
|
181,574
|
|
$
|
40,109
|
|
$
|
1,458,445
|
|
|||
|
Amortization of intangible assets
|
26,690
|
|
725
|
|
574
|
|
27,989
|
|
|||||||
|
Income from operations (2)
|
115,149
|
|
56,891
|
|
9,562
|
|
181,602
|
|
|||||||
|
Year ended December 31, 2014
|
|||||||||||||||
|
Revenue
|
$
|
1,156,661
|
|
$
|
162,886
|
|
$
|
33,452
|
|
$
|
1,352,999
|
|
|||
|
Amortization of intangible assets
|
27,696
|
|
725
|
|
578
|
|
28,999
|
|
|||||||
|
Income from operations (3)
|
92,229
|
|
49,317
|
|
5,374
|
|
146,920
|
|
|||||||
|
(1)
|
For the year ended
December 31, 2016
, income from operations includes of
$2.5 million
of costs associated with secondary offerings of common shares, completed acquisitions, and the amendments to the credit agreement completed in January and November 2016, all of which are allocated to full service center-based care.
|
67
|
(2)
|
For the year ended
December 31, 2015
, income from operations includes
$0.9 million
of costs associated with secondary offerings of common shares and completed acquisitions, all of which are allocated to full service center-based care.
|
|
(3)
|
For the year ended
December 31, 2014
, income from operations includes
$2.7 million
of costs associated with secondary offerings of common shares and the amendment to the credit agreement completed in November 2014 (
$2.4 million
to full service center-based care and
$0.3 million
to back-up dependent care).
|
Revenue and long-lived assets by geographic region are as follows (in thousands):
|
Years ended December 31,
|
|||||||||||
|
Revenue
|
2016
|
2015
|
2014
|
||||||||
|
North America
|
$
|
1,277,165
|
|
$
|
1,182,629
|
|
$
|
1,074,951
|
|
||
|
Europe and other
|
292,676
|
|
275,816
|
|
278,048
|
|
|||||
|
Total revenue
|
$
|
1,569,841
|
|
$
|
1,458,445
|
|
$
|
1,352,999
|
|
||
|
December 31,
|
|||||||||||
|
Long-lived assets
|
2016
|
2015
|
2014
|
||||||||
|
North America
|
$
|
322,267
|
|
$
|
308,469
|
|
$
|
277,971
|
|
||
|
Europe and other
|
207,165
|
|
121,267
|
|
120,976
|
|
|||||
|
Total long-lived assets
|
$
|
529,432
|
|
$
|
429,736
|
|
$
|
398,947
|
|
||
The classification “North America” is comprised of the Company’s United States, Canada and Puerto Rico operations and the classification “Europe and other” includes the Company’s United Kingdom, Netherlands, Ireland, and India operations. Revenues in the United States were
$1.3 billion
in
2016
,
$1.2 billion
in
2015
, and
$1.1 billion
in
2014
. Revenues in the United Kingdom were
$248.2 million
in
2016
,
$238.5 million
in
2015
, and
$239.6 million
in
2014
. Long-lived assets were
$320.5 million
,
$306.6 million
, and
$275.7 million
at December 31,
2016
,
2015
, and
2014
respectively, in the United States, and
$193.9 million
,
$107.8 million
, and
$104.0 million
at December 31,
2016
,
2015
, and
2014
respectively, in the United Kingdom. Revenue and long-lived assets associated with other countries were not material.
16. TRANSACTIONS WITH RELATED PARTIES
Certain of the Company's stockholders affiliated with the Sponsor sold shares of the Company’s common stock in secondary offerings totaling
4.1 million
,
9.7 million
, and
15.9 million
shares in the years ended
December 31, 2016
,
2015
, and
2014
, respectively.
The Company purchased
1.0 million
,
2.1 million
, and
4.5 million
of the shares sold in the secondary offerings in
2016
,
2015
, and
2014
, respectively, from investment funds affiliated with the Sponsor at the same price per share paid by the underwriter to the selling stockholders.
As of
December 31, 2016
, investment funds affiliated with the Sponsor hold approximately
21.0%
of the Company’s common stock.
Three
members of the Company's board of directors are affiliated with the Sponsor.
17. QUARTERLY RESULTS (UNAUDITED)
In the opinion of the Company’s management, the accompanying unaudited interim consolidated financial statements contain all adjustments which are necessary for a fair presentation of the quarters presented. The operating results for any quarter are not necessarily indicative of the results of any future quarter.
68
Selected quarterly financial information follows for the years ended December 31,
2016
and
2015
(in thousands, except share and per share amounts):
|
March 31, 2016
|
June 30, 2016
|
September 30, 2016
|
December 31, 2016
|
||||||||||||
|
Revenue
|
$
|
385,322
|
|
$
|
402,053
|
|
$
|
383,929
|
|
$
|
398,537
|
|
|||
|
Gross profit
|
95,776
|
|
104,383
|
|
91,472
|
|
99,216
|
|
|||||||
|
Income from operations
|
48,597
|
|
56,578
|
|
44,715
|
|
47,348
|
|
|||||||
|
Net income
|
24,727
|
|
30,403
|
|
22,510
|
|
17,120
|
|
|||||||
|
Allocation of net income to common stockholders:
|
|||||||||||||||
|
Common stock—basic
|
24,517
|
|
30,131
|
|
22,306
|
|
16,965
|
|
|||||||
|
Common stock—diluted
|
24,522
|
|
30,137
|
|
22,311
|
|
16,968
|
|
|||||||
|
Earnings per share:
|
|||||||||||||||
|
Common stock—basic
|
$
|
0.41
|
|
$
|
0.51
|
|
$
|
0.38
|
|
$
|
0.29
|
|
|||
|
Common stock—diluted
|
$
|
0.40
|
|
$
|
0.50
|
|
$
|
0.37
|
|
$
|
0.28
|
|
|||
|
March 31, 2015
|
June 30, 2015
|
September 30, 2015
|
December 31, 2015
|
||||||||||||
|
Revenue
|
$
|
350,440
|
|
$
|
370,465
|
|
$
|
365,944
|
|
$
|
371,596
|
|
|||
|
Gross profit
|
86,608
|
|
95,860
|
|
85,384
|
|
89,903
|
|
|||||||
|
Income from operations
|
42,841
|
|
52,138
|
|
41,741
|
|
44,882
|
|
|||||||
|
Net income
|
22,532
|
|
26,919
|
|
20,558
|
|
23,918
|
|
|||||||
|
Allocation of net income to common stockholders:
|
|||||||||||||||
|
Common stock—basic
|
22,386
|
|
26,735
|
|
20,415
|
|
23,751
|
|
|||||||
|
Common stock—diluted
|
22,390
|
|
26,739
|
|
20,419
|
|
23,755
|
|
|||||||
|
Earnings per common share:
|
|||||||||||||||
|
Common stock—basic
|
$
|
0.36
|
|
$
|
0.44
|
|
$
|
0.34
|
|
$
|
0.40
|
|
|||
|
Common stock—diluted
|
$
|
0.35
|
|
$
|
0.43
|
|
$
|
0.33
|
|
$
|
0.39
|
|
|||
69
None.
Disclosure Controls and Procedures
We maintain disclosure controls and procedures as defined in Rule 13a-15(e) under the Exchange Act that are intended to ensure that information that would be required to be disclosed in Exchange Act reports is recorded, processed, summarized and reported within the time periods specified in the SEC’s rules and forms, and that such information is accumulated and communicated to our management, including the Chief Executive Officer and the Chief Financial Officer, as appropriate, to allow timely decisions regarding required disclosure.
We carried out an evaluation, under the supervision, and with the participation of our management, including our Chief Executive Officer and Chief Financial Officer, of the effectiveness of the design and operation of our disclosure controls and procedures as of
December 31, 2016
. Based on this evaluation, our Chief Executive Officer and Chief Financial Officer concluded that, as of
December 31, 2016
, such disclosure controls and procedures were effective.
Management’s Report on Internal Control Over Financial Reporting
Management of the Company is responsible for establishing and maintaining adequate internal control over financial reporting. Internal control over financial reporting is defined in Rule 13a-15(f) promulgated under the Exchange Act as a process, designed by, or under the supervision of the Company’s principal executive and principal financial officers and effected by the Company’s board of directors, management and other personnel, to provide reasonable assurance regarding the reliability of financial reporting and the preparation of financial statements for external purposes in accordance with accounting principles generally accepted in the United States of America. Internal control over financial reporting includes maintaining records that in reasonable detail accurately and fairly reflect our transactions and disposition of assets; providing reasonable assurance that transactions are recorded as necessary for preparation of our financial statements; providing reasonable assurance that receipts and expenditures are made only in accordance with management and board authorizations; and providing reasonable assurance regarding prevention or timely detection of unauthorized acquisition, use or disposition of our assets that could have a material effect on our financial statements.
Because of its inherent limitations, internal control over financial reporting is not intended to provide absolute assurance that a misstatement of our financial statements would be prevented or detected. Also, projections of any evaluation of effectiveness to future periods are subject to the risk that controls may become inadequate because of changes in conditions or that the degree of compliance with policies or procedures may deteriorate.
Management, with the participation of the Company’s principal executive and principal financial officers, conducted an evaluation of the effectiveness of our internal control over financial reporting as of
December 31, 2016
based on the framework and criteria established in
Internal Control - Integrated Framework (2013)
issued by the Committee of Sponsoring Organizations of the Treadway Commission. This evaluation included review of the documentation of controls, evaluation of the design effectiveness of controls, testing of the operating effectiveness of controls and a conclusion on this evaluation. Consistent with published SEC guidance, management excluded from its assessment of internal control over financial reporting Conchord Limited, which was acquired on November 10, 2016, whose assets and revenue constituted 10.2% and 0.7%, respectively, of the consolidated financial statements as of and for the year ended
December 31, 2016
.
Based on the foregoing, management concluded that the Company’s internal control over financial reporting was effective as of
December 31, 2016
.
Attestation Report of the Independent Registered Public Accounting Firm
Our internal control over financial reporting as of
December 31, 2016
, has been audited by Deloitte & Touche LLP, an independent registered public accounting firm, as stated in their attestation report, which follows below.
Changes in Internal Control Over Financial Reporting
In the course of completing our assessment of internal control over financial reporting as of December 31, 2014, management identified a material weakness in internal control over financial reporting related to information technology (“IT”) general controls, which had not been remediated as of December 31, 2015. In our assessment, management identified a number of deficiencies related to the design and operating effectiveness of IT general controls for information systems that comprise part of the Company’s system of internal control over financial reporting and are relevant to the preparation of our consolidated financial statements (such information technology systems are referred to as the “affected IT systems”). These deficiencies involved user access controls and program change management controls that are intended to ensure that access to
70
financial applications and data is adequately restricted to appropriate personnel, and that changes affecting the financial applications and underlying account records are identified, authorized, tested and implemented appropriately. Over the course of 2015 and 2016, the Company implemented a number of remediation efforts to address the material weakness and to improve and strengthen our internal controls including the following:
|
•
|
Improved the design, operation and monitoring of control activities and procedures associated with user and administrator access to the affected IT systems, including both preventive and detective control activities.
|
|
•
|
Implemented appropriate program change management control activities, including the installation of third party utility tools, to track access, authorizations and history of changes across the affected IT systems.
|
|
•
|
Hired additional information technology personnel and expanded the resources in the functional areas that support and monitor our IT systems and the information generated therefrom.
|
|
•
|
Implemented expanded training focused on the design and function of our control procedures, and employed dedicated compliance personnel to drive the design, maintenance and optimization of our control framework, including monitoring activities.
|
|
•
|
Implemented business process controls that directly mitigate the risks related to the electronic data and financial reports generated from the affected IT systems and used in the performance of underlying business process controls while remediation was in progress to address the IT general controls deficiencies.
|
During the fourth quarter of 2016, we completed our testing of internal controls over financial reporting and determined that controls and procedures over the affected IT systems were operating effectively. Management has therefore concluded that the previously reported material weakness in internal controls over financial reporting related to IT general controls in the areas of user access and program change management for the affected IT systems had been remediated as of
December 31, 2016
.
Except as described above, there have been no changes in the Company’s internal control over financial reporting that occurred during the three months ended
December 31, 2016
that have materially affected, or are reasonably likely to materially affect, the Company’s internal control over financial reporting.
71
REPORT OF INDEPENDENT REGISTERED PUBLIC ACCOUNTING FIRM
To the Board of Directors and Stockholders of
Bright Horizons Family Solutions Inc.
Watertown, Massachusetts
We have audited the internal control over financial reporting of Bright Horizons Family Solutions Inc. and subsidiaries (the “Company”) as of
December 31, 2016
, based on criteria established in
Internal Control Integrated Framework (2013)
issued by the Committee of Sponsoring Organizations of the Treadway Commission. As described in Management's Report on Internal Control over Financial Reporting, management excluded from its assessment the internal control over financial reporting at Conchord Limited, which was acquired on November 10, 2016, and whose financial statements constitute 10.2% of consolidated operating assets and 0.7% of consolidated revenues of the consolidated financial statement amounts as of and for the year ended December 31, 2016. Accordingly, our audit did not include the internal control over financial reporting at Conchord Limited. The Company’s management is responsible for maintaining effective internal control over financial reporting and for its assessment of the effectiveness of internal control over financial reporting, included in the accompanying Management’s Report on Internal Control over Financial Reporting. Our responsibility is to express an opinion on the Company’s internal control over financial reporting based on our audit.
We conducted our audit in accordance with the standards of the Public Company Accounting Oversight Board (United States). Those standards require that we plan and perform the audit to obtain reasonable assurance about whether effective internal control over financial reporting was maintained in all material respects. Our audit included obtaining an understanding of internal control over financial reporting, assessing the risk that a material weakness exists, testing and evaluating the design and operating effectiveness of internal control based on that risk, and performing such other procedures as we considered necessary in the circumstances. We believe that our audit provides a reasonable basis for our opinion.
A company’s internal control over financial reporting is a process designed by, or under the supervision of, the company’s principal executive and principal financial officers, or persons performing similar functions, and effected by the company’s board of directors, management, and other personnel to provide reasonable assurance regarding the reliability of financial reporting and the preparation of financial statements for external purposes in accordance with generally accepted accounting principles. A company’s internal control over financial reporting includes those policies and procedures that (1) pertain to the maintenance of records that, in reasonable detail, accurately and fairly reflect the transactions and dispositions of the assets of the company; (2) provide reasonable assurance that transactions are recorded as necessary to permit preparation of financial statements in accordance with generally accepted accounting principles, and that receipts and expenditures of the company are being made only in accordance with authorizations of management and directors of the company; and (3) provide reasonable assurance regarding prevention or timely detection of unauthorized acquisition, use, or disposition of the company’s assets that could have a material effect on the financial statements.
Because of the inherent limitations of internal control over financial reporting, including the possibility of collusion or improper management override of controls, material misstatements due to error or fraud may not be prevented or detected on a timely basis. Also, projections of any evaluation of the effectiveness of the internal control over financial reporting to future periods are subject to the risk that the controls may become inadequate because of changes in conditions, or that the degree of compliance with the policies or procedures may deteriorate.
In our opinion, the Company maintained, in all material respects, effective internal control over financial reporting as of
December 31, 2016
, based on the criteria established in
Internal Control Integrated Framework (2013)
issued by the Committee of Sponsoring Organizations of the Treadway Commission.
We also have audited, in accordance with the standards of the Public Company Accounting Oversight Board (United States), the consolidated financial statements of Bright Horizons Family Solutions Inc. and subsidiaries as of and for the year ended
December 31, 2016
, and our report dated
March 1, 2017
expressed an unqualified opinion on those financial statements.
/s/ DELOITTE & TOUCHE LLP
Boston, Massachusetts
March 1, 2017
72
None.
Information regarding our executive officers is set forth at the end of Part I of this Annual Report on Form 10-K under the caption “Executive Officers of the Registrant.” The remaining information required by this Item 10 will be contained in our Definitive Proxy Statement for our
2017
Annual Meeting of Stockholders, which will be filed no later than 120 days after the close of our fiscal year ended
December 31, 2016
(the “Definitive Proxy Statement”) and is incorporated herein by reference.
Except for information regarding securities authorized under our equity compensation plans as set forth in Part II, Item 5 of this Annual Report on Form 10-K under the caption “Equity Compensation Plans,” the information required by this item will be contained in our Definitive Proxy Statement and is incorporated herein by reference.
The information required by this item will be contained in our Definitive Proxy Statement and is incorporated herein by reference.
The information required by this item will be contained in our Definitive Proxy Statement and is incorporated herein by reference.
The information required by this item will be contained in our Definitive Proxy Statement and is incorporated herein by reference.
73
(a) The following documents are filed as part of this report:
|
1.
|
Financial statements: All financial statements are included in Part II, Item 8 of this report.
|
|
2.
|
Financial statement schedules: All other financial statement schedules are omitted because they are not required or are not applicable, or the required information is provided in the consolidated financial statements or notes described in Item 15(a)(1) above.
|
|
3.
|
Exhibits: The following is an index of the exhibits included in this Annual Report on Form 10-K or incorporated by reference.
|
|
Exhibit
Number
|
Exhibit Title
|
|
|
3.1
|
Form of Second Restated Certificate of Incorporation of Bright Horizons Family Solutions Inc. (incorporated by reference to Exhibit 3.1 to the Company’s Registration Statement on Form S-1, File No. 333-184579, filed October 24, 2012)
|
|
|
3.2
|
Form of Amended and Restated Bylaws of Bright Horizons Family Solutions Inc. (incorporated by reference to Exhibit 3.2 to the Company’s Registration Statement on Form S-1, File No. 333-184579, filed October 24, 2012)
|
|
|
4.1
|
Form of Amended and Restated Registration Rights Agreement among Bright Horizons Family Solutions Inc. and certain stockholders of Bright Horizons Family Solutions Inc. (incorporated by reference to Exhibit 4.1 to Amendment No. 1 to the Company’s Registration Statement on Form S-1, File No. 333-184579, filed November 9, 2012)
|
|
|
10.1†
|
Bright Horizons Family Solutions Inc. (f/k/a Bright Horizons Solutions Corp.) 2008 Equity Incentive Plan amended (incorporated by reference to Exhibit 10.1 to the Company’s Registration Statement on Form S-1, File No. 333-184579, filed October 24, 2012)
|
|
|
10.2†
|
Amendment to Bright Horizons Family Solutions Inc. 2008 Equity Incentive Plan (incorporated by reference to Exhibit 10.1(1) to Amendment No. 2 to the Company’s Registration Statement on Form S-1, File No. 333-184579, filed on January 14, 2013)
|
|
|
10.3 (1)*
|
Incremental and Amendment and Restatement Agreement, dated as of November 7, 2016, among Bright Horizons Family Solutions LLC, Bright Horizons Capital Corp., Goldman Sachs Bank USA, JPMorgan Chase Bank, N.A. and the Incremental Term Lenders as parties thereto
|
|
|
10.3 (2)*
|
Credit Agreement, as amended and restated on November 7, 2016, by and among Bright Horizons Family Solutions LLC, Bright Horizons Capital Corp., JPMorgan Chase Bank, N.A., the Lenders and other parties thereto, as previously named
|
|
|
10.4†
|
Form of Non-Statutory Time-Based Option Award under the 2008 Equity Incentive Plan (incorporated by reference to Exhibit 10.2 to the Company’s Registration Statement on Form S-1, File No. 333-184579, filed October 24, 2012)
|
|
|
10.5†
|
Form of Non-Statutory Performance-Based Option Award under the 2008 Equity Incentive Plan (incorporated by reference to Exhibit 10.3 to the Company’s Registration Statement on Form S-1, File No. 333-184579, filed October 24, 2012)
|
|
|
10.6†
|
Form of Non-Statutory Continuation Option Award under the 2008 Equity Incentive Plan (incorporated by reference to Exhibit 10.4 to the Company’s Registration Statement on Form S-1, File No. 333-184579, filed October 24, 2012)
|
|
|
10.7†
|
Amended and Restated Severance Agreement between Bright Horizons Family Solutions LLC and Stephen I. Dreier (incorporated by reference to Exhibit 10.15 to the Company’s Registration Statement on Form S-1, File No. 333-188903, filed May 29, 2013)
|
|
|
10.8†
|
Form of Non-Statutory Stock Option Agreement (Directors) under 2012 Omnibus Long-Term Incentive Plan (incorporated by reference to Exhibit 10.6(1) to Amendment No. 1 to the Company’s Registration Statement on Form S-1, File No. 333-184579, filed November 9, 2012)
|
|
|
10.9†
|
Form of Non-Statutory Stock Option Agreement (Employees) under 2012 Omnibus Long-Term Incentive Plan (incorporated by reference to Exhibit 10.6(2) to Amendment No. 1 to the Company’s Registration Statement on Form S-1, File No. 333-184579, filed November 9, 2012)
|
|
|
10.10†
|
Bright Horizons Family Solutions Inc. 2012 Omnibus Long-Term Incentive Plan (incorporated by reference to Exhibit 10.10 to the Company’s Annual Report on Form 10-K, filed March 26, 2013)
|
|
74
|
Exhibit
Number
|
Exhibit Title
|
|
|
10.11†
|
Bright Horizons Family Solutions Inc. Annual Incentive Plan (incorporated by reference to Exhibit 10.7 Amendment No. 1 to the Company’s Registration Statement on Form S-1, File No. 333-184579, filed November 9, 2012)
|
|
|
10.12†
|
Form of Amended and Restated Severance Agreement between Bright Horizons Family Solutions LLC and David Lissy (incorporated by reference to Exhibit 10.8 to the Company’s Registration Statement on Form S-1, File No. 333-184579, filed October 24, 2012)
|
|
|
10.13†*
|
Amended and Restated Severance Agreement between Bright Horizons Family Solutions LLC and Mandy Berman
|
|
|
10.14†
|
Form of Amended and Restated Severance Agreement between Bright Horizons Family Solutions LLC and Elizabeth Boland (incorporated by reference to Exhibit 10.10 to the Company’s Registration Statement on Form S-1, File No. 333-184579, filed October 24, 2012)
|
|
|
10.15†
|
Form of Director and Officer Indemnification Agreement (incorporated by reference to Exhibit 10.16 to the Company’s Registration Statement on Form S-1, File No. 333-184579, filed October 24, 2012)
|
|
|
10.16†
|
Form of Amended and Restated Stockholders Agreement among Bright Horizons Family Solutions Inc. and certain stockholders named therein (incorporated by reference to Exhibit 10.17 to the Company’s Registration Statement on Form S-1, File No. 333-184579, filed October 24, 2012)
|
|
|
10.17†*
|
Amended and Restated Severance Agreement between Bright Horizons Family Solutions LLC and Mary Lou Burke
|
|
|
10.18
|
Amended and Restated Lease between the President and Fellows of Harvard College and Bright Horizons Children’s Centers, LLC, dated December 1, 2009 (incorporated by reference to Exhibit 10.22 to the Company’s Registration Statement on Form S-1, File No. 333-184579, filed October 24, 2012)
|
|
|
10.19
|
Assignment and Assumption of Lease and Novation Agreement among the President and Fellows of Harvard College, Enterprise Mobile, Inc. and Bright Horizons Children’s Centers LLC, dated June 15, 2011 (incorporated by reference to Exhibit 10.23 to the Company’s Registration Statement on Form S-1, File No. 333-184579, filed October 24, 2012)
|
|
|
10.20
|
First Amendment to Amended and Restated Lease between the President and Fellows of Harvard College and Bright Horizons Children’s Centers LLC, dated July 25, 2011 (incorporated by reference to Exhibit 10.24 to the Company’s Registration Statement on Form S-1, File No. 333-184579, filed October 24, 2012)
|
|
|
10.21
|
Second Amendment to Amended and Restated Lease between the President and Fellows of Harvard College and Bright Horizons Children’s Centers LLC, dated September 30, 2012 (incorporated by reference to Exhibit 10.25 to the Company’s Registration Statement on Form S-1, File No. 333-184579, filed October 24, 2012)
|
|
|
10.22*
|
Agreement for the Sale and Purchase of the Entire Issued Share Capital of Conchord Limited, dated as of November 8, 2016, among Kaupthing ehf, BHFS Two Limited, Bright Horizons Family Solutions LLC and the persons listed therein (1)
|
|
|
10.23*
|
Management Warranty Deed, dated as of November 8, 2016, among the persons listed therein and BHFS Two Limited (1)
|
|
|
10.24*
|
Debt Assignment Agreement of Facilities Agreement, dated November 10, 2016, among Kaupthing ehf, Chestnutbay Acquisitionco Limited and BHFS Two Limited (1)
|
|
|
10.25†
|
Form of Restricted Stock Agreement (incorporated by reference to Exhibit 10.24 to the Company’s Annual Report on Form 10-K for the year ended December 31, 2014, filed March 2, 2015)
|
|
|
10.26†
|
Form of Restricted Stock Unit Agreement (Directors) (incorporated by reference to Exhibit 10.25 to the Company’s Annual Report on Form 10-K for the year ended December 31, 2014, filed March 2, 2015)
|
|
|
10.27†
|
Amended and Restated Severance Agreement between Bright Horizons Family Solutions LLC and Stephen Kramer (incorporated by reference to Exhibit 10.26 to the Company’s Annual Report on Form 10-K for the year ended December 31, 2014, filed March 2, 2015)
|
|
|
10.28†
|
Bright Horizons Family Solutions Non-Qualified Deferred Compensation Plan (incorporated by reference to Exhibit 10.29 to the Company’s Annual Report on Form 10-K for the year ended December 31, 2014, filed March 2, 2015)
|
|
|
21.1*
|
Subsidiaries of Bright Horizons Family Solutions Inc.
|
|
|
23.1*
|
Consent of Independent Registered Public Accounting Firm Deloitte & Touche LLP
|
|
|
31.1*
|
Certification pursuant to Section 302 of Sarbanes Oxley Act of 2002 by Chief Executive Officer
|
|
|
31.2*
|
Certification pursuant to Section 302 of Sarbanes Oxley Act of 2002 by Chief Financial Officer
|
|
|
32.1**
|
Certification pursuant to Section 906 of Sarbanes Oxley Act of 2002 by Chief Executive Officer
|
|
|
32.2**
|
Certification pursuant to Section 906 of Sarbanes Oxley Act of 2002 by Chief Financial Officer
|
|
|
101.INS*
|
XBRL Instance Document
|
|
75
|
Exhibit
Number
|
Exhibit Title
|
|
|
101.SCH*
|
XBRL Taxonomy Extension Schema Document
|
|
|
101.CAL*
|
XBRL Taxonomy Extension Calculation Linkbase Document
|
|
|
101.DEF*
|
XBRL Taxonomy Extension Definition Linkbase Document
|
|
|
101.LAB*
|
XBRL Taxonomy Extension Label Linkbase Document
|
|
|
101.PRE*
|
XBRL Taxonomy Extension Presentation Linkbase Document
|
|
|
*
|
Exhibits filed herewith
|
|
|
**
|
Exhibits furnished herewith
|
|
|
†
|
Management contract or compensatory plan
|
|
|
(1)
|
Schedules (or similar attachments) have been omitted pursuant to Item 601(b)(2) of Regulation S-K. The registrant hereby undertakes to furnish supplementally copies of any of the omitted schedules (or similar attachments) upon request by the SEC.
|
|
76
Signatures
Pursuant to the requirements of Section 13 or 15(d) of the Securities Exchange Act of 1934, the registrant has duly caused this report to be signed on its behalf by the undersigned, thereunto duly authorized.
Date:
March 1, 2017
|
Bright Horizons Family Solutions Inc.
|
|||
|
By:
|
/s/ David Lissy
|
||
|
Name:
|
David Lissy
|
||
|
Title:
|
Chief Executive Officer
|
||
Pursuant to the requirements of the Securities and Exchange Act of 1934, this report has been signed below by the following persons on behalf of the Registrant and in the capacities and on the dates indicated.
|
Signature
|
Title
|
Date
|
||
|
/s/ David Lissy
|
Director, Chief Executive Officer (Principal Executive Officer)
|
March 1, 2017
|
||
|
David Lissy
|
||||
|
/s/ Elizabeth Boland
|
Chief Financial Officer (Principal Financial and Accounting Officer)
|
March 1, 2017
|
||
|
Elizabeth Boland
|
||||
|
/s/ Linda Mason
|
Director, Chair of the Board
|
March 1, 2017
|
||
|
Linda Mason
|
||||
|
/s/ Lawrence Alleva
|
Director
|
March 1, 2017
|
||
|
Lawrence Alleva
|
||||
|
/s/ Joshua Bekenstein
|
Director
|
March 1, 2017
|
||
|
Joshua Bekenstein
|
||||
|
/s/ Roger Brown
|
Director
|
March 1, 2017
|
||
|
Roger Brown
|
||||
|
/s/ E. Townes Duncan
|
Director
|
March 1, 2017
|
||
|
E. Townes Duncan
|
||||
|
/s/ Jordan Hitch
|
Director
|
March 1, 2017
|
||
|
Jordan Hitch
|
||||
|
/s/ David Humphrey
|
Director
|
March 1, 2017
|
||
|
David Humphrey
|
||||
|
/s/ Marguerite Kondracke
|
Director
|
March 1, 2017
|
||
|
Marguerite Kondracke
|
||||
|
/s/ Sara Lawrence-Lightfoot
|
Director
|
March 1, 2017
|
||
|
Sara Lawrence-Lightfoot
|
||||
|
/s/ Cathy E. Minehan
|
Director
|
March 1, 2017
|
||
|
Cathy E. Minehan
|
||||
|
/s/ Mary Ann Tocio
|
Director
|
March 1, 2017
|
||
|
Mary Ann Tocio
|
||||
77
TABLE OF CONTENTS
Part IItem 1. BusinessItem 1A. Risk FactorsItem 1B. Unresolved Staff CommentsItem 2. PropertiesItem 3. Legal ProceedingsItem 4. Mine Safety DisclosuresPart IIItem 5. Market For Registrant's Common Equity, Related Stockholder Matters and Issuer Purchases Of Equity SecuritiesItem 6. Selected Financial DataItem 7. Management's Discussion and Analysis Of Financial Condition and Results Of OperationsItem 7A. Quantitative and Qualitative Disclosures About Market RiskItem 8. Financial Statements and Supplementary DataItem 9. Changes in and Disagreements with Accountants on Accounting and Financial DisclosureItem 9A. Controls and ProceduresItem 9B. Other InformationPart IIIItem 10. Directors, Executive Officers and Corporate GovernanceItem 11. Executive CompensationItem 12. Security Ownership Of Certain Beneficial Owners and Management and Related Stockholder MattersItem 13. Certain Relationships, Related Transactions and Director IndependenceItem 14. Principal Accounting Fees and ServicesPart IVItem 15. Exhibits, Financial Statement Schedules