BAUSCH HEALTH COMPANIES INC.
10-Ks and 10-Qs
|
|
|
|
|
|
|
|
|
|
|
|
|
|
|
|
|
|
|
|
|
|
|
|
|
|
|
|
|
|
|
|
|
|
|
|
|
|
|
|
|
|
|
|
|
|
|
|
|
|
|
|
|
|
|
|
|
|
|
|
|
|
|
|
|
UNITED STATES
SECURITIES AND EXCHANGE COMMISSION
Washington, D.C. 20549
_____________________________
FORM 10-K
|
ý
|
ANNUAL REPORT PURSUANT TO SECTION 13 OR 15(d) OF THE SECURITIES EXCHANGE ACT OF 1934
|
|
For the fiscal year ended
December 31, 2018
|
|
|
OR
|
|
|
o
|
TRANSITION REPORT PURSUANT TO SECTION 13 OR 15(d) OF THE SECURITIES EXCHANGE ACT OF 1934
|
|
For the transition period from to
|
|
Commission file number 001-14956
BAUSCH HEALTH COMPANIES INC.
(Exact Name of Registrant as Specified in its Charter)
|
BRITISH COLUMBIA, CANADA
State or other jurisdiction of
incorporation or organization
|
98-0448205
(I.R.S. Employer Identification No.)
|
|
2150 St. Elzéar Blvd. West
Laval, Québec
Canada, H7L 4A8
(Address of principal executive offices)
|
|
Registrant's telephone number, including area code
(514) 744-6792
Securities registered pursuant to Section 12(b) of the Act:
|
Title of each class
|
|
Name of each exchange on which registered
|
|
Common Shares, No Par Value
|
|
New York Stock Exchange, Toronto Stock Exchange
|
Securities registered pursuant to section 12(g) of the Act:
None
(Title of class)
Indicate by check mark if the registrant is a well-known seasoned issuer, as defined in Rule 405 of the Securities Act. Yes
ý
No
o
Indicate by check mark if the registrant is not required to file reports pursuant to Section 13 or Section 15(d) of the Act. Yes
o
No
ý
Indicate by check mark whether the registrant (1) has filed all reports required to be filed by Section 13 or Section 15(d) of the Securities Exchange Act of 1934 during the preceding 12 months (or for such shorter period that the registrant was required to file such reports), and (2) has been subject to such filing requirements for the past 90 days. Yes
ý
No
o
Indicate by check mark whether the registrant has submitted electronically and posted on its corporate Web site, if any, every Interactive Data File required to be submitted and posted pursuant to Rule 405 of Regulation S-T during the preceding 12 months (or for such shorter period that the registrant was required to submit and post such files). Yes
ý
No
o
Indicate by check mark if disclosure of delinquent filers pursuant to Item 405 of Regulation S-K is not contained herein, and will not be contained, to the best of registrant’s knowledge, in definitive proxy or information statements incorporated by reference in Part III of this Form 10-K or any amendment to this Form 10-K.
o
Indicate by check mark whether the registrant is a large accelerated filer, an accelerated filer, a non-accelerated filer, or a smaller reporting company. See the definitions of “large accelerated filer,” “accelerated filer” and “smaller reporting company” in Rule 12b-2 of the Exchange Act. (Check one):
|
Large accelerated filer
|
x
|
Accelerated filer
|
o
|
Non-accelerated filer
(Do not check if a smaller reporting company) |
o
|
Smaller reporting company
|
o
|
Emerging growth company
|
o
|
|
If an emerging growth company, indicate by check mark if the registrant has elected not to use the extended transition period for complying with any new or revised financial accounting standards provided pursuant to Section 13(a) of the Exchange Act.
o
|
|||||||||
Indicate by check mark whether the registrant is a shell company (as defined in Rule 12b-2 of the Exchange Act). Yes
o
No
ý
The aggregate market value of the common shares held by non-affiliates of the registrant as of the last business day of the registrant’s most recently completed second fiscal quarter was
$7,208,197,000
based on the last reported sale price on the New York Stock Exchange on June 30,
2018
.
The number of outstanding shares of the registrant’s common stock as of
February 14, 2019
was
350,993,877
.
DOCUMENTS INCORPORATED BY REFERENCE
Part III incorporates certain information by reference from the registrant’s proxy statement for the
2019
Annual Meeting of Shareholders. Such proxy statement will be filed no later than 120 days after the close of the registrant’s fiscal year ended
December 31, 2018
.
TABLE OF CONTENTS
GENERAL INFORMATION
|
|
|
|
|
Page
|
|
PART I
|
||||
|
Item 1.
|
|
Business
|
|
|
|
Item 1A.
|
|
Risk Factors
|
|
|
|
Item 1B.
|
|
Unresolved Staff Comments
|
|
|
|
Item 2.
|
|
Properties
|
|
|
|
Item 3.
|
|
Legal Proceedings
|
|
|
|
Item 4.
|
|
Mine Safety Disclosures
|
|
|
|
PART II
|
||||
|
Item 5.
|
|
Market for Registrant’s Common Equity, Related Stockholder Matters and Issuer Purchases of Equity Securities
|
|
|
|
Item 6.
|
|
Selected Financial Data
|
|
|
|
Item 7.
|
|
Management’s Discussion and Analysis of Financial Condition and Results of Operations
|
|
|
|
Item 7A.
|
|
Quantitative and Qualitative Disclosures About Market Risk
|
|
|
|
Item 8.
|
|
Financial Statements and Supplementary Data
|
|
|
|
Item 9.
|
|
Changes in and Disagreements with Accountants on Accounting and Financial Disclosure
|
|
|
|
Item 9A.
|
|
Controls and Procedures
|
|
|
|
Item 9B.
|
|
Other Information
|
|
|
|
PART III
|
||||
|
Item 10.
|
|
Directors, Executive Officers and Corporate Governance
|
|
|
|
Item 11.
|
|
Executive Compensation
|
|
|
|
Item 12.
|
|
Security Ownership of Certain Beneficial Owners and Management and Related Stockholder Matters
|
|
|
|
Item 13.
|
|
Certain Relationships and Related Transactions, and Director Independence
|
|
|
|
Item 14.
|
|
Principal Accounting Fees and Services
|
|
|
|
PART IV
|
||||
|
Item 15.
|
|
Exhibits and Financial Statement Schedules
|
|
|
|
Item 16.
|
|
Form 10-K Summary
|
||
|
SIGNATURES
|
|
|||
i
Basis of Presentation
General
Except where the context otherwise requires, all references in this Annual Report on Form 10-K (“Form 10-K”) to the “Company”, “we”, “us”, “our” or similar words or phrases are to Bausch Health Companies Inc. and its subsidiaries, taken together. In this Form 10-K, references to “$” or “USD” are to United States dollars, references to “€” are to Euros, and references to “CAD” are to Canadian dollars. Unless otherwise indicated, the statistical and financial data contained in this Form 10-K are presented
as of December 31, 2018
.
Effective on July 13, 2018, the Company changed its corporate name from Valeant Pharmaceuticals International, Inc. to Bausch Health Companies Inc.
Trademarks
The following words are some of the trademarks in our Company’s trademark portfolio and are the subject of either registration, or application for registration, in one or more of Canada, the United States of America (the “U.S.”) or certain other jurisdictions: ACANYA
®
, AERGEL
®
, AKREOS
®
, ALDARA
®
, ALREX
®
, ALTRENO
™
, AMMONUL
®
, AMYTAL
®
, APLENZIN
®
, APRISO
®
, AQUALOX
®
, ARESTIN
®
, ARTELAC
®
, ATIVAN
®
, ATRALIN
®
, B&L
®
, B+L
®
, BAUSCH & LOMB
®
, BAUSCH + LOMB
®
, BAUSCH + LOMB ULTRA
®
, BAUSCH HEALTH
™
, BAUSCH HEALTH COMPANIES
™
, BEPREVE
®
, BESIVANCE
®
, BIOTRUE
®
, BOSTON
®
, BRYHALI
TM
, CARAC
®
, CARDIZEM
®
, CLEAR + BRILLIANT
®
, CLINDAGEL
®
, COLD-FX
®
, COMFORTMOIST
®
, CRYSTALENS
®
, CUPRIMINE
®
, DIASTAT
®
, DUOBRII
™
, EDECRIN
®
, ENVISTA
®
, GLUMETZA
®
, IPRIVASK
®
, ISTALOL
®
, JUBLIA
®
, LIPOSONIX
®
, LOTEMAX
®
, LUMIFY
®
, LUZU
®
, MEDICIS
®
, MEPHYTON
®
, MESTINON
®
, MIGRANAL
®
, MINOCIN
®
, MOISTURESEAL
®
, MYSOLINE
®
, NEUTRASAL
®
, OCUVITE
®
, ONEXTON
®
, OPTICALIGN
®
, ORTHO DERMATOLOGICS
®
, PRESERVISION
®
, PROLENSA
®
, PUREVISION
®
, RELISTOR
®
, RENU
®
, RENU MULTIPLUS
®
, RETIN-A
®
, RETIN-A MICRO
®
, SALIX
®
, SCLERALFIL
®
, SECONAL SODIUM
™
, SHOWER TO SHOWER
®
, SILIQ™, SILSOFT
®
, SOFLENS
®
, SOLODYN
®
, SOLTA MEDICAL
®
, STELLARIS
®
, STELLARIS ELITE
™
, STORZ
®
, SYNERGETICS
®
, SYPRINE
®
, TARGRETIN
®
, TASMAR
®
, THERMAGE
®
, THERMAGE FLX
®
, TRULIGN
®
, UCERIS
®
, VALEANT
®
, VANOS
®
, VICTUS
®
, VIRAZOLE
®
, VITESSE
®
, VYZULTA
®
, XENAZINE
®
, ZEGERID
®
, ZELAPAR
®
, ZIANA
®
, and ZYLET
®
.
In addition to the trademarks previously noted, we have filed trademark applications and/or obtained trademark registrations for many of our other trademarks in the U.S., Canada and in other jurisdictions and have implemented, on an ongoing basis, a trademark protection program for new trademarks.
WELLBUTRIN
®
, WELLBUTRIN XL
®
and ZOVIRAX
®
are trademarks of GlaxoSmithKline LLC and are used by us under license. ELIDEL
®
and XERESE
®
are registered trademarks of Meda Pharma SARL and are used by us under license. EMERADE
®
is a registered trademark of Medeca Pharma AB and is used by us under license. DEFLUX
®
and SOLESTA
®
are registered trademarks of Nestlé Skin Health S.A. and are used by us under license. ISUPREL
®
and NITROPRESS
®
are registered trademarks of Hospira, Inc. and are used by us under license. XIFAXAN
®
is a registered trademark of Alfasigma S.P.A. and is used by us under license. PEPCID
®
is a brand of McNeil Consumer Pharmaceuticals and is used by us under license. MOVIPREP
®
is a registered trademark of Velinor AG and is used by us under license. PLENVU
®
is a registered trademark of the Norgine group of companies and is used by us under license. LOCOID
®
is a registered trademark of Leo Pharma A/S and is used by us under license. LUCEMYRA
TM
is a trademark of US Worldmeds, LLC and is used by us under license. DOPTELET
®
is a trademark of AkaRx, Inc. and is used by us under license.
Forward-Looking Statements
Caution regarding forward-looking information and statements and “Safe-Harbor” statements under the U.S. Private Securities Litigation Reform Act of 1995 and applicable Canadian securities laws:
To the extent any statements made in this Form 10-K contain information that is not historical, these statements are forward-looking statements within the meaning of Section 27A of the Securities Act of 1933, as amended, and Section 21E of the Securities Exchange Act of 1934, as amended, and may be forward-looking information within the meaning defined under applicable Canadian securities laws (collectively, “forward-looking statements”).
These forward-looking statements relate to, among other things: our business strategy, business plans and prospects and forecasts and changes thereto; product pipeline, prospective products and product approvals, product development and future performance and results of current and anticipated products; anticipated revenues for our products, including the Significant Seven; anticipated growth in our Ortho Dermatologics business; expected R&D and marketing spend, including in connection with the promotion of the Significant Seven; our expected primary cash and working capital requirements for 2019 and beyond;
ii
the Company's plans for continued improvement in operational efficiency and the anticipated impact of such plans; our liquidity and our ability to satisfy our debt maturities as they become due; our ability to reduce debt levels; the impact of our distribution, fulfillment and other third-party arrangements; proposed pricing actions; exposure to foreign currency exchange rate changes and interest rate changes; the outcome of contingencies, such as litigation, subpoenas, investigations, reviews, audits and regulatory proceedings; the anticipated impact of the adoption of new accounting standards; general market conditions; our expectations regarding our financial performance, including revenues, expenses, gross margins and income taxes; our ability to meet the financial and other covenants contained in our Fourth Amended and Restated Credit and Guaranty Agreement (the "Restated Credit Agreement"), and indentures; and our impairment assessments, including the assumptions used therein and the results thereof.
Forward-looking statements can generally be identified by the use of words such as “believe”, “anticipate”, “expect”, “intend”, “estimate”, “plan”, “continue”, “will”, “may”, “could”, “would”, “should”, “target”, “potential”, “opportunity”, “designed”, “create”, “predict”, “project”, “forecast”, “seek”, “ongoing” or “increase” and variations or other similar expressions. In addition, any statements that refer to expectations, intentions, projections or other characterizations of future events or circumstances are forward-looking statements. These forward-looking statements may not be appropriate for other purposes. Although we have previously indicated certain of these statements set out herein, all of the statements in this Form 10-K that contain forward-looking statements are qualified by these cautionary statements. These statements are based upon the current expectations and beliefs of management. Although we believe that the expectations reflected in such forward-looking statements are reasonable, such statements involve risks and uncertainties, and undue reliance should not be placed on such statements. Certain material factors or assumptions are applied in making such forward-looking statements, including, but not limited to, factors and assumptions regarding the items previously
outlined, those factors, risks and uncertainties outlined below and the assumption that none of these factors, risks and uncertainties will cause actual results or events to differ materially from those described in such forward-looking statements. Actual results may differ materially from those expressed or implied in such statements. Important factors, risks and uncertainties that could cause actual results to differ materially from these expectations include, among other things, the following:
|
•
|
the expense, timing and outcome of legal and governmental proceedings, investigations and information requests relating to, among other matters, our past distribution, marketing, pricing, disclosure and accounting practices (including with respect to our former relationship with Philidor Rx Services, LLC ("Philidor")), including pending investigations by the U.S. Attorney's Office for the District of Massachusetts and the U.S. Attorney's Office for the Southern District of New York, the pending investigations by the U.S. Securities and Exchange Commission (the “SEC”) of the Company, the investigation order issued by the Company from the Autorité des marchés financiers (the “AMF”) (the Company’s principal securities regulator in Canada), a number of pending putative securities class action litigations in the U.S. (including related opt-out actions) and Canada (including related opt-out actions) and purported class actions under the federal RICO statute and other claims, investigations or proceedings that may be initiated or that may be asserted;
|
|
•
|
potential additional litigation and regulatory investigations (and any costs, expenses, use of resources, diversion of management time and efforts, liability and damages that may result therefrom), negative publicity and reputational harm on our Company, products and business that may result from the past and ongoing public scrutiny of our past distribution, marketing, pricing, disclosure and accounting practices and from our former relationship with Philidor;
|
|
•
|
the past and ongoing scrutiny of our legacy business practices, including with respect to pricing (including the investigations by the U.S. Attorney's Offices for the District of Massachusetts and the Southern District of New York), and any pricing controls or price adjustments that may be sought or imposed on our products as a result thereof;
|
|
•
|
pricing decisions that we have implemented, or may in the future elect to implement, whether as a result of recent scrutiny or otherwise, such as the Patient Access and Pricing Committee’s commitment that the average annual price increase for our branded prescription pharmaceutical products will be set at no greater than single digits, or any future pricing actions we may take following review by our Patient Access and Pricing Committee (which is responsible for the pricing of our drugs);
|
|
•
|
legislative or policy efforts, including those that may be introduced and passed by the U.S. Congress, designed to reduce patient out-of-pocket costs for medicines, which could result in new mandatory rebates and discounts or other pricing restrictions, controls or regulations (including mandatory price reductions);
|
|
•
|
ongoing oversight and review of our products and facilities by regulatory and governmental agencies, including periodic audits by the U.S. Food and Drug Administration (the
“
FDA”) and the results thereof;
|
|
•
|
actions by the FDA or other regulatory authorities with respect to our products or facilities;
|
iii
|
•
|
our substantial debt (and potential additional future indebtedness) and current and future debt service obligations, our ability to reduce our outstanding debt levels and the resulting impact on our financial condition, cash flows and results of operations;
|
|
•
|
our ability to meet the financial and other covenants contained in our Restated Credit Agreement, indentures and other current or future debt agreements and the limitations, restrictions and prohibitions such covenants impose or may impose on the way we conduct our business, including prohibitions on incurring additional debt if certain financial covenants are not met, limitations on the amount of additional debt we are able to incur where not prohibited, and restrictions on our ability to make certain investments and other restricted payments;
|
|
•
|
any default under the terms of our senior notes indentures or Restated Credit Agreement and our ability, if any, to cure or obtain waivers of such default;
|
|
•
|
any delay in the filing of any future financial statements or other filings and any default under the terms of our senior notes indentures or Restated Credit Agreement as a result of such delays;
|
|
•
|
any downgrade by rating agencies in our credit ratings, which may impact, among other things, our ability to raise debt and the cost of capital for additional debt issuances;
|
|
•
|
any reductions in, or changes in the assumptions used in, our forecasts for 2019 or beyond, which could lead to, among other things: (i) a failure to meet the financial and/or other covenants contained in our Restated Credit Agreement and/or indentures and/or (ii) impairment in the goodwill associated with certain of our reporting units or impairment charges related to certain of our products or other intangible assets, which impairments could be material;
|
|
•
|
changes in the assumptions used in connection with our impairment analyses or assessments, which would lead to a change in such impairment analyses and assessments and which could result in an impairment in the goodwill associated with any of our reporting units or impairment charges related to certain of our products or other intangible assets;
|
|
•
|
any additional divestitures of our assets or businesses and our ability to successfully complete any such divestitures on commercially reasonable terms and on a timely basis, or at all, and the impact of any such divestitures on our Company, including the reduction in the size or scope of our business or market share, loss of revenue, any loss on sale, including any resultant write-downs of goodwill, or any adverse tax consequences suffered as a result of any such divestitures;
|
|
•
|
the uncertainties associated with the acquisition and launch of new products, including, but not limited to, our ability to provide the time, resources, expertise and costs required for the commercial launch of new products, the acceptance and demand for new pharmaceutical products, and the impact of competitive products and pricing, which could lead to material impairment charges;
|
|
•
|
our ability to retain, motivate and recruit executives and other key employees;
|
|
•
|
our ability to implement effective succession planning for our executives and key employees;
|
|
•
|
factors impacting our ability to achieve anticipated growth in our Ortho Dermatologics business, including the approval of pending and pipeline products (and the timing of such approvals), expected geographic expansion, changes in estimates on market potential for dermatology products and continued investment in and success of our sales force;
|
|
•
|
factors impacting our ability to achieve anticipated revenues for our Significant Seven products, including the approval of pending products in the Significant Seven (and the timing of such approvals), changes in anticipated marketing spend on such products and launch of competing products;
|
|
•
|
the challenges and difficulties associated with managing a large complex business, which has, in the past, grown rapidly;
|
|
•
|
our ability to compete against companies that are larger and have greater financial, technical and human resources than we do, as well as other competitive factors, such as technological advances achieved, patents obtained and new products introduced by our competitors;
|
|
•
|
our ability to effectively operate, stabilize and grow our businesses in light of the challenges that the Company currently faces, including with respect to its substantial debt, pending investigations and legal proceedings, scrutiny of our past pricing, distribution and other practices, reputational harm and limitations on the way we conduct business imposed by the covenants in our Restated Credit Agreement, indentures and the agreements governing our other indebtedness;
|
|
•
|
the extent to which our products are reimbursed by government authorities, pharmacy benefit managers ("PBMs") and other third-party payors; the impact our distribution, pricing and other practices (including as it relates to our current relationship with Walgreen Co. ("Walgreens")) may have on the decisions of such government authorities, PBMs and
|
iv
other third-party payors to reimburse our products; and the impact of obtaining or maintaining such reimbursement on the price and sales of our products;
|
•
|
the inclusion of our products on formularies or our ability to achieve favorable formulary status, as well as the impact on the price and sales of our products in connection therewith;
|
|
•
|
our eligibility for benefits under tax treaties and the continued availability of low effective tax rates for the business profits of certain of our subsidiaries;
|
|
•
|
the actions of our third-party partners or service providers of research, development, manufacturing, marketing, distribution or other services, including their compliance with applicable laws and contracts, which actions may be beyond our control or influence, and the impact of such actions on our Company, including the impact to the Company of our former relationship with Philidor and any alleged legal or contractual non-compliance by Philidor;
|
|
•
|
the risks associated with the international scope of our operations, including our presence in emerging markets and the challenges we face when entering and operating in new and different geographic markets (including the challenges created by new and different regulatory regimes in such countries and the need to comply with applicable anti-bribery and economic sanctions laws and regulations);
|
|
•
|
adverse global economic conditions and credit markets and foreign currency exchange uncertainty and volatility in certain of the countries in which we do business;
|
|
•
|
the impact of the recently signed United States-Mexico-Canada Agreement (“USMCA”) and any potential changes to other trade agreements;
|
|
•
|
the final outcome and impact of Brexit negotiations;
|
|
•
|
the potentially escalating trade conflict between the United States and China;
|
|
•
|
our ability to obtain, maintain and license sufficient intellectual property rights over our products and enforce and defend against challenges to such intellectual property;
|
|
•
|
the introduction of generic, biosimilar or other competitors of our branded products and other products, including the introduction of products that compete against our products that do not have patent or data exclusivity rights;
|
|
•
|
our ability to identify, finance, acquire, close and integrate acquisition targets successfully and on a timely basis and the difficulties, challenges, time and resources associated with the integration of acquired companies, businesses and products;
|
|
•
|
the expense, timing and outcome of pending or future legal and governmental proceedings, arbitrations, investigations, subpoenas, tax and other regulatory audits, reviews and regulatory proceedings against us or relating to us and settlements thereof;
|
|
•
|
our ability to negotiate the terms of or obtain court approval for the settlement of certain legal and regulatory proceedings;
|
|
•
|
our ability to obtain components, raw materials or finished products supplied by third parties (some of which may be single-sourced) and other manufacturing and related supply difficulties, interruptions and delays;
|
|
•
|
the disruption of delivery of our products and the routine flow of manufactured goods;
|
|
•
|
economic factors over which the Company has no control, including changes in inflation, interest rates, foreign currency rates, and the potential effect of such factors on revenues, expenses and resulting margins;
|
|
•
|
interest rate risks associated with our floating rate debt borrowings;
|
|
•
|
our ability to effectively distribute our products and the effectiveness and success of our distribution arrangements, including the impact of our arrangements with Walgreens;
|
|
•
|
our ability to effectively promote our own products and those of our co-promotion partners, such as Doptelet
®
(Dova Pharmaceuticals, Inc.) and Lucemyra
TM
(US WorldMeds, LLC);
|
|
•
|
the success of our fulfillment arrangements with Walgreens, including market acceptance of, or market reaction to, such arrangements (including by customers, doctors, patients, PBMs, third-party payors and governmental agencies), the continued compliance of such arrangements with applicable laws, and our ability to successfully negotiate any improvements to our arrangements with Walgreens;
|
v
|
•
|
our ability to secure and maintain third-party research, development, manufacturing, licensing, marketing or distribution arrangements;
|
|
•
|
the risk that our products could cause, or be alleged to cause, personal injury and adverse effects, leading to potential lawsuits, product liability claims and damages and/or recalls or withdrawals of products from the market;
|
|
•
|
the mandatory or voluntary recall or withdrawal of our products from the market and the costs associated therewith;
|
|
•
|
the availability of, and our ability to obtain and maintain, adequate insurance coverage and/or our ability to cover or insure against the total amount of the claims and liabilities we face, whether through third-party insurance or self-insurance;
|
|
•
|
the difficulty in predicting the expense, timing and outcome within our legal and regulatory environment, including with respect to approvals by the FDA, Health Canada and similar agencies in other countries, legal and regulatory proceedings and settlements thereof, the protection afforded by our patents and other intellectual and proprietary property, successful generic challenges to our products and infringement or alleged infringement of the intellectual property of others;
|
|
•
|
the results of continuing safety and efficacy studies by industry and government agencies;
|
|
•
|
the success of preclinical and clinical trials for our drug development pipeline or delays in clinical trials that adversely impact the timely commercialization of our pipeline products, as well as other factors impacting the commercial success of our products, which could lead to material impairment charges;
|
|
•
|
the results of management reviews of our research and development portfolio (including following the receipt of clinical results or feedback from the FDA or other regulatory authorities), which could result in terminations of specific projects which, in turn, could lead to material impairment charges;
|
|
•
|
the seasonality of sales of certain of our products;
|
|
•
|
declines in the pricing and sales volume of certain of our products that are distributed or marketed by third parties, over which we have no or limited control;
|
|
•
|
compliance by the Company or our third party partners and service providers (over whom we may have limited influence), or the failure of our Company or these third parties to comply, with health care “fraud and abuse” laws and other extensive regulation of our marketing, promotional and business practices (including with respect to pricing), worldwide anti-bribery laws (including the U.S. Foreign Corrupt Practices Act and the Canadian Corruption of Foreign Public Officials Act), worldwide economic sanctions and/or export laws, worldwide environmental laws and regulation and privacy and security regulations;
|
|
•
|
the impacts of the Patient Protection and Affordable Care Act, as amended by the Health Care and Education Reconciliation Act of 2010 (the “Health Care Reform Act”) and potential amendment thereof and other legislative and regulatory health care reforms in the countries in which we operate, including with respect to recent government inquiries on pricing;
|
|
•
|
the impact of any changes in or reforms to the legislation, laws, rules, regulation and guidance that apply to the Company and its business and products or the enactment of any new or proposed legislation, laws, rules, regulations or guidance that will impact or apply to the Company or its businesses or products;
|
|
•
|
the impact of changes in federal laws and policy under consideration by the Trump administration and Congress, including the effect that such changes will have on fiscal and tax policies, the potential revision of all or portions of the Health Care Reform Act, international trade agreements and policies and policy efforts designed to reduce patient out-of-pocket costs for medicines (which could result in new mandatory rebates and discounts or other pricing restrictions);
|
|
•
|
illegal distribution or sale of counterfeit versions of our products; and
|
|
•
|
interruptions, breakdowns or breaches in our information technology systems.
|
Additional information about these factors and about the material factors or assumptions underlying such forward-looking statements may be found elsewhere in this Form 10-K, under Item 1A. "Risk Factors" and in the Company's other filings with the SEC and the Canadian Securities Administrators (the “CSA”). When relying on our forward-looking statements to make decisions with respect to the Company, investors and others should carefully consider the foregoing factors and other uncertainties and potential events. These forward-looking statements speak only as of the date made. We undertake no obligation to update or revise any of these forward-looking statements to reflect events or circumstances after the date of this Form 10-K or to reflect actual outcomes, except as required by law. We caution that, as it is not possible to predict or identify all relevant factors that may impact
vi
forward-looking statements, the foregoing list of important factors that may affect future results is not exhaustive and should not be considered a complete statement of all potential risks and uncertainties.
vii
PART I
Item 1. Business
Biovail Corporation (“Biovail”) was formed under the
Business Corporations Act
(Ontario) on February 18, 2000, as a result of the amalgamation of TXM Corporation and Biovail Corporation International. Biovail was continued under the
Canada Business Corporations Act
effective June 29, 2005. In connection with the acquisition of Valeant Pharmaceuticals International in September 2010, Biovail was renamed “Valeant Pharmaceuticals International, Inc.”
Effective August 9, 2013, we continued from the federal jurisdiction of Canada to the Province of British Columbia, meaning that we became a company registered under the laws of the Province of British Columbia as if we had been incorporated under the laws of the Province of British Columbia. As a result of this continuance, our legal domicile became the Province of British Columbia, the Canada Business Corporations Act ceased to apply to us and we became subject to the British Columbia Business Corporations Act.
Effective on July 13, 2018, the Company changed its corporate name from Valeant Pharmaceuticals International, Inc. to Bausch Health Companies Inc.
Introduction
We are
a global company whose mission is to improve people’s lives with our health care products. We develop, manufacture and market, primarily in the therapeutic areas of eye-health, gastroenterology ("GI") and dermatology, a broad range of: (i) branded pharmaceuticals, (ii) generic and branded generic pharmaceuticals, (iii) over-the-counter (“OTC”) products and (iv) medical devices (contact lenses, intraocular lenses, ophthalmic surgical equipment and aesthetics devices) products.
Our portfolio of products falls into four operating and reportable segments: (i) Bausch + Lomb/International, (ii) Salix, (iii) Ortho Dermatologics and (iv) Diversified Products.
|
•
|
The Bausch + Lomb/International segment
consists of: (i) sales in the U.S. of pharmaceutical products, OTC products and medical device products, primarily comprised of Bausch + Lomb products, with a focus on the Vision Care, Surgical, Consumer and Ophthalmology Rx products and (ii) with the exception of sales of Solta products, sales in Canada, Europe, Asia, Australia, Latin America, Africa and the Middle East of branded pharmaceutical products, branded generic pharmaceutical products, OTC products, medical device products and Bausch + Lomb products.
|
|
•
|
The Salix segment
consists of sales in the U.S. of
GI products.
|
|
•
|
The Ortho Dermatologics
segment
consists of: (i) sales in the U.S. of Ortho Dermatologics (dermatological) products and (ii) global sales of Solta medical aesthetic devices.
|
|
•
|
The Diversified Products segment
consists of sales: (i) in the U.S. of pharmaceutical products in the areas of neurology and certain other therapeutic classes, (ii) in the U.S. of generic products, (iii) in the U.S. of dentistry products and (iv) of certain other businesses divested during 2017 that were not core to the Company's operations, including the Company's equity interests in Dendreon
Pharmaceuticals LLC (“Dendreon”)
(June 28, 2017) and Sprout
Pharmaceuticals, Inc. (“Sprout”)
(December 20, 2017). As a result of the divestitures of Dendreon and Sprout, the Company exited the oncology and women's health businesses, respectively.
|
For additional discussion of our reportable segments, see the discussion in Item 1 "Business - Segment Information" and
Note 22, "SEGMENT INFORMATION"
to our audited Consolidated Financial Statements for further details on these reportable segments.
Business Strategy
Our strategy is to focus our business on core therapeutic classes that offer attractive growth opportunities. Within our chosen therapeutic classes, we prioritize durable products which we believe have the potential for strong operating margins and evidence of growth opportunities. We have found and continue to believe there is significant opportunity in the: (i) eye-health, (ii) GI and (iii) dermatology businesses. We believe our existing portfolio, commercial footprint and pipeline of product development projects position us to successfully compete in these markets and provide us with the greatest opportunity to build value for our shareholders. We identify these businesses as “core”, meaning that we believe we are best positioned to grow and develop them.
As a result of the focus on our core businesses, the divestitures of businesses not aligned with our core business objectives and the loss of exclusivity for certain products in our Diversified Products segment, a greater portion of our revenues are now driven by our core businesses. In 2018, 2017 and 2016, our Bausch + Lomb, GI and dermatology revenues collectively represented
approximately
71%
,
67%
and
63%
of our total revenues, respectively. The increase in this percentage over this period demonstrates our commitment and the effectiveness of our business strategy in these businesses.
We believe we have a well-established product portfolio that is diversified within our core businesses and provides a sustainable revenue stream to fund our operations. Our continued success is dependent upon our ability to continually refresh our pipeline and bring new product solutions to the market that meet changing demands and replace other products that have lost momentum. We have a robust pipeline that we believe not only provides for the next generation of our existing products, but is also poised to bring new and innovative solutions to market. Our research and development (“R&D”) organization focuses on the development of products through clinical trials and as of December 31, 2018, included approximately
1,200
dedicated R&D and quality assurance employees in
23
R&D facilities.
Our pipeline of R&D projects includes certain products we have dubbed our "Significant Seven", which are products recently launched or expected to launch in the near future pending completion of testing and receipt of approval from the U.S. Food and Drug Administration (the
“
FDA
”
).
These Significant Seven products are: (i) Bryhali™ (Ortho Dermatologics), (ii) Duobrii™ (provisional name) (Ortho Dermatologics), (iii) Lumify
®
(Bausch + Lomb), (iv) Relistor
®
(Salix), (v) SiHy Daily (Bausch + Lomb), (vi) Siliq™ (Ortho Dermatologics) and (vii) Vyzulta
®
(Bausch + Lomb).
Although revenues associated with our Significant Seven products are currently not material, we believe the prospects for this group are substantial.
Although we primarily rely on our R&D organization to build-out and refresh our product portfolio, to supplement those efforts we continually seek out opportunities, such as co-promotions and strategic acquisitions, to leverage our commercial footprint, particularly our sales force, by strategically aligning ourselves with other innovative product solutions that, when coupled with our existing product portfolio, address specific needs in the market.
Segment Information
Our revenues for
2018, 2017 and 2016
were
$8,380 million
,
$8,724 million
and
$9,674 million
, respectively. We have approximately 1,500 products in our portfolio of products, which fall into four reportable segments: (i) Bausch + Lomb/International, (ii) Salix, (iii) Ortho Dermatologics and (iv) Diversified Products. Comparative segment information for
2018, 2017 and 2016
is presented in
Note 22, "SEGMENT INFORMATION"
to our audited Consolidated Financial Statements.
Bausch + Lomb/International
Revenues for our Bausch + Lomb/International segment for 2018, 2017 and 2016 were
$4,664 million
,
$4,795 million
and
$4,857 million
, respectively. Our Bausch + Lomb/International segment includes our Global Bausch + Lomb eye-health business and our International Rx business. Our Global Bausch + Lomb eye-health business includes our Vision Care, Surgical, Consumer and Ophthalmology Rx products, which in aggregate accounted for approximately 43%, 41% and 37% of our Company's revenues for 2018, 2017 and 2016, respectively. Our International Rx business, with the exception of our Solta business, includes sales in Canada, Europe, Asia, Australia, Latin America, Africa and the Middle East of branded pharmaceutical products, branded generic pharmaceutical products, OTC products and medical device products.
Our Bausch + Lomb business is a fully integrated eye-health business, which we believe is critical to maintaining our position in the global eye-health market. As a fully integrated eye-health business with a 165-year legacy, Bausch + Lomb has an established line of contact lenses, intraocular lenses and other medical devices, surgical systems and devices, vitamin and mineral supplements, lens care products, prescription eye-medications and other consumer products that positions us to compete in all areas of the eye-health market.
As part of our Global Bausch + Lomb business strategy, we continually look for key trends in the eye-health market to meet changing consumer/patient needs and identify areas for investment and growth. We continue to see increased demand for new eye-health products that address conditions brought on by factors such as increased screen time, lack of outdoor activities and academic pressures, as well as conditions brought on by an aging population (as more and more baby-boomers in the U.S. are reaching the age of 65). To supplement our well-established Bausch + Lomb product lines, we continue to identify for development new products tailored to address these key trends which we develop internally with our own R&D team to generate organic growth. Recent product launches include Biotrue
®
ONEday daily disposable contact lenses, the next generation of Bausch + Lomb ULTRA
®
contact lenses, SiHy Daily contact lenses, Lumify
®
(an eye redness treatment) and Vyzulta
®
(a pressure lowering eye drop for patients with angle glaucoma or ocular hypertension).
Our principal products in the Global Bausch + Lomb business include:
Vision Care
|
•
|
SofLens
®
Daily Disposable Contact Lenses use ComfortMoist
®
Technology (a combination of thin lens design and moisture-rich packaging solution) and High Definition Optics™ which is an aspheric design that reduces spherical aberration over a range of powers, especially in low light.
|
1
|
•
|
PureVision
®
is a silicone hydrogel frequent replacement contact lens using AerGel
®
technology lens material to allow natural levels of oxygen to reach the eye as well as resist protein buildup. The lens also incorporates an aspheric optical design that reduces spherical aberration.
|
|
•
|
Biotrue
®
ONEday daily disposable contact lenses are made of a unique material that works like the eye to form a dehydration barrier. The lens maintains over 98% of its moisture for up to 16 hours, it matches the water content of the cornea at 78%, and allows for the oxygen a healthy eye needs.
|
|
•
|
Biotrue
®
ONEday for Astigmatism is a daily disposable contact lens for astigmatic patients. The Biotrue
®
ONEday lenses incorporates Surface Active Technology
™
to provide a dehydration barrier. The Biotrue
®
ONEday for Astigmatism also includes evolved peri-ballast geometry to deliver stability and comfort for the astigmatic patient. We launched this product in December 2016 and launched the complete extended power range in 2017.
|
|
•
|
Bausch + Lomb ULTRA
®
is a silicone hydrogel frequent replacement contact lens that uses the proprietary MoistureSeal
®
technology which allows the contact lens to retain 95% of moisture after 16 hours of wear, limiting lens dryness and resulting symptoms.
|
|
•
|
Bausch + Lomb ULTRA
®
for Astigmatism is a monthly planned replacement contact lens for astigmatic patients. The Bausch + Lomb ULTRA
®
for Astigmatism lens was developed using the proprietary MoistureSeal
®
technology. In addition, the Bausch + Lomb ULTRA
®
for Astigmatism lens integrates an OpticAlign
™
design engineered for lens stability and to promote a successful wearing experience for the astigmatic patient. We launched this product and the extended power range for this product throughout 2017.
|
|
•
|
Bausch + Lomb ULTRA
®
for Presbyopia is a monthly planned replacement contact lens for presbyopic patients. The Bausch + Lomb ULTRA
®
for Presbyopia lens was developed using the proprietary MoistureSeal
®
technology. In addition, the Bausch + Lomb ULTRA
®
for Presbyopia lens integrates a 3 zone progressive design for near, intermediate and distance vision. We launched expanded parameters of this product throughout 2017.
|
Surgical
|
•
|
The Stellaris Elite
™
Vision Enhancement System is our next generation phacoemulsification cataract platform, which offers new innovations, as well as the opportunity to add upgrades and enhancements every one to two years. Stellaris Elite
™
is the first phacoemulsification platform on the market to offer Adaptive Fluidics
™
, which combines aspiration control with predictive infusion management to create a responsive and controlled surgical environment for efficient cataract lens removal. Our Stellaris Elite
™
Vision Enhancement System was launched in April 2017.
|
|
•
|
Vitesse
®
is a hypersonic vitrectomy system for the removal of the vitreous humor gel that fills the eye cavity to provide better access to the retina and allow for a variety of repairs, including the removal of scar tissue, laser repair of retinal detachments and treatment of macular holes. Available exclusively on the Stellaris Elite
™
system, Vitesse
®
liquefies tissue in a highly-localized zone at the edge of the port to increase the level of surgical control and precision to vitrectomies. We launched Vitesse
®
on a limited basis in October 2017.
|
|
•
|
A portfolio of ophthalmic surgical products, including: (i) intraocular lenses such as Akreos
®
, enVista
®
, Crystalens
®
and Trulign
®
, (ii) a suite of surgical instruments including Storz
®
and Synergetics
®
and (iii) surgical equipment for cataract, refractive, and vitreoretinal surgery, such as Stellaris
®
PC, a vitreoretinal and cataract surgery system, VersaVIT2.0 for vitreoretinal surgery and the VICTUS
®
femtosecond laser for cataract surgery.
|
Consumer
|
•
|
PreserVision
®
AREDS 2 is an eye vitamin formula for those with moderate-to-advanced age-related macular degeneration.
|
|
•
|
Ocuvite
®
is a vitamin and mineral supplement for the eye that contains lutein (an antioxidant carotenoid), a nutrient that supports macular health by helping filter harmful blue light.
|
|
•
|
Bausch + Lomb Renu
®
Advanced Formula multi-purpose solution was launched in 2017 and is a novel soft and silicone hydrogel contact lenses solution that makes use of three disinfectants and two moisture agents.
|
|
•
|
Biotrue
®
multi-purpose solution helps prevent certain tear proteins from denaturing and fights germs for healthy contact lens wear. Biotrue
®
multi-purpose solution uses a lubricant found in eyes and is pH balanced to match healthy tears.
|
|
•
|
Lumify
®
(brimonidine tartrate ophthalmic solution, 0.025%) is an OTC eye drop developed as an ocular redness reliever. Lumify
®
was launched in May 2018.
|
|
•
|
Boston
®
solution is a specialty cleansing solution design for gas permeable contact lenses.
|
2
|
•
|
Bausch + Lomb ScleralFil
®
solution is a novel contact lens care solution launched in 2017 that makes use of a preservative free buffered saline solution for use with the insertion of scleral lenses.
|
Ophthalmology Rx
|
•
|
Lotemax
®
Gel is a topical corticosteroid indicated for the treatment of inflammation and pain following ocular surgery. This formulation is a technology that allows the drug to adhere to the ocular surface and offers dose uniformity, which eliminates the need to shake the product in order to ensure the drug is in suspension. The product contains a low concentration of preservative and two known moisturizers.
|
|
•
|
Vyzulta
®
(latanoprostene bunod ophthalmic solution, 0.024%) is an intraocular pressure lowering single-agent eye drop dosed once daily for patients with open angle glaucoma or ocular hypertension and was launched in December 2017.
|
Salix
The Salix segment consists of sales in the U.S. of gastrointestinal or GI products and includes Xifaxan
®
which accounted for approximately 14%, 11% and 10% of our total revenues for 2018, 2017 and 2016, respectively. Salix revenues were
$1,749 million
,
$1,566 million
and
$1,530 million
for 2018, 2017 and 2016, respectively.
As part of our acquisition of Salix Pharmaceutical, Ltd. in 2015, we acquired the intellectual property to a number of products which have provided us with year over year revenue growth, particularly the intellectual properties behind Xifaxan
®
for irritable bowel syndrome with diarrhea (“IBS-D”) and Relistor
®
for opioid induced constipation (“OIC”). Recognizing the growth opportunities in these products, we initiated a significant sales force expansion program in December 2016 to aggressively reach out to potential primary care physician (“PCP”) prescribers of Xifaxan
®
and Relistor
®
tablets. This sales force expansion program met our objectives as revenues from our Xifaxan
®
and Relistor
®
products increased approximately
22%
and
37%
, respectively, in 2018 when compared to 2017.
Because we strongly believe in our Xifaxan
®
and Relistor
®
business models, we have taken initiatives to further capitalize on the value of the infrastructure we built around these products. For instance, in order to continue to generate growth in these products, we continue to directly invest in next generation formulations of Xifaxan
®
and rifaximin, the principal semi-synthetic antibiotic used in our Xifaxan
®
product. In addition to one R&D program in progress, we have three other R&D programs planned to start in 2019 for next generation formulations of Xifaxan
®
and rifaximin which address new indications.
In addition to driving growth through internal R&D development opportunities, we strive to access other products outside our existing Salix business that allow us to leverage our existing GI sales force, supply channel and distribution channel to bring about growth through co-promotion and acquisition. For instance, in the second half of 2018, we entered into agreements with Dova Pharmaceuticals, Inc. to co-promote Doptelet
®
, a new treatment of thrombocytopenia in adult patients with chronic liver disease, and with US WorldMeds, LLC to co-promote Lucemyra™, a non-opioid medication for the mitigation of withdrawal symptoms to facilitate abrupt discontinuation of opioids. We are also pursuing the acquisition of Synergy Pharmaceuticals Inc. (“Synergy”) as the “stalking horse” bidder in a bankruptcy court supervised auction and sale process expected to be completed in March 2019. If successful, we will acquire certain assets of Synergy including its worldwide rights to the Trulance
®
(plecanatide) product, a once-daily tablet for adults with chronic idiopathic constipation and irritable bowel syndrome with constipation. We believe these co-promotion and acquisition opportunities will be accretive to our business by providing us access to products that are a natural pairing to either our Xifaxan
®
or Relistor
®
businesses, allowing us to effectively leverage our existing infrastructure and generate growth.
Our principal products in the Salix segment (including products of our third-party co-promotion partners) include:
|
•
|
Xifaxan
®
which includes: (i) tablets indicated for the treatment of IBS-D in adults and for the reduction in risk of overt hepatic encephalopathy recurrence in adults and (ii) tablets indicated for the treatment of travelers’ diarrhea caused by noninvasive strains of Escherichia coli in patients 12 years of age and older.
|
|
•
|
Relistor
®
(methylnaltrexone) is given to adults who use narcotic medicine to treat severe chronic pain that is not caused by cancer to prevent constipation without reducing the pain-relieving effects of the narcotic.
|
|
•
|
Apriso
®
is an aminosalicylate anti-inflammatory drug used to treat ulcerative colitis, proctitis and proctosigmoiditis. Apriso is also used to prevent the symptoms of ulcerative colitis from recurring.
|
|
•
|
Glumetza
®
(metformin hydrochloride) extended release tablets are indicated as an adjunct to diet and exercise to improve glycemic control in adults with type 2 diabetes mellitus.
|
|
•
|
Plenvu
®
is a novel, lower-volume polyethylene glycol-based bowel preparation developed to help provide complete bowel cleansing, with an additional focus on the ascending colon. Plenvu
®
was launched in September 2018.
|
3
|
•
|
Doptelet
®
(avatrombopag) is a new treatment of thrombocytopenia in adult patients with chronic liver disease whom are scheduled to undergo a procedure, which we are co-promoting through a partnership with Dova Pharmaceuticals, Inc.
|
|
•
|
Lucemyra™ (lofexidine) is a non-opioid medication for the mitigation of withdrawal symptoms to facilitate abrupt discontinuation of opioids in adults, which we are co-promoting through a partnership with US WorldMeds, LLC.
|
Ortho Dermatologics
The Ortho Dermatologics segment consists of: (i) sales in the U.S. of Ortho Dermatologics (dermatological products) and (ii) global sales of Solta medical dermatological devices. Ortho Dermatologics revenues were
$625 million
,
$725 million
and
$949 million
for 2018, 2017 and 2016, respectively.
In 2017, we retained a proven leadership team of experienced dermatology sales professionals and marketers and rebranded our dermatology business as Ortho Dermatologics, as part of a larger rebranding initiative for our dermatology business. In January 2018, the leadership team increased our Ortho Dermatologics sales force by more than 25% in support of our growth initiatives for our Ortho Dermatologics business. We believe the additional sales force is vital to meet the demand we expect from our recently launched products and those we expect to launch in the near term, pending FDA approval.
We have made significant investments to build out our psoriasis and acne product portfolios, which are the markets within dermatology where we see the greatest opportunities, with a focus on topical gel and lotion products over injectable biologics. We continue to support and develop injectable biologics; however, we believe some patients prefer topical products as an alternative delivery method to injectable biologics. Further, as topical products can, in many cases, defer the use of injectable biologics and need not be administered by a certified biologic physician, a topical product is usually more cost-effective and better supported by managed care payors over its alternative injectable biologic product. Therefore, we believe topical products represent significant innovation for physicians, payors and patients, and as the preferred choice of treatment, have the potential to drive greater volumes, generate better margins and will ultimately be a key contributing factor of our Ortho Dermatologics business.
In addition to our established and in development product lines, we also look to gain access to other dermatology products through strategic licensing agreements. We believe this allows us to leverage our experienced dermatology sales leadership team and our recently expanded Ortho Dermatologics sales force to drive growth in our Ortho Dermatologics business.
Our principal products in the Ortho Dermatologics segment include:
|
•
|
Targretin
®
(bexarotene) capsules and gel are prescription medicines used to treat the skin problems arising from the disease cutaneous T-cell lymphoma, or CTCL, in patients who have not responded well to other treatments.
|
|
•
|
Bryhali™ was launched in November 2018 and is a novel product that contains a unique, lower concentration of halobetasol propionate for the treatment of moderate-to-severe psoriasis.
|
|
•
|
Jublia
®
(efinaconazole 10% topical solution) is a topical azole approved for the treatment of onychomycosis of the toenails (toenail fungus).
|
|
•
|
Siliq™ was launched in the U.S. in 2017 and is an IL-17 receptor blocker monoclonal antibody for patients with moderate-to-severe plaque psoriasis.
|
|
•
|
Elidel
®
is used to treat certain skin conditions such as eczema (atopic dermatitis), which is an allergic-type condition that causes red, irritated and itchy skin.
|
|
•
|
Zovirax
®
is an antiviral prescription medicine that is used to treat cold sores on the lips and around the mouth only, in patients 12 years of age and older with normal immune systems. Applied directly to the infected area, Zovirax
®
stops the cold sore virus from multiplying by fighting the virus itself.
|
|
•
|
Altreno™ (tretinoin 0.05%) was launched in the U.S. in October 2018 and is a lotion approved for the topical treatment of acne vulgaris in patients 9 years of age and older.
|
|
•
|
An Acne franchise, which includes Solodyn
®
, a prescription oral antibiotic approved to treat only the red, pus-filled pimples of moderate to severe acne in patients 12 years of age and older, as well as Retin-A
®
, Ziana
®
, Clindagel
®
, Acanya
®
, Atralin
®
, and Onexton
®
Gel, a fixed combination 1.2% clindamycin phosphate and 3.75% benzoyl peroxide medication for the once-daily treatment of comedonal (non-inflammatory) and inflammatory acne in patients 12 years of age and older.
|
|
•
|
Medical device systems for aesthetic applications, including the Thermage
®
, that provides non-invasive treatment options using radiofrequency energy for skin tightening.
|
4
Diversified Products
The Diversified Products segment consists of sales: (i) in the U.S. of pharmaceutical products in the areas of neurology and certain other therapeutic classes, (ii) in the U.S. of generic products, (iii) in the U.S. of dentistry products and (iv) of certain other businesses divested during 2017 that were not core to the Company's operations, including the Company's equity interests in Dendreon (June 28, 2017) and Sprout (December 20, 2017). As a result of the divestitures of Dendreon and Sprout, the Company exited the oncology and women's health businesses, respectively. Diversified Products revenues were
$1,342 million
,
$1,638 million
and
$2,338 million
for 2018, 2017 and 2016, respectively. Our principal products in this segment include:
Pharmaceutical
|
•
|
Wellbutrin XL
®
is an extended release formulation of bupropion indicated for the treatment of major depressive disorder in adults.
|
|
•
|
Cuprimine
®
is a treatment for Wilson's disease (a condition in which high levels of copper in the body cause damage to the liver, brain, and other organs), cystinuria (a condition which leads to cystine stones in the kidneys) and for patients with severe rheumatoid arthritis who have failed to respond to an adequate trial of conventional therapy.
|
|
•
|
Migranal
®
(dihydroergotamine mesylate) Nasal Spray is used to treat an active migraine headache with or without aura.
|
|
•
|
Ativan
®
(lorazepam) is indicated for the management of anxiety disorders or for the short-term relief of the symptoms of anxiety or anxiety associated with depressive symptoms.
|
|
•
|
Xenazine
®
is indicated for the treatment of chorea associated with Huntington’s disease. In the U.S., Xenazine
®
is distributed for us by Lundbeck LLC under an exclusive marketing, distribution and supply agreement.
|
|
•
|
Syprine
®
is a treatment for Wilson's disease in patients who cannot take the medication known as penicillamine.
|
|
•
|
Aplenzin
®
(bupropion hydrobromide extended release tablets) is indicated for the treatment of major depressive disorder, and for the prevention of seasonal major depressive episodes in patients with a diagnosis of seasonal affective disorder.
|
|
•
|
Isuprel
®
(Isoproterenol hydrochloride) injections is indicated for: (i) mild or transient episodes of heart block that do not require electric shock or pacemaker therapy, (ii) for serious episodes of heart block and Adams-Stokes attacks (except when caused by ventricular tachycardia or fibrillation), (iii) for use in cardiac arrest until electric shock or pacemaker therapy, the treatments of choice, is available and (iv) for bronchospasm occurring during anesthesia.
|
Generics
|
•
|
Diastat
®
(diazepam rectal gel) is a gel formulation of diazepam intended for rectal administration for certain patients with epilepsy who are already taking antiepileptic medications, and who require occasional use of diazepam to control bouts of increased seizure activity.
|
|
•
|
Uceris
®
(budesonide) extended release tablets are a prescription corticosteroid medicine used to help get mild to moderate ulcerative colitis under control (induce remission).
|
|
•
|
Zegerid
®
is used to treat certain stomach and esophagus problems (such as acid reflux and ulcers) by decreasing the amount of acid your stomach makes. It belongs to a class of drugs known as proton pump inhibitors.
|
Dentistry
|
•
|
Arestin
®
(minocycline hydrochloride) is a subgingival sustained-release antibiotic. Arestin
®
is indicated as an adjunct to scaling and root planing ("SRP") procedures for reduction of pocket depth in patients with adult periodontitis. Arestin
®
may be used as part of a periodontal maintenance program, which includes good oral hygiene and SRP.
|
|
•
|
NeutraSal
®
is indicated for dryness of the mouth (hyposalivation, xerostomia) and dryness of the oral mucosa due to drugs that suppress salivary secretion.
|
Research and Development
Our R&D organization focuses on the development of products through clinical trials. Currently, we have over
250
R&D projects in our pipeline.
As of December 31, 2018
, approximately
1,200
dedicated R&D and quality assurance employees in
23
R&D facilities were involved in our R&D efforts.
Our R&D expenses for 2018, 2017 and 2016, were
$413 million
,
$361 million
and
$421 million
, respectively. R&D expenses as a percentage of revenue were
5%
in 2018 as compared to
4%
in 2017 and
4%
in 2016. As part of our turnaround, we removed
5
projects related to divested businesses and rebalanced our portfolio to better align with our long-term plans and focus on core businesses. Our investment in R&D reflects our commitment to drive organic growth through internal development of new products, a pillar of our new strategy, and also reflects our investment in our Significant Seven as previously discussed.
For more information regarding our products in clinical development, see Item 7 “Management’s Discussion and Analysis of Financial Condition and Results of Operations — Overview — Our Transformation” of this Form 10-K.
Trademarks, Patents and Proprietary Rights
We rely on a combination of contractual provisions, confidentiality policies and procedures and patent, trademark, copyright and trade secrecy laws to protect the proprietary aspects of our technology and business. Our policy is to vigorously protect, enforce and defend our rights to our intellectual property and proprietary rights, as appropriate. See Item 1A “Risk Factors” of this Form 10-K for additional information on the risks associated with our intellectual property and proprietary rights.
Trademarks
We believe that trademark protection is an important part of establishing product and brand recognition. We own or license a number of registered trademarks and trademark applications in the U.S., Canada and in various other countries throughout the world. U.S. federal registrations for trademarks remain in force for 10 years and may be renewed every 10 years after issuance, provided the mark is still being used in commerce. Trademark registrations in Canada currently remain in force for 15 years and may be renewed every 15 years after issuance, provided that, as in the case of U.S. federal trademark registrations, the mark is still being used in commerce. Other countries generally have similar but varying terms and renewal policies with respect to trademarks registered in those countries.
Data and Patent Exclusivity
For certain of our products, we rely on a combination of regulatory and patent rights to protect the value of our investment in the development of these products.
A patent is the grant of a property right which allows its holder to exclude others from, among other things, selling the subject invention in, or importing such invention into, the jurisdiction that granted the patent. In the U.S., Canada and the European Union (“EU”), generally patents expire 20 years from the date of application. We have obtained, acquired or in-licensed a number of patents and patent applications covering key aspects of certain of our principal products. In the aggregate, our patents are of material importance to our business taken as a whole.
In the U.S., the Hatch-Waxman Act provides non-patent regulatory exclusivity for five years from the date of the first FDA approval of a new drug compound in a New Drug Application (“NDA”). The FDA, with one exception, is prohibited during those five years from accepting for filing a generic, or Abbreviated New Drug Application (“ANDA”), that references the NDA. In reference to the foregoing exception, if a patent is indexed in the FDA Orange Book for the new drug compound, a generic may file an ANDA four years from the NDA approval date if it also files a Paragraph IV Certification with the FDA challenging the patent. Protection under the Hatch-Waxman Act will not prevent the filing or approval of another full NDA. However, the NDA applicant would be required to conduct its own pre-clinical and adequate and well-controlled clinical trials to independently demonstrate safety and effectiveness.
A similar data exclusivity scheme exists in the EU, whereby only the pioneer drug company can use data obtained at the pioneer’s expense for up to eight years from the date of the first approval of a drug by the European Medicines Agency (“EMA”) and no generic drug can be marketed for ten years from the approval of the innovator product. Under both the U.S. and the EU data exclusivity programs, products without patent protection can be marketed by others so long as they repeat the clinical trials necessary to show safety and efficacy.
In the U.S., the Biologics Price Competition and Innovation Act ("BPCIA") allows companies to seek FDA approval to manufacture and sell biosimilar or interchangeable versions of brand name biological products. Due to the size and complexity of biological products, as compared to small molecule drugs, a biosimilar must be “highly similar” to the reference product with “no clinically meaningful differences” in safety, purity and potency between the two. The BPCIA provides reference product sponsors with 12 years (potential for 6 additional months of pediatric exclusivity) of market exclusivity, but unlike the Hatch-Waxman Act which covers small molecules, it does not require reference product sponsors to list patents in an Orange Book equivalent and does not include an automatic 30-month stay of FDA approval upon the timely filing of a lawsuit. The BPCIA, however, does provide pre-litigation procedures for the parties to follow, including identification of relevant patents and each party’s basis for infringement and invalidity. A biosimilar patent application cannot be filed until four years after the reference product is first licensed and a biosimilar cannot be launched, at the earliest (assumes no patent litigation or an adverse decision on all patents), until the expiration of the twelve years of data exclusivity from the approval of the reference product.
6
Under the Orphan Drug Act, the FDA may designate a product as an orphan drug if it is a drug intended to treat a disease or condition that affects populations of fewer than 200,000 individuals in the U.S. or a disease whose incidence rates number more than 200,000 where the sponsor establishes that it does not realistically anticipate that its product sales will be sufficient to recover its costs. The sponsor that obtains the first marketing approval for a designated orphan drug for a given rare disease is eligible to receive marketing exclusivity for use of that drug for the orphan indication for a period of seven years.
In Canada, the Patented Medicines (Notice of Compliance) Regulations (“PM(NOC) Regulations”) create a regime analogous to the U.S. Hatch-Waxman Act, and link the regulatory approval process for generic and biosimilar drugs to the adjudication of innovator patent rights. To be eligible for protection under the PM(NOC) Regulations, patents must first be listed on the Patent Register in connection with an innovator’s drug submission to Health Canada. A generic or biosimilar manufacturer must then provide notice to the innovator of its plans to market a drug that it compared to the innovator’s patented drug in the Health Canada approval process. Within 45 days of receiving such a notice of allegation, an innovator drug company may commence patent infringement proceedings against the generic or biosimilar manufacturer. The commencement of an action by the innovator under the PM(NOC) Regulations may stay Health Canada’s regulatory approval of the generic or biosimilar drug for a period of 24 months.
Canada also employs a data exclusivity regime for innovative drugs that provides an eight-year period of data protection from the date of market approval by Health Canada. An additional six months of data exclusivity is provided for drugs studied in clinical trials relating to use in pediatric populations. Drug submissions seeking approval based on a comparison to an innovative drug cannot be filed during the first six years of the data exclusivity period. Generic or biosimilar drug submissions remain on hold until expiry of the innovator’s data protection term, unless the innovative product is a patented drug subject to further protection under the PM(NOC) Regulations. Canada has no distinct drug submission process for biosimilar or orphan drug products.
Proprietary Know-How
We also rely upon unpatented proprietary know-how, trade secrets and technological innovation in the development and manufacture of many of our principal products. We protect our proprietary rights through a variety of methods, including confidentiality and non-disclosure agreements and proprietary information agreements with vendors, employees, consultants and others who may have access to proprietary information.
Government Regulations
Government authorities in the U.S., at the federal, state and local level, in Canada, in the EU and in other countries extensively regulate, among other things, the research, development, testing, approval, manufacturing, labeling, post-approval monitoring and reporting, packaging, advertising and promotion, storage, distribution, marketing and export and import of pharmaceutical products and medical devices. As such, our products and product candidates are subject to extensive regulation both before and after approval. The process of obtaining regulatory approvals and the subsequent compliance with applicable federal, state, local and foreign statutes and regulations require the expenditure of substantial time and financial resources. Failure to comply with these regulations could result in, among other things, warning letters, civil penalties, delays in approving or refusal to approve a product candidate, product recall, product seizure, interruption of production, operating restrictions, suspension or withdrawal of product approval, injunctions or criminal prosecution.
Prior to human use, FDA approval (drugs (in the form of an NDA or ANDA for generic equivalents), biologics (in the form of a Biologics License Application (“BLA”)) and some medical devices) or marketing clearance (other devices) must be obtained in the U.S., approval by Health Canada must be obtained in Canada, EMA approval (drugs) or a CE Marking (devices) must be obtained for countries that are part of the EU and approval must be obtained from comparable agencies in other countries prior to manufacturing or marketing new pharmaceutical products or medical devices. Generally, preclinical studies and clinical trials of the products must first be conducted and the results submitted to the applicable regulatory agency (such as the FDA) for approval.
Regulation by other federal agencies, such as the Drug Enforcement Administration (“DEA”), and state and local authorities in the U.S., and by comparable agencies in certain foreign countries, is also required. In the U.S., the Federal Trade Commission (the “FTC”), the FDA and state and local authorities regulate the advertising of medical devices, prescription drugs, OTC drugs and cosmetics. The Federal Food, Drug and Cosmetic Act, as amended and the regulations promulgated thereunder, and other federal and state statutes and regulations, govern, among other things, the testing, manufacture, safety, effectiveness, labeling, storage, record keeping, approval, sale, distribution, advertising and promotion of our products. The FDA requires a Boxed Warning (sometimes referred to as a “Black Box” Warning) for products that have shown a significant risk of severe or life-threatening adverse events and similar warnings are also required to be displayed on the product in certain other jurisdictions.
Manufacturers of pharmaceutical products and medical devices are required to comply with manufacturing regulations, including current good manufacturing practices and quality system management requirements, enforced by the FDA and Health Canada, in the U.S. and Canada respectively, and similar regulations enforced by regulatory agencies in other countries and we
7
face annual audits of our facilities and plants and those of our contract manufacturers by the FDA and such other regulatory agencies. In addition, we are subject to price control restrictions on our pharmaceutical products in many countries in which we operate.
We are also subject to extensive U.S. federal and state health care marketing and fraud and abuse regulations, such as the federal False Claims Act, federal and provincial marketing regulation in Canada and similar regulations in foreign countries in which we may conduct our business. The federal False Claims Act imposes civil and criminal liability on individuals or entities who submit (or cause the submission of) false or fraudulent claims for payment to the government. The U.S. federal Anti-Kickback Statute prohibits persons or entities from knowingly and willfully soliciting, receiving, offering or providing remuneration, directly or indirectly, to induce either the referral of an individual, or the furnishing, recommending, or arranging for a good or service, for which payment may be made under a federal or state health care program such as the Medicare and Medicaid programs. Some state anti-kickback laws also prohibit such conduct where commercial insurance, rather than federal or state, programs are involved. Due to recent legislative changes, violations of the U.S. federal Anti-Kickback Statute also carry potential federal False Claims Act liability. In addition, in the U.S. and Canada, companies may not promote drugs or medical devices for “off-label” uses - that is, uses that are not described in the product’s labeling and that differ from those that were approved or cleared by the FDA or Health Canada, respectively - and “off-label promotion” in the U.S. has also formed the predicate for False Claims Act liability resulting in significant financial settlements. These and other laws and regulations, rules and policies may significantly impact the manner in which we are permitted to market our products. If our operations are found to be in violation of any of these laws, regulations, rules or policies or any other law or governmental regulation, or if interpretations of the foregoing change, we may be subject to civil and criminal penalties, damages, fines, exclusion from the Medicare and Medicaid programs and the curtailment or restructuring of our operations.
We may also be subject to various privacy and security regulations, including, but not limited to, the Health Insurance Portability and Accountability Act of 1996, as amended by the Health Information Technology for Economic and Clinical Health Act of 2009 (collectively, "HIPAA"). HIPAA mandates, among other things, the adoption of uniform standards for the electronic exchange of information in common health care transactions (e.g., health care claims information and plan eligibility, referral certification and authorization, claims status, plan enrollment, coordination of benefits and related information), as well as standards relating to the privacy and security of individually identifiable health information. These standards require the adoption of administrative, physical and technical safeguards to protect such information. In addition, many states have enacted comparable laws addressing the privacy and security of health information, some of which are more stringent than HIPAA. Complying with these laws involves costs to our business, and failure to comply with these laws can result in the imposition of significant civil and criminal penalties.
Successful commercialization of our products may depend, in part, on the availability of governmental and third-party payor reimbursement for the cost of our products. Third-party payors may include government health administration authorities, private health insurers and other organizations. In the U.S., the E.U. and other significant or potentially significant markets for our products and product candidates, government authorities and third-party payors are increasingly attempting to limit or regulate the price of medical products and services, which has resulted in lower average realized prices. In the U.S., these pressures can arise from rules and practices of managed care groups, judicial decisions and governmental laws and regulations related to Medicare, Medicaid and health care reform, pharmaceutical reimbursement policies and pricing in general. In particular, sales of our products may be subject to discounts from list price and rebate obligations, as well as formulary coverage decisions impacting or limiting the types of patients for whom coverage will be provided. Various U.S. health care and other laws regulate our interactions with government agencies, private insurance companies and other third-party payors regarding coverage and reimbursement for our products. Failure to comply with these laws could subject us to civil, criminal and administrative sanctions. In countries outside the U.S., the success of our products may depend, at least in part, on obtaining and maintaining government reimbursement because, in many countries, patients are unlikely to use prescription drugs that are not reimbursed by their governments. In addition, negotiating prices with certain governmental authorities for newly developed products can delay commercialization. In Canada and many international markets, governments control the prices of prescription pharmaceuticals, including through the implementation of reference pricing, price cuts, rebates, revenue-related taxes, tenders and profit control, and they expect prices of prescription pharmaceuticals to decline over the life of the product or as volumes increase.
See Item 1A “Risk Factors” of this Form 10-K for additional information on the risks associated with these regulations and related matters.
Environmental and Other Regulation
Our facilities and operations are subject to federal, state and local environmental and occupational health and safety laws and regulations in both the U.S. and countries outside the U.S. (including Canada), including those governing the discharges of substances into the air, water and land, the handling treatment, storage and disposal of hazardous substances and wastes, wastewater and solid waste, the cleanup of contaminated properties and other environmental matters. Certain of our development and manufacturing activities involve the use of hazardous substances. We believe we are in compliance in all material respects with
8
applicable environmental and occupational health and safety laws and regulations. We are not aware of any pending environmental or and occupational health and safety litigation or significant liabilities that are likely to have a material adverse effect on our financial position. We cannot assure, however, that environmental liabilities relating to us or facilities owned, leased or operated by us will not develop in the future, and we cannot predict whether any such liabilities, if they were to develop, would require significant expenditures on our part. In addition, we are unable to predict what environmental or and occupational health and safety legislation or regulations may be adopted or enacted in the future. See Item 1A “Risk Factors” of this Form 10-K for additional information.
Customers and Marketing
In
2018
the
U.S. and Puerto Rico
accounted for
60%
of our total revenue. No other country accounted for more than 5%. See
Note 22, "SEGMENT INFORMATION"
to our audited Consolidated Financial Statements for revenues by geographic area.
Customers that accounted for 10% or more of our total revenue for
2018
,
2017
and
2016
are as follows:
|
2018
|
2017
|
2016
|
||||
|
AmerisourceBergen Corporation
|
18%
|
15%
|
13%
|
|||
|
McKesson Corporation
|
18%
|
19%
|
21%
|
|||
|
Cardinal Health, Inc.
|
13%
|
13%
|
15%
|
|||
We currently promote our pharmaceutical products to physicians, hospitals, pharmacies and wholesalers through our own sales force and sell through wholesalers. In some markets, we additionally sell directly to physicians, hospitals and large drug store chains and we sell through distributors in countries where we do not have our own sales staff. As part of our marketing program for pharmaceuticals, we use direct to customer advertising, direct mailings, advertise in trade and medical periodicals, exhibit products at medical conventions and sponsor medical education symposia.
Competition
Competitive Landscape for Products and Products in Development
The pharmaceutical and medical device industries are highly competitive. Our competitors include specialty and other large pharmaceutical companies, medical device companies, biotechnology companies, OTC companies and generic manufacturers, in the U.S., Canada, Europe, Asia, Latin America, Middle East, Africa and in other countries in which we market our products. The dermatology competitive landscape is highly fragmented, with a large number of mid-size and smaller companies competing in both the prescription sector and the OTC and cosmeceutical sectors. With respect to the GI market, generic entrants continue to capture significant share for treatment of many GI conditions. In the area of irritable bowel syndrome ("IBS") and OIC, competitors have recently launched new competing products, which should increase the size of these markets and intensify competition. The market for Bausch + Lomb products is very competitive, both across product categories and geographies. In addition to larger diversified pharmaceutical and medical device companies, we face competition in the eye-health market from mid-size and smaller, regional and entrepreneurial companies with fewer products in niche areas or regions.
Our competitors are pursuing the development and/or acquisition of pharmaceuticals, medical devices and OTC products that target the same diseases and conditions that we are targeting in dermatology, GI, eye-health and other therapeutic areas. Academic and other research and development institutions may also develop products or technologies that compete with our products, which technologies and products may be acquired or licensed by our competitors. These competitors may have greater financial, R&D or marketing resources than we do. If competitors introduce new products, delivery systems or processes with therapeutic or cost advantages, our products can be subject to progressive price reductions or decreased volume of sales, or both. Most new products that we introduce must compete with other products already on the market or products that are later developed by competitors.
We sell a broad range of products, and competitive factors vary by product line and geographic area in which the products are sold. The principal methods of competition for our products include quality, efficacy, market acceptance, price, and marketing and promotional efforts.
Generic Competition and Loss of Exclusivity
We face increased competition from manufacturers of generic pharmaceutical products when patents covering certain of our currently marketed products expire or are successfully challenged or when the regulatory exclusivity for our products expires or is otherwise lost. Generic versions are generally significantly less expensive than branded versions, and, where available, may be required to be utilized before or in preference to the branded version under third-party reimbursement programs, or substituted
9
by pharmacies. Accordingly, when a branded product loses its market exclusivity, it normally faces intense price competition from generic forms of the product. To successfully compete for business with managed care and pharmacy benefits management organizations, we must often demonstrate that our products offer not only medical benefits, but also cost advantages as compared with other forms of care.
For details regarding products that are facing generic competition, products that are potentially facing generic competition, the corresponding potential revenue impact and infringement proceedings we initiated against potential generic competition, see Item 7 “Management’s Discussion and Analysis of Financial Condition and Results of Operations — Overview — Our Transformation” of this Form 10-K. See
Note 20, "LEGAL PROCEEDINGS"
to our audited Consolidated Financial Statements for further details regarding certain infringement proceedings. See Item 1A “Risk Factors” of this Form 10-K for additional information on our competition risks.
Manufacturing
We currently operate approximately 38 manufacturing plants worldwide. All of our manufacturing facilities that require certification from the FDA, Health Canada or foreign agencies have obtained such approval.
We also subcontract the manufacturing of certain of our products, including products manufactured under the rights acquired from other pharmaceutical companies. Products representing approximately 40% of our product sales for
2018
are produced in total, or in part, by third-party manufacturers under manufacturing arrangements.
In some cases, the principal raw materials, including active pharmaceutical ingredient, used by us (or our third-party manufacturers) for our various products are purchased in the open market or are otherwise available from several sources. However, some of the active pharmaceutical ingredients and other raw materials used in our products and some of the finished products themselves are currently only available from a single source; or others may in the future become available from only one source. For example, with respect to some of our largest or most significant products, the supply of the finished product for each of our Siliq
™
, Vyzulta
®
, SofLens
®
, Wellbutrin XL
®
, Ocuvite
®
, PreserVision
®
, Renu
®
, Isuprel
®
, Xenazine
®
, Uceris
®
tablet, Relistor
®
Oral and PureVision
®
products are only available from a single source and the supply of active pharmaceutical ingredient for each of our Siliq
™
,
Isuprel
®
, Xenazine
®
, Relistor
®
Oral and Uceris
®
tablet products are also only available from a single source. Any disruption in the supply of any such single-sourced active pharmaceutical ingredient, other raw material or finished product or an increase in the cost of such materials or products could adversely impact our ability to manufacture or sell such products, the ability of our third-party manufacturers to supply us with such products, or our profitability. We attempt to manage the risks associated with reliance on single sources of active pharmaceutical ingredient, other raw materials or finished products by carrying additional inventories or, where possible, developing second sources of supply. See Item 1A “Risk Factors” of this Form 10-K for additional information on the risks associated with our manufacturing arrangements.
Employees
As of December 31, 2018
, we had approximately 21,100 employees. These employees included approximately 10,900 in production, 7,400 in sales and marketing, 1,600 in general and administrative positions and
1,200
in R&D. Collective bargaining exists for some employees in a number of countries in which we do business. We consider our relations with our employees to be good and have not experienced any work stoppages, slowdowns or other serious labor problems that have materially impeded our business operations.
Product Liability Insurance
Since March 31, 2014, we have self-insured substantially all of our product liability risk for claims arising after that date. In the future, we will continue to re-evaluate our decision to self-insure and may purchase additional product liability insurance to cover product liability risk. See Item 1A “Risk Factors” of this Form 10-K for additional information.
Seasonality of Business
Historically, revenues from our business tend to be weighted toward the second half of the year. Sales in the first quarter tend to be lower as patient co-pays and deductibles reset at the beginning of each year. Sales in the fourth quarter tend to be higher based on consumer and customer purchasing patterns associated with health care reimbursement programs. However, there are no assurances that these historical trends will continue in the future.
10
Geographic Areas
A significant portion of our revenues is generated from operations or otherwise earned outside the U.S. and Canada. All of our foreign operations are subject to risks inherent in conducting business abroad, including price and currency exchange controls, fluctuations in the relative values of currencies, political and economic instability and restrictive governmental actions including possible nationalization or expropriation. Changes in the relative values of currencies may materially affect our results of operations. For a discussion of these risks, see Item 1A “Risk Factors” of this Form 10-K.
See
Note 22, "SEGMENT INFORMATION"
to our audited Consolidated Financial Statements for revenues and long-lived assets by geographic area.
A portion of our revenue and income was earned in Ireland and Luxembourg, which have low tax rates. See Item 1A “Risk Factors” of this Form 10-K relating to tax rates.
Available Information
Our Internet address is
www.bauschhealth.com
. We post links on our website to the following filings as soon as reasonably practicable after they are electronically filed or furnished to the SEC: annual reports on Form 10-K, quarterly reports on Form 10-Q, current reports on Form 8-K and any amendment to those reports filed or furnished pursuant to Section 13(a) or 15(d) of the Securities Exchange Act of 1934, as amended. All such filings are available through our website free of charge. The information on our Internet website is not incorporated by reference into this Form 10-K or our other securities filings and is not a part of such filings.
We are also required to file reports and other information with the securities commissions in all provinces in Canada. You are invited to read and copy any reports, statements or other information, other than confidential filings, that we file with the provincial securities commissions. These filings are also electronically available from the Canadian System for Electronic Document Analysis and Retrieval (“SEDAR”) (http://www.sedar.com), the Canadian equivalent of the SEC’s electronic document gathering and retrieval system.
Our filings may also be read and copied at the SEC’s Public Reference Room at 100 F Street, N.E., Room 1580, Washington, DC 20549. Information on the operation of the Public Reference Room may be obtained by calling the SEC at 1-800-SEC-0330. The SEC also maintains an Internet website at
www.sec.gov
that contains reports, proxy and information statements, and other information regarding issuers, including us, that file electronically with the SEC.
11
Item 1A. Risk Factors
Our business, financial condition, cash flows and results of operations are subject to various risks and uncertainties. You should carefully consider the risks and uncertainties described below, together with all of the other information in this Form 10-K, including those risks set forth under the heading entitled “Forward-Looking Statements” and in other documents that we file with the SEC and the CSA, before making any investment decision with respect to our common shares or debt securities. If any of the risks or uncertainties actually occur or develop, our business, financial condition, cash flows, results of operations and/or future growth prospects could change, and such change could be materially adverse. Under these circumstances, the market value of our common shares and/or debt securities could decline, and you could lose all or part of your investment in our common shares and/or debt securities.
Legal and Reputational Risks
We are the subject of a number of ongoing legal proceedings, investigations and inquiries respecting certain of our historical distribution, marketing, pricing, disclosure and accounting practices, including our former relationship with Philidor, which have had and could continue to have a material adverse effect on our reputation, business, financial condition, cash flows and results of operations, could result in additional claims and material liabilities, and could cause the market value of our common shares and/or debt securities to decline.
We have been or are currently the subject of a number of ongoing legal proceedings and investigations and inquiries by governmental agencies, including, but not limited to, the following: (i) investigations by the U.S. Attorney’s Offices for the District of Massachusetts and the Southern District of New York relating to certain matters, including our patient assistance programs (including financial support provided to patients), our former relationship with Philidor and other pharmacies, our accounting treatment for sales by specialty pharmacies, information provided to the Centers for Medicare and Medicaid Services, our pricing (including discounts and rebates), marketing and distribution of our products, our compliance program, and employee compensation; (ii) the investigation by the SEC of the Company relating to certain matters, including our former relationship with Philidor, our accounting practices and policies and our public disclosures; (iii) an investigation by the State of North Carolina Department of Justice relating to certain matters, including the production, marketing, distribution, sale and pricing of, and patient assistance programs covering, our Nitropress
®
, Isuprel
®
and Cuprimine
®
products and our pricing decisions for certain of our other products; (iv) an investigation order from the Autorité des marches financiers (the “AMF”) (our principal securities regulator in Canada) relating to certain matters, including with respect to our former relationship with Philidor and our accounting practices and policies; (v) an investigation by the State of Texas concerning various price reporting matters relating to the State's Medicaid program for certain B&L products; (vi) a number of pending putative class action securities litigations in the U.S. (including related opt-out actions) and Canada (including related opt-out actions) have been instituted, the allegations of which relate to, among other things, allegedly false and misleading statements by the Company and/or failures to disclose information about our business and prospects, including relating to drug pricing, our policies and accounting practices, our use of specialty pharmacies, and our former relationship with Philidor and (vii) purported class actions under the federal RICO statute on behalf of third-party payors arising out of our pricing and use of specialty pharmacies, and our former relationship with Philidor. In addition, we could, in the future, face additional legal proceedings and investigations and inquiries by governmental agencies relating to these or similar matters. Philidor and certain of its executives and employees are also subject to disputes with third-party payors and governmental investigations related to Philidor's business practices and relationship with the Company which may result in claims being asserted against the Company. For more information regarding legal proceedings, see
Note 20, "LEGAL PROCEEDINGS"
to our audited Consolidated Financial Statements.
We are unable to predict how long such proceedings, investigations and inquiries will continue, but we anticipate that we will continue to incur significant costs in connection with some or all of these matters and that some or all of these proceedings, investigations and inquiries will result in a substantial distraction of management’s time, regardless of the outcome. Some or all of these proceedings, investigations and inquiries may result in damages, fines, penalties, consent orders or other administrative sanctions (including exclusion from federal programs) against the Company and/or certain of our officers, or in changes to our business practices, which, in turn, may result in or may contribute to an inability by us to meet the financial covenant contained in our Restated Credit Agreement. Furthermore, publicity surrounding these proceedings, investigations and inquiries or any enforcement action as a result thereof, even if ultimately resolved favorably for us could result in additional investigations and legal proceedings. As a result, these proceedings, investigations and inquiries could have a material adverse effect on our reputation, business, financial condition, cash flows and results of operations and could cause the market value of our common shares and/or debt securities to decline.
12
Our historical business practices, including with respect to past pricing practices, are under scrutiny. Any changes to our practices relating to pricing or the current prices of products, whether imposed, legislated or voluntary, could have a material adverse effect on our business, financial condition, cash flows and results of operations and could cause the market value of our common shares and/or debt securities to decline.
We are under scrutiny with respect to our business historical practices (including with respect to past pricing practices), including investigations by the U.S. Attorney’s Offices for the District of Massachusetts and the Southern District of New York, the State of North Carolina Department of Justice, various purported class action suits against us in the U.S. (including related opt-out actions) and Canada (including related opt-out actions) and purported class actions under the federal RICO statute on behalf of third-party payors. We are unable to predict how such proceedings, investigations and inquiries will impact our current business practices, including with respect to pricing, or the prices of our products, including whether we will be required to impose pricing freezes or controls, pricing reductions (including on a retroactive basis) or other price regulation for some or all of our products.
In addition, in recent years, in the U.S., state and federal governments have considered implementing legislation that would control or regulate the prices of drugs, and the new administration has expressed support for lowering the cost of drug prices. Other countries have announced or implemented measures on pricing, including suspensions on price increases, prospective and possibly retroactive price reductions and other recoupments. These measures and proposed measures vary by country. These measures and these proposed measures and legislation, if implemented, could lead to impairment of certain of our intangible assets which could be significant, and/or could have a material adverse effect on our business, financial condition, cash flows and results of operations and could cause the market value of our common shares and/or debt securities to decline.
We are involved in various other legal and governmental proceedings that are uncertain, costly and time-consuming and could have a material adverse effect on our business, financial condition, cash flows and results of operations and could cause the market value of our common shares and/or debt securities to decline.
We are involved in a number of other legal and governmental proceedings and may be involved in additional litigation in the future. These proceedings are complex and extended and occupy the resources of our management and employees. These proceedings are also costly to prosecute and defend and may involve substantial awards or damages payable by us if not found in our favor. We may also be required to pay substantial amounts or grant certain rights on unfavorable terms in order to settle such proceedings. Defending against or settling such claims and any unfavorable legal decisions, settlements or orders could have a material adverse effect on our business, financial condition, cash flows and results of operations and could cause the market value of our common shares and/or debt securities to decline. For more information regarding legal proceedings, see
Note 20, "LEGAL PROCEEDINGS"
to our audited Consolidated Financial Statements.
For example, the pharmaceutical industry, and our Company in particular, has been the focus of both private payor and governmental concern regarding pricing of pharmaceutical products. Related actions, including Congressional and other governmental investigations and litigation, are costly and time-consuming, and adverse resolution of such actions or changes in our business practices, such as our approach to the pricing of our pharmaceutical products, could adversely affect our business, financial condition, cash flows and results of operations and could cause the market value of our common shares and/or debt securities to decline.
Further, the pharmaceutical and medical device industries historically have generated substantial litigation concerning the manufacture, use and sale of products and we expect this litigation activity to continue. As a result, we expect that patents related to our products will be routinely challenged, and the validity or enforceability of our patents may not be upheld. In order to protect or enforce patent rights, we may initiate litigation against third parties. Our patents may also be challenged in administrative proceedings in the United States Patent and Trademark Office and patent offices outside of the United States. If we are not successful in defending an attack on our patents and maintaining exclusive rights to market one or more of our products still under patent protection, we could lose a significant portion of sales in a very short period. We may also become subject to infringement claims by third parties and may have to defend against charges that we infringed or otherwise violated patents or the intellectual property or proprietary rights of third parties. If we infringe or otherwise violate the intellectual property rights of others, we could lose our right to develop, manufacture or sell products, including our generic products, or could be required to pay monetary damages or royalties to license proprietary rights from third parties, which could be substantial.
In addition, in the U.S., it has become increasingly common for patent infringement actions to prompt claims that antitrust laws have been violated during the prosecution of the patent or during litigation involving the defense of that patent. Such claims by direct and indirect purchasers and other payers are typically filed as class actions. The relief sought may include treble damages and restitution claims. Similarly, antitrust claims may be brought by government entities or private parties following settlement of patent litigation, alleging that such settlements are anti-competitive and in violation of antitrust laws. In the U.S. and Europe, regulatory authorities have continued to challenge as anti-competitive so-called “reverse payment” settlements between branded and generic drug manufacturers. We may also be subject to other antitrust litigation involving competition claims unrelated to
13
patent infringement and prosecution. For example, we are currently defending a class action complaint alleging that defendants engaged in an anticompetitive scheme to eliminate price competition on certain contact lens lines through the use of unilateral pricing policies. For more information regarding legal proceedings, see
Note 20, "LEGAL PROCEEDINGS"
to our audited Consolidated Financial Statements. A successful antitrust claim by a private party or government entity against us could have a material adverse effect on our business, financial condition, cash flows and results of operations and could cause the market value of our common shares and/or debt securities to decline.
We depend on third parties to meet their contractual, legal, regulatory, and other obligations.
We rely on distributors, suppliers, contract research organizations, vendors, service providers, business partners and other third parties to research, develop, manufacture, distribute, market and sell our products, as well as perform other services relating to our business. We rely on these third parties to meet their contractual, legal, regulatory and other obligations. A failure to maintain these relationships or poor performance by these third parties could negatively impact our business. In addition, we cannot guarantee that the contractual terms and protections and compliance controls, policies and procedures we have put in place will be sufficient to ensure that such third parties will meet their legal, contractual and regulatory obligations or that these terms, controls, policies, procedures and other protections will protect us from acts committed by our agents, contractors, distributors, suppliers, service providers or business partners that violate contractual obligations or the laws or regulations of the jurisdictions in which we operate, including matters respecting anti-corruption, fraud, kickbacks and false claims, pricing, sales and marketing practices, privacy laws and other legal obligations. Any failure of such third parties to meet these legal, contractual and regulatory obligations or any improper actions by such third parties or even allegations of such non-compliance or actions could damage our reputation, adversely impact our ability to conduct business in certain markets and subject us to civil or criminal legal proceedings and regulatory investigations, monetary and non-monetary damages and penalties and could cause us to incur significant legal and investigatory fees and, as a result, could have a material adverse effect on our business, financial condition, cash flows and results of operations and could cause the market value of our common shares and/or debt securities to decline. For example, the allegations about the activities of Philidor and our former relationship with Philidor have resulted in a number of investigations, inquiries and legal proceedings against us, which may damage our reputation and result in damages, fines, penalties or administrative sanctions against the Company and/or certain of our officers. For more information regarding legal proceedings, see
Note 20, "LEGAL PROCEEDINGS"
to our audited Consolidated Financial Statements.
If our products cause, or are alleged to cause, serious or widespread personal injury, we may have to withdraw those products from the market and/or incur significant costs, including payment of substantial sums in damages, and we may be subject to exposure relating to product liability claims. In addition, our product liability self-insurance program may not be adequate to cover future losses.
We face an inherent business risk of exposure to significant product liability and other claims in the event that the use of our products caused, or is alleged to have caused, adverse effects. For example, we have been named as a defendant (along with other entities) in certain lawsuits in the United States and Canada in which the plaintiffs have made certain product liability claims respecting Shower to Shower
®
(a product we acquired in 2012). For more information regarding legal proceedings, see
Note 20, "LEGAL PROCEEDINGS"
to our audited Consolidated Financial Statements. These and other product liability proceedings may be costly to prosecute and defend and may involve substantial awards or damages payable by us if not found in our favor.
Furthermore, our products may cause, or may appear to have caused, adverse side effects (including death) or potentially dangerous drug interactions that we may not learn about or understand fully until the drug has been administered to patients for some time. The withdrawal of a product following complaints and/or incurring significant costs, including the requirement to pay substantial damages in personal injury cases or product liability cases, could have a material adverse effect on our business, financial condition, cash flows and results of operations and could cause the market value of our common shares and/or debt securities to decline.
In addition, since March 31, 2014, we have self-insured substantially all of our product liability risk for claims arising after that date. We periodically evaluate and adjust our claims reserves to reflect trends in our own experience, as well as industry trends. However, historical loss trends may not be adequate to cover future losses, as historical trends may not be indicative of future losses. If ultimate results exceed our estimates, this would result in losses in excess of our reserved amounts. If we were required to pay a significant amount on account of these liabilities for which we self-insure, this could have a material adverse effect on our business, financial condition, cash flows and results of operations and could cause the market value of our common shares and/or debt securities to decline.
14
Our marketing, promotional and business practices, as well as the manner in which sales forces interact with purchasers, prescribers and patients, are subject to extensive regulation and any material failure to comply could result in significant sanctions against us.
The marketing, promotional and business practices of pharmaceutical and medical device companies, as well as the manner in which companies’ in-house or third-party sales forces interact with purchasers, prescribers, and patients, are subject to extensive regulation, enforcement of which may result in the imposition of civil and/or criminal penalties, injunctions, and/or limitations on marketing practice for some of our products and/or pricing restrictions or mandated price reductions for some of our products. Many companies, including us, have been the subject of claims related to these practices asserted by federal authorities. These claims have resulted in fines and other consequences, such as entering into corporate integrity agreements with the U.S. government. Companies may not promote drugs for “off-label” uses-that is, uses that are not described in the product’s labeling and that differ from those approved by the FDA, Health Canada, EMA or other applicable regulatory agencies. A company that is found to have improperly promoted off-label uses may be subject to significant liability, including civil and administrative remedies (such as entering into corporate integrity agreements with the U.S. government), as well as criminal sanctions. In addition, management’s attention could be diverted from our business operations and our reputation could be damaged. For more information regarding legal proceedings, see
Note 20, "LEGAL PROCEEDINGS"
to our audited Consolidated Financial Statements.
Debt-related Risks
Our Restated Credit Agreement and the indentures governing our senior notes impose restrictive covenants on us. Our failure to comply with these covenants could trigger events, which could result in the acceleration of the related debt, a cross-default or cross-acceleration to other debt, foreclosure upon any collateral securing the debt and termination of any commitments to lend, each of which would have a material adverse effect on our business, financial condition, cash flows and results of operations and would cause the market value of our common shares and/or securities to decline and could lead to bankruptcy or liquidation.
Our Restated Credit Agreement and the various indentures governing our senior notes contain covenants that restrict the way we conduct business and require us to satisfy certain financial tests in order to incur debt or take other actions. Additionally, our Restated Credit Agreement contains a financial covenant that, for example, require us to maintain a certain financial ratio at fiscal quarter end.
The Company’s Restated Credit Agreement contains a specified quarterly financial maintenance covenant (consisting of a first lien leverage ratio).
As of December 31, 2018
, we were in compliance with this financial maintenance covenant. However, we can make no assurance that we will be able to comply with the restrictive covenants contained in the Restated Credit Agreement and indentures in the future. Based on our current forecast for the next twelve months from the date of issuance of this Form 10-K, we expect to remain in compliance with this financial maintenance covenant and meet our debt obligations over that same period. In the event that we perform below our forecasted levels, we will implement certain additional cost-efficiency initiatives, such as rationalization of selling, general and administrative expenses ("SG&A") and R&D spend, which would allow us to continue to comply with the financial maintenance covenant. We may consider taking other actions, including divesting other businesses, refinancing debt and/or negotiating with the applicable lenders for an amendment or modification to such covenant, as deemed appropriate; however, we cannot guarantee that such actions would be achieved. If we perform below our forecasted levels and the actions referenced above are not effective, we would fail to comply with our financial maintenance covenant. In that instance, we would be in default, and our lenders would be permitted to accelerate our debt unless we could obtain an amendment. If our debt was accelerated, we would not have sufficient funds to repay our debt absent a refinancing, and we cannot provide assurance that we will be able to obtain a refinancing.
Our inability to comply with the covenants in our debt instruments could lead to a default or an event of default under the terms thereof, for which we may need to seek relief from our lenders and noteholders in order to waive the associated default or event of default and avoid a potential acceleration of the related indebtedness or cross-default or cross-acceleration to other debt. There can be no assurance that we would be able to obtain such relief on commercially reasonable terms or otherwise and we may be required to incur significant additional costs. In addition, the lenders under our Restated Credit Agreement and holders of our senior notes may impose additional operating and financial restrictions on us as a condition to granting any such waiver. If an event of default is not cured or is not otherwise waived, a majority of lenders in principal amount under our Restated Credit Agreement or the trustee or holders of at least 25% in principal amount of a series of our senior notes may accelerate the maturity of the related debt under these agreements, foreclose upon any collateral securing the debt and terminate any commitments to lend, any of which would have a material adverse effect on our business, financial condition, cash flows and results of operations and would cause the market value of our securities to decline. Furthermore, under these circumstances, we may not have sufficient funds or other resources to satisfy all of our obligations and we may be unable to obtain alternative financing on terms acceptable to us or at all. In such circumstances, we could be forced into bankruptcy or liquidation and, as a result, investors could lose all or a portion of their investment in our securities.
15
To service our debt, we will be required to generate a significant amount of cash. Our ability to generate cash depends on a number of factors, some of which are beyond our control, and any failure to meet our debt obligations would have a material adverse effect on our business, financial condition, cash flows and results of operations and could cause the market value of our common shares and/or debt securities to decline.
We have a significant amount of indebtedness. For details regarding our debt and the maturity dates thereof, see
Note 11, "FINANCING ARRANGEMENTS"
to our audited Consolidated Financial Statements. Our ability to satisfy our debt obligations will depend principally upon our future operating performance. As a result, prevailing economic conditions and financial, business and other factors, many of which are beyond our control, may affect our ability to make payments on our debt. If we do not generate sufficient cash flow to satisfy our debt obligations, we may have to undertake alternative financing plans, such as refinancing or restructuring our debt, selling assets, reducing or delaying capital investments or seeking to raise additional capital. Alternatively, as we have done in the past, we may also elect to refinance certain of our debt, for example, to extend maturities. Our ability to restructure or refinance our debt will depend on the capital markets and our financial condition at such time. If we are unable to access the capital markets, whether because of the condition of those capital markets or our own financial condition or reputation within such capital markets, we may be unable to refinance our debt. In addition, any refinancing of our debt could be at higher interest rates and may require us to comply with more onerous covenants, which could further restrict our business operations. Further, given our capital structure, any refinancing of our senior unsecured debt may be with secured debt, thereby increasing our first lien and/or secured leverage ratios. Our inability to generate sufficient cash flow to satisfy our debt obligations or to refinance our obligations on commercially reasonable terms, or at all, could have a material adverse effect on our business, financial condition, cash flows and results of operations and could cause the market value of our common shares and/or debt securities to decline.
Repayment of our indebtedness is dependent on the generation of cash flow by our subsidiaries and their ability to make such cash available to us, by dividend, debt repayment or otherwise. Our subsidiaries may not be able to, or may not be permitted to, make distributions to enable us to make payments in respect of our indebtedness. Each subsidiary is a distinct legal entity and, under certain circumstances, legal and contractual restrictions may limit our ability to obtain cash from our subsidiaries. Certain non-guarantor subsidiaries include non-U.S. subsidiaries that may be prohibited by law or other regulations from distributing funds to us and/or we may be subject to payment of taxes and withholdings on such distributions. In the event that we do not receive distributions from our subsidiaries or receive cash via services rendered and intellectual property licensed, we may be unable to make required principal and interest payments on our indebtedness.
Our ability to continue to reduce our indebtedness will depend upon factors including our future operating performance, our ability to access the capital markets to refinance existing debt and prevailing economic conditions and financial, business and other factors, many of which are beyond our control. We can provide no assurance of the amount by which we will reduce our debt, if at all. In addition, servicing our debt will result in a reduction in the amount of our cash flow available for other purposes, including operating costs and capital expenditures that could improve our competitive position and results of operations.
We have incurred significant indebtedness, which restricts the manner in which we conduct business.
We have incurred significant indebtedness, including in connection with our prior acquisitions. We may incur additional long-term debt and working capital lines of credit to meet future financing needs, subject to certain restrictions and prohibitions under the agreements governing our indebtedness, which would increase our total debt. This additional debt may be substantial and some of this indebtedness may be secured.
The agreements governing our indebtedness contain restrictive covenants which impose certain limitations on the way we conduct our business, including limitations on the amount of additional debt we are able to incur, prohibitions on incurring additional debt if a certain financial covenant is not met and restrictions on our ability to make certain investments and other restricted payments. Any additional debt, to the extent we are able to incur it, may further restrict the manner in which we conduct business. Such restrictions, prohibitions and limitations could impact our ability to implement elements of our strategy, including in the following ways:
|
•
|
our flexibility to plan for, or react to, competitive challenges in our business and the pharmaceutical and medical device industries may be compromised;
|
|
•
|
we may be put at a competitive disadvantage relative to competitors that do not have as much debt as we have, and competitors that may be in a more favorable position to access additional capital resources;
|
|
•
|
our ability to make acquisitions and execute business development activities through acquisitions will be limited and may, in future years, continue to be limited; and
|
|
•
|
our ability to resolve regulatory and litigation matters may be limited.
|
In the past, our credit ratings have been downgraded. Any further downgrade in our corporate credit ratings or other credit ratings may increase our cost of borrowing and may negatively impact our ability to raise additional debt capital.
16
We are exposed to risks related to interest rates.
Our senior secured credit facilities bear interest based on U.S. dollar London Interbank Offering Rates or U.S. Prime Rate, or Federal Funds effective rate (for U.S. dollar loans) and Canadian Prime Rate or Canada Bankers’ Acceptance Rate (for Canadian dollar loans). Thus, a change in the short-term interest rate environment (especially a material change) could have an adverse effect on our business, financial condition, cash flows and results of operations (which adverse effect could be material) and could cause the market value of our common shares and/or debt securities to decline. As of December 31, 2018, we did not have any outstanding interest rate swap contracts.
In July 2017, the head of the United Kingdom Financial Conduct Authority announced the desire to phase out the use of LIBOR by the end of 2021. If LIBOR ceases to exist, we may need to renegotiate our senior secured credit facilities that bear interest based on LIBOR or to endeavor, with the administrative agent thereunder, to amend the credit facilities to substitute LIBOR with an alternative rate of interest that gives due consideration to the then-prevailing market convention for syndicated loans in the U.S., subject to notice to all lenders and the absence of objection by the “required lenders.” Any change in accordance with the aforementioned procedures, or the conversion of loans to base rate or U.S. prime rate loans, could have an adverse impact on our cost of capital. Currently, there is no definitive information regarding the future utilization of LIBOR or of any particular replacement rate. As such, the potential effect of any such event on our business, financial condition, cash flows and results of operations cannot yet be determined.
Employment-related Risks
The loss of the services of, or our inability to recruit, retain, motivate, our executives and other key employees could have a material adverse effect on our business, financial condition, cash flows and results of operations and could cause the market value of our common shares and/or debt securities to decline.
We must continue to retain and motivate our executives and other key employees, and to recruit other executives and employees, in order to strengthen our management team and workforce. Our ability to retain or recruit executive and other key employees may be hindered or delayed by, among other things, competition from other employers who may be able to offer more attractive compensation packages or the reputational challenges the Company faces as a result of historical issues and may in the future continue to face. A failure by us to retain, motivate and recruit executives and other key employees or the unanticipated loss of the services of any of these executives or key employees for any reason, whether temporary or permanent, could create disruptions in our business, could cause concerns and instability for management and employees, current and potential customers, credit rating agencies and other third parties with whom we do business and our shareholders and debt holders and could cause concern regarding our ability to execute our business strategy or to manage operations in the manner previously conducted and, as a result, could have a material adverse effect on our business, financial condition, cash flows and results of operations and could cause the market value of our common shares and/or debt securities to decline. Furthermore, as a result of any failure to retain, or loss of, any executives or key employees, we may experience increased costs in order to identify and recruit a suitable replacement in a timely manner (and, even if we are able to hire a qualified successor, the search process and transition period may be difficult to manage and result in additional periods of uncertainty), which could have a material adverse effect on our business, financial condition, cash flows and results of operations and could cause the market value of our common shares and/or debt securities to decline. In addition, once identified and recruited, the transition of new executives and key employees may be difficult to manage and we cannot guarantee that new executives and employees will efficiently transition into their roles or ultimately be successful in their roles. Finally, as a result of changes in our executives and key employees, there may be changes in the way we conduct our business, as well as changes to our business strategy. We cannot predict what these changes may involve or the timing of any such changes and how they will impact our product sales, revenue, business, financial condition, cash flows or results of operation, but any such changes could have a material adverse effect on our business, financial condition, cash flows and results of operations and could cause the market value of our common shares and/or
debt securities
to decline. Any of these factors could have a material adverse effect on our business, financial condition, cash flows and results of operations and could cause the market value of our common shares and/or debt securities to decline.
Tax-related Risks
Our effective tax rates may increase.
We have operations in various countries that have differing tax laws and rates. Our tax reporting is supported by current domestic tax laws in the countries in which we operate and the application of tax treaties between the various countries in which we operate. Our income tax reporting is subject to audit by domestic and foreign authorities. Our effective tax rate may change from year to year based on changes in the mix of activities and income earned among the different jurisdictions in which we operate; changes in tax laws in these jurisdictions; changes in the tax treaties between various countries in which we operate; changes in our eligibility for benefits under those tax treaties; and changes in the estimated values of deferred tax assets and liabilities. Tax laws, regulations, and administrative practices in various jurisdictions may be subject to significant change, with
17
or without notice, due to economic, political, and other conditions, and significant judgment is required in evaluating and estimating our provision and accruals for these taxes. Such changes could result in a substantial increase in the effective tax rate on all or a portion of our income.
On December 22, 2017, the Tax Cuts and Jobs Act (the “Tax Act”) significantly revised U.S. federal corporate income tax law by, among other things, reducing the U.S. federal corporate income tax rate to 21%, limiting the tax deduction for interest expense to 30% of adjusted earnings, allowing immediate expensing for certain new investments, implementing a modified territorial tax system that includes a one-time transition tax on deemed repatriated earnings of foreign subsidiaries, imposing an additional U.S. tax on certain non-U.S. subsidiaries’ earnings which are considered to be Global Intangible Low Taxed Income (referred to as “GILTI”) and imposing an alternative “base erosion and anti-abuse tax” (“BEAT”) on domestic corporations that make deductible payments to foreign related persons in excess of specified amounts, and, effective for net operating losses (”NOLs”) arising in taxable years beginning after December 31, 2017, eliminating net operating loss carrybacks, permitting indefinite net operating loss carryforwards, and limiting the use of net operating loss carryforwards to 80% of current year taxable income.
There are a number of uncertainties and ambiguities as to the interpretation and application of many of the provisions in the Tax Act, including the provisions relating to the modified territorial tax system, the one-time transition tax and the BEAT. While the U.S. Treasury Department and the Internal Revenue Service have issued proposed and final regulations and other guidance on certain provisions in the Tax Act that address certain of these uncertainties and ambiguities, there are still no final regulations or other definitive guidance on many provisions in the Tax Act. In the absence of guidance on these issues, we will use what we believe are reasonable interpretations and assumptions in interpreting and applying the Tax Act for purposes of determining our cash tax liabilities and results of operations, which may change as we receive additional clarification and implementation guidance and as the interpretation of the Tax Act evolves over time. It is possible that the Internal Revenue Service could issue subsequent guidance or take positions on audit that differ from the interpretations and assumptions that we previously made, which could have a material adverse effect on our cash tax liabilities, results of operations and financial condition.
Our provision for income taxes is based on certain estimates and assumptions made by management. Our consolidated income tax rate is affected by the amount of pre-tax income earned in our various operating jurisdictions, the availability of benefits under tax treaties, and the rates of taxes payable in respect of that income. We enter into many transactions and arrangements in the ordinary course of business in respect of which the tax treatment is not entirely certain. We therefore make estimates and judgments based on our knowledge and understanding of applicable tax laws and tax treaties, and the application of those tax laws and tax treaties to our business, in determining our consolidated tax provision. For example, certain countries could seek to tax a greater share of income than we will allocate to our business in such countries. The final outcome of any audits by taxation authorities may differ from the estimates and assumptions that we may use in determining our consolidated tax provisions and accruals. This could result in a material adverse effect on our consolidated income tax provision, financial condition and the net income for the period in which such determinations are made.
Our deferred tax liabilities, deferred tax assets and any related valuation allowances are affected by events and transactions arising in the ordinary course of business, acquisitions of assets and businesses, and non-recurring items. The assessment of the appropriate amount of a valuation allowance against the deferred tax assets is dependent upon several factors, including estimates of the realization of deferred income tax assets, which realization will be primarily based on future taxable income, including the reversal of existing taxable temporary differences. Significant judgment is applied to determine the appropriate amount of valuation allowance to record. Changes in the amount of any valuation allowance required could materially increase or decrease our provision for income taxes in a given period.
See
Note 17, "INCOME TAXES"
to our audited Consolidated Financial Statements.
Risks Relating to Intellectual Property and Exclusivity
Products representing a significant amount of our revenue are not protected by patent or marketing or data exclusivity rights or are nearing the end of their exclusivity period. In addition, we have faced generic competition in the past and expect to face additional generic competition in the future. Competitors (including generic and biosimilar competitors) of our products could have a material adverse effect on our business, financial condition, cash flows and results of operations and could cause the market value of our common shares and/or debt securities to decline.
A significant number of the products we sell either: (i) have no meaningful exclusivity protection via patent or marketing or data exclusivity rights or (ii) are protected by patents or regulatory exclusivity periods that will be expiring in the near future. These products represent a significant amount of our revenues (See Item 1 “Business - Competition - Generic Competition” in this Form 10-K for a list of some of these products). Without exclusivity protection, competitors (including generics and biosimilars) face fewer barriers in introducing competing products. Upon the expiration or loss of patent exclusivity or regulatory exclusivity for our products or otherwise upon the introduction of generic, biosimilar or other competitors (which may be sold at significantly lower prices than our products), we could lose a significant portion of sales and market share of that product in a very short period
18
and, as a result, our revenues could be lower. In addition, the introduction of generic and biosimilar competitors may have a significant downward pressure on the pricing of our branded products which compete with such generics and biosimilars. Where we have the rights, we may elect to launch an authorized generic of such product (either ourselves or through a third party) prior to, upon or following generic entry, which may mitigate the anticipated decrease in product sales; however, even with the launch of an authorized generic, the decline in product sales of such product would still be expected to be significant, and the effect on our future revenues could be material. The introduction of competing products (including generic products and biosimilars) could have a material adverse effect on our business, financial condition, cash flows and results of operations and could cause the market value of our common shares and/or debt securities to decline.
We may fail to obtain, maintain, license, enforce or defend the intellectual property rights required to conduct our business, which could have a material adverse effect on our business, financial condition, cash flows and results of operations and could cause the market value of our common shares and/or debt securities to decline.
We strive to acquire, maintain and defend patent, trademark and other intellectual property protections over our products and the processes used to manufacture these products. However, we may not be successful in obtaining such protections, or the patent, trademark and intellectual property rights we do obtain may not be sufficient in breadth and scope to fully protect our products or prevent competing products, or such patent and intellectual property rights may be susceptible to third-party challenges, which could result in the loss of such intellectual property rights or the narrowing of scope of protection afforded by such rights. Our intellectual property rights may also be circumvented by third parties. The failure to obtain, maintain, enforce or defend such intellectual property rights, for any reason, could allow third parties to manufacture and sell products that compete with our products or may impact our ability to develop, manufacture and market our own products, which could have a material adverse effect on our business, financial condition, cash flows and results of operations and could cause the market value of our common shares and/or debt securities to decline.
For certain of our products and manufacturing processes, we rely on trade secrets and other proprietary information, which we seek to protect, in part, by confidentiality and nondisclosure agreements with our employees, consultants, advisors and partners. We also attempt to enter into agreements whereby such employees, consultants, advisors and partners assign to us the rights in any intellectual property they develop. These agreements may not effectively prevent disclosure or misappropriation of such information and disputes may still arise with respect to the ownership of intellectual property. In addition, third parties may independently develop the same or similar proprietary information. The disclosure of such proprietary information or the loss of such intellectual property rights may impact our ability to develop, manufacture and market our own products or may assist competitors in the development, manufacture and sale of competing products, which could have a material adverse effect on our revenues, financial condition, cash flows or results of operations and could cause the market value of our common shares and/or debt securities to decline.
For a number of our commercialized products and pipeline products, including Xifaxan
®
, Siliq
™
, Lumify
®
, Plenvu
®
, Vyzulta
®
, Relistor
®
and Jublia
®
, we rely on licenses to patents and other technologies, know-how and proprietary rights held by third parties. Any loss, expiration, termination or suspension of our rights to such licensed intellectual property would result in our inability to continue to develop, manufacture and market our products or product candidates and, as a result, could have a material adverse effect on our business, financial condition, cash flows and results of operations and could cause the market value of our common shares and/or debt securities to decline. In the future, we may also need to obtain such licenses from third parties to develop, manufacture, market or continue to manufacture or market our products. If we are unable to timely obtain these licenses on commercially reasonable terms, our ability to develop, manufacture and market our products may be inhibited or prevented, which could have a material adverse effect on our business, financial condition, cash flows and results of operations and could cause the market value of our common shares and/or debt securities to decline.
Competitive Risks
We operate in extremely competitive industries. If competitors develop or acquire more effective or less costly pharmaceutical products or medical devices for our target indications, it could have a material adverse effect on our business, financial condition, cash flows and results of operations and could cause the market value of our common shares and/or debt securities to decline.
The pharmaceutical and medical device industries are extremely competitive. Our success and future growth depend, in part, on our ability to develop, license or acquire products that are more effective than those of our competitors or that incorporate the latest technologies and our ability to effectively manufacture and market those products. Many of our competitors, particularly larger pharmaceutical and medical device companies, have substantially greater financial, technical and human resources than we do. Many of our competitors spend significantly more on research and development related activities than we do. Others may succeed in developing or acquiring products and technologies that are more effective, more advanced or less costly than those currently marketed or proposed for development by us. In addition, academic institutions, government agencies and other public and private organizations conducting research may seek patent protection with respect to potentially competitive products and may also establish exclusive collaborative or licensing relationships with our competitors. These competitors and the introduction
19
of competing products (that may be more effective or less costly than our products) could make our products less competitive or obsolete, which could have a material adverse effect on our business, financial condition, cash flows and results of operations and could cause the market value of our common shares and/or debt securities to decline.
Risks Relating to Our Business Strategy
We have made commitments and public statements with respect to the cessation of or limitation on pricing increases for certain of our products. These pricing decisions could have a material adverse effect on our business, financial condition, cash flows and results of operations and could cause the market value of our common shares and/or debt securities to decline.
In May 2016, we formed a new Patient Access and Pricing Committee responsible for the pricing of our drugs. The new committee’s first action was a recommendation, which we implemented, for an enhanced rebate program to all hospitals in the U.S. to reduce the price of our Nitropress
®
and Isuprel
®
products. In addition, the Patient Access and Pricing Committee made a commitment that the average annual price increase for our branded prescription pharmaceutical products will be set at no greater than single digits and below the 5-year weighted average of the increases within the branded biopharmaceutical industry and, in August 2018, further committed that it will not increase prices on our U.S. branded prescription drugs for the remainder of 2018. All future pricing actions will be subject to review by the Patient Access and Pricing Committee and we expect that the Patient Access and Pricing Committee will implement or recommend additional price changes and/or new programs to enhance patient access to our drugs.
At this time, we cannot predict what specific pricing changes the committee will make nor can we predict what other changes in our business practices we may implement with respect to pricing (such as imposing limits or prohibitions on the amount of pricing increases we may take on certain of our products or taking retroactive or future price reductions). We also cannot predict the impact such pricing decisions or changes will or would have on our business. However, any such changes could have a material adverse effect on our business, financial condition, cash flows and results of operations and could cause the market value of our common shares and/or debt securities to decline.
For example, any pricing changes and programs could affect the average realized prices for our products and may have a significant impact on our revenue trends. In addition, limiting or eliminating price increases on certain of our products will result in fewer or lower price appreciation credits from certain of our wholesalers. Price appreciation credits are generated when we increase a product’s wholesaler acquisition cost (“WAC”) under our contracts with certain wholesalers. Under such contracts, we are entitled to credits from such wholesalers for the impact of that WAC increase on inventory currently on hand at the wholesalers. Such credits, which can be significant, are used to offset against the total distribution service fees we pay on all of our products to each wholesaler. As a result, to the extent we decide to cease or limit price increases, we will have fewer or lower price appreciation credits to use to offset against our distribution fees owing to these wholesalers. In addition, under certain of our agreements with our wholesaler customers, we have price protection or price depreciation provisions, pursuant to which we have agreed to adjust the value of any on-hand or in-transit inventory with such customers in the event we reduce the price of any of our products. As a result, to the extent we reduce the WAC price for any of our products, we may owe a payment to such customers (or such customers may earn a credit to be offset against any amounts owing to us) equal to the amount of such inventory multiplied by the difference between the price at which they acquired the product inventory and the new reduced price.
In prior years, we have undertaken a number of divestitures or certain of our assets and business. We may, in the future, seek to divest additional asset and/or businesses, some of which may be material and/or transformative, which could adversely affect our business, prospects and opportunities for growth.
Over the last few years, we have completed a number of divestitures of our assets, products or businesses that were not considered core to our ongoing operations or the needs of our primary-customer base, including the divestitures of our Obagi Medical Products business, our iNova Pharmaceuticals business, our Dendreon Pharmaceuticals subsidiary, our Sprout Pharmaceuticals subsidiary and the CeraVe
®
, AcneFree
™
and AMBI
®
skincare brands. We may, in the future, seek to complete additional divestitures.
Each of these divestitures has been time-consuming and has diverted management’s attention. As a result of these divestitures (and others we may in the future complete), we may experience lower revenue and lower cash flows from operations. In addition, as was the case with our sale of our Sprout Pharmaceuticals subsidiary, we may recognize a loss on sale in connection with such divestitures. We may also suffer adverse tax consequences as a result of such divestitures, including capital gains tax or the accelerated use of NOLs or other attributes. Furthermore, divesting certain of our businesses or assets may require us to incur restructuring charges, and we may not be able to achieve the cost savings that we expect from any such restructuring efforts or divestitures. Any such divestiture could reduce the size or scope of our business, our market share in particular markets, our opportunities with respect to certain markets, products or therapeutic categories or our ability to compete in certain markets and therapeutic categories. Furthermore, we will be required to use the net proceeds (or substantial portions thereof) from certain asset sales to repay the term loans under the Restated Credit Agreement, subject to certain reinvestment rights.
20
In addition, should we seek to divest other of our assets and business, we may be unable to dispose of such businesses and assets on satisfactory or commercially reasonable terms within our anticipated timeline. In addition, our ability to identify, enter into and/or consummate divestitures may be limited by competition we face from other companies in pursuing similar transactions in the pharmaceutical industry. Any divestiture or other disposition we pursue, whether we are able to complete it or not, may be complex, time consuming and expensive, may divert the management’s attention, have a negative impact on our customer relationships, cause us to incur costs associated with maintaining the business of the targeted divestiture during the disposition process and also to incur costs of closing and disposing the affected business or transferring the operations of the business to other facilities. The divestiture process may also further expose us to operational inefficiencies. In addition, if such transactions are not completed for any reason, the market price of our common shares may reflect a market assumption that such transactions will occur, and a failure to complete such transactions could result in a negative perception by the market of us generally and a decline in the market price of our common shares.
As a result of these factors, any divestiture (whether or not completed) could have a material adverse effect on our business, financial condition, cash flows and results of operations and could cause the market value of our common shares and/or debt securities to decline.
As part of our business strategy, we may seek to identify and acquire certain assets, products and businesses.
Historically, part of our business strategy included acquiring and integrating complementary businesses, products, technologies or other assets. We anticipate that, as part of our current business strategy, we again seek to complete certain acquisitions of assets, products and businesses, including by way of in-license arrangements, although not at the volume and pace that we did historically. Acquisitions or similar arrangements may be complex, time consuming and expensive. We may not consummate some negotiations for acquisitions or other arrangements, which could result in significant diversion of management and other employee time, as well as substantial out-of-pocket costs. In addition, there are a number of risks and uncertainties relating to our closing transactions. If such transactions are not completed for any reason, we will be subject to several risks, including the following: (i) the market price of our common shares may reflect a market assumption that such transactions will occur, and a failure to complete such transactions could result in a negative perception by the market of us generally and a decline in the market price of our common shares; and (ii) many costs relating to such transactions may be payable by us whether or not such transactions are completed.
If an acquisition is consummated, the integration of the acquired business, product or other assets into our Company may also be complex and time-consuming and, if such businesses, products and assets are not successfully integrated, we may not achieve the anticipated benefits, cost-savings or growth opportunities. Potential difficulties that may be encountered in the integration process include the following: integrating personnel, operations and systems, while maintaining focus on selling and promoting existing and newly-acquired products; coordinating geographically dispersed organizations; distracting management and employees from operations; retaining existing customers and attracting new customers; maintaining the business relationships the acquired company has established, including with health care providers; and managing inefficiencies associated with integrating the operations of the Company.
Furthermore, we may incur restructuring and integration costs and a number of non-recurring transaction costs associated with these acquisitions, combining the operations of the Company and the acquired company and achieving desired synergies. These fees and costs may be substantial. Non-recurring transaction costs include, but are not limited to, fees paid to legal, financial and accounting advisors, filing fees and printing costs. Additional unanticipated costs may be incurred in the integration of the businesses of the Company and the acquired company. There can be no assurance that the elimination of certain duplicative costs, as well as the realization of other efficiencies related to the integration of the acquired business, will offset the incremental transaction-related costs over time. Therefore, any net benefit may not be achieved in the near term, the long term or at all.
Finally, these acquisitions and other arrangements, even if successfully integrated, may fail to further our business strategy as anticipated or to achieve anticipated benefits and success, expose us to increased competition or challenges with respect to our products or geographic markets, and expose us to additional liabilities associated with an acquired business, product, technology or other asset or arrangement. Any one of these challenges or risks could impair our ability to realize any benefit from our acquisition or arrangement after we have expended resources on them.
Commercialization Risks
Our approved products may not achieve or maintain expected levels of market acceptance.
Even if we are able to obtain and maintain regulatory approvals for our pharmaceutical and medical device products, generic or branded, the success of these products is dependent upon achieving and maintaining market acceptance. Launching and commercializing products is time consuming, expensive and unpredictable. The commercial launch of a product takes significant time, resources, personnel and expertise, which we may not have in sufficient levels to achieve success, and is subject to various
21
market conditions, some of which may be beyond our control. There can be no assurance that we will be able to, either by ourselves or in collaboration with our partners or through our licensees or distributors, successfully launch and commercialize new products or gain market acceptance for such products. New product candidates that appear promising in development may fail to reach the market or may have only limited or no commercial success. While we have been successful in launching some of our products, we may not achieve the same level of success with respect to all of our new products. Our inability to successfully launch our new products may negatively impact the commercial success of such product, which could have a material adverse effect on our business, financial condition, cash flows and results of operations and could cause the market value of our common shares and/or debt securities to decline. Our inability to successfully launch our new products could also lead to material impairment charges.
Levels of market acceptance for our new products could be impacted by several factors, some of which are not within our control, including but not limited to the following:
|
•
|
safety, efficacy, convenience and cost-effectiveness of our products compared to products of our competitors;
|
|
•
|
scope of approved uses and marketing approval;
|
|
•
|
availability of patent or regulatory exclusivity;
|
|
•
|
timing of market approvals and market entry;
|
|
•
|
ongoing regulatory obligations following approval, such as the requirement to conduct a Risk Evaluation and Mitigation Strategy ("REMS") programs;
|
|
•
|
any restrictions or “black box” warnings required on the labeling of such products;
|
|
•
|
availability of alternative products from our competitors;
|
|
•
|
acceptance of the price of our products;
|
|
•
|
effectiveness of our sales forces and promotional efforts;
|
|
•
|
the level of reimbursement of our products;
|
|
•
|
acceptance of our products on government and private formularies;
|
|
•
|
ability to market our products effectively at the retail level or in the appropriate setting of care; and
|
|
•
|
the reputation of our products.
|
Further, the market perception and reputation of our products and their safety and efficacy are important to our business and the continued acceptance of our products. Any negative publicity about our products, such as the discovery of safety issues with our products, adverse events involving our products, or even public rumors about such events, could have a material adverse effect on our business, financial condition, cash flows or results of operation or could cause the market value of our common shares and/or debt securities to decline. In addition, the discovery of significant problems with a product similar to one of our products that implicate (or are perceived to implicate) an entire class of products or the withdrawal or recall of such similar products could have a material adverse effect on sales of our products. Accordingly, new data about our products, or products similar to our products, could cause us reputational harm and could negatively impact demand for our products due to real or perceived side effects or uncertainty regarding safety or efficacy and, in some cases, could result in product withdrawal.
If our products fail to gain, or lose, market acceptance, our revenues would be adversely impacted and we may be required to take material impairment charges, all of which could have a material adverse effect on our business, financial condition, cash flows and results of operations and could cause the market value of our common shares and/or debt securities to decline.
For certain of our products, we depend on reimbursement from governmental and other third-party payors and a reduction in reimbursement could reduce our product sales and revenue. In addition, failure to be included in formularies developed by managed care organizations and coverage by other organizations may negatively impact the utilization of our products, which could harm our market share and could have a material adverse effect on our business, financial condition, cash flows and results of operations and could cause the market value of our common shares and/or debt securities to decline.
Sales of certain of our products are dependent, in part, on the availability and extent of reimbursement from government health administration authorities, private health insurers, pharmacy benefit managers and other organizations of the costs of our products and the continued reimbursement and coverage of our products in such programs. Changes in government regulations or private third-party payors’ reimbursement policies may reduce reimbursement for our products. In addition, such third-party payors may otherwise make the decision to reduce reimbursement of some or all our products or fail to cover some or all our products in such programs or assert that reimbursements were not in accordance with applicable requirements. For example, these decisions may be based on the price of our products or our current or former pricing practices and decisions. Any reduction or elimination of such reimbursement or coverage could result in a negative impact on the utilization of our products and, as a result, could have a material adverse effect on our business, financial condition, cash flows and results of operations and could cause the market value of our common shares and/or debt securities to decline.
Managed care organizations and other third-party payors try to negotiate the pricing of medical services and products to control their costs. Managed care organizations and pharmacy benefit managers typically develop formularies to reduce their cost for medications. Formularies can be based on the prices and therapeutic benefits of the available products. Due to their lower
22
costs, generic products are often favored. The breadth of the products covered by formularies varies considerably from one managed care organization to another, and many formularies include alternative and competitive products for treatment of particular medical conditions. Failure to be included in such formularies or to achieve favorable formulary status may negatively impact the utilization and market share of our products. If our products are not included within an adequate number of formularies or adequate reimbursement levels are not provided, or if those policies increasingly favor generic products, this could have a material adverse effect on our business, financial condition, cash flows and results of operations and could cause the market value of our common shares and/or debt securities to decline.
Our fulfillment arrangements with Walgreens may not be successful.
At the beginning of 2016, we launched a brand fulfillment arrangement with Walgreen Co. ("Walgreens"), pursuant to which we have made certain of our dermatology and ophthalmology products available to eligible patients through a patient access and co-pay program available at Walgreens U.S. retail pharmacy locations, as well as participating independent retail pharmacies. We have, in the past, experienced certain operational and other issues respecting this arrangement, including lower than anticipated average realized prices associated with these products through this arrangement. We cannot guarantee this arrangement will continue to be successful in the future, nor can we guarantee that additional operational issues will not be encountered, nor can we guarantee that we will be able to successfully negotiate with Walgreens any improvements or amendments to this arrangement we identify as necessary or desired. In addition, we cannot predict how the market, including customers, doctors, patients, pharmacy benefit managers and third-party payors, or governmental agencies, will continue to react to these arrangements and programs. If this arrangement or program fails, if they do not achieve sufficient success and market acceptance, if we face retaliation from third parties as a result of this arrangement and program (for example, in the form of limitations on or exclusions from the reimbursement of our products) or if any part of this arrangement is found to be non-compliant with applicable law or regulations, this could have a material adverse effect on our business, financial condition, cash flows and results of operations and could cause the market value of our common shares and/or debt securities to decline.
Risks Relating to the International Scope of our Business
Our business, financial condition, cash flows and results of operations are subject to risks arising from the international scope of our operations.
We conduct a significant portion of our business outside the U.S. and Canada and may, in the future, expand our operations into new countries, including emerging markets. We sell our pharmaceutical and medical device products in many countries around the world. All of our foreign operations are subject to risks inherent in conducting business abroad, including, among other things:
|
•
|
difficulties in coordinating and managing foreign operations, including ensuring that foreign operations comply with foreign laws as well as Canadian and U.S. laws applicable to Canadian companies with U.S. and foreign operations, such as export and sanctions laws and the U.S. Foreign Corrupt Practices Act (“FCPA”), the Canadian Corruption of Foreign Public Officials Act, and other applicable worldwide anti-bribery laws;
|
|
•
|
price and currency exchange controls;
|
|
•
|
restrictions on the repatriation of funds;
|
|
•
|
scarcity of hard currency, including the U.S. dollar, which may require a transfer or loan of funds to the operations in such countries, which they may not be able to repay on a timely basis;
|
|
•
|
political and economic instability;
|
|
•
|
compliance with multiple regulatory regimes;
|
|
•
|
compliance with economic sanctions laws and other laws that apply to our activities in the countries where we operate;
|
|
•
|
less established legal and regulatory regimes in certain jurisdictions, including as relates to enforcement of anti-bribery and anti-corruption laws and the reliability of the judicial systems;
|
|
•
|
differing degrees of protection for intellectual property;
|
|
•
|
unexpected changes in foreign regulatory requirements, including quality standards and other certification requirements;
|
|
•
|
new export license requirements;
|
|
•
|
adverse changes in tariff and trade protection measures;
|
|
•
|
differing labor regulations;
|
|
•
|
potentially negative consequences from changes in or interpretations of tax laws;
|
|
•
|
restrictive governmental actions;
|
|
•
|
possible nationalization or expropriation;
|
|
•
|
credit market uncertainty;
|
|
•
|
differing local practices, customs and cultures, some of which may not align or comply with our Company practices and policies or U.S. laws and regulations;
|
23
|
•
|
difficulties with licensees, contract counterparties, or other commercial partners; and
|
|
•
|
differing local product preferences and product requirements.
|
As a result of changes to U.S. policy, there may be changes to existing trade agreements and greater restrictions on trade generally. On November 30, 2018, the United States, Canada and Mexico signed the United States-Mexico-Canada Agreement (“USMCA”) as an overhaul and update to the North American Free Trade Agreement. The USMCA is subject to ratifications by the legislative bodies of all three signatory countries. It is difficult to anticipate the full impact of this agreement on our business, financial condition, cash flows and results of operations.
Notwithstanding the USMCA, support for protectionism and rising anti-globalization sentiment in the United States and other countries may slow global growth. In particular, a protracted and wide-ranging trade conflict between the United States and China could adversely affect global economic growth. Concerns also remain around the social, political and economic impacts of the changing political landscape in Europe, including the final outcome of Brexit (as defined below) negotiations. In addition, there are growing concerns over an economic slowdown in emerging markets in light of capital outflows in favor of developed markets and expected interest rate increases. Broader geopolitical tensions remained high amongst the U.S., Russia, China, and across the Middle East.
Given the international scope of our operations, any of the above factors, including tariffs, trade wars and other governmental actions, could have a material adverse effect on our business, financial condition, cash flows and results of operations and could cause the market value of our common shares and/or debt securities to decline.
Similarly, adverse economic conditions impacting our customers in these countries or uncertainty about global economic conditions could cause purchases of our products to decline, which would adversely affect our revenues and operating results. Moreover, our projected revenues and operating results are based on assumptions concerning certain levels of customer spending. Any failure to attain our projected revenues and operating results as a result of adverse economic or market conditions could have a material adverse effect on our business, financial condition, cash flows and results of operations and could cause the market value of our common shares and/or debt securities to decline.
Due to the large portion of our business conducted in currency other than U.S. dollars, we have significant foreign currency risk.
We face foreign currency exposure on the translation into U.S. dollars of the financial results of our operations in Europe, Canada, Latin America, Asia, Africa and the Middle East and other regions. Where possible, we manage foreign currency risk by managing same currency revenue in relation to same currency expenses. We face foreign currency exposure in those countries where we have revenue denominated in the local foreign currency and expenses denominated in other currencies. Both favorable and unfavorable foreign currency impacts to our foreign currency-denominated operating expenses are mitigated to a certain extent by the natural, opposite impact on our foreign currency-denominated revenue. In addition, the repurchase of our U.S. dollar denominated debt may result in foreign exchange gains or losses for Canadian income tax purposes. One half of any foreign exchange gains or losses will be included in our Canadian taxable income. Any foreign exchange gain will result in a corresponding reduction in our available Canadian tax attributes.
In addition, in November 2016, as a result of the Egyptian government’s decision to float the Egyptian pound and un-peg it to the U.S. Dollar, the Egyptian pound was significantly devalued. Our exposure to the Egyptian pound is primarily with respect to Amoun Pharmaceutical Company S.A.E., which we acquired in October 2015, and which represented approximately
2%
of our total 2018 and 2017 revenues. Further strengthening of the U.S. dollar and/or the devaluation of other countries' currencies could have a negative impact on our reported international revenue.
Development and Regulatory Risks
The successful development of our pipeline products is highly uncertain and requires significant expenditures and time. In addition, obtaining necessary government approvals is time-consuming and not assured. The failure to commercialize certain of our pipeline products could have a material adverse effect on our business, financial condition, cash flows and results of operations and could cause the market value of our common shares and/or debt securities to decline.
We currently have a number of pipeline products in development. We and our development partners, as applicable, conduct extensive preclinical studies and clinical trials to demonstrate the safety and efficacy in humans of our pipeline products in order to obtain regulatory approval for the sale of our pipeline products. Preclinical studies and clinical trials are expensive, complex, can take many years and have uncertain outcomes. None of, or only a small number of, our research and development programs may actually result in the commercialization of a product. We will not be able to commercialize our pipeline products if preclinical studies do not produce successful results or if clinical trials do not demonstrate safety and efficacy in humans. While we expect significant revenues from our Significant Seven, there is no evidence we will get FDA approval for all of these products. Furthermore, success in preclinical studies or early-stage clinical trials does not ensure that later stage clinical trials will be
24
successful nor does it ensure that regulatory approval for the product candidate will be obtained. In addition, the process for the completion of pre-clinical and clinical trials is lengthy and may be subject to a number of delays for various reasons, which would delay the commercialization of any successful product. If our development projects are not successful or are significantly delayed, we may not recover our substantial investments in the pipeline product and our failure to bring these pipeline products to market on a timely basis, or at all, could have a material adverse effect on our business, financial condition, cash flows and results of operations and could cause the market value of our common shares and/or debt securities to decline.
In addition, FDA and Health Canada approval must be obtained in the U.S. and Canada, respectively, EMA approval (drugs) and CE Marking (devices) must be obtained in countries in the EU and similar approvals must be obtained from comparable agencies in other countries, prior to marketing or manufacturing new pharmaceutical and medical device products for use by humans. Obtaining such regulatory approvals for new products and devices and manufacturing processes can take a number of years and involves the expenditure of substantial resources. Even if such products appear promising in development stages, regulatory approval may not be achieved and no assurance can be given that we will obtain approval in those countries where we wish to commercialize such products. Nor can any assurance be given that if such approval is secured, the approved labeling will not have significant labeling limitations, including limitations on the indications for which we can market a product, or require onerous risk management programs. Furthermore, from time to time, changes to the applicable legislation or regulations may be introduced that change these review and approval processes for our products, which changes may make it more difficult and costly to obtain or maintain regulatory approvals.
Our marketed drugs will be subject to ongoing regulatory review.
Following initial regulatory approval of any products, we or our partners may develop or acquire, we will be subject to continuing regulatory review by various government authorities in those countries where our products are marketed or intended to be marketed, including the review of adverse drug events and clinical results that are reported after product candidates become commercially available. In addition, we are subject to ongoing audits and investigations of our facilities and products by the FDA, as well as other regulatory agencies in and outside the U.S.
If we fail to comply with the regulatory requirements in those countries where our products are sold, we could lose our marketing approvals or be subject to fines or other sanctions. Also, as a condition to granting marketing approval of a product, the applicable regulatory agencies may require a company to conduct additional clinical trials or remediate Current Good Manufacturing Practice ("CGMP") issues, the results of which could result in the subsequent loss of marketing approval, changes in product labeling or new or increased concerns about side effects or efficacy of a product.
In May 2017, the European Commission published the Medical Device Regulation (MDR) 2017/745, which replaced the Medical Device Directive (MDD). Pursuant to the terms of the new regulations, in order to continue to market medical device products in the EU, such products must achieve compliance with these new regulations and be re-registered in the EU within a specified transition period, which, for a portion of products, will end as early as May 26, 2020. These new regulations impact all of our existing and pipeline medical device products being sold in the EU for which we are legal manufacturer and/or distributor, including contact lens, lens care, eye-health, aesthetic and surgical areas, as well as certain of our products outside the EU, which rely on the EU registration to support registration in those other countries. These products, in the aggregate, account for a meaningful portion of our net revenue in this region. While we are working to ensure compliance with these new regulations for all impacted products, we may not be able to achieve compliance for all products within the applicable transition period. If we fail to achieve compliance, we will not be able to market and sell the non-compliant products in the EU, nor will we be able to rely on the non-compliant registration for such products in regions outside of the EU, which could have a material adverse effect on our business, financial condition, cash flows and results of operations in the EU and, possibly, on a consolidated basis, and could cause the market value of our common shares and/or debt securities to decline.
In addition, incidents of adverse drug reactions, unintended side effects or misuse relating to our products could result in additional regulatory controls or restrictions, or even lead to the regulatory authority requiring us to withdraw the product from the market. Further, if faced with these incidents of adverse drug reactions, unintended side effects or misuse relating to our products, we may elect to voluntarily implement a recall or market withdrawal of our product. A recall or market withdrawal, whether voluntary or required by a regulatory authority, may involve significant costs to us, potential disruptions in the supply of our products to our customers and reputational harm to our products and business, all of which could harm our ability to market our products and could have a material adverse effect on our business, financial condition, cash flows and results of operations and could cause the market value of our common shares and/or debt securities to decline.
The United Kingdom’s exit from the European Union may impact the development and the regulatory approval and review of our products.
On June 23, 2016, the United Kingdom held a referendum on its membership in the European Union, in which United Kingdom voters approved an exit from the European Union (“Brexit”). On March 29, 2017, the United Kingdom formally notified the
25
European Council pursuant to Article 50 of the Treaty of Lisbon of its intention to leave the European Union. Since a significant proportion of the United Kingdom’s regulatory framework is derived from European Union directives and regulations, Brexit could materially impact the regulatory regime with respect to the approval of our products in the United Kingdom. Following the Brexit vote, the European Union decided to move the European Medicines Agency’s headquarters from the United Kingdom to the Netherlands, which could result in disruptions and delays in new drug approvals in the European Union. In addition, we could face new regulatory costs and challenges that could have a material adverse effect on our business, financial condition, cash flows and results of operations. While the United Kingdom is currently expected to leave the European Union on March 29, 2019, uncertainty remains as to the exact timing and process. Until Brexit negotiations are completed, it is difficult to anticipate Brexit’s potential impact.
Manufacturing and Supply Risks
If we or our third-party manufacturers are unable to manufacture our products or the manufacturing process is interrupted due to failure to comply with regulations or for other reasons, the interruption of the manufacture of our products could adversely affect our business. Other manufacturing and supply difficulties or delays may also have a material adverse effect on our business, financial condition, cash flows and results of operations and could cause the market value of our common shares and/or debt securities to decline.
Our manufacturing facilities and those of our contract manufacturers must be inspected and found to be in full compliance with CGMP, quality system management requirements or similar standards before approval for marketing. Compliance with CGMP regulations requires the dedication of substantial resources and requires significant expenditures. In addition, while we attempt to build in certain contractual obligations on our third party manufacturers, we may not be able to ensure that such third-parties comply with these obligations. Our failure or that of our contract manufacturers to comply with CGMP regulations, quality system management requirements or similar regulations outside of the U.S. could result in enforcement action by the FDA or its foreign counterparts, including, but not limited to, warning letters, fines, injunctions, civil or criminal penalties, recall or seizure of products, total or partial suspension of production or importation, suspension or withdrawal of regulatory approval for approved or in-market products, refusal of the government to renew marketing applications or approve pending applications or supplements, refusal of certificates for export to foreign jurisdictions, suspension of ongoing clinical trials, imposition of new manufacturing requirements, closure of facilities and criminal prosecution. These enforcement actions could lead to a delay or suspension in production, which could have a material adverse effect on our competitive position, business, financial condition, results of operations and cash flows.
In addition, our manufacturing and other processes use complicated and sophisticated equipment, which sometimes requires a significant amount of time to obtain and install. Manufacturing complexity, testing requirements and safety and security processes combine to increase the overall difficulty of manufacturing these products and resolving manufacturing problems that we may encounter. Although we endeavor to properly maintain our equipment (and require our contract manufacturers to properly maintain their equipment), including through on-site quality control and experienced manufacturing supervision, and have key spare parts on hand, our business could suffer if certain manufacturing or other equipment, or all or a portion of our or their facilities, were to become inoperable for a period of time. We could experience substantial production delays or inventory shortages in the event of any such occurrence until we or they repair such equipment or facility or we or they build or locate replacement equipment or a replacement facility, as applicable, and seek to obtain necessary regulatory approvals for such replacement. Any interruption in our manufacture of products could adversely affect the sales of our current products or introduction of new products and could have a material adverse effect on our business, financial condition, cash flows and results of operations and could cause the market value of our common shares and/or debt securities to decline.
The supply of our products to our customers (or, in some case, supply from our contract manufacturers to us) is subject to and dependent upon the use of transportation services. Disruption of transportation services (including as a result of weather conditions) could have a material adverse effect on our business, financial condition, cash flows and results of operations and could cause the market value of our common shares and/or debt securities to decline. In addition, any prolonged disruption in the operations of our existing distribution facilities, whether due to technical, labor or other difficulties, weather conditions, equipment malfunction, contamination, failure to follow specific protocols and procedures, destruction of or damage to any facility or other reasons, could have a material adverse effect on our business, financial condition, cash flows and results of operations and could cause the market value of our common shares and/or debt securities to decline.
For some of our finished products and raw materials, we obtain supply from one or a limited number of sources. If we are unable to obtain components or raw materials, or products supplied by third parties, our ability to manufacture and deliver our products to the market would be impeded, which could have a material adverse effect on our business, financial condition, cash flows and results of operations and could cause the market value of our common shares and/or debt securities to decline.
Some components and raw materials used in our manufactured products, and some finished products sold by us, are currently available only from one or a limited number of domestic or foreign suppliers. For example, with respect to some of our largest or
26
most significant products, the supply of the finished product for each of our Siliq
™
, Vyzulta
®
, SofLens
®
, Wellbutrin XL
®
, Ocuvite
®
, PreserVision
®
, Renu
®
, Isuprel
®
, Xenazine
®
, Uceris
®
tablet, Relistor
®
Oral and PureVision
®
products are only available from a single source and the supply of active pharmaceutical ingredient for each of our Siliq
™
,
Isuprel
®
, Xenazine
®
, Relistor
®
Oral and Uceris
®
tablet products are also only available from a single source. In the event an existing supplier fails to supply product on a timely basis and/or in the requested amount, supplies product that fails to meet regulatory requirements, becomes unavailable through business interruption or financial insolvency or loses its regulatory status as an approved source or we are unable to renew current supply agreements when such agreements expire and we do not have a second supplier, we may be unable to obtain the required components, raw materials or products on a timely basis or at commercially reasonable prices. We attempt to mitigate these risks by maintaining safety stock of these products, but such safety stock may not be sufficient. In addition, in some cases, only a single source of active pharmaceutical ingredient is identified in filings with regulatory agencies, including the FDA, and cannot be changed without prior regulatory approval, which would involve time and expense to us. A prolonged interruption in the supply of a single-sourced raw material, including the active pharmaceutical ingredient, or single-sourced finished product could have a material adverse effect on our business, financial condition, cash flows and results of operations and could cause the market value of our common shares and/or debt securities to decline. In addition, these third-party manufacturers may have the ability to increase the supply price payable by us for the manufacture and supply of our products, in some cases without our consent.
As a result, our dependence upon others to manufacture our products may adversely affect our profit margins and our ability to obtain approval for and produce our products on a timely and competitive basis, which could have a material adverse effect on our business, financial condition, cash flows and results of operations and could cause the market value of our common shares and/or debt securities to decline.
Risks Relating to Specific Legislation and Regulations
We are subject to various laws and regulations, including “fraud and abuse” laws, anti-bribery laws, environmental laws and privacy and security regulations, and a failure to comply with such laws and regulations or prevail in any litigation related to noncompliance could have a material adverse effect on our business, financial condition, cash flows and results of operations and could cause the market value of our common shares and/or debt securities to decline.
Pharmaceutical and medical device companies have faced lawsuits and investigations pertaining to violations of health care “fraud and abuse” laws, such as the federal False Claims Act, the federal Anti-Kickback Statute (“AKS”) and other state and federal laws and regulations. The AKS prohibits, among other things, knowingly and willfully offering, paying, soliciting or receiving remuneration to induce or in return for purchasing, leasing, ordering or arranging for the purchase, lease or order of any health care item or service reimbursable under federally financed health care programs. This statute has been interpreted to apply to arrangements between pharmaceutical or medical device manufacturers, on the one hand, and prescribers, purchasers, formulary managers and other health care related professionals, on the other hand. More generally, the federal False Claims Act, among other things, prohibits any person from knowingly presenting, or causing to be presented, a false claim for payment to the federal government. Pharmaceutical and medical device companies have been prosecuted or faced civil liability under these laws for a variety of alleged promotional and marketing activities, including engaging in off-label promotion that caused claims to be submitted for non-covered off-label uses. If we are in violation of any of these requirements or any such actions are instituted against us, and we are not successful in defending ourselves or asserting our rights, this could have a significant impact on our business, including the imposition of significant criminal and civil fines and penalties, exclusion from federal health care programs or other sanctions, including consent orders or corporate integrity agreements.
We also face increasingly strict and numerous data privacy and security laws and regulations in the U.S. and in other countries, the violation of which could result in fines and other sanctions. These laws and regulations change frequently and can conflict with one another. The interpretation and application of certain laws and regulation, such as the European Union’s General Data Protection Regulation, is unclear at this time. It is possible that the scope and requirements of these laws and regulations may be interpreted or applied in a manner that is inconsistent with our understanding, our current or future practices or other legal requirements. In addition, the U.S. Department of Health and Human Services Office of Inspector General recommends, and increasingly states require pharmaceutical companies to have comprehensive compliance programs. In addition, the Physician Payment Sunshine Act enacted in 2010 imposes reporting and disclosure requirements on device and drug manufacturers for any “transfer of value” made or distributed to prescribers and other health care providers. Failure to submit this required information may result in significant civil monetary penalties. While we have developed corporate compliance programs based on what we believe to be current best practices, we cannot provide assurance that we or our employees or agents are or will be in compliance with all applicable federal, state or foreign regulations and laws. If we are in violation of any of these requirements or any such actions are instituted against us, and we are not successful in defending ourselves or asserting our rights, those actions could have a significant impact on our business, including the imposition of significant criminal and civil fines and penalties, exclusion from federal health care programs or other sanctions, including consent orders or corporate integrity agreements.
27
The U.S. FCPA and similar worldwide anti-bribery laws generally prohibit companies and their intermediaries from making improper payments to officials for the purpose of obtaining or retaining business. Our policies mandate compliance with these anti-bribery laws. We operate in many parts of the world that have experienced governmental corruption and in certain circumstances, strict compliance with anti-bribery laws may conflict with local customs and practices or may require us to interact with doctors and hospitals, some of which may be state controlled, in a manner that is different than in the U.S. and Canada. We cannot provide assurance that our internal control policies and procedures will protect us from reckless or criminal acts committed by our employees or agents. Violations of these laws, or allegations of such violations, could disrupt our business and result in criminal or civil penalties or remedial measures, any of which could have a material adverse effect on our business, financial condition, cash flows and results of operations and could cause the market value of our common shares and/or debt securities to decline.
We are subject to laws and regulations concerning the environment, safety matters, regulation of chemicals and product safety in the countries where we manufacture and sell our products or otherwise operate our business. These requirements include, among other matters, regulation of the handling, manufacture, transportation, storage, use and disposal of materials, including the discharge of pollutants into the environment. In the normal course of our business, hazardous substances may be released into the environment, which could cause environmental or property damage or personal injuries, and which could subject us to remediation obligations regarding contaminated soil and groundwater or potential liability for damage claims. Under certain laws, we may be required to remediate contamination at certain of our properties regardless of whether the contamination was caused by us or by previous occupants of the property or by others and at third-party sites where we send waste. In recent years, the operations of all companies have become subject to increasingly stringent legislation and regulation related to occupational safety and health, product registration and environmental protection. Such legislation and regulations are complex and constantly changing, and future changes in laws or regulations may require us to install additional controls for certain of our emission sources, undertake changes in our manufacturing processes or remediate soil or groundwater contamination at facilities where such cleanup is not currently required.
We are also subject to various data privacy and security laws and regulations specific to sensitive health information, including HIPAA. HIPAA mandates, among other things, the adoption of uniform standards for the electronic exchange of information in common health care transactions (e.g., health care claims information and plan eligibility, referral certification and authorization, claims status, plan enrollment, coordination of benefits and related information), as well as standards relating to the privacy and security of individually identifiable health information, which require the adoption of administrative, physical and technical safeguards to protect such information. In addition, many states have enacted comparable laws addressing the privacy and security of health information, some of which are more stringent than HIPAA. Failure to comply with these laws can result in the imposition of significant civil and criminal penalties. The costs of compliance with these laws and the potential liability associated with the failure to comply with these laws could have a material adverse effect on our business, financial condition, cash flows and results of operations and could cause the market value of our common shares and/or debt securities to decline.
We are also subject to U.S. federal laws regarding reporting and payment obligations with respect to our participation in federal health care programs, including Medicare and Medicaid. Because our processes for calculating applicable government prices and the judgments involved in making these calculations involve subjective decisions and complex methodologies, these calculations are subject to risk of errors and differing interpretations. In addition, they are subject to review and challenge by the applicable governmental agencies, and it is possible that such reviews could result in changes that could have material adverse legal, regulatory, or economic consequences.
Legislative or regulatory reform of the health care system may affect our ability to sell our products profitably and could have a material adverse effect on our business, financial condition, cash flows and results of operations and could cause the market value of our common shares and/or debt securities to decline.
In the U.S. and certain foreign jurisdictions, there have been a number of legislative and regulatory proposals to change the health care system in ways that could impact our ability to sell our products profitably. The Patient Protection and Affordable Care Act, as amended by the Health Care Reform Act may affect the operational results of companies in the pharmaceutical and medical device industries, including the Company and other health care related industries, by imposing on them additional costs. Effective January 1, 2010, the Health Care Reform Act increased the minimum Medicaid drug rebates for pharmaceutical companies, expanded the 340B drug discount program, and made changes to affect the Medicare Part D coverage gap, or “donut hole.” The law also revised the definition of “average manufacturer price” for reporting purposes, which may affect the amount of our Medicaid drug rebates to states. Beginning in 2011, the law imposed a significant annual fee on companies that manufacture or import branded prescription drug products. The law also imposed an annual tax on manufacturers of certain medical devices. The tax was deferred until January 1, 2020. More recently, the Bipartisan Budget Act of 2018 amended the Patient Protection and Affordable Care Act, effective January 1, 2019, to close the donut hole in most Medicare drug plans. In addition, in April 2018, the Centers for Medicare & Medicaid Services published a final rule that gives states greater flexibility in setting benchmarks for insurers in
28
the individual and small group marketplaces, which may have the effect of relaxing the essential health benefits required under the Patient Protection and Affordable Care Act for plans sold through such marketplaces.
A
lthough efforts at replacing the Health Care Reform Act have stalled in Congress, there could still be changes to this legislation in the near term. We cannot predict what those changes will be or when they will take effect, and we could face additional risks arising from such changes or changed interpretations of our obligations under the legislation. Because of this continued uncertainty, including the potential for further legal challenges or repeal of that legislation, we cannot quantify or predict with any certainty the likely impact of the Health Care Reform Act or its repeal on our business model, prospects, financial condition or results of operations, in particular on the pricing, coverage or reimbursement of any of our product candidates that may receive marketing approval. Additionally, policy efforts designed specifically to reduce patient out-of-pocket costs for medicines could result in new mandatory rebates and discounts or other pricing restrictions. Legislative efforts relating to drug pricing, the cost of prescription drugs under Medicare, the relationship between pricing and manufacturer patient programs, and government program reimbursement methodologies for drugs have been proposed and considered at the U.S. federal and state level. At the federal level, the administration's budget proposal for fiscal year 2019 contains further drug price control measures that could be enacted during the 2019 budget process or in other future legislation, including, for example, measures to permit Medicare Part D plans to negotiate the price of certain drugs under Medicare Part B, to allow some states to negotiate drug prices under Medicaid and to eliminate cost sharing for generic drugs for low-income patients. While any proposed measures will require authorization through additional legislation to become effective, Congress and the administration have each indicated an intent to continue to seek new legislative or administrative measures to control drug costs. At the state level, legislatures have increasingly passed legislation and implemented regulations designed to control pharmaceutical product pricing, including price or patient reimbursement constraints, discounts, restrictions on certain product access and marketing cost disclosure and transparency measures, and, in some cases, designed to encourage importation from other countries and bulk purchasing. We also anticipate that Congress, state legislatures, and third-party payors may continue to review and assess alternative health care delivery and payment systems and may in the future propose and adopt legislation or policy changes or implementations effecting additional fundamental changes in the health care delivery system. We cannot provide assurance as to the ultimate content, timing, or effect of changes, nor is it possible at this time to estimate the impact of any such potential legislation.
The Health Care Reform Act and further changes to health care laws or regulatory framework that reduce our revenues or increase our costs could also have a material adverse effect on our business, financial condition, cash flows and results of operations and could cause the market value of our common shares and/or debt securities to decline.
Other Risks
We have significant goodwill and other intangible assets and potential impairment of goodwill and other intangibles may have a significant adverse impact on our profitability.
Goodwill and intangible assets represent a significant portion of our total assets. Finite-lived intangible assets are subject to an impairment analysis whenever events or changes in circumstances indicate the carrying amount of the asset may not be recoverable. Goodwill and indefinite-lived intangible assets are tested for impairment annually, or more frequently if events or changes in circumstances indicate that the asset may be impaired. If impairment exists, we would be required to take an impairment charge with respect to the impaired asset.
For example, in 2018, 2017 and 2016, we recognized impairments to finite-lived and indefinite-lived intangible assets of
$568 million
,
$714 million
and
$422 million
, respectively.
These asset impairments were primarily attributable to: (i) assets being classified as held for sale and (ii) revisions in sales forecasts associated with discontinuances, generic competition and other market forces.
In addition to impairments to finite-lived and indefinite-lived intangible assets, in 2018, 2017 and 2016, we recognized goodwill impairments of
$2,322 million
, $312 million and $1,077 million, respectively.
These goodwill impairments were primarily the result of: (i) the adoption of new accounting guidance in 2018, (ii) revisions to forecasts to certain reporting units and (iii) realignments to our reporting units.
As of October 1, 2018, the date of the Company's annual impairment testing, the fair value of each reporting unit with associated goodwill exceeded its carrying value by more than
15%
. If market conditions deteriorate, or if the Company is unable to execute its strategies, it may be necessary to record impairment charges in the future.
See
Note 6, "FAIR VALUE MEASUREMENTS"
and
Note 9, "INTANGIBLE ASSETS AND GOODWILL"
to our audited Consolidated Financial Statements for further information on these impairment charges.
Events giving rise to impairment are difficult to predict, including the uncertainties associated with the launch of new products, and are an inherent risk in the pharmaceutical and medical device industries. As a result of the significance of goodwill and intangible assets, our financial condition and results of operations in a future period could be negatively impacted should such an
29
impairment of goodwill or intangible assets occur, which could cause the market value of our common shares and/or debt securities to decline. We may be required to take additional impairment charges in the future and such impairment charges may be material.
We have become increasingly dependent on information technology and any breakdown, interruption or breach of our information technology systems could subject us to liability or interrupt the operation of our business, which could have a material adverse effect on our business, financial condition, cash flows and results of operations and could cause the market value of our common shares and/or debt securities to decline.
We are increasingly dependent upon our information technology systems and infrastructure, as well as those of third parties with whom we interact, in connection with the conduct of our business, including the collection, storage, processing and transmission of sensitive, non-public information. We must constantly update our information technology infrastructure and we cannot provide assurance that various current information technology systems on which we depend will continue to meet our current and future business needs or adequately safeguard our operations. Furthermore, modification, upgrade or replacement of such systems may be costly.
Due to the size and complexity of these systems, any breakdown, interruption, corruption or unauthorized access to or cyber-attack on these systems could create system disruptions, shutdowns or unauthorized disclosure of confidential information. Cyber-attacks are increasing in frequency, sophistication and intensity. Cyber-attacks could include the deployment of harmful malware, denial-of-service attacks, worms, social engineering and other means to affect service reliability or threaten data confidentiality, integrity or availability. Techniques used in these attacks change frequently and may be difficult to detect for periods of time. We have established (i) physical, electronic and organizational measures to safeguard and secure our systems to prevent a data compromise, (ii) policies and procedures designed to provide for the timely investigation of cybersecurity incidents and the timely disclosure of cybersecurity incidents consistent with our legal and contractual obligations and (iii) safeguards against insider trading of directors, officers and other corporate insiders between the period of investigation and the public disclosure of such an incident. We also rely on commercially available systems, software, tools and monitoring to provide security for the processing, transmission and storage of digital information. While we attempt to take appropriate security and cybersecurity measures to protect our data and information technology systems and to prevent breakdowns, unauthorized breaches and cyber-attacks, we cannot guarantee that these measures will be successful and that these breakdowns and breaches in, or attacks on, our systems and data will be prevented. Such breakdowns, breaches in, or attacks on, our systems and data or public perception that we have suffered a cybersecurity incident or breakdown may cause business interruption and could have a material adverse effect on our business, financial condition, cash flows and results of operations, damage our reputation with customers, employees and third- parties with whom we do business and cause the market value of our common shares and/or debt securities to decline, and we may suffer financial damage or other loss, including fines or criminal penalties because of lost or misappropriated information. While we maintain insurance against these risks, this insurance may not be sufficient to cover the financial, legal, business or reputational losses that may result from a cybersecurity incident or other interruption to our information technology systems.
In addition, we provide confidential, proprietary and personal information to third parties when necessary to pursue our business objectives. While we obtain assurances that these third parties will protect this information and, where appropriate, monitor the protections employed by these third parties, there is a risk that the confidentiality of data held by third parties may be compromised. If personal information of our customers or employees is misappropriated, our reputation with our customers and employees may be injured, resulting in loss of business and/or morale, and we may incur costs to remediate possible injury to our customers and employees or be required to pay fines or take other action with respect to judicial or regulatory actions arising out of such incidents.
Our operating results and financial condition may fluctuate.
Our operating results and financial condition may fluctuate from quarter to quarter for a number of reasons. In addition, our stock price is volatile. The following events or occurrences, among others, could cause fluctuations in our financial performance and/or stock price from period to period:
|
•
|
development and launch of new competitive products;
|
|
•
|
the timing and receipt of FDA approvals or lack of approvals;
|
|
•
|
costs related to business development transactions;
|
|
•
|
changes in the amount we spend to promote our products;
|
|
•
|
delays between our expenditures to acquire new products, technologies or businesses and the generation of revenues from those acquired products, technologies or businesses;
|
|
•
|
changes in treatment practices of physicians that currently prescribe certain of our products;
|
|
•
|
increases in the cost of raw materials used to manufacture our products;
|
|
•
|
FDA regulatory actions relating to our manufacturers;
|
|
•
|
manufacturing and supply interruptions;
|
|
•
|
our responses to price competition;
|
30
|
•
|
new legislation that would control or regulate the prices of drugs;
|
|
•
|
a protracted and wide-ranging trade conflict between the United States and China;
|
|
•
|
expenditures as a result of legal actions (and settlements thereof), including the defense of our patents and other intellectual property;
|
|
•
|
market acceptance of our products;
|
|
•
|
the timing of wholesaler and distributor purchases and success of our wholesaler and distributor arrangements;
|
|
•
|
general economic and industry conditions, including potential fluctuations in interest rates;
|
|
•
|
changes in seasonality of demand for certain of our products;
|
|
•
|
foreign currency exchange rate fluctuations;
|
|
•
|
changes to, or the confidence in, our business strategy;
|
|
•
|
changes to, or the confidence in, our management; and
|
|
•
|
expectations for future growth.
|
As a result, we believe that quarter-to-quarter comparisons of results from operations, or any other similar period-to-period comparisons, should not be construed as reliable indicators of our future performance. In any quarterly period, our results may be below the expectations of market analysts and investors, which could cause the market value of our common shares and/or debt securities to decline.
The restatement of our previously issued financial statements was time-consuming and expensive and could expose us to additional risks that could have a material adverse effect on our business, financial condition, cash flows and results of operations and could cause the market value of our common shares and/or debt securities to decline.
We restated our previously issued audited Consolidated Financial Statements for the year ended December 31, 2014 and the unaudited financial information for the quarters ended December 31, 2014 and March 31, 2015. This restatement and the review of the misstatements that necessitated the restatement was time consuming and expensive and could expose us to potential claims and additional risks that could have a material adverse effect on our business, financial condition, cash flows and results of operations and could cause the market value of our common shares and/or debt securities to decline. In particular, we could be subject to further shareholder litigation and additional governmental investigations and proceedings in connection with the restatements or related other matters. If we do not prevail in any such proceedings, we could be required to pay substantial damages or settlement costs. In addition, although the remediation of the material weaknesses in our internal control over financial reporting that contributed to the material misstatements in the Consolidated Financial Statements previously described has been completed, if our remedial measures were insufficient to properly and fully address the material weaknesses, or if additional material weaknesses in our internal controls are discovered or occur in the future, it may materially adversely affect our ability to report our financial condition and results of operations in a timely and accurate manner and there will continue to be an increased risk of future misstatements.
We have entered into distribution agreements with other companies to distribute certain of our products at supply prices based on net sales. Declines in the pricing and/or volume, over which we have no or limited control, of such products, and therefore the amounts paid to us, could have a material adverse effect on our business, financial condition, cash flows and results of operations and could cause the market value of our common shares and/or debt securities to decline.
Certain of our products are the subject of third-party distribution or sublicense agreements, pursuant to which we may manufacture and sell products to other companies, which distribute such products in return for a royalty or a supply price, in both cases which are often based on net sales. Our ability to control pricing and volume of these products may be limited and, in some cases, these companies make all distribution and pricing decisions independently of us. If the pricing or volume of such products declines, our revenues would be adversely impacted which could have a material adverse effect on our business, financial condition, cash flows and results of operations and could cause the market value of our common shares and/or debt securities to decline.
The illegal distribution and sale of counterfeit versions of our products may reduce demand for our products or have a negative impact on the reputation of our products, which could have a material adverse effect on our business, financial condition, cash flows and results of operations and could cause the market value of our common shares and/or debt securities to decline.
Third parties may illegally distribute and sell counterfeit versions of our products, which do not meet or adhere to the rigorous quality, safety, manufacturing, storage and handling standards and regulations that apply to our products. The prevalence of counterfeit products is a growing industry-wide issue due to the widespread use of the Internet, which has greatly facilitated the ease by which counterfeit products can be advertised, purchased and delivered. The discovery of safety or efficacy issues, adverse events or even death or personal injury associated with or caused by counterfeit products may be attributed to our products and may cause reputational harm to our products or the Company. We may not be able to detect or, if detected, prevent or prohibit the sale of such counterfeit products. As a result, the illegal sale or distribution of counterfeit products may negatively impact the demand for and sales of our products, which could have a material adverse effect on our business, financial condition, cash flows and results of operations and could cause the market value of our common shares and/or debt securities to decline.
31
Our revenues and profits could be reduced by imports from countries where our products are available at lower prices.
Prices for our products are based on local market economics and competition and differ from country to country. Our sales in countries with relatively higher prices may be reduced if products can be imported into those or other countries from lower price markets. If this happens with our products, our revenues and profits may be adversely affected, which could have a material adverse effect on our business, financial condition, cash flows and results of operations and could cause the market value of our common shares and/or debt securities to decline.
Our policies regarding returns, allowances and chargebacks, and marketing programs adopted by wholesalers, may reduce our revenues in future fiscal periods.
We provide certain rebates, allowances, chargebacks and other credits to our customers with respect to certain of our products. For example, we make payments or give credits to certain wholesalers for the difference between the invoice price paid to us by our wholesaler customer for a particular product and the negotiated price that such wholesaler sells such products to its hospitals, group purchasing organizations, pharmacies or other retail customers. We also give certain of our customers credits on our products that such customers hold in inventory after we have decreased the WAC prices of such products, such credit being for the difference between the old and new price. In addition, we also implement and maintain returns policies, pursuant to which our customers may return product to us in certain circumstances in return for a credit. Although we establish reserves based on our prior experience, wholesaler data, then-current on-hand inventory, our best estimates of the impact that these policies may have in subsequent periods and certain other considerations, we cannot ensure that our reserves are adequate or that actual product returns, rebates, allowances and chargebacks will not exceed our estimates, which could have a material adverse effect on our business, financial condition, cash flows and results of operations and could cause the market value of our common shares and/or debt securities to decline.
We may experience declines in sales volumes or prices of certain of our products as the result of the concentration of sales to wholesalers and the continuing trend towards consolidation of such wholesalers and other customer groups and this could have a material adverse effect on our business, financial condition, cash flows and results of operations and could cause the market value of our common shares and/or debt securities to decline.
For certain of our products, a significant portion of our sales are to a relatively small number of customers. If our relationship with one or more of such customers is disrupted or changes adversely or if one or more of such customers experience financial difficulty or other material adverse changes in their businesses, it could materially and adversely affect our sales and financial results, which could have a material adverse effect on our business, financial condition, cash flows and results of operations and could cause the market value of our common shares and/or debt securities to decline.
In addition, wholesalers and retail drug chains have undergone, and are continuing to undergo, significant consolidation. This consolidation may result in these groups gaining additional purchasing leverage and consequently increasing the product pricing pressures facing our business. The result of these developments could have a material adverse effect on our business, financial condition, cash flows and results of operations and could cause the market value of our common shares and/or debt securities to decline.
We have various indemnity agreements and indemnity arrangements in place, which may result in an obligation to indemnify or reimburse the relevant counterparty, which amounts may be material.
All directors and/or officers of the Company, and each of its various subsidiary entities, are indemnified by the Company in respect of their service as directors and/or officers, subject to certain restrictions. We have purchased directors’ and officers’ liability insurance to mitigate the cost of any potential future lawsuits or actions. The maximum amount of any potential future payment cannot be reasonably estimated but could have a material adverse effect on the Company.
In the normal course of business, we have entered or may enter into agreements that include indemnities in favor of third parties, such as purchase and sale agreements, license agreements, engagement letters with advisors and consultants and various product and service agreements. These indemnification arrangements may require us to compensate counterparties for losses incurred by the counterparties as a result of breaches in representations, covenants and warranties provided by us or as a result of litigation or other third-party claims or statutory sanctions that may be suffered by the counterparties as a consequence of the relevant transaction. In some instances, the terms of these indemnities are not explicitly defined. We, whenever possible, try to limit this potential liability within the particular agreement or contract, but due to the unpredictability of future events the maximum amount of any potential reimbursement cannot be reasonably estimated, but could have a material adverse effect on the Company.
Item 1B. Unresolved Staff Comments
None.
32
Item 2. Properties
We own and lease a number of important properties. Our headquarters and one of our manufacturing facilities are located in Laval, Quebec. We own several manufacturing facilities throughout the U.S. We also own or have an interest in manufacturing plants or other properties outside the U.S., including in Canada, Mexico, and certain countries in Europe, North Africa, Asia and South America.
We consider our facilities to be in satisfactory condition and suitable for their intended use, although some limited investments to improve our manufacturing and other related facilities are contemplated, based on the needs and requirements of our business. Our administrative, marketing, research/laboratory, distribution and warehousing facilities are located in various parts of the world. We co-locate our R&D activities with our manufacturing at the plant level in a number of facilities. Our scientists, engineers, quality control and manufacturing technicians work side-by-side in designing and manufacturing products that fit the needs and requirements of our customers, regulators and business units.
We believe that we have sufficient facilities to conduct our operations during
2019
. Our facilities in aggregate are over 12 million square feet and include, among others, the following list of principal properties by segment:
|
Location
|
Purpose
|
Owned
or
Leased
|
Approximate
Square
Footage
|
||||
|
Corporate & Administration
|
|||||||
|
Laval, Quebec, Canada
|
Corporate headquarters, R&D, manufacturing and warehouse facility
|
Owned
|
337,000
|
|
|||
|
Bridgewater, New Jersey
(1)
|
Administration
|
Leased
|
310,000
|
|
|||
|
Bausch + Lomb/International
|
|
|
|
||||
|
Jelenia Gora, Poland
|
Offices, R&D, manufacturing and warehouse facility
|
Owned
|
1,570,000
|
|
|||
|
Rochester, New York
|
Offices, R&D and manufacturing facility
|
Owned
|
966,000
|
|
|||
|
San Juan del Rio, Mexico
|
Offices and manufacturing facility
|
Owned
|
853,000
|
|
|||
|
El Obour City, Egypt
|
Offices, R&D, manufacturing and warehouse facility
|
Owned
|
628,000
|
|
|||
|
Waterford, Ireland
|
R&D and manufacturing facility
|
Owned
|
500,000
|
|
|||
|
Greenville, South Carolina
|
Distribution facility
|
Leased
|
432,000
|
|
|||
|
Jinan, China
|
Offices and manufacturing facility
|
Owned
|
420,000
|
|
|||
|
Rzeszow, Poland
|
Offices, R&D, manufacturing and warehouse facility
|
Owned
|
380,000
|
|
|||
|
Berlin, Germany
|
Manufacturing, distribution and office facility
|
Owned
|
339,000
|
|
|||
|
Greenville, South Carolina
|
Manufacturing and distribution facility
|
Owned
|
321,000
|
|
|||
|
Chattanooga, Tennessee
|
Distribution facility
|
Leased
|
320,000
|
|
|||
|
Tampa, Florida
|
R&D and manufacturing facility
|
Owned
|
176,000
|
|
|||
|
Porto Alegre, Brazil
|
Offices, manufacturing and warehouse facility
|
Owned
|
165,000
|
|
|||
|
Belgrade, Serbia
|
Offices and manufacturing facility
|
Owned
|
162,000
|
|
|||
|
Mexico City, Mexico
|
Offices and manufacturing facility
|
Owned
|
158,000
|
|
|||
|
Aubenas, France
|
Offices, manufacturing and warehouse facility
|
Owned
|
148,000
|
|
|||
|
St. Louis, Missouri
|
Manufacturing facility
|
Owned
|
140,000
|
|
|||
|
Cuautitlan Izcalli, Mexico
|
R&D and manufacturing facility
|
Leased
|
139,000
|
|
|||
|
Myslowice, Poland
|
Warehouse facility
|
Leased
|
136,000
|
|
|||
|
Macherio, Italy
|
Offices, R&D, manufacturing and warehouse facility
|
Owned
|
119,000
|
|
|||
|
Lynchburg, Virginia
|
Distribution facility
|
Owned
|
116,000
|
|
|||
|
Beijing, China
|
Warehouse facility and distribution
|
Leased
|
110,000
|
|
|||
|
Clearwater, Florida
|
Manufacturing facility
|
Owned
|
102,000
|
|
|||
|
Salix
|
|
|
|
||||
|
Steinbach, Manitoba, Canada
|
Offices, manufacturing and warehouse facility
|
Owned
|
241,000
|
|
|||
____________________________________
(1) — A lease for a second building in Bridgewater, New Jersey was signed in 2015 and was not included in the square footage shown in the table above as the Company never occupied the second building. In 2016, the Company concluded that it would not occupy the second building and recognized the appropriate charge for all future rents due, net of the anticipated sub-let income associated with the second building.
33
Item 3. Legal Proceedings
See
Note 20, "LEGAL PROCEEDINGS"
to our audited Consolidated Financial Statements for details on legal proceedings.
Item 4. Mine Safety Disclosures
Not applicable.
34
PART II
Item 5. Market for Registrant’s Common Equity, Related Stockholder Matters and Issuer Purchases of Equity Securities
Market Information
Our common shares are traded on the New York Stock Exchange (“NYSE”) and on the Toronto Stock Exchange (“TSX”) under the symbol “BHC”. The following table sets forth the high and low the market price of our common shares on the NYSE and TSX during the periods indicated.
|
|
NYSE in USD
|
TSX in CAD
|
||||||
|
|
High
|
Low
|
High
|
Low
|
||||
|
2018
|
|
|
|
|
||||
|
First quarter
|
24.43
|
14.44
|
30.56
|
18.62
|
||||
|
Second quarter
|
27.79
|
14.96
|
36.02
|
19.36
|
||||
|
Third quarter
|
25.88
|
20.38
|
33.44
|
26.83
|
||||
|
Fourth quarter
|
28.45
|
17.20
|
36.52
|
23.60
|
||||
|
2017
|
|
|
|
|
||||
|
First quarter
|
17.55
|
10.35
|
23.14
|
13.82
|
||||
|
Second quarter
|
18.25
|
8.31
|
23.75
|
11.20
|
||||
|
Third quarter
|
18.17
|
12.89
|
22.69
|
15.83
|
||||
|
Fourth quarter
|
22.81
|
10.94
|
29.28
|
14.01
|
||||
Sources: NYSE.com, TSX Historical Data Access
Market Price Volatility of Common Shares
Market prices for the securities of pharmaceutical, medical devices and biotechnology companies, including our securities, have historically been highly volatile, and the market has experienced significant price and volume fluctuations that are unrelated to the operating performance of particular companies. Factors such as fluctuations in our operating results, the aftermath of public announcements by us or by others about us, changes in our executive management, changes in our business strategy, concern as to the safety of drugs and medical devices, the commencement or outcome of legal or governmental proceedings, changes in our ability to access credit markets, changes in the cost of capital, investigations or inquiries, and general market conditions can have an adverse effect on the market price of our common shares and other securities. For example, during 2015 and 2016, we experienced significant fluctuations and decreases in the market price of our common shares as a result of, among other things, legal and governmental proceedings and investigations with respect to certain of our distribution, marketing, pricing, disclosure and accounting practices, rising interest rates and certain public allegations made by short sellers and other third parties relating to certain of these matters. See Item 1A “Risk Factors” of this Form 10-K for additional information.
Holders
The approximate number of holders of record of our common shares as of
February 14, 2019
was 1,885.
35
Performance Graph
The following graph compares the cumulative total return on a $100 investment on January 1, 2014, assuming reinvestment of all dividends, in: (i) our common shares, (ii) the S&P 500 Index, (iii) the S&P/TSX Composite Index and (iv) a composite peer group of 12 major U.S. based pharmaceutical companies for the five years ended
December 31, 2018
. The composite peer group of 12 major U.S.-based pharmaceutical companies consists of Allergan PLC, Amgen Inc., Biogen Inc., Bristol-Myers Squibb Co, Celgene Corp, Danaher Corp, Eli Lilly and Co, Gilead Sciences Inc., Mylan NV, Perrigo Company PLC, Shire PLC and Vertex Pharmaceuticals Inc.
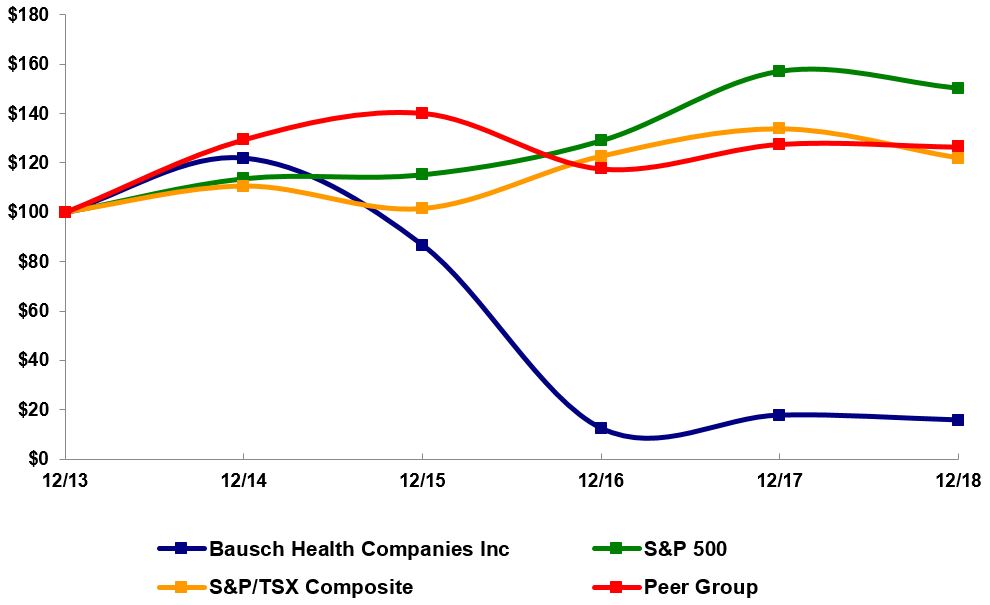
|
|
2013
|
2014
|
2015
|
2016
|
2017
|
2018
|
||||||
|
Bausch Health Companies Inc.
|
$100
|
$122
|
$87
|
$12
|
$18
|
$16
|
||||||
|
S&P 500
|
$100
|
$114
|
$115
|
$129
|
$157
|
$150
|
||||||
|
S&P/TSX Composite
|
$100
|
$111
|
$101
|
$123
|
$134
|
$122
|
||||||
|
Peer Group
|
$100
|
$130
|
$140
|
$118
|
$128
|
$126
|
||||||
Dividends
No dividends were declared or paid in
2018
,
2017
or
2016
. While our Board of Directors will review our dividend policy periodically, we currently do not intend to pay any cash dividends in the foreseeable future. In addition, our Restated Credit Agreement and indentures include restrictions on the payment of dividends. See
Note 11, "FINANCING ARRANGEMENTS"
to our audited Consolidated Financial Statements for further details regarding these restrictions.
Restrictions on Share Ownership by Non-Canadians
There are no limitations under the laws of Canada or in our organizational documents on the right of foreigners to hold or vote securities of our Company, except that the
Investment Canada Act (Canada)
(the “Investment Canada Act”) may require review and approval by the Minister of Innovation, Science and Economic Development (Canada) (the “Minister”) of an acquisition of “control” of our Company by a “non-Canadian”.
36
Investment Canada Act
An acquisition of control of a Canadian business by a non-Canadian is either reviewable (a “Reviewable Transaction”), in which case it is subject to both a reporting obligation and an approval process, or notifiable, in which case it is subject to only a reporting obligation. In the case of a Reviewable Transaction, the non-Canadian acquirer must submit an application for review with the prescribed information. The Minister is then required to determine whether the Reviewable Transaction is likely to be of net benefit to Canada, taking into account the assessment factors specified in the Investment Canada Act and any written undertakings that may have been given by the non-Canadian acquirer.
The Investment Canada Act provides that any investment by a non-Canadian in a Canadian business, even where control has not been acquired, can be reviewed on grounds of whether it may be injurious to national security. Where an investment is determined to be injurious to national security, Cabinet can prohibit closing or, if closed, can order the investor to divest control. Short of a prohibition or divestment order, Cabinet can impose terms or conditions on the investment or can require the investor to provide binding undertakings to remove the national security concern.
Competition Act
Part IX of the
Competition Act
(Canada) (the “Competition Act”) requires that a pre-merger notification filing be submitted to the Commissioner of Competition (the “Commissioner”) in respect of certain classes of merger transactions that exceed certain prescribed thresholds. If a proposed transaction exceeds such thresholds, subject to certain exceptions, the notification filing must be submitted to the Commissioner and the statutory waiting period must expire or be terminated early or waived by the Commissioner before the transaction can be completed.
All mergers, regardless of whether they are subject to Part IX of the Competition Act, are subject to the substantive mergers provisions under Section 92 of the Competition Act. In particular, the Commissioner may challenge a transaction before the Competition Tribunal where the transaction prevents or lessens, or is likely to prevent or lessen, competition substantially in a market. The Commissioner may not make an application to the Competition Tribunal under Section 92 of the Competition Act more than one year after the merger has been substantially completed.
Exchange Controls
Canada has no system of exchange controls. There are no Canadian restrictions on the repatriation of capital or earnings of a Canadian public company to non-resident investors. There are no laws in Canada or exchange restrictions affecting the remittance of dividends, profits, interest, royalties and other payments to non-resident holders of our securities, except as discussed in “Taxation” below.
Taxation
Canadian Federal Income Taxation
The following discussion is a summary of the principal Canadian federal income tax considerations generally applicable to a holder of our common shares who, at all relevant times, for purposes of the Income Tax Act (Canada) and the Income Tax Regulations (collectively, the “Canadian Tax Act”) deals at arm’s-length with, and is not affiliated with, our Company, beneficially owns its common shares as capital property, does not use or hold and is not deemed to use or hold such common shares in carrying on a business in Canada, does not with respect to common shares enter into a “derivative forward agreement” as defined in the Income Tax Act, and who, at all relevant times, for purposes of the application of the Canadian Tax Act and the Canada-U.S. Income Tax Convention (1980, as amended) (the “U.S. Treaty”), is resident in the U.S., is not, and is not deemed to be, resident in Canada and is eligible for benefits under the U.S. Treaty (a “U.S. Holder”). Special rules, which are not discussed in the summary, may apply to a non-resident holder that is an insurer that carries on an insurance business in Canada and elsewhere or that is an “authorized foreign bank” as defined in the Canadian Tax Act.
The U.S. Treaty includes limitation on benefits rules that restrict the ability of certain persons who are resident in the U.S. to claim any or all benefits under the U.S. Treaty. Furthermore, limited liability companies (“LLCs”) that are not taxed as corporations pursuant to the provisions of the U.S. Internal Revenue Code of 1986, as amended (the “Code”) do not generally qualify as resident in the U.S. for purposes of the U.S. Treaty. Under the U.S. Treaty, a resident of the U.S. who is a member of such an LLC and is otherwise eligible for benefits under the U.S. Treaty may generally be entitled to claim benefits under the U.S. Treaty in respect of income, profits or gains derived through the LLC. Residents of the U.S. should consult their own tax advisors with respect to their eligibility for benefits under the U.S. Treaty, having regard to these rules.
37
This summary is based upon the current provisions of the U.S. Treaty and the Canadian Tax Act and our understanding of the current administrative policies and assessing practices of the Canada Revenue Agency published in writing prior to the date hereof. This summary takes into account all specific proposals to amend the U.S. Treaty and the Canadian Tax Act publicly announced by or on behalf of the Minister of Finance (Canada) prior to the date hereof. This summary does not otherwise take into account or anticipate changes in law or administrative policies and assessing practices, whether by judicial, regulatory, administrative or legislative decision or action, nor does it take into account provincial, territorial or foreign tax legislation or considerations, which may differ from those discussed herein.
This summary is of a general nature only and is not intended to be, nor should it be construed to be, legal or tax advice generally or to any particular holder. Holders should consult their own tax advisors with respect to their own particular circumstances.
Gains on Disposition of Common Shares
In general, a U.S. Holder will not be subject to tax under the Canadian Tax Act on capital gains arising on the disposition of such holder’s common shares unless the common shares are “taxable Canadian property” to the U.S. Holder and are not “treaty-protected property”.
As long as the common shares are then listed on a “designated stock exchange”, which currently includes the NYSE and TSX, the common shares generally will not constitute taxable Canadian property of a U.S. Holder, unless: (a) at any time during the 60-month period preceding the disposition, the U.S. Holder, persons not dealing at arm’s length with such U.S. Holder or the U.S. Holder together with all such persons, owned 25% or more of the issued shares of any class or series of the capital stock of the Company and more than 50% of the fair market value of the common shares was derived, directly or indirectly, from any combination of: (i) real or immoveable property situated in Canada, (ii) “Canadian resource property” (as such term is defined in the Canadian Tax Act), (iii) “timber resource property” (as such term is defined in the Canadian Tax Act) or (iv) options in respect of, or interests in, or for civil law rights in, any such properties whether or not the property exists or the common shares are otherwise deemed to be taxable Canadian property.
Common shares will be treaty-protected property where the U.S. Holder is exempt from income tax under the Canadian Tax Act on the disposition of common shares because of the U.S. Treaty. Common shares owned by a U.S. Holder will generally be treaty-protected property where the value of the common shares is not derived principally from real property situated in Canada, as defined in the U.S. Treaty.
Dividends on Common Shares
Dividends paid or credited on the common shares or deemed to be paid or credited on the common shares to a U.S. Holder that is the beneficial owner of such dividends will generally be subject to non-resident withholding tax under the Canadian Tax Act and the U.S. Treaty at the rate of: (a) 5% of the amounts paid or credited if the U.S. Holder is a company that owns (or is deemed to own) at least 10% of our voting stock or (b) 15% of the amounts paid or credited in all other cases. The rate of withholding under the Canadian Tax Act in respect of dividends paid to non-residents of Canada is 25% where no tax treaty applies.
Securities Authorized for Issuance under Equity Compensation Plans
Information required under this Item will be included in our definitive proxy statement for the
2019
Annual Meeting of Shareholders expected to be filed with the SEC no later than 120 days after the end of the fiscal year covered by this Form 10-K (the “
2019
Proxy Statement”), and such required information is incorporated herein by reference.
Purchases of Equity Securities by the Company and Affiliated Purchases
There were no purchases of equity securities by the Company during the fourth quarter of the year ended
December 31, 2018
.
38
Item 6. Selected Financial Data
The following tables of selected consolidated financial data of our Company have been prepared in accordance with U.S. generally accepted accounting principles (“GAAP”). The data is qualified by reference to, and should be read in conjunction with our audited Consolidated Financial Statements and related notes thereto prepared in accordance with U.S. GAAP. See Item 15 “Exhibits and Financial Statement Schedules” and the discussion in Item 7 “Management’s Discussion and Analysis of Financial Condition and Results of Operations” to this Form 10-K.
|
|
Years Ended December 31,
|
|||||||||||||||||||
|
(in millions, except per share data)
|
2018
|
2017
|
2016
|
2015
|
2014
|
|||||||||||||||
|
Consolidated operating data:
|
|
|
|
|
|
|||||||||||||||
|
Revenues
|
$
|
8,380
|
|
$
|
8,724
|
|
$
|
9,674
|
|
$
|
10,447
|
|
$
|
8,206
|
|
|||||
|
Operating (loss) income
|
$
|
(2,384
|
)
|
$
|
102
|
|
$
|
(566
|
)
|
$
|
1,527
|
|
$
|
2,001
|
|
|||||
|
Net (loss) income attributable to Bausch Health Companies Inc.
|
$
|
(4,148
|
)
|
$
|
2,404
|
|
$
|
(2,409
|
)
|
$
|
(292
|
)
|
$
|
881
|
|
|||||
|
(Loss) earnings per share attributable to Bausch Health Companies Inc.
|
|
|
|
|||||||||||||||||
|
Basic
|
$
|
(11.81
|
)
|
$
|
6.86
|
|
$
|
(6.94
|
)
|
$
|
(0.85
|
)
|
$
|
2.63
|
|
|||||
|
Diluted
|
$
|
(11.81
|
)
|
$
|
6.83
|
|
$
|
(6.94
|
)
|
$
|
(0.85
|
)
|
$
|
2.58
|
|
|||||
|
Cash dividends declared per share
|
$
|
—
|
|
$
|
—
|
|
$
|
—
|
|
$
|
—
|
|
$
|
—
|
|
|||||
|
|
At December 31,
|
|||||||||||||||||||
|
(in millions)
|
2018
|
2017
|
2016
|
2015
|
2014
|
|||||||||||||||
|
Consolidated balance sheet information:
|
|
|
|
|
|
|||||||||||||||
|
Cash and cash equivalents
|
$
|
721
|
|
$
|
720
|
|
$
|
542
|
|
$
|
597
|
|
$
|
323
|
|
|||||
|
Working capital
|
$
|
375
|
|
$
|
478
|
|
$
|
1,468
|
|
$
|
194
|
|
$
|
1,423
|
|
|||||
|
Total assets
|
$
|
32,492
|
|
$
|
37,497
|
|
$
|
43,529
|
|
$
|
48,965
|
|
$
|
26,305
|
|
|||||
|
Long-term debt, including current portion
|
$
|
24,305
|
|
$
|
25,444
|
|
$
|
29,846
|
|
$
|
31,088
|
|
$
|
15,229
|
|
|||||
|
Common shares
|
$
|
10,121
|
|
$
|
10,090
|
|
$
|
10,038
|
|
$
|
9,897
|
|
$
|
8,349
|
|
|||||
|
Bausch Health Companies Inc. shareholders’ equity
|
$
|
2,733
|
|
$
|
5,849
|
|
$
|
3,152
|
|
$
|
5,910
|
|
$
|
5,279
|
|
|||||
|
Number of common shares issued and outstanding
|
349.9
|
|
348.7
|
|
347.8
|
|
342.9
|
|
334.4
|
|
||||||||||
The following are the significant items affecting the comparability of the selected financial information for the periods presented:
Acquisitions
- The Company completed a series of mergers and acquisitions, the most significant, of which, were the acquisition of Amoun Pharmaceutical Company S.A.E. (October 19, 2015) and the acquisition of Salix Pharmaceuticals, Ltd. (the "Salix Acquisition") (April 1, 2015). The assets, liabilities and results of operations of these and other acquisitions are included in the reported amounts effective upon the respective acquisition dates.
Divestitures -
In order to better focus on our core businesses, we have divested businesses that were not considered core to our ongoing operations or the needs of our primary-customer base. The most significant of these divestitures included the divestitures of the Obagi Medical Products, Inc. business (November 9, 2017), the iNova Pharmaceuticals business (September 29, 2017), the Company's equity interest in Dendreon Pharmaceuticals LLC (June 28, 2017), the Company's equity interests in Sprout Pharmaceuticals, Inc. ("Sprout") (December 20, 2017) and the Company's interests in the CeraVe
®
, AcneFree
™
and AMBI
®
skincare brands (March 3, 2017). The assets, liabilities and results of operations of these and other divestitures and discontinuances are included in the reported amounts through the date of the respective divestiture and discontinuance dates. See
Note 4, "DIVESTITURES"
to our audited Consolidated Financial Statements for additional information.
Restructuring and Integration Costs
- In connection with certain acquisitions previously noted, the Company incurred cost-rationalization and integration initiatives in order to capture operating synergies, which generated cost savings across the Company. In 2018, 2017, 2016, 2015 and 2014, Restructuring and integration costs were
$22 million
,
$52 million
,
$132 million
, $362 million and $382 million, respectively. See
Note 5, "RESTRUCTURING AND INTEGRATION COSTS"
to our audited Consolidated Financial Statements for additional information.
Goodwill Impairments
- In
2018
,
2017
, 2016, 2015 and 2014,
Operating (loss) income
included
Goodwill impairments
of
$2,322 million
,
$312 million
, $1,077 million, $0 and $0, respectively.
These goodwill impairments were primarily the result of: (i) the adoption of new accounting guidance in 2018, (ii) revisions to forecasts to certain reporting units and (iii) realignments to our reporting units.
See
Note 9, "INTANGIBLE ASSETS AND GOODWILL"
to our audited Consolidated Financial Statements for additional information.
39
Asset Impairments
- In
2018
,
2017
, 2016, 2015 and 2014,
Operating (loss) income
included
Asset impairments
of
$568 million
,
$714 million
,
$422 million
, $304 million and $145 million, respectively.
These asset impairments were primarily attributable to: (i) assets being classified as held for sale and (ii) revisions in sales forecasts associated with discontinuances, generic competition and other market forces.
Net Gains on Sales of Assets -
In 2017,
Operating (loss) income
included the net gains on sales of assets of
$580 million
related to the 2017 divestitures previously discussed. In 2014,
Operating (loss) income
included the net gains on sales of assets of $251 million, primarily driven by a $324 million gain related to the divestiture of facial aesthetic fillers and toxins.
Benefit from Income Taxes
- In 2017,
Net (loss) income attributable to Bausch Health Companies Inc.
included non-cash deferred income tax benefits of approximately
$4,145 million
related to: (i) adjustments to previously recorded outside basis differences as a result of the Company’s internal corporate restructuring and (ii) the accounting for the U.S. Tax Cuts and Jobs Act of 2017.
Debt Issuance, Refinancing, Interest Expense, and Loss on Extinguishment of Debt -
We completed a series of transactions which allowed us to obtain the necessary financing to fund the acquisitions previously discussed and refinance certain of our debt arrangements under our Senior Secured Credit Facilities and our Senior Unsecured Notes to extend the maturities of the refinanced debt. See
Note 11, "FINANCING ARRANGEMENTS"
to our audited Consolidated Financial Statements for additional information. These transactions impacted
Net (loss) income attributable to Bausch Health Companies Inc.
for the periods presented as follows:
|
•
|
Interest Expense
in 2018, 2017, 2016, 2015 and 2014 was
$1,685 million
,
$1,840 million
,
$1,836 million
, $1,563 million and $971 million, respectively. The increase in interest expense over the years 2014 through 2017 is reflective of the additional debt obtained to finance the acquisitions previously discussed and, to a lesser extent, increases in the stated rates of interest for our debt obligations. The decrease in interest expense in the year 2018 as compared to 2017 reflects: (i) lower principal amounts of outstanding debt as during 2017 and 2016 the Company repaid (net of additional borrowings) over $5,800 million of debt and (ii) lower amortization and write-offs of debt discounts and deferred financing costs.
|
|
•
|
Loss on extinguishment of debt
in 2018, 2017, 2016, 2015 and 2014 was
$119 million
,
$122 million
, $0, $20 million and $130 million, respectively, and was incurred in connection with the repayments and refinancing of our debt obligations.
|
|
•
|
Weighted average stated rate of interest
as of December 31, 2018, 2017, 2016, 2015 and 2014 was
6.23%
, 6.07%, 5.75%, 5.10% and 5.20%, respectively.
|
40
Item 7. Management’s Discussion and Analysis of Financial Condition and Results of Operations
INTRODUCTION
This “Management’s Discussion and Analysis of Financial Condition and Results of Operations” has been updated through
February 20, 2019
and should be read in conjunction with the audited Consolidated Financial Statements and the related notes thereto included elsewhere in this Annual Report on Form 10-K. Additional company information, including this Form 10-K, is available on SEDAR at www.sedar.com and on the U.S. Securities and Exchange Commission (the “SEC”) website at
www.sec.gov
. All currency amounts are expressed in U.S. dollars, unless otherwise noted.
OVERVIEW
Bausch Health Companies Inc. (“we”, “us”, “our” or the “Company”) is
a global company whose mission is to improve people’s lives with our health care products. We develop, manufacture and market, primarily in the therapeutic areas of eye-health, gastroenterology ("GI") and dermatology, a broad range of: (i) branded pharmaceuticals, (ii) generic and branded generic pharmaceuticals, (iii) over-the-counter (“OTC”) products and (iv) medical devices (contact lenses, intraocular lenses, ophthalmic surgical equipment and aesthetics devices) products.
We generated revenues for
2018, 2017 and 2016
, of
$8,380 million
,
$8,724 million
and
$9,674 million
, respectively.
Our portfolio of products falls into four operating and reportable segments: (i) Bausch + Lomb/International, (ii) Salix, (iii) Ortho Dermatologics and (iv) Diversified Products.
|
•
|
The Bausch + Lomb/International segment
consists of: (i) sales in the U.S. of pharmaceutical products, OTC products and medical device products, primarily comprised of Bausch + Lomb products, with a focus on the Vision Care, Surgical, Consumer and Ophthalmology Rx products and (ii) with the exception of sales of Solta products, sales in Canada, Europe, Asia, Australia, Latin America, Africa and the Middle East of branded pharmaceutical products, branded generic pharmaceutical products, OTC products, medical device products and Bausch + Lomb products.
|
|
•
|
The Salix segment
consists of sales in the U.S. of
GI products.
|
|
•
|
The Ortho Dermatologics
segment
consists of: (i) sales in the U.S. of Ortho Dermatologics (dermatological) products and (ii) global sales of Solta medical aesthetic devices.
|
|
•
|
The Diversified Products segment
consists of sales: (i) in the U.S. of pharmaceutical products in the areas of neurology and certain other therapeutic classes, (ii) in the U.S. of generic products, (iii) in the U.S. of dentistry products and (iv) of certain other businesses divested during 2017 that were not core to the Company's operations, including the Company's equity interests in Dendreon
Pharmaceuticals LLC (“Dendreon”)
(June 28, 2017) and Sprout
Pharmaceuticals, Inc. (“Sprout”)
(December 20, 2017). As a result of the divestitures of Dendreon and Sprout, the Company exited the oncology and women's health businesses, respectively.
|
For additional discussion of our reportable segments, see the discussion in Item 1 "Business - Segment Information" and
Note 22, "SEGMENT INFORMATION"
to our audited Consolidated Financial Statements for further details on these reportable segments.
We have focused our research and development (“R&D”) to advance development programs that we believe will drive growth, while creating efficiencies in our R&D efforts and expenses. These R&D projects include certain products we have dubbed our "Significant Seven", which are products recently launched or expected to launch in the near future pending completion of testing and receipt of approval from the U.S. Food and Drug Administration (the “FDA”).
These Significant Seven products are: (i) Bryhali™ (Ortho Dermatologics), (ii) Duobrii™ (provisional name) (Ortho Dermatologics), (iii) Lumify
®
(Bausch + Lomb), (iv) Relistor
®
(Salix), (v) SiHy Daily (Bausch + Lomb), (vi) Siliq™ (Ortho Dermatologics) and (vii) Vyzulta
®
(Bausch + Lomb).
As outlined later in this discussion, although revenues associated with our Significant Seven products are currently not material, we believe the prospects for this group are substantial.
Our Transformation
In response to changing business dynamics within our Company, we recognized the need to change our focus in order to build a world-class health care organization. In 2016, we retained a new executive team which immediately implemented a multi-year plan to stabilize, turnaround and transform the Company. As we continue to work through our plan to build a world-class health care organization, the Company has made changes to its leadership, product focus, infrastructure, geographic footprint and capital structure. We outline some of these changes below.
41
We also evaluated our corporate name and searched for a name that we believe more accurately represents the full scope of the Company today as we continue to build an innovative company, striving to improve the health of patients globally. Therefore, effective July 13, 2018, the Company changed its corporate name from Valeant Pharmaceuticals International, Inc. to Bausch Health Companies Inc. We believe our new name more accurately represents the Company today and reflects our visions to build a world-class health care organization.
Stabilize
In 2016, the new executive team: (i) identified and retained a new leadership team, (ii) enhanced the Company's focus on core assets, which enabled the Company to recruit and retain stronger talent for its sales initiatives and (iii) realigned the Company’s operations to improve transparency and operational efficiency and better support the Company's sales force. Once in place, the new leadership team began executing on the turnaround phase of the multi-year action plan and delivering on commitments to narrow the Company's activities to our core businesses where we believe we have an existing and sustainable competitive edge and to identify opportunities to improve operational efficiencies and our capital structure.
Turnaround
Throughout 2017 and 2018, the Company has executed and continues to execute on its commitments to stabilize and turnaround our business. During this time, we believe we: (i) have better defined our core businesses, (ii) made measurable progress in improving our capital structure and (iii) have been aggressively addressing and resolving certain legacy matters to eliminate disruptions to our operations.
Focus on Core Businesses
As part of our turnaround, we narrowed our operating focus to our core businesses. We believe this strategy has reduced complexity in our operations and maximized the value of our eye-health, GI and dermatology businesses. In order to focus our efforts, we performed a review of our portfolio of assets within these core businesses to identify those products where we believe we have, and can maintain, a competitive advantage and we continue to define and shape our operations and business strategies around these assets.
Once we committed to our core businesses, we began analyzing the strategic alternatives for business units and assets that fall outside our definition of “core”. In order to focus on our objectives, we began divesting businesses and assets, which, in each case, were not aligned with our core business objectives. This not only allowed us to better focus our internal resources on our eye-health, GI and dermatology businesses, but also provided us with significant sources of capital, which we used to reduce our debt and improve our capital structure
As a result of the focus on our core businesses and the divestitures of businesses not aligned with our core business objectives, and reduced sales of products in our Diversified Products segment due to the loss of exclusivity, a greater portion of our revenues are now driven by our core businesses. In 2018, 2017 and 2016, our Bausch + Lomb (eye-health), Salix (GI) and Ortho Dermatologics (dermatology) revenues collectively represented approximately
71%
,
67%
and
63%
of our total revenues, respectively. The increase in this percentage over this period demonstrates our convictions in these businesses.
Begin Redirecting the Allocation of Capital to Drive Growth
The ranking of our business units during 2016 changed our view as to how to allocate capital across our activities. In support of our core activities, our leadership team aggressively reallocated resources to: (i) promote our core businesses, (ii) make strategic investments in our infrastructure and (iii) direct R&D to our eye-health, GI and dermatology businesses to drive growth organically. The outcome of this process allows us to better drive value in our product portfolio and generate operational efficiencies.
Promotion of our Core Businesses
- To position the Company to drive the value of our core assets, we made a number of leadership changes and took steps to increase our promotional and sales force efforts, particularly in our GI business.
In support of our GI business, we initiated a significant sales force expansion program in December 2016 to reach potential primary care physician (“PCP”) prescribers of Xifaxan
®
for irritable bowel syndrome with diarrhea (“IBS-D”) and Relistor
®
tablets for opioid induced constipation (“OIC”). In the first quarter of 2017, we hired approximately 250 trained and experienced sales force representatives and managers to create, bolster and sustain deep relationships with PCPs. With approximately 70% of IBS-D patients initially presenting symptoms to a PCP, we believe that the dedicated PCP sales force is better positioned to reach more patients in need of IBS-D treatment. In addition, we have expanded our dedicated pain sales representatives to strengthen our position in the OIC market. The investment in these additional sales resources, including an increase in associated promotional costs, was in excess of $50 million during 2017; these investments were essential and strategic as they have allowed us to capitalize
42
on the potential of our Xifaxan
®
and Relistor
®
franchises. Revenues from our Xifaxan
®
and Relistor
®
franchises increased approximately
22%
and
37%
, respectively, in 2018 when compared to 2017.
Continued Investment in Emerging Markets
- In October 2018, we acquired the 40% minority interests of Medpharma Pharmaceutical and Chemical Industries LLC ("Medpharma") for
$18 million
, thereby completing the planned acquisition of this joint venture. Medpharma formulates, manufactures and distributes certain branded generic pharmaceuticals and non-patented generic pharmaceuticals for the Company and third parties. In 2014, we entered into the Medpharma joint venture to provide the Company with a presence in the United Arab Emirates ("UAE"). The completion of this acquisition provides us with full control over the business activities of Medpharma and allows us to wholly benefit from the allocation of additional Company resources and the growth, if any, in the UAE and the surrounding region.
Strategic Investments in our Infrastructure
- In support of our core businesses, we have and continue to make strategic investments in our infrastructure, the most significant of which are at our Waterford facility in Ireland, our Rochester facility in New York, and our Greenville facility in South Carolina.
To meet the forecasted demand for our Biotrue
®
ONEday lenses, in July 2017, we placed into service a $175 million multi-year strategic expansion project of the Waterford facility. The emphasis of the expansion project was to: (i) develop new technology to manufacture, automatically inspect and package contact lenses, (ii) bring that technology to full validation and (iii) increase the size of the Waterford facility. As a result of the increased production capacity and in support of our core eye-health business, we added approximately 300 production employees since the project’s inception, bringing total headcount to approximately 1,350 employees, and succeeded in increasing production, which in 2017 was over 30% higher than it was in 2015 at the facility. We continue to invest in this facility, spending approximately $5 million during 2018 and budgeting an additional $16 million through June 2020.
In order to address the expected global demand for our Bausch + Lomb ULTRA
®
contact lens, in December 2017, we completed a multi-year, $200 million strategic upgrade to our Rochester facility. The upgrade increased production capacity in support of our Bausch + Lomb Ultra
®
and SiHy Daily AQUALOX
TM
product lines and better supports the production of other well established contact lenses such as our PureVision
®
, PureVision
®
2 (SVS, Toric, and Multifocal), SofLens
®
38 and SilSoft
®
. In connection with the increased production capacity, we added approximately 120 production employees since the project’s inception, bringing total headcount to approximately 1,000 employees, and continue to make investments to enhance our production technologies and capacity at the facility. These enhancements to our production technologies and capacity led, in part, to the validation of SiHy Daily production at the Rochester facility and the successful launch of SiHy Daily AQUALOX
TM
lenses in Japan in September 2018.
Additionally, in November 2018, we announced strategic expansion projects that will add multiple production lines to our Waterford and Rochester facilities in order to support our strategic investments in eye-health and meet the anticipated global demand for our SiHy Daily contact lenses, one of our Significant Seven products. These expansion projects are expected to be completed in 2022 and increase our combined headcount at these sites by more than 200 employees.
To support the growth of our Biotrue
®
lens care product lines, in May 2018, we placed into service a new production line in our Bausch + Lomb Greenville, South Carolina manufacturing facility, where we produce a substantial portion of our lens care product lines. The new production line has been validated to produce contact lens solutions for our Biotrue
®
, Renu
®
and Sensitive Eyes
®
brands and replaces one of the facility’s original 1983 production lines that had limitations in product configurations. Planned and in development for more than two years, the new production line cost $25 million, has a capacity ranging between 40 million and 50 million bottles annually and is expected to generate additional sustainable operational efficiencies through 2019.
We believe the investments in our Waterford, Rochester and Greenville facilities and related expansion of labor forces further demonstrates the growth potential we see in our Bausch + Lomb products and our eye-health business.
Direct R&D Investment to our Bausch + Lomb, GI and Dermatology Businesses to Drive Growth
- Our R&D organization focuses on the development of products through clinical trials.
As of December 31, 2018
, approximately
1,200
dedicated R&D and quality assurance employees in
23
R&D facilities were involved in our R&D efforts.
Our R&D expenses for 2018, 2017 and 2016, were
$413 million
,
$361 million
and
$421 million
, respectively, and was approximately
5%
as a percentage of revenue for 2018 as opposed to approximately 4% for 2017 and 4% for 2016. As part of our turnaround, we removed projects related to divested businesses and rebalanced our portfolio to better align with our long-term plans and focus on core businesses. Our investment in R&D reflects our commitment to drive organic growth through internal development of new products, a pillar of our new strategy. We have over
250
projects in our global pipeline and anticipate submitting approximately 120 of those projects for regulatory approval in 2019 and 2020.
43
Core assets that have received a significant portion of our R&D investment in current and prior periods are listed below.
|
•
|
Dermatology - Duobrii™ (provisional name), under development as Internal Development Project ("IDP") 118, is the first and only topical lotion that contains a unique combination of halobetasol propionate and tazarotene for the treatment of moderate-to-severe plaque psoriasis in adults. Halobetasol propionate and tazarotene are each approved to treat plaque psoriasis when used separately, but are limited in duration of use. Halobetasol propionate may be used for up to two weeks and tazarotene may be limited due to irritation. Based on existing data from clinical studies, the combination of these ingredients in Duobrii™ (provisional name) with a dual mechanism of action, potentially allows for expanded duration of use, with reduced adverse events. On June 18, 2018, we announced that we received a Complete Response Letter (“CRL”) from the FDA to our New Drug Application (“NDA”) for Duobrii™ (provisional name). The CRL did not specify any deficiencies related to the clinical efficacy or safety of Duobrii™ (provisional name) and did not identify issues with our Chemistry, Manufacturing and Controls processes. The CRL only noted questions regarding pharmacokinetic data. Working to resolve this matter expeditiously, we met with the FDA to understand the additional data requirements. We resubmitted our NDA, and on August 29, 2018, we announced that the FDA accepted the application as a Class 2 resubmission, with a Prescription Drug User Fee Act (“PDUFA”) action date of February 15, 2019. On February 15, 2019 we announced that the FDA is still finalizing its review and would be unable to meet the PDUFA action date. We expect a decision from the FDA in the near future.
|
|
•
|
Dermatology - Bryhali™ is a novel product that contains a unique, lower concentration of halobetasol propionate for the treatment of moderate-to-severe psoriasis which is FDA approved for 8 weeks of use. The FDA has previously approved halobetasol propionate to treat plaque psoriasis, but limited in duration of use. We launched Bryhali™ in November 2018.
|
|
•
|
Dermatology - We are planning to expand the indication for Bryhali™ (halobetasol propionate lotion 0.01%) from plaque psoriasis to corticosteroid responsive dermatoses (IDP-133). A Phase 3 study is planned to start in the second half of 2019.
|
|
•
|
Dermatology - IDP-131 is a new chemical entity, KP-470, for the topical treatment of psoriasis. On February 27, 2018, we announced that we entered into an exclusive license agreement with Kaken Pharmaceutical Co., Ltd. to develop and commercialize the compound. Early proof of concept studies are planned for the first half of 2019. If approved by the FDA, KP-470 could represent a novel drug with an alternative mechanism of action in the topical treatment of psoriasis.
|
|
•
|
Bausch + Lomb - Bausch + Lomb ULTRA
®
for Astigmatism is a monthly planned replacement contact lens for astigmatic patients. The Bausch + Lomb ULTRA
®
for Astigmatism lens was developed using the proprietary MoistureSeal
®
technology. In addition, the Bausch + Lomb ULTRA
®
for Astigmatism lens integrates an OpticAlign
®
design engineered for lens stability and to promote a successful wearing experience for the astigmatic patient. In 2017, we launched this product and the extended power range for this product. In 2018, we launched the Bausch + Lomb ULTRA
®
for Astigmatism -2.75 cylinder expanded SKU range.
|
|
•
|
Dermatology - On July 27, 2017, we launched Siliq™ in the U.S. Siliq™ is an IL-17 receptor blocker monoclonal antibody biologic for treatment of moderate-to-severe plaque psoriasis, which we estimate to be an over $5,000 million market in the U.S. The FDA approved the Biologics License Application for Siliq™ injection for subcutaneous use for the treatment of moderate-to-severe plaque psoriasis in adult patients who are candidates for systemic therapy or phototherapy and have failed to respond or have lost response to other systemic therapies. Siliq™ has a Black Box Warning for the risks in patients with a history of suicidal thoughts or behavior and was approved with a Risk Evaluation and Mitigation Strategy involving a one-time enrollment for physicians and one-time informed consent for patients.
|
|
•
|
Bausch + Lomb - Vyzulta
®
(latanoprostene bunod ophthalmic solution, 0.024%) is an intraocular pressure lowering single-agent eye drop dosed once daily for patients with open angle glaucoma or ocular hypertension and was launched in December 2017.
|
|
•
|
Bausch + Lomb - SiHy Daily AQUALOX
TM
is a silicone hydrogel daily disposable contact lens designed to provide clear vision throughout the day. Product validation was completed in June 2018 and SiHy Daily AQUALOX
TM
was launched in Japan in September 2018.
|
|
•
|
Dermatology - IDP-126 is an acne product with a fixed combination of benzoyl peroxide, clindamycin phosphate and adapalene, currently in Phase 2 testing.
|
|
•
|
Bausch + Lomb - Lumify
®
(brimonidine tartrate ophthalmic solution, 0.025%) is an OTC eye drop developed as an ocular redness reliever. Lumify
®
was approved by the FDA in December 2017 and launched in May 2018.
|
44
|
•
|
Gastrointestinal - We have initiated a Phase 2 study for the treatment of overt hepatic encephalopathy with a new formulation of rifaximin, which we acquired as part of our acquisition of Salix Pharmaceuticals, Ltd. in April 2015 (the "Salix Acquisition"). We are also planning to use this same formulation of rifaximin in a Phase 2 study for the treatment of small intestinal bacterial overgrowth or SIBO. That study is scheduled to start in the second half of 2019.
|
|
•
|
Gastrointestinal - We plan to initiate a Phase 3 study for the treatment of postoperative Crohns disease using a novel rifaximin extended release formulation. The study is scheduled to start in the first half of 2019.
|
|
•
|
Gastrointestinal - We plan to initiate a Phase 2 study evaluating Xifaxan
®
550mg tablets for the prevention of complications of decompensation cirrhosis. The study is scheduled to start in the first half of 2019.
|
|
•
|
Dermatology - On August 23, 2018, the FDA approved Altreno™ (tretinoin 0.05%) lotion, indicated for the topical treatment of acne vulgaris in patients 9 years of age and older. Altreno™ is the first tretinoin formulation in a lotion, approved for patients 9 years of age and older. We launched Altreno™ in the U.S. in October 2018.
|
|
•
|
Dermatology - IDP-120 is an acne product with a fixed combination of mutually incompatible ingredients; benzoyl peroxide and tretinoin. Phase 3 clinical studies are ongoing.
|
|
•
|
Dermatology - IDP-123 is an acne product containing lower concentration of tazarotene in a lotion form to help reduce irritation while maintaining efficacy. We have completed Phase 3 testing and plan to file an NDA with the FDA in the first half of 2019.
|
|
•
|
Dermatology - IDP-124 is a topical lotion product designed to treat moderate to severe atopic dermatitis, with pimecrolimus, currently in Phase 3 testing.
|
|
•
|
Dermatology - IDP-135 is a topical retinoid product in development. We are seeking guidance from the FDA to develop this product for OTC use for the treatment of acne. The guidance meeting is targeted for the first half of 2019.
|
|
•
|
Gastrointestinal - On September 11, 2018, we announced the launch of Plenvu
®
in the U.S. We license Plenvu
®
from Norgine B.V. Plenvu
®
is a novel, lower-volume polyethylene glycol-based bowel preparation developed to help provide complete bowel cleansing, with an additional focus on the ascending colon.
|
|
•
|
Bausch + Lomb - In April 2017, we launched our Stellaris Elite™ Vision Enhancement System. The Stellaris Elite™ Vision Enhancement System is our next generation phacoemulsification cataract platform, which offers new innovations, as well as the opportunity to add upgrades and enhancements every one to two years. Stellaris Elite™ is the first phacoemulsification platform on the market to offer Adaptive Fluidics™, which combines aspiration control with predictive infusion management to create a responsive and controlled surgical environment for efficient cataract lens removal.
|
|
•
|
Bausch + Lomb - Vitesse
®
is a hypersonic vitrectomy system for the removal of the vitreous humor gel that fills the eye cavity to provide better access to the retina and allows for a variety of repairs, including the removal of scar tissue, laser repair of retinal detachments and treatment of macular holes. Available exclusively on the Stellaris Elite
TM
system, Vitesse
®
liquefies tissue in a highly-localized zone at the edge of the port to increase the level of surgical control and precision to vitrectomies. We launched this product on a limited basis in October 2017.
|
|
•
|
Dermatology - Next Generation Thermage FLX
®
is a fourth-generation non-invasive treatment option using a radiofrequency platform designed to optimize key functional characteristics and improve patient outcomes. On September 22, 2017, we received 510(k) clearance from the FDA and launched this product in the United States. During 2018, Next Generation Thermage FLX
®
was launched in Hong Kong, Japan, Korea, China, Thailand, Vietnam, and Australia as part of our Solta medical aesthetic devices portfolio.
|
|
•
|
Bausch + Lomb - On May 1, 2018, we received Premarket Approval from the FDA for, and subsequently launched, 7-day extended wear for our Bausch + Lomb ULTRA
®
monthly planned replacement contact lenses.
|
|
•
|
Bausch + Lomb - Bausch + Lomb ULTRA
®
for Presbyopia is a monthly planned replacement contact lens for presbyopic patients. The Bausch + Lomb ULTRA
®
for Presbyopia lens was developed using the proprietary MoistureSeal
®
technology. In addition, the Bausch + Lomb ULTRA
®
for Presbyopia lens integrates a 3 zone progressive design for near, intermediate and distance vision. We launched expanded parameters of this product throughout 2017.
|
|
•
|
Bausch + Lomb - Biotrue
®
ONEday for Astigmatism is a daily disposable contact lens for astigmatic patients. The Biotrue
®
ONEday lenses incorporate Surface Active Technology
TM
to provide a dehydration barrier. The Biotrue
®
ONEday for Astigmatism also includes evolved peri-ballast geometry to deliver stability and comfort for the astigmatic patient. We
|
45
launched this product in December 2016 and launched an extended power range in 2017. During 2018, we launched a further extended power range for this product.
|
•
|
Bausch + Lomb - We are developing a new Ophthalmic Viscosurgical Device product, with a formulation to protect corneal endothelium during phacoemulsification process during a cataract surgery and to help chamber maintenance and lubrication during interocular lens delivery. In April 2018, we initiated an investigative device exemption (“IDE”) study for this product and completed enrollment in December 2018.
|
|
•
|
Dermatology - Traser™ is an energy-based platform device with significant versatility and power capabilities to address various dermatological conditions, including vascular and pigmented lesions. We are planning to launch this product in the second half of 2022 as part of our Solta business.
|
|
•
|
Bausch + Lomb - Loteprednol Gel 0.38% is a new formulation for the treatment of post-operative ocular inflammation and pain. The FDA has accepted for review our NDA for Loteprednol Gel 0.38% and set a PDUFA action date of February 25, 2019. If approved, the product would be the lowest concentrated loteprednol ophthalmic corticosteroid indicated for the treatment of post-operative inflammation and pain following ocular surgery in the U.S.
|
|
•
|
Bausch + Lomb - enVista
®
Trifocal intraocular lens is an innovative lens design, for which we have initiated an IDE study for this product in May 2018.
|
|
•
|
Bausch + Lomb - enVista
®
Toric intraocular lens received FDA approval in June 2018 and was launched in July 2018.
|
|
•
|
Bausch + Lomb - We are developing a preloaded intraocular lens injector platform for enVista interocular lens. The Premarket Approval application was submitted to the FDA in July 2018.
|
|
•
|
Bausch + Lomb - An ULTRA
®
Multifocal for Astigmatism lens combining the benefits of our ULTRA
®
for Presbyopia design with our ULTRA
®
for Astigmatism OpticAlign™ design engineered for lens stability for presbyopic/astigmatic patients. We received FDA approval for this product in November 2018.
|
|
•
|
Bausch + Lomb - Renu
®
Advanced Multi-Purpose Solution (“MPS”) contains a triple disinfectant system that kills 99.9% of germs, and has a dual surfactant system that provides up to 20 hours of moisture. Renu Advanced MPS is FDA cleared with indications for use to condition, clean, remove protein, disinfectant, rinse and store soft contact lenses including those composed of silicone hydrogels. Renu Advanced MPS has gained global regulatory approvals in Korea, India, Mexico, Indonesia, Malaysia and Singapore.
|
|
•
|
Bausch + Lomb - Custom soft contact lens (Ultra buttons) is a latheable silicone hydrogel button for custom soft specialty lenses including; Sphere, Toric, Multifocal, Toric Multifocal and irregular corneas. FDA approval is expected in May 2020.
|
|
•
|
Bausch + Lomb - Zen™ Multifocal Scleral Lens for presbyopia exclusively available with Zenlens™ and Zen™ RC scleral lenses and will allow eye care professionals to fit presbyopic patients with irregular and regular corneas and those with ocular surface disease, such as dry eye. The Zen™ multifocal Scleral Lens incorporates decentered optics, enabling the near power to be positioned over the visual axis. This product was launched during the first quarter of 2019.
|
|
•
|
Bausch + Lomb - Tangible
®
Hydra-PEG
®
is a high-water polymer coating that is bonded to the surface of a contact lens and designed to address contact lens discomfort and dry eye. Tangible
®
Hydra-PEG
®
coating technology in combination with our Boston
®
materials and Zenlens™ family of scleral lenses will help eye care professionals provide a better lens wearing experience for their patients with challenging vision needs. We plan to launch this product during the first quarter of 2019.
|
Improve Capital Structure
We have made measurable progress in improving our capital structure by: (i) reducing our debt through repayments and (ii) extending the maturities of debt through refinancing. Using the net cash proceeds from divestitures of non-core assets, cash generated from operations and cash generated from tighter working capital management, we repaid (net of additional borrowings) over $6,800 million of long-term debt since the beginning of 2016, in the aggregate.
Divestitures -
During 2017, we divested businesses and assets not aligned with our core business objectives, which simplified our operating model and generated over $3,200 million of net cash proceeds that we used to improve our capital structure, the most significant of which were the divestitures of the Company's interests in the CeraVe
®
, AcneFree
™
and AMBI
®
skincare brands (the "Skincare Sale") (March 3, 2017), the iNova Pharmaceuticals business (the "iNova Sale") (September 29, 2017), the Company's equity interest in Dendreon Pharmaceuticals LLC (the "Dendreon Sale") (June 28, 2017) and the Obagi Medical Products, Inc. business (the "Obagi Sale") (November 9, 2017).
46
Debt Repayments
- During 2017 and 2016, we repaid (net of additional borrowings) over $5,800 million of long-term debt using the net cash proceeds from divestitures of non-core assets, cash generated from operations and cash generated from tighter working capital management. During 2018, we repaid: (i)
$206 million
of our Series F Tranche B Term Loan Facility, (ii)
$200 million
of our 5.625% Senior Unsecured Notes due 2021 (the “
December 2021 Unsecured Notes
”), (iii)
$171 million
of our
June 2025 Term Loan B Facility
(as defined below), (iv)
$125 million
of our 7.50% Senior Unsecured Notes due 2021 (the "July 2021 Unsecured Notes"), (v)
$104 million
of our 6.375% October 2020 Unsecured Notes (the “6.375% October 2020 Unsecured Notes”), (vi) the remaining
$71 million
of outstanding principal amount of our 7.00% Senior Unsecured Notes Due 2020, (vii)
$19 million
of our
November 2025 Term Loan B Facility
(as defined below) and (viii)
$175 million
(net of additional borrowings) of amounts outstanding under our revolving credit facilities. These repayments during 2018 were funded with cash on hand and reduced our outstanding debt obligations by more than $1,000 million.
2017 Transactions
- In March, October, November and December of 2017, we accessed the credit markets and completed a series of transactions, whereby we extended over $9,500 million in aggregate maturities of certain debt obligations due to mature in April 2018 through April 2022, out to March 2022 through December 2025. As part of these transactions we also extended commitments under our revolving credit facility, originally set to expire in April 2018, out to April 2020. The impacts of these transactions were discussed in prior filings and are fully disclosed in
Note 11, "FINANCING ARRANGEMENTS"
to our audited Consolidated Financial Statements.
2018 Refinancing Transactions
- In March, June and November 2018, we accessed the credit markets and completed a series of transactions, whereby we extended approximately $8,300 million in aggregate maturities of certain debt obligations due to mature in March 2020 through July 2022, out to June 2025 through January 2027. As part of these transactions we obtained less stringent loan financial maintenance covenants under our Senior Secured Credit Facilities and extended the availability of our revolving credit facility by more than three years by replacing our previously existing revolving credit facility due in April 2020 with a revolving credit facility of
$1,225 million
due in June 2023 (the “2023 Revolving Credit Facility”). These transactions in 2018 were as follows:
On March 26, 2018, Bausch Health Americas, Inc. (“BHA”) (formerly Valeant Pharmaceuticals International) issued
$1,500 million
aggregate principal amount of 9.25% Senior Unsecured Notes due April 2026 (the “April 2026 Unsecured Notes”) in a private placement, the net proceeds of which, along with cash on hand, were used to repurchase
$1,500 million
in aggregate principal amount of unsecured notes which consisted of: (i)
$1,017 million
of our 5.375% Senior Unsecured Notes due March 2020 (the “March 2020 Unsecured Notes”), (ii)
$411 million
of our 6.375% October 2020 Unsecured Notes and (iii)
$72 million
of our 6.75% Senior Unsecured Notes due 2021 (the "August 2021 Unsecured Notes") (collectively, the “March 2018 Refinancing Transactions”). All fees and expenses associated with these transactions were paid with cash on hand.
On June 1, 2018, the Company entered into a Restatement Agreement in respect of a Fourth Amended and Restated Credit and Guaranty Agreement (the “Restated Credit Agreement”). The Restated Credit Agreement amended and restated in full the Third Amended Credit Agreement (as defined below). The Restated Credit Agreement: (i) replaced our revolving credit facility of $1,250 million due in April 2020 with the 2023 Revolving Credit Facility of
$1,225 million
and (ii) replaced the Series F Tranche B Term Loan Facility principal amount outstanding of
$3,315 million
with the seven year Tranche B Term Loan Facility of
$4,565 million
(the “June 2025 Term Loan B Facility”) borrowed by BHA.
In June 2018, using the net proceeds from the
June 2025 Term Loan B Facility
, the net proceeds from the issuance of
$750 million
in aggregate principal amount of 8.50% Senior Unsecured Notes due January 2027 (the “January 2027 Unsecured Notes”) by BHA and cash on hand, the Company prepaid the remaining outstanding principal amounts of: (i)
$691 million
of the March 2020 Unsecured Notes, (ii)
$578 million
of the August 2021 Unsecured Notes, (iii)
$550 million
of the 7.25% Senior Unsecured Notes due July 2022 (the “July 2022 Unsecured Notes”) and (iv)
$146 million
of the 6.375% October 2020 Unsecured Notes (collectively, the 6.375% October 2020 Unsecured Notes, March 2020 Unsecured Notes, August 2021 Unsecured Notes and July 2022 Unsecured Notes, being the “June 2018 Unsecured Refinanced Debt”).
On November 27, 2018, the Company entered into the First Incremental Amendment to the Restated Credit Agreement which provided an additional
seven
year Tranche B Term Loan Facility of
$1,500 million
(the "
November 2025 Term Loan B Facility
"). The net proceeds and cash on hand were used to repurchase
$1,483 million
in aggregate principal amount of the
July 2021 Unsecured Notes
in a tender offer. On December 27, 2018, the Company redeemed the remaining outstanding principal amount of
$17 million
of the
July 2021 Unsecured Notes
using cash on hand.
47
As a result of prepayments and a series of refinancing transactions during 2018, we have extended the maturities of a substantial portion of our long-term debt, providing us with additional liquidity and greater flexibility to execute our business plans. The table below summarizes our debt portfolio
as of December 31, 2018 and 2017
.
|
2018
|
2017
|
|||||||||||||||||
|
(in millions)
|
Maturity
|
Principal Amount
|
Net of Discounts and Issuance Costs
|
Principal Amount
|
Net of Discounts and Issuance Costs
|
|||||||||||||
|
Senior Secured Credit Facilities:
|
||||||||||||||||||
|
Revolving Credit Facilities
|
June 2023
|
$
|
75
|
|
$
|
75
|
|
$
|
250
|
|
$
|
250
|
|
|||||
|
Series F Tranche B Term Loan Facility
|
April 2022
|
—
|
|
—
|
|
3,521
|
|
3,420
|
|
|||||||||
|
June 2025 Term Loan B Facility
|
June 2025
|
4,394
|
|
4,269
|
|
—
|
|
—
|
|
|||||||||
|
November 2025 Term Loan B Facility
|
November 2025
|
1,481
|
|
1,456
|
|
—
|
|
—
|
|
|||||||||
|
Senior Secured Notes:
|
||||||||||||||||||
|
6.50% Secured Notes
|
March 2022
|
1,250
|
|
1,239
|
|
1,250
|
|
1,235
|
|
|||||||||
|
7.00% Secured Notes
|
March 2024
|
2,000
|
|
1,979
|
|
2,000
|
|
1,975
|
|
|||||||||
|
5.50% Secured Notes
|
November 2025
|
1,750
|
|
1,730
|
|
1,750
|
|
1,729
|
|
|||||||||
|
Senior Unsecured Notes:
|
|
|||||||||||||||||
|
5.375%
|
March 2020
|
—
|
|
—
|
|
1,708
|
|
1,699
|
|
|||||||||
|
7.00%
|
October 2020
|
—
|
|
—
|
|
71
|
|
71
|
|
|||||||||
|
6.375%
|
October 2020
|
—
|
|
—
|
|
661
|
|
656
|
|
|||||||||
|
7.50%
|
July 2021
|
—
|
|
—
|
|
1,625
|
|
1,615
|
|
|||||||||
|
6.75%
|
August 2021
|
—
|
|
—
|
|
650
|
|
648
|
|
|||||||||
|
5.625%
|
December 2021
|
700
|
|
697
|
|
900
|
|
896
|
|
|||||||||
|
7.25%
|
July 2022
|
—
|
|
—
|
|
550
|
|
545
|
|
|||||||||
|
9.25%
|
April 2026
|
1,500
|
|
1,482
|
|
—
|
|
—
|
|
|||||||||
|
8.50%
|
January 2027
|
750
|
|
738
|
|
—
|
|
—
|
|
|||||||||
|
All other Senior Unsecured Notes
|
March 2023 through December 2025
|
10,720
|
|
10,628
|
|
10,801
|
|
10,690
|
|
|||||||||
|
Other
|
Various
|
12
|
|
12
|
|
15
|
|
15
|
|
|||||||||
|
Total long-term debt and other
|
|
$
|
24,632
|
|
$
|
24,305
|
|
$
|
25,752
|
|
$
|
25,444
|
|
|||||
The weighted average stated interest rate of the Company's outstanding debt
as of December 31, 2018 and 2017
was
6.23%
and
6.07%
, respectively.
The aforementioned repayments and refinancings have also had an impact on our cash requirements for principal debt repayment over the next five years. The scheduled principal repayments of our debt obligations as of
December 31, 2018
as compared with December 31, 2017 were as follows:
|
(in millions)
|
December 31, 2018
|
December 31, 2017
|
||||||
|
2018
|
$
|
—
|
|
$
|
209
|
|
||
|
2019
|
228
|
|
—
|
|
||||
|
2020
|
303
|
|
2,690
|
|
||||
|
2021
|
1,003
|
|
3,175
|
|
||||
|
2022
|
1,553
|
|
5,115
|
|
||||
|
2023
|
6,348
|
|
6,051
|
|
||||
|
Thereafter
|
15,197
|
|
8,512
|
|
||||
|
|
$
|
24,632
|
|
$
|
25,752
|
|
||
See
Note 11, "FINANCING ARRANGEMENTS"
to our audited Consolidated Financial Statements for further details and “Management's Discussion and Analysis - Liquidity and Capital Resources: Long-term Debt” for additional discussion of these matters. Cash requirements for future debt repayments including interest can be found in “Management's Discussion and Analysis - Off-Balance Sheet Arrangements and Contractual Obligations.”
48
Address Legacy Legal Matters
The Company was burdened with addressing certain ongoing legal matters, some of which were inherited as part of the acquisitions we completed in 2015 and prior. In order to better focus on our core activities and simplify our operations, we have been vigorously addressing many of these matters, and, during 2018, we achieved dismissals and other positive outcomes in approximately 70 litigations, disputes and investigations, as we continue to actively address others. This included: (i) a win in the Cosmo (Uceris
®
) arbitration, (ii) a partial win in the Relistor
®
(injectable) ANDA case on validity in the Company's favor protecting the product to at least April 2024, (iii) a settlement resolving the Solodyn
®
antitrust litigations, (iv) a settlement with the California Department of Insurance to resolve the matter relating to our terminated relationship with Philidor, (v) a settlement on the Mimetogen litigation, (vi) a settlement in the Allergan litigation, (vii) a settlement in the Xifaxan
®
patent litigation, (viii) a settlement with the SEC relating to the Salix investigation of 2014 with no monetary penalty against the Company or Salix Ltd. and (ix) a settlement in the Arbitration with Alfasigma S.p.A.
The significant matters are discussed in detail in
Note 20, "LEGAL PROCEEDINGS"
to our audited Consolidated Financial Statements and include:
Uceris
®
Arbitration -
Beginning in December 2016, we were involved in an arbitration respecting our Uceris
®
extended release tablets, which had been commenced by Cosmo Technologies Ltd. and Cosmo Technologies III Ltd. (collectively, “Cosmo”), the licensor of certain intellectual property rights in, and supplier of, that Uceris
®
product. In the arbitration, Cosmo alleged breach of contract with respect to certain terms of the license agreement and sought a declaration that both the license agreement and a supply agreement had been terminated. On April 12, 2018, the Arbitral Tribunal issued a ruling rejecting Cosmo's claims; accordingly, both the license agreement and supply agreement remain in effect. Additionally, the Arbitral Tribunal ordered Cosmo to pay the entirety of the Company's legal costs of approximately $3 million, which Cosmo has paid. The parties subsequently informed the Tribunal and the International Chamber of Commerce ("ICC") that the remaining issues in the arbitration have been resolved, and, accordingly, the case has been dismissed.
Solodyn
®
Antitrust Class Actions
- Beginning in July 2013, we were named as co-defendants in a number of civil antitrust class action suits alleging that the defendants engaged in an anticompetitive scheme to exclude competition from the market for minocycline hydrochloride extended release tablets, a prescription drug for the treatment of acne marketed by our subsidiary, Medicis Pharmaceutical Corporation, under the brand name Solodyn
®
. The plaintiffs sought declaratory and injunctive relief and, where applicable, treble, multiple, punitive and/or other damages, including attorneys’ fees. In February 2018, we agreed to resolve the class action litigation with the End-Payor and Direct Purchaser classes for an amount of $58 million and have resolved related litigation with opt-out retailers for additional consideration. On July 18, 2018, the Court granted approval of these settlements with the End-Payor and Direct Purchaser classes. All amounts in settlement of these matters were paid during the first quarter of 2018.
Investigation by the California Department of Insurance -
On or about September 16, 2016, the Company received an investigative subpoena from the California Department of Insurance. The materials requested include documents concerning the Company’s former relationship with Philidor and certain California-based pharmacies, the marketing and distribution of its products in California, the billing of insurers for its products being used by California residents, and other matters. On May 1, 2018, the Company and the California Department of Insurance signed an agreement to resolve this investigation, with the Company making a payment to the California Department of Insurance in the amount of approximately $2 million, with no admission of facts or liability by the Company.
Allergan Litigation -
On December 28, 2017, all parties agreed to settle the Allergan shareholder class actions for a total of $290 million. The complaints had asserted violations of Section 14(e) of the Exchange Act and rules promulgated by the SEC thereunder and Section 20A of the Exchange Act by the Company and the other defendants, as well as violations of Section 20(a) of the Exchange Act by certain defendants, and had sought, among other relief, money damages, equitable relief, and attorneys’ fees and costs. The settlement was approved by the Court in a hearing held June 12, 2018. Under the terms of the settlement, the Company is responsible for paying $96 million, or 33% of the settlement amount. We made this payment in January 2018. We are pursuing recovery of the settlement amount and the costs of defense under our insurance policies, although recovery is not assured.
Xifaxan
®
Patent Litigation -
The Company initiated litigation alleging infringement by Actavis Laboratories FL, Inc. (“Actavis”) which filed an ANDA for a generic version of the Company’s Xifaxan
®
(rifaximin) 550 mg tablets. In February 2016, the Company received a Notice of Paragraph IV Certification Actavis, in which Actavis asserted that certain U.S. patents, owned or licensed by certain subsidiaries of the Company for Xifaxan
®
550 mg tablets, were either invalid, unenforceable and/or would not be infringed by the commercial manufacture, use or sale of Actavis’ generic version of Xifaxan
®
(rifaximin) 550 mg tablets, for which it filed an ANDA. On March 23, 2016, the Company initiated litigation against Actavis which alleged infringement by Actavis of one or more claims of each of the Xifaxan
®
patents.
49
On September 12, 2018, we announced that we had agreed to resolve all outstanding intellectual property litigation regarding Actavis’ ANDA. The parties have agreed to dismiss all litigation related to Xifaxan
®
, and all intellectual property protecting Xifaxan
®
will remain intact and enforceable. We will not make any financial payments or other transfers of value as part of the agreement and Actavis acknowledges the validity of the Xifaxan
®
patents. In addition, under the terms of the agreement, beginning January 1, 2028, Actavis will have the option to: (1) market a royalty-free generic version of Xifaxan
®
tablets, 550 mg, should it receive approval from the FDA on its ANDA, or (2) market an authorized generic version of Xifaxan
®
tablets, 550 mg, in which case we will receive a share of the economics from Actavis on its sales of such an authorized generic. Actavis will be able to commence such marketing earlier if another generic rifaximin product is granted approval and such other generic rifaximin product begins to be sold or distributed before January 1, 2028.
Salix SEC Investigation -
In the fourth quarter of 2014, the SEC commenced a formal investigation into alleged securities law violations by Salix Ltd. The investigation related to certain disclosures made prior to the Salix Acquisition by Salix Ltd. and its then-chief financial officer relating to the amounts of Salix Ltd. drugs held in inventory by certain wholesaler customers. On September 28, 2018, we reached a settlement of the relevant charges with the SEC, which remains subject to approval by the U.S. District Court for the Southern District of New York. Salix Ltd. did not admit or deny the SEC’s allegations. No monetary penalty against the Company or Salix Ltd. was assessed by the terms of the settlement. As a result, we recorded a favorable adjustment of $40 million reflecting the reversal of the contingent liability assumed in connection with the Salix Acquisition.
Arbitration with Alfasigma S.p.A. (“Alfasigma”)
- In July 2016, Alfasigma commenced arbitration against the Company and its subsidiary, Salix Inc., pursuant to which Alfasigma made certain allegations respecting a development project for a formulation of the rifaximin compound that was being conducted under the terms of the Amended and Restated License Agreement between Alfasigma and Salix Inc.
On October 25, 2018, Alfasigma, the Company and Salix Inc. entered into a settlement agreement, pursuant to which the parties released each other from all of the claims raised in the arbitration. In connection with the settlement, the parties requested a dismissal of the arbitration on a with prejudice basis, which the ICC has granted.
Address Regulatory Matters
In the normal course of business, our products, devices and facilities are the subject of ongoing oversight and review, by regulatory and governmental agencies, including general, for cause and pre-approval inspections by the FDA. In 2016, FDA inspections of our Rochester, New York and Tampa, Florida facilities resulted in observations that we needed to address as we disclosed in previous filings. As we disclosed in previous filings, in 2017, we resolved these matters with the FDA. Following the resolution of these matters and the completion of U.S. FDA inspections of our other facilities going back to February 2017, all of our facilities were in good compliance standing with the FDA.
In August 2018, the FDA conducted its annual inspection of the Tampa Florida facility. The FDA inspection resulted in an Official Action Indicated (“OAI”) of the Goods Manufacturing Practices (“GMP”) of our Tampa Florida facility. The findings of this inspection does not impact our ability to manufacture and deliver products to the U.S. and approved foreign markets. Following the inspection, we provided the FDA with a comprehensive response which was accepted by the FDA. On December 17, 2018 we met with the FDA at which time the FDA pledged to work with us to expedite the reversal of the OAI status to Voluntary Action Indicated (“VAI”) status or better. The FDA completed the verification of actions promised in our responses during a re-inspection of the Tampa Florida facility during the period January 22, 2019 through January 30, 2019. The inspection was closed successfully without any observation. We expect the FDA to revert the OAI compliance status of the Tampa Florida facility to VAI or better imminently.
As of the date of this filing, with the exception of the Tampa Florida facility, all of our facilities are rated as either No Action Indicated (or NAI, where there was no Form 483 observation) or VAI (where there was a Form 483 with one or more observations). In the case of the VAI inspection outcome, the FDA has accepted our responses to the issues cited in the Form 483, which will be verified when the agency makes its next inspection of those specific facilities. (A Form 483 is issued at the end of each inspection when FDA investigators have observed any condition that in their judgment may constitute violations of CGMP.)
Patient Access and Pricing Committee and New Pricing Actions
Improving patient access to our products, as well as making them more affordable, is an important element of our turnaround. In May 2016, we formed the Patient Access and Pricing Committee responsible for setting, changing and monitoring the pricing of our branded products to ensure launch prices and price changes are assessed and implemented across channels with a focus on patient accessibility and affordability while maintaining profitability. Since that time, the Patient Access and Pricing Committee has been committed to limiting the average annual price increase for our branded prescription pharmaceutical products to no greater than single digits and reaffirmed this commitment for 2019. We expect that the Patient Access and Pricing Committee will continue to implement or recommend additional price changes and/or new programs in line with this commitment to enhance patient access to our drugs. These pricing changes and programs could affect the average realized pricing for our products and may have a significant impact on our revenue trends.
50
Walgreens Fulfillment Arrangements
In the beginning of 2016, we launched a brand fulfillment arrangement with Walgreen Co. ("Walgreens") and extended these programs to additional participating independent retail pharmacies. Under the terms of the brand fulfillment arrangement, we made available certain of our products to eligible patients through a patient access and co-pay program available at Walgreens U.S. retail pharmacy locations, as well as participating independent retail pharmacies. The program under this 20-year agreement initially covers certain of our dermatology products, including Jublia
®
, Luzu
®
, Solodyn
®
, Retin-A Micro
®
Gel 0.08% and 0.06%, Onexton
®
and Acanya
®
Gel, certain of our ophthalmology products, including Vyzulta
®
, Besivance
®
, Lotemax
®
, Alrex
®
, Prolensa
®
, Bepreve
®
and Zylet
®
. The Company continues to explore options to modify the Walgreens arrangement to improve the distribution and sales of our products.
Transform
With our business objectives now set and our leadership team in place, we have begun to move toward our transformation.
Increase the Focus of our Pipeline
We are constantly challenged by the dynamics of our industry to innovate and bring new products to market. Now that we have divested certain businesses where we saw limited growth opportunities, we can be more aggressive in redirecting our R&D spend and other corporate investments narrowly focused to innovate within our core businesses where we believe we can be most profitable and where we aim to be an industry leader.
We believe that we have a well-established product portfolio that is diversified within our core businesses and provides a sustainable revenue stream to fund our operations. However, the success of our transformation is also dependent upon our ability to continually refresh our pipeline, to provide a rotation of product launches that meet new and changing demands and replace other products that have lost momentum. We believe we have a robust pipeline that not only provides for the next generation of our existing products, but is also poised to bring new products to market.
During 2018, we launched and/or relaunched innovative products, across multiple countries that contributed to organic growth in most of our core businesses and we currently have over
250
R&D projects in our global pipeline. These products and R&D projects include the products we have dubbed our "Significant Seven", which were products recently launched or which we expect to launch pending completion of testing and receipt of approval from the FDA.
These Significant Seven products are: (i) Bryhali™ (Ortho Dermatologics), (ii) Duobrii™ (provisional name) (Ortho Dermatologics), (iii) Lumify
®
(Bausch + Lomb), (iv) Relistor
®
(Salix), (v) SiHy Daily (Bausch + Lomb), (vi) Siliq™ (Ortho Dermatologics) and (vii) Vyzulta
®
(Bausch + Lomb).
Descriptions of these products and relevant launch dates and/or stages of testing were previously discussed. Revenues for our Significant Seven were greater than
$150 million
and approximately
$75 million
in 2018 and 2017, respectively; however, we believe the prospects for this group of products to be substantial and anticipate devoting significant marketing efforts toward their promotion. We believe that the strength of these launches and the impact of these products on their respective markets will demonstrate the effectiveness of our pipeline and R&D strategies and inspire further innovation in our businesses.
Leveraging our Salix Brands
As previously discussed, in December 2016, we initiated a significant GI sales force expansion program in support of our Xifaxan
®
for IBS-D and Relistor
®
tablets for OIC products. This initiative provided us with positive results, as we experienced consistent growth in demand for these products throughout the balance of 2017 and 2018. Revenues from our Xifaxan
®
and Relistor
®
franchises increased approximately
22%
and
37%
, respectively, in 2018 when compared to 2017. These results encouraged us to seek out ways to bring out further value through leveraging our existing sales force and in the second half of 2018, we identified certain opportunities.
Because we strongly believe in our Xifaxan
®
and Relistor
®
business models, we have taken initiatives to further capitalize on the value of the infrastructure we have built around these products. For instance, in order to continue to generate growth, we continue to directly invest in next generation formulations of Xifaxan
®
and rifaximin, the principal semi-synthetic antibiotic used in our Xifaxan
®
product. In addition to one R&D program in process, we have three other R&D programs planned to start in 2019 for next generation formulations of Xifaxan
®
and rifaximin which address new indications.
51
In addition to driving organic growth through internal R&D development opportunities, we strive to access other products outside our existing Salix business that allow us to leverage our existing GI sales force, supply channel and distribution channel to bring about growth through co-promotion and acquisition. For instance, in the second half of 2018, we entered into agreements with Dova Pharmaceuticals, Inc. to co-promote Doptelet
®
, a new treatment of thrombocytopenia in adult patients with chronic liver disease, and with US WorldMeds, LLC to co-promote Lucemyra™, a non-opioid medication for the mitigation of withdrawal symptoms to facilitate abrupt discontinuation of opioids. We are also pursuing the acquisition of Synergy Pharmaceuticals Inc. (“Synergy”) as the “stalking horse” bidder in a bankruptcy court supervised auction and sale process expected to be completed in March 2019. If successful, we will acquire certain assets of Synergy, including its worldwide rights to the Trulance
®
(plecanatide) product, a once-daily tablet for adults with chronic idiopathic constipation and irritable bowel syndrome with constipation. We believe that these co-promotion and acquisition opportunities will be accretive to our business by providing us access to products that are a natural pairing to either our Xifaxan
®
or Relistor
®
businesses, allowing us to effectively leverage our existing infrastructure and generate growth.
Refocus the Ortho Dermatologics Business
In support of our Ortho Dermatologics business and the opportunities we see for growth in this business, we continue to allocate resources and make additional investments in this business to recruit and retain talent and focus on our core dermatology portfolio of products.
During 2017, we began the turnaround of our dermatology business by taking a number of actions which we believe will help our efforts to stabilize our dermatology business, which included: (i) rebranding our dermatology business, (ii) recruiting a new experienced leadership team, (iii) making significant investment in the dermatology pipeline, (iv) adjusting the size of the dermatology sales force and (v) reorganizing that sales force around roughly 150 territories, as we work to rebuild relationships with prescribers of our products.
Recruit and Retain Talent
- In 2017, we identified and retained a proven leadership team of experienced dermatology sales professionals and marketers. In January 2018, the leadership team, encouraged by the success of our 2016 GI sales force expansion program, increased our Ortho Dermatologics sales force by more than 25% in support of our growth initiatives for our Ortho Dermatologics business. We believe the additional sales force is vital to meet the demand we expect from our recently launched products and those we expect to launch in the near term, pending FDA approval. We continue to monitor our pipeline for other near term launches that we believe will create opportunity needs in our other core businesses requiring us to make additional investment in our sales force to retain people for additional leadership and sales force roles.
Investment in Core Dermatology Portfolio
-
We have made significant investments to build out our psoriasis and acne product portfolios, which are the markets within dermatology where we see the greatest opportunities, with a focus on topical gel and lotion products over injectable biologics. We continue to support and develop injectable biologics; however, we believe some patients prefer topical products as an alternative delivery method to injectable biologics. Further, as topical products can, in many cases, defer the use of injectable biologics and need not be administered by a certified biologic physician, a topical product is usually more cost-effective and better supported by managed care payors over its alternative injectable biologic product. Therefore, we believe topical products represent significant innovation for physicians, payors and patients, and as the preferred choice of treatment, have the potential to drive greater volumes, generate better margins and will ultimately be a key contributing factor of our Ortho Dermatologics business.
Psoriasis
- As the number of reported cases of psoriasis in the U.S. has increased, we believe there is a need to make further investments in this market in order to maximize our opportunity and supplement our current psoriasis product portfolio. We have filed NDAs for several new topical psoriasis products, including Bryhali™ (launched November 2018) and Duobrii
TM
(provisional name), which we expect to launch in the near term pending FDA approval. On June 18, 2018, we announced that we received a CRL from the FDA to our NDA for Duobrii
TM
(provisional name). The CRL did not specify any deficiencies related to the clinical efficacy or safety of Duobrii
TM
(provisional name) and did not identify issues with our Chemistry, Manufacturing and Controls processes. The CRL only noted questions regarding pharmacokinetic data. Working to resolve this matter expeditiously, we met with the FDA to understand the additional data requirements. We resubmitted our NDA, and on August 29, 2018, we announced that the FDA accepted the application as a Class 2 resubmission, with a PDUFA action date of February 15, 2019. On February 15, 2019 we announced that the FDA is still finalizing its review and would be unable to meet the PDUFA action date. We expect a decision from the FDA in the near future. We expect that Bryhali™ and Duobrii
TM
(provisional name), if approved by the FDA, will line up well with our existing topical portfolio of psoriasis treatments and, supplemented by our injectable biologic products such as Siliq
TM
launched in July 2017, will provide a diverse choice of psoriasis treatments to doctors and patients. In addition, on February 27, 2018, we announced that we entered into an exclusive license agreement with Kaken Pharmaceutical Co., Ltd. to develop and commercialize products containing a new chemical entity, KP-470, for the topical treatment of psoriasis. Early proof of concept studies are now planned for the first half of 2019. If approved by the FDA, KP-470 could represent a novel drug with an alternative mechanism of action in the topical treatment of psoriasis.
52
Acne
- In support of our established acne product portfolio, we have been developing several products, which includes Retin-A Micro
®
0.06% (launched in January 2018) and other products in various stages of development, such as Altreno
TM
, the first lotion (rather than a gel or cream) product containing tretinoin for the treatment of acne. The FDA has approved Altreno
TM
in August 2018 and Altreno
TM
was launched in the United States in October 2018. In addition to Retin-A Micro
®
0.06% and Altreno
TM
, we have three other unique acne projects in earlier stages of development that, if approved by the FDA, we believe will further innovate and advance the treatment of acne.
Bolstered by the new product opportunities we are creating in our psoriasis and acne product lines, our experienced dermatology sales leadership team and our increased sales force, we believe we have set the groundwork for the potential to achieve growth in our Ortho Dermatologics business over the next five years.
Continue to Manage Our Capital Structure
As previously outlined, we completed a series of transactions that reduced our debt levels and improved our capital structure. As a result of prepayments and a series of refinancing transactions during 2017 and 2018, we have extended the maturities of a substantial portion of our long-term debt beyond 2023, providing us with additional liquidity and greater flexibility to execute our business plans. Our reduced debt levels and improved debt portfolio will translate to lower repayments of principal over the next five years, which, in turn, will permit more cash flows to be directed toward developing our core assets and repay additional debt amounts. In addition, as a result of the changes in our debt portfolio, approximately 76% of our debt is fixed rate debt as of
December 31, 2018
, as compared to approximately 65% as of January 1, 2017.
We continue to monitor our capital structure and to evaluate other opportunities to simplify our business and improve our capital structure giving us the ability to better focus on our core businesses. While we anticipate focusing any future divestiture activities on non-core assets, consistent with our duties to our shareholders and other stakeholders, we will consider dispositions in core areas that we believe represent attractive opportunities for the Company. Also, the Company regularly evaluates market conditions, its liquidity profile and various financing alternatives for opportunities to enhance its capital structure. If the Company determines that conditions are favorable, the Company may refinance or repurchase existing debt or issue additional debt, equity or equity-linked securities.
Managing Generic Competition and Loss of Exclusivity
Certain of our products face the expiration of their patent or regulatory exclusivity in 2019 or in later years, following which we anticipate generic competition of these products. In addition, in certain cases, as a result of negotiated settlements of some of our patent infringement proceedings against generic competitors, we have granted licenses to such generic companies, which will permit them to enter the market with their generic products prior to the expiration of our applicable patent or regulatory exclusivity. Finally, for certain of our products that lost patent or regulatory exclusivity in prior years, we anticipate that generic competitors may launch in 2019 or in later years. Following a loss of exclusivity of and/or generic competition for a product, we would anticipate that product sales for such product would decrease significantly shortly following the loss of exclusivity or entry of a generic competitor. Where we have the rights, we may elect to launch an authorized generic of such product (either ourselves or through a third party) prior to, upon or following generic entry, which may mitigate the anticipated decrease in product sales; however, even with launch of an authorized generic, the decline in product sales of such product would still be expected to be significant, and the effect on our future revenues could be material.
A number of our products already face generic competition. Prior to and during 2018, in the U.S., these products include, among others, Ammonul
®
, Benzaclin
®
, Bupap
®
, Edecrin
®
, Elidel
®
, Glumetza
®
, Istalol
®
, Isuprel
®
, Locoid
®
Lotion, Mephyton
®
, Nitropress
®
, Syprine
®
, Virazole
®
, Uceris
®
Tablet, Wellbutrin XL
®
, Xenazine
®
and Zegerid
®
. In Canada, these products include, among others, Glumetza
®
, Sublinox
®
and Wellbutrin
®
XL.
Based on current patent expiration dates, settlement agreements and/or competitive information, we believe our key products facing potential loss of exclusivity and/or generic competition in the U.S. during the years 2019 through 2023 include, but are not limited to, Apriso
®
, Clindagel
®
, Cuprimine
®
, Lotemax
®
Gel, Lotemax
®
Suspension, Migranal
®
, Noritate
®
, Onexton
®
, PreserVision
®
, Prolensa
®
, Targretin
®
Gel, Xerese
®
, Zovirax
®
cream and certain other products subject to settlement agreements. Aggregate revenues from key products that we believe will face potential loss of exclusivity and/or generic competition in the U.S. during: (i) 2019 represented 8% and 8%; (ii) 2020 represented 2% and 2%; (iii) 2021 represented 4% and 4%; (iv) 2022 represented less than 1% and 1%; and (v) 2023 represented 2% and 2% of our U.S., Mexico and Puerto Rico revenues for 2018 and 2017, respectively. These dates may change based on, among other things, successful challenge to our patents, settlement of existing or future patent litigation and at-risk generic launches.
In addition, for a number of our products (including Apriso
®
, Uceris
®
, Relistor
®
and Jublia
®
in the U.S. and Glumetza
®
in Canada), we have commenced (or anticipate commencing) infringement proceedings against potential generic competitors in the U.S. and Canada. If we are not successful in these proceedings, we may face increased generic competition for these products.
53
Xifaxan
®
Patent Litigation -
As previously discussed, on March 23, 2016, the Company initiated litigation against Actavis which alleged infringement by Actavis of one or more claims of each of the Xifaxan
®
patents. On September 12, 2018, we announced that we reached an agreement with Actavis which resolved the existing litigation and eliminated the pending challenges to our intellectual property protecting Xifaxan
®
(rifaximin) 550 mg tablets. As part of the agreement, the parties have agreed to dismiss all litigation related to Xifaxan
®
(rifaximin), Actavis acknowledges the validity of the licensed patents for Xifaxan
®
(rifaximin) 550 mg tablets and all intellectual property protecting Xifaxan
®
(rifaximin) 550 mg tablets will remain intact and enforceable until expiry in 2029. The agreement also grants Actavis a non-exclusive license to the intellectual property relating to Xifaxan
®
(rifaximin) 550 mg tablets in the United States beginning January 1, 2028 (or earlier under certain circumstances). The Company will not make any financial payments or other transfers of value as part of the agreement. In addition, under the terms of the agreement, beginning January 1, 2028 (or earlier under certain circumstances), Actavis will have the option to: (1) market a royalty-free generic version of Xifaxan
®
tablets, 550 mg, should it receive approval from the FDA on its ANDA, or (2) market an authorized generic version of Xifaxan
®
tablets, 550 mg, in which case, we will receive a share of the economics from Actavis on its sales of such an authorized generic.
Generic Competition to Uceris
®
-
In July 2018, a generic competitor launched a product which will directly compete with our Uceris
®
Tablet product. The ultimate impact of this generic competitor on our future revenues cannot be predicted; however, Uceris
®
Tablet revenues for the six months ended June 30, 2018 were approximately $70 million and for the full years 2018, 2017 and 2016 were approximately $84 million, $134 million and $156 million, respectively. As disclosed in our prior filings, the Company initiated various infringement proceedings against this and other generic competitors. The Company continues to believe that its Uceris
®
Tablet-related patents are enforceable and is proceeding in the ongoing litigation between the Company and the generic competitor; however, the ultimate outcome of the matter is not predictable.
Generic Competition to Jublia
®
-
On June 6, 2018, the U.S. Patent and Trial Appeal Board completed its inter partes review for an Orange Book-listed patent covering Jublia
®
and issued a written determination invalidating such patent. Although the Company is not aware of any imminent launches of a generic competitor to Jublia
®
, the ultimate impact of this decision on our future revenues cannot be predicted. Jublia
®
revenues for the nine months ended September 30, 2018 were approximately $62 million and for the full years 2018, 2017 and 2016 were approximately $89 million, $96 million and $140 million, respectively. The Company continues to believe that the Jublia
®-
related patent is valid and enforceable and, on August 7, 2018, an appeal of this decision was filed. The ultimate outcome of this matter is not predictable. Jublia
®
continues to be covered by seven remaining Orange Book-listed patents owned by the Company, which expire in the years 2028 through 2034. In August and September 2018, we received notices of the filing of a number of ANDAs with paragraph IV certification, and have timely filed patent infringement suits against these ANDA filers.
See
Note 20, "LEGAL PROCEEDINGS"
to our audited Consolidated Financial Statements for further details regarding certain infringement proceedings.
The risks of generic competition are a fact of the health care industry and are not specific to our operations or product portfolio. These risks are not avoidable, but we believe they are manageable. To manage these risks, our leadership team continually evaluates the impact that generic competition may have on future profitability and operations. In addition to aggressively defending the Company's patents and other intellectual property, our leadership team makes operational and investment decisions regarding these products and businesses at risk, not the least of which are decisions regarding our pipeline. Our leadership team actively manages the Company's pipeline in order to identify what we believe are the proper projects to pursue. Innovative and realizable projects aligned with our core businesses that are expected to provide incremental and sustainable revenues and growth into the future. We believe that our current pipeline is strong enough to meet these objectives and provide future sources of revenues, in our core businesses, sufficient enough to sustain our growth and corporate health as other products in our established portfolio face generic competition and lose momentum.
We believe that we have a well-established product portfolio that is diversified within our core businesses. We also believe that we have a robust pipeline that not only provides for the next generation of our existing products, but also brings new solutions into the market. Revenues for our Significant Seven were greater than
$150 million
and approximately
$75 million
in 2018 and 2017, respectively, as several of these products have only recently been launched and others are yet to be launched. However, we believe the potential revenues for our Significant Seven to be substantial.
See Item 1A “Risk Factors” of this Form 10-K for additional information on our competition risks.
54
Business Trends
In addition to the acquisition and divestiture actions previously outlined, the following events have affected and are expected to affect our business trends:
U.S. Health Care Reform
The U.S. federal and state governments continue to propose and pass legislation designed to regulate the health care industry. In March 2010, the Patient Protection and Affordable Care Act (the “ACA”) was enacted in the U.S. The ACA contains several provisions that impact our business, including: (i) an increase in the minimum Medicaid rebate to states participating in the Medicaid program, (ii) the extension of the Medicaid rebates to Managed Care Organizations that dispense drugs to Medicaid beneficiaries, (iii) the expansion of the 340(B) Public Health Services drug pricing program, which provides outpatient drugs at reduced rates, to include additional hospitals, clinics and health care centers and (iv) a fee payable to the federal government based on our prior-calendar-year share relative to other companies of branded prescription drug sales to specified government programs.
In addition, in 2013: (i) federal subsidies began to be phased in for brand-name prescription drugs filled in the Medicare Part D cover gap and (ii) the law requires the medical device industry to subsidize health care reform in the form of a 2.3% excise tax on U.S. sales of most medical devices. However, the Consolidated Appropriations Act, 2016 (Pub. L. 114-113), signed into law on December 18, 2015, included a two-year moratorium on the medical device excise tax. On January 22, 2018, with the passage of continuing appropriations through February 8, 2018 (HR 195), the moratorium on the medical device excise tax was further extended until January 1, 2020. The ACA also included provisions designed to increase the number of Americans covered by health insurance. In 2014, the ACA's private health insurance exchanges began to operate. The ACA also allows states to expand Medicaid coverage with most of the expansion’s cost paid for by the federal government.
For
2018, 2017 and 2016
, we incurred costs of $36 million, $48 million and $36 million, respectively, related to the annual fee assessed on prescription drug manufacturers and importers that sell branded prescription drugs to specified U.S. government programs (e.g., Medicare and Medicaid). For
2018, 2017 and 2016
, we also incurred costs of $90 million, $106 million and $128 million, respectively, on Medicare Part D utilization incurred by beneficiaries whose prescription drug costs cause them to be subject to the Medicare Part D coverage gap (i.e., the “donut hole”).
On July 28, 2014, the U.S. Internal Revenue Service issued final regulations related to the branded pharmaceutical drug annual fee pursuant to the ACA. Under the final regulations, an entity’s obligation to pay the annual fee is triggered by qualifying sales in the current year, rather than the liability being triggered upon the first qualifying sale of the following year. We adopted this guidance in the third quarter of 2014, and it did not have a material impact on our financial position or results of operations.
The financial impact of the ACA will be affected by certain additional developments over the next few years, including pending implementation guidance and certain health care reform proposals. Additionally, policy efforts designed specifically to reduce patient out-of-pocket costs for medicines could result in new mandatory rebates and discounts or other pricing restrictions. Also, it is possible, as discussed further below, that under the current administration, legislation will be passed by Congress repealing the ACA in whole or in part. Adoption of legislation at the federal or state level could materially affect demand for, or pricing of, our products.
In 2018, we faced uncertainties due to federal legislative and administrative efforts to repeal, substantially modify or invalidate some or all of the provisions of the ACA. However, we believe there is low likelihood of repeal of the ACA, given the recent failure of the Senate’s multiple attempts to repeal various combinations of ACA provisions. There is no assurance that any replacement or administrative modifications of the ACA will not adversely affect our business and financial results, particularly if the replacing legislation reduces incentives for employer-sponsored insurance coverage, and we cannot predict how future federal or state legislative or administrative changes relating to the reform will affect our business.
Other legislative efforts relating to drug pricing have been proposed and considered at the U.S. federal and state level. We also anticipate that Congress, state legislatures and third-party payors may continue to review and assess alternative health care delivery and payment systems and may in the future propose and adopt legislation or policy changes or implementations affecting additional fundamental changes in the health care delivery system.
U.S. Tax Reform
On December 22, 2017, the Tax Cuts and Jobs Act of 2017 (the “Tax Act”) was signed into law which includes a number of changes to existing U.S. tax laws, most notably a reduction in the U.S. corporate federal statutory tax rate from 35% to 21% for tax years beginning after December 31, 2017. The Tax Act also implemented a modified territorial tax system that includes a one-time transition tax on the accumulated previously untaxed earnings of foreign subsidiaries (the “Transition Toll Tax”) equal to
55
15.5% (reinvested in liquid assets) or 8% (reinvested in non-liquid assets). At the taxpayer's election, the Transition Toll Tax can be paid over an eight-year period without interest, beginning in 2018. The Company has elected to use a portion of its U.S. NOLs to offset the transition toll tax.
The Tax Act also included two new U.S. tax base erosion provisions: (i) the base-erosion and anti-abuse tax (“BEAT”) and (ii) the global intangible low-taxed income (“GILTI”). BEAT provides a minimum tax on U.S. tax deductible payments made to related foreign parties after December 31, 2017. GILTI requires a U.S. entity to include in its U.S. taxable income the earnings of certain foreign subsidiaries in excess of an allowable return on each foreign subsidiary’s depreciable tangible assets. Accounting guidance provides that the impacts of this provision can be included in the consolidated financial statements either by recording the impacts in the period in which GILTI has been incurred or by adjusting deferred tax assets or liabilities in the period of enactment related to basis differences expected to reverse as a result of the GILTI provisions in future years. The Company has elected to provide for the GILTI tax in the period in which it is incurred and, therefore, the 2017 benefit for income taxes did not include a provision for GILTI. Further, as the BEAT tax is a period cost and was not in effect until after December 31, 2017, there was no provision required in 2017.
As part of the Tax Act, the Company’s U.S. interest expense is subject to limitation rules which limit U.S. interest expense to 30% of adjusted taxable income, defined similar to EBITDA through 2021 and EBIT thereafter. Disallowed interest can be carried forward indefinitely and any unused interest deduction assessed for recoverability. The Company considered such provisions in the 2018 annual estimated effective rate assessment and expects to fully utilize any interest carry forwards in future periods.
In December 2017, the SEC issued guidance in situations where the accounting for certain elements of the Tax Act could not be completed prior to the release of an entity's financial statements. At the time of releasing our financial statements for the year ended December 31, 2017, the Tax Act was only recently passed and full guidance associated with its impacts was not yet provided from the relevant state and federal jurisdictions. As such, and as provided by the guidance issued by the SEC, we used all available information at that time to form appropriate accounting estimates for certain elements of the Tax Act, but we did not make any estimates for other elements of the Tax Act as to which further guidance was necessary in order for us to estimate the impact of those elements.
During the fourth quarter of 2018, the Company completed its full assessment and finalized its Benefit from income taxes for the year 2017, including the Transition Toll Tax, in accordance with guidance issued by accounting regulatory bodies, the U.S. Internal Revenue Service and state and local governments. As part of its full assessment, the Company assessed the impact of the Tax Act on its tax filings for the year 2017 which were completed during the fourth quarter of 2018. Differences between the provisional net income tax benefit provided in 2017 attributable to the Tax Act and the net income tax benefit as finalized were included in our Benefit from income taxes for the year ended December 31, 2018 and were not material to our Net loss for the year ended December 31, 2018 and any of its interim periods. At this time management is unable to estimate the impact, if any, of any future regulations.
We have provided for income taxes, including the impacts of the Tax Act, in accordance with guidance issued by accounting regulatory bodies, the U.S. Internal Revenue Service and state and local governments through the date of this filing. Additional guidance and interpretations can be expected and such guidance, if any, could impact our future results. While management continues to monitor these matters, the ultimate impact, if any, as a result of the application of any guidance issued in the future cannot be determined at this time.
See
Note 2, "SIGNIFICANT ACCOUNTING POLICIES"
and
Note 17, "INCOME TAXES"
to our audited Consolidated Financial Statements, as well as the sub-heading "Income Taxes" below, for further details.
56
SELECTED FINANCIAL INFORMATION
Organic Revenues and Organic Growth Rates
Organic growth, a non-GAAP metric, is defined as a change on a period-over-period basis in revenues on a constant currency basis (if applicable) excluding the impact of recent acquisitions, divestitures and discontinuations. Organic revenue growth is growth in GAAP Revenue (its most directly comparable GAAP financial measure), adjusted for certain items, of businesses that have been owned for one or more years. The Company uses organic revenue and organic revenue growth to assess performance of its reportable segments, and the Company in total, without the impact of foreign currency exchange fluctuations and recent acquisitions, divestitures and product discontinuations. The Company believes that such measures are useful to investors as they provide a supplemental period-to-period comparison.
Organic revenue growth reflects adjustments for: (i) the impact of period-over-period changes in foreign currency exchange rates on revenues and (ii) the revenues associated with acquisitions, divestitures and discontinuations of businesses divested and/or discontinued. These adjustments are determined as follows:
Foreign currency exchange rates:
Although changes in foreign currency exchange rates are part of our business, they are not within management’s control. Changes in foreign currency exchange rates, however, can mask positive or negative trends in the underlying business performance. The impact for changes in foreign currency exchange rates is determined as the difference in the current period reported revenues at their current period currency exchange rates and the current period reported revenues revalued using the monthly average currency exchange rates during the comparable prior period.
Acquisitions, divestitures and discontinuations:
In order to present period-over-period organic revenues (non-GAAP) on a comparable basis, revenues associated with acquisitions, divestitures and discontinuations are adjusted to include only revenues from those businesses and assets owned during both periods. Accordingly, organic revenue (non-GAAP) growth excludes from the current period, all revenues attributable to each acquisition for twelve months subsequent to the day of acquisition, as there are no revenues from those businesses and assets included in the comparable prior period. Organic revenue (non-GAAP) growth excludes from the prior period (but not the current period), all revenues attributable to each divestiture and discontinuance during the twelve months prior to the day of divestiture or discontinuance, as there are no revenues from those businesses and assets included in the comparable current period.
Please refer to the tables of organic revenues (non-GAAP) and organic revenue growth rates presented in the subsequent section titled “Reportable Segment Revenues and Profits” for a reconciliation of GAAP revenues to organic revenues (non-GAAP).
The following table provides selected financial information for each of the last three years:
|
|
Years Ended December 31,
|
Change
|
||||||||||||||||||
|
(in millions, except per share data)
|
2018
|
2017
|
2016
|
2017 to 2018
|
2016 to 2017
|
|||||||||||||||
|
Revenues
|
$
|
8,380
|
|
$
|
8,724
|
|
$
|
9,674
|
|
$
|
(344
|
)
|
$
|
(950
|
)
|
|||||
|
Operating (loss) income
|
$
|
(2,384
|
)
|
$
|
102
|
|
$
|
(566
|
)
|
$
|
(2,486
|
)
|
$
|
668
|
|
|||||
|
Loss before benefit from income taxes
|
$
|
(4,154
|
)
|
$
|
(1,741
|
)
|
$
|
(2,435
|
)
|
$
|
(2,413
|
)
|
$
|
694
|
|
|||||
|
Net (loss) income
|
$
|
(4,144
|
)
|
$
|
2,404
|
|
$
|
(2,408
|
)
|
$
|
(6,548
|
)
|
$
|
4,812
|
|
|||||
|
Net (loss) income attributable to Bausch Health Companies Inc.
|
$
|
(4,148
|
)
|
$
|
2,404
|
|
$
|
(2,409
|
)
|
$
|
(6,552
|
)
|
$
|
4,813
|
|
|||||
|
(Loss) earnings per share attributable to Bausch Health Companies Inc.
|
||||||||||||||||||||
|
Basic
|
$
|
(11.81
|
)
|
$
|
6.86
|
|
$
|
(6.94
|
)
|
$
|
(18.67
|
)
|
$
|
13.80
|
|
|||||
|
Diluted
|
$
|
(11.81
|
)
|
$
|
6.83
|
|
$
|
(6.94
|
)
|
$
|
(18.64
|
)
|
$
|
13.77
|
|
|||||
Financial Performance
Summary of 2018 Compared with 2017
Our revenue for
2018
and
2017
was
$8,380 million
and
$8,724 million
, respectively,
a decrease
of
$344 million
, or
4%
. The
decrease
was primarily driven by: (i)
the impact of 2017 divestitures and discontinuations
and (ii) lower volumes primarily as a result of the loss of exclusivity for a number of products in our Diversified Products and Ortho Dermatologics segments which were partially offset by higher volumes in our Bausch + Lomb/International segment. These decreases in Revenue were partially offset by: (i)
higher gross selling prices
, (ii)
lower sales deductions
and (iii) the favorable
effect of foreign currencies
, primarily in Europe and Asia
.
57
Operating loss
for
2018
was
$2,384 million
, as compared to
operating income
for
2017
of
$102 million
,
a decrease
of
$2,486 million
. Our
operating loss
for
2018
compared to our
operating income
for
2017
reflects, among other factors:
|
•
|
a decrease
in contribution (product sales revenue less cost of goods sold, exclusive of amortization and impairments of intangible assets) of
$127 million
. The
decrease
was primarily driven by
the impact of 2017 divestitures and discontinuations
, partially offset by: (i)
higher gross selling prices
, (ii)
lower sales deductions
, (iii) lower third-party royalty costs and (iv) the favorable
effect of foreign currencies
;
|
|
•
|
a decrease
in Selling, general, and administrative expenses (“SG&A”) of
$109 million
, primarily attributable to: (i)
the impact of 2017 divestitures and discontinuations
, (ii) a decrease in legal expenses as we resolved certain legacy legal issues and (iii) a decrease in bad debt expense. The decrease was partially offset by: (i) higher advertising and promotion expenses, (ii) higher compensation costs and (iii) the unfavorable impact of the
effect of foreign currencies
;
|
|
•
|
an increase
in R&D of
$52 million
;
|
|
•
|
a decrease
in
Amortization of intangible assets
of
$46 million
, primarily attributable to: (i) the impact of the change in the estimated useful life of the Xifaxan
®-
related intangible assets made in September 2018 to reflect management's changes in assumptions, (ii) lower amortization as a result of impairments to intangible assets and divestitures and (iii) discontinuances of product lines during 2017 as the Company focuses on its core assets. These decreases were partially offset by the impact of changes in estimates made in 2017 to reduce the remaining useful lives of certain products and the Salix brand name to reflect management's changes in assumptions;
|
|
•
|
an increase
in
Goodwill impairments
of
$2,010 million
. In 2018, we recognized Goodwill impairments of
$2,322 million
in connection with: (i) impairment to the goodwill of our Salix reporting unit recognized upon adopting new accounting guidance at January 1, 2018, (ii) impairment to the goodwill of the Ortho Dermatologics reporting unit due to unforeseen changes in business dynamics and (iii) impairment to the goodwill of the Dentistry reporting unit as a result of revised forecasts due to changing market conditions during the three months ended December 31, 2018. In 2017, we recognized Goodwill impairments of
$312 million
in connection with a change in reporting unit during the three months ended September 30, 2017;
|
|
•
|
a decrease
in
Asset impairments
of
$146 million
, as a result of Asset impairments of
$714 million
, recognized in 2017, primarily related to the Sprout and Obagi businesses being classified as held for sale, compared to Asset impairments of
$568 million
, in 2018, that were primarily due to decreases in forecasted sales for the Uceris
®
Tablet product and other product lines due to generic competition;
|
|
•
|
an increase
in
Acquisition-related contingent consideration
of
$280 million
as a result of a fair value adjustments in 2017 which reflected a decrease in forecasted sales for specific products, including Addyi
®
;
|
|
•
|
a decrease in net gains on sales of businesses and other assets of $586 million. In order to improve our capital structure and simplify our operations, during 2017, we divested certain businesses and assets not aligned with our core business objectives. Included in
Other (income) expense, net
is the net loss on sales of businesses and other assets of $6 million for 2018 as compared to the net gain on sales of businesses and other assets $580 million in 2017; and
|
|
•
|
a decrease in Litigation and other matters of $253 million. Included in
Other (income) expense, net
are net favorable adjustments to Litigation and other matters of $27 million for 2018, primarily associated with a favorable adjustment related to the Salix SEC litigation as compared to net charges of $226 million in 2017, primarily associated with estimated settlements of the Allergan shareholder class actions litigation and Solodyn
®
antitrust class actions litigation and the partial summary judgment related to the Mimetogen Pharmaceuticals litigation.
|
Operating loss
for
2018
of
$2,384 million
and
Operating income
for
2017
of
$102 million
includes non-cash charges for
Depreciation and amortization of intangible assets
of
$2,819 million
and
$2,858 million
,
Asset impairments
of
$568 million
and
$714 million
and Share-based compensation of
$87 million
and
$87 million
, respectively.
Our
Loss before benefit from income taxes
for
2018
and
2017
was
$4,154 million
and
$1,741 million
, respectively,
an increase
of
$2,413 million
. The
increase
in our
Loss before benefit from income taxes
is primarily attributable to: (i) the decrease in our operating results of
$2,486 million
previously discussed and (ii)
an unfavorable net change
in
Foreign exchange and other
of
$84 million
. These changes in
Loss before benefit from income taxes
were partially offset by: (i)
a decrease
in Interest expense of
$155 million
as a result of lower principal amounts of outstanding debt partially offset by the effect of higher interest rates during 2018 and (ii) the
decrease
in the
Loss on extinguishment of debt
of
$3 million
.
58
Net loss
attributable to Bausch Health Companies Inc. for
2018
was
$4,148 million
as compared to
Net income
attributable to Bausch Health Companies Inc. for
2017
of
$2,404 million
,
a decrease
of
$6,552 million
. The
decrease
in our results was primarily due to: (i) the
decrease
in the
Benefit from income taxes
of
$4,135 million
which in 2017 included non-cash income tax benefits related to the Company’s internal corporate restructuring and the accounting for the Tax Act and (ii) the
increase
in
Loss before benefit from income taxes
of
$2,413 million
previously described.
Summary of 2017 Compared with 2016
Our revenue for 2017 and 2016 was $8,724 million and $9,674 million, respectively, a decrease of $950 million, or 10%. The decrease was driven by divestitures and discontinuations and lower volumes in: (i) our Diversified Products segment as a result of the loss of exclusivity for a number of products, (ii) our Ortho Dermatologics segment as a result of challenging market dynamics in dermatology and (iii) to a lesser extent, our Salix segment. Revenues were also negatively affected, to a lesser extent, by foreign exchange. These decreases were partially offset by increased volumes in our Bausch + Lomb / International segment, primarily driven by the U.S. Bausch + Lomb Consumer business, and increased international pricing in our Bausch + Lomb / International segment. The changes in our segment revenues and segment profits are discussed in detail in the section titled “Reportable Segment Revenues and Profits”.
Operating income for 2017 was $102 million, as compared to operating loss for 2016 of $566 million, an increase of $668 million. Our operating income for 2017 compared to our operating loss for 2016 reflects, among other factors:
|
•
|
a decrease in contribution (product sales revenue less cost of goods sold, exclusive of amortization and impairments of intangible assets) of $875 million, primarily driven by: (i) lower volumes and (ii) the impact of divestitures and discontinuances;
|
|
•
|
a decrease in SG&A of $228 million, primarily attributable to: (i) a net decrease in advertising and promotion expenses, (ii) higher severance and other benefits in 2016 associated with exiting executives and on-boarding a new executive team and other key employees, (iii) termination benefits associated with our former Chief Executive Officer in 2016 and (iv) the impact of divestitures. These factors were partially offset by an increase in professional fees;
|
|
•
|
a decrease in R&D of $60 million due to the year over year phasing as we completed the R&D investment in Siliq™ and other newly launched products requiring investment in the prior year, removed projects related to divested businesses and rebalanced our portfolio to better focus on its core assets;
|
|
•
|
an increase in Amortization of intangible assets of $17 million, driven by the impact of changes in estimates made in 2017 to reduce the remaining useful lives of certain products and the Salix brand name to reflect management's changes in assumptions, partially offset by lower amortization as a result of impairments to intangible assets and divestitures and discontinuances of product lines during 2017 and 2016, as the Company focuses on its core assets;
|
|
•
|
a decrease in Goodwill impairments of $765 million. In 2016, we recognized Goodwill impairments of $1,077 million primarily in connection with the realignment of our operating segment structure during the three months ended September 30, 2016. In 2017, we recognized Goodwill impairments of $312 million in connection with a change in reporting unit during the three months ended September 30, 2017;
|
|
•
|
an increase in Asset impairments of $292 million, primarily related to the Sprout and Obagi businesses;
|
|
•
|
a decrease in Restructuring and integration costs of $80 million as the integration of acquisitions in 2015 and prior is substantially complete;
|
|
•
|
a decrease in Acquisition-related contingent consideration of $276 million, primarily due to a fair value adjustment of $312 million reflecting a decrease in forecasted sales for the Addyi
®
product prior to the sale of Sprout, which impacted the expected future royalty payments; and
|
|
•
|
an increase in Other income, net of $426 million, primarily due to the increase in net gains on sales of businesses and other assets of $574 million, partially offset by higher charges for accruals for Litigation and other matters of $167 million.
|
Operating income for 2017 of $102 million and Operating loss for 2016 of $566 million includes non-cash charges for Depreciation and amortization of intangible assets of $2,858 million and $2,866 million, Asset impairments of $714 million and $422 million and Share-based compensation of $87 million and $165 million, respectively.
Our Loss before benefit from income taxes for 2017 and 2016 was $1,741 million and $2,435 million, respectively, a decrease of $694 million. The decrease in our Loss before benefit from income taxes is primarily attributable to: (i) the increase in Operating
59
income of $668 million previously discussed and (ii) a favorable net change in Foreign exchange and other of $148 million. These changes in Loss before benefit from income taxes were partially offset by the Loss on extinguishment of debt of $122 million in 2017.
Net income attributable to Bausch Health Companies Inc. for 2017 was $2,404 million as compared to Net loss attributable to Bausch Health Companies Inc. for 2016 of $2,409 million, an increase of $4,813 million. The increase in Net income attributable to Bausch Health Companies Inc. was primarily due to: (i) the increase in the Benefit from income taxes of $4,118 million which in 2017 includes non-cash income tax benefits related to the Company’s internal corporate restructuring and the accounting for the Tax Act and (ii) the decrease in Loss before benefit from income taxes of $694 million previously described.
RESULTS OF OPERATIONS
Our results for each of the last three years were as follows:
|
|
Years Ended December 31,
|
Change
|
||||||||||||||||||
|
(in millions, except per share data)
|
2018
|
2017
|
2016
|
2017 to 2018
|
2016 to 2017
|
|||||||||||||||
|
Revenues
|
||||||||||||||||||||
|
Product sales
|
$
|
8,271
|
|
$
|
8,595
|
|
$
|
9,536
|
|
$
|
(324
|
)
|
$
|
(941
|
)
|
|||||
|
Other revenues
|
109
|
|
129
|
|
138
|
|
(20
|
)
|
(9
|
)
|
||||||||||
|
8,380
|
|
8,724
|
|
9,674
|
|
(344
|
)
|
(950
|
)
|
|||||||||||
|
Expenses
|
|
|
|
|||||||||||||||||
|
Cost of goods sold (excluding amortization and impairments of intangible assets)
|
2,309
|
|
2,506
|
|
2,572
|
|
(197
|
)
|
(66
|
)
|
||||||||||
|
Cost of other revenues
|
42
|
|
42
|
|
39
|
|
—
|
|
3
|
|
||||||||||
|
Selling, general and administrative
|
2,473
|
|
2,582
|
|
2,810
|
|
(109
|
)
|
(228
|
)
|
||||||||||
|
Research and development
|
413
|
|
361
|
|
421
|
|
52
|
|
(60
|
)
|
||||||||||
|
Amortization of intangible assets
|
2,644
|
|
2,690
|
|
2,673
|
|
(46
|
)
|
17
|
|
||||||||||
|
Goodwill impairments
|
2,322
|
|
312
|
|
1,077
|
|
2,010
|
|
(765
|
)
|
||||||||||
|
Asset impairments
|
568
|
|
714
|
|
422
|
|
(146
|
)
|
292
|
|
||||||||||
|
Restructuring and integration costs
|
22
|
|
52
|
|
132
|
|
(30
|
)
|
(80
|
)
|
||||||||||
|
Acquired in-process research and development costs
|
1
|
|
5
|
|
34
|
|
(4
|
)
|
(29
|
)
|
||||||||||
|
Acquisition-related contingent consideration
|
(9
|
)
|
(289
|
)
|
(13
|
)
|
280
|
|
(276
|
)
|
||||||||||
|
Other (income) expense, net
|
(21
|
)
|
(353
|
)
|
73
|
|
332
|
|
(426
|
)
|
||||||||||
|
10,764
|
|
8,622
|
|
10,240
|
|
2,142
|
|
(1,618
|
)
|
|||||||||||
|
Operating (loss) income
|
(2,384
|
)
|
102
|
|
(566
|
)
|
(2,486
|
)
|
668
|
|
||||||||||
|
Interest income
|
11
|
|
12
|
|
8
|
|
(1
|
)
|
4
|
|
||||||||||
|
Interest expense
|
(1,685
|
)
|
(1,840
|
)
|
(1,836
|
)
|
155
|
|
(4
|
)
|
||||||||||
|
Loss on extinguishment of debt
|
(119
|
)
|
(122
|
)
|
—
|
|
3
|
|
(122
|
)
|
||||||||||
|
Foreign exchange and other
|
23
|
|
107
|
|
(41
|
)
|
(84
|
)
|
148
|
|
||||||||||
|
Loss before benefit from income taxes
|
(4,154
|
)
|
(1,741
|
)
|
(2,435
|
)
|
(2,413
|
)
|
694
|
|
||||||||||
|
Benefit from income taxes
|
10
|
|
4,145
|
|
27
|
|
(4,135
|
)
|
4,118
|
|
||||||||||
|
Net (loss) income
|
(4,144
|
)
|
2,404
|
|
(2,408
|
)
|
(6,548
|
)
|
4,812
|
|
||||||||||
|
Net income attributable to noncontrolling interest
|
(4
|
)
|
—
|
|
(1
|
)
|
(4
|
)
|
1
|
|
||||||||||
|
Net (loss) income attributable to Bausch Health Companies Inc.
|
$
|
(4,148
|
)
|
$
|
2,404
|
|
$
|
(2,409
|
)
|
$
|
(6,552
|
)
|
$
|
4,813
|
|
|||||
60
2018
Compared with
2017
Revenues
Our
revenues are primarily generated from product sales that consist of: (i) branded pharmaceuticals, (ii) generic and branded generic pharmaceuticals, (iii) OTC products and (iv) medical devices (contact lenses, intraocular lenses, ophthalmic surgical equipment and aesthetics devices). Other revenues include alliance and service revenue from the licensing and co-promotion of products and contract service revenue primarily in the areas of dermatology and topical medication. Contract service revenue is derived primarily from contract manufacturing for third parties and is not material.
See
Note 22, "SEGMENT INFORMATION"
to our audited Consolidated Financial Statements
for the disaggregation of revenue which depicts how the nature, amount, timing and uncertainty of revenue and cash flows are affected by the economic factors of each category of customer contracts.
Our revenue was
$8,380 million
and
$8,724 million
for
2018
and
2017
, respectively,
a decrease
of
$344 million
, or
4%
. The
decrease
was primarily driven by: (i) the impact of 2017 divestitures and discontinuations of
$541 million
, (ii) the net decrease in volume of
$100 million
, primarily as a result of the loss of exclusivity for a number of products in our Diversified Products and Ortho Dermatologics segments which were partially offset by higher volumes in our Bausch + Lomb/International segment and (iii) the decrease in other revenues of
$17 million
. These decreases in revenue were partially offset by: (i)
higher gross selling prices
of $226 million, (ii)
lower sales deductions
of $70 million and (iii) the favorable effect of foreign currencies of
$18 million
, primarily in Europe and Asia.
Our segment revenues and segment profits are discussed in detail in the subsequent section titled "Reportable Segment Revenues and Profits".
Cash Discounts and Allowances, Chargebacks and Distribution Fees
As is customary in the pharmaceutical industry, gross product sales are subject to a variety of deductions in arriving at net product sales. Provisions for these deductions are recognized concurrently with the recognition of gross product sales. These provisions include cash discounts and allowances, chargebacks, and distribution fees, which are paid or credited to direct customers, as well as rebates and returns, which can be paid or credited to direct and indirect customers. Price appreciation credits are generated when we increase a product’s wholesaler acquisition cost ("WAC") under our contracts with certain wholesalers. Under such contracts, we are entitled to credits from such wholesalers for the impact of that WAC increase on inventory on hand at the wholesalers. In wholesaler contracts, such credits are offset against the total distribution service fees we pay on all of our products to each such wholesaler. In addition, some payor contracts require discounting if a price increase or series of price increases in a contract period exceeds a negotiated threshold. Provision balances relating to amounts payable to direct customers are netted against trade receivables and balances relating to indirect customers are included in accrued liabilities.
We actively manage these offerings, focusing on the incremental costs of our patient assistance programs, the level of discounting to non-retail accounts and identifying opportunities to minimize product returns. We also concentrate on managing our relationships with our payors and wholesalers, reviewing the ranges of our offerings and being disciplined as to the amount and type of incentives we negotiate. Provisions recorded to reduce gross product sales to net product sales and revenues for the years ended December 31,
2018
and
2017
were as follows:
|
Years Ended December 31,
|
|||||||||||||
|
2018
|
2017
|
||||||||||||
|
(in millions)
|
Amount
|
Pct.
|
Amount
|
Pct.
|
|||||||||
|
Gross product sales
|
$
|
14,158
|
|
100
|
%
|
$
|
14,825
|
|
100%
|
||||
|
Provisions to reduce gross product sales to net product sales
|
|||||||||||||
|
Discounts and allowances
|
865
|
|
6
|
%
|
829
|
|
6%
|
||||||
|
Returns
|
293
|
|
2
|
%
|
423
|
|
3%
|
||||||
|
Rebates
|
2,551
|
|
18
|
%
|
2,545
|
|
17%
|
||||||
|
Chargebacks
|
1,966
|
|
14
|
%
|
2,145
|
|
14%
|
||||||
|
Distribution service fees
|
212
|
|
2
|
%
|
288
|
|
2%
|
||||||
|
5,887
|
|
42
|
%
|
6,230
|
|
42%
|
|||||||
|
Net product sales
|
$
|
8,271
|
|
58
|
%
|
$
|
8,595
|
|
58%
|
||||
Cash discounts and allowances, returns, rebates, chargebacks and distribution fees as a percentage of gross product sales were
42%
and
42%
in
2018
and
2017
, respectively,
primarily driven by:
61
|
•
|
discounts and allowances as a percentage of gross product sales were unchanged as higher sales and discount and allowance rates associated with Migranal
®
AG, Tobramycin
CD and Xenazine
®
AG and the launch of Diastat
®
AG were offset by lower sales and discount and allowance rates for Zegerid
®
AG, Metrogel
®
AG and Isuprel
®
;
|
|
•
|
returns as a percentage of gross product sales was lower primarily due to lower sales and lower return rates associated with certain products, primarily Nitropress
®
which was impacted by multiple generics in 2017, Glumetza
®
SLX, Mephyton
®
and Relistor
®
SLX partially offset by higher return rates for Edecrin
®
and Solodyn
®
;
|
|
•
|
rebates as a percentage of gross product sales were higher primarily due to increased sales of products that carry higher contractual rebates and co-pay assistance programs, including the impact of incremental rebates from contractual price increase limitations. The comparisons were impacted primarily by higher provisions for rebates and the co-pay assistance programs for promoted products, such as Apriso
®
, Xifaxan
®
, Prolensa
®
and Elidel
®
. These increases were offset by decreases in rebates for Solodyn
®
, Jublia
®
, Carac
®
, Mephyton
®
, Acanya
®
, Syprine
®
, Glumetza
®
SLX and other products, primarily caused by declines in year over year volume, in part, due to generic competition to certain products;
|
|
•
|
chargebacks as a percentage of gross product sales were unchanged. Decreases in chargebacks were due to: (i) better management of contractual terms of certain non-retail classes of trade products, such as Zegerid
®
,
Glumetza
®
SLX, Retina
®
, Apriso
®
and Tobramycin CD and other drugs in part due to generic competition, (ii) lower volumes of Isuprel
®
and Syprine
®
primarily the result of generic competition, (iii) chargebacks in 2017 associated with Provenge
®
, which was divested with the Dendreon Sale on June 28, 2017 and (iv) lower utilization by the U.S. government of certain products such as Minocin
®
. The decreases in chargebacks as a percentage of gross product sales were offset by higher sales of certain generic products, such as Targretin
®
AG, and certain branded drugs, such as Nifedipine
®
and Ofloxacin
®
; and
|
|
•
|
distribution service fees as a percentage of gross product sales were lower as the impact of: (i) better contract terms with our distributors, (ii) lower volumes of certain branded products with higher distribution fees, such as Isuprel
®
, Glumetza
®
SLX, Uceris
®
Tablets, Syprine
®
, Mephyton
®
, and other branded products primarily the result of generic competition and (iii) higher appreciation credits were offset by higher volumes of certain branded products with higher distribution fees, such as Xifaxan
®
, Apriso
®
and other branded products. Price appreciation credits are offset against the distribution service fees we pay wholesalers and were
$31 million
and $21 million for 2018 and 2017, respectively.
|
Operating Expenses
Cost of Goods Sold (exclusive of amortization and impairments of intangible assets)
Cost of goods sold primarily includes: manufacturing and packaging; the cost of products we purchase from third parties; royalty payments we make to third parties; depreciation of manufacturing facilities and equipment; and lower of cost or market adjustments to inventories. Cost of goods sold excludes the amortization and impairments of intangible assets.
Cost of goods sold was
$2,309 million
and
$2,506 million
for
2018
and
2017
, respectively,
a decrease
of
$197 million
, or
8%
. The
decrease
was primarily driven by: (i) the impact of 2017 divestitures and discontinuations, (ii) lower third-party royalty costs and (iii) the favorable impact of foreign currencies.
Cost of goods sold as a percentage of revenue was
28%
and
29%
for
2018
and
2017
, respectively, a decrease of
1
percentage point. The decrease was primarily driven by: (i)
higher gross selling prices
, (ii)
lower sales deductions
, (iii) the favorable result of the impact of 2017 divestitures and discontinuations, which historically reported lower gross margins than our core businesses and (iv) lower third-party royalty costs. The decrease in Cost of goods sold as a percentage of revenue was partially offset by the unfavorable change in our remaining product mix as a greater percentage of our revenue in 2018 was attributable to the Bausch + Lomb/International segment, which generally has lower gross margins than our remaining product portfolio.
Our segment revenues and segment profits are discussed in detail in the subsequent section titled “Reportable Segment Revenues and Profits”.
Selling, General and Administrative Expenses
SG&A expenses primarily include: employee compensation associated with sales and marketing, finance, legal, information technology, human resources and other administrative functions; certain outside legal fees and consultancy costs; product promotion expenses; overhead and occupancy costs; depreciation of corporate facilities and equipment; and other general and administrative costs.
62
SG&A was
$2,473 million
and
$2,582 million
for
2018
and
2017
, respectively,
a decrease
of
$109 million
, or
4%
. The
decrease
was primarily driven by: (i) the impact of 2017 divestitures and discontinuations, (ii) a decrease in legal expenses as we resolved certain legacy legal issues in late 2017 and throughout 2018 as previously discussed and (iii) a decrease in bad debt expense. The decrease was partially offset by: (i) higher advertising and promotion expenses, primarily associated with our launch of Lumify
®
, (ii) higher compensation costs and (iii) the unfavorable impact of the effect of foreign currencies.
Research and Development Expenses
Included in Research and development are costs related to our product development and quality assurance programs. Expenses related to product development include: employee compensation costs; overhead and occupancy costs; depreciation of research and development facilities and equipment; clinical trial costs; clinical manufacturing and scale-up costs; and other third-party development costs. Quality assurance are the costs incurred to meet evolving customer and regulatory standards and include: employee compensation costs; overhead and occupancy costs; amortization of software; and other third-party costs.
R&D expenses were
$413 million
and
$361 million
for
2018
and
2017
, respectively,
an increase
of
$52 million
, or
14%
. R&D expenses as a percentage of revenue was approximately
5%
and
4%
for
2018
and
2017
, respectively, an increase of 1 percentage point.
Amortization of Intangible Assets
Intangible assets with finite lives are amortized using the straight-line method over their estimated useful lives, generally 2 to 20 years.
Amortization of intangible assets was
$2,644 million
and
$2,690 million
for
2018
and
2017
, respectively,
a decrease
of
$46 million
, or
2%
. The
decrease
is driven by: (i) the impact of the change in the estimated useful life of the Xifaxan
®-
related intangible assets, (ii) lower amortization as a result of impairments to intangible assets and divestitures and (iii) discontinuances of product lines during 2017 as the Company focuses on its core assets. These decreases were partially offset by the impact of changes in the estimated useful lives of certain products and the Salix brand name in the third and fourth quarters of 2017 to reflect management's changes in assumptions. Management continually assesses the useful lives related to the Company's long-lived assets to reflect the most current assumptions. As a result, the useful lives of certain product brands, with an aggregate carrying value of
$7,618 million
as of
December 31, 2017
, were revised from an average of seven years to four years, primarily due to each product expected to lose its exclusivity. In addition, the useful life of the Salix brand, with a carrying value of
$569 million
as of
December 31, 2017
, was revised from seventeen years to ten years due to revisions in the forecasted sales of its product portfolio. These 2017 changes in useful lives resulted in an increase in amortization in 2018. Effective September 12, 2018, the Company changed the estimated useful life of its Xifaxan
®-
related intangible assets due to the positive impact of the agreement between the Company and Actavis resolving the intellectual property litigation regarding Xifaxan
®
tablets, 550 mg. As a result, the useful life of the Xifaxan
®-
related intangible assets, with a carrying value of
$4,848 million
as of
December 31, 2018
, was extended from 2024 to January 1, 2028.
Goodwill Impairments
Goodwill is not amortized but is tested for impairment at least annually at the reporting unit level. A reporting unit is the same as, or one level below, an operating segment. The fair value of a reporting unit refers to the price that would be received to sell the unit as a whole in an orderly transaction between market participants. The Company estimates the fair values of all reporting units using a discounted cash flow model which utilizes Level 3 unobservable inputs.
Goodwill impairments
was
$2,322 million
and
$312 million
for
2018
and
2017
, respectively.
2018 Adoption of New Accounting Guidance for Goodwill Impairment Testing
In January 2017, the FASB issued guidance which simplifies the subsequent measurement of goodwill by eliminating “Step 2” from the goodwill impairment test. Instead, goodwill impairment is measured as the amount by which a reporting unit's carrying value exceeds its fair value. The FASB also eliminated the requirements for any reporting unit with a zero or negative carrying amount to perform a qualitative assessment. The Company elected to early adopt this guidance effective January 1, 2018.
Upon adopting the new guidance, the Company tested goodwill for impairment and determined that the carrying value of the Salix reporting unit exceeded its fair value. As a result of the adoption of new accounting guidance, the Company recognized a goodwill impairment of $1,970 million associated with the Salix reporting unit.
As of October 1, 2017, the date of the 2017 annual impairment test, the fair value of the Ortho Dermatologics reporting unit exceeded its carrying value. However, at January 1, 2018, the carrying value of the Ortho Dermatologics reporting unit exceeded
63
its fair value. Unforeseen changes in the business dynamics of the Ortho Dermatologics reporting unit, such as: (i) changes in the dermatology sector, (ii) increased pricing pressures from third-party payors and (iii) additional risks to the exclusivity of certain products. In response to these adverse business indicators, the Company reduced its near and long term financial projections for the Ortho Dermatologics reporting unit. As a result of the reductions in the near and long term financial projections, the carrying value of the Ortho Dermatologics reporting unit exceeded its fair value at January 1, 2018 and the Company recognized a goodwill impairment of $243 million.
2018 Realignment of Segment Structure
In the second quarter of 2018, the Company began operating in the following reportable segments: (i) Bausch + Lomb/International segment, (ii) Salix segment, (iii) Ortho Dermatologics segment and (iv) Diversified Products segment. As the second quarter realignment of the segment structure did not change the reporting units, there was no triggering event which would require the Company to test goodwill for impairment.
2018 Annual Goodwill Impairment Test
The Company conducted its annual goodwill impairment test as of October 1, 2018 and determined that the carrying value of the Dentistry reporting unit exceeded its fair value and, as a result, the Company recognized a goodwill impairment of
$109 million
for the Dentistry reporting unit, representing the full amount of goodwill for the reporting unit. Changing market conditions such as: (i) an increasing competitive environment and (ii) increasing pricing pressures negatively impacted the reporting unit's operating results. The Company is taking steps to address these changing market and business conditions.
The Company's remaining reporting units passed the goodwill impairment test as the estimated fair value of each reporting unit exceeded its carrying value at the date of testing and, therefore, there was
no
impairment to goodwill for any reporting unit other than the Dentistry reporting unit. In order to evaluate the sensitivity of its fair value calculations on the goodwill impairment test, the Company compared the carrying value of each reporting unit to its fair value as of October 1, 2018, the date of testing. As of October 1, 2018, the fair value of each reporting unit with associated goodwill exceeded its carrying value by more than
15%
. If market conditions deteriorate, or if the Company is unable to execute its strategies, it may be necessary to record impairment charges in the future. The Company will continue to perform qualitative interim assessments of the carrying value and fair value of the Ortho Dermatologics reporting unit on a quarterly basis to determine if impairment testing of goodwill will be warranted.
If market conditions deteriorate, or if the Company is unable to execute its strategies, it may be necessary to record impairment charges in the future.
September 30, 2017
During the three months ended September 30, 2017, the Sprout business was classified as held for sale. As the Sprout business represented only a portion of the former Branded Rx reporting unit, we assessed the remaining reporting unit for impairment and determined the carrying value of the remaining reporting unit exceeded its fair value. After completing step two of the impairment testing, the Company determined and recorded a goodwill impairment charge of $312 million during the three months ended September 30, 2017.
See
Note 9, "INTANGIBLE ASSETS AND GOODWILL"
to our audited Consolidated Financial Statements for further details related to our goodwill impairment analysis.
Asset Impairments
Long-lived assets with finite lives are tested for impairment whenever events or changes in circumstances indicate that the carrying value of an asset may not be recoverable. The Company continues to monitor the recoverability of its finite-lived intangible assets and tests the intangible assets for impairment if indicators of impairment are present.
Asset impairments were
$568 million
and
$714 million
for 2018 and 2017, respectively a decrease of
$146 million
.
Asset impairments for 2018 included impairments of: (i)
$348 million
reflecting decreases in forecasted sales for the Uceris
®
Tablet product and other product lines due to generic competition, (ii)
$132 million
reflecting decreases in forecasted sales for the Arestin
®
product in our Dentistry reporting unit and other product lines due to changing market conditions, (iii)
$55 million
, in aggregate, related to certain product/patent assets associated with the discontinuance of specific product lines not aligned with the focus of the Company's core businesses, (iv)
$28 million
to Acquired IPR&D not in service related to a certain product and (v)
$5 million
related to assets being classified as held for sale.
64
Asset impairments for 2017 included impairments of: (i) $351 million related to the Sprout business being classified as held for sale, (ii) $151 million reflecting decreases in forecasted sales for other product lines, (iii) $114 million to other assets classified as held for sale, primarily related to the Obagi business, (iv) $95 million, in aggregate, to certain product/patent assets associated with the discontinuance of specific product lines not aligned with the focus of the Company's core business and (v) $3 million related to acquired IPR&D.
See
Note 4, "DIVESTITURES"
and
Note 9, "INTANGIBLE ASSETS AND GOODWILL"
to our audited Consolidated Financial Statements regarding further details related to our intangible assets.
Restructuring and Integration Costs
Restructuring and integration costs were
$22 million
and
$52 million
for
2018
and
2017
, respectively. We have substantially completed the integration of the businesses acquired prior to 2016. The Company continues to evaluate opportunities to streamline its operations and identify additional cost savings globally. Although a specific plan does not exist at this time, the Company may identify and take additional exit and cost-rationalization restructuring actions in the future, the costs of which could be material.
See
Note 5, "RESTRUCTURING AND INTEGRATION COSTS"
to our audited Consolidated Financial Statements for further details regarding these actions.
Acquisition-Related Contingent Consideration
Acquisition-related contingent consideration primarily consists of potential milestone payments and royalty obligations associated with businesses and assets we acquired in the past. These obligations are recorded in the Consolidated Balance Sheets at their estimated fair values at the acquisition date, in accordance with the acquisition method of accounting. The fair value of the acquisition-related contingent consideration is remeasured each reporting period, with changes in fair value recorded in the Consolidated Statements of Operations. The fair value measurement is based on significant inputs not observable in the market and thus represents a Level 3 measurement as defined in fair value measurement accounting.
Acquisition-related contingent consideration was a net gain of
$9 million
for
2018
and included net fair value adjustments due to changes in estimates of expected future royalty payments of
$33 million
, which included net fair value adjustments the expected future royalty payments for a specific product, partially offset by accretion for the time value of money of
$24 million
.
Acquisition-related contingent consideration was a net gain of
$289 million
for
2017
which included:
(i) a fair value adjustment of $312 million reflecting a decrease in forecasted sales for the Addyi
®
product, which impacted the expected future payments and (ii) net fair value adjustments due to changes in estimates of other expected future payments of $31 million. These net gains were partially offset by accretion for the time value of money of $54 million.
See
Note 6, "FAIR VALUE MEASUREMENTS"
to our audited Consolidated Financial Statements for further details.
Other (income) expense, net
Other (income) expense, net
for
2018
and
2017
consists of the following:
|
(in millions)
|
2018
|
2017
|
||||||
|
Gain on the Skincare Sale
|
$
|
—
|
|
$
|
(309
|
)
|
||
|
Gain on the iNova Sale
|
—
|
|
(309
|
)
|
||||
|
Gain on the Dendreon Sale
|
—
|
|
(97
|
)
|
||||
|
Loss on the Sprout Sale
|
—
|
|
98
|
|
||||
|
Net loss (gain) on other sales of assets
|
6
|
|
37
|
|
||||
|
Litigation and other matters
|
(27
|
)
|
226
|
|
||||
|
Other, net
|
—
|
|
1
|
|
||||
|
Other (income) expense, net
|
$
|
(21
|
)
|
$
|
(353
|
)
|
||
In 2018, Litigation and other matters includes a favorable adjustment of
$40 million
related to the Salix SEC litigation. In 2017, Litigation and other matters includes: (i)
$96 million
related to the settlement of the Allergan shareholder class actions, (ii)
$93 million
related to the settlement of the Solodyn
®
antitrust class actions litigation and (iii)
$20 million
related to the Mimetogen Pharmaceuticals litigation.
Litigation and other matters
includes other amounts provided for certain matters discussed in
Note 20, "LEGAL PROCEEDINGS"
to our audited Consolidated Financial Statements.
65
Non-Operating Income and Expense
Interest Expense
Interest expense primarily consists of interest payments due and amortization of debt discounts and deferred financing costs on indebtedness under our credit facilities and notes. Interest expense was
$1,685 million
and
$1,840 million
and included non-cash amortization and write-offs of debt discounts and deferred financing costs of
$79 million
and
$151 million
for
2018
and
2017
, respectively. The decrease in interest expense is primarily due to: (i) lower principal amounts of outstanding long term debt and (ii) lower amortization and write-offs of debt discounts and deferred financing costs. Prepayments of long term debt were lower during 2018 as compared to 2017, and resulted in lower acceleration of amortization and write-offs of debt discounts and deferred financing costs during 2018 as compared to 2017. These decreases in interest expense were partially offset by higher interest rates associated with the refinancing transactions that occurred during 2017 and the March 2018 Refinancing Transactions. The weighted average stated rate of interest
as of December 31, 2018 and 2017
was
6.23%
and
6.07%
, respectively.
See
Note 11, "FINANCING ARRANGEMENTS"
to our audited Consolidated Financial Statements for further details.
Loss on Extinguishment of Debt
Loss on extinguishment of debt represents the differences between the amounts paid to settle extinguished debts and the carrying value of the related extinguished debt. Loss on extinguishment of debt was
$119 million
and
$122 million
for
2018
and
2017
, associated with a series of transactions which allowed us to refinance portions of our debt arrangements.
See
Note 11, "FINANCING ARRANGEMENTS"
to our audited Consolidated Financial Statements for further details.
Foreign Exchange and Other
Foreign exchange and other was a net gain of
$23 million
and
$107 million
for
2018
and
2017
, respectively,
an unfavorable net change
of
$84 million
. Foreign exchange gains/losses include translation gains/losses on intercompany loans, primarily on euro-denominated intercompany loans.
Income Taxes
Income taxes are accounted for under the liability method. Deferred tax assets and liabilities are recognized for the differences between the financial statement and income tax bases of assets and liabilities, and for operating losses and tax credit carryforwards. Deferred tax assets for outside basis differences in investments in subsidiaries are only recognized if the difference will be realized in the foreseeable future. As a result of the Tax Act, our deferred tax assets and liabilities were re-measured to reflect the reduction in the U.S. corporate income tax rate from 35% to 21%. Benefit from income taxes was
$10 million
and
$4,145 million
for
2018
and
2017
, respectively, a decrease of
$4,135 million
which is primarily attributable to certain non-cash income tax benefits related to the Company’s internal corporate restructuring and the accounting for the Tax Act during 2017 which did not repeat in 2018.
Our consolidated foreign rate differential reflects the net total tax cost or benefit on income earned or losses incurred in jurisdictions outside of Canada as compared to the net total tax cost or benefit of such income (on a jurisdictional basis) at the Canadian statutory rate of 26.9%. Tax costs below the Canadian statutory rate generate a beneficial foreign rate differential as do tax benefits generated in jurisdictions where the statutory tax rate exceeds the Canadian statutory tax rate. The net total foreign rate differentials generated in each jurisdiction in which we operate is not expected to bear a direct relationship to the net total amount of foreign income (or loss) earned outside of Canada.
In 2018, our effective tax rate differed from the Canadian statutory tax rate of 26.9% primarily due to: (i) the recording of valuation allowance on entities for which no tax benefit of losses is expected, (ii) a charge related to the non-deductibility of goodwill impairments, (iii) a benefit related to internal integrations and restructurings and (iv) a benefit generated from our annualized mix of earnings by jurisdiction.
In 2017, our effective tax rate differed from the Canadian statutory tax rate of 26.9% primarily due to: (i) a benefit related to internal integrations and restructurings, (ii) a benefit related to the Tax Act, (iii) a benefit generated from our annualized mix of earnings by jurisdiction, (iv) a benefit from the sale of divested businesses and (v) the recording of valuation allowance on entities for which no tax benefit of losses is expected.
On December 22, 2017, the Tax Act was signed into law and includes a number of changes in the U.S. tax law. In 2017, our Benefit from income taxes included provisional net tax benefits of
$975 million attributable to the Tax Act for: (i) the re-measurement of certain deferred tax assets and liabilities based on the rates at which they are expected to reverse in the future of $774 million, (ii) the one-time Transition Toll Tax of $88 million and (iii) the decrease in deferred tax assets attributable to certain legal accruals,
66
the deductibility of which is uncertain for U.S. federal income tax purposes, of $10 million. We provisionally utilized NOLs to offset the provisionally determined $88 million Transition Toll Tax and therefore no amount was recorded as payable. The Company has previously provided for residual U.S. federal income tax on its outside basis differences in certain foreign subsidiaries which, due to the Tax Act, are no longer taxable. As such, our residual U.S. federal income tax liability of $299 million prior to the law change was reversed and we recognized a deferred tax benefit of $299 million in the fourth quarter of 2017.
During 2018, we completed our full assessment and finalized the accounting for the impact of the Tax Act. Differences between the provisional net income tax benefits provided in 2017 attributable to the Tax Act and the net income tax benefits as finalized are included in our Benefit from income taxes for the year ended December 31, 2018 and were not material to our results for the year ended December 31, 2018. Although we have completed our assessment and finalized our accounting for the impact of the Tax Act, we will monitor guidance issued in the future and assess the impact, if any, on the amounts provided.
In 2017, the Company liquidated its top U.S. subsidiary (Biovail Americas Corp.) (“BAC”) in a taxable transaction, resulting in a taxable loss which was of a character that would offset certain gains from internal restructurings and third-party divestitures, the excess of which was, under U.S. tax law, able to be carried back to offset previously recognized gains in 2016, 2015 and 2014. This carryback resulted in an increase in the Company’s deferred tax asset for NOLs previously utilized against such gains. In 2017, as a result of this taxable transaction, the Company recognized a net income tax benefit of approximately $400 million primarily related to the carryback of losses.
We record a valuation allowance against our deferred tax assets to reduce their net carrying value to an amount that we believe is more likely than not to be realized. In determining our deferred tax asset valuation allowance, we estimate our ability to utilize future sources of income to realize the benefits of our temporary income tax differences including: (i) NOL carryforwards in each jurisdiction, primarily in Canada, the U.S. and Ireland, (ii) research and development tax credit carryforwards, (iii) scientific research and experimental development pool carryforwards and (iv) investment tax credit carryforwards. When we establish/increase or reduce/decrease the valuation allowance, the provision for income taxes will increase or decrease, respectively, in the period such determination is made. Our valuation allowance against deferred tax assets as of December 31, 2018 and 2017 was
$2,913 million
and
$2,001 million
, respectively,
an increase
of
$912 million
. The increase in our valuation allowance was primarily driven by: (i) the transfer of certain intangible assets from foreign subsidiaries to Canadian subsidiaries as part of the internal restructurings discussed above and (ii) additional NOLs generated during 2018 which could not be used to reduce income taxes payable.
See
Note 17, "INCOME TAXES"
to our audited Consolidated Financial Statements for further details regarding income taxes.
Reportable Segment Revenues and Profits
Our portfolio of products falls into four operating and reportable segments: (i) Bausch + Lomb/International, (ii) Salix, (iii) Ortho Dermatologics and (iv) Diversified Products.
The following is a brief description of our segments:
|
•
|
The Bausch + Lomb/International segment
consists of: (i) sales in the U.S. of pharmaceutical products, OTC products and medical device products, primarily comprised of Bausch + Lomb products, with a focus on the Vision Care, Surgical, Consumer and Ophthalmology Rx products and (ii) with the exception of sales of Solta products, sales in Canada, Europe, Asia, Australia, Latin America, Africa and the Middle East of branded pharmaceutical products, branded generic pharmaceutical products, OTC products, medical device products and Bausch + Lomb products.
|
|
•
|
The Salix segment
consists of sales in the U.S. of
GI products.
|
|
•
|
The Ortho Dermatologics
segment
consists of: (i) sales in the U.S. of Ortho Dermatologics (dermatological) products and (ii) global sales of Solta medical aesthetic devices.
|
|
•
|
The Diversified Products segment
consists of sales: (i) in the U.S. of pharmaceutical products in the areas of neurology and certain other therapeutic classes, (ii) in the U.S. of generic products, (iii) in the U.S. of dentistry products and (iv) of certain other businesses divested during 2017 that were not core to the Company's operations, including the Company's equity interests in Dendreon
(June 28, 2017) and Sprout
(December 20, 2017). As a result of the divestitures of Dendreon and Sprout, the Company exited the oncology and women's health businesses, respectively.
|
Segment profit is based on operating income after the elimination of intercompany transactions (including transactions with any consolidated variable interest entities). Certain costs, such as amortization and impairments of intangible assets, goodwill
67
impairments, certain R&D expenses not specific to the Company's active portfolio, acquired in-process research and development costs, restructuring, integration and acquisition-related costs and other (income) expense are not included in the measure of segment profit, as management excludes these items in assessing financial performance. In addition, a portion of share-based compensation, representing the difference between actual and budgeted expense, is not allocated to segments.
See
Note 22, "SEGMENT INFORMATION"
to our audited Consolidated Financial Statements for a reconciliation of segment profit to
Loss before benefit from income taxes
.
The following table presents segment revenues, segment revenues as a percentage of total revenues and the year over year changes in segment revenues for
2018
and
2017
. The following table also presents segment profits, segment profits as a percentage of segment revenues and the year over year changes in segment profits for
2018
and
2017
.
|
|
Years Ended December 31,
|
Change
|
|||||||||||||||||||
|
|
2018
|
2017
|
2017 to 2018
|
||||||||||||||||||
|
(in millions)
|
Amount
|
Pct.
|
Amount
|
Pct.
|
Amount
|
Pct.
|
|||||||||||||||
|
Segment Revenue
|
|||||||||||||||||||||
|
Bausch + Lomb/International
|
$
|
4,664
|
|
56
|
%
|
$
|
4,795
|
|
55
|
%
|
$
|
(131
|
)
|
(3
|
)%
|
||||||
|
Salix
|
1,749
|
|
21
|
%
|
1,566
|
|
18
|
%
|
183
|
|
12
|
%
|
|||||||||
|
Ortho Dermatologics
|
625
|
|
7
|
%
|
725
|
|
8
|
%
|
(100
|
)
|
(14
|
)%
|
|||||||||
|
Diversified Products
|
1,342
|
|
16
|
%
|
1,638
|
|
19
|
%
|
(296
|
)
|
(18
|
)%
|
|||||||||
|
Total revenues
|
$
|
8,380
|
|
100
|
%
|
$
|
8,724
|
|
100
|
%
|
$
|
(344
|
)
|
(4
|
)%
|
||||||
|
Segment Profits / Segment Profit Margins
|
|||||||||||||||||||||
|
Bausch + Lomb/International
|
$
|
1,330
|
|
29
|
%
|
$
|
1,412
|
|
29
|
%
|
$
|
(82
|
)
|
(6
|
)%
|
||||||
|
Salix
|
1,149
|
|
66
|
%
|
935
|
|
60
|
%
|
214
|
|
23
|
%
|
|||||||||
|
Ortho Dermatologics
|
265
|
|
42
|
%
|
336
|
|
46
|
%
|
(71
|
)
|
(21
|
)%
|
|||||||||
|
Diversified Products
|
1,004
|
|
75
|
%
|
1,112
|
|
68
|
%
|
(108
|
)
|
(10
|
)%
|
|||||||||
|
Total segment profit
|
$
|
3,748
|
|
45
|
%
|
$
|
3,795
|
|
44
|
%
|
$
|
(47
|
)
|
(1
|
)%
|
||||||
The following table presents organic revenue (Non-GAAP) and the year over year changes in organic revenue for
2018
and
2017
by segment. Organic revenues and organic growth rates are defined in the previous section titled “Selected Financial Information”.
|
|
Year Ended December 31, 2018
|
Year ended December 31, 2017
|
Change in
Organic Revenue
|
||||||||||||||||||||||||||||
|
Revenue
as
Reported
|
Changes in Exchange Rates
|
Organic Revenue
(Non-GAAP)
|
Revenue
as
Reported
|
Divested Revenues
|
Organic Revenue
(Non-GAAP)
|
||||||||||||||||||||||||||
|
(in millions)
|
Amount
|
Pct.
|
|||||||||||||||||||||||||||||
|
Bausch + Lomb/International
|
$
|
4,664
|
|
$
|
(18
|
)
|
$
|
4,646
|
|
$
|
4,795
|
|
$
|
(312
|
)
|
$
|
4,483
|
|
$
|
163
|
|
4
|
%
|
||||||||
|
Salix
|
1,749
|
|
—
|
|
1,749
|
|
1,566
|
|
(3
|
)
|
1,563
|
|
186
|
|
12
|
%
|
|||||||||||||||
|
Ortho Dermatologics
|
625
|
|
—
|
|
625
|
|
725
|
|
(5
|
)
|
720
|
|
(95
|
)
|
(13
|
)%
|
|||||||||||||||
|
Diversified Products
|
1,342
|
|
—
|
|
1,342
|
|
1,638
|
|
(221
|
)
|
1,417
|
|
(75
|
)
|
(5
|
)%
|
|||||||||||||||
|
Total
|
$
|
8,380
|
|
$
|
(18
|
)
|
$
|
8,362
|
|
$
|
8,724
|
|
$
|
(541
|
)
|
$
|
8,183
|
|
$
|
179
|
|
2
|
%
|
||||||||
Bausch + Lomb/International Segment:
Bausch + Lomb/International Segment Revenue
The Bausch + Lomb/International segment has a diversified product line with no single product group representing 10% or more of its segment product sales. The Bausch + Lomb/International segment revenue was
$4,664 million
and
$4,795 million
for
2018
and
2017
, respectively,
a decrease
of
$131 million
, or
3%
. The
decrease
was driven by: (i) the impact of 2017 divestitures and discontinuations of
$312 million
, which includes the Skincare Sale (March 3, 2017) and the iNova Sale (September 29, 2017) and (ii) a decrease in average realized pricing of
$19 million
primarily driven by our Global Vision Care business. The decrease was partially offset by: (i) an increase in volume across our global eye-health businesses of
$178 million
primarily driven by our Global Vision Care and Global Consumer businesses, (ii) the favorable effect of foreign currencies of
$18 million
primarily attributable to European and Asian currencies and (iii) an increase in other revenues of
$4 million
. The increase in volume in our Global Vision Care business was primarily attributable to our Biotrue
®
ONEday and Ultra
®
product lines. The increase in volume in our Global Consumer business was primarily attributable to the launch of Lumify
®
and sales of Preservision
®
.
68
Bausch + Lomb/International Segment Profit
The Bausch + Lomb/International segment profit was
$1,330 million
and
$1,412 million
for
2018
and
2017
, respectively,
a decrease
of
$82 million
, or
6%
. The
decrease
was driven by: (i) the impact of 2017 divestitures and discontinuations, (ii) an increase in selling, advertising and promotion expenses in support of the launch of products, primarily our launch of Lumify
®
and (iii) a decrease in average realized pricing as previously discussed. The decrease was partially offset by: (i) the increase in contribution as a result of the increase in volume as previously discussed, (ii) the net favorable effect of foreign currencies and (iii) a decrease in legal expenses.
Salix Segment:
Salix Segment Revenue
The Salix segment includes the Xifaxan
®
product line, which accounted for approximately 68% and 63% of the Salix segment product sales and approximately 14% and 11% of the Company's product sales for
2018
and
2017
, respectively. No other single product group represents 10% or more of the Salix segment product sales. The Salix segment revenue was
$1,749 million
and
$1,566 million
for
2018
and
2017
, respectively,
an increase
of
$183 million
, or
12%
. The
increase
is due to an increase in average realized pricing of
$208 million
as a result of
higher gross selling prices
mainly from Xifaxan
®
and
lower sales deductions
primarily attributable to Glumetza
®
and Xifaxan
®
. The increase was partially offset by: (i) decreases in volume of
$18 million
, (ii) decreases in other revenues of
$4 million
and (iii) the impact of discontinuations of
$3 million
. The net decrease in volume of
$18 million
was primarily attributable to the impact of generic competition as certain products lost exclusivity including Uceris
®
, Glumetza
®
and Zegerid
®
, which was partially offset by increased demand for Xifaxan
®
.
Salix Segment Profit
The Salix segment profit was
$1,149 million
and
$935 million
for
2018
and
2017
, respectively,
an increase
of
$214 million
, or
23%
. The
increase
includes: (i) the increase in contribution as a result of the increase in revenue, as previously discussed, and lower third-party royalty costs and (ii) a decrease in bad debt expense.
Ortho Dermatologics Segment:
Ortho Dermatologics Segment Revenue
The Ortho Dermatologics segment revenue was
$625 million
and
$725 million
for
2018
and
2017
, respectively,
a decrease
of
$100 million
, or
14%
. The
decrease
was driven by: (i) a decrease in volume of
$96 million
, (ii) the decrease in other revenues of
$18 million
and (iii) the impact of 2017 divestitures and discontinuations of
$5 million
. The decrease in volume is primarily due to: (i) the impact of generic competition as certain products lost exclusivity, including certain strengths of Solodyn
®
, (ii) decreased demand for Jublia
®
and Targretin
®
and (iii) a decrease in royalty revenue associated with certain partnerships partially offset by the impact on volume from the launches of Siliq
TM
(July 2017), Retin-A Micro
®
0.06% (January 2018) and Bryhali
TM
(November 2018). The decrease in volume was partially offset by an increase in average realized pricing of
$19 million
as a result of
higher gross selling prices
and
lower sales deductions
primarily attributable to Targretin
®
and Zovirax
®
.
Ortho Dermatologics Segment Profit
The Ortho Dermatologics segment profit was
$265 million
and
$336 million
for
2018
and
2017
, respectively,
a decrease
of
$71 million
, or
21%
. The
decrease
includes: (i) a decrease in contribution primarily due to the decrease in revenue, as previously discussed and (ii) higher compensation expenses. These decreases were partially offset by decreases in: (i) legal expenses, (ii) advertising and promotion expenses and (iii) bad debt expense.
69
Diversified Products Segment:
Diversified Products Segment Revenue
The following table displays the Diversified Products segment revenues by product and product revenues as a percentage of segment revenue for
2018
and
2017
.
|
|
Years Ended December 31,
|
Change
|
||||||||||||||||
|
|
2018
|
2017
|
2017 to 2018
|
|||||||||||||||
|
(in millions)
|
Amount
|
Pct.
|
Amount
|
Pct.
|
Amount
|
Pct.
|
||||||||||||
|
Wellbutrin
®
Franchise
|
$
|
252
|
|
19%
|
$
|
235
|
|
14%
|
$
|
17
|
|
7%
|
||||||
|
Arestin
®
|
96
|
|
7%
|
111
|
|
7%
|
(15
|
)
|
(14)%
|
|||||||||
|
Cuprimine
®
|
88
|
|
6%
|
78
|
|
5%
|
10
|
|
13%
|
|||||||||
|
Migranal
®
Franchise
|
62
|
|
5%
|
58
|
|
3%
|
4
|
|
7%
|
|||||||||
|
Ativan
®
|
54
|
|
4%
|
60
|
|
4%
|
(6
|
)
|
(10)%
|
|||||||||
|
Aplenzin
®
|
54
|
|
4%
|
31
|
|
2%
|
23
|
|
74%
|
|||||||||
|
Xenazine
®
Franchise
|
52
|
|
4%
|
122
|
|
7%
|
(70
|
)
|
(57)%
|
|||||||||
|
Syprine
®
|
47
|
|
3%
|
91
|
|
6%
|
(44
|
)
|
(48)%
|
|||||||||
|
Mephyton
®
Franchise
|
37
|
|
3%
|
52
|
|
3%
|
(15
|
)
|
(29)%
|
|||||||||
|
Isuprel
®
|
36
|
|
3%
|
105
|
|
6%
|
(69
|
)
|
(66)%
|
|||||||||
|
Other product revenues
|
548
|
|
41%
|
681
|
|
42%
|
(133
|
)
|
(20)%
|
|||||||||
|
Other revenues
|
16
|
|
1%
|
14
|
|
1%
|
2
|
|
14%
|
|||||||||
|
Total U.S. Diversified revenues
|
$
|
1,342
|
|
100%
|
$
|
1,638
|
|
100%
|
$
|
(296
|
)
|
(18)%
|
||||||
The Diversified Products segment revenue was
$1,342 million
and
$1,638 million
for
2018
and
2017
, respectively,
a decrease
of
$296 million
, or
18%
. The
decrease
was primarily driven by: (i) the impact of 2017 divestitures and discontinuations of
$221 million
, which includes the Dendreon Sale (June 28, 2017), the Obagi Sale (November 9, 2017) and the Sprout Sale (December 20, 2017) and (ii) a decrease in volume of
$164 million
. The decrease in volume was primarily attributable to the impact of generic competition as certain products lost exclusivity, including Isuprel
®
, Xenazine
®
, Syprine
®
and Mephyton
®
. These decreases in volume were partially offset by increased volumes in our Generics business, primarily due to the launches of Diastat
®
AG and Uceris
®
AG products. The net decrease in volume was partially offset by: (i) a net increase in average realized pricing of
$88 million
as a result of
higher gross selling prices
and
lower sales deductions
primarily associated with our Neurology and Other business partially offset by a decrease in average realized pricing of Arestin
®
in our Dentistry business and (ii) an increase in other revenues of
$1 million
.
Diversified Products Segment Profit
The Diversified Products segment profit was
$1,004 million
and
$1,112 million
for
2018
and
2017
, respectively,
a decrease
of
$108 million
, or
10%
. The
decrease
was primarily driven by the decrease in contribution as a result of: (i) the impact of 2017 divestitures and discontinuations and (ii) the decrease in volume, as previously discussed, partially offset by lower third-party royalty costs.
2017
Compared with
2016
Revenues
Our revenue was $8,724 million and $9,674 million for 2017 and 2016, respectively, a decrease of $950 million, or 10%. The decrease was primarily driven by: (i) the impact of divestitures and discontinuations of $459 million and (ii) a decline in revenues of $403 million primarily due to lower volumes associated with: (a) our Diversified Products segment as a result of the loss of exclusivity for a number of products, (b) our Ortho Dermatologics segment as a result of challenging market dynamics in dermatology and (c) to a lesser extent, our Salix segment, partially offset by increased volumes in our Bausch + Lomb / International segment, primarily driven by the U.S. Bausch + Lomb Consumer business and increased international pricing in our Bausch + Lomb / International segment and Salix segment and (iii) the unfavorable impact of foreign currencies of $78 million which is primarily attributable to the Egyptian pound.
70
Our segment revenues and segment profits are discussed in detail in the subsequent section titled "Reportable Segment Revenues and Profits".
Cash Discounts and Allowances, Chargebacks and Distribution Fees
|
Years Ended December 31,
|
||||||||||||||
|
2017
|
2016
|
|||||||||||||
|
(in millions)
|
Amount
|
Pct.
|
Amount
|
Pct.
|
||||||||||
|
Gross product sales
|
$
|
14,825
|
|
100
|
%
|
$
|
16,047
|
|
100
|
%
|
||||
|
Provisions to reduce gross product sales to net product sales
|
||||||||||||||
|
Discounts and allowances
|
829
|
|
6%
|
789
|
|
5
|
%
|
|||||||
|
Returns
|
423
|
|
3%
|
460
|
|
3
|
%
|
|||||||
|
Rebates
|
2,545
|
|
17%
|
2,521
|
|
16
|
%
|
|||||||
|
Chargebacks
|
2,145
|
|
14%
|
2,318
|
|
14
|
%
|
|||||||
|
Distribution service fees
|
288
|
|
2%
|
423
|
|
3
|
%
|
|||||||
|
6,230
|
|
42%
|
6,511
|
|
41
|
%
|
||||||||
|
Net product sales
|
$
|
8,595
|
|
58%
|
$
|
9,536
|
|
59
|
%
|
|||||
Cash discounts and allowances, returns, rebates, chargebacks and distribution fees as a percentage of gross product sales were
42% and 41% in 2017 and 2016, respectively,
an increase of 1% primarily driven by:
|
•
|
an increase in discounts and allowances as a percentage of product sales primarily associated with the generic release of Glumetza
®
AG partially offset by lower sales of Zegerid
®
AG due to generic competition;
|
|
•
|
returns as a percentage of gross product sales was unchanged as higher return rates for products with generic launches in 2017, such as Nitropress
®
and Glumetza
®
, were substantially offset by decreases from lower year over year sales and return rates associated with certain products, primarily Zegerid
®
AG which was launched in 2016, and Retin
®
AG which was impacted by multiple generics in 2016;
|
|
•
|
rebates as a percentage of product sales was higher as increased sales of products that carry higher contractual rebates and co-pay assistance programs, including the impact of gross price increases where customers receive incremental rebates based on contractual price increase limitations. The comparisons were impacted primarily by higher provisions for rebates and the co-pay assistance programs for promoted products, such as Xifaxan
®
, Wellbutrin
®
and Apriso
®
. These increases were offset by decreases in rebates for Glumetza
®
, Solodyn
®
, Jublia
®
, Carac
®
, Ziana
®
and other products as generic competition caused a decline in volume year over year;
|
|
•
|
chargebacks as a percentage of gross product sales was unchanged as increases in chargebacks from higher year over year sales of certain generic drugs such as Glumetza
®
AG, Targretin
®
AG and Xenazine
®
AG and certain branded drugs such as Nifedical
™
, Xifaxan
®
and Ofloxacin were substantially offset by decreases in chargebacks associated with: (i) lower utilization by the U.S. government of certain products such as Minocin
®
, Ativan
®
and Mysoline
®
, (ii) lower year over year sales of Zegerid
®
AG, Nitropress
®
and Anusol
™
and other drugs due to generic competition and Provenge
®
which was divested with the Dendreon Sale and (iii) better contract pricing as a result of the Company's pricing discipline. During much of 2016, the Company was subject to higher chargeback rates as a result of its 2015 pricing strategies. As a result of corrective actions taken by the Company, and its continued pricing discipline during 2016, the previous chargeback rates, which were substantial, are no longer effective during 2017; and
|
|
•
|
a decrease in distribution service fees as a percentage of gross product sales due in part to higher offsetting price appreciation credits and better contract terms with our distributors. Price appreciation credits are offset against the distribution service fees we pay wholesalers and were $21 million and $13 million for 2017 and 2016, respectively.
|
Operating Expenses
Cost of Goods Sold (exclusive of amortization and impairments of intangible assets)
Cost of goods sold was
$2,506 million
and
$2,572 million
in
2017
and
2016
, respectively,
a decrease
of
$66 million
, or
3%
. The
decrease
was primarily driven by: (i) lower volumes from revenues, (ii) the impact of divestitures and discontinuations, (iii) lower amortization of acquisition accounting adjustments related to inventories of $38 million and (iv) the favorable impact of foreign currencies of $22 million. These decreases were partially offset by: (i) an increase of $21 million in certain maintenance costs and (ii) higher third-party royalty costs on certain drugs.
71
Effective July 1, 2017, we began classifying certain maintenance costs as costs of sales which in previous periods were included in R&D expenses. The costs incurred for the period July 1, 2017 through December 31, 2017 was $21 million. No adjustments were made to prior periods based on materiality.
Cost of goods sold as a percentage of revenue was 29% and 27% for 2017 and 2016, respectively, an increase of 2 percentage points and was primarily driven by an unfavorable change in our product mix. In 2017, a greater percentage of our revenue was attributable to the Bausch + Lomb/International segment, which generally has lower gross margins than our remaining product portfolio. The shift toward a lower gross margin is also partly due to the loss of exclusivity across our portfolio. These increases in costs of goods sold as a percentage of product sales revenue were partially offset by acquisition accounting adjustments related to inventories expensed in 2016 of $38 million. Our segment revenues and segment profits are discussed in detail in the subsequent section titled “Reportable Segment Revenues and Profits”.
Selling, General and Administrative Expenses
SG&A was
$2,582 million
and
$2,810 million
for
2017
and
2016
, respectively, a decrease of
$228 million
, or
8%
. The decrease was primarily driven by: (i) a net decrease in advertising and promotion expenses, primarily driven by decreases in direct to consumer advertising in support of our Jublia
®
, Xifaxan
®
, Bausch + Lomb ULTRA
®
contact lenses and other branded products, (ii) a net decrease in compensation expense as we incurred higher personnel costs in 2016 resulting from changes in our senior management team and employee retention costs, (iii) termination benefits associated with our former Chief Executive Officer in 2016 consisting of: (a) the pro-rata vesting of performance-based restricted stock units (“RSUs”) (no shares were issued on vesting of these performance-based RSUs because the associated market-based performance condition was not attained), (b) a cash severance payment and (c) a pro-rata annual cash bonus, (iv) lower expenses due to the impact of divestitures, (v) the favorable impact of foreign currencies and (vi) a net decrease in third-party consulting fees. These factors were partially offset by an increase in professional fees incurred in connection with: (i) legal and governmental proceedings, investigations and information requests relating to, among other matters, our distribution, marketing, pricing, disclosure and accounting practices, (ii) the execution on our key initiatives and (iii) other ongoing corporate and business matters.
Research and Development Expenses
R&D expenses were
$361 million
and
$421 million
for
2017
and
2016
, respectively, a decrease of
$60 million
, or
14%
. The decrease was primarily due to: (i) the year over year phasing as we completed the R&D investment in Siliq™ and other newly launched products requiring investment in the prior year, removed projects related to divested businesses and rebalanced our portfolio to better focus on its core assets as this is not representative of our current product development activities and (ii) $21 million of certain maintenance costs classified as cost of sales in 2017 that in previous periods were included in R&D expenses as previously discussed.
Although R&D expenses in 2017 were lower when compared to 2016 by $60 million, R&D expenses as a percentage of revenue was approximately 4% in 2017 and 2016 and demonstrates our consistent commitment to our investment in our R&D strategy. The decrease in dollars spent in 2017 is attributable to year over year phasing as we completed the R&D investment in Siliq
TM
and other recently launched products requiring investment in 2016, removed projects related to businesses divested in 2017 and rebalanced our portfolio to better align with our long-term plans and focus on our Bausch + Lomb, GI and dermatology businesses.
Amortization of Intangible Assets
Amortization of intangible assets was
$2,690 million
and
$2,673 million
for
2017
and
2016
, respectively, an increase of
$17 million
, or
1%
. The increase in amortization is driven by changes to the estimated remaining useful lives of certain products and the Salix brand name, partially offset by lower amortization as a result of impairments to intangible assets and divestitures and discontinuances of product lines during 2017 and 2016 as the Company focuses on its core assets. Management continually assesses the useful lives related to the Company's long-lived assets to reflect the most current assumptions. In review of the Company’s finite-lived intangible assets, management revised the estimated useful lives of certain intangible assets in the third and fourth quarters of 2017. As a result, the useful lives of certain product brands, with an aggregate carrying value of $7,618 million as of December 31, 2017, were revised from an average of seven years to four years, primarily due to each product expected to lose its exclusivity. In addition, the useful life of the Salix brand, with a carrying value of $569 million as of December 31, 2017, was revised from seventeen years to ten years due to revisions in the forecasted sales of its product portfolio.
Goodwill Impairments
Goodwill impairments
was
$312 million
and
$1,077 million
for
2017
and
2016
, respectively.
72
During the three months ended September 30, 2017, the Sprout business was classified as held for sale. As the Sprout business represented only a portion of a reporting unit of our former Branded Rx segment, we assessed the remaining reporting unit for impairment and determined and recorded a goodwill impairment charge of $312 million during the three months ended September 30, 2017.
Commencing in the three months ended September 30, 2016 through the first quarter of 2018, the Company operated in three operating segments: (i) Bausch + Lomb/International, (ii) Branded Rx and (iii) U.S. Diversified Products. The realignment of the segment structure in 2016 resulted in changes in the Company’s reporting units. In the third and fourth quarter of 2016, goodwill impairment testing was performed under the former reporting unit structure immediately prior to the change and under the then-current reporting unit structure immediately subsequent to the change.
Under the former (pre-2016 realignment) reporting unit structure, the fair value of each reporting unit exceeded its carrying value by more than 15%, except for the former U.S. reporting unit whose carrying value exceeded its fair value by 2%. As a result, the Company proceeded to perform step two of the goodwill impairment test for the former U.S. reporting unit and determined that the carrying value of the unit's goodwill exceeded its implied fair value, which resulted in a goodwill impairment charge of $905 million, as adjusted through December 31, 2016. The goodwill impairment was primarily driven by changes to the Company's forecasted performance, which resulted in a lower fair value of the U.S. businesses, mainly the Salix business.
Under the then-current reporting unit structure, the carrying value of the Salix reporting unit exceeded its fair value, as updates to the unit's forecast resulted in a lower estimated fair value for the business. As a result, the Company proceeded to perform step two of the goodwill impairment test for the Salix reporting unit and determined that the carrying value of the unit's goodwill exceeded its implied fair value, which resulted in a goodwill impairment charge of $172 million, as adjusted through December 31, 2016.
See
Note 9, "INTANGIBLE ASSETS AND GOODWILL"
to our audited Consolidated Financial Statements for further details related to our goodwill impairment analysis.
Asset Impairments
Asset impairments were
$714 million
and
$422 million
for
2017
and
2016
, respectively, an increase of
$292 million
.
Asset impairments for 2017 included impairments of: (i) $351 million related to the Sprout business being classified as held for sale, (ii) $151 million reflecting decreases in forecasted sales for other product lines, (iii) $114 million to other assets classified as held for sale, primarily related to the Obagi business, (iv) $95 million, in aggregate, to certain product/patent assets associated with the discontinuance of specific product lines not aligned with the focus of the Company's core business and (v) $3 million related to acquired IPR&D.
Asset impairments for 2016 included impairments of: (i)
$221 million
related to the divestiture of Ruconest
®
, (ii)
$88 million
related to other assets classified as held for sale, (iii)
$74 million
related to other asset impairments which were individually not material, (iv)
$25 million
related to IBS
Chek
TM
due to a decrease in forecasted sales and (v)
$14 million
related to acquired IPR&D.
See
Note 4, "DIVESTITURES"
and
Note 9, "INTANGIBLE ASSETS AND GOODWILL"
to our audited Consolidated Financial Statements regarding further details related to our intangible assets.
Restructuring and Integration Costs
Restructuring and integration costs were
$52 million
and
$132 million
for
2017
and
2016
, respectively. We have substantially completed the integration of the businesses acquired prior to 2016. The Company continues to evaluate opportunities to streamline its operations and identify additional cost savings globally and the Company may identify and take additional exit and cost-rationalization restructuring actions in the future, the costs of which could be material.
See
Note 5, "RESTRUCTURING AND INTEGRATION COSTS"
to our audited Consolidated Financial Statements for further details regarding these actions.
Acquired In-Process Research and Development Costs
Acquired in-process research and development costs were
$5 million
and
$34 million
for
2017
and
2016
, respectively. Acquired in-process research and development costs in
2016
were primarily related to a $25 million license payment.
73
Acquisition-Related Contingent Consideration
Acquisition-related contingent consideration was a net gain of
$289 million
for
2017
which included:
(i) a fair value adjustment of $312 million reflecting a decrease in forecasted sales for the Addyi
®
product, which impacted the expected future payments and (ii) net fair value adjustments due to changes in estimates of other expected future payments of $31 million. These net gains were partially offset by accretion for the time value of money of $54 million.
Acquisition-related contingent consideration was a net gain of
$13 million
for
2016
, which included net fair value adjustments of $105 million which, were partially offset by accretion for the time value of money of $92 million.
See
Note 6, "FAIR VALUE MEASUREMENTS"
to our audited Consolidated Financial Statements for further details.
Other (income) expense, net
Other (income) expense, net
for
2017
and
2016
consists of the following:
|
(in millions)
|
2017
|
2016
|
||||||
|
Gain on the Skincare Sale
|
$
|
(309
|
)
|
$
|
—
|
|
||
|
Gain on the iNova Sale
|
(309
|
)
|
—
|
|
||||
|
Gain on the Dendreon Sale
|
(97
|
)
|
—
|
|
||||
|
Loss on the Sprout Sale
|
98
|
|
—
|
|
||||
|
Net loss (gain) on other sales of assets
|
37
|
|
(6
|
)
|
||||
|
Litigation and other matters
|
226
|
|
59
|
|
||||
|
Other, net
|
1
|
|
20
|
|
||||
|
Other (income) expense, net
|
$
|
(353
|
)
|
$
|
73
|
|
||
In 2017, Litigation and other matters includes: (i)
$96 million
related to the settlement of the Allergan shareholder class actions, (ii)
$93 million
related to the settlement of the Solodyn
®
antitrust class actions litigation and (iii)
$20 million
related to the Mimetogen Pharmaceuticals litigation. In 2016, Litigation and other matters includes: (i) an unfavorable adjustment of $90 million from the proposed settlement of the Salix securities litigation and (ii) a favorable adjustment of $39 million from the settlement of the investigation into Salix's pre-acquisition sales and promotional practices for the Xifaxan
®
, Relistor
®
and Apriso
®
products. Net gain on other sales of assets includes: (i) a gain of $20 million from an amendment to a license agreement terminating the Company's right to develop and commercialize brodalumab in Europe and (ii) a loss of $22 million from the divestiture of Ruconest
®
.
Litigation and other matters
includes other amounts provided for certain matters discussed in
Note 20, "LEGAL PROCEEDINGS"
to our audited Consolidated Financial Statements.
Non-Operating Income and Expense
Interest Expense
Interest expense was
$1,840 million
and
$1,836 million
and included non-cash amortization and write-offs of debt discounts and deferred financing costs of
$151 million
and
$118 million
for
2017
and
2016
, respectively. The increase in interest expense is primarily due to: (i) higher amortization and write-offs of debt discounts and deferred financing costs and (ii) higher interest rates associated with the refinancing transactions that occurred during 2017 and amendments made in 2016 to our Third Amended Credit Agreement (as defined below). Prepayments of long term debt were higher in 2017 as compared to 2016, and resulted in higher acceleration of amortization and write-offs of debt discounts and deferred financing costs during 2017 as compared to 2016. These increases were partially offset by a decrease in interest expense as a result of lower principal amounts of outstanding long term debt. The weighted average stated rate of interest as of December 31, 2017 and 2016 was 6.07% and 5.75%, respectively.
See
Note 11, "FINANCING ARRANGEMENTS"
to our audited Consolidated Financial Statements for further details.
Loss on Extinguishment of Debt
Loss on extinguishment of debt was
$122 million
for
2017
. In March 2017, October 2017, November 2017 and December 2017, we completed a series of transactions which allowed us to refinance a portion of our debt arrangements. In August 2017, we repurchased the remaining $500 million of our August 2018 Unsecured Notes. Losses representing the differences between the amounts paid to settle the extinguished debts and the carrying value of the extinguished debts (the debts' stated principal net of unamortized debt discount and debt issuance costs) were recognized.
74
See
Note 11, "FINANCING ARRANGEMENTS"
to our audited Consolidated Financial Statements for further details.
Foreign Exchange and Other
Foreign exchange and other was a net gain of
$107 million
for
2017
and includes: (i) a foreign exchange gain related to a euro-denominated intercompany loan and (ii) net foreign exchange gains related to intercompany transactions within our European operations.
Foreign exchange and other was a net loss of
$41 million
for
2016
and includes: (i) a foreign exchange loss related to a euro-denominated intercompany loan and (ii) net foreign exchange losses related to intercompany transactions within our European operations.
Income Taxes
Benefit from income taxes was
$4,145 million
and
$27 million
for
2017
and
2016
, respectively.
As previously discussed, in 2017, our effective tax rate differed from the Canadian statutory tax rate of 26.9% primarily due to: (i) a benefit related to internal integrations and restructurings, (ii) a benefit related to U.S. tax law changes enacted in December 2017, (iii) a benefit generated from our annualized mix of earnings by jurisdiction, (iv) a benefit from the sale of divested businesses and (v) the recording of valuation allowance on entities for which no tax benefit of losses is expected.
In 2016, our effective tax rate differed from the Canadian statutory tax rate of 26.9% primarily due to: (i) a benefit related to internal integrations and restructurings, (ii) a charge for the impact of non-deductible goodwill impairment, (iii) a benefit for the effect of valuation allowance on our tax attribute carryforwards in Canada, (iv) benefit of intra-entity transfers including the amortization of intangibles for tax purposes (these include a charge for internal restructuring) and (v) a benefit from income earned in jurisdictions with a lower statutory rate than in Canada.
See
Note 17, "INCOME TAXES"
to our audited Consolidated Financial Statements for further details regarding income taxes.
Reportable Segment Revenues and Profits
The following table presents segment revenues, segment revenues as a percentage of total revenues, and the year over year changes in segment revenues for
2017
and
2016
. The following table also presents segment profits, segment profits as a percentage of segment revenues and the year over year changes in segment profits for
2017
and
2016
.
|
|
Years Ended December 31,
|
Change
|
|||||||||||||||||||
|
|
2017
|
2016
|
2016 to 2017
|
||||||||||||||||||
|
(in millions)
|
Amount
|
Pct.
|
Amount
|
Pct.
|
Amount
|
Pct.
|
|||||||||||||||
|
Segment Revenue
|
|||||||||||||||||||||
|
Bausch + Lomb/International
|
$
|
4,795
|
|
55
|
%
|
$
|
4,857
|
|
50
|
%
|
$
|
(62
|
)
|
(1
|
)%
|
||||||
|
Salix
|
1,566
|
|
18
|
%
|
1,530
|
|
16
|
%
|
36
|
|
2
|
%
|
|||||||||
|
Ortho Dermatologics
|
725
|
|
8
|
%
|
949
|
|
10
|
%
|
(224
|
)
|
(24
|
)%
|
|||||||||
|
Diversified Products
|
1,638
|
|
19
|
%
|
2,338
|
|
24
|
%
|
(700
|
)
|
(30
|
)%
|
|||||||||
|
Total revenues
|
$
|
8,724
|
|
100
|
%
|
$
|
9,674
|
|
100
|
%
|
$
|
(950
|
)
|
(10
|
)%
|
||||||
|
Segment Profits / Segment Profit Margins
|
|||||||||||||||||||||
|
Bausch + Lomb/International
|
$
|
1,412
|
|
29
|
%
|
$
|
1,456
|
|
30
|
%
|
$
|
(44
|
)
|
(3
|
)%
|
||||||
|
Salix
|
935
|
|
60
|
%
|
946
|
|
62
|
%
|
(11
|
)
|
(1
|
)%
|
|||||||||
|
Ortho Dermatologics
|
336
|
|
46
|
%
|
408
|
|
43
|
%
|
(72
|
)
|
(18
|
)%
|
|||||||||
|
Diversified Products
|
1,112
|
|
68
|
%
|
1,712
|
|
73
|
%
|
(600
|
)
|
(35
|
)%
|
|||||||||
|
Total segment profit
|
$
|
3,795
|
|
44
|
%
|
$
|
4,522
|
|
47
|
%
|
$
|
(727
|
)
|
(16
|
)%
|
||||||
75
The following table presents organic revenue (Non-GAAP) and the year over year changes in organic revenue for
2017
and
2016
by segment. Organic revenue and organic growth rates are defined in the previous section titled “Selected Financial Information”.
|
|
Year Ended December 31, 2017
|
Year Ended December 31, 2016
|
Change in
Organic Revenue
|
||||||||||||||||||||||||||||
|
Revenue
as
Reported
|
Changes in Exchange Rates
|
Organic Revenue
(Non-GAAP)
|
Revenue
as
Reported
|
Revenues of Businesses Divested
|
Organic Revenue
(Non-GAAP)
|
||||||||||||||||||||||||||
|
(in millions)
|
Amount
|
Pct.
|
|||||||||||||||||||||||||||||
|
Bausch + Lomb/International
|
$
|
4,795
|
|
$
|
78
|
|
$
|
4,873
|
|
$
|
4,857
|
|
$
|
(240
|
)
|
$
|
4,617
|
|
$
|
256
|
|
6
|
%
|
||||||||
|
Salix
|
1,566
|
|
—
|
|
1,566
|
|
1,530
|
|
(32
|
)
|
1,498
|
|
68
|
|
5
|
%
|
|||||||||||||||
|
Ortho Dermatologics
|
725
|
|
—
|
|
725
|
|
949
|
|
(3
|
)
|
946
|
|
(221
|
)
|
(23
|
)%
|
|||||||||||||||
|
Diversified Products
|
1,638
|
|
—
|
|
1,638
|
|
2,338
|
|
(184
|
)
|
2,154
|
|
(516
|
)
|
(24
|
)%
|
|||||||||||||||
|
Total
|
$
|
8,724
|
|
$
|
78
|
|
$
|
8,802
|
|
$
|
9,674
|
|
$
|
(459
|
)
|
$
|
9,215
|
|
$
|
(413
|
)
|
(4
|
)%
|
||||||||
Bausch + Lomb/International Segment:
Bausch + Lomb/International Segment Revenue
The Bausch + Lomb/International segment revenue was
$4,795 million
and
$4,857 million
for
2017
and
2016
, respectively,
a decrease
of
$62 million
, or
1%
. The
decrease
was primarily driven by: (i) the impact of the Skincare Sale, the iNova Sale and other divestitures and discontinuations of
$240 million
and (ii) the unfavorable impact of foreign currencies of
$78 million
, which includes the unfavorable impact from the Egyptian pound of $138 million.
These factors were partially offset by: (i) an increase in volume of $139 million primarily driven by the U.S. Bausch + Lomb Consumer and international businesses and, to a lesser extent, the U.S. Bausch + Lomb Vision Care and Surgical businesses and (ii) an increase in average realized pricing of
$121 million
, primarily in Egypt in order to offset the unfavorable impact of foreign exchange due to the Egyptian pound devaluation.
Bausch + Lomb/International Segment Profit
The Bausch + Lomb/International segment profit was
$1,412 million
and
$1,456 million
for
2017
and
2016
, respectively,
a decrease
of
$44 million
, or
3%
. The
decrease
was primarily driven by: (i) the decrease in contribution from the impact of the Skincare Sale, the iNova Sale and other divestitures and discontinuations of
$151 million
and (ii) the unfavorable impact of foreign currencies on our business of
$40 million
, primarily due to the Egyptian pound.
These factors were partially offset by: (i) an increase in contribution as a result of increases in volume and average realized pricing as previously discussed and (ii) a decrease in operating expenses (excluding amortization and impairments of intangible assets) of
$27 million
primarily in advertising and promotion expenses, including expenses eliminated as a result of the Skincare Sale, the iNova Sale and other divestitures and discontinuances.
Salix Segment:
Salix Segment Revenue
The Salix segment revenue was
$1,566 million
and
$1,530 million
for
2017
and
2016
, respectively,
an increase
of
$36 million
, or
2%
. The
increase
includes an increase in average realized pricing of
$138 million
primarily driven by: (i) increased wholesale selling prices and (ii) lower discounts 2017 when compared to 2016. As previously discussed in “Cash Discounts and Allowances, Chargebacks and Distribution Fees,”
as a result of corrective actions taken by the Company, and its continued pricing discipline during 2016, chargeback rates within the Salix segment were lower in 2017 when compared to 2016.
These factors were partially offset by: (i) a decrease in volume of
$70 million
primarily driven by: (a) lower demand most notably with our Glumetza
®
and Uceris
®
products attributable to competition and the increase in high deductible medical plans and (b) generic competition as certain products lost exclusivity, such as our Zegerid
®
product and (ii) the impact from the divestiture of Ruconest
®
and other divestitures of approximately
$32 million
.
Salix Segment Profit
The Salix segment profit was
$935 million
and
$946 million
for
2017
and
2016
, respectively,
a decrease
of
$11 million
, or
1%
. The
decrease
was primarily driven by a decrease in contribution from: (i) the lower volumes previously discussed, (ii) increase
76
in selling expenses associated with our sales force expansion program and (iii) the impact from the divestiture of Ruconest
®
of approximately
$27 million
.
These factors were partially offset by: (i) lower advertising and promotion expenses and (ii) acquisition accounting adjustments related to inventories expensed in 2016 of
$30 million
.
Ortho Dermatologics Segment:
Ortho Dermatologics Segment Revenue
The Ortho Dermatologics segment revenue was
$725 million
and
$949 million
for
2017
and
2016
, respectively,
a decrease
of
$224 million
, or
24%
. The
decrease
was primarily driven by: (i) a decrease in volume of
$211 million
primarily driven by: (a) our Jublia
®
product, and, to a lesser extent, our Solodyn
®
product, which have experienced lower volumes since the change in our fulfillment model, (b) generic competition as certain products lost exclusivity, such as our Carac
®
, Targretin
®
and Ziana
®
products and (c) reduced patient access by third-party payors to certain legacy dermatology products, (ii) the decrease in average realized pricing of
$8 million
and (iii) the decrease from the impact of divestitures and discontinuations of
$3 million
.
Ortho Dermatologics Segment Profit
The Ortho Dermatologics segment profit was
$336 million
and
$408 million
for
2017
and
2016
, respectively,
a decrease
of
$72 million
, or
18%
. The
decrease
was primarily driven by a decrease in contribution from lower volume and average realized pricing as previously discussed. These factors were partially offset by the decrease in operating expenses primarily related to lower selling and advertising and promotion expenses.
Diversified Products Segment:
Diversified Products Segment Revenue
The following table displays the U.S. Diversified Products segment revenues in U.S. dollars by product and product revenues as a percentage of segment revenue for
2017
and
2016
.
|
|
Years Ended December 31,
|
Change
|
||||||||||||||||
|
|
2017
|
2016
|
2016 to 2017
|
|||||||||||||||
|
(in millions)
|
Amount
|
Pct.
|
Amount
|
Pct.
|
Amount
|
Pct.
|
||||||||||||
|
Wellbutrin
®
Franchise
(1)
|
$
|
235
|
|
14%
|
$
|
279
|
|
12%
|
$
|
(44
|
)
|
(16)%
|
||||||
|
Provenge
®
|
164
|
|
10%
|
303
|
|
13%
|
(139
|
)
|
(46)%
|
|||||||||
|
Xenazine
®
Franchise
(1)
|
122
|
|
7%
|
166
|
|
7%
|
(44
|
)
|
(27)%
|
|||||||||
|
Arestin
®
|
111
|
|
7%
|
142
|
|
6%
|
(31
|
)
|
(22)%
|
|||||||||
|
Isuprel
®
|
105
|
|
6%
|
178
|
|
8%
|
(73
|
)
|
(41)%
|
|||||||||
|
Syprine
®
|
91
|
|
6%
|
88
|
|
4%
|
3
|
|
3%
|
|||||||||
|
Cuprimine
®
|
78
|
|
5%
|
104
|
|
4%
|
(26
|
)
|
(25)%
|
|||||||||
|
Ativan
®
|
60
|
|
4%
|
41
|
|
2%
|
19
|
|
46%
|
|||||||||
|
Migranal
®
Franchise
(1)
|
58
|
|
4%
|
66
|
|
3%
|
(8
|
)
|
(12)%
|
|||||||||
|
Mephyton
®
Franchise
(1)
|
52
|
|
3%
|
56
|
|
2%
|
(4
|
)
|
(7)%
|
|||||||||
|
Other product revenues
|
548
|
|
33%
|
897
|
|
38%
|
(349
|
)
|
(39)%
|
|||||||||
|
Other revenues
|
14
|
|
1%
|
18
|
|
1%
|
(4
|
)
|
(22)%
|
|||||||||
|
Total Diversified Products revenues
|
$
|
1,638
|
|
100%
|
$
|
2,338
|
|
100%
|
$
|
(700
|
)
|
(30)%
|
||||||
1
2017 and 2016 product revenues have been recast to include international revenues and other products within the franchise.
The Diversified Products segment revenue was
$1,638 million
and
$2,338 million
for
2017
and
2016
, respectively,
a decrease
of
$700 million
, or
30%
. The
decrease
was primarily driven by: (i) a decrease in volume of
$354 million
, (ii) the impact of the Dendreon Sale and other divestitures and discontinuations of
$184 million
and (iii) a decrease in average realized pricing of
$158 million
. Dendreon’s only commercialized product, Provenge
®
, is an autologous cellular immunotherapy (vaccine) for prostate cancer treatment approved by the FDA in April 2010. With this sale completed, we have exited the oncology business, which was not core to our objectives. The decrease in volumes and average realized pricing is primarily driven by generic competition to certain products, such as Nitropress
®
, Isuprel
®
, Xenazine
®
and Wellbutrin
®
in our neurology business unit and the Zegerid
®
AG in our generics business unit.
77
Diversified Products Segment Profit
The Diversified Products segment profit was
$1,112 million
and
$1,712 million
for
2017
and
2016
, respectively,
a decrease
of
$600 million
, or
35%
. The
decrease
was primarily driven by the decrease in contribution as a result of the decreases in volumes and average realized pricing as previously discussed and the impact of the Dendreon Sale and other divestitures and discontinuations.
LIQUIDITY AND CAPITAL RESOURCES
Cash Flows
Summarized cash flow information for the years ended December 31,
2018, 2017 and 2016
is as follows:
|
|
Years Ended December 31,
|
Change
|
||||||||||||||||||
|
(in millions)
|
2018
|
2017
|
2016
|
2017 to 2018
|
2016 to 2017
|
|||||||||||||||
|
Net (loss) income
|
$
|
(4,144
|
)
|
$
|
2,404
|
|
$
|
(2,408
|
)
|
$
|
(6,548
|
)
|
$
|
4,812
|
|
|||||
|
Adjustments to reconcile net (loss) income to net cash provided by operating activities
|
5,627
|
|
(958
|
)
|
4,605
|
|
6,585
|
|
(5,563
|
)
|
||||||||||
|
Changes in operating assets and liabilities
|
18
|
|
844
|
|
(110
|
)
|
(826
|
)
|
954
|
|
||||||||||
|
Net cash provided by operating activities
|
1,501
|
|
2,290
|
|
2,087
|
|
(789
|
)
|
203
|
|
||||||||||
|
Net cash (used in) provided by investing activities
|
(196
|
)
|
2,887
|
|
(125
|
)
|
(3,083
|
)
|
3,012
|
|
||||||||||
|
Net cash used in financing activities
|
(1,353
|
)
|
(4,963
|
)
|
(1,963
|
)
|
3,610
|
|
(3,000
|
)
|
||||||||||
|
Effect of exchange rate changes on cash and cash equivalents
|
(26
|
)
|
41
|
|
(54
|
)
|
(67
|
)
|
95
|
|
||||||||||
|
Net (decrease) increase in cash and cash equivalents and restricted cash
|
(74
|
)
|
255
|
|
(55
|
)
|
(329
|
)
|
310
|
|
||||||||||
|
Cash and cash equivalents and restricted cash, beginning of year
|
797
|
|
542
|
|
597
|
|
255
|
|
(55
|
)
|
||||||||||
|
Cash and cash equivalents and restricted cash, end of year
|
$
|
723
|
|
$
|
797
|
|
$
|
542
|
|
$
|
(74
|
)
|
$
|
255
|
|
|||||
Operating Activities
Net cash provided by operating activities
was
$1,501 million
and
$2,290 million
in
2018
and
2017
, respectively,
a decrease
of
$789 million
, or
34%
. The
decrease
was primarily attributable to: (i) the favorable impact of changes in our operating assets and liabilities in 2017 discussed below which did not repeat in 2018 and (ii) higher payments (net of insurance proceeds) of legal settlements in 2018. Payments of accrued legal settlements were
$224 million
, primarily related to the settlement of the Allergan shareholder class actions and Solodyn
®
antitrust class actions litigations, and
$221 million
, primarily related to the settlement of the legacy Salix securities class action litigation, and Insurance proceeds for legal settlements were $0 and
$60 million
for
2018
and
2017
, respectively.
Net cash provided by operating activities
was
$2,290 million
and
$2,087 million
for
2017
and
2016
, respectively, an increase of
$203 million
, or
10%
. The increase was primarily attributable to the favorable impact of changes in our operating assets and liabilities in 2017 discussed below which did not occur in 2016 partially offset by higher payments (net of insurance proceeds) of legal settlements in 2017. Payments of accrued legal settlements were
$221 million
and
$69 million
and Insurance proceeds for legal settlements were
$60 million
and $0 for
2017
and 2016, respectively.
The favorable impact of changes in our operating assets and liabilities in 2017 was primarily attributable to: (i) better working capital management and (ii) the timing of the collection of trade receivables attributable to our fulfillment agreement with Walgreens in resolution of certain 2016 billing issues. As a result of our focus on our core businesses and divestitures of non-core businesses, we reduced our inventory days and working capital days during 2017. In 2017, we also simplified our supply chain by reducing the number of manufacturing sites and discontinued more than 1,900 stock keeping units or SKUs. These operational improvements generated over $800 million of additional cash from changes in working capital during 2017. Although we continually drive for operational excellence across our organization, at this time we believe we have right-sized the Company's working capital to a level that fits our business size and needs.
Investing Activities
Net cash (used in) provided by investing activities was
$(196) million
,
$2,887 million
and
$(125) million
and included payments for: (i) purchases of property, plant and equipment of
$157 million
,
$171 million
and
$235 million
and (ii) acquisitions of intangible assets and other assets previously acquired of
$78 million
,
$165 million
and
$56 million
, for the years 2018, 2017
78
and 2016, respectively. In 2017, net cash provided by investing activities included the net proceeds from sales of non-core assets of
$3,253 million
, as previously discussed, which were substantially used to reduce the Company's debt obligations.
Financing Activities
Net cash
used in
financing activities during 2018, 2017 and 2016 was primarily driven by repayments of long-term debt in execution of leadership’s commitment to improve the Company’s capital structure.
Net cash
used in
financing activities during 2018 was
$1,353 million
and included repayments of long-term debt of
$10,101 million
consisting of: (i) repayments of term loans under our Senior Secured Credit Facilities of
$3,711 million
, (ii) repayments of principal amounts due under our Senior Notes of
$5,465 million
, (iii) refinancing $500 million of outstanding amounts under our 2020 Revolving Credit Facility with our 2023 Revolving Credit Facility and (iv) repayments of our revolving credit facilities of
$425 million
. Issuance of long-term debt, net of discounts for
2018
was
$8,944 million
and included: (i) the net proceeds of: (a) $4,507 million from the issuance of
$4,565 million
in principal amount of
June 2025 Term Loan B Facility
, (b) $1,480 million from the issuance of
$1,500 million
in principal amount of April 2026 Unsecured Notes (c) $1,476 million from the issuance of
$1,500 million
in principal amount of
November 2025 Term Loan B Facility
and (d) $738 million from the issuance of
$750 million
in principal amount of January 2027 Unsecured Notes, (ii) refinancing $500 million of outstanding amounts under our 2020 Revolving Credit Facility with our 2023 Revolving Credit Facility and (iii)
$250 million
of borrowings under our revolving credit facilities. The net proceeds from the Issuance of long-term debt, net of discounts in 2018 is further reduced by $7 million in payments we made in 2018 for issuance costs associated with senior notes issued during 2017. Payments for costs associated with the refinancing of certain debt was
$102 million
for
2018
.
Net cash
used in
financing activities during 2017 was
$4,963 million
and included repayments of long-term debt of
$14,203 million
consisting of: (i) repayments of term loans under our Senior Secured Credit Facilities of $9,478 million, (ii) repayments of Senior Unsecured Notes of $4,100 million and (iii) repayments of amounts due under our revolving credit facility of $625 million. These repayments were funded with: (i) the net proceeds from the sales of non-core assets, including the Skincare Sale, the Dendreon Sale, the iNova Sale and the Obagi Sale, (ii) net proceeds of
$9,424 million
from the 2017 Refinancing Transactions and (iii) cash on hand. Payments for costs associated with the refinancing of certain debt was
$110 million
for 2017.
Net cash
used in
financing activities during 2016 was
$1,963 million
and included repayments of long-term debt of $2,436 million consisting of: (i) repayments of term loans under our Senior Secured Credit Facilities of $1,841 million and (ii) repayments of amounts due under our revolving credit facility of $595 million. Other uses of cash by financing activities included: (i) payment of deferred consideration of $500 million in connection with an acquisition, (ii) payments of contingent consideration of $123 million, including $50 million in connection with the FDA approval of Relistor
®
tablets and (iii) payments of $97 million in connection with certain amendments to our Senior Secured Credit Facilities. Repayments of long-term debt in 2016 were funded with: (i) borrowings under our revolving credit facility of $1,220 million, (ii) proceeds from the sale of non-core assets and (iii) cash on hand.
See
Note 11, "FINANCING ARRANGEMENTS"
to our audited Consolidated Financial Statements for further details regarding the financing activities previously described.
Liquidity and Debt
Future Sources of Liquidity
Our primary sources of liquidity are our cash and cash equivalents, cash collected from customers, funds as available from our revolving credit facility, issuances of long-term debt and issuances of equity and equity-linked securities. We believe these sources will be sufficient to meet our current liquidity needs for the next twelve months.
The Company regularly evaluates market conditions, its liquidity profile, and various financing alternatives for opportunities to enhance its capital structure. If opportunities are favorable, the Company may refinance or repurchase existing debt or issue equity or equity-linked securities. We believe our existing cash and cash generated from operations will be sufficient to service our debt obligations in the years 2019 through 2020.
Long-term Debt
Long-term debt, net of unamortized discounts and finance costs was
$24,305 million
and
$25,444 million
as of December 31, 2018
and
December 31, 2017
, respectively. Aggregate contractual principal amounts due under our debt obligations were
$24,632 million
and
$25,752 million
as of December 31, 2018
and
2017
, respectively,
a decrease
of
$1,120 million
.
79
In March, June and November 2018, we accessed the credit markets and completed a series of transactions, whereby we extended approximately $8,300 million in aggregate maturities of certain debt obligations due to mature in March 2020 through July 2022, out to June 2025 through January 2027. As part of these transactions we obtained less stringent loan financial maintenance covenants under our Senior Secured Credit Facilities and extended the availability of our revolving credit facility by more than three years by replacing our previously existing revolving credit facility due in April 2020 with the 2023 Revolving Credit Facility of
$1,225 million
.
Debt repayments - During 2018, we repaid: (i)
$206 million
of our Series F Tranche B Term Loan Facility, (ii)
$200 million
of our
December 2021 Unsecured Notes
, (iii)
$171 million
of our
June 2025 Term Loan B Facility
, (iv)
$125 million
of our July 2021 Unsecured Notes, (v)
$104 million
of our 6.375% October 2020 Unsecured Notes, (vi) the remaining
$71 million
of outstanding principal amount of our 7.00% Senior Unsecured Notes Due 2020, (vii)
$19 million
of our
November 2025 Term Loan B Facility
and (viii)
$175 million
(net of additional borrowings) of amounts outstanding under our revolving credit facilities. These repayments during 2018 were funded with cash on hand and reduced our outstanding debt obligations by more than $1,000 million.
2018 Refinancing Transactions
On March 26, 2018, BHA issued
$1,500 million
aggregate principal amount of April 2026 Unsecured Notes in a private placement, the net proceeds of which, along with cash on hand, were used to repurchase
$1,500 million
in aggregate principal amount of unsecured notes which consisted of: (i)
$1,017 million
in principal amount of our existing March 2020 Unsecured Notes, (ii)
$411 million
in principal amount of our existing 6.375% October 2020 Unsecured Notes and (iii)
$72 million
in principal amount of our existing August 2021 Unsecured Notes. All fees and expenses associated with these transactions were paid with cash on hand.
On June 1, 2018, the Company entered into the Restated Credit Agreement. The Restated Credit Agreement amended and restated in full the Third Amended Credit Agreement (as defined below). The Restated Credit Agreement replaced the 2020 Revolving Credit Facility with the 2023 Revolving Credit Facility of
$1,225 million
and replaced the Series F Tranche B Term Loan Facility principal amount outstanding of
$3,315 million
with the
June 2025 Term Loan B Facility
of
$4,565 million
.
In June 2018, using the net proceeds from the
June 2025 Term Loan B Facility
, the net proceeds from the issuance of
$750 million
of the January 2027 Unsecured Notes by BHA and cash on hand, the Company prepaid the remaining outstanding principal amounts of: (i)
$691 million
of the March 2020 Unsecured Notes, (ii)
$578 million
of the August 2021 Unsecured Notes, (iii)
$550 million
of the July 2022 Unsecured Notes and (iv)
$146 million
of the 6.375% October 2020 Unsecured Notes.
On November 27, 2018, the Company entered into the First Incremental Amendment to the Restated Credit Agreement which provided the
November 2025 Term Loan B Facility
of
$1,500 million
. The net proceeds and cash on hand were used to repurchase
$1,483 million
in outstanding principal amount of
July 2021 Unsecured Notes
in a tender offer. On December 27, 2018, the Company redeemed the remaining outstanding principal amount of
$17 million
of the
July 2021 Unsecured Notes
using cash on hand.
The aforementioned repayments, refinancings and other changes in our debt portfolio completed during 2018 have lowered our cash requirements for principal debt repayment over the next five years. The mandatory scheduled principal repayments of our debt obligations as of
December 31, 2018
and
2017
were as follows:
|
(in millions)
|
December 31, 2018
|
December 31, 2017
|
||||||
|
2018
|
$
|
—
|
|
$
|
209
|
|
||
|
2019
|
228
|
|
—
|
|
||||
|
2020
|
303
|
|
2,690
|
|
||||
|
2021
|
1,003
|
|
3,175
|
|
||||
|
2022
|
1,553
|
|
5,115
|
|
||||
|
2023
|
6,348
|
|
6,051
|
|
||||
|
Thereafter
|
15,197
|
|
8,512
|
|
||||
|
$
|
24,632
|
|
$
|
25,752
|
|
|||
See
Note 11, "FINANCING ARRANGEMENTS"
to our audited Consolidated Financial Statements and “Management's Discussion and Analysis - Liquidity and Capital Resources: Long-term Debt” for further details.
The weighted average stated rate of interest
as of December 31, 2018 and 2017
was
6.23%
and
6.07%
, respectively.
80
Senior Secured Credit Facilities
On February 13, 2012, the Company and certain of its subsidiaries as guarantors entered into the “Senior Secured Credit Facilities” under the Company’s Third Amended and Restated Credit and Guaranty Agreement, as amended (the “Third Amended Credit Agreement”) with a syndicate of financial institutions and investors.
On June 1, 2018, the Company entered into the Restated Credit Agreement, effectuating the Restated Credit Agreement which amended and restated in full the Company’s Third Amended Credit Agreement.
On November 27, 2018, the Company entered into the First Incremental Amendment to the Restated Credit Agreement which provided the
November 2025 Term Loan B Facility
of
$1,500 million
.
As of
December 31, 2018
, the Company had
$75 million
of outstanding borrowings,
$169 million
of issued and outstanding letters of credit, and remaining availability of
$981 million
under its 2023 Revolving Credit Facility.
Current Description of Senior Secured Credit Facilities
Borrowings under the Senior Secured Credit Facilities in U.S. dollars bear interest at a rate per annum equal to, at the Company's option, either: (i) a base rate determined by reference to the higher of: (a) the prime rate (as defined in the Restated Credit Agreement), (b) the federal funds effective rate plus 1/2 of
1.00%
or (c) the eurocurrency rate (as defined in the Restated Credit Agreement) for a period of one month plus
1.00%
(or if such eurocurrency rate shall not be ascertainable,
1.00%
) or (ii) a eurocurrency rate determined by reference to the costs of funds for U.S. dollar deposits for the interest period relevant to such borrowing adjusted for certain additional costs (provided however, that the eurocurrency rate shall at no time be less than zero), in each case plus an applicable margin.
Borrowings under the 2023 Revolving Credit Facility in Euros bear interest at a eurocurrency rate determined by reference to the costs of funds for Euro deposits for the interest period relevant to such borrowing (provided however, that the eurocurrency rate shall at no time be less than
0.00%
per annum), plus an applicable margin.
Borrowings under the 2023 Revolving Credit Facility in Canadian dollars bear interest at a rate per annum equal to, at the Company's option, either (a) a prime rate determined by reference to the higher of: (1) the rate of interest last quoted by The Wall Street Journal as the “Canadian Prime Rate” or, if The Wall Street Journal ceases to quote such rate, the highest per annum interest rate published by the Bank of Canada as its prime rate and (2) the 1 month BA rate (as defined below) calculated daily plus
1.00%
(provided however, that the prime rate shall at no time be less than
0.00%
) or (b) the bankers’ acceptance rate for Canadian dollar deposits in the Toronto interbank market (the “BA rate”) for the interest period relevant to such borrowing (provided however, that the BA rate shall at no time be less than
0.00%
per annum), in each case plus an applicable margin.
Subject to certain exceptions and customary baskets set forth in the Restated Credit Agreement, the Company is required to make mandatory prepayments of the loans under the Senior Secured Credit Facilities under certain circumstances, including from: (i)
100%
of the net cash proceeds of insurance and condemnation proceeds for property or asset losses (subject to reinvestment rights and net proceeds threshold), (ii)
100%
of the net cash proceeds from the incurrence of debt (other than permitted debt as described in the Restated Credit Agreement), (iii)
50%
of Consolidated Excess Cash Flow (as defined in the Restated Credit Agreement) subject to decrease based on leverage ratios and subject to a threshold amount and (iv)
100%
of net cash proceeds from asset sales (subject to reinvestment rights). These mandatory prepayments may be used to satisfy future amortization.
The applicable interest rate margins for the
June 2025 Term Loan B Facility
and the
November 2025 Term Loan B Facility
are
2.00%
and
1.75%
, respectively, with respect to base rate and prime rate borrowings and
3.00%
and
2.75%
, respectively, with respect to eurocurrency rate and bankers' acceptance rate borrowings.
As of December 31, 2018
, the stated rate of interest on the Company’s borrowings under the
June 2025 Term Loan B Facility
and the
November 2025 Term Loan B Facility
was
5.38%
and
5.13%
per annum, respectively.
The amortization rate for both the
June 2025 Term Loan B Facility
and the
November 2025 Term Loan B Facility
is
5.00%
per annum. The Company may direct that prepayments be applied to such amortization payments in order of maturity.
As of December 31, 2018
, the remaining mandatory quarterly amortization payments for the Senior Secured Credit Facilities were
$1,857 million
through November 27, 2025.
The applicable interest rate margins for borrowings under the 2023 Revolving Credit Facility are
1.50%
-
2.00%
with respect to base rate or prime rate borrowings and
2.50%
-
3.00%
with respect to eurocurrency rate or bankers' acceptance rate borrowings.
As of December 31, 2018
, the stated rate of interest on the 2023 Revolving Credit Facility was
5.38%
per annum. In addition, the Company is required to pay commitment fees of
0.25%
-
0.50%
per annum with respect to the unutilized commitments under the 2023 Revolving Credit Facility, payable quarterly in arrears. The Company also is required to pay: (i) letter of credit fees on the
81
maximum amount available to be drawn under all outstanding letters of credit in an amount equal to the applicable margin on eurocurrency rate borrowings under the 2023 Revolving Credit Facility on a per annum basis, payable quarterly in arrears, (ii) customary fronting fees for the issuance of letters of credit and (iii) agency fees.
The Restated Credit Agreement permits the incurrence of
$1,000 million
of incremental credit facility borrowings, subject to customary terms and conditions, as well as the incurrence of additional incremental credit facility borrowings subject to, in the case of secured debt, a secured leverage ratio of not greater than
3.50
:1.00, and, in the case of unsecured debt, a total leverage ratio of not greater than
6.50
:1.00 or an interest coverage ratio of not less than
2.00
:1.00.
Senior Secured Notes
The Senior Secured Notes are guaranteed by each of the Company’s subsidiaries that is a guarantor under the Restated Credit Agreement and existing Senior Unsecured Notes (together, the “Note Guarantors”). The Senior Secured Notes and the guarantees related thereto are senior obligations and are secured, subject to permitted liens and certain other exceptions, by the same first priority liens that secure the Company’s obligations under the Restated Credit Agreement under the terms of the indenture governing the Senior Secured Notes.
The Senior Secured Notes and the guarantees rank equally in right of repayment with all of the Company’s and Note Guarantors’ respective existing and future unsubordinated indebtedness and senior to the Company’s and Note Guarantors’ respective future subordinated indebtedness. The Senior Secured Notes and the guarantees related thereto are effectively
pari passu
with the Company’s and the Note Guarantors’ respective existing and future indebtedness secured by a first priority lien on the collateral securing the Senior Secured Notes and effectively senior to the Company’s and the Note Guarantors’ respective existing and future indebtedness that is unsecured, including the existing Senior Unsecured Notes, or that is secured by junior liens, in each case to the extent of the value of the collateral. In addition, the Senior Secured Notes are structurally subordinated to: (i) all liabilities of any of the Company’s subsidiaries that do not guarantee the Senior Secured Notes and (ii) any of the Company’s debt that is secured by assets that are not collateral.
Upon the occurrence of a change in control (as defined in the indentures governing the Senior Secured Notes), unless the Company has exercised its right to redeem all of the notes of a series, holders of the Senior Secured Notes may require the Company to repurchase such holder’s notes, in whole or in part, at a purchase price equal to
101%
of the principal amount thereof plus accrued and unpaid interest.
Senior Unsecured Notes
The Senior Unsecured Notes issued by the Company are the Company’s senior unsecured obligations and are jointly and severally guaranteed on a senior unsecured basis by each of its subsidiaries that is a guarantor under the Senior Secured Credit Facilities. The Senior Unsecured Notes issued by the Company’s subsidiary are senior unsecured obligations of the Company and are jointly and severally guaranteed on a senior unsecured basis by the Company and each of its subsidiaries that is a guarantor under the Senior Secured Credit Facilities. Future subsidiaries of the Company, if any, may be required to guarantee the Senior Unsecured Notes.
If the Company experiences a change in control, the Company may be required to make an offer to repurchase each series of Senior Unsecured Notes, in whole or in part, at a purchase price equal to
101%
of the aggregate principal amount of the Senior Unsecured Notes repurchased, plus accrued and unpaid interest.
9.25% Senior Unsecured Notes due 2026 - March 2018 Refinancing Transactions
On March 26, 2018, BHA issued
$1,500 million
in aggregate principal amount of April 2026 Unsecured Notes in a private placement, the net proceeds of which, along with cash on hand, were used to repurchase
$1,500 million
in aggregate principal amount of unsecured notes which consisted of: (i)
$1,017 million
in principal amount of the March 2020 Unsecured Notes, (ii)
$411 million
in principal amount of the
6.375%
October 2020 Unsecured Notes and (iii)
$72 million
in principal amount of the August 2021 Unsecured Notes. During May 2018, BHA redeemed an additional
$104 million
in principal amount of
6.375%
October 2020 Unsecured Notes using cash on hand. The April 2026 Unsecured Notes accrue interest at the rate of
9.25%
per year, payable semi-annually in arrears on each of April 1 and October 1.
82
BHA may redeem all or a portion of the April 2026 Unsecured Notes at any time prior to April 1, 2022, at a price equal to 100% of the principal amount thereof, plus accrued and unpaid interest, if any, to the date of redemption, plus a “make-whole” premium. In addition, at any time prior to April 1, 2021, BHA may redeem up to 40% of the aggregate principal amount of the outstanding April 2026 Unsecured Notes with the net proceeds of certain equity offerings at the redemption price set forth in the April 2026 Unsecured Notes indenture. On or after April 1, 2022, BHA may redeem all or a portion of the April 2026 Unsecured Notes at the applicable redemption prices set forth in the April 2026 Unsecured Notes indenture, plus accrued and unpaid interest to the date of redemption.
8.50% Senior Unsecured Notes due 2027 - June 2018 Refinancing Transactions
As part of the June 2018 Refinancing Transactions, BHA issued
$750 million
in aggregate principal amount of January 2027 Unsecured Notes in a private placement, the proceeds of which, when combined with the remaining net proceeds from the
June 2025 Term Loan B Facility
and cash on hand, were used to redeem the June 2018 Unsecured Refinanced Debt at its aggregate redemption price. The January 2027 Unsecured Notes accrue interest at the rate of
8.50%
per year, payable semi-annually in arrears on each of January 31 and July 31.
BHA may redeem all or a portion of the January 2027 Unsecured Notes at any time prior to July 31, 2022, at a price equal to
100%
of the principal amount thereof, plus accrued and unpaid interest, if any, to the date of redemption, plus a “make-whole” premium. In addition, at any time prior to July 31, 2021, BHA may redeem up to
40%
of the aggregate principal amount of the outstanding January 2027 Unsecured Notes with the net proceeds of certain equity offerings at the redemption price set forth in the January 2027 Unsecured Notes indenture. On or after July 31, 2022, BHA may redeem all or a portion of the January 2027 Unsecured Notes at the applicable redemption prices set forth in the January 2027 Unsecured Notes indenture, plus accrued and unpaid interest to the date of redemption.
Remaining Senior Unsecured Notes
In addition to the repurchases and refinancings of Senior Unsecured Notes discussed above, during 2018, we repurchased the remaining outstanding principal amount of $1,625 million of our
July 2021 Unsecured Notes
as follows: (i)
$125 million
on October 26, 2018 using cash on hand, (ii)
$1,483 million
on November 27, 2018 using the net proceeds from the
November 2025 Term Loan B Facility
in a tender offer and (iii)
$17 million
on December 27, 2018 using cash on hand.
The aggregate principal amount and aggregate principal amount net of discounts of our other Senior Unsecured Notes as of December 31,
2018
were
$11,420 million
and
$11,325 million
, respectively, and had limited activity during 2018.
Covenant Compliance
Any inability to comply with the financial maintenance covenant under the terms of our Restated Credit Agreement, Senior Secured Notes indentures or Senior Unsecured Notes indentures could lead to a default or an event of default for which we may need to seek relief from our lenders and noteholders in order to waive the associated default or event of default and avoid a potential acceleration of the related indebtedness or cross-default or cross-acceleration to other debt. There can be no assurance that we would be able to obtain such relief on commercially reasonable terms or otherwise and we may be required to incur significant additional costs. In addition, the lenders under our Restated Credit Agreement, holders of our Senior Secured Notes and holders of our Senior Unsecured Notes may impose additional operating and financial restrictions on us as a condition to granting any such waiver.
During 2017 and 2018, the Company completed several actions which included using cash flows from operations to repay debt and refinancing debt with near term maturities. These actions have reduced the Company’s debt balance and positively affected the Company’s ability to comply with its financial maintenance covenant. As of
December 31, 2018
, the Company was in compliance with the financial maintenance covenant related to its outstanding debt. The Company, based on its current forecast for the next twelve months from the date of issuance of this Form 10-K, expects to remain in compliance with the financial maintenance covenant and meet its debt service obligations over that same period.
The Company continues to take steps to improve its operating results to ensure continual compliance with its financial maintenance covenant and take other actions to reduce its debt levels to align with the Company’s long term strategy. We may consider taking other actions, including divesting other businesses, refinancing debt and issuing equity or equity-linked securities as deemed appropriate, to provide additional coverage in complying with the financial maintenance covenant and meeting its debt service obligations.
The Senior Notes and Secured Notes are guaranteed by a substantial portion of the Company’s subsidiaries. On a non-consolidated basis, the non-guarantor subsidiaries had total assets of $2,954 million and $3,247 million and total liabilities of
83
$1,264 million and $1,367 million as of
December 31, 2018
and
2017
, respectively, and revenues of $1,689 million and $1,657 million and operating income of $174 million and $149 million for
years ended December 31, 2018 and 2017
, respectively.
Credit Ratings
In November 2018, Moody’s upgraded our credit ratings and revised our outlook to Stable from Positive. As of
February 20, 2019
, the credit ratings and outlook from Moody's, Standard & Poor's and Fitch for certain outstanding obligations of the Company were as follows:
|
Rating Agency
|
Corporate Rating
|
Senior Secured Rating
|
Senior Unsecured Rating
|
Outlook
|
||||
|
Moody’s
|
B2
|
Ba2
|
B3
|
Stable
|
||||
|
Standard & Poor’s
|
B
|
BB-
|
B-
|
Stable
|
||||
|
Fitch
|
B-
|
BB-
|
B-
|
Stable
|
||||
Any downgrade in our corporate credit ratings or other credit ratings may increase our cost of borrowing and may negatively impact our ability to raise additional debt capital.
OFF-BALANCE SHEET ARRANGEMENTS AND CONTRACTUAL OBLIGATIONS
We have no off-balance sheet arrangements that have a material current effect or that are reasonably likely to have a material future effect on our results of operations, financial condition, capital expenditures, liquidity, or capital resources.
The following table summarizes our contractual obligations
as of December 31, 2018
for the periods presented:
|
(in millions)
|
Total
|
2019
|
2020 and 2021
|
2022 and 2023
|
Thereafter
|
|||||||||||||||
|
Long-term debt obligations, including interest
|
$
|
33,757
|
|
$
|
1,777
|
|
$
|
4,382
|
|
$
|
10,538
|
|
$
|
17,060
|
|
|||||
|
Operating lease obligations
|
419
|
|
78
|
|
104
|
|
71
|
|
166
|
|
||||||||||
|
Purchase obligations
|
690
|
|
416
|
|
173
|
|
93
|
|
8
|
|
||||||||||
|
Total contractual obligations
|
$
|
34,866
|
|
$
|
2,271
|
|
$
|
4,659
|
|
$
|
10,702
|
|
$
|
17,234
|
|
|||||
Purchase obligations consist of agreements to purchase goods and services that are enforceable and legally binding and include obligations for minimum inventory and capital expenditures, and outsourced information technology, product promotion and clinical research services.
The table of contractual obligations excludes payments for: (i) contingent milestone payments to third parties as part of certain development, collaboration and license agreements and (ii) acquisition-related contingent consideration. See
Note 21, "COMMITMENTS AND CONTINGENCIES"
and
Note 6, "FAIR VALUE MEASUREMENTS"
to our audited Consolidated Financial Statements for further details related to these contingent payments.
The table of contractual obligations excludes payments for uncertain tax positions totaling
$345 million
as of December 31, 2018
because a reliable estimate of the period in which uncertain tax positions will be payable, if ever, cannot be made.
Other Future Cash Requirements
Our other future cash requirements relate to working capital, capital expenditures, business development transactions (contingent consideration), restructuring and integration, benefit obligations and litigation settlements. In addition, we may use cash to enter into licensing arrangements and/or to make strategic acquisitions, although we have made minimal acquisitions since 2015 and expect the volume and size of acquisitions to be low for the foreseeable future.
In addition to our working capital requirements and other amounts presented in the contractual obligations table presented above, we expect our primary cash requirements for 2019 to include:
|
•
|
Debt repayments
-We may, under certain circumstances, elect to make additional principal repayments during 2019. Further, in the ordinary course of business, we may borrow and repay amounts under our Revolving Credit Facility to meet business needs;
|
|
•
|
Capital expenditures
-We expect to make payments of approximately $275 million for property, plant and equipment during 2019, of which there were $44 million in committed amounts as of
December 31, 2018
;
|
84
|
•
|
Contingent consideration payments
-We expect to make contingent consideration and other approval/sales-based milestone payments of $44 million during 2019;
|
|
•
|
Restructuring and integration payments
-We expect to make payments of $19 million during 2019 for employee separation costs and lease termination obligations associated with restructuring and integration actions we have taken through December 31, 2018; and
|
|
•
|
Benefit obligations
-We expect to make payments under our pension and postretirement obligations of
$2 million
,
$7 million
and
$5 million
to the U.S. pension benefit plan, the non-U.S. pension benefit plans and the U.S. postretirement benefit plan, respectively during 2019. See
Note 12, "PENSION AND POSTRETIREMENT EMPLOYEE BENEFIT PLANS"
to our audited interim Consolidated Financial Statements for further details of our benefit obligations.
|
Acquisition Agreement for Synergy Pharmaceuticals Inc.
- As previously discussed, on December 12, 2018, we entered into an agreement to acquire certain assets of Synergy in a transaction valued at approximately
$200 million
plus certain assumed liabilities. Under the terms of the agreement, the Company will serve as the “stalking horse” bidder in a court-supervised auction and sale process pursuant to Section 363 of the Bankruptcy Code, which is expected to be completed in March 2019. Completion of this transaction is subject to other parties having an opportunity to submit competing bids (which may be superior to the Company's), bankruptcy court approval and other customary closing conditions. If the Company's bid is successful, among the assets to be acquired are the worldwide rights to the Trulance
®
(plecanatide) product; a once-daily tablet for adults with chronic idiopathic constipation and irritable bowel syndrome with constipation.
We continue to evaluate opportunities to improve our operating results and may initiate additional cost savings programs to streamline our operations and eliminate redundant processes and expenses. These cost savings programs may include, but are not limited to: (i) reducing headcount, (ii) eliminating real estate costs associated with unused or under-utilized facilities and (iii) implementing contribution margin improvement and other cost reduction initiatives. The expenses associated with the implementation of these cost savings programs could be material and may impact our cash flows.
In the ordinary course of business, the Company is involved in litigation, claims, government inquiries, investigations, charges and proceedings. See
Note 20, "LEGAL PROCEEDINGS"
to our audited Consolidated Financial Statements for further details of these matters. Our ability to successfully defend the Company against pending and future litigation may impact cash flows.
OUTSTANDING SHARE DATA
Our common shares are listed on the TSX and the NYSE under the ticker symbol “BHC”.
At
February 14, 2019
, we had
350,993,877
issued and outstanding common shares. In addition, as of
February 14, 2019
, we had 5,883,077 stock options and 5,053,653 time-based RSUs that each represent the right of a holder to receive one of the Company’s common shares, and 1,464,669 performance-based RSUs that represent the right of a holder to receive a number of the Company's common shares up to a specified maximum. A maximum of 2,862,147 common shares could be issued upon vesting of the performance-based RSUs outstanding.
QUANTITATIVE AND QUALITATIVE DISCLOSURES ABOUT MARKET RISK
Our business and financial results are affected by fluctuations in world financial markets, including the impacts of foreign currency exchange rate and interest rate movements. We evaluate our exposure to such risks on an ongoing basis, and seek ways to manage these risks to an acceptable level, based on management’s judgment of the appropriate trade-off between risk, opportunity and cost. We may use derivative financial instruments from time to time as a risk management tool and not for trading or speculative purposes. Currently, we do not hold any market risk sensitive instruments whose value is subject to market price risk.
Inflation; Seasonality
We are subject to price control restrictions on our pharmaceutical products in a number of countries in which we now operate. As a result, our ability to raise prices in a timely fashion in anticipation of inflation may be limited in some markets.
Historically, revenues from our business tend to be weighted toward the second half of the year. Sales in the first quarter tend to be lower as patient co-pays and deductibles reset at the beginning of each year. Sales in the fourth quarter tend to be higher based on consumer and customer purchasing patterns associated with health care reimbursement programs. However, there are no assurances that these historical trends will continue in the future.
85
Foreign Currency Risk
In
the year ended December 31, 2018
, a majority of our revenue and expense activities and capital expenditures were denominated in U.S. dollars. We have exposure to multiple foreign currencies, including, among others, the Euro, Polish zloty, Chinese yuan, Canadian dollar and Mexican peso. Our operations are subject to risks inherent in conducting business abroad, including price and currency exchange controls and fluctuations in the relative values of currencies. In November 2016, as a result of the Egyptian government’s decision to float the Egyptian pound and un-peg it to the U.S. Dollar, the Egyptian pound was significantly devalued. Our exposure to the Egyptian pound is primarily with respect to Amoun Pharmaceutical Company S.A.E., which we acquired in October 2015, and which represented approximately
2%
of our total 2018 and 2017 revenues. In addition, to the extent that we require, as a source of debt repayment, earnings and cash flows from some of our operations located in foreign countries, we are subject to risk of changes in the value of the U.S. dollar, relative to all other currencies in which we operate, which may materially affect our results of operations. Where possible, we manage foreign currency risk by managing same currency revenues in relation to same currency expenses. Further strengthening of the U.S. dollar and/or further devaluation of foreign currencies will have a negative impact on our reported revenue and reported results.
As of December 31, 2018
, a 1% change in foreign currency exchange rates would have impacted our shareholders’ equity by approximately $31 million.
As of December 31, 2018
, the unrealized foreign exchange loss on the translation of the remaining principal amount of the senior notes was $1,229 million, for Canadian income tax purposes. Additionally, as of December 31, 2018, the unrealized foreign exchange gain on certain intercompany balances was equal to $63 million. One-half of any realized foreign exchange gain or loss will be included in our Canadian taxable income. Any resulting gain will result in a corresponding reduction in our available Canadian Losses, Scientific Research and Experimental Development Pool, and/or Investment Tax Credit carryforward balances. However, the repayment of the senior notes and the intercompany loans denominated in U.S. dollars does not result in a foreign exchange gain or loss being recognized in our Consolidated Financial Statements, as these statements are prepared in U.S. dollars.
Interest Rate Risk
We currently do not hold financial instruments for speculative purposes. Our financial assets are not subject to significant interest rate risk due to their short duration. The primary objective of our policy for the investment of temporary cash surpluses is the protection of principal, and accordingly, we generally invest in high quality, money market investments and time deposits with varying maturities, but typically less than three months. As it is our intent and policy to hold these investments until maturity, we do not have a material exposure to interest rate risk.
As of December 31, 2018
, we had $16,962 million and $5,950 million principal amount of issued fixed rate debt and variable rate debt, respectively, that requires U.S. dollar repayment, as well as €1,500 million principal amount of issued fixed rate debt that requires repayment in Euros. The estimated fair value of our issued fixed rate debt as of
December 31, 2018
, including the foreign currency denominated debt, was $17,712 million. If interest rates were to increase by 100 basis-points, the fair value of our long-term debt would decrease by approximately $810 million. If interest rates were to decrease by 100 basis-points, the fair value of our long-term debt would increase by approximately $797 million. We are subject to interest rate risk on our variable rate debt as changes in interest rates could adversely affect earnings and cash flows. A 100 basis-points increase in interest rates, based on 3-month LIBOR, would have an annualized pre-tax effect of approximately $60 million in our Consolidated Statements of Operations and Consolidated Statements of Cash Flows, based on current outstanding borrowings and effective interest rates on our variable rate debt. While our variable-rate debt may impact earnings and cash flows as interest rates change, it is not subject to changes in fair value.
CRITICAL ACCOUNTING POLICIES AND ESTIMATES
Critical accounting policies and estimates are those policies and estimates that are most important and material to the preparation of our Consolidated Financial Statements, and which require management’s most subjective and complex judgments due to the need to select policies from among alternatives available, and to make estimates about matters that are inherently uncertain. We base our estimates on historical experience and other factors that we believe to be reasonable under the circumstances. On an ongoing basis, we review our estimates to ensure that these estimates appropriately reflect changes in our business and new information as it becomes available. If historical experience and other factors we use to make these estimates do not reasonably reflect future activity, our results of operations and financial condition could be materially impacted.
86
Revenue Recognition
In May 2014, the FASB issued guidance on recognizing revenue from contracts with customers. The core principle of the revenue model is that an entity recognizes revenue to depict the transfer of promised goods or services to customers in an amount that reflects the consideration to which the entity expects to be entitled in exchange for those goods or services. In applying the revenue model to contracts within its scope, an entity will: (i) identify the contract(s) with a customer, (ii) identify the performance obligations in the contract, (iii) determine the transaction price, (iv) allocate the transaction price to the performance obligations in the contract and (v) recognize revenue when (or as) the entity satisfies a performance obligation. In addition to these provisions, the new standard provides implementation guidance on several other topics, including the accounting for certain revenue-related costs, as well as enhanced disclosure requirements. The new guidance requires entities to disclose both quantitative and qualitative information that enables users of financial statements to understand the nature, amount, timing and uncertainty of revenue and cash flows arising from contracts with customers.
The Company adopted this guidance effective January 1, 2018 using the modified retrospective approach, and therefore, revenue reported for the years 2017 and 2016 have not been restated. Based upon review of customer contracts, the Company concluded the implementation of the new guidance did not have a material quantitative impact on its 2018 Consolidated Financial Statements as the timing of revenue recognition for product sales did not significantly change. The new guidance did however result in additional disclosures as to the nature, amounts, and concentrations of revenue.
Product Sales Provisions
The following table presents the activity and ending balances for our product sales provisions for each of the last three years.
|
(in millions)
|
Discounts
and
Allowances
|
Returns
|
Rebates
|
Chargebacks
|
Distribution
Fees
|
Total
|
||||||||||||||||||
|
Reserve balance, January 1, 2016
|
$
|
103
|
|
$
|
627
|
|
$
|
902
|
|
$
|
271
|
|
$
|
112
|
|
$
|
2,015
|
|
||||||
|
Current year provision
|
789
|
|
460
|
|
2,521
|
|
2,318
|
|
423
|
|
6,511
|
|
||||||||||||
|
Payments or credits
|
(768
|
)
|
(379
|
)
|
(2,526
|
)
|
(2,316
|
)
|
(338
|
)
|
(6,327
|
)
|
||||||||||||
|
Reserve balance, December 31, 2016
|
124
|
|
708
|
|
897
|
|
273
|
|
197
|
|
2,199
|
|
||||||||||||
|
Current year provision
|
829
|
|
423
|
|
2,545
|
|
2,145
|
|
288
|
|
6,230
|
|
||||||||||||
|
Payments or credits
|
(786
|
)
|
(268
|
)
|
(2,348
|
)
|
(2,144
|
)
|
(337
|
)
|
(5,883
|
)
|
||||||||||||
|
Reserve balance, December 31, 2017
|
167
|
|
863
|
|
1,094
|
|
274
|
|
148
|
|
2,546
|
|
||||||||||||
|
Current year provision
|
865
|
|
293
|
|
2,551
|
|
1,966
|
|
212
|
|
5,887
|
|
||||||||||||
|
Payments or credits
|
(857
|
)
|
(343
|
)
|
(2,621
|
)
|
(2,031
|
)
|
(197
|
)
|
(6,049
|
)
|
||||||||||||
|
Reserve balance, December 31, 2018
|
$
|
175
|
|
$
|
813
|
|
$
|
1,024
|
|
$
|
209
|
|
$
|
163
|
|
$
|
2,384
|
|
||||||
Included in Rebates in the table above are cooperative advertising credits due to customers of approximately
$26 million
as of
December 31, 2018
, which are reflected as a reduction of Trade accounts receivable, net in the Consolidated Balance Sheets.
The development and application of the critical accounting policies associated with the new revenue recognition guidance, including the policies associated with each of the above product sales provisions, are discussed in more detail in
Note 2, "SIGNIFICANT ACCOUNTING POLICIES"
.
Other Revenues
We generate alliance revenue and service revenue from the licensing of products and from contract services mainly in the areas of dermatology and topical medication. Contract service revenue is derived primarily from contract manufacturing for third parties.
Acquisitions
We have completed several acquisitions of companies, as well as acquisitions of certain assets of companies. To determine whether such acquisitions qualify as business combinations or asset acquisitions, we make certain judgments, which include assessment of the inputs, processes and outputs associated with the acquired set of activities. If we determine that the acquisition consists of inputs, as well as processes that when applied to those inputs have the ability to create outputs, the acquisition is determined to be a business combination. In instances where the acquired set of activities does not include all of the inputs and processes used by the seller in operating the business, we make judgments as to whether market participants would be capable of
87
acquiring the business and continuing to produce outputs, for example, by integrating the business with their own inputs and processes. If we conclude that market participants would have this capability, the acquisition is determined to be a business combination.
In a business combination, we account for acquired businesses using the acquisition method of accounting, which requires that assets acquired and liabilities assumed be recorded at fair value, with limited exceptions. The judgments made in determining the estimated fair value assigned to each class of asset acquired and liability assumed can materially impact our results of operations. As part of our valuation procedures, we typically consult an independent advisor. There are several methods that can be used to determine fair value. For intangible assets, we typically use an excess earnings or relief from royalty method. The excess earnings method starts with a forecast of the net cash flows expected to be generated by the asset over its estimated useful life. These cash flows are then adjusted to present value by applying an appropriate discount rate that reflects the risk factors associated with the cash flow streams. Some of the more significant estimates and assumptions inherent in the excess earnings method include:
|
•
|
the amount and timing of projected future cash flows, adjusted for the probability of technical success of products in the IPR&D stage;
|
|
•
|
the amount and timing of projected costs to develop IPR&D into commercially viable products;
|
|
•
|
the discount rate selected to measure the risks inherent in the future cash flows; and
|
|
•
|
an assessment of the asset’s life-cycle and the competitive trends impacting the asset, including consideration of any technical, legal, regulatory, or economic barriers to entry.
|
The relief from royalty method involves estimating the amount of notional royalty income that could be generated if the intangible asset was licensed to a third party. The fair value of the intangible asset is the net present value of the prospective stream of the notional royalty income that would be generated over the expected useful life of the intangible asset. Values derived using the relief from royalty method are based on royalty rates observed for comparable intangible assets.
We believe the fair values assigned to the assets acquired and liabilities assumed are based on reasonable assumptions. However, these assumptions may be incomplete or inaccurate, and unanticipated events and circumstances may occur. Any changes resulting from facts and circumstances that existed as of the acquisition dates may result in adjustments to the provisional amounts recognized at the acquisition dates. These changes could be significant. We finalize these amounts no later than one year from the respective acquisition dates.
Determining the useful life of an intangible asset also requires judgment, as different types of intangible assets will have different useful lives and certain assets may even be considered to have indefinite useful lives. Useful life is the period over which the intangible asset is expected to contribute directly or indirectly to our future cash flows. We determine the useful lives of intangible assets based on a number of factors, such as legal, regulatory, or contractual provisions that may limit the useful life, and the effects of obsolescence, anticipated demand, existence or absence of competition and other economic factors. We determined that the B&L corporate trademark has an indefinite useful life as there are no legal, regulatory, contractual, competitive, economic, or other factors that limit the useful life of this intangible asset.
Acquisition-Related Contingent Consideration
Some of the business combinations that we have consummated include contingent consideration to be potentially paid based upon the occurrence of future events, such as sales performance and the achievement of certain future development, regulatory and sales milestones. Acquisition-related contingent consideration associated with a business combination is initially recognized at fair value and remeasured each reporting period, with changes in fair value recorded in the Consolidated Statements of Operations. The estimates of fair value involve the use of acceptable valuation methods, such as probability-weighted discounted cash flow analysis and Monte Carlo Simulation, and contain uncertainties as they require assumptions about the likelihood of achieving specified milestone criteria, projections of future financial performance and assumed discount rates. Changes in the fair value of the acquisition-related contingent consideration result from several factors including changes in the timing and amount of revenue estimates, changes in probability assumptions with respect to the likelihood of achieving specified milestone criteria and changes in discount rates. A change in any of these assumptions could produce a different fair value, which could have a material impact on our results of operations. At
December 31, 2018
, the fair value measurements of acquisition-related contingent consideration were determined using risk-adjusted discount rates ranging from
5%
to
25%
.
88
Intangible Assets
We evaluate potential impairments of amortizable intangible assets acquired through asset acquisitions or business combinations if events or changes in circumstances indicate that the carrying amounts of these assets may not be recoverable. Our evaluation is based on an assessment of potential indicators of impairment, such as:
|
•
|
an adverse change in legal factors or in the business climate that could affect the value of an asset. For example, a successful challenge of our patent rights resulting in earlier than expected generic competition;
|
|
•
|
an adverse change in the extent or manner in which an asset is used or is expected to be used. For example, a decision not to pursue a product line-extension strategy to enhance an existing product due to changes in market conditions and/or technological advances; or
|
|
•
|
current or forecasted reductions in revenue, operating income, or cash flows associated with the use of an asset. For example, the introduction of a competing product that results in a significant loss of market share.
|
Impairment exists when the carrying value of the asset exceeds the related estimated undiscounted future cash flows expected to be derived from the asset. If impairment exists, the carrying value of the asset is adjusted to its fair value. A discounted cash flow analysis is typically used to determine an asset's fair value, using estimates and assumptions that market participants would apply. Some of the estimates and assumptions inherent in a discounted cash flow model include the amount and timing of the projected future cash flows, and the discount rate used to reflect the risks inherent in the future cash flows. A change in any of these estimates and assumptions could produce a different fair value, which could have a material impact on our results of operations. In addition, an intangible asset’s expected useful life can increase estimation risk, as longer-lived assets necessarily require longer-term cash flow forecasts, which for some of our intangible assets can be up to 20 years. In connection with an impairment evaluation, we also reassess the remaining useful life of the intangible asset and modify it, as appropriate.
Management continually assesses the useful lives of the Company's long-lived assets. In 2017 and 2018, management revised the estimated useful lives of certain intangible assets in connection with market events and changes in assumptions. In 2017, the useful lives of certain product brands, with an aggregate carrying value of
$7,618 million
as of December 31, 2017, were revised to take into consideration, among other factors, various scenarios related to the date each product is anticipated to lose its exclusivity and the resulting potential changes in the forecasted sales. In addition, the useful life of the Salix Brand, with a carrying value of
$569 million
as of December 31, 2017, was revised from seventeen years to ten years to reflect a number of possible scenarios related to forecasted sales of its product portfolio.
Effective September 12, 2018, the Company changed the estimated useful life of its Xifaxan
®
-related intangible assets due to the positive impact of the agreement between the Company and Actavis resolving the intellectual property litigation regarding Xifaxan
®
tablets, 550 mg. As discussed in further detail in
Note 20, "LEGAL PROCEEDINGS"
, the parties have agreed to dismiss all litigation related to Xifaxan
®
tablets, 550 mg and all intellectual property protecting Xifaxan
®
will remain intact and enforceable. As a result, the useful life of the Xifaxan
®
related intangible assets was extended from 2024 to January 1, 2028. This change in the estimated useful life is considered a change in accounting estimate and will result in changes to the Company's amortization expense prospectively. As of December 31, 2018, the net carrying value of the Xifaxan
®
related intangible assets was
$4,848 million
.
Indefinite-lived intangible assets, including IPR&D and the B&L corporate trademark, are tested for impairment annually, or more frequently if events or changes in circumstances between annual tests indicate that the asset may be impaired. Impairment losses on indefinite-lived intangible assets are recognized based solely on a comparison of their fair value to carrying value, without consideration of any recoverability test. In particular, we will continue to monitor closely the progression of our R&D programs as their likelihood of success is contingent upon the achievement of future milestones. See Item 7 “Management’s Discussion and Analysis of Financial Condition and Results of Operations — Overview — Key Initiatives — Internal Capital Allocation and Operating Efficiencies” for additional information regarding our R&D programs.
Goodwill
Goodwill is not amortized but is tested for impairment at least annually as of October 1st at the reporting unit level. A reporting unit is the same as, or one level below, an operating segment. The fair value of a reporting unit refers to the price that would be received to sell the unit as a whole in an orderly transaction between market participants. The Company estimates the fair values of all reporting units using a discounted cash flow model which utilizes Level 3 unobservable inputs.
The discounted cash flow method relies on assumptions regarding revenue growth rates, gross profit, projected working capital requirements, selling, general and administrative expenses, research and development expenses, business restructuring
89
costs, capital expenditures, income tax rates, discount rates and terminal growth rates. To estimate fair value, the Company discounts the forecasted cash flows of each reporting unit. The discount rate the Company uses represents the estimated weighted average cost of capital, which reflects the overall level of inherent risk involved in its reporting unit operations and the rate of return a market participant would expect to earn. To estimate cash flows beyond the final year of its model, the Company estimates a terminal value by applying an in perpetuity growth assumption and discount factor to determine the reporting unit's terminal value. The Company incorporates the present value of the resulting terminal value into its estimate of fair value.
The Company forecasted cash flows for each of its reporting units and took into consideration economic conditions and trends, estimated future operating results, management's and a market participant's view of growth rates and product lives, and anticipated future economic conditions. Revenue growth rates inherent in these forecasts were based on input from internal and external market research that compare factors such as growth in global economies, recent industry trends and product life-cycles. Macroeconomic factors such as changes in economies, changes in the competitive landscape including the unexpected loss of exclusivity to the Company's product portfolio, changes in government legislation, product life-cycles, industry consolidations and other changes beyond the Company’s control could have a positive or negative impact on achieving its targets. Accordingly, if market conditions deteriorate, or if the Company is unable to execute its strategies, it may be necessary to record impairment charges in the future.
In January 2017, the FASB issued guidance which simplifies the subsequent measurement of goodwill by eliminating “Step 2” from the goodwill impairment test. Instead, goodwill impairment is measured as the amount by which a reporting unit's carrying value exceeds its fair value. The FASB also eliminated the requirements for any reporting unit with a zero or negative carrying amount to perform a qualitative assessment. The guidance is effective for annual periods beginning after December 15, 2019, and interim periods within those annual periods, with early adoption permitted. The Company elected to early adopt this guidance effective January 1, 2018.
Upon adopting the new guidance, the Company tested goodwill for impairment and determined that the carrying value of the Salix reporting unit exceeded its fair value. As a result of the adoption of new accounting guidance, the Company recognized a goodwill impairment of $1,970 million associated with the Salix reporting unit.
2018 Annual Goodwill Impairment Test
The Company conducted its annual goodwill impairment test as of October 1, 2018 and determined that the carrying value of the Dentistry reporting unit exceeded its fair value and, as a result, the Company recognized a goodwill impairment of
$109 million
for the Dentistry reporting unit, representing the full amount of goodwill for the reporting unit. Changing market conditions such as: (i) an increasing competitive environment and (ii) increasing pricing pressures negatively impacted the reporting unit's operating results. The Company is taking steps to address these changing market and business conditions.
The Company's remaining reporting units passed the goodwill impairment test as the estimated fair value of each reporting unit exceeded its carrying value at the date of testing and, therefore, there was
no
impairment to goodwill for any reporting unit other than the Dentistry reporting unit. In order to evaluate the sensitivity of its fair value calculations on the goodwill impairment test, the Company compared the carrying value of each reporting unit to its fair value as of October 1, 2018, the date of testing. As of October 1, 2018, the fair value of each reporting unit with associated goodwill exceeded its carrying value by more than
15%
. If market conditions deteriorate, or if the Company is unable to execute its strategies, it may be necessary to record impairment charges in the future. The Company will continue to perform qualitative interim assessments of the carrying value and fair value of the Ortho Dermatologics reporting unit on a quarterly basis to determine if impairment testing of goodwill will be warranted.
As previously discussed the Company estimated the fair value of each reporting unit using an income approach which values the unit based on the future cash flows expected from that reporting unit. Future cash flows are based on forward-looking information regarding market share and costs for each reporting unit and are discounted using an appropriate discount rate. Future discounted cash flows can be affected by changes in industry or market conditions or the rate and extent to which anticipated synergies or cost savings are realized with newly acquired entities. The Company performed its annual impairment test as of October 1, 2018, utilizing long-term growth rates for its reporting units ranging from
1.0%
to
3.0%
and discount rates applied to the estimated cash flows ranging from
7.5%
to
14.0%
in estimation of fair value. To estimate cash flows beyond the final year of its model, the Company estimates a terminal value by applying an in perpetuity growth assumption and discount factor to determine the reporting unit's terminal value.
See
Note 9, "INTANGIBLE ASSETS AND GOODWILL"
to our audited Consolidated Financial Statements for further details on the goodwill impairments recognized in 2018 and 2017.
90
Contingencies
In the normal course of business, we are subject to loss contingencies, such as claims and assessments arising from litigation and other legal proceedings, contractual indemnities, product and environmental liabilities and tax matters. Other than loss contingencies that are assumed in business combinations for which we can reliably estimate the fair value, we are required to accrue for such loss contingencies if it is probable that the outcome will be unfavorable and if the amount of the loss can be reasonably estimated. We evaluate our exposure to loss based on the progress of each contingency, experience in similar contingencies and consultation with our legal counsel. We re-evaluate all contingencies as additional information becomes available. Given the uncertainties inherent in complex litigation and other contingencies, these evaluations can involve significant judgment about future events. The ultimate outcome of any litigation or other contingency may be material to our results of operations, financial condition and cash flows. See
Note 20, "LEGAL PROCEEDINGS"
to our audited Consolidated Financial Statements for further details regarding our current legal proceedings.
Income Taxes
We have operations in various countries that have differing tax laws and rates. Our tax structure is supported by current domestic tax laws in the countries in which we operate and the application of tax treaties between the various countries in which we operate. Our income tax reporting is subject to audit by domestic and foreign tax authorities. Our effective tax rate may change from year to year based on changes in the mix of activities and income earned under our intercompany arrangements among the different jurisdictions in which we operate, changes in tax laws in these jurisdictions, changes in tax treaties between various countries in which we operate, changes in our eligibility for benefits under those tax treaties and changes in the estimated values of deferred tax assets and liabilities. Such changes could result in an increase in the effective tax rate on all or a portion of our income and/or any of our subsidiaries.
Our provision for income taxes is based on a number of estimates and assumptions made by management. Our consolidated income tax rate is affected by the amount of income earned in our various operating jurisdictions, the availability of benefits under tax treaties and the rates of taxes payable in respect of that income. We enter into many transactions and arrangements in the ordinary course of business in which the tax treatment is not entirely certain. We must therefore make estimates and judgments based on our knowledge and understanding of applicable tax laws and tax treaties, and the application of those tax laws and tax treaties to our business, in determining our consolidated tax provision. For example, certain countries could seek to tax a greater share of income than has been provided for by us. The final outcome of any audits by taxation authorities may differ from the estimates and assumptions we have used in determining our consolidated income tax provisions and accruals. This could result in a material effect on our consolidated income tax provision, results of operations, and financial condition for the period in which such determinations are made.
Our income tax returns are subject to audit in various jurisdictions. Existing and future audits by, or other disputes with, tax authorities may not be resolved favorably for us and could have a material adverse effect on our reported effective tax rate and after-tax cash flows. We record liabilities for uncertain tax positions, which involve significant management judgment. New laws and new interpretations of laws and rulings by tax authorities may affect the liability for uncertain tax positions. Due to the subjectivity and complex nature of the underlying issues, actual payments or assessments may differ from our estimates. To the extent that our estimates differ from amounts eventually assessed and paid our income and cash flows may be materially and adversely affected.
We assess whether it is more likely than not that we will realize the tax benefits associated with our deferred tax assets and establish a valuation allowance for assets that are not expected to result in a realized tax benefit. A significant amount of judgment is used in this process, including preparation of forecasts of future taxable income and evaluation of tax planning initiatives. If we revise these forecasts or determine that certain planning events will not occur, an adjustment to the valuation allowance will be made to tax expense in the period such determination is made.
For the year ended December 31, 2017, the Company provided for income taxes, including the impacts of the Tax Act, in accordance with the accounting guidance issued through the date of issuance of its audited Consolidated Financial Statements. In accordance with that accounting guidance, the Company had provisionally provided for the income tax effects of the Tax Act as of December 31, 2017. The Company’s Benefit from income taxes for the year 2017 included provisional net tax benefits of
$975 million attributable to the Tax Act for: (i) the re-measurement of certain deferred tax assets and liabilities based on the rates at which they are expected to reverse in the future of $774 million, (ii) the one-time Transition Toll Tax of $88 million and (iii) the decrease in deferred tax assets attributable to certain legal accruals, the deductibility of which is uncertain for U.S. federal income tax purposes, of $10 million. We provisionally utilized NOLs to offset the provisionally determined $88 million Transition Toll Tax and therefore no amount was recorded as payable. The Company has previously provided for residual U.S. federal income tax on its outside basis differences in certain foreign subsidiaries which, due to the Tax Act, are no longer taxable. As such, our
91
residual U.S. federal income tax liability of $299 million prior to the law change was reversed and we recognized a deferred tax benefit of $299 million in the fourth quarter of 2017.
The provisional amounts included in the Company's Benefit from income taxes for the year 2017, including the Transition Toll Tax, were finalized during the three months ended December 31, 2018. In finalizing the Benefit from income taxes for the year 2017, the Company considered the guidance issued by accounting regulatory bodies, the U.S. Internal Revenue Service, state and local governments, and the proposed regulations regarding the one-time Transition Toll Tax on the pre-2018 earnings of certain non-U.S. subsidiaries issued by the U.S. Treasury Department on August 1, 2018. As part of its full assessment, the Company also assessed the impact of the Tax Act on the Company’s tax filings for the year 2017. Differences between the provisional net income tax benefits provided in 2017 attributable to the Tax Act of
$975 million
, as previously disclosed, and the benefit for income taxes as finalized are included in the Benefit from income taxes for the year ended December 31, 2018 and were not material to the Company’s financial results for the year ended December 31, 2018. Although the Company has completed its full assessment and finalized its accounting for the impact of the Tax Act, the Company will monitor guidance issued in the future and assess the impact, if any, on the amounts provided.
Share-Based Compensation
We recognize employee share-based compensation, including grants of stock options and RSUs, at estimated fair value. As there is no market for trading our employee stock options, we use the Black-Scholes option-pricing model to calculate stock option fair values, which requires certain assumptions related to the expected life of the stock option, future stock price volatility, risk-free interest rate and dividend yield. The expected life of the stock option is based on historical exercise and forfeiture patterns. The expected volatility of our common stock is estimated by using implied volatility in market traded options. The risk-free interest rate is based on the rate at the time of grant for U.S. Treasury bonds with a remaining term equal to the expected life of the stock option. Dividend yield is based on the stock option’s exercise price and expected annual dividend rate at the time of grant. Changes to any of these assumptions, or the use of a different option-pricing model, such as the lattice model, could produce a different fair value for share-based compensation expense, which could have a material impact on our results of operations.
We determine the fair value of each RSU granted based on the trading price of our common shares on the date of grant, unless the vesting of the RSU is conditional on the attainment of any applicable performance goals based on total shareholder return, in which case we use a Monte Carlo simulation model. The Monte Carlo simulation model utilizes multiple input variables to estimate the probability that the performance condition will be achieved. Changes to any of these inputs could materially affect the measurement of the fair value of the performance-based RSUs.
We also have performance-based RSUs that vest upon attainment of certain performance targets. We recognize the expense associated with these performance-based RSUs based on the number of RSUs we expect to vest, which is estimated by comparing our latest forecast to the applicable performance targets. If RSUs do not vest as a result of a determination that the prescribed performance goals failed to be attained, then no expense would be recognized and any expense previously recognized for the RSUs would be reversed upon such determination.
NEW ACCOUNTING STANDARDS
Information regarding the recently issued new accounting guidance (adopted and not adopted
as of December 31, 2018
) is contained in
Note 2, "SIGNIFICANT ACCOUNTING POLICIES"
to our audited Consolidated Financial Statements.
FORWARD-LOOKING STATEMENTS
Caution regarding forward-looking information and statements and “Safe-Harbor” statements under the U.S. Private Securities Litigation Reform Act of 1995 and applicable Canadian securities laws:
To the extent any statements made in this Form 10-K contain information that is not historical, these statements are forward-looking statements within the meaning of Section 27A of the Securities Act of 1933, as amended, and Section 21E of the Securities Exchange Act of 1934, as amended, and may be forward-looking information within the meaning defined under applicable Canadian securities laws (collectively, “forward-looking statements”).
These forward-looking statements relate to, among other things: our business strategy, business plans and prospects and forecasts and changes thereto; product pipeline, prospective products and product approvals, product development and future performance and results of current and anticipated products; anticipated revenues for our products, including the Significant Seven; anticipated growth in our Ortho Dermatologics business; expected R&D and marketing spend, including in connection with the promotion of the Significant Seven; our expected primary cash and working capital requirements for 2019 and beyond; the
92
Company's plans for continued improvement in operational efficiency and the anticipated impact of such plans; our liquidity and our ability to satisfy our debt maturities as they become due; our ability to reduce debt levels; the impact of our distribution, fulfillment and other third-party arrangements; proposed pricing actions; exposure to foreign currency exchange rate changes and interest rate changes; the outcome of contingencies, such as litigation, subpoenas, investigations, reviews, audits and regulatory proceedings; the anticipated impact of the adoption of new accounting standards; general market conditions; our expectations regarding our financial performance, including revenues, expenses, gross margins and income taxes; our ability to meet the financial and other covenants contained in our Fourth Amended and Restated Credit and Guaranty Agreement (the "Restated Credit Agreement"), and indentures; and our impairment assessments, including the assumptions used therein and the results thereof.
Forward-looking statements can generally be identified by the use of words such as “believe”, “anticipate”, “expect”, “intend”, “estimate”, “plan”, “continue”, “will”, “may”, “could”, “would”, “should”, “target”, “potential”, “opportunity”, “designed”, “create”, “predict”, “project”, “forecast”, “seek”, “ongoing” or “increase” and variations or other similar expressions. In addition, any statements that refer to expectations, intentions, projections or other characterizations of future events or circumstances are forward-looking statements. These forward-looking statements may not be appropriate for other purposes. Although we have previously indicated certain of these statements set out herein, all of the statements in this Form 10-K that contain forward-looking statements are qualified by these cautionary statements. These statements are based upon the current expectations and beliefs of management. Although we believe that the expectations reflected in such forward-looking statements are reasonable, such statements involve risks and uncertainties, and undue reliance should not be placed on such statements. Certain material factors or assumptions are applied in making such forward-looking statements, including, but not limited to, factors and assumptions regarding the items previously outlined, those factors, risks and uncertainties outlined below and the assumption that none of these factors, risks and uncertainties will cause actual results or events to differ materially from those described in such forward-looking statements. Actual results may differ materially from those expressed or implied in such statements. Important factors, risks and uncertainties that could cause actual results to differ materially from these expectations include, among other things, the following:
|
•
|
the expense, timing and outcome of legal and governmental proceedings, investigations and information requests relating to, among other matters, our past distribution, marketing, pricing, disclosure and accounting practices (including with respect to our former relationship with Philidor Rx Services, LLC ("Philidor")), including pending investigations by the U.S. Attorney's Office for the District of Massachusetts and the U.S. Attorney's Office for the Southern District of New York, the pending investigations by the U.S. Securities and Exchange Commission (the “SEC”) of the Company, the investigation order issued by the Company from the Autorité des marchés financiers (the “AMF”) (the Company’s principal securities regulator in Canada), a number of pending putative securities class action litigations in the U.S. (including related opt-out actions) and Canada (including related opt-out actions) and purported class actions under the federal RICO statute and other claims, investigations or proceedings that may be initiated or that may be asserted;
|
|
•
|
potential additional litigation and regulatory investigations (and any costs, expenses, use of resources, diversion of management time and efforts, liability and damages that may result therefrom), negative publicity and reputational harm on our Company, products and business that may result from the past and ongoing public scrutiny of our past distribution, marketing, pricing, disclosure and accounting practices and from our former relationship with Philidor;
|
|
•
|
the past and ongoing scrutiny of our legacy business practices, including with respect to pricing (including the investigations by the U.S. Attorney's Offices for the District of Massachusetts and the Southern District of New York), and any pricing controls or price adjustments that may be sought or imposed on our products as a result thereof;
|
|
•
|
pricing decisions that we have implemented, or may in the future elect to implement, whether as a result of recent scrutiny or otherwise, such as the Patient Access and Pricing Committee’s commitment that the average annual price increase for our branded prescription pharmaceutical products will be set at no greater than single digits, or any future pricing actions we may take following review by our Patient Access and Pricing Committee (which is responsible for the pricing of our drugs);
|
|
•
|
legislative or policy efforts, including those that may be introduced and passed by the U.S. Congress, designed to reduce patient out-of-pocket costs for medicines, which could result in new mandatory rebates and discounts or other pricing restrictions, controls or regulations (including mandatory price reductions);
|
|
•
|
ongoing oversight and review of our products and facilities by regulatory and governmental agencies, including periodic audits by the U.S. Food and Drug Administration (the “FDA”) and the results thereof;
|
|
•
|
actions by the FDA or other regulatory authorities with respect to our products or facilities;
|
93
|
•
|
our substantial debt (and potential additional future indebtedness) and current and future debt service obligations, our ability to reduce our outstanding debt levels and the resulting impact on our financial condition, cash flows and results of operations;
|
|
•
|
our ability to meet the financial and other covenants contained in our Restated Credit Agreement, indentures and other current or future debt agreements and the limitations, restrictions and prohibitions such covenants impose or may impose on the way we conduct our business, including prohibitions on incurring additional debt if certain financial covenants are not met, limitations on the amount of additional debt we are able to incur where not prohibited, and restrictions on our ability to make certain investments and other restricted payments;
|
|
•
|
any default under the terms of our senior notes indentures or Restated Credit Agreement and our ability, if any, to cure or obtain waivers of such default;
|
|
•
|
any delay in the filing of any future financial statements or other filings and any default under the terms of our senior notes indentures or Restated Credit Agreement as a result of such delays;
|
|
•
|
any downgrade by rating agencies in our credit ratings, which may impact, among other things, our ability to raise debt and the cost of capital for additional debt issuances;
|
|
•
|
any reductions in, or changes in the assumptions used in, our forecasts for 2019 or beyond, which could lead to, among other things: (i) a failure to meet the financial and/or other covenants contained in our Restated Credit Agreement and/or indentures and/or (ii) impairment in the goodwill associated with certain of our reporting units or impairment charges related to certain of our products or other intangible assets, which impairments could be material;
|
|
•
|
changes in the assumptions used in connection with our impairment analyses or assessments, which would lead to a change in such impairment analyses and assessments and which could result in an impairment in the goodwill associated with any of our reporting units or impairment charges related to certain of our products or other intangible assets;
|
|
•
|
any additional divestitures of our assets or businesses and our ability to successfully complete any such divestitures on commercially reasonable terms and on a timely basis, or at all, and the impact of any such divestitures on our Company, including the reduction in the size or scope of our business or market share, loss of revenue, any loss on sale, including any resultant write-downs of goodwill, or any adverse tax consequences suffered as a result of any such divestitures;
|
|
•
|
the uncertainties associated with the acquisition and launch of new products, including, but not limited to, our ability to provide the time, resources, expertise and costs required for the commercial launch of new products, the acceptance and demand for new pharmaceutical products, and the impact of competitive products and pricing, which could lead to material impairment charges;
|
|
•
|
our ability to retain, motivate and recruit executives and other key employees;
|
|
•
|
our ability to implement effective succession planning for our executives and key employees;
|
|
•
|
factors impacting our ability to achieve anticipated growth in our Ortho Dermatologics business, including the approval of pending and pipeline products (and the timing of such approvals), expected geographic expansion, changes in estimates on market potential for dermatology products and continued investment in and success of our sales force;
|
|
•
|
factors impacting our ability to achieve anticipated revenues for our Significant Seven products, including the approval of pending products in the Significant Seven (and the timing of such approvals), changes in anticipated marketing spend on such products and launch of competing products;
|
|
•
|
the challenges and difficulties associated with managing a large complex business, which has, in the past, grown rapidly;
|
|
•
|
our ability to compete against companies that are larger and have greater financial, technical and human resources than we do, as well as other competitive factors, such as technological advances achieved, patents obtained and new products introduced by our competitors;
|
|
•
|
our ability to effectively operate, stabilize and grow our businesses in light of the challenges that the Company currently faces, including with respect to its substantial debt, pending investigations and legal proceedings, scrutiny of our past pricing, distribution and other practices, reputational harm and limitations on the way we conduct business imposed by the covenants in our Restated Credit Agreement, indentures and the agreements governing our other indebtedness;
|
94
|
•
|
the extent to which our products are reimbursed by government authorities, pharmacy benefit managers ("PBMs") and other third-party payors; the impact our distribution, pricing and other practices (including as it relates to our current relationship with Walgreen Co. ("Walgreens")) may have on the decisions of such government authorities, PBMs and other third-party payors to reimburse our products; and the impact of obtaining or maintaining such reimbursement on the price and sales of our products;
|
|
•
|
the inclusion of our products on formularies or our ability to achieve favorable formulary status, as well as the impact on the price and sales of our products in connection therewith;
|
|
•
|
our eligibility for benefits under tax treaties and the continued availability of low effective tax rates for the business profits of certain of our subsidiaries;
|
|
•
|
the actions of our third-party partners or service providers of research, development, manufacturing, marketing, distribution or other services, including their compliance with applicable laws and contracts, which actions may be beyond our control or influence, and the impact of such actions on our Company, including the impact to the Company of our former relationship with Philidor and any alleged legal or contractual non-compliance by Philidor;
|
|
•
|
the risks associated with the international scope of our operations, including our presence in emerging markets and the challenges we face when entering and operating in new and different geographic markets (including the challenges created by new and different regulatory regimes in such countries and the need to comply with applicable anti-bribery and economic sanctions laws and regulations);
|
|
•
|
adverse global economic conditions and credit markets and foreign currency exchange uncertainty and volatility in certain of the countries in which we do business;
|
|
•
|
the impact of the recently signed United States-Mexico-Canada Agreement (“USMCA”) and any potential changes to other trade agreements;
|
|
•
|
the final outcome and impact of Brexit negotiations;
|
|
•
|
the potentially escalating trade conflict between the United States and China;
|
|
•
|
our ability to obtain, maintain and license sufficient intellectual property rights over our products and enforce and defend against challenges to such intellectual property;
|
|
•
|
the introduction of generic, biosimilar or other competitors of our branded products and other products, including the introduction of products that compete against our products that do not have patent or data exclusivity rights;
|
|
•
|
our ability to identify, finance, acquire, close and integrate acquisition targets successfully and on a timely basis and the difficulties, challenges, time and resources associated with the integration of acquired companies, businesses and products;
|
|
•
|
the expense, timing and outcome of pending or future legal and governmental proceedings, arbitrations, investigations, subpoenas, tax and other regulatory audits, reviews and regulatory proceedings against us or relating to us and settlements thereof;
|
|
•
|
our ability to negotiate the terms of or obtain court approval for the settlement of certain legal and regulatory proceedings;
|
|
•
|
our ability to obtain components, raw materials or finished products supplied by third parties (some of which may be single-sourced) and other manufacturing and related supply difficulties, interruptions and delays;
|
|
•
|
the disruption of delivery of our products and the routine flow of manufactured goods;
|
|
•
|
economic factors over which the Company has no control, including changes in inflation, interest rates, foreign currency rates, and the potential effect of such factors on revenues, expenses and resulting margins;
|
|
•
|
interest rate risks associated with our floating rate debt borrowings;
|
|
•
|
our ability to effectively distribute our products and the effectiveness and success of our distribution arrangements, including the impact of our arrangements with Walgreens;
|
|
•
|
our ability to effectively promote our own products and those of our co-promotion partners, such as Doptelet
®
(Dova Pharmaceuticals, Inc.) and Lucemyra
TM
(US WorldMeds, LLC);
|
95
|
•
|
the success of our fulfillment arrangements with Walgreens, including market acceptance of, or market reaction to, such arrangements (including by customers, doctors, patients, PBMs, third-party payors and governmental agencies), the continued compliance of such arrangements with applicable laws, and our ability to successfully negotiate any improvements to our arrangements with Walgreens;
|
|
•
|
our ability to secure and maintain third-party research, development, manufacturing, licensing, marketing or distribution arrangements;
|
|
•
|
the risk that our products could cause, or be alleged to cause, personal injury and adverse effects, leading to potential lawsuits, product liability claims and damages and/or recalls or withdrawals of products from the market;
|
|
•
|
the mandatory or voluntary recall or withdrawal of our products from the market and the costs associated therewith;
|
|
•
|
the availability of, and our ability to obtain and maintain, adequate insurance coverage and/or our ability to cover or insure against the total amount of the claims and liabilities we face, whether through third-party insurance or self-insurance;
|
|
•
|
the difficulty in predicting the expense, timing and outcome within our legal and regulatory environment, including with respect to approvals by the FDA, Health Canada and similar agencies in other countries, legal and regulatory proceedings and settlements thereof, the protection afforded by our patents and other intellectual and proprietary property, successful generic challenges to our products and infringement or alleged infringement of the intellectual property of others;
|
|
•
|
the results of continuing safety and efficacy studies by industry and government agencies;
|
|
•
|
the success of preclinical and clinical trials for our drug development pipeline or delays in clinical trials that adversely impact the timely commercialization of our pipeline products, as well as other factors impacting the commercial success of our products, which could lead to material impairment charges;
|
|
•
|
the results of management reviews of our research and development portfolio (including following the receipt of clinical results or feedback from the FDA or other regulatory authorities), which could result in terminations of specific projects which, in turn, could lead to material impairment charges;
|
|
•
|
the seasonality of sales of certain of our products;
|
|
•
|
declines in the pricing and sales volume of certain of our products that are distributed or marketed by third parties, over which we have no or limited control;
|
|
•
|
compliance by the Company or our third party partners and service providers (over whom we may have limited influence), or the failure of our Company or these third parties to comply, with health care “fraud and abuse” laws and other extensive regulation of our marketing, promotional and business practices (including with respect to pricing), worldwide anti-bribery laws (including the U.S. Foreign Corrupt Practices Act and the Canadian Corruption of Foreign Public Officials Act), worldwide economic sanctions and/or export laws, worldwide environmental laws and regulation and privacy and security regulations;
|
|
•
|
the impacts of the Patient Protection and Affordable Care Act, as amended by the Health Care and Education Reconciliation Act of 2010 (the “Health Care Reform Act”) and potential amendment thereof and other legislative and regulatory health care reforms in the countries in which we operate, including with respect to recent government inquiries on pricing;
|
|
•
|
the impact of any changes in or reforms to the legislation, laws, rules, regulation and guidance that apply to the Company and its business and products or the enactment of any new or proposed legislation, laws, rules, regulations or guidance that will impact or apply to the Company or its businesses or products;
|
|
•
|
the impact of changes in federal laws and policy under consideration by the Trump administration and Congress, including the effect that such changes will have on fiscal and tax policies, the potential revision of all or portions of the Health Care Reform Act, international trade agreements and policies and policy efforts designed to reduce patient out-of-pocket costs for medicines (which could result in new mandatory rebates and discounts or other pricing restrictions);
|
|
•
|
illegal distribution or sale of counterfeit versions of our products; and
|
|
•
|
interruptions, breakdowns or breaches in our information technology systems.
|
Additional information about these factors and about the material factors or assumptions underlying such forward-looking statements may be found elsewhere in this Form 10-K, under Item 1A. "Risk Factors" and in the Company's other filings with the
96
SEC and the Canadian Securities Administrators (the “CSA”). When relying on our forward-looking statements to make decisions with respect to the Company, investors and others should carefully consider the foregoing factors and other uncertainties and potential events. These forward-looking statements speak only as of the date made. We undertake no obligation to update or revise any of these forward-looking statements to reflect events or circumstances after the date of this Form 10-K or to reflect actual outcomes, except as required by law. We caution that, as it is not possible to predict or identify all relevant factors that may impact forward-looking statements, the foregoing list of important factors that may affect future results is not exhaustive and should not be considered a complete statement of all potential risks and uncertainties.
97
Item 7A. Quantitative and Qualitative Disclosures About Market Risk
Information relating to quantitative and qualitative disclosures about market risk is detailed in Item 7 “Management’s Discussion and Analysis of Financial Condition and Results of Operations — Quantitative and Qualitative Disclosures About Market Risk” and is incorporated herein by reference.
Item 8. Financial Statements and Supplementary Data
The information required by this Item is contained in the financial statements set forth in Item 15 “Exhibits and Financial Statement Schedules” as part of this Form 10-K and is incorporated herein by reference.
Item 9. Changes in and Disagreements with Accountants on Accounting and Financial Disclosure
Not applicable.
Item 9A. Controls and Procedures
Evaluation of Disclosure Controls and Procedures
The Company’s management, with the participation of the Company’s Chief Executive Officer and Chief Financial Officer, has evaluated the effectiveness of the Company’s disclosure controls and procedures (as defined in Rules 13a-15(e) and 15d-15(e) under the Securities Exchange Act of 1934, as amended (the “Exchange Act”)) as of
December 31, 2018
. Based on that evaluation, the Company’s Chief Executive Officer and the Company’s Chief Financial Officer have concluded that as of
December 31, 2018
,
the Company’s disclosure controls and procedures were effective to provide reasonable assurance that the information required to be disclosed by the Company in the reports that it files or submits under the Exchange Act is recorded, processed, summarized and reported within the time periods specified in the SEC’s rules and forms, and that such information is accumulated and communicated to management as appropriate to allow timely decisions regarding required disclosure.
Management’s Annual Report on Internal Control Over Financial Reporting
The Company’s management is responsible for establishing and maintaining adequate internal control over financial reporting as defined in Rules 13a-15(f) and 15d-15(f) under the Exchange Act. The Company’s internal control over financial reporting is a process designed to provide reasonable assurance regarding the reliability of financial reporting and the preparation of financial statements for external purposes in accordance with generally accepted accounting principles.
Because of its inherent limitations, internal control over financial reporting may not prevent or detect misstatements. Also, projections of any evaluation of effectiveness to future periods are subject to the risk that controls may become inadequate because of changes in conditions, or that the degree of compliance with the policies or procedures may deteriorate.
Under the supervision and with the participation of management, including the Company’s Chief Executive Officer and the Company’s Chief Financial Officer, the Company conducted an evaluation of the effectiveness of its internal control over financial reporting as of
December 31, 2018
based on the framework described in
Internal Control - Integrated Framework
(2013) issued by the Committee of Sponsoring Organizations of the Treadway Commission. Based on that evaluation, management has concluded that the Company maintained effective internal control over financial reporting as of
December 31, 2018
.
The effectiveness of the Company’s internal control over financial reporting as of
December 31, 2018
has been audited by PricewaterhouseCoopers LLP, an independent registered public accounting firm, as stated in their report which appears herein.
Changes in Internal Control over Financial Reporting
There have not been any changes in the Company’s internal control over financial reporting (as such term is defined in Rules 13a-15(f) and 15d-15(f) under the Exchange Act) during the last fiscal quarter of
2018
that have materially affected, or are reasonably likely to materially affect, the Company’s internal control over financial reporting.
Item 9B. Other Information
None.
98
PART III
Item 10. Directors, Executive Officers and Corporate Governance
Information required under this Item is incorporated herein by reference from information included in the
2019
Proxy Statement.
The Board of Directors has adopted a Code of Ethics that applies to our Chief Executive Officer, Chief Financial Officer, the principal accounting officer, controller, and all vice presidents and above in the finance department of the Company worldwide. A copy of the Code of Ethics can be found as an annex to our Standards of Business Conduct, which is located on our website at: www.bauschhealth.com. We intend to satisfy the SEC disclosure requirements regarding amendments to, or waivers from, any provisions of our Code of Ethics on our website.
Item 11. Executive Compensation
Information required under this Item relating to executive compensation is incorporated herein by reference from information included in the
2019
Proxy Statement.
Item 12. Security Ownership of Certain Beneficial Owners and Management and Related Stockholder Matters
Information required under this Item relating to securities authorized for issuance under equity compensation plans and to security ownership of certain beneficial owners and management is incorporated herein by reference from information included in the
2019
Proxy Statement.
Item 13. Certain Relationships and Related Transactions, and Director Independence
Information required under this Item relating to certain relationships and transactions with related parties and about director independence is incorporated herein by reference from information included in the
2019
Proxy Statement.
Item 14. Principal Accounting Fees and Services
Information required under this Item relating to the fees for professional services rendered by our independent auditors in
2018
and
2017
is incorporated herein by reference from information included in the
2019
Proxy Statement.
99
PART IV
Item 15. Exhibits and Financial Statement Schedules
|
(a)
|
Documents filed as a part of the report:
|
|
(1)
|
The consolidated financial statements required to be filed in the Annual Report on Form 10-K are listed on page F-1 hereof.
|
|
(2)
|
Schedule II — Valuation and Qualifying Accounts.
|
SCHEDULE II — VALUATION AND QUALIFYING ACCOUNTS
|
(in millions)
|
Balance at
Beginning
of Year
|
Charged to
Costs and
Expenses
|
Charged to
Other
Accounts
|
Deductions
|
Balance at
End of
Year
|
|||||||||||||||
|
Year ended December 31, 2018
|
||||||||||||||||||||
|
Allowance for doubtful accounts
|
$
|
97
|
|
$
|
4
|
|
$
|
(4
|
)
|
$
|
(50
|
)
|
$
|
47
|
|
|||||
|
Deferred tax asset valuation allowance
|
$
|
2,001
|
|
$
|
870
|
|
$
|
42
|
|
$
|
—
|
|
$
|
2,913
|
|
|||||
|
Year ended December 31, 2017
|
||||||||||||||||||||
|
Allowance for doubtful accounts
|
$
|
80
|
|
$
|
33
|
|
$
|
4
|
|
$
|
(20
|
)
|
$
|
97
|
|
|||||
|
Deferred tax asset valuation allowance
|
$
|
1,857
|
|
$
|
221
|
|
$
|
(77
|
)
|
$
|
—
|
|
$
|
2,001
|
|
|||||
|
Year ended December 31, 2016
|
||||||||||||||||||||
|
Allowance for doubtful accounts
|
$
|
67
|
|
$
|
57
|
|
$
|
(22
|
)
|
$
|
(22
|
)
|
$
|
80
|
|
|||||
|
Deferred tax asset valuation allowance
|
$
|
1,367
|
|
$
|
627
|
|
$
|
(137
|
)
|
$
|
—
|
|
$
|
1,857
|
|
|||||
With respect to the deferred tax valuation allowance, the amounts in
2016
,
2017
and
2018
charged to other accounts primarily relates to foreign currency fluctuations on debt.
|
(3)
|
Exhibits
|
Item 16. Form 10-K Summary
None.
100
INDEX TO EXHIBITS
|
Exhibit
Number
|
Exhibit Description
|
|
|
3.1
|
||
|
3.2
|
||
|
3.3
|
||
|
3.4
|
||
|
3.5
|
||
|
4.1
|
||
|
4.2
|
||
|
4.3
|
||
|
4.4
|
||
|
4.5
|
||
|
4.6
|
||
|
4.7
|
||
|
4.8
|
||
|
4.9
|
||
|
4.10
|
||
101
|
10.1
|
||
|
10.2
|
||
|
10.3
|
||
|
10.4
|
||
|
10.5
|
||
|
10.6
|
||
|
10.7
|
||
|
10.8
|
||
|
10.9
|
||
|
10.10
|
||
|
10.11
|
||
|
10.12
|
||
|
10.13
|
||
|
10.14
|
||
|
10.15
|
||
|
10.16
|
||
|
10.17
|
||
|
10.18
|
||
102
|
10.19
|
||
|
10.20
|
||
|
10.21
|
||
|
10.22
|
||
|
10.23
|
||
|
10.24
|
||
|
10.25*
|
||
|
10.26
|
||
|
10.27
|
||
|
10.28*
|
||
|
10.29
|
||
|
10.30
|
||
|
10.31
|
||
|
10.32*
|
||
|
21.1*
|
||
|
23.1*
|
||
|
31.1*
|
||
|
31.2*
|
||
|
32.1*
|
||
|
32.2*
|
||
|
*101.INS
|
XBRL Instance Document
|
|
|
*101.SCH
|
XBRL Taxonomy Extension Schema Document
|
|
|
*101.CAL
|
XBRL Taxonomy Extension Calculation Linkbase Document
|
|
|
*101.LAB
|
XBRL Taxonomy Extension Label Linkbase Document
|
|
103
|
*101.PRE
|
XBRL Taxonomy Extension Presentation Linkbase Document
|
|
|
*101.DEF
|
XBRL Taxonomy Extension Definition Linkbase Document
|
|
____________________________________
* Filed herewith.
** Portions of this exhibit have been omitted pursuant to an application for confidential treatment. Such information has been omitted and filed separately with the SEC.
|
†
|
Management contract or compensatory plan or arrangement.
|
|
††
|
One or more exhibits or schedules to this exhibit have been omitted pursuant to Item 601(b)(2) of Regulation S-K. We undertake to furnish supplementally a copy of any omitted exhibit or schedule to the SEC upon request.
|
104
SIGNATURES
Pursuant to the requirements of Section 13 or 15(d) of the Securities Exchange Act of 1934, the registrant has duly caused this report to be signed on its behalf by the undersigned, thereunto duly authorized.
|
|
|
BAUSCH HEALTH COMPANIES INC.
(Registrant)
|
|||
|
Date:
|
February 20, 2019
|
|
By:
|
/s/ JOSEPH C. PAPA
|
|
|
|
|
Joseph C. Papa
Chief Executive Officer
(Principal Executive Officer and Chairman of the Board)
|
|||
Pursuant to the requirements of the Securities Exchange Act of 1934, this report has been signed below by the following persons on behalf of the registrant and in the capacities and on the dates indicated.
|
|
Signature
|
|
Title
|
|
Date
|
|
|
|
|
|
|
|
|
|
/s/ JOSEPH C. PAPA
Joseph C. Papa
|
|
Chief Executive Officer and Chairman of the Board
|
|
February 20, 2019
|
|
|
/s/ PAUL S. HERENDEEN
Paul S. Herendeen
|
|
Executive Vice President and Chief Financial Officer (Principal Financial Officer)
|
|
February 20, 2019
|
|
|
/s/ SAM ELDESSOUKY
Sam Eldessouky
|
|
Senior Vice President, Controller and Chief Accounting Officer (Principal Accounting Officer)
|
|
February 20, 2019
|
|
/s/ RICHARD U. DESCHUTTER
Richard U. DeSchutter
|
Director
|
|
February 20, 2019
|
||
|
/s/ D. ROBERT HALE
D. Robert Hale
|
Director
|
February 20, 2019
|
|||
|
/s/ ARGERIS N. KARABELAS
Argeris N. Karabelas
|
Director
|
February 20, 2019
|
|||
|
/s/ SARAH B. KAVANAGH
Sarah B. Kavanagh
|
Director
|
February 20, 2019
|
|||
|
/s/ JOHN PAULSON
John Paulson
|
Director
|
February 20, 2019
|
|||
|
|
/s/ ROBERT N. POWER
Robert N. Power
|
|
Director
|
|
February 20, 2019
|
|
/s/ RUSSEL C. ROBERTSON
Russel C. Robertson
|
Director
|
|
February 20, 2019
|
||
|
/s/ THOMAS W. ROSS, SR.
Thomas W. Ross, Sr.
|
Director
|
|
February 20, 2019
|
||
|
/s/ ANDREW C. VON ESCHENBACH
Andrew C. von Eschenbach
|
Director
|
|
February 20, 2019
|
||
|
/s/ AMY B. WECHSLER
Amy B. Wechsler
|
Director
|
|
February 20, 2019
|
||
105
BAUSCH HEALTH COMPANIES INC.
INDEX TO CONSOLIDATED FINANCIAL STATEMENTS
|
Page
|
||
|
Report of Management on Financial Statements
|
||
|
Report of Independent Registered Public Accounting Firm
|
||
|
Consolidated Balance Sheets as of December 31, 2018 and 2017
|
||
|
Consolidated Statements of Operations for the years ended December 31, 2018, 2017 and 2016
|
||
|
Consolidated Statements of Comprehensive (Loss) Income for the years ended December 31, 2018, 2017 and 2016
|
||
|
Consolidated Statements of Shareholders’ Equity for the years ended December 31, 2018, 2017 and 2016
|
||
|
Consolidated Statements of Cash Flows for the years ended December 31, 2018, 2017 and 2016
|
||
|
Notes to Consolidated Financial Statements
|
||
F-1
REPORT OF MANAGEMENT ON FINANCIAL STATEMENTS
The Company’s management is responsible for preparing the accompanying consolidated financial statements in conformity with United States generally accepted accounting principles (“U.S. GAAP”). In preparing these consolidated financial statements, management selects appropriate accounting policies and uses its judgment and best estimates to report events and transactions as they occur. Management has determined such amounts on a reasonable basis in order to ensure that the consolidated financial statements are presented fairly, in all material respects. Financial information included throughout this Annual Report is prepared on a basis consistent with that of the accompanying consolidated financial statements.
PricewaterhouseCoopers LLP has been engaged by the Company to audit the consolidated financial statements.
The Board of Directors is responsible for ensuring that management fulfills its responsibility for financial reporting and is ultimately responsible for reviewing and approving the consolidated financial statements. The Board of Directors carries out this responsibility principally through its Audit and Risk Committee. The members of the Audit and Risk Committee are outside Directors. The Audit and Risk Committee considers, for review by the Board of Directors and approval by the shareholders, the engagement or reappointment of the external auditors. PricewaterhouseCoopers LLP has full and free access to the Audit and Risk Committee.
|
/s/ JOSEPH C. PAPA
|
/s/ PAUL S. HERENDEEN
|
|
|
Joseph C. Papa
Chief Executive Officer
|
|
Paul S. Herendeen
Executive Vice President and
Chief Financial Officer
|
February 20, 2019
F-2
REPORT OF INDEPENDENT REGISTERED PUBLIC ACCOUNTING FIRM
To the Board of Directors and Shareholders of Bausch Health Companies Inc.
Opinions on the Financial Statements and Internal Control over Financial Reporting
We have audited the accompanying consolidated balance sheets of Bausch Health Companies Inc. and its subsidiaries (the "Company") as of December 31, 2018 and 2017, and the related consolidated statements of operations, comprehensive (loss) income, shareholders’ equity and cash flows for each of the three years in the period ended December 31, 2018, including the related notes, and schedule of valuation and qualifying accounts for each of the three years in the period ended December 31, 2018 appearing under Item 15(a)(2) (collectively referred to as the “consolidated financial statements”). We also have audited the Company's internal control over financial reporting as of December 31, 2018, based on criteria established in
Internal Control - Integrated Framework
(2013)
issued by the Committee of Sponsoring Organizations of the Treadway Commission (COSO).
In our opinion, the consolidated financial statements referred to above present fairly, in all material respects, the financial position of the Company as of December 31, 2018 and 2017, and the results of its operations and its cash flows for each of the three years in the period ended December 31, 2018 in conformity with accounting principles generally accepted in the United States of America. Also in our opinion, the Company maintained, in all material respects, effective internal control over financial reporting as of December 31, 2018, based on criteria established in
Internal Control - Integrated Framework
(2013)
issued by the COSO.
Change in Accounting Principles
As discussed in Note 2 to the consolidated financial statements, the Company changed the manner in which it accounts for income taxes and the manner in which it accounts for goodwill in 2018.
Basis for Opinions
The Company's management is responsible for these consolidated financial statements, for maintaining effective internal control over financial reporting, and for its assessment of the effectiveness of internal control over financial reporting, included in Management’s Annual Report on Internal Control Over Financial Reporting appearing under Item 9A. Our responsibility is to express opinions on the Company’s consolidated financial statements and on the Company's internal control over financial reporting based on our audits. We are a public accounting firm registered with the Public Company Accounting Oversight Board (United States) (PCAOB) and are required to be independent with respect to the Company in accordance with the U.S. federal securities laws and the applicable rules and regulations of the Securities and Exchange Commission and the PCAOB.
We conducted our audits in accordance with the standards of the PCAOB. Those standards require that we plan and perform the audits to obtain reasonable assurance about whether the consolidated financial statements are free of material misstatement, whether due to error or fraud, and whether effective internal control over financial reporting was maintained in all material respects.
Our audits of the consolidated financial statements included performing procedures to assess the risks of material misstatement of the consolidated financial statements, whether due to error or fraud, and performing procedures that respond to those risks. Such procedures included examining, on a test basis, evidence regarding the amounts and disclosures in the consolidated financial statements. Our audits also included evaluating the accounting principles used and significant estimates made by management, as well as evaluating the overall presentation of the consolidated financial statements. Our audit of internal control over financial reporting included obtaining an understanding of internal control over financial reporting, assessing the risk that a material weakness exists, and testing and evaluating the design and operating effectiveness of internal control based on the assessed risk. Our audits also included performing such other procedures as we considered necessary in the circumstances. We believe that our audits provide a reasonable basis for our opinions.
Definition and Limitations of Internal Control over Financial Reporting
A company’s internal control over financial reporting is a process designed to provide reasonable assurance regarding the reliability of financial reporting and the preparation of financial statements for external purposes in accordance with generally accepted accounting principles. A company’s internal control over financial reporting includes those policies and procedures that (i) pertain to the maintenance of records that, in reasonable detail, accurately and fairly reflect the transactions and dispositions of the assets of the company; (ii) provide reasonable assurance that transactions are recorded as necessary to permit preparation of financial statements in accordance with generally accepted accounting principles, and that receipts and expenditures of the company are being made only in accordance with authorizations of management and directors of the company; and (iii) provide reasonable
F-3
assurance regarding prevention or timely detection of unauthorized acquisition, use, or disposition of the company’s assets that could have a material effect on the financial statements.
Because of its inherent limitations, internal control over financial reporting may not prevent or detect misstatements. Also, projections of any evaluation of effectiveness to future periods are subject to the risk that controls may become inadequate because of changes in conditions, or that the degree of compliance with the policies or procedures may deteriorate.
/s/ PricewaterhouseCoopers LLP
Florham Park, New Jersey
February 20, 2019
We have served as the Company’s auditor since 2012.
F-4
BAUSCH HEALTH COMPANIES INC.
CONSOLIDATED BALANCE SHEETS
(in millions, except share amounts)
|
|
December 31,
|
|||||||
|
|
2018
|
2017
|
||||||
|
Assets
|
|
|
||||||
|
Current assets:
|
|
|
||||||
|
Cash and cash equivalents
|
$
|
721
|
|
$
|
720
|
|
||
|
Restricted cash
|
2
|
|
77
|
|
||||
|
Trade receivables, net
|
1,865
|
|
2,130
|
|
||||
|
Inventories, net
|
934
|
|
1,048
|
|
||||
|
Prepaid expenses and other current assets
|
689
|
|
771
|
|
||||
|
Total current assets
|
4,211
|
|
4,746
|
|
||||
|
Property, plant and equipment, net
|
1,353
|
|
1,403
|
|
||||
|
Intangible assets, net
|
12,001
|
|
15,211
|
|
||||
|
Goodwill
|
13,142
|
|
15,593
|
|
||||
|
Deferred tax assets, net
|
1,676
|
|
433
|
|
||||
|
Other non-current assets
|
109
|
|
111
|
|
||||
|
Total assets
|
$
|
32,492
|
|
$
|
37,497
|
|
||
|
Liabilities
|
|
|
||||||
|
Current liabilities:
|
|
|
||||||
|
Accounts payable
|
$
|
411
|
|
$
|
365
|
|
||
|
Accrued and other current liabilities
|
3,197
|
|
3,694
|
|
||||
|
Current portion of long-term debt and other
|
228
|
|
209
|
|
||||
|
Total current liabilities
|
3,836
|
|
4,268
|
|
||||
|
Acquisition-related contingent consideration
|
298
|
|
344
|
|
||||
|
Non-current portion of long-term debt
|
24,077
|
|
25,235
|
|
||||
|
Deferred tax liabilities, net
|
885
|
|
1,180
|
|
||||
|
Other non-current liabilities
|
581
|
|
526
|
|
||||
|
Total liabilities
|
29,677
|
|
31,553
|
|
||||
|
Commitments and contingencies (Notes 20 and 21)
|
|
|
||||||
|
Equity
|
|
|
||||||
|
Common shares, no par value, unlimited shares authorized, 349,871,102 and 348,708,567 issued and outstanding at December 31, 2018 and 2017, respectively
|
10,121
|
|
10,090
|
|
||||
|
Additional paid-in capital
|
413
|
|
380
|
|
||||
|
Accumulated deficit
|
(5,664
|
)
|
(2,725
|
)
|
||||
|
Accumulated other comprehensive loss
|
(2,137
|
)
|
(1,896
|
)
|
||||
|
Total Bausch Health Companies Inc. shareholders’ equity
|
2,733
|
|
5,849
|
|
||||
|
Noncontrolling interest
|
82
|
|
95
|
|
||||
|
Total equity
|
2,815
|
|
5,944
|
|
||||
|
Total liabilities and equity
|
$
|
32,492
|
|
$
|
37,497
|
|
||
On behalf of the Board:
|
/s/ JOSEPH C. PAPA
|
/s/ RUSSEL C. ROBERTSON
|
|
|
Joseph C. Papa
|
|
Russel C. Robertson
|
|
Chief Executive Officer
|
|
Chairperson, Audit and Risk Committee
|
The accompanying notes are an integral part of these consolidated financial statements.
F-5
BAUSCH HEALTH COMPANIES INC.
CONSOLIDATED STATEMENTS OF OPERATIONS
(in millions, except per share amounts)
|
|
Years Ended December 31,
|
|||||||||||
|
|
2018
|
2017
|
2016
|
|||||||||
|
Revenues
|
|
|
|
|||||||||
|
Product sales
|
$
|
8,271
|
|
$
|
8,595
|
|
$
|
9,536
|
|
|||
|
Other revenues
|
109
|
|
129
|
|
138
|
|
||||||
|
8,380
|
|
8,724
|
|
9,674
|
|
|||||||
|
Expenses
|
|
|
|
|||||||||
|
Cost of goods sold (excluding amortization and impairments of intangible assets)
|
2,309
|
|
2,506
|
|
2,572
|
|
||||||
|
Cost of other revenues
|
42
|
|
42
|
|
39
|
|
||||||
|
Selling, general and administrative
|
2,473
|
|
2,582
|
|
2,810
|
|
||||||
|
Research and development
|
413
|
|
361
|
|
421
|
|
||||||
|
Amortization of intangible assets
|
2,644
|
|
2,690
|
|
2,673
|
|
||||||
|
Goodwill impairments
|
2,322
|
|
312
|
|
1,077
|
|
||||||
|
Asset impairments
|
568
|
|
714
|
|
422
|
|
||||||
|
Restructuring and integration costs
|
22
|
|
52
|
|
132
|
|
||||||
|
Acquired in-process research and development costs
|
1
|
|
5
|
|
34
|
|
||||||
|
Acquisition-related contingent consideration
|
(9
|
)
|
(289
|
)
|
(13
|
)
|
||||||
|
Other (income) expense, net
|
(21
|
)
|
(353
|
)
|
73
|
|
||||||
|
10,764
|
|
8,622
|
|
10,240
|
|
|||||||
|
Operating (loss) income
|
(2,384
|
)
|
102
|
|
(566
|
)
|
||||||
|
Interest income
|
11
|
|
12
|
|
8
|
|
||||||
|
Interest expense
|
(1,685
|
)
|
(1,840
|
)
|
(1,836
|
)
|
||||||
|
Loss on extinguishment of debt
|
(119
|
)
|
(122
|
)
|
—
|
|
||||||
|
Foreign exchange and other
|
23
|
|
107
|
|
(41
|
)
|
||||||
|
Loss before benefit from income taxes
|
|
(4,154
|
)
|
|
(1,741
|
)
|
|
(2,435
|
)
|
|||
|
Benefit from income taxes
|
10
|
|
4,145
|
|
27
|
|
||||||
|
Net (loss) income
|
(4,144
|
)
|
|
2,404
|
|
|
(2,408
|
)
|
||||
|
Net income attributable to noncontrolling interest
|
(4
|
)
|
—
|
|
(1
|
)
|
||||||
|
Net (loss) income attributable to Bausch Health Companies Inc.
|
|
$
|
(4,148
|
)
|
|
$
|
2,404
|
|
|
$
|
(2,409
|
)
|
|
(Loss) earnings per share attributable to Bausch Health Companies Inc.
|
||||||||||||
|
Basic
|
$
|
(11.81
|
)
|
$
|
6.86
|
|
$
|
(6.94
|
)
|
|||
|
Diluted
|
$
|
(11.81
|
)
|
$
|
6.83
|
|
$
|
(6.94
|
)
|
|||
|
Weighted-average common shares
|
|
|
|
|||||||||
|
Basic
|
351.3
|
|
350.2
|
|
347.3
|
|
||||||
|
Diluted
|
351.3
|
|
351.8
|
|
347.3
|
|
||||||
The accompanying notes are an integral part of these consolidated financial statements.
F-6
BAUSCH HEALTH COMPANIES INC.
CONSOLIDATED STATEMENTS OF COMPREHENSIVE (LOSS) INCOME
(in millions)
|
Years Ended December 31,
|
|||||||||||
|
2018
|
2017
|
2016
|
|||||||||
|
Net (loss) income
|
$
|
(4,144
|
)
|
$
|
2,404
|
|
$
|
(2,408
|
)
|
||
|
Other comprehensive (loss) income
|
|||||||||||
|
Foreign currency translation adjustment
|
(237
|
)
|
202
|
|
(548
|
)
|
|||||
|
Net unrealized holding loss on sale of assets and businesses:
|
|||||||||||
|
Arising in period
|
—
|
|
(26
|
)
|
—
|
|
|||||
|
Reclassification to net (loss) income
|
—
|
|
26
|
|
—
|
|
|||||
|
(237
|
)
|
202
|
|
(548
|
)
|
||||||
|
Pension and postretirement benefit plan adjustments:
|
|||||||||||
|
Newly established prior service credit
|
—
|
|
—
|
|
6
|
|
|||||
|
Net actuarial (loss) gain arising during the year
|
(7
|
)
|
20
|
|
(32
|
)
|
|||||
|
Amortization of prior service credit
|
(4
|
)
|
(4
|
)
|
(3
|
)
|
|||||
|
Amortization or settlement recognition of net gain
|
1
|
|
2
|
|
1
|
|
|||||
|
Income tax benefit (expense)
|
3
|
|
(4
|
)
|
4
|
|
|||||
|
Foreign currency impact
|
—
|
|
1
|
|
1
|
|
|||||
|
Net pension and postretirement benefit plan adjustments
|
(7
|
)
|
15
|
|
(23
|
)
|
|||||
|
Other comprehensive (loss) income
|
(244
|
)
|
217
|
|
(571
|
)
|
|||||
|
Comprehensive (loss) income
|
(4,388
|
)
|
2,621
|
|
(2,979
|
)
|
|||||
|
Comprehensive (income) loss attributable to noncontrolling interest
|
(1
|
)
|
(4
|
)
|
4
|
|
|||||
|
Comprehensive (loss) income attributable to Bausch Health Companies Inc.
|
$
|
(4,389
|
)
|
$
|
2,617
|
|
$
|
(2,975
|
)
|
||
The accompanying notes are an integral part of these consolidated financial statements.
F-7
BAUSCH HEALTH COMPANIES INC.
CONSOLIDATED STATEMENTS OF SHAREHOLDERS’ EQUITY
(in millions)
|
|
Bausch Health Companies Inc. Shareholders' Equity
|
|
|
||||||||||||||||||||||||||||
|
|
Common Shares
|
|
|
Accumulated
Other
Comprehensive
Loss
|
Bausch Health
Companies Inc.
Shareholders'
Equity
|
|
|||||||||||||||||||||||||
|
|
Shares
|
Amount
|
Additional
Paid-In
Capital
|
Accumulated
Deficit
|
Noncontrolling
Interest
|
Total
Equity
|
|||||||||||||||||||||||||
|
Balance, January 1, 2016
|
342.9
|
|
$
|
9,897
|
|
$
|
305
|
|
$
|
(2,750
|
)
|
$
|
(1,542
|
)
|
$
|
5,910
|
|
$
|
119
|
|
$
|
6,029
|
|
||||||||
|
Effect of application of new accounting standard: Share-based payments
|
—
|
|
—
|
|
—
|
|
30
|
|
—
|
|
30
|
|
—
|
|
30
|
|
|||||||||||||||
|
Common shares issued under share-based compensation plans
|
4.9
|
|
141
|
|
(108
|
)
|
—
|
|
—
|
|
33
|
|
—
|
|
33
|
|
|||||||||||||||
|
Share-based compensation
|
—
|
|
—
|
|
165
|
|
—
|
|
—
|
|
165
|
|
—
|
|
165
|
|
|||||||||||||||
|
Employee withholding taxes related to share-based awards
|
—
|
|
—
|
|
(11
|
)
|
—
|
|
—
|
|
(11
|
)
|
—
|
|
(11
|
)
|
|||||||||||||||
|
Noncontrolling interest distributions
|
—
|
|
—
|
|
—
|
|
—
|
|
—
|
|
—
|
|
(9
|
)
|
(9
|
)
|
|||||||||||||||
|
Net (loss) income
|
—
|
|
—
|
|
—
|
|
(2,409
|
)
|
—
|
|
(2,409
|
)
|
1
|
|
(2,408
|
)
|
|||||||||||||||
|
Other comprehensive loss
|
—
|
|
—
|
|
—
|
|
—
|
|
(566
|
)
|
(566
|
)
|
(5
|
)
|
(571
|
)
|
|||||||||||||||
|
Balance, December 31, 2016
|
347.8
|
|
10,038
|
|
351
|
|
(5,129
|
)
|
(2,108
|
)
|
3,152
|
|
106
|
|
3,258
|
|
|||||||||||||||
|
Common shares issued under share-based compensation plans
|
0.9
|
|
52
|
|
(52
|
)
|
—
|
|
—
|
|
—
|
|
—
|
|
—
|
|
|||||||||||||||
|
Share-based compensation
|
—
|
|
—
|
|
87
|
|
—
|
|
—
|
|
87
|
|
—
|
|
87
|
|
|||||||||||||||
|
Employee withholding taxes related to share-based awards
|
—
|
|
—
|
|
(4
|
)
|
—
|
|
—
|
|
(4
|
)
|
—
|
|
(4
|
)
|
|||||||||||||||
|
Acquisition of noncontrolling interest
|
—
|
|
—
|
|
(2
|
)
|
—
|
|
(1
|
)
|
(3
|
)
|
(6
|
)
|
(9
|
)
|
|||||||||||||||
|
Noncontrolling interest distributions
|
—
|
|
—
|
|
—
|
|
—
|
|
—
|
|
—
|
|
(9
|
)
|
(9
|
)
|
|||||||||||||||
|
Net income
|
—
|
|
—
|
|
—
|
|
2,404
|
|
—
|
|
2,404
|
|
—
|
|
2,404
|
|
|||||||||||||||
|
Other comprehensive income
|
—
|
|
—
|
|
—
|
|
—
|
|
213
|
|
213
|
|
4
|
|
217
|
|
|||||||||||||||
|
Balance, December 31, 2017
|
348.7
|
|
10,090
|
|
380
|
|
(2,725
|
)
|
(1,896
|
)
|
5,849
|
|
95
|
|
5,944
|
|
|||||||||||||||
|
Effect of application of new accounting standard: Income taxes (see Note 2)
|
—
|
|
—
|
|
—
|
|
1,209
|
|
—
|
|
1,209
|
|
—
|
|
1,209
|
|
|||||||||||||||
|
Common shares issued under share-based compensation plans
|
1.2
|
|
31
|
|
(29
|
)
|
—
|
|
—
|
|
2
|
|
—
|
|
2
|
|
|||||||||||||||
|
Share-based compensation
|
—
|
|
—
|
|
87
|
|
—
|
|
—
|
|
87
|
|
—
|
|
87
|
|
|||||||||||||||
|
Employee withholding taxes related to share-based awards
|
—
|
|
—
|
|
(10
|
)
|
—
|
|
—
|
|
(10
|
)
|
—
|
|
(10
|
)
|
|||||||||||||||
|
Acquisition of noncontrolling interest
|
—
|
|
—
|
|
(15
|
)
|
—
|
|
—
|
|
(15
|
)
|
(3
|
)
|
(18
|
)
|
|||||||||||||||
|
Noncontrolling interest distributions
|
—
|
|
—
|
|
—
|
|
—
|
|
—
|
|
—
|
|
(11
|
)
|
(11
|
)
|
|||||||||||||||
|
Net (loss) income
|
—
|
|
—
|
|
—
|
|
(4,148
|
)
|
—
|
|
(4,148
|
)
|
4
|
|
(4,144
|
)
|
|||||||||||||||
|
Other comprehensive loss
|
—
|
|
—
|
|
—
|
|
—
|
|
(241
|
)
|
(241
|
)
|
(3
|
)
|
(244
|
)
|
|||||||||||||||
|
Balance, December 31, 2018
|
349.9
|
|
$
|
10,121
|
|
$
|
413
|
|
$
|
(5,664
|
)
|
$
|
(2,137
|
)
|
$
|
2,733
|
|
$
|
82
|
|
$
|
2,815
|
|
||||||||
The accompanying notes are an integral part of these consolidated financial statements.
F-8
BAUSCH HEALTH COMPANIES
INC.
CONSOLIDATED STATEMENTS OF CASH FLOWS
(in millions)
|
|
Years Ended December 31,
|
|||||||||||
|
|
2018
|
2017
|
2016
|
|||||||||
|
Cash Flows From Operating Activities
|
|
|
|
|||||||||
|
Net (loss) income
|
$
|
(4,144
|
)
|
$
|
2,404
|
|
$
|
(2,408
|
)
|
|||
|
Adjustments to reconcile net (loss) income to net cash provided by operating activities:
|
|
|
|
|||||||||
|
Depreciation and amortization of intangible assets
|
2,819
|
|
2,858
|
|
2,866
|
|
||||||
|
Amortization and write-off of debt discounts and debt issuance costs
|
79
|
|
151
|
|
118
|
|
||||||
|
Asset impairments
|
568
|
|
714
|
|
422
|
|
||||||
|
Goodwill impairment
|
2,322
|
|
312
|
|
1,077
|
|
||||||
|
Acquisition accounting adjustment on inventory sold
|
—
|
|
—
|
|
38
|
|
||||||
|
Acquisition-related contingent consideration
|
(9
|
)
|
(289
|
)
|
(13
|
)
|
||||||
|
Allowances for losses on trade receivables and inventories
|
69
|
|
119
|
|
174
|
|
||||||
|
Deferred income taxes
|
(144
|
)
|
(4,386
|
)
|
(236
|
)
|
||||||
|
Loss (gain) on disposal of assets and businesses
|
6
|
|
(579
|
)
|
(8
|
)
|
||||||
|
(Reductions) additions to accrued legal settlements
|
(27
|
)
|
226
|
|
59
|
|
||||||
|
Insurance proceeds for legal settlement
|
—
|
|
60
|
|
—
|
|
||||||
|
Payments of accrued legal settlements
|
(224
|
)
|
(221
|
)
|
(69
|
)
|
||||||
|
Share-based compensation
|
87
|
|
87
|
|
165
|
|
||||||
|
Foreign exchange (gain) loss
|
(19
|
)
|
(106
|
)
|
14
|
|
||||||
|
Loss on extinguishment of debt
|
119
|
|
122
|
|
—
|
|
||||||
|
Payments of contingent consideration adjustments, including accretion
|
(2
|
)
|
(4
|
)
|
(28
|
)
|
||||||
|
Other
|
(17
|
)
|
(22
|
)
|
26
|
|
||||||
|
Changes in operating assets and liabilities:
|
|
|
|
|||||||||
|
Trade receivables
|
216
|
|
417
|
|
(34
|
)
|
||||||
|
Inventories
|
(5
|
)
|
7
|
|
(164
|
)
|
||||||
|
Prepaid expenses and other current assets
|
(72
|
)
|
33
|
|
232
|
|
||||||
|
Accounts payable, accrued and other liabilities
|
(121
|
)
|
387
|
|
(144
|
)
|
||||||
|
Net cash provided by operating activities
|
1,501
|
|
2,290
|
|
2,087
|
|
||||||
|
Cash Flows From Investing Activities
|
|
|
|
|||||||||
|
Acquisition of businesses, net of cash acquired
|
5
|
|
—
|
|
(19
|
)
|
||||||
|
Acquisition of intangible assets and other assets
|
(78
|
)
|
(165
|
)
|
(56
|
)
|
||||||
|
Purchases of property, plant and equipment
|
(157
|
)
|
(171
|
)
|
(235
|
)
|
||||||
|
Purchases of marketable securities
|
(7
|
)
|
(7
|
)
|
(1
|
)
|
||||||
|
Proceeds from sale of marketable securities
|
7
|
|
2
|
|
17
|
|
||||||
|
Proceeds from sale of assets and businesses, net of costs to sell
|
34
|
|
3,253
|
|
199
|
|
||||||
|
Reduction of cash due to deconsolidation
|
—
|
|
—
|
|
(30
|
)
|
||||||
|
Other
|
—
|
|
(25
|
)
|
—
|
|
||||||
|
Net cash (used in) provided by investing activities
|
(196
|
)
|
2,887
|
|
(125
|
)
|
||||||
|
Cash Flows From Financing Activities
|
|
|
|
|||||||||
|
Issuance of long-term debt, net of discounts
|
8,944
|
|
9,424
|
|
1,220
|
|
||||||
|
Repayments of long-term debt
|
(10,101
|
)
|
(14,203
|
)
|
(2,436
|
)
|
||||||
|
Borrowings of short-term debt
|
—
|
|
1
|
|
3
|
|
||||||
|
Repayments of short-term debt
|
(3
|
)
|
(8
|
)
|
(3
|
)
|
||||||
|
Proceeds from exercise of stock options
|
2
|
|
—
|
|
33
|
|
||||||
|
Payment of employee withholding tax upon vesting of share-based awards
|
(10
|
)
|
(4
|
)
|
(11
|
)
|
||||||
|
Payments of contingent consideration
|
(37
|
)
|
(45
|
)
|
(123
|
)
|
||||||
|
Payments of deferred consideration
|
(18
|
)
|
—
|
|
(540
|
)
|
||||||
|
Payments of financing costs
|
(102
|
)
|
(110
|
)
|
(97
|
)
|
||||||
|
Other
|
(28
|
)
|
(18
|
)
|
(9
|
)
|
||||||
|
Net cash used in financing activities
|
(1,353
|
)
|
(4,963
|
)
|
(1,963
|
)
|
||||||
|
Effect of exchange rate changes on cash and cash equivalents
|
(26
|
)
|
41
|
|
(54
|
)
|
||||||
|
Net (decrease) increase in cash and cash equivalents and restricted cash
|
(74
|
)
|
255
|
|
(55
|
)
|
||||||
|
Cash and cash equivalents and restricted cash, beginning of year
|
797
|
|
542
|
|
597
|
|
||||||
|
Cash and cash equivalents and restricted cash, end of year
|
$
|
723
|
|
$
|
797
|
|
$
|
542
|
|
|||
|
Cash and cash equivalents, end of year
|
$
|
721
|
|
$
|
720
|
|
$
|
542
|
|
|||
|
Restricted cash, end of year
|
2
|
|
77
|
|
—
|
|
||||||
|
Cash and cash equivalents and restricted cash, end of year
|
$
|
723
|
|
$
|
797
|
|
$
|
542
|
|
|||
The accompanying notes are an integral part of these consolidated financial statements.
F-9
BAUSCH HEALTH COMPANIES INC.
NOTES TO CONSOLIDATED FINANCIAL STATEMENTS
|
1.
|
DESCRIPTION OF BUSINESS
|
Bausch Health Companies Inc. (the “Company”), formerly known as Valeant Pharmaceuticals International, Inc., is a multinational, specialty pharmaceutical and medical device company that develops, manufactures and markets a broad range of branded, generic and branded generic pharmaceuticals, over-the-counter (“OTC”) products and medical devices (contact lenses, intraocular lenses, ophthalmic surgical equipment and aesthetics devices) which are marketed directly or indirectly in over
90
countries. Effective August 9, 2013, the Company continued from the federal jurisdiction of Canada to the Province of British Columbia, meaning that the Company became a company registered under the laws of the Province of British Columbia as if it had been incorporated under the laws of the Province of British Columbia. As a result of this continuance, the legal domicile of the Company became the Province of British Columbia, the Canada Business Corporations Act ceased to apply to the Company and the Company became subject to the British Columbia Business Corporations Act.
|
2.
|
SIGNIFICANT ACCOUNTING POLICIES
|
Basis of Presentation and Use of Estimates
The Consolidated Financial Statements have been prepared by the Company in United States (“U.S.”) dollars and in accordance with U.S. generally accepted accounting principles (“U.S. GAAP”), applied on a consistent basis. In preparing the Company’s Consolidated Financial Statements, management is required to make estimates and assumptions that affect the reported amounts of assets and liabilities, the disclosure of contingent assets and liabilities at the date of the financial statements and the reported amounts of revenues and expenses during the reporting periods. Significant estimates made by management include: provisions for product returns, rebates, chargebacks, discounts and allowances and distribution fees paid to certain wholesalers; useful lives of amortizable intangible assets and property, plant and equipment; expected future cash flows used in evaluating intangible assets for impairment, assessing compliance with debt covenants and making going concern assessments; reporting unit fair values for testing goodwill for impairment and allocating goodwill to new reporting unit structure on a relative fair value basis; provisions for loss contingencies; provisions for income taxes, uncertain tax positions and realizability of deferred tax assets; and the recognition of the fair value of assets and liabilities acquired in a business combination, including the fair value of contingent consideration. Under certain product manufacturing and supply agreements, management uses information from the Company’s commercialization counterparties to arrive at estimates for future returns, rebates and chargebacks.
On an ongoing basis, management reviews its estimates to ensure that these estimates appropriately reflect changes in the Company’s business and new information as it becomes available. If historical experience and other factors used by management to make these estimates do not reasonably reflect future activity, the Company’s Consolidated Financial Statements could be materially impacted.
Principles of Consolidation
The Consolidated Financial Statements include the accounts of the Company and those of its subsidiaries and any variable interest entities (“VIEs”) for which the Company is the primary beneficiary. All intercompany transactions and balances have been eliminated.
Acquisitions
Acquired businesses are accounted for using the acquisition method of accounting, which requires that assets acquired and liabilities assumed be recorded at fair value, with limited exceptions. Transaction costs and costs to restructure the acquired company are expensed as incurred. The operating results of the acquired business are reflected in the Consolidated Financial Statements after the date of acquisition. Acquired in-process research and development (“IPR&D”) is recognized at fair value and initially characterized as an indefinite-lived intangible asset, irrespective of whether the acquired IPR&D has an alternative future use. If the acquired net assets do not constitute a business under the acquisition method of accounting, the transaction is accounted for as an asset acquisition and no goodwill is recognized. In an asset acquisition, the amount allocated to acquired IPR&D with no alternative future use is charged to expense at the acquisition date.
Fair Value of Financial Instruments
The estimated fair values of cash and cash equivalents, trade receivables, accounts payable and accrued liabilities approximate their carrying values due to their short maturity periods. The fair value of acquisition-related contingent consideration is based on estimated discounted future cash flows or Monte Carlo Simulation analyses and assessment of the probability of occurrence of potential future events.
F-10
Cash and Cash Equivalents
Cash and cash equivalents consist of highly liquid investments with maturities of
three
months or less when purchased.
Concentrations of Credit Risk
Financial instruments that potentially subject the Company to significant concentrations of credit risk consist primarily of cash and cash equivalents, marketable securities and trade receivables.
The Company invests its excess cash in high-quality, money market instruments and term deposits with varying maturities, but typically less than
three
months.
The Company’s cash and cash equivalents are invested in various investment grade institutional money market accounts and bank term deposits. Cash deposited at banks may exceed the amount of insurance provided on such deposits. Generally, these cash deposits may be redeemed upon demand and are maintained with financial institutions with reputable credit and therefore bear minimal credit risk. The Company seeks to mitigate such risks by spreading its risk across multiple counterparties and monitoring the risk profiles of these counterparties.
The Company’s trade receivables primarily represent amounts due from wholesale distributors, retail pharmacies, government entities and group purchasing organizations. Outside of the U.S., concentrations of credit risk with respect to trade receivables, which are typically unsecured, are limited due to the number of customers using the Company’s products, as well as their dispersion across many different geographic regions. The Company performs periodic credit evaluations of customers and does not require collateral. The Company monitors economic conditions, including volatility associated with international economies, and related impacts on the relevant financial markets and its business, especially in light of sovereign credit issues. The credit and economic conditions within Portugal, Greece, among other members of the European Union, Brazil, Egypt, Argentina, Turkey and Ukraine have been weak in recent years. In November 2016, as a result of the Egyptian government’s decision to float the Egyptian pound and un-peg it to the U.S. Dollar, the Egyptian pound was significantly devalued. The Company's exposure to the Egyptian pound is with respect to the Amoun Pharmaceutical Company S.A.E. business acquired in October 2015, which represented approximately
2%
of the Company's revenue in each of the years 2018, 2017 and 2016 total revenues. These conditions have increased, and may continue to increase, the average length of time that it takes to collect on the Company’s trade receivables outstanding in these countries.
An allowance for doubtful accounts is maintained for potential credit losses based on the aging of trade receivables, historical bad debts experience and changes in customer payment patterns. Trade receivable balances are written off against the allowance when it is deemed probable that the receivable will not be collected. Trade receivables, net are stated net of reserves for sales returns and allowances and provisions for doubtful accounts of
$47 million
and
$97 million
as of December 31, 2018 and 2017
, respectively.
As of December 31, 2018
, the Company’s
three
largest U.S. wholesaler customers accounted for approximately
39%
of net trade receivables. In addition,
as of December 31, 2018 and 2017
, the Company’s net trade receivable balance from Greece, Portugal, Ukraine, Turkey, Egypt, Argentina and Brazil amounted to
$110 million
and
$230 million
, respectively, the majority of which is current or less than
90
days past due. The portion of the net trade receivable from these countries that is past due more than
90
days amounted to
$2 million
,
as of December 31, 2018
, a portion of which is comprised of public hospitals. Based on analysis of bad debt experience and assessment of historical payment patterns for such customers, the Company has established a reserve covering approximately half of the balance past due more than
90
days for such countries. The Company has not experienced any significant losses from uncollectible accounts in the three-year period ended
December 31, 2018
.
Inventories
Inventories comprise raw materials, work in process and finished goods, which are valued at the lower of cost or net realizable value, on a first-in, first-out basis. The cost value for work in process and finished goods inventories includes materials, direct labor and an allocation of overheads.
The Company evaluates the carrying value of inventories on a regular basis, taking into account such factors as historical and anticipated future sales compared with quantities on hand, the price the Company expects to obtain for products in their respective markets compared with historical cost and the remaining shelf life of goods on hand.
F-11
Property, Plant and Equipment
Property, plant and equipment are reported at cost, less accumulated depreciation. Costs incurred on assets under construction are capitalized as construction in progress. Depreciation is calculated using the straight-line method, commencing when the assets become available for productive use, based on the following estimated useful lives:
|
Land improvements
|
15 - 30 years
|
|
|
Buildings and improvements
|
|
Up to 40 years
|
|
Machinery and equipment
|
|
3 - 20 years
|
|
Other equipment
|
|
3 - 10 years
|
|
Equipment on operating lease
|
Up to 5 years
|
|
|
Leasehold improvements and capital leases
|
|
Lesser of term of lease or 10 years
|
Intangible Assets
Intangible assets are reported at cost, less accumulated amortization and impairments. Intangible assets with finite lives are amortized over their estimated useful lives. Amortization is calculated primarily using the straight-line method based on the following estimated useful lives:
|
Product brands
|
|
2 - 20 years
|
|
Corporate brands
|
|
7 - 20 years
|
|
Product rights
|
|
3 - 15 years
|
|
Partner relationships
|
|
7 - 9 years
|
|
Out-licensed technology and other
|
|
8 - 10 years
|
Divestitures of Products
The net of the proceeds on the divestiture of products and the carrying amount of the related assets is recorded as a gain/loss on sale within
Other (income) expense, net
. Any contingent payments that are potentially due to the Company as a result of these divestitures are recorded when realizable.
IPR&D
The fair value of IPR&D acquired through a business combination is capitalized as an indefinite-lived intangible asset until the completion or abandonment of the related research and development activities. When the related research and development is completed, the asset will be assigned a useful life and amortized. IPR&D assets are tested for impairment at least annually or when triggering events are identified.
The fair value of an IPR&D intangible asset is typically determined using an income approach. This approach starts with a forecast of the net cash flows expected to be generated by the asset over its estimated useful life. The net cash flows reflect the asset’s stage of completion, the probability of technical success, the projected costs to complete, expected market competition and an assessment of the asset’s life-cycle. The net cash flows are then adjusted to present value by applying an appropriate discount rate that reflects the risk factors associated with the expected cash flow streams.
Impairment of Long-Lived Assets
Long-lived assets with finite lives are tested for impairment whenever events or changes in circumstances indicate that the carrying value of an asset may not be recoverable. If indicators of impairment are present, the asset is tested for recoverability by comparing the carrying value of the asset to the related estimated undiscounted future cash flows expected to be derived from the asset. If the expected undiscounted cash flows are less than the carrying value of the asset, then the asset is considered to be impaired and its carrying value is written down to fair value, based on the related estimated discounted future cash flows.
Indefinite-lived intangible assets, which includes acquired IPR&D and the corporate trademark acquired in the acquisition of Bausch & Lomb Holdings Incorporated (the ‘‘B&L Trademark’’), are tested for impairment annually or more frequently if events or changes in circumstances between annual tests indicate that the asset may be impaired. Impairment losses on indefinite-lived intangible assets are recognized based solely on a comparison of the fair value of the asset to its carrying value.
F-12
Goodwill
Goodwill is recorded with the acquisition of a business and is calculated as the difference between the acquisition date fair value of the consideration transferred and the values assigned to the assets acquired and liabilities assumed. Goodwill is not amortized but is tested for impairment at least annually as of October 1st at the reporting unit level. A reporting unit is the same as, or one level below, an operating segment.
An interim goodwill impairment test in advance of the annual impairment assessment may be required if events occur that indicate an impairment might be present. For example, a substantial decline in the Company’s market capitalization, changes in reportable segments, unexpected adverse business conditions, economic factors and unanticipated competitive activities may signal that an interim impairment test is needed. Accordingly, among other factors, the Company monitors changes in its share price between annual impairment tests. The Company considers a decline in its share price that corresponds to an overall deterioration in stock market conditions to be less of an indicator of goodwill impairment than a unilateral decline in its share price reflecting adverse changes in its underlying operating performance, cash flows, financial condition and/or liquidity. In the event that the Company’s market capitalization does decline below its book value, the Company would consider the length and severity of the decline and the reason for the decline when assessing whether potential goodwill impairment exists. The Company believes that short-term fluctuations in share prices may not necessarily reflect underlying values.
Prior to January 1, 2018, the goodwill impairment test consisted of two steps. In step one, the Company compared the carrying value of each reporting unit to its fair value. In step two, if the carrying value of a reporting unit exceeded its fair value, the Company would measure goodwill impairment as the excess of the carryi
ng value of the reporting unit’s goodwill over the fair value of its goodwill, if any. The fair value of goodwill was derived as the excess of the fair value of the reporting unit over the fair value of the reporting unit’s identifiable assets and liabilities.
Effective January 1, 2018, the Company elected to early adopt guidance issued by the
Financial Accounting Standards Board ("FASB") which simplified the subsequent measurement of goodwill by eliminating “Step 2” from the goodwill impairment test. Instead, as of January 1, 2018 and all subsequent periods, goodwill impairment is measured as the amount by which a reporting unit's carrying value exceeds its fair value.
Debt Discounts, Issuance Costs and Deferred Financing Costs
Debt discounts and issuance costs are presented in the Consolidated Balance Sheets as a direct deduction from the carrying amount of the related debt and are amortized, using the effective interest method, as interest expense over the contractual lives of the related credit facilities or notes. Deferred financing costs associated with revolving credit facility arrangements are included in the balances of Prepaid expenses and other current assets and Other non-current assets in the Consolidated Balance Sheets and are amortized as interest expense over the contractual life of the related revolving credit facility.
Foreign Currency Translation
The assets and liabilities of the Company’s foreign operations having a functional currency other than the U.S. dollar are translated into U.S. dollars at the exchange rate prevailing at the balance sheet date, and at the average exchange rate for the reporting period for revenue and expense accounts. The cumulative foreign currency translation adjustment is recorded as a component of accumulated other comprehensive loss in shareholders’ equity.
Foreign currency exchange gains and losses on transactions occurring in a currency other than an operation’s functional currency are recognized in Net (loss) income.
Revenue Recognition
As discussed under the caption "Adoption of New Accounting Standards" to this Note
2
, effective January 1, 2018, the Company adopted guidance issued by the FASB regarding recognizing revenue from contracts with customers. Based upon review of current customer contracts, the Company concluded the implementation of the new guidance did not have a material quantitative impact on its Consolidated Financial Statements as the timing of revenue recognition for product sales did not significantly change. The Company adopted this guidance using the modified retrospective approach, and therefore, revenue reported for the years 2017 and 2016 have not been restated. Although the new guidance did result in additional disclosures as to the nature, amounts and concentrations of revenue, it did not have a material impact on the Company's significant accounting policies. The revenue recognition policies as enumerated below reflect the Company's accounting policies effective January 1, 2018, which did not have a materially different financial statement result than what the results would have been under the previous accounting policies for revenue recognition.
F-13
The Company’s
revenues are primarily generated from product sales that consist of: (i) branded pharmaceuticals, (ii) generic and branded generic pharmaceuticals, (iii) OTC products and (iv) medical devices (contact lenses, intraocular lenses, ophthalmic surgical equipment and aesthetics devices). Other revenues include alliance and service revenue from the licensing and co-promotion of products and contract service revenue primarily in the areas of dermatology and topical medication. Contract service revenue is derived primarily from contract manufacturing for third parties and is not material.
See
Note 22, "SEGMENT INFORMATION"
for the disaggregation of revenue which depicts how the nature, amount, timing and uncertainty of revenue and cash flows are affected by the economic factors of each category of customer contracts.
The Company recognizes revenue when the customer obtains control of promised goods or services and in an amount that reflects the consideration to which the Company expects to be entitled to receive in exchange for those goods or services. To achieve this core principle, the Company applies the five-step revenue model to contracts within its scope: (i) identify the contract(s) with a customer, (ii) identify the performance obligations in the contract, (iii) determine the transaction price, (iv) allocate the transaction price to the performance obligations in the contract and (v) recognize revenue when (or as) the entity satisfies a performance obligation.
Product Sales
A contract with the Company’s customers exists for each product sale. Where a contract with a customer contains more than one performance obligation, the Company allocates the transaction price to each distinct performance obligation based on its relative standalone selling price. The transaction price is adjusted for variable consideration which is discussed further below. The Company generally recognizes revenue for product sales at a point in time, when the customer obtains control of the products.
Product Sales Provisions
As is customary in the pharmaceutical industry, gross product sales are subject to a variety of deductions in arriving at reported net product sales. The transaction price for product sales is typically adjusted for variable consideration, which may be in the form of cash discounts, allowances, returns, rebates, chargebacks and distribution fees paid to customers. Provisions for variable consideration are established to reflect the Company’s best estimates of the amount of consideration to which it is entitled based on the terms of the contract. The amount of variable consideration included in the transaction price may be constrained, and is included in the net sales price only to the extent that it is probable that a significant reversal in the amount of the cumulative revenue recognized will not occur in the future period.
Provisions for these deductions are recorded concurrently with the recognition of gross product sales revenue and include cash discounts and allowances, chargebacks, and distribution fees, which are paid to direct customers, as well as rebates and returns, which can be paid to direct and indirect customers. Returns provision balances and volume discounts to direct customers are included in Accrued and other current liabilities. All other provisions related to direct customers are included in Trade receivables, net, while provision balances related to indirect customers are included in Accrued and other current liabilities.
The following table presents the activity and ending balances of the Company’s variable consideration provisions for
the year ended December 31, 2018
.
|
(in millions)
|
Discounts
and
Allowances
|
Returns
|
Rebates
|
Chargebacks
|
Distribution
Fees
|
Total
|
||||||||||||||||||
|
Reserve balance, January 1, 2018
|
$
|
167
|
|
$
|
863
|
|
$
|
1,094
|
|
$
|
274
|
|
$
|
148
|
|
$
|
2,546
|
|
||||||
|
Current period provision
|
865
|
|
293
|
|
2,551
|
|
1,966
|
|
212
|
|
5,887
|
|
||||||||||||
|
Payments and credits
|
(857
|
)
|
(343
|
)
|
(2,621
|
)
|
(2,031
|
)
|
(197
|
)
|
(6,049
|
)
|
||||||||||||
|
Reserve balance, December 31, 2018
|
$
|
175
|
|
$
|
813
|
|
$
|
1,024
|
|
$
|
209
|
|
$
|
163
|
|
$
|
2,384
|
|
||||||
Included in Rebates in the table above are cooperative advertising credits due to customers of approximately
$26 million
as of
December 31, 2018
, which are reflected as a reduction of Trade accounts receivable, net in the Consolidated Balance Sheets.
The Company continually monitors its variable consideration provisions and evaluates the estimates used as additional information becomes available. Adjustments will be made to these provisions periodically to reflect new facts and circumstances that may indicate that historical experience may not be indicative of current and/or future results. The Company is required to make subjective judgments based primarily on its evaluation of current market conditions and trade inventory
F-14
levels related to the Company's products. This evaluation may result in an increase or decrease in the experience rate that is applied to current and future sales, or an adjustment related to past sales, or both. If the actual amounts paid vary from the Company’s estimates, the Company adjusts these estimates, which would affect net product revenue and earnings in the period such variance becomes known. The Company applies this method consistently for contracts with similar characteristics. The following describes the major sources of variable consideration in the Company’s customer arrangements and the methodology, estimates and judgments applied to estimate each type of variable consideration.
Cash Discounts and Allowances
Cash discounts are offered for prompt payment and allowances for volume purchases. Provisions for cash discounts are estimated at the time of sale and recorded as direct reductions to trade receivables and revenue. Management estimates the provisions for cash discounts and allowances based on contractual sales terms with customers, an analysis of unpaid invoices and historical payment experience. Estimated cash discounts and allowances have historically been predictable and less subjective, due to the limited number of assumptions involved, the consistency of historical experience and the fact that these amounts are generally settled within
one month
of incurring the liability.
Returns
Consistent with industry practice, customers are generally allowed to return products within a specified period of time before and after its expiration date, excluding European businesses which generally do not provide a right of return. The returns provision is estimated utilizing historical sales and return rates over the period during which customers have a right of return, taking into account available information on competitive products and contract changes. The information utilized to estimate the returns provision includes: (i) historical return and exchange levels, (ii) external data with respect to inventory levels in the wholesale distribution channel, (iii) external data with respect to prescription demand for products, (iv) remaining shelf lives of products at the date of sale and (v) estimated returns liability to be processed by year of sale based on an analysis of lot information related to actual historical returns.
In determining the estimate for returns, management is required to make certain assumptions regarding the timing of the introduction of new products and the potential of these products to capture market share. In addition, certain assumptions with respect to the extent and pattern of decline associated with generic competition are necessary. These assumptions are formulated using market data for similar products, past experience and other available information. These assumptions are continually reassessed, and changes to the estimates and assumptions are made as new information becomes available. A change of 1% in the estimated return rates would have impacted the Company’s pre-tax earnings by approximately
$86 million
for
the year ended December 31, 2018
.
The estimate for returns may be impacted by a number of factors, but the principal factor relates to the inventory levels in the distribution channel. When management becomes aware of an increase in such inventory levels, it considers whether the increase may be temporary or other-than-temporary. Temporary increases in wholesaler inventory levels will not differ from original estimates of provision for returns. Other-than-temporary increases in wholesaler inventory levels, however, may be an indication that future product returns could be higher than originally anticipated, and, as a result, estimates for returns may need to be adjusted. Factors that suggest increases in wholesaler inventory levels are temporary include: (i) recently implemented or announced price increases for certain products, (ii) new product launches or expanded indications for existing products and (iii) timing of purchases by wholesale customers. Conversely, factors that suggest increases in wholesaler inventory levels are other-than-temporary include: (i) declining sales trends based on prescription demand, (ii) introduction of new products or generic competition, (iii) increasing price competition from generic competitors and (iv) changes to the U.S. National Drug Codes (“NDC”) of products. Changes in the NDC of products could result in a period of higher returns related to products with the old NDC, as U.S. customers generally permit only one NDC per product for identification and tracking within their inventory systems.
Rebates and Chargebacks
Product sales made under governmental and managed-care pricing programs in the U.S. are subject to rebates. The Company participates in state government-managed Medicaid programs, as well as certain other qualifying federal and state government programs whereby rebates are provided to participating government entities. Medicaid rebates are generally billed 45 days after the quarter, but can be billed up to 270 days after the quarter in which the product is dispensed to the Medicaid participant. As a result, the Medicaid rebate reserve includes an estimate of outstanding claims for end-customer sales that occurred, but for which the related claim has not been billed and/or paid, and an estimate for future claims that will be made when inventory in the distribution channel is sold through to plan participants. The calculation of the Medicaid rebate reserve also requires
F-15
other estimates, such as estimates of sales mix, to determine which sales are subject to rebates and the amount of such rebates. A change of 1% in the volume of product sold through to Medicaid plan participants would have impacted the Company’s pre-tax earnings by approximately
$87 million
for
the year ended December 31, 2018
. Quarterly, the Medicaid rebate reserve is adjusted based on actual claims paid. Due to the delay in billing, adjustments to actual claims paid may incorporate revisions of that reserve for several periods.
Managed Care rebates relate to contractual agreements to sell products to managed care organizations and pharmacy benefit managers at contractual rebate percentages in exchange for volume and/or market share.
Chargebacks relate to contractual agreements to sell products to government agencies, group purchasing organizations and other indirect customers at contractual prices that are lower than the list prices the Company charges wholesalers. When these group purchasing organizations or other indirect customers purchase products through wholesalers at these reduced prices, the wholesaler charges the Company for the difference between the prices they paid the Company and the prices at which they sold the products to the indirect customers.
In estimating provisions for rebates and chargebacks, management considers relevant statutes with respect to governmental pricing programs and contractual sales terms with managed-care providers and group purchasing organizations. Management estimates the amount of product sales subject to these programs based on historical utilization levels. Changes in the level of utilization of products through private or public benefit plans and group purchasing organizations will affect the amount of rebates and chargebacks that the Company is obligated to pay. Management continually updates these factors based on new contractual or statutory requirements, and any significant changes in sales trends that may impact the percentage of products subject to rebates or chargebacks.
The amount of Managed Care, Medicaid and other rebates and chargebacks has become more significant as a result of a combination of deeper discounts due to the price increases implemented in each of the last three years, changes in the Company’s product portfolio due to recent acquisitions and increased Medicaid utilization due to expansion of government funding for these programs. Management’s estimate for rebates and chargebacks may be impacted by a number of factors, but the principal factor relates to the level of inventory in the distribution channel.
Rebate provisions are based on factors such as timing and terms of plans under contract, time to process rebates, product pricing, sales volumes, amount of inventory in the distribution channel and prescription trends. Adjustments to actual for the
years ended December 31, 2018 and 2017
were not material to the Company’s revenues or earnings.
Patient Co-Pay Assistance programs, Consumer Rebates and Loyalty Programs are rebates offered on many of the Company’s products. Patient Co-Pay Assistance Programs are patient discount programs offered in the form of coupon cards or point of sale discounts, with which patients receive certain discounts off their prescription at participating pharmacies, as defined by the specific product program. An accrual for these programs is established, equal to management’s estimate of the discount, rebate and loyalty incentives attributable to a sale. That estimate is based on historical experience and other relevant factors. The accrual is adjusted throughout each quarter based on actual experience and changes in other factors, if any.
Distribution Fees
The Company sells product primarily to wholesalers, and in some instances to large pharmacy chains such as CVS and Wal-Mart. The Company has Distribution Services Agreements ("DSAs") with several large wholesale customers such as McKesson Corporation, AmerisourceBergen Corporation, Cardinal Health, Inc. and McKesson Specialty. Under the DSAs, the wholesalers agree to provide services, and the Company pays the contracted DSA distribution service fees for these services based on product volumes. Additionally, price appreciation credits are generated when the Company increases a product’s wholesaler acquisition cost (“WAC”) under contracts with certain wholesalers. Under such contracts, the Company is entitled to credits from such wholesalers for the impact of that WAC increase on inventory currently on hand at the wholesalers. Such credits are offset against the total distribution service fees paid to each such wholesaler. The variable consideration associated with price appreciation credits is reflected in the transaction price of products sold when it is determined to be probable that a significant reversal will not occur. Net revenue from price appreciation credits for
the year ended December 31, 2018
was
$31 million
and is a reduction of distribution fees in the variable consideration provisions table above.
Contract Assets and Contract Liabilities
There are no contract assets for any period presented. Contract liabilities consist of deferred revenue, the balance of which is not material to any period presented.
F-16
Sales Commissions
The Company expenses sales commissions when incurred because the amortization period would have been less than one year. Sales commissions are included in selling, general and administrative expenses.
Financing Component
The Company has elected not to adjust consideration for the effects of a significant financing component when the period between the transfer of a promised good or service to the customer and when the customer pays for that good or service will be one year or less. The Company's global payment terms are generally between
thirty
to
ninety
days.
Research and Development Expenses
Costs related to internal research and development programs, including costs associated with the development of acquired IPR&D, are expensed as goods are delivered or services are performed. Under certain research and development arrangements with third parties, the Company may be required to make payments that are contingent on the achievement of specific developmental, regulatory and/or commercial milestones. Milestone payments made to third parties before a product receives regulatory approval, but after the milestone is determined to be probable, are expensed and included in Research and development expenses
.
Milestone payments made to third parties after regulatory approval is received are capitalized and amortized over the estimated useful life of the approved product.
Amounts due from third parties as reimbursement of development activities conducted under certain research and development arrangements are recognized as a reduction of Research and development expenses.
Legal Costs
Legal fees and other costs related to litigation and other legal proceedings or services are expensed as incurred and are included in Selling, general and administrative expenses. Certain legal costs associated with acquisitions are included in Acquisition-related costs, and certain legal costs associated with divestitures, legal settlements and other business development activities are included in
Other (income) expense, net
or Gain on investments, net, as appropriate. Legal costs expensed are reported net of expected insurance recoveries. A claim for insurance recovery is recognized when realization becomes probable.
Advertising Costs
Advertising costs comprise product samples, print media, promotional materials and television advertising. Advertising costs related to new product launches are expensed on the first use of the advertisement. Included in Selling, general and administrative expenses are advertising costs of
$481 million
,
$462 million
and
$564 million
, for
2018, 2017 and 2016
, respectively.
Share-Based Compensation
The Company recognizes all share-based payments to employees, including grants of employee stock options and restricted share units (“RSUs”), at estimated fair value. The Company amortizes the fair value of stock option or RSU grants on a straight-line basis over the requisite service period of the individual stock option or RSU grant, which generally equals the vesting period. Stock option and RSU forfeitures are estimated at the time of grant and revised, if necessary, in subsequent periods if actual forfeitures differ from those estimates. Share-based compensation is recorded in Research and development expenses, Selling, general and administrative expenses and
Other (income) expense, net
, as appropriate.
Acquisition-Related Contingent Consideration
Acquisition-related contingent consideration, which primarily consists of potential milestone payments and royalty obligations, is recorded in the Consolidated Balance Sheets at its acquisition date estimated fair value, in accordance with the acquisition method of accounting. The fair value of the acquisition-related contingent consideration is remeasured each reporting period, with changes in fair value recorded in the Consolidated Statements of Operations. The fair value measurement is based on significant inputs not observable in the market and thus represents a Level 3 measurement as defined in fair value measurement accounting.
Interest Expense
Interest expense includes standby fees and the amortization of debt discounts and deferred financing costs. Interest costs are expensed as incurred, except to the extent such interest is related to construction in progress, in which case interest is capitalized.
F-17
Capitalized interest related to construction in progress as of December 31, 2018 and 2017 was
$34 million
and
$32 million
, respectively, and is included in Property, plant and equipment, net.
Income Taxes
Income taxes are accounted for under the liability method. Deferred tax assets and liabilities are recognized for the temporary differences between the financial statement and income tax bases of assets and liabilities, and for operating losses and tax credit carryforwards. A valuation allowance is provided for the portion of deferred tax assets that is more likely than not to remain unrealized. Deferred tax assets and liabilities are measured using enacted tax rates and laws. Deferred tax assets for outside basis differences in investments in subsidiaries are only recognized if the difference will be realized in the foreseeable future.
The tax benefit from an uncertain tax position is recognized only if it is more likely than not that the tax position will be sustained upon examination by the appropriate taxing authority, based on the technical merits of the position. The tax benefits recognized from such position are measured based on the amount for which there is a greater than
50%
likelihood of being realized upon settlement. Liabilities associated with uncertain tax positions are classified as long-term unless expected to be paid within
one
year. Interest and penalties related to uncertain tax positions, if any, are recorded in the provision for income taxes and classified with the related liability on the consolidated balance sheets.
In accordance with recently issued accounting guidance, the Company has provided for the income tax effects of the Tax Cuts and Jobs Act (the “Tax Act”) which was enacted on December 22, 2017. The Company has finalized the provisional amounts during the year ended December 31, 2018.
Earnings Per Share
Basic
(Loss) earnings per share attributable to Bausch Health Companies Inc.
is calculated by dividing
Net (loss) income attributable to Bausch Health Companies Inc.
by the weighted-average number of common shares outstanding during the reporting period. Diluted
(Loss) earnings per share attributable to Bausch Health Companies Inc.
is calculated by dividing
Net (loss) income attributable to Bausch Health Companies Inc.
by the weighted-average number of common shares outstanding during the reporting period after giving effect to dilutive potential common shares for stock options and RSUs, determined using the treasury stock method.
Comprehensive Income
Comprehensive (loss) income
comprises
Net (loss) income
and
Other comprehensive (loss) income
.
Other comprehensive (loss) income
includes items such as foreign currency translation adjustments, unrealized holding gains and losses on available-for-sale and other investments and certain pension and other postretirement benefit plan adjustments.
Accumulated other comprehensive loss
is recorded as a component of shareholders’ equity.
Contingencies
In the normal course of business, the Company is subject to loss contingencies, such as claims and assessments arising from litigation and other legal proceedings, contractual indemnities, product and environmental liabilities, and tax matters. Accruals for loss contingencies are recorded when the Company determines that it is both probable that a liability has been incurred and the amount of loss can be reasonably estimated. If the estimate of the amount of the loss is a range and some amount within the range appears to be a better estimate than any other amount within the range, that amount is accrued as a liability. If no amount within the range is a better estimate than any other amount, the minimum amount of the range is accrued as a liability. These accruals are adjusted periodically as assessments change or additional information becomes available.
If no accrual is made for a loss contingency because the amount of loss cannot be reasonably estimated, the Company will disclose contingent liabilities when there is at least a reasonable possibility that a loss or an additional loss may have been incurred.
Employee Benefit Plans
The Company sponsors various retirement and pension plans, including defined benefit pension plans, defined contribution plans and a participatory defined benefit postretirement plan. The determination of defined benefit pension and postretirement plan obligations and their associated expenses requires the use of actuarial valuations to estimate the benefits employees earn while working, as well as the present value of those benefits. Net actuarial gains and losses that exceed
10 percent
of the greater of the plan’s projected benefit obligations or the market-related value of assets are amortized to earnings over the
F-18
shorter of the estimated average future service period of the plan participants (or the estimated average future lifetime of the plan participants if the majority of plan participants are inactive) or the period until any anticipated final plan settlements.
Adoption of New Accounting Standards
In May 2014, the FASB issued guidance on recognizing revenue from contracts with customers. The core principle of the revenue model is that an entity recognizes revenue to depict the transfer of promised goods or services to customers in an amount that reflects the consideration to which the entity expects to be entitled in exchange for those goods or services. In applying the revenue model to contracts within its scope, an entity will: (i) identify the contract(s) with a customer, (ii) identify the performance obligations in the contract, (iii) determine the transaction price, (iv) allocate the transaction price to the performance obligations in the contract and (v) recognize revenue when (or as) the entity satisfies a performance obligation. In addition to these provisions, the new standard provides implementation guidance on several other topics, including the accounting for certain revenue-related costs, as well as enhanced disclosure requirements. The new guidance requires entities to disclose both quantitative and qualitative information that enables users of financial statements to understand the nature, amount, timing and uncertainty of revenue and cash flows arising from contracts with customers. In March 2016, the FASB issued an amendment to clarify the implementation guidance around considerations whether an entity is a principal or an agent, impacting whether an entity reports revenue on a gross or net basis. In April 2016, the FASB issued an amendment to clarify guidance on identifying performance obligations and the implementation guidance on licensing. The guidance is effective for annual reporting periods beginning after December 15, 2017. Entities had the option of using either a full retrospective or a modified retrospective approach to adopt the guidance.
The Company completed its detailed assessment and training program for its personnel. Pursuant to the detailed assessment program, the Company reviewed its revenue arrangements and assessed the differences in accounting for such contracts under the new guidance as compared with prior revenue accounting guidance.
The Company adopted this guidance effective January 1, 2018 using the modified retrospective approach, and therefore, revenue reported for the years 2017 and 2016 have not been restated. Based upon review of customer contracts, the Company concluded the implementation of the new guidance did not have a material quantitative impact on its 2018 Consolidated Financial Statements as the timing of revenue recognition for product sales did not significantly change. The new guidance did however result in additional disclosures as to the nature, amounts, and concentrations of revenue.
See "Revenue Recognition" discussed in this Note
2
and
Note 22, "SEGMENT INFORMATION"
for additional details and the application of this guidance.
In October 2016, the FASB issued guidance requiring an entity to recognize the income tax consequences of an intra-entity transfer of an asset other than inventory when the transfer occurs, rather than when the asset has been sold to an outside party. This guidance was effective for the Company January 1, 2018 and was applied using a modified retrospective approach through a cumulative-effect adjustment to accumulated deficit and deferred income taxes as of the effective date. The Company recorded a net cumulative-effect adjustment of
$1,209 million
to increase deferred income tax assets and decrease the opening balance of Accumulated deficit for the income tax consequences deferred from past intra-entity transfers involving assets other than inventory.
In January 2017, the FASB issued guidance which clarifies the definition of a business with the objective of assisting with evaluating whether transactions should be accounted for as acquisitions (or disposals) of assets or businesses. The Company prospectively applied the new definition to all transactions effective January 1, 2018.
In January 2017, the FASB issued guidance which simplifies the subsequent measurement of goodwill by eliminating “Step 2” from the goodwill impairment test. Instead, goodwill impairment is measured as the amount by which a reporting unit's carrying value exceeds its fair value. The FASB also eliminated the requirements for any reporting unit with a zero or negative carrying amount to perform a qualitative assessment. The guidance is effective for annual periods beginning after December 15, 2019, and interim periods within those annual periods, with early adoption permitted. The Company elected to early adopt this guidance effective January 1, 2018. The Company tested goodwill for impairment upon adopting this guidance and recognized impairment charges of
$2,213 million
, related to its Salix reporting unit and Ortho Dermatologics reporting unit at January 1, 2018. See
Note 9, "INTANGIBLE ASSETS AND GOODWILL"
for additional details and the application of this guidance.
F-19
Recently Issued Accounting Standards, Not Adopted as of
December 31, 2018
In February 2016, the FASB issued guidance on lease accounting to increase transparency and comparability among organizations that lease buildings, equipment and other assets by requiring the recognition of lease assets and lease liabilities on the balance sheet. Consistent with the current lease accounting standard, leases will continue to be classified as finance leases or operating leases. The classification is determined based on whether the risks and rewards, as well as substantive control, have been transferred to the Company and its determination will govern the pattern of lease cost recognition. Finance leases will be accounted for in substantially the same manner as capital leases are accounted for under current U.S. GAAP. Operating leases will be accounted for (both in the statement of operations and statement of cash flows) in a manner consistent with operating leases under existing U.S. GAAP. However, as it relates to the balance sheet, lessees will recognize lease liabilities based upon the present value of remaining lease payments and corresponding right of use lease assets for operating leases with limited exception. The new guidance will also require lessees and lessors to provide additional qualitative and quantitative disclosures to help financial statement users assess the amount, timing and uncertainty of cash flows arising from leases.
The new guidance is effective for annual reporting periods beginning after December 15, 2018. Early application is permitted. The Company has adopted the standard on January 1, 2019, and is electing to apply the modified retrospective approach to recognize a cumulative-effect adjustment to accumulated deficit at the adoption date. The Company also has elected the available practical expedients upon adoption. The Company has updated its systems, processes and controls to track, record and account for its lease portfolio. The Company has implemented a third-party software tool to assist in complying with the new standard. The Company is in the process of completing an analysis of the Company's existing lease arrangements including the Company's assessment of the impact that embedded leases within the Company's service arrangements will have on the Consolidated Balance Sheets.
The inclusion of lease-related assets and liabilities will have a material impact on the Consolidated Balance Sheets. As of December 31, 2018, the Company had undiscounted future minimum lease payments of approximately
$419 million
under the Company's portfolio of non-cancelable operating leases primarily relating to facilities, vehicles and equipment. The final right-of-use and lease liability to be recorded under the new guidance will be discounted and is not expected to have a material impact on the Consolidated Statements of Operations. The accounting for capital leases will remain substantially unchanged under the new standard. Additionally, the new standard will not have a material impact on the Company's lessor activities.
In June 2016, the FASB issued guidance on the impairment of financial instruments requiring an impairment model based on expected losses rather than incurred losses. Under this guidance, an entity recognizes as an allowance its estimate of expected credit losses. The guidance is effective for annual periods beginning after December 15, 2019, and interim periods within those annual periods. Early adoption is permitted for annual periods beginning after December 15, 2018, and interim periods within those annual periods. The Company is evaluating the impact of adoption of this guidance on its financial position, results of operations and cash flows.
In August 2018, the FASB issued guidance modifying the disclosure requirements for fair value measurement. The guidance is effective for annual periods beginning after December 15, 2019. The Company is permitted to early adopt any removed or modified disclosures upon issuance of this update and delay adoption of the additional disclosures until the effective date. The Company is evaluating the impact of adoption of this guidance on its disclosures.
In August 2018, the FASB issued guidance modifying the disclosure requirements for employers that sponsor defined benefit pension or other postretirement plans. The guidance is effective for annual periods ending after December 15, 2020, with early adoption permitted. The Company is evaluating the impact of adoption of this guidance on its disclosures.
In August 2018, the FASB issued guidance aligning the requirements for capitalizing implementation costs incurred in a hosting arrangement that is a service contract with the requirements for capitalizing implementation costs incurred to develop or obtain internal-use software. The guidance is effective for annual periods beginning after December 15, 2019, and interim periods within those fiscal years with early adoption permitted. The Company will early adopt this guidance prospectively for all implementation costs incurred after January 1, 2019.
F-20
|
3.
|
ACQUISITIONS
|
Acquisition Agreement for Synergy Pharmaceuticals Inc.
On December 12, 2018, the Company entered into an agreement to acquire certain assets of Synergy Pharmaceuticals Inc. ("Synergy") in a transaction valued at approximately
$200 million
plus certain assumed liabilities. Under the terms of the agreement, the Company will serve as the “stalking horse” bidder in a court-supervised auction and sale process pursuant to Section 363 of the Bankruptcy Code, which is expected to be completed in March 2019. Completion of this transaction is subject to other parties having an opportunity to submit competing bids (which may be superior to the Company's), bankruptcy court approval and other customary closing conditions. If the Company's bid is successful, among the assets to be acquired are the worldwide rights to the Trulance
®
(plecanatide) product; a once-daily tablet for adults with chronic idiopathic constipation and irritable bowel syndrome with constipation.
Noncontrolling Interest in Medpharm
a
On October 16, 2018, using cash on hand, the Company acquired the
40%
noncontrolling interest of Medpharma Pharmaceutical & Chemical Industries LLC (“Medpharma”) for
$18 million
. The difference between the carrying value and the price paid for the noncontrolling interest in Medpharma of
$15 million
, is a reduction of additional paid-in capital.
There were
no
other material business combinations in 2018, 2017 or 2016. The measurement period for all other acquisitions has closed.
Licensing Agreement
On February 21, 2017, EyeGate Pharmaceuticals, Inc. (“EyeGate”) granted a subsidiary of the Company the exclusive worldwide licensing rights to manufacture and sell the EyeGate
®
II Delivery System and EGP-437 combination product candidate for the treatment of post-operative pain and inflammation in ocular surgery patients. EyeGate will be responsible for the continued development of this product candidate in the U.S. for the treatment of post-operative pain and inflammation in ocular surgery patients, and all associated costs. The Company has the right to further develop the product in the field outside of the U.S. at its cost. In connection with the licensing agreement, the Company paid an initial license fee of
$4 million
during the three months ended March 31, 2017 and is obligated to make future payments of: (i) up to
$34 million
upon the achievement of certain development and regulatory milestones, of which
$3 million
has been paid, (ii) up to
$65 million
upon the achievement of certain sales-based milestones and (iii) royalties. Based on early stage of development of the asset, and lack of acquired significant inputs, the Company concluded this was an asset acquisition.
On December 14, 2018, the Company issued a notice voluntarily terminating certain licensing agreements dated July 9, 2015 and February 21, 2017 as discussed above, with EyeGate effective March 14, 2019. Following the termination of these agreements on March 14, 2019, the Company will relinquish all rights to the EyeGate
®
II Delivery System and EGP-437 combination product. During the three months ended September 30, 2018, the Company fully impaired the EyeGate
®
II Delivery System and EGP-437 combination product intangible assets and reduced the carrying value of the contingent consideration liabilities associated with these licensing agreements to
zero
. As of December 31, 2018, future payments, if any, to reimburse EyeGate for certain out-of-pocket costs incurred in connection with development work pursuant to its licensing agreements with EyeGate will not be material.
|
4.
|
DIVESTITURES
|
The Company did
no
t make any material divestitures during 2018. During 2017 and 2016, the Company has divested certain businesses and assets, which, in each case, was not aligned with its core business objectives.
2017
CeraVe
®
, AcneFree
™
and AMBI
®
skincare brands
On March 3, 2017, the Company completed the sale of its interests in the CeraVe
®
, AcneFree
™
and AMBI
®
skincare brands for
$1,300 million
in cash (the “Skincare Sale”). The CeraVe
®
, AcneFree
™
and AMBI
®
skincare business was part of the Bausch + Lomb/International segment and was reclassified as held for sale as of December 31, 2016. Included in
Other (income) expense, net
for the year ended December 31, 2017 is the Gain on the Skincare Sale of
$309 million
, as adjusted.
F-21
Dendreon Pharmaceuticals LLC
On June 28, 2017, the Company completed the sale of all outstanding equity interests in Dendreon Pharmaceuticals LLC (formerly Dendreon Pharmaceuticals, Inc.) (“Dendreon”) for
$845 million
in cash (the “Dendreon Sale”), as adjusted. Dendreon was part of the former Branded Rx segment and was reclassified as held for sale as of December 31, 2016. Included in
Other (income) expense, net
for the year ended December 31, 2017 is the Gain on the Dendreon Sale of
$97 million
, as adjusted.
iNova Pharmaceuticals
On September 29, 2017, the Company completed the sale of its Australian-based iNova Pharmaceuticals (“iNova”) business for
$938 million
in cash (the “iNova Sale”), as adjusted. iNova markets a diversified portfolio of weight management, pain management, cardiology and cough and cold prescription and OTC products in more than
15
countries, with leading market positions in Australia and South Africa, as well as an established platform in Asia. The Company will continue to operate in these geographies through the Bausch + Lomb franchise. The iNova business was part of the Bausch + Lomb/International segment and was reclassified as held for sale as of December 31, 2016. Included in
Other (income) expense, net
for the year ended December 31, 2017 is the Gain on the iNova Sale of
$309 million
, as adjusted.
Obagi Medical Products, Inc.
On November 9, 2017, certain of the Company's affiliates completed the sale its Obagi Medical Products, Inc. (“Obagi”) business for
$190 million
in cash (the “Obagi Sale”). Obagi is a global specialty skin care pharmaceutical business with products focused on premature skin aging, skin damage, hyperpigmentation, acne and sun damage which are primarily available through dermatologists, plastic surgeons and other skin care professionals. The Obagi business was part of the former U.S. Diversified Products segment and was reclassified as held for sale as of March 31, 2017. The carrying value of the Obagi business, including associated goodwill, was adjusted to its estimated fair value less costs to sell and an impairment of
$103 million
was recognized in Asset impairments in the Consolidated Statement of Operations. Included in
Other (income) expense, net
for the year ended December 31, 2017 is a
$13 million
loss related to this transaction.
Sprout Pharmaceuticals, Inc.
On
December 20, 2017
, the Company completed the sale of Sprout to a buyer affiliated with certain former shareholders of Sprout (the “Sprout Sale”), in exchange for a
6%
royalty on global sales of Addyi
®
(flibanserin 100 mg) beginning June 2019. In connection with the completion of the Sprout Sale, the terms of the October 2015 merger agreement relating to the Company's acquisition of Sprout were amended to terminate the Company's ongoing obligation to make future royalty payments associated with the Addyi
®
product, as well as certain related provisions (including the obligation to make certain marketing and other expenditures). In connection with the completion of the Sprout Sale, the litigation against the Company, initiated on behalf of the former shareholders of Sprout, which disputed the Company's compliance with certain contractual terms of that same merger agreement with respect to the use of certain diligent efforts to develop and commercialize the Addyi
®
product (including a disputed contractual term with respect to the spend of no less than
$200 million
in certain expenditures), was dismissed with prejudice. In connection with the completion of the Sprout Sale, the Company issued the buyer a
five
-year
$25 million
loan for initial operating expenses. Addyi
®
, a once-daily, non-hormonal tablet approved for the treatment of acquired, generalized hypoactive sexual desire disorder in premenopausal women, is Sprout's only approved and commercialized product. Sprout was part of the former Branded Rx segment and was reclassified as held for sale as of September 30, 2017. The carrying value of the Sprout business, including associated goodwill, was adjusted to its estimated fair value less costs to sell and a
$351 million
impairment was recognized in Asset impairments in the year ended December 31, 2017. Upon consummation of the transaction, a loss of
$98 million
was recognized in
Other (income) expense, net
. The Company will recognize the agreed upon
6%
royalty of global sales of Addyi
®
beginning in June 2019 as these royalties become due, as the Company does not recognize contingent payments until such amounts are realizable.
2016
Portfolio of Neurology Medical Device Products
On April 1, 2016, the Company completed the sale of a portfolio of neurology medical device products, including product rights and related fixed assets, for an upfront payment and a milestone payment. These assets were included in the Bausch + Lomb /International segment and a nominal loss on sale in the second quarter of 2016 was recorded.
F-22
Ruconest
®
On December 7, 2016, the Company completed the sale of all North American commercialization rights to Ruconest
®
(recombinant human C1 esterase inhibitor) for up to
$125 million
in consideration, consisting of
$60 million
paid at closing and future sales-based milestone payments of up to
$65 million
. These assets were included in the former Branded Rx segment and were reclassified as held for sale in the second quarter of 2016. At that time, the assets were written down to the fair value of the expected consideration and a loss of
$199 million
was recorded in Asset impairments in the Consolidated Statement of Operations. Upon consummation of the transaction on December 7, 2016, a loss of
$22 million
was recognized in Other expense (income) in the year ended December 31, 2016 Consolidated Statement of Operations, representing the estimated fair value of the contingent consideration associated with the sale as the Company does not recognize contingent payments until such amounts are realizable. Through December 31, 2018,
$20 million
of sales-based milestones have been achieved.
Paragon Holdings I, Inc.
On November 9, 2016, the Company completed the sale of Paragon Holdings I, Inc. In connection with the divestiture, the Company recognized a loss of
$19 million
in the third quarter of 2016, when the assets of the divested business were classified as held for sale.
|
5.
|
RESTRUCTURING AND INTEGRATION COSTS
|
In connection with acquisitions prior to 2016, the Company implemented cost-rationalization and integration initiatives to capture operating synergies and generate cost savings. These measures included: (i) workforce reductions company-wide and other organizational changes, (ii) closing of duplicative facilities and other site rationalization actions company-wide, including research and development facilities, sales offices and corporate facilities, (iii) leveraging research and development spend and (iv) procurement savings. Cost-rationalization and integration initiatives relating to the acquisition of Salix Pharmaceuticals, Ltd. ("Salix Ltd.") in April 2015 (the "Salix Acquisition") were substantially completed by mid-2016 and are included in the amounts listed below. The remaining liability associated with all cost-rationalization and integration initiatives as of December 31, 2018 was
$27 million
.
During the year ended December 31, 2018, the Company incurred
$22 million
of restructuring and integration-related costs. These costs included: (i)
$11 million
of severance costs, (ii)
$10 million
of facility closure costs and (iii)
$1 million
of other costs. The Company made payments of
$33 million
during 2018.
During the year ended December 31, 2017, the Company incurred
$52 million
of restructuring and integration-related costs. These costs included: (i)
$16 million
of integration consulting, transition service and other costs, (ii)
$16 million
of severance costs and (iii)
$20 million
of facility closure costs. The Company made payments of
$85 million
during 2017.
During the year ended December 31, 2016, the Company incurred
$132 million
of restructuring and integration costs. These costs included: (i)
$90 million
of integration consulting, duplicate labor, transition service and other costs, (ii)
$22 million
of severance costs, (iii)
$19 million
of facility closure costs and (iv)
$1 million
of other costs. These costs primarily related to integration and restructuring costs for other smaller acquisitions. The Company made payments of
$121 million
during 2016.
The Company continues to evaluate opportunities to improve its operating results and may initiate additional cost savings programs to streamline its operations and eliminate redundant processes and expenses. The expenses associated with the implementation of these cost savings programs could be material and may include, but are not limited to, expenses associated with: (i) reducing headcount, (ii) eliminating real estate costs associated with unused or under-utilized facilities and (iii) implementing contribution margin improvement and other cost reduction initiatives.
|
6.
|
FAIR VALUE MEASUREMENTS
|
Fair value measurements are estimated based on valuation techniques and inputs categorized as follows:
|
•
|
Level 1 — Quoted prices in active markets for identical assets or liabilities;
|
|
•
|
Level 2 — Observable inputs other than Level 1 prices, such as quoted prices for similar assets or liabilities, or other inputs that are observable or can be corroborated by observable market data for substantially the full term of the assets or liabilities; and
|
F-23
|
•
|
Level 3 — Unobservable inputs that are supported by little or no market activity and that are financial instruments whose values are determined using discounted cash flow methodologies, pricing models, or similar techniques, as well as instruments for which the determination of fair value requires significant judgment or estimation.
|
If the inputs used to measure the financial assets and liabilities fall within more than one level described above, the categorization is based on the lowest level input that is significant to the fair value measurement of the instrument.
Assets and Liabilities Measured at Fair Value on a Recurring Basis
The following fair value hierarchy table presents the components and classification of the Company’s financial assets and liabilities measured at fair value on a recurring basis as of
December 31, 2018
and
2017
:
|
|
2018
|
2017
|
||||||||||||||||||||||||||||||
|
(in millions)
|
Carrying
Value
|
Quoted
Prices
in Active
Markets for
Identical
Assets
(Level 1)
|
Significant
Other
Observable
Inputs
(Level 2)
|
Significant
Unobservable
Inputs
(Level 3)
|
Carrying
Value
|
Quoted
Prices
in Active
Markets for
Identical
Assets
(Level 1)
|
Significant
Other
Observable
Inputs
(Level 2)
|
Significant
Unobservable
Inputs
(Level 3)
|
||||||||||||||||||||||||
|
Assets:
|
|
|
|
|
|
|
|
|
||||||||||||||||||||||||
|
Cash equivalents
|
$
|
197
|
|
$
|
166
|
|
$
|
31
|
|
$
|
—
|
|
$
|
265
|
|
$
|
230
|
|
$
|
35
|
|
$
|
—
|
|
||||||||
|
Restricted cash
|
$
|
2
|
|
$
|
2
|
|
$
|
—
|
|
$
|
—
|
|
$
|
77
|
|
$
|
77
|
|
$
|
—
|
|
$
|
—
|
|
||||||||
|
Liabilities:
|
|
|
|
|
|
|
|
|
|
|||||||||||||||||||||||
|
Acquisition-related contingent consideration
|
$
|
339
|
|
$
|
—
|
|
$
|
—
|
|
$
|
339
|
|
$
|
387
|
|
$
|
—
|
|
$
|
—
|
|
$
|
387
|
|
||||||||
As of December 31, 2017, Restricted cash of
$77 million
was deposited with a bank as collateral to secure a bank guarantee for the benefit of the Australian Government in connection with the notice of assessment received on August 8, 2017 from the Australian Taxation Office, as discussed in
Note 17, "INCOME TAXES"
. On January 9, 2018, the cash collateral of
$77 million
of Restricted cash was returned to the Company in exchange for a
$77 million
letter of credit.
There were no transfers between Level 1, Level 2 or Level 3 during
2018
and
2017
.
Assets and Liabilities Measured at Fair Value on a Recurring Basis Using Significant Unobservable Inputs (Level 3)
The fair value measurement of acquisition-related contingent consideration arising from business combinations is determined via a probability-weighted discounted cash flow analysis or Monte Carlo Simulation, using unobservable (Level 3) inputs. These inputs may include: (i) the estimated amount and timing of projected cash flows; (ii) the probability of the achievement of the factor(s) on which the contingency is based; (iii) the risk-adjusted discount rate used to present value the probability-weighted cash flows; and (iv) volatility of projected performance (Monte Carlo Simulation). Significant increases (decreases) in any of those inputs in isolation could result in a significantly lower (higher) fair value measurement. At
December 31, 2018
, the fair value measurements of acquisition-related contingent consideration were determined using risk-adjusted discount rates ranging from
5%
to
25%
.
F-24
The following table presents a reconciliation of contingent consideration obligations measured on a recurring basis using significant unobservable inputs (Level 3) for
2018
and
2017
:
|
(in millions)
|
2018
|
2017
|
||||||||||||||
|
Beginning balance, January 1,
|
$
|
387
|
|
$
|
892
|
|
||||||||||
|
Adjustments to Acquisition-related contingent consideration:
|
||||||||||||||||
|
Accretion for the time value of money
|
$
|
24
|
|
$
|
54
|
|
||||||||||
|
Fair value adjustments to the expected future royalty payments for Addyi
®
|
—
|
|
(312
|
)
|
||||||||||||
|
Fair value adjustments due to changes in estimates of other future payments
|
(33
|
)
|
(31
|
)
|
||||||||||||
|
Acquisition-related contingent consideration adjustments
|
(9
|
)
|
(289
|
)
|
||||||||||||
|
Reclassified to liabilities held for sale and subsequently disposed
|
—
|
|
(168
|
)
|
||||||||||||
|
Payments / Settlements
|
(39
|
)
|
(49
|
)
|
||||||||||||
|
Foreign currency translation adjustment included in other comprehensive loss
|
—
|
|
1
|
|
||||||||||||
|
Ending balance, December 31,
|
339
|
|
387
|
|
||||||||||||
|
Current portion
|
41
|
|
43
|
|
||||||||||||
|
Non-current portion
|
$
|
298
|
|
$
|
344
|
|
||||||||||
During 2017 and prior to identifying the Sprout business as held for sale, the Company recorded fair value adjustments to contingent consideration to reflect management's revised estimates of the future sales of Addyi
®
. The Sprout Sale was completed on
December 20, 2017
and the remaining contingent consideration related to Addyi
®
was eliminated.
Fair Value of Long-term Debt
The fair value of long-term debt as of
December 31, 2018
and
2017
was
$23,357 million
and
$25,385 million
, respectively, and was estimated using the quoted market prices for the same or similar debt issuances (Level 2).
|
7.
|
INVENTORIES
|
Inventories, net of allowance for obsolescence,
as of December 31, 2018 and 2017
consist of:
|
(in millions)
|
2018
|
2017
|
||||||
|
Raw materials
|
$
|
275
|
|
$
|
276
|
|
||
|
Work in process
|
95
|
|
146
|
|
||||
|
Finished goods
|
564
|
|
626
|
|
||||
|
$
|
934
|
|
$
|
1,048
|
|
|||
|
8.
|
PROPERTY, PLANT AND EQUIPMENT
|
The major components of property, plant and equipment
as of December 31, 2018 and 2017
consist of:
|
(in millions)
|
2018
|
2017
|
||||||
|
Land
|
$
|
81
|
|
$
|
84
|
|
||
|
Buildings
|
693
|
|
687
|
|
||||
|
Machinery and equipment
|
1,527
|
|
1,436
|
|
||||
|
Other equipment and leasehold improvements
|
366
|
|
358
|
|
||||
|
Equipment on operating lease
|
46
|
|
42
|
|
||||
|
Construction in progress
|
162
|
|
226
|
|
||||
|
2,875
|
|
2,833
|
|
|||||
|
Less accumulated depreciation
|
(1,522
|
)
|
(1,430
|
)
|
||||
|
$
|
1,353
|
|
$
|
1,403
|
|
|||
Depreciation expense was
$175 million
,
$168 million
and
$193 million
for
2018
,
2017
and
2016
, respectively.
F-25
|
9.
|
INTANGIBLE ASSETS AND GOODWILL
|
Intangible Assets
The major components of intangible assets as of
December 31, 2018
and
2017
consist of:
|
|
Weighted-
Average
Useful
Lives
(Years)
|
2018
|
2017
|
||||||||||||||||||||||
|
(in millions)
|
Gross
Carrying
Amount
|
Accumulated
Amortization and Impairments
|
Net
Carrying
Amount
|
Gross
Carrying
Amount
|
Accumulated
Amortization and Impairments |
Net
Carrying
Amount
|
|||||||||||||||||||
|
Finite-lived intangible assets:
|
|
|
|
|
|
|
|
||||||||||||||||||
|
Product brands
|
7
|
$
|
20,891
|
|
$
|
(11,958
|
)
|
$
|
8,933
|
|
$
|
20,913
|
|
$
|
(9,281
|
)
|
$
|
11,632
|
|
||||||
|
Corporate brands
|
9
|
926
|
|
(263
|
)
|
663
|
|
933
|
|
(179
|
)
|
754
|
|
||||||||||||
|
Product rights/patents
|
4
|
3,292
|
|
(2,658
|
)
|
634
|
|
3,310
|
|
(2,346
|
)
|
964
|
|
||||||||||||
|
Partner relationships
|
2
|
168
|
|
(166
|
)
|
2
|
|
179
|
|
(169
|
)
|
10
|
|
||||||||||||
|
Technology and other
|
3
|
208
|
|
(173
|
)
|
35
|
|
214
|
|
(147
|
)
|
67
|
|
||||||||||||
|
Total finite-lived intangible assets
|
|
25,485
|
|
(15,218
|
)
|
10,267
|
|
25,549
|
|
(12,122
|
)
|
13,427
|
|
||||||||||||
|
Acquired IPR&D not in service
|
NA
|
36
|
|
—
|
|
36
|
|
86
|
|
—
|
|
86
|
|
||||||||||||
|
B&L Trademark
|
NA
|
1,698
|
|
—
|
|
1,698
|
|
1,698
|
|
—
|
|
1,698
|
|
||||||||||||
|
|
$
|
27,219
|
|
$
|
(15,218
|
)
|
$
|
12,001
|
|
$
|
27,333
|
|
$
|
(12,122
|
)
|
$
|
15,211
|
|
|||||||
Long-lived assets with finite lives are tested for impairment whenever events or changes in circumstances indicate that the carrying value of an asset may not be recoverable. Impairment charges associated with these assets are included in Asset impairments in the Consolidated Statement of Operations. The Company continues to monitor the recoverability of its finite-lived intangible assets and tests the intangible assets for impairment if indicators of impairment are present.
Asset impairments in 2018 included impairments of: (i)
$348 million
reflecting decreases in forecasted sales for the Uceris
®
Tablet product in the Company's Salix reporting unit and other product lines due to generic competition, (ii)
$132 million
reflecting decreases in forecasted sales for the Arestin
®
product in the Company's Dentistry reporting unit and other product lines due to changing market conditions, (iii)
$55 million
, in aggregate, related to certain product/patent assets associated with the discontinuance of specific product lines not aligned with the focus of the Company's core businesses, (iii)
$28 million
to Acquired IPR&D not in service related to a certain product and (iv)
$5 million
related to assets being classified as held for sale.
Asset impairments in 2017 included impairments of: (i)
$351 million
related to the Sprout business being classified as held for sale, (ii)
$151 million
reflecting decreases in forecasted sales for other product lines, (iii)
$114 million
to other assets classified as held for sale, primarily related to the Obagi business, (iv)
$95 million
, in aggregate, to certain product/patent assets associated with the discontinuance of specific product lines not aligned with the focus of the Company's core business and (v)
$3 million
related to acquired IPR&D.
Asset impairments in 2016 included impairments of: (i)
$221 million
related to the divestiture of Ruconest
®
, (ii)
$88 million
related to other assets classified as held for sale, (iii)
$74 million
related to other asset impairments which were individually not material, (iv)
$25 million
related to IBS
Chek
TM
due to a decrease in forecasted sales and (v)
$14 million
related to acquired IPR&D.
The impairments to assets reclassified as held for sale were measured as the difference of the carrying value of these assets as compared to the estimated fair values of these assets less costs to sell determined using a discounted cash flow analysis which utilized Level 3 unobservable inputs. The other impairments and adjustments to finite-lived intangible assets were measured as the difference of the historical carrying value of these finite-lived assets as compared to the estimated fair value as determined using a discounted cash flow analysis using Level 3 unobservable inputs.
Periodically, the Company’s products face the expiration of their patent or regulatory exclusivity. The Company anticipates that product sales for such product would decrease shortly following a loss of exclusivity, due to the possible entry of a generic competitor. Where the Company has the rights, it may elect to launch an authorized generic of such product (either as the Company’s own branded generic or through a third-party). This may occur prior to, upon or following generic entry, which
F-26
may mitigate the anticipated decrease in product sales; however, even with launch of an authorized generic, the decline in product sales of such product could still be significant, and the effect on future revenues could be material.
As a result of the launch of a generic competitor in July 2018, the Company revised its near and long term financial projections of the Uceris
®
Tablet-related intangible assets. As of June 30, 2018, the carrying value of the Uceris
®
Tablet-related intangible assets exceeded the undiscounted expected cash flows from the Uceris
®
Tablet. As a result, the Company recognized an impairment of
$263 million
to reduce the carrying value of the Uceris
®
Tablet-related intangible assets to their estimated fair value.
As of December 31, 2018
, the remaining carrying value of the Uceris
®
Tablet-related intangible assets was
$140 million
. The Company initiated infringement proceedings against this generic competitor shortly after their launch. The Company continues to believe that its Uceris
®
Tablet related patents are enforceable and is proceeding in the ongoing litigation between the Company and the generic competitor; however, the ultimate outcome of the matter is not predictable.
Management continually assesses the useful lives related to the Company's long-lived assets to reflect the most current assumptions. In review of the Company’s finite-lived intangible assets, management revised the estimated useful lives of certain intangible assets in 2018 and 2017.
In review of the Company’s finite-lived intangible assets, management revised the estimated useful lives of certain intangible assets in the third and fourth quarters of 2017. As a result, the useful lives of certain product brands, with an aggregate carrying value of
$7,618 million
as of December 31, 2017, were revised from an average of
seven
years to
four
years primarily due to revisions in forecasted sales as a result of revisions to the date each product is expected to lose exclusivity. In addition, the useful life of the Salix Brand, with a carrying value of
$569 million
as of December 31, 2017, was revised from
seventeen
years to
ten
years, due to a change in the forecasted sales of its product portfolio.
Effective September 12, 2018, the Company changed the estimated useful life of its Xifaxan
®
-related intangible assets due to the positive impact of the agreement between the Company and Actavis resolving the intellectual property litigation regarding Xifaxan
®
tablets, 550 mg. As discussed in further detail in
Note 20, "LEGAL PROCEEDINGS"
, the parties have agreed to dismiss all litigation related to Xifaxan
®
tablets, 550 mg and all intellectual property protecting Xifaxan
®
will remain intact and enforceable. As a result, the useful life of the Xifaxan
®
-related intangible assets was extended from 2024 to January 1, 2028. As this change in the estimated useful life is a change in accounting estimate, amortization expense is impacted prospectively. The change in the estimated useful life of the Xifaxan
®
-related intangible assets resulted in a decrease to the Net loss attributable to Bausch Health Companies Inc. of
$143 million
, and a decrease to the Basic and Diluted Loss per share attributable to Bausch Health Companies Inc. of
$0.41
for the year ended December 31, 2018. As of December 31, 2018, the net carrying value of the Xifaxan
®
-related intangible assets was
$4,848 million
.
Estimated amortization of finite-lived intangible assets for the five years ending December 31 and thereafter are as follows:
|
(in millions)
|
||||
|
2019
|
$
|
1,877
|
|
|
|
2020
|
1,613
|
|
||
|
2021
|
1,365
|
|
||
|
2022
|
1,214
|
|
||
|
2023
|
1,063
|
|
||
|
Thereafter
|
3,135
|
|
||
|
Total
|
$
|
10,267
|
|
|
F-27
Goodwill
The changes in the carrying amount of goodwill for the
years ended December 31, 2018, 2017 and 2016
were as follows:
|
(in millions)
|
Developed Markets
|
Emerging Markets
|
Bausch +
Lomb/
International
|
Branded Rx
|
U.S. Diversified Products
|
Salix
|
Ortho Dermatologics
|
Diversified Products
|
Total
|
|||||||||||||||||||||||||||
|
Balance, January 1, 2016
|
$
|
16,141
|
|
$
|
2,412
|
|
$
|
—
|
|
$
|
—
|
|
$
|
—
|
|
$
|
—
|
|
$
|
—
|
|
$
|
—
|
|
$
|
18,553
|
|
|||||||||
|
Acquisitions
|
1
|
|
—
|
|
—
|
|
—
|
|
—
|
|
—
|
|
—
|
|
—
|
|
1
|
|
||||||||||||||||||
|
Divestiture of a portfolio of neurology medical device products
|
(36
|
)
|
—
|
|
—
|
|
—
|
|
—
|
|
—
|
|
—
|
|
—
|
|
(36
|
)
|
||||||||||||||||||
|
Goodwill related to Ruconest
®
reclassified to assets held for sale
|
(37
|
)
|
—
|
|
—
|
|
—
|
|
—
|
|
—
|
|
—
|
|
—
|
|
(37
|
)
|
||||||||||||||||||
|
Foreign exchange and other
|
47
|
|
(12
|
)
|
—
|
|
—
|
|
—
|
|
—
|
|
—
|
|
—
|
|
35
|
|
||||||||||||||||||
|
Impairment of the former U.S. reporting unit
|
(905
|
)
|
—
|
|
—
|
|
—
|
|
—
|
|
—
|
|
—
|
|
—
|
|
(905
|
)
|
||||||||||||||||||
|
Realignment of segment goodwill
|
(15,211
|
)
|
(2,400
|
)
|
6,708
|
|
7,873
|
|
3,030
|
|
—
|
|
—
|
|
—
|
|
—
|
|
||||||||||||||||||
|
Impairment of the Salix reporting unit
|
—
|
|
—
|
|
—
|
|
(172
|
)
|
—
|
|
—
|
|
—
|
|
—
|
|
(172
|
)
|
||||||||||||||||||
|
Divestitures
|
—
|
|
—
|
|
(5
|
)
|
—
|
|
—
|
|
—
|
|
—
|
|
—
|
|
(5
|
)
|
||||||||||||||||||
|
Goodwill of certain businesses reclassified to assets held for sale
|
—
|
|
—
|
|
(947
|
)
|
(431
|
)
|
—
|
|
—
|
|
—
|
|
—
|
|
(1,378
|
)
|
||||||||||||||||||
|
Foreign exchange and other
|
—
|
|
—
|
|
(257
|
)
|
(5
|
)
|
—
|
|
—
|
|
—
|
|
—
|
|
(262
|
)
|
||||||||||||||||||
|
Balance, December 31, 2016
|
—
|
|
—
|
|
5,499
|
|
7,265
|
|
3,030
|
|
—
|
|
—
|
|
—
|
|
15,794
|
|
||||||||||||||||||
|
Realignment of segment goodwill
|
—
|
|
—
|
|
264
|
|
(264
|
)
|
—
|
|
—
|
|
—
|
|
—
|
|
—
|
|
||||||||||||||||||
|
Goodwill reclassified to assets held for sale and subsequently disposed
|
—
|
|
—
|
|
(30
|
)
|
(61
|
)
|
(84
|
)
|
—
|
|
—
|
|
—
|
|
(175
|
)
|
||||||||||||||||||
|
Impairment of the former Branded Rx reporting unit
|
—
|
|
—
|
|
—
|
|
(312
|
)
|
—
|
|
—
|
|
—
|
|
—
|
|
(312
|
)
|
||||||||||||||||||
|
Foreign exchange and other
|
—
|
|
—
|
|
283
|
|
3
|
|
—
|
|
—
|
|
—
|
|
—
|
|
286
|
|
||||||||||||||||||
|
Balance, December 31, 2017
|
—
|
|
—
|
|
6,016
|
|
6,631
|
|
2,946
|
|
—
|
|
—
|
|
—
|
|
15,593
|
|
||||||||||||||||||
|
Impairment of the Salix and Ortho Dermatologics reporting units
|
—
|
|
—
|
|
—
|
|
(2,213
|
)
|
—
|
|
—
|
|
—
|
|
—
|
|
(2,213
|
)
|
||||||||||||||||||
|
Realignment of Global Solta reporting unit goodwill
|
—
|
|
—
|
|
(82
|
)
|
115
|
|
(33
|
)
|
—
|
|
—
|
|
—
|
|
—
|
|
||||||||||||||||||
|
Goodwill reclassified to assets held for sale and subsequently disposed
|
—
|
|
—
|
|
(2
|
)
|
—
|
|
—
|
|
—
|
|
—
|
|
—
|
|
(2
|
)
|
||||||||||||||||||
|
Realignment of segment goodwill
|
—
|
|
—
|
|
—
|
|
(4,533
|
)
|
(2,913
|
)
|
3,156
|
|
1,267
|
|
3,023
|
|
—
|
|
||||||||||||||||||
|
Impairment of the Dentistry reporting unit
|
—
|
|
—
|
|
—
|
|
—
|
|
—
|
|
—
|
|
—
|
|
(109
|
)
|
(109
|
)
|
||||||||||||||||||
|
Foreign exchange and other
|
—
|
|
—
|
|
(127
|
)
|
—
|
|
—
|
|
—
|
|
—
|
|
—
|
|
(127
|
)
|
||||||||||||||||||
|
Balance, December 31, 2018
|
$
|
—
|
|
$
|
—
|
|
$
|
5,805
|
|
$
|
—
|
|
$
|
—
|
|
$
|
3,156
|
|
$
|
1,267
|
|
$
|
2,914
|
|
$
|
13,142
|
|
|||||||||
Goodwill is not amortized but is tested for impairment at least annually at the reporting unit level. A reporting unit is the same as, or one level below, an operating segment. The fair value of a reporting unit refers to the price that would be received to sell the unit as a whole in an orderly transaction between market participants. The Company estimates the fair values of all reporting units using a discounted cash flow model which utilizes Level 3 unobservable inputs.
The discounted cash flow model relies on assumptions regarding revenue growth rates, gross profit, projected working capital needs, selling, general and administrative expenses, research and development expenses, capital expenditures, income tax rates, discount rates and terminal growth rates. To estimate fair value, the Company discounts the forecasted cash flows of
F-28
each reporting unit. The discount rate the Company uses represents the estimated weighted average cost of capital, which reflects the overall level of inherent risk involved in its reporting unit operations and the rate of return a market participant would expect to earn. The Company performed its annual impairment test as of October 1, 2018, utilizing long-term growth rates for its reporting units ranging from
1.0%
to
3.0%
and discount rates applied to the estimated cash flows ranging from
7.5%
to
14.0%
in estimation of fair value. To estimate cash flows beyond the final year of its model, the Company estimates a terminal value by applying an in perpetuity growth assumption and discount factor to determine the reporting unit's terminal value.
The Company forecasts cash flows for each of its reporting units and takes into consideration economic conditions and trends, estimated future operating results, management's and a market participant's view of growth rates and product lives, and anticipates future economic conditions. Revenue growth rates inherent in these forecasts were based on input from internal and external market research that compare factors such as growth in global economies, recent industry trends and product life-cycles. Macroeconomic factors such as changes in economies, changes in the competitive landscape including the unexpected loss of exclusivity to the Company's product portfolio, changes in government legislation, product life-cycles, industry consolidations and other changes beyond the Company’s control could have a positive or negative impact on achieving its targets. Accordingly, if market conditions deteriorate, or if the Company is unable to execute its strategies, it may be necessary to record impairment charges in the future.
2016
Prior to the change in operating segments in the third quarter of 2016, the Company operated in
two
operating and reportable segments: Developed Markets and Emerging Markets. The Developed Markets segment consisted of
four
geographic reporting units: (i) U.S., (ii) Canada and Australia, (iii) Western Europe and (iv) Japan. The Emerging Markets segment consisted of
three
geographic reporting units: (i) Central and Eastern Europe, Middle East and Africa, (ii) Latin America and (iii) Asia.
2016 Realignment of Segment Structure
Commencing in the third quarter of 2016, the Company then operated in
three
operating segments: (i) Bausch + Lomb/International, (ii) Branded Rx and (iii) U.S. Diversified Products. This 2016 segment structure realignment resulted in the Bausch + Lomb/International segment consisting of the following reporting units: (i) U.S. Bausch + Lomb and (ii) International; the Branded Rx segment consisting of the following reporting units: (i) Salix, (ii) Dermatology, (iii) Canada and (iv) Branded Rx Other; and the U.S. Diversified Products segment consisting of the following reporting units: (i) Neurology and other and (ii) Generics. As a result of these changes, goodwill was reassigned to each of the aforementioned reporting units using a relative fair value approach. Goodwill previously reported in the former U.S. reporting unit, after adjustment of impairment as described below, was reassigned, using a relative fair value approach, to the U.S. Bausch + Lomb, Salix, Dermatology, Branded Rx Other, Neurology and other, and Generics reporting units. Similarly, goodwill previously reported in the former Canada and Australia reporting unit was reassigned to the Canada and the International reporting units using a relative fair value approach. Goodwill previously reported in the remaining former reporting units was reassigned to the International reporting unit.
In the third quarter of 2016, goodwill impairment testing was performed under the former reporting unit structure immediately prior to the change and under the then-current reporting unit structure immediately subsequent to the change. Using the forecasts and assumptions at the time, management estimated the fair value of each reporting unit using a discounted cash flow analysis. As a result of its test, management determined that goodwill associated with the former U.S. reporting unit and the goodwill associated with the Salix reporting unit under the then-current reporting unit structure were impaired. Consequently, in the aggregate, goodwill impairment charges of
$1,077 million
were recognized.
2016 Annual Goodwill Impairment Test
The Company conducted its annual goodwill impairment test as of October 1, 2016 and determined that the carrying value of the Salix reporting unit exceeded its fair value and, as a result, the Company proceeded to perform step two of the goodwill impairment test for the Salix reporting unit. After completing step two of the impairment testing, the Company determined that the carrying value of the unit's goodwill did not exceed its implied fair value and, therefore,
no
impairment was identified to the goodwill of the Salix reporting unit. At the date of testing, the Salix reporting unit had a carrying value of
$14,087 million
, an estimated fair value of
$10,319 million
and goodwill with a carrying value of
$5,128 million
. The Company's remaining reporting units passed step one of the goodwill impairment test as the estimated fair value of each reporting unit exceeded its carrying value at the date of testing and, therefore, there was no impairment to goodwill.
F-29
2017
2017 Realignment of Segment Structure
Effective January 1, 2017, revenues and profits from the Company's operations in Canada were reclassified from the former Branded Rx segment to the Bausch + Lomb/International segment. In connection with this change, the prior-period presentation of segment goodwill has been recast to conform to the then-current reporting structure, of which
$264 million
of goodwill as of December 31, 2016 was reclassified from the former Branded Rx segment to the Bausch + Lomb/International segment. No facts or circumstances were identified in connection with this change in alignment that would suggest an impairment existed.
As detailed in
Note 4, "DIVESTITURES"
, the Sprout business was classified as held for sale as of September 30, 2017. As the Sprout business represented only a portion of a former Branded Rx reporting unit, the Company assessed the remaining reporting unit for impairment and determined the carrying value of the remaining reporting unit exceeded its fair value. After completing step two of the impairment testing, the Company determined and recorded a goodwill impairment charge of
$312 million
during the three months ended September 30, 2017.
2017 Annual Goodwill Impairment Test
The Company conducted its annual goodwill impairment test as of October 1, 2017 and determined that the carrying value of the Salix reporting unit exceeded its fair value and, as a result, the Company proceeded to perform step two of the goodwill impairment test for the Salix reporting unit. After completing step two of the impairment testing, the Company determined that the carrying value of the unit's goodwill did not exceed its implied fair value and, therefore,
no
impairment was identified to the goodwill of the Salix reporting unit. As of the date of testing, the Salix reporting unit had an estimated fair value of
$10,660 million
and a carrying value of
$13,404 million
, including goodwill of
$5,127 million
. The Company's remaining reporting units passed step one of the goodwill impairment test as the estimated fair value of each reporting unit exceeded its carrying value at the date of testing and, therefore, there was no impairment to goodwill.
Subsequent to the annual impairment test, the Company considered events occurring after October 1
st
to determine if further testing was required. The Company considered the impact of the changes in the Tax Act on its reporting units, including the impact on the carrying value, for changes in deferred tax assets and liabilities, and changes in assumptions related to the tax rate when assessing the fair value. The Company concluded that the fair value continued to exceed the carrying value for all reporting units, except Salix, after considering the impact of the changes in the Tax Act. Further, the step 2 impairment test for Salix continued to support the carrying value of goodwill. As a result, no additional impairment charges were recorded.
2018
Adoption of New Accounting Guidance for Goodwill Impairment Testing
In January 2017, the FASB issued guidance which simplifies the subsequent measurement of goodwill by eliminating “Step 2” from the goodwill impairment test. Instead, goodwill impairment is measured as the amount by which a reporting unit's carrying value exceeds its fair value. The Company elected to early adopt this guidance effective January 1, 2018.
Upon adopting the new guidance, the Company tested goodwill for impairment and determined that the carrying value of the Salix reporting unit exceeded its fair value. As a result of the adoption of new accounting guidance, the Company recognized a goodwill impairment of
$1,970 million
associated with the Salix reporting unit.
As of October 1, 2017, the date of the 2017 annual impairment test, the fair value of the Ortho Dermatologics reporting unit exceeded its carrying value. However, at January 1, 2018, the carrying value of the Ortho Dermatologics reporting unit exceeded its fair value. Unforeseen changes in the business dynamics of the Ortho Dermatologics reporting unit, such as: (i) changes in the dermatology sector, (ii) increased pricing pressures from third-party payors, (iii) additional risks to the exclusivity of certain products and (iv) an expected longer launch cycle for a new product, were factors that negatively impacted the reporting unit's operating results beyond management's expectations as of October 1, 2017, when the Company performed its 2017 annual goodwill impairment test. In response to these adverse business indicators, the Company reduced its near and long term financial projections for the Ortho Dermatologics reporting unit. As a result of the reductions in the near and long term financial projections, the carrying value of the Ortho Dermatologics reporting unit exceeded its fair value at January 1, 2018 and the Company recognized a goodwill impairment of
$243 million
.
As of January 1, 2018, the fair value of all other reporting units exceeded their respective carrying value by more than
15%
.
F-30
2018 Realignment of Solta Business
Effective March 1, 2018, revenues and profits from the U.S. Solta business included in the former U.S. Diversified Products segment in prior periods and revenues and profits from the international Solta business included in the Bausch + Lomb/International segment in prior periods, are reported in the new Global Solta reporting unit, which, at that time, was a part of the former Branded Rx segment. As a result of this change,
$115 million
of goodwill was reallocated to the new Global Solta reporting unit and the Company assessed the impact on the fair values of each of the reporting units affected. After considering, among other matters: (i) the limited period of time between last impairment test (January 1, 2018) and the realignment (March 1, 2018), (ii) the results of the last impairment test and (iii) the amount of goodwill reallocated to the new Global Solta reporting unit, the Company did not identify any indicators of impairment at the time of the realignment.
2018 Realignment of Segment Structure
In the second quarter of 2018, the Company began operating in the following reportable segments: (i) Bausch + Lomb/International segment, (ii) Salix segment, (iii) Ortho Dermatologics segment and (iv) Diversified Products segment. The Bausch + Lomb/International segment consists of the: (i) U.S. Bausch + Lomb and (ii) International reporting units. The Salix segment consists of the Salix reporting unit. The Ortho Dermatologics segment consists of the: (i) Ortho Dermatologics and (ii) Global Solta reporting units. The Diversified Products segment consists of the: (i) Neurology and Other, (ii) Generics and (iii) Dentistry reporting units. There was no triggering event which would require the Company to test goodwill for impairment as a result of the second quarter realignment of the segment structure as it did not result in a change in the reporting units.
2018 Interim Goodwill Impairment Assessments - Salix
As a result of the change in accounting policy for goodwill impairment testing and the resulting impairment to the goodwill of the Salix reporting unit as of January 1, 2018, the carrying value of the Salix reporting unit approximated its fair value at that time. Therefore, during the three months ended March 31, 2018, June 30, 2018 and September 30, 2018, the Company performed qualitative assessments of the Salix reporting unit to determine if testing was warranted.
As part of these qualitative assessments, management considered the revisions made to its forecasts for the Salix reporting unit and compared the reporting unit’s revised operating results to its original forecasts through the date of each assessment. The revisions to the forecasts reflected, among other matters: (i) the launch of a generic competitor in July 2018 to the Company’s Uceris
®
Tablet product, (ii) the improved performance of the remaining Salix product portfolio, including the Xifaxan
®
products, (iii) the positive impact of the settlement agreement between the Company and Actavis resolving the intellectual property litigation regarding Xifaxan
®
tablets, 550 mg and (iv) certain other assumptions used in preparing its discounted cash flow model. As part of these qualitative assessments, management also considered the sensitivity of its conclusions as they relate to changes in the estimates and assumptions used in the latest forecast available for each period. Based on these qualitative assessments, management believed that the carrying value of the Salix reporting unit did not exceed its fair value and, therefore, concluded a quantitative assessment was not required for the Salix reporting unit.
2018 Interim Goodwill Impairment Assessments and Testing - Ortho Dermatologics
As a result of the change in accounting policy for goodwill impairment testing and the resulting impairment to the goodwill of the Ortho Dermatologics reporting unit as of January 1, 2018, the carrying value of the Ortho Dermatologics reporting unit approximated its fair value at that time. Therefore, during the three months ended March 31, 2018, June 30, 2018 and September 30, 2018, the Company performed qualitative assessments of the Ortho Dermatologics reporting unit to determine if testing was warranted.
As part of the qualitative assessment as of March 31, 2018, management compared the reporting unit’s operating results to the forecast used to test the goodwill of the Ortho Dermatologics reporting unit as of January 1, 2018. Based on the qualitative assessment, management believed that the carrying value of Ortho Dermatologics reporting unit did not exceed its fair value and, therefore, concluded a quantitative assessment was not required at March 31, 2018.
During the three months ended June 30, 2018, unforeseen changes in the business dynamics of the Ortho Dermatologics reporting unit, such as changes in the dermatology sector, additional risks to the exclusivity of certain products and a longer than originally expected launch cycle for a certain product, were factors that negatively impacted the reporting unit's operating results beyond management's expectations as of January 1, 2018, when the Company performed its last goodwill impairment test. In response to these adverse business indicators, the Company performed a goodwill impairment test of the Ortho
F-31
Dermatologics reporting unit. Based on the goodwill impairment test performed, the estimated fair value of the Ortho Dermatologics reporting unit exceeded its carrying value at the date of testing by approximately
5%
and, therefore, there was
no
impairment to goodwill.
As part of the qualitative assessment as of September 30, 2018, management compared the reporting unit’s operating results to the forecast used to test the goodwill of the Ortho Dermatologics reporting unit as of June 30, 2018. Based on the qualitative assessment, management believed that the carrying value of Ortho Dermatologics reporting unit did not exceed its fair value and, therefore, concluded a quantitative assessment was not required at September 30, 2018.
2018 Annual Goodwill Impairment Test
The Company conducted its annual goodwill impairment test as of October 1, 2018 and determined that the carrying value of the Dentistry reporting unit exceeded its fair value and, as a result, the Company recognized a goodwill impairment of
$109 million
for the Dentistry reporting unit, representing the full amount of goodwill for the reporting unit. Changing market conditions such as: (i) an increasing competitive environment and (ii) increasing pricing pressures negatively impacted the reporting unit's operating results. The Company is taking steps to address these changing market and business conditions.
The Company's remaining reporting units passed the goodwill impairment test as the estimated fair value of each reporting unit exceeded its carrying value at the date of testing and, therefore, there was
no
impairment to goodwill for any reporting unit other than the Dentistry reporting unit. In order to evaluate the sensitivity of its fair value calculations on the goodwill impairment test, the Company compared the carrying value of each reporting unit to its fair value as of October 1, 2018, the date of testing. As of October 1, 2018, the fair value of each reporting unit with associated goodwill exceeded its carrying value by more than
15%
. If market conditions deteriorate, or if the Company is unable to execute its strategies, it may be necessary to record impairment charges in the future. The Company will continue to perform qualitative interim assessments of the carrying value and fair value of the Ortho Dermatologics reporting unit on a quarterly basis to determine if impairment testing of goodwill will be warranted.
Total accumulated goodwill impairment charges to date are
$3,711 million
.
|
10.
|
ACCRUED AND OTHER CURRENT LIABILITIES
|
Accrued and other current liabilities
as of December 31, 2018 and 2017
consist of:
|
(in millions)
|
2018
|
2017
|
||||||
|
Product rebates
|
$
|
998
|
|
$
|
1,094
|
|
||
|
Product returns
|
813
|
|
863
|
|
||||
|
Interest
|
273
|
|
324
|
|
||||
|
Employee compensation and benefit costs
|
301
|
|
259
|
|
||||
|
Income taxes payable
|
167
|
|
202
|
|
||||
|
Other
|
645
|
|
952
|
|
||||
|
$
|
3,197
|
|
$
|
3,694
|
|
|||
F-32
|
11.
|
FINANCING ARRANGEMENTS
|
Principal amounts of debt obligations and principal amounts of debt obligations net of discounts and issuance costs
as of December 31, 2018 and 2017
consists of the following:
|
2018
|
|
2017
|
||||||||||||||||
|
(in millions)
|
Maturity
|
Principal Amount
|
Net of Discounts and Issuance Costs
|
Principal Amount
|
Net of Discounts and Issuance Costs
|
|||||||||||||
|
Senior Secured Credit Facilities:
|
||||||||||||||||||
|
2018 Revolving Credit Facility
|
April 2018
|
$
|
—
|
|
$
|
—
|
|
$
|
—
|
|
$
|
—
|
|
|||||
|
2020 Revolving Credit Facility
|
(1)
|
—
|
|
—
|
|
250
|
|
250
|
|
|||||||||
|
2023 Revolving Credit Facility
|
June 2023
|
75
|
|
75
|
|
—
|
|
—
|
|
|||||||||
|
Series F Tranche B Term Loan Facility
|
April 2022
|
—
|
|
—
|
|
3,521
|
|
3,420
|
|
|||||||||
|
June 2025 Term Loan B Facility
|
June 2025
|
4,394
|
|
4,269
|
|
—
|
|
—
|
|
|||||||||
|
November 2025 Term Loan B Facility
|
November 2025
|
1,481
|
|
1,456
|
|
—
|
|
—
|
|
|||||||||
|
Senior Secured Notes:
|
||||||||||||||||||
|
6.50% Secured Notes
|
March 2022
|
1,250
|
|
1,239
|
|
1,250
|
|
1,235
|
|
|||||||||
|
7.00% Secured Notes
|
March 2024
|
2,000
|
|
1,979
|
|
2,000
|
|
1,975
|
|
|||||||||
|
5.50% Secured Notes
|
November 2025
|
1,750
|
|
1,730
|
|
1,750
|
|
1,729
|
|
|||||||||
|
Senior Unsecured Notes:
|
|
|||||||||||||||||
|
5.375%
|
March 2020
|
—
|
|
—
|
|
1,708
|
|
1,699
|
|
|||||||||
|
7.00%
|
October 2020
|
—
|
|
—
|
|
71
|
|
71
|
|
|||||||||
|
6.375%
|
October 2020
|
—
|
|
—
|
|
661
|
|
656
|
|
|||||||||
|
7.50%
|
July 2021
|
—
|
|
—
|
|
1,625
|
|
1,615
|
|
|||||||||
|
6.75%
|
August 2021
|
—
|
|
—
|
|
650
|
|
648
|
|
|||||||||
|
5.625%
|
December 2021
|
700
|
|
697
|
|
900
|
|
896
|
|
|||||||||
|
7.25%
|
July 2022
|
—
|
|
—
|
|
550
|
|
545
|
|
|||||||||
|
5.50%
|
March 2023
|
1,000
|
|
995
|
|
1,000
|
|
993
|
|
|||||||||
|
5.875%
|
May 2023
|
3,250
|
|
3,229
|
|
3,250
|
|
3,224
|
|
|||||||||
|
4.50% euro-denominated debt
|
May 2023
|
1,720
|
|
1,709
|
|
1,801
|
|
1,787
|
|
|||||||||
|
6.125%
|
April 2025
|
3,250
|
|
3,226
|
|
3,250
|
|
3,222
|
|
|||||||||
|
9.00%
|
December 2025
|
1,500
|
|
1,469
|
|
1,500
|
|
1,464
|
|
|||||||||
|
9.25%
|
April 2026
|
1,500
|
|
1,482
|
|
—
|
|
—
|
|
|||||||||
|
8.50%
|
January 2027
|
750
|
|
738
|
|
—
|
|
—
|
|
|||||||||
|
Other
|
Various
|
12
|
|
12
|
|
15
|
|
15
|
|
|||||||||
|
Total long-term debt and other
|
|
|
|
$
|
24,632
|
|
24,305
|
|
|
$
|
25,752
|
|
25,444
|
|
||||
|
Less: Current portion of long-term debt and other
|
|
228
|
|
209
|
|
|||||||||||||
|
Non-current portion of long-term debt
|
|
|
|
|
|
$
|
24,077
|
|
|
$
|
25,235
|
|
||||||
1
The 2020 Revolving Credit Facility available at December 31, 2017 had a maturity date of April 2020 and was replaced with the 2023 Revolving Credit Facility on June 1, 2018 as discussed below.
Covenant Compliance
The Senior Secured Credit Facilities (as defined below) and the indentures governing the Senior Secured Notes and Senior Unsecured Notes contain customary affirmative and negative covenants and specified events of default. These affirmative and negative covenants include, among other things, and subject to certain qualifications and exceptions, covenants that restrict the Company’s ability and the ability of its subsidiaries to: incur or guarantee additional indebtedness; create or permit liens on assets; pay dividends on capital stock or redeem, repurchase or retire capital stock or subordinated indebtedness; make certain investments and other restricted payments; engage in mergers, acquisitions, consolidations and amalgamations; transfer and sell certain assets; and engage in transactions with affiliates. The 2023 Revolving Credit Facility also contains a financial
F-33
maintenance covenant that requires the Company to maintain a first lien net leverage ratio of not greater than
4.00
:1.00. The financial maintenance covenant may be waived or amended without the consent of the term loan facility lenders and contains a customary term loan facility standstill.
As of December 31, 2018
, the Company was in compliance with its financial maintenance covenant related to its debt obligations. The Company, based on its current forecast for the next twelve months from the date of issuance of these financial statements, expects to remain in compliance with its financial maintenance covenant and meet its debt service obligations over that same period.
The Company continues to take steps to improve its operating results to ensure continual compliance with its financial maintenance covenant and may take other actions to reduce its debt levels to align with the Company’s long term strategy, including divesting other businesses, refinancing debt and issuing equity or equity-linked securities as deemed appropriate.
Senior Secured Credit Facilities
On February 13, 2012, the Company and certain of its subsidiaries as guarantors entered into the “Senior Secured Credit Facilities” under the Company’s Third Amended and Restated Credit and Guaranty Agreement, as amended (the “Third Amended Credit Agreement”) with a syndicate of financial institutions and investors, as lenders. As of January 1, 2016, the Third Amended Credit Agreement provided for: (i) a
$1,500 million
Revolving Credit Facility maturing on April 20, 2018 (the "2018 Revolving Credit Facility"), which included a sublimit for the issuance of standby and commercial letters of credit and a sublimit for swing line loans and (ii) a series of term loans maturing during the years 2016 through 2022.
2016 Activity
On April 11, 2016, the Company obtained an amendment and waiver to its Third Amended Credit Agreement (the “April 2016 amendment”). The April 2016 amendment modified, among other things, the interest coverage financial maintenance covenant from
3.00
to
1.00
to
2.75
to
1.00
from the fiscal quarter ending June 30, 2016 through the fiscal quarter ending March 31, 2017. The April 2016 amendment also increased the interest rate margins applicable to the loans under the Credit Agreement by
1.00%
until delivery of the Company's Consolidated Financial Statements for the fiscal quarter ending June 30, 2017. Certain financial definitions were also amended in the April 2016 amendment.
On August 23, 2016, the Company entered into an amendment to its Third Amended Credit Agreement (the “August 2016 amendment”). The August 2016 amendment reduced the minimum interest coverage maintenance covenant to
2.00
to
1.00
for all fiscal quarters ending on or after September 30, 2016. The August 2016 amendment increased each of the applicable interest rate margins under the Third Amended Credit Agreement by
0.50%
, until delivery of the Company’s Consolidated Financial Statements for the quarter ending June 30, 2017. Thereafter, each of the applicable interest rate margins were determined on the basis of a pricing grid tied to the Company’s secured leverage ratio, which was also increased by
0.50%
across the grid.
The April 2016 amendment and August 2016 amendment were accounted for as debt modifications. As a result, repayments to the lenders were recognized as additional debt discounts and were being amortized over the remaining term of each term loan.
2017 Activity
On March 3, 2017, the Company used substantially all the proceeds from the Skincare Sale to repay
$1,086 million
of outstanding debt under its Senior Secured Credit Facilities.
On March 21, 2017, the Company entered into Amendment No. 14 to the Third Amended Credit Agreement (“Amendment No. 14”), which: (i) provided additional financing from an incremental term loan under the Company's Series F Tranche B Term Loan Facility of
$3,060 million
(the “Series F-3 Tranche B Term Loan Facility”), (ii) amended the financial covenants contained in the Third Amended Credit Agreement, (iii) increased the amortization rate for the Series F-3 Tranche B Term Loan Facility from
0.25%
per quarter (
1%
per annum) to
1.25%
per quarter (
5%
per annum), with quarterly repayments starting March 31, 2017, (iv) amended certain financial definitions, including the definition of Consolidated Adjusted EBITDA and (v) provided additional ability for the Company to, among other things, incur indebtedness and liens, consummate acquisitions and make other investments, including relaxing certain limitations imposed by prior amendments. The proceeds from the additional financing, combined with the proceeds from the issuance of the March 2022 Secured Notes (as they are defined below) and the March 2024 Secured Notes (as they are defined below) and cash on hand, were used to: (i) repay all outstanding balances under the Company’s Series A-3 Tranche A Term Loan Facility, Series A-4 Tranche A Term Loan Facility,
F-34
Series D-2 Tranche B Term Loan Facility, Series C-2 Tranche B Term Loan Facility, and Series E-1 Tranche B Term Loan Facility (collectively the “March 2017 Refinanced Debt”), (ii) repurchase
$1,100 million
in principal amount of
6.75%
Senior Unsecured Notes due August 2018 (the “
August 2018 Unsecured Notes
”), (iii) repay
$350 million
of amounts outstanding under the Company's 2018 Revolving Credit Facility and (iv) pay related fees and expenses (collectively, the “March 2017 Refinancing Transactions”).
Amendments to the covenants made as part of Amendment No. 14 include: (i) removed the financial maintenance covenants with respect to the Series F Tranche B Term Loan Facility, (ii) reduced the interest coverage ratio maintenance covenant with respect to both the 2018 Revolving Credit Facility and the 2020 Revolving Credit Facility beginning in the quarter ending March 31, 2017 through the quarter ending March 31, 2019 (stepping up to
1.75
:1.00 thereafter), (iii) increased the secured leverage ratio maintenance covenant to
3.00
:1.00 with respect to both the 2018 Revolving Credit Facility and the 2020 Revolving Credit Facility beginning in the quarter ending March 31, 2017 through the quarter ending March 31, 2019 (stepping down to
2.75
:1.00 thereafter) and (iv) modifications to Consolidated Adjusted EBITDA.
Amendment No. 14 was accounted for as a modification of debt to the extent the March 2017 Refinanced Debt was replaced with the incremental Series F-3 Tranche B Term Loan Facility issued to the same creditor and an extinguishment of debt to the extent the March 2017 Refinanced Debt was replaced with Series F-3 Tranche B Term Loan Facility issued to a different creditor. The March 2017 Refinanced Debt that was replaced with the proceeds of the newly issued Senior Secured Notes was accounted for as an extinguishment of debt. For amounts accounted for as an extinguishment of debt, the Company incurred a loss on extinguishment of debt of
$27 million
representing the difference between the amount paid to settle the extinguished debt and the extinguished debt’s carrying value (the stated principal amount net of unamortized discount and debt issuance costs). Payments made to the lenders of
$38 million
associated with the issuance of the new Series F-3 Tranche B Term Loan Facility were capitalized and were being amortized as interest expense over the remaining term of the Series F-3 Tranche B Term Loan Facility. Third-party expenses of
$3 million
associated with the modification of debt were expensed as incurred and included in Interest expense.
On March 28, 2017, the Company entered into Amendment No. 15 to the Third Amended Credit Agreement (“Amendment No. 15”) which provided for the extension of the maturity date of
$1,190 million
of revolving credit commitments under the 2018 Revolving Credit Facility from April 20, 2018 to the earlier of: (i) April 20, 2020 and (ii) the date that was
91
calendar days prior to the scheduled maturity of any series or tranche of term loans under the Third Amended Credit Agreement, certain Senior Secured Notes or Senior Unsecured Notes and any other indebtedness for borrowed money in excess of
$750 million
(the "Extended Revolving Maturity Date", and these extended commitments comprising the “2020 Revolving Credit Facility”). Amendment No. 15 was accounted for, in part, as a debt modification, whereby the fees paid to lenders agreeing to extend their commitment through April 20, 2020 and the fees paid to lenders providing additional commitments were recognized as additional debt issuance costs and were being amortized over the remaining term of the 2020 Revolving Credit Facility. Amendment No. 15 was also accounted for, in part, as an extinguishment of debt and the Company incurred a loss on extinguishment of debt of
$1 million
representing the unamortized debt issuance costs associated with the commitments canceled by lenders in the amendment.
In April 2017, using the remaining net proceeds from the Skincare Sale and the proceeds from the divestiture of a manufacturing facility in Brazil, the Company repaid
$220 million
of its Series F Tranche B Term Loan Facility. On July 3, 2017, using the net proceeds from the Dendreon Sale, the Company repaid
$811 million
of its Series F Tranche B Term Loan Facility. On
October 5, 2017
, using the net proceeds from the iNova Sale, the Company repaid
$923 million
of its Series F Tranche B Term Loan Facility. On
November 10, 2017
, using the net proceeds from the Obagi Sale, the Company repaid
$181 million
of its Series F Tranche B Term Loan Facility. On
November 21, 2017
, using the proceeds from the November 2017 Refinancing Transactions (as defined below), the Company repaid
$750 million
of its Series F Tranche B Term Loan Facility.
On November 21, 2017, the Company entered into Amendment No. 16 to the Third Amended Credit Agreement (“Amendment No. 16”) to reprice the Series F Tranche B Term Loan Facility. The applicable margins for borrowings under the Series F Tranche B Term Loan Facility, as modified by the repricing, were
2.50%
with respect to base rate borrowings and
3.50%
with respect to LIBO rate borrowings. Amendment No. 16 also increased the letter of credit facility sublimit under the Third Amended Credit Agreement to
$300 million
and made certain other amendments to provide the Company with additional flexibility to enter into certain cash management transactions. The Company paid a prepayment penalty of approximately
$38 million
in connection with Amendment No. 16, recognized in the
Loss on extinguishment of debt
in the Consolidated Statement of Operations for the year ended December 31, 2017.
F-35
2018 Activity
On April 19, 2018, the Company entered into Amendment No. 17 to the Third Amended Credit Agreement which provided for the extension of the maturity date of an additional
$60 million
of revolving credit commitments under the 2018 Revolving Credit Facility from April 20, 2018 to the Extended Revolving Maturity Date under the 2020 Revolving Credit Facility consistent with the terms of Amendment No. 15 outlined above. The remaining
$250 million
of revolving credit commitments under the 2018 Revolving Credit Facility matured on April 20, 2018.
On June 1, 2018, the Company entered into a Restatement Agreement in respect of a Fourth Amended and Restated Credit and Guaranty Agreement (the “Restated Credit Agreement”). The Restated Credit Agreement amended and restated in full the Third Amended Credit Agreement. The Restated Credit Agreement replaced the 2020 Revolving Credit Facility with a revolving credit facility of
$1,225 million
(the "2023 Revolving Credit Facility") and replaced the Series F Tranche B Term Loan Facility principal amount outstanding of
$3,315 million
with a
seven
year Tranche B Term Loan Facility of
$4,565 million
(the “
June 2025 Term Loan B Facility
”) borrowed by the Company’s subsidiary, Bausch Health Americas, Inc. ("BHA") (formerly Valeant Pharmaceuticals International).
The 2023 Revolving Credit Facility matures on the earlier of June 1, 2023 and the date that is
91
calendar days prior to the scheduled maturity of indebtedness for borrowed money of the Company or BHA in an aggregate principal amount in excess of
$1,000 million
. Both the Company and BHA are borrowers with respect to the 2023 Revolving Credit Facility. Borrowings under the 2023 Revolving Credit Facility may be made in U.S. dollars, Canadian dollars or euros.
On June 1, 2018, the Company issued an irrevocable notice of redemption for the remaining outstanding principal amounts of: (i)
$691 million
of the
5.375%
March 2020 Unsecured Notes
(as defined below), (ii)
$578 million
of the
6.75%
Senior
August 2021 Unsecured Notes
(as defined below), (iii)
$550 million
of the
7.25%
July 2022 Unsecured Notes
(as defined below) and (iv)
$146 million
of the
6.375%
October 2020 Unsecured Notes
(as defined below) (the "
6.375%
October 2020 Unsecured Notes
" and together with the March 2020 Unsecured Notes, August 2021 Unsecured Notes and July 2022 Unsecured Notes the “June 2018 Unsecured Refinanced Debt”). On June 1, 2018, using the remaining net proceeds from the
June 2025 Term Loan B Facility
, the net proceeds from the issuance of
$750 million
in aggregate principal amount of
8.50%
Senior Unsecured Notes due 2027 (the "January 2027 Unsecured Notes") by BHA and cash on hand, the Company prepaid the remaining Series F Tranche B Term Loan Facility and redeemed the June 2018 Unsecured Refinanced Debt at its aggregate redemption price and the indentures governing the June 2018 Unsecured Refinanced Debt were discharged (collectively, the “
June 2018 Refinancing Transactions
”).
The Restated Credit Agreement was accounted for as a modification of debt, to the extent the June 2018 Unsecured Refinanced Debt was replaced with newly issued debt to the same creditor, and as an extinguishment of debt if: (i) the June 2018 Unsecured Refinanced Debt was replaced with newly issued debt to a different creditor, (ii) a portion of the unamortized deferred financing fees was allocated to debt that was paid down or (iii) the borrowing capacity declined when issuing a new revolving credit facility. The following was accounted for as an extinguishment of debt: (i) the difference between the amounts paid to redeem the June 2018 Unsecured Refinanced Debt and the June 2018 Unsecured Refinanced Debt’s carrying value, (ii) the replacement of the Series F Tranche B Term Loan with the
June 2025 Term Loan B Facility
to the extent any unamortized deferred financing fees were associated with the portion of the Series F Tranche B Term Loan that was paid down and (iii) the replacement of the 2020 Revolving Credit Facility with the 2023 Revolving Credit Facility to the extent any unamortized deferred financing fees were associated with the decline in borrowing capacity. For amounts accounted for as an extinguishment of debt, the Company incurred a loss on extinguishment of debt of
$48 million
. Payments made to the lenders and a portion of payments made to third parties of
$74 million
associated with the June 2018 Refinancing Transactions were capitalized and are being amortized as interest expense over the remaining terms of the debt, ranging from 2023 through 2027. Third-party expenses of
$4 million
associated with the modification of debt were expensed as incurred and included in Interest expense.
On November 27, 2018, the Company entered into the First Incremental Amendment to the Restated Credit Agreement, which provided an additional
seven
year Tranche B Term Loan Facility of
$1,500 million
(the "
November 2025 Term Loan B Facility
") and used the net proceeds, along with cash on hand, to repay
$1,483 million
of
7.50%
Senior Unsecured Notes due July 2021 (the “
July 2021 Unsecured Notes
”) in a tender offer (the "
November 2018 Refinancing Transactions
"). On December 27, 2018, the Company redeemed, using cash on hand, the remaining outstanding principal amount of
$17 million
of the
July 2021 Unsecured Notes
.
The repayment of the
July 2021 Unsecured Notes
was accounted for as an extinguishment of debt and the Company incurred a loss on extinguishment of debt of
$43 million
representing the difference between the amount paid to settle the extinguished
F-36
debt and the extinguished debt’s carrying value. Payments made to the lenders and other third parties of
$25 million
associated with the issuance of the
November 2025 Term Loan B Facility
were capitalized and are being amortized as interest expense over the remaining term of the
November 2025 Term Loan B Facility
.
As of
December 31, 2018
, the Company had
$75 million
of outstanding borrowings,
$169 million
of issued and outstanding letters of credit, and remaining availability of
$981 million
under its 2023 Revolving Credit Facility.
Current Description of Senior Secured Credit Facilities
Borrowings under the Senior Secured Credit Facilities in U.S. dollars bear interest at a rate per annum equal to, at the Company's option, either: (i) a base rate determined by reference to the higher of: (a) the prime rate (as defined in the Restated Credit Agreement), (b) the federal funds effective rate plus 1/2 of
1.00%
or (c) the eurocurrency rate (as defined in the Restated Credit Agreement) for a period of one month plus
1.00%
(or if such eurocurrency rate shall not be ascertainable,
1.00%
) or (ii) a eurocurrency rate determined by reference to the costs of funds for U.S. dollar deposits for the interest period relevant to such borrowing adjusted for certain additional costs (provided however, that the eurocurrency rate shall at no time be less than zero), in each case plus an applicable margin.
Borrowings under the 2023 Revolving Credit Facility in Euros bear interest at a eurocurrency rate determined by reference to the costs of funds for Euro deposits for the interest period relevant to such borrowing (provided however, that the eurocurrency rate shall at no time be less than
0.00%
per annum), plus an applicable margin.
Borrowings under the 2023 Revolving Credit Facility in Canadian dollars bear interest at a rate per annum equal to, at the Company's option, either (a) a prime rate determined by reference to the higher of: (1) the rate of interest last quoted by The Wall Street Journal as the “Canadian Prime Rate” or, if The Wall Street Journal ceases to quote such rate, the highest per annum interest rate published by the Bank of Canada as its prime rate and (2) the 1 month BA rate (as defined below) calculated daily plus
1.00%
(provided however, that the prime rate shall at no time be less than
0.00%
) or (b) the bankers’ acceptance rate for Canadian dollar deposits in the Toronto interbank market (the “BA rate”) for the interest period relevant to such borrowing (provided however, that the BA rate shall at no time be less than
0.00%
per annum), in each case plus an applicable margin.
Subject to certain exceptions and customary baskets set forth in the Restated Credit Agreement, the Company is required to make mandatory prepayments of the loans under the Senior Secured Credit Facilities under certain circumstances, including from: (i)
100%
of the net cash proceeds of insurance and condemnation proceeds for property or asset losses (subject to reinvestment rights and net proceeds threshold), (ii)
100%
of the net cash proceeds from the incurrence of debt (other than permitted debt as described in the Restated Credit Agreement), (iii)
50%
of Consolidated Excess Cash Flow (as defined in the Restated Credit Agreement) subject to decrease based on leverage ratios and subject to a threshold amount and (iv)
100%
of net cash proceeds from asset sales (subject to reinvestment rights). These mandatory prepayments may be used to satisfy future amortization.
The applicable interest rate margins for the
June 2025 Term Loan B Facility
and the
November 2025 Term Loan B Facility
are
2.00%
and
1.75%
, respectively, with respect to base rate and prime rate borrowings and
3.00%
and
2.75%
, respectively, with respect to eurocurrency rate and bankers' acceptance rate borrowings.
As of December 31, 2018
, the stated rate of interest on the Company’s borrowings under the
June 2025 Term Loan B Facility
and the
November 2025 Term Loan B Facility
was
5.38%
and
5.13%
per annum, respectively.
The amortization rate for both the
June 2025 Term Loan B Facility
and the
November 2025 Term Loan B Facility
is
5.00%
per annum. The Company may direct that prepayments be applied to such amortization payments in order of maturity.
As of December 31, 2018
, the remaining mandatory quarterly amortization payments for the Senior Secured Credit Facilities were
$1,857 million
through November 1, 2025.
The applicable interest rate margins for borrowings under the 2023 Revolving Credit Facility are
1.50%
-
2.00%
with respect to base rate or prime rate borrowings and
2.50%
-
3.00%
with respect to eurocurrency rate or bankers' acceptance rate borrowings.
As of December 31, 2018
, the stated rate of interest on the 2023 Revolving Credit Facility was
5.38%
per annum. In addition, the Company is required to pay commitment fees of
0.25%
-
0.50%
per annum with respect to the unutilized commitments under the 2023 Revolving Credit Facility, payable quarterly in arrears. The Company also is required to pay: (i) letter of credit fees on the maximum amount available to be drawn under all outstanding letters of credit in an amount equal to the applicable margin on eurocurrency rate borrowings under the 2023 Revolving Credit Facility on a per annum basis, payable quarterly in arrears, (ii) customary fronting fees for the issuance of letters of credit and (iii) agency fees.
F-37
The Restated Credit Agreement permits the incurrence of
$1,000 million
of incremental credit facility borrowings, subject to customary terms and conditions, as well as the incurrence of additional incremental credit facility borrowings subject to, in the case of secured debt, a secured leverage ratio of not greater than
3.50
:1.00, and, in the case of unsecured debt, a total leverage ratio of not greater than
6.50
:1.00 or an interest coverage ratio of not less than
2.00
:1.00.
Senior Secured Notes
The Senior Secured Notes are guaranteed by each of the Company’s subsidiaries that is a guarantor under the Restated Credit Agreement and existing Senior Unsecured Notes (together, the “Note Guarantors”). The Senior Secured Notes and the guarantees related thereto are senior obligations and are secured, subject to permitted liens and certain other exceptions, by the same first priority liens that secure the Company’s obligations under the Restated Credit Agreement under the terms of the indenture governing the Senior Secured Notes.
The Senior Secured Notes and the guarantees rank equally in right of repayment with all of the Company’s and Note Guarantors’ respective existing and future unsubordinated indebtedness and senior to the Company’s and Note Guarantors’ respective future subordinated indebtedness. The Senior Secured Notes and the guarantees related thereto are effectively
pari passu
with the Company’s and the Note Guarantors’ respective existing and future indebtedness secured by a first priority lien on the collateral securing the Senior Secured Notes and effectively senior to the Company’s and the Note Guarantors’ respective existing and future indebtedness that is unsecured, including the existing Senior Unsecured Notes, or that is secured by junior liens, in each case to the extent of the value of the collateral. In addition, the Senior Secured Notes are structurally subordinated to: (i) all liabilities of any of the Company’s subsidiaries that do not guarantee the Senior Secured Notes and (ii) any of the Company’s debt that is secured by assets that are not collateral.
Upon the occurrence of a change in control (as defined in the indentures governing the Senior Secured Notes), unless the Company has exercised its right to redeem all of the notes of a series, holders of the Senior Secured Notes may require the Company to repurchase such holder’s notes, in whole or in part, at a purchase price equal to
101%
of the principal amount thereof plus accrued and unpaid interest.
6.50%
Senior Secured Notes due 2022 and
7.00%
Senior Secured Notes due 2024 - March 2017 Refinancing Transactions
As part of the March 2017 Refinancing Transactions, the Company issued
$1,250 million
aggregate principal amount of
6.50%
senior secured notes due March 15, 2022 (the “
March 2022 Secured Notes
”) and
$2,000 million
aggregate principal amount of
7.00%
senior secured notes due March 15, 2024 (the “
March 2024 Secured Notes
”), in a private placement, the proceeds of which, when combined with the proceeds from the Series F-3 Tranche B Term Loan Facility and cash on hand, were used to: (i) repay the March 2017 Refinanced Debt, (ii) repurchase
$1,100 million
in principal amount of August 2018 Senior Unsecured Notes, (iii) repay
$350 million
of amounts outstanding under the 2018 Revolving Credit Facility and (iv) pay related fees and expenses. Interest on these notes is payable semi-annually in arrears on each March 15 and September 15.
The
March 2022 Secured Notes
are redeemable at the option of the Company, in whole or in part, at any time on or after March 15, 2019, at the redemption prices set forth in the indenture. The Company may redeem some or all of the
March 2022 Secured Notes
prior to March 15, 2019 at a price equal to
100%
of the principal amount thereof plus a “make-whole” premium. Prior to March 15, 2019, the Company may redeem up to
40%
of the aggregate principal amount of the
March 2022 Secured Notes
using the proceeds of certain equity offerings at the redemption price set forth in the indenture.
The
March 2024 Secured Notes
are redeemable at the option of the Company, in whole or in part, at any time on or after March 15, 2020, at the redemption prices set forth in the indenture. The Company may redeem some or all of the
March 2024 Secured Notes
prior to March 15, 2020 at a price equal to
100%
of the principal amount thereof plus a “make-whole” premium. Prior to March 15, 2020, the Company may redeem up to
40%
of the aggregate principal amount of the
March 2024 Secured Notes
using the proceeds of certain equity offerings at the redemption price set forth in the indenture.
5.50%
Senior Secured Notes due 2025 - October 2017 Refinancing Transactions and November 2017 Refinancing Transactions
On October 17, 2017, the Company issued
$1,000 million
aggregate principal amount of
5.50%
Senior Secured Notes due November 2025 (the “
November 2025 Secured Notes
”), in a private placement, the proceeds of which were used to: (i) repurchase
$569 million
in principal amount of the
6.375%
October 2020 Unsecured Notes
(as defined below) and (ii) repurchase
$431 million
in principal amount of the
7.00%
October 2020 Unsecured Notes
(as defined below) (collectively, the “October 2017 Refinancing Transactions”). The related fees and expenses were paid using cash on hand. Interest on the
November 2025 Secured Notes
is payable semi-annually in arrears on each May 1 and November 1.
F-38
The
November 2025 Secured Notes
are redeemable at the option of the Company, in whole or in part, at any time on or after November 1, 2020, at the redemption prices set forth in the indenture. The Company may redeem some or all of the
November 2025 Secured Notes
prior to November 1, 2020 at a price equal to
100%
of the principal amount thereof plus a “make-whole” premium. Prior to November 1, 2020, the Company may redeem up to
40%
of the aggregate principal amount of the
November 2025 Secured Notes
using the proceeds of certain equity offerings at the redemption price set forth in the indenture.
On
November 21, 2017
, the Company issued
$750 million
aggregate principal amount of the
November 2025 Secured Notes
in a private placement. These are additional notes and form part of the same series as the Company’s existing
November 2025 Secured Notes
. The proceeds were used to prepay
$750 million
of its Series F Tranche B Term Loan Facility. The related fees and expenses were paid using cash on hand (collectively, the “November 2017 Refinancing Transactions”).
Senior Unsecured Notes
The Senior Unsecured Notes issued by the Company are the Company’s senior unsecured obligations and are jointly and severally guaranteed on a senior unsecured basis by each of its subsidiaries that is a guarantor under the Senior Secured Credit Facilities. The Senior Unsecured Notes issued by BHA are senior unsecured obligations of BHA and are jointly and severally guaranteed on a senior unsecured basis by the Company and each of its subsidiaries (other than BHA) that is a guarantor under the Senior Secured Credit Facilities. Future subsidiaries of the Company and BHA, if any, may be required to guarantee the Senior Unsecured Notes.
If the Company experiences a change in control, the Company may be required to make an offer to repurchase each series of Senior Unsecured Notes, in whole or in part, at a purchase price equal to
101%
of the aggregate principal amount of the Senior Unsecured Notes repurchased, plus accrued and unpaid interest.
7.00%
Senior Unsecured Notes due 2020
On September 28, 2010, the Company issued
$700 million
aggregate principal amount of
7.00%
Senior Unsecured Notes due 2020 (the “
7.00%
October 2020 Unsecured Notes
”) in a private placement. The
7.00%
October 2020 Unsecured Notes
accrued interest at the rate of
7.00%
per year and were subsequently repaid in full: (i) as part of the October 2017 Refinancing Transactions, (ii) as part of the December 2017 Refinancing Transactions (as defined below) and (iii) using cash on hand of
$71 million
in March 2018.
6.75%
Senior Unsecured Notes due 2021
On February 8, 2011, the Company issued
$650 million
aggregate principal amount of
6.75%
Senior Unsecured Notes due 2021 (the "
August 2021 Unsecured Notes
") in a private placement. The
August 2021 Unsecured Notes
accrued interest at the rate of
6.75%
per year and were subsequently repaid in full as part of: (i) the
March 2018 Refinancing Transactions
(as defined below) and (ii) the
June 2018 Refinancing Transactions
.
7.25%
Senior Unsecured Notes due 2022
On March 8, 2011, the Company issued
$550 million
aggregate principal amount of
7.25%
Senior Unsecured Notes due 2022 (the "
July 2022 Unsecured Notes
") in a private placement. The
July 2022 Unsecured Notes
accrued interest at the rate of
7.25%
per year and were subsequently repaid in full as part of the
June 2018 Refinancing Transactions
.
6.375%
Senior Unsecured Notes due 2020
On October 4, 2012, VPI Escrow Corp. (the “VPI Escrow Issuer”), a newly formed wholly owned subsidiary of the Company, issued
$1,750 million
aggregate principal amount of
6.375%
Senior Unsecured Notes due 2020 (the “
6.375%
October 2020 Unsecured Notes
”) in a private placement. The
6.375%
October 2020 Unsecured Notes
accrued interest at the rate of
6.375%
per year, payable semi-annually in arrears. In December 2012: (i) the VPI Escrow Issuer merged with and into the Company, with the Company continuing as the surviving corporation, (ii) the Company assumed all of the VPI Escrow Issuer’s obligations under the
6.375%
October 2020 Unsecured Notes
and the related indenture and (iii) the funds previously held in escrow were released to the Company and were used to finance an acquisition.
Concurrently with the offering of the
6.375%
October 2020 Unsecured Notes
, the Company issued
$500 million
aggregate principal amount of
6.375%
Senior Unsecured Notes due 2020 (the “Exchangeable Notes”) in a private placement, the form and terms of such notes being substantially identical to the form and terms of the
6.375%
October 2020 Unsecured Notes
, as previously described.
F-39
On March 29, 2013, the Company announced that the Company commenced an offer to exchange (the “Exchange Offer”) any and all of its Exchangeable Notes into
6.375%
October 2020 Unsecured Notes
. The Company conducted the Exchange Offer in order to satisfy its obligations under the indenture governing the Exchangeable Notes with the anticipated result being that some or all of such notes would be part of a single series of
6.375%
October 2020 Unsecured Notes
under one indenture. The Exchange Offer, which did not result in any changes to existing terms or to the total amount of the Company’s outstanding debt, expired on April 26, 2013. All of the Exchangeable Notes were tendered in the Exchange Offer and exchanged for
6.375%
October 2020 Unsecured Notes
to form a single series.
The Company subsequently repaid the
6.375%
October 2020 Unsecured Notes
, in full: (i) as part of the October 2017 Refinancing Transactions, (ii) as part of the December 2017 Refinancing Transactions (as defined below), (iii) as part of the
March 2018 Refinancing Transactions
(as defined below), (iv) using cash on hand of
$104 million
in May 2018 and (v) as part of the
June 2018 Refinancing Transactions
.
6.75%
Senior Unsecured Notes due 2018 and
7.50%
Senior Unsecured Notes due 2021
On July 12, 2013, VPII Escrow Corp. (the “VPII Escrow Issuer”), a newly formed wholly-owned subsidiary of the Company, issued
$1,600 million
aggregate principal amount of the
August 2018 Unsecured Notes
and
$1,625 million
aggregate principal amount of the
July 2021 Unsecured Notes
in a private placement. The
August 2018 Unsecured Notes
accrued interest at the rate of
6.75%
per year, payable semi-annually in arrears. The
July 2021 Unsecured Notes
accrued interest at the rate of
7.50%
per year, payable semi-annually in arrears. At the time of the closing of the B&L Acquisition: (i) the VPII Escrow Issuer was voluntarily liquidated and all of its obligations were assumed by, and all of its assets were distributed to, the Company, (ii) the Company assumed all of the VPII Escrow Issuer’s obligations under the
August 2018 Unsecured Notes
and
July 2021 Unsecured Notes
and the related indenture and (iii) the funds previously held in escrow were released to the Company and were used to finance the B&L Acquisition.
The Company subsequently repaid the
August 2018 Unsecured Notes
in full: (i) as part of the March 2017 Refinancing Transactions and (ii) using cash on hand of
$500 million
in August 2017. Loss on extinguishment of debt during the year ended December 31, 2017 associated with the repurchase of the
August 2018 Unsecured Notes
was
$37 million
representing the difference between the amount paid to settle the debt and the debt’s carrying value.
The Company subsequently repaid the
July 2021 Unsecured Notes
in full: (i) using cash on hand of
$125 million
in October 2018, (ii) as part of the
November 2018 Refinancing Transactions
and (iii) using cash on hand of
$17 million
in December 2018.
5.625%
Senior Unsecured Notes due 2021
On December 2, 2013, the Company issued
$900 million
aggregate principal amount of
5.625%
Senior Unsecured Notes due 2021 (the “
December 2021 Unsecured Notes
”) in a private placement. The
December 2021 Unsecured Notes
accrue interest at the rate of
5.625%
per year, payable semi-annually in arrears. On December 30, 2018, the Company repurchased, using cash on hand,
$200 million
of outstanding
December 2021 Unsecured Notes
plus accrued and unpaid interest. The Company may redeem all or a portion of the
December 2021 Unsecured Notes
at par value, plus accrued and unpaid interest to the date of redemption.
5.50%
Senior Unsecured Notes due 2023
On January 30, 2015, the Company issued
$1,000 million
aggregate principal amount of
5.50%
Senior Unsecured Notes due 2023 (the "
March 2023 Unsecured Notes
") in a private placement. The
March 2023 Unsecured Notes
accrue interest at the rate of
5.50%
per year, payable semi-annually in arrears. The Company may redeem all or a portion of the
March 2023 Unsecured Notes
at the applicable redemption prices set forth in the
March 2023 Unsecured Notes
indenture, plus accrued and unpaid interest to the date of redemption.
5.375%
Senior Unsecured Notes due 2020,
5.875%
Senior Unsecured Notes due 2023,
4.50%
Senior Unsecured Notes due 2023 and
6.125%
Senior Unsecured Notes due 2025
On March 27, 2015, VRX Escrow Corp. (the "VRX Issuer"), a newly formed wholly owned subsidiary of the Company, issued
$2,000 million
aggregate principal amount of
5.375%
Senior Unsecured Notes due 2020 (the "
March 2020 Unsecured Notes
"),
$3,250 million
aggregate principal amount of
5.875%
Senior Unsecured Notes due 2023 (the "
May 2023 Unsecured Notes
"),
€1,500 million
aggregate principal amount of
4.50%
Senior Unsecured Notes due 2023 (the "Euro Notes”) and
$3,250 million
aggregate principal amount of
6.125%
Senior Unsecured Notes due 2025 (the "
May 2025 Unsecured Notes
" and, together
F-40
with the
March 2020 Unsecured Notes
, the
May 2023 Unsecured Notes
and the Euro Notes, the "VRX Notes") in a private placement.
In addition, the VRX Issuer entered into an escrow and security agreement (the “Escrow Agreement”) dated as of March 27, 2015, with an escrow agent. Pursuant to the Escrow Agreement, the proceeds from the issuance of the VRX Notes, together with cash sufficient to fund certain accrued and unpaid interest on the VRX Notes, totaling
$10,340 million
in the aggregate, were deposited into escrow accounts and held as security for the VRX Issuer’s obligations until the consummation of the Salix Acquisition, which occurred on April 1, 2015. At the time of the closing of the Salix Acquisition, (1) the VRX Issuer was voluntarily liquidated and all of its obligations were assumed by, and all of its assets were distributed to, the Company, (2) the Company assumed all of the VRX Issuer's obligations under the VRX Notes and the related indenture and (3) the funds previously held in escrow were released to the Company and were used to finance the Salix Acquisition (as such, the
$10,340 million
referenced in this paragraph was released from restricted cash and cash equivalents in April 2015.)
The
March 2020 Unsecured Notes
accrued interest at the rate of
5.375%
per year and were repaid in full as part of: (i) the December 2017 Refinancing Transactions (as defined below), (ii) the
March 2018 Refinancing Transactions
(as defined below) and (iii) the
June 2018 Refinancing Transactions
.
The
May 2023 Unsecured Notes
, the Euro Notes and the
May 2025 Unsecured Notes
accrue interest at the rate of
5.875%
,
4.50%
and
6.125%
per year, respectively, payable semi-annually in arrears. The Company may redeem all or a portion of the
May 2025 Unsecured Notes
at any time prior to April 15, 2020 at a price equal to
100%
of the principal amount thereof, plus accrued and unpaid interest, if any, to the date of redemption, plus a “make-whole” premium. The Company may redeem all or a portion of the
May 2023 Unsecured Notes
or the Euro Notes and, on or after April 15, 2020, the Company may redeem all or a portion of the
May 2025 Unsecured Notes
, at the redemption prices applicable to each series of such notes, as set forth in the applicable indenture, plus accrued and unpaid interest to the date of redemption.
9.00%
Senior Unsecured Notes due 2025 - December 2017 Refinancing Transactions
On
December 18, 2017
, the Company issued
$1,500 million
aggregate principal amount of
9.00%
Senior Unsecured Notes due 2025 (the “
December 2025 Unsecured Notes
”) in a private placement, the proceeds of which were used to: (i) repurchase
$1,021 million
in principal amount of the
6.375%
October 2020 Unsecured Notes
, (ii) repurchase
$291 million
in principal amount of the
March 2020 Unsecured Notes
and (iii) repurchase
$188 million
in principal amount of the
7.00%
October 2020 Unsecured Notes
(collectively, the “December 2017 Refinancing Transactions”). The related fees and expenses were paid using cash on hand. The
December 2025 Unsecured Notes
accrue interest at the rate of
9.00%
per year, payable semi-annually in arrears on each of June 15 and December 15.
The Company may redeem all or a portion of the
December 2025 Unsecured Notes
at any time prior to December 15, 2021, at a price equal to
100%
of the principal amount thereof, plus accrued and unpaid interest, if any, to the date of redemption, plus a “make-whole” premium. In addition, at any time prior to December 15, 2020, the Company may redeem up to
40%
of the aggregate principal amount of the outstanding
December 2025 Unsecured Notes
with the net proceeds of certain equity offerings at the redemption price set forth in the
December 2025 Unsecured Notes
indenture. On or after December 15, 2021, the Company may redeem all or a portion of the
December 2025 Unsecured Notes
at the applicable redemption prices set forth in the
December 2025 Unsecured Notes
indenture, plus accrued and unpaid interest to the date of redemption.
9.25%
Senior Unsecured Notes due 2026 - March 2018 Refinancing Transactions
On March 26, 2018, BHA issued
$1,500 million
in aggregate principal amount of
9.25%
Senior Unsecured Notes due 2026 (the “April 2026 Unsecured Notes”) in a private placement, the net proceeds of which, along with cash on hand, were used to repurchase
$1,500 million
in aggregate principal amount of unsecured notes which consisted of: (i)
$1,017 million
in principal amount of the March 2020 Unsecured Notes, (ii)
$411 million
in principal amount of the
6.375%
October 2020 Unsecured Notes and (iii)
$72 million
in principal amount of the August 2021 Unsecured Notes. All fees and expenses associated with these transactions were paid with cash on hand (collectively, the “
March 2018 Refinancing Transactions
”). The
March 2018 Refinancing Transactions
was accounted for as an extinguishment of debt and the Company incurred a loss on extinguishment of debt of
$26 million
representing the difference between the amount paid to settle the extinguished debt and the extinguished debt’s carrying value. The April 2026 Unsecured Notes accrue interest at the rate of
9.25%
per year, payable semi-annually in arrears on each of April 1 and October 1.
F-41
BHA may redeem all or a portion of the April 2026 Unsecured Notes at any time prior to April 1, 2022, at a price equal to
100%
of the principal amount thereof, plus accrued and unpaid interest, if any, to the date of redemption, plus a “make-whole” premium. In addition, at any time prior to April 1, 2021, BHA may redeem up to
40%
of the aggregate principal amount of the outstanding April 2026 Unsecured Notes with the net proceeds of certain equity offerings at the redemption price set forth in the April 2026 Unsecured Notes indenture. On or after April 1, 2022, BHA may redeem all or a portion of the April 2026 Unsecured Notes at the applicable redemption prices set forth in the April 2026 Unsecured Notes indenture, plus accrued and unpaid interest to the date of redemption.
8.50%
Senior Unsecured Notes due 2027
As part of the June 2018 Refinancing Transactions, BHA issued
$750 million
in aggregate principal amount of January 2027 Unsecured Notes in a private placement, the proceeds of which, when combined with the remaining net proceeds from the
June 2025 Term Loan B Facility
and cash on hand, were deposited with The Bank of New York Mellon Trust Company, N.A., as trustee under the indentures governing the June 2018 Unsecured Refinanced Debt, to redeem the June 2018 Unsecured Refinanced Debt at its aggregate redemption price and the indentures governing the June 2018 Unsecured Refinanced Debt were discharged. The January 2027 Unsecured Notes accrue interest at the rate of
8.50%
per year, payable semi-annually in arrears on each of January 31 and July 31.
BHA may redeem all or a portion of the January 2027 Unsecured Notes at any time prior to July 31, 2022, at a price equal to
100%
of the principal amount thereof, plus accrued and unpaid interest, if any, to the date of redemption, plus a “make-whole” premium. In addition, at any time prior to July 31, 2021, BHA may redeem up to
40%
of the aggregate principal amount of the outstanding January 2027 Unsecured Notes with the net proceeds of certain equity offerings at the redemption price set forth in the January 2027 Unsecured Notes indenture. On or after July 31, 2022, BHA may redeem all or a portion of the January 2027 Unsecured Notes at the applicable redemption prices set forth in the January 2027 Unsecured Notes indenture, plus accrued and unpaid interest to the date of redemption.
Weighted Average Stated Rate of Interest
The weighted average stated rate of interest for the Company's outstanding debt obligations
as of December 31, 2018 and 2017
was
6.23%
and
6.07%
, respectively.
Maturities
Maturities and mandatory payments of debt obligations for the five succeeding years ending December 31 and thereafter are as follows:
|
(in millions)
|
|||
|
2019
|
$
|
228
|
|
|
2020
|
303
|
|
|
|
2021
|
1,003
|
|
|
|
2022
|
1,553
|
|
|
|
2023
|
6,348
|
|
|
|
Thereafter
|
15,197
|
|
|
|
Total gross maturities
|
24,632
|
|
|
|
Unamortized discounts
|
(327
|
)
|
|
|
Total long-term debt and other
|
$
|
24,305
|
|
Under the Restated Credit Agreement, there is no Excess Cash Flow payment due for 2018. On January 29, 2019, using cash on hand, the Company repaid
$100 million
of outstanding term loans under its Senior Secured Credit Facilities in partial satisfaction of the scheduled mandatory amortization payments due for 2019 in the table above.
|
12.
|
PENSION AND POSTRETIREMENT EMPLOYEE BENEFIT PLANS
|
In connection with the acquisition of Bausch & Lomb Holdings Incorporated ("B&L") completed on August 5, 2013, the Company assumed all of B&L’s benefit obligations and related plan assets. This includes defined benefit plans and a participatory defined benefit postretirement medical and life insurance plan, which covers a closed grandfathered group of
F-42
legacy B&L U.S. employees and employees in certain other countries. The U.S. defined benefit accruals were frozen as of December 31, 2004 and benefits that were earned up to December 31, 2004 were preserved. Participants continue to earn interest credits on their cash balance. The most significant non-U.S. plans are
two
defined benefit plans in Ireland. In 2011, both Ireland defined benefit plans were closed to future service benefit accruals; however, additional accruals related to annual salary increases continued. In December 2014, one of the Ireland defined benefit plans was amended effective August 2014 to eliminate future benefit accruals related to salary increases. All of the pension benefits accrued through the plan amendment date were preserved. As a result of the plan amendment, there are no active plan participants accruing benefits under the amended Ireland defined benefit plan. The U.S. postretirement benefit plan was amended effective January 1, 2005 to eliminate employer contributions after age
65
for participants who did not meet the minimum requirements of age and service on that date. The employer contributions for medical and prescription drug benefits for participants retiring after March 1, 1989 were frozen effective January 1, 2010. Effective January 1, 2014, the Company no longer offers medical and life insurance coverage to new retirees.
In addition to the B&L benefit plans, outside of the U.S., a limited group of the Company's employees are covered by defined benefit pension plans.
The Company uses December 31 as the year-end measurement date for all of its defined benefit pension plans and the postretirement benefit plan.
Accounting for Pension Benefit Plans and Postretirement Benefit Plan
The Company recognizes in its Consolidated Balance Sheets an asset or liability equal to the over- or under-funded benefit obligation of each defined benefit pension plan and postretirement benefit plan. Actuarial gains or losses and prior service costs or credits that arise during the period but are not recognized as components of net periodic benefit cost are recognized, net of tax, as a component of other comprehensive income (loss).
The amounts included in accumulated other comprehensive loss
as of December 31, 2018
,
2017
and
2016
were as follows:
|
Pension Benefit Plans
|
U.S. Postretirement
Benefit Plan
|
|||||||||||||||||||||||||||||||||||
|
U.S. Plan
|
Non-U.S. Plans
|
|||||||||||||||||||||||||||||||||||
|
(in millions)
|
2018
|
2017
|
2016
|
2018
|
2017
|
2016
|
2018
|
2017
|
2016
|
|||||||||||||||||||||||||||
|
Unrecognized actuarial losses
|
$
|
(31
|
)
|
$
|
(18
|
)
|
$
|
(26
|
)
|
$
|
(50
|
)
|
$
|
(56
|
)
|
$
|
(61
|
)
|
$
|
(1
|
)
|
$
|
(4
|
)
|
$
|
(6
|
)
|
|||||||||
|
Unrecognized prior service credits
|
$
|
—
|
|
$
|
—
|
|
$
|
—
|
|
$
|
27
|
|
$
|
29
|
|
$
|
26
|
|
$
|
17
|
|
$
|
20
|
|
$
|
23
|
|
|||||||||
Of the
December 31, 2018
amounts, the Company expects to recognize
$3 million
and
$1 million
of unrecognized prior service credits related to the U.S. postretirement benefit plan and the non-U.S. defined benefit plans, respectively, in net periodic (benefit) cost during
2019
. In addition, the Company expects to recognize
$1 million
of unrecognized actuarial losses related to the non-U.S. pension benefit plans in net periodic (benefit) cost during
2019
.
Net Periodic (Benefit) Cost
The following table provides the components of net periodic (benefit) cost for the Company’s defined benefit pension plans and postretirement benefit plan in
2018
,
2017
and
2016
:
|
|
Pension Benefit Plans
|
U.S. Postretirement
Benefit Plan
|
||||||||||||||||||||||||||||||||||
|
U.S. Plan
|
Non-U.S. Plans
|
|||||||||||||||||||||||||||||||||||
|
(in millions)
|
2018
|
2017
|
2016
|
2018
|
2017
|
2016
|
2018
|
2017
|
2016
|
|||||||||||||||||||||||||||
|
Service cost
|
$
|
2
|
|
$
|
2
|
|
$
|
2
|
|
$
|
3
|
|
$
|
3
|
|
$
|
3
|
|
$
|
—
|
|
$
|
—
|
|
$
|
—
|
|
|||||||||
|
Interest cost
|
7
|
|
8
|
|
8
|
|
5
|
|
5
|
|
6
|
|
1
|
|
2
|
|
2
|
|
||||||||||||||||||
|
Expected return on plan assets
|
(15
|
)
|
(13
|
)
|
(13
|
)
|
(5
|
)
|
(5
|
)
|
(7
|
)
|
—
|
|
—
|
|
—
|
|
||||||||||||||||||
|
Amortization of net loss
|
—
|
|
—
|
|
—
|
|
1
|
|
2
|
|
—
|
|
—
|
|
—
|
|
—
|
|
||||||||||||||||||
|
Amortization of prior service credit
|
—
|
|
—
|
|
—
|
|
(1
|
)
|
(1
|
)
|
(1
|
)
|
(2
|
)
|
(3
|
)
|
(3
|
)
|
||||||||||||||||||
|
Other
|
—
|
|
—
|
|
—
|
|
—
|
|
—
|
|
2
|
|
—
|
|
—
|
|
—
|
|
||||||||||||||||||
|
Net periodic (benefit) cost
|
$
|
(6
|
)
|
$
|
(3
|
)
|
$
|
(3
|
)
|
$
|
3
|
|
$
|
4
|
|
$
|
3
|
|
$
|
(1
|
)
|
$
|
(1
|
)
|
$
|
(1
|
)
|
|||||||||
F-43
Benefit Obligation, Change in Plan Assets and Funded Status
The table below presents components of the change in projected benefit obligation, change in plan assets and funded status
for 2018 and 2017
:
|
|
Pension Benefit Plans
|
U.S. Postretirement
Benefit Plan
|
||||||||||||||||||||||
|
U.S. Plan
|
Non-U.S. Plans
|
|||||||||||||||||||||||
|
(in millions)
|
2018
|
2017
|
2018
|
2017
|
2018
|
2017
|
||||||||||||||||||
|
Change in Projected benefit Obligation
|
||||||||||||||||||||||||
|
Projected benefit obligation, beginning of year
|
$
|
234
|
|
$
|
230
|
|
$
|
254
|
|
$
|
230
|
|
$
|
48
|
|
$
|
52
|
|
||||||
|
Service cost
|
2
|
|
2
|
|
3
|
|
3
|
|
—
|
|
—
|
|
||||||||||||
|
Interest cost
|
7
|
|
8
|
|
5
|
|
5
|
|
1
|
|
2
|
|
||||||||||||
|
Employee contributions
|
—
|
|
—
|
|
—
|
|
—
|
|
1
|
|
1
|
|
||||||||||||
|
Settlements
|
—
|
|
—
|
|
(2
|
)
|
(1
|
)
|
—
|
|
—
|
|
||||||||||||
|
Benefits paid
|
(16
|
)
|
(15
|
)
|
(5
|
)
|
(4
|
)
|
(5
|
)
|
(6
|
)
|
||||||||||||
|
Actuarial (gains) losses
|
(13
|
)
|
9
|
|
(10
|
)
|
(9
|
)
|
(4
|
)
|
(1
|
)
|
||||||||||||
|
Currency translation adjustments
|
—
|
|
—
|
|
(10
|
)
|
30
|
|
—
|
|
—
|
|
||||||||||||
|
Projected benefit obligation, end of year
|
214
|
|
234
|
|
235
|
|
254
|
|
41
|
|
48
|
|
||||||||||||
|
Change in Plan Assets
|
||||||||||||||||||||||||
|
Fair value of plan assets, beginning of year
|
206
|
|
181
|
|
155
|
|
128
|
|
—
|
|
—
|
|
||||||||||||
|
Actual return on plan assets
|
(11
|
)
|
30
|
|
(2
|
)
|
7
|
|
—
|
|
—
|
|
||||||||||||
|
Employee contributions
|
—
|
|
—
|
|
—
|
|
—
|
|
1
|
|
1
|
|
||||||||||||
|
Company contributions
|
8
|
|
10
|
|
7
|
|
7
|
|
4
|
|
5
|
|
||||||||||||
|
Settlements
|
—
|
|
—
|
|
(2
|
)
|
(1
|
)
|
—
|
|
—
|
|
||||||||||||
|
Benefits paid
|
(16
|
)
|
(15
|
)
|
(5
|
)
|
(4
|
)
|
(5
|
)
|
(6
|
)
|
||||||||||||
|
Currency translation adjustments
|
—
|
|
—
|
|
(6
|
)
|
18
|
|
—
|
|
—
|
|
||||||||||||
|
Fair value of plan assets, end of year
|
187
|
|
206
|
|
147
|
|
155
|
|
—
|
|
—
|
|
||||||||||||
|
Funded Status at end of year
|
$
|
(27
|
)
|
$
|
(28
|
)
|
$
|
(88
|
)
|
$
|
(99
|
)
|
$
|
(41
|
)
|
$
|
(48
|
)
|
||||||
|
Recognized as:
|
||||||||||||||||||||||||
|
Accrued and other current liabilities
|
$
|
—
|
|
$
|
—
|
|
$
|
(2
|
)
|
$
|
(2
|
)
|
$
|
(5
|
)
|
$
|
(6
|
)
|
||||||
|
Other non-current liabilities
|
$
|
(27
|
)
|
$
|
(28
|
)
|
$
|
(86
|
)
|
$
|
(97
|
)
|
$
|
(36
|
)
|
$
|
(42
|
)
|
||||||
A number of the Company’s pension benefit plans were underfunded
as of December 31, 2018 and 2017
, having accumulated benefit obligations exceeding the fair value of plan assets. Information for the underfunded pension benefit plans is as follows:
|
U.S. Plan
|
Non-U.S. Plans
|
|||||||||||||||
|
(in millions)
|
2018
|
2017
|
2018
|
2017
|
||||||||||||
|
Projected benefit obligation
|
$
|
214
|
|
$
|
234
|
|
$
|
235
|
|
$
|
254
|
|
||||
|
Accumulated benefit obligation
|
214
|
|
234
|
|
225
|
|
244
|
|
||||||||
|
Fair value of plan assets
|
187
|
|
206
|
|
147
|
|
155
|
|
||||||||
The Company’s policy for funding its pension benefit plans is to make contributions that meet or exceed the minimum statutory funding requirements. These contributions are determined based upon recommendations made by the actuary under accepted actuarial principles. In
2019
, the Company expects to contribute
$2 million
,
$7 million
and
$5 million
to the U.S. pension benefit plan, the non-U.S. pension benefit plans and the U.S. postretirement benefit plan, respectively. The Company plans to use postretirement benefit plan assets and cash on hand, as necessary, to fund the U.S. postretirement benefit plan benefit payments in
2019
.
F-44
Estimated Future Benefit Payments
Future benefit payments over the next
10
years for the pension benefit plans and the postretirement benefit plan, which reflect expected future service, as appropriate, are expected to be paid as follows:
|
(in millions)
|
Pension Benefit Plans
|
U.S. Postretirement
Benefit
Plan
|
||||||||||
|
U.S. Plan
|
Non-U.S. Plans
|
|||||||||||
|
2019
|
$
|
14
|
|
$
|
5
|
|
$
|
5
|
|
|||
|
2020
|
18
|
|
5
|
|
5
|
|
||||||
|
2021
|
18
|
|
6
|
|
4
|
|
||||||
|
2022
|
18
|
|
6
|
|
4
|
|
||||||
|
2023
|
17
|
|
6
|
|
4
|
|
||||||
|
2024-2028
|
79
|
|
37
|
|
14
|
|
||||||
Assumptions
The weighted-average assumptions used to determine net periodic benefit costs and benefit obligations
for 2018, 2017 and 2016
were as follows:
|
Pension Benefit Plans
|
U.S. Postretirement Benefit Plan
|
|||||||||||||||||
|
2018
|
2017
|
2016
|
2018
|
2017
|
2016
|
|||||||||||||
|
For Determining Net Periodic (Benefit) Cost
|
||||||||||||||||||
|
U.S. Plans:
|
||||||||||||||||||
|
Discount rate
|
3.56
|
%
|
4.04
|
%
|
4.34
|
%
|
3.47
|
%
|
3.85
|
%
|
4.13
|
%
|
||||||
|
Expected rate of return on plan assets
|
7.50
|
%
|
7.50
|
%
|
7.50
|
%
|
—
|
|
—
|
%
|
5.50
|
%
|
||||||
|
Rate of compensation increase
|
—
|
|
—
|
|
—
|
|
—
|
|
—
|
|
—
|
|
||||||
|
Non-U.S. Plans:
|
||||||||||||||||||
|
Discount rate
|
2.29
|
%
|
2.08
|
%
|
2.74
|
%
|
||||||||||||
|
Expected rate of return on plan assets
|
3.66
|
%
|
3.84
|
%
|
5.46
|
%
|
||||||||||||
|
Rate of compensation increase
|
2.87
|
%
|
2.64
|
%
|
2.87
|
%
|
||||||||||||
|
|
Pension Benefit Plans
|
U.S. Postretirement Benefit Plan
|
||||||||||
|
2018
|
2017
|
2018
|
2017
|
|||||||||
|
For Determining Benefit Obligation
|
||||||||||||
|
U.S. Plans:
|
||||||||||||
|
Discount rate
|
4.25
|
%
|
3.56
|
%
|
4.16
|
%
|
3.47
|
%
|
||||
|
Rate of compensation increase
|
—
|
|
—
|
|
—
|
|
—
|
|
||||
|
Non-U.S. Plans:
|
||||||||||||
|
Discount rate
|
2.39
|
%
|
2.29
|
%
|
||||||||
|
Rate of compensation increase
|
2.89
|
%
|
2.87
|
%
|
||||||||
The expected long-term rate of return on plan assets was developed based on a capital markets model that uses expected asset class returns, variance and correlation assumptions. The expected asset class returns were developed starting with current Treasury (for the U.S. pension plan) or Eurozone (for the Ireland pension plans) government yields and then adding corporate bond spreads and equity risk premiums to develop the return expectations for each asset class. The expected asset class returns are forward-looking. The variance and correlation assumptions are also forward-looking. They take into account historical relationships, but are adjusted to reflect expected capital market trends. The expected return on plan assets for the Company’s U.S. pension plan for
2018
was
7.50%
. The expected return on plan assets for the Company’s Ireland pension plans was
3.75%
for
2018
.
The discount rate used to determine benefit obligations represents the current rate at which the benefit plan liabilities could be effectively settled considering the timing of expected payments for plan participants.
F-45
The
2019
expected rate of return for the U.S. pension benefit plan will be
7.25%
. The
2019
expected rate of return for the Ireland pension benefit plans will be
3.50%
.
Pension Benefit Plans Assets
Pension benefit plan assets are invested in several asset categories. The following presents the actual asset allocation
as of December 31, 2018 and 2017
:
|
2018
|
2017
|
|||||
|
U.S. Plan
|
||||||
|
Equity securities
|
52
|
%
|
60
|
%
|
||
|
Fixed income securities
|
47
|
%
|
30
|
%
|
||
|
Other
|
1
|
%
|
10
|
%
|
||
|
Non-U.S. Plans
|
||||||
|
Cash and cash equivalents
|
5
|
%
|
9
|
%
|
||
|
Equity securities
|
20
|
%
|
23
|
%
|
||
|
Fixed income securities
|
69
|
%
|
66
|
%
|
||
|
Other
|
6
|
%
|
2
|
%
|
||
The investment strategy underlying pension plan asset allocation is to manage the assets of the plan to provide for the non-current liabilities while maintaining sufficient liquidity to pay current benefits. Pension plan assets are diversified to protect against large investment losses and to reduce the probability of excessive performance volatility. Diversification of assets is achieved by allocating funds to various asset classes and investment styles within asset classes, and retaining investment management firm(s) with complementary investment philosophies, styles and approaches.
The Company’s pension plan assets are managed by outside investment managers using a total return investment approach, whereby a mix of equity and debt securities investments are used to maximize the long-term rate of return on plan assets. A significant portion of the assets of the U.S. and Ireland pension plans have been invested in equity securities, as equity portfolios have historically provided higher returns than debt and other asset classes over extended time horizons. Correspondingly, equity investments also entail greater risks than other investments. Equity risks are balanced by investing a significant portion of plan assets in broadly diversified fixed income securities.
Fair Value of Plan Assets
The Company measured the fair value of plan assets based on the prices that would be received to sell an asset or paid to transfer a liability in an orderly transaction between market participants at the measurement date. See
Note 6, "FAIR VALUE MEASUREMENTS"
for details on the Company's fair value measurements based on a three-tier hierarchy.
F-46
The table below presents total plan assets by investment category
as of December 31, 2018 and 2017
and the classification of each investment category within the fair value hierarchy with respect to the inputs used to measure fair value. There were
no
transfers between Level 1 and Level 2 during the years ended
December 31, 2018
and
2017
.
|
Pension Benefit Plans - U.S. Plans
|
||||||||||||||||||||||||||||||||
|
As of December 31, 2018
|
As of December 31, 2017
|
|||||||||||||||||||||||||||||||
|
(in millions)
|
Quoted Prices in Active Markets for Identical Assets
(Level 1)
|
Significant
Other
Observable
Inputs
(Level 2)
|
Significant
Unobservable
Inputs
(Level 3)
|
Total
|
Quoted Prices in Active Markets for Identical Assets
(Level 1)
|
Significant
Other
Observable
Inputs
(Level 2)
|
Significant
Unobservable
Inputs
(Level 3)
|
Total
|
||||||||||||||||||||||||
|
Cash and cash equivalents
|
$
|
2
|
|
$
|
—
|
|
$
|
—
|
|
$
|
2
|
|
$
|
—
|
|
$
|
—
|
|
$
|
—
|
|
$
|
—
|
|
||||||||
|
Commingled funds:
|
|
|
|
|
|
|
|
|
|
|
||||||||||||||||||||||
|
Equity securities:
|
||||||||||||||||||||||||||||||||
|
U.S. broad market
|
—
|
|
51
|
|
—
|
|
51
|
|
—
|
|
76
|
|
—
|
|
76
|
|
||||||||||||||||
|
Emerging markets
|
—
|
|
13
|
|
—
|
|
13
|
|
—
|
|
19
|
|
—
|
|
19
|
|
||||||||||||||||
|
Worldwide developed markets
|
—
|
|
21
|
|
—
|
|
21
|
|
—
|
|
29
|
|
—
|
|
29
|
|
||||||||||||||||
|
Other assets
|
—
|
|
13
|
|
—
|
|
13
|
|
—
|
|
20
|
|
—
|
|
20
|
|
||||||||||||||||
|
Fixed income securities:
|
|
|
||||||||||||||||||||||||||||||
|
Investment grade
|
—
|
|
87
|
|
—
|
|
87
|
|
—
|
|
62
|
|
—
|
|
62
|
|
||||||||||||||||
|
$
|
2
|
|
$
|
185
|
|
$
|
—
|
|
$
|
187
|
|
$
|
—
|
|
$
|
206
|
|
$
|
—
|
|
$
|
206
|
|
|||||||||
|
Pension Benefit Plans - Non-U.S. Plans
|
||||||||||||||||||||||||||||||||
|
As of December 31, 2018
|
As of December 31, 2017
|
|||||||||||||||||||||||||||||||
|
(in millions)
|
Quoted Prices in Active Markets for Identical Assets
(Level 1)
|
Significant
Other
Observable
Inputs
(Level 2)
|
Significant
Unobservable
Inputs
(Level 3)
|
Total
|
Quoted Prices in Active Markets for Identical Assets
(Level 1)
|
Significant
Other
Observable
Inputs
(Level 2)
|
Significant
Unobservable
Inputs
(Level 3)
|
Total
|
||||||||||||||||||||||||
|
Cash and cash equivalents
|
$
|
7
|
|
$
|
—
|
|
$
|
—
|
|
$
|
7
|
|
$
|
14
|
|
$
|
—
|
|
$
|
—
|
|
$
|
14
|
|
||||||||
|
Commingled funds:
|
|
|
|
|
|
|
|
|
|
|
||||||||||||||||||||||
|
Equity securities:
|
||||||||||||||||||||||||||||||||
|
Emerging markets
|
—
|
|
1
|
|
—
|
|
1
|
|
—
|
|
1
|
|
—
|
|
1
|
|
||||||||||||||||
|
Worldwide developed markets
|
—
|
|
29
|
|
—
|
|
29
|
|
—
|
|
35
|
|
—
|
|
35
|
|
||||||||||||||||
|
Fixed income securities:
|
|
|
||||||||||||||||||||||||||||||
|
Investment grade
|
—
|
|
9
|
|
—
|
|
9
|
|
—
|
|
10
|
|
—
|
|
10
|
|
||||||||||||||||
|
Global high yield
|
—
|
|
2
|
|
—
|
|
2
|
|
—
|
|
4
|
|
—
|
|
4
|
|
||||||||||||||||
|
Government bond funds
|
—
|
|
90
|
|
—
|
|
90
|
|
—
|
|
88
|
|
—
|
|
88
|
|
||||||||||||||||
|
Other assets
|
—
|
|
9
|
|
—
|
|
9
|
|
—
|
|
3
|
|
—
|
|
3
|
|
||||||||||||||||
|
$
|
7
|
|
$
|
140
|
|
$
|
—
|
|
$
|
147
|
|
$
|
14
|
|
$
|
141
|
|
$
|
—
|
|
$
|
155
|
|
|||||||||
Cash equivalents consisted primarily of term deposits and money market instruments. The fair value of the term deposits approximates their carrying amounts due to their short term maturities. The money market instruments also have short maturities and are valued using a market approach based on the quoted market prices of identical instruments.
Commingled funds are not publicly traded. The underlying assets in these funds are publicly traded on the exchanges and have readily available price quotes. The Ireland pension plans held approximately
93%
and
92%
of the non-U.S. commingled funds in
2018
and
2017
, respectively. The commingled funds held by the U.S. and Ireland pension plans are primarily invested in index funds.
The underlying assets in the fixed income funds are generally valued using the net asset value per fund share, which is derived using a market approach with inputs that include broker quotes, benchmark yields, base spreads and reported trades.
The insurance policies held by the postretirement benefit plan consist of variable life insurance contracts whose fair value is their cash surrender value. Cash surrender value is the amount currently payable by the insurance company upon surrender
F-47
of the policy and is based principally on the net asset values of the underlying trust funds. The trust funds are commingled funds that are not publicly traded. The underlying assets in these funds are primarily publicly traded on exchanges and have readily available price quotes.
Defined Contribution Plans
The Company sponsors defined contribution plans in the U.S., Ireland and certain other countries. Under these plans, employees are allowed to contribute a portion of their salaries to the plans, and the Company matches a portion of the employee contributions. The Company contributed
$36 million
,
$22 million
and
$28 million
to these plans during the
years ended December 31, 2018, 2017 and 2016
, respectively.
|
13.
|
SHARE-BASED COMPENSATION
|
In May 2014, shareholders approved the Company’s 2014 Omnibus Incentive Plan (the “2014 Plan”) which replaced the Company’s 2011 Omnibus Incentive Plan (the “2011 Plan”) for future equity awards granted by the Company. The Company transferred the common shares available under the 2011 Plan to the 2014 Plan. The maximum number of common shares that may be issued to participants under the 2014 Plan is equal to
18,000,000
common shares, plus the number of common shares under the 2011 Plan reserved but unissued and not underlying outstanding awards and the number of common shares becoming available for reuse after awards are terminated, forfeited, cancelled, exchanged or surrendered under the 2011 Plan and the Company’s 2007 Equity Compensation Plan. The Company registered
20,000,000
common shares of common stock for issuance under the 2014 Plan.
Effective April 30, 2018, the Company amended and restated the 2014 Plan (the “Amended and Restated 2014 Plan”). The Amended and Restated 2014 Plan includes the following amendments: (i) the number of common shares authorized for issuance under the Amended and Restated 2014 Plan has been increased by an additional
11,900,000
common shares, as approved by the requisite number of shareholders at the Company’s annual general meeting held on April 30, 2018, (ii) introduction of a
$750,000
aggregate fair market value limit on awards (in either equity, cash or other compensation) that can be granted in any calendar year to a participant who is a non-employee director, (iii) housekeeping changes to address recent changes to Section 162(m) of the Internal Revenue Code, (iv) awards are expressly subject to the Company’s clawback policy and (v) awards not assumed or substituted in connection with a Change of Control (as defined in the Amended and Restated 2014 Plan) will only vest on a pro rata basis.
Approximately
14,423,000
common shares were available for future grants as of
December 31, 2018
. The Company uses reserved and unissued common shares to satisfy its obligation under its share-based compensation plans.
The components and classification of share-based compensation expense related to stock options and RSUs for the
years ended December 31, 2018, 2017 and 2016
were as follows:
|
(in millions)
|
2018
|
2017
|
2016
|
|||||||||
|
Stock options
|
$
|
23
|
|
$
|
18
|
|
$
|
16
|
|
|||
|
RSUs
|
64
|
|
69
|
|
149
|
|
||||||
|
Share-based compensation expense
|
$
|
87
|
|
$
|
87
|
|
$
|
165
|
|
|||
|
Research and development expenses
|
$
|
9
|
|
$
|
8
|
|
$
|
7
|
|
|||
|
Selling, general and administrative expenses
|
78
|
|
79
|
|
158
|
|
||||||
|
Share-based compensation expense
|
$
|
87
|
|
$
|
87
|
|
$
|
165
|
|
|||
During 2017, the Company introduced a new long-term incentive program with the objective of realigning the share-based awards granted to senior management with the Company’s focus on improving its tangible capital usage and allocation, while maintaining focus on improving total shareholder return over the long-term. The share-based awards granted under this long-term incentive program consist of time-based stock options, time-based RSUs and performance-based RSUs. Performance-based RSUs are comprised of: (i) awards that vest upon achievement of certain share price appreciation conditions that are based on total shareholder return (“TSR”) and (ii) awards that vest upon attainment of certain performance targets that are based on the Company’s return on tangible capital (“ROTC”).
F-48
The fair value of the ROTC performance-based RSUs is estimated based on the trading price of the Company’s common shares on the date of grant. Expense recognized for the ROTC performance-based RSUs in each reporting period reflects the Company’s latest estimate of the number of ROTC performance-based RSUs that are expected to vest. If the ROTC performance-based RSUs do not ultimately vest due to the ROTC targets not being met, no compensation expense is recognized and any previously recognized compensation expense is reversed.
In March 2016, the Company announced that its Board of Directors had initiated a search to identify a candidate for a new CEO to succeed the Company's then current CEO, who would continue to serve in that role until his replacement was appointed. On May 2, 2016, the Company's new CEO assumed the role, succeeding the Company's former CEO. Pursuant to the terms of his employment agreement dated January 2015, the former CEO was entitled to certain share-based awards and payments upon termination. Under his January 2015 employment agreement, the former CEO received performance-based RSUs that vest when certain market conditions (namely total shareholder return) are met at the defined dates, provided continuing employment through those dates. Under the termination provisions of his employment agreement, upon termination of the former CEO, the defined dates for meeting the market conditions of the performance-based RSUs were eliminated and, as a result, vesting was based solely on the attainment of the applicable level of total shareholder return through the date of termination and the resulting number of common shares, if any, to be awarded to the former CEO was determined on a pro-rata basis for service provided under the original performance period, with credit given for an additional year of service. Because the total shareholder return at the time of the former CEO’s termination did not meet the performance threshold, no common shares were issued and no value was ultimately received by the former CEO pursuant to this performance-based RSU award. However, an incremental share-based compensation expense of
$28 million
was recognized in the six-month period ended June 30, 2016, which represents the additional year of service credit consistent with the grant date fair value calculated using a Monte Carlo Simulation Model in the first quarter of 2015, notwithstanding the fact that no value was ultimately received by the former CEO. In addition to the acceleration of his performance-based RSUs, the former CEO was also entitled to a cash severance payment of
$9 million
and a pro-rata annual cash bonus of approximately
$2 million
pursuant to his employment agreement. The cash severance payments, the pro-rata cash bonus and the associated payroll taxes were also recognized as expense in the first quarter of 2016.
The granted stock options, time-based RSUs and performance-based RSUs includes long-term incentive awards granted to the Company’s Chief Executive Officer ("CEO") which had an aggregate value of
$10 million
. In connection with his award, approximately
933,000
performance-based RSUs received by the CEO upon his hire in 2016 were canceled, and the shares underlying those performance-based RSUs were permanently retired and are not available for future grants under the 2014 Plan. The CEO's long-term incentive award was accounted for as an award modification whereby the Company continues to recognize the unamortized compensation associated with the original award plus the incremental fair value of the new award measured at the date of grant, over the vesting period of the new award.
Stock Options
Stock options granted under the 2011 Plan and the Amended and Restated 2014 Plan generally expire on the fifth or tenth anniversary of the grant date. The exercise price of any stock option granted under the 2011 Plan and the Amended and Restated 2014 Plan will not be less than the closing price per common share preceding the date of grant. Stock options generally vest
33%
and
25%
each year over a
three
-year and
four
-year period, respectively, on the anniversary of the date of grant.
The fair values of all stock options granted for the years ended
December 31, 2018
,
2017
and
2016
were estimated as of the date of grant using the Black-Scholes option-pricing model with the following weighted-average assumptions:
|
2018
|
2017
|
2016
|
|||||||
|
Expected stock option life (years)
|
3.0
|
|
3.0
|
|
3.3
|
|
|||
|
Expected volatility
|
54.0
|
%
|
67.3
|
%
|
75.0
|
%
|
|||
|
Risk-free interest rate
|
2.7
|
%
|
1.8
|
%
|
1.1
|
%
|
|||
|
Expected dividend yield
|
—
|
%
|
—
|
%
|
—
|
%
|
|||
The expected stock option life was determined based on historical exercise and forfeiture patterns. The expected volatility was determined based on implied volatility in the market traded options of the Company’s common stock. The risk-free interest rate was determined based on the rate at the time of grant for zero-coupon U.S. or Canadian government bonds with maturity dates equal to the expected life of the stock option. The expected dividend yield was determined based on the stock option’s exercise price and expected annual dividend rate at the time of grant.
F-49
The Black-Scholes option-pricing model used by the Company to calculate stock option values was developed to estimate the fair value of freely tradeable, fully transferable stock options without vesting restrictions, which significantly differ from the Company’s stock option awards. This model also requires highly subjective assumptions, including future stock price volatility and expected time until exercise, which greatly affect the calculated values.
The following table summarizes stock option activity during
2018
:
|
(in millions, except per share amounts)
|
Options
|
Weighted-
Average
Exercise
Price Per Share
|
Weighted-
Average
Remaining
Contractual
Term
(Years)
|
Aggregate
Intrinsic
Value
|
|||||||||
|
Outstanding, January 1, 2018
|
4.5
|
|
$
|
34.65
|
|
|
|
|
|||||
|
Granted
|
2.1
|
|
$
|
15.52
|
|
|
|
|
|||||
|
Exercised
|
(0.2
|
)
|
$
|
16.73
|
|
|
|
|
|||||
|
Expired or forfeited
|
(0.5
|
)
|
$
|
37.47
|
|
|
|
|
|||||
|
Outstanding, December 31, 2018
|
5.9
|
|
$
|
27.88
|
|
7.9
|
$
|
11
|
|
||||
|
Vested and expected to vest, December 31, 2018
|
5.5
|
|
$
|
28.61
|
|
7.9
|
$
|
10
|
|
||||
|
Vested and exercisable, December 31, 2018
|
2.2
|
|
$
|
43.85
|
|
6.8
|
$
|
2
|
|
||||
The weighted-average fair values of all stock options granted in
2018, 2017 and 2016
were
$7.83
,
$5.97
and
$14.50
, respectively. The total intrinsic values of stock options exercised in
2018, 2017 and 2016
were
$1 million
,
$1 million
and
$65 million
, respectively. Proceeds received on the exercise of stock options in
2018, 2017 and 2016
were
$2 million
,
$1 million
and
$33 million
, respectively.
As of December 31, 2018
, the total remaining unrecognized compensation expense related to non-vested stock options amounted to
$18 million
, which will be amortized over the weighted-average remaining requisite service period of approximately
1.5
years. The total fair value of stock options vested in
2018, 2017 and 2016
were
$17 million
,
$20 million
and
$26 million
, respectively.
RSUs
RSUs generally vest either on the third anniversary date from the date of grant or
33%
a year over a
three
-year period. Annual RSUs granted to non-management directors vest immediately prior to the next Annual Meeting of Shareholders. Pursuant to the applicable unit agreement, certain RSUs may be subject to the attainment of any applicable performance goals specified by the Board of Directors. If the vesting of the RSUs is conditional upon the attainment of performance goals, any RSUs that do not vest as a result of a determination that the prescribed performance goals failed to be attained will be forfeited immediately upon such determination. RSUs are credited with dividend equivalents, in the form of additional RSUs, when dividends are paid on the Company’s common shares. Such additional RSUs will have the same vesting dates and will vest under the same terms as the RSUs in respect of which such additional RSUs are credited.
To the extent provided for in a RSU agreement, the Company may, in lieu of all or a portion of the common shares which would otherwise be provided to a holder, elect to pay a cash amount equivalent to the market price of the Company’s common shares on the vesting date for each vested RSU. The amount of cash payment will be determined based on the average market price of the Company’s common shares on the vesting date. The Company’s current intent is to settle vested RSUs through the issuance of common shares.
Time-Based RSUs
Each vested time-based RSU represents the right of a holder to receive one of the Company’s common shares. The fair value of each RSU granted is estimated based on the trading price of the Company’s common shares on the date of grant.
F-50
The following table summarizes non-vested time-based RSU activity during
2018
:
|
(in millions, except per share amounts)
|
Time-Based
RSUs
|
Weighted-
Average
Grant-Date
Fair Value Per Share
|
|||||
|
Non-vested, January 1, 2018
|
4.7
|
|
$
|
19.09
|
|
||
|
Granted
|
3.0
|
|
$
|
17.59
|
|
||
|
Vested
|
(1.5
|
)
|
$
|
20.19
|
|
||
|
Forfeited
|
(0.4
|
)
|
$
|
16.48
|
|
||
|
Non-vested, December 31, 2018
|
5.8
|
|
$
|
18.29
|
|
||
As of December 31, 2018
, the total remaining unrecognized compensation expense related to non-vested time-based RSUs amounted to
$47 million
, which will be amortized over the weighted-average remaining requisite service period of approximately
1.8
years. The total fair value of time-based RSUs vested in
2018, 2017 and 2016
were
$30 million
,
$58 million
and
$43 million
, respectively.
Performance-Based RSUs
Each vested performance-based RSU represents the right of a holder to receive a number of the Company’s common shares up to a specified maximum. Performance-based RSUs vest upon achievement of certain share price appreciation conditions or attainment of certain performance targets. If the Company’s performance is below a specified performance level, no common shares will be paid.
The fair value of each performance-based RSU granted during
2018
,
2017
and
2016
was estimated using a Monte Carlo Simulation model, which utilizes multiple input variables to estimate the probability that the performance condition will be achieved. The fair values of performance-based RSUs granted during
2018
,
2017
and
2016
were estimated with the following assumptions:
|
2018
|
2017
|
2016
|
||||
|
Contractual term (years)
|
3.0
|
3.0
|
3.0 - 4.0
|
|||
|
Expected Company share volatility
|
54.2%
|
67.2% - 77.2%
|
78.2% - 81.4%
|
|||
|
Risk-free interest rate
|
2.7%
|
1.7% - 1.8%
|
1.0% - 1.2%
|
|||
The expected company share volatility was determined based on historical volatility over the contractual term of the performance-based RSU. The risk-free interest rate was determined based on the rate at the time of grant for zero-coupon U.S. government bonds with maturity dates equal to the contractual term of the performance-based RSUs.
The following table summarizes non-vested performance-based RSU activity during
2018
:
|
(in millions, except per share amounts)
|
Performance-based
RSUs
|
Weighted-
Average
Grant-Date
Fair Value Per Share
|
|||||
|
Non-vested, January 1, 2018
|
1.8
|
|
$
|
48.55
|
|
||
|
Granted
|
0.9
|
|
$
|
24.44
|
|
||
|
Vested
|
(0.1
|
)
|
$
|
247.04
|
|
||
|
Forfeited
|
(1.1
|
)
|
$
|
39.63
|
|
||
|
Non-vested, December 31, 2018
|
1.5
|
|
$
|
34.06
|
|
||
During
2018
, the Company granted approximately
878,000
performance-based RSUs, consisting of approximately
469,000
units of TSR performance-based RSUs with an average grant date fair value of
$29.35
per RSU and approximately
409,000
units of ROTC performance-based RSUs with a weighted-average grant date fair value of
$18.80
per RSU.
F-51
As of December 31, 2018
, the total remaining unrecognized compensation expense related to non-vested performance-based RSUs amounted to
$24 million
, which will be amortized over the weighted-average remaining requisite service period of approximately
1.7
years. A maximum of
2,860,510
common shares could be issued upon vesting of the performance-based RSUs outstanding
as of December 31, 2018
.
|
14.
|
ACCUMULATED OTHER COMPREHENSIVE LOSS
|
Accumulated other comprehensive loss
as of
December 31, 2018
and
2017
consists of:
|
(in millions)
|
2018
|
2017
|
||||||
|
Foreign currency translation adjustment
|
$
|
(2,111
|
)
|
$
|
(1,877
|
)
|
||
|
Pension adjustment, net of tax
|
(26
|
)
|
(19
|
)
|
||||
|
$
|
(2,137
|
)
|
$
|
(1,896
|
)
|
|||
Income taxes are not provided for foreign currency translation adjustments arising on the translation of the Company’s operations having a functional currency other than the U.S. dollar, except to the extent of translation adjustments related to the Company’s retained earnings for foreign jurisdictions in which the Company is not considered to be permanently reinvested.
|
15.
|
RESEARCH AND DEVELOPMENT
|
Included in Research and development are costs related to product development and quality assurance programs. Quality assurance are the costs incurred to meet evolving customer and regulatory standards. Research and development costs for the
years ended December 31, 2018, 2017 and 2016
consist of:
|
(in millions)
|
2018
|
2017
|
2016
|
|||||||||
|
Product related research and development
|
$
|
376
|
|
$
|
328
|
|
$
|
385
|
|
|||
|
Quality assurance
|
37
|
|
33
|
|
36
|
|
||||||
|
Research and development
|
$
|
413
|
|
$
|
361
|
|
$
|
421
|
|
|||
|
16.
|
OTHER (INCOME) EXPENSE, NET
|
Other (income) expense, net
for the
years ended December 31, 2018, 2017 and 2016
were as follows:
|
(in millions)
|
|
2018
|
|
2017
|
|
2016
|
||||||
|
Gain on the Skincare Sale
|
$
|
—
|
|
$
|
(309
|
)
|
$
|
—
|
|
|||
|
Gain on the iNova Sale
|
—
|
|
(309
|
)
|
—
|
|
||||||
|
Gain on the Dendreon Sale
|
—
|
|
(97
|
)
|
—
|
|
||||||
|
Loss on the Sprout Sale
|
—
|
|
98
|
|
—
|
|
||||||
|
Net loss (gain) on other sales of assets
|
6
|
|
37
|
|
(6
|
)
|
||||||
|
Litigation and other matters
|
(27
|
)
|
226
|
|
59
|
|
||||||
|
Other, net
|
—
|
|
1
|
|
20
|
|
||||||
|
Other (income) expense, net
|
|
$
|
(21
|
)
|
$
|
(353
|
)
|
$
|
73
|
|
||
In 2018, Litigation and other matters includes a favorable adjustment of
$40 million
related to the Salix SEC litigation. In 2017, Litigation and other matters includes: (i)
$96 million
related to the settlement of the Allergan shareholder class actions, (ii)
$93 million
related to the settlement of the Solodyn
®
antitrust class actions litigation and (iii)
$20 million
related to the Mimetogen Pharmaceuticals litigation. In 2016, Litigation and other matters includes: (i) an unfavorable adjustment of
$90 million
from the settlement of the Salix securities litigation and (ii) a favorable adjustment of
$39 million
from the settlement of the investigation into Salix's pre-acquisition sales and promotional practices for the Xifaxan
®
, Relistor
®
and Apriso
®
products. See
Note 20, "LEGAL PROCEEDINGS"
for additional information.
F-52
|
17.
|
INCOME TAXES
|
The components of
Loss before benefit from income taxes
for the
years ended December 31, 2018, 2017 and 2016
consist of:
|
(in millions)
|
2018
|
2017
|
2016
|
|||||||||
|
Domestic
|
$
|
(1,475
|
)
|
$
|
(2,032
|
)
|
$
|
(1,804
|
)
|
|||
|
Foreign
|
(2,679
|
)
|
291
|
|
(631
|
)
|
||||||
|
$
|
(4,154
|
)
|
$
|
(1,741
|
)
|
$
|
(2,435
|
)
|
||||
The components of
Benefit from income taxes
for the
years ended December 31, 2018, 2017 and 2016
consist of:
|
(in millions)
|
2018
|
2017
|
2016
|
|||||||||
|
Current:
|
|
|
|
|||||||||
|
Domestic
|
$
|
—
|
|
$
|
(20
|
)
|
$
|
—
|
|
|||
|
Foreign
|
(327
|
)
|
(146
|
)
|
(241
|
)
|
||||||
|
(327
|
)
|
|
(166
|
)
|
|
(241
|
)
|
|||||
|
Deferred:
|
|
|
|
|||||||||
|
Domestic
|
17
|
|
(2
|
)
|
—
|
|
||||||
|
Foreign
|
320
|
|
4,313
|
|
268
|
|
||||||
|
337
|
|
|
4,311
|
|
|
268
|
|
|||||
|
$
|
10
|
|
$
|
4,145
|
|
$
|
27
|
|
||||
The
Benefit from income taxes
differs from the expected amount calculated by applying the Company’s Canadian statutory rate of
26.9%
to
Loss before benefit from income taxes
for the
years ended December 31, 2018, 2017 and 2016
as follows:
|
(in millions)
|
2018
|
2017
|
2016
|
|||||||||
|
Loss before benefit from income taxes
|
$
|
(4,154
|
)
|
$
|
(1,741
|
)
|
$
|
(2,435
|
)
|
|||
|
Benefit from income taxes
|
||||||||||||
|
Expected benefit from income taxes at Canadian statutory rate
|
$
|
1,117
|
|
$
|
468
|
|
$
|
655
|
|
|||
|
Non-deductible amount of share-based compensation
|
(10
|
)
|
(37
|
)
|
(30
|
)
|
||||||
|
Adjustments to tax attributes
|
(4
|
)
|
(242
|
)
|
147
|
|
||||||
|
Impact of changes in enacted income tax rates
|
—
|
|
747
|
|
—
|
|
||||||
|
Canadian tax impact of foreign exchange gain or loss on U.S. dollar denominated debt held by BHC and its Canadian Affiliates
|
(8
|
)
|
157
|
|
(11
|
)
|
||||||
|
Change in valuation allowance related to foreign tax credits and NOLs
|
(3
|
)
|
139
|
|
(155
|
)
|
||||||
|
Change in valuation allowance on Canadian deferred tax assets and tax rate changes
|
(867
|
)
|
(517
|
)
|
(472
|
)
|
||||||
|
Change in uncertain tax positions
|
(47
|
)
|
(65
|
)
|
(10
|
)
|
||||||
|
Foreign tax rate differences
|
(3
|
)
|
933
|
|
(101
|
)
|
||||||
|
Goodwill impairment
|
(488
|
)
|
(139
|
)
|
(377
|
)
|
||||||
|
Tax differences on divestitures of businesses
|
—
|
|
203
|
|
—
|
|
||||||
|
Tax benefit on intra-entity transfers
|
356
|
|
2,480
|
|
399
|
|
||||||
|
Other
|
(33
|
)
|
18
|
|
(18
|
)
|
||||||
|
$
|
10
|
|
$
|
4,145
|
|
$
|
27
|
|
||||
F-53
Deferred tax assets and liabilities
as of December 31, 2018 and 2017
consist of:
|
(in millions)
|
2018
|
2017
|
||||||
|
Deferred tax assets:
|
|
|
||||||
|
Tax loss carryforwards
|
$
|
2,886
|
|
$
|
2,485
|
|
||
|
Provisions
|
519
|
|
589
|
|
||||
|
Research and development tax credits
|
143
|
|
140
|
|
||||
|
Scientific Research and Experimental Development pool
|
52
|
|
57
|
|
||||
|
Tax credit carryforwards
|
46
|
|
59
|
|
||||
|
Deferred revenue
|
4
|
|
11
|
|
||||
|
Unrealized FX on U.S. dollar debt and other financing cost
|
262
|
|
61
|
|
||||
|
Prepaid expenses
|
44
|
|
—
|
|
||||
|
Share-based compensation
|
24
|
|
22
|
|
||||
|
Total deferred tax assets
|
3,980
|
|
3,424
|
|
||||
|
Less valuation allowance
|
(2,913
|
)
|
(2,001
|
)
|
||||
|
Net deferred tax assets
|
1,067
|
|
1,423
|
|
||||
|
Deferred tax liabilities:
|
|
|
||||||
|
Intangible assets
|
163
|
|
2,014
|
|
||||
|
Plant, equipment and technology
|
55
|
|
18
|
|
||||
|
Outside basis differences
|
29
|
|
28
|
|
||||
|
Prepaid expenses
|
—
|
|
35
|
|
||||
|
Other
|
29
|
|
75
|
|
||||
|
Total deferred tax liabilities
|
276
|
|
2,170
|
|
||||
|
Net deferred tax asset (liability)
|
$
|
791
|
|
$
|
(747
|
)
|
||
On December 22, 2017, the Tax Act was signed into law and includes a number of changes in the U.S. tax law, most notably a reduction of the U.S. corporate income tax rate from
35%
to
21%
for tax years beginning after December 31, 2017. The Tax Act also implements a modified territorial tax system that includes a one-time transition tax on the accumulated previously untaxed earnings of foreign subsidiaries (the “Transition Toll Tax”) equal to
15.5%
(reinvested in liquid assets) or
8%
(reinvested in non-liquid assets). At the taxpayer's election, the Transition Toll Tax can be paid over an
eight
-year period without interest, starting in 2018.
The Company elected not to use this option and instead used a portion of its U.S. net operating losses ("NOLs") to offset this income inclusion.
The Tax Act also includes two new U.S. tax base erosion provisions: (i) the base-erosion and anti-abuse tax (“BEAT”) and (ii) the global intangible low-taxed income (“GILTI”). BEAT provides a minimum tax on U.S. tax deductible payments made to related foreign parties after December 31, 2017. GILTI requires an entity to include in its U.S. taxable income the earnings of its foreign subsidiaries in excess of an allowable return on each foreign subsidiary’s depreciable tangible assets. Accounting guidance provides that the impacts of GILTI can be included in the consolidated financial statements either by recording the impacts in the period in which GILTI has been incurred or by adjusting deferred tax assets or liabilities in the period of enactment related to basis differences expected to reverse as a result of the GILTI provisions in future years. The Company has elected to provide for the GILTI tax in the period in which it is incurred and, therefore, the 2017 benefit for income taxes did not include a provision for GILTI. The tax expense in 2018 includes the effects of the Tax Act including both GILTI and BEAT.
As part of the Tax Act, the Company’s U.S. interest expense is subject to limitation rules which limit U.S. interest expense to
30%
of adjusted taxable income, defined similar to EBITDA through 2021 and EBIT thereafter. Disallowed interest can be carried forward indefinitely and any unused interest deduction assessed for recoverability. The Company considered such provisions in 2018 and expects to fully utilize any interest carry forwards in future periods.
For the year ended December 31, 2017, the Company provided for income taxes, including the impacts of the Tax Act, in accordance with the accounting guidance issued through the date of issuance of its audited Consolidated Financial Statements. In accordance with that accounting guidance, the Company had provisionally provided for the income tax effects of the Tax Act as of December 31, 2017. The Company’s Benefit from income taxes for the year 2017 included provisional net tax
F-54
benefits of
$975 million
attributable to the Tax Act which included: (i) the re-measurement of certain deferred tax assets and liabilities based on the rates at which they are expected to reverse in the future of
$774 million
, (ii) the one-time Transition Toll Tax of
$88 million
and (iii) the decrease in deferred tax assets attributable to certain legal accruals, the deductibility of which is uncertain for U.S. federal income tax purposes, of
$10 million
. The Company has utilized NOLs to offset the provisionally determined
$88 million
Transition Toll Tax and therefore no amount was recorded as payable. The Company had previously provided for residual U.S. federal income tax on its outside basis differences in certain foreign subsidiaries which, due to the Tax Act, are no longer taxable. As such, the Company's residual U.S. federal income tax liability of
$299 million
prior to the law change was reversed and the Company recognized a deferred tax benefit of
$299 million
in the fourth quarter of 2017.
The provisional amounts included in the Company's Benefit from income taxes for the year 2017, including the Transition Toll Tax, were finalized during the three months ended December 31, 2018. In finalizing the Benefit from income taxes for the year 2017, the Company considered the guidance issued by accounting regulatory bodies, the U.S. Internal Revenue Service, state and local governments, and the proposed regulations regarding the one-time Transition Toll Tax on the pre-2018 earnings of certain non-U.S. subsidiaries issued by the U.S. Treasury Department on August 1, 2018. As part of its full assessment, the Company also assessed the impact of the Tax Act on the Company’s tax filings for the year 2017. Differences between the provisional net income tax benefits provided in 2017 attributable to the Tax Act of
$975 million
, as previously disclosed, and the benefit for income taxes as finalized are included in the Benefit from income taxes for the year ended December 31, 2018 and were not material to the Company’s financial results for the year ended December 31, 2018. Although the Company has completed its full assessment and finalized its accounting for the impact of the Tax Act, the Company will monitor guidance issued in the future and assess the impact, if any, on the amounts provided.
The Company has provided for income taxes, including the impacts of the Tax Act, in accordance with guidance issued by accounting regulatory bodies, the U.S. Internal Revenue Service and state and local governments through the date of the issuance of these Consolidated Financial Statements. Additional guidance and interpretations can be expected and such guidance, if any, could impact future results. While management continues to monitor these matters, the ultimate impact, if any, as a result of the application of any guidance issued in the future cannot be determined at this time.
On December 21, 2018, the U.S. Treasury Department released proposed regulations under the new dividend received deduction and anti-hybrid rules. The Company has evaluated the proposed regulations, the impact of which was not material and has been included in the Benefit from income taxes.
On September 5, 2018, Ireland’s Minister for Finance and Public Expenditure and Reform published Ireland’s Corporation Tax Roadmap incorporating implementation of the European Union Anti-Tax Avoidance Directives. The regulations have no impact for 2018 and the Company is in the process of evaluating these proposals and the impacts on its future financial results.
In 2017, the Company liquidated its top U.S. subsidiary (Biovail Americas Corp.) in a taxable transaction that resulted in a taxable loss which was of a character that offset certain gains from internal restructurings and third-party divestitures, the excess of which was, under U.S. tax law, able to be carried back to offset previously recognized gains in 2016, 2015 and 2014. This carryback resulted in an increase in the deferred tax asset for NOLs previously utilized against such gains. In connection with this taxable transaction, the Company recognized a net income tax benefit of approximately
$400 million
primarily related to the carryback of losses and reversed a previously established deferred tax liability of approximately
$1,900 million
.
The realization of deferred tax assets is dependent on the Company generating sufficient domestic and foreign taxable income in the years that the temporary differences become deductible. A valuation allowance has been provided for the portion of the deferred tax assets that the Company determined is more likely than not to remain unrealized based on estimated future taxable income and tax planning strategies. As a result of taxable losses in Canada and deferred tax assets generated in conjunction with internal restructurings, the valuation allowance increased by
$912 million
and
$144 million
during the years ended
December 31, 2018 and 2017
, respectively. Given the Company’s history of pre-tax losses and expected future losses in Canada, the Company maintained that there was insufficient objective evidence to release the valuation allowance against Canadian tax loss carryforwards, International Tax Credits (“ITC”) and pooled Scientific Research and Experimental Development Tax Incentive (“SR&ED”) expenditures.
As of
December 31, 2018 and 2017
, the Company had accumulated taxable losses available to offset future years’ federal and provincial taxable income in Canada of approximately
$5,655 million
and
$5,047 million
, respectively. As of
December 31, 2018 and 2017
, unclaimed ITCs available to offset future federal taxes in Canada were approximately
$34 million
and
$37 million
, respectively, which expire in the years 2019 through 2036. In addition, as of
December 31, 2018 and 2017
, pooled SR&ED expenditures available to offset against future taxable income in Canada were approximately
$192 million
and
$210
F-55
million
, respectively, which may be carried forward indefinitely. As of
December 31, 2018 and 2017
, a full valuation allowance against the net Canadian deferred tax assets has been provided of
$2,470 million
and
$1,576 million
, respectively.
As of
December 31, 2018 and 2017
, the Company had accumulated taxable losses available to offset future years' federal taxable income in the U.S. of approximately
$1,552 million
and
$1,703 million
, respectively, including acquired losses which expire in the years 2021 through 2037. While the remaining taxable losses are subject to multiple annual loss limitations as a result of previous ownership changes, the Company believes that the recoverability of the deferred tax assets associated with these taxable losses are more likely than not to be realized. As of
December 31, 2018 and 2017
U.S. research and development credits available to offset future years' federal income taxes in the U.S. were approximately
$97 million
and
$95 million
, respectively, which includes acquired research and development credits and which expire in the years 2021 through 2038. The Company intends to amend prior U.S. tax filings in order to deduct foreign taxes rather than take a foreign tax credit. Therefore, during 2017, the Company reversed the deferred tax asset and associated valuation allowance of approximately
$342 million
in U.S. foreign tax credits, including acquired U.S. foreign tax credits. The Company recorded a deferred tax benefit of
$84 million
for such deduction and adjusted its expected NOL carryforward accordingly. In conjunction with the Sprout Sale in 2017, the Company recognized a capital loss and established a valuation allowance on the portion of the loss for which a benefit is not expected to be realized.
The Company provides for Canadian tax on the unremitted earnings of its direct foreign affiliates except for its direct U.S. subsidiaries. The Company continues to assert that the unremitted earnings of its U.S. subsidiaries will be permanently reinvested and not repatriated to Canada.
As of December 31, 2018
, the Company estimates there will be no Canadian tax liability attributable to the permanently reinvested U.S. earnings.
As of
December 31, 2018 and 2017
, unrecognized tax benefits (including interest and penalties) were
$654 million
and
$598 million
, of which
$345 million
and
$273 million
would affect the effective income tax rate, respectively. In 2018 and 2017, the remaining unrecognized tax benefits would not impact the effective tax rate as the tax positions are offset against existing tax attributes or are timing in nature. In 2018 and 2017, the Company recognized net increases to unrecognized tax benefits for current year tax positions of
$18 million
and
$147 million
, respectively. In 2018 and 2017, the Company recognized net increases to unrecognized tax benefits related to tax positions taken in the prior years of
$38 million
and
$28 million
, respectively.
The Company provides for interest and penalties related to unrecognized tax benefits in the provision for income taxes. As of
December 31, 2018 and 2017
, accrued interest and penalties related to unrecognized tax benefits were approximately
$42 million
and
$41 million
. In 2018 and 2017, the Company recognized an increase of approximately
$1 million
and
$2 million
of interest and penalties, respectively.
The Company and
one
or more of its subsidiaries file federal income tax returns in Canada, the U.S., and other foreign jurisdictions, as well as various provinces and states in Canada and the U.S. The Company and its subsidiaries have open tax years, primarily from 2005 to 2017, with significant taxing jurisdictions, respectively, including Canada and the U.S. These open years contain certain matters that could be subject to differing interpretations of applicable tax laws and regulations and tax treaties, as they relate to the amount, timing, or inclusion of revenues and expenses, or the sustainability of income tax positions of the Company and its subsidiaries. Certain of these tax years are expected to remain open indefinitely.
|
Jurisdiction:
|
Open Years
|
|
|
United States - Federal
|
2014 - 2017
|
|
|
Canada
|
2005 - 2017
|
|
|
Germany
|
2013 - 2017
|
|
|
France
|
2013 - 2017
|
|
|
China
|
2015 - 2017
|
|
|
Ireland
|
2013 - 2017
|
|
|
Netherlands
|
2015 - 2017
|
|
|
Australia
|
2011 - 2017
|
|
The Internal Revenue Service completed its examinations of the Company’s U.S. consolidated federal income tax returns for the years 2013 and 2014. There were no material adjustments to the Company's taxable income as a result of these examinations. The 2014 tax year remains open to the extent of a 2017 capital loss carried back to that year. Additionally, the Internal Revenue
F-56
Service has selected for examination the Company's annual tax filings for 2015 and 2016 and the Company's short period tax return for the period ended September 8, 2017, which was filed as a result of the Company's internal restructuring efforts during 2017. At this time, the Company does not expect that proposed adjustments, if any, for these periods would be material to the Company's Consolidated Financial Statements.
The Company is currently under examination by the Canada Revenue Agency for three separate cycles: (a) years 2005 through 2006, (b) years 2007 through 2009 and (c) years 2012 through 2013. The Company received from the Canada Revenue Agency a proposed audit adjustment for the years 2005 through 2009. The Company disagrees with the adjustments and has filed the respective Notices of Objection. The total proposed adjustment will result in a loss of tax attributes which are subject to a full valuation allowance and will not result in material change to the provision for income taxes. The Canada Revenue Agency audits of the 2010 and 2011 tax years were closed in 2016, and resulted in no material adjustments. The Company received an assessment for certain transfer pricing matters in 2012 for CAD
88 million
. The Company disagrees the adjustments and will file a Notice of Objection. Of the total proposed adjustment, all but CAD
2 million
will result in a loss of tax attributes which are subject to a full valuation allowance and will not result in a material change to the provision for income taxes.
The Company’s subsidiaries in Germany are under audit for tax years 2014 through 2016. At this time, the Company does not expect that proposed adjustments, if any, would be material to the Company's Consolidated Financial Statements.
The Company’s subsidiaries in Australia are under audit by the Australian Tax Office for various years beginning in 2010. On August 8, 2017, the Australian Taxation Office issued a notice of assessment for the tax years 2011 through 2017 in the aggregate amount of
$117 million
, which includes penalties and interest. The Company disagrees with the assessment and continues to believe that its tax positions are appropriate and supported by the facts, circumstances and applicable laws. The Company intends to defend its tax position in this matter vigorously and has filed a holding objection against the assessment by the Australian Taxation Office and has secured a bank guarantee to cover any potential cash outlays regarding this assessment. As of December 31, 2017, Restricted cash of
$77 million
was deposited with a bank as collateral to secure a bank guarantee for the benefit of the Australian Government. On January 9, 2018, the cash collateral of
$77 million
of Restricted cash was returned to the Company in exchange for a
$77 million
letter of credit.
The Company's U.S. affiliates remain under examination for various state tax audits in the U.S. for years 2012 through 2017.
Certain affiliates of the Company in regions outside of Canada, the U.S., Germany and Australia are currently under examination by relevant taxing authorities, and all necessary accruals have been recorded, including uncertain tax benefits. At this time, the Company does not expect that proposed adjustments, if any, would be material to the Company's Consolidated Financial Statements.
The following table presents a reconciliation of the unrecognized tax benefits for
2018, 2017 and 2016
:
|
(in millions)
|
2018
|
2017
|
2016
|
|||||||||
|
Balance, beginning of year
|
$
|
598
|
|
$
|
423
|
|
$
|
344
|
|
|||
|
Additions based on tax positions related to the current year
|
18
|
|
145
|
|
16
|
|
||||||
|
Additions for tax positions of prior years
|
55
|
|
57
|
|
96
|
|
||||||
|
Reductions for tax positions of prior years
|
(11
|
)
|
(18
|
)
|
(20
|
)
|
||||||
|
Lapse of statute of limitations
|
(6
|
)
|
(9
|
)
|
(13
|
)
|
||||||
|
Balance, end of year
|
$
|
654
|
|
$
|
598
|
|
$
|
423
|
|
|||
The Company estimates that unrecognized tax benefits realized during the next
12
months will not be material.
On February 15, 2019, the Company received a ruling from the Polish tax authorities confirming the deductibility of royalties paid to certain Canadian subsidiaries. In connection with this ruling, the Company expects to recognize a tax benefit and will reduce its uncertain tax benefit liability for the full amount of the previously recorded liability for this matter of
$32 million
during the quarter ending March 31, 2019.
F-57
|
18.
|
(LOSS) EARNINGS PER SHARE
|
(Loss) earnings per share attributable to Bausch Health Companies Inc.
for 2018, 2017 and 2016
were calculated as follows:
|
(in millions, except per share amounts)
|
2018
|
2017
|
2016
|
|||||||||
|
Net (loss) income attributable to Bausch Health Companies Inc.
|
$
|
(4,148
|
)
|
$
|
2,404
|
|
$
|
(2,409
|
)
|
|||
|
Basic weighted-average number of common shares outstanding
|
351.3
|
|
350.2
|
|
347.3
|
|
||||||
|
Dilutive effect of stock options, RSUs and other
|
—
|
|
1.6
|
|
—
|
|
||||||
|
Diluted weighted-average number of common shares outstanding
|
351.3
|
|
351.8
|
|
347.3
|
|
||||||
|
(Loss) earnings per share attributable to Bausch Health Companies Inc.
|
||||||||||||
|
Basic
|
$
|
(11.81
|
)
|
$
|
6.86
|
|
$
|
(6.94
|
)
|
|||
|
Diluted
|
$
|
(11.81
|
)
|
$
|
6.83
|
|
$
|
(6.94
|
)
|
|||
In 2018 and 2016, all potential common shares issuable for stock options and RSUs were excluded from the calculation of diluted loss per share, as the effect of including them would have been anti-dilutive. The dilutive effect of potential common shares issuable for stock options and RSUs on the weighted-average number of common shares outstanding would have been approximately
3,763,000
and
2,795,000
common shares for 2018 and 2016, respectively.
Additionally, in
2018, 2017 and 2016
, stock options, time-based RSUs and performance-based RSUs to purchase approximately
4,185,000
,
7,050,000
and
7,825,000
common shares of the Company, respectively, were not included in the computation of diluted earnings per share because the effect would have been anti-dilutive under the treasury stock method.
|
19.
|
SUPPLEMENTAL CASH FLOW DISCLOSURES
|
The Supplemental cash flow disclosures
for 2018, 2017 and 2016
were as follows:
|
(in millions)
|
2018
|
2017
|
2016
|
|||||||||
|
Other Payments
|
||||||||||||
|
Interest paid
|
$
|
1,665
|
|
$
|
1,708
|
|
$
|
1,718
|
|
|||
|
Income taxes paid
|
$
|
138
|
|
$
|
179
|
|
$
|
149
|
|
|||
20.
LEGAL PROCEEDINGS
From time to time, the Company becomes involved in various legal and administrative proceedings, which include product liability, intellectual property, commercial, tax, antitrust, governmental and regulatory investigations, related private litigation and ordinary course employment-related issues. From time to time, the Company also initiates actions or files counterclaims. The Company could be subject to counterclaims or other suits in response to actions it may initiate. The Company believes that the prosecution of these actions and counterclaims is important to preserve and protect the Company, its reputation and its assets. Certain of these proceedings and actions are described below.
On a quarterly basis, the Company evaluates developments in legal proceedings, potential settlements and other matters that could increase or decrease the amount of the liability accrued.
As of December 31, 2018
, the Company's Consolidated Balance Sheets includes accrued current loss contingencies of
$11 million
related to matters which are both probable and reasonably estimable. For all other matters, unless otherwise indicated, the Company cannot reasonably predict the outcome of these legal proceedings, nor can it estimate the amount of loss, or range of loss, if any, that may result from these proceedings. An adverse outcome in certain of these proceedings could have a material adverse effect on the Company’s business, financial condition and results of operations, and could cause the market value of its common shares and/or debt securities to decline.
F-58
Governmental and Regulatory Inquiries
Investigation by the U.S. Attorney's Office for the District of Massachusetts
In October 2015, the Company received a subpoena from the U.S. Attorney's Office for the District of Massachusetts, and, in June 2016, the Company received a follow-up subpoena. The materials requested, pursuant to the subpoenas and follow-up requests, include documents and witness interviews with respect to the Company’s patient assistance programs and contributions to patient assistance organizations that provide financial assistance to Medicare patients taking products sold by the Company, and the Company’s pricing of its products. The Company is cooperating with this investigation. The Company cannot predict the outcome or the duration of this investigation or any other legal proceedings or any enforcement actions or other remedies that may be imposed on the Company arising out of this investigation.
Investigation by the U.S. Attorney's Office for the Southern District of New York
In October 2015, the Company received a subpoena from the U.S. Attorney's Office for the Southern District of New York. The materials requested, pursuant to the subpoena and follow-up requests, include documents and witness interviews with respect to the Company’s patient assistance programs; its former relationship with Philidor Rx Services, LLC ("Philidor") and other pharmacies; the Company’s accounting treatment for sales by specialty pharmacies; information provided to the Centers for Medicare and Medicaid Services; the Company’s pricing (including discounts and rebates), marketing and distribution of its products; the Company’s compliance program; and employee compensation. The Company is cooperating with this investigation. The Company cannot predict the outcome or the duration of this investigation or any other legal proceedings or any enforcement actions or other remedies that may be imposed on the Company arising out of this investigation.
SEC Investigation
Beginning in November 2015, the Company received from the staff of the Los Angeles Regional Office of the SEC subpoenas for documents, as well as various document, testimony and interview requests, related to its investigation of the Company, including requests concerning the Company's former relationship with Philidor, its accounting practices and policies, its public disclosures and other matters. The Company is cooperating with the SEC in this matter. The Company cannot predict the outcome or the duration of the SEC investigation or any other legal proceedings or any enforcement actions or other remedies that may be imposed on the Company arising out of the SEC investigation.
AMF Investigation
On April 12, 2016, the Company received a request letter from the Autorité des marchés financiers (the “AMF”) requesting documents concerning the work of the Company’s ad hoc committee of independent directors (established to review certain allegations regarding the Company’s former relationship with Philidor and related matters), the Company’s former relationship with Philidor, the Company's accounting practices and policies and other matters. The Company is cooperating with the AMF in this matter. In July 2018, the Company was advised by the AMF that it had issued a formal investigation order in respect of the Company on February 2, 2018. The Company cannot predict whether any enforcement action against the Company will result from such investigation.
Investigation by the State of Texas
On May 27, 2014, the State of Texas served Bausch & Lomb Incorporated (“B&L Inc.”) with a Civil Investigative Demand concerning various price reporting matters relating to the State's Medicaid program and the amounts the State paid in reimbursement for B&L products for the period from 1995 to the date of the Civil Investigative Demand. The Company and B&L Inc. have cooperated fully with the State's investigation and have produced all of the documents requested by the State. In April 2016, the State sent B&L Inc. a demand letter claiming damages in the amount of
$20 million
. The Company and B&L Inc. have evaluated the letter and disagree with the allegations and methodologies set forth in the letter. In June 2016, the Company and B&L Inc. responded to the State. In July 2018, the State responded to the Company's June 2016 letter and indicated that it disagreed with certain of the Company’s positions and would send a response to the Company's June 2016 letter, which the Company has not yet received.
Securities and RICO Class Actions and Related Matters
U.S. Securities Litigation
In October 2015,
four
putative securities class actions were filed in the U.S. District Court for the District of New Jersey against the Company and certain current or former officers and directors. The allegations related to, among other things,
F-59
allegedly false and misleading statements and/or failures to disclose information about the Company’s business and prospects, including relating to drug pricing, the Company’s use of specialty pharmacies, and the Company’s relationship with Philidor.
On May 31, 2016, the Court entered an order consolidating the
four
actions under the caption In re Valeant Pharmaceuticals International, Inc. Securities Litigation, Case No. 3:15-cv-07658. On June 24, 2016, the lead plaintiff filed a consolidated complaint asserting claims under Sections 10(b) and 20(a) of the Exchange Act against the Company, and certain current or former officers and directors, as well as claims under Sections 11, 12(a)(2) and 15 of the Securities Act of 1933 (the “Securities Act”) against the Company, certain current or former officers and directors, and certain other parties. The lead plaintiff seeks to bring these claims on behalf of a putative class of persons who purchased the Company’s equity securities and senior notes in the United States between January 4, 2013 and March 15, 2016, including all those who purchased the Company’s securities in the United States in the Company’s debt and stock offerings between July 2013 to March 2015. On September 13, 2016, the Company and the other defendants moved to dismiss the consolidated complaint. On April 28, 2017, the Court dismissed certain claims arising out of the Company's private placement offerings and otherwise denied the motions to dismiss. On September 20, 2018, lead plaintiff filed an amended complaint, adding claims against ValueAct Capital Management L.P. and affiliated entities. On October 31, 2018, ValueAct filed a motion to dismiss and the parties then agreed that the action was stayed pursuant to the Private Securities Litigation Reform Act.
On June 6, 2018, a putative class action was filed in the U.S. District Court for the District of New Jersey against the Company and certain current or former officers and directors. This action, captioned Timber Hill LLC, v. Valeant Pharmaceuticals International, Inc., et al., (Case No. 2:18-cv-10246) (“Timber Hill”), asserts securities fraud claims under Sections 10(b) and 20(a) of the Exchange Act on behalf of a putative class of persons who purchased call options or sold put options on the Company’s common stock during the period January 4, 2013 through August 11, 2016. On June 11, 2018, this action was consolidated with In re Valeant Pharmaceuticals International, Inc. Securities Litigation, (Case No. 3:15-cv-07658). On January 14, 2019, Defendants filed a motion to dismiss the Timber Hill complaint. Briefing on that motion was completed on February 13, 2019.
In addition to the consolidated putative class action,
thirty-one
groups of individual investors in the Company’s stock and debt securities have chosen to opt out of the consolidated putative class action and filed securities actions pending in the U.S. District Court for the District of New Jersey against the Company and certain current or former officers and directors. These actions are captioned: T. Rowe Price Growth Stock Fund, Inc. v. Valeant Pharmaceuticals International, Inc. (Case No. 16-cv-5034); Equity Trustees Limited as Responsible Entity for T. Rowe Price Global Equity Fund v. Valeant Pharmaceuticals International Inc. (Case No. 16-cv-6127); Principal Funds, Inc. v. Valeant Pharmaceuticals International, Inc. (Case No. 16-cv-6128); BloombergSen Partners Fund LP v. Valeant Pharmaceuticals International, Inc. (Case No. 16-cv-7212); Discovery Global Citizens Master Fund, Ltd. v. Valeant Pharmaceuticals International, Inc. (Case No. 16-cv-7321); MSD Torchlight Partners, L.P. v. Valeant Pharmaceuticals International, Inc. (Case No. 16-cv-7324); BlueMountain Foinaven Master Fund, L.P. v. Valeant Pharmaceuticals International, Inc. (Case No. 16-cv-7328); Incline Global Master LP v. Valeant Pharmaceuticals International, Inc. (Case No. 16-cv-7494); VALIC Company I v. Valeant Pharmaceuticals International, Inc. (Case No. 16-cv-7496); Janus Aspen Series v. Valeant Pharmaceuticals International, Inc. (Case No. 16-cv-7497) (“Janus Aspen”); Okumus Opportunistic Value Fund, LTD v. Valeant Pharmaceuticals International, Inc. (Case No. 17-cv-6513) (“Okumus”); Lord Abbett Investment Trust- Lord Abbett Short Duration Income Fund, v. Valeant Pharmaceuticals International, Inc. (Case No. 17-cv-6365) (“Lord Abbett”); Pentwater Equity Opportunities Master Fund LTD v. Valeant Pharmaceuticals International, Inc., et al. (Case No. 17-cv-7552) ("Pentwater"); Public Employees’ Retirement System of Mississippi v. Valeant Pharmaceuticals International Inc. (Case No. 17-cv-7625) (“Mississippi”);
The Boeing Company Employee Retirement Plans Master Trust v. Valeant Pharmaceuticals International Inc., et al., (Case No. 17-cv-7636) (“Boeing”); State Board of Administration of Florida v. Valeant Pharmaceuticals International Inc. (Case No. 17-cv-12808); The Regents of the University of California v. Valeant Pharmaceuticals International, Inc. (Case No. 17-cv-13488); GMO Trust v. Valeant Pharmaceuticals International, Inc. (Case No. 18-cv-0089); Första AP Fonden v. Valeant Pharmaceuticals International, Inc. (Case No. 17-cv-12088); New York City Employees’ Retirement System v. Valeant Pharmaceuticals International, Inc. (Case No. 18-cv-0032) (“NYCERS”); Hound Partners Offshore Fund, LP v. Valeant Pharmaceuticals International, Inc. (Case No. 3:18-cv-08705) (“Hound Partners”); Blackrock Global Allocation Fund, Inc. v. Valeant Pharmaceuticals International, Inc. (Case No. 18-cv-0343) (“Blackrock”); Colonial First State Investments Limited As Responsible Entity for Commonwealth Global Shares Fund 1 v. Valeant Pharmaceuticals International, Inc. (Case No. 18-cv-0383); Bharat Ahuja v. Valeant Pharmaceuticals International, Inc. (Case No. 18-cv-0846); Brahman Capital Corp. v. Valeant Pharmaceuticals International, Inc (Case No. 18-cv-0893); The Prudential Insurance Company of America v. Valeant Pharmaceuticals International, Inc. (Case No. 3:18-cv-01223) (“Prudential”); Senzar Healthcare Master Fund LP v. Valeant Pharmaceuticals International, Inc. (Case No. 18-cv-02286) ("Senzar"); 2012 Dynasty UC LLC v. Valeant Pharmaceuticals International, Inc. (Case No. 18-cv-08595) ("2012
F-60
Dynasty"); Catalyst Dynamic Alpha Fund v. Valeant Pharmaceuticals International, Inc. (Case No. 18-cv-12673) (“Catalyst”); Northwestern Mutual Life Insurance Co., v. Valeant Pharmaceuticals International, Inc. (Case No. 18-cv-15286) (“Northwestern Mutual”); and Bahaa Aly, et al. v. Valeant Pharmaceuticals International, Inc., (Case No. 18-cv-17393) (“Aly”).
These individual shareholder actions assert claims under Sections 10(b), 18, and 20(a) of the Exchange Act, Sections 11, 12(a)(2), and 15 of the Securities Act, common law fraud, and negligent misrepresentation under state law, based on alleged purchases of Company stock, options, and/or debt at various times between January 3, 2013 and August 10, 2016. Plaintiffs in the Lord Abbett, Boeing, Mississippi, NYCERS, Hound Partners, Blackrock, Catalyst, 2012 Dynasty cases and Northwestern Mutual additionally assert claims under the New Jersey Racketeer Influenced and Corrupt Organizations Act. The allegations in the complaints are similar to those made by plaintiffs in the putative class action. Motions to dismiss have been filed in many of these individual actions. To date, the Court has dismissed state law claims including New Jersey Racketeer Influenced and Corrupt Organizations Act, common law fraud, and negligent misrepresentation claims in certain cases.
The Company believes the individual complaints and the consolidated putative class action are without merit and intends to defend itself vigorously.
Canadian Securities Litigation
In 2015,
six
putative class actions were filed and served against the Company and certain current or former officers and directors in Canada in the provinces of British Columbia, Ontario and Quebec. These actions are captioned: (a) Alladina v. Valeant, et al. (Case No. S-1594B6) (Supreme Court of British Columbia) (filed November 17, 2015); (b) Kowalyshyn v. Valeant, et al. (CV-15-540593-00CP) (Ontario Superior Court) (filed November 16, 2015); (c) Kowalyshyn et al. v. Valeant, et al. (CV-15-541082-00CP) (Ontario Superior Court) (filed November 23, 2015); (d) O’Brien v. Valeant et al. (CV-15-543678-00CP) (Ontario Superior Court) (filed December 30, 2015); (e) Catucci v. Valeant, et al. (Court File No. 540-17-011743159) (Quebec Superior Court) (filed October 26, 2015); and (f) Rousseau-Godbout v. Valeant, et al. (Court File No. 500-06-000770-152) (Quebec Superior Court) (filed October 27, 2015).
The actions generally allege violations of Canadian provincial securities legislation on behalf of putative classes of persons who purchased or otherwise acquired securities of the Company for periods commencing as early as January 1, 2013 and ending as late as November 16, 2015. The alleged violations relate to the same matters described in the US Securities Litigation description above.
The Rosseau-Godbout action was stayed by the Quebec Superior Court by consent order. The Kowalyshyn action has been consolidated with the O’Brien action and that the consolidated action is stayed in favor of the Catucci action. In the Catucci action, on August 29, 2017, the judge granted the plaintiffs leave to proceed with their claims under the Quebec Securities Act and authorized the class proceeding. On October 26, 2017, the plaintiffs issued their Judicial Application Originating Class Proceedings. A timetable for certain pre-trial procedural matters in the action has been set and the notice of certification has been disseminated to class members. Among other things, the timetable established a deadline of June 19, 2018 for class members to exercise their right to opt-out of the class.
The Company is aware of
two
additional putative class actions that have been filed with the applicable court but which have not yet been served on the Company. These actions are captioned: (i) Okeley v. Valeant, et al. (Case No. S-159991) (Supreme Court of British Columbia) (filed December 2, 2015); and (ii) Sukenaga v Valeant et al. (CV-15-540567-00CP) (Ontario Superior Court) (filed November 16, 2015), and the factual allegations made in these actions are substantially similar to those outlined above. The Company has been advised that the plaintiffs in these actions do not intend to pursue the actions.
In addition to the class proceedings described above, on April 12, 2018, the Company was served with an application for leave filed in the Quebec Superior Court of Justice to pursue an action under the Quebec Securities Act against the Company and certain current or former officers and directors. This proceeding is captioned BlackRock Asset Management Canada Limited et al. v. Valeant, et al. (Court File No. 500-11-054155-185). The allegations in the proceeding are similar to those made by plaintiffs in the Catucci class action. That application has been scheduled to be heard on May 14, 2019. On June 18, 2018, the same BlackRock entities filed an originating application (Court File No. 500-17-103749-183) against the same defendants asserting claims under the Quebec Civil Code in respect of the same alleged misrepresentations.
The Company is aware that certain other members of the Catucci class exercised their opt-out rights prior to the June 19, 2018 deadline. On February 15, 2019,
one
of the entities who exercised their opt-out rights served the Company with an application in the Quebec Superior Court of Justice for leave to pursue an action under the Quebec Securities Act against the Company, certain current or former officers and directors of the Company and its auditor. That proceeding is captioned California State
F-61
Teachers’ Retirement System v. Bausch Health Companies Inc. et al. (Court File No. 500-11-055722-181). The allegations in the proceeding are similar to those made by the plaintiffs in the Catucci class action and in the BlackRock opt out proceedings. On that same date, California State Teachers’ Retirement System also served the Company with proceedings (Court File No. 500-17-106044-186) against the same defendants asserting claims under the Quebec Civil Code in respect of the same alleged misrepresentations.
The Company believes that it has viable defenses in each of these actions. In each case, the Company intends to defend itself vigorously.
Insurance Coverage Lawsuit
On December 7, 2017, the Company filed a lawsuit against its insurance companies that issued insurance policies covering claims made against the Company, its subsidiaries, and its directors and officers during
two
distinct policy periods, (i) 2013-14 and (ii) 2015-16. The lawsuit is currently pending in the United States District Court for the District of New Jersey (Valeant Pharmaceuticals International, Inc., et al. v. AIG Insurance Company of Canada, et al.; 3:18-CV-00493). In the lawsuit, the Company seeks coverage for (1) the costs of defending and resolving claims brought by former shareholders and debtholders of Allergan, Inc. in In re Allergan, Inc. Proxy Violation Securities Litigation and Timber Hill LLC, individually and on behalf of all others similarly situated v. Pershing Square Capital Management, L.P., et al. (under the 2013-2014 coverage period), and (2) costs incurred and to be incurred in connection with the securities class actions and opt-out cases described in this section and certain of the investigations described above (under the 2015-2016 coverage period).
RICO Class Actions
Between May 27, 2016 and September 16, 2016,
three
virtually identical actions were filed in the U.S. District Court for the District of New Jersey against the Company and various third-parties, alleging claims under the federal Racketeer Influenced Corrupt Organizations Act (“RICO”) on behalf of a putative class of certain third-party payors that paid claims submitted by Philidor for certain Company branded drugs between January 2, 2013 and November 9, 2015. On November 30, 2016, the Court entered an order consolidating the
three
actions under the caption
In re Valeant Pharmaceuticals International, Inc. Third-Party Payor Litigation
, No. 3:16-cv-03087. A consolidated class action complaint was filed on December 14, 2016. The consolidated complaint alleges, among other things, that the Defendants committed predicate acts of mail and wire fraud by submitting or causing to be submitted prescription reimbursement requests that misstated or omitted facts regarding (1) the identity and licensing status of the dispensing pharmacy; (2) the resubmission of previously denied claims; (3) patient co-pay waivers; (4) the availability of generic alternatives; and (5) the insured’s consent to renew the prescription. The complaint further alleges that these acts constitute a pattern of racketeering or a racketeering conspiracy in violation of the RICO statute and caused plaintiffs and the putative class unspecified damages, which may be trebled under the RICO statute. The Company moved to dismiss the consolidated complaint on February 13, 2017. On March 14, 2017, other defendants filed a motion to stay the RICO class action pending the resolution of criminal proceedings against Andrew Davenport and Gary Tanner. On August 9, 2017, the Court granted the motion to stay and entered an order staying all proceedings in the case and accordingly terminating other pending motions.
The Company believes these claims are without merit and intends to defend itself vigorously.
Hound Partners Lawsuit
On October 19, 2018, Hound Partners Offshore Fund, LP, Hound Partners Long Master, LP, and Hound Partners Concentrated Master, LP, filed a lawsuit against the Company in the Superior Court of New Jersey Law Division/Mercer County. This action is captioned Hound Partners Offshore Fund, LP et al., v. Valeant Pharmaceuticals International, Inc., et al. (No. MER-L-002185-18). This suit asserts claims for common law fraud, negligent misrepresentation, and violations of the New Jersey Racketeer Influenced and Corrupt Organizations Act. The factual allegations made in this complaint are similar to those made in the District of New Jersey Hound Partners action. The Company disputes the claims and intends to vigorously defend this matter.
Antitrust
Contact Lens Antitrust Class Actions
Beginning in March 2015, a number of civil antitrust class action suits were filed by purchasers of contact lenses against B&L Inc.,
three
other contact lens manufacturers, and a contact lens distributor, alleging that the defendants engaged in an anticompetitive scheme to eliminate price competition on certain contact lens lines through the use of unilateral pricing policies.
F-62
The plaintiffs in such suits alleged violations of Section 1 of the Sherman Act, 15 U.S.C. § 1, and of various state antitrust and consumer protection laws, and further alleged that the defendants have been unjustly enriched through their alleged conduct. The plaintiffs sought declaratory and injunctive relief and, where applicable, treble, punitive and/or other damages, including attorneys’ fees. By order dated June 8, 2015, the Judicial Panel for Multidistrict Litigation ("JPML") centralized the suits in the Middle District of Florida, under the caption In re Disposable Contact Lens Antitrust Litigation, Case No. 3:15-md-02626-HES-JRK, before U.S. District Judge Harvey E. Schlesinger. After the class plaintiffs filed a corrected consolidated class action complaint on December 16, 2015, the defendants jointly moved to dismiss those complaints. On June 16, 2016, the Court granted the defendants' motion to dismiss with respect to claims brought under the Maryland Consumer Protection Act, but denied the motion to dismiss with respect to claims brought under Sherman Act, Section 1 and other state laws. On December 4, 2018, the Court certified
six
classes,
four
of which relate to B&L Inc. On December 18, 2018, the defendants filed petitions seeking leave from the Eleventh Circuit Court of Appeals to file an immediate appeal of the class certification order (the “Petitions”). On August 20, 2018, B&L Inc. individually and jointly with defendants filed motions for summary judgment. The Court indicated that resolution of the motions for summary judgment may require the trial (currently set for May 2019) to be rescheduled for a later date. On January 29, 2019, the Court ordered the parties to file briefs addressing whether the litigation should be stayed pending a ruling on the Petitions. On February 12, 2019, defendants requested that the Court enter a stay until resolution of the Petitions, including the ensuing appeal should the Petitions be granted. Plaintiffs oppose a stay of the litigation, but both parties requested the Court reschedule the May 2019 trial date. The Company intends to vigorously defend this matter.
Generic Pricing Antitrust Class Action
On June 22, 2018, the Company's subsidiaries, Oceanside Pharmaceuticals, Inc. (“Oceanside”), Bausch Health US, LLC (formerly Valeant Pharmaceuticals North America LLC) (“Bausch Health US”), and Bausch Health Americas, Inc. (formerly Valeant Pharmaceuticals International) (“Bausch Health Americas”), were added as defendants in putative class action multidistrict antitrust litigation entitled
In re: Generic Pharmaceuticals Pricing Antitrust Litigation
, pending in the United States District Court for the Eastern District of Pennsylvania (MDL 2724, 16-MD-2724). The complaint was filed by direct purchaser plaintiffs on behalf of themselves and others similarly situated. The plaintiffs seek damages under federal antitrust laws. Separate complaints by other plaintiffs which had been consolidated in the same multidistrict litigation did not name the Company or any of its subsidiaries as a defendant. The direct purchaser plaintiffs assert that the Company’s subsidiaries purportedly entered into a conspiracy to fix, stabilize, and raise prices, rig bids and engage in market and customer allocation for generic pharmaceuticals. Specific claims against the Company’s subsidiaries relate to generic pricing of the Company’s metronidazole vaginal product as part of an alleged overarching conspiracy among generic drug manufacturers. Prior to the Company’s subsidiaries being added to the case, some of the defendants moved to dismiss certain of the consolidated amended complaints. On October 16, 2018, the Court granted in part and denied in part these defendants’ motions to dismiss. On December 21, 2018, the direct purchaser plaintiffs filed an amended complaint alleging similar claims against the Company’s subsidiaries as the earlier-filed putative class action complaint. On December 20, 2018,
three
direct purchaser plaintiffs that had opted out of the putative class filed an amended complaint in the MDL that added Oceanside, Bausch Health US and Bausch Health Americas, alleging similar claims as the direct purchaser plaintiffs’ putative class action complaint. The current deadline for filing motions to dismiss is February 21, 2019. Discovery against the Company’s subsidiaries has commenced. The Company intends to vigorously defend this matter.
F-63
Intellectual Property
Patent Litigation/Paragraph IV Matters
From time to time, the Company (and/or certain of its affiliates) is also party to certain patent infringement proceedings in the United States and Canada, including as arising from claims filed by the Company (or that the Company anticipates filing within the required time periods) in connection with Notices of Paragraph IV Certification (in the United States) and Notices of Allegation (in Canada) received from third-party generic manufacturers respecting their pending applications for generic versions of certain products sold by or on behalf of the Company, including Relistor
®
, Apriso
®
, Uceris
®
and Jublia
®
in the United States and Glumetza
®
in Canada, or other similar suits. These matters are proceeding in the ordinary course. In addition, patents covering the Company's branded pharmaceutical products may be challenged in proceedings other than court proceedings, including inter partes review ("IPR") at the US Patent & Trademark Office. The proceedings operate under different standards from district court proceedings, and are often completed within 18 months of institution. IPR challenges have been brought against patents covering the Company's branded pharmaceutical products. For example, following Acrux DDS’s IPR petition, the US Patent and Trial Appeal Board, in May 2017, instituted inter partes review for an Orange Book-listed patent covering Jublia
®
and, on June 6, 2018, issued a written determination invalidating such patent. An appeal of this decision was filed on August 7, 2018. Jublia
®
continues to be covered by seven other Orange Book-listed patents owned by the Company, which expire in the years 2028 through 2034.
Product Liability
Shower to Shower Products Liability Litigation
The Company has been named in
one hundred sixty-five
lawsuits involving the Shower to Shower body powder product acquired in September 2012 from Johnson & Johnson.
These lawsuits include
one
case originally filed in the
In re Johnson & Johnson Talcum Powder Litigation
, Multidistrict Litigation 2738, pending in the United States District Court for the District of New Jersey. The Company and Bausch Health US were first named in a lawsuit filed directly into the MDL alleging that the use of the Shower to Shower product caused the plaintiff to develop ovarian cancer. The plaintiff agreed to a dismissal of all claims against the Company and Bausch Health US without prejudice. The Company has been named in
one
additional lawsuit, originally filed in the District of Puerto Rico and subsequently transferred into the MDL, but has not been served in that case. The Company was also named in
two
additional lawsuits filed directly into the MDL that have also not yet been served.
These lawsuits also include a number of matters filed in the Superior Court of Delaware and
five
cases filed in the Superior Court of New Jersey alleging that the use of Shower to Shower caused the plaintiffs to develop ovarian cancer. The Company has been voluntarily dismissed from nearly all of these cases, with claims against Bausch Health US only remaining in most of these cases.
Four
of the
five
cases in the Superior Court of New Jersey were voluntarily dismissed as to Bausch Health US as well. The allegations in these cases specifically directed to Bausch Health US include failure to warn, design defect, negligence, gross negligence, breach of express and implied warranties, civil conspiracy concert in action, negligent misrepresentation, wrongful death, and punitive damages.
One hundred forty-nine
of the Delaware actions were voluntarily dismissed without prejudice in January 2019, but, pursuant to a stipulation among the parties, will be refiled in either the MDL or in coordinated proceedings in Atlantic County, New Jersey Superior Court, depending on the state of residence of each plaintiff. As of the date of this Form 10-K, these re-filings have not yet occurred.
In addition, these lawsuits also include a number of cases filed in certain state courts in the United States (including the Superior Courts of California, Delaware and New Jersey); the District Court of Louisiana; the Supreme Court of New York (Niagara County); the District Court of Oklahoma City, Oklahoma; the South Carolina Court of Common Pleas (Richland County); and the District Court of Nueces County, Texas (transferred to the asbestos MDL docket in the District Court of Harris County, Texas for pre-trial purposes) alleging use of Shower to Shower and other products resulted in the plaintiffs developing mesothelioma. The Company has been successful in obtaining voluntarily dismissals in most of these cases or the plaintiffs have not opposed summary judgment. The allegations in these cases generally include design defect, manufacturing defect, failure to warn, negligence, and punitive damages, and in some cases breach of express and implied warranties, misrepresentation, and loss of consortium. The damages sought by the various Plaintiffs include compensatory damages, including medical expenses, lost wages or earning capacity, and loss of consortium. In addition, Plaintiffs seek compensation for pain and suffering, mental anguish anxiety and discomfort, physical impairment and loss of enjoyment of life. Plaintiffs also seek pre- and post-judgment interest, exemplary and punitive damages, and attorneys’ fees.
F-64
On February 11, 2019,
seven
plaintiffs filed a pre-suit notice letter with the California Attorney General notifying the Attorney General’s office of their intent to file suit after 60 days against the Company and certain of its subsidiaries, alleging they committed violations of the California Safe Drinking Water and Toxic Enforcement Act of 1986 (Proposition 65) by manufacturing and distributing Shower to Shower that they allege contained chemical compounds known to cause cancer. By statute, a private lawsuit may not be filed until at least 60 days have passed following service of this pre-suit notice letter.
Finally,
two
proposed class actions have been filed in Canada against the Company and various Johnson & Johnson entities (
one
in the Supreme Court of British Columbia and
one
in the Superior Court of Quebec). The Company also acquired the rights to the Shower to Shower product in Canada from Johnson & Johnson in September 2012. In the British Columbia matter, the plaintiff seeks to certify a proposed class action on behalf of persons in British Columbia and Canada who have purchased or used Johnson & Johnson’s Baby Powder or Shower to Shower, including their estates, executors and personal representatives, and is alleging that the use of this product increases certain health risks. In the Quebec matter, the plaintiff sought to certify a proposed class action on behalf of persons in Quebec who have used Johnson & Johnson’s Baby Powder or Shower to Shower, as well as their family members, assigns and heirs, and is alleging negligence in failing to properly test, failing to warn of health risks, and failing to remove the products from the market in a timely manner. A certification (also known as authorization) hearing in the Quebec matter and the Court certified (or as stated under Quebec law, authorized) the bringing of a class action by a representative plaintiff on behalf of people in Quebec who have used Johnson & Johnson's Baby Powder and/or Shower to Shower in their perineal area and have been diagnosed with ovarian cancer and/or family members, assigns and heirs. The plaintiffs in these actions are seeking awards of general, special, compensatory and punitive damages.
The Company intends to defend itself vigorously in each of the remaining actions that are not voluntarily dismissed or subject to a grant of summary judgment. The Company believes that its potential liability (including its attorneys’ fees and costs) arising out the Shower to Shower lawsuits filed against the Company is subject to certain indemnification obligations of Johnson & Johnson owed to the Company, and legal fees and costs have been and are currently being reimbursed by Johnson & Johnson. The Company has provided Johnson & Johnson with notice that the lawsuits filed against the Company relating to Shower to Shower are subject to indemnification by Johnson & Johnson. While Johnson & Johnson continues to indemnify the Company, the Company has initiated proceedings in arbitration against Johnson & Johnson relating to the scope and amount of such indemnification.
General Civil Actions
Mississippi Attorney General Consumer Protection Action
The Company and Bausch Health US are named in an action brought by James Hood, Attorney General of Mississippi, in the Chancery Court of the First Judicial District of Hinds County, Mississippi (Hood ex rel. State of Mississippi, Civil Action No. G2014-1207013, filed on August 22, 2014), alleging consumer protection claims against Johnson & Johnson and Johnson Consumer Companies, Inc., the Company and Bausch Health US related to the Shower to Shower body powder product and its alleged causal link to ovarian cancer. As indicated above, the Company acquired the Shower to Shower body powder product in September 2012 from Johnson & Johnson. The State seeks compensatory damages, punitive damages, injunctive relief requiring warnings for talc-containing products, removal from the market of products that fail to warn, and to prevent the continued violation of the Mississippi Consumer Protection Act (“MCPA”). The State also seeks disgorgement of profits from the sale of the product and civil penalties. In October 2017, plaintiffs dismissed certain claims under the MCPA related to advertising/marketing that did not appear on the label and/or packaging of Shower to Shower. The State has not made specific allegations as to the Company or Bausch Health US. The Company intends to defend itself vigorously in this action. The Company believes that its potential liability (including its attorneys’ fees and costs) arising out this Shower to Shower matter filed against the Company is subject to certain indemnification obligations of Johnson & Johnson owed to the Company, and legal fees and costs have been and are currently being reimbursed by Johnson & Johnson.
Doctors Allergy Formula Lawsuit
In April 2018, Doctors Allergy Formula, LLC (“Doctors Allergy”), filed a lawsuit against Bausch Health Americas in the Supreme Court of the State of New York, County of New York, Index No. 651597/2018. Doctors Allergy asserts breach of contract and related claims under a 2015 Asset Purchase Agreement, which purports to include milestone payments that Doctors Allergy alleges should have been paid by Bausch Health Americas. Doctors Allergy claims its damages are not less than
$23 million
. On June 14, 2018, Bausch Health Americas filed a motion to dismiss the complaint in part and a motion to strike. Oral argument on this motion was held on November 13, 2018. Discovery is proceeding. Bausch Health Americas disputes the claims and intends to vigorously defend this matter.
F-65
Litigation with Former Salix CEO
On January 28, 2019, former Salix Ltd. CEO and director Carolyn Logan filed a lawsuit in the Delaware Court of Chancery, Case No. 2019-0059, asserting claims for breach of contract and declaratory relief. The lawsuit arises out of the contractual termination of approximately
$30 million
in unvested equity awards following the determination by the Salix Ltd. Board of Directors that Logan intentionally engaged in wrongdoing that resulted, or would reasonably be expected to result, in material harm to Salix Ltd., or to the business or reputation of Salix Ltd. Logan seeks the restoration of the unvested equity awards and a declaration regarding certain rights related to indemnification. The Company disputes the claims and intends to vigorously defend the matter.
Completed or Inactive Matters
The following matters have concluded, have settled, are the subject of an agreement to settle or have otherwise been closed since January 1, 2018, have been inactive from the Company’s perspective for several quarters or the Company anticipates that no further material activity will take place with respect thereto. Due to the closure, settlement, inactivity or change in status of the matters referenced below, these matters will no longer appear in the Company's next public reports and disclosures, unless required. With respect to inactive matters, to the extent material activity takes place in subsequent quarters with respect thereto, the Company will provide updates as required or as deemed appropriate.
Allergan Shareholder Class Actions
On December 16, 2014, Anthony Basile, an alleged shareholder of Allergan filed a lawsuit on behalf of a putative class of Allergan shareholders against the Company, Bausch Health Americas (then Valeant Pharmaceuticals International (“VPI”)), AGMS, Pershing Square, PS Management, GP, LLC, PS Fund 1 and William A. Ackman in the U.S. District Court for the Central District of California (Basile v. Valeant Pharmaceuticals International, Inc., et al., Case No. 14-cv-02004-DOC). On June 26, 2015, lead plaintiffs the State Teachers Retirement System of Ohio, the Iowa Public Employees Retirement System and Patrick T. Johnson filed an amended complaint against the Company, Bausch Health Americas (then VPI), J. Michael Pearson, Pershing Square, PS Management, GP, LLC, PS Fund 1 and William A. Ackman. The amended complaint alleged claims on behalf of a putative class of sellers of Allergan securities between February 25, 2014 and April 21, 2014, against all defendants contending that various purchases of Allergan securities by PS Fund were made while in possession of material, non-public information concerning a potential tender offer by the Company for Allergan stock, and asserting violations of Section 14(e) of the Exchange Act and rules promulgated by the SEC thereunder and Section 20A of the Exchange Act. The amended complaint also alleged violations of Section 20(a) of the Exchange Act against Pershing Square, various Pershing Square affiliates, William A. Ackman and J. Michael Pearson. The amended complaint sought, among other relief, money damages, equitable relief, and attorneys’ fees and costs. On March 15, 2017, the Court entered an order certifying a plaintiff class comprised of persons who sold Allergan common stock contemporaneously with purchases of Allergan common stock made or caused by defendants during the period February 25, 2014 through April 21, 2014.
On June 28, 2017, Timber Hill LLC, a Connecticut limited liability company that allegedly traded in Allergan derivative instruments, filed a lawsuit on behalf of a putative class of derivative traders against the Company, Bausch Health Americas (then VPI), AGMS, Michael Pearson, Pershing Square, PS Management, GP, LLC, PS Fund 1 and William A. Ackman in the U.S. District Court for the Central District of California (Timber Hill LLC v. Pershing Square Capital Management, L.P., et al., Case No. 17-cv-04776-DOC). The complaint alleged claims on behalf of a putative class of investors who sold Allergan call options, purchased Allergan put options and/or sold Allergan equity forward contracts between February 25, 2014 and April 21, 2014, against all defendants contending that various purchases of Allergan securities by PS Fund 1 were made while in possession of material, non-public information concerning a potential tender offer by the Company for Allergan stock, and asserting violations of Section 14(e) of the Exchange Act and rules promulgated by the SEC thereunder and Section 20A of the Exchange Act. The complaint also alleged violations of Section 20(a) of the Exchange Act against Pershing Square, various Pershing Square affiliates, William A. Ackman and Michael Pearson. The complaint sought, among other relief, money damages, equitable relief, and attorneys’ fees and costs. On July 25, 2017, the Court decided not to consolidate this lawsuit with the Basile action described above.
On December 28, 2017, all parties agreed to settle the ongoing, related Allergan shareholder class actions for a total of
$290 million
. As part of that proposed settlement, the Company parties paid
$96 million
, being
33%
of the settlement amount (which amount was paid in January 2018), while the Pershing Square parties are to pay
$195 million
, being
67%
of the settlement amount. The Court preliminarily approved the settlement on March 19, 2018. Following a hearing held on June 12, 2018, the Court granted final approval of the settlement.
F-66
Solodyn
®
Antitrust Class Actions
Beginning in July 2013, a number of civil antitrust class action suits were filed against Medicis Pharmaceutical Corporation (“Medicis”) a subsidiary of the Company, Valeant Pharmaceuticals International, Inc. (“VPII”) (now named Bausch Health Companies Inc.) and various manufacturers of generic forms of Solodyn
®
, alleging that the defendants engaged in an anticompetitive scheme to exclude competition from the market for minocycline hydrochloride extended release tablets, a prescription drug for the treatment of acne marketed by Medicis under the brand name, Solodyn
®
. The plaintiffs in such suits alleged violations of Sections 1 and 2 of the Sherman Act, 15 U.S.C. §§ 1, 2, and of various state antitrust and consumer protection laws, and further alleged that the defendants have been unjustly enriched through their alleged conduct. The plaintiffs sought declaratory and injunctive relief and, where applicable, treble, multiple, punitive and/or other damages, including attorneys’ fees. By order dated February 25, 2014, the JPML centralized the suits in the District of Massachusetts, under the caption In re Solodyn (Minocycline Hydrochloride) Antitrust Litigation, Case No. 1:14-md-02503-DJC, before U.S. District Judge Denise Casper. After the Direct Purchaser Class Plaintiffs and the End-Payor Class Plaintiffs each filed a consolidated amended class action complaint on September 12, 2014, the defendants jointly moved to dismiss those complaints. On August 14, 2015, the Court granted the Defendants' motion to dismiss with respect to claims brought under Sherman Act, Section 2 and various state laws but denied the motion to dismiss with respect to claims brought under Sherman Act, Section 1 and other state laws. VPII was dismissed from the case, but the litigation continued against Medicis and the generic manufacturers as to the remaining claims.
On March 26, 2015, and on April 6, 2015, while the motion to dismiss the class action complaints was pending,
two
additional non-class action complaints were filed against Medicis by certain retail pharmacy and grocery chains ("Individual Plaintiffs") making similar allegations and seeking similar relief to that sought by Direct Purchaser Class Plaintiffs. Those suits have been centralized with the class action suits in the District of Massachusetts. Following the Court's August 14, 2015 decision on the motion to dismiss, the Individual Plaintiffs each filed amended complaints on October 1, 2015, and Medicis answered on December 7, 2015. A third non-class action was filed by another retail pharmacy against Medicis on January 26, 2016, and Medicis answered on March 28, 2016.
Plaintiffs reached settlements with
two
of
three
generic manufacturer defendants prior to the close of discovery. On April 14, 2017, the Court granted the Direct Purchaser Plaintiffs' and End-Payor Plaintiffs' motions for preliminary approval of those settlements. The Court granted final approval on November 27, 2017. For the remaining parties, following the close of fact discovery and expert discovery, the Court granted Direct Purchaser Plaintiffs' and End-Payor Plaintiffs' motions for class certification for the purposes of damages, but denied End-Payor Plaintiffs' motion for class certification for the purposes of injunctive and declaratory relief. The remaining defendants petitioned to appeal the certification of the End-Payor Class and this petition was denied. Plaintiffs and the remaining defendants each filed motions for summary judgment. The Court heard oral argument on the parties’ summary judgment motions on January 12, 2018. On January 25, 2018, the Court issued a Memorandum and Order denying the parties’ motions, except for partially allowing defendants’ motion on market power. In February 2018, Medicis agreed to resolve the class action litigation with the End-Payor and Direct Purchaser classes for an amount of
$58 million
and has resolved related litigation with opt-out retailers for additional consideration. On July 18, 2018, the district court granted final approval of these settlements with the End-Payor and Direct Purchaser classes.
GAF Realty Lawsuit
In January 2018, GAF Realty Advisors, Inc. filed a lawsuit against the Company (
GAF Realty Advisors, Inc. v. Valeant Pharmaceuticals International, Inc.
, Case No. 30-2018-00967586-CU-BC-CJC) in the Superior Court of the State of California (Orange County), which alleged breach of contract and related claims with respect to a dispute over real estate commissions. In March 2018, the Company settled this matter, which included the payment of a
de minimus
amount by the Company.
Uceris
®
Arbitration
On or about December 5, 2016, Cosmo Technologies Ltd. and Cosmo Technologies III Ltd. (collectively, “Cosmo”), the licensor of certain intellectual property rights in, and supplier of, the Company’s Uceris
®
extended release tablets, commenced arbitration against certain affiliates of the Company, Santarus Inc. (“Santarus”) and Valeant Pharmaceuticals Ireland (now named Bausch Health Ireland Limited) (“Bausch Ireland”), under the Rules of Arbitration of the International Chamber of Commerce (No. 22453/GR,
Cosmo Technologies Ltd. et al. v. Santarus, Inc. et al.
). In the arbitration, Cosmo alleged breach of contract with respect to certain terms of the license agreement, including the obligations on Santarus to use certain commercially reasonable efforts to promote the Uceris
®
extended release tablets. Cosmo sought a declaration that both the license agreement and a supply agreement with Bausch Ireland had been terminated, plus audit and attorney fees. A hearing on liability issues was conducted from October 5, 2017 to October 8, 2017. On April 12, 2018, the Arbitral Tribunal issued a
F-67
ruling rejecting Cosmo's claims; accordingly, both the license agreement and supply agreement remain in effect. Additionally, the Arbitral Tribunal ordered Cosmo to pay the entirety of the Company's legal costs of approximately
$3 million
, which Cosmo has paid. The parties subsequently informed the Tribunal and the International Chamber of Commerce (“ICC”) that the remaining issues in the arbitration have been resolved, and, accordingly, the case has been dismissed.
Investigation by the California Department of Insurance
On or about September 16, 2016, the Company received an investigative subpoena from the California Department of Insurance. The materials requested include documents concerning the Company’s former relationship with Philidor and certain California-based pharmacies, the marketing and distribution of its products in California, the billing of insurers for its products being used by California residents, and other matters. On May 1, 2018, the Company and the California Department of Insurance signed an agreement to resolve this investigation, with the Company making a payment to the California Department of Insurance in the amount of approximately
$2 million
, with no admission of facts or liability by the Company.
Mimetogen Litigation
In November 2014, B&L Inc. filed a lawsuit against Mimetogen Pharmaceuticals Inc. (“MPI”) in the United States District Court for the Western District of New York (
Bausch & Lomb Incorporated v. Mimetogen Pharmaceuticals Inc.
, Case No. 6:14-06640 (FPG-JWF) (W.D.N.Y.)) relating to the Development Collaboration and Exclusive Option Agreement between B&L Inc. and MPI dated July 17, 2013 (the “MIM-D3 Agreement”) for MIM-D3, a compound created by MPI to treat dry eye syndrome. In particular, B&L Inc. sought a declaratory judgment that the Initial Phase III Trial regarding the safety and efficacy of MIM-D3 conducted pursuant to the MIM-D3 Agreement was “Not Successful” as defined in the MIM-D3 Agreement and, as a result, B&L Inc. had no further obligation to MPI when B&L Inc. elected not to exercise or extend its option to obtain an exclusive license to the MIM-D3 technology to develop and commercialize certain products pursuant to the MIM-D3 Agreement before the end of the applicable option period. MPI filed a counterclaim against B&L Inc., in which it contended that the result of the clinical trial did not meet the definition of “Not Successful” under the MIM-D3 Agreement and that, as a result, a
$20 million
termination fee was due by B&L Inc. to MPI under the terms of the MIM-D3 Agreement and that B&L Inc. had breached the MIM-D3 Agreement by failing to pay this termination fee. MPI also contended that B&L Inc. acted intentionally and consequently was entitled to additional damages. MPI also brought certain third-party claims against the Company, alleging that the Company intentionally interfered with the MIM-D3 Agreement with the intent to harm MPI. MPI also asserted a claim against the Company for unfair and deceptive acts under Massachusetts law, and sought recovery of the
$20 million
fee, as well as additional damages related to this claimed delay and injury to the value of its developmental product. In May 2016, the Court dismissed all claims against the Company, other than the claim for tortious interference, and declined to dismiss the claims against B&L Inc. and the Company for extra-contractual damages. On June 30, 2017, the Court issued a Decision and Order granting MPI’s motion for partial summary judgment, awarding MPI the amount of
$20 million
(based on a finding that the termination fee was due based on the outcome of the clinical trial) and denying the cross-motion for summary judgment filed by B&L Inc. and the Company. On March 1, 2018, final judgment was entered against B&L Inc. in the amount of
$26 million
. On March 30, 2018, B&L Inc. filed its appeal of the final judgment and all prior decisions in the case, including the Court’s June 30, 2017 Decision and Order granting MPI partial summary judgment. While the appeal was pending, the parties entered into a confidential settlement agreement and dismissed the appeal, concluding the case.
F-68
Settlement of Xifaxan
®
Patent Litigation
On or about February 16, 2016, the Company received a Notice of Paragraph IV Certification dated February 11, 2016, from Actavis Laboratories FL, Inc. (“Actavis”), in which Actavis asserted that the U.S. patents listed in the U.S. Food and Drug Administration's (the "FDA") Orange Book for Salix Inc. Xifaxan
®
tablets, 550 mg (the “Xifaxan
®
Patents”), were either invalid, unenforceable and/or would not be infringed by the commercial manufacture, use or sale of Actavis’ generic rifaximin tablets, 550 mg, for which an Abbreviated New Drug Application (“ANDA”) has been filed by Actavis. On March 23, 2016, Salix Inc. and its affiliates, Salix Ltd. and Valeant Pharmaceuticals Luxembourg S.à r.l., Alfa Wassermann S.p.A. (“Alfa Wassermann”) (as owner of certain of the Xifaxan
®
Patents) and Cedars-Sinai Medical Center (as owner of certain of the Xifaxan
®
Patents) (collectively, the “Plaintiffs”) filed suit against Actavis in the U.S. District Court for the District of Delaware (Case No. 1:16-cv-00188), pursuant to the Hatch-Waxman Act, alleging infringement by Actavis of
one
or more claims of each of the Xifaxan
®
Patents, thereby triggering a
30
-month stay of the approval of Actavis’ ANDA for rifaximin tablets, 550 mg. On May 24, 2016, Actavis filed its answer in this matter.
On September 12, 2018, the Company announced that it had agreed to resolve all outstanding intellectual property litigation regarding Actavis’ ANDA. Under the terms of the agreement, beginning January 1, 2028 (or earlier under certain circumstances), Actavis will have the option to: (1) market a royalty-free generic version of Xifaxan
®
tablets, 550 mg, should it receive approval from the FDA on its ANDA, or (2) market an authorized generic version of Xifaxan
®
tablets, 550 mg, with drug supply being provided by Salix Ltd. In the case an authorized generic is marketed, the volume of the authorized generic will be subject to manufacturing and supply quantities until final patent expiry, and the Company will receive a share of the economics from Actavis on its sales of such an authorized generic. The parties have agreed to dismiss all litigation related to Xifaxan
®
, and all intellectual property protecting Xifaxan
®
will remain intact and enforceable. The Company will not make any financial payments or other transfers of value as part of the agreement. Actavis acknowledges the validity of the Xifaxan
®
Patents.
Settlement of Salix Ltd. SEC Investigation
In the fourth quarter of 2014, the SEC commenced a formal investigation into alleged securities law violations by Salix Ltd. The investigation related to certain disclosures made prior to the Salix Acquisition by Salix Ltd. and its then-chief financial officer relating to the amounts of Salix Ltd. drugs held in inventory by certain wholesaler customers. The Company cooperated with the SEC's investigation. On September 28, 2018, the Company reached a settlement of the relevant charges with the SEC, which settlement remains subject to approval by the U.S. District Court for the Southern District of New York. Under the terms of the settlement, Salix Ltd. neither admitted or denied the SEC’s allegations. No monetary penalty against the Company or Salix Ltd. was assessed by the terms of the settlement. As a result, the Company recorded a favorable adjustment of
$40 million
reflecting the reversal of the contingent liability assumed in connection with the Salix Acquisition.
Settlement of Arbitration with Alfasigma S.p.A. (“Alfasigma”) (formerly Alfa Wasserman S.p.A.)
On or about July 21, 2016, Alfasigma commenced arbitration against the Company and its subsidiary, Salix Pharmaceuticals, Inc.’s (“Salix Inc.”) under the Rules of Arbitration of the International Chamber of Commerce (No. 22132/GR, Alfa Wasserman S.p.A. v. Salix Pharmaceuticals, Inc. et al.), pursuant to the terms of the Amended and Restated License Agreement between Alfasigma and Salix Inc. (the “ARLA”). In the arbitration, Alfasigma made certain allegations respecting a development project for a formulation of the rifaximin compound (a different formulation to the current formulation, not the Xifaxan
®
product) that is being conducted under the terms of the ARLA, including allegations that Salix Inc. has failed to use the required efforts with respect to this development and that the Company’s acquisition of Salix Ltd. resulted in a change of control under the ARLA, which entitled Alfasigma to assume control of this development. Alfasigma sought, among other things, a declaration that the provisions of the ARLA relating to the development product and the rights relating to the rifaximin formulation being developed had been terminated and such development and rights shall be returned to Alfasigma, an order requiring the Company and Salix Inc. to pay for the costs of such development (in an amount of at least
$80 million
), and alleged damages in the amount of approximately
$285 million
plus arbitration costs and attorney fees. The Company’s Xifaxan
®
products (and Salix Inc.'s rights thereto under the ARLA) were not the subject of any of the relief sought in this arbitration.
On October 25, 2018, Alfasigma, the Company and Salix Inc. entered into a settlement agreement, pursuant to which the parties released each other from all of the claims raised in the arbitration. In connection with the settlement, the parties requested a dismissal of the arbitration on a with prejudice basis. The ICC has granted the requested dismissal. In addition, in connection with the settlement, the parties also entered into an amendment to the ARLA providing for the initiation of a late-stage clinical program to study an investigational formulation of the rifaximin compound in patients with Postoperative Crohn’s disease.
F-69
Settlement of Horizon Blue Cross Blue Shield of New Jersey Lawsuit
On July 26, 2018, Horizon Blue Cross Blue Shield of New Jersey filed a lawsuit against the Company in the Superior Court of New Jersey Law Division/Essex County. This action was captioned Horizon Blue Cross Blue Shield of New Jersey v. Valeant Pharmaceuticals International Inc., et. al., (No. ESX-L-005234-18). This suit asserted a claim under the New Jersey Insurance Fraud Prevention Act, N.J.S.A. 17:33A-1 to -30, as well as claims for common law fraud and negligent misrepresentation. In its complaint, Horizon alleged that the Company and other defendants submitted and caused Horizon to pay fraudulent insurance claims. On October 5, 2018, the Company filed a motion to dismiss the claims against it. While that motion was pending, plaintiffs and the Company entered into a confidential settlement agreement, pursuant to which the Company was dismissed from the action on January 8, 2019.
Afexa Class Action
On March 9, 2012, a Notice of Civil Claim was filed in the Supreme Court of British Columbia which sought an order certifying a proposed class proceeding against the Company and a predecessor, Afexa Life Sciences Inc. ("Afexa") (Case No. NEW-S-S-140954). The proposed claim asserted that Afexa and the Company made false representations respecting Cold-FX
®
to residents of British Columbia who purchased the product during the applicable period and that the proposed class has suffered damages as a result. On November 8, 2013, the plaintiff served an amended notice of civil claim which sought to re-characterize the representation claims and broaden them from what was originally claimed. On December 8, 2014, the Company filed a motion to strike certain elements of the plaintiff’s claim for failure to state a cause of action. In response, the plaintiff proposed further amendments to its claim. The hearing on the motion to strike and the plaintiff’s amended claim was held on February 4, 2015. The Court allowed certain additional subsequent amendments, while it struck others. The hearing to certify the class was held on April 4-8, 2016 and, on November 16, 2016, the Court issued a decision dismissing the plaintiff’s application for certification of this action as a class proceeding. On December 15, 2016, the plaintiff filed a notice of appeal in the British Columbia Court of Appeal appealing the decision to dismiss the application for certification. The plaintiff filed its appeal factum on March 15, 2017 and the Company filed its appeal factum on April 19, 2017. The appeal hearing was held on September 19, 2017 and, on April 30, 2018, the British Columbia Court of Appeal dismissed the appeal. On June 29, 2018, the plaintiff filed leave to appeal to the Supreme Court of Canada in this matter and, on February 7, 2019, the Supreme Court of Canada dismissed the application for leave to appeal with costs.
Letter from the U.S. Department of Justice Civil Division and the U.S. Attorney’s Office for the Eastern District of Pennsylvania
The Company has received a letter dated September 10, 2015 from the U.S. Department of Justice Civil Division and the U.S. Attorney’s Office for the Eastern District of Pennsylvania stating that they are investigating potential violations of the False Claims Act arising out of Biovail Pharmaceuticals, Inc.'s ("Biovail Pharmaceuticals") treatment of certain service fees under agreements with wholesalers when calculating and reporting Average Manufacturer Prices in connection with the Medicaid Drug Rebate Program. The letter requests that the Company voluntarily produce documents and information relating to the investigation. The Company produced certain documents and clarifying information in response to the government’s request and has cooperated with the government’s investigation; although, during 2018, there has been no material activity on the part of the Company with respect to this matter nor has the Company had contact from the government with respect to this matter. The Company cannot predict the outcome or the duration of this investigation or any other legal proceedings or any enforcement actions or other remedies that may be imposed on the Company arising out of these investigations.
On October 12, 2017, the underlying qui tam complaint asserting claims under the federal and certain state False Claims Acts was unsealed in the Eastern District of Pennsylvania, after the United States and the states on whose behalf claims were asserted declined to intervene in the case. The complaint named Biovail Pharmaceuticals and
three
other pharmaceutical manufacturers as defendants. The complaint alleged that Biovail Pharmaceuticals and other manufacturers failed to accurately account for service fees in its calculation of Average Manufacturer Prices reported to the federal government, and as a result underpaid Medicaid rebates. On January 10, 2018, the Relator in this matter filed a voluntary dismissal in this matter, dismissing Biovail Pharmaceuticals, Inc. and
two
of the other defendants, on a without prejudice basis. The United States and the states on whose behalf claims were asserted have consented to the voluntary dismissal on March 2, 2018.
Investigation by the State of North Carolina Department of Justice
In the beginning of March 2016, the Company received an investigative demand from the State of North Carolina Department of Justice. The materials requested relate to the Company's Nitropress
®
, Isuprel
®
and Cuprimine
®
products, including documents relating to the production, marketing, distribution, sale and pricing of, and patient assistance programs covering, such products, as well as issues relating to the Company's pricing decisions for certain of its other products. The Company
F-70
has cooperated with this investigation; although, during 2018, there has been no material activity on the part of the Company with respect to this matter nor has the Company had contact from the State with respect to this matter. The Company cannot predict the outcome or the duration of this investigation or any other legal proceedings or any enforcement actions or other remedies that may be imposed on the Company arising out of this investigation.
California Department of Insurance Investigation
On May 4, 2016, B&L International, Inc. (“B&L International”) received from the Office of the California Insurance Commissioner an administrative subpoena to produce books, records and documents. On September 1, 2016, a revised and corrected subpoena, issued to B&L Inc., was received naming that entity in place of B&L International and seeking additional books records and documents. The requested books, records and documents are being requested in connection with an investigation by the California Department of Insurance and relate to, among other things, consulting agreements and financial arrangements between Bausch & Lomb Holdings Incorporated and its subsidiaries (“B&L”) and health care professionals in California, the provision of ocular equipment, including the Victus
®
femtosecond laser platform, by B&L to health care professionals in California and prescribing data for prescriptions written by health care professionals in California for certain of B&L’s products, including the Crystalens
®
, Lotemax
®
, Besivance
®
and Prolensa
®
. B&L Inc. and the Company have cooperated with the investigation, although, during 2018, there has been no material activity on the part of either B&L Inc. or the Company with respect to this matter nor has B&L Inc. nor the Company had contact from the California Department of Insurance with respect to this matter. The Company cannot predict the outcome or the duration of this investigation or any other legal proceedings or any enforcement actions or other remedies that may be imposed on the Company arising out of this investigation.
|
21.
|
COMMITMENTS AND CONTINGENCIES
|
Lease Commitments
The Company leases certain facilities, vehicles and equipment principally under operating leases. Rental expense related to operating lease agreements was
$92 million
,
$102 million
and
$103 million
and for
2018
,
2017
and
2016
, respectively. Minimum future rental payments under noncancelable operating leases for each of the five succeeding years ending December 31 and thereafter are as follows:
|
(in millions)
|
Operating Lease Obligations
|
|||
|
2019
|
$
|
78
|
|
|
|
2020
|
60
|
|
||
|
2021
|
44
|
|
||
|
2022
|
39
|
|
||
|
2023
|
32
|
|
||
|
Thereafter
|
166
|
|
||
|
Total
|
$
|
419
|
|
|
Minimum future rental payments under noncancelable capital leases are not material.
Other Commitments
The Company has commitments related to capital expenditures of approximately
$64 million
as of
December 31, 2018
.
Under certain agreements, the Company may be required to make payments contingent upon the achievement of specific developmental, regulatory, or commercial milestones. In connection with certain business combinations and divestitures, the Company may make contingent consideration payments, as further described in
Note 4, "DIVESTITURES"
and
Note 6, "FAIR VALUE MEASUREMENTS"
. In addition to these contingent consideration payments, as of
December 31, 2018
, the Company estimates that it may pay other potential milestone payments and license fees, including sales-based milestones, of up to approximately
$1,150 million
over time, in the aggregate, to third parties, primarily consisting of the following:
|
•
|
Under the terms of the co-promotion agreement with US WorldMeds, LLC, the Company may be required to make potential sales-based milestone payments over time up to
$335 million
, in the aggregate.
|
F-71
|
•
|
The Company has made specific regulatory milestone payments related to and shares the profits for brodalumab with AstraZeneca under the terms of the October 2015 license agreement. The Company may be required to pay up to an additional
$20 million
in regulatory milestone payments and up to
$175 million
in sales-related milestone payments in accordance with the October 2015 license agreement.
|
|
•
|
Under the terms of a March 2010 development and licensing agreement between B&L and Nicox Inc., the Company has exclusive worldwide rights to develop and commercialize, for certain indications, products containing latanoprostene bunod, a nitric oxide donating compound for the treatment of glaucoma and ocular hypertension. The Company may be required to make potential regulatory, commercialization and sales-based milestone payments over time up to
$145 million
, in the aggregate, as well as royalties on future sales.
|
|
•
|
Under the term of the 2012 acquisition of Medicis Pharmaceutical Corporation, the Company may be required to make potential regulatory, commercialization and sales-based milestone payments over time up to approximately
$111 million
, in the aggregate.
|
|
•
|
In connection with certain agreements assumed in the Salix Acquisition which was consummated in April 2015, the Company estimates that it may pay to third parties potential milestones of up to approximately
$88 million
over time, in the aggregate.
|
Due to the nature of these arrangements, the future potential payments related to the attainment of the specified milestones over a period of several years are inherently uncertain.
Indemnification Provisions
In the normal course of business, the Company enters into agreements that include indemnification provisions for product liability and other matters. These provisions are generally subject to maximum amounts, specified claim periods and other conditions and limits. As of
December 31, 2018 and 2017
, no material amounts were accrued for the Company’s obligations under these indemnification provisions. In addition, the Company is obligated to indemnify its officers and directors in respect of any legal claims or actions initiated against them in their capacity as officers and directors of the Company in accordance with applicable law. Pursuant to such indemnities, the Company is indemnifying certain former officers and directors in respect of certain litigation and regulatory matters.
|
22.
|
SEGMENT INFORMATION
|
Reportable Segments
The Company’s CEO, who is the Company’s Chief Operating Decision Maker, manages the business through operating and reportable segments consistent with how the Company’s CEO: (i) assesses operating performance on a regular basis, (ii) makes resource allocation decisions and (iii) designates responsibilities of his direct reports. The Company operates in the following reportable segments: (i) Bausch + Lomb/International segment, (ii) Salix segment, (iii) Ortho Dermatologics segment and (iv) Diversified Products segment.
The following is a brief description of the Company’s segments:
|
•
|
The Bausch + Lomb/International segment
consists of: (i) sales in the U.S. of pharmaceutical products, OTC products and medical device products, primarily comprised of Bausch + Lomb products, with a focus on the Vision Care, Surgical, Consumer and Ophthalmology Rx products and (ii) with the exception of sales of Solta products, sales in Canada, Europe, Asia, Australia, Latin America, Africa and the Middle East of branded pharmaceutical products, branded generic pharmaceutical products, OTC products, medical device products and Bausch + Lomb products.
|
|
•
|
The Salix segment
consists of sales in the U.S. of
gastrointestinal ("GI") products.
|
|
•
|
The Ortho Dermatologics
segment
consists of: (i) sales in the U.S. of Ortho Dermatologics (dermatological) products and (ii) global sales of Solta medical aesthetic devices.
|
|
•
|
The Diversified Products segment
consists of sales: (i) in the U.S. of pharmaceutical products in the areas of neurology and certain other therapeutic classes, (ii) in the U.S. of generic products, (iii) in the U.S. of dentistry products and (iv) of certain other businesses divested during 2017 that were not core to the Company's operations, including the Company's
|
F-72
equity interests in Dendreon
(June 28, 2017) and Sprout
(December 20, 2017). As a result of the divestitures of Dendreon and Sprout, the Company exited the oncology and women's health businesses, respectively.
Segment profit is based on operating income after the elimination of intercompany transactions (including transactions with any consolidated variable interest entities). Certain costs, such as amortization and impairments of intangible assets, goodwill impairments, certain R&D expenses not specific to the Company's active portfolio, acquired in-process research and development costs, restructuring, integration and acquisition-related costs and other (income) expense are not included in the measure of segment profit, as management excludes these items in assessing financial performance. In addition, a portion of share-based compensation, representing the difference between actual and budgeted expense, is not allocated to segments.
The Company evaluates segment performance at the segment revenue and segment profit levels. Additionally, the Company does not evaluate total assets at the segment level.
Corporate includes the finance, treasury, certain research and development programs, tax and legal operations of the Company’s businesses and maintains and/or incurs certain assets, liabilities, expenses, gains and losses related to the overall management of the Company, which are not allocated to the other business segments. In assessing segment performance and managing operations, management does not review segment assets. In addition, a portion of share-based compensation is considered a corporate cost, since the amount of such expense depends on Company-wide performance rather than the operating performance of any single segment.
F-73
Segment Revenues and Profit
Segment revenues and profits for the years ended
December 31, 2018
,
2017
and
2016
were as follows:
|
(in millions)
|
2018
|
2017
|
2016
|
||||||||
|
Revenues:
|
|
|
|
||||||||
|
Bausch + Lomb/International
|
$
|
4,664
|
|
$
|
4,795
|
|
$
|
4,857
|
|
||
|
Salix
|
1,749
|
|
1,566
|
|
1,530
|
|
|||||
|
Ortho Dermatologics
|
625
|
|
725
|
|
949
|
|
|||||
|
Diversified Products
|
1,342
|
|
1,638
|
|
2,338
|
|
|||||
|
Total revenues
|
$
|
8,380
|
|
$
|
8,724
|
|
$
|
9,674
|
|
||
|
Segment profit:
|
|
|
|
||||||||
|
Bausch + Lomb/International
|
$
|
1,330
|
|
$
|
1,412
|
|
$
|
1,456
|
|
||
|
Salix
|
1,149
|
|
935
|
|
946
|
|
|||||
|
Ortho Dermatologics
|
265
|
|
336
|
|
408
|
|
|||||
|
Diversified Products
|
1,004
|
|
1,112
|
|
1,712
|
|
|||||
|
Total segment profit
|
3,748
|
|
3,795
|
|
4,522
|
|
|||||
|
Corporate
|
(605
|
)
|
(562
|
)
|
(690
|
)
|
|||||
|
Amortization of intangible assets
|
(2,644
|
)
|
(2,690
|
)
|
(2,673
|
)
|
|||||
|
Goodwill impairments
|
(2,322
|
)
|
(312
|
)
|
(1,077
|
)
|
|||||
|
Asset impairments
|
(568
|
)
|
(714
|
)
|
(422
|
)
|
|||||
|
Restructuring and integration costs
|
(22
|
)
|
(52
|
)
|
(132
|
)
|
|||||
|
Acquired in-process research and development costs
|
(1
|
)
|
(5
|
)
|
(34
|
)
|
|||||
|
Acquisition-related contingent consideration
|
9
|
|
289
|
|
13
|
|
|||||
|
Other income (expense)
|
21
|
|
353
|
|
(73
|
)
|
|||||
|
Operating (loss) income
|
(2,384
|
)
|
102
|
|
(566
|
)
|
|||||
|
Interest income
|
11
|
|
12
|
|
8
|
|
|||||
|
Interest expense
|
(1,685
|
)
|
(1,840
|
)
|
(1,836
|
)
|
|||||
|
Loss on extinguishment of debt
|
(119
|
)
|
(122
|
)
|
—
|
|
|||||
|
Foreign exchange and other
|
23
|
|
107
|
|
(41
|
)
|
|||||
|
Loss before benefit from income taxes
|
$
|
(4,154
|
)
|
$
|
(1,741
|
)
|
$
|
(2,435
|
)
|
||
Capital Expenditures
Capital expenditures by segment for the years ended
December 31, 2018
,
2017
and
2016
were as follows:
|
(in millions)
|
2018
|
2017
|
2016
|
||||||||
|
Capital expenditures:
|
|
|
|
||||||||
|
Bausch + Lomb/International
|
$
|
139
|
|
$
|
159
|
|
$
|
221
|
|
||
|
Salix
|
2
|
|
3
|
|
2
|
|
|||||
|
Ortho Dermatologics
|
1
|
|
2
|
|
1
|
|
|||||
|
Diversified Products
|
2
|
|
4
|
|
5
|
|
|||||
|
144
|
|
168
|
|
229
|
|
||||||
|
Corporate
|
13
|
|
3
|
|
6
|
|
|||||
|
Total capital expenditures
|
$
|
157
|
|
$
|
171
|
|
$
|
235
|
|
||
F-74
Revenues by Product and by Product Category
The top
ten
products for the
years ended December 31, 2018, 2017 and 2016
represented
36%
,
32%
and
31%
of total revenues for the
years ended December 31, 2018, 2017 and 2016
, respectively. Revenues by segment and product category were as follows:
|
(in millions)
|
Bausch + Lomb/ International
|
Salix
|
Ortho Dermatologics
|
Diversified Products
|
Total
|
||||||||||||||||||||||||||||||||||||||||||||
|
2018
|
2017
|
2016
|
2018
|
2017
|
2016
|
2018
|
2017
|
2016
|
2018
|
2017
|
2016
|
2018
|
2017
|
2016
|
|||||||||||||||||||||||||||||||||||
|
Pharmaceuticals
|
$
|
892
|
|
$
|
956
|
|
$
|
966
|
|
$
|
1,752
|
|
$
|
1,564
|
|
$
|
1,529
|
|
$
|
465
|
|
$
|
571
|
|
$
|
806
|
|
$
|
923
|
|
$
|
1,286
|
|
$
|
1,865
|
|
$
|
4,032
|
|
$
|
4,377
|
|
$
|
5,166
|
|
||||
|
Devices
|
1,505
|
|
1,421
|
|
1,407
|
|
—
|
|
—
|
|
—
|
|
135
|
|
111
|
|
97
|
|
—
|
|
—
|
|
—
|
|
1,640
|
|
1,532
|
|
1,504
|
|
|||||||||||||||||||
|
OTC
|
1,412
|
|
1,529
|
|
1,581
|
|
—
|
|
—
|
|
—
|
|
—
|
|
—
|
|
—
|
|
—
|
|
—
|
|
—
|
|
1,412
|
|
1,529
|
|
1,581
|
|
|||||||||||||||||||
|
Branded and Other Generics
|
784
|
|
819
|
|
830
|
|
—
|
|
—
|
|
—
|
|
—
|
|
—
|
|
—
|
|
403
|
|
338
|
|
455
|
|
1,187
|
|
1,157
|
|
1,285
|
|
|||||||||||||||||||
|
Other revenues
|
71
|
|
70
|
|
73
|
|
(3
|
)
|
2
|
|
1
|
|
25
|
|
43
|
|
46
|
|
16
|
|
14
|
|
18
|
|
109
|
|
129
|
|
138
|
|
|||||||||||||||||||
|
$
|
4,664
|
|
$
|
4,795
|
|
$
|
4,857
|
|
$
|
1,749
|
|
$
|
1,566
|
|
$
|
1,530
|
|
$
|
625
|
|
$
|
725
|
|
$
|
949
|
|
$
|
1,342
|
|
$
|
1,638
|
|
$
|
2,338
|
|
$
|
8,380
|
|
$
|
8,724
|
|
$
|
9,674
|
|
|||||
Geographic Information
Revenues are attributed to a geographic region based on the location of the customer for the years ended
December 31, 2018
,
2017
and
2016
were as follows:
|
(in millions)
|
2018
|
2017
|
2016
|
||||||||
|
U.S. and Puerto Rico
|
$
|
5,011
|
|
$
|
5,225
|
|
$
|
6,247
|
|
||
|
China
|
361
|
|
331
|
|
300
|
|
|||||
|
Canada
|
319
|
|
326
|
|
320
|
|
|||||
|
Japan
|
226
|
|
223
|
|
232
|
|
|||||
|
Poland
|
218
|
|
201
|
|
140
|
|
|||||
|
Mexico
|
211
|
|
201
|
|
189
|
|
|||||
|
France
|
205
|
|
188
|
|
186
|
|
|||||
|
Egypt
|
178
|
|
152
|
|
196
|
|
|||||
|
Germany
|
170
|
|
157
|
|
157
|
|
|||||
|
Russia
|
154
|
|
200
|
|
165
|
|
|||||
|
United Kingdom
|
117
|
|
108
|
|
104
|
|
|||||
|
Italy
|
85
|
|
78
|
|
72
|
|
|||||
|
Spain
|
83
|
|
77
|
|
70
|
|
|||||
|
Other
|
1,042
|
|
1,257
|
|
1,296
|
|
|||||
|
$
|
8,380
|
|
$
|
8,724
|
|
$
|
9,674
|
|
|||
F-75
Long-lived assets consisting of property, plant and equipment, net of accumulated depreciation, are attributed to geographic regions based on their physical location as of
December 31, 2018
and
2017
were as follows:
|
(in millions)
|
2018
|
2017
|
|||||
|
U.S. and Puerto Rico
|
$
|
593
|
|
$
|
599
|
|
|
|
Ireland
|
217
|
|
235
|
|
|||
|
Canada
|
99
|
|
98
|
|
|||
|
Poland
|
94
|
|
100
|
|
|||
|
Germany
|
66
|
|
70
|
|
|||
|
Egypt
|
50
|
|
47
|
|
|||
|
Mexico
|
48
|
|
50
|
|
|||
|
France
|
31
|
|
34
|
|
|||
|
Serbia
|
28
|
|
30
|
|
|||
|
China
|
25
|
|
28
|
|
|||
|
Italy
|
23
|
|
23
|
|
|||
|
South Korea
|
14
|
|
15
|
|
|||
|
Other
|
65
|
|
74
|
|
|||
|
$
|
1,353
|
|
$
|
1,403
|
|
||
Major Customers
Customers that accounted for 10% or more of total revenues were as follows:
|
|
2018
|
2017
|
2016
|
||
|
AmerisourceBergen Corporation
|
18%
|
|
15%
|
|
13%
|
|
McKesson Corporation
|
18%
|
|
19%
|
|
21%
|
|
Cardinal Health, Inc.
|
13%
|
|
13%
|
|
15%
|
F-76
SUPPLEMENTARY DATA (UNAUDITED)
Selected unaudited quarterly consolidated financial data are shown below:
|
2018
|
||||||||||||||||
|
(in millions, except per share amounts)
|
First
Quarter
|
Second
Quarter
|
Third
Quarter
|
Fourth
Quarter
|
||||||||||||
|
Revenue
|
$
|
1,995
|
|
$
|
2,128
|
|
$
|
2,136
|
|
$
|
2,121
|
|
||||
|
Expenses
|
4,276
|
|
2,373
|
|
2,019
|
|
2,096
|
|
||||||||
|
Operating (loss) income
|
$
|
(2,281
|
)
|
$
|
(245
|
)
|
$
|
117
|
|
$
|
25
|
|
||||
|
Net loss attributable to Bausch Health Companies Inc.
|
$
|
(2,581
|
)
|
$
|
(873
|
)
|
$
|
(350
|
)
|
$
|
(344
|
)
|
||||
|
Loss per share attributable to Bausch Health Companies Inc.:
|
||||||||||||||||
|
Basic
|
$
|
(7.36
|
)
|
$
|
(2.49
|
)
|
$
|
(1.00
|
)
|
$
|
(0.98
|
)
|
||||
|
Diluted
|
$
|
(7.36
|
)
|
$
|
(2.49
|
)
|
$
|
(1.00
|
)
|
$
|
(0.98
|
)
|
||||
|
Net cash provided by operating activities
|
$
|
438
|
|
$
|
222
|
|
$
|
522
|
|
$
|
319
|
|
||||
During the second quarter of 2018, the Company identified a
$112 million
understatement to the Benefit from income taxes as originally reported for the three months ended March 31, 2018, due to an error in the forecasted effective tax rate. The understatement resulted in overstatements of the Company's Net loss attributable to Bausch Health Companies Inc. of
$112 million
and Basic and Diluted loss per share of
$0.32
for the three months ended March 31, 2018. Based on its evaluation, the Company concluded that the misstatement was not material to its financial position and statements of operations, comprehensive loss and cash flows as of and for the three months ended March 31, 2018 or the related disclosures. The first quarter 2018 financial information presented above was revised to correct this misstatement.
|
2017
|
||||||||||||||||
|
(in millions, except per share amounts)
|
First
Quarter
|
Second
Quarter
|
Third
Quarter
|
Fourth
Quarter
|
||||||||||||
|
Revenue
|
$
|
2,109
|
|
$
|
2,233
|
|
$
|
2,219
|
|
$
|
2,163
|
|
||||
|
Expenses
|
1,898
|
|
2,058
|
|
2,181
|
|
2,485
|
|
||||||||
|
Operating income (loss)
|
$
|
211
|
|
$
|
175
|
|
$
|
38
|
|
$
|
(322
|
)
|
||||
|
Net income (loss) attributable to Bausch Health Companies Inc.
|
$
|
628
|
|
$
|
(38
|
)
|
$
|
1,301
|
|
$
|
513
|
|
||||
|
Earnings (loss) per share attributable to Bausch Health Companies Inc.:
|
||||||||||||||||
|
Basic
|
$
|
1.80
|
|
$
|
(0.11
|
)
|
$
|
3.71
|
|
$
|
1.46
|
|
||||
|
Diluted
|
$
|
1.79
|
|
$
|
(0.11
|
)
|
$
|
3.69
|
|
$
|
1.45
|
|
||||
|
Net cash provided by operating activities
|
$
|
954
|
|
$
|
268
|
|
$
|
490
|
|
$
|
578
|
|
||||
F-77
TABLE OF CONTENTS
Part IX Of TheItem 6. Selected Financial DataNote 4, "divestitures"Note 5, "restructuring and Integration Costs"Note 9, "intangible Assets and Goodwill"Note 11, "financing Arrangements"Item 7. Management S Discussion and Analysis Of Financial Condition and Results Of OperationsNote 22, "segment Information"Note 20, "legal Proceedings"Note 2, "significant Accounting Policies"Note 17, "income Taxes"Note 6, "fair Value Measurements"Note 21, "commitments and Contingencies"Note 12, "pension and Postretirement Employee Benefit Plans"Item 7A. Quantitative and Qualitative Disclosures About Market RiskItem 8. Financial Statements and Supplementary DataItem 9. Changes in and Disagreements with Accountants on Accounting and Financial DisclosureItem 9A. Controls and ProceduresItem 9B. Other InformationPart IIIItem 10. Directors, Executive Officers and Corporate GovernanceItem 11. Executive CompensationItem 12. Security Ownership Of Certain Beneficial Owners and Management and Related Stockholder MattersItem 13. Certain Relationships and Related Transactions, and Director IndependenceItem 14. Principal Accounting Fees and ServicesPart IVItem 15. Exhibits and Financial Statement SchedulesItem 16. Form 10-k Summary