BRIGHTHOUSE FINANCIAL, INC.
Washington, D.C. 20549
__________________________
FORM 10-K
(Mark One)
|
þ
|
ANNUAL REPORT PURSUANT TO SECTION 13 OR 15(d) OF THE SECURITIES EXCHANGE ACT OF 1934
|
For the fiscal year ended
December 31, 2017
or
|
¨
|
TRANSITION REPORT PURSUANT TO SECTION 13 OR 15(d) OF THE SECURITIES EXCHANGE ACT OF 1934
|
For the transition period from _____ to _____
Commission file number 001-37905
Brighthouse Financial, Inc.
(Exact name of registrant as specified in its charter)
(980) 365-7100
|
Delaware
|
81-3846992
|
||
|
(State or other jurisdiction of incorporation or organization)
|
(I.R.S. Employer Identification No.)
|
||
|
11225 North Community House Road, Charlotte, North Carolina
|
28277
|
||
|
(Address of principal executive offices)
|
(Zip Code)
|
||
(Registrant’s telephone number, including area code)
Securities registered pursuant to Section 12(b) of the Act:
Securities registered pursuant to Section 12(g) of the Act: None
|
Title of each class
|
Name of each exchange on which registered
|
|
Common stock, par value $0.01 per share
|
The Nasdaq Stock Market LLC
|
Indicate by check mark if the registrant is a well-known seasoned issuer, as defined in Rule 405 of the Securities Act. Yes
¨
No
þ
Indicate by check mark if the registrant is not required to file reports pursuant to Section 13 or 15(d) of the Act. Yes
¨
No
þ
Indicate by check mark whether the registrant (1) has filed all reports required to be filed by Section 13 or 15(d) of the Securities Exchange Act of 1934 during the preceding 12 months (or for such shorter period that the registrant was required to file such reports), and (2) has been subject to such filing requirements for the past 90 days. Yes
þ
No
¨
Indicate by check mark whether the registrant has submitted electronically and posted on its corporate Web site, if any, every Interactive Data File required to be submitted and posted pursuant to Rule 405 of Regulation S-T (§ 232.405 of this chapter) during the preceding 12 months (or for such shorter period that the registrant was required to submit and post such files). Yes
þ
No
¨
Indicate by check mark if disclosure of delinquent filers pursuant to Item 405 of Regulation S-K (§ 229.405 of this chapter) is not contained herein, and will not be contained, to the best of registrant’s knowledge, in definitive proxy or information statements incorporated by reference in Part III of this Form 10-K or any amendment to this Form 10-K.
¨
Indicate by check mark whether the registrant is a large accelerated filer, an accelerated filer, a non-accelerated filer, a smaller reporting company, or an emerging growth company. See the definitions of “large accelerated filer,” “accelerated filer,” “smaller reporting company” and “emerging growth company” in Rule 12b-2 of the Exchange Act. (Check one):
|
Large accelerated filer
¨
|
Accelerated filer
¨
|
|
|
Non-accelerated filer
þ
(Do not check if a smaller reporting company)
|
Smaller reporting company
¨
|
|
|
Emerging growth company
¨
|
||
If an emerging growth company, indicate by check mark if the registrant has elected not to use the extended transition period for complying with any new or revised financial accounting standards provided pursuant to Section 13(a) of the Exchange Act.
¨
Indicate by check mark whether the registrant is a shell company (as defined in Rule 12b-2 of the Exchange Act). Yes
¨
No
þ
As of June 30, 2017, the last business day of the registrant’s most recently completed second fiscal quarter, the registrant’s common stock was not publicly traded.
As of March 15,
2018
,
119,773,106
shares of the registrant’s common stock were outstanding.
DOCUMENTS INCORPORATED BY REFERENCE
Portions of the registrant’s proxy statement to be filed with the U.S. Securities and Exchange Commission in connection with the registrant’s 2018 annual meeting of stockholders (the “Proxy Statement”) are incorporated by reference into Part III of this Annual Report on Form 10-K. Such Proxy Statement will be filed within 120 days of the registrant’s fiscal year ended December 31, 2017.
Table of Contents
|
|
|
|
|
Page
|
|
Part I
|
||||
|
Item 1.
|
|
|||
|
Item 1A.
|
|
|||
|
Item 1B.
|
|
|||
|
Item 2.
|
|
|||
|
Item 3.
|
|
|||
|
Item 4.
|
|
|||
|
Part II
|
||||
|
Item 5.
|
||||
|
Item 6.
|
||||
|
Item 7.
|
||||
|
Item 7A.
|
||||
|
Item 8.
|
||||
|
Item 9.
|
||||
|
Item 9A.
|
||||
|
Item 9B.
|
||||
|
Part III
|
||||
|
Item 10.
|
||||
|
Item 11.
|
||||
|
Item 12.
|
||||
|
Item 13.
|
||||
|
Item 14.
|
||||
|
Part IV
|
||||
|
Item 15.
|
||||
As used in this Annual Report on Form 10-K, “Brighthouse,” the “Company,” “we,” “us” and “our” refer to Brighthouse Financial, Inc. a corporation incorporated in Delaware in 2016, and its subsidiaries. Brighthouse Financial, Inc. was formerly a wholly-owned subsidiary of MetLife, Inc. (MetLife, Inc., together with its subsidiaries and affiliates, “MetLife”). The term “Separation” refers to the separation of MetLife, Inc.’s former Brighthouse Financial segment from MetLife’s other businesses and the creation of a separate, publicly traded company, Brighthouse Financial, Inc., to hold the assets (including the equity interests of certain MetLife, Inc. subsidiaries) and liabilities associated with MetLife, Inc.’s former Brighthouse Financial segment from and after the Distribution; the term “Distribution” refers to the distribution on August 4, 2017 of 96,776,670 shares, or 80.8%, of the 119,773,106 shares of Brighthouse Financial, Inc. common stock outstanding immediately prior to the Distribution date by MetLife, Inc. to shareholders of MetLife, Inc. as of the record date for the Distribution.
Note Regarding Forward-Looking Statements
This report and other written or oral statements that we make from time to time may contain information that includes or is based upon forward-looking statements within the meaning of the Private Securities Litigation Reform Act of 1995. Such forward-looking statements involve substantial risks and uncertainties. We have tried, wherever possible, to identify such statements using words such as “anticipate,” “estimate,” “expect,” “project,” “may,” “will,” “could,” “intend,” “goal,” “target,” “forecast,” “objective,” “continue,” “aim,” “plan,” “believe” and other words and terms of similar meaning, or are tied to future periods, in connection with a discussion of future operating or financial performance. In particular, these include, without limitation, statements relating to future actions, prospective services or products, future performance or results of current and anticipated services or products, sales efforts, expenses, the outcome of contingencies such as legal proceedings, trends in operating and financial results, as well as statements regarding the expected benefits of the Separation and the recapitalization actions.
Any or all forward-looking statements may turn out to be wrong. They can be affected by inaccurate assumptions or by known or unknown risks and uncertainties. Many such factors will be important in determining the actual future results of Brighthouse. These statements are based on current expectations and the current economic environment and involve a number of risks and uncertainties that are difficult to predict. These statements are not guarantees of future performance. Actual results could differ materially from those expressed or implied in the forward-looking statements due to a variety of known and unknown risks, uncertainties and other factors. Although it is not possible to identify all of these risks and factors, they include, among others:
|
•
|
differences between actual experience and actuarial assumptions and the effectiveness of our actuarial models;
|
|
•
|
higher risk management costs and exposure to increased counterparty risk due to guarantees within certain of our products;
|
|
•
|
the effectiveness of our exposure management strategy and the impact of such strategy on net income volatility and negative effects on our statutory capital;
|
|
•
|
the additional reserves we will be required to hold against our variable annuities as a result of actuarial guidelines;
|
|
•
|
a sustained period of low equity market prices and interest rates that are lower than those we assumed when we issued our variable annuity products;
|
|
•
|
our degree of leverage due to indebtedness incurred in connection with the Separation;
|
|
•
|
the effect adverse capital and credit market conditions may have on our ability to meet liquidity needs and our access to capital;
|
|
•
|
the impact of changes in regulation and in supervisory and enforcement policies on our insurance business or other operations;
|
|
•
|
the effectiveness of our risk management policies and procedures;
|
|
•
|
the availability of reinsurance and the ability of our counterparties to our reinsurance or indemnification arrangements to perform their obligations thereunder;
|
|
•
|
heightened competition, including with respect to service, product features, scale, price, actual or perceived financial strength, claims-paying ratings, credit ratings, e-business capabilities and name recognition;
|
|
•
|
changes in accounting standards, practices and/or policies applicable to us;
|
|
•
|
the ability of our insurance subsidiaries to pay dividends to us, and our ability to pay dividends to our shareholders;
|
|
•
|
our ability to market and distribute our products through distribution channels;
|
2
|
•
|
the impact of the Separation on our business and profitability due to MetLife’s strong brand and reputation, the increased costs related to replacing arrangements with MetLife with those of third parties and incremental costs as a public company;
|
|
•
|
whether the operational, strategic and other benefits of the Separation can be achieved, and our ability to implement our business strategy;
|
|
•
|
whether all or any portion of the Separation tax consequences are not as expected, leading to material additional taxes or material adverse consequences to tax attributes that impact us;
|
|
•
|
the uncertainty of the outcome of any disputes with MetLife over tax-related matters and agreements including the potential of outcomes adverse to us that could cause us to owe MetLife material tax reimbursements or payments;
|
|
•
|
the impact on our business structure, profitability, cost of capital and flexibility due to restrictions we have agreed to that preserve the tax-free treatment of certain parts of the Separation;
|
|
•
|
the potential material negative tax impact of the Tax Cuts and Jobs Act (the “Tax Act”) and other potential future tax legislation that could decrease the value of our tax attributes, lead to increased RBC requirements and cause other cash expenses, such as reserves, to increase materially and make some of our products less attractive to consumers;
|
|
•
|
whether the Distribution will qualify for non-recognition treatment for U.S. federal income tax purposes and potential indemnification to MetLife if the Distribution does not so qualify;
|
|
•
|
our ability to attract and retain key personnel; and
|
|
•
|
other factors described in this report and from time to time in documents that we file with the
U.S. Securities and Exchange Commission (“SEC”)
.
|
For the reasons described above, we caution you against relying on any forward-looking statements, which should also be read in conjunction with the other cautionary statements included and the risks, uncertainties and other factors identified elsewhere in this Annual Report on Form 10-K, particularly in “Risk Factors” and “Quantitative and Qualitative Disclosures About Market Risk,” as well as in our quarterly reports on Form 10-Q, current reports on Form 8-K and other documents we file from time to time with the SEC.
Further, any forward-
looking statement speaks only as of the date on which it is made, and we undertake no obligation to update or revise any forward-looking statement to reflect events or circumstances after the date on which the statement is made or to reflect the occurrence of unanticipated events, except as otherwise may be required by law. Please consult any further disclosures Brighthouse makes on related subjects in reports to the SEC.
Corporate Information
We announce financial and other information about Brighthouse to our investors through the Brighthouse Investor Relations web page at www.brighthousefinancial.com, as well as SEC filings, news releases, public conference calls and webcasts. Brighthouse encourages investors to visit the Investor Relations web page from time to time, as information is updated and new information is posted. The information found on our website is not incorporated by reference into this Annual Report on Form 10-K or in any other report or document we file with the SEC, and any references to our website are intended to be inactive textual references only.
Note Regarding Reliance on Statements in Our Contracts
See “Exhibit Index — Note Regarding Reliance on Statements in Our Contracts” for information regarding agreements included as exhibits to this Annual Report on Form 10-K.
3
Index to Business
4
Overview
Our Company
We are a major provider of annuity products and life insurance in the United States through multiple independent distribution channels and marketing arrangements with a diverse network of distribution partners. Our in-force book of products consists of approximately 2.7 million insurance policies and annuity contracts at December 31, 2017, which are organized into three reporting segments:
|
(i)
|
Annuities, which includes variable, fixed, index-linked and income annuities;
|
|
(ii)
|
Life, which includes variable, term, universal and whole life policies; and
|
|
(iii)
|
Run-off, which consists of operations related to products which we are not actively selling and which are separately managed.
|
In addition, the Company reports certain of its results of operations not included in the segments in Corporate & Other.
At December 31, 2017, we had $224.2 billion of total assets with total stockholders’ equity of $14.5 billion, including accumulated other comprehensive income (“AOCI”); approximately $629.4 billion of life insurance face amount in-force and $147.5 billion of annuity assets under management (“AUM”), which we define as our general account investments and our separate account assets.
Prior to the Distribution, the companies that became our subsidiaries were wholly owned by MetLife. Brighthouse Life Insurance Company (together with its subsidiaries and affiliates, “BLIC”), which is our largest operating subsidiary, was formed in November 2014 through the merger of three affiliated life insurance companies and a former offshore, internal reinsurance subsidiary that mainly reinsured guarantees associated with variable annuity products issued by MetLife affiliates. The principal purpose of the merger was to provide increased transparency relative to capital allocation and variable annuity risk management. In order to further our capabilities to market and distribute our products, prior to the Distribution, MetLife contributed to us (i) several entities including Brighthouse Life Insurance Company, New England Life Insurance Company (“NELICO”) and Brighthouse Life Insurance Company of NY (“BHNY”); (ii) a licensed broker-dealer; (iii) a licensed investment advisor; and (iv) other entities necessary for the execution of our strategy.
We seek to be a financially disciplined and, over time, cost-competitive product manufacturer with an emphasis on independent distribution. We aim to leverage our large block of in-force life insurance policies and annuity contracts to operate more efficiently. We believe that our strategy of offering a targeted set of products to serve our customers and distribution partners, each of which is intended to produce positive statutory distributable cash flows on an accelerated basis compared to our legacy products, will enhance our ability to invest in our business and distribute cash to our shareholders over time. We also believe that our product strategy of offering a more tailored set of new products and our agreement to outsource a significant portion of our client administration and service processes, is consistent with our focus on reducing our expense structure over time.
Risk management of both our in-force book and our new business to enhance sustained, long-term shareholder value is fundamental to our strategy. Consequently, in writing new business we prioritize the value of the new business we write over sales volumes. We assess the value of new products by taking into account the amount and timing of cash flows, the use and cost of capital required to support our financial strength ratings and the cost of risk mitigation. We remain focused on maintaining our strong capital base and we have established a risk management approach that seeks to mitigate the effects of severe market disruptions and other economic events on our business. See “Risk Factors — Risks Related to Our Business — Our variable annuity exposure management strategy may not be effective, may result in net income volatility and may negatively affect our statutory capital,” “— Segments and Corporate & Other — Annuities” and “— Risk Management Strategies — ULSG Market Risk Exposure Management.”
We believe that general demographic trends in the U.S. population, the increase in under-insured individuals, the potential risk to governmental social safety net programs and the shifting of responsibility for retirement planning and financial security from employers and other institutions to individuals will create opportunities to generate significant demand for our products. We also believe our transition to an independent distribution system will enhance our ability to operate most effectively within the emerging requirements of the April 6, 2016 Department of Labor (“DOL”) fiduciary rule (“Fiduciary Rule”) which became effective on June 9, 2017, and sets forth a new regulatory framework for the sale of insurance and annuity products to individual retirement accounts and individual retirement annuities (collectively, “IRAs”) and Employee Retirement Income Security Act (“ERISA”) qualified plans, which is a significant market for annuity products. See “—Regulation — Department of Labor and ERISA Considerations” for a discussion of further developments with respect to the Fiduciary Rule.
5
Market Environment and Opportunities
We believe the shift away from defined benefit plans and the concern over government social safety net programs, occurring at a time of significant demographic change in the United States, as baby boomers transition to retirement, present an opportunity to assist individuals in planning for their long-term financial security. We believe we are well positioned to benefit from this environment and the changes and trends affecting it, including the following:
|
•
|
Largest individual insurance market in the world.
As noted in the Insurance Retirement Institute (“IRI”) 2017 fact book, the U.S. life insurance market has $2.8 trillion net assets in annuities and approximately $12.0 trillion of individual life insurance face amount in-force. This represents a large opportunity pool for us from which we expect to benefit because of the scale and scope of our life and annuity products, risk management and distribution capabilities, and our ability to operate nationally.
|
|
•
|
Shifting of responsibility for retirement planning and life time income security from employers and other institutions to individuals.
The shift away from traditional defined benefit plans, together with increased life expectancy, has increased the burden on individuals for retirement planning and financial security and created a significant risk that many people will outlive their retirement assets. The Employee Benefit Research Institute estimates that participation in an employment-based defined benefit plan among private sector workers declined from 38% in 1979 to 13% in 2013. Fifty-one percent of households have no retirement savings in a defined contribution plan or IRA, and Social Security provides an average of 40% of the retirement income of retired households. According to the U.S. Government Accountability Office, among the 48% of households age 55 and older with some retirement savings, the median amount is approximately $109,000. The individual life insurance and retirement industry has traditionally offered solutions that address this underserved need among consumers, such as annuities, which represent an alternative means of generating pension-like income to permit contract holders to secure guaranteed income for life. We believe our simplified suite of annuity products will be attractive to consumers as a supplement to Social Security or employer provided pension income.
|
|
•
|
Favorable demographic trends.
There are several demographic trends that we believe we can take advantage of, including:
|
|
•
|
The ongoing transition of baby boomers into retirement offers opportunities for the accumulation of wealth, as well as its distribution and transfer.
According to the Insured Retirement Institute, each day 10,000 Americans reach the age of 65 and this is expected to continue through at least 2030. One of the market segments we target, the Secure Seniors, includes individuals from the baby boomer demographic and is projected to grow by 15% between 2015 and 2025. See “— Our Business Strategy — Focus on target market segments.”
|
|
•
|
The emergence of Generation X and Millennials as a larger and fast growing, potentially ethnically diverse segment of the U.S. population.
Many of these individuals are in their prime earning years and we believe they will increase their focus on savings for wealth and protection products. As Generation X and Millennials continue to age into the Middle Aged Strivers and Diverse and Protected segments that we target, we believe we have an opportunity to increase our share of the industry profit pool represented by these groups. See “— Our Business Strategy — Focus on target market segments.”
|
|
•
|
Underinsured and underserved population is growing.
According to LIMRA International Inc.’s (Life Insurance Marketing and Research Association) Facts of Life and Annuities 2016 Update and 2017 Insurance Barometer Study, 41% of U.S. households believe that they need more life insurance. Seven in 10 Americans have life insurance, but ownership of individual coverage has declined over a 50-year period. We believe the products and solutions we offer will address the financial security needs of the under-insured portion of the U.S. population, which are our target segments.
|
|
•
|
Regulatory changes.
Regulatory and compliance requirements in the insurance and financial services industries have increased over the past several years and resulted in new and proposed regulation and enhanced supervision. For example, the DOL issued new rules on April 6, 2016 that raise the standards for sales of variable and index-linked annuities into retirement accounts to a fiduciary standard, meaning that sales must consider the customer’s interest above all factors. These rules became applicable on June 9, 2017. On November 29, 2017, the DOL finalized an 18-month delay, from January 1, 2018 to July 1, 2019, of the applicability of significant portions of exemptions proposed under the fiduciary rule (including Best Interest Contract Exemption (“BIC”) and prohibited transaction exemption 84-24), to afford sufficient time to review further the previously adopted rules and such exemptions. These rules and their implications are undergoing a further review by the DOL and the scope and ramifications of these rules could be modified as a result of such review. See “
—
Regulation — Department of Labor and ERISA Considerations.” As currently adopted, these rules are expected to require meaningful changes to distribution practices and disclosures and affect sales of annuity products from providers with proprietary distribution. In addition, the National Association of Insurance Commissioners (the “NAIC”), as well as certain state regulators are currently considering implementing regulations that would apply an impartial conduct standard similar to the
|
6
DOL rules to recommendations made in connection with certain annuities and, in the case of New York, life insurance policies. In particular, on December 27, 2017, the New York State Department of Financial Services (the “NYDFS”) proposed regulations that would adopt a “best interest” standard for the sale of life insurance and annuity products in New York. The likelihood of enactment of these regulations is uncertain at this time, but if implemented, these regulations could have significant adverse effects on our business and consolidated results of operations. We believe our history of navigating a changing regulatory environment and our transition to independent distribution may present us with an opportunity to capture market share from those who are less able to adapt to changing regulatory requirements.
We believe these trends, together with our competitive strengths and strategy discussed below, provide us a unique opportunity to increase the value of our business.
Our Competitive Strengths
We believe that our large in-force book of business, strong balance sheet, risk management strategy, experienced management team and focus on expense reduction allow us to capitalize on the attractive market environment and opportunities as we develop and grow our business on an independent basis.
|
•
|
Large in-force book of business
. We are a major provider of life insurance and annuity products in the United States, with approximately 2.7 million insurance policies and annuity contracts at December 31, 2017. We believe our size and long-standing market presence position us well for potential future growth and margin expansion.
|
|
•
|
Our size provides opportunities to achieve economies of scale, permitting us to spread our fixed general and administrative costs, including expenditures on branding, over a large revenue base, resulting in a competitive expense ratio.
|
|
•
|
Our large policyholder base provides us with an opportunity to leverage underlying data to develop risk and policyholder insights, as well as, implement operational best practices, permitting us to effectively differentiate ourselves from our competitors with the design and management of our products.
|
|
•
|
Our in-force book of business was sold by a wide range of distribution partners to whom we continue to pay trail and renewal commissions on the policies and contracts sold by them. For the year ended December 31, 2017, over 1,000 distribution firms or general agencies of our distributors received trail and renewal commissions. We believe this enhances our ability to maintain connectivity and relevance to those distributors.
|
|
•
|
Strong balance sheet.
At December 31, 2017, we had total assets of $224.2 billion; total policyholder liabilities and other policy-related balances, including separate accounts, of $209.6 billion; and total stockholders’ equity of $14.5 billion, including AOCI. We intend to maintain and improve the strong statutory capitalization and financial strength ratings of our insurance subsidiaries, as well as the diversity of invested asset classes.
|
|
•
|
Our insurance subsidiaries had combined statutory total adjusted capital (“Combined TAC”) of $6.6 billion resulting in a combined action level risk based capital (“Combined RBC ratio”) in excess of 600% at December 31, 2017. We intend to support our variable annuity business with assets consistent with those required at the CTE95 standard (defined as the amount of assets required to satisfy contract holder obligations across market environments in the average of the worst five percent of 1,000 capital market scenarios over the life of the contracts (“CTE95”), consistent with guidelines promulgated by the NAIC”). We held approximately $2.6 billion of assets in excess of CTE95 at December 31, 2017 to support our variable annuity book, which would be equivalent to holding assets at greater than a CTE98 standard as of such date (defined as the amount of assets required to satisfy contract holder obligations across market environments in the average of the worst two percent of 1,000 capital market scenarios over the life of the contracts (“CTE98”), consistent with guidelines promulgated by the NAIC).
|
|
•
|
We have strong financial strength ratings from the rating agencies that rate us. Financial strength ratings represent the opinions of the rating agencies regarding the ability of our insurance subsidiaries to meet their financial obligations to policyholders and contract holders and are not designed or intended for use by investors in evaluating our securities.
|
|
•
|
We have a diversified, high quality investment portfolio with $82.3 billion of general account assets at December 31, 2017, comprised of over 79% fixed maturity securities, of which over 95% were investment grade and 60% were U.S. corporate, government and agency securities.
|
|
•
|
Proven risk management and capital management expertise.
We have brought to Brighthouse a strong risk management culture as demonstrated by our product decisions in recent years and our focused risk and capital management strategies for our existing book of business. We believe our insurance subsidiaries are capitalized at a level which is sufficient to maintain our financial strength ratings notwithstanding modest fluctuations in equity markets and interest rates in any given period. Further, over time by increasing the proportion of non-derivative, income-generating invested assets compared to
|
7
derivative instruments supporting our variable annuity book of business, we believe our capital profile will be stronger and more able to mitigate a broader range of risk exposures.
|
•
|
Experienced senior management team with a proven track record of execution including producing cost savings.
Our senior management team has an average of over 20 years of insurance industry experience. They have worked together to manage our business and reduce the cost base prior to the Distribution and continue to manage our business as a separate and focused individual life insurance and annuity company. The senior management team has taken significant actions over the last five years, including the following:
|
|
•
|
In 2012, MetLife announced a multi-year $1.0 billion gross expense savings initiative, which was substantially completed in 2015. This management team delivered approximately $200 million of expense savings with respect to MetLife’s former Retail segment under that initiative.
|
|
•
|
The merger of three affiliated life insurance companies and a former offshore, reinsurance company affiliate that mainly reinsured guarantees associated with variable annuity products issued by MetLife affiliates to form our largest operating subsidiary, Brighthouse Life Insurance Company.
|
|
•
|
The consolidation of MetLife’s former Retail segment in Charlotte, North Carolina, which, in addition to generating expense savings noted above, permitted our management to work together collaboratively at the same geographic location.
|
|
•
|
The sale of MetLife’s former Retail segment’s proprietary distribution channel, MetLife Premier Client Group (“MPCG”), to Massachusetts Mutual Life Insurance Company (“MassMutual”), completing our transition to a more efficient acquisition cost distribution model through independent, third-party channel partners. As part of the sale, MetLife reduced its former Retail segment employee base by approximately 3,900 advisors and over 2,000 support employees. The sale of the proprietary distribution channel has enabled us to pursue a simplified, capital efficient product suite and reduce our fixed expense structure.
|
|
•
|
On July 31, 2016, MetLife entered into a multi-year outsourcing arrangement with Computer Sciences Corporation (now DXC Technology Company (“DXC”)) for the administration of certain in-force policies currently housed on up to 20 systems. Pursuant to this arrangement, at least 13 of such systems will be consolidated down to one. The arrangement provides administrative support for certain MetLife and Brighthouse policies, resulting in a phased net reduction in our overall expenses for maintenance over the next three to five years. Despite the separation of Brighthouse from MetLife, MetLife continues to oversee the transition of the administration of this business to DXC.
|
|
•
|
In December 2017, Brighthouse formalized a second arrangement with DXC for the administration of life and annuities new business and approximately 1.3 million in-force life and annuities contracts. Brighthouse is responsible for overseeing the transition of the administration of this business to DXC. Similar to the first contract, Brighthouse expects to achieve a variable expense structure and a phased net reduction in overall expenses for sales and administration maintenance of these contracts over the next three to five years.
|
Our Business Strategy
Our objective is to leverage our competitive strengths, to distinguish ourselves in the individual life insurance and annuity markets and over time increase the amount of statutory distributable cash generated by our business. We seek to achieve this by being a focused product manufacturer with an emphasis on independent distribution, while having a competitive expense ratio relative to our competitors. We intend to achieve our goals by executing on the following strategies:
|
•
|
Focus on target market segments.
We intend to focus our sales and marketing efforts on those specific market segments where we believe we will best be able to sell products capable of producing attractive long-term value to our shareholders.
|
In 2015, we conducted a survey of 7,000 U.S. customers with the goal of understanding our different market segments. Ultimately, the study revealed seven distinct segments based on both traditional demographic information including socio-economic information and an analysis of customer needs, attitudes and behaviors. Our review of the customer segmentation data resulted in our focusing product design and marketing on the following target customer segments:
|
•
|
Secure Seniors.
This segment represents approximately 15% of the current U.S. population. Because the customer segments are designed to reflect attitudes and behaviors, in addition to other factors, this segment includes a broad range in age, but is composed primarily of individuals between the ages of 55 to 70 about to retire or already in retirement, of which a majority have investible assets of greater than $500,000. Secure Seniors have higher net worth relative to the other customer segments and exhibit a strong desire to work with financial advisors. The larger share of assets, relative to the other segments, may make Secure Seniors an attractive market for financial security products and solutions.
|
8
|
•
|
Middle Aged Strivers.
This segment represents approximately 23% of the current U.S. population and is the largest customer segment of those identified by our survey. There is more diversity in this segment compared to the Secure Seniors in terms of amount of investible assets, age, life stage and potential lifetime value to us. The study indicates that these individuals tend to be in the early to later stages of family formation. Almost half of the population in this segment is between the ages of 40 and 55. They are focused on certain core needs, such as paying bills, reducing debt and protecting family wealth. We believe Middle Aged Strivers are an attractive market for protection products and many of these individuals will graduate to wealth and retirement products in their later years.
|
|
•
|
Diverse and Protected.
This is the most diverse segment of the population, but is also the smallest constituting only 8% of the current U.S. population. While this segment has lower income and investible assets than Secure Seniors and Middle Aged Strivers, our study indicates that they are active purchasers of insurance products. We believe that a portion of this segment, as they become older and more affluent, may purchase our annuity products in addition to our insurance products.
|
We believe that these three customer segments represent a significant portion of the market opportunity, and by focusing our product development and marketing efforts to meeting the needs of these segments we will be able to offer a targeted set of products which will benefit our expense ratio thereby increasing our profitability. Our study also indicates that Secure Seniors, Middle Aged Strivers and Diverse and Protected customer segments are open to financial guidance and, accordingly, will be receptive to the products we intend to sell and we can share our insights about these segments to our distribution partners to increase the targeting efficiency of our sales efforts with them.
|
•
|
Focused manufacturer, with a simpler product suite designed to meet our customers’ and distributors’ needs.
We intend to be financially disciplined in terms of the number of products which we offer and their risk-adjusted return profile, while being responsive to the needs of our customers and distribution partners.
|
|
•
|
We seek to manage our existing book of annuity business to mitigate the effects of severe market downturns and other economic effects on our statutory capital while preserving the ability to benefit from positive changes in equity markets and interest rates through our selection of derivative instruments.
|
|
•
|
We intend to offer products designed to produce statutory distributable cash flows on a more accelerated basis than those of some of our legacy in-force products. We will also focus on offering products which are more capital efficient than our pre-2013 generation of products. Our product design and sales strategies will focus on achieving long-term risk-adjusted distributable cash flows, rather than generating sales volumes or purchasing market share. We believe this approach aligns well with long-term value creation for our shareholders.
|
|
•
|
Our suite of structured annuities consists of products marketed under various names (collectively, “Shield Annuities”) and were introduced to respond to market downturns and consumer demands without compromising our risk-adjusted return hurdles. Shield Annuities provide contract holders with a specified level of market downside protection, sharing the balance of market downside risk with the contract holder, along with offering the contract holder tax-deferred accumulation.
|
|
•
|
Independent distribution with enhanced support and collaboration with key distributors.
We believe that the completion of our transition from having both a captive sales force and third-party distributors to that of exclusively leveraging a diverse network of independent distributors will focus our distribution efforts and improve our profitability and capital efficiency.
|
|
•
|
We have proactively chosen to focus on independent distribution, which we believe aligns with our focus on product manufacturing. We believe distributing our products through only the independent distribution channel will enhance our ability to control our fixed costs, target our resources more appropriately and increase our profitability because we will be better able to leverage our product development and wholesale distribution capabilities.
|
|
•
|
Since 2001, we have successfully built third-party distribution relationships. Following the sale of MPCG to MassMutual, we are dedicated to supporting and expanding these relationships. We seek to become a leading provider of insurance and annuity products for our leading distribution partners by leveraging our marketing strengths which include customer segmentation, distribution servicing and sales support, as well as, our product management competencies. We believe that our distribution strategy will result in deeper relationships with these distribution partners.
|
|
•
|
As part of our collaborative approach with key distributors to leverage our product design expertise through tailored product arrangements, we launched a fixed index annuity (“FIA”) with MassMutual in July 2017. As part of our relationship with MassMutual, we’ve entered into a joint‑wholesaling agreement, aimed at providing MassMutual’s distribution channels, primarily career agency advisors, with easy access to product knowledge coverage.
|
9
|
•
|
Maintain strong statutory capitalization through an exposure management program intended to be effective across market environments.
|
|
•
|
The principal objective of our exposure management programs is to manage the risk to our statutory capitalization resulting from changes to equity markets and interest rates. This permits us to focus on the management of the long-term statutory distributable cash flow profile of our business and the underlying long-term returns of our product guarantees. See “
— Risk Management Strategies
.”
|
|
•
|
Our variable annuity exposure management program has four components:
|
|
•
|
We intend to support our variable annuities with assets consistent with those required at a CTE95 standard. At December 31, 2017, we held approximately $2.6 billion of assets in excess of CTE95, which would be equivalent to holding assets at greater than a CTE98 standard as of such date. We believe these excess assets will permit us to absorb modest losses, which may be temporary, from changes in equity markets and interest rates without adversely affecting our financial strength ratings.
|
|
•
|
We will continue to enter into derivative instruments to offset the impact on our statutory capital from more significant changes to equity markets and interest rates.
|
|
•
|
We believe the earnings from our large and seasoned block of in-force business will provide an additional means of increasing and regenerating our statutory capital organically to the extent it may have been eroded due to periodic changes in equity markets and interest rates.
|
|
•
|
We intend to invest a portion of the assets supporting our variable annuity asset requirements in income-generating investments, which we believe will provide an additional means to increase or regenerate our statutory capital.
|
|
•
|
We have a large in-force block of life insurance policies and annuity contracts that we actively manage to improve profitability, prudently minimize exposures, grow cash margins and release capital for shareholders in the medium to long-term.
|
|
•
|
Focus on operating cost and flexibility.
A key element of our strategy is to leverage our infrastructure over time to be a lean, flexible, cost-competitive operator.
|
|
•
|
We will continue our focus on reducing our cost base while maintaining strong service levels for our policyholders and contract holders. As part of separating our business processes and systems from MetLife, we are taking a phased approach to re-engineering our processes and systems across all functional areas. This phased transition is expected to occur over the coming few years. We are planning on run-rate operating cost reductions as part of this initiative.
|
|
•
|
We have identified and are actively pursuing several initiatives that we expect will make our business less complex, more flexible and better able to adapt to changing market conditions. Consistent with this strategy, MetLife sold MPCG to MassMutual, completing our transition to a more efficient acquisition cost distribution model and reducing its former Retail segment employee base by approximately 5,900 employees.
|
|
•
|
We intend to leverage emerging technology and outsourcing arrangements to become more profitable. Examples of this include our decision to outsource the administration of new business and certain in-force policies to DXC.
|
Segments and Corporate & Other
The Company is organized into three segments: two ongoing business segments, Annuities and Life, and the Run-off segment. In addition, the Company reports certain of its results of operations in Corporate & Other.
10
The following table presents the relevant contributions of each of our segments to our net income (loss) and
adjusted earnings
, for our ongoing business and for the total Company:
|
Years Ended December 31,
|
||||||||||||
|
2017
|
2016
|
2015
|
||||||||||
|
(In millions)
|
||||||||||||
|
Annuities
|
$
|
1,017
|
|
$
|
1,152
|
|
$
|
1,089
|
|
|||
|
Life
|
16
|
|
26
|
|
20
|
|
||||||
|
Total ongoing business
|
1,033
|
|
1,178
|
|
1,109
|
|
||||||
|
Run-off
|
104
|
|
(539
|
)
|
468
|
|
||||||
|
Corporate & Other
|
(217
|
)
|
47
|
|
(36
|
)
|
||||||
|
Total adjusted earnings
|
920
|
|
686
|
|
1,541
|
|
||||||
|
Adjustments:
|
||||||||||||
|
Net investment gains (losses)
|
(28
|
)
|
(78
|
)
|
7
|
|
||||||
|
Net derivative gains (losses)
|
(1,620
|
)
|
(5,851
|
)
|
(326
|
)
|
||||||
|
Other adjustments
|
(564
|
)
|
357
|
|
(332
|
)
|
||||||
|
Provision for income tax (expense) benefit
|
914
|
|
1,947
|
|
229
|
|
||||||
|
Net income (loss)
|
$
|
(378
|
)
|
$
|
(2,939
|
)
|
$
|
1,119
|
|
|||
The following table presents the total assets for each of our segments and Corporate & Other:
|
December 31,
|
||||||||
|
2017
|
2016
|
|||||||
|
(In millions)
|
||||||||
|
Annuities
|
$
|
154,667
|
|
$
|
152,146
|
|
||
|
Life
|
$
|
18,049
|
|
$
|
17,150
|
|
||
|
Run-off
|
$
|
36,824
|
|
$
|
40,007
|
|
||
|
Corporate & Other
|
$
|
14,652
|
|
$
|
12,627
|
|
||
The following table presents our assets under management by segment and Corporate & Other, which we define as our general account investments and our separate account assets.
|
December 31, 2017
|
December 31, 2016
|
|||||||||||||||||||||||
|
Investments
|
Separate Accounts
|
Total
|
Investments
|
Separate Accounts
|
Total
|
|||||||||||||||||||
|
(In millions)
|
||||||||||||||||||||||||
|
Annuities
|
$
|
37,606
|
|
$
|
109,888
|
|
$
|
147,494
|
|
$
|
38,716
|
|
$
|
104,855
|
|
$
|
143,571
|
|
||||||
|
Life
|
9,216
|
|
5,250
|
|
14,466
|
|
7,303
|
|
4,704
|
|
12,007
|
|
||||||||||||
|
Run-off
|
29,595
|
|
3,119
|
|
32,714
|
|
33,098
|
|
3,483
|
|
36,581
|
|
||||||||||||
|
Corporate & Other
|
5,921
|
|
—
|
|
5,921
|
|
1,516
|
|
—
|
|
1,516
|
|
||||||||||||
|
Total
|
$
|
82,338
|
|
$
|
118,257
|
|
$
|
200,595
|
|
$
|
80,633
|
|
$
|
113,042
|
|
$
|
193,675
|
|
||||||
Annuities
Overview
Annuities are used by consumers for pre-retirement wealth accumulation and post-retirement income management. The “fixed” and “variable” classifications describe generally whether we or the contract holders bear the investment risk of the assets supporting the contract, and determine the manner in which we earn profits from these products, as investment spreads for fixed products or as asset-based fees charged to variable products. Index-linked annuities allow the contract holder to participate in returns from equity indices and, in the case of Shield Annuities, provide a specified level of market downside protection. Income annuities provide a guaranteed monthly income for a specified period of years and/or for the life of the annuitant.
11
The following table presents the insurance liabilities of our annuity products.
|
December 31, 2017
|
December 31, 2016
|
|||||||||||||||||||||||
|
General
Account (1)
|
Separate
Account
|
Total
|
General
Account (1)
|
Separate
Account
|
Total
|
|||||||||||||||||||
|
(In millions)
|
||||||||||||||||||||||||
|
Variable
|
$
|
5,111
|
|
$
|
109,795
|
|
$
|
114,906
|
|
$
|
5,444
|
|
$
|
104,784
|
|
$
|
110,228
|
|
||||||
|
Fixed Deferred
|
13,067
|
|
—
|
|
13,067
|
|
13,523
|
|
—
|
|
13,523
|
|
||||||||||||
|
Shield Annuities
|
5,428
|
|
—
|
|
5,428
|
|
3,043
|
|
—
|
|
3,043
|
|
||||||||||||
|
Income
|
4,451
|
|
93
|
|
4,544
|
|
4,450
|
|
71
|
|
4,521
|
|
||||||||||||
|
Total
|
$
|
28,057
|
|
$
|
109,888
|
|
$
|
137,945
|
|
$
|
26,460
|
|
$
|
104,855
|
|
$
|
131,315
|
|
||||||
_______________
|
(1)
|
Excludes liabilities for guaranteed minimum benefits (“GMxBs”) and Shield Annuity embedded derivatives.
|
The following table presents the relevant contributions of our annuity products to our annualized new premium (“ANP”):
|
Years Ended December 31,
|
||||||||||||
|
2017
|
2016
|
2015
|
||||||||||
|
(In millions)
|
||||||||||||
|
Variable
|
$
|
137
|
|
$
|
231
|
|
$
|
397
|
|
|||
|
Fixed (1)
|
49
|
|
61
|
|
105
|
|
||||||
|
Shield Annuities
|
248
|
|
166
|
|
91
|
|
||||||
|
Total
|
$
|
434
|
|
$
|
458
|
|
$
|
593
|
|
|||
_______________
|
(1)
|
Includes deferred, income and indexed annuities as described below.
|
We seek to meet our risk-adjusted return objectives in our Annuities segment through a disciplined risk-selection approach and innovative product design, balancing bottom line profitability with top line growth, while remaining focused on margin preservation. Our underwriting approach and product design take into account numerous criteria, including evolving consumer demographics and macroeconomic market conditions, offering a suite of products tailored to respond to external factors without compromising internal constraints. As an example, between 2011 and 2016 we reduced our ANP of our variable annuity contracts by approximately 90%. Beginning in 2013, we began to shift our new annuity business towards products with diversifying market and contract holder behavioral risk attributes and improved risk-adjusted cash returns. Examples of this include transitioning from the sale of variable annuities with guaranteed minimum income benefits (“GMIB”) to the sale of variable annuities with guaranteed minimum withdrawal benefits (“GMWB”), and our increased emphasis on our Shield Annuities, for which we had new deposits of approximately $2.5 billion and $1.7 billion for the years ended December 31, 2017 and 2016. We believe we have the product design capabilities and distribution relationships to permit us to design and offer new products meeting our risk-adjusted return requirements. We believe these capabilities will enhance our ability to maintain market presence and relevance over the long-term. We intend to meet our risk management objectives by continuing to hedge market risks associated with our existing annuity products, as well as new business. See “— Risk Management Strategies — Variable Annuity Statutory Reserving Requirements and Exposure Management.”
Current Products
Our Annuities segment product offerings include fixed, variable, structured and income annuities (each as described below) and are designed to address customer needs for tax-deferred asset accumulation and retirement income and their wealth-protection concerns. Under our variable annuities, the contract holder can choose to invest his or her purchase payments in either the separate account or general account investment options under the contract. For the separate account options, the contract holder can elect among several internally and externally managed subaccounts offered at that time. For the general account options, Brighthouse credits the contract’s account value with the net purchase payment and credits interest to the contract holder at rates declared periodically, subject to a guaranteed minimum crediting rate. Some of our annuity products are immediate income annuities, for which the contract holder can choose to receive periodic income payments beginning within 13 months after the first purchase payment is received. Our other annuities are known as deferred annuities, for which the contract holder may defer beginning periodic income payments until a later date. In 2013, we began a shift in our business towards products with lower guaranteed minimum crediting rates, variable annuity products with less risky living benefits
12
and increased emphasis on index-linked annuity products. Since 2014, our new sales have primarily focused on variable annuities with simplified living benefits and Shield Annuities. As a separate, publicly traded company, we believe we can continue to innovate in response to customer and distributer needs and market conditions.
Fixed Deferred Annuities
In contrast to variable annuities, where contract holders can invest in both equity and debt instruments and bear risk of loss of their investment, fixed annuities address asset accumulation needs by offering an interest crediting rate that we declare from time to time, subject to a guaranteed minimum rate, and providing a guarantee related to the preservation of principal and interest credited. Purchase payments under deferred fixed annuity contracts are allocated to our general account and are credited with interest at rates we determine, subject to specified guaranteed minimums. Credited interest rates are guaranteed for at least one year. To protect from premature withdrawals, we impose surrender charges. Surrender charges are typically applicable during the early years of the annuity contract, with a declining level of surrender charges over time. We expect to earn a spread between what we earn on the underlying general account investments supporting the fixed annuity product line and what we credit to our fixed annuity contract holders’ accounts. Surrender charges allow us to recoup amounts we expended to initially market and sell such annuities.
Approximately 90% of our fixed annuities have a remaining surrender charge of 2% or less.
We launched a FIA with MassMutual in July 2017. The FIA is a single premium fixed indexed annuity designed for growth that credits interest based on the annual performance of an index. Additionally, an optional living benefit rider is available for an additional charge, designed to provide guaranteed lifetime withdrawals.
Structured Annuities
This family of structured annuities combines certain features similar to variable and fixed annuities. Shield Annuities are a suite of single premium deferred annuity contracts that provides for accumulation of retirement savings and is intended for retirement or other long-term investment purposes. These index-linked annuities we currently offer provide the ability for the contract holder to participate in the appreciation of certain financial markets up to a stated level (i.e., a “cap”), while offering protection from a portion of declines in the applicable indices or benchmark (i.e., a “shield” or “protection level”) unlike a variable annuity, which typically passes through the performance of the relevant separate account assets. Rather than allocating purchase payments directly into the equity market, the customer has an opportunity to participate in the returns of a particular market index, such as the Standard & Poor’s Global Ratings (“S&P”) 500, for a specified term. The contract is credited interest based on the performance of that index over a period of time, with certain parameters on the maximum level of performance as of the end of the selected term, as well as protection from losses up to a specified level. The reserve assets are held in a book value non-unitized separate account, but the issuing insurance company is obligated to pay distributions and benefits irrespective of the value of the separate account assets. Interest is calculated based on parameters that are periodically declared by us for both the initial and subsequent periods. Shield Annuities offer account value and return of premium death benefits. Shield Annuities are included with variable annuities in our statutory reserve requirements and CTE estimates.
Income Annuities
Income annuities are annuity contracts under which the contract holder contributes a portion of their retirement assets in exchange for a steady stream of retirement income, lasting either for a specified period of time or as long as the life of the annuitant.
We offer two types of income annuities: immediate income annuities, referred to as “single premium immediate annuities” (“SPIAs”) and deferred income annuities (“DIAs”). Both products provide guaranteed lifetime income that can be used to supplement other retirement income sources. SPIAs are single premium annuity products that provide a guaranteed level of income to the contract holder for a specified number of years or the duration of the life of the annuitant(s) beginning during the first 13 months (in certain products longer) from the SPIA’s start date. DIAs differ from SPIAs in that they require the contract holder to wait at least 15 months before starting income payments. If a contract holder makes multiple purchase payments on the DIA to build pension-like income over time, each payment will restart the waiting period. SPIAs and DIAs are priced based on considerations consistent with the annuitant’s age, gender and, in the case of DIAs, the deferral period. DIAs provide a pension-like stream of income payments after a specified deferral period. DIAs are flexible premium payment products that guarantee a specified amount of income, based on the contract holder’s age, gender and deferral period. Income annuities offered currently allow level or increasing income payments, as well as optional guaranteed death benefits.
Variable Annuities
We issue variable annuity contracts that offer contract holders a tax-deferred basis for wealth accumulation and rights to receive a future stream of payments. The contract holder can choose to invest his or her purchase payments in the separate
13
account or, if available, the general account investment options under the contract. For the separate account options, the contract holder can elect among several subaccounts that invest in internally and externally managed investment portfolios offered at that time, and unless the contract holder has elected to pay additional amounts for guaranteed minimum living or death benefits, as discussed below, the contract holder bears the entire risk and receives all of the net returns resulting from the variable investment option chosen. For the general account options, Brighthouse credits the contract’s account value with the net purchase payment and credits interest to the contract holder at rates declared periodically, subject to a guaranteed minimum crediting rate. The account value of most types of general account options is guaranteed and is not exposed to market risk, because the insurance company rather than the contract holder directly bears the risk that the value of the underlying general account investments of the insurance companies may decline. At December 31, 2017, our variable annuity total account value was $114.9 billion, consisting of $109.8 billion of contract holder separate account assets and $5.1 billion of contract holder general account assets.
The majority of the variable annuities we have issued have GMxBs, which we believe make these products attractive to our customers in periods of economic uncertainty. These GMxBs must be chosen by the contract holder no later than at the issuance of the contract. The primary types of GMxBs are those that guarantee death benefits payable upon the death of a contract holder (“GMDBs”) and those that guarantee benefits payable while the contract holder or annuitant is alive (“GMLBs”). There are three primary types of GMLBs: GMIBs, GMWBs, and guaranteed minimum accumulation benefits (“GMABs”). We ceased issuing GMIBs for new purchase in February 2016.
In addition to our directly written business, we also previously assumed from MetLife certain GMxBs pursuant to a coinsurance agreement that was fully recaptured by M
etLife in January 2017. For comparative purposes, the tables below do not reflect historical balances for GMxB business recaptured by MetLife.
The guaranteed benefit received by a contract holder pursuant to the GMxBs is calculated based on the benefit base (“Benefit Base”). The calculation of the Benefit Base varies by benefit type and may differ in value from the contract holder’s account value for the following reasons:
|
•
|
The Benefit Base is defined to exclude the effect of a decline in the market value of the contract holder’s account value. By excluding market declines, actual claim payments to be made in the future to the contract holder will be determined without giving effect to equity market declines.
|
|
•
|
The terms of the Benefit Base may allow it to increase at a guaranteed rate irrespective of the rate of return on the contract holder’s account value.
|
|
•
|
The Benefit Base may also increase with subsequent purchase payments, after the initial purchase payment made by the contract holder at the issuance of the contract, or at the contract holder’s election with an increase in the account value due to market performance.
|
GMxBs provide the contract holder with protection against the possibility that a downturn in the markets will reduce the certain specified benefits that can be claimed under the contract. The principal features of our in-force block of variable annuity contracts with GMxBs are as follows:
|
•
|
GMDBs, a contract holder’s beneficiaries are entitled to the greater of (a) the account value or (b) the Benefit Base upon the death of the annuitant;
|
|
•
|
GMIBs, a contract holder is entitled to annuitize the policy after a specified period of time and receive a minimum amount of lifetime income based on pre-determined payout factors and the Benefit Base, which could be greater than the account value;
|
|
•
|
GMWBs, a contract holder is entitled to withdraw each year a maximum amount of their Benefit Base, which could be greater than the underlying account value; and
|
|
•
|
GMABs, a contract holder is entitled to a percentage of the Benefit Base, which could be greater than the account value, after the specified accumulation period, regardless of actual investment performance.
|
Variable annuities may have more than one GMxB. Variable annuities with a GMLB may also have a GMDB. Additional detail concerning our GMxBs is provided in “— Risk Management Strategies — Variable Annuity Statutory Reserving Requirements and Exposure Management.”
14
Variable Annuity Fees
The following table presents the fees and charges we earn on our variable annuity contracts invested in separate accounts, by type of fee:
|
Years Ended December 31,
|
||||||||
|
2017
|
2016
|
|||||||
|
(In millions)
|
||||||||
|
Mortality & Expense Fees and Administrative Fees
|
$
|
1,532
|
|
$
|
1,495
|
|
||
|
Surrender Charges
|
27
|
|
29
|
|
||||
|
Investment Management Fees (1)
|
247
|
|
244
|
|
||||
|
12b-1 Fees and Other Revenue (1)
|
271
|
|
284
|
|
||||
|
Death Benefit Rider Fees
|
213
|
|
214
|
|
||||
|
Living Benefit Riders Fees
|
937
|
|
947
|
|
||||
|
Total
|
$
|
3,227
|
|
$
|
3,213
|
|
||
_______________
|
(1)
|
These fees are net of pass through amounts.
|
For the account value on contracts that invest through a separate account, we earn various types of fee revenue based on account value, fund assets and Benefit Base. In general, GMxB fees calculated based on the Benefit Base are more stable in market downturns compared to fees based on the account value.
Mortality & Expense Fees and Administrative Fees.
We earn mortality and expense fees (“M&E Fees”), as well as administrative fees on variable annuity contracts. The M&E Fees are calculated based on the portion of the contract holder’s account value allocated to the separate accounts and are expressed as an annual percentage deducted daily. These fees are used to offset the insurance and operational expenses relating to our variable annuity contracts. Additionally, the administrative fees are charged either based on the daily average of the net asset values in the subaccounts or when contracts fall below minimum values based on a flat annual fee per contract.
Surrender Charges.
Most, but not all, variable annuity contracts depending on their share class may also impose surrender charges on withdrawals for a period of time after the purchase and in certain products for a period of time after each subsequent deposit, also known as the surrender charge period. A surrender charge is a deduction of a percentage of the contract holder’s account value prior to distribution to him or her. Surrender charges generally decline gradually over the surrender charge period, which can range from zero to 10 years. Our variable annuity contracts typically permit contract holders to withdraw up to 10% of their account value each year without any surrender charge, although their guarantees may be significantly impacted by such withdrawals. Contracts may also specify circumstances when no surrender charges apply, for example, upon payment of a death benefit.
The following table presents account value by remaining surrender charge:
|
Variable Annuities (1)
|
||||||||
|
2017
|
2016
|
|||||||
|
(In billions)
|
||||||||
|
0%
|
$
|
65.3
|
|
$
|
55.8
|
|
||
|
>0 to 2%
|
29.6
|
|
23.3
|
|
||||
|
>2% to 4%
|
14.2
|
|
22.7
|
|
||||
|
>4% to 6%
|
4.8
|
|
6.2
|
|
||||
|
>6%
|
6.7
|
|
5.1
|
|
||||
|
Total
|
$
|
120.6
|
|
$
|
113.1
|
|
||
_______________
|
(1)
|
Shield Annuities are included with variable annuities.
|
Investment Management Fees.
We charge investment management fees for managing the proprietary mutual funds managed by our subsidiary Brighthouse Investment Advisers, LLC (“Brighthouse Advisers”) that are offered as investments under the variable annuities. Investment management fees are also paid on the non-proprietary funds managed by investment advisors unaffiliated with us, to the unaffiliated investment advisors. Investment management fees differ by fund. A portion
15
of the investment management fees charged on proprietary funds managed by subadvisors unaffiliated with us are paid by us to the subadvisors. Investment management fees reduce the net returns on the variable annuity investments
.
12b-1 Fees and Other Revenue.
12b-1 fees are paid by the mutual funds which our contract holders chose to invest in and are calculated based on the net assets of the funds allocated to our subaccounts. These fees reduce the returns contract holders earn from these funds. Additionally, mutual fund companies with funds which are available to contract holders through the variable annuity subaccounts pay us fees consistent with the terms of administrative service agreements. These fees are funded from the fund companies’ net revenues.
Death Benefit Rider Fees.
W
e may earn fees in addition to the base mortality and expense fees for promising to pay GMDBs. The fees earned vary by generation and rider type. For some death benefits, the fees are calculated based on account value, but for enhanced death benefits (“EDBs”), the fees are normally calculated based on the Benefit Base. In general, these fees were set at a level intended to be sufficient to cover the anticipated expenses of covering claim payments and hedge costs associated with these benefits. These fees are deducted from the account value.
Living Benefit Riders Fees.
We earn these fees for promising to pay guaranteed benefits while the contract holder is alive, such as for any type of GMLB (including GMIBs, GMWBs and GMABs). The fees earned vary by generation and rider type and are calculated based on the Benefit Base and deducted from account value. Generally, these fees are set at a level intended to be sufficient to cover the anticipated expenses of covering claim payments and hedge costs associated with these benefits.
In addition to fees, we also earn a spread on the portion of the account value allocated to the general account.
Pricing and Risk Selection
Product pricing reflects our pricing standards and guidelines. Annuities are priced based on various factors, which may include investment returns, expenses, persistency, longevity, policyholder behavior, equity market returns, and interest rate scenarios.
Rates for annuity products are highly regulated and generally the forms of which must be approved by the regulators of the jurisdictions in which the product is sold. The offer and sale of variable annuity products are regulated by the SEC. Generally, these products include pricing terms that are guaranteed for a certain period of time. Such products generally include surrender charges for early withdrawals and fees for guaranteed benefits. We periodically reevaluate the costs associated with such guarantees and may adjust pricing levels accordingly. Further, from time to time, we may also reevaluate the type and level of guarantee features being offered. See “Management’s Discussion and Analysis of Financial Condition and Results of Operations — Summary of Critical Accounting Estimates.”
We continually review our pricing guidelines in light of applicable regulations and to ensure that our policies remain competitive and supportive of our marketing strategies and profitability goals.
Evolution of our Variable Annuity Business
Our in-force variable annuity block reflects a wide variety of product offerings within each type of guarantee, reflecting the changing nature of these products over the past two decades. The changes in product features and terms over time are driven partially by customer demand but also reflect our continually refined evaluation of the guarantees, their expected long-term claims costs and the most effective market risk management strategies in the prevailing market conditions.
We introduced our variable annuity product over 50 years ago and began offering GMIBs, which were our first living benefit riders, in 2001. The design of our more recent generations of GMIBs have been modified to reduce payouts in certain circumstances. Beginning in 2009, we reduced the minimum payments we guaranteed if the contract holder were to annuitize; in 2012 we began to reduce the guaranteed portion of account value up to a percentage of the Benefit Base (“roll-up rates”); and, after first reducing the maximum equity allocation in separate accounts, in 2011 we introduced managed volatility funds for all our GMLBs. We ceased offering GMIBs for new purchase in February 2016 and to the extent permitted, we have suspended subsequent premium payments on all but our final generation of GMIBs.
While we added GMWBs to our variable annuity product suite in 2003, we shifted our marketing focus from GMIBs to GMWBs in 2015 with the release of FlexChoice
SM
, a GMWB with lifetime payments (“GMWB4L”). In the first quarter of 2018, we launched an updated version of FlexChoice
SM
, “Flex Choice Access” to provide financial advisors and their clients more investment flexibility.
In 2013, we introduced Shield Annuities, which generated approximately $2.5 billion, $1.7 billion and $0.9 billion of new deposits for the years ended December 31, 2017, 2016 and 2015, respectively, representing 64%, 41% and 19% of our annuity deposits for the years ended December 31, 2017, 2016 and 2015, respectively. We intend to increase sales of Shield Annuities due to growing consumer demand for the products. In addition, we believe that Shield Annuities may provide us
16
with risk offset to the GMxBs offered in our traditional variable annuity products. As of December 31, 2017, there was $5.4 billion of policyholder account balances for Shield Annuities.
With the goal of continuing to diversify and better manage our in-force block, in the future we intend to focus on selling the following products:
|
•
|
variable annuities with GMWBs;
|
|
•
|
variable annuities without GMLBs; and
|
|
•
|
Shield Annuities.
|
The table below presents our variable and Shield Annuity deposits and ANP.
|
Deposits
|
Annual New Premium
|
|||||||||||||||||||||||
|
|
Years Ended December 31,
|
Years Ended December 31,
|
||||||||||||||||||||||
|
2017
|
2016
|
2015
|
2017
|
2016
|
2015
|
|||||||||||||||||||
|
|
(In millions)
|
|||||||||||||||||||||||
|
GMIB
|
$
|
155
|
|
$
|
356
|
|
$
|
859
|
|
$
|
15
|
|
$
|
36
|
|
$
|
86
|
|
||||||
|
GMWB (1)
|
812
|
|
1,317
|
|
1,869
|
|
81
|
|
132
|
|
187
|
|
||||||||||||
|
GMAB (1)
|
—
|
|
54
|
|
509
|
|
—
|
|
5
|
|
51
|
|
||||||||||||
|
GMDB only
|
408
|
|
574
|
|
705
|
|
41
|
|
58
|
|
73
|
|
||||||||||||
|
Shield Annuities
|
2,475
|
|
1,655
|
|
905
|
|
248
|
|
166
|
|
91
|
|
||||||||||||
|
Total
|
$
|
3,850
|
|
$
|
3,956
|
|
$
|
4,847
|
|
$
|
385
|
|
$
|
397
|
|
$
|
488
|
|
||||||
_______________
|
(1)
|
The decline in sales of GMWBs and GMABs is driven by the suspension of sales by Fidelity in 2016.
|
We describe below in more detail the product features and relative account values, Benefit Base and net amount at risk (“NAR”) for our death benefit and living benefit guarantees.
Guaranteed Death Benefits
Since 2001, we have offered a variety of GMDBs to our contract holders, which include the following (with no additional charge unless noted):
|
•
|
Account Value Death Benefit.
The Account Value Death Benefit returns the account value at the time of the claim with no imposition of surrender charges at the time of the claim.
|
|
•
|
Return of Premium Death Benefit.
The Return of Premium Death Benefit, also referred to as Principal Protection, comes standard with many of our base contracts and pays the greater of the contract holder’s account value at the time of the claim or their total purchase payments, adjusted proportionately for any withdrawals.
|
|
•
|
Interval Reset.
The Reset Death Benefit enables the contract holder to lock in their guaranteed death benefit on the interval anniversary date with this level of death benefit being reset (either up or down) on the next interval anniversary date. This may only be available through a maximum age. This death benefit pays the greater of the contract holder’s account value at the time of the claim, their total purchase payments, adjusted proportionately for any withdrawals, or the interval reset value, adjusted proportionally for any withdrawals. We no longer offer this guarantee.
|
|
•
|
Annual Step-Up Death Benefit.
Contract holders may elect, for an additional fee, the option to step up their guaranteed death benefit on any contract anniversary through age 80. The Annual Step-Up Death Benefit allows for the contract holder to lock in the high water mark on their death benefit adjusted proportionally for any withdrawals. This death benefit may only be elected at issue through age 79. Fees charged for this benefit are usually based on account value. This death benefit pays the greater of the contract holder’s account value at the time of the claim, their total purchase payments, adjusted proportionately for any withdrawals, or the highest anniversary value, adjusted proportionally for any withdrawals.
|
|
•
|
Combination Death Benefit.
Contract holders may elect, for an additional fee, a combination death benefit that, in addition to the Annual Step-Up Death Benefit as described above, includes a roll-up feature which accumulates aggregate purchase payments at a predetermined roll-up rate, as adjusted for withdrawals. Descriptions of the two principal versions of this guaranteed death benefit are as follows:
|
17
|
•
|
Compounded-Plus Death Benefit.
The death benefit is the greater of (i) the account value at time of the claim, (ii) the highest anniversary value (highest anniversary value/high water mark through age 80, adjusted proportionately for any withdrawals) or (iii) a roll-up Benefit Base, which rolls up through age 80, and is adjusted proportionally for withdrawals. Fees for this benefit are calculated and charged against the account value. We stopped offering this rider in 2013.
|
|
•
|
Enhanced Death Benefit.
The death benefit is equal to the Benefit Base which is defined as the greater of (i) the highest anniversary value Benefit Base (highest anniversary value/high water mark through age 80, adjusted proportionately for any withdrawals) or (ii) a roll-up benefit, which may apply to the step-up (rollup applies through age 90), which allows for dollar-for-dollar withdrawals up to the permitted amount for that contract year and proportional adjustments for withdrawals in excess of the permitted amount. The fee may be increased upon step-up of the roll-up Benefit Base. Fees charged for this benefit are calculated based on the Benefit Base and charged annually against the account value. We stopped offering this rider on a stand-alone basis in 2011.
|
In addition, we currently also offer an optional death benefit for an additional fee with our FlexChoice
SM
GMWB4L riders, available at issue through age 65, which has a similar level of death benefit protection as the Benefit Base for the living benefit rider. However, the Benefit Base for this death benefit is adjusted for all withdrawals.
The table below presents the breakdown of variable annuity guarantee account value and Benefit Base for the above described GMDBs at:
|
|
December 31, 2017 (1)
|
December 31, 2016 (1)
|
||||||||||||||
|
|
Account Value
|
Benefit Base
|
Account Value
|
Benefit Base
|
||||||||||||
|
|
(In millions)
|
|||||||||||||||
|
Account value / other
|
$
|
3,320
|
|
$
|
2,757
|
|
$
|
3,180
|
|
$
|
3,194
|
|
||||
|
Return of premium
|
50,892
|
|
51,333
|
|
49,018
|
|
49,137
|
|
||||||||
|
Interval reset
|
5,917
|
|
6,133
|
|
5,598
|
|
5,643
|
|
||||||||
|
Annual step-up
|
23,835
|
|
24,211
|
|
22,863
|
|
23,200
|
|
||||||||
|
Combination Death Benefit (2)
|
31,184
|
|
35,371
|
|
29,859
|
|
35,179
|
|
||||||||
|
Total
|
$
|
115,148
|
|
$
|
119,805
|
|
$
|
110,518
|
|
$
|
116,353
|
|
||||
_______________
|
(1)
|
Many of our annuity contracts offer more than one type of guarantee such that death benefit guarantee amounts listed above are not mutually exclusive to the amounts in the GMLBs table below.
|
|
(2)
|
Combination Death Benefit includes Compounded-Plus Death Benefit, Enhanced Death Benefit, and FlexChoice
SM
death benefit.
|
Guaranteed Living Benefits
Our in-force block of variable annuities consists of three varieties of GMLBs, including variable annuities with GMIBs, GMWBs and GMABs. Since 2001, we have offered a variety of guaranteed living benefit riders to our contract holders. Based on total account value, approximately 80% of our variable annuity block included living benefit guarantees at December 31, 2017 and 2016, respectively.
GMIBs.
GMIBs are our largest block of living benefit guarantees based on in-force account value. Contract holders must wait for a defined period, usually 10 years, before they can elect to receive income through guaranteed annuity payments. This initial period when the contract holder invests their account value in the separate and/or general account to grow on a tax-deferred basis is often referred to as the accumulation phase. The contract holder may elect to continue the accumulation phase beyond the waiting period in order to maintain access to their account value or continue to participate in the potential growth of both the account value and Benefit Base pursuant to the contract terms. During the accumulation phase, the contract holder still has access to his or her account value through the following choices, although their Benefit Base may be adjusted downward consistent with these choices:
|
•
|
Partial surrender or withdrawal to a maximum specified amount each year (typically 10% of account value). This action does not trigger surrender charges, but the Benefit Base is adjusted downward depending on the contract terms;
|
18
|
•
|
Full surrender or lapse of the contract, with the net proceeds paid to the contract holder being the then prevailing account value less surrender charges defined in the contract; or
|
|
•
|
Limited “Dollar-for-Dollar Withdrawal” from the account value as described in the paragraph below.
|
The second phase of the contract starts upon annuitization. The occurrence and timing of annuitization depends on how contract holders choose to utilize the multiple benefit options available to them in their annuity contract. Below are examples of contract holder benefit utilization choices that can affect benefit payment patterns and reserves:
|
•
|
Lapse.
The contract holder may lapse or exit the contract at which time all GMxB guarantees are canceled. If he or she partially exits, the GMxB Benefit Base may be reduced in accordance with the contract terms.
|
|
•
|
Use of Guaranteed Principal Option after waiting period.
For certain GMIB contracts issued since 2005, the contract holder has the option to receive a lump sum return of initial premium less withdrawals (the Benefit Base does not apply) in exchange for cancellation of the GMIB optional benefit.
|
|
•
|
Dollar-for-Dollar Withdrawal.
The contract holder may, in any year, withdraw, without penalty and regardless of the underlying account value, a portion of his or her account value up to a percentage of the Benefit Base (“roll-up rate”). The withdrawal reduces the contract holder’s Benefit Base “dollar-for-dollar.” If making such withdrawals in combination with market movements reduces the account value to zero, the contract may have an automatic annuitization feature, which entitles the contract holder to receive a stream of lifetime (with period certain) annuity payments based on a variety of factors, including the Benefit Base, the age and gender of the annuitant, and predetermined annuity interest rates and mortality rates. The Benefit Base depends on the contract terms, but the majority of our in-force has a greater of roll-up or step-up combination Benefit Base similar to the roll-up and step-up Benefit Base described above in “— Guaranteed Death Benefits.” Any withdrawal greater than the roll-up rate would result in a penalty which may be a proportional reduction in the Benefit Base.
|
|
•
|
Elective Annuitization.
The contract holder may elect to annuitize the account value or exercise the guaranteed annuitization under the GMIB. The guaranteed annuitization entitles the contract holder to receive a stream of lifetime (with period certain) annuity payments based on the same factors that would be used as if the contract holder elected to annuitize.
|
|
•
|
Do nothing.
If the contract holder elects to continue to remain in the accumulation phase past the maximum age for electing annuitization under the GMIB and the account value has not depleted to zero, then the contract will continue as a variable annuity with a death benefit. The Benefit Base for the death benefit may be the same as the Benefit Base for the GMIB.
|
Contract holder behaviors around choosing a particular option cannot be predicted with certainty at the time of contract issuance or thereafter. The incidents and timing of benefit elections and the resulting benefit payments may materially differ from those we anticipate at the time we issue a variable annuity contract. As we observe actual contract holder behavior, we periodically update our assumptions with respect to contract holder behavior and take appropriate action with respect to the amount of the reserves we establish for the future payment of such benefits. See “Risk Factors — Risks Related to Our Business — Guarantees within certain of our products may decrease our earnings, decrease our capitalization, increase the volatility of our results, result in higher risk management costs and expose us to increased counterparty risk” and “Management’s Discussion and Analysis of Financial Condition and Results of Operations — Summary of Critical Accounting Estimates.”
We have employed several risk exposure reduction strategies at the product level. These include reducing the interest rates used to determine annuity payout rates on GMIBs from 2.5% to 0.5% over time, partially in response to the low interest rate environment. In addition, we increased the setback period used to determine the annuity payout rates for contract holders from seven years to 10 years. For example, a 10 year age setback would determine actual annuitization monthly payout rates for a contract holder assuming they were 10 years younger than their actual age at the time of annuitization, thereby reducing the monthly guaranteed annuity claim payments. We have also reduced the guarantee roll-up rates from 6% to 4%.
Additionally, we introduced limitations on fund selections inside variable annuity contracts. In 2005, we reduced the maximum equity allocation in the separate accounts. Further, in 2011 we introduced managed volatility funds to our fund offerings in conjunction with the introduction of our last generation GMIB product “Max.” Approximately 33% of the $67.1 billion and $64.5 billion of GMIB total account value as of both December 31, 2017 and 2016, was invested in managed volatility funds. The managers of these funds seek to reduce the risk of large, sudden declines in account value during market
19
downturns by managing the volatility or draw-down risk of the underlying fund holdings by re-balancing the fund holdings within certain guidelines or overlaying hedging strategies at the fund level. We believe that these risk mitigation actions at the fund level reduce the amount of hedging or reinsurance we require to manage our risks arising from guarantees we provide on the underlying variable annuity separate accounts.
GMWBs.
GMWBs have a Benefit Base that contract holders may roll up for up to 10 years. If contract holders take withdrawals early, the roll-up may be less than 10 years. This is in contrast to GMIBs, in which roll ups may continue beyond 10 years. Therefore, the roll-up period for the Benefit Base on GMWBs is typically less uncertain and is shorter than those on GMIBs. Additionally, the contract holder may receive income only through withdrawal of his or her Benefit Base. These withdrawal percentages are defined in the contract and differ by the age when contract holders start to take withdrawals. Withdrawal rates may differ if they are offered on a single contract holder or a couple (joint life). GMWBs primarily come in two versions depending on if they are period certain or if they are lifetime payments, GMWB4L. Our latest generation of GMWB4L, FlexChoice
SM
, includes the additional option to take the remaining lifetime payments in an actuarially calculated lump sum when the account value reaches zero.
GMABs
.
GMABs guarantee a minimum amount of account value to the contract holder after a set period of time, which can also include locking in capital market gains. This protects the value of the annuity from market fluctuations.
The table below presents the breakdown of our variable annuity account value and Benefit Base by type of GMLBs as of December 31, 2017 and 2016.
|
|
December 31, 2017 (1)(2)
|
December 31, 2016 (1)(2)
|
||||||||||||||
|
|
Account Value
|
Benefit Base
|
Account Value
|
Benefit Base
|
||||||||||||
|
|
(In millions)
|
|||||||||||||||
|
GMIB
|
$
|
67,110
|
|
$
|
77,460
|
|
$
|
64,505
|
|
$
|
78,797
|
|
||||
|
GMWB
|
3,357
|
|
2,564
|
|
3,374
|
|
2,858
|
|
||||||||
|
GMWB4L
|
20,379
|
|
19,998
|
|
19,208
|
|
20,302
|
|
||||||||
|
GMAB
|
737
|
|
603
|
|
697
|
|
634
|
|
||||||||
|
Total
|
$
|
91,583
|
|
$
|
100,625
|
|
$
|
87,784
|
|
$
|
102,591
|
|
||||
_______________
|
(1)
|
Many of our annuity contracts offer more than one type of guarantee such that living benefit guarantee amounts listed above are not mutually exclusive to the amounts in the GMDBs table above.
|
|
(2)
|
As of December 31, 2017 and 2016, the total account value includes investments in the general account totaling $5.1 billion and $5.5 billion, respectively.
|
Net Amount at Risk
The NAR for the GMDB is the amount of death benefit in excess of the account value (if any) as of the balance sheet date. It represents the amount of the claim we would incur if death claims were made on all contracts on the balance sheet date and includes any additional contractual claims associated with riders purchased to assist with covering income taxes payable upon death.
The NAR for the GMWB and GMAB is the amount of guaranteed benefit in excess of the account values (if any) as of the balance sheet date. The NAR assumes utilization of benefits by all contract holders as of the balance sheet date. For the GMWB benefits, only a small portion of the Benefit Base is available for withdrawal on an annual basis. For the GMAB, the NAR would not be available until the GMAB maturity date.
The NAR for the GMWB4L is the amount (if any) that would be required to be added to the total account value to purchase a lifetime income stream, based on current annuity rates, equal to the lifetime amount provided under the guaranteed benefit. For contracts where the GMWB4L provides for a guaranteed cumulative dollar amount of payments, the NAR is based on the
purchase of a lifetime with period certain income stream where the period certain ensures payment of this cumulative dollar amount. The NAR represents our potential economic exposure to such guarantees in the event all contract holders were to begin lifetime withdrawals on the balance sheet date regardless of age. Only a small portion of the Benefit Base is available for withdrawal on an annual basis.
The NAR for the GMIB is the amount (if any) that would be required to be added to the total account value to purchase a lifetime income stream, based on current annuity rates, equal to the minimum amount provided under the guaranteed benefit. This amount represents our potential economic exposure to such guarantees in the event all contract holders were to annuitize
20
on the balance sheet date, even though the guaranteed amount under the contracts may not be annuitized until after the waiting period of the contract.
The account values and NAR of contract holders by type of guaranteed minimum benefit for variable annuity contracts are summarized below.
|
December 31, 2017 (1)
|
December 31, 2016 (1)
|
||||||||||||||||||||||||||||
|
|
Account Value
|
Death Benefit NAR (1)
|
Living Benefit NAR (1)
|
% of Account Value In-the-Money (2)
|
Account Value
|
Death Benefit NAR (1)
|
Living Benefit NAR (1)
|
% of Account Value In-the-Money (2)
|
|||||||||||||||||||||
|
|
(Dollars in millions)
|
||||||||||||||||||||||||||||
|
GMIB
|
$
|
46,585
|
|
$
|
1,796
|
|
$
|
2,641
|
|
25.0
|
%
|
$
|
44,945
|
|
$
|
2,527
|
|
$
|
3,006
|
|
31.0%
|
|
|||||||
|
GMIB Max w/ Enhanced DB
|
13,035
|
|
1,850
|
|
1
|
|
0.1
|
%
|
12,461
|
|
2,407
|
|
—
|
|
<0.1%
|
|
|||||||||||||
|
GMIB Max w/o Enhanced DB
|
7,490
|
|
3
|
|
—
|
|
<0.1%
|
|
7,098
|
|
37
|
|
—
|
|
<0.1%
|
|
|||||||||||||
|
GMWB4L (FlexChoice
SM
)
|
2,351
|
|
—
|
|
1
|
|
1.0
|
%
|
1,519
|
|
9
|
|
3
|
|
5.0
|
%
|
|||||||||||||
|
GMAB
|
695
|
|
2
|
|
1
|
|
0.3
|
%
|
697
|
|
7
|
|
6
|
|
42.6%
|
|
|||||||||||||
|
GMWB
|
3,355
|
|
46
|
|
13
|
|
2.0
|
%
|
3,373
|
|
63
|
|
29
|
|
15.0%
|
|
|||||||||||||
|
GMWB4L
|
18,026
|
|
73
|
|
267
|
|
13.5
|
%
|
17,689
|
|
126
|
|
524
|
|
24.0%
|
|
|||||||||||||
|
EDB Only
|
4,020
|
|
453
|
|
—
|
|
N/A
|
|
3,814
|
|
656
|
|
—
|
|
N/A
|
|
|||||||||||||
|
GMDB Only (Other than EDB)
|
19,587
|
|
1,038
|
|
—
|
|
N/A
|
|
18,922
|
|
1,106
|
|
—
|
|
N/A
|
|
|||||||||||||
|
Total
|
$
|
115,144
|
|
$
|
5,261
|
|
$
|
2,924
|
|
$
|
110,518
|
|
$
|
6,938
|
|
$
|
3,568
|
|
|||||||||||
_______________
|
(1)
|
The “Death Benefit NAR” and “Living Benefit NAR” are not additive at the contract level.
|
|
(2)
|
In-The-Money is defined as any contract with a living benefit NAR in excess of zero.
|
Reserves
Under accounting principles generally accepted in the United States of America (“GAAP”), certain of our variable annuity guarantee features are accounted for as insurance liabilities and recorded on the balance sheet in Future Policy Benefits with changes reported in policyholder benefits and claims. These liabilities are accounted for using long term assumptions of equity and bond market returns and the level of interest rates. Therefore, these liabilities, valued at $4.1 billion as of December 31, 2017, are less sensitive than derivative instruments to periodic changes to equity and fixed income market returns and the level of interest rates. Guarantees accounted for in this manner include GMDBs, as well as the life contingent portion of GMIBs and certain GMWBs. All other variable annuity guarantee features are accounted for as embedded derivatives and recorded on the balance sheet in Policyholder Account Balances with changes reported in net derivative gains (losses). These liabilities, valued at $1.2 billion as of December 31, 2017, are accounted for at fair value. Guarantees accounted for in this manner include GMABs, GMWBs and the non-life contingent portions of GMIBs. In some cases, a guarantee will have multiple features or options that require separate accounting such that the guarantee is not fully accounted for under only one of the accounting models (known as “split accounting”). Additionally, the index protection and accumulation features of Shield Annuities are accounted for as embedded derivatives, recorded on the balance sheet in policyholder account balances with changes reported in net derivative gains (losses) and valued at $727 million as of December 31, 2017. See “Management’s Discussion and Analysis of Financial Condition and Results of Operations — Summary of Critical Accounting Estimates.”
The table below presents the GAAP variable annuity reserve balances by guarantee type and accounting model.
21
|
|
December 31, 2017
|
December 31, 2016
|
|||||||||||||||||||||
|
Future Policy Benefits
|
Policyholder Account Balances
|
Total Reserves
|
Future Policy Benefits (1)
|
Policyholder Account Balances (2)
|
Total Reserves
|
||||||||||||||||||
|
(In millions)
|
|||||||||||||||||||||||
|
GMDB
|
$
|
1,163
|
|
$
|
—
|
|
$
|
1,163
|
|
$
|
987
|
|
$
|
—
|
|
$
|
987
|
|
|||||
|
GMIB
|
2,310
|
|
1,416
|
|
3,726
|
|
2,041
|
|
2,026
|
|
4,067
|
|
|||||||||||
|
GMIB Max
|
399
|
|
(243
|
)
|
156
|
|
294
|
|
(2
|
)
|
292
|
|
|||||||||||
|
GMAB
|
—
|
|
(15
|
)
|
(15
|
)
|
—
|
|
1
|
|
1
|
|
|||||||||||
|
GMWB
|
—
|
|
18
|
|
18
|
|
—
|
|
50
|
|
50
|
|
|||||||||||
|
GMWB4L
|
277
|
|
30
|
|
307
|
|
138
|
|
268
|
|
406
|
|
|||||||||||
|
GMWB4L (FlexChoice
SM
)
|
—
|
|
5
|
|
5
|
|
—
|
|
15
|
|
15
|
|
|||||||||||
|
Total
|
$
|
4,149
|
|
$
|
1,211
|
|
$
|
5,360
|
|
$
|
3,460
|
|
$
|
2,358
|
|
$
|
5,818
|
|
|||||
_______________
|
(1)
|
Excludes $102 million of insurance liabilities assumed from a former affiliate, which were recaptured as of January 1, 2017.
|
|
(2)
|
Excludes $460 million of embedded derivatives assumed from a former affiliate, which were recaptured as of January 1, 2017.
|
The carrying values of these guarantees can change significantly during periods of sizable and sustained shifts in equity market performance, equity market volatility, or interest rates. Carrying values are also affected by our assumptions around mortality, separate account returns and policyholder behavior, including lapse, annuitization and withdrawal rates. See “Risk Factors — Risks Related to Our Business — Guarantees within certain of our products may decrease our earnings, decrease our capitalization, increase the volatility of our results, result in higher risk management costs and expose us to increased counterparty risk.” Furthermore, changes in policyholder behavior assumptions can result in additional changes in accounting estimates.
Life
Overview
Our Life segment manufactures products to serve our target segments through a broad independent distribution network. While our in-force book reflects a broad range of life products, we have focused on term life and universal life, consistent with our financial objectives, with a concentration on design and profitability over volume. By managing our in-force book of business, we expect to generate future revenue and profits for the Company. The Life segment generates profits from premiums, investment margins, expense margins, mortality margins, morbidity margins and surrender fees. We aim to maximize our profits by focusing on operational excellence and cost optimization in order to continue to reduce the cost basis and underwriting expenses. Our life insurance in-force book provides natural diversification to our Annuity segment and a source of future profits.
The following table presents the insurance liabilities of our life insurance products.
|
December 31, 2017
|
December 31, 2016
|
||||||||||||||||||||||
|
General
Account
|
Separate
Account
|
Total
|
General
Account
|
Separate
Account
|
Total
|
||||||||||||||||||
|
(In millions)
|
|||||||||||||||||||||||
|
Term
|
$
|
2,444
|
|
$
|
—
|
|
$
|
2,444
|
|
$
|
2,343
|
|
$
|
—
|
|
$
|
2,343
|
|
|||||
|
Whole
|
2,192
|
|
—
|
|
2,192
|
|
1,917
|
|
—
|
|
1,917
|
|
|||||||||||
|
Universal
|
2,052
|
|
—
|
|
2,052
|
|
2,136
|
|
—
|
|
2,136
|
|
|||||||||||
|
Variable
|
1,124
|
|
5,250
|
|
6,374
|
|
1,296
|
|
4,704
|
|
6,000
|
|
|||||||||||
|
Total
|
$
|
7,812
|
|
$
|
5,250
|
|
$
|
13,062
|
|
$
|
7,692
|
|
$
|
4,704
|
|
$
|
12,396
|
|
|||||
22
The following table presents the relevant contributions of our life insurance products, excluding universal life with secondary guarantees (“ULSG”), to our ANP:
|
Years Ended December 31,
|
||||||||||||
|
2017
|
2016
|
2015
|
||||||||||
|
(In millions)
|
||||||||||||
|
Term
|
$
|
12
|
|
$
|
53
|
|
$
|
79
|
|
|||
|
Whole
|
15
|
|
75
|
|
115
|
|
||||||
|
Total Traditional
|
27
|
|
128
|
|
194
|
|
||||||
|
Universal
|
6
|
|
19
|
|
3
|
|
||||||
|
Variable
|
3
|
|
11
|
|
23
|
|
||||||
|
Total Universal and Variable
|
9
|
|
30
|
|
26
|
|
||||||
|
Total Life (Excluding ULSG)
|
$
|
36
|
|
$
|
158
|
|
$
|
220
|
|
|||
The following table presents our in-force face amount and direct premiums received, respectively, for the life insurance products that we offer:
|
In-Force Face Amount
|
Premiums
|
|||||||||||||||
|
December 31,
|
December 31,
|
|||||||||||||||
|
2017
|
2016
|
2017
|
2016
|
|||||||||||||
|
|
(In millions)
|
|||||||||||||||
|
Term
|
$
|
453,804
|
|
$
|
471,857
|
|
$
|
750
|
|
$
|
785
|
|
||||
|
Whole (1)
|
$
|
23,204
|
|
$
|
24,280
|
|
$
|
508
|
|
$
|
549
|
|
||||
|
Universal
|
$
|
15,617
|
|
$
|
16,102
|
|
$
|
234
|
|
$
|
281
|
|
||||
|
Variable
|
$
|
44,897
|
|
$
|
47,607
|
|
$
|
292
|
|
$
|
331
|
|
||||
_______________
|
(1)
|
All new business written since 2013 is 90% coinsured to a former affiliate.
|
Products
We currently offer term life and universal life products.
Term Life
Term life products are designed to provide a fixed death benefit in exchange for a guaranteed level premium to be paid over a specified period of time, usually 10 to 30 years. A one-year term option is also offered. Our term life product does not include any cash value, accumulation or investment components. As a result, it is our most basic life insurance product offering and generally has lower premiums than other forms of life insurance. Term life products may allow the policyholder to continue coverage beyond the guaranteed level premium period, generally at an elevated cost. Some of our term life policies allow the policyholder to convert the policy during the conversion period to a permanent policy. Such conversion does not require additional medical or financial underwriting. Term life products allow us to spread expenses over a large number of policies while gaining mortality insights that come from high policy volumes.
Universal Life
Universal life products provide a death benefit in return for payment of specified annual policy charges that are generally related to specific costs, which may change over time. To the extent that the policyholder chooses to pay more than the charges required in any given year to keep the policy in-force, the excess premium will be added to the cash value of the policy and credited with a stated interest rate on a monthly basis. This structure gives policyholders flexibility in the amount and timing of premium payments, subject to tax guidelines. Consequently, universal life policies can be used in a variety of different ways. We may market universal life policies focused on cash accumulation within the policy; this can be accessed later via surrender, withdrawals, loans or ultimate payment of the death benefit. Our policies may feature limited surrender charges and low initial compensation related to policy expenses, compared to our competitors.
Our current universal life offering has no surrender charges; advisor compensation is based mostly on accumulated cash value instead of a “target premium” set by us. We believe this universal life offering provides greater flexibility for the policyholder in the form of a higher cash surrender value in the early contract years given its levelized commission over time structure and an appeal to different types of advisors with the compensation aligning to asset based business mod
els.
23
Advisors have incentive to service these policies based on this compensation model. These product features allow our universal life product to be a differentiated product as compared to other universal life contracts offered in the industry and we believe it demonstrates our ability to create new products that appeal to both consumers and advisors.
Whole Life
Although we have a significant in-force book of whole life policies, we suspended new sales of participating whole life and conversions into participating whole life beginning with the first quarter of 2017. Whole life products provide a guaranteed death benefit in exchange for a guaranteed level premium for a specified period of time in order to maintain coverage for the life of the insured. Whole life products also have guaranteed minimum cash surrender values. Our in-force whole life products provide for participation in the returns generated by the business, delivered to the policyholder in the form of non-guaranteed dividend payments. The policyholder can elect to receive the dividends in cash or to use them to increase the paid-up policy death benefit or pay the required premium. They can also be used for other purposes, including payment of loans and loan interest. The versatility of whole life allows it to be used for a variety of different purposes beyond just the primary purpose of death benefit protection. With our in-force policies, the policyholder can withdraw or borrow against the policy (sometimes on a tax favored basis), in order to provide anything from education costs to emergency funds to systematic income for retirement. In November 2017, we launched a non-participating conversion whole life product that is available for term and group conversions and to satisfy other contractual obligations. This product received Insurance Department approvals in 49 states, the District of Columbia, Puerto Rico, the Bahamas, Guam, the British Virgin Islands and the U.S. Virgin Islands.
Variable Life
Although we have a significant in-force book of variable life policies, we suspended new sales of certain variable life policies and conversions into certain variable life policies beginning with the first quarter of 2017. We may choose to issue additional variable life products in the future. Variable life products operate similarly to universal life products, with the additional feature that the excess amount paid over policy charges can be directed by the policyholder into a variety of separate account investment options. In the separate account investment options, the policyholder bears the entire risk of the investment results. We collect specified fees for the management of the investment options in addition to the base policy charges. In some instances, third-party asset management firms manage these investment options. The policyholder’s cash value reflects the investment return of the selected investment options, net of management fees and insurance-related charges. With some products, by maintaining a certain premium level, policyholders may also have the advantage of various guarantees designed to protect the death benefit from adverse investment experience.
Pricing and Underwriting
Pricing
Life insurance pricing at issuance is based on the expected payout of benefits calculated using our assumptions for mortality, morbidity, premium payment patterns, sales mix, expenses, persistency and investment returns, as well as certain macroeconomic factors, such as inflation. Our product pricing models consider additional factors, such as hedging costs, reinsurance programs, and capital requirements. We have historically leveraged the actuarial capabilities and long history of MetLife. Our product pricing reflects our pricing standards and guidelines. We continually review our pricing guidelines in light of applicable regulations and to ensure that our policies remain competitive and supportive of our marketing strategies and profitability goals.
We have a dedicated unit, the primary responsibility of which is the development of product pricing standards and independent pricing and underwriting oversight for our insurance business. Further important controls around management of underwriting and pricing processes include regular experience studies to monitor assumptions against expectations, formal new product approval processes, periodic updates to product profitability studies and the use of reinsurance to manage our exposures, as appropriate. See “Management’s Discussion and Analysis of Financial Condition and Results of Operations — Summary of Critical Accounting Estimates — Reinsurance.”
Underwriting
Underwriting generally involves an evaluation of applications by a professional staff of underwriters and actuaries, who determine the type and the amount of insurance risk that we are willing to accept. We employ detailed underwriting policies, guidelines and procedures designed to assist the underwriters to properly assess and quantify such risks before issuing policies to qualified applicants or groups.
Insurance underwriting may consider not only an insured’s medical history, but also other factors such as the insured’s foreign travel, vocations, alcohol, drug and tobacco use, and the policyholder’s financial profile. We generally perform our
24
own underwriting; however, certain policies are reviewed by intermediaries under guidelines established by us. Requests for coverage are reviewed on their merits and a policy is not issued unless the particular risk has been examined and approved in accordance with our underwriting guidelines.
The underwriting conducted by our corporate underwriting office and intermediaries is subject to periodic quality assurance reviews to maintain high standards of underwriting and consistency. The office is also subject to periodic external audits by reinsurers with whom we do business.
We have established oversight of the underwriting process that facilitates quality sales and serves the needs of our customers, while supporting our financial strength and business objectives. Our goal is to achieve the underwriting, mortality and morbidity levels reflected in the assumptions in our product pricing. This is accomplished by determining and establishing underwriting policies, guidelines, philosophies and strategies that are competitive and suitable for the customer, the agent and us.
We continually review our underwriting guidelines (i) in light of applicable regulations and (ii) to ensure that our practices remain competitive and supportive of our marketing strategies, emerging industry trends and profitability goals.
Run-off
This segment consists of operations related to products which we are not actively selling and which are separately managed, including structured settlements, pension risk transfer contracts, company-owned life insurance (“COLI”) policies, funding agreements and ULSG. With the exception of ULSG, these legacy business lines were not part of MetLife’s former Retail segment, but were issued by certain of the legal entities that are now part of Brighthouse. See “Management’s Discussion and Analysis of Financial Condition and Results of Operations — Executive Summary — Overview.”
The following table presents the insurance liabilities of our annuity contracts and life insurance policies which are reported in our Run-off segment:
|
December 31, 2017
|
December 31, 2016
|
||||||||||||||||||||||
|
General
Account
|
Separate
Account
|
Total
|
General
Account
|
Separate
Account
|
Total
|
||||||||||||||||||
|
(In millions)
|
|||||||||||||||||||||||
|
Annuities (1)
|
$
|
11,908
|
|
$
|
18
|
|
$
|
11,926
|
|
$
|
11,213
|
|
$
|
15
|
|
$
|
11,228
|
|
|||||
|
Life (2)
|
15,118
|
|
3,100
|
|
18,218
|
|
13,606
|
|
3,469
|
|
17,075
|
|
|||||||||||
|
Total
|
$
|
27,026
|
|
$
|
3,118
|
|
$
|
30,144
|
|
$
|
24,819
|
|
$
|
3,484
|
|
$
|
28,303
|
|
|||||
_______________
|
(1)
|
Includes $3.9 billion and $4.1 billion of pension risk transfer general account liabilities at December 31, 2017 and 2016, respectively.
|
|
(2)
|
Includes $14.1 billion and $12.6 billion of general account liabilities associated with the ULSG business at December 31, 2017 and 2016, respectively.
|
Corporate & Other
Corporate & Other contains the excess capital not allocated to the segments and interest expense related to the majority of our outstanding debt, as well as expenses associated with certain legal proceedings and income tax audit issues. Corporate & Other also includes the elimination of intersegment amounts, long term care and workers compensation business reinsured through 100% quota share reinsurance agreements, and term life insurance sold direct to customers, which is no longer being offered for new sales.
Risk Management Strategies
Variable Annuity Statutory Reserving Requirements and Exposure Management
We are required to calculate the statutory reserves which support our variable annuity products in conformity with Actuarial Guideline 43 (“AG 43”) issued by the NAIC. The principal components of AG 43 are a deterministic calculation based on a single standard scenario (“Standard Scenario”) and a calculation utilizing stochastic scenario analysis across 1,000 capital market scenarios, referred to as the conditional tail expectations (“CTE”). AG 43 requires that we carry reserves for our variable annuity contracts that include the greater of the amount determined under the Standard Scenario or CTE.
The Standard Scenario reflects an instantaneous drop in account values followed by a recovery in each case using returns specified in AG 43. Unlike CTE, which is calculated on an aggregate basis, the Standard Scenario is a seriatim (policy-by-
25
policy) calculation which does not permit deficiencies for certain contracts to be offset by redundancies in other contracts. In addition, the Standard Scenario has prescribed assumptions, including those for policyholder behavior, which we believe to be conservative when applied to GMIB products.
CTE is a statistical tail risk measure used to assess the adequacy of assets supporting variable annuity contract liabilities by averaging the worst “x” percent of the 1,000 stochastic capital market scenarios used, which is commonly described as CTE100 less “x”. The CTE calculation under AG 43 represents the result derived from the worst 30% of these stochastic scenarios, or “CTE70”. Although the NAIC does not specify the exact scenarios used, it has issued guidelines that must be complied with when selecting the scenarios used.
The results of the Standard Scenario and CTE70 calculations under AG 43 may differ materially. We held $4.3 billion of statutory reserves, including voluntary reserves, to support our variable annuity products at December 31, 2017.
The calculation of total assets (reserves plus capital) required to be held to support variable annuity contracts is referred to as a total asset requirement (“TAR”). The NAIC has issued separate guidelines, pursuant to Life Risk Based Capital Phase II Instructions (“RBC C3 Phase II”), regarding the calculation of TAR for purposes of determining risked based capital (“RBC”). We refer to this as “Statutory TAR”. Under these guidelines, Statutory TAR must be at least equal to the greater of (a) the average amount of assets needed to satisfy policyholder obligations in the worst 10% of the 1,000 scenarios, or CTE90, and (b) the total amount of assets required under a deterministic calculation based on a standard scenario prescribed in these RBC guidelines (“RBC Standard Scenario”). Our Statutory TAR was $3.7 billion at December 31, 2017.
Our internal target TAR, consistent with rating agency criteria for our target credit ratings, is based on the worst 5% of scenarios, or CTE 95, which we refer to as our “Variable Annuity Target Funding Level”. We intend to maintain across markets over the life of the book of business our Variable Annuity Target Funding Level, which was $5.7 billion at December 31, 2017.
Our exposure risk management program seeks to mitigate the potential adverse effects of changes in capital markets, specifically equity markets and interest rates, on our Variable Annuity Target Funding Level and hence our view of statutory distributable cash flows. We seek to accomplish this by using derivative instruments together with holding $2.0 billion to $3.0 billion of assets in excess of the CTE95 requirement to fund the first dollar increase in CTE95 requirements under stressed capital market conditions. We utilize a combination of short-term and longer-term derivative instruments to have a laddered maturity of protection and reduce roll over risk during periods of market disruption or higher volatility. We continually monitor the capital markets for opportunities to adjust our derivative positions to manage our variable annuity exposure, as appropriate.
The table below presents the gross notional amount and estimated fair value of the derivatives in our variable annuity hedging program.
|
December 31, 2017
|
December 31, 2016
|
|||||||||||||||||||||||||
|
Primary Underlying Risk Exposure
|
Instrument Type
|
Gross Notional Amount
|
Estimated Fair Value
|
Gross Notional Amount
|
Estimated Fair Value
|
|||||||||||||||||||||
|
Assets
|
Liabilities
|
Assets
|
Liabilities
|
|||||||||||||||||||||||
|
|
|
(In millions)
|
||||||||||||||||||||||||
|
Interest rate
|
Interest rate swaps
|
$
|
14,586
|
|
$
|
899
|
|
$
|
378
|
|
$
|
16,551
|
|
$
|
1,180
|
|
$
|
787
|
|
|||||||
|
|
Interest rate futures
|
282
|
|
1
|
|
—
|
|
1,288
|
|
9
|
|
—
|
|
|||||||||||||
|
|
Interest rate options
|
20,800
|
|
68
|
|
27
|
|
15,520
|
|
136
|
|
—
|
|
|||||||||||||
|
Equity market
|
Equity futures
|
2,713
|
|
15
|
|
—
|
|
8,037
|
|
38
|
|
—
|
|
|||||||||||||
|
|
Equity index options
|
47,066
|
|
793
|
|
1,663
|
|
37,215
|
|
895
|
|
934
|
|
|||||||||||||
|
|
Equity variance swaps
|
8,998
|
|
128
|
|
430
|
|
14,894
|
|
140
|
|
517
|
|
|||||||||||||
|
|
Equity total return swaps
|
1,767
|
|
—
|
|
79
|
|
2,855
|
|
1
|
|
117
|
|
|||||||||||||
|
|
Total
|
$
|
96,212
|
|
$
|
1,904
|
|
$
|
2,577
|
|
$
|
96,360
|
|
$
|
2,399
|
|
$
|
2,355
|
|
|||||||
Period to period changes in the estimated fair value of these hedges affect our net income, as well as stockholders’ equity and these effects can be material in any given period. See “Risk Factors — Risks Related to Our Business — Our variable annuity exposure management strategy may not be effective, may result in net income volatility and may negatively affect our statutory capital” and “Management’s Discussion and Analysis of Financial Condition and Results of Operations — Summary of Critical Accounting Estimates.”
The principal components of our exposure risk management strategy are described in further detail below:
26
|
•
|
Variable Annuity Assets - This includes both derivative assets and non-derivative assets. We intend to continue to hold non-derivative assets supporting our variable annuity contracts to sustain asset adequacy during modest market downturns without substantial reliance on gains on derivative instruments and accordingly, reduce the need for hedging the daily or weekly fluctuations from small movements in capital markets. At December 31, 2017, we held approximately $2.6 billion of assets in excess of those required under CTE95, which would be equivalent to holding assets greater than a CTE98 standard at December 31, 2017.
|
|
•
|
Hedge Target - We focus our hedging activities primarily on mitigating the risk from larger movements in capital markets, which may deplete variable annuity contract holder account values, and may increase long-term variable annuity guarantee claims. When we determine hedges to hold for this risk, we consider the fact that our obligations under Shield Annuity contracts decrease in falling equity markets when variable annuity guarantee obligations increase, and increase in rising equity markets when variable annuity guarantee obligations decrease.
Additionally, we believe that holding longer dated assets including derivative instruments to support our Variable Annuity Target Funding Level is consistent with the long-term nature of our variable annuity contract guarantees. We believe this will result in our being less exposed to the risk that we will be unable to roll-over expiring derivative instruments into new derivative instruments consistent with our hedge strategy on economically attractive terms and conditions. Over time, we expect our variable annuity exposure management strategy will allow us to reduce net hedge costs and increase long-term value for our shareholders for various reasons, including:
|
|
•
|
Protect against more significant market risks.
Protecting against larger market movements can be achieved at a lower cost through the use of derivatives with strike levels that are below the current market level, referred to as “out of the money.” These derivatives, typically, require a lower premium outlay than those with strike levels at the current market level, known as “at the money.” However, they may result in higher bid-ask spread or trading cost, if frequently re-balanced. Additionally, we believe a strategy using primarily options will produce fewer losses from extreme realized volatility over a compressed time period, with potentially multiple up and down market movements, referred to as “gamma losses.”
|
|
•
|
Reduce transaction costs associated with hedge execution.
Less frequent rebalancing of derivative positions can reduce trading costs. This approach is commonly described as a “semi-static hedging” approach. With a greater emphasis on semi-static hedging, we generally favor using longer-term option instruments.
|
|
•
|
Improve statutory results in rising markets.
First dollar dynamic hedging strategies, for example using futures or swaps, have similar symmetrical impacts in both rising and falling markets. Therefore, while protecting for market downside situations, first dollar dynamic hedging strategies also incur first dollar losses in rising markets, which is what we refer to as selling upside.
We have reduced the use of futures and swaps (as reflected in the preceding table), which should improve statutory earnings for the Company in the event markets outperform our baseline expectations.
|
We believe the higher statutory earnings that our strategy may generate can be used to increase financial flexibility and support deploying capital for growing long-term, sustainable shareholder value. However, because this hedge strategy places a lower priority on offsetting changes to GAAP liabilities and moderate market movement impacts to statutory capital, some GAAP net income and statutory capital volatility could result when markets are volatile.
Further, by holding more non-derivative, income bearing assets in addition to derivative instruments to support our Variable Annuity Target Funding Level, we should benefit from earning additional investment income over time. This increases the sufficiency of assets supporting our Variable Annuity Target Funding Level and increases the possibility of generating excess capital over time, depending on market conditions. We believe this will enhance our financial condition across more market scenarios than an approach that relies purely on derivative instruments for protecting against market downside.
Variable Annuity Sensitivities
Set forth below are two tables that analyze the sensitivity of our Variable Annuity Assets, CTE95 and Statutory TAR to instantaneous changes in equity markets and interest rates. The next two tables present the change in our Variable Annuity Target Funding Level and analyze the sensitivity. We then set forth below several tables which show the present value of our cash flows under certain economic scenarios. Lastly, we set forth a table which analyzes the sensitivity of our variable annuity GAAP net income to changes in equity markets and interest rates. All of these tables reflect the risk offset impact of Shield Annuities.
Sensitivity of Variable Annuity Targets
The following table estimates the impact of various instantaneous changes in equity markets and interest rates, assuming implied volatility is held constant with respect to market levels at December 31, 2017 on the estimated Variable Annuity Assets
27
supporting our variable annuity contracts. It does not reflect an increase in total asset requirements as the block of business seasons over time. For purposes of the table we have estimated the impacts of these equity market and interest rate changes on our (i) variable annuity contract liabilities as of December 31, 2017; and (ii) Variable Annuity Assets consisting of derivative instruments as of December 31, 2017. The impacts presented below are not representative of the aggregate changes that could result if a combination of such changes to equity markets and interest rates occurred.
|
Estimated at December 31, 2017
|
|||||||||||||||||||||||||||||||||||||||||||
|
Equity Market (S&P 500)
|
Interest Rates
|
||||||||||||||||||||||||||||||||||||||||||
|
(40)%
|
(25)%
|
(10)%
|
(5)%
|
Base
|
5%
|
10%
|
25%
|
40%
|
(1)%
|
1%
|
|||||||||||||||||||||||||||||||||
|
(In billions)
|
|||||||||||||||||||||||||||||||||||||||||||
|
Variable Annuity Assets (1)
|
$
|
15.8
|
|
$
|
12.0
|
|
$
|
9.3
|
|
$
|
8.8
|
|
$
|
8.3
|
|
$
|
7.9
|
|
$
|
7.5
|
|
$
|
6.7
|
|
$
|
6.1
|
|
$
|
10.3
|
|
$
|
7.3
|
|
||||||||||
|
CTE95
|
13.7
|
|
10.3
|
|
7.4
|
|
6.5
|
|
5.7
|
|
5.0
|
|
4.3
|
|
2.6
|
|
1.7
|
|
7.6
|
|
4.2
|
|
|||||||||||||||||||||
|
Variable Annuity Assets above CTE95 (2)(3)(4)
|
$
|
2.1
|
|
$
|
1.7
|
|
$
|
1.9
|
|
$
|
2.3
|
|
$
|
2.6
|
|
$
|
2.9
|
|
$
|
3.2
|
|
$
|
4.1
|
|
$
|
4.4
|
|
$
|
2.7
|
|
$
|
3.1
|
|
||||||||||
|
Change in Variable Annuity Assets above CTE95 (5)
|
$
|
(0.5
|
)
|
$
|
(0.9
|
)
|
$
|
(0.7
|
)
|
$
|
(0.3
|
)
|
$
|
—
|
|
$
|
0.3
|
|
$
|
0.6
|
|
$
|
1.5
|
|
$
|
1.8
|
|
$
|
0.1
|
|
$
|
0.5
|
|
||||||||||
_______________
|
(1)
|
Variable Annuity Assets for purposes of this sensitivity analysis is the total amount of assets we hold to support our variable annuity contracts. Under the base case scenario, our Variable Annuity Assets exceeded our Variable Annuity Target Funding Level by $2.6 billion. The sensitivities of Variable Annuity Assets only reflect fair value changes of the variable annuity hedging program (non-derivative assets are not held at fair value).
|
|
(2)
|
Variable Annuity Assets above CTE95 is the difference between the amount of assets necessary to support our variable annuities at a CTE95 standard and Variable Annuity Assets.
|
|
(3)
|
Our risk management program is designed to protect against larger equity market movements through the use of out of the money derivative instruments. The rate of change in the fair value of these derivative instruments increases as the level of equity markets approaches and goes below the strike level on these derivative instruments.
|
|
(4)
|
We hold assets in excess of our Variable Annuity Target Funding Level in order to mitigate the effect of adverse market scenarios on the adequacy of the assets supporting our variable annuity contracts. This table shows sensitivities under instantaneous changes and does not reflect multiple effects across equity markets and interest rates, a failure of markets to recover following such change or the impact the passage of time may have.
|
|
(5)
|
Change of Variable Annuity Assets above CTE95 is the difference between the Variable Annuity Assets above CTE95 and the base amount.
|
The Company is subject to regulatory minimum capital requirements, as expressed by the Statutory TAR. Statutory TAR may respond differently than CTE95 to equity market and interest rates. The following table estimates the impact of various instantaneous changes in equity markets and interest rates, assuming implied volatility is held constant with respect to market levels at December 31, 2017 on the estimated Variable Annuity Assets supporting our variable annuity contracts. It does not reflect an increase in total asset requirements as the block of business seasons over time. For purposes of the table we have estimated the impacts of these equity market and interest rate changes on our (i) variable annuity contract liabilities as of December 31, 2017; and (ii) Variable Annuity Assets consisting of derivative instruments as of December 31, 2017. The impacts presented below are not representative of the aggregate changes that could result if a combination of such changes to equity markets and interest rates occurred.
|
Estimated at December 31, 2017
|
|||||||||||||||||||||||||||||||||||||||||||
|
Equity Market (S&P 500)
|
Interest Rates
|
||||||||||||||||||||||||||||||||||||||||||
|
(40)%
|
(25)%
|
(10)%
|
(5)%
|
Base
|
5%
|
10%
|
25%
|
40%
|
(1)%
|
1%
|
|||||||||||||||||||||||||||||||||
|
(In billions)
|
|||||||||||||||||||||||||||||||||||||||||||
|
Variable Annuity Assets (1)
|
$
|
15.8
|
|
$
|
12.0
|
|
$
|
9.3
|
|
$
|
8.8
|
|
$
|
8.3
|
|
$
|
7.9
|
|
$
|
7.5
|
|
$
|
6.7
|
|
$
|
6.1
|
|
$
|
10.3
|
|
$
|
7.3
|
|
||||||||||
|
Statutory TAR
|
12.1
|
|
8.6
|
|
5.5
|
|
4.5
|
|
3.7
|
|
3.0
|
|
2.4
|
|
1.5
|
|
1.0
|
|
5.5
|
|
3.6
|
|
|||||||||||||||||||||
|
Variable Annuity Assets above Statutory TAR (2)
|
$
|
3.7
|
|
$
|
3.4
|
|
$
|
3.8
|
|
$
|
4.3
|
|
$
|
4.6
|
|
$
|
4.9
|
|
$
|
5.1
|
|
$
|
5.2
|
|
$
|
5.1
|
|
$
|
4.8
|
|
$
|
3.7
|
|
||||||||||
|
Change in Variable Annuity Assets above Statutory TAR (3)
|
$
|
(0.9
|
)
|
$
|
(1.2
|
)
|
$
|
(0.8
|
)
|
$
|
(0.3
|
)
|
$
|
—
|
|
$
|
0.3
|
|
$
|
0.5
|
|
$
|
0.6
|
|
$
|
0.5
|
|
$
|
0.2
|
|
$
|
(0.9
|
)
|
||||||||||
28
_______________
|
(1)
|
Variable Annuity Assets for purposes of this sensitivity analysis is the total amount of assets we hold to support our variable annuity contracts. The sensitivities of Variable Annuity Assets only reflect fair value changes of the variable annuity hedging program (non-derivative assets are not held at fair value).
|
|
(2)
|
Variable Annuity Assets above Statutory TAR is the difference between the Statutory TAR and Variable Annuity Assets.
|
|
(3)
|
Change of Variable Annuity Assets above Statutory TAR is the difference between the Variable Annuity Assets above TAR and the base amount.
|
Growth of or Decline in Our Variable Annuity Target Funding Level and Sensitivities
Based on our Base Case Scenario (as defined below), we believe the Variable Annuity Target Funding Level for our variable annuity in-force book (“VA In-Force”) will continue to increase over time until it peaks in approximately 2024. We believe this to be typical of most insurance liabilities, where reserves or reserves and required capital, combined as total asset requirements, increase as the block of business seasons over time until it reaches maturity. After maturity, total asset requirements decline, thereby permitting a release of assets and an increase to retained capital and surplus. Assuming our Base Case Scenario, as of December 31, 2017, our Variable Annuity Target Funding Level was approximately 90% of the estimated peak level of our total variable annuity asset requirements in approximately 2024. By December 31, 2022, we believe that we will be holding approximately 98% of the expected peak Variable Annuity Target Funding Level as shown in the following table:
|
2017
|
2022
|
2024
|
||||||||||
|
(Dollars in billions)
|
||||||||||||
|
Variable Annuity Target Funding Level
|
$
|
5.7
|
|
$
|
6.2
|
|
$
|
6.3
|
|
|||
|
Percent of peak Variable Annuity Target Funding Level
|
90
|
%
|
98
|
%
|
100
|
%
|
||||||
We anticipate that our increasing total asset requirements will be funded with revenues from our VA In-Force, net of expenses, exposure management impacts and commitments for the Variable Annuity business. We expect the residual cash flows will be available for investment in new business, as well as other corporate purposes. Additionally, after the business is past the peak level, we expect the Variable Annuity Target Funding Level to decline and increase distributable earnings to provide a source of cash flow to shareholders.
The following table is based on Scenario 4 (as defined below). We believe this helps represent the impact that aging has on the Variable Annuity Target Funding Level, which is growth that occurs in the CTE95 requirement assuming separate account funds earn modest premium to risk-free rates and interest rates follow the forward curve. We estimate this to be approximately $800 million per year through 2022, declining to approximately $450 million per year through 2027.
|
2017
|
2022
|
2027
|
||||||||||
|
(Dollars in billions)
|
||||||||||||
|
Variable Annuity Target Funding Level
|
$
|
5.7
|
|
$
|
9.9
|
|
$
|
12.1
|
|
|||
|
Percent of peak Variable Annuity Target Funding Level
|
47
|
%
|
82
|
%
|
100
|
%
|
||||||
Sensitivity of Cash Flows
In addition, the following tables illustrate the impact on variable annuity business cash flows across five capital market scenarios, outlined below, which reflect simultaneous changes in equity markets and interest rates as outlined below, reflecting our current hedging program as of December 31, 2017. Contract holder behavior in these five scenarios is based on current best estimate assumptions which include dynamic variables to reflect the impact of change in market levels.
29
|
Assumptions
|
|
|
Base Case Scenario
|
Separate Account Returns: 6.5%
Interest Rate Yields: mean reversion of 10 Year UST to 4.25% over 10 years
|
|
Scenario 2
|
Separate Account Returns: 9.0%
Interest Rate Yields: mean reversion of 10 Year UST to 4.25% over 10 years
|
|
Scenario 3
|
Separate Account Returns: 4.0%
Interest Rate Yields: mean reversion of 10 Year UST to 4.25% over 10 years
|
|
Scenario 4
|
Separate Account Returns: 4.0%
Interest Rate Yields: follows the forward U.S. Treasury and swap interest rate curve as of December 31, 2017
|
|
Scenario 5
|
Separate Account Returns: (25)% shock to equities, then 6.5% separate account return
Interest Rate Yields: 10-year U.S. Treasury interest rates drop to 1.0%, and then follows the implied forward rate
|
The tables below estimate the impact of distributable statutory cash flow from our variable annuity business for both the three and five annual periods beginning December 31, 2017, under the above defined five capital market scenarios. These values are presented on a pre-tax basis.
Effective December 31, 2017, we made certain tax elections related to our variable annuity hedging program to better align recognition of taxes on hedge gain (loss) with the longer term nature of the hedges and reduce any potential tax friction impacts due to the difference in the amount of tax reserves and the hedge target based on CTE95. As a result of these elections, we believe that statutory pre-tax and post-tax results will be similar for the next few years. Additionally, the tables do not reflect any potential impact of variable annuity capital reform or change in tax rates on the CTE requirements.
|
For the Three Years Ending
December 31, 2018 to December 31, 2020
|
||||||||||||||||||||
|
Base Case Scenario
|
Scenario 2
|
Scenario 3
|
Scenario 4
|
Scenario 5
|
||||||||||||||||
|
(In billions)
|
||||||||||||||||||||
|
Fees
|
$
|
5.5
|
|
$
|
5.7
|
|
$
|
5.4
|
|
$
|
5.4
|
|
$
|
4.6
|
|
|||||
|
Rider fees
|
3.6
|
|
3.6
|
|
3.6
|
|
3.6
|
|
3.5
|
|
||||||||||
|
Surrender charges
|
0.1
|
|
0.1
|
|
0.1
|
|
0.1
|
|
0.1
|
|
||||||||||
|
Hedge gains (losses) (including Shield net impact)
|
(4.6
|
)
|
(5.7
|
)
|
(3.3
|
)
|
(3.3
|
)
|
3.5
|
|
||||||||||
|
Benefits and expenses
|
(3.0
|
)
|
(3.0
|
)
|
(3.1
|
)
|
(3.1
|
)
|
(3.3
|
)
|
||||||||||
|
Investment income
|
0.9
|
|
0.9
|
|
1.0
|
|
1.0
|
|
1.0
|
|
||||||||||
|
Increase (decrease) in Commissioners Annuity Reserve Valuation Method (“CARVM”) allowance
|
(0.8
|
)
|
(0.8
|
)
|
(0.8
|
)
|
(0.8
|
)
|
(0.7
|
)
|
||||||||||
|
Impact of (increase) decrease in CTE95
|
(0.2
|
)
|
1.4
|
|
(2.1
|
)
|
(2.5
|
)
|
(9.6
|
)
|
||||||||||
|
Subtotal
|
1.5
|
|
2.2
|
|
0.8
|
|
0.4
|
|
(0.9
|
)
|
||||||||||
|
(Increase) decrease in assets to fund hedge target
|
(0.4
|
)
|
(0.4
|
)
|
(0.4
|
)
|
(0.4
|
)
|
0.9
|
|
||||||||||
|
Variable annuity distributable earnings
|
$
|
1.1
|
|
$
|
1.8
|
|
$
|
0.4
|
|
$
|
—
|
|
$
|
—
|
|
|||||
30
|
For the Five Years Ending
December 31, 2018 to December 31, 2022
|
||||||||||||||||||||
|
Base Case Scenario
|
Scenario 2
|
Scenario 3
|
Scenario 4
|
Scenario 5
|
||||||||||||||||
|
(In billions)
|
||||||||||||||||||||
|
Fees
|
$
|
8.6
|
|
$
|
9.1
|
|
$
|
8.1
|
|
$
|
8.1
|
|
$
|
7.0
|
|
|||||
|
Rider fees
|
5.7
|
|
5.8
|
|
5.7
|
|
5.7
|
|
5.6
|
|
||||||||||
|
Surrender charges
|
0.1
|
|
0.1
|
|
0.1
|
|
0.1
|
|
0.1
|
|
||||||||||
|
Hedge gains (losses) (including Shield net impact)
|
(6.3
|
)
|
(8.0
|
)
|
(4.3
|
)
|
(4.4
|
)
|
1.4
|
|
||||||||||
|
Benefits and expenses
|
(5.0
|
)
|
(5.0
|
)
|
(5.0
|
)
|
(5.1
|
)
|
(5.6
|
)
|
||||||||||
|
Investment income
|
1.7
|
|
1.5
|
|
1.9
|
|
1.9
|
|
1.8
|
|
||||||||||
|
Increase (decrease) in CARVM allowance
|
(1.0
|
)
|
(1.0
|
)
|
(1.0
|
)
|
(1.0
|
)
|
(0.8
|
)
|
||||||||||
|
Impact of (increase) decrease in CTE95
|
(0.5
|
)
|
2.1
|
|
(3.4
|
)
|
(4.3
|
)
|
(10.3
|
)
|
||||||||||
|
Subtotal
|
3.3
|
|
4.6
|
|
2.1
|
|
1.0
|
|
(0.8
|
)
|
||||||||||
|
(Increase) decrease in assets to fund hedge target
|
(0.4
|
)
|
(0.4
|
)
|
(0.4
|
)
|
(0.4
|
)
|
0.8
|
|
||||||||||
|
Variable annuity distributable earnings
|
$
|
2.9
|
|
$
|
4.2
|
|
$
|
1.7
|
|
$
|
0.6
|
|
$
|
—
|
|
|||||
With the successful transition to our variable annuity hedging strategy in 2017, distributable earnings reflect lower hedge costs than under the legacy strategy. Lower hedge costs also resulted from growth in Shield Annuity balances, which provides a risk offset to variable annuity in-force, and favorable equity markets have resulted in lower in-the-moneyness for client guarantees.
The table below presents, under these five scenarios, the present value over the lifetime of the existing variable annuity block at a 4% discount rate of anticipated revenues net of all expenses and hedge costs, without reflecting the effect of capital and reserving requirements on the cash flows of this business.
|
Estimated at December 31, 2017
|
||||||||||||||||||||
|
Base Case Scenario
|
Scenario 2
|
Scenario 3
|
Scenario 4
|
Scenario 5
|
||||||||||||||||
|
(In billions)
|
||||||||||||||||||||
|
Present value of cash flows
|
$
|
9.0
|
|
$
|
16.2
|
|
$
|
1.7
|
|
$
|
0.3
|
|
$
|
(2.2
|
)
|
|||||
|
Present value of hedge gains (losses) (including Shield net impact)
|
(7.5
|
)
|
(11.1
|
)
|
(4.1
|
)
|
(5.7
|
)
|
(2.9
|
)
|
||||||||||
|
Total present value pre-tax
|
1.5
|
|
5.1
|
|
(2.4
|
)
|
(5.4
|
)
|
(5.1
|
)
|
||||||||||
|
Variable Annuity Assets
|
8.3
|
|
8.3
|
|
8.3
|
|
8.3
|
|
8.3
|
|
||||||||||
|
Total (including Variable Annuity Assets) (1)
|
$
|
9.8
|
|
$
|
13.4
|
|
$
|
5.9
|
|
$
|
2.9
|
|
$
|
3.2
|
|
|||||
_______________
|
(1)
|
Only represents cash flows and value from variable annuity in-force business and does not reflect any value or cost from other businesses, which includes value of non-variable annuity businesses (any future profits and approximately $3.4 billion of non-variable annuity capital), value of future new business, taxes, debt and other holding company costs.
|
Sensitivity of GAAP Net Income
The following table estimates the GAAP net income impact of various instantaneous changes in equity markets and interest rates
, assuming implied volatility is held constant with respect to market levels at December 31, 2017 on the estimated Variable Annuity Assets supporting our variable annuity contracts
. For purposes of the table we have estimated the impacts of these equity market and interest rate changes on our (i) variable annuity contract liabilities as of December 31, 2017; and (ii) Variable Annuity Assets consisting of derivative instruments at December 31, 2017. The impacts presented below are not representative of the aggregate changes that could result if a combination of such changes to equity markets and interest rates occurred. The changes do not include a deferred policy acquisition cost (“DAC”) offset and are net of the statutory tax rate of 21%.
31
|
Estimated at December 31, 2017
|
|||||||||||||||||||||||||||||||||||||||||||
|
Equity Market (S&P 500)
|
Interest Rates
|
||||||||||||||||||||||||||||||||||||||||||
|
(40)%
|
(25)%
|
(10)%
|
(5)%
|
Base
|
5%
|
10%
|
25%
|
40%
|
(1)%
|
1%
|
|||||||||||||||||||||||||||||||||
|
(In billions)
|
|||||||||||||||||||||||||||||||||||||||||||
|
Change in Variable Annuity Assets
|
$
|
5.9
|
|
$
|
2.9
|
|
$
|
0.8
|
|
$
|
0.4
|
|
$
|
—
|
|
$
|
(0.3
|
)
|
$
|
(0.5
|
)
|
$
|
(1.3
|
)
|
$
|
(1.7
|
)
|
$
|
1.5
|
|
$
|
(0.8
|
)
|
||||||||||
|
Change in Variable Annuity GAAP Reserves (1)
|
2.5
|
|
1.3
|
|
0.4
|
|
0.2
|
|
—
|
|
(0.2
|
)
|
(0.3
|
)
|
(0.8
|
)
|
(1.1
|
)
|
1.3
|
|
(1.0
|
)
|
|||||||||||||||||||||
|
Impact on Variable Annuity GAAP Net Income (Loss)
|
$
|
3.4
|
|
$
|
1.6
|
|
$
|
0.4
|
|
$
|
0.2
|
|
$
|
—
|
|
$
|
(0.1
|
)
|
$
|
(0.2
|
)
|
$
|
(0.5
|
)
|
$
|
(0.6
|
)
|
$
|
0.2
|
|
$
|
0.2
|
|
||||||||||
_______________
|
(1)
|
Change in Variable Annuity GAAP Reserves represents only those variable annuity guarantees accounted for at fair value as embedded derivatives and does not include adjustments for nonperformance or risk margins.
|
Risks in Sensitivities for Variable Annuities
The preceding sensitivities and scenarios discussed in this sensitivities section (the “Analyses”) are estimates and are not intended to predict the future financial performance of our variable annuity hedging program or to represent an opinion of market value. They were selected for illustrative purposes only and they do not purport to encompass all of the many factors that may bear upon a market value and are based on a series of assumptions as to the future. It should be recognized that actual future results may differ from those shown, on account of changes in the operating and economic environments and natural variations in experience. The results shown are presented as of December 31, 2017 and no assurance can be given that future experience will be in line with the assumptions made.
The Analyses use inputs which are difficult to approximate and may result in material differences in actual outcomes compared to the information shown above. These inputs include the following estimates:
|
•
|
Basis risk - fund allocations are mapped to different equity or fixed income indices and the projected returns which we attribute to these indices may be materially different from estimates we used in our modeling. A material portion of our separate account asset value is also included in target volatility funds and our modeling is unable to capture the continuous equity and fixed income re-allocations within these types of funds;
|
|
•
|
Actuarial assumptions - policyholder behavior and life expectancy may vary compared to our actuarial assumptions and much of the data that is used in formulating our actuarial assumptions is still developing, so we may have insufficient information on which to base the actuarial assumptions used in our modeling, which could result in material differences in actual outcomes compared to our modeling results; and
|
|
•
|
Management actions - the Analyses assume no actions by management in response to developing facts, circumstances and experience, which is unlikely to be the case and could result in material deviations from our modeling results.
|
In the modeling supporting our Analyses, we use seriatim calculations, that is, each individual annuity contract is considered.
Although the NAIC has promulgated guidelines on the total amount of assets required to support statutory reserves and capital relating to variable annuities, neither the NAIC nor any state insurance department specifies the particular 1,000 stochastic capital market scenarios that an insurance company must use in its CTE calculation or whether or not those scenarios can be changed or need be held constant going forward. Therefore, each insurance company runs scenarios which it believes are appropriate to it at a particular time, and the CTE95 of one company may be materially different than the CTE95 of another company. The NAIC is currently considering modifying its prescribed methodologies and assumptions. There is no guarantee it will implement these modifications or that it will not implement different modifications in the future, any of which may have a material impact on our statutory capitalization and our variable annuity hedging strategy, its implementation and timing.
In addition, the Analyses do not take into account simultaneous shocks to equity markets, interest rates and market volatility. The actual effect of changes in equity markets and interest rates on the assets supporting our variable annuity contracts may vary depending on a number of factors which include but are not limited to (i) the Analyses are only valid as of the measurement date and (ii) changes in our hedging program, policyholder behavior and underlying fund performance could materially affect the liabilities our assets support. In addition, the foregoing Analyses illustrate the estimated impact of the indicated shocks occurring instantaneously, and therefore give no effect to rebalancing over the course of the shock event. The estimates of equity market shocks reflect a shock to all equity markets, domestic and global, of the same magnitude. The estimates of interest rate shocks reflect a shock to rates at all durations (a parallel shift in the yield curve).
32
Management of non-market risks
Our product guarantees are subject to uncertainty associated with the future behavior of contract holders with respect to the exercise of contractual options (e.g., annuitization for GMIBs), lapse, timing and extent of withdrawals and underlying mortality experience. We are required to make assumptions about these uncertainties when valuing the liabilities and update such assumptions annually. Because assumptions may not reflect the actual behaviors and patterns we experience in the future, they are subject to change, potentially resulting in significant increases or decreases to the carrying value of liabilities impacting earnings in the period of the change. On an annual basis, we review these assumptions and make updates to the extent emerging and actual experience deviates from prior assumptions. It is possible that future assumption changes could produce reserve or CTE95 TAR hedge target changes in a magnitude that could require us to contribute a significant amount of additional capital to one or more of our insurance subsidiaries, or could otherwise be material and adverse to the results of operations or financial condition of the Company. For additional information regarding the actuarial assumption reviews for all periods presented, see “Management’s Discussion and Analysis of Financial Condition and Results of Operations — Results of Operations — Actuarial Assumption Review.”
ULSG Market Risk Exposure Management
The ULSG block includes the business ceded to
Brighthouse Reinsurance Company of Delaware (“BRCD”),
providing reserve financing support and business that remains in our operating companies. The primary market risk associated with our ULSG block is future levels of U.S. interest rates and bond yields. To help ensure Brighthouse has sufficient assets to meet future ULSG policyholder obligations, we have employed our NY Regulation 126 Cash Flow Testing (“ULSG CFT”) modeling approach as the basis for setting our ULSG asset requirement target for BRCD. For the business that remains in the operating companies, we set our ULSG asset requirement target to equal the actuarially determined statutory reserves, which, taken together with our ULSG asset requirement target of BRCD, comprises our total ULSG asset requirement target (“ULSG Target”). Under the ULSG CFT approach, we assume that interest rates remain flat or lower than current levels and our actuarial assumptions include a provision for adverse deviation. These underlying assumptions used in ULSG CFT are more conservative than those required under GAAP, which assumes a long-term upward mean reversion of interest rates and less conservative actuarial assumptions.
We seek to mitigate interest rate exposures associated with these liabilities by holding ULSG Assets to closely match our ULSG Target under different interest rate environments. “ULSG Assets” are defined as (i) total general account assets in the operating companies and affiliated reinsurance companies supporting statutory reserves and capital and (ii) interest rate derivative instruments dedicated to mitigate ULSG interest rate exposures. As of December 31, 2017, both ULSG Assets and the ULSG Target were estimated to be $16.9 billion. At December 31, 2017, the statutory reserves for the ULSG business (in our operating companies and affiliated reinsurers) were $21.0 billion and GAAP reserves were $12.2 billion.
Our ULSG Target is sensitive to the actual and future expected level of long-term U.S. interest rates. If interest rates fall, our ULSG Target increases. Likewise, if interest rates rise, our ULSG Target declines. Given this profile, we maintain a dedicated interest rate risk mitigation program, composed of interest rate derivatives (the “ULSG Hedge Program”), which we may rebalance periodically to preserve a risk mitigation profile consistent with our objectives. The ULSG Hedge Program prioritizes the ULSG Target (comprised of ULSG CFT and statutory considerations), with less emphasis on mitigating GAAP net income volatility. This could increase the period-to-period volatility of net income and equity due to differences in the sensitivity of the ULSG Target and GAAP liabilities to the changes in interest rates. This mitigation strategy enables us to better protect statutory capitalization from potential losses due to an increase in our ULSG Target under lower interest rate conditions. Conversely, we may allow for lower realization of gains as the ULSG Target declines in moderately rising interest rate environments, in order to limit the cost of this risk mitigation strategy. We intend to maintain an adequate amount of liquid investments in our investment portfolio supporting our ULSG book to support any contingent collateral posting requirements from our ULSG Hedge Program.
ULSG Sensitivities
The following tables analyze the sensitivity of our ULSG Assets, ULSG Target and ULSG GAAP net income to instantaneous changes in interest rates.
The following table summarizes the sensitivity of our estimated ULSG Assets and ULSG Target to changes in interest rates, and assumes rebalancing of our ULSG Hedge Program during the first quarter of 2018 was in place as of December 31, 2017. The resulting changes in the ULSG Target and ULSG Assets for the instantaneous interest rate changes only reflect changes for the business in BRCD. The changes are net of a statutory tax rate of 35%.
33
|
Estimated at December 31, 2017
|
||||||||||||||||||||||||||||||||||||
|
Interest Rates
|
||||||||||||||||||||||||||||||||||||
|
(2.0)%
|
(1.5)%
|
(1.0)%
|
(0.5)%
|
Base
|
0.5%
|
1.0%
|
1.5%
|
2.0%
|
||||||||||||||||||||||||||||
|
(In billions)
|
||||||||||||||||||||||||||||||||||||
|
ULSG Assets (1)
|
$
|
19.1
|
|
$
|
18.3
|
|
$
|
17.7
|
|
$
|
17.2
|
|
$
|
16.9
|
|
$
|
16.7
|
|
$
|
16.5
|
|
$
|
16.3
|
|
$
|
16.3
|
|
|||||||||
|
ULSG Target
|
19.1
|
|
18.4
|
|
17.8
|
|
17.4
|
|
16.9
|
|
16.4
|
|
16.0
|
|
15.4
|
|
14.8
|
|
||||||||||||||||||
|
Surplus (deficit) (2)
|
$
|
—
|
|
$
|
(0.1
|
)
|
$
|
(0.1
|
)
|
$
|
(0.2
|
)
|
$
|
—
|
|
$
|
0.3
|
|
$
|
0.5
|
|
$
|
0.9
|
|
$
|
1.5
|
|
|||||||||
_______________
|
(1)
|
ULSG Assets are the general account assets of the operating companies and BRCD and changes in ULSG Assets only reflect fair value changes of the ULSG Hedge Program.
|
|
(2)
|
Surplus (deficit) represents the difference between the ULSG Assets and the ULSG Target.
|
With respect to GAAP, ULSG policy reserves are relatively insensitive to interest rate movements. As a result, the sensitivity of ULSG GAAP net income largely consists of changes in the fair value of the ULSG Hedge Program, as depicted in the following table, which represents our ULSG Hedge Program as of December 31, 2017. The changes are net of a statutory tax rate of 21%.
|
Estimated at December 31, 2017
|
||||||||||||||||||||||||||||||||||||
|
Interest Rates
|
||||||||||||||||||||||||||||||||||||
|
(2.0)%
|
(1.5)%
|
(1.0)%
|
(0.5)%
|
Base
|
0.5%
|
1.0%
|
1.5%
|
2.0%
|
||||||||||||||||||||||||||||
|
(In billions)
|
||||||||||||||||||||||||||||||||||||
|
Change in ULSG Hedge Program (1)
|
$
|
3.5
|
|
$
|
2.3
|
|
$
|
1.3
|
|
$
|
0.6
|
|
$
|
—
|
|
$
|
(0.4
|
)
|
$
|
(0.8
|
)
|
$
|
(1.1
|
)
|
$
|
(1.2
|
)
|
|||||||||
As previously mentioned, we periodically rebalance our ULSG Hedge Program to preserve a risk mitigation profile consistent with our objectives. During the first quarter of 2018, we executed some rebalancing that maintained downside protection against increases in the ULSG Target if interest rates decline while affording upside if interest rates rise. The following table summarizes the ULSG GAAP net income sensitivity assuming the rebalancing of our ULSG Hedge Program during the first quarter of 2018 was in place as of December 31, 2017. The changes are net of a statutory tax rate of 21%.
|
Estimated at December 31, 2017
|
||||||||||||||||||||||||||||||||||||
|
Interest Rates
|
||||||||||||||||||||||||||||||||||||
|
(2.0)%
|
(1.5)%
|
(1.0)%
|
(0.5)%
|
Base
|
0.5%
|
1.0%
|
1.5%
|
2.0%
|
||||||||||||||||||||||||||||
|
(In billions)
|
||||||||||||||||||||||||||||||||||||
|
Change in ULSG Hedge Program (1)
|
$
|
2.7
|
|
$
|
1.7
|
|
$
|
1.0
|
|
$
|
0.4
|
|
$
|
—
|
|
$
|
(0.3
|
)
|
$
|
(0.5
|
)
|
$
|
(0.7
|
)
|
$
|
(0.7
|
)
|
|||||||||
The preceding sensitivities discussed in this section are estimates and are not intended to predict the future financial performance of our ULSG Hedge Program or to represent an opinion of market value. They were selected for illustrative purposes only and they do not purport to encompass all of the many factors that may bear upon a market value and are based on a series of assumptions as to the future. It should be recognized that actual future results may differ from those shown, on account of changes in the operating and economic environments and natural variations in experience. The results shown are presented as of December 31, 2017 and no assurance can be given that future experience will be in line with the assumptions made.
Reinsurance Activity
In connection with our risk management efforts and in order to provide opportunities for growth and capital management, we enter into reinsurance arrangements pursuant to which we cede certain insurance risks to unaffiliated reinsurers (“Unaffiliated Third-party Reinsurance”). We discuss below our use of Unaffiliated Third-party Reinsurance, as well as the cession of a block of legacy insurance liabilities to a third party and related indemnification and assignment arrangements.
Unaffiliated Third-Party Reinsurance
We cede risks to third parties in order to limit losses, minimize exposure to significant risks and provide capacity for future growth. We enter into various agreements with reinsurers that cover groups of risks, as well as individual risks. Our ceded reinsurance to third parties is primarily structured on a treaty basis as coinsurance, yearly renewable term, excess or catastrophe excess of retention insurance. These reinsurance arrangements are an important part of our risk management strategy because they permit us to spread risk and minimize the effect of losses. The extent of each risk retained by us depends on our evaluation of the specific risk, subject, in certain circumstances, to maximum retention limits based on the characteristics and relative cost of reinsurance. We also cede first dollar mortality risk under certain contracts. In addition to reinsuring mortality risk, we cede other risks, as well as specific coverages.
34
Under the terms of the reinsurance agreements, the reinsurer agrees to reimburse us for the ceded amount in the event that we pay a claim. Cessions under reinsurance agreements do not discharge our obligations as the primary insurer. In the event the reinsurers do not meet their obligations under the terms of the reinsurance agreements, reinsurance recoverable balances could become uncollectible.
We have historically reinsured the mortality risk on our life insurance policies primarily on an excess of retention basis or on a quota share basis. When we cede risks to a reinsurer on an excess of retention basis we retain the liability up to a contractually specified amount and the reinsurer is responsible for indemnifying us for amounts in excess of the liability we retain, subject sometimes to a cap. When we cede risks on a quota share basis we share a portion of the risk within a contractually specified layer of reinsurance coverage. We reinsure on a facultative basis for risks with specified characteristics. On a case by case basis, we may retain up to $20 million per life and reinsure 100% of the risk in excess of $20 million. We also reinsure portions of the risk associated with certain whole life policies to a former affiliate and we assume certain term life policies and universal life policies with secondary death benefit guarantees issued by a former affiliate. We routinely evaluate our reinsurance program and may increase or decrease our retention at any time.
We also reinsure portions of the living and death benefit guarantees issued in connection with variable annuities to unaffiliated reinsurers. Under these arrangements, we typically pay a reinsurance premium based on fees associated with the guarantees collected from contract holders, and receive reimbursement for benefits paid or accrued in excess of account values, subject to certain limitations. We reinsure 100% of certain variable annuity risks to a former affiliate.
Our reinsurance is diversified with a group of well-capitalized, highly rated reinsurers. We analyze recent trends in arbitration and litigation outcomes in disputes, if any, with our reinsurers. We monitor ratings and evaluate the financial strength of our reinsurers by analyzing their financial statements. In addition, the reinsurance recoverable balance due from each reinsurer is evaluated as part of the overall monitoring process. Recoverability of reinsurance recoverable balances is evaluated based on these analyses. We generally secure large reinsurance recoverable balances with various forms of collateral, including secured trusts, funds withheld accounts and irrevocable letters of credit.
We reinsure, through 100% quota share reinsurance agreements, certain run-off long-term care and workers’ compensation business that we have originally written. For products in our Run-off segment other than ULSG, we have periodically engaged in reinsurance activities on an opportunistic basis.
The following table presents our ordinary course net reinsurance recoverables from unaffiliated third-party reinsurers as of December 31, 2017.
|
|
Reinsurance
Recoverables
|
A.M. Best
Financial
Strength Rating (1)
|
|||
|
|
(In millions)
|
|
|||
|
The Travelers Co (2)
|
$
|
677
|
|
A++
|
|
|
RGA
|
299
|
|
A+
|
||
|
AXA
|
243
|
|
B+
|
||
|
Munich Re
|
227
|
|
A+
|
||
|
Swiss Re
|
214
|
|
A+
|
||
|
Scor
|
207
|
|
A+
|
||
|
Voya Financial, Inc.
|
162
|
|
A
|
||
|
Aegon NV
|
148
|
|
A+
|
||
|
Optimum Re
|
77
|
|
A
_
|
||
|
Other
|
327
|
|
|
||
|
Total
|
$
|
2,581
|
|
|
|
_______________
|
(1)
|
These financial strength ratings are the most currently available for our reinsurance counterparties, while the companies listed are the parent companies to such counterparties, as there may be numerous subsidiary counterparties to each listed parent.
|
|
(2)
|
Relates to a block of workers compensation insurance policies reinsured in connection with MetLife’s acquisition of Travelers from Citigroup.
|
In addition, in 2000, a block of long-term care policies was sold to Genworth Life Insurance Company and Genworth Life Insurance Company of New York in an indemnity reinsurance transaction with a reinsurance recoverable of $6.5 billion at
35
December 31, 2017. See “— Long-Term Care Reinsurance and Indemnity.” The most currently available financial strength rating is B- for both of these Genworth insurance companies.
Affiliated Reinsurance
We are required to calculate reserves for term life products and ULSG products pursuant to Regulation XXX and Guideline AXXX, respectively. Affiliated reinsurance companies are affiliated insurance companies licensed under specific provisions of insurance law of their respective jurisdictions, such as the Special Purpose Financial Captive law adopted by several states including Delaware, and have a very narrow business plan that specifically restricts the majority or all of their activity to reinsuring business from their affiliates. We are party to reinsurance agreements with a former affiliate in order to mitigate risk, as well as free up capital, which can be used for diverse corporate purposes. Additionally, our reinsurance subsidiary, BRCD, was formed to manage our capital and risk exposures and to support our various operations, through the use of affiliated reinsurance arrangements and related reserve financing. See “Risk Factors — Risks Related to Our Business — We may not be able to take credit for reinsurance, our statutory life insurance reserve financings may be subject to cost increases and new financings may be subject to limited market capacity” and “Regulation — Insurance Regulation.”
Catastrophe Coverage
We have exposure to catastrophes which could contribute to significant fluctuations in our results of operations. We use excess reinsurance agreements, under which the direct writing company reinsures risk in excess of a specific dollar value for each policy within a class of policies, to provide greater diversification of risk and minimize exposure to larger risks. Such excess reinsurance agreements include retention reinsurance agreements and quota share reinsurance agreements. Retention reinsurance agreements provide for a portion of a risk to remain with the direct writing company, and quota share reinsurance agreements provide for the direct writing company to transfer a fixed percentage of all risks of a class of policies. Our life insurance products subject us to catastrophe risk which we do not reinsure other than through our ongoing mortality reinsurance program which transfers risk at the individual policy level.
Long-Term Care Reinsurance and Indemnity
In 2005, our former parent, MetLife acquired Travelers from Citigroup. Travelers was redomesticated to Delaware in 2014, merged with two affiliated life insurance companies and a former offshore, reinsurance subsidiary and renamed MetLife USA, now BLIC. Prior to this acquisition, Travelers agreed to reinsure a 90% quota share of its long-term care insurance business to certain affiliates of General Electric Company, which following a spin-off became part of Genworth Financial, Inc. (“Genworth”) and subsequently agreed to reinsure the remaining 10% quota share of such long-term care insurance business to what became Genworth. The applicable Genworth reinsurers, Genworth Life Insurance Company and Genworth Life Insurance Company of New York, established trust accounts for our benefit to secure their obligations under such arrangements with qualifying collateral. Although the Genworth reinsurers are primarily obligated for the liabilities of the long-term care insurance business, such reinsurance arrangements do not relieve BLIC of its direct liability under the ceded long-term care insurance policies. In connection with the acquisition of Travelers by MetLife, Citigroup agreed to indemnify MetLife for any losses and certain other payment obligations MetLife might incur with respect to the long-term care insurance business reinsured by Genworth. Prior to the Separation from MetLife, MetLife assigned its indemnification rights to us with the consent of Citigroup and, together with MetLife, we agreed to comply with certain obligations relating to these indemnification rights in connection with the long-term care insurance business. The long-term care insurance business of Travelers had reserves of $6.5 billion at December 31, 2017 and BLIC had reinsurance recoverables of $6.5 billion associated with the reinsurance transaction with Genworth at December 31, 2017.
Sales Distribution
We distribute our annuity and life insurance products through a diverse network of independent distribution partners. Our partners include over 400 national and regional brokerage firms, banks, other financial institutions and financial planners, in connection with the sale of our annuity products, and general agencies, financial advisors, brokerage general agencies and financial intermediaries, in connection with the distribution of our life insurance products. We believe this strategy will permit us to maximize penetration of our target markets and distribution partners without incurring the fixed costs of maintaining a proprietary distribution channel and will facilitate our ability to quickly comply with evolving regulatory requirements applicable to the sale of our products. We discuss below the execution of our strategy, certain key strategic distribution relationships and data with respect to the relative importance of our distribution channels.
Execution of our Strategy - Increasing Penetration
It is fundamental to our distribution strategy that we be among the most important manufacturers to each of our most productive distribution partners. Our objective is to be one of the top annuity and life insurance product manufacturers for those distributors who collectively produce 70%-80% of our annuity and life insurance deposits and premiums. In furtherance of our
36
strategy, we seek to differentiate ourselves from our competitors by providing our most productive distributors with focused product, sales and technology support through our approximately 20 strategic relationship managers (“SRMs”) and our excess of 200 internal and external wholesalers.
Strategic Relationship Managers
Our SRMs serve as the principal contact for our largest annuity and life insurance distributors and coordinate the relationship between our wholesalers and the distributor. SRMs provide an enhanced level of service to partners that require more resources to support their larger distribution network. SRMs are responsible for tracking and providing our key distributors with sales and activity data. They participate in business planning sessions with our distributors and are critical in providing us with insights into the product design, education and other support requirements of our principal distributors. They are also responsible for addressing proactively relationship issues with our distributors. They work closely with our wholesalers.
Wholesalers
Our wholesalers are licensed sales representatives who are responsible for providing our distributors with product support and facilitating the ease with which our distributors and customers do business with us. Our wholesalers are organized into internal wholesalers and external wholesalers. Approximately 100 of our wholesalers, which we refer to as internal wholesalers, support our distributors from our Charlotte, North Carolina corporate center where they are responsible for providing telephonic call center and online support functions. Our approximately 100 field sales representatives, which we refer to as external wholesalers, are responsible for providing on site face-to-face product and sales support to our distributors. The external wholesalers have responsibility for a specific geographic region. In addition, we also have external wholesalers dedicated to Primerica and MassMutual.
Strategic Distribution Relationships
We distribute our annuity products through a broad geographic network of over 400 independent distribution partners including wire houses, which we group into distribution channels including national brokerage firms, regional brokerage firms, banks and other financial institutions and independent financial planners. Our annuity distribution relationships have an average tenure in excess of 10 years.
New Distribution Initiatives
In May 2017, we announced an expansion of our suite of Shield Annuities with the availability of our Shield Level 10
SM
annuity. Shield Level 10
SM
was the first new product introduction following the launch of the Brighthouse Financial brand in March 2017. Wells Fargo Advisors serves as the initial distributor for Shield Level 10
SM
.
In connection with the sale of MPCG to MassMutual, we entered into an agreement which would permit us to serve as the exclusive manufacturer for certain proprietary products which would be offered through MassMutual’s career agent channel. We partnered with MassMutual to develop the initial product distributed under this arrangement, the Index Horizons fixed indexed annuity, and agreed on the terms of the related reinsurance.
Relative Channel Importance and Related Data
Our annuity and life insurance products are distributed through a diverse network of distribution relationships. In the tables below we show the relative percentage of new premium production by our principal distribution channels for our annuity and life insurance products.
The table below presents the percentage of ANP of our annuity products by distribution channel.
|
Year Ended December 31, 2017
|
|||||||||||||||
|
Percentage of ANP
|
|||||||||||||||
|
Channel
|
Variable
|
Fixed
|
Shield Annuities
|
Fixed Indexed Annuity
|
Total
|
||||||||||
|
Banks/financial institutions
|
3
|
%
|
—
|
%
|
16
|
%
|
—
|
%
|
19
|
%
|
|||||
|
National brokerage firms
|
1
|
%
|
1
|
%
|
4
|
%
|
—
|
%
|
6
|
%
|
|||||
|
Regional brokerage firms
|
1
|
%
|
1
|
%
|
2
|
%
|
—
|
%
|
4
|
%
|
|||||
|
Independent financial planners
|
24
|
%
|
3
|
%
|
36
|
%
|
6
|
%
|
69
|
%
|
|||||
|
Other
|
2
|
%
|
—
|
%
|
—
|
%
|
—
|
%
|
2
|
%
|
|||||
The table below presents the percentage of ANP of our life insurance policies by distribution channel.
37
|
Year Ended December 31, 2017
|
|||
|
Channel
|
Percentage of
ANP
|
||
|
Brokerage general agencies
|
80
|
%
|
|
|
Financial intermediaries
|
7
|
%
|
|
|
General agencies
|
11
|
%
|
|
|
Financial advisors
|
2
|
%
|
|
Our top five distributors of variable annuity products produced 35%, 16%, 5%, 4% and 4% of our ANP of annuity products for the year ended December 31, 2017.
Our top five distributors of life insurance policies produced 36%, 12%, 9%, 8% and 7% of our LIMRA
(Life Insurance Marketing and Research Association)
production of life insurance policies for the year ended December 31, 2017. Revenues derived from any customer did not exceed 10% of premiums, universal life and investment-type product policy fees and other revenues for the years ended December 31, 2017, 2016 and 2015. Substantially all of our premiums, universal life and investment-type product policy fees and other revenues originated in the U.S. Financial information, including revenues, expenses, adjusted earnings, and total assets by segment, as well as premiums, universal life and investment-type product policy fees and other revenues by major product groups, is provided in
Note 2
of the Notes to the
Consolidated and Combined
Financial Statements. Adjusted earnings is a performance measure that is not based on GAAP. See “Management’s Discussion and Analysis of Financial Condition and Results of Operations — Non-GAAP and Other Financial Disclosures” for a definition of such measure.
Regulation
Index to Regulation
|
Page
|
|
38
Overview
Our life insurance companies are regulated primarily at the state level, with some products and services also subject to federal regulation. In addition, Brighthouse Financial, Inc. and our insurance subsidiaries are subject to regulation under the insurance holding company laws of various U.S. jurisdictions. Furthermore, some of our operations, products and services are subject to ERISA, consumer protection laws, securities, broker-dealer and investment advisor regulations, and environmental and unclaimed property laws and regulations. See “Risk Factors — Regulatory and Legal Risks — Our insurance business is highly regulated, and changes in regulation and in supervisory and enforcement policies may materially impact our capitalization or cash flows, reduce our profitability and limit our growth.”
Insurance Regulation
State insurance regulation generally aims at supervising and regulating insurers, with the goal of protecting policyholders and ensuring that insurance companies remain solvent. Insurance regulators have increasingly sought information about the potential impact of activities in holding company systems as a whole and have adopted laws and regulations enhancing “group-wide” supervision. See “— Holding Company Regulation” for information regarding an enterprise risk report.
Each of our insurance subsidiaries is licensed and regulated in each U.S. jurisdiction where it conducts insurance business. BLIC is licensed to issue insurance products in all U.S. states (except New York), the District of Columbia, the Bahamas, Guam, Puerto Rico, the British Virgin Islands and the U.S. Virgin Islands. BHNY is only licensed to issue insurance products in New York, and NELICO is licensed in all U.S. states and the District of Columbia. The primary regulator of an insurance company, however, is the insurance regulator in its state of domicile. Our insurance subsidiaries, Brighthouse Life Insurance Company, BHNY and NELICO, are domiciled in Delaware, New York and Massachusetts, respectively, and regulated by the Delaware Department of Insurance, the NYDFS and the Massachusetts Division of Insurance, respectively. In addition, BRCD, which provides reinsurance to our insurance subsidiaries, is domiciled in Delaware and regulated by the Delaware Department of Insurance.
The extent of such regulation varies, but most jurisdictions have laws and regulations governing the financial aspects and business conduct of insurers. State laws in the U.S. grant insurance regulatory authorities broad administrative powers with respect to, among other things:
|
•
|
licensing companies and agents to transact business;
|
|
•
|
calculating the value of assets to determine compliance with statutory requirements;
|
|
•
|
mandating certain insurance benefits;
|
|
•
|
regulating certain premium rates;
|
|
•
|
reviewing and approving certain policy forms and rates;
|
|
•
|
regulating unfair trade and claims practices, including through the imposition of restrictions on marketing and sales practices, distribution arrangements and payment of inducements, and identifying and paying to the states benefits and other property that are not claimed by the owners;
|
|
•
|
regulating advertising and marketing of insurance products;
|
|
•
|
protecting privacy;
|
|
•
|
establishing statutory capital (including RBC) and reserve requirements and solvency standards;
|
|
•
|
specifying the conditions under which a ceding company can take credit for reinsurance in its statutory financial statements (i.e., reduce its reserves by the amount of reserves ceded to a reinsurer);
|
|
•
|
fixing maximum interest rates on insurance policy loans and minimum rates for guaranteed crediting rates on life insurance policies and annuity contracts;
|
|
•
|
adopting and enforcing suitability standards with respect to the sale of annuities and other insurance products;
|
|
•
|
approving changes in control of insurance companies;
|
|
•
|
restricting the payment of dividends and other transactions between affiliates; and
|
|
•
|
regulating the types, amounts and valuation of investments.
|
39
Each insurance subsidiary is required to file reports, generally including detailed annual financial statements, with insurance regulatory authorities in each of the jurisdictions in which it does business, and its operations and accounts are subject to periodic examination by such authorities. These subsidiaries must also file, and in many jurisdictions and in some lines of insurance obtain regulatory approval for, rules, rates and forms relating to the insurance written in the jurisdictions in which they operate.
State and federal insurance and securities regulatory authorities and other state law enforcement agencies and attorneys general from time to time may make inquiries regarding our compliance with insurance, securities and other laws and regulations regarding the conduct of our insurance and securities businesses. We cooperate with such inquiries and take corrective action when warranted. See
Note 15
of the Notes to the Consolidated and Combined Financial Statements.
Holding Company Regulation
Insurance holding company laws and regulations vary from jurisdiction to jurisdiction, but generally require a controlled insurance company (i.e., insurers that are subsidiaries of insurance holding companies) to register with state regulatory authorities and to file with those authorities certain reports, including information concerning its capital structure, ownership, financial condition, certain intercompany transactions and general business operations. The NAIC adopted revisions to the NAIC Insurance Holding Company System Model Act (“Model Holding Company Act”) and the Insurance Holding Company System Model Regulation (“Model Holding Company Regulation”) in December 2010 and December 2014. Certain of the states, including Delaware, have adopted insurance holding company laws and regulations in a substantially similar manner to the model law and regulation. Other states, including New York and Massachusetts, have adopted modified versions, although their supporting regulation is substantially similar to the model regulation.
Insurance holding company regulations generally provide that no person, corporation or other entity may acquire control of an insurance company, or a controlling interest in any parent company of an insurance company, without the prior approval of such insurance company’s domiciliary state insurance regulator. Under the laws of each of the domiciliary states of our insurance subsidiaries, any person acquiring, directly or indirectly, 10% or more of the voting securities of an insurance company is presumed to have acquired “control” of the company. This statutory presumption of control may be rebutted by a showing that control does not exist in fact. The state insurance regulators, however, may find that “control” exists in circumstances in which a person owns or controls less than 10% of voting securities.
The laws and regulations regarding acquisition of control transactions may discourage potential acquisition proposals and may delay, deter or prevent a change of control involving us, including through unsolicited transactions that some of our shareholders might consider desirable.
The insurance company laws and regulations include a requirement that the ultimate controlling person of a U.S. insurer file an annual enterprise risk report with the lead state of the insurance holding company system identifying risks likely to have a material adverse effect upon the financial condition or liquidity of the insurer or its insurance holding company system as a whole. To date, all of the states where Brighthouse has domestic insurers have enacted this enterprise risk reporting requirement.
State insurance statutes also typically place restrictions and limitations on the amount of dividends or other distributions payable by insurance subsidiaries to their parent companies, as well as on transactions between an insurer and its affiliates. Dividends in excess of prescribed limits and transactions above a specified size between an insurer and its affiliates require the approval of the insurance regulator in the insurer’s state of domicile.
Under the Delaware Insurance Code, Brighthouse Life Insurance Company is permitted, without prior insurance regulatory clearance, to pay a stockholder dividend as long as the amount of the dividend when aggregated with all other dividends in the preceding 12 months does not exceed the greater of: (i) 10% of its surplus to policyholders as of the end of the immediately preceding calendar year; or (ii) its net statutory gain from operations for the immediately preceding calendar year (excluding realized capital gains), not including pro rata distributions of Brighthouse Life Insurance Company’s own securities. Brighthouse Life Insurance Company will be permitted to pay a stockholder dividend in excess of the greater of such two amounts only if it files notice of the declaration of such a dividend and the amount thereof with the Delaware Commissioner and the Delaware Commissioner either approves the distribution of the dividend or does not disapprove the distribution within 30 days of its filing. In addition, any dividend that exceeds earned surplus (defined as “unassigned funds (surplus)”) as of the immediately preceding calendar year requires insurance regulatory approval. Under the Delaware Insurance Code, the Delaware Commissioner has broad discretion in determining whether the financial condition of a stock life insurance company would support the payment of such dividends to its stockholders.
40
Under the Massachusetts State Insurance Law, NELICO is permitted, without prior insurance regulatory clearance, to pay a stockholder dividend as long as the aggregate amount of the dividend, when aggregated with all other dividends paid in the preceding 12 months, does not exceed the greater of: (i) 10% of its surplus to policyholders as of the end of the immediately preceding calendar year; or (ii) its statutory net gain from operations for the immediately preceding calendar year, not including pro rata distributions of NELICO’s own securities. NELICO will be permitted to pay a dividend in excess of the greater of such two amounts only if it files notice of the declaration of such a dividend and the amount thereof with the Massachusetts Commissioner of Insurance (the “Massachusetts Commissioner”) and the Massachusetts Commissioner either approves the distribution of the dividend or does not disapprove the distribution within 30 days of its filing. In addition, any dividend that exceeds earned surplus (defined as “unassigned funds (surplus)”) as of the last filed annual statutory statement requires insurance regulatory approval. Under the Massachusetts State Insurance Law, the Massachusetts Commissioner has broad discretion in determining whether the financial condition of a stock life insurance company would support the payment of such dividends to its stockholders.
Effective for dividends paid during 2016 and going forward, the New York Insurance Law was amended permitting BHNY, without prior insurance regulatory clearance, to pay stockholder dividends to its parent in any calendar year based on either of two standards. Under one standard, BHNY is permitted, without prior insurance regulatory clearance, to pay dividends out of earned surplus (defined as positive “unassigned funds (surplus)”), excluding 85% of the change in net unrealized capital gains or losses (less capital gains tax), for the immediately preceding calendar year), in an amount up to the greater of: (i) 10% of its surplus to policyholders as of the end of the immediately preceding calendar year, or (ii) its statutory net gain from operations for the immediately preceding calendar year (excluding realized capital gains), not to exceed 30% of surplus to policyholders as of the end of the immediately preceding calendar year. In addition, under this standard, BHNY may not, without prior insurance regulatory clearance, pay any dividends in any calendar year immediately following a calendar year for which its net gain from operations, excluding realized capital gains, was negative. Under the second standard, if dividends are paid out of other than earned surplus, BHNY may, without prior insurance regulatory clearance, pay an amount up to the lesser of: (i) 10% of its surplus to policyholders as of the end of the immediately preceding calendar year, or (ii) its statutory net gain from operations for the immediately preceding calendar year (excluding realized capital gains). In addition, BHNY will be permitted to pay a dividend to its parent in excess of the amounts allowed under both standards only if it files notice of its intention to declare such a dividend and the amount thereof with the New York Superintendent of Financial Services (the “Superintendent”) and the Superintendent either approves the distribution of the dividend or does not disapprove the dividend within 30 days of its filing. Under New York Insurance Law, the Superintendent has broad discretion in determining whether the financial condition of a stock life insurance company would support the payment of such dividends to its stockholders.
Under BRCD’s plan of operations, no dividend or distribution may be made by BRCD without the prior approval of the Delaware Commissioner. During the year ended December 31, 2017, BRCD paid an extraordinary cash dividend of $535 million to Brighthouse Life Insurance Company.
See “Risk Factors — Capital-Related Risks — As a holding company, Brighthouse Financial, Inc. depends on the ability of its subsidiaries to pay dividends.” See also “Market for Registrant’s Common Equity, Related Stockholder Matters and Issuer Purchases of Equity Securities — Dividend Policy” and “Management’s Discussion and Analysis of Financial Condition and Results of Operations — Liquidity and Capital Resources — The Company — Capital — Restrictions on Dividends and Returns of Capital from Insurance Subsidiaries” for further information regarding such limitations.
41
Own Risk and Solvency Assessment Model Act
In September 2012, the NAIC adopted the Risk Management and Own Risk and Solvency Assessment Model Act (“ORSA”), which has been enacted by our insurance subsidiaries’ domiciliary states. ORSA requires that insurers maintain a risk management framework and conduct an internal own risk and solvency assessment of the insurer’s material risks in normal and stressed environments. The assessment must be documented in a confidential annual summary report, a copy of which must be made available to regulators as required or upon request. To date, all of the states where Brighthouse has domestic insurers have enacted ORSA.
Federal Initiatives
Although the insurance business in the United States is primarily regulated by the states, federal initiatives often have an impact on our business in a variety of ways. From time to time, federal measures are proposed which may significantly and adversely affect the insurance business. These areas include financial services regulation, securities regulation, derivatives regulation, pension regulation, privacy, tort reform legislation and taxation. In addition, various forms of direct and indirect federal regulation of insurance have been proposed from time to time, including proposals for the establishment of an optional federal charter for insurance companies. See “Risk Factors — Regulatory and Legal Risks — Our insurance business is highly regulated, and changes in regulation and in supervisory and enforcement policies may materially impact our capitalization or cash flows, reduce our profitability and limit our growth.”
Dodd-Frank Wall Street Reform and Consumer Protection Act (“Dodd-Frank”) effected the most far-reaching overhaul of financial regulation in the U.S. in decades. The full impact of Dodd-Frank on us will depend on the numerous rulemaking initiatives required or permitted by Dodd-Frank and the various studies mandated by Dodd-Frank, a number of which remain to be completed.
Dodd-Frank established the Federal Insurance Office (“FIO”) within the Department of the Treasury, which has the authority to participate in the negotiations of international insurance agreements with foreign regulators for the United States, as well as to collect information about the insurance industry, negotiate covered agreements with one or more foreign governments and recommend prudential standards. While not having a general supervisory or regulatory authority over the business of insurance, the director of this office performs various functions with respect to insurance, including serving as a non-voting member of the Financial Stability Oversight Council (“FSOC”) and making recommendations to the FSOC regarding insurers to be designated for more stringent regulation. On December 12, 2013, the FIO issued a report, mandated by Dodd-Frank, which, among other things, urged the states to modernize and promote greater uniformity in insurance regulation. However, the report also discussed potential federal solutions if states fail to modernize and improve regulation and some of the report’s recommendations, for instance, favored a greater federal role in monitoring financial stability and identifying issues or gaps in the regulation of large national and internationally active insurers.
Under the provisions of Dodd-Frank relating to the resolution or liquidation of certain types of financial institutions, if Brighthouse or another financial institution were to become insolvent or were in danger of defaulting on its obligations, it could be compelled to undergo liquidation with the Federal Deposit Insurance Corporation (“FDIC”) as receiver. For this new regime to be applicable, a number of determinations would have to be made, including that a default by the affected company would have serious adverse effects on financial stability in the U.S. Under this new regime an insurance company such as Brighthouse Life Insurance Company, BHNY or NELICO would be resolved in accordance with state insurance law. If the FDIC were to be appointed as the receiver for another type of company (including an insurance holding company such as Brighthouse Financial, Inc.), the liquidation of that company would occur under the provisions of the new liquidation authority, and not under the Bankruptcy Code, which ordinarily governs liquidations. The FDIC’s purpose under the liquidation regime is to mitigate the systemic risks the institution’s failure poses, which is different from that of a bankruptcy trustee under the Bankruptcy Code. In an FDIC-managed liquidation, the holders of such company’s debt could in certain respects be treated differently than under the Bankruptcy Code. As required by Dodd-Frank, the FDIC has established rules relating to the priority of creditors’ claims and the potentially dissimilar treatment of similarly situated creditors. These provisions could apply to some financial institutions whose outstanding debt securities we hold in our investment portfolios.
The Trump administration has released a memorandum that generally delayed all pending regulations from publication in the Federal Register pending their review and approval by a department or agency head appointed or designated by President Trump. President Trump has also issued an executive order that calls for a comprehensive review of Dodd-Frank and requires the Secretary of the Treasury to consult with the heads of the member agencies of FSOC to identify any laws, regulations or requirements that inhibit federal regulation of the financial system in a manner consistent with the core principles identified in the executive order. On June 8, 2017, the U.S. House of Representatives passed the Financial CHOICE Act of 2017, which proposes to amend or repeal various sections of Dodd-Frank. This proposed legislation will now be considered by the U.S.
42
Senate. We cannot predict what other proposals may be made or what legislation may be introduced or enacted, or what impact any such legislation may have on our business, results of operations and financial condition.
On September 22, 2017, the U.S. Department of the Treasury and the Office of the U.S. Trade Representative entered into a bilateral covered agreement on insurance and reinsurance with the European Union (the “Covered Agreement”), which addresses, among other things, reinsurance collateral requirements and insurance group supervision. In connection with the announcement of its signature, the U.S. Department of the Treasury and the Office of the U.S. Trade Representative released a “Statement of the United States on the Covered Agreement with the European Union” (the “Policy Statement”). To comply with the terms of the Covered Agreement, the Policy Statement encourages each U.S. state to adopt applicable credit for reinsurance laws and regulations and to phase out the amount of collateral required for full credit for reinsurance cessions to European Union reinsurers. It also states that the U.S. expects that the group capital calculation under development by the NAIC will satisfy the Covered Agreement’s group capital assessment requirement. The Covered Agreement is to be fully applicable to the U.S. and the European Union 60 months after signature. However, some parts of the agreement are subject to further procedural requirements, and so full implementation of the Covered Agreement may occur, if at all, only after a significant period of time.
Guaranty Associations and Similar Arrangements
Most of the jurisdictions in which we are admitted to transact business require life insurers doing business within the jurisdiction to participate in guaranty associations, which are organized to pay contractual benefits owed pursuant to insurance policies issued by impaired, insolvent or failed insurers, or those that may become impaired, insolvent or fail, for example, following the occurrence of one or more catastrophic events. These associations levy assessments, up to prescribed limits, on all member insurers in a particular state on the basis of the proportionate share of the premiums written by member insurers in the lines of business in which the impaired, insolvent or failed insurer is engaged. Some states permit member insurers to recover assessments paid through full or partial premium tax offsets.
In December of 2017, the NAIC approved revisions to its Life and Health Insurance Guaranty Association Model Act governing assessments for long-term care insurance. The revisions include a 50/50 split between life and health carriers for future long term care insolvencies, the inclusion of HMOs in the assessment base, and no change to the premium tax offset. Several states are now considering legislation to codify these changes into law, and more states are expected to propose legislation in their 2018 legislative sessions.
In the past five years, the aggregate assessments levied against us have not been material. We have established liabilities for guaranty fund assessments that we consider adequate. See “Risk Factors — Regulatory and Legal Risks — State insurance guaranty associations” and
Note 15
of the Notes to the Consolidated and Combined Financial Statements for additional information on the guaranty association assessments.
Insurance Regulatory Examinations and Other Activities
As part of their regulatory oversight process, state insurance departments conduct periodic detailed examinations of the books, records, accounts, and business practices of insurers domiciled in their states. State insurance departments also have the authority to conduct examinations of non-domiciliary insurers that are licensed in their states. During the years ended December 31, 2017, 2016 and 2015, Brighthouse Life Insurance Company, BHNY and NELICO did not receive any material adverse findings resulting from state insurance department examinations of them or their respective insurance subsidiaries.
Regulatory authorities in a small number of states, Financial Industry Regulatory Authority, Inc. (“FINRA”) and, occasionally, the SEC, have had investigations or inquiries relating to sales of individual life insurance policies, annuities or other products by Brighthouse Life Insurance Company, BHNY and NELICO. These investigations have focused on the conduct of particular financial services representatives, the sale of unregistered or unsuitable products, the misuse of client assets, and sales and replacements of annuities and certain riders on such annuities. Over the past several years, these and a number of investigations by other regulatory authorities were resolved for monetary payments and certain other relief, including restitution payments. We may continue to receive, and may resolve, further investigations and actions on these matters in a similar manner.
In addition, claims payment practices by insurance companies have received increased scrutiny from regulators. See
Note 15
of the Notes to the Consolidated and Combined Financial Statements for further information regarding unclaimed property inquiries and related litigation and sales practices claims.
Policy and Contract Reserve Adequacy Analysis
Annually, our insurance subsidiaries, including BRCD, are required to conduct an analysis of the adequacy of all statutory reserves. In each case, a qualified actuary must submit an opinion which states that the statutory reserves make adequate
43
provision, according to accepted actuarial standards of practice, for the anticipated cash flows required by the contractual obligations and related expenses of the insurance subsidiary. The adequacy of the statutory reserves is considered in light of the assets held by the insurer with respect to such reserves and related actuarial items including, but not limited to, the investment earnings on such assets, and the consideration anticipated to be received and retained under the related policies and contracts. An insurance company may increase reserves in order to submit an opinion without qualification. Since the inception of this requirement, our insurance subsidiaries, which are required by their states of domicile to provide these opinions, have provided such opinions without qualifications.
NAIC
The NAIC is an organization, whose mission is to assist state insurance regulatory authorities in serving the public interest and achieving the insurance regulatory goals of its members, the state insurance regulatory officials. Through the NAIC, state insurance regulators establish standards and best practices, conduct peer reviews, and coordinate their regulatory oversight. The NAIC provides standardized insurance industry accounting and reporting guidance through its Accounting Practices and Procedures Manual (the “Manual”), which states have largely adopted by regulation. However, statutory accounting principles continue to be established by individual state laws, regulations and permitted practices, which may differ from the Manual. Changes to the Manual or modifications by the various state insurance departments may impact our statutory capital and surplus.
In 2015, the NAIC commissioned an initiative to identify changes to the statutory framework for variable annuities that can remove or mitigate the motivation for insurers to engage in captive reinsurance transactions. In September 2015, a third-party consultant engaged by the NAIC provided the NAIC with a preliminary report covering several sets of recommendations regarding AG 43 and RBC C3 Phase II reserve requirements. These recommendations generally focus on (i) mitigating the asset-liability accounting mismatch between hedge instruments and statutory instruments and statutory liabilities, (ii) removing the non-economic volatility in statutory capital charges and the resulting solvency ratios and (iii) facilitating greater harmonization across insurers and products for greater comparability. An updated variable annuity reserve and capital framework proposal was presented at the August 2016 NAIC meeting, followed by a 90-day comment period on the proposal. This updated proposal included the initial recommendations from 2015, but also some new aspects. The standard scenario floor for reserves may incorporate multiple paths. The stochastic calculations may include alternative calibration criteria for equities and other market risk factors, and the RBC C3 Phase II component may reflect a new level of capitalization. The NAIC is continuing its consideration of these recommendations. These recommendations, if adopted, would likely apply to all existing business and may materially change the sensitivity of reserve and capital requirements to capital markets including interest rate, equity markets and volatility, as well as prescribed assumptions for policyholder behavior. It is not possible at this time to predict whether the amount of reserves or capital required to support our variable annuity contracts would increase or decrease if the NAIC adopts any new model laws, regulations and/or other standards applicable to variable annuity business after considering such recommendations, nor is it possible to predict the materiality of any such increase or decrease. It is also not possible to predict the extent to which any such model laws, regulations and/or other standards would affect the effectiveness and design of our risk mitigation and hedging programs. Furthermore, no assurances can be given to whether any such model laws, regulations and/or other standards will be adopted or to the timing of any such adoption.
The NAIC has adopted a new approach for the calculation of life insurance reserves, known as principle-based reserving (“PBR”). PBR became operative on January 1, 2017 in those states where it has been adopted, to be followed by a three-year phase-in period for business issued on or after this date. With respect to the states in which our insurance subsidiaries are domiciled, the Delaware Department of Insurance implemented PBR on January 1, 2017, and the NYDFS has publicly stated its intention to implement this approach, subject to a working group of the NYDFS establishing the necessary reserves safeguards and the adopting of enabling legislation by the New York legislature. Massachusetts has not yet adopted PBR.
The NAIC as well as certain state regulators are currently considering implementing regulations that would apply an impartial conduct standard similar to the Fiduciary Rule to recommendations made in connection with certain annuities and, in the case of New York, life insurance policies. In particular, on December 27, 2017, the NYDFS proposed regulations that would adopt a “best interest” standard for the sale of life insurance and annuity products in New York. The likelihood of enactment of these regulations is uncertain at this time, but if implemented, these regulations could have significant adverse effects on our business and consolidated results of operations.
The NAIC is considering revisions to RBC factors for bonds, real estate, common stock and collateral pledged to support Federal Home Loan Bank (“FHLB”) advances, as well as developing RBC charges for operational and longevity risk. We cannot predict the impact of any potential proposals that may result from these studies.
We cannot predict the capital and reserve impacts or compliance costs, if any, that may result from the above initiatives.
44
Surplus and Capital; Risk-Based Capital
The NAIC has established regulations that provide minimum capitalization requirements based on RBC formulas for insurance companies. Insurers are required to maintain their capital and surplus at or above minimum levels. Regulators have discretionary authority, in connection with the continued licensing of an insurer, to limit or prohibit the insurer’s sales to policyholders if, in their judgment, the regulators determine that such insurer has not maintained the minimum surplus or capital or that the further transaction of business will be hazardous to policyholders. Each of our insurance subsidiaries are subject to RBC requirements and other minimum statutory capital and surplus requirements imposed under the laws of its respective jurisdiction of domicile. RBC is based on a formula calculated by applying factors to various asset, premium, claim, expense and statutory reserve items. The formula takes into account the risk characteristics of the insurer and is calculated on an annual basis. The major categories of risk involved are asset risk, insurance risk, interest rate risk, market risk and business risk, including equity, interest rate and expense recovery risks associated with variable annuities that contain guaranteed minimum death and living benefits. The formula is used as an early warning regulatory tool to identify possible inadequately capitalized insurers for purposes of initiating regulatory action, and not as a means to rank insurers generally. State insurance laws provide insurance regulators the authority to require various actions by, or take various actions against, insurers whose total adjusted capital does not meet or exceed certain RBC levels. As of the date of the most recent annual statutory financial statements filed with insurance regulators, the total adjusted capital of each of our insurance subsidiaries was in excess of each of those RBC levels. See “Management’s Discussion and Analysis of Financial Condition and Results of Operations — Liquidity and Capital Resources” and “Risk Factors — Regulatory and Legal Risks — A decrease in the RBC ratio (as a result of a reduction in statutory surplus and/or increase in RBC requirements) of our insurance subsidiaries could result in increased scrutiny by insurance regulators and rating agencies and have a material adverse effect on our results of operations and financial condition.”
Regulation of Investments
Each of our insurance subsidiaries is subject to state laws and regulations that require diversification of investment portfolios and limit the amount of investments that an insurer may have in certain asset categories, such as below investment grade fixed income securities, real estate equity, other equity investments, and derivatives. Failure to comply with these laws and regulations would cause investments exceeding regulatory limitations to be treated as non-admitted assets for purposes of measuring surplus and, in some instances, would require divestiture of such non-qualifying investments. We believe that the investments made by each of our insurance subsidiaries complied, in all material respects, with such regulations at December 31, 2017.
Cybersecurity Regulation
On February 16, 2017, the NYDFS announced the adoption of a new cybersecurity regulation for financial services institutions, including banking and insurance entities, under its jurisdiction. The new regulation became effective on March 1, 2017 and will be implemented in stages commencing 180 days later. Among other things, this new regulation requires these entities to establish and maintain a cybersecurity program designed to protect the consumers’ private data. The new regulation specifically provides for: (i) implementation and maintenance of, and a governance framework for overseeing, the cybersecurity program and a cybersecurity policy based on a risk assessment to be periodically conducted; (ii) development of access controls and other technology standards for data protection, and the monitoring and testing of the cybersecurity program, in accordance with the entity’s risk assessment; (iii) implementation of policies and procedures designed to ensure the security of private data accessible to or held by third-party service providers; (iv) minimum standards for cyber breach responses, including an incident response plan, preservation of data to respond to such breaches, and notice to NYDFS of material events; and (v) annual certifications of regulatory compliance to the NYDFS. In addition to New York’s cybersecurity regulation, the NAIC adopted the Insurance Data Security Model Law in October 2017. Under the model law, companies that are compliant with the NYDFS cybersecurity regulation are deemed also to be in compliance with the model law. The purpose of the model law is to establish standards for data security and for the investigation and notification of insurance commissioners of cybersecurity events involving unauthorized access to, or the misuse of, certain nonpublic information.
NYDFS Insurance Regulation 210
On March 19, 2018, NYDFS Insurance Regulation 210: Life Insurance and Annuity Non-Guaranteed Elements, will take effect. The regulation establishes standards for the determination and readjustment of non-guaranteed elements (“NGEs”) that may vary at the insurer’s discretion for life insurance policies and annuity contracts delivered or issued in New York. In addition, the regulation establishes guidelines for related disclosure to NYDFS and policy owners. The regulation applies to all individual life insurance policies, individual annuity contracts and certain group life insurance and group annuity certificates. NGEs include such policy elements as expense rates and interest crediting rates.
45
Department of Labor and ERISA Considerations
We manufacture annuities for third parties to sell to tax-qualified pension plans, retirement plans and IRAs, as well as individual retirement annuities sold to individuals that are subject to ERISA or the Internal Revenue Code of 1986, as amended (the “Code”). Also, a portion of our in-force life insurance products are held by tax-qualified pension and retirement plans. While we currently believe manufacturers do not have as much exposure to ERISA and the Code as distributors, certain activities are subject to the restrictions imposed by ERISA and the Code, including the requirement under ERISA that fiduciaries of a Plan subject to Title I of ERISA (an “ERISA Plan”) must perform their duties solely in the interests of the ERISA plan participants and beneficiaries, and those fiduciaries may not cause a covered plan to engage in certain prohibited transactions. The applicable provisions of ERISA and the Code are subject to enforcement by the DOL, the Internal Revenue Service (“IRS”) and the Pension Benefit Guaranty Corporation (“PBGC”).
In addition, the prohibited transaction rules of ERISA and the Code generally restrict the provision of investment advice to ERISA qualified plans, plan participants and IRAs if the investment recommendation results in fees paid to an individual advisor, the firm that employs the advisor or their affiliates that vary according to the investment recommendation chosen.
The DOL issued new regulations on April 6, 2016 that became applicable on June 9, 2017 (the “Fiduciary Rule”). As initially adopted, these rules substantially expand the definition of “investment advice,” thereby broadening the circumstances under which distributors and manufacturers can be considered fiduciaries under ERISA or the Code and subject to an impartial or “best interests” standard in providing such advice. Pursuant to the final rule, certain communications with plans, plan participants and IRA holders, including the marketing of products, and marketing of investment management or advisory services, could be deemed fiduciary investment advice, thus, causing increased exposure to fiduciary liability if the distributor does not recommend what is in the client’s best interests.
In connection with the promulgation of the Fiduciary Rule, the DOL also issued amendments to certain of its prohibited transaction exemptions, and issued BIC, a new prohibited transaction exemption that imposes more significant disclosure and contract requirements to certain transactions involving ERISA plans, plan participants and IRAs. The new and amended exemptions increase fiduciary requirements and fiduciary liability exposure for transactions involving ERISA plans, plan participants and IRAs. The application of the BIC contract and point of sale disclosures required under BIC and the changes made to prohibited transaction exemption 84-24 were delayed until July 1, 2019, except for the impartial conduct standards (i.e., compliance with the “best interest” standard, reasonable compensation, and no misleading statements), which are applicable as of June 9, 2017. Contracts entered into prior to June 9, 2017 are generally “grandfathered” and, as such, are not subject to the requirements of the rule and related exemptions. To retain “grandfathered” status for annuity products, no investment recommendations may be made after the applicability date of the final regulation with respect to such annuity products that were sold to ERISA plans or IRAs.
MetLife sold MPCG, its former Retail segment’s proprietary distribution channel, in July 2016 to MassMutual to complete a transition to an independent third-party distribution model. We will not be engaging in direct distribution of retail products, including IRA products and retail annuities sold into ERISA plans and IRAs, and therefore we anticipate that we will have limited exposure to the new DOL regulations, as the application of the vast majority of the provisions of the new DOL regulations are targeted at such retail products. Specifically, the most onerous of the requirements under the DOL Fiduciary Rule, as currently adopted, relate to BIC. The DOL guidance makes clear that distributors, not manufacturers, are primarily responsible for BIC compliance. However, we will be asked by our distributors, to assist them with preparing the voluminous disclosures required under BIC. Furthermore, if we want to retain the “grandfathered” status described above of current contracts, we will be limited in the interactions we can have directly with customers and the information that can be provided. We also anticipate that we will need to undertake certain additional tasks in order to comply with certain of the exemptions provided in the DOL regulations, including additional compliance reviews of material shared with distributors, wholesaler and call center training and product reporting and analysis. See “Risk Factors — Regulatory and Legal Risks — Our insurance business is highly regulated, and changes in regulation and in supervisory and enforcement policies may materially impact our capitalization or cash flows, reduce our profitability and limit our growth.”
On February 3, 2017, President Trump, in a memorandum to the Secretary of Labor, requested that the DOL prepare an updated economic and legal analysis concerning the likely impact of the new rules, and possible revisions to the rules. In response to President Trump’s request, on June 29, 2017, the DOL issued a request for information related to the Fiduciary Rule and also the DOL’s new and amended exemptions that were published in conjunction with the final rule. The request for information sought public input that could lead to new exemptions or changes and revisions to the final rule. On November 29, 2017, the DOL finalized an 18 month delay, from January 1, 2018 to July 1, 2019, of the applicability of significant portions of the previously proposed exemptions (including BIC and prohibited transaction exemption 84-24), to afford sufficient time to review further the previously adopted rules and such exemptions. The DOL also updated its enforcement policy to indicate that the
46
DOL and IRS will not pursue claims, until July 1, 2019, against fiduciaries who are working diligently and in good faith to comply with the final Fiduciary Rule or treat those fiduciaries as being in violation of the final rule.
While we continue to analyze the impact of the final regulations on our business and work diligently to comply with the final rule, we anticipate that we will need to undertake certain additional tasks in order to comply with certain of the exemptions provided in the DOL regulations, including additional compliance reviews of material shared with distributors, wholesaler and call center training and product reporting and analysis.
The change of administration, the DOL’s June 29, 2017 request for information related to the Fiduciary Rule and related exemptions, and the November 29, 2017 extension of the applicability of many of the conditions of the proposed and revised exemptions leaves uncertainty over whether the regulations will be substantially modified or repealed. This uncertainty could create confusion among our distribution partners, which could negatively impact product sales. We cannot predict what other proposals may be made, what legislation or regulations may be introduced or enacted, or what impact any such legislation or regulations may have on our business, results of operations and financial condition.
On July 11, 2016, the DOL, the IRS and the PBGC proposed revisions to the Form 5500, the form used for ERISA annual reporting. The DOL included the proposed revisions in its Fall 2017 regulatory agenda released December 14, 2017. The revisions affect employee pension and welfare benefit plans, including our ERISA plans and require audits of information, self-directed brokerage account disclosure requirements and additional extensive disclosure. We cannot predict the effect these proposals, if enacted, will have on our business, or what other proposals may be made, what legislation, regulations or exemptions may be introduced or enacted or the impact of any such legislation, regulations or exemptions on our results of operations and financial condition.
In addition, the DOL has issued a number of regulations that increase the level of disclosure that must be provided to plan sponsors and participants. The participant disclosure regulations and the regulations which require service providers to disclose fee and other information to plan sponsors took effect in 2012. In John Hancock Mutual Life Insurance Company v. Harris Trust and Savings Bank (1993), the U.S. Supreme Court held that certain assets in excess of amounts necessary to satisfy guaranteed obligations under a participating group annuity general account contract are “plan assets.” Therefore, these assets are subject to certain fiduciary obligations under ERISA, which requires fiduciaries to perform their duties solely in the interest of ERISA plan participants and beneficiaries. On January 5, 2000, the Secretary of Labor issued final regulations indicating, in cases where an insurer has issued a policy backed by the insurer’s general account to or for an employee benefit plan, the extent to which assets of the insurer constitute plan assets for purposes of ERISA and the Code. The regulations apply only with respect to a policy issued by an insurer on or before December 31, 1998 (“Transition Policy”). No person will generally be liable under ERISA or the Code for conduct occurring prior to July 5, 2001, where the basis of a claim is that insurance company general account assets constitute plan assets. An insurer issuing a new policy that is backed by its general account and is issued to or for an employee benefit plan after December 31, 1998 will generally be subject to fiduciary obligations under ERISA, unless the policy is a guaranteed benefit policy.
The regulations indicate the requirements that must be met so that assets supporting a Transition Policy will not be considered plan assets for purposes of ERISA and the Code. These requirements include detailed disclosures to be made to the employee benefits plan and the requirement that the insurer must permit the policyholder to terminate the policy on 90 days’ notice and receive without penalty, at the policyholder’s option, either (i) the unallocated accumulated fund balance (which may be subject to market value adjustment), or (ii) a book value payment of such amount in annual installments with interest. We have taken and continue to take steps designed to ensure compliance with these regulations.
Federal Tax Reform
On December 22, 2017, President Trump signed the Tax Act into law, resulting in sweeping changes to the tax code. The Tax Act reduced the corporate tax rate to 21%, reduced interest expense deductibility, increased capitalization amounts for deferred acquisition costs, eliminated the corporate alternative minimum tax, provided for determining reserve deductions as 92.81% of statutory reserves, and reduced the dividend received deduction. Most of the changes in the Tax Act are effective as of January 1, 2018. We expect our adjusted earnings effective tax rate to be in the high teens going forward.
The reduction in the corporate rate will require a one-time remeasurement of certain deferred tax items, as well as our liability to MetLife under the Tax Receivables Agreement. For the estimated impact of the Tax Act on our financial statements, including the estimated impact resulting from the remeasurement of our deferred tax assets and liabilities, and the impact of the Tax Act on our liability to MetLife under the Tax Receivables Agreement. See
Note 13
of the Notes to the Consolidated and Combined Financial Statements for additional information. Our actual results may materially differ from our current estimate due to, among other things, further guidance that may be issued by U.S. tax authorities or regulatory bodies and/or changes in interpretations and assumptions we have preliminarily made. We will continue to analyze the Tax Act to finalize its financial statement impact.
47
Consumer Protection Laws
Numerous federal and state laws affect our earnings and activities, including federal and state consumer protection laws. As part of Dodd-Frank, Congress established the Consumer Financial Protection Bureau (“CFPB”) to supervise and regulate institutions that provide certain financial products and services to consumers. Although the consumer financial services subject to the CFPB’s jurisdiction generally exclude insurance business of the kind in which we engage, the CFPB does have authority to regulate non-insurance consumer services we may provide.
Regulation of Over-the-Counter Derivatives
Dodd-Frank includes a framework of regulation of the over-the-counter (“OTC”) derivatives markets which requires clearing of certain types of currently traded OTC derivatives and imposes additional costs, including new reporting and margin requirements, and will likely impose additional regulation on us. Our costs of risk mitigation are increasing under Dodd-Frank. For example, Dodd-Frank imposes requirements, including the requirement to pledge initial margin (i) for “OTC-cleared” transactions (OTC derivatives that are cleared and settled through central clearing counterparties), and (ii) for “OTC-bilateral” transactions (OTC derivatives that are bilateral contracts between two counterparties) entered into after the phase-in period. The initial margin requirements for OTC-bilateral transactions will likely be applicable to us in September 2020. The increased margin requirements, combined with increased capital charges for our counterparties and central clearinghouses with respect to non-cash collateral, will likely require increased holdings of cash and highly liquid securities with lower yields causing a reduction in income and less favorable pricing for OTC-cleared and OTC-bilateral transactions. Centralized clearing of certain OTC derivatives exposes us to the risk of a default by a clearing member or clearinghouse with respect to our cleared derivative transactions. We use derivatives to mitigate a wide range of risks in connection with our businesses, including the impact of increased benefit exposures from certain of our annuity products that offer guaranteed benefits. We have always been subject to the risk that hedging and other management procedures might prove ineffective in reducing the risks to which insurance policies expose us or that unanticipated policyholder behavior or mortality, combined with adverse market events, could produce economic losses beyond the scope of the risk management techniques employed. Any such losses could be increased by higher costs of writing derivatives (including customized derivatives) and the reduced availability of customized derivatives that might result from the implementation of Dodd-Frank and comparable international derivatives regulations.
Dodd-Frank also expanded the definition of “swap” and mandated the SEC and the U.S. Commodity Futures Trading Commission (“CFTC”) study whether “stable value contracts” should be treated as swaps. Pursuant to the new definition and the Commissions’ interpretive regulations, products offered by our insurance subsidiaries other than stable value contracts might also be treated as swaps, even though we believe otherwise. Should such products become regulated as swaps, we cannot predict how the rules would be applied to them or the effect on such products’ profitability or attractiveness to our clients. Federal banking regulators have recently adopted new rules that will apply to certain qualified financial contracts, including many derivatives contracts, securities lending agreements and repurchase agreements, with certain banking institutions and certain of their affiliates. These new rules, which will begin to go into effect in 2019, will generally require the banking institutions and their applicable affiliates to include contractual provisions in their qualified financial contracts that limit or delay certain rights of their counterparties including counterparties’ default rights (such as the right to terminate the contracts or foreclose on collateral) and restrictions on assignments and transfers of credit enhancements (such as guarantees) arising in connection with the banking institution or an applicable affiliate becoming subject to a bankruptcy, insolvency, resolution or similar proceeding. To the extent that any of the derivatives, securities lending agreements or repurchase agreements that we enter into are subject to these new rules, it could limit our recovery in the event of a default and increase our counterparty risk.
Securities, Broker-Dealer and Investment Advisor Regulation
Some of our activities in offering and selling variable insurance products, as well as certain fixed interest rate contracts, are subject to extensive regulation under the federal securities laws administered by the SEC. We issue variable annuity contracts and variable life insurance policies through separate accounts that are registered with the SEC as investment companies under the Investment Company Act. Each registered separate account is generally divided into sub-accounts, each of which invests in an underlying mutual fund which is itself a registered investment company under the Investment Company Act. In addition, the variable annuity contracts and variable life insurance policies issued by these registered separate accounts are registered with the SEC under the Securities Act of 1933, as amended (the “Securities Act”). We also issue fixed interest rate or index-linked contracts with features that require them to be registered as securities under the Securities Act. Brighthouse Securities, LLC (“Brighthouse Securities”) is registered with the SEC as a broker-dealer under the Securities Exchange Act of 1934, as amended (the “Exchange Act”) and approved as a member of, and subject to regulation by, FINRA, and is registered as a broker-dealer in all applicable U.S. states. Its business will be to serve as the principal underwriter and exclusive distributor of the SEC-registered life insurance policies and annuity contracts issued by its affiliates, and the principal underwriter of the registered mutual funds advised by its affiliated investment advisor and used to fund variable annuity contracts and variable life insurance policies. Another one of our subsidiaries is registered as an investment advisor with the SEC under the Investment Advisers Act
48
of 1940, and its primary business is to serve as investment advisor to the registered mutual funds that underlie our variable annuity contracts and variable life insurance policies. Certain variable contract separate accounts sponsored by our subsidiaries are exempt from registration under the Securities Act and the Investment Company Act, but may be subject to other provisions of the federal securities laws. In addition, because our variable contracts are required to be sold by broker-dealers that are FINRA members, sales of our variable contracts also are subject to the requirements of FINRA rules.
Federal, state and other securities regulatory authorities, including the SEC and FINRA, may from time to time make inquiries and conduct examinations regarding our compliance with securities and other laws and regulations. We will cooperate with such inquiries and examinations and take corrective action when warranted. See “
—
Insurance Regulation
—
Insurance Regulatory Examinations and Other Activities.”
Federal and state securities laws and regulations are primarily intended to ensure the integrity of the financial markets, to protect investors in the securities markets, and to protect investment advisory or brokerage clients, and generally grant regulatory agencies broad rulemaking and enforcement powers, including the power to limit or restrict the conduct of business for failure to comply with such laws and regulations.
Environmental Considerations
As an owner and operator of real property, we are subject to extensive federal, state and local environmental laws and regulations. Inherent in such ownership and operation is also the risk that there may be potential environmental liabilities and costs in connection with any required remediation of such properties. In addition, we hold equity interests in companies that could potentially be subject to environmental liabilities. We routinely have environmental assessments performed with respect to real estate being acquired for investment and real property to be acquired through foreclosure. We cannot provide assurance that unexpected environmental liabilities will not arise. However, based on information currently available to us, we believe that any costs associated with compliance with environmental laws and regulations or any remediation of such properties will not have a material adverse effect on our results of operations or financial condition.
Unclaimed Property
We are subject to the laws and regulations of states and other jurisdictions concerning identification, reporting and escheatment of unclaimed or abandoned funds, and are subject to audit and examination for compliance with these requirements.
Company Ratings
Financial strength ratings represent the opinion of rating agencies regarding the ability of an insurance company to pay obligations under insurance policies and contracts in accordance with their terms. Credit ratings indicate the rating agency’s opinion regarding a debt issuer’s ability to meet the terms of debt obligations in a timely manner. They are important factors in our overall funding profile and ability to access certain types of liquidity and capital. The level and composition of regulatory capital at the subsidiary level and our equity capital are among the many factors considered in determining our financial strength ratings and credit ratings. Each agency has its own capital adequacy evaluation methodology, and assessments are generally based on a combination of factors. Rating agencies may increase the frequency and scope of their credit reviews, may request additional information from the companies that they rate and may adjust upward the capital and other requirements employed in the rating agency models for maintenance of certain ratings levels. See
“Management’s Discussion and Analysis of Financial Condition and Results of Operations — Liquidity and Capital Resources — The Company — Rating Agencies” and
“Risk Factors — Risks Related to Our Business — A downgrade or a potential downgrade in our financial strength or credit ratings could result in a loss of business and materially adversely affect our financial condition and results of operations.”
Competition
Both the annuities and the life insurance markets are very competitive, with many participants and no one company dominating the market for all products. According to the American Council of Life Insurers (November 2016), the U.S. life insurance industry is made up of 814 companies with sales and operations across the country. We compete with major, well-established stock and mutual life insurance companies in all of our product offerings. Our Annuities segment also faces competition from other financial service providers that focus on retirement products and advice. Our competitive positioning overall is focused on access to distribution channels, product features and financial strength.
Principal competitive factors in the annuities business include product features, distribution channel relationships, ease of doing business, annual fees, investment performance, speed to market, brand recognition and the financial strength ratings of the insurance company. In particular for the variable annuity business, our living benefit rider product features and the quality of our relationship management and wholesaling support are key drivers in our competitive position. In the fixed annuity business, the crediting rates and guaranteed payout product features are the primary competitive factors, while for index-linked annuities
49
the competitiveness of the crediting methodology is the primary driver. For income annuities, the competitiveness of the lifetime income payment amount is generally the principal factor.
Principal competitive factors in the life insurance business include customer service and distribution channel relationships, price, the financial strength ratings of our insurance subsidiaries and financial stability. For term life, we also focus on our relatively low pricing compared to our competitors, high internal death benefit risk retention and policy conversion guidelines.
Employees
At December 31,
2017
, we had approximately 1,260 employees. We believe that our relations with our employees are satisfactory.
Our Executive Officers
The following table presents certain information regarding our executive officers.
|
Name
|
Age
|
Position
|
||
|
Eric T. Steigerwalt
|
56
|
President and Chief Executive Officer
|
||
|
Anant Bhalla
|
39
|
Executive Vice President and Chief Financial Officer
|
||
|
Peter M. Carlson
|
53
|
Executive Vice President and Chief Operating Officer
|
||
|
Christine M. DeBiase
|
50
|
Executive Vice President, Chief Administrative Officer and General Counsel
|
||
|
Myles J. Lambert
|
43
|
Executive Vice President and Chief Distribution and Marketing Officer
|
||
|
Conor Murphy
|
49
|
Executive Vice President and Chief Product and Strategy Officer
|
||
|
John L. Rosenthal
|
57
|
Executive Vice President and Chief Investment Officer
|
||
Set forth below is biographical information about each of the executive officers named in the table above.
Eric T. Steigerwalt
Business Experience:
|
•
|
President and Chief Executive Officer; Director, Brighthouse Financial, Inc. (August 2016 - present)
|
|
•
|
MetLife (May 1998 - August 2017)
|
|
•
|
Executive Vice President, U.S. Retail (September 2012 - August 2017)
|
|
•
|
Executive Vice President and interim Chief Financial Officer (November 2011 - September 2012)
|
|
•
|
Executive Vice President, Chief Financial Officer of U.S. Business (January 2010 - November 2011)
|
|
•
|
Senior Vice President and Chief Financial Officer of U.S. Business (September 2009 - January 2010)
|
|
•
|
Senior Vice President and Treasurer (May 2007 - September 2009)
|
|
•
|
Senior Vice President and Chief Financial Officer of Individual Business (July 2003 - May 2007)
|
|
•
|
Vice President, AXA S.A., a financial services and insurance company (May 1993 - May 1998)
|
Anant Bhalla
Business Experience:
|
•
|
Executive Vice President and Chief Financial Officer, Brighthouse Financial, Inc. (August 2016 - present)
|
|
•
|
MetLife (April 2014 - August 2017)
|
|
•
|
Senior Vice President and Chief Financial Officer of Retail business (July 2014 - August 2017)
|
|
•
|
Chief Financial Officer of Retail business (April 2014 - July 2014)
|
|
•
|
American International Group, a financial services and insurance company (October 2012 - April 2014)
|
|
•
|
Senior Managing Director, Global Strategy (January 2014 - April 2014)
|
|
•
|
Senior Vice President and Chief Risk Officer, Global Consumer business (October 2012 - January 2014)
|
50
|
•
|
Founding Partner, Bhalla Capital Partners, an investment management and strategic advisory firm (January 2012 - September 2012)
|
|
•
|
Lincoln Financial Group (October 2009 - December 2011)
|
|
•
|
Senior Vice President, Chief Risk Officer and Treasurer (January 2011 - December 2011)
|
|
•
|
Senior Vice President, Treasurer (October 2009 - December 2010)
|
Peter M. Carlson
Business Experience:
|
•
|
Executive Vice President and Chief Operating Officer, Brighthouse Financial, Inc. (June 2017 - present)
|
|
•
|
Executive Vice President and Chief Accounting Officer, MetLife (May 2009 - August 2017)
|
|
•
|
Wells Fargo & Company/Wachovia Corporation, a financial services company (August 2002 - April 2009)
|
|
•
|
Executive Vice President and Deputy Controller, Wells Fargo (January 2009 - April 2009)
|
|
•
|
Executive Vice President, Corporate Controller and Principal Accounting Officer, Wachovia (June 2007 - December 2008)
|
|
•
|
Senior Vice President, Interim Corporate Controller and Principal Accounting Officer, Wachovia (October 2006 - May 2007)
|
|
•
|
Senior Vice President, Accounting and Finance, Wachovia (August 2002 - September 2006)
|
Christine M. DeBiase
Business Experience:
|
•
|
Brighthouse Financial, Inc. (August 2016 - present)
|
|
•
|
Executive Vice President, Chief Administrative Officer and General Counsel (February 2018 - present)
|
|
•
|
Executive Vice President, General Counsel, Corporate Secretary and Interim Head of Human Resources (May 2017 - November 2017)
|
|
•
|
Executive Vice President, General Counsel and Corporate Secretary (August 2016 - February 2018)
|
|
•
|
MetLife (December 1996 - August 2017)
|
|
•
|
Senior Vice President and Associate General Counsel, U.S. Retail (August 2014 - August 2017)
|
|
•
|
Associate General Counsel, Retail (October 2013 - August 2014)
|
|
•
|
Vice President and Secretary (November 2010 - September 2013)
|
|
•
|
Associate General Counsel, Regulatory Affairs (November 2009 - November 2010)
|
|
•
|
Vice President, Compliance (May 2006 - November 2009)
|
Myles J. Lambert
Business Experience:
|
•
|
Executive Vice President and Chief Marketing and Distribution Officer, Brighthouse Financial, Inc. (August 2016 - present)
|
|
•
|
MetLife (July 2012 - August 2017)
|
|
•
|
Senior Vice President, U.S. Retail Distribution and Marketing (April 2016 - August 2017)
|
|
•
|
Senior Vice President, Head of MPCG Northeast Region (August 2014 - April 2016)
|
|
•
|
Vice President, MPCG Northeast Region (July 2012 - August 2014)
|
|
•
|
Executive Director and head of insurance and annuity business, Morgan Stanley, a financial services company (June 2011 - July 2012)
|
51
Conor Murphy
Business Experience:
|
•
|
Executive Vice President and Head of Client Solutions and Strategy, Brighthouse Financial, Inc. (September 2017 - present)
|
|
•
|
MetLife (September 2000 - August 2017)
|
|
•
|
Chief Financial Officer, Latin America region (January 2012 - August 2017)
|
|
•
|
Head of International Strategy and M&A (January 2011 - December 2011)
|
|
•
|
Chief Financial Officer, Europe, Middle East and Africa (EMEA) region (January 2011 - June 2011)
|
|
•
|
Head of Investor Relations (January 2008 - December 2010)
|
|
•
|
Chief Financial Officer, MetLife Investments (June 2002 - December 2007)
|
|
•
|
VP - Investments Audit (December 2000 - June 2002)
|
John L. Rosenthal
Business Experience:
|
•
|
Executive Vice President and Chief Investment Officer, Brighthouse Financial, Inc. (September 2016 - present)
|
|
•
|
MetLife (1984 - August 2017)
|
|
•
|
Senior Managing Director, head of global portfolio management (2011 - August 2017)
|
|
•
|
Senior Managing Director, head of core securities (2004 - 2011)
|
|
•
|
Managing Director, co-head of fixed income and equity investments (2000 - 2004)
|
Trademarks
We have established a portfolio of trademarks in the United States that we consider important in the marketing of our products and services, including for our name, "Brighthouse Financial." We have also filed other trademark applications in the United States, including for our logo design and potential taglines.
Available Information and the Brighthouse Website
Our website is located at www.brighthousefinancial.com. We use our website as a routine channel for distribution of important information, including news releases, analyst presentations, financial information and corporate governance information. We post filings on our website as soon as practicable after they are electronically filed with, or furnished to, the SEC, including our annual and quarterly reports on Forms 10-K and 10-Q and current reports on Form 8-K; our proxy statements; and any amendments to those reports or statements. All such postings and filings are available on the “Investor Relations” portion of our website free of charge. The SEC’s website, www.sec.gov, contains reports, proxy and information statements, and other information regarding issuers that file electronically with the SEC.
We may use our website as a means of disclosing material information and for complying with our disclosure obligations under Regulation Fair Disclosure promulgated by the SEC. These disclosures are included on our website in the “Investor Relations” or “Newsroom” sections. Accordingly, investors should monitor these portions of our website, in addition to following Brighthouse’s press releases, SEC filings, public conference calls and webcasts.
Information contained on or connected to any website referenced in this Annual Report on Form 10-K is not incorporated by reference in this Annual Report on Form 10-K unless expressly noted.
You should carefully consider the factors described below, in addition to the other information set forth in this Annual Report on Form 10-K. These risk factors are important to understanding the contents of this Form 10-K and our other reports. If any of the following events occur, our business, financial condition and operating results may be materially adversely affected. In that event, the trading price of our securities could decline, and you could lose all or part of your investment.
The materialization of any risks and uncertainties set forth below or identified in “Note Regarding Forward-Looking Statements” contained in this Annual Report on Form 10-K and our other filings with the SEC or those that are presently
52
unforeseen or that we currently believe to be immaterial could result in significant adverse effects on our financial condition, results of operations and cash flows. See “Note Regarding Forward-Looking Statements.”
Risks Related to Our Business
Differences between actual experience and actuarial assumptions and the effectiveness of our actuarial models may adversely affect our financial results, capitalization and financial condition
Our earnings significantly depend upon the extent to which our actual claims experience and benefit payments on our products are consistent with the assumptions we use in setting prices for our products and establishing liabilities for future policy benefits and claims. Such amounts are established based on estimates by actuaries of how much we will need to pay for future benefits and claims. To the extent that actual claims and benefits experience is less favorable than the underlying assumptions we used in establishing such liabilities, we could be required to increase our liabilities. We make assumptions regarding policyholder behavior at the time of pricing and in selecting and utilizing the guaranteed options inherent within our products based in part upon expected persistency of the products, which change the probability that a policy or contract will remain in force from one period to the next. Persistency within our annuities business may be significantly affected by the value of GMxBs contained in many of our variable annuities being higher than current account values in light of poor equity market performance or extended periods of low interest rates, as well as other factors. Persistency could be adversely affected generally by developments affecting policyholder perception of us, including perceptions arising from adverse publicity. The pricing of certain of our variable annuity products that contain certain living benefit guarantees is also based on assumptions about utilization rates, or the percentage of contracts that will utilize the benefit during the contract duration, including the timing of the first lifetime income withdrawal. Results may vary based on differences between actual and expected benefit utilization. A material increase in the valuation of the liability could result to the extent emerging and actual experience deviates from these policyholder option utilization assumptions, and in certain circumstances this deviation may impair our solvency.
We use actuarial models to assist us in establishing reserves for liabilities arising from our insurance policies and annuity contracts. We periodically review the effectiveness of these models, their underlying logic and assumptions and, from time to time, implement refinements to our models based on these reviews. We only implement refinements after rigorous testing and validation and, even after such validation and testing our models remain subject to inherent limitations. Accordingly, no assurances can be given as to whether or when we will implement refinements to our actuarial models, and, if implemented, the extent of such refinements. Furthermore, if implemented, any such refinements could cause us to increase the reserves we hold for our insurance policy and annuity contract liabilities which would adversely affect our risk-based capital ratio and the amount of variable annuity assets we hold in excess of CTE95 and, in the case of any material model refinements, could materially adversely affect our financial condition and results of operations.
Due to the nature of the underlying risks and the uncertainty associated with the determination of liabilities for future policy benefits and claims, we cannot determine precisely the amounts which we will ultimately pay to settle our liabilities. Such amounts may vary materially from the estimated amounts, particularly when those payments may not occur until well into the future. We evaluate our liabilities periodically based on accounting requirements, which change from time to time, the assumptions and models used to establish the liabilities, as well as our actual experience. If the liabilities originally established for future benefit payments and claims prove inadequate, we must increase them. Such increases would adversely affect our earnings and could have a material adverse effect on our results of operations and financial condition, including our capitalization and our ability to receive statutory dividends from our operating insurance companies, as well as a material adverse effect on the financial strength ratings which are necessary to support our product sales. See “Management’s Discussion and Analysis of Financial Condition and Results of Operations — Policyholder Liabilities.”
Guarantees within certain of our products may decrease our earnings, decrease our capitalization, increase the volatility of our results, result in higher risk management costs and expose us to increased counterparty risk
Certain of the variable annuity products we offer include guaranteed benefits, including GMDBs, GMWBs and GMABs. While we continue to have GMIBs in force with respect to which we are obligated to perform, we no longer offer GMIBs. We also offer index-linked annuities with guarantees against a defined floor on losses. These guarantees are designed to protect contract holders against significant changes in equity markets and interest rates. Any such periods of significant and sustained negative or low separate account returns, increased equity volatility, or reduced interest rates could result in an increase in the valuation of our liabilities associated with those products. In addition, if the separate account assets consisting of fixed income securities, which support the guaranteed index-linked return feature are insufficient to reflect a period of sustained growth in the equity-index on which the product is based, we may be required to support such separate accounts with assets from our general account and increase our liabilities. An increase in these liabilities would result in a decrease in our net income and could materially and adversely affect our financial condition, including our capitalization and our ability to receive statutory dividends from our operating insurance companies, as well as the financial strength ratings which are necessary to support our product
53
sales. See “Management’s Discussion and Analysis of Financial Condition and Results of Operations — Results of Operations — Actuarial Assumption Review.”
Additionally, we make assumptions regarding policyholder behavior at the time of pricing and in selecting and utilizing the guaranteed options inherent within our products (e.g., utilization of option to annuitize within a GMIB product). An increase in the valuation of the liability could result to the extent emerging and actual experience deviates from these policyholder option utilization assumptions. On an annual basis we review key actuarial assumptions used to record our variable annuity liabilities, including those assumptions regarding policyholder behavior. Changes to assumptions based on our annual actuarial assumption review in future years could result in an increase in the liabilities we record for future policy benefits and claims to a level that may materially and adversely affect our results of operations and financial condition which, in certain circumstances, could impair our solvency. See “Business — Risk Management Strategies” and “Management’s Discussion and Analysis of Financial Condition and Results of Operations — Results of Operations — Actuarial Assumption Review.”
We also use hedging and other risk management strategies to mitigate the liability exposure primarily related to capital market risks. These strategies involve the use of reinsurance and derivatives, which may not be completely effective. For example, in the event that reinsurers, derivative counterparties or central clearinghouses are unable or unwilling to pay, we remain liable for the guaranteed benefits. See “— Our variable annuity exposure management strategy may not be effective, may result in net income volatility and may negatively affect our statutory capital.”
In addition, capital markets hedging instruments may not effectively offset the costs of guarantees or may otherwise be insufficient in relation to our obligations. Furthermore, we are subject to the risk that changes in policyholder behavior or mortality, combined with adverse market events, could produce economic losses not addressed by the risk management techniques employed. These, individually or collectively, may have a material adverse effect on our results of operations, including net income, capitalization, financial condition or liquidity including our ability to receive dividends from our insurance operating companies. See “Business — Segments and Corporate & Other — Annuities — Current Products — Variable Annuities” for further consideration of the risks associated with guaranteed benefits.
Our variable annuity exposure management strategy may not be effective, may result in net income volatility and may negatively affect our statutory capital
We have recently completed the process of modifying our variable annuity exposure management strategy to emphasize as an objective the mitigation of the potential adverse effects of changes in equity markets and interest rates on our statutory capitalization and statutory distributable cash flows. The principal focus of our exposure risk management program is to maintain assets supporting our variable annuity contract guarantees at the Variable Annuity Target Funding Level, which we intend to be CTE95.
We intend to hold assets supporting our variable annuity contracts at our Variable Annuity Target Funding Level to sustain asset adequacy during modest market downturns without the use of derivative instruments and, accordingly, reduce the need for hedging the daily or weekly fluctuations from small movements in capital markets. We focus our hedging activities primarily on mitigating the risk from larger movements in capital markets, which may deplete contract holder account values and may increase long-term guarantee claims. We also intend to make greater use of longer dated derivative instruments. However, our hedging strategy may not be fully effective. In connection with our exposure risk management program we may determine to seek the approval of applicable regulatory authorities to permit us to increase our hedge limits consistent with those contemplated by the program. No assurance can be given that the approvals we request, if any, will be obtained and whether any such approvals would be subject to qualifications, limitations or conditions. In addition, the hedging instruments we enter into may not effectively offset the costs of variable annuity contract guarantees or may otherwise be insufficient in relation to our obligations. If our capital is depleted in the event of persistent market downturns, we will need to replenish it by holding additional capital, which we may have allocated for other uses, or purchasing additional hedging protection through the use of more expensive derivatives with strike levels at the current market level. Under our hedging strategy, changes from period to period in the valuation of our policyholder benefits and claims and net derivative gains (losses) may result in more significant volatility, which in certain circumstances could be material, to our results of operations and financial condition under GAAP and our statutory capital levels than has been the case historically.
In addition, estimates and assumptions we make in connection with hedging activities may fail to reflect or correspond to our actual long-term exposure in respect of our guarantees. Further, the risk of increases in the costs of our guarantees not covered by our hedging and other capital and risk management strategies may become more significant due to changes in policyholder behavior driven by market conditions or other factors. The use of assets and derivative instruments may not effectively mitigate the effect of changes in policyholder behavior.
Finally, the cost of our hedging program may be greater than anticipated because adverse market conditions can limit the availability and increase the costs of the derivatives we intend to employ and such costs may not be recovered in the pricing of
54
the underlying products we offer. The above factors, individually or collectively, may have a material adverse effect on our results of operations, financial condition, capitalization and liquidity. See “— Guarantees within certain of our products may decrease our earnings, decrease our capitalization, increase the volatility of our results, result in higher risk management costs and expose us to increased counterparty risk.” See also “Business — Risk Management Strategies” and “Management’s Discussion and Analysis of Financial Condition and Results of Operations — Results of Operations — Actuarial Assumption Review.”
Our ULSG asset requirement target may not ensure we have sufficient assets to meet our future ULSG policyholder obligations and may result in net income volatility
We actively manage the market risk sensitivity related to our in-force ULSG exposure specifically to adapt to changes in interest rates.
We have utilized our NY Regulation 126 Cash Flow Testing (“ULSG CFT”) modeling approach as the basis for setting our ULSG asset requirement target for our affiliated reinsurance companies. For the business that remains in the operating companies, we set our ULSG asset requirement target to equal the actuarially determined statutory reserves under stressed conditions, which, taken together with our ULSG asset requirement target of our affiliated reinsurers, comprises our total ULSG asset requirement target (“ULSG Target”). Under this approach we assume that interest rates remain flat or decline as compared to current levels and our actuarial assumptions include a provision for adverse deviation.
We seek to mitigate exposure to interest rate risk associated with these liabilities by maintaining ULSG Assets at or in excess of our ULSG Target in different interest rate environments. We define “ULSG Assets” as (i) total general account assets supporting statutory reserves and capital, and (ii) interest rate derivative instruments dedicated to mitigate ULSG interest rate exposures.
Our ULSG Target is sensitive to the actual and future expected level of long-term U.S. interest rates. If interest rates fall, our ULSG Target increases, and if interest rates rise, our ULSG Target declines. We primarily use interest rate swaps to better protect statutory capitalization from potential losses due to an increase in reserves to achieve our ULSG Target in lower interest rate environments. We have implemented a dedicated interest rate risk mitigation program for our ULSG business. This risk mitigation strategy may negatively impact our GAAP equity and net income in circumstances in which interest rates are rising. Under rising interest rates, our ULSG Target will likely decline, whereas our reported ULSG GAAP liabilities are predominately insensitive to market conditions.
This risk mitigation strategy will likely result in higher net income volatility due to the insensitivity of GAAP liabilities to changes in interest rates. Our interest rate derivative instruments may not effectively offset the costs of our ULSG policyholder obligations or may otherwise be insufficient in relation to our objectives. In addition, the assumptions we make in connection with our risk mitigation strategy may fail to reflect or correspond to actual long-term exposure to our ULSG policyholder obligations. If our liquid investments are depleted we will need to replenish our liquid portfolio by selling higher-yielding less liquid assets, which we may have allocated for other uses. The above factors, individually or collectively, may have a material adverse effect on our results of operations, financial condition, capitalization or liquidity. See “Business — Risk Management Strategies — ULSG Market Risk Exposure Management.”
We may be required to hold additional statutory reserves against our variable annuities as a result of AG 43, which could impair our ability to make distributions to our shareholders
We are required to calculate the statutory reserves which support our variable annuity products in conformity with AG 43. The principal components of the AG 43 reserve calculation are a calculation referred to as CTE utilizing stochastic analysis across 1,000 capital market scenarios and a deterministic calculation based on a single standard scenario (“Standard Scenario”). The reserves we carry for our variable annuity contracts are required under AG 43 to include the greater of the CTE or the Standard Scenario. See “Management’s Discussion and Analysis of Financial Condition and Results of Operations — Liquidity and Capital Resources — Parent Company — Constraints on Parent Company Liquidity.”
We intend to support our variable annuity contracts with assets which are $2.0 billion to $3.0 billion in excess of the average amount of assets required under CTE95. Under our Base Case Scenario (which, although we believe reasonable, does not incorporate all capital markets and other scenarios relevant to asset adequacy and reserving) in the near term we anticipate the assets we hold to support our variable annuity contracts at CTE95 will exceed the amount required by AG 43. Under this scenario, we anticipate that beginning in approximately 2021 under AG 43 as currently in effect the Standard Scenario Reserve Amount will exceed the amount that would be required to be held consistent with CTE95 (although still less than CTE95 plus $2.0 billion to $3.0 billion), and that the amount of such excess will increase materially in subsequent years.
During the period that the Standard Scenario Reserve Amount materially exceeds CTE95, our insurance subsidiaries’ RBC ratios and surplus will be adversely affected to the extent we make distributions to our shareholders. Notwithstanding this impact, and although no assurances can be given, under our Base Case Scenario we believe that during this period our excess reserving
55
requirements under the standard scenario will allow us to maintain our Combined RBC ratio, surplus and financial strength ratings at levels necessary to market and sell our products in accordance with our business plan. If anticipated regulatory reform fails to bring AG 43 calculations in line with the NAIC’s current RBC C3 Phase II requirements, which require us to hold assets to support our variable annuity contracts at a CTE90 standard, we may be required to pay extraordinary dividends from Brighthouse Life Insurance Company, which would be subject to regulatory approval, in order to make distributions to our shareholders. Furthermore, absent such regulatory reform, we may seek regulatory relief or engage in transactions, including restructuring or financing transactions, to mitigate the effect of the standard scenario on the surplus and RBC ratios of our insurance subsidiaries.
The primary objective of our variable annuity exposure management program is to mitigate the impact on our statutory balance sheet from any increase in CTE95 total asset requirements under capital market stress conditions. We seek to accomplish this by using derivatives instruments together with holding $2.0 billion to $3.0 billion in excess of the CTE95 requirement to fund the first dollar increase in CTE95 requirements under stressed capital market conditions. We do not currently intend our exposure management program to address any potential increase in excess standard scenario requirements above CTE95 under stressed market conditions. Under moderate to extreme market conditions, this may result in deterioration in the RBC ratio of our insurance subsidiaries, until capital markets recover, although under these conditions we still expect to maintain the RBC ratio of our insurance subsidiaries in excess of minimum regulatory requirements. Our current intentions notwithstanding, we may, in the future, opportunistically consider adding incremental hedge protection to mitigate the impact of capital market stress conditions on standard scenario reserve funding requirements in excess of CTE95.
No assurances can be given that the assumptions underlying our Base Case Scenario can or will be realized. In addition, our liquidity, statutory capitalization, results of operations and financial condition may be affected by a broad range of capital market scenarios, which, depending on whether they positively or adversely affect account values, could materially positively or adversely affect our reserving requirements under AG 43. See “Business — Risk Management Strategies” and “Management’s Discussion and Analysis of Financial Condition and Results of Operations — Results of Operations — Actuarial Assumption Review.”
A sustained period of low equity market prices and interest rates that are lower than those we assumed when we issued our variable annuity products could have a material adverse effect on our results of operations, capitalization and financial condition
Future policy benefit liabilities for GMDBs and GMLBs under our variable annuity contracts are based on the value of the benefits we expect to be payable under such contracts in excess of the contract holders’ projected account balances. We determine the fees we charge for providing these guarantees in substantial part on the basis of assumptions we make with respect to the growth of the account values relating to these contracts, including assumptions with respect to investment performance. If the actual growth in account values differs from our initial assumptions we may need to increase or decrease the amount of future benefit liabilities we record to the extent that other factors we consider in estimating the expected value of benefits payable, including policyholder behavior, do not offset the impact of changes in our assumptions with respect to investment performance. Although extreme declines or shocks in equity markets and interest rates can increase the level of reserves we need to hold to fund guarantees, other types of economic scenarios can also impact the adequacy of our reserves. For example, certain scenarios involving sustained stagnation in equity markets and low interest rates would adversely affect growth in account values and could require us to materially increase our benefit liabilities. As a result, in the absence of incremental management actions and not taking into account the effects of new business, our ability to retain the ratings necessary to market and sell our products, as well as our ability to repay or refinance indebtedness for borrowed money, could be materially adversely affected and our solvency could be impaired.
Elements of our business strategy are new and may not be effective in accomplishing our objectives
Our objective is to leverage our competitive strengths to distinguish ourselves in the individual life insurance and annuity markets and, over the longer term, to generate more distributable cash from our business. We seek to achieve this by being a focused product manufacturer with an emphasis on independent distribution, while having the goal of achieving a competitive expense ratio through financial discipline. We intend to achieve our goals by focusing on target market segments, concentrating on product manufacturing, maintaining a strong balance sheet and using the scale of our seasoned in-force business to support the effectiveness of our risk management program, and focusing on operating cost and flexibility. See “Business — Overview — Our Business Strategy.”
There can be no assurance that our strategy will be successful as it may not adequately alleviate the risks relating to less diverse product offerings; volatility of, and capital requirements with respect to, variable annuities; risk of loss with respect to use of derivatives in hedging transactions; and greater dependence on a relatively small number of independent distributors to market our products and generate most of our sales. Furthermore, such distributions may be subject to differing commission
56
structures depending on the product sold and there can be no assurance that these new commission structures will be acceptable. See “
—
General Risks
— W
e may experience difficulty in marketing and distributing products through our distribution channels.” We may also be unable to reduce operating costs and enhance efficiencies, at least initially, due to the increased costs as a result of our Separation from MetLife, as well as the cost and duration of transitional services agreements. See “Certain Relationships and Related Person Transactions.” For these reasons, no assurances can be given that we will be able to execute our strategy or that our strategy will achieve our objectives.
We incurred significant indebtedness in connection with the Separation and have incurred other indebtedness that for a period of time will not provide us with liquidity or interest-expense tax deductions and the terms of which could restrict our operations and use of funds that may result in a material adverse effect on our results of operations and financial condition
We incurred substantial indebtedness in connection with the Separation in the form of debt securities issued to investors and bank debt from third-party lenders. These initial borrowings, and any further borrowings, may reduce our capacity to access credit markets for additional liquidity until such time as our equity and credit position are strengthened. We used a significant portion of the proceeds of these initial borrowings to make a distribution to MetLife as partial consideration for MetLife’s transfer of assets to Brighthouse and, accordingly, we are required to service the initial borrowings with cash at Brighthouse and dividends from our insurance subsidiaries and other operating subsidiaries. The funds needed to service these initial borrowings will not be available to meet any short-term liquidity needs we may have, invest in our business or pay dividends on our common stock. Furthermore, Brighthouse Financial, Inc. was incorporated in 2016 and our life insurance subsidiaries were transferred to it on July 28, 2017. Pursuant to current IRS regulations, Brighthouse Financial, Inc. will not be permitted to join in the filing of a U.S. consolidated federal income tax return with our insurance subsidiaries for a period of five taxable years following the Distribution. Additionally, the Tax Act generally limits the deductibility of interest payments to a percentage of a taxpayer’s taxable income (except to the extent of the taxpayer’s interest income). As a result, we may not initially be able to fully deduct the interest payments on certain indebtedness we incurred at the Brighthouse Financial, Inc. level in connection with the Separation or certain other borrowings from the taxable income of our insurance subsidiaries.
On December 2, 2016, we entered into a $2.0 billion five-year senior unsecured revolving credit facility that matures on December 2, 2021 (the “Revolving Credit Facility”) and, on July 21, 2017, we entered into a $600 million senior unsecured term loan facility that matures on December 2, 2019 (the “2017 Term Loan Facility” and, together with the Revolving Credit Facility, the “Brighthouse Credit Facilities”). In August 2017, we borrowed the full $600 million under the 2017 Term Loan Facility and, on June 22, 2017, we issued $1.5 billion aggregate principal amount of 3.700% senior notes due 2027 (the “2027 Senior Notes”) and $1.5 billion aggregate principal amount of 4.700% senior notes due 2047 (the “2047 Senior Notes” and, together with the 2027 Senior Notes, the “Senior Notes”) to third-party investors.
We have historically relied upon MetLife for working capital requirements on a short-term basis and for other financial support functions. We are no longer able to rely on MetLife’s earnings, assets or cash flow, and we are responsible for servicing our own debt, obtaining and maintaining sufficient working capital and paying dividends. We may not generate sufficient funds to service our debt and meet our business needs, such as funding working capital or the expansion of our operations. In addition, our substantial leverage could put us at a competitive disadvantage compared to our competitors that are less leveraged. Our substantial leverage could also impede our ability to withstand downturns in our industry or the economy in general.
Our failure to comply with the agreements relating to our outstanding indebtedness, including as a result of events beyond our control, could result in an event of default that could materially and adversely affect our business, financial condition, results of operations or cash flows.
If there were an event of default under any of the agreements relating to our outstanding indebtedness, including the Revolving Credit Facility, the 2017 Term Loan Facility, the Senior Notes and a new $10.0 billion financing arrangement which consists of credit-linked notes each with a term of 20 years entered into in April 2017 by BRCD and a pool of highly rated third-party reinsurers (the “Reinsurance Financing Arrangement”) we may not be able to incur additional indebtedness under the Revolving Credit Facility and the holders of the defaulted debt could cause all amounts outstanding with respect to that debt to be due and payable immediately.
The Brighthouse Credit Facilities and the Reinsurance Financing Arrangement contain certain administrative, reporting, legal and financial covenants, including in certain cases requirements to maintain a specified minimum consolidated net worth and to maintain a ratio of indebtedness to total capitalization not in excess of a specified percentage, and limitations on the dollar amount of indebtedness that may be incurred by our subsidiaries, which could restrict our operations and use of funds. See “Management’s Discussion and Analysis of Financial Condition and Results of Operations — Liquidity and Capital Resources — Parent Company — Capital.” Failure to comply with the covenants in the Revolving Credit Facility or fulfill the conditions to borrowings, or the failure of lenders to fund their lending commitments (whether due to insolvency, illiquidity or other reasons) in the amounts provided for under the terms of the Revolving Credit Facility, would restrict the ability to access the Revolving
57
Credit Facility when needed and, consequently, could have a material adverse effect on our liquidity, results of operations and financial condition.
Our ability to make payments on and to refinance our indebtedness, including the debt retained or incurred in connection with the Separation, as well as any future indebtedness that we may incur, will depend on our ability to generate cash in the future from operations, financings or asset sales. Our ability to generate cash to meet our debt obligations in the future is sensitive to capital market returns, primarily due to our variable annuity business. Overall, our ability to generate cash is subject to general economic, financial market, competitive, legislative, regulatory, client behavioral, and other factors that are beyond our control.
The lenders who hold our debt could also accelerate amounts due in the event that we default, which could potentially trigger a default or acceleration of the maturity of our other debt. We cannot assure you that our assets or cash flow would be sufficient to fully repay borrowings under our outstanding debt instruments if accelerated upon an event of default, which could have a material adverse effect on our ability to continue to operate as a going concern. If we are not able to repay or refinance our debt as it becomes due, we may be forced to take disadvantageous actions, including significant business and legal entity restructuring, limited new business investment, selling assets or dedicating an unsustainable level of our cash flow from operations to the payment of principal and interest on our indebtedness. In addition, our ability to withstand competitive pressures and to react to changes in the insurance industry could be impaired. Further, if we are unable to repay, refinance or restructure our secured indebtedness, the holders of such indebtedness could proceed against any collateral securing that indebtedness.
A downgrade or a potential downgrade in our financial strength or credit ratings could result in a loss of business and materially adversely affect our financial condition and results of operations
Financial strength ratings are published by various nationally recognized statistical rating organizations (“NRSROs”) and similar entities not formally recognized as NRSROs. They indicate the NRSROs’ opinions regarding an insurance company’s ability to meet contract holder and policyholder obligations, and are important to maintaining public confidence in our products and our competitive position. See “Management’s Discussion and Analysis of Financial Condition and Results of Operations — Liquidity and Capital Resources — The Company — Rating Agencies” for additional information regarding our financial strength ratings, including current rating agency ratings and outlooks.
Downgrades in our financial strength ratings or changes to our ratings outlooks could have a material adverse effect on our financial condition and results of operations in many ways, including:
|
•
|
reducing new sales of insurance products and annuity products;
|
|
•
|
adversely affecting our relationships with independent sales intermediaries;
|
|
•
|
increasing the number or amount of policy surrenders and withdrawals by contract holders and policyholders;
|
|
•
|
requiring us to reduce prices for many of our products and services to remain competitive;
|
|
•
|
providing termination rights for the benefit of our derivative instrument counterparties;
|
|
•
|
providing termination rights to cedents under assumed reinsurance contracts;
|
|
•
|
adversely affecting our ability to obtain reinsurance at reasonable prices, if at all; and
|
|
•
|
subjecting us to potentially increased regulatory scrutiny.
|
Certain rating agencies took initial rating actions in response to the initial filing with the SEC on October 5, 2016 of our registration statement on Form 10 in connection with the then proposed Separation (as amended, the “Form 10”), and certain rating agencies took additional rating actions during 2017.
Credit ratings are opinions of each agency with respect to specific securities and contractual financial obligations and the issuer’s ability and willingness to meet those obligations when due, and are important factors in our overall financial profile, including funding profiles, and our ability to access certain types of liquidity. Downgrades in our credit or financial strength ratings or changes to our rating outlook could have a material adverse effect on our financial condition and results of operations in many ways, including limiting our access to distributors, restricting our ability to generate new sales because our products depend on strong financial strength ratings to compete effectively, limiting our access to capital markets, and potentially increasing the cost of debt, which could adversely affect our liquidity.
In view of the difficulties experienced by many financial institutions as a result of the financial crisis and ensuing global recession, including our competitors in the insurance industry, we believe it is possible that the NRSROs will continue to heighten the level of scrutiny that they apply to insurance companies, will continue to increase the frequency and scope of their credit reviews, will continue to request additional information from the companies that they rate, and may adjust upward the capital and other requirements employed in the models for maintenance of certain ratings levels. Our ratings could be downgraded at
58
any time and without notice by any NRSRO. Any such downgrade could result in a reduction in new sales of our insurance products, which could have a material adverse effect on our results of operations.
Reinsurance may not be available, affordable or adequate to protect us against losses
As part of our overall risk management strategy, our insurance subsidiaries purchase reinsurance from third-party reinsurers for certain risks we underwrite. While reinsurance agreements generally bind the reinsurer for the life of the business reinsured at generally fixed pricing, market conditions beyond our control determine the availability and cost of the reinsurance protection for new business. In certain circumstances, the price of reinsurance for business already reinsured may also increase. Also, under certain of our reinsurance arrangements, it is common for the reinsurer to have a right to increase reinsurance rates on in-force business if there is a systematic deterioration of mortality in the market as a whole. Any decrease in the amount of reinsurance will increase our risk of loss and any increase in the cost of reinsurance will, absent a decrease in the amount of reinsurance, reduce our earnings. Accordingly, we may be forced to incur additional expenses for reinsurance or may not be able to obtain sufficient reinsurance on acceptable terms, which could adversely affect our ability to write future business or result in the assumption of more risk with respect to those policies we issue. See “Business — Reinsurance Activity.”
If the counterparties to our reinsurance or indemnification arrangements or to the derivatives we use to hedge our business risks default or fail to perform, we may be exposed to risks we had sought to mitigate, which could materially adversely affect our financial condition and results of operations
We use reinsurance, indemnification and derivatives to mitigate our risks in various circumstances. In general, reinsurance, indemnification and derivatives do not relieve us of our direct liability to our policyholders, even when the reinsurer is liable to us. Accordingly, we bear credit risk with respect to our reinsurers, indemnitors, counterparties and central clearinghouses. A reinsurer’s, indemnitor’s, counterparty’s or central clearinghouse’s insolvency, inability or unwillingness to make payments under the terms of reinsurance agreements, indemnity agreements or derivatives agreements with us or inability or unwillingness to return collateral could have a material adverse effect on our financial condition and results of operations. See “Business — Reinsurance Activity.”
In addition, we use derivatives to hedge various business risks. We enter into a variety of derivatives, including options, forwards, interest rate, credit default and currency swaps with a number of counterparties on a bilateral basis for uncleared OTC derivatives and with clearing brokers and central clearinghouses for OTC-cleared derivatives (OTC derivatives that are cleared and settled through central clearing counterparties). See “Management’s Discussion and Analysis of Financial Condition and Results of Operations — Derivatives.” If our counterparties, clearing brokers or central clearinghouses fail or refuse to honor their obligations under these derivatives, our hedges of the related risk will be ineffective. Such failure could have a material adverse effect on our financial condition and results of operations.
Extreme mortality events resulting from catastrophes may adversely impact liabilities for policyholder claims and reinsurance availability
Our life insurance operations are exposed to the risk of catastrophic mortality, such as a pandemic or other event that causes a large number of deaths. For example, significant influenza pandemics have occurred three times in the last century. The likelihood, timing, and severity of a future pandemic cannot be predicted. A significant pandemic could have a major impact on the global economy or the economies of particular countries or regions, including travel, trade, tourism, the health system, food supply, consumption, overall economic output, as well as on the financial markets. In addition, a pandemic that affected our employees or the employees of our distributors or of other companies with which we do business could disrupt our business operations. The effectiveness of external parties, including governmental and non-governmental organizations, in combating the spread and severity of such a pandemic could have a material impact on the losses we experience. These events could cause a material adverse effect on our results of operations in any period and, depending on their severity, could also materially and adversely affect our financial condition.
Consistent with industry practice and accounting standards, we establish liabilities for claims arising from a catastrophe only after assessing the probable losses arising from the event. We cannot be certain that the liabilities we have established will be adequate to cover actual claim liabilities. A catastrophic event or multiple catastrophic events could have a material adverse effect on our results of operations and financial condition. Conversely, improvements in medical care and other developments which positively affect life expectancy can cause our assumptions with respect to longevity, which we use when we price our products, to become incorrect and, accordingly, can adversely affect our results of operations and financial condition.
We may not be able to take credit for reinsurance, our statutory life insurance reserve financings may be subject to cost increases and new financings may be subject to limited market capacity
We currently utilize capital markets solutions to finance a portion of our statutory reserve requirements for several products, including, but not limited to, our level premium term life products subject to the NAIC Valuation of Life Insurance Policies
59
Model Regulation (“Regulation XXX”), and ULSG subject to NAIC Actuarial Guideline 38 (“Guideline AXXX”). Following the receipt of all approvals from applicable regulators, effective April 28, 2017, we merged certain of our affiliate reinsurance companies into BRCD, a licensed reinsurance subsidiary of Brighthouse Life Insurance Company. This single, larger reinsurance subsidiary provides certain benefits to Brighthouse, including (i) enhancing the ability to hedge the interest rate risk of the reinsured liabilities, (ii) allowing increased allocation flexibility in managing an investment portfolio, and (iii) improving operating flexibility and administrative cost efficiency, but there can be no assurance that such benefits will materialize. BRCD obtained statutory reserve financing through a funding structure involving a single financing arrangement supported by a pool of highly rated third-party reinsurers, with financing at a lower cost than previous financing arrangements, which were terminated effective April 28, 2017. The restructured financing facility has a term of 20 years, but the liabilities being supported by such facility have a duration, in some cases, of more than 30 years. Therefore, we may need to refinance this facility in the future and any such refinancing may not be at costs attractive to us or may not be available at all. If such financing cannot be obtained on favorable terms, our statutory capitalization, results of operations and financial condition, as well as our competitiveness, could be adversely affected.
Future capacity for these statutory reserve funding structures in the marketplace is not guaranteed. During 2014, the NAIC approved a new regulatory framework applicable to the use of captive insurers in connection with Regulation XXX and Guideline AXXX transactions. Among other things, the framework called for more disclosure of an insurer’s use of captives in its statutory financial statements, and narrows the types of assets permitted to back statutory reserves that are required to support the insurer’s future obligations. In 2014, the NAIC implemented the framework through an actuarial guideline (“AG 48”), which requires the actuary of the ceding insurer that opines on the insurer’s reserves to issue a qualified opinion if the framework is not followed. The requirements of AG 48 became effective as of January 1, 2015 in all states, without any further action necessary by state legislatures or insurance regulators to implement them, and apply prospectively to new policies issued and new reinsurance transactions entered into on or after January 1, 2015. AG 48 does not apply to policies included under captive reinsurance and certain other agreements that were in existence prior to January 1, 2015.
In December 2016, the NAIC adopted a new model regulation containing similar substantive requirements as AG 48. The model regulation will generally replace AG 48 in a state upon the state’s adoption of the model regulation. To the extent the types of assets permitted under AG 48 or under the new model regulation to back statutory reserves relating to these captive transactions are not available in future statutory reserve funding structures, we would not be able to take some or all statutory reserve credit for such transactions and could consequently be required to materially affect the statutory capitalization of Brighthouse Life Insurance Company, which would materially and adversely affect our financial condition.
Factors affecting our competitiveness may adversely affect our market share and profitability
We believe competition among insurance companies is based on a number of factors, including service, product features, scale, price, actual or perceived financial strength, claims-paying ratings, credit ratings, e-business capabilities and name recognition. We compete with a large number of other insurance companies, as well as non-insurance financial services companies, such as banks, broker-dealers and asset managers. Some of these companies offer a broader array of products, have more competitive pricing or, with respect to other insurance companies, have higher claims paying ability and financial strength ratings. Some may also have greater financial resources with which to compete. In some circumstances, national banks that sell annuity products of life insurers may also have a pre-existing customer base for financial services products. These competitive pressures may adversely affect the persistency of our products, as well as our ability to sell our products in the future. If, as a result of competitive factors or otherwise, we are unable to generate a sufficient return on insurance policies and annuity products we sell in the future, we may stop selling such policies and products, which could have a material adverse effect on our financial condition and results of operations. See “Business — Competition.”
We have limited control over many of our costs. For example, we have limited control over the cost of Unaffiliated Third-party Reinsurance, the cost of meeting changing regulatory requirements, and our cost to access capital or financing. There can be no assurance that we will be able to achieve or maintain a cost advantage over our competitors. If our cost structure increases and we are not able to achieve or maintain a cost advantage over our competitors, it could have a material adverse effect on our ability to execute our strategy, as well as on our results of operations and financial condition. If we hold substantially more capital than is needed to support credit ratings that are commensurate with our business strategy, over time, our competitive position could be adversely affected.
In addition, since numerous aspects of our business are subject to regulation, legislative and other changes affecting the regulatory environment for our business may have, over time, the effect of supporting or burdening some aspects of the financial services industry. This can affect our competitive position within the life insurance industry and within the broader financial services industry. See “Business — Regulation.”
60
The failure of third parties to provide various services, or any failure of the practices and procedures that these third parties use to provide services to us, could have a material adverse effect on our business
A key part of our operating strategy is to outsource certain services important to our business. In July 2016, we entered into a multi-year outsourcing arrangement for the administration of certain in-force policies currently housed on up to 20 systems. Pursuant to this arrangement, at least 13 of such systems will be consolidated down to one. In December 2017, we formalized an arrangement for the administration of life and annuities new business and approximately 1.3 million in-force life and annuities contracts. We intend to focus on further outsourcing opportunities with third-party vendors, including after the Transition Services Agreement, Investment Management Agreement and other agreements with MetLife companies expire. See “
—
Risks Related to Our Separation from, and Continuing Relationship with, MetLife
— Our contractual arrangements with MetLife may not be adequate to meet our operational and business needs
. The terms of our arrangements with MetLife may be more favorable than we would be able to obtain from an unaffiliated third party, and we may be unable to replace those services in a timely manner or on comparable terms” for information regarding the potential effect that the Separation from MetLife will have on the pricing of such services. It may be difficult and disruptive for us to replace some of our third-party vendors in a timely manner if they were unwilling or unable to provide us with these services in the future (as a result of their financial or business conditions or otherwise), and our business and operations likely could be materially adversely affected.
In addition, if a third-party provider fails to provide the administrative, operational, financial, and actuarial services we require, fails to meet contractual requirements, such as compliance with applicable laws and regulations, or suffers a cyberattack or other security breach, our business could suffer economic and reputational harm that could have a material adverse effect on our business and results of operations. See “
—
Operational Risks — The failure in cyber- or other information security systems, as well as the occurrence of events unanticipated in Brighthouse’s and MetLife’s disaster recovery systems and business continuity planning could result in a loss or disclosure of confidential information, damage to our reputation and impairment of our ability to conduct business effectively.”
Similarly, if any third-party provider experiences any deficiency in internal controls, determines that its practices and procedures used in administering our policies require review or otherwise fails to administer our policies in accordance with acceptable standards, we could incur expenses and experience other adverse effects as a result. In these situations, we may be unable to resolve any issues on our own without assistance from the third-party provider, and we may have limited ability to influence the speed and effectiveness of that resolution. In December 2017, for example, MetLife announced that it was undertaking a review of practices and procedures used to estimate its reserves related to certain group annuitants that have been unresponsive or missing over time. As a result of this review, MetLife identified a material weakness in its internal control over financial reporting relating to certain group annuity reserves and announced that it was recording charges to reinstate reserves previously released. As a result of that review and based on information provided by MetLife, we have identified approximately 14,000 group annuitants across Brighthouse entities who may be owed annuity payments now or in the future. We announced a related increase in reserves of $38 million after tax during the fourth quarter of 2017 relating to legacy non-retail group annuity contracts that are pension risk transfers included in our Run-off segment. These group annuity contracts are administered by MetLife under the Transition Services Agreement, and we depend on MetLife for the information and modifications to administrative practices and procedures necessary to resolve this matter. If similar issues were to arise in the future, whether involving MetLife or another third-party provider, any resulting expenses or other economic or reputational harm could have a material adverse effect on our business and results of operations, particularly if they involved our core annuity and life insurance businesses. In addition, we could be subject to litigation or regulatory investigations and actions resulting from any such issues, which could have a material adverse effect on our financial condition and results of operations.
We may be required to establish a valuation allowance against our deferred income tax assets, which could adversely affect our results of operations or financial condition
Deferred income tax represents the tax effect of the differences between the book and tax bases of assets and liabilities. Deferred tax assets are assessed periodically by management to determine whether they are realizable. Factors in management’s determination include the performance of the business including the ability to generate future taxable income. If, based on available information, it is more likely than not that the deferred income tax asset will not be realized, then a valuation allowance must be established with a corresponding charge to net income. Such charges could have a material adverse effect on our results of operations or financial position. In addition, changes in the corporate tax rates could affect the value of our deferred tax assets and may require a write-off of some of those assets. See
Note 13
of the Notes to the Consolidated and Combined Financial Statements for the impact of the Tax Act on our financial statements. Also, see “Management’s Discussion and Analysis of Financial Condition and Results of Operations — Summary of Critical Accounting Estimates.”
61
If our business does not perform well or if actual experience versus estimates used in valuing and amortizing DAC and VOBA vary significantly, we may be required to accelerate the amortization and/or impair the DAC and VOBA, which could adversely affect our results of operations or financial condition
We incur significant costs in connection with acquiring new and renewal insurance business. Costs that are related directly to the successful acquisition of new and renewal insurance business are deferred and referred to as DAC. Value of business acquired (“VOBA”) represents the excess of book value over the estimated fair value of acquired insurance and annuity contracts in-force at the acquisition date. The estimated fair value of the acquired liabilities is based on actuarially determined projections, by each block of business, of future policy and contract charges, premiums, mortality and morbidity, separate account performance, surrenders, operating expenses, investment returns, nonperformance risk adjustment and other factors. DAC and VOBA related to fixed and variable life and deferred annuity contracts are amortized in proportion to actual and expected future gross profits. The amount of future gross profit is dependent principally on investment returns in excess of the amounts credited to policyholders, mortality, morbidity, persistency, interest crediting rates, dividends paid to policyholders, expenses to administer the business, creditworthiness of reinsurance counterparties and certain economic variables, such as inflation.
If actual gross profits are less than originally expected, then the amortization of such costs would be accelerated in the period the actual experience is known and would result in a charge to net income. Significant or sustained equity market declines could result in an acceleration of amortization of DAC and VOBA related to variable annuity and variable life contracts, resulting in a charge to net income. Such adjustments could have a material adverse effect on our results of operations or financial condition. See “Management’s Discussion and Analysis of Financial Condition and Results of Operations
—
Summary of Critical Accounting Estimates — Deferred Policy Acquisition Costs and Value of Business Acquired” for a discussion of how significantly lower net investment spreads may cause us to accelerate amortization, thereby reducing net income in the affected reporting period.
Economic Environment and Capital Markets-Related Risks
If difficult conditions in the capital markets and the U.S. economy generally persist or are perceived to persist, they may materially adversely affect our business and results of operations
Our business and results of operations are materially affected by conditions in the capital markets and the U.S. economy generally, as well as by the global economy to the extent it affects the U.S. economy. In addition, while our operations are entirely in the United States, we have foreign investments in our general and separate accounts and, accordingly, conditions in the global capital markets can affect the value of our general account and separate account assets, as well as our financial results. Stressed conditions, volatility and disruptions in financial asset classes or various capital markets can have an adverse effect on us, both because we have a large investment portfolio and our benefit and claim liabilities are sensitive to changing market factors. In addition, perceived difficult conditions in the capital markets may discourage individuals from making investment decisions and purchasing our products. Market factors include interest rates, credit spreads, equity and commodity prices, derivative prices and availability, real estate markets, foreign exchange rates and the volatility and the returns of capital markets. Our business operations and results may also be affected by the level of economic activity, such as the level of employment, business investment and spending, consumer spending and savings; monetary and fiscal policies and their resulting impact on economic activity and conditions like inflation and credit formation. Accordingly, both market and economic factors may affect our business results by adversely affecting our business volumes, profitability, cash flow, capitalization and overall financial condition, our ability to receive dividends from our insurance subsidiaries and meet our obligations at our holding company. Disruptions in one market or asset class can also spread to other markets or asset classes. Upheavals and stagnation in the financial markets can also affect our financial condition (including our liquidity and capital levels) as a result of the impact of such events on our assets and liabilities.
At times throughout the past several years, volatile conditions have characterized financial markets. Significant market volatility in reaction to geopolitical risks, changing monetary policy and uncertain fiscal policy may exacerbate some of the risks we face. The Federal Reserve may reduce the size of its balance sheet and continue to raise interest rates as it unwinds the monetary accommodation put in place after the global financial crisis in 2008-2009, while other major central banks may continue to pursue accommodative, unconventional monetary policies. Uncertainties associated with the United Kingdom’s potential withdrawal from the European Union (“EU”) and concerns about the political and/or economic stability of Puerto Rico and certain countries outside the EU have also contributed to market volatility in the U.S. This market volatility has affected, and may continue to affect the performance of the various asset classes in which we invest, as well as separate account values. See “Management’s Discussion and Analysis of Financial Condition and Results of Operations — Investments — Current Environment” and “Management’s Discussion and Analysis of Financial Condition and Results of Operations — Industry Trends and Uncertainties — Financial and Economic Environment.”
62
To the extent these uncertain financial market conditions persist, our revenues, reserves and net investment income, as well as the demand for certain of our products, are likely to come under pressure. Similarly, sustained periods of low interest rates and risk asset returns could reduce income from our investment portfolio, increase our liabilities for claims and future benefits, and increase the cost of risk transfer measures such as hedging, causing our profit margins to erode as a result of reduced income from our investment portfolio and increase in insurance liabilities. Extreme declines in equity markets could cause us to incur significant capital and/or operating losses due to, among other reasons, the impact on us of guarantees related to our annuity products, including increases in liabilities, increased capital requirements, and/or collateral requirements associated with our risk transfer arrangements. Even in the absence of a financial market downturn, sustained periods of low market returns and/or low level of U.S. interest rates and/or heightened market volatility may increase the cost of our insurance liabilities, which could have a material adverse effect on our statutory capital and earnings, as well as impair our financial strength ratings.
Variable annuity products issued through separate accounts are a significant portion of our in-force business. The account values of these products decrease as a result of declining equity markets. Lower interest rates may result in lower returns in the future due to lower returns on our investments. Decreases in account values reduce certain fees generated by these products, cause the amortization of DAC to accelerate, could increase the level of insurance liabilities we must carry to support such products issued with any associated guarantees and could require us to provide additional funding to our affiliated reinsurer. Even absent declining equity and bond markets, periods of sustained stagnation in these markets, which are characterized by multiple years of low annualized total returns impacting the growth in separate accounts and/or low level of U.S. interest rates, may materially increase our liabilities for claims and future benefits due to inherent market return guarantees in these liabilities. In an economic downturn characterized by higher unemployment, lower family income, lower corporate earnings, lower business investment and lower consumer spending, the demand for our annuity and insurance products could be adversely affected as customers are unwilling or unable to purchase our products. In addition, we may experience an elevated incidence of claims, adverse utilization of benefits relative to our best estimate expectations and lapses or surrenders of policies. Furthermore, our policyholders may choose to defer paying insurance premiums or stop paying insurance premiums altogether. Such adverse changes in the economy could negatively affect our earnings and capitalization and have a material adverse effect on our results of operations and financial condition.
Difficult conditions in the U.S. capital markets and the economy generally may also continue to raise the possibility of legislative, judicial, regulatory and other governmental actions. The Trump administration has released a memorandum that generally delayed all pending regulations from publication in the Federal Register pending their review and approval by a department or agency head appointed or designated by President Trump, and has issued an executive order that calls for a comprehensive review of Dodd-Frank. Also, on June 8, 2017, the U.S. House of Representatives passed the Financial CHOICE Act of 2017, which proposes to amend or repeal various sections of Dodd-Frank. We cannot predict what other proposals may be made or what legislation may be introduced or enacted, or what impact any such legislation may have on our business, results of operations and financial condition. See “— Regulatory and Legal Risks — Our insurance business is highly regulated, and changes in regulation and in supervisory and enforcement policies may materially impact our capitalization or cash flows, reduce our profitability and limit our growth” and “— Risks Related to Our Business — Factors affecting our competitiveness may adversely affect our market share and profitability.”
Adverse capital and credit market conditions may significantly affect our ability to meet liquidity needs and our access to capital
The capital and credit markets may be subject to periods of extreme volatility. Disruptions in capital markets could adversely affect our liquidity and credit capacity or limit our access to capital which may in the future be needed to operate our business and meet policyholder obligations.
We need liquidity at our holding company to pay our operating expenses, pay interest on indebtedness we may incur and any potential dividends on our common stock, provide our subsidiaries with cash or collateral, maintain our securities lending activities and replace certain maturing liabilities. Without sufficient liquidity, we could be forced to curtail our operations and limit the investments necessary to grow our business.
For our insurance subsidiaries, the principal sources of liquidity are insurance premiums and fees paid in connection with annuity products, and cash flow from our investment portfolio to the extent consisting of cash and readily marketable securities.
In the event capital market or other conditions have an adverse impact on our capital and liquidity, or our stress-testing indicates that such conditions could have such an impact beyond expectations and our current resources do not satisfy our needs or regulatory requirements, we may have to seek additional financing to enhance our capital and liquidity position. The availability of additional financing will depend on a variety of factors such as the then current market conditions, regulatory capital requirements, availability of credit to us and the financial services industry generally, our credit ratings and credit capacity, and the perception of our customers and lenders regarding our long- or short-term financial prospects if we incur large operating or
63
investment losses or if the level of our business activity decreases due to a market downturn. Similarly, our access to funds may be impaired if regulatory authorities or rating agencies take negative actions against us. Our internal sources of liquidity may prove to be insufficient and, in such case, we may not be able to successfully obtain additional financing on favorable terms, or at all.
In addition, our liquidity requirements may change if, among other things, we are required to return significant amounts of cash collateral on short notice under securities lending agreements or other collateral requirements. See “Investments-Related Risks — Should the need arise, we may have difficulty selling certain holdings in our investment portfolio or in our securities lending program in a timely manner and realizing full value given that not all assets are liquid,” “Management’s Discussion and Analysis of Financial Condition and Results of Operations — Off-Balance Sheet Arrangements — Collateral for Securities Lending, Repurchase Programs and Derivatives” and “Management’s Discussion and Analysis of Financial Condition and Results of Operations
—
Liquidity and Capital Resources
—
The Company — Liquidity.”
Such conditions may limit our ability to replace, in a timely manner, maturing liabilities, satisfy regulatory capital requirements, and access the capital necessary to grow our business. See “— Regulatory and Legal Risks — Our insurance business is highly regulated, and changes in regulation and in supervisory and enforcement policies may materially impact our capitalization or cash flows, reduce our profitability and limit our growth.”
As a result, we may be forced to delay raising capital, issue different types of securities than we would have otherwise, less effectively deploy such capital, issue shorter tenor securities than we prefer, or bear an unattractive cost of capital, which could decrease our profitability and significantly reduce our financial flexibility. Our results of operations, financial condition, cash flows and statutory capital position could be materially adversely affected by disruptions in the financial markets.
We are exposed to significant financial and capital markets risks which may adversely affect our results of operations, financial condition and liquidity, and may cause our net investment income and net income to vary from period to period
We are exposed to significant financial and capital markets risks both in the United States and in global markets generally to the extent they influence U.S. financial and capital markets, including changes in interest rates, credit spreads, equity markets, real estate markets, the performance of specific obligors, including governments, included in our investment portfolio, derivatives and other factors outside our control. From time to time we may also have exposure through our investment portfolio to foreign currency and commodity price volatility.
Interest rate risk
Some of our current or anticipated future products, principally traditional life, universal life and fixed annuities, as well as funding agreements and structured settlements, expose us to the risk that changes in interest rates will reduce our investment margin or “net investment spread,” or the difference between the amounts that we are required to pay under the contracts in our general account and the rate of return we earn on general account investments intended to support obligations under such contracts. Our net investment spread is a key component of our net income.
We are affected by the monetary policies of the Board of Governors of the Federal Reserve System (“Federal Reserve Board”) and the Federal Reserve Bank of New York (collectively, with the Federal Reserve Board, the “Federal Reserve”) and other major central banks, as such policies may adversely impact the level of interest rates and, as discussed below, the income we earn on our investments or the level of product sales.
In a low interest rate environment, we may be forced to reinvest proceeds from investments that have matured or have been prepaid or sold at lower yields, which will reduce our net investment spread. Moreover, borrowers may prepay or redeem the fixed income securities and commercial, agricultural or residential mortgage loans in our investment portfolio with greater frequency in order to borrow at lower market rates, thereby exacerbating this risk. Although reducing interest crediting rates can help offset decreases in net investment spreads on some products, our ability to reduce these rates is limited to the portion of our in-force product portfolio that has adjustable interest crediting rates, and could be limited by the actions of our competitors or contractually guaranteed minimum rates and may not match the timing or magnitude of changes in asset yields. As a result, our net investment spread would decrease or potentially become negative, which could have a material adverse effect on our results of operations and financial condition. See “Management’s Discussion and Analysis of Financial Condition and Results of Operations — Policyholder Liabilities.”
Our estimation of future net investment spreads is an important component in the amortization of DAC and VOBA. Significantly lower than anticipated net investment spreads reduce our net income and may cause us to accelerate amortization, thereby reducing net income in the affected reporting period and thereby potentially negatively affecting our credit instrument covenants or rating agency assessment of our financial condition.
During periods of declining interest rates, our return on investments that do not support particular policy obligations may decrease. During periods of sustained lower interest rates, our reserves for policy liabilities may not be sufficient to meet future
64
policy obligations and may need to be strengthened. Accordingly, declining and sustained lower interest rates may materially adversely affect our results of operations and financial condition, ability to take dividends from operating insurance companies and significantly reduce our profitability.
Increases in interest rates could also negatively affect our profitability. In periods of rapidly increasing interest rates, we may not be able to replace, in a timely manner, the investments in our general account with higher yielding investments needed to fund the higher crediting rates necessary to keep interest rate sensitive products competitive. We, therefore, may have to accept a lower credit spread and, thus, lower profitability or face a decline in sales and greater loss of existing contracts and related assets. In addition, policy loans, surrenders and withdrawals may tend to increase as policyholders seek investments with higher perceived returns as interest rates rise. This process may result in cash outflows requiring that we sell investments at a time when the prices of those investments are adversely affected by the increase in interest rates, which may result in realized investment losses. Unanticipated withdrawals, terminations and substantial policy amendments may cause us to accelerate the amortization of DAC and VOBA, which reduces net income and potentially negatively affects our credit instrument covenants and rating agency assessments of our financial condition. An increase in interest rates could also have a material adverse effect on the value of our investment portfolio, for example, by decreasing the estimated fair values of the fixed income securities and mortgage loans that comprise a significant portion of our investment portfolio. Finally, an increase in interest rates could result in decreased fee revenue associated with a decline in the value of variable annuity account balances invested in fixed income funds.
We manage interest rate risk as part of our asset and liability management strategies, which include (i) maintaining an investment portfolio with diversified maturities that has a weighted average duration that is approximately equal to the duration of our estimated liability cash flow profile, and (ii) a hedging program. For certain of our liability portfolios, it is not possible to invest assets to the full liability duration, thereby creating some asset/liability mismatch. Where a liability cash flow may exceed the maturity of available assets, as is the case with certain retirement products, we may support such liabilities with equity investments, derivatives or interest rate mismatch strategies. Although we take measures to manage the economic risks of investing in a changing interest rate environment, we may not be able to mitigate the interest rate risk of our fixed income investments relative to our interest sensitive liabilities. The level of interest rates also affects our liabilities for benefits under our annuity contracts. As interest rates decline we may need to increase our reserves for future benefits under our annuity contracts, which would adversely affect our results of operations and financial condition. See “Quantitative and Qualitative Disclosures About Market Risk
—
Market Risk Fair Value Exposures —
Interest Rates.”
In addition, while we use a risk mitigation strategy relating to our ULSG portfolio intended to reduce our risk to statutory capitalization and long-term economic exposures from sustained low levels of interest rates, this strategy will likely result in higher net income volatility due to the insensitivity of GAAP liabilities to the change in interest rate levels. This strategy may adversely affect our results of operations and financial condition. See “
—
Risks Related to Our Business
—
Our ULSG asset requirement target may not ensure we have sufficient assets to meet our future ULSG policyholder obligations and may result in net income volatility” and “Business
—
Risk Management Strategies
—
ULSG Market Risk Exposure Management.”
Significant volatility in the markets could cause changes in the risks described above which, individually or in tandem, could have a material adverse effect on our results of operations, financial condition, liquidity or cash flows through realized investment losses, derivative losses, change in insurance liabilities, impairments, increased valuation allowances, increases in reserves for future policyholder benefits, reduced net investment income and changes in unrealized gain or loss positions.
Credit spread risk
Our exposure to credit spreads primarily relates to market price volatility. Market price volatility can make it difficult to value certain of our securities if trading becomes less frequent, as was the case, for example, during the financial crisis commencing in 2008. In such case, valuations may include assumptions or estimates that may have significant period-to-period changes, which could have a material adverse effect on our results of operations or financial condition and may require additional reserves. If there is a resumption of significant volatility in the markets, it could cause changes in credit spreads and defaults and a lack of pricing transparency which, individually or in tandem, could have a material adverse effect on our results of operations, financial condition or liquidity. See “Management’s Discussion and Analysis of Financial Condition and Results of Operations — Investments — Investment Risks.” An increase in credit spreads relative to U.S. Treasury benchmarks can also adversely affect the cost of our borrowing if we need to access credit markets.
Equity risk
Our primary exposure to equity relates to the potential for lower earnings associated with certain of our businesses where fee income is earned based upon the estimated market value of the separate account assets and other assets related to our variable annuity business. Because these products generate fees related primarily to the value of separate account assets and other assets under management, a decline in the equity markets could reduce our revenues as a result of the reduction in the value of the investments supporting those products and services. The variable annuity business in particular is highly sensitive to equity
65
markets, and a sustained weakness or stagnation in the equity markets could decrease revenues and earnings with respect to those products. Furthermore, certain of our variable annuity products offer guaranteed benefits which increase our potential benefit exposure should equity markets decline or stagnate. We seek to mitigate the impact of such increased potential benefit exposures from market declines through the use of derivatives, reinsurance and capital management. However, such derivatives and reinsurance may become less available and, to the extent available, their price could materially increase in a period characterized by volatile equity markets. The risk of stagnation in equity market returns cannot be addressed by hedging. See “Business — Segments and Corporate & Other — Annuities — Current Products — Variable Annuities” for details regarding sensitivity of our variable annuity business to capital markets.
In addition, a portion of our investments are in leveraged buy-out funds, hedge funds and other private equity funds. The amount and timing of net investment income from such funds tends to be uneven as a result of the performance of the underlying investments. The timing of distributions from such funds, which depends on particular events relating to the underlying investments, as well as the funds’ schedules for making distributions and their needs for cash, can be difficult to predict. As a result, the amount of net investment income from these investments can vary substantially from period to period. Significant volatility could adversely impact returns and net investment income on these alternative investments. In addition, the estimated fair value of such investments may be impacted by downturns or volatility in equity markets. See “— Investments-Related Risks — Our valuation of securities and investments and the determination of the amount of allowances and impairments taken on our investments are subjective and, if changed, could materially adversely affect our results of operations or financial condition.” In addition, we rely, and expect to continue to rely, on MetLife Investment Advisors, LLC (“MLIA”), a related party investment manager, for a period to provide the services required to manage the portfolio.
Real estate risk
A portion of our investment portfolio consists of mortgage loans on commercial, agricultural and residential real estate. Our exposure to this risk stems from various factors, including the supply and demand of leasable commercial space, creditworthiness of tenants and partners, capital markets volatility, interest rate fluctuations, agricultural prices and farm incomes. Although we manage credit risk and market valuation risk for our commercial, agricultural and residential real estate assets through geographic, property type and product type diversification and asset allocation, general economic conditions in the commercial, agricultural and residential real estate sectors will continue to influence the performance of these investments. These factors, which are beyond our control, could have a material adverse effect on our results of operations, financial condition, liquidity or cash flows. In addition, we rely, and expect to continue to rely, on MLIA for a period to provide the services required to manage the portfolio.
Obligor-related risk
Fixed income securities and mortgage loans represent a significant portion of our investment portfolio. We are subject to the risk that the issuers, or guarantors, of fixed income securities and mortgage loans we own may default on principal and interest payments they owe us. We are also subject to the risk that the underlying collateral within asset-backed securities (“ABS”), including mortgage-backed securities, may default on principal and interest payments causing an adverse change in cash flows. The occurrence of a major economic downturn, acts of corporate malfeasance, widening mortgage or credit spreads, or other events that adversely affect the issuers, guarantors or underlying collateral of these securities and mortgage loans could cause the estimated fair value of our portfolio of fixed income securities and mortgage loans and our earnings to decline and the default rate of the fixed income securities and mortgage loans in our investment portfolio to increase.
Derivatives risk
We use the payments we receive from counterparties pursuant to derivative instruments we have entered into to offset future changes in the fair value of our assets and liabilities and current or future changes in cash flows. We enter into a variety of derivative instruments, including options, futures, forwards, and interest rate and credit default swaps with a number of counterparties. Amounts that we expect to collect under current and future derivatives are subject to counterparty risk. Our obligations under our products are not changed by our hedging activities and we are liable for our obligations even if our derivative counterparties do not pay us. Such defaults could have a material adverse effect on our financial condition and results of operations. Substantially all of our derivatives require us to pledge or receive collateral or make payments related to any decline in the net estimated fair value of such derivatives executed through a specific broker at a clearinghouse or entered into with a specific counterparty on a bilateral basis. In addition, ratings downgrades or financial difficulties of derivative counterparties may require us to utilize additional capital with respect to the impacted businesses. Furthermore, the valuation of our derivatives could change based on changes to our valuation methodology or the discovery of errors.
Federal banking regulators have recently adopted new rules that will apply to certain qualified financial contracts, including many derivatives contracts, securities lending agreements and repurchase agreements, with certain banking institutions and certain of their affiliates. These new rules, which will be applicable beginning in 2019, will generally require the banking institutions and their applicable affiliates to include contractual provisions in their qualified financial contracts that limit or delay
66
certain rights of their counterparties including counterparties’ default rights (such as the right to terminate the contracts or foreclose on collateral) and restrictions on assignments and transfers of credit enhancements (such as guarantees) arising in connection with the banking institution or an applicable affiliate becoming subject to a bankruptcy, insolvency, resolution or similar proceeding. To the extent that any of the derivatives, securities lending agreements or repurchase agreements that we enter into are subject to these new rules, it could increase our counterparty risk or limit our recovery in the event of a default.
Summary
In addition to the economic or counterparty risks described above which, individually or in tandem, could have a material adverse effect on our results of operations, financial condition, liquidity or cash flows through realized investment losses, derivative losses, change in insurance liabilities, impairments, increased valuation allowances, increases in reserves for future policyholder benefits, reduced net investment income and changes in unrealized gain or loss positions, we are also exposed to volatility risk with respect to any one or more of these economic risks. Significant volatility in the markets could cause changes in the risks set forth above which, individually or in tandem, could have a material adverse effect on our results of operations, financial condition, liquidity or cash flows through realized investment losses, derivative losses, change in insurance liabilities, impairments, increased valuation allowances, increases in reserves for future policyholder benefits, reduced net investment income and changes in unrealized gain or loss positions.
Regulatory and Legal Risks
Our insurance business is highly regulated, and changes in regulation and in supervisory and enforcement policies may materially impact our capitalization or cash flows, reduce our profitability and limit our growth
Our insurance operations are subject to a wide variety of insurance and other laws and regulations. Our insurance company operating subsidiaries are domiciled in Delaware, Massachusetts and New York. Each entity is subject to regulation by its primary state regulator, and is also subject to other regulation in states in which it operates. See “Business — Regulation.” as supplemented by discussions of regulatory developments in our subsequently filed Quarterly Reports on Form 10-Q under the caption “Management’s Discussion and Analysis of Financial Condition and Results of Operations — Industry Trends — Regulatory Developments.”
NAIC - Existing and proposed insurance regulation
The NAIC is an organization whose mission is to assist state insurance regulatory authorities in serving the public interest and achieving the insurance regulatory goals of its members, the state insurance regulatory officials. State insurance regulators may act independently or adopt regulations proposed by the NAIC. State insurance regulators and the NAIC regularly re-examine existing laws and regulations applicable to insurance companies and their products. Some NAIC pronouncements take effect automatically in the various states, particularly with respect to accounting issues. Statutes, regulations and interpretations may be applied with retroactive impact, particularly in areas such as accounting and reserve requirements. Changes in existing laws and regulations, or in interpretations thereof, can sometimes lead to additional expense for the insurer and, thus, could have a material adverse effect on our financial condition and results of operations.
From time to time, regulators raise issues during examinations or audits of us that could, if determined adversely, have a material adverse effect on us. In addition, the interpretations of regulations by regulators may change and statutes may be enacted with retroactive impact, particularly in areas such as accounting or statutory reserve requirements. Compliance with applicable laws and regulations is time consuming and personnel-intensive, and changes in these laws and regulations may materially increase our direct and indirect compliance and other expenses of doing business, thus having a material adverse effect on our financial condition and results of operations.
During 2014, the NAIC approved a new regulatory framework applicable to the use of captive insurers in connection with Regulation XXX and Guideline AXXX transactions. This could impact our competitiveness and have a material adverse effect on our results of operations and financial condition.
See “— Risks Related to Our Business — We may not be able to take credit for reinsurance, our statutory life insurance reserve financings may be subject to cost increases and new financings may be subject to limited market capacity.”
In 2015, the NAIC commissioned an initiative to identify changes to the statutory framework for variable annuities that can remove or mitigate the motivation for insurers to engage in captive reinsurance transactions. In September 2015, a third-party consultant engaged by the NAIC provided the NAIC with a preliminary report covering several sets of recommendations regarding AG 43 and RBC C3 Phase II reserve requirements. These recommendations generally focus on (1) addressing inconsistencies between the statutory reserve and RBC regimes, (2) mitigating the asset-liability accounting mismatch between hedge instruments and statutory instruments and statutory liabilities, (3) removing the non-economic volatility in statutory total asset requirements and the resulting solvency ratios and (4) facilitating greater harmonization across insurers and products for greater comparability. An updated variable annuity reserve and capital framework proposal was presented at the August 2016 NAIC meeting, followed
67
by a 90-day comment period on the proposal. This updated proposal included the initial recommendations from 2015, but also some new aspects. The standard scenario floor for reserves may incorporate multiple paths instead of the current single deterministic scenario, also known as the standard scenario. The stochastic calculations may include alternative calibration criteria for equities and other market risk factors, and the RBC C3 Phase II component may reflect a new level of capitalization. The NAIC is continuing its consideration of these recommendations. These recommendations, if adopted, would likely apply to all existing business and may materially change the sensitivity of reserve and capital requirements to capital markets including interest rate, equity markets and volatility, as well as prescribed assumptions for policyholder behavior. It is not possible at this time to predict whether the amount of reserves or capital required to support our variable annuity contracts would increase or decrease if the NAIC adopts any new model laws, regulations and/or other standards applicable to variable annuity business after considering such recommendations, nor is it possible to predict the materiality of any such increase or decrease. It is also not possible to predict the extent to which any such model laws, regulations and/or other standards would affect the effectiveness and design of our risk mitigation and hedging programs. Furthermore, no assurances can be given to whether any such model laws, regulations and/or other standards will be adopted or to the timing of any such adoption.
The NAIC has adopted a new approach for the calculation of life insurance reserves, known as principle-based reserving (“PBR”). PBR became operative on January 1, 2017 in those states where it has been adopted, to be followed by a three-year phase-in period for business issued on or after this date. With respect to the states in which our insurance subsidiaries are domiciled: in Delaware, the Delaware Department of Insurance implemented PBR on January 1, 2017; in New York, the NYDFS has publicly stated its intention to implement this approach, subject to a working group of the NYDFS establishing the necessary reserves safeguards and the adopting of enabling legislation by the New York legislature. Massachusetts has not yet adopted PBR. We cannot predict how PBR will impact our reserves or compliance costs, if any, of our insurance subsidiaries. See “Business — Regulation — Insurance Regulation — NAIC.”
The NAIC, as well as certain state regulators are currently considering implementing regulations that would apply an impartial conduct standard similar to the Fiduciary Rule to recommendations made in connection with certain annuities, and in the case of New York, life insurance policies. In particular, on December 27, 2017, the NYDFS proposed regulations that would adopt a “best interest” standard for the sale of life insurance and annuity products in New York. The likelihood of enactment of these regulations is uncertain at this time, but if implemented, these regulations could have significant adverse effects on our business and consolidated results of operations. Generally, changes in laws and regulations, or in interpretations thereof, including potentially rescinding prior product approvals, are often made for the benefit of the consumer at the expense of the insurer and could materially and adversely affect our business, results of operations or financial condition.
The NAIC is developing a U.S. group capital calculation using an RBC aggregation methodology. We cannot predict with any certainty when the group capital calculation might be implemented or the impact (if any) that such implementation may have on our capital requirements, compliance costs or other aspects of our business.
In addition, following the reduction in the federal corporate income tax rate pursuant to federal tax reform, the NAIC may revise the methodology or factors used to calculate RBC, which is the denominator of the RBC ratio. If such potential revisions to the NAIC’s RBC calculation would result in a reduction in the RBC ratio for one or more of our insurance subsidiaries below certain prescribed levels, we may be required to hold additional capital in such subsidiary or subsidiaries. Any reduction in the RBC ratios of our insurance subsidiaries could adversely affect their financial strength ratings. For more information regarding federal tax reform, see “See “Business — Regulation — Federal Tax Reform.”
The NAIC has started work related to macro-prudential initiatives. Currently, the NAIC is focused on liquidity, but other macro-prudential topics of focus are expected to include recovery and resolution, capital stress testing and exposure concentrations.
State insurance guaranty associations
Most of the jurisdictions in which we transact business require life insurers doing business within the jurisdiction to participate in guaranty associations. These associations are organized to pay contractual benefits owed pursuant to insurance policies issued by impaired, insolvent or failed insurers, or those that may become impaired, insolvent or fail, for example, following the occurrence of one or more catastrophic events. These associations levy assessments, up to prescribed limits, on all member insurers in a particular state on the basis of the proportionate share of the premiums written by member insurers in the lines of business in which the impaired, insolvent or failed insurer is engaged. In addition, certain states have government owned or controlled organizations providing life insurance to their citizens. The activities of such organizations could also place additional stress on the adequacy of guaranty fund assessments. Many of these organizations also have the power to levy assessments similar to those of the guaranty associations described above. Some states permit member insurers to recover assessments paid through full or partial premium tax offsets. See “Business — Regulation — Insurance Regulation — Guaranty Associations and Similar Arrangements.”
68
In December of 2017, the NAIC approved revisions to its Life and Health Insurance Guaranty Association Model Act governing assessments for long-term care insurance. The revisions include a 50/50 split between life and health carriers for future long term care insolvencies, the inclusion of HMOs in the assessment base, and no change to the premium tax offset. Several states are now considering legislation to codify these changes into law, and more states are expected to propose legislation in their 2018 legislative sessions.
It is possible that additional insurance company insolvencies or failures could render the guaranty funds from assessments previously levied against us inadequate and we may be called upon to contribute additional amounts, which may have a material impact on our financial condition or results of operations in a particular period. We have established liabilities for guaranty fund assessments that we consider adequate, but additional liabilities may be necessary. See “Business — Regulation — Insurance Regulation — Guaranty Associations and Similar Arrangements.”
Federal - Insurance regulation
Currently, the U.S. federal government does not directly regulate the business of insurance. However, Dodd-Frank established the FIO within the Department of the Treasury, which has the authority to, among other things, collect information about the insurance industry, negotiate covered agreements with one or more foreign governments and recommend prudential standards. On December 12, 2013, the FIO issued a report, mandated by Dodd-Frank, which, among other things, urged the states to modernize and promote greater uniformity in insurance regulation. The report raised the possibility of a greater role for the federal government if states do not achieve greater uniformity in their laws and regulations. Following the transition occurring in the federal government and the priorities of the Trump administration, we cannot predict whether any such legislation or regulatory changes will be adopted, or what impact they will have on our business, financial condition or results of operations. The Trump administration and the Republican party have expressed goals to dismantle or roll back Dodd-Frank and President Trump has issued an executive order that calls for a comprehensive review of Dodd-Frank in light of certain enumerated core principles of financial system regulation. On June 8, 2017, the U.S. House of Representatives passed the Financial CHOICE Act of 2017, which proposed to amend or repeal various sections of Dodd-Frank. This proposed legislation will now be considered by the U.S. Senate. We are not able to predict whether any such proposal to roll back Dodd-Frank would have a material effect on our business operations and cannot currently identify the risks, if any, that may be posed to our businesses as a result of changes to, or legislative replacements for, Dodd-Frank.
Federal legislation and administrative policies can significantly and adversely affect insurance companies, including policies regarding financial services regulation, securities regulation, derivatives regulation, pension regulation, privacy, tort reform legislation and taxation. In addition, various forms of direct and indirect federal regulation of insurance have been proposed from time to time, including proposals for the establishment of an optional federal charter for insurance companies.
Department of Labor and ERISA considerations
We manufacture annuities for third parties to sell to tax-qualified pension plans, retirement plans and IRAs, as well as individual retirement annuities sold to individuals that are subject to ERISA or the Code. Also, a portion of our in-force life insurance products are held by tax-qualified pension and retirement plans. While we currently believe manufacturers do not have as much exposure to ERISA and the Code as distributors, certain activities are subject to the restrictions imposed by ERISA and the Code, including the requirement under ERISA that fiduciaries must perform their duties solely in the interests of ERISA plan participants and beneficiaries, and those fiduciaries may not cause a covered plan to engage in certain prohibited transactions. The prohibited transaction rules of ERISA and the Code generally restrict the provision of investment advice to ERISA qualified plans and participants and IRAs if the investment recommendation results in fees paid to the individual advisor, the firm that employs the advisor or their affiliates that vary according to the investment recommendation chosen. Similarly, without an exemption, fiduciary advisors are prohibited from receiving compensation from third parties in connection with their advice. ERISA also affects certain of our in-force insurance policies and annuity contracts, as well as insurance policies and annuity contracts we may sell in the future.
The DOL issued the Fiduciary Rule on April 6, 2016, which became applicable on June 9, 2017. As initially adopted, the Fiduciary Rule substantially expands the definition of “investment advice” and requires that an impartial or “best interests” standard be met in providing such advice, thereby broadening the circumstances under which we or our representatives, in providing investment advice with respect to ERISA plans, plan participants or IRAs, could be deemed a fiduciary under ERISA or the Code. Pursuant to the Fiduciary Rule, certain communications with plans, plan participants and IRA owners, including the marketing of products, and marketing of investment management or advisory services, could be deemed fiduciary investment advice, thus causing increased exposure to fiduciary liability if the distributor does not recommend what is in the client’s best interests.
In connection with the promulgation of the Fiduciary Rule, the DOL also issued amendments to certain of its prohibited transaction exemptions, and issued BIC, a new prohibited transaction exemption that imposes more significant disclosure and
69
contract requirements to certain transactions involving ERISA plans, plan participants and IRAs. The new and amended exemptions increase fiduciary requirements and fiduciary liability exposure for transactions involving ERISA plans, plan participants and IRAs. The application of the BIC contract and point of sale disclosures required under BIC and the changes made to prohibited transaction exemption 84-24 were delayed until July 1, 2019, except for the impartial conduct standards (i.e., compliance with the “best interest” standard, reasonable compensation, and no misleading statements), which are applicable as of June 9, 2017.
On February 3, 2017, President Trump, in a memorandum to the Secretary of Labor, requested that the DOL prepare an updated economic and legal analysis concerning the likely impact of the new rules, and possible revisions to the rules. In response to President Trump’s request, on June 29, 2017, the DOL issued a request for information related to the Fiduciary Rule and the DOL’s new and amended exemptions that were published in conjunction with the final rule. The request for information sought public input that could lead to new exemptions or changes and revisions to the final rule. On November 29, 2017, the DOL finalized an 18-month delay from January 1, 2018 to July 1, 2019, of the applicability of significant portions of the previously proposed exemptions (including BIC and prohibited transaction exemption 84-24), to afford sufficient time to review further the previously adopted rules and such exemptions. The DOL also updated its enforcement policy to indicate that the DOL and IRS will not pursue claims, until July 1, 2019, against fiduciaries who are working diligently and in good faith to comply with the final Fiduciary Rule or treat those fiduciaries as being in violation of the final rule.
While we continue to analyze the impact of the final regulations on our business and work diligently to comply with the final rule, we anticipate that we will need to undertake certain additional tasks in order to comply with certain of the exemptions provided in the DOL regulations, including additional compliance reviews of material shared with distributors, wholesaler and call center training, and product reporting and analysis. The change of administration, the DOL’s June 29, 2017 request for information related to the Fiduciary Rule and related exemptions, and the November 29, 2017 extension of the applicability of many of the conditions of the proposed and revised exemptions leaves uncertainty over whether the regulations will be substantially modified or repealed. This uncertainty could create confusion among our distribution partners, which could negatively impact product sales. We cannot predict what other proposals may be made, what legislation or regulations may be introduced or enacted, or what impact any such legislation or regulations may have on our business, results of operations and financial condition.
While the Fiduciary Rule also provides that, to a limited extent, contracts sold and advice provided prior to the applicable date would not have to be modified to comply with the new investment advice regulations, there is lack of clarity surrounding some of the conditions for qualifying for this limited exception. There can be no assurance that the DOL will agree with our interpretation of these provisions, in which case the DOL and IRS could assess significant penalties against a portion of products sold prior to the applicable date of the new regulations. The assessment of such penalties could also trigger substantial litigation risk. Any such penalties and related litigation could adversely affect our results of operations and financial condition.
While we continue to analyze the impact of the final regulation on our business, we believe it could have an adverse effect on sales of annuity products to ERISA qualified plans and IRAs through our independent distribution partners. A significant portion of our annuity sales are to IRAs. The new regulation deems advisors, including independent distributors, who sell fixed index-linked annuities to IRAs, IRA rollovers or 401(k) plans, to be fiduciaries and prohibits them from receiving compensation unless they comply with a prohibited transaction exemption. The relevant exemption requires advisors to comply with impartial conduct standards and may require us to exercise additional oversight of the sales process. Compliance with the prohibited transaction exemptions will likely result in increased regulatory burdens on us and our independent distribution partners, changes to our compensation practices and product offerings and increased litigation risk, which could adversely affect our results of operations and financial condition. See “Business — Regulation — Department of Labor and ERISA Considerations.”
The NAIC and certain regulators, including the NYDFS, have proposed a “best interest” standard become part of their suitability requirements. These new rules could increase the amount of training and documentation of sales practices required between us, our distributors and their advisors. Depending on the final version of these rules, we could be exposed to regulatory penalties if and when the best interest standard is not met.
A decrease in the RBC ratio (as a result of a reduction in statutory surplus and/or increase in RBC requirements) of our insurance subsidiaries could result in increased scrutiny by insurance regulators and rating agencies and have a material adverse effect on our results of operations and financial condition
The NAIC has established model regulations that provide minimum capitalization requirements based on RBC formulas for insurance companies. The RBC formula for life insurance companies establishes capital requirements relating to asset, insurance, interest rate, market and business risks, including equity, interest rate and expense recovery risks associated with variable annuities that contain certain guaranteed minimum death and living benefits. Each of our insurance subsidiaries is subject to RBC standards and/or other minimum statutory capital and surplus requirements imposed under the laws of its
70
respective jurisdiction of domicile. See “Business — Regulation — Insurance Regulation — Surplus and Capital; Risk-Based Capital.”
In any particular year, statutory surplus amounts and RBC ratios may increase or decrease depending on a variety of factors, including the amount of statutory income or losses generated by the insurance subsidiary (which itself is sensitive to equity market and credit market conditions), the amount of additional capital such insurer must hold to support business growth, changes in equity market levels, the value and credit ratings of certain fixed-income and equity securities in its investment portfolio, the value of certain derivative instruments that do not receive hedge accounting and changes in interest rates, as well as changes to the RBC formulas and the interpretation of the NAIC’s instructions with respect to RBC calculation methodologies. Our financial strength and credit ratings are significantly influenced by statutory surplus amounts and RBC ratios. In addition, rating agencies may implement changes to their own internal models, which differ from the RBC capital model, that have the effect of increasing or decreasing the amount of statutory capital we or our insurance subsidiaries should hold relative to the rating agencies’ expectations. Under stressed or stagnant capital market conditions and with the aging of existing insurance liabilities, without offsets from new business, the amount of additional statutory reserves that an insurance subsidiary is required to hold may materially increase. This increase in reserves would decrease the statutory surplus available for use in calculating the subsidiary’s RBC ratios. To the extent that an insurance subsidiary’s RBC ratio is deemed to be insufficient, we may seek to take actions either to increase the capitalization of the insurer or to reduce the capitalization requirements. If we were unable to accomplish such actions, the rating agencies may view this as a reason for a ratings downgrade.
The failure of any of our insurance subsidiaries to meet its applicable RBC requirements or minimum capital and surplus requirements could subject it to further examination or corrective action imposed by insurance regulators, including limitations on its ability to write additional business, supervision by regulators or seizure or liquidation. Any corrective action imposed could have a material adverse effect on our business, results of operations and financial condition. A decline in RBC ratios, whether or not it results in a failure to meet applicable RBC requirements, may limit the ability of an insurance subsidiary to make dividends or distributions to us, could result in a loss of customers or new business, and could be a factor in causing ratings agencies to downgrade financial strength ratings, each of which could have a material adverse effect on our business, results of operations and financial condition.
The Dodd-Frank provisions compelling the liquidation of certain types of financial institutions could materially and adversely affect us, as such a financial institution and as an investor in or counterparty to other such financial institutions, as well as our respective investors
Under provisions of Dodd-Frank, if we or another financial institution were to become insolvent or were in danger of defaulting on our or its respective obligations and it was determined that such default would have serious effects on financial stability in the United States, we or such other financial institution could be compelled to undergo liquidation with the FDIC as receiver. Under this new regime an insurance company such as Brighthouse Life Insurance Company, BHNY or NELICO would be resolved in accordance with state insurance law. If the FDIC were to be appointed as the receiver for another type of company (including an insurance holding company such as Brighthouse Financial, Inc.), the liquidation of that company would occur under the provisions of the new liquidation authority, and not under the Bankruptcy Code, which ordinarily governs liquidations. In an FDIC-managed liquidation, holders of a company’s debt could in certain respects be treated differently than they would be under the Bankruptcy Code and similarly situated creditors could be treated differently. In particular, unsecured creditors and shareholders are intended to bear the losses of the company being liquidated. These provisions could apply to some financial institutions whose debt securities Brighthouse holds in its investment portfolios and could adversely affect the respective positions of creditors and the value of their respective holdings.
Dodd-Frank also provides for the assessment of charges against certain financial institutions, including non-bank systemically important financial institutions and bank holding companies, to cover the costs of liquidating any financial company subject to the new liquidation authority. The liquidation authority could increase the funding charges assessed against Brighthouse.
We are subject to U.S. federal, state and other securities and state insurance laws and regulations which, among other things, require that we distribute certain of our products through a registered broker-dealer; failure to comply with these laws or changes to these laws may have a material adverse effect on our operations and our profitability
Federal and state securities laws and regulations apply to insurance products that are also “securities,” including variable annuity contracts and variable life insurance policies, to the separate accounts that issue them, and to certain fixed interest rate or index-linked contracts (“registered fixed annuity contracts”). Such laws and regulations require that we distribute these products through a broker-dealer that is registered with the SEC and certain state securities regulators and is a member of the FINRA. Accordingly, by offering and selling of variable annuity contracts, variable life insurance policies and registered fixed annuity contracts, and in managing certain proprietary mutual funds associated with those products, we are subject to, and bear
71
the costs of compliance with, extensive regulation under federal and state securities laws, as well as FINRA rules. Due to the increased operating and compliance costs, the profitability of issuing these products is uncertain.
While prior to the Separation we relied on a MetLife-affiliated broker-dealer to distribute our variable and registered fixed products, we currently and in the future will utilize Brighthouse Securities, a subsidiary we acquired from MetLife in the Separation. Brighthouse Securities is a FINRA member and a broker-dealer registered with the SEC and applicable state regulators.
Federal and state securities laws and regulations are primarily intended to ensure the integrity of the financial markets, to protect investors in the securities markets, and to protect investment advisory or brokerage clients. These laws and regulations generally grant regulatory and self-regulatory agencies broad rulemaking and enforcement powers, including the power to adopt new rules impacting new and/or existing products, regulate the issuance, sale and distribution of our products and limit or restrict the conduct of business for failure to comply with securities laws and regulations.
As a result of Dodd-Frank and the Fiduciary Rule, there have been a number of proposed or adopted changes to the laws and regulations that govern the conduct of our variable and registered fixed insurance products business and the firms that distribute these products. The future impact of recently adopted revisions to laws and regulations, as well as revisions that are still in the proposal stage, on the way we conduct our business and the products we sell is unclear. Such impact could adversely affect our operations and profitability, including increasing the regulatory and compliance burden upon us, resulting in increased costs, or limiting the type, amount or structure of compensation arrangements into which we may enter with certain of our employees, negatively impacting our ability to compete with other companies in recruiting and maintaining key personnel. See “Business — Regulation — Insurance Regulation — Federal Initiatives.” However, following the change of administration, we cannot predict with certainty whether any such proposals will be adopted, or what impact adopted revisions will have on our business, financial condition or results of operations. See “— Our insurance business is highly regulated, and changes in regulation and in supervisory and enforcement policies may materially impact our capitalization or cash flows, reduce our profitability and limit our growth.”
The global financial crisis has led to significant changes in economic and financial markets that have, in turn, led to a dynamic competitive landscape for variable and registered fixed annuity contract issuers. Our ability to react to rapidly changing market and economic conditions will depend on the continued efficacy of provisions we have incorporated into our product design allowing frequent and contemporaneous revisions of key pricing elements and our ability to work collaboratively with federal securities regulators. Changes in regulatory approval processes, rules and other dynamics in the regulatory process could adversely impact our ability to react to such changing conditions.
Changes in tax laws or interpretations of such laws could reduce our earnings and materially impact our operations by increasing our corporate taxes and making some of our products less attractive to consumers
Changes in tax laws could have a material adverse effect on our profitability and financial condition, and could result in our incurring materially higher corporate taxes. Higher tax rates may adversely affect our business, financial condition, results of operations and liquidity. Conversely, if tax rates decline it could adversely affect the desirability of our products.
On December 22, 2017, President Trump signed into law sweeping changes to the tax code (the “Tax Act”). The Tax Act reduced the corporate tax rate to 21%, reduced interest expense deductibility, increased capitalization amounts for deferred acquisition costs, eliminated the corporate alternative minimum tax, provided for determining reserve deductions as 92.81% of statutory reserves, and reduced the dividend received deduction. Most of the changes in the Tax Act are effective as of January 1, 2018.
The reduction in the corporate rate will require a one-time remeasurement of certain deferred tax items. For additional information on the estimated impact of the Tax Act on our financial statements, including the estimated impact resulting from the remeasurement of our deferred tax assets and liabilities, see
Note 13
of the Notes to the Consolidated and Combined Financial Statements. Our actual results may materially differ from our current estimate due to, among other things, further guidance that may be issued by U.S. tax authorities or regulatory bodies and/or changes in interpretations and assumptions we have preliminarily made. We will continue to analyze the Tax Act to finalize its financial statement impact.
Litigation and regulatory investigations are increasingly common in our businesses and may result in significant financial losses and/or harm to our reputation
We face a significant risk of litigation and regulatory investigations and actions in the ordinary course of operating our businesses, including the risk of class action lawsuits. Our pending legal and regulatory actions include proceedings specific to us, as well as other proceedings that raise issues that are generally applicable to business practices in the industries in which we operate. In connection with our insurance operations, plaintiffs’ lawyers may bring or are bringing class actions and individual suits alleging, among other things, issues relating to sales or underwriting practices, claims payments and procedures, product
72
design, disclosure, administration, investments, denial or delay of benefits and breaches of fiduciary or other duties to customers. Plaintiffs in class action and other lawsuits against us may seek very large and/or indeterminate amounts, including punitive and treble damages. Due to the vagaries of litigation, the outcome of a litigation matter and the amount or range of potential loss at particular points in time may be difficult to ascertain. Uncertainties can include how fact finders will evaluate documentary evidence and the credibility and effectiveness of witness testimony, and how trial and appellate courts will apply the law in the context of the pleadings or evidence presented, whether by motion practice, at trial, or on appeal. Disposition valuations are also subject to the uncertainty of how opposing parties and their counsel will themselves view the relevant evidence and applicable law. Material pending litigation and regulatory matters affecting us and risks to our business presented by these proceedings, if any, are discussed in
Note 15
of the Notes to the Consolidated and Combined Financial Statements.
A substantial legal liability or a significant federal, state or other regulatory action against us, as well as regulatory inquiries or investigations, could harm our reputation, result in material fines or penalties, result in significant legal costs and otherwise have a material adverse effect on our business, financial condition and results of operations. Even if we ultimately prevail in the litigation, regulatory action or investigation, our ability to attract new customers, retain our current customers and recruit and retain employees could be materially and adversely impacted. Regulatory inquiries and litigation may also cause volatility in the price of stocks of companies in our industry.
Current claims, litigation, unasserted claims probable of assertion, investigations and other proceedings against us could have a material adverse effect on our business, financial condition or results of operations. It is also possible that related or unrelated claims, litigation, unasserted claims probable of assertion, investigations and proceedings may be commenced in the future, and we could become subject to further investigations and have lawsuits filed or enforcement actions initiated against us. Increased regulatory scrutiny and any resulting investigations or proceedings in any of the jurisdictions where we operate could result in new legal actions and precedents or changes in regulations that could adversely affect our business, financial condition and results of operations.
Investments-Related Risks
Should the need arise, we may have difficulty selling certain holdings in our investment portfolio or in our securities lending program in a timely manner and realizing full value given that not all assets are liquid
There may be a limited market for certain investments we hold in our investment portfolio, making them relatively illiquid. These include privately-placed fixed maturity securities, derivative instruments such as options, mortgage loans, policy loans, leveraged leases, other limited partnership interests, and real estate equity, such as real estate joint ventures and funds. In the past, even some of our very high quality investments experienced reduced liquidity during periods of market volatility or disruption. If we were forced to sell certain of our investments during periods of market volatility or disruption, market prices may be lower than our carrying value in such investments. This could result in realized losses which could have a material adverse effect on our results of operations and financial condition, as well as our financial ratios, which could affect compliance with our credit instruments and rating agency capital adequacy measures.
Similarly, we loan blocks of our securities to third parties (primarily brokerage firms and commercial banks) through our securities lending program, including fixed maturity securities and short-term investments. Under this program, we obtain collateral, usually cash, at the inception of a loan and typically purchase securities with the cash collateral. Upon the return to us of these loaned securities, we must return to the third-party the cash collateral we received. If the cash collateral has been invested in securities, we need to sell the securities. However, in some cases, the maturity of those securities may exceed the term of the related securities on loan and the estimated fair value of the securities we need to sell may fall below the amount of cash received.
If we are required to return significant amounts of cash collateral in connection with our securities lending or otherwise need significant amounts of cash on short notice and we are forced to sell securities, we may have difficulty selling such collateral that is invested in securities in a timely manner, be forced to sell securities in a volatile or illiquid market for less than we otherwise would have been able to realize under normal market conditions, or both. In the event of a forced sale, accounting guidance requires the recognition of a loss for securities in an unrealized loss position and may require the impairment of other securities based on our ability to hold those securities, which would negatively impact our financial condition, as well as our financial ratios, which could affect compliance with our credit instruments and rating agency capital adequacy measures. In addition, under stressful capital market and economic conditions, liquidity broadly deteriorates, which may further restrict our ability to sell securities. Furthermore, if we decrease the amount of our securities lending activities over time, the amount of net investment income generated by these activities will also likely decline. See “Management’s Discussion and Analysis of Financial Condition and Results of Operations — Investments — Securities Lending.”
73
Our requirements to pledge collateral or make payments related to declines in estimated fair value of derivatives transactions or specified assets in connection with OTC-cleared, OTC-bilateral transactions and exchange traded derivatives may adversely affect our liquidity, expose us to central clearinghouse and counterparty credit risk, and increase our costs of hedging
Many of our derivatives transactions require us to pledge collateral related to any decline in the net estimated fair value of such derivatives transactions executed through a specific broker at a clearinghouse or entered into with a specific counterparty on a bilateral basis. The amount of collateral we may be required to pledge and the payments we may be required to make under our derivatives transactions may increase under certain circumstances and will increase as a result of the requirement to pledge initial margin for OTC-cleared transactions entered into after June 10, 2013 and for OTC-bilateral transactions entered into after the phase-in period, which would be applicable to us in 2020 as a result of the adoption by the Office of the Comptroller of the Currency, the Federal Reserve Board, FDIC, Farm Credit Administration and Federal Housing Finance Agency (collectively, the “Prudential Regulators”) and the CFTC of final margin requirements for non-centrally cleared derivatives. Although the final rules allow us to pledge a broad range of non-cash collateral as initial and variation margin, the Prudential Regulators, CFTC, central clearinghouses and counterparties may restrict or eliminate certain types of previously eligible collateral, or charge us to pledge such non-cash collateral, which would increase our costs and could adversely affect our liquidity and the composition of our investment portfolio. See “Business — Regulation — Regulation of Over-the-Counter Derivatives.”
Gross unrealized losses on fixed maturity and equity securities and defaults, downgrades or other events may result in future impairments to the carrying value of such securities, resulting in a reduction in our net income
Fixed maturity and equity securities classified as available-for-sale (“AFS”) securities are reported at their estimated fair value. Unrealized gains or losses on AFS securities are recognized as a component of other comprehensive income (loss) (“OCI”) and are, therefore, excluded from net income. In recent periods, as a result of low interest rates, the unrealized gains on our fixed maturity securities have exceeded the unrealized losses. However, if interest rates rise, our unrealized gains would decrease and our unrealized losses would increase, perhaps substantially. The accumulated change in estimated fair value of these AFS securities is recognized in net income when the gain or loss is realized upon the sale of the security or in the event that the decline in estimated fair value is determined to be other-than-temporary and impairment charges to earnings are taken. See “Management’s Discussion and Analysis of Financial Condition and Results of Operations — Investments — Fixed Maturity and Equity Securities Available-for-Sale.”
The occurrence of a major economic downturn, acts of corporate malfeasance, widening credit risk spreads, or other events that adversely affect the issuers or guarantors of securities or the underlying collateral of structured securities could cause the estimated fair value of our fixed maturity securities portfolio and corresponding earnings to decline and cause the default rate of the fixed maturity securities in our investment portfolio to increase. A ratings downgrade affecting issuers or guarantors of particular securities, or similar trends that could worsen the credit quality of issuers, such as the corporate issuers of securities in our investment portfolio, could also have a similar effect. With economic uncertainty, credit quality of issuers or guarantors could be adversely affected. Similarly, a ratings downgrade affecting a security we hold could indicate the credit quality of that security has deteriorated and could increase the capital we must hold to support that security to maintain our RBC levels. Levels of write-downs or impairments are impacted by intent to sell, or our assessment of the likelihood that we will be required to sell, fixed maturity securities, as well as our intent and ability to hold equity securities which have declined in value until recovery. Realized losses or impairments on these securities may have a material adverse effect on our results of operations and financial condition in, or at the end of, any quarterly or annual period.
Our valuation of securities and investments and the determination of the amount of allowances and impairments taken on our investments are subjective and, if changed, could materially adversely affect our results of operations or financial condition
Fixed maturity and equity securities, as well as short-term investments that are reported at estimated fair value, represent the majority of our total cash and investments. We define fair value generally as the price that would be received to sell an asset or paid to transfer a liability. Considerable judgment is often required in interpreting market data to develop estimates of fair value, and the use of different assumptions or valuation methodologies may have a material effect of the estimated fair value amounts. During periods of market disruption, including periods of significantly rising or high interest rates, rapidly widening credit spreads or illiquidity, it may be difficult to value certain of our securities if trading becomes less frequent and/or market data becomes less observable. In addition, in times of financial market disruption, certain asset classes that were in active markets with significant observable data may become illiquid. In those cases, the valuation process includes inputs that are less observable and require more subjectivity and management judgment. Valuations may result in estimated fair values which vary significantly from the amount at which the investments may ultimately be sold. Further, rapidly changing and unprecedented credit and equity market conditions could materially impact the valuation of securities as reported within our c
onsolidated and combined
financial statements and the period-to-period changes in estimated fair value could vary significantly. Decreases in the estimated fair value of securities we hold may have a material adverse effect on our financial condition. See “Management’s Discussion and
74
Analysis of Financial Condition and Results of Operations — Summary of Critical Accounting Estimates — Estimated Fair Value of Investments.”
The determination of the amount of allowances and impairments varies by investment type and is based upon our periodic evaluation and assessment of known and inherent risks associated with the respective asset class. Such evaluations and assessments are revised as conditions change and new information becomes available. We reflect any changes in allowances and impairments in earnings as such evaluations are revised. However, historical trends may not be indicative of future impairments or allowances. In addition, any such future impairments or allowances could have a materially adverse effect on our earnings and financial position. See “Management’s Discussion and Analysis of Financial Condition and Results of Operations — Summary of Critical Accounting Estimates — Investment Impairments.”
Defaults on our mortgage loans and volatility in performance may adversely affect our profitability
Our mortgage loans face default risk and are principally collateralized by commercial, agricultural and residential properties. We establish valuation allowances for estimated impairments, which are based on loan risk characteristics, historical default rates and loss severities, real estate market fundamentals, such as housing prices and unemployment, and outlooks, as well as other relevant factors (for example, local economic conditions). In addition, substantially all of our commercial and agricultural mortgage loans held-for-investment have balloon payment maturities. An increase in the default rate of our mortgage loan investments or fluctuations in their performance could have a material adverse effect on our results of operations and financial condition.
Further, any geographic or property type concentration of our mortgage loans may have adverse effects on our investment portfolio and consequently on our results of operations or financial condition. Events or developments that have a negative effect on any particular geographic region or sector may have a greater adverse effect on our investment portfolio to the extent that the portfolio is concentrated. Moreover, our ability to sell assets relating to a group of related assets may be limited if other market participants are seeking to sell at the same time. In addition, scrutiny of the mortgage industry continues and there may be legislative proposals that would allow or require modifications to the terms of mortgage loans could be enacted. We cannot predict whether any such proposals will be adopted, or what impact, if any, such proposals or, if enacted, such laws, could have on our business or investments. See “Management’s Discussion and Analysis of Financial Condition and Results of Operations — Investments — Mortgage Loans.”
The defaults or deteriorating credit of other financial institutions could adversely affect us
We have exposure to many different industries and counterparties, and routinely execute transactions with counterparties in the financial services industry, including brokers and dealers, central clearinghouses, commercial banks, investment banks, hedge funds and investment funds and other financial institutions. Many of these transactions expose us to credit risk in the event of the default of our counterparty. In addition, with respect to secured transactions, our credit risk may be exacerbated when the collateral held by us cannot be realized or is liquidated at prices not sufficient to recover the full amount of the loan or derivative exposure due to us. We also have exposure to these financial institutions in the form of unsecured debt instruments, non-redeemable and redeemable preferred securities, derivatives and joint venture, hedge fund and equity investments. Further, potential action by governments and regulatory bodies in response to the financial crisis affecting the global banking system and financial markets, such as investment, nationalization, conservatorship, receivership and other intervention, whether under existing legal authority or any new authority that may be created, or lack of action by governments and central banks, as well as deterioration in the banks’ credit standing, could negatively impact these instruments, securities, transactions and investments or limit our ability to trade with them. Any such losses or impairments to the carrying value of these investments or other changes may materially and adversely affect our results of operations and financial condition.
The continued threat of terrorism and ongoing military actions may adversely affect the value of our investment portfolio and the level of claim losses we incur
The continued threat of terrorism, both within the United States and abroad, ongoing military and other actions and heightened security measures in response to these types of threats may cause significant volatility in global financial markets and result in loss of life, property damage, additional disruptions to commerce and reduced economic activity. The value of assets in our investment portfolio may be adversely affected by declines in the credit and equity markets and reduced economic activity caused by the continued threat of terrorism. Companies in which we maintain investments may suffer losses as a result of financial, commercial or economic disruptions and such disruptions might affect the ability of those companies to pay interest or principal on their securities or mortgage loans. Terrorist actions also could disrupt our operations centers in the U.S. and result in higher than anticipated claims under our insurance policies. See “Management’s Discussion and Analysis of Financial Condition and Results of Operations — Policyholder Liabilities.”
75
Capital-Related Risks
As a holding company, Brighthouse Financial, Inc. depends on the ability of its subsidiaries to pay dividends
Brighthouse Financial, Inc. is a holding company for its insurance subsidiaries and does not have any significant operations of its own. We depend on the cash at the holding company plus dividends from our subsidiaries to meet our obligations and to pay common stock dividends, if any. See “Management’s Discussion and Analysis of Financial Condition and Results of Operations — Liquidity and Capital Resources — The Company — Capital — Restrictions on Dividends and Returns of Capital from Insurance Subsidiaries.”
If the cash Brighthouse Financial, Inc. receives from its subsidiaries is insufficient for it to fund its debt service and other holding company obligations, Brighthouse Financial, Inc. may be required to raise cash through the incurrence of indebtedness, the issuance of additional equity or the sale of assets. Our ability to access funds through such methods is subject to prevailing market conditions and there can be no assurance that we will be able to do so. In addition, the terms of a tax separation agreement that we entered into with MetLife immediately prior to the Distribution contain restrictions that may restrict or limit our ability to issue additional equity or sell assets. See “— Economic Environment and Capital Markets-Related Risks — Adverse capital and credit market conditions may significantly affect our ability to meet liquidity needs and our access to capital” and “Certain Relationships and Related Party Transactions—Agreements Between Us and MetLife—Tax Separation Agreement.”
The payment of dividends and other distributions to Brighthouse Financial, Inc. by its insurance subsidiaries is regulated by insurance laws and regulations. In general, dividends in excess of prescribed limits require insurance regulatory approval. In addition, insurance regulators may prohibit the payment of dividends or other payments to Brighthouse Financial, Inc. by its insurance subsidiaries if they determine that the payment could be adverse to the interests of our policyholders or contract holders. In connection with our affiliated reinsurance company restructuring, the Delaware Department of Insurance approved the payment of a dividend from BRCD to its parent, Brighthouse Life Insurance Company, which we completed in May 2017. Any additional dividends by BRCD are subject to the approval of the Delaware Department of Insurance. Any requested payment of dividends by Brighthouse Life Insurance Company and NELICO to Brighthouse Financial, Inc., or by BHNY to Brighthouse Life Insurance Company, in excess of their respective 2018 ordinary dividend capacity would be considered an extraordinary dividend subject to prior approval by the Delaware Department of Insurance and the Massachusetts Division of Insurance, and the New York State Department of Financial Services, respectively. The payment of dividends and other distributions by insurance companies is also influenced by business conditions including those described in the Risk Factors above and rating agency considerations. See “— Regulatory and Legal Risks — A decrease in the RBC ratio (as a result of a reduction in statutory surplus and/or increase in RBC requirements) of our insurance subsidiaries could result in increased scrutiny by insurance regulators and rating agencies and have a material adverse effect on our results of operations and financial condition.” See also “Business — Regulation — Insurance Regulation” and “Management’s Discussion and Analysis of Financial Condition and Results of Operations — Liquidity and Capital Resources — The Company — Capital — Restrictions on Dividends and Returns of Capital from Insurance Subsidiaries.”
Operational Risks
Gaps in our risk management policies and procedures may leave us exposed to unidentified or unanticipated risk, which could negatively affect our business
We have developed and continue to develop risk management policies and procedures to reflect the ongoing review of our risks and expect to continue to do so in the future. Nonetheless, our policies and procedures may not be comprehensive and may not identify every risk to which we are exposed. Many of our methods for managing risk and exposures are based upon the use of observed historical market behavior to model or project potential future exposure. Models used by our business are based on assumptions and projections which may be inaccurate. Business decisions based on incorrect or misused model output and reports could have a material adverse impact on our results of operations. Model risk may be the result of a model being misspecified for its intended purpose, being misused or producing incorrect or inappropriate results. Models used by our business may not operate properly and could contain errors related to model inputs, data, assumptions, calculations, or output which could give rise to adjustments to models that may adversely impact our results of operations. As a result, these methods may not fully predict future exposures, which can be significantly greater than our historical measures indicate. Other risk management methods depend upon the evaluation of information regarding markets, clients, catastrophe occurrence or other matters that are publicly available or otherwise accessible to us. This information may not always be accurate, complete, up-to-date or properly evaluated. Furthermore, there can be no assurance that we can effectively review and monitor all risks or that all of our employees will follow our risk management policies and procedures, nor can there be any assurance that our risk management policies and procedures will enable us to accurately identify all risks and limit our exposures based on our assessments. In addition, we may have to implement more extensive and perhaps different risk management policies and procedures under pending regulations.
76
See “— Risks Related to Our Business — Our variable annuity exposure management strategy may not be effective, may result in net income volatility and may negatively affect our statutory capital.”
The failure in cyber- or other information security systems, as well as the occurrence of events unanticipated in Brighthouse’s and MetLife’s disaster recovery systems and business continuity planning could result in a loss or disclosure of confidential information, damage to our reputation and impairment of our ability to conduct business effectively
Our business is highly dependent upon the effective operation of our computer systems and, for the duration of the Transition Services Agreement and other agreements with MetLife companies, MetLife’s computer systems. We rely on these systems throughout our business for a variety of functions, including processing new business, claims, and post-issue transactions, providing information to customers and distributors, performing actuarial analyses and maintaining financial records. We also retain confidential and proprietary information on such computer systems and we rely on sophisticated technologies to maintain the security of that information. Such computer systems have been, and will likely continue to be, subject to a variety of forms of cyberattacks with the objective of gaining unauthorized access to Brighthouse systems and data or disrupting Brighthouse operations. These include, but are not limited to, phishing attacks, malware, ransomware, denial of service attacks, and other computer-related penetrations. Administrative and technical controls and other preventive actions taken to reduce the risk of cyber-incidents and protect our information technology may be insufficient to prevent physical and electronic break-ins, cyberattacks or other security breaches to such computer systems. In some cases, such physical and electronic break-ins, cyberattacks or other security breaches may not be immediately detected. This may impede or interrupt our business operations and could adversely affect our business, financial condition and results of operations. In addition, the availability and cost of insurance for operational and other risks relating to our business and systems may change and any such change may affect our results of operations.
In the event of a disaster such as a natural catastrophe, epidemic, industrial accident, blackout, computer virus, terrorist attack, cyberattack or war, unanticipated problems with our disaster recovery systems or, for the duration of the Transition Services Agreement and other agreements with MetLife companies, MetLife’s disaster recovery systems, could have a material adverse impact on our ability to conduct business and on our results of operations and financial position, particularly if those problems affect our computer-based data processing, transmission, storage and retrieval systems and destroy valuable data. In addition, in the event that a significant number of our or MetLife’s managers were unavailable following a disaster, our ability to effectively conduct business could be severely compromised. These interruptions also may interfere with our suppliers’ ability to provide goods and services and our employees’ ability to perform their job responsibilities.
The failure of our computer systems or, for the duration of the Transition Services Agreement and other agreements with MetLife companies, MetLife’s systems, and/or our respective disaster recovery plans for any reason could cause significant interruptions in our operations and result in a failure to maintain the security, confidentiality or privacy of sensitive data, including personal information relating to our customers. Such a failure could harm our reputation, subject us to regulatory sanctions and legal claims, lead to a loss of customers and revenues and otherwise adversely affect our business and financial results. Vendors, distributors, and other third parties, including MetLife, provide operational or information technology services to us. The failure of such third parties’ or MetLife’s computer systems and/or their disaster recovery plans for any reason might cause significant interruptions in our operations and result in a failure to maintain the security, confidentiality or privacy of sensitive data, including personal information relating to our customers. Such a failure could harm our reputation, subject us to regulatory sanctions and legal claims, lead to a loss of customers and revenues and otherwise adversely affect our business and financial results. While we maintain cyber liability insurance that provides both third-party liability and first-party liability coverages, this insurance may not be sufficient to protect us against all losses. There can be no assurance that our information security policies and systems in place can prevent unauthorized use or disclosure of confidential information, including nonpublic personal information. Any failure to protect the confidentiality of customer information could adversely affect our reputation and have a material adverse effect on our business, financial condition and results of operations.
Our associates and those of MetLife may take excessive risks which could negatively affect our financial condition and business
As an insurance enterprise, we are in the business of accepting certain risks. The associates who conduct our business, including executive officers and other members of management, sales intermediaries, investment professionals, product managers, and other associates, as well as associates of MetLife who provide services to Brighthouse in connection with the Transition Services Agreement, the Third-Party Administrative Services Agreement or the Investment Management Agreements do so in part by making decisions and choices that involve exposing us to risk. See “Certain Relationships and Related Person Transactions — Agreements Between Us and MetLife” for information regarding such agreements. These include decisions such as setting underwriting guidelines and standards, product design and pricing, determining what assets to purchase for
77
investment and when to sell them, which business opportunities to pursue, and other decisions. Associates may take excessive risks regardless of the structure of our compensation programs and practices. Similarly, our controls and procedures designed to monitor associates’ business decisions and prevent them from taking excessive risks, and to prevent employee misconduct, may not be effective. If our associates take excessive risks, the impact of those risks could harm our reputation and have a material adverse effect on our financial condition and business operations.
General Risks
Changes in accounting standards issued by the Financial Accounting Standards Board may adversely affect our financial statements
Our financial statements are subject to the application of GAAP, which is periodically revised by the Financial Accounting Standards Board (“FASB”), a recognized authoritative body. Accordingly, from time to time we are required to adopt new or revised accounting standards or interpretations issued by the FASB. The impact of accounting pronouncements that have been issued but not yet implemented are disclosed in our reports filed with the SEC. See
Note 1
of the Notes to the Consolidated and Combined Financial Statements. The FASB issued several proposed amendments to the accounting for long duration insurance contracts on September 29, 2016. One of the proposed amendments, in particular, would require all guarantees associated with our variable annuity business to be accounted for at fair value, with changes in fair value reported in net income (excluding the change in fair value attributable to nonperformance risk, which would be reported in OCI). Any of the proposed amendments to the accounting for long duration insurance contracts, if adopted, would not be expected to be effective for several years after issuance of a final standard. An assessment of the potential impact of proposed FASB standards, including the proposed changes to long duration insurance accounting, is not provided as such proposals are subject to change through the exposure process and official positions of the FASB are determined only after extensive due process and deliberations. The required adoption of these proposed and other future accounting standards could have a material adverse effect on our GAAP basis equity and results of operations, including on our net income.
We may not be able to protect our intellectual property and may be subject to infringement claims
We rely on a combination of contractual rights with third parties and copyright, trademark, patent and trade secret laws to establish and protect our intellectual property. Third parties may infringe or misappropriate our intellectual property. We may have to litigate to enforce and protect our copyrights, trademarks, patents, trade secrets and know-how or to determine their scope, validity or enforceability. This would represent a diversion of resources that may be significant and our efforts may not prove successful. The inability to secure or protect our intellectual property assets could harm our reputation and have a material adverse effect on our business and our ability to compete with other insurance companies and financial institutions. See “— Risks Related to Our Separation from, and Continuing Relationship with, MetLife — Our separation from MetLife could adversely affect our business and profitability due to MetLife’s strong brand and reputation.”
In addition, we may be subject to claims by third parties for (i) patent, trademark or copyright infringement, (ii) breach of patent, trademark or copyright license usage rights, or (iii) misappropriation of trade secrets. Any such claims or resulting litigation could result in significant expense and liability for damages. If we were found to have infringed or misappropriated a third-party patent or other intellectual property right, we could in some circumstances be enjoined from providing certain products or services to our customers or from utilizing and benefiting from certain patents, copyrights, trademarks, trade secrets or licenses. Alternatively, we could be required to enter into costly licensing arrangements with third parties or implement a costly alternative. Any of these scenarios could harm our reputation and have a material adverse effect on our business and results of operations.
We may experience difficulty in marketing and distributing products through our distribution channels
We distribute our products exclusively through a variety of third-party distribution channels. We may periodically negotiate the terms of these relationships, and there can be no assurance that such terms will remain acceptable to us or such third parties. Such distributors will be subject to differing commission structures, depending on the product sold, one of which is a level/asset-based commission structure; other products are subject to a more traditional commission structure. If a particular commission structure is not acceptable to these distributors, or if we are unsuccessful in attracting and retaining key associates who conduct our business, including wholesalers and financial advisors, our sales of individual insurance, annuities and investment products could decline and our results of operations and financial condition could be materially adversely affected. See “— Risks Related to Our Business — Elements of our business strategy are new and may not be effective in accomplishing our objectives.”
Furthermore, an interruption in certain key relationships could materially affect our ability to market our products and could have a material adverse effect on our results of operations and financial condition. Our Separation from MetLife prompted some third parties to re-price, modify or terminate their distribution or vendor relationships with us. An interruption or significant change in certain key relationships could materially affect our ability to market our products and could have a material adverse
78
effect on our results of operations and financial condition. In February 2016, Fidelity elected to suspend its distribution relationship with us following the announcement of the planned separation from MetLife; the suspension was the primary cause of a significant reduction in our sales of variable annuities year-over-year for the year ended December 31, 2016. Other distributors may elect to suspend, alter, reduce or terminate their distribution relationships with us for various reasons, changes in our distribution strategy, adverse developments in our business, adverse rating agency actions, or concerns about market-related risks. We are also at risk that key distribution partners may merge, change their business models in ways that affect how our products are sold, or terminate their distribution contracts with us, or that new distribution channels could emerge and adversely impact the effectiveness of our distribution efforts. In addition, we rely on a core number of our distributors to produce the majority of our sales. If any one such distributor were to terminate its relationship with us or reduce the amount of sales which it produces for us our results of operations could be adversely affected. An increase in bank and broker-dealer consolidation activity could increase competition for access to distributors, result in greater distribution expenses and impair our ability to market products through these channels. Consolidation of distributors and/or other industry changes may also increase the likelihood that distributors will try to renegotiate the terms of any existing selling agreements to terms less favorable to us.
Because our products are distributed through unaffiliated firms, we may not be able to monitor or control the manner of their distribution despite our training and compliance programs. If our products are distributed by such firms in an inappropriate manner, or to customers for whom they are unsuitable, we may suffer reputational and other harm to our business.
In addition, our distributors may also sell our competitors’ products. If our competitors offer products that are more attractive than ours, or pay higher commission rates to the sales representatives than we do, these representatives may concentrate their efforts in selling our competitors’ products instead of ours. Prior to the sale of MPCG to MassMutual we distributed a significant portion of our annuity products and insurance policies through MPCG. In connection with the sale we entered into an agreement which permits us to serve as the exclusive manufacturer for certain proprietary products which are offered through MassMutual’s career agent channel. We partnered with MassMutual to develop the initial product distributed under this arrangement, the Index Horizons fixed indexed annuity, and agreed on the terms of the related reinsurance. While the agreement has a term of 10 years, it is possible that MassMutual may terminate our exclusivity or the agreement itself in specified circumstances, such as our inability or failure to provide product designs that reasonably meet MassMutual requirements. Although we expect MassMutual to be an important distribution partner with respect to certain of our products, we believe that the level of sales, if any, produced through this channel will be materially less than the levels produced historically through MPCG.
We may be unable to attract and retain key personnel to support our business
Our success depends, in large part, on our ability to attract and retain key personnel. We compete with other financial services companies for personnel primarily on the basis of compensation, support services and financial position. Intense competition exists for key personnel with demonstrated ability, and we may be unable to hire or retain such personnel. The unexpected loss of services of one or more of our key personnel could have a material adverse effect on our business due to loss of their skills, knowledge of our business, their years of industry experience and the potential difficulty of promptly finding qualified replacement personnel in North Carolina or elsewhere who are prepared to relocate. We may not be able to attract and retain qualified personnel to fill open positions or replace or succeed members of our senior management team or other key personnel. Proposed rules implementing the executive compensation provisions of Dodd-Frank may limit the type and structure of compensation arrangements into which we may enter with certain of our employees and officers. In addition, proposed rules under Dodd-Frank would prohibit the payment of “excessive compensation” to our executives. These restrictions could negatively impact our ability to compete with other companies in recruiting and retaining key personnel.
Our ability to attract and retain highly qualified independent sales intermediaries for our products may also be negatively affected by our Separation from MetLife. We may be required to lower the prices of our products, increase our sales commissions and fees, change long-term selling and marketing agreements and take other actions to maintain our relationship with our sales intermediaries and distribution partners, all of which could have an adverse effect on our financial condition and results of operations. We cannot accurately predict the long-term effect that our Separation from MetLife will have on our business, sales intermediaries, customers, distributors or associates who conduct our business. In addition, we agreed in the Master Separation Agreement with MetLife that for a certain period following the date of the Master Separation Agreement, subject to customary exceptions regarding prior associates who conduct our business, general solicitation and employees who contact us without being solicited, we will not solicit for employment certain current employees of MetLife or any of its affiliates. We cannot predict how this potential agreement not to solicit employees will impact our ability to attract and recruit associates necessary to the operation of our business.
79
Any failure to protect the confidentiality of client information could adversely affect our reputation and have a material adverse effect on our business, financial condition and results of operations
Pursuant to federal and state laws, various government agencies have established rules protecting the privacy and security of personal information. In addition, most states have enacted laws, which vary significantly from jurisdiction to jurisdiction, to safeguard the privacy and security of personal information. Many of the associates who conduct our business have access to, and routinely process, personal information of clients through a variety of media, including information technology systems. We rely on various internal processes and controls to protect the confidentiality of client information that is accessible to us, or in our possession or the possession of our associates. It is possible that an associate could, intentionally or unintentionally, disclose or misappropriate confidential client information and our data has been the subject of cyberattacks and could be subject to additional attacks. If we fail to maintain adequate internal controls or if our associates fail to comply with our policies and procedures, misappropriation or intentional or unintentional inappropriate disclosure or misuse of client information could occur. Such internal control inadequacies or non-compliance could materially damage our reputation or lead to civil or criminal penalties, which, in turn, could have a material adverse effect on our business, financial condition and results of operations. In addition, we analyze customer data to better manage our business. There has been increased scrutiny, including from state regulators, regarding the use of “big data” techniques such as price optimization. We cannot predict what, if any, actions may be taken with regard to “big data,” but any inquiry in connection with our “big data” business practices could cause reputational harm and any limitations could have a material impact on our business, financial condition and results of operations. See “— The failure in cyber- or other information security systems, as well as the occurrence of events unanticipated in Brighthouse’s and MetLife’s disaster recovery systems and business continuity planning could result in a loss or disclosure of confidential information, damage to our reputation and impairment of our ability to conduct business effectively.
”
We could face difficulties, unforeseen liabilities, asset impairments or rating actions arising from business acquisitions or dispositions
We may engage in dispositions and acquisitions of businesses. Such activity exposes us to a number of risks arising from (i) potential difficulties achieving projected financial results including the costs and benefits of integration or deconsolidation; (ii) unforeseen liabilities or asset impairments; (iii) the scope and duration of rights to indemnification for losses; (iv) the use of capital which could be used for other purposes; (v) rating agency reactions; (vi) regulatory requirements that could impact our operations or capital requirements; (vii) changes in statutory accounting principles or GAAP, practices or policies; and (viii) certain other risks specifically arising from activities relating to a legal entity reorganization.
Our ability to achieve certain financial benefits we anticipate from any acquisitions of businesses will depend in part upon our ability to successfully integrate such businesses in an efficient and effective manner. There may be liabilities or asset impairments that we fail, or are unable, to discover in the course of performing acquisition-related due diligence investigations. Furthermore, even for obligations and liabilities that we do discover during the due diligence process, neither the valuation adjustment nor the contractual protections we negotiate may be sufficient to fully protect us from losses.
We may from time to time dispose of business or blocks of in-force business through outright sales, reinsurance transactions or by alternate means. After a disposition, we may remain liable to the acquirer or to third parties for certain losses or costs arising from the divested business or on other bases. We may also not realize the anticipated profit on a disposition or incur a loss on the disposition. In anticipation of any disposition, we may need to restructure our operations, which could disrupt such operations and affect our ability to recruit key personnel needed to operate and grow such business pending the completion of such transaction. In addition, the actions of key employees of the business to be divested could adversely affect the success of such disposition as they may be more focused on obtaining employment, or the terms of their employment, than on maximizing the value of the business to be divested. Furthermore, transition services or tax arrangements related to any such separation could further disrupt our operations and may impose restrictions, liabilities, losses or indemnification obligations on us. Depending on its particulars, a separation could increase our exposure to certain risks, such as by decreasing the diversification of our sources of revenue. Moreover, we may be unable to timely dissolve all contractual relationships with the divested business in the course of the proposed transaction, which may materially adversely affect our ability to realize value from the disposition. Such restructuring could also adversely affect our internal controls and procedures and impair our relationships with key customers, distributors and suppliers. An interruption or significant change in certain key relationships could materially affect our ability to market our products and could have a material adverse effect on our business, operating results and financial condition.
80
Risks Related to Our Separation from, and Continuing Relationship with, MetLife
Our Separation from MetLife could adversely affect our business and profitability due to MetLife’s strong brand and reputation
Prior to the Distribution, as a wholly-owned subsidiary of MetLife, we marketed our products and services using the “MetLife” brand name and logo. We have also benefited from trademarks licensed in connection with the MetLife brand. We believe the association with MetLife provided us with preferred status among our customers, vendors and other persons due to MetLife’s globally recognized brand, reputation for high quality products and services and strong capital base and financial strength.
Our Separation from MetLife could adversely affect our ability to attract and retain customers, which could result in reduced sales of our products. In connection with the Distribution, we entered into the Intellectual Property License Agreement and Master Separation Agreement with MetLife, pursuant to which we have a license to use certain trademarks and the “MetLife” name in certain limited circumstances, including as part of a marketing tag line, for a transition period or otherwise to refer to our historic affiliation with MetLife on selected materials for a limited period of time following the Distribution. See “Certain Relationships and Related Person Transactions — Agreements Between Us and MetLife — Master Separation Agreement —The separation of our business.” We have undergone operational and legal work to rebrand to “Brighthouse.”
We have established a portfolio of trademarks in the United States that we consider important in the marketing of our products and services, including for our name, “Brighthouse Financial.” We have also filed other trademark applications in the United States, including for our logo design and potential taglines. However, the registration of some of these trademarks is not complete and they may not all ultimately become registered. Our use of the Brighthouse Financial name for the Company or for our existing or any new products in the United States has been challenged by third parties, and we were involved in legal proceedings to protect or defend our rights with respect to the Brighthouse Financial name and trademarks. Although the parties to these proceedings have resolved this matter and dismissed the action, it is possible that other challenges to our trademarks could arise in the future.
As a result of our Separation from MetLife, some of our existing policyholders, contract owners and other customers have chosen, and some may in the future choose to stop doing business with us, which could increase the rate of surrenders and withdrawals in our policies and contracts. In addition, other potential policyholders and contract owners may decide not to purchase our products because we no longer are a part of MetLife.
Our contractual arrangements with MetLife may not be adequate to meet our operational and business needs. The terms of our arrangements with MetLife may be more favorable than we would be able to obtain from an unaffiliated third party, and we may be unable to replace those services in a timely manner or on comparable terms
We have contractual arrangements, such as the Transition Services Agreement, Investment Management Agreements, the Intellectual Property License Agreement, the Investment Finance Services Agreements entered into in connection with the Investment Management Agreements and other agreements that require MetLife affiliates to provide certain services to us, including the receipt of certain IT services pursuant to software license agreements that MetLife affiliates have with certain third-party software vendors, and the provision of investment management and related accounting, reporting, actuarial and other administrative services by MLIA with respect to Brighthouse’s general and separate account investment portfolios. See “Certain Relationships and Related Person Transactions.” There can be no assurance that the services to be provided by the MetLife affiliates will be sufficient to meet our operational and business needs, that the MetLife affiliates will be able to perform such functions in a manner satisfactory to us, that MetLife’s practices and procedures will enable it to adequately administer the policies it handles or that any remedies available under these arrangements will be sufficient to us in the event of a dispute or nonperformance. See “— Risks Related to Our Business — The failure of third parties to provide various services that are important to our operations, or any failure of the practices and procedures that these third parties use to provide services to us, could have a material adverse effect on our business.”
Upon termination or expiration of any agreement between us and MetLife affiliates, there can be no assurance that these services will be sustained at the same levels as they were when we were receiving such services from MetLife or that we will be able to obtain the same benefits from another provider or our indemnity rights from such third parties will not be limited. We may not be able to replace services and arrangements in a timely manner or on terms and conditions, including cost, as favorable as those we have previously received from MetLife. The agreements with the MetLife affiliates were entered into in the context of intercompany relationships that arose from enterprise-wide agreements with vendors, and we may have to pay higher prices for similar services from MetLife or unaffiliated third parties in the future.
81
The Brighthouse Board and its directors and officers may have limited liability to us and you for breach of fiduciary duty
Our amended and restated certificate of incorporation provides that none of our directors and officers will be personally liable to us or our shareholders for monetary damages for breach of fiduciary duty, except for liability for breach of their duty of loyalty, acts or omissions not in good faith or which involve intentional misconduct or a knowing violation of law, dividend payments or stock repurchases that are unlawful under Delaware law or any transaction in which a director has derived an improper personal benefit.
There are incremental costs as a separate, public company
As a result of the Separation, we needed to replicate or replace certain functions, systems and infrastructure. We have begun to make infrastructure investments in order to operate without MetLife’s existing operational and administrative infrastructure. These initiatives involve substantial costs, the hiring and integration of a large number of new employees, and integration of the new and expanded operations and infrastructure with our existing operations and infrastructure and, in some cases, the operations and infrastructure of our partners and other third parties. They also require significant time and attention from our senior management and others throughout the Company, in addition to their day-to-day responsibilities running the business. There can be no assurance that we will be able to establish and expand the operations and infrastructure to the extent required, in the time, or at the costs anticipated, and without disrupting our ongoing business operations in a material way, all of which could have a material adverse effect on our business and results of operations.
Our business has benefited from MetLife’s purchasing power when procuring goods and services. As a standalone company, we may be unable to obtain such goods and services at comparable prices or on terms as favorable as those obtained prior to the Distribution, which could decrease our overall profitability. See “— Our contractual arrangements with MetLife may not be adequate to meet our operational and business needs. The terms of our arrangements with MetLife may be more favorable than we would be able to obtain from an unaffiliated third party, and we may be unable to replace those services in a timely manner or on comparable terms.”
We have a very large number of shareholders which may impact the efficacy of shareholder votes and will result in increased costs
Under the plan of reorganization of Metropolitan Life Insurance Company (“MLIC”), the MetLife Policyholder Trust was established to hold the shares of MetLife common stock allocated to eligible policyholders not receiving cash or policy credits under the plan. As of February 16, 2018, 154,420,615, or 14.9%, of the outstanding shares of MetLife common stock were held in the MetLife Policyholder Trust for the benefit of approximately three million trust beneficiaries. These trust beneficiaries are eligible to vote only on certain fundamental corporate actions of MetLife. The trustee of the MetLife Policyholder Trust votes on their behalf on all other matters in accordance with the recommendation of the MetLife Board of Directors.
Brighthouse does not have such a trust structure and, therefore a large number of trust beneficiaries became shareholders of Brighthouse. The addition of this large number of additional shareholders with full voting rights to our shareholder base may have a significant impact on matters brought to a shareholder vote and other aspects of our corporate governance. We will also incur increased costs in connection with a larger shareholder base. These costs may include mailing costs and vendor fees related to servicing the needs of these shareholders.
As a separate, public company, we expend additional time and resources to comply with rules and regulations that did not apply to us prior to the Separation
As a separate, public company, the various rules and regulations of the SEC, as well as the rules of Nasdaq Stock Market LLC (“Nasdaq”), on which our common stock is listed, require us to implement additional corporate governance practices and adhere to a variety of reporting requirements. Compliance with these public company obligations has increased our legal and financial compliance costs and could place additional demands on our finance, legal and accounting staff and on our financial, accounting and information systems.
In particular, as a separate, public company, our management will be required to conduct an annual evaluation of our internal controls over financial reporting and include a report of management on our internal controls in our Annual Reports on Form 10-K. In addition, we will be required to have our independent registered public accounting firm attest to the effectiveness of our internal controls over financial reporting pursuant to Auditing Standard No. 5. If we are unable to conclude that we have effective internal controls over financial reporting, investors could lose confidence in the reliability of our financial statements, which could result in a decrease in the value of our common stock.
82
Our historical combined financial data are not necessarily representative of the results we would have achieved as a separate company and may not be a reliable indicator of our future results
Our historical combined financial data included in this Annual Report on Form 10-K and in our other filings with the SEC do not necessarily reflect the financial condition, results of operations or cash flows we would have achieved as a standalone company during the periods presented or those we will achieve in the future. For example, we are in the process of adjusting our capital structure to more closely align with U.S. public companies. As a result, financial metrics that are influenced by our capital structure, such as interest expense and return on equity, will not necessarily be indicative for historical periods of the performance we may achieve as a separate company. In addition, significant increases may occur in our cost structure as a result of the Distribution, including costs related to public company reporting, investor relations and compliance with the Sarbanes-Oxley Act of 2002. Also, we have incurred and anticipate incurring substantial expenses in connection with rebranding our business.
As a result of these matters, among others, it may be difficult for investors to compare our future results to historical results or to evaluate our relative performance or trends in our business.
We have agreed under the Master Separation Agreement with MetLife to indemnify MetLife, its directors, officers and employees and certain of its agents for liabilities relating to, arising out of or resulting from certain events relating to our business
The Master Separation Agreement provides that, subject to certain exceptions, we will indemnify, hold harmless and defend MetLife and certain related individuals (generally including MetLife’s directors, officers and employees and certain agents), from and against all liabilities relating to, arising out of or resulting from certain events relating to our business. We cannot predict whether any event triggering this indemnity will occur or the extent to which we may be obligated to indemnify MetLife or such related individuals. In addition, the Master Separation Agreement provides that, subject to certain exceptions, MetLife will indemnify, hold harmless and defend us and certain related individuals (generally including our directors, officers and employees and certain agents), from and against all liabilities relating to, arising out of or resulting from certain events relating to its business. There can be no assurance that MetLife will be able to satisfy its indemnification obligation to us or that such indemnification will be sufficient to us in the event of a dispute or nonperformance by MetLife. See “Certain Relationships and Related Person Transactions — Agreements Between Us and MetLife — Master Separation Agreement — Provisions relating to indemnification and liability insurance.”
Risks Relating to the Distribution
If the Distribution were to fail to qualify for non-recognition treatment for U.S. federal income tax purposes, then we could be subject to significant tax liabilities
The Distribution was conditioned on the continued validity as of the Distribution date of the private letter ruling that MetLife has received from the IRS regarding certain significant issues under the Code, and the receipt and continued validity as of the Distribution date of an opinion from MetLife’s tax advisor that the Distribution qualifies for non-recognition of gain or loss to MetLife and MetLife’s shareholders pursuant to Sections 355 and 361 of the Code, except to the extent of cash received in lieu of fractional shares, each subject to the accuracy of and compliance with certain representations, assumptions and covenants therein.
Notwithstanding the receipt of the private letter ruling and the tax opinion, the IRS could determine that the Distribution should be treated as a taxable transaction if it determines that any of the representations, assumptions or covenants on which the private letter ruling is based are untrue or have been violated. Furthermore, as part of the IRS’s policy, the IRS did not determine whether the Distribution satisfies certain conditions that are necessary to qualify for non-recognition treatment. Rather, the private letter ruling is based on representations by MetLife and us that these conditions have been satisfied. The tax opinion addresses the satisfaction of these conditions.
The tax opinion is not binding on the IRS or the courts, and there can be no assurance that the IRS or a court will not take a contrary position. In addition, the tax advisor relied on certain representations and covenants that have been delivered by MetLife and us.
If the IRS ultimately determines that the Distribution is taxable, we could incur significant U.S. federal income tax liabilities, and we could have an indemnification obligation to MetLife. For a more detailed discussion, see “— Potential indemnification obligations if the Distribution does not qualify for non-recognition treatment or if certain other steps that are part of the Separation do not qualify for their intended tax treatment could materially adversely affect our financial condition.”
83
Potential indemnification obligations if the Distribution does not qualify for non-recognition treatment or if certain other steps that are part of the Separation do not qualify for their intended tax treatment could materially adversely affect our financial condition
Generally, taxes resulting from the failure of the Distribution to qualify for non-recognition treatment for U.S. federal income tax purposes would be imposed on MetLife or MetLife’s shareholders and, under the Tax Separation Agreement, MetLife is generally obligated to indemnify us against such taxes if the failure to qualify for tax-free treatment results from any action or inaction that is within MetLife’s control or if the failure results from any direct or indirect transfer of MetLife’s stock. MetLife may have an adverse interpretation of or object to its indemnification obligations to us under the Tax Separation Agreement, and there can be no assurance that MetLife will be able to satisfy its indemnification obligation to us or that such indemnification will be sufficient to us in the event of a dispute or nonperformance by MetLife. The failure of MetLife to fully indemnify us could have a material adverse effect on our financial condition and results of operations.
In addition, MetLife will generally bear tax-related losses due to the failure of certain steps that were part of the Separation to qualify for their intended tax treatment. However, the IRS could seek to hold us responsible for such liabilities, and under the Tax Separation Agreement, we could be required, under certain circumstances, to indemnify MetLife and its affiliates against certain tax-related liabilities caused by those failures, to the extent those liabilities result from an action we or our affiliates take or from any breach of our or our affiliates’ representations, covenants or obligations under the Tax Separation Agreement. Events triggering an indemnification obligation under the Tax Separation Agreement include ceasing to actively conduct our business and events occurring after the Distribution that cause MetLife to recognize a gain under Section 355(e) of the Code. If the Distribution does not qualify for non-recognition treatment or if certain other steps that are part of the Separation do not qualify for their intended tax treatment, we could be required to pay material additional taxes or an indemnification obligation to MetLife, which could materially and adversely affect our financial condition. See “Certain Relationships and Related Person Transactions — Agreements Between Us and MetLife — Tax Agreements — Tax Separation Agreement.”
We could be required to pay material additional taxes or suffer other material adverse tax consequences if the tax consequences of the Separation to us are not as expected
The Separation is expected to have certain federal income tax consequences to MetLife and to us, as set forth in a private letter ruling issued by the IRS to MetLife and opinions provided by MetLife’s tax advisors. These opinions are not binding on the IRS or the courts, and the tax opinions and the private letter ruling do not address all of the tax consequences of the Separation to us. The Separation is a complex transaction subject to numerous tax rules, including rules that could require us to reduce our tax attributes (such as the basis in our assets) in certain circumstances, and the application of these various rules to the Separation is not entirely clear. The ultimate tax consequences to us of the Separation may not be finally determined for many years and may differ from the tax consequences that we and MetLife currently expect and intend to report. As a result, we could be required to pay material additional taxes and to materially reduce the tax assets (or materially increase the tax liabilities) on our consolidated balance sheet. These changes could impact our available capital, ratings or cost of capital. There can be no assurance that the Tax Separation Agreement will protect us from any such consequences, or that any issue that may arise will be subject to indemnification by MetLife under the Tax Separation Agreement. As a result our financial condition and results of operations could be materially and adversely affected.
Disputes or disagreements with MetLife may affect our financial statements and business operations, and our contractual remedies may not be sufficient
In connection with the Separation, we entered into certain agreements that provide a framework for our ongoing relationship, including a Transition Services Agreement, a Tax Separation Agreement and a Tax Receivables Agreement. Our agreements with MetLife may not reflect terms that would have resulted from negotiation between unaffiliated parties. Such provisions may include, among other things, indemnification rights and obligations, the allocation of tax liabilities, and other payment obligations between us and MetLife. Disagreements regarding the obligations of MetLife or us under these agreements or any renegotiation of their terms could create disputes that may be resolved in a manner unfavorable to us and our shareholders. In addition, there can be no assurance that any remedies available under these agreements will be sufficient to us in the event of a dispute or nonperformance by MetLife or that any such remedies will be sufficiently broad to cover any issues that arise under our arrangements with MetLife. The failure of MetLife to perform its obligations under these agreements (or claims by MetLife that we have failed to perform our obligations under the agreements) may have a material adverse effect on our financial statements, and could consume substantial resources and attention thus creating a material adverse impact on our business performance.
84
We are required to pay MetLife for certain tax benefits, which amounts are expected to be material
In partial consideration for the assets contributed by MetLife to us, we have entered into a Tax Receivables Agreement with MetLife that provided for the payment by us to MetLife of 86% of the amount of cash savings, if any, in U.S. federal income tax that we and our subsidiaries actually realize (or are deemed to realize under certain circumstances, as discussed in more detail below under the heading “Certain Relationships and Related Person Transactions — Agreements Between Us and MetLife — Tax Agreements — Tax Receivables Agreement”) as a result of the utilization of our and our subsidiaries’ net operating losses, capital losses, tax basis and amortization or depreciation deductions in respect of certain tax benefits we may realize as a result of certain transactions involved in the Separation, together with interest accrued from the date the applicable tax return is due (without extension) until the date the applicable payment is due. See “Certain Relationships and Related Person Transactions — Agreements Between Us and MetLife — Tax Agreements — Tax Separation Agreement.”
Estimating the amount of payments that may be made under the Tax Receivables Agreement is by its nature imprecise, insofar as the calculation of amounts payable depends on a variety of factors. The actual amount and utilization of net operating losses, tax basis and other tax attributes, as well as the amount and timing of any payments under the Tax Receivables Agreement, will vary depending upon a number of factors, including the amount, character and timing of our and our subsidiaries’ taxable income in the future. The Base Case Scenario has not assumed any benefit from the deferred taxes that are subject to the Tax Receivables Agreement.
If we breach any of our material obligations under the Tax Receivables Agreement or undergo a change of control as defined in the Tax Receivables Agreement, the Tax Receivables Agreement will terminate and we will be required to make a lump sum payment equal to the present value of expected future payments under the Tax Receivables Agreement, which payment would be based on certain assumptions, including those relating to our and our subsidiaries’ future taxable income. Additionally, if we or a direct or indirect subsidiary transfers any asset to a corporation with which we do not file a consolidated tax return, we will be treated as having sold that asset for its fair market value in a taxable transaction for purposes of determining the cash savings in income tax under the Tax Receivables Agreement. If we sell or otherwise dispose of any of our subsidiaries in a transaction that is not a change of control, we will be required to make a payment equal to the present value of future payments under the Tax Receivables Agreement attributable to the tax benefits of such subsidiary that is sold or disposed of, applying the assumptions described above. Any such payment resulting from a breach of material obligations, change of control, asset transfer or subsidiary disposition could be substantial and could exceed our actual cash tax savings.
We have agreed to numerous restrictions to preserve the non-recognition treatment of the transactions, which may reduce our strategic and operating flexibility
Even if the Distribution otherwise qualifies for non-recognition of gain or loss under Section 355 of the Code, it may be taxable to MetLife, but not MetLife’s shareholders, under Section 355(e) of the Code if 50% or more (by vote or value) of our common stock or MetLife’s common stock is acquired as part of a plan or series of related transactions that include the Distribution. For this purpose, any acquisitions of MetLife’s or our common stock within two years before or after the Distribution are presumed to be part of such a plan, although MetLife or we may be able to rebut that presumption based on either applicable facts and circumstances or a “safe harbor” described in the tax regulations. We have provided numerous covenants not to engage in certain transactions for two years after the Distribution and have agreed to indemnify MetLife if we do not comply with such covenants. These covenants and indemnity obligations may limit our ability to pursue strategic transactions or engage in new business or other transactions, such as a share repurchase program, that may maximize the value of our business, and may discourage or delay a strategic transaction that our shareholders may consider favorable, including limiting our ability to use our equity to raise capital or fund acquisitions. Any payments required under these indemnity obligations could be significant and could materially adversely affect our business, results of operations and financial condition. See “Certain Relationships and Related Person Transactions — Agreements Between Us and MetLife — Tax Agreements — Tax Separation Agreement.”
We may be unable to achieve some or all of the benefits that we expect to achieve from the Separation and the cost of achieving such benefits may be more than we estimated
We believe that, as a separate, public company, we will be able to, among other matters, better focus our financial and operational resources on our specific business, growth profile and strategic priorities, design and implement corporate strategies and policies targeted to our operational focus and strategic priorities, streamline our processes and infrastructure to focus on our core manufacturing strengths, implement and maintain a capital structure designed to meet our specific needs and more effectively respond to industry dynamics. However, we may be unable to achieve some or all of these benefits. For example, in order to position ourselves for the Distribution, we undertook a series of strategic, structural and process realignment and restructuring actions within our operations, including significant cost-cutting initiatives. These actions may not provide the cost benefits we currently expect, may cost more to achieve than we have estimated, and could lead to disruption of our operations, loss of, or inability to recruit, key personnel needed to operate and grow our businesses following the Distribution. As a result, these actions
85
could cause a weakening of our internal standards, controls or procedures and impairment of our key customer and supplier relationships. If we fail to achieve some or all of the benefits that we expect to achieve as a separate company, or do not achieve them in the time we expect, our business, financial condition and results of operations could be materially and adversely affected.
Certain of our directors and officers may have actual or potential conflicts of interest because of their MetLife equity ownership or their former MetLife positions
Certain of the persons who currently are our executive officers and directors have been MetLife officers, directors or employees and, thus, will have professional relationships with MetLife’s executive officers, directors or employees. In addition, because of their former MetLife positions, certain of our directors and executive officers may own MetLife common stock,or have received equity-based awards from MetLife pursuant to which they may acquire or receive shares of MetLife common stock, and, for some of these individuals, their individual holdings may be significant compared to their total assets. These relationships and financial interests may create, or may create the appearance of, conflicts of interest when these directors and officers are faced with decisions that could have different implications for MetLife and us. For example, potential conflicts of interest could arise in connection with the resolution of any dispute that may arise between MetLife and us regarding the terms of the agreements governing the Distribution and the Separation, and the relationship thereafter between the companies.
Risks Relating to Our Common Stock
Our stock price may fluctuate significantly
We cannot predict the prices at which our common stock may trade. The market price of our common stock may fluctuate widely, depending on many factors, some of which may be beyond our control, including:
|
•
|
actual or anticipated fluctuations in our operating results due to factors related to our business;
|
|
•
|
success or failure of our business strategies;
|
|
•
|
our quarterly or annual earnings, or those of other companies in our industry;
|
|
•
|
our ability to obtain financing as needed;
|
|
•
|
our announcements or our competitors’ announcements regarding new products or services, enhancements, significant contracts, acquisitions or strategic investments;
|
|
•
|
changes in accounting standards, policies, guidance, interpretations or principles;
|
|
•
|
the failure of securities analysts to cover our common stock;
|
|
•
|
changes in earnings estimates by securities analysts;
|
|
•
|
failure to meet any guidance given by us or any change in any guidance given by us, or changes by us to our guidance practices;
|
|
•
|
the operating and stock price performance of other comparable companies;
|
|
•
|
investor perception of our company and the insurance industry;
|
|
•
|
speculation in the press or investment community;
|
|
•
|
our business profile, dividend policy or market capitalization;
|
|
•
|
actions by institutional stockholders and other large stockholders (including MetLife), including future sales of our common stock;
|
|
•
|
overall market fluctuations;
|
|
•
|
results from any material litigation or government investigation;
|
|
•
|
changes in laws, rules and regulations, including insurance laws and regulations, affecting our business;
|
|
•
|
changes in our customers’ preferences;
|
|
•
|
changes in capital gains taxes and taxes on dividends affecting shareholders;
|
|
•
|
epidemic disease, “Acts of God,” war and terrorist acts;
|
|
•
|
additions or departures of key personnel; and
|
|
•
|
general economic conditions and other external factors.
|
86
Stock markets in general have experienced volatility that has often been unrelated to the operating performance of a particular company. These broad market fluctuations could also adversely affect the trading price of our common stock.
We do not anticipate declaring or paying regular dividends or making other distributions on our common stock in the near term
We do not currently anticipate declaring or paying regular cash dividends or making other distributions on our common stock in the near term. We currently intend to use our future earnings, if any, to pay debt obligations, to fund our growth, to develop our business, for working capital needs and for general corporate purposes. Therefore, you are not likely to receive any dividends or other distributions on your common stock in the near term, and the success of an investment in shares of our common stock will depend upon any future appreciation in their value. There is no guarantee that shares of our common stock will appreciate in value or even maintain the price at which the shares currently trade. Any future declaration and payment of dividends or other distributions of capital will be at the discretion of our Board of Directors and will depend on and be subject to our financial condition, results of operations, earnings, cash needs, regulatory and other constraints, capital requirements (including capital requirements of our subsidiaries), contractual restrictions and any other factors that our Board of Directors deems relevant in making such a determination, including, without limitation, the Company’s continued development as a standalone public company. Therefore, there can be no assurance that we will pay any dividends or make other distributions on our common stock or as to the amount of any such dividends or distributions of capital. In addition, indebtedness or financial instruments that we may incur or issue in the future may limit or prohibit the payment of dividends or other distributions. There can be no assurance that we will establish a dividend policy or pay dividends in the future or continue to pay any dividend if we do commence paying dividends pursuant to a dividend policy or otherwise.
Any future sales by us or our existing stockholders may cause our stock price to decline
Any transfer or sales of substantial amounts of our common stock in the public market or the perception that such transfer or sales might occur may cause the market price of our common stock to decline. As of March 14, 2018, we had an aggregate of 119,773,106 shares of our common stock issued and outstanding. Shares will generally be freely tradeable without restriction or further registration under the Securities Act, except for shares owned by one of our “affiliates,” as that term is defined in Rule 405 under the Securities Act. Shares held by “affiliates” may be sold in the public market if registered or if they qualify for an exemption from registration under Rule 144. Further, we plan to file one or more registration statements to cover the shares issuable under our equity-based benefit plans
MetLife beneficially owns 23,169,597 shares of our common stock. MetLife has announced that, subject to market conditions and regulatory approval, it currently intends to divest of this remaining ownership interest through an exchange offer for MetLife common stock during 2018. Any disposition by MetLife of our common stock in the public market in one or more offerings or the perception that such dispositions could occur, could adversely affect prevailing market prices for our common stock.
We also have a large shareholder base of former MetLife policyholder trust beneficiaries, and it is not possible to predict whether or not those shareholders will wish to sell their shares of our common stock. The sales of significant amounts of shares of our common stock or the perception in the market that this will occur may result in the lowering of the market price of our common stock.
Our amended and restated certificate of incorporation designates the Court of Chancery of the State of Delaware as the sole and exclusive forum for certain litigation that may be initiated by our stockholders, which could limit our stockholders’ ability to obtain a favorable judicial forum for disputes with us or our current or former directors, officers or stockholders
Our amended and restated certificate of incorporation provides that, unless we consent in writing to the selection of an alternative forum, the Court of Chancery of the State of Delaware is the sole and exclusive forum for any (i) derivative action or proceeding brought on our behalf, (ii) action asserting a claim of breach of a fiduciary duty owed to us or our stockholders by any of our current or former directors, officers or stockholders, (iii) action asserting a claim arising out of or pursuant to the Delaware General Corporation Law (the “DGCL”) or our amended and restated certificate of incorporation or our amended and restated bylaws, or as to which the DGCL confers jurisdiction on the Court of Chancery of the State of Delaware or (iv) action asserting a claim governed by the internal affairs doctrine. By becoming a stockholder in our company, you will be deemed to have notice of and have consented to the provisions of our amended and restated certificate of incorporation related to choice of forum. The choice of forum provision in our amended and restated certificate of incorporation may limit our stockholders’ ability to bring a claim in a judicial forum that they find favorable for disputes with us or any of our current or former directors, officers or stockholders, which may discourage lawsuits with respect to such claims. Alternatively, if a court were to find the choice of forum provision contained in our amended and restated certificate of incorporation to be inapplicable or unenforceable in an action, we may incur additional costs associated with resolving such action in other jurisdictions, which could materially and adversely affect our results of operations and financial condition.
87
Your percentage ownership in Brighthouse may be diluted in the future
Your percentage ownership in Brighthouse may be diluted in the future because of equity awards that we expect to grant to our directors, officers and employees. We have adopted, subject to shareholder approval, equity incentive plans that will permit the grant of common stock-based equity awards to our directors, officers and other employees. We have also adopted a tax-qualified employee stock purchase plan that will permit eligible employees to acquire shares of our common stock at a discount to fair market value. In addition, we may issue equity as all or part of the consideration paid for acquisitions and strategic investments we may make in the future or for currently unanticipated future development or unforeseen circumstances, given uncertainties related to our business.
State insurance laws and Delaware corporate law may prevent or delay an acquisition of us, which could decrease the trading price of our common stock
State laws may delay, deter, prevent or render more difficult a takeover attempt that our stockholders might consider in their best interests. For example, such laws may prevent our stockholders from receiving the benefit from any premium to the market price of our common stock offered by a bidder in a takeover context.
The insurance laws and regulations of the various states in which our insurance subsidiaries are organized may delay or impede a business combination involving the Company. State insurance laws prohibit an entity from acquiring control of an insurance company without the prior approval of the domestic insurance regulator. Under most states’ statutes, an entity is presumed to have control of an insurance company if it owns, directly or indirectly, 10% or more of the voting stock of that insurance company or its parent company. These regulatory restrictions may delay, deter or prevent a potential merger or sale of our company, even if our Board of Directors decides that it is in the best interests of stockholders for us to merge or be sold. These restrictions also may delay sales by us or acquisitions by third parties of our insurance subsidiaries. In addition, the Investment Company Act may require approval by the contract owners of our variable contracts in order to effectuate a change of control of any affiliated investment advisor to a mutual fund underlying our variable contracts, including Brighthouse Advisers (formerly known as MetLife Advisers, LLC). Further, FINRA approval would be necessary for a change of control of any broker-dealer that is a direct or indirect subsidiary of Brighthouse Financial, Inc.
Section 203 of the DGCL may affect the ability of an “interested stockholder” to engage in certain business combinations, including, among other things, mergers, consolidations or acquisitions of additional shares of our capital stock, for a period of three years following the time that the stockholder becomes an “interested stockholder.” An “interested stockholder” is defined to include persons who, together with affiliates, own, or did own within three years prior to the determination of interested stockholder status, 15% or more of the outstanding voting stock of a corporation.
Certain provisions in our amended and restated certificate of incorporation and amended and restated bylaws may prevent or delay an acquisition of us, which could decrease the trading price of our common stock
Our amended and restated certificate of incorporation and amended and restated bylaws contain provisions that are intended to deter coercive takeover practices and inadequate takeover bids to encourage prospective acquirers to negotiate with our Board of Directors rather than to attempt a hostile takeover. These provisions include, among others:
•
the inability of our stockholders to act by written consent;
•
rules regarding how stockholders may present proposals or nominate directors for election at stockholder meetings;
•
the right of our Board of Directors to issue preferred stock without stockholder approval;
•
the ability of our remaining directors to fill vacancies and newly created directorships on our Board;
|
•
|
the division of our Board of Directors into classes of directors until such times as all directors are elected annually commencing at the Company’s 2020 annual meeting of stockholders;
|
•
the inability of our stockholders to remove directors other than for cause while the Board of Directors is classified; and
|
•
|
the requirement that the affirmative vote of holders of at least two-thirds of our outstanding voting stock is required to amend certain provisions of our amended and restated certificate of incorporation and to amend our amended and restated bylaws.
|
These provisions are not intended to make us immune from takeovers. However, these provisions will apply even if the offer may be considered beneficial by some stockholders and could delay or prevent an acquisition that our Board of Directors determines is not in the best interests of Brighthouse and our stockholders. These provisions may also prevent or discourage attempts to remove and replace incumbent directors. For additional tax considerations, see “— We have agreed to numerous
88
restrictions to preserve the non-recognition treatment of the transactions, which may reduce our strategic and operating flexibility.”
Not applicable.
Our corporate headquarters are located in Charlotte, North Carolina on a site of approximately 285,000 rentable square feet leased by a MetLife affiliate from a third party. The term of that lease expires in September 2026. In connection with the Separation, we entered into arms-length sublease agreements with such MetLife affiliate for our Charlotte headquarters, as well as certain other locations. Our Charlotte facilities are occupied by each of our three segments, as well as Corporate & Other.
See
Note 15
of the N
otes to the Consolidated and Combined Financial Statements.
Not applicable.
89
Common Stock Market Prices
Brighthouse Financial, Inc.’s common stock began “regular-way” trading on the Nasdaq under the symbol “BHF” on August 7, 2017, following the completion of the Separation.
The following table presents high and low closing prices for our common stock on the Nasdaq for the periods indicated:
|
High
|
Low
|
||||||
|
Fiscal year ended December 31, 2017
|
|||||||
|
Third Quarter (beginning August 7, 2017)
|
$
|
62.85
|
|
$
|
52.75
|
|
|
|
Fourth Quarter
|
$
|
63.66
|
|
$
|
54.61
|
|
|
Holders
As of March 6, 2018, there were 2,435,787 registered holders of record of our common stock. The actual number of holders of our common stock is substantially greater than this number of record holders, and includes stockholders who are beneficial owners, but whose shares are held in “street name” by banks, brokers, and other financial institutions.
Dividend Policy
Brighthouse Financial, Inc. did not pay dividends in 2017. On August 3, 2017, we made a cash distribution in an aggregate amount of $1.8 billion to MetLife, Inc., the sole holder of our common stock as of the record date for the Distribution. We do not currently anticipate declaring or paying regular cash dividends or making other distributions on our common stock in the near term. Any future declaration and payment of dividends or other distributions of capital will be at the discretion of our Board of Directors and will depend on and be subject to our financial condition, results of operations, earnings, cash needs, regulatory and other constraints, capital requirements (including capital requirements of our subsidiaries), contractual restrictions and any other factors that our Board of Directors deems relevant in making such a determination, including, without limitation, the Company’s continued development as a standalone public company. Therefore, there can be no assurance that we will pay any dividends or make other distributions on our common stock, or as to the amount of any such dividends or distributions of capital.
Delaware law requires that dividends be paid only out of statutory surplus, which is defined as the fair market value of our net assets, minus our stated capital, or out of the current or the immediately preceding year’s earnings. We are a holding company, and we have no direct operations. All of our business operations are conducted through our subsidiaries. The states in which our insurance subsidiaries are domiciled impose certain restrictions on our insurance subsidiaries’ ability to pay dividends to us. These restrictions are based in part on the prior year’s statutory income and surplus. Such restrictions, or any future restrictions adopted by the states in which our insurance subsidiaries are domiciled, could have the effect, under certain circumstances, of significantly reducing dividends or other amounts payable to us by our subsidiaries without affirmative approval of state regulatory authorities. See “Business — Regulation — Insurance Regulation — Holding Company Regulation” in “Risk Factors — Capital-Related Risks — As a holding company, Brighthouse Financial, Inc. depends on the ability of its subsidiaries to pay dividends.” and “Risk Factors — Risks Relating to Our Common Stock — We do not anticipate declaring or paying regular dividends on our common stock in the near term.” See also “Management’s Discussion and Analysis of Financial Condition and Results of Operations — Liquidity and Capital Resources — The Company — Capital — Restrictions on Dividends and Returns of Capital from Insurance Subsidiaries.”
90
Stock Performance Graph
The graph and table below present Brighthouse Financial, Inc.’s cumulative total shareholder return relative to the performance of (1) the Standard & Poor’s 500 Index, (2) the Standard & Poor’s 500 Insurance Index and (3) the Standard & Poor’s 500 Financials Index, respectively, for the year ended December 31, 2017, commencing August 7, 2017 (our initial day of “regular-way” trading on the Nasdaq). All values assume a $100 initial investment at the opening price of Brighthouse Financial, Inc.’s common stock on the Nasdaq and data for each of the Standard & Poor’s 500 Index, the Standard & Poor’s 500 Insurance Index and the Standard & Poor’s 500 Financials Index assume all dividends were reinvested on the date paid. The points on the graph and the values in the table represent month-end values based on the last trading day of each month. The comparisons are based on historical data and are not indicative of, nor intended to forecast, the future performance of our common stock.

|
Aug 7
|
Aug 31
|
Sep 30
|
Oct 31
|
Nov 30
|
Dec 31
|
|||||||||||||||||||
|
Brighthouse Financial, Inc. common stock
|
$
|
100.00
|
|
$
|
92.47
|
|
$
|
98.51
|
|
$
|
100.75
|
|
$
|
95.25
|
|
$
|
95.01
|
|
||||||
|
S&P 500
|
100.00
|
|
99.83
|
|
101.89
|
|
104.27
|
|
107.47
|
|
108.66
|
|
||||||||||||
|
S&P 500 Financials
|
100.00
|
|
97.35
|
|
102.36
|
|
105.36
|
|
109.05
|
|
111.19
|
|
||||||||||||
|
S&P 500 Insurance
|
100.00
|
|
96.01
|
|
99.36
|
|
102.10
|
|
104.26
|
|
102.71
|
|
||||||||||||
Unregistered Sales of Equity Securities
In connection with the Separation, on August 4, 2017, Brighthouse Financial, Inc. issued an additional 119,673,106 shares of its common stock to MetLife, Inc. in exchange for the transfer by MetLife, Inc. of 100 common units of Brighthouse Holdings, LLC (“BH Holdings”), representing all of the common units of BH Holdings, to Brighthouse Financial, Inc., pursuant to the Contribution Agreement, dated as of July 27, 2017, among Brighthouse Financial, Inc., MetLife, Inc. and BH Holdings.
To the extent applicable, the issuance of the shares of common stock by Brighthouse Financial, Inc. to MetLife, Inc. in connection with the Separation was exempt from registration pursuant to Section 4(a)(2) of the Securities Act. We did not register the issuance of the issued shares under the Securities Act because such issuance did not constitute a public offering.
Issuer Purchases of Equity Securities
Neither the Company nor any “affiliated purchaser” repurchased any shares of Brighthouse Financial, Inc. common stock during the quarter ended December 31, 2017.
91
The following tables set forth selected historical financial data for Brighthouse Financial, Inc. and its subsidiaries (formerly, the “MetLife U.S. Retail Separation Business”). The statement of operations data for the years ended December 31, 2017, 2016 and 2015, and the balance sheet data at December 31, 2017 and 2016, have been derived from the audited
Consolidated and Combined F
inancial Statements of Brighthouse Financial, Inc. included elsewhere herein. The statement of operations data for the years ended December 31, 2014 and 2013, and the balance sheet data at December 31, 2015 and 2014, have been derived from the audited
Consolidated and Combined Financial Statements
of the MetLife U.S. Retail Separation Business not included herein. The balance sheet data at December 31, 2013 has been derived from the unaudited
Consolidated and Combined Financial Statements
of the MetLife U.S. Retail Separation Business not included herein.
The selected historical financial data should be read together with Management’s Discussion and Analysis of Financial Condition and Results of Operations and the financial statements and the related notes included elsewhere herein. The following statement of operations and balance sheet data have been prepared in conformity with GAAP. The historical results presented below are not necessarily indicative of the financial results to be achieved in future periods, or what the financial results would have been had Brighthouse Financial, Inc. or the MetLife U.S. Retail Separation Business been a separate publicly traded company during the periods presented.
|
Years Ended December 31,
|
||||||||||||||||||||
|
2017
|
2016
|
2015
|
2014
|
2013
|
||||||||||||||||
|
(In millions, except per share data)
|
||||||||||||||||||||
|
Statement of Operations Data
|
||||||||||||||||||||
|
Total revenues
|
$
|
6,842
|
|
$
|
3,018
|
|
$
|
8,891
|
|
$
|
9,448
|
|
$
|
8,788
|
|
|||||
|
Premiums
|
$
|
863
|
|
$
|
1,222
|
|
$
|
1,679
|
|
$
|
1,500
|
|
$
|
1,018
|
|
|||||
|
Universal life and investment-type product policy fees
|
$
|
3,898
|
|
$
|
3,782
|
|
$
|
4,010
|
|
$
|
4,335
|
|
$
|
4,255
|
|
|||||
|
Net investment income
|
$
|
3,078
|
|
$
|
3,207
|
|
$
|
3,099
|
|
$
|
3,090
|
|
$
|
3,366
|
|
|||||
|
Other revenue
|
$
|
651
|
|
$
|
736
|
|
$
|
422
|
|
$
|
535
|
|
$
|
616
|
|
|||||
|
Net investment gains (losses)
|
$
|
(28
|
)
|
$
|
(78
|
)
|
$
|
7
|
|
$
|
(435
|
)
|
$
|
7
|
|
|||||
|
Net derivative gains (losses) (1)
|
$
|
(1,620
|
)
|
$
|
(5,851
|
)
|
$
|
(326
|
)
|
$
|
423
|
|
$
|
(474
|
)
|
|||||
|
Total expenses
|
$
|
7,457
|
|
$
|
7,723
|
|
$
|
7,429
|
|
$
|
7,920
|
|
$
|
7,424
|
|
|||||
|
Policyholder benefits and claims
|
$
|
3,636
|
|
$
|
3,903
|
|
$
|
3,269
|
|
$
|
3,334
|
|
$
|
3,647
|
|
|||||
|
Interest credited to policyholder account balances
|
$
|
1,111
|
|
$
|
1,165
|
|
$
|
1,259
|
|
$
|
1,278
|
|
$
|
1,376
|
|
|||||
|
Amortization of DAC and VOBA
|
$
|
227
|
|
$
|
371
|
|
$
|
781
|
|
$
|
1,109
|
|
$
|
123
|
|
|||||
|
Other expenses
|
$
|
2,483
|
|
$
|
2,284
|
|
$
|
2,120
|
|
$
|
2,199
|
|
$
|
2,278
|
|
|||||
|
Income (loss) before provision for income tax
|
$
|
(615
|
)
|
$
|
(4,705
|
)
|
$
|
1,462
|
|
$
|
1,528
|
|
$
|
1,364
|
|
|||||
|
Net income (loss)
|
$
|
(378
|
)
|
$
|
(2,939
|
)
|
$
|
1,119
|
|
$
|
1,159
|
|
$
|
1,031
|
|
|||||
|
Earnings per common share:
|
||||||||||||||||||||
|
Basic
|
$
|
(3.16
|
)
|
$
|
(24.54
|
)
|
$
|
9.34
|
|
$
|
9.68
|
|
$
|
8.61
|
|
|||||
92
|
December 31,
|
||||||||||||||||||||
|
2017
|
2016
|
2015
|
2014
|
2013
|
||||||||||||||||
|
(In millions)
|
||||||||||||||||||||
|
Balance Sheet Data
|
||||||||||||||||||||
|
Total assets
|
$
|
224,192
|
|
$
|
221,930
|
|
$
|
226,725
|
|
$
|
231,620
|
|
$
|
235,200
|
|
|||||
|
Total investments and cash and cash equivalents
|
$
|
84,195
|
|
$
|
85,860
|
|
$
|
85,199
|
|
$
|
81,141
|
|
$
|
84,644
|
|
|||||
|
Separate account assets
|
$
|
118,257
|
|
$
|
113,043
|
|
$
|
114,447
|
|
$
|
122,922
|
|
$
|
124,438
|
|
|||||
|
Long-term financing obligations:
|
||||||||||||||||||||
|
Debt (2)
|
$
|
3,612
|
|
$
|
810
|
|
$
|
836
|
|
$
|
928
|
|
$
|
2,326
|
|
|||||
|
Reserve financing debt (3)
|
$
|
—
|
|
$
|
1,100
|
|
$
|
1,100
|
|
$
|
1,100
|
|
$
|
1,100
|
|
|||||
|
Collateral financing arrangement (4)
|
$
|
—
|
|
$
|
2,797
|
|
$
|
2,797
|
|
$
|
2,797
|
|
$
|
2,797
|
|
|||||
|
Policyholder liabilities (5)
|
$
|
77,384
|
|
$
|
73,943
|
|
$
|
71,881
|
|
$
|
69,992
|
|
$
|
74,751
|
|
|||||
|
Variable annuities liabilities:
|
||||||||||||||||||||
|
Future policy benefits
|
$
|
4,148
|
|
$
|
3,562
|
|
$
|
2,937
|
|
$
|
2,346
|
|
$
|
1,950
|
|
|||||
|
Policyholder account balances
|
$
|
12,479
|
|
$
|
11,517
|
|
$
|
7,379
|
|
$
|
5,781
|
|
$
|
4,358
|
|
|||||
|
Other policy-related balances
|
$
|
96
|
|
$
|
89
|
|
$
|
99
|
|
$
|
104
|
|
$
|
210
|
|
|||||
|
Non-variable annuities liabilities:
|
||||||||||||||||||||
|
Future policy benefits
|
$
|
32,468
|
|
$
|
29,810
|
|
$
|
28,266
|
|
$
|
27,296
|
|
$
|
29,711
|
|
|||||
|
Policyholder account balances
|
$
|
25,304
|
|
$
|
26,009
|
|
$
|
30,142
|
|
$
|
31,645
|
|
$
|
35,051
|
|
|||||
|
Other policy-related balances
|
$
|
2,889
|
|
$
|
2,956
|
|
$
|
3,058
|
|
$
|
2,820
|
|
$
|
3,471
|
|
|||||
|
Total Brighthouse Financial, Inc. stockholders’ equity (6)
|
$
|
14,515
|
|
$
|
14,862
|
|
$
|
16,839
|
|
$
|
17,525
|
|
$
|
15,436
|
|
|||||
|
Noncontrolling interests
|
$
|
65
|
|
$
|
—
|
|
$
|
—
|
|
$
|
—
|
|
$
|
—
|
|
|||||
|
Accumulated other comprehensive income (loss)
|
$
|
1,676
|
|
$
|
1,265
|
|
$
|
1,523
|
|
$
|
2,715
|
|
$
|
977
|
|
|||||
_______________
|
(1)
|
See “Management’s Discussion and Analysis of Financial Condition and Results of Operations — Results of Operations” for a discussion of net derivative gains (losses).
|
|
(2)
|
At December 31, 2016 and prior periods, this balance includes surplus notes in aggregate principal amount of $750 million issued by BLIC to a financing trust. On February 10, 2017, MetLife, Inc. became the sole beneficial owner of the financing trust. In connection with the Restructuring, (i) the financing trust was terminated in accordance with its terms on March 23, 2017, (ii) MetLife, Inc. became the owner of the surplus notes, and (iii) prior to the Separation, MetLife, Inc. forgave the obligation of BLIC to pay the principal under the surplus notes. See “Management’s Discussion and Analysis of Financial Condition and Results of Operations — Liquidity and Capital Resources — The Company — Outstanding Debt and Collateral Financing Arrangement — Surplus Notes.”
|
|
(3)
|
Includes long-term financing of statutory reserves supporting level premium term life and ULSG policies provided by surplus notes issued to MetLife. These surplus notes were eliminated in April 2017 in connection with the Restructuring of existing reserve financing arrangements.
|
|
(4)
|
Supports statutory reserves relating to level premium term and ULSG policies pursuant to credit facilities entered into by MetLife, Inc. and an unaffiliated financial institution. These facilities were replaced in April 2017 in connection with the Restructuring of existing reserve financing arrangements.
|
|
(5)
|
Includes future policy benefits, policyholder account balances and other policy-related balances.
|
|
(6)
|
For periods ending prior to the Separation, stockholders’ equity was previously reported as shareholder’s net investment.
|
93
Index to Management’s Discussion and Analysis of Financial Condition and Results of Operations
|
Page
|
|
|
Industry Trends
and Uncertainties
|
|
94
Introduction
For purposes of this discussion, “Brighthouse,” the “Company,” “we,” “our” and “us” refer to Brighthouse Financial, Inc. a corporation incorporated in Delaware in 2016, and its subsidiaries. Brighthouse Financial, Inc. was formerly a wholly-owned subsidiary of MetLife, Inc. (MetLife, Inc., together with its subsidiaries and affiliates, “MetLife”). Following this summary is a discussion addressing the consolidated results of operations and financial condition of the Company for the periods indicated. This discussion should be read in conjunction with “Note Regarding Forward-Looking Statements,” “Risk Factors,” “Selected Financial Data,” “Quantitative and Qualitative Disclosures About Market Risk” and the Company’s consolidated financial statements included elsewhere herein.
The following discussion may contain forward-looking statements that reflect our plans, estimates and beliefs. Our actual results could differ materially from those discussed in these forward-looking statements. Factors that could cause or contribute to these differences include those factors discussed below and elsewhere in this report, particularly in “Note Regarding Forward-Looking Statements” and “Risk Factors.”
Presentation
Prior to discussing our Results of Operations, we present background information and definitions that we believe are useful to understanding the discussion of our financial results. This information precedes the Results of Operations and is most beneficial when read in the sequence presented. A summary of key informational sections is as follows:
|
•
|
“Executive Summary” contains the following sub-sections:
|
|
•
|
“Overview” provides information regarding our business, reporting segments and results as discussed in the Results of Operations.
|
|
•
|
“Background” presents details of the Company’s legal entity structure and key events that led up to the completion of the Separation.
|
|
•
|
“Industry Trends and Uncertainties” discusses updates and changes to a number of trends and uncertainties that we believe may materially affect our future financial condition, results of operations or cash flows.
|
|
•
|
“Summary of Critical Accounting Estimates” explains the most critical estimates and judgments applied in determining our GAAP results.
|
|
•
|
“Non-GAAP and Other Financial Disclosures” defines key financial measures presented in the Results of Operations that are not calculated in accordance with GAAP but are used by management in evaluating company and segment performance. As described in this section, adjusted earnings is presented by key business activities which are derived from, but different than, the line items presented in the GAAP statement of operations. This section also refers to certain other terms used to describe our insurance business and financial and operating metrics, but is not intended to be exhaustive.
|
|
•
|
The Results of Operations section begins with two introductory sections to facilitate an understanding of the results discussion:
|
|
•
|
“Significant Business Actions” defines certain actions that had a significant impact to either or both net income (loss) and adjusted earnings, as defined in “
—
Non-GAAP and Other Financial Disclosures”, which are not indicative of performance in the respective periods. Events defined in this section are referred to in the Results of Operations discussion.
|
|
•
|
“Actuarial Assumption Review” describes the changes in key assumptions applied in 2017 and 2016, respectively, resulting in a favorable impact to net income (loss) in the current period.
|
Executive Summary
Overview
We are a major provider of annuity products and life insurance in the United States through multiple independent distribution channels and marketing arrangements with a diverse network of distribution partners.
For operating purposes, we have established three reporting segments: (i) Annuities, (ii) Life and (iii) Run-off, which consists of operations relating to products we are not actively selling and which are separately managed. In addition, we report certain of our results of operations not included in the segments in Corporate & Other.
95
In the third quarter of 2016, the Company reorganized its businesses in anticipation of the Separation. Also, in the fourth quarter of 2016, the Company moved the universal life policies with secondary guarantees business from the Life segment to the Run-off segment (“ULSG Re-segmentation”). These changes were applied retrospectively and did not have an impact on total consolidated net income (loss) or adjusted earnings in the prior periods.
See “Business — Segments and Corporate & Other” and
Note 2
of the Notes to the Consolidated and Combined Financial Statements for further information on our segments and Corporate & Other.
The following table presents a summary of our net income (loss) and adjusted earnings. For a detailed discussion of our results see “— Results of Operations.”
|
Years Ended December 31,
|
Years Ended December 31,
|
||||||||||||||||||||||
|
2017
|
2016
|
Change
|
2016
|
2015
|
Change
|
||||||||||||||||||
|
(In millions)
|
|||||||||||||||||||||||
|
Income (loss) before provision for income tax
|
$
|
(615
|
)
|
$
|
(4,705
|
)
|
$
|
4,090
|
|
$
|
(4,705
|
)
|
$
|
1,462
|
|
$
|
(6,167
|
)
|
|||||
|
Provision for income tax expense (benefit)
|
(237
|
)
|
(1,766
|
)
|
1,529
|
|
(1,766
|
)
|
343
|
|
(2,109
|
)
|
|||||||||||
|
Net income (loss)
|
$
|
(378
|
)
|
$
|
(2,939
|
)
|
$
|
2,561
|
|
$
|
(2,939
|
)
|
$
|
1,119
|
|
$
|
(4,058
|
)
|
|||||
|
Adjusted earnings before provision for income tax
|
$
|
1,597
|
|
$
|
867
|
|
$
|
730
|
|
$
|
867
|
|
$
|
2,113
|
|
$
|
(1,246
|
)
|
|||||
|
Provision for income tax expense (benefit)
|
677
|
|
181
|
|
496
|
|
181
|
|
572
|
|
(391
|
)
|
|||||||||||
|
Adjusted earnings
|
$
|
920
|
|
$
|
686
|
|
$
|
234
|
|
$
|
686
|
|
$
|
1,541
|
|
$
|
(855
|
)
|
|||||
For the year ended December 31, 2017, we had a net loss of $378 million and $920 million of adjusted earnings as compared to a net loss of $2.9 billion and $686 million of adjusted earnings for the year ended December 31, 2016. Despite higher adjusted earnings, the net loss for the year ended December 31, 2017 was driven by unfavorable changes in our derivative instruments resulting from strong equity market performance and rising interest rates. In the third quarter of 2017 we recognized a $1.1 billion tax charge in connection with the Separation which was substantially offset by a benefit of $947 million recorded in the fourth quarter of 2017 in connection with changes to the federal tax code. The net loss for the year ended December 31, 2016 was driven by reserve strengthening, including the effect of our 2016 annual actuarial review for our variable annuities business, our second quarter refinement in the actuarial model which we use to calculate the reserves for our in-force book of ULSG products and the loss recognition, mostly in the form of a write down of deferred acquisition costs, triggered by the move of our ULSG products into the Run-off segment in the fourth quarter of 2016. In addition to reserve strengthening, derivative losses on our economic hedges of certain liabilities also contributed to the net loss, primarily due to the impact of the fourth quarter 2016 rise in interest rates without an offset from the liabilities being hedged due to the insensitivity of those
accounting principles generally accepted in the United States (“GAAP”)
liabilities to changes in interest rates. See “— Results of Operations.”
Background
Brighthouse Financial, Inc., which until the completion of the Separation on August 4, 2017 was a wholly-owned subsidiary of MetLife, Inc., is a holding company incorporated in Delaware on August 1, 2016 to own the legal entities that have historically operated a substantial portion of MetLife’s former Retail segment, as well as certain portions of its former Corporate Benefit Funding segment, which is included in our Run-off segment.
This Management’s Discussion and Analysis of Financial Condition and Results of Operations is intended to help the reader understand the results of operations, financial condition and cash flows of Brighthouse for the periods indicated. In addition to Brighthouse Financial, Inc., the companies and businesses included in the results of operations, financial condition and cash flows are:
|
•
|
Brighthouse Life Insurance Company (together with its subsidiaries and affiliates, “BLIC”), formerly MetLife Insurance Company USA, our largest insurance operating entity, domiciled in Delaware and licensed to write business in 49 states;
|
|
•
|
Brighthouse Life Insurance Company of NY (“BHNY”), formerly First MetLife Investors Insurance Company, domiciled in New York and licensed to write business in New York, which is a subsidiary of Brighthouse Life Insurance Company;
|
|
•
|
New England Life Insurance Company (“NELICO”), domiciled in Massachusetts and licensed to write business in all 50 states;
|
|
•
|
Brighthouse Reinsurance Company of Delaware (“BRCD”), our single reinsurance company licensed in Delaware, which is a subsidiary of Brighthouse Life Insurance Company;
|
96
|
•
|
Brighthouse Investment Advisers, LLC (“Brighthouse Advisers”), formerly MetLife Advisers, LLC, serving as investment advisor to certain proprietary mutual funds that are underlying investments under our and MetLife’s variable insurance products;
|
|
•
|
Brighthouse Services, LLC (“Brighthouse Services”), an internal services and payroll company;
|
|
•
|
Brighthouse Securities, LLC (“Brighthouse Securities”), registered as a broker-dealer with the SEC, approved as a member of FINRA and registered as a broker-dealer and licensed as an insurance agency in all required states; and
|
|
•
|
Brighthouse Holdings, LLC (“BH Holdings”), a wholly-owned holding company subsidiary of Brighthouse Financial, Inc. domiciled in Delaware.
|
The Separation
On Jan
uary 12, 2016, MetLife, Inc. announced its plan to pursue the separation of a substantial portion of its former U.S. retail business. Additionally, on July 21, 2016, MetLife, Inc. announced that the separated business would be rebranded as “Brighthouse Financial.”
In July 2016, MetLife, Inc. completed the sale to MassMutual of MetLife’s U.S. retail advisor force and certain assets associated with MPCG, including all of the issued and outstanding shares of MetLife’s affiliated broker-dealer, MetLife Securities, Inc., a wholly-owned subsidiary of MetLife, Inc. (the “U.S. Retail Advisor Force Divestiture”). MassMutual assumed all of the liabilities related to such assets that arise or occur (or have arisen or occurred) after the sale was closed. As part of the transactions, MetLife, Inc. and MassMutual entered into a product development agreement under which Brighthouse is the exclusive developer of certain annuity products to be issued by MassMutual. In connection with the Separation, we entered into an agreement with MetLife, Inc., that among other things, provides for the sharing of certain liabilities that may arise with respect to this relationship.
On October 5, 2016, Brighthouse Financial, Inc., which until the completion of the Separation on August 4, 2017 was a wholly-owned subsidiary of MetLife, Inc., filed a registration statement on Form 10 with the SEC that was declared effective by the SEC on July 6, 2017. The Form 10 disclosed MetLife, Inc.’s plans to undertake several actions, including an internal reorganization involving its U.S. retail business (the “Restructuring”) and include, among others, Brighthouse Life Insurance Company, BHNY, NELICO, Brighthouse Advisers and certain affiliated reinsurance companies in the separated business, and distribute at least 80.1% of the shares of Brighthouse Financial, Inc.’s common stock on a pro rata basis to the holders of MetLife, Inc. common stock. In connection with the Restructuring, effective April 2017 following receipt of applicable regulatory approvals, MetLife, Inc. contributed certain affiliated reinsurance companies and BHNY to Brighthouse Life Insurance Company. The affiliated reinsurance companies were then merged into BRCD, a licensed reinsurance subsidiary of Brighthouse Life Insurance Company (the “Reinsurance Merger”). On June 20, 2017, BH Holdings issued $50 million aggregate liquidation preference of fixed rate cumulative preferred units to MetLife, Inc., which MetLife, Inc. subsequently resold to unaffiliated third parties. These preferred units are reported as noncontrolling interests on the consolidated and combined balance sheet. Additionally, on June 16, 2017 in connection with the Separation, MetLife, Inc. forgave the $750 million principal amount of 8.595% surplus notes, and on July 28, 2017, MetLife, Inc. contributed BH Holdings to Brighthouse Financial, Inc. On August 4, 2017, MetLife, Inc. completed the distribution of Brighthouse Financial, Inc. shares to its shareholders through a distribution of 96,776,670 of the 119,773,106 shares of the Company’s common stock, representing 80.8% of MetLife’s interest in Brighthouse, to holders of MetLife common stock.
Industry Trends and Uncertainties
Throughout this Management’s Discussion and Analysis of Financial Condition and Results of Operations, we discuss a number of trends and uncertainties that we believe may materially affect our future financial condition, results of operations or cash flows. Where these trends or uncertainties are specific to a particular aspect of our business, we often include such a discussion under the relevant caption of this Management’s Discussion and Analysis of Financial Condition and Results of Operations, as part of our broader analysis of that area of our business. In addition, the following factors represent some of the key general trends and uncertainties that have influenced the development of our business and our historical financial performance and that we believe will continue to influence our business and results of operations in the future.
Financial and Economic Environment
Our business and results of operations are materially affected by conditions in the capital markets and the economy generally. Stressed conditions, volatility and disruptions in the capital markets, particular markets, or financial asset classes can have an adverse effect on us. The impact on capital markets and the economy generally of the priorities and policies of the Trump administration is uncertain. See “Risk Factors — Economic Environment and Capital Markets-Related Risks — If difficult conditions in the capital markets and the U.S. economy generally persist or are perceived to persist, they may materially adversely
97
affect our business and results of operations.” Equity market performance can affect our profitability for variable annuities and other separate account products as a result of the effects it has on product demand, revenues, expenses, reserves and our risk management effectiveness. The level of long-term interest rates and the shape of the yield curve can have a negative effect on the demand for, and the profitability of, spread-based products such as fixed annuities, index-linked annuities and universal life insurance. Low interest rates and risk premium, including credit spread, affect new money rates on invested assets and the cost of product guarantees. Insurance premium growth and demand for our products is impacted by the general health of U.S. economic activity.
The above factors affect our expectations regarding future margins, which in turn, affect the amortization of certain of our intangible assets such as DAC and VOBA. Significantly lower expected margins may cause us to accelerate the amortization of DAC and VOBA, thereby reducing net income in the affected reporting period. We review our long-term assumptions about capital market returns and interest rates, along with other assumptions such as contract holder behavior, as part of our actuarial assumption review. As additional company specific and/or industry information on contract holder behavior becomes available, related assumptions may change and may potentially have a material impact on liability valuations and net income. In addition, the change in accounting estimate relating to the liability valuations that occurred in the second quarter of 2016 may result in greater income statement volatility in the future.
As reported in February 2017, the Federal Reserve indicated that, with gradual adjustments in the stance of monetary policy, economic activity will expand at a moderate pace, labor market conditions will strengthen and inflation will rise to 2.0% over the medium term. On March 15, 2017, the Federal Reserve increased the Federal Funds Target Rate by 25 basis points to a target range of 0.75% to 1.0%. See “— Summary of Critical Accounting Estimates — Deferred Policy Acquisition Costs and Value of Business Acquired” and “— Results of Operations — Actuarial Assumption Review.”
Demographics
We believe that demographic trends in the U.S. population, the increase in under-insured individuals, the potential risk to governmental social safety net programs and the shifting of responsibility for retirement planning and financial security from employers and other institutions to individuals, highlight the need of individuals to plan for their long-term financial security and will create opportunities to generate significant demand for our products. Moreover, we believe that the Secure Seniors, Middle Aged Strivers and Diverse and Protected customer segments, the three customer segments we intend to target, represent a significant portion of the market opportunity. Our research indicates that these segments are open to financial guidance and, accordingly, we expect that they will be receptive to the products we intend to sell. See “Business — Overview — Our Business Strategy.”
By focusing our product development and marketing efforts to meeting the needs of these customer segments we will be able to focus on offering a smaller number of products that we believe are appropriately priced given current economic conditions, which we believe will benefit our expense ratio thereby increasing our profitability.
Competitive Environment
The life insurance industry remains highly fragmented and competitive. See “Business — Segments and Corporate & Other” for each of our segments. In particular, we believe that financial strength and financial flexibility are highly relevant differentiators from the perspective of customers and distributors. We believe we are adequately positioned to compete in this environment.
Regulatory Developments
Our life insurance companies are regulated primarily at the state level, with some products and services also subject to federal regulation. In addition, Brighthouse Financial, Inc. and its insurance subsidiaries are subject to regulation under the insurance holding company laws of various U.S. jurisdictions. Furthermore, some of our operations, products and services are subject to ERISA, consumer protection laws, securities, broker-dealer and investment advisor regulations, and environmental and unclaimed property laws and regulations. In addition, in marketing certain of Brighthouse’s products and services to tax-qualified pension plans, retirement plans and IRAs, new rules issued by the DOL on April 6, 2016 that became applicable on June 8, 2017 raise the standard for recommendations to such plans and IRAs to purchase variable and index-linked annuities to a fiduciary standard. See “Business — Regulation” and “Risk Factors — Regulatory and Legal Risks.”
98
Summary of Critical Accounting Estimates
The preparation of financial statements in conformity with GAAP requires management to adopt accounting policies and make estimates and assumptions that affect amounts reported on the Consolidated and Combined Financial Statements.
The most critical estimates include those used in determining:
|
i.
|
liabilities for future policy benefits;
|
|
ii.
|
accounting for reinsurance;
|
|
iii.
|
capitalization and amortization of DAC and the establishment and amortization of VOBA;
|
|
iv.
|
estimated fair values of investments in the absence of quoted market values;
|
|
v.
|
investment impairments;
|
|
vi.
|
estimated fair values of freestanding derivatives and the recognition and estimated fair value of embedded derivatives requiring bifurcation;
|
|
vii.
|
measurement of income taxes and the valuation of deferred tax assets; and
|
|
viii.
|
liabilities for litigation and regulatory matters.
|
In applying our accounting policies, we make subjective and complex judgments that frequently require estimates about matters that are inherently uncertain. Many of these policies, estimates and related judgments are common in the insurance and financial services industries; others are specific to our business and operations. Actual results could differ from these estimates.
The above critical accounting estimates are described below and in
Note 1
of the Notes to the Consolidated and Combined Financial Statements.
Liability for Future Policy Benefits
Generally, future policy benefits are payable over an extended period of time and related liabilities are calculated as the present value of future expected benefits to be paid, reduced by the present value of future expected premiums. Such liabilities are established based on methods and underlying assumptions that are in accordance with GAAP and applicable actuarial standards. The principal assumptions used in the establishment of liabilities for future policy benefits are mortality, morbidity, benefit utilization and withdrawals, policy lapse, retirement, disability incidence, disability terminations, investment returns, inflation, expenses and other contingent events as appropriate to the respective product type. These assumptions, intended to estimate the experience for the period the policy benefits are payable, are established at the time the policy is issued and locked in. Utilizing these assumptions, liabilities are established on a block of business basis. If experience is less favorable than assumed, DAC may be reduced and/or additional insurance liabilities established, resulting in a reduction in earnings.
Future policy benefit liabilities for GMDBs and GMIBs relating to certain variable annuity contracts are based on estimates of the expected value of benefits in excess of the projected account balance, recognizing the excess ratably over the accumulation period based on total expected assessments. Liabilities for universal and variable life secondary guarantees are determined by estimating the expected value of death benefits payable when the account balance is projected to be zero and recognizing those benefits ratably over the contract period based on total expected assessments. The assumptions used in estimating the excess benefits under variable annuity guarantees and the secondary guarantee liabilities under universal and variable life policies are consistent with those used for amortizing DAC, and are therefore subject to the same variability and risk. The assumptions of investment performance and volatility for variable products are consistent with historical experience of the appropriate underlying equity index, such as the S&P 500 Index.
We regularly review our assumptions supporting our estimates of actuarial liabilities for future policy benefits. For universal life and annuity product guarantees, assumptions are updated periodically, whereas for traditional life products, such as term life and non-participating whole life insurance, assumptions are established and locked in at inception but reviewed periodically to determine whether a premium deficiency exists that would trigger an unlocking of assumptions. We also review our actuarial liabilities to determine if profits are projected in earlier years followed by losses projected in later years, which could require us to establish an additional liability. Differences between actual experience and the assumptions used in pricing our policies and guarantees, as well as adjustments to the related liabilities, result in variances in profit and could result in losses.
In assessing loss recognition and profits followed by losses, product groupings are limited by segment. Historically, all of our universal life business was grouped together for evaluating loss recognition and profits followed by losses. In the second quarter of 2016, an actuarial model change reduced expected future gross profits for ULSG and triggered loss recognition resulting in a loss of $258 million, after tax. Subsequently, in the fourth quarter of 2016, ULSG was moved from our Life segment
99
to our Run-off segment, triggering a change in groupings for loss recognition testing that resulted in an additional loss of $399 million, after tax. See “— Results of Operations — Significant Business Actions — ULSG Re-segmentation.” For an overview of our products and balance sheet accounts impacted by actuarial assumptions, see “— Results of Operations — Actuarial Assumption Review.”
See
Note 1
of the Notes to the Consolidated and Combined Financial Statements for additional information on our accounting policy relating to variable annuity guarantees and liability for future policy benefits and
Note 3
of the Notes to the Consolidated and Combined Financial Statements for future policyholder benefit liabilities.
Reinsurance
Accounting for reinsurance requires extensive use of assumptions and estimates, particularly related to the future performance of the underlying business and the potential impact of counterparty credit risk with respect to reinsurance receivables. We periodically review actual and anticipated experience compared to the aforementioned assumptions used to establish assets and liabilities relating to ceded and assumed reinsurance and evaluate the financial strength of counterparties to our reinsurance agreements using criteria similar to those evaluated in our security impairment process. See “— Investment Impairments.”
Additionally, for each of our reinsurance agreements, we determine whether the agreement provides indemnification against loss or liability relating to insurance risk, in accordance with applicable accounting standards. We review all contractual features, including those that may limit the amount of insurance risk to which the reinsurer is subject or features that delay the timely reimbursement of claims. We evaluate present values of projected future cash flows on blocks of policies subject to new reinsurance agreements in light of all such contractual features to determine whether our reinsurance counterparties are exposed to a reasonable possibility of significant loss. Such analysis involves management estimates as to the cash flow projections, as well as management judgment as to what constitutes a reasonable possibility of significant loss. If we determine that a reinsurance agreement does not expose the reinsurer to a reasonable possibility of a significant loss from insurance risk, we record the agreement using the deposit method of accounting.
See
Note 5
of the Notes to the Consolidated and Combined Financial Statements for additional information on our reinsurance programs.
Deferred Policy Acquisition Costs and Value of Business Acquired
We incur significant costs in connection with acquiring new and renewal insurance business. Costs that relate directly to the successful acquisition or renewal of insurance contracts are deferred as DAC. In addition to commissions and other direct costs, deferrable costs include the portion of an employee’s total compensation and benefits related to time spent selling, underwriting or processing the issuance of new and renewal insurance business only with respect to actual policies acquired or renewed. We utilize various techniques to estimate the portion of an employee’s time spent on qualifying acquisition activities that result in actual sales, including surveys, interviews, representative time studies and other methods. These estimates include assumptions that are reviewed and updated on a periodic basis or more frequently to reflect significant changes in processes or distribution methods.
VOBA represents the excess of book value over the estimated fair value of acquired insurance, annuity and investment-type contracts in force at the acquisition date. The estimated fair value of the acquired liabilities is based on projections, by each block of business, of future policy and contract charges, premiums, mortality and morbidity, separate account performance, surrenders, operational expenses, investment returns, nonperformance risk adjustment and other factors. Actual experience on the purchased business may vary from these projections. The recovery of DAC and VOBA is dependent upon the future profitability of the related business.
Separate account rates of return on variable universal life contracts and variable deferred annuity contracts affect in-force account balances on such contracts each reporting period, which can result in significant fluctuations in amortization of DAC and VOBA, which is based on estimated gross profits. Our practice to determine the impact of gross profits resulting from returns on separate accounts assumes that long-term appreciation in equity markets is not changed by short-term market fluctuations, but is only changed when sustained interim deviations are expected. We monitor these events and only change the assumption when our long-term expectation changes. The effect of an increase (decrease) by 100 basis points in the assumed future rate of return is reasonably likely to result in a decrease (increase) in the DAC and VOBA amortization with an offset to our unearned revenue liability which nets to approximately $230 million. We use a mean reversion approach to separate account returns where the mean reversion period is five years with a long-term separate account return after the five-year reversion period is over. The current long-term rate of return assumption for the variable universal life contracts and variable deferred annuity contracts is in the mid-6% range.
We also generally review other long-term assumptions underlying the projections of estimated gross profits on an annual basis. These assumptions primarily relate to investment returns, interest crediting rates, mortality, persistency, benefit elections
100
and withdrawals, and expenses to administer business. Assumptions used in the calculation of estimated gross profits which may have significantly changed are updated annually. If the update of assumptions causes expected future gross profits to increase, DAC and VOBA amortization will generally decrease, resulting in a current period increase to earnings. The opposite result occurs when the assumption update causes expected future gross profits to decrease.
Our most significant assumption updates resulting in a change to the expected future gross profits and the amortization of DAC and VOBA are due to revisions to expenses, in-force or persistency assumptions, benefit elections, withdrawals and expected future investment returns on annuity contracts and variable and universal life insurance policies. We expect these assumptions to be the ones most reasonably likely to cause significant changes in the future. Changes in these assumptions can be offsetting and we are unable to predict their movement or offsetting impact over time.
In addition, we update the estimated gross profits with actual gross profits in each reporting period. When the change in estimated gross profits principally relates to the difference between actual and estimates in the current period, an increase in profits will generally result in an increase in amortization and a decrease in profits will generally result in a decrease in amortization.
See
Note 4
of the Notes to the Consolidated and Combined Financial Statements for additional information relating to DAC and VOBA amortization.
At December 31, 2017, 2016 and 2015, our DAC and VOBA was $6.3 billion, $6.3 billion and $6.4 billion, respectively. Amortization of DAC and VOBA associated with the variable and universal life policies and the annuity contracts was significantly impacted by changes including: (i) updating assumptions that impact the future estimated gross profits; and (ii) updating the estimated gross profits of the most current period for actual experience including market performance. To illustrate the impact on amortization of DAC and VOBA from these two types of changes, the following highlights the significant items contributing to the amortization of DAC and VOBA during each of the years ended December 31, 2017, 2016 and 2015.
DAC and VOBA amortization was approximately $430 million lower than expected for the year ended December 31, 2017, which consisted of:
|
•
|
A decrease of approximately $250 million related to variable annuity net derivative losses, mainly hedge losses in the first three quarters of the year, offset by higher amortization related to the impact from the favorable change to nonperformance risk;
|
|
•
|
An increase of approximately $150 million related to changes to the GMIB insurance liabilities; and
|
|
•
|
A decrease of approximately $370 million due to assumption updates related to refinements in the amortization horizon.
|
DAC and VOBA amortization was approximately $380 million lower than expected for the year ended December 31, 2016, which consisted of:
|
•
|
A reversal of previous amortization of approximately $1.4 billion related to net derivative losses driven mostly by assumption updates increasing the variable annuity guarantees accounted for as embedded derivatives and net losses from the freestanding derivatives hedging these guarantees; partially offset by
|
|
•
|
An acceleration of approximately $360 million, mainly resulting from reserve adjustments from modeling improvements for universal life products;
|
|
•
|
An acceleration of approximately $560 million related to loss recognition triggered by the move of ULSG into the Run-off segment; and
|
|
•
|
An increase of amortization of approximately $140 million primarily associated with the variable annuity assumption updates other than that related to the embedded derivatives described above.
|
DAC and VOBA amortization was approximately $70 million lower than expected for the year ended December 31, 2015, which consisted of:
|
•
|
A reversal of previous amortization of approximately $200 million related to net derivative losses which resulted from an increase in variable annuity guarantees, partially offset by market-to-market changes from free standing derivatives hedging these guarantees; and
|
|
•
|
Improvements in persistency related to both adjustments for actual experience and assumption updates which caused an increase in actual and expected future gross profits resulting in a net decrease of approximately $120 million; partially offset by
|
101
|
•
|
An increase of approximately $140 million from a net gain for the period related to the GMIB insurance liabilities and associated hedges; and
|
|
•
|
An increase associated with net investment gains of approximately $70 million.
|
Our DAC and VOBA balance is also impacted by unrealized investment gains (losses) and the amount of amortization which would have been recognized if such gains and losses had been realized. The change in unrealized investment gains (losses) decreased the DAC and VOBA balance by $40 million for the year ended December 31, 2017, decreased the DAC and VOBA balance by $10 million for the year ended December 31, 2016 and increased the DAC and VOBA balance by $190 million in 2015. See Notes
4
and
6
of the Notes to the Consolidated and Combined Financial Statements for information regarding the DAC and VOBA offset to unrealized investment losses.
Estimated Fair Value of Investments
In determining the estimated fair value of our investments, fair values are based on unadjusted quoted prices for identical investments in active markets that are readily and regularly obtainable. When such quoted prices are not available, fair values are based on quoted prices in markets that are not active, quoted prices for similar but not identical investments, or other observable inputs. If these inputs are not available, or observable inputs are not determinable, unobservable inputs and/or adjustments to observable inputs requiring management judgment are used to determine the estimated fair value of investments.
The methodologies, assumptions and inputs utilized are described in
Note 8
of the Notes to the Consolidated and Combined Financial Statements.
Financial markets are susceptible to severe events evidenced by rapid depreciation in asset values accompanied by a reduction in asset liquidity. Our ability to sell investments, or the price ultimately realized for investments, depends upon the demand and liquidity in the market and increases the use of judgment in determining the estimated fair value of certain investments.
Investment Impairments
One of the significant estimates related to AFS securities is our impairment evaluation. The assessment of whether an other-than-temporary impairment (“OTTI”) occurred is based on our case-by-case evaluation of the underlying reasons for the decline in estimated fair value on a security-by-security basis. Our review of each fixed maturity and equity security for OTTI includes an analysis of gross unrealized losses by three categories of severity and/or age of gross unrealized loss. An extended and severe unrealized loss position on a fixed maturity security may not have any impact on the ability of the issuer to service all scheduled interest and principal payments. Accordingly, such an unrealized loss position may not impact our evaluation of recoverability of all contractual cash flows or the ability to recover an amount at least equal to its amortized cost based on the present value of the expected future cash flows to be collected. In contrast, for certain equity securities, greater weight and consideration are given to a decline in estimated fair value and the likelihood such estimated fair value decline will recover.
Additionally, we consider a wide range of factors about the security issuer and use our best judgment in evaluating the cause of the decline in the estimated fair value of the security and in assessing the prospects for near-term recovery. Inherent in our evaluation of the security are assumptions and estimates about the operations of the issuer and its future earnings potential. Factors we consider in the OTTI evaluation process are described in
Note 6
of the Notes to the Consolidated and Combined Financial Statements.
The determination of the amount of allowances and impairments on the remaining invested asset classes is highly subjective and is based upon our periodic evaluation and assessment of known and inherent risks associated with the respective asset class. Such evaluations and assessments are revised as conditions change and new information becomes available.
See Notes
1
and
6
of the Notes to the Consolidated and Combined Financial Statements for additional information relating to our determination of the amount of allowances and impairments.
Derivatives
We use freestanding derivative instruments to hedge various capital market risks in our products, including: (i) certain guarantees, some of which are reported as embedded derivatives; (ii) current or future changes in the fair value of our assets and liabilities; and (iii) current or future changes in cash flows. All derivatives, whether freestanding or embedded, are required to be carried on the balance sheet at fair value with changes reflected in either net income (loss) or in OCI, depending on the type of hedge. Below is a summary of critical accounting estimates by type of derivative.
Freestanding Derivatives
The determination of the estimated fair value of freestanding derivatives, when quoted market values are not available, is based on market standard valuation methodologies and inputs that management believes are consistent with what other market
102
participants would use when pricing such instruments. Derivative valuations can be affected by changes in interest rates, foreign currency exchange rates, financial indices, credit spreads, default risk, nonperformance risk, volatility, liquidity and changes in estimates and assumptions used in the pricing models. See
Note 7
of the Notes to the Consolidated and Combined Financial Statements for additional information on significant inputs into the OTC derivative pricing models and credit risk adjustment.
Embedded Derivatives
We issue variable annuity products with guaranteed minimum benefits, some of which are embedded derivatives measured at estimated fair value separately from the host variable annuity product, with changes in estimated fair value reported in net derivative gains (losses). The estimated fair values of these embedded derivatives are determined based on the present value of projected future benefits minus the present value of projected future fees attributable to the guarantee. The projections of future benefits and future fees require capital markets and actuarial assumptions, including expectations concerning policyholder behavior. A risk neutral valuation methodology is used under which the cash flows from the guarantees are projected under multiple capital market scenarios using observable risk-free rates.
Market conditions, including, but not limited to, changes in interest rates, equity indices, market volatility and variations in actuarial assumptions, including policyholder behavior, mortality and risk margins related to non-capital market inputs, as well as changes in our nonperformance risk adjustment may result in significant fluctuations in the estimated fair value of the guarantees that could materially affect net income. Changes to actuarial assumptions, principally related to contract holder behavior such as annuitization utilization and withdrawals associated with GMIB riders, can result in a change of expected future cash outflows of a guarantee between the accrual-based model for insurance liabilities and the fair-value based model for embedded derivatives. See
Note 1
of the Notes to the Consolidated and Combined Financial Statements for additional information relating to the determination of the accounting model. Risk margins are established to capture the non-capital market risks of the instrument which represent the additional compensation a market participant would require to assume the risks related to the uncertainties in certain actuarial assumptions. The establishment of risk margins requires the use of significant management judgment, including assumptions of the amount and cost of capital needed to cover the guarantees.
With respect to assumptions regarding policyholder behavior, we have recorded charges, and in some cases benefits, in prior years as a result of the availability of sufficient and credible data at the conclusion of each review. During the second quarter of 2016, MetLife undertook its annual review of actuarial assumptions for its U.S. retail variable annuity business in light of the availability of updated industry studies and a larger body of cumulative actual experience data than had been previously available. This data provided greater insight into contract holder behavior for GMIB riders passing the initial 10-year waiting period before benefits can be fully utilized. As a result of this review, we made changes to contract holder benefit utilization behavior and long-term economic assumptions, as well as risk margins. These assumption updates resulted in a change in our estimate of expected future cash flows and moved certain of those cash flows from the accrual-based insurance liabilities model to the fair value-based embedded derivatives model. This change in accounting estimate and the resulting charge to earnings were primarily due to an increase in the anticipated level of forced annuitizations where the non-life contingent portion is now reported as an embedded derivative. With more of the estimated future cash outflows being accounted for as embedded derivatives, the GMIB rider liabilities are more sensitive to market changes and thus may result in greater income statement volatility. In addition, in the third quarter of 2016, we performed the annual review of our actuarial assumptions for our remaining annuity and life businesses.
We ceded the risk associated with certain of the variable annuities with guaranteed minimum benefits described in the preceding paragraphs. The value of the embedded derivatives on the ceded risk is determined using a methodology consistent with that described previously for the guarantees directly written by us with the exception of the input for nonperformance risk that reflects the credit of the reinsurer. However, because certain of the reinsured guarantees do not meet the definition of an embedded derivative and, thus are not accounted for at fair value, significant fluctuations in net income may occur when the change in the fair value of the reinsurance recoverable is recorded in net income without a corresponding and offsetting change in fair value of the directly written guaranteed liability.
See
Note 7
of the Notes to the Consolidated and Combined Financial Statements for additional information on our embedded derivatives.
Nonperformance Risk Adjustment
The valuation of our embedded derivatives includes an adjustment for the risk that we fail to satisfy our obligations, which we refer to as our nonperformance risk. The nonperformance risk adjustment, which is captured as a spread over the risk-free rate in determining the discount rate to discount the cash flows of the liability, was previously determined by taking into consideration publicly available information relating to spreads in the secondary market for MetLife, Inc.’s debt, including related credit default swaps.
103
In the third quarter of 2017, in connection with the Separation, we updated our assumptions for determining the credit spread underlying the nonperformance risk adjustment to be based on Brighthouse Financial, Inc.’s creditworthiness instead of that of MetLife, Inc. The credit spread was determined by taking into consideration publicly available information relating to spreads in the secondary market for Brighthouse Financial, Inc.’s debt. These observable spreads are then adjusted, as necessary, to reflect the financial strength ratings of the issuing insurance subsidiaries as compared to the credit rating of Brighthouse Financial, Inc. The impact of this change in methodology resulted in an increase in net income (loss) before provision for income tax of $521 million ($339 million, net of income tax).
The following table illustrates the impact that a range of reasonably likely variances in credit spreads would have on our consolidated and combined balance sheet, excluding the effect of income tax, related to the embedded derivative valuation on certain variable annuity products measured at estimated fair value. Even when credit spreads do not change, the impact of the nonperformance risk adjustment on fair value will change when the cash flows within the fair value measurement change. The table only reflects the impact of changes in credit spreads on the balance sheet and not these other potential changes. In determining the ranges, we have considered current market conditions, as well as the market level of spreads that can reasonably be anticipated over the near term.
|
|
|
||||||
|
|
Policyholder Account
Balances
|
DAC and VOBA
|
|||||
|
|
(In millions)
|
||||||
|
100% increase in our credit spread
|
$
|
508
|
|
$
|
47
|
|
|
|
As reported
|
$
|
985
|
|
$
|
276
|
|
|
|
50% decrease in our credit spread
|
$
|
1,284
|
|
$
|
419
|
|
|
Income Taxes
We provide for federal and state income taxes currently payable, as well as those deferred due to temporary differences between the financial reporting and tax bases of assets and liabilities. Our accounting for income taxes represents our best estimate of various events and transactions. Tax laws are often complex and may be subject to differing interpretations by the taxpayer and the relevant governmental taxing authorities. In establishing a provision for income tax expense, we must make judgments and interpretations about the application of tax laws. We must also make estimates about when in the future certain items will affect taxable income in the various taxing jurisdictions.
In establishing a liability for unrecognized tax benefits, assumptions may be made in determining whether, and to what extent, a tax position may be sustained. Once established, unrecognized tax benefits are adjusted when there is more information available or when events occur requiring a change.
Valuation allowances are established against deferred tax assets, particularly those arising from carryforwards, when management determines, based on available information, that it is more likely than not that deferred income tax assets will not be realized. The realization of deferred tax assets related to carryforwards depends upon the existence of sufficient taxable income within the carryforward periods under the tax law in the applicable tax jurisdiction. Significant judgment is required in projecting future taxable income to determine whether valuation allowances should be established, as well as the amount of such allowances. See
Note 1
of the Notes to the Consolidated and Combined Financial Statements for additional information relating to our determination of such valuation allowances.
We may be required to change our provision for income taxes when estimates used in determining valuation allowances on deferred tax assets significantly change, or when new information indicates the need for adjustment in valuation allowances. Additionally, future events, such as changes in tax laws, tax regulations, or interpretations of such laws or regulations, could have an impact on the provision for income tax and the effective tax rate. Any such changes could significantly affect the amounts reported in the financial statements in the year these changes occur.
On December 22, 2017, President Trump signed the Tax Act into law. The Tax Act reduced the corporate tax rate to 21%, reduced interest expense deductibility, increased capitalization amounts for deferred acquisition costs, eliminated the corporate alternative minimum tax, provided for determining reserve deductions at 92.81% of statutory reserves, and reduced the dividend received deduction. Most of the changes in the Tax Act are effective on January 1, 2018.
The reduction in the corporate rate required a one-time remeasurement of certain deferred tax items as of December 31, 2017. For the estimated impact of the Tax Act on the financial statements, including the estimated impact resulting from the remeasurement of deferred tax assets and liabilities, see
Note 13
for more information. Actual results may materially differ from
104
the Company’s current estimate due to, among other things, further guidance that may be issued by tax authorities or regulatory bodies and/or changes in interpretations and assumptions preliminarily made. The Company will continue to analyze the Tax Act to finalize its financial statement impact.
In December 2017, the SEC issued Staff Accounting Bulletin (“SAB”) 118, addressing the application of GAAP in situations when a registrant does not have necessary information available to complete the accounting for certain income tax effects of the Tax Act. SAB 118 provides guidance for registrants under three scenarios: (1) the measurement of certain income tax effects is complete, (2) the measurement of certain income tax effects can be reasonably estimated, and (3) the measurement of certain income tax effects cannot be reasonably estimated. SAB 118 provides that the measurement period is complete when a company’s accounting is complete. The measurement period cannot extend beyond one year from the enactment date. SAB 118 acknowledges that a company may be able to complete the accounting for some provisions earlier than others. As such, it may need to apply all three scenarios in determining the accounting for the Tax Act based on information that is available. The Company has not fully completed its accounting for the tax effects of the Tax Act, and thus certain items relating to accounting for the Tax Act are provisional, including accounting for reserves. However, it has recorded the effects of the Tax Act as reasonable estimates due to the need for further analysis of the provisions within the Tax Act and collection, preparation and analysis of relevant data necessary to complete the accounting.
The corporate rate reduction also left certain tax effects, which were originally booked using the previous corporate rate, stranded in AOCI. The Company adopted new accounting guidance as of December 31, 2017 that allowed the Company to reclassify the stranded tax effects from AOCI into retained earnings. The Company elected to reclassify amounts based on the difference between the previously enacted federal corporate tax rate and the newly enacted rate as applied on an aggregate basis.
See Notes
1
and
13
of the Notes to the Consolidated and Combined Financial Statements for additional information on our income taxes.
Litigation Contingencies
We are a party to a number of legal actions and are involved in a number of regulatory investigations. Given the inherent unpredictability of these matters, it is difficult to estimate the impact on our financial position. Liabilities are established when it is probable that a loss has been incurred and the amount of the loss can be reasonably estimated. On a quarterly and annual basis, we review relevant information with respect to liabilities for litigation, regulatory investigations and litigation-related contingencies to be reflected in our results of operations and financial condition.
See
Note 15
of the Notes to the Consolidated and Combined Financial Statements for additional information regarding our assessment of litigation contingencies.
Non-GAAP and Other Financial Disclosures
Non-GAAP Financial Disclosures
Adjusted Earnings
In this report, we present
adjusted earnings as a
measure of our performance that is not calculated in accordance with GAAP. We believe that this non-GAAP financial measure enhances the understanding of our performance by highlighting the results of operations and the underlying profitability drivers of our business. However, adjusted earnings should not be viewed as a substitute for net income (loss), which is the most directly comparable financial measure calculated in accordance with GAAP. See “— Results of Operations” for a reconciliation of adjusted earnings to net income (loss). A reconciliation of adjusted earnings to net income (loss) is not accessible on a forward-looking basis because we believe it is not possible without unreasonable efforts to provide other than a range of net investment gains and losses and net derivative gains and losses, which can fluctuate significantly within or outside the range and from period to period and may have a material impact on net income (loss).
Our definitions of the non-GAAP and other financial measures discussed in this report may differ from those used by other companies. For example, as indicated below, we exclude GMIB revenues and related embedded derivatives gains (losses), as well as GMIB benefits and associated DAC and VOBA offsets from adjusted earnings, thereby excluding substantially all GMLB activity from adjusted earnings.
Adjusted earnings, which may be positive or negative,
is used by management to evaluate performance, allocate resources and facilitate comparisons to industry results. This financial measure focuses on our primary businesses principally by excluding the impact of market volatility, which could distort trends, as well as businesses that have been or will be sold or exited by us, referred to as divested businesses.
105
The following are the significant items excluded from total revenues, net of income tax, in calculating adjusted earnings:
|
•
|
Net investment gains (losses);
|
|
•
|
Net derivative gains (losses) except earned income on derivatives and amortization of premium on derivatives that are hedges of investments or that are used to replicate certain investments, but do not qualify for hedge accounting treatment (“Investment Hedge Adjustments”); and
|
|
•
|
Amortization of unearned revenue related to net investment gains (losses) and net derivative gains (losses) and certain variable annuity GMIB fees (“GMIB Fees”).
|
The following are the significant items excluded from total expenses, net of income tax, in calculating adjusted earnings:
|
•
|
Amounts associated with benefits and hedging costs related to GMIBs (“GMIB Costs”);
|
|
•
|
Amounts associated with periodic crediting rate adjustments based on the total return of a contractually referenced pool of assets and market value adjustments associated with surrenders or terminations of contracts (“Market Value Adjustments”); and
|
|
•
|
Amortization of DAC and VOBA related to (i) net investment gains (losses), (ii) net derivative gains (losses), (iii) GMIB Fees and GMIB Costs and (iv) Market Value Adjustments.
|
The tax impact of the adjustments mentioned are calculated net of the U.S. statutory tax rate, which could differ from our effective tax rate.
We present adjusted earnings in a manner consistent with management’s view of the primary business activities that drive the profitability of our core businesses. The following table illustrates how each component of adjusted earnings is calculated from the GAAP statement of operations line items:
|
Component of Adjusted Earnings
|
How Derived from GAAP (1)
|
||
|
(i)
|
Fee income
|
(i)
|
Universal life and investment-type policy fee
s (excluding (a) unearned revenue adjustments related to net investment gains (losses) and net derivative gains (losses) and (b) GMIB Fees) plus
Other revenues
(excluding other revenues associated with related party reinsurance) and amortization of deferred gain on reinsurance.
|
|
(ii)
|
Net investment spread
|
(ii)
|
Net investment income
(excluding securitization entities income) plus Investment Hedge Adjustments and interest received on ceded fixed annuity reinsurance deposit funds reduced by
Interest credited to policyholder account balances
and interest on future policy benefits.
|
|
(iii)
|
Insurance-related activities
|
(iii)
|
Premiums
less
Policyholder benefits and claims
(excluding (a) GMIB Costs, (b) Market Value Adjustments, (c) interest on future policy benefits and (d) amortization of deferred gain on reinsurance) plus the pass through of performance of ceded separate account assets.
|
|
(iv)
|
Amortization of DAC and VOBA
|
(iv)
|
Amortization of DAC and VOBA (excluding amounts related to (a) net investment gains (losses), (b) net derivative gains (losses), (c) GMIB Fees and GMIB Costs and (d) Market Value Adjustments).
|
|
(v)
|
Other expenses, net of DAC capitalization
|
(v)
|
Other expenses
reduced by capitalization of DAC and securitization entities expense.
|
|
(vi)
|
Provision for income tax expense (benefit)
|
(vi)
|
Tax impact of the above items.
|
_______________
|
(1)
|
Italicized items indicate GAAP statement of operations line items.
|
Consistent with GAAP guidance for segment reporting, adjusted earnings is also our GAAP measure of segment performance. Accordingly, we report adjusted earnings by segment in
Note 2
of the Notes to the Consolidated and Combined Financial Statements.
Other Financial Disclosures
The following additional information is relevant to an understanding of our performance results:
|
•
|
We sometimes refer to sales activity for various products. Statistical sales information for life sales are calculated using the LIMRA definition of sales for core direct sales, excluding company-sponsored internal exchanges, corporate-owned life insurance, bank-owned life insurance, and private placement variable universal life insurance. Annuity sales consist
|
106
of 10% of direct statutory premiums, excluding company sponsored internal exchanges. These sales statistics do not correspond to revenues under GAAP, but are used as relevant measures of business activity.
|
•
|
Allocated equity is the portion of common stockholders’ equity that management allocates to each of its segments and sub-segments. See “Management’s Discussion and Analysis of Financial Condition and Results of Operations — Executive Summary — Overview” and
Note 2
of the Notes to the Consolidated and Combined Financial Statements for further details regarding allocated equity and the use of an internal capital model.
|
Economic Capital
Economic capital is an internally developed risk capital model, the purpose of which is to measure the risk in the business and to provide a basis upon which capital is deployed. The economic capital model accounts for the unique and specific nature of the risks inherent in our business.
Our economic capital model, coupled with considerations of regulatory capital requirements, aligns segment allocated equity with emerging standards and consistent risk principles. The model applies statistics-based risk evaluation principles to the material risks to which the Company is exposed. These consistent risk principles include calibrating required economic capital shock factors to a specific confidence level and time horizon while applying an industry standard method for the inclusion of diversification benefits among risk types. Segment net investment income is credited or charged based on the level of allocated equity; however, changes in allocated equity do not impact our consolidated net investment income, adjusted earnings or income (loss) from continuing operations, net of income tax. Net investment income is based upon the actual results of each segment’s specifically identifiable investment portfolios adjusted for allocated equity. Other costs are allocated to each of the segments based upon: (i) a review of the nature of such costs; (ii) time studies analyzing the amount of employee compensation costs incurred by each segment; and (iii) cost estimates included in the Company’s product pricing. This model was used through December 31, 2017.
Going forward, for variable annuities, the Company will deploy capital consistent with its Variable Annuity Risk Exposure Management Strategy, which defines Variable Annuity’s capital target based on statutory capital oriented risk principles. For businesses other than variable annuity, the allocation will be based on a percentage of statutory risk based capital. The Company’s management is responsible for the ongoing production and enhancement of the Variable Annuity capital model and reviews its approach periodically to ensure it remains consistent with emerging industry practice standards.
Economic capital-based risk estimation is an evolving science, and industry best practices have emerged and continue to evolve. Areas of evolving industry best practices include stochastic liability valuation techniques, alternative methodologies for the calculation of diversification benefits, and the quantification of appropriate shock levels.
Results of Operations
Index to Results of Operations
|
Page
|
|
107
Significant Business Actions
The following table presents the effect on income (loss) before provision for income tax and pre-tax adjusted earnings from certain business actions undertaken by management that resulted in significant earnings impacts but are not indicative of underlying business performance in the period. These actions do not include the results from the annual review of actuarial assumptions used in determining our insurance liabilities, which are separately discussed, nor other significant impacts to earnings from events that may occur as a result of normal business operations, such as market factors or regulatory changes. Items discussed in this section are referred to in the discussion of our results of operations and are intended to facilitate an understanding of that discussion.
|
Impact on Income (Loss) Before Provision for Income Tax
|
Impact on Pre-tax Adjusted Earnings
|
|||||||||||||||||||||||
|
Years Ended December 31,
|
Years Ended December 31,
|
|||||||||||||||||||||||
|
2017
|
2016
|
2015
|
2017
|
2016
|
2015
|
|||||||||||||||||||
|
(In millions)
|
||||||||||||||||||||||||
|
ULSG Model Change
|
$
|
—
|
|
$
|
(652
|
)
|
$
|
—
|
|
$
|
—
|
|
$
|
(652
|
)
|
$
|
—
|
|
||||||
|
ULSG Re-segmentation
|
$
|
—
|
|
$
|
(614
|
)
|
$
|
—
|
|
$
|
—
|
|
$
|
(614
|
)
|
$
|
—
|
|
||||||
|
SPDA Recaptures
|
$
|
—
|
|
$
|
413
|
|
$
|
—
|
|
$
|
—
|
|
$
|
413
|
|
$
|
—
|
|
||||||
|
VA Recaptures
|
$
|
(140
|
)
|
$
|
—
|
|
$
|
—
|
|
$
|
14
|
|
$
|
—
|
|
$
|
—
|
|
||||||
|
ULSG Actions
|
$
|
(82
|
)
|
$
|
—
|
|
$
|
—
|
|
$
|
(82
|
)
|
$
|
—
|
|
$
|
—
|
|
||||||
ULSG Model Change.
In the second quarter of 2016, we refined our actuarial model which calculates the reserves for our ULSG products (the “ULSG Model Change”). The new model treats projected premiums and death claims differently than the previous model. This change resulted in a one-time charge to both income (loss) before provision for income tax and pre-tax adjusted earnings of $652 million for the year ended December 31, 2016. Of this one-time charge, $262 million resulted directly from the model refinements, as follows:
|
•
|
a $231 million increase in insurance-related liabilities;
|
|
•
|
a $24 million decrease in amortization of unearned revenue; and
|
|
•
|
a $7 million increase in amortization of DAC.
|
The above impacts from the model change also resulted in a reduction of expected future gross profits, which drove our loss recognition margins negative, resulting in a further DAC write-off of $358 million and an increase in insurance-related liabilities of $32 million for the year ended December, 31, 2016. In addition to the one-time charges, as a result of the lower expected future gross profits, we have recognized ongoing increases in insurance-related liabilities of $218 million and $132 million for the years ended December 31, 2017 and 2016, respectively, that are not included in the preceding table. We expect to recognize similar ongoing increases in future periods.
ULSG Re-segmentation
. In the fourth quarter of 2016, we moved the ULSG products out of the Life segment and into the Run-off segment. The move was triggered by the decision in late 2016 to cease sales of all ULSG products in early 2017 and to manage this business separately from the rest of the Life business. In accordance with our accounting policies, the move to a different segment required us to separately evaluate and test the ULSG products for loss recognition without being able to offset losses with future earnings from the variable and universal life products remaining in the Life segment. This re-segmentation driven loss recognition resulted in a decrease in both income (loss) before provision for income tax and pre-tax adjusted earnings of $614 million, of which $562 million was from the write-off of DAC and $52 million was from an increase in insurance-related liabilities.
SPDA Recaptures.
In 2016, in contemplation of the Separation, we recaptured certain blocks of single premium deferred annuities ceded to MLIC, a subsidiary of MetLife, on a 90% coinsurance basis (together, the “SPDA Recaptures”). The SPDA Recaptures resulted in a benefit to both income (loss) before provision for income tax and pre-tax adjusted earnings of $413 million for the year ended December 31, 2016, comprised of higher fee income of $303 million due to a net favorable settlement and a recovery of DAC amortization of $110 million. The SPDA Recaptures were primarily settled with market-adjusted assets-in-kind, which increased the invested asset base but also resulted in lower yields as compared to the yield used in determining the interest income recognized on the reinsurance receivable balances prior to the recaptures. Together these changes had additional impacts to net investment spread on a comparative basis which are not reflected in the preceding table.
VA Recaptures
.
Effective January 1, 2017, certain ceded and assumed variable annuity reinsurance agreements with MLIC were recaptured (“VA Recaptures”). The initial settlement of these transactions resulted in a charge in the first quarter of 2017 which decreased income (loss) before provision for income tax by $277 million. Of this amount, $265 million was included in
108
GMLB Riders, recognized in net derivative gains (losses). The remaining $12 million was included in pre-tax adjusted earnings, recognized in other expenses, net of DAC capitalization, partially offset by lower amortization of DAC and VOBA. Upon final settlement in the second quarter of 2017, we recognized a benefit of $137 million, of which $110 million was included in GMLB Riders in net derivative gains (losses), and $27 million was included in adjusted earnings in other revenue.
ULSG Actions
. In the fourth quarter of 2017, several actions involving our USLG business resulted in a net decrease to both income (loss) before provision for income tax and pre-tax adjusted earnings of $82 million. These actions included the following:
|
•
|
the recapture of certain Unaffiliated Third-party Reinsurance agreements which resulted in net charges totaling $147 million; partially offset by
|
|
•
|
refinements to the actuarial valuation model, resulting in a net favorable impact of $65 million.
|
Actuarial Assumption Review
As a result of the 2016 actuarial assumption review related to our variable annuity business, we made certain changes to policyholder behavior and long-term economic assumptions, primarily relating to annuitization utilization, as well as withdrawals and risk margins. The 2016 review included an analysis of a larger body of actual experience than was previously available which, when combined with relevant industry-wide data that had recently become available, we believed provided greater insight into anticipated policyholder behavior for variable annuity contracts that are in the money. This experience included a statistically significant amount of our GMIB policies passing the ten year waiting period required to allow contract holders to use certain benefits and a longer period of experience in a low interest rate environment.
For the 2017 variable annuity review, we (i) made certain changes to policyholder behavior; (ii) harmonized models and assumptions between GAAP and statutory; and (iii) reflected Brighthouse specific variables after the completion of the Separation from our former parent. The policyholder behavior updates were for lapse assumptions on all variable annuities with living benefits, and withdrawal assumptions on GMWBs to reflect contract age, in addition to client age over time. This change resulted in earlier client withdrawals for GMWB contracts. This policyholder behavior update was in part informed by the recent quantitative impact study (“QIS”) conducted as part of the NAIC variable annuity reserve and capital reform initiative that is still under development. In the harmonization category of changes, on economic assumptions, we lowered our long-term rate of return assumption to the mid-6% range for separate account funds, consistent with our base case projections which are the basis for setting our financial targets. Additionally, in this category, we refined the DAC model time horizon to be harmonized with the estimated weighted average life of the liabilities. In the third and final category, triggered by the Separation, we updated our assumptions for determining the credit spread underlying the nonperformance risk adjustment in the valuation of our embedded derivative liabilities to be based on Brighthouse’s creditworthiness instead of that of MetLife. See “— Summary of Critical Accounting Estimates — Derivatives — Nonperformance Risk Adjustment.”
Updates to assumptions for our life businesses were related to realized experience in terms of mortality, lapses and premium payment patterns. Additionally, while we did not revise our long term general account rate setting methodology inherited from our former parent this year, we did experience positive impacts from differentiating the blended general account earned rates between the Life and Run-off segments. We may review and update these general account assumptions in future annual actuarial reviews.
The following table presents the impact on pre-tax adjusted earnings and net income (loss) before provision for income tax from the actuarial assumption reviews. The impact related to GMLBs is included in net income (loss), but not included in adjusted earnings. See “— Non-GAAP and Other Financial Disclosures.”
|
Years Ended December 31,
|
||||||||||||
|
2017
|
2016
|
2015
|
||||||||||
|
(In millions)
|
||||||||||||
|
GMLBs
|
$
|
(329
|
)
|
$
|
(2,348
|
)
|
$
|
(94
|
)
|
|||
|
Included in adjusted earnings:
|
||||||||||||
|
Other annuity business
|
218
|
|
(200
|
)
|
(42
|
)
|
||||||
|
Life business
|
(28
|
)
|
2
|
|
5
|
|
||||||
|
Run-off
|
43
|
|
—
|
|
(42
|
)
|
||||||
|
Total included in adjusted earnings
|
233
|
|
(198
|
)
|
(79
|
)
|
||||||
|
Total impact on net income (loss)
|
$
|
(96
|
)
|
$
|
(2,546
|
)
|
$
|
(173
|
)
|
|||
109
Consolidated Results for the Years Ended December 31, 2017, 2016, and 2015
Business Overview.
We continue to evaluate our product offerings with the goal to provide new products that are simpler, more transparent and provide value to our advisors, clients and shareholders. New business efforts in 2017 centered on the sale of Shield Annuities, which increased 50% compared to 2016. In addition, as part of our distribution agreement with MassMutual, we launched a new fixed indexed annuity product in the second half of 2017. However, overall 2017 sales declined on a comparative basis due to impacts from Separation-related events that occurred in 2016, including the sale of MPCG to MassMutual and the suspension of sales by Fidelity, as well as our migration away from participating whole life and certain term life products.
Unless otherwise noted, all amounts in the following discussions of our results of operations are stated before income tax except for adjusted earnings, which are presented net of income tax.
|
|
Years Ended December 31,
|
|||||||||||
|
|
2017
|
2016
|
2015
|
|||||||||
|
|
(In millions)
|
|||||||||||
|
Revenues
|
||||||||||||
|
Premiums
|
$
|
863
|
|
$
|
1,222
|
|
$
|
1,679
|
|
|||
|
Universal life and investment-type product policy fees
|
3,898
|
|
3,782
|
|
4,010
|
|
||||||
|
Net investment income
|
3,078
|
|
3,207
|
|
3,099
|
|
||||||
|
Other revenues
|
651
|
|
736
|
|
422
|
|
||||||
|
Net investment gains (losses)
|
(28
|
)
|
(78
|
)
|
7
|
|
||||||
|
Net derivative gains (losses)
|
(1,620
|
)
|
(5,851
|
)
|
(326
|
)
|
||||||
|
Total revenues
|
6,842
|
|
3,018
|
|
8,891
|
|
||||||
|
Expenses
|
||||||||||||
|
Policyholder benefits and claims
|
3,636
|
|
3,903
|
|
3,269
|
|
||||||
|
Interest credited to policyholder account balances
|
1,111
|
|
1,165
|
|
1,259
|
|
||||||
|
Capitalization of DAC
|
(260
|
)
|
(334
|
)
|
(399
|
)
|
||||||
|
Amortization of DAC and VOBA
|
227
|
|
371
|
|
781
|
|
||||||
|
Interest expense on debt
|
153
|
|
175
|
|
168
|
|
||||||
|
Other expenses
|
2,590
|
|
2,443
|
|
2,351
|
|
||||||
|
Total expenses
|
7,457
|
|
7,723
|
|
7,429
|
|
||||||
|
Income (loss) before provision for income tax
|
(615
|
)
|
(4,705
|
)
|
1,462
|
|
||||||
|
Provision for income tax expense (benefit)
|
(237
|
)
|
(1,766
|
)
|
343
|
|
||||||
|
Net income (loss)
|
$
|
(378
|
)
|
$
|
(2,939
|
)
|
$
|
1,119
|
|
|||
The following table presents the components of net income (loss), in addition to adjusted earnings:
|
Years Ended December 31,
|
||||||||||||
|
2017
|
2016
|
2015
|
||||||||||
|
|
(In millions)
|
|||||||||||
|
GMLB Riders
|
$
|
(1,937
|
)
|
$
|
(3,221
|
)
|
$
|
(500
|
)
|
|||
|
Other derivative instruments
|
(203
|
)
|
(2,015
|
)
|
(156
|
)
|
||||||
|
Net investment gains (losses)
|
(28
|
)
|
(78
|
)
|
7
|
|
||||||
|
Other adjustments
|
(44
|
)
|
(258
|
)
|
(2
|
)
|
||||||
|
Adjusted earnings before provision for income tax
|
1,597
|
|
867
|
|
2,113
|
|
||||||
|
Income (loss) before provision for income tax
|
(615
|
)
|
(4,705
|
)
|
1,462
|
|
||||||
|
Provision for income tax expense (benefit)
|
(237
|
)
|
(1,766
|
)
|
343
|
|
||||||
|
Net income (loss)
|
$
|
(378
|
)
|
$
|
(2,939
|
)
|
$
|
1,119
|
|
|||
Year Ended December 31, 2017
Compared with the
Year Ended December 31, 2016
Overview
.
Income (loss) before provision for income tax increased $4.1 billion ($2.6 billion, net of income tax) compared to 2016. In addition to higher adjusted earnings, this increase was driven primarily by favorable changes from freestanding derivatives and GMLB Riders. Additionally, after-tax results were impacted by a non-cash charge recognized in the third quarter
110
of 2017 in connection with the Separation of $1.1 billion which was substantially offset by the favorable impact recognized in the fourth quarter of 2017 of $947 million related to the enactment of the Tax Act. Excluding the impacts from the annual actuarial assumption review, income (loss) before provision for income tax increased
$1.6
billion.
GMLB Riders.
The GMLB Riders reflect (i) changes in the carrying value of GMLB liabilities, including GMIBs, GMWBs and GMABs; (ii) changes in the fair value of the hedges and reinsurance of the GMLB liabilities; (iii) the fees earned from the GMLB liabilities; and (iv) the effects related to DAC and VOBA amortization offsets to each of the preceding components.
Comparative results from GMLB Riders were favorable by $1.3 billion as benefits recognized from lower liability reserves were partially offset by unfavorable impacts from the related DAC offsets and market factor impacts on our hedging program. For a detailed discussion of the GMLB Riders, see “— GMLB Riders for the Years Ended December 31, 2017, 2016 and 2015.”
Other Derivative Instruments
.
We have other derivative instruments, in addition to the hedges and embedded derivatives included in the GMLB Riders, for which changes in fair value are recognized in net derivative gains (losses). Changes in the fair value of our other derivative instruments had a favorable impact on comparative results of $1.8 billion.
Freestanding Derivatives.
We have freestanding derivatives that economically hedge certain invested assets and insurance liabilities. The majority of this hedging activity is focused in the following areas:
|
•
|
use of interest rate swaps when we have duration mismatches where suitable assets with maturities similar to those of our long-dated liabilities are not readily available in the market; and
|
|
•
|
use of foreign currency swaps when we hold fixed maturity securities denominated in foreign currencies that are matching insurance liabilities denominated in U.S. dollars.
|
The market impacts on the hedges are accounted for in net income (loss) while the offsetting economic impact on the items they are hedging are either not recognized or recognized through OCI in equity.
In 2016, in connection with the Separation, we entered into additional interest rate swaps in order to hedge the risk of a decline in the statutory capital of the Company from further declines in interest rates.
Changes in the fair value of freestanding derivatives had a $1.8 billion favorable impact on comparative results, primarily due to favorable changes in interest rates on the fair value of our interest rate swaps. This favorable change was partially offset by unfavorable changes in our foreign currency swaps due to the U.S. dollar weakening against key foreign currencies in the current period when compared to the prior period.
Embedded Derivatives.
Certain ceded reinsurance agreements in our Life and Run-off segments are written on a coinsurance with funds withheld basis. The funds withheld component is accounted for as an embedded derivative with changes in the fair value recognized in net income (loss) in the period in which they occur. In addition, the changes in liability values of our index-linked annuity products that result from changes in the underlying equity index are accounted for as embedded derivatives. Changes in the fair value of embedded derivatives had a favorable impact on comparative results of $16 million, primarily due to lower unfavorable impacts recognized in the current period on our Shield Annuities. In connection with the transition to our new variable annuity hedging program, changes in the fair value of the Shield Annuities are included in the direct written liabilities component of GMLB Riders beginning in the third quarter of 2017 on a prospective basis.
Other Adjustments.
Other adjustments to determine adjusted earnings had a favorable impact on comparative results of $214 million, primarily due to charges in the prior period for an impairment of goodwill in our Run-off segment and the write-off of previously capitalized items in Corporate & Other in connection with the sale of MPCG to MassMutual.
Income Tax Expense (Benefit).
Income tax benefit for the year ended December 31, 2017 was $237 million, or 39% of income (loss) before provision for income tax, compared to $1.8 billion, or 38% of income (loss) before provision for income tax for the year ended December 31, 2016. Our effective tax rate differs from the U.S. statutory rate primarily due to the impacts of the dividend received deductions and utilization of tax credits. In the current period, we recognized an additional $1.1 billion non-cash tax charge in connection with the Separation, as well as a $725 million tax benefit related to the enactment of the Tax Act.
Adjusted Earnings.
As more fully described in “— Non-GAAP and Other Financial Disclosures,” we use adjusted earnings, which does not equate to net income (loss), as determined in accordance with GAAP, to analyze our performance, evaluate segment performance, and allocate resources. We believe that the presentation of adjusted earnings, as we measure it for management purposes, enhances the understanding of our performance by highlighting the results of operations and the underlying profitability drivers of the business. Adjusted earnings and other financial measures based on adjusted earnings allow analysis of our performance relative to our business plan and facilitate comparisons to industry results. Adjusted earnings should not be viewed as a substitute for net income (loss). Adjusted earnings before provision for income tax increased $730 million
111
($234 million, net of income tax) for the year ended December 31, 2017, compared to the prior period. Adjusted earnings is discussed in greater detail below.
Year Ended December 31, 2016
Compared with the
Year Ended December 31, 2015
Overview.
Income (loss) before provision for income tax decreased $6.2 billion ($4.1 billion, net of income tax) to a loss in 2016 compared to income in 2015. In addition to lower adjusted earnings, this decrease was primarily due to unfavorable results from GMLB Riders and unfavorable changes in other derivative instruments. Excluding the impact of the annual actuarial assumption review, income (loss) before provision for income tax decreased $3.8 billion ($2.5 billion, net of income tax).
GMLB Riders.
Comparative results from GMLB Riders were unfavorable by $2.7 billion, as our annual actuarial assumption review resulted in changes to assumptions regarding policyholder behavior which significantly increased the carrying value of the liabilities. In addition, market factors resulted in a significant decrease in the fair value of our related hedges. These decreases were partially offset by the favorable impacts on the GMLB Riders liabilities due to those same market factors, as well as favorable impacts to DAC amortization. Excluding the impact of the annual actuarial assumption review, comparative results from GMLB Riders were unfavorable by $466 million.
Other Derivative Instruments.
Changes in the fair value of our other derivative instruments had an unfavorable impact on comparative results of $1.9 billion.
Freestanding Derivatives.
Changes in the fair value of freestanding derivatives had an unfavorable impact on comparative results of $1.7 billion, primarily due to the unfavorable changes in our receive fixed interest rate swaps and interest rate total return swaps resulting from long-term interest rates increasing in 2016, including a significant increase in the fourth quarter, compared to decreasing in 2015.
Embedded Derivatives.
Changes in the fair value of embedded derivatives, primarily our Shield Annuity liabilities, had an unfavorable impact on comparative results of $181 million due to increases in equity index levels.
Net Investment Gains (Losses).
Net investment gains (losses) had an unfavorable impact on comparative results of $85 million, primarily due to realized gains on real estate and real estate joint ventures recognized in 2015 and higher impairments on real estate joint ventures in 2016, compared to 2015. These decreases were partially offset by lower impairments of fixed maturity securities in 2016, compared to 2015.
Other Adjustments.
Other adjustments to determine adjusted earnings had an unfavorable impact on comparative results of $256 million, primarily due to:
|
•
|
an impairment of goodwill in 2016 in our Run-off segment of $161 million ($109 million, net of income tax); and
|
|
•
|
higher expenses of $72 million in 2016 in Corporate & Other related to the write-off of previously capitalized items in connection with the sale of MPCG to MassMutual.
|
Income Tax Expense (Benefit).
Income tax benefit for the year ended December 31, 2016 was $1.8 billion, or 38% of income (loss) before provision for income tax, compared to income tax expense of $343 million, or 23% of income (loss) before provision for income tax, for the year ended December 31, 2015. Our effective tax rate differs from the U.S. statutory rates primarily due to the impacts of the dividend received deductions and utilization of tax credits.
Adjusted earnings.
Adjusted earnings before provision for income tax decreased $1.2 billion ($855 million, net of income tax) for the year ended December 31, 2016, compared to 2015. Adjusted earnings is discussed in greater detail below.
112
Reconciliation of Net Income (Loss) to Adjusted Earnings
The following tables reconcile net income (loss) to adjusted earnings:
|
Year Ended December 31, 2017
|
||||||||||||||||||||
|
Annuities
|
Life
|
Run-off
|
Corporate & Other
|
Total
|
||||||||||||||||
|
(In millions)
|
||||||||||||||||||||
|
Net income (loss)
|
$
|
(394
|
)
|
$
|
(31
|
)
|
$
|
75
|
|
$
|
(28
|
)
|
$
|
(378
|
)
|
|||||
|
Add: Provision for income tax expense (benefit)
|
(391
|
)
|
(35
|
)
|
25
|
|
164
|
|
(237
|
)
|
||||||||||
|
Net income (loss) before provision for income tax
|
(785
|
)
|
(66
|
)
|
100
|
|
136
|
|
(615
|
)
|
||||||||||
|
Less: GMLB Riders
|
(1,937
|
)
|
—
|
|
—
|
|
—
|
|
(1,937
|
)
|
||||||||||
|
Less: Other derivative instruments
|
(242
|
)
|
(21
|
)
|
(53
|
)
|
113
|
|
(203
|
)
|
||||||||||
|
Less: Net investment gains (losses)
|
26
|
|
(52
|
)
|
25
|
|
(27
|
)
|
(28
|
)
|
||||||||||
|
Less: Other adjustments
|
(18
|
)
|
—
|
|
(19
|
)
|
(7
|
)
|
(44
|
)
|
||||||||||
|
Adjusted earnings before provision for income tax
|
1,386
|
|
7
|
|
147
|
|
57
|
|
1,597
|
|
||||||||||
|
Less: Provision for income tax (expense) benefit
|
369
|
|
(9
|
)
|
43
|
|
274
|
|
677
|
|
||||||||||
|
Adjusted earnings
|
$
|
1,017
|
|
$
|
16
|
|
$
|
104
|
|
$
|
(217
|
)
|
$
|
920
|
|
|||||
|
Year Ended December 31, 2016
|
||||||||||||||||||||
|
Annuities
|
Life
|
Run-off
|
Corporate & Other
|
Total
|
||||||||||||||||
|
(In millions)
|
||||||||||||||||||||
|
Net income (loss)
|
$
|
(1,177
|
)
|
$
|
(23
|
)
|
$
|
(770
|
)
|
$
|
(969
|
)
|
$
|
(2,939
|
)
|
|||||
|
Add: Provision for income tax expense (benefit)
|
(770
|
)
|
(27
|
)
|
(413
|
)
|
(556
|
)
|
(1,766
|
)
|
||||||||||
|
Net income (loss) before provision for income tax
|
(1,947
|
)
|
(50
|
)
|
(1,183
|
)
|
(1,525
|
)
|
(4,705
|
)
|
||||||||||
|
Less: GMLB Riders
|
(3,221
|
)
|
—
|
|
—
|
|
—
|
|
(3,221
|
)
|
||||||||||
|
Less: Other derivative instruments
|
(354
|
)
|
(71
|
)
|
(163
|
)
|
(1,427
|
)
|
(2,015
|
)
|
||||||||||
|
Less: Net investment gains (losses)
|
(8
|
)
|
10
|
|
(15
|
)
|
(65
|
)
|
(78
|
)
|
||||||||||
|
Less: Other adjustments
|
—
|
|
(15
|
)
|
(171
|
)
|
(72
|
)
|
(258
|
)
|
||||||||||
|
Adjusted earnings before provision for income tax
|
1,636
|
|
26
|
|
(834
|
)
|
39
|
|
867
|
|
||||||||||
|
Less: Provision for income tax (expense) benefit
|
484
|
|
—
|
|
(295
|
)
|
(8
|
)
|
181
|
|
||||||||||
|
Adjusted earnings
|
$
|
1,152
|
|
$
|
26
|
|
$
|
(539
|
)
|
$
|
47
|
|
$
|
686
|
|
|||||
|
Year Ended December 31, 2015
|
||||||||||||||||||||
|
Annuities
|
Life
|
Run-off
|
Corporate & Other
|
Total
|
||||||||||||||||
|
(In millions)
|
||||||||||||||||||||
|
Net income (loss)
|
$
|
751
|
|
$
|
15
|
|
$
|
447
|
|
$
|
(94
|
)
|
$
|
1,119
|
|
|||||
|
Add: Provision for income tax expense (benefit)
|
181
|
|
(1
|
)
|
237
|
|
(74
|
)
|
343
|
|
||||||||||
|
Net income (loss) before provision for income tax
|
932
|
|
14
|
|
684
|
|
(168
|
)
|
1,462
|
|
||||||||||
|
Less: GMLB Riders
|
(500
|
)
|
—
|
|
—
|
|
—
|
|
(500
|
)
|
||||||||||
|
Less: Other derivative instruments
|
(70
|
)
|
(31
|
)
|
(58
|
)
|
3
|
|
(156
|
)
|
||||||||||
|
Less: Net investment gains (losses)
|
74
|
|
4
|
|
22
|
|
(93
|
)
|
7
|
|
||||||||||
|
Less: Other adjustments
|
(24
|
)
|
20
|
|
3
|
|
(1
|
)
|
(2
|
)
|
||||||||||
|
Adjusted earnings before provision for income tax
|
1,452
|
|
21
|
|
717
|
|
(77
|
)
|
2,113
|
|
||||||||||
|
Less: Provision for income tax (expense) benefit
|
363
|
|
1
|
|
249
|
|
(41
|
)
|
572
|
|
||||||||||
|
Adjusted earnings
|
$
|
1,089
|
|
$
|
20
|
|
$
|
468
|
|
$
|
(36
|
)
|
$
|
1,541
|
|
|||||
113
Consolidated Results for the
Years Ended December 31,
2017, 2016 and 2015 - Adjusted Earnings
The following table presents the components of adjusted earnings:
|
Years Ended December 31,
|
||||||||||||
|
2017
|
2016
|
2015
|
||||||||||
|
(In millions)
|
||||||||||||
|
Fee income
|
$
|
4,270
|
|
$
|
4,320
|
|
$
|
4,090
|
|
|||
|
Net investment spread
|
1,284
|
|
1,546
|
|
1,486
|
|
||||||
|
Insurance-related activities
|
(1,147
|
)
|
(1,332
|
)
|
(617
|
)
|
||||||
|
Amortization of DAC and VOBA
|
(330
|
)
|
(1,635
|
)
|
(735
|
)
|
||||||
|
Other expenses, net of DAC capitalization
|
(2,480
|
)
|
(2,032
|
)
|
(2,111
|
)
|
||||||
|
Adjusted earnings before provision for income tax
|
1,597
|
|
867
|
|
2,113
|
|
||||||
|
Provision for income tax expense (benefit)
|
677
|
|
181
|
|
572
|
|
||||||
|
Adjusted earnings
|
$
|
920
|
|
$
|
686
|
|
$
|
1,541
|
|
|||
Year Ended December 31, 2017
Compared with the
Year Ended December 31, 2016
Overview.
Adjusted earnings increased $234 million, primarily driven by lower amortization of DAC which was partially offset by higher expenses and lower net investment income. In addition, we recognized a non-cash tax charge of $1.1 billion in the third quarter of 2017, which was substantially offset by the favorable impact of $947 million in the fourth quarter of 2017 related to the enactment of the Tax Act. Excluding the impacts from the annual actuarial assumption review, adjusted earnings decreased $47 million.
Fee Income.
Fee income
decreased by $50 million, primarily due to a decline in our Annuities segment related to the SPDA Recaptures which was partially offset by higher asset-based fees and a tax-related increase in Corporate & Other. Excluding the impact of the annual actuarial assumption review, fee income decreased by $119 million.
Net Investment Spread.
Net investment spread decreased $262 million, primarily due to lower net investment income recognized in our Annuities segment and Corporate & Other, which is discussed in greater detail below.
Insurance-related Activities.
Net costs from insurance-related activities decreased by $185 million, primarily due to charges recognized in the prior period, net of additional charges in the current period, related to the ULSG Model Change and associated loss recognition in our Run-off segment, as well as a favorable change in the fair value of the underlying ceded separate account assets related to a related party reinsurance agreement for certain variable annuity contracts. Excluding the impact of the annual actuarial assumption review, insurance-related costs decreased by $109 million.
Amortization of DAC and VOBA.
DAC amortization is affected by estimated future gross profits, as well as differences between actual gross profits and estimates in the current period. See “— Summary of Critical Accounting Estimates — Deferred Policy Acquisition Costs and Value of Business Acquired.” Lower amortization of DAC and VOBA had a favorable impact comparative results of $1.3 billion, primarily due to charges recognized in the prior period from loss recognition triggered by the ULSG Model Change in our Run-off segment and refinements to the amortization period as a result of the current period annual actuarial assumption review in our Annuities segment. Excluding the impact of the annual actuarial assumption review, lower amortization of DAC and VOBA had a favorable impact on comparative results of $1.0 billion.
Other Expenses, Net of DAC Capitalization.
Expenses increased by $448 million, primarily due to establishment costs related to our technology transformation and branding in Corporate & Other, as well as increases in operating expenses as a result of being a stand-alone company and higher asset-based expenses in our Annuities segment.
Actuarial Assumption Review.
The results from the annual actuarial assumption review, which are included in the amounts discussed above, had a favorable impact on comparative results of $431 million, primarily due to
lower amortization of DAC in our Annuities segment from refinements in the amortization period along with other changes discussed in greater detail below.
Income Tax Expense (Benefit).
Income tax expense for the year ended December 31, 2017 was $677 million compared to $181 million for the year ended December 31, 2016. Our effective tax rate typically differs from the U.S. statutory rate primarily due to the dividend received deductions and utilization of tax credits. In the current period, we recognized a $1.1 billion non-cash tax charge in connection with the Separation. We also recognized a tax benefit in the current period of $725 million due to the Tax Act. These adjustments resulted in effective tax rate percentages that are not meaningful for comparison purposes and accordingly have not been included.
114
Year Ended December 31, 2016
Compared with the
Year Ended December 31, 2015
Overview.
The $855 million decrease in adjusted earnings resulted from a decrease in our Run-off segment, partially offset by increases in our Annuities segment and Corporate & Other. The decrease in our Run-off segment was due primarily to the ULSG Model Change and ULSG Re-segmentation. The increase in our Annuities segment was primarily due to higher fee income, lower amortization of DAC and VOBA and higher net investment spread, partially offset by higher GMDB costs. The increase in Corporate & Other was due primarily to higher net investment spread. Excluding the impact of the annual actuarial assumption review, adjusted earnings decreased $777 million.
Fee Income.
Fee income increased by $230 million, primarily due to the impacts of the SPDA Recaptures and the recapture of several reinsurance agreements in our Life segment, which was partially offset by lower asset-based fees in our Annuities segment. Excluding the impact of the annual actuarial assumption review, fee income increased by $218 million.
Net Investment Spread.
Net investment spread increased by $60 million, primarily due to higher net investment income resulting from higher invested asset bases in our Annuities segment and Corporate & Other, partially offset by a lower invested asset base in our Run-off segment. The overall increase in net investment income was partially offset by lower yields earned on the reinvestment of fixed maturity securities throughout our portfolios as a result of the low interest rate environment and lower returns on real estate joint ventures and securities lending in our Run-off segment. Net investment spread was further reduced by a decrease in income on the reinsurance deposit funds related to the SPDA Recaptures.
Insurance-Related Activities.
Net costs from insurance-related activities increased by $715 million primarily due to higher liabilities in our Run-off segment resulting from the ULSG Model Change and ULSG Re-segmentation and higher GMDB costs in our Annuities segment. Excluding the impact of the annual actuarial assumption review discussed below, net costs from insurance-related activities increased by $708 million.
Amortization of DAC and VOBA.
Higher amortization of DAC and VOBA had an unfavorable impact on comparative earnings of $900 million, primarily due to the impacts of the ULSG Re-segmentation and the ULSG Model Change. Excluding the impact of the annual actuarial assumption review, higher amortization of DAC and VOBA had an unfavorable impact on comparative results of $775 million.
Other Expenses, Net of DAC Capitalization.
Expenses decreased by $79 million, primarily due to the impact of the sale of MPCG to MassMutual in our Annuities and Life segments and lower asset-based costs in our Annuities segment, partially offset by higher allocated software amortization in our Annuities and Life segments as a result of certain projects being completed and placed into service in 2016.
Actuarial Assumption Review.
The results of the annual actuarial assumption review, which are included in the amounts discussed above, had an unfavorable impact on comparative results of $119 million, primarily due to higher DAC amortization and an increase in insurance-related liabilities in our Annuities segment, partially offset by a decrease in insurance-related liabilities in our Run-off segment.
Income Tax Expense (Benefit).
Income tax expense for the year ended December 31, 2016 was $181 million, or 21% of adjusted earnings before provision for income tax, compared to income tax expense of $572 million, or 27% of adjusted earnings before income tax, for the year ended December 31, 2015. Our effective tax rate typically differs from the U.S. statutory rate primarily due to the impacts of the dividend received deductions and utilization of tax credits.
115
Segments and Corporate & Other - Adjusted Earnings for the
Years Ended December 31,
2017, 2016 and 2015
Annuities
The following table presents the components of adjusted earnings for our Annuities segment:
|
Years Ended December 31,
|
||||||||||||
|
2017
|
2016
|
2015
|
||||||||||
|
(In millions)
|
||||||||||||
|
Fee income
|
$
|
2,918
|
|
$
|
3,155
|
|
$
|
3,042
|
|
|||
|
Net investment spread
|
501
|
|
714
|
|
651
|
|
||||||
|
Insurance-related activities
|
(388
|
)
|
(619
|
)
|
(484
|
)
|
||||||
|
Amortization of DAC and VOBA
|
(80
|
)
|
(368
|
)
|
(456
|
)
|
||||||
|
Other expenses, net of DAC capitalization
|
(1,565
|
)
|
(1,246
|
)
|
(1,301
|
)
|
||||||
|
Adjusted earnings before provision for income tax
|
1,386
|
|
1,636
|
|
1,452
|
|
||||||
|
Provision for income tax expense (benefit)
|
369
|
|
484
|
|
363
|
|
||||||
|
Adjusted earnings
|
$
|
1,017
|
|
$
|
1,152
|
|
$
|
1,089
|
|
|||
A significant portion of our adjusted earnings is driven by separate account balances related to our variable annuity business. Most directly, these balances determine asset-based fee income but they also impact DAC amortization and asset-based commissions. Separate account balances are driven by sales, market movements, surrenders, withdrawals, benefit payments, policy charges and transfers. Below is a rollforward of our variable annuities separate account balances
. Variable annuities separate account balances increased in 2017 driven by the strong equity market performance partially offset by continued negative net flows.
|
Years Ended December 31,
|
||||||||||||
|
2017
|
2016
|
2015
|
||||||||||
|
(In millions)
|
||||||||||||
|
Balance, beginning of period
|
$
|
104,857
|
|
$
|
106,595
|
|
$
|
115,897
|
|
|||
|
Deposits
|
1,259
|
|
1,934
|
|
3,216
|
|
||||||
|
Surrenders, withdrawals and benefits
|
(9,677
|
)
|
(8,046
|
)
|
(9,222
|
)
|
||||||
|
Net Flows
|
(8,418
|
)
|
(6,112
|
)
|
(6,006
|
)
|
||||||
|
Investment performance
|
16,124
|
|
7,177
|
|
7,094
|
|
||||||
|
Policy charges
|
(2,649
|
)
|
(2,607
|
)
|
(10,346
|
)
|
||||||
|
Transfers to general account
|
(25
|
)
|
(196
|
)
|
(44
|
)
|
||||||
|
Balance, end of period
|
$
|
109,889
|
|
$
|
104,857
|
|
$
|
106,595
|
|
|||
|
Average balance
|
$
|
108,007
|
|
$
|
105,255
|
|
$
|
113,106
|
|
|||
Year Ended December 31, 2017
Compared with the
Year Ended December 31, 2016
Overview.
Adjusted earnings decreased $135 million, primarily due to higher expenses, lower fee income and lower net investment spread, partially offset by favorable changes in DAC amortization and insurance-related activities. Excluding the favorable impact from the annual actuarial assumption review, adjusted earnings decreased $407 million.
Fee Income.
Fee income decreased by $237 million, primarily due to:
|
•
|
a benefit recorded in the prior period of $303 million in connection with the SPDA Recaptures; and
|
|
•
|
a deferred gain of $47 million recognized in the prior period related to the reinsurance agreements that were part of the VA Recaptures; partially offset by
|
|
•
|
an increase of $82 million from additional revenue sharing fees which were passed through to third parties and had a corresponding offset in other expenses; and
|
|
•
|
an increase in asset-based fees in our variable annuity business of $55 million resulting from higher average separate account balances.
|
116
Excluding the impact of the annual actuarial assumption review, fee income decreased by $222 million.
Net Investment Spread.
Net investment spread decreased by $213 million, primarily due to lower net investment income driven by (i) lower income on derivatives as a result of the termination of interest rate swaps, (ii) lower yields on fixed maturity securities and mortgage loans as proceeds from maturing investments were reinvested at rates lower than the portfolio average and (iii) lower prepayment fees. These decreases were partially offset by the impact from an increase in the average invested asset base, primarily due to positive net flows in the general account. There was also an increase in average invested assets from the SPDA Recaptures, however, much of the resulting increase in net investment income was offset by the elimination of interest credited payments on the related reinsurance receivable, recognized in other revenue. In addition, segment net investment income decreased due to lower interest on allocated equity resulting from decrease in both the interest credited rate and the allocated equity base.
Insurance-related Activities.
Net costs from insurance-related activities decreased by $231 million, primarily due to:
|
•
|
a favorable change of $108 million in the fair value of the underlying ceded separate account assets under a related party reinsurance agreement for certain variable annuity contracts; and
|
|
•
|
lower amortization of deferred sales inducements (“DSI”) of $106 million mostly from refinements to the amortization period as part of the annual actuarial assumption review.
|
Excluding the impact of the annual actuarial assumption review, net costs from insurance-related activities decreased by $174 million.
Amortization of DAC and VOBA.
Lower DAC and VOBA amortization had a favorable impact on comparative results of $288 million, primarily due to:
|
•
|
lower amortization of $376 million from refinements to the amortization period in connection with the annual actuarial assumption review in the current period, partially offset by
|
|
•
|
higher amortization of $109 million as a result of the recovery recorded in the prior period in connection with the SPDA Recaptures.
|
Excluding the impact of the annual actuarial assumption review, DAC and VOBA amortization had an unfavorable impact on comparative results of $88 million.
Other Expenses, Net of DAC Capitalization.
Expenses increased by $319 million, primarily due to increased operating costs as a result of being a stand-alone company, as well as an increase in pass-through variable annuity expenses. With respect to the variable annuity pass-through expenses, it is an increase of approximately $140 million driven by Separation related changes to arrangements with third parties impacting the recognition of pass-through investment management and revenue sharing fees, most of which is offset by an increase in fee income.
Actuarial Assumption Review.
The results of the annual actuarial assumption review, which are included in the amounts discussed above, had a favorable impact on comparative results of $418 million, primarily due to:
|
•
|
lower DAC amortization of $376 million resulting mostly from refinements to the amortization period; and
|
|
•
|
lower DSI amortization of $87 million, primarily from refinements to the amortization period; partially offset by
|
|
•
|
higher policyholder benefits and claims of $32 million resulting from a increase in insurance liabilities from changes in lapse and withdrawal rates, as well as separate account growth rates; and
|
|
•
|
lower amortization of unearned revenue of $15 million from refinements to the amortization period.
|
Income Tax Expense (Benefit).
Income tax expense for the year ended December 31, 2017 was $369 million, or 27% of adjusted earnings before provision for income tax, compared to $484 million, or 30% of adjusted earnings before provision for income tax, for the year ended December 31, 2016. Our effective tax rate typically differs from the U.S. statutory rate primarily due to the impacts of the dividend received deductions. In the current period, we recognized a tax benefit of $115 million related to the dividend received deductions.
Year Ended December 31, 2016
Compared with the
Year Ended December 31, 2015
Overview.
Adjusted earnings increased $63 million, driven by higher fee income, lower DAC and VOBA amortization, higher net investment spread and lower expenses, partially offset by higher GMDB costs and unfavorable mortality experience. Excluding the impact of the annual actuarial assumption review, adjusted earnings increased $166 million.
117
Fee Income.
Fee income increased by $113 million, primarily due to:
|
•
|
an increase of $303 million resulting from the SPDA Recaptures; partially offset by
|
|
•
|
a decrease of $194 million in asset-based fees resulting from the lower average separate account balances noted above, a portion of which was offset by a decrease in other expenses, net of DAC capitalization, from lower asset-based commissions.
|
Net Investment Spread.
Net investment spread increased by $63 million, primarily due to higher net investment income and lower interest credited, partially offset by lower interest earned on the reinsurance deposit funds related to the SPDA Recaptures. Net investment income increased primarily due to an increase in the average invested asset base and higher returns on private equity investments, partially offset by the impact from the low interest rate environment, which resulted in investments in fixed maturity securities and mortgage loans at yields lower than the portfolio average. The average invested asset base increased as a result of the SPDA Recaptures, positive net flows in the general account and an increase in allocated equity. Interest credited on policyholder account balances decreased primarily due to lower average crediting rates in connection with the low interest rate environment.
Insurance-related Activities.
Net costs from insurance-related activities increased by $135 million, primarily due to:
|
•
|
higher costs associated with GMDBs of $109 million driven by an increase in liability balances resulting from changes in rider utilization assumptions, higher claims, and hedge losses; and
|
|
•
|
unfavorable mortality of $38 million in our income annuities business.
|
Excluding the impact of the annual actuarial assumption review, net costs from insurance-related activities increased by $89 million.
Amortization of DAC and VOBA.
Lower DAC and VOBA amortization had a favorable impact on comparative results of $88 million. The decrease in amortization was primarily due to:
|
•
|
a decrease of $109 million from a recovery of DAC related to the SPDA Recaptures;
|
|
•
|
a decrease of $62 million from lower actual profits resulting from lower asset-based fees earned on the lower average separate account balances noted above, net of the inverse impact on amortization from reduced future expected gross profits due to the same lower fees; and
|
|
•
|
a decrease of $29 million from model refinements to DAC amortization related to affiliated reinsurance and hedges of variable annuities; partially offset by
|
|
•
|
an increase of $112 million from changes in annual actuarial assumptions discussed below.
|
Excluding the impact of the actuarial assumption review, DAC and VOBA amortization had a favorable impact on comparative results of $200 million.
Other Expenses, Net of DAC Capitalization.
Expenses decreased by $55 million, primarily due (i) to the sale of MPCG to MassMutual, (ii) impacts from the suspension of sales by a major distributor, (iii) lower investment management fees resulting from lower assets under management in our proprietary funds, and (iv) lower asset-based commissions related to the lower average separate account balances noted above. These decreases were partially offset by higher allocated software amortization.
Actuarial Assumption Review.
The results from the annual actuarial assumption review, which is included in the amounts discussed above, had an unfavorable impact on comparative results of $158 million, primarily due to:
|
•
|
additional DAC amortization of $112 million from assumption changes related to rider utilization, separate account growth, market volatility and lapses; and
|
|
•
|
higher net costs from insurance-related activities of $46 million resulting from changes to rider utilization assumptions impacting GMDBs, net of changes in lapse assumptions.
|
Income Tax Expense (Benefit).
Income tax expense for the year ended December 31, 2016 was $484 million, or 30% of adjusted earnings before provision for income tax, compared to $363 million, or 25% of adjusted earnings before provision for income tax, for the year ended December 31, 2015. Our effective tax rate differs from the U.S. statutory rate primarily due to the impacts of the dividend received deductions.
118
Life
The following table presents the components of adjusted earnings for our Life segment:
|
Years Ended December 31,
|
||||||||||||
|
2017
|
2016
|
2015
|
||||||||||
|
(In millions)
|
||||||||||||
|
Fee income
|
$
|
395
|
|
$
|
386
|
|
$
|
254
|
|
|||
|
Net investment spread
|
85
|
|
98
|
|
106
|
|
||||||
|
Insurance-related activities
|
15
|
|
85
|
|
126
|
|
||||||
|
Amortization of DAC and VOBA
|
(223
|
)
|
(284
|
)
|
(190
|
)
|
||||||
|
Other expenses, net of DAC capitalization
|
(265
|
)
|
(259
|
)
|
(275
|
)
|
||||||
|
Adjusted earnings before provision for income tax
|
7
|
|
26
|
|
21
|
|
||||||
|
Provision for income tax expense (benefit)
|
(9
|
)
|
—
|
|
1
|
|
||||||
|
Adjusted earnings
|
$
|
16
|
|
$
|
26
|
|
$
|
20
|
|
|||
Year Ended December 31, 2017
Compared with the
Year Ended December 31, 2016
Overview.
Adjusted earnings decreased $10 million, primarily due to unfavorable impacts from insurance-related activities partially offset by lower amortization of DAC and VOBA. Excluding the impact of the annual actuarial assumption review, adjusted earnings increased $10 million. During 2016 we recaptured several reinsurance agreements from an affiliate of MetLife and a third party. While these recaptures did not result in a material impact to adjusted earnings, the primary impacts of the recaptures resulted in a significant increase in amortization of DAC that was mostly offset by higher fee income.
Fee Income.
Fee income increased by $9 million, primarily due to (i) the recapture from a former affiliate of a yearly renewable term reinsurance agreement for certain life contracts (“YRT Recapture”) in the second quarter of 2017, (ii) a refinement in the allocation of ceded reinsurance fees between the Run-off and Life segments, and (iii) amortization of unearned revenue mostly related to changes in assumptions regarding maintenance expenses and mortality in connection with the annual actuarial assumption review. These favorable items were partially offset by lower fees resulting from the prior year reinsurance recapture transactions. Excluding the impact from the annual actuarial assumption review, fee income decreased by $55 million.
Net Investment Spread.
Net investment spread decreased by $13 million, primarily driven by a decrease in net investment income, partially offset by lower interest credited to policyholders. The decline in net investment income was primarily due to (i) lower investment yields on fixed maturity securities, as proceeds from maturing investments were invested at lower yields than the portfolio average, (ii) lower funds withheld assets as a result of reinsurance recapture activity and (iii) a reduction in interest on allocated equity as a result of reduced interest credited and allocated equity assets. These decreases were partially offset by higher returns on other limited partnership interests driven by an improvement in equity market performance. Interest credited to policyholders decreased due to lower imputed interest on insurance liabilities driven by the prior year reinsurance recapture transactions, partially offset by higher interest credited on higher average policyholder account balances resulting from positive net flows.
Insurance-related Activities.
Insurance-related activities had an unfavorable impact on comparative results of $70 million, primarily due to lower ceded claim recoveries resulting from the current period YRT Recapture and a higher volume of low severity claims below our reinsurance retention limits, partially offset by lower direct claims and favorable impacts from the prior year reinsurance recapture transactions.
Amortization of DAC and VOBA.
Lower amortization of DAC and VOBA had a favorable impact on comparative results of $61 million, primarily due to the prior year reinsurance recapture transactions and the impact on gross profits from higher policyholder benefits and claims in 2017, partially offset by the impact from changes in assumptions regarding mortality and maintenance expenses in connection with the annual actuarial assumption review. Excluding the impact of the annual actuarial assumption review, amortization of DAC and VOBA had a favorable impact on comparative results of $150 million.
Other Expenses, Net of DAC Capitalization.
Expenses increased by $6 million, primarily due to increased operating costs as a result of being a stand-alone company and from one-time, separation-related reinsurance activity, partially offset by lower operational expenses as a result of the sale of MPCG to MassMutual.
119
Actuarial Assumption Review.
The results of the annual actuarial assumption review, which are included in the amounts discussed above, had an unfavorable impact on comparative results of $30 million, primarily due to:
|
•
|
higher DAC amortization of $89 million mostly driven by changes in mortality and maintenance expense assumptions and, to a lesser extent, projected premiums and separate account growth rates; partially offset by
|
|
•
|
higher amortization of unearned revenue of $64 million due to changes in mortality and maintenance expense assumptions.
|
Income Tax Expense (Benefit).
Income tax benefit for the year ended December 31, 2017 was $9 million. There was no tax expense for the year ended December 31, 2016. Our effective tax rate typically differs from the U.S. statutory rate primarily due to the impacts of the dividend received deductions. In the current period, we recognized an additional benefit related to true-ups for the dividend received deductions.
Year Ended December 31, 2016
Compared with the
Year Ended December 31, 2015
Overview.
Adjusted earnings increased $6 million resulting primarily from lower amortization of DAC and VOBA excluding the 2016 reinsurance recapture transactions and lower expenses, partially offset by unfavorable underwriting experience.
Fee Income.
Fee income increased by $132 million, primarily due to the impact from the 2016 reinsurance recapture transactions.
Net Investment Spread.
Net investment spread decreased by $8 million, primarily due to higher implied interest on insurance liabilities due to growth in the average liability balances.
Insurance-related Activities.
Insurance-related activities had an unfavorable impact on comparative results of $41 million, primarily due to higher frequency and severity of claims in our variable and universal life business.
Amortization of DAC and VOBA.
Higher amortization of DAC and VOBA had an unfavorable impact on comparative results of $94 million, primarily due to:
|
•
|
higher amortization of $120 million resulting from the 2016 reinsurance recapture transactions; partially offset by
|
|
•
|
lower amortization of $37 million from a decline in expected gross profits resulting from the aging of the business.
|
Other Expenses, Net of DAC Capitalization.
Expenses decreased by $16 million, primarily due to the impacts from the sale of MPCG to MassMutual, partially offset by higher allocated software amortization and costs related to the 2016 reinsurance recapture transactions.
Actuarial Assumption Review
.
There was not a significant impact to comparative results from the annual actuarial assumption review.
Income Tax Expense (Benefit).
There was no income tax expense or benefit for the year ended December 31, 2016 compared to income tax expense of $1 million, or 5% of adjusted earnings before provision for income tax, for the year ended December 31, 2015. Our effective tax rate typically differs from the U.S. statutory rate primarily due to the impacts of the dividend received deductions.
Run-off
The following table presents the components of adjusted earnings for our Run-off segment:
|
Years Ended December 31,
|
||||||||||||
|
2017
|
2016
|
2015
|
||||||||||
|
(In millions)
|
||||||||||||
|
Fee income
|
$
|
748
|
|
$
|
757
|
|
$
|
803
|
|
|||
|
Net investment spread
|
506
|
|
496
|
|
604
|
|
||||||
|
Insurance-related activities
|
(821
|
)
|
(851
|
)
|
(340
|
)
|
||||||
|
Amortization of DAC and VOBA
|
(7
|
)
|
(961
|
)
|
(65
|
)
|
||||||
|
Other expenses, net of DAC capitalization
|
(279
|
)
|
(275
|
)
|
(285
|
)
|
||||||
|
Adjusted earnings before provision for income tax
|
147
|
|
(834
|
)
|
717
|
|
||||||
|
Provision for income tax expense (benefit)
|
43
|
|
(295
|
)
|
249
|
|
||||||
|
Adjusted earnings
|
$
|
104
|
|
$
|
(539
|
)
|
$
|
468
|
|
|||
120
Year Ended December 31, 2017
Compared with the
Year Ended December 31, 2016
Overview
.
Adjusted earnings increased by $643 million, primarily due to lower amortization of DAC and VOBA and favorable impacts from ULSG-related charges recognized in the prior period, net of additional charges recognized in the current period. Excluding the impact from the annual actuarial assumption review, adjusted earnings increased by $615 million.
Fee Income.
Fee income decreased by $9 million, primarily due to a refinement in the allocation of ceded reinsurance fees between the Run-off and Life segments, as well as declines in separate account balances, partially offset by changes in assumptions regarding premium persistency and mortality in connection with the annual actuarial assumption review. Excluding the impact from the annual actuarial assumption review, fee income decreased by $29 million.
Insurance-related Activities.
Net costs from insurance-related activities decreased by $30 million, primarily due to:
|
•
|
a charge recognized in the prior period of $231 million related to the ULSG Model Change; partially offset by
|
|
•
|
higher net costs of $119 million associated with ULSG of which $66 million was attributable to the ULSG Actions and $53 million was driven by the recurring impact of the ULSG Re-segmentation combined with additional loss recognition from an increase in policyholder conversions from term life policies in anticipation of the discontinuation of the ULSG products; and
|
|
•
|
higher policyholder benefits and claims of $58 million resulting from an increase in pension risk transfer reserves.
|
Excluding the impact from the annual actuarial assumption review, net costs from insurance-related activities decreased by $7 million.
Amortization of DAC and VOBA.
Lower amortization of DAC and VOBA had a favorable impact on comparative results of $954 million driven by charges in 2016 to write-down the DAC asset in connection with the loss recognition triggered by the ULSG Model Change and ULSG Re-segmentation, which also resulted in no ULSG-related amortization expense in the current period.
Actuarial Assumption Review.
The results from the annual actuarial assumption review, which are included in the amounts discussed above, had a favorable impact on comparative results of $43 million, primarily due to:
|
•
|
lower policyholder benefits and claims of $23 million from a decrease in insurance liabilities from changes in general account growth rates and mortality, net of changes regarding premium persistency and maintenance expenses; and
|
|
•
|
higher amortization of unearned revenue of $20 million due to changes in premium persistency and mortality.
|
Income Tax Expense (Benefit).
Income tax expense for the year ended December 31, 2017 was $43 million, or 29% of adjusted earnings before provision for income tax, compared to a benefit of $295 million, or 35% of adjusted earnings before provision for income tax, for the year ended December 31, 2016. Our effective tax rate typically differs from the U.S. statutory rate primarily due to the impacts of the dividend received deductions.
Year Ended December 31, 2016
Compared with the
Year Ended December 31, 2015
Overview.
A
djusted earnings decreased by $1.0 billion primarily due to the impacts of the ULSG Model Change and the ULSG Re-segmentation as well as lower net investment spread.
Fee Income.
Fee income decreased by $46 million primarily due to our no longer selling ULSG products with lifetime guarantees and lower amortization of unearned revenue resulting from the ULSG Model Change.
Net Investment Spread.
Net investment spread decreased by $108 million, primarily due to the impacts to net investment income from a lower average invested asset base and lower yields. Average invested assets decreased due to continued repayments of funding agreements in our spread-based business. Investment yields declined primarily due to lower returns on real estate joint ventures. Net investment income also declined due to a reduction in the size of our securities lending program and lower margins on the remaining balances as a result of a flatter yield curve.
Insurance-related Activities.
Net costs from
insurance-related activities increased by $511 million, primarily due to the following:
|
•
|
an increase in policyholder benefits and claims of $263 million resulting from higher insurance liabilities due to one-time impacts of the ULSG Model Change;
|
|
•
|
an increase in policyholder benefits and claims of $132 million resulting from higher insurance liabilities due to the recurring impact of lower expected future gross profits due to the ULSG Model Change;
|
121
|
•
|
an increase in policyholder benefits and claims of $52 million resulting from higher insurance liabilities due to the ULSG Re-segmentation; and
|
|
•
|
unfavorable mortality experience of $46 million due to higher claims in our ULSG products.
|
Excluding the impact of the annual actuarial assumption review, net costs from insurance-related activities increased by $549 million.
Amortization of DAC and VOBA.
Higher amortization of DAC and VOBA had an unfavorable impact on comparative results of $896 million, primarily due to the following:
|
•
|
higher amortization of $562 million resulting from the ULSG Re-segmentation; and
|
|
•
|
higher amortization of $365 million resulting from the ULSG Model Change.
|
Actuarial Assumption Review.
The results of the annual actuarial assumption review, which are included in the amounts discussed above, had a favorable impact on comparative results of $42 million, primarily due to lower liabilities resulting from changes in assumptions related to surrenders in our ULSG business.
Income Tax Expense (Benefit).
Income tax benefit for the year ended December 31, 2016 was $295 million, or 35% of adjusted earnings before provision for income tax, compared to income tax expense of $249 million, or 35% of adjusted earnings before provision for income tax, for the year ended December 31, 2015.
Corporate & Other
The following table presents the components of adjusted earnings for Corporate & Other:
|
Years Ended December 31,
|
||||||||||||
|
2017
|
2016
|
2015
|
||||||||||
|
(In millions)
|
||||||||||||
|
Fee income
|
$
|
209
|
|
$
|
22
|
|
$
|
(9
|
)
|
|||
|
Net investment spread
|
192
|
|
238
|
|
125
|
|
||||||
|
Insurance-related activities
|
47
|
|
53
|
|
81
|
|
||||||
|
Amortization of DAC and VOBA
|
(20
|
)
|
(22
|
)
|
(24
|
)
|
||||||
|
Other expenses, net of DAC capitalization
|
(371
|
)
|
(252
|
)
|
(250
|
)
|
||||||
|
Adjusted earnings before provision for income tax
|
57
|
|
39
|
|
(77
|
)
|
||||||
|
Provisions for income tax expense (benefit)
|
274
|
|
(8
|
)
|
(41
|
)
|
||||||
|
Adjusted earnings
|
$
|
(217
|
)
|
$
|
47
|
|
$
|
(36
|
)
|
|||
Year Ended December 31, 2017
Compared with the
Year Ended December 31, 2016
Overview.
Adjusted earnings decreased by $264 million, primarily due to net unfavorable tax adjustments recognized in the current period, higher expenses and lower net investment income. Excluding the impact of the current period tax adjustments, adjusted earnings decreased by $124 million.
Fee Income.
Fee income increased by $187 million, primarily from a reduction in the tax liability due to MetLife under the Tax Separation Agreement as a result of the enactment of the Tax Act. This adjustment was recognized in other revenue. See
Note 13
of the Notes to the Consolidated and Combined Financial Statements for additional information regarding the Tax Separation Agreement.
Net Investment Spread.
Net investment income decreased by $46 million, primarily driven by (i) a reduction in the invested asset base, (ii) lower returns on other limited partnerships and (iii) lower income from our securities lending program. These decreases were partially offset by the impact from a lower interest credited rate on allocated equity. The invested asset base decreased as a result of the termination of certain collateral financing arrangements in connection with the formation of BRCD and a cash distribution paid to MetLife in the current period in connection with the Separation, as well as lower allocated equity managed on behalf of the segments. Income from our securities lending program decreased as a result of a reduction in program size, as well as lower margins resulting from a flatter yield curve.
Other Expenses, Net of DAC Capitalization.
Expenses increased by $119 million, primarily due to establishment costs related to our technology transformation and branding. In addition, certain corporate branding costs that had previously been allocated to the segments were reallocated to Corporate & Other. These increases were partially offset by lower project-related costs and lower marketing costs associated with our U.S. direct to consumer business.
122
Income Tax Expense (Benefit).
Income tax expense for the year ended December 31, 2017 was $274 million compared to $8 million benefit for the year ended December 31, 2016. Our effective tax rate typically differs from the U.S. statutory rate primarily due to the utilization of tax credits. We recognized a $1.1 billion non-cash tax charge in connection with the Separation. We also recognized an additional tax benefit of $725 million related to the Tax Act. These adjustments resulted in effective tax rate percentages that are not meaningful for comparison purposes and accordingly have not been included.
Year Ended December 31, 2016
Compared with the
Year Ended December 31, 2015
Overview.
Adjusted earnings increased by $83 million primarily due to higher net investment spread.
Net Investment Spread.
Net investment spread increased by $113 million, primarily due to higher net investment income resulting from an increase in the average invested asset base, increased accruals on interest rate derivatives and higher returns on private equity investments, partially offset by lower yields. Average invested assets increased primarily as a result of a capital contribution from MetLife. Investment yields declined as we continued to encounter negative impacts of the low interest rate environment on the investment of fixed maturity securities at yields lower than the portfolio average.
Income Tax Expense (Benefit).
Income tax benefit for the year ended December 31, 2016 was $8 million, or 21% of adjusted earnings before provision for income tax, compared to $41 million, or 53% of adjusted earnings before provision for income tax, for the year ended December 31, 2015. Our effective tax rate differs from the U.S. statutory rate primarily due to the utilization of tax credits.
123
GMLB Riders for the Years Ended December 31, 2017, 2016 and 2015
The following table presents the overall impact on income (loss) before provision for income tax from the performance of GMLB Riders for (i) changes in carrying value of the GAAP liabilities, (ii) the mark-to-market of hedges and reinsurance, (iii) fees, and (iv) associated DAC offsets.
|
Years Ended December 31,
|
||||||||||||
|
2017
|
2016
|
2015
|
||||||||||
|
(In millions)
|
||||||||||||
|
Directly Written Liabilities (1)
|
$
|
391
|
|
$
|
(2,587
|
)
|
$
|
(1,139
|
)
|
|||
|
Assumed Reinsurance Liabilities
|
1
|
|
(35
|
)
|
(45
|
)
|
||||||
|
Total Liabilities
|
392
|
|
(2,622
|
)
|
(1,184
|
)
|
||||||
|
Hedging Program (2)
|
(3,143
|
)
|
(2,800
|
)
|
(249
|
)
|
||||||
|
Ceded Reinsurance
|
(169
|
)
|
69
|
|
119
|
|
||||||
|
Total Hedging Program and Reinsurance
|
(3,312
|
)
|
(2,731
|
)
|
(130
|
)
|
||||||
|
Directly Written Fees
|
864
|
|
859
|
|
849
|
|
||||||
|
Assumed Reinsurance Fees
|
—
|
|
12
|
|
12
|
|
||||||
|
Total Fees (3)
|
864
|
|
871
|
|
861
|
|
||||||
|
GMLB Riders before DAC Offsets
|
(2,056
|
)
|
(4,482
|
)
|
(453
|
)
|
||||||
|
DAC Offsets
|
119
|
|
1,261
|
|
(47
|
)
|
||||||
|
Total GMLB Riders
|
$
|
(1,937
|
)
|
$
|
(3,221
|
)
|
$
|
(500
|
)
|
|||
______________
|
(1)
|
Includes cumulative changes in fair value of the Shield Annuities embedded derivatives of ($305) million for the third and fourth quarters of 2017. Changes in the fair value of the Shield Annuities embedded derivatives were not included in the GMLB results for the first and second quarters of 2017 and the years ended December 31, 2016 and 2015.
|
|
(2)
|
Certain hedges of GMIB insurance liabilities were historically reported in policyholder benefits and claims. Amounts reported in policyholder benefits and claims were ($324) million, ($278) million and $14 million for the years ended December 2017, 2016 and 2015, respectively. Consistent with the hedge strategy now focused on a statutory target, with less emphasis on matching GAAP liabilities, all hedge program amounts will be recorded in net derivative gains (losses) beginning in 2018.
|
|
(3)
|
Excludes living benefit fees, included as a component of
adjusted earnings
, of $71 million, $76 million and $76 million for the years ended December 31, 2017, 2016 and 2015, respectively.
|
Year Ended December 31, 2017
Compared with the
Year Ended December 31, 2016
Comparative results from GMLB Riders were favorable by $1.3 billion. Of this amount, a favorable change of $2.6 billion was recorded in net derivative gains (losses). Excluding the impact of the annual actuarial assumption review, comparative results from GLMB Riders were unfavorable by $735 million.
GMLB Riders Liabilities
.
GMLB Riders liabilities represent our obligation to protect policyholders against the possibility that a downturn in the markets will reduce the specified benefits that can be claimed under the base annuity contract. Any periods of significant and/or sustained downturns in equity markets, increased equity volatility, or reduced interest rates could result in an increase in the valuation of the GMLB Riders liabilities. An increase in these liabilities would result in a decrease to our net income (loss), which could be significant.
The change in carrying value of GMLB Riders Liabilities resulted in a favorable impact on comparative results of $3.0 billion primarily due to lower charges related to the annual actuarial assumption review in the current year than in the prior year combined with favorable market impacts resulting from higher equity market performance partially offset by interest rates increasing less in the current period than in the prior period. Included in this amount is a decrease of $305 million in the fair value of our Shield Annuities embedded derivatives which have been included in the directly written liability results beginning in the third quarter of 2017 on a prospective basis. Excluding the impact of the annual actuarial assumption review, GMLB Riders Liabilities had an unfavorable impact on comparative results of $61 million.
124
GMLB Riders Hedging Program and Reinsurance.
We enter into freestanding derivatives, and to a lesser extent reinsurance, to hedge the market risks inherent in the GMLB Riders liabilities. However, certain of the risks inherent in the GMLB Riders liabilities are unhedged, including the adjustment for nonperformance risk. Generally, the same market factors that impact the fair value of the GMLB Riders liabilities impact the value of the hedges, though in the opposite direction. However, due to the complex nature of the business and any unhedged risks, the changes in fair value of the GMLB Riders liabilities and GMLB Riders hedges and reinsurance are not always in an equal amount.
The change in the fair value of GMLB Riders hedging program and reinsurance had an unfavorable impact on comparative results of $581 million primarily due to the inverse impact of the same equity market and interest rate factors that favorably impacted the GMLB Riders liabilities.
GMLB Riders Fees.
We earn fees on the GMLB Riders liabilities, which are calculated based on the policyholder’s Benefit Base. Fees calculated based on the Benefit Base are more stable in market downturns, compared to fees based on the account value because the Benefit Base excludes the impact of a decline in the market value of the policyholder’s account value. We use the fees directly earned from the GMLB Riders to fund the reserves, future claims and costs associated with the hedges of market risks inherent in the GMLB Riders liabilities. For GMLB Riders liabilities accounted for as embedded derivatives, the future fees are included in the fair value of the embedded derivative liabilities, with changes recorded in net derivative gains (losses). For GMLB Riders liabilities accounted for as insurance, while the related fees do affect the valuations of these liabilities, they are not included in the resulting liability values, but are recorded separately in universal life and investment-type policy fees. Fees from GMLB Riders were largely unchanged.
DAC Offsets.
DAC offsets, which are inversely related to the changes in certain components of the GMLB Riders discussed above, resulted in an unfavorable impact on comparative results by $1.1 billion. The DAC offset related to certain components of the directly written GMLB Riders is determined by the same factors that impact the respective component, but generally in the opposite direction. There is no DAC related to assumed reinsurance and, accordingly, no DAC offset. Excluding the impact of the annual actuarial assumption review, DAC offsets had an unfavorable impact on comparative results of $90 million.
Actuarial Assumption Review
.
As previously discussed, we review and update, on an annual basis, our long-term assumptions used in the calculations of the GMLB Riders liabilities. The annual actuarial assumption review, which is included in the amounts discussed above, resulted in a favorable impact on comparative results of $2.0 billion, primarily due to the following:
|
•
|
lower net derivative losses of $3.0 billion resulting from the prior period increase in GMLB Riders liabilities accounted for as embedded derivatives, of which $2.4 billion was primarily due to changes in behavioral assumptions regarding rider utilization and $571 million was due to changes in risk margins related to these behavioral assumption changes; and
|
|
•
|
a favorable change to comparative results of $521 million, recognized in net derivative gains (losses), from the current period adjustment for nonperformance risk resulting from a change in the assumption for the underlying credit spread being based on Brighthouse’s post-separation creditworthiness, instead of that of MetLife; partially offset by
|
|
•
|
unfavorable DAC amortization offsets of $1.1 billion primarily due to (i) the large offset benefit recorded in the prior period, (ii) an unfavorable offset adjustment in the current period related to the change in nonperformance risk and (iii) refinements in the current period to the amortization period; and
|
|
•
|
higher policyholder benefits and claims of $146 million resulting from net favorable changes in the prior period to GMLB Riders liabilities accounted for as insurance, of which $326 million was primarily due behavioral assumption changes, mainly relating to rider utilization, reduced by $180 million related to economic assumptions, primarily lower projected interest rates.
|
Year Ended December 31, 2016
Compared with the
Year Ended December 31, 2015
Comparative results from GMLB Riders were unfavorable by $2.7 billion. Of this amount, an unfavorable change of $3.7 billion was recorded in net derivative gains (losses). Excluding the impact of the annual actuarial assumption review, comparative results from GMLB Riders were unfavorable by $466 million.
GMLB Riders Liabilities.
The change in the carrying value of GMLB Riders liabilities resulted in an unfavorable impact on comparative results of $1.4 billion, primarily due to:
|
•
|
net derivative losses of $3.3 billion due to increased reserves resulting from non-market risks that generally cannot be hedged, primarily changes in actuarial assumptions related to policyholder behavior, mainly rider utilization, net of a favorable impact from the associated nonperformance risk adjustment, and the risk margins related to these policyholder behavior assumptions; partially offset by
|
125
|
•
|
a favorable adjustment to net derivative gains (losses) of $1.9 billion due to decreased reserves resulting from market factors, as higher equity market performance and a decrease in key equity market volatility measures, as compared to 2015, together with the impact from long-term interest rates increasing during 2016, compared to decreasing in 2015, resulted in a favorable change in our liabilities accounted for as embedded derivatives.
|
Excluding the impact of the actuarial assumption review, GMLB Riders liabilities had an unfavorable impact on comparative results of $1.6 billion.
GMLB Riders Hedging Program and Reinsurance.
The change in the fair value of GMLB Riders hedges and reinsurance had an unfavorable impact on comparative results of $2.6 billion, primarily due to the inverse effect on the hedges from the interest rate and equity market factors that impacted the GMLB Rider liabilities.
GMLB Riders Fees.
GMLB Riders fees increased by $10 million, primarily due to the impact from the roll-up of the average Benefit Base.
DAC Offsets.
DAC offsets, which are inversely related to the changes in certain components of GMLB Riders discussed above, resulted in a favorable impact on comparative results of $1.3 billion. Excluding the impact of the annual actuarial assumption review, DAC offsets had a favorable impact on comparative results of $552 million.
Actuarial Assumption Review.
As previously discussed, we review and update, on an annual basis, our long-term assumptions used in the calculations of the GMLB Riders liabilities. The annual assumption review, which is included in the amounts discussed above, resulted in an unfavorable impact on comparative results of $2.3 billion, primarily due to the following:
|
•
|
net derivative losses of $3.0 billion from an increase in GMLB Riders liabilities accounted for as embedded derivatives, of which $2.4 billion was primarily due to changes in behavioral assumptions regarding rider utilization and $571 million was due to changes in risk margins related to these behavioral assumption changes; and
|
|
•
|
higher policyholder benefits and claims resulting from an increase in GMLB Riders liabilities accounted for as insurance of $7 million, of which $250 million was due to unfavorable impacts of economic assumption changes mainly related to lower projected interest rates and long-term separate account returns, mostly offset by $247 million related to behavioral assumption changes, primarily regarding rider utilization; partially offset by
|
|
•
|
favorable DAC amortization offsets of $756 million, which are inversely related to the assumption changes above.
|
Effects of Inflation
Management believes that inflation has not had a material effect on the Company’s results of operations, except insofar as inflation may affect interest rates.
An increase in inflation could affect our business in several ways. During inflationary periods, the value of fixed income investments falls which could increase realized and unrealized losses. Inflation also increases expenses for labor and other materials, potentially putting pressure on profitability if such costs cannot be passed through in our product prices. Prolonged and elevated inflation could adversely affect the financial markets and the economy generally, and dispelling it may require governments to pursue a restrictive fiscal and monetary policy, which could constrain overall economic activity, inhibit revenue growth and reduce the number of attractive investment opportunities.
126
Investments
Investment Risks
Our primary investment objective is to optimize risk-adjusted net investment income and risk-adjusted total return while appropriately matching assets and liabilities. In addition, the investment process is designed to ensure that the portfolio has an appropriate level of liquidity, quality and diversification.
We are exposed to the following primary sources of investment risks:
|
•
|
credit risk, relating to the uncertainty associated with the continued ability of a given obligor to make timely payments of principal and interest;
|
|
•
|
interest rate risk, relating to the market price and cash flow variability associated with changes in market interest rates. Changes in market interest rates will impact the net unrealized gain or loss position of our fixed income investment portfolio and the rates of return we receive on both new funds invested and reinvestment of existing funds;
|
|
•
|
market valuation risk, relating to the variability in the estimated fair value of investments associated with changes in market factors such as credit spreads and equity market levels. A widening of credit spreads will adversely impact the net unrealized gain (loss) position of the fixed income investment portfolio, will increase losses associated with credit-based non-qualifying derivatives while we assume credit exposure, and, if credit spreads widen significantly or for an extended period of time, will likely result in higher OTTI. Credit spread tightening will reduce net investment income associated with new purchases of fixed maturity securities and will favorably impact the net unrealized gain (loss) position of the fixed income investment portfolio;
|
|
•
|
liquidity risk, relating to the diminished ability to sell certain investments, in times of strained market conditions;
|
|
•
|
real estate risk, relating to commercial, agricultural and residential real estate, and stemming from factors, which include, but are not limited to, market conditions, including the demand and supply of leasable commercial space, creditworthiness of borrowers and their tenants and joint venture partners, capital markets volatility and inherent interest rate movements; and
|
|
•
|
currency risk, relating to the variability in currency exchange rates for foreign denominated investments.
|
We manage these risks through asset-type allocation and industry and issuer diversification. Risk limits are also used to promote diversification by asset sector, avoid concentrations in any single issuer and limit overall aggregate credit and equity risk exposure. Real estate risk is managed through geographic and property type and product type diversification. We manage interest rate risk as part of our Asset Liability Management (“ALM”) strategies. Product design, such as the use of market value adjustment features and surrender charges, is also utilized to manage interest rate risk. These strategies include maintaining an investment portfolio with diversified maturities that targets a weighted average duration that reflects the duration of our estimated liability cash flow profile. For certain of our liability portfolios, it is not possible to invest assets to the full liability duration, thereby creating some asset/liability mismatch. We also use certain derivatives in the management of currency, credit, interest rate, and equity market risks.
Current Environment
Our business and results of operations are materially affected by conditions in capital markets and the economy, generally. As a U.S. insurance company, we are affected by the monetary policy of the Federal Reserve Board in the United States. In December 2017, the Federal Open Market Committee increased the federal funds rate, the third such increase in 2017. The Federal Reserve may take further actions to influence interest rates in the future, which may have an impact on the pricing levels of risk-bearing investments and may adversely impact the level of product sales. We are also affected by the monetary policy of central banks around the world due to the diversification of our investment portfolio. See “— Industry Trends — Financial and Economic Environment.”
Selected Country and Sector Investments
Recent elevated levels of market volatility have affected the performance of various asset classes. Contributing factors include concerns about economic conditions and capital markets; declining sales and increased online competition in the retail sector and recent country and sector specific volatility due to local economic and/or political concerns have affected the performance of certain of our investments. See “— Industry Trends — Financial and Economic Environment”
We have exposure to global market volatility, as we maintain general account investments in Puerto Rico, among other countries, through our global portfolio diversification. Our exposure to sovereign fixed maturity securities and total fixed maturity securities of Puerto Rico totaled $3 million and $20 million, at estimated fair value, respectively, at December 31, 2017.
127
There has been an increased market focus on retail sector investments as a result of declining sales and the effects of online competition. Our exposure to retail sector corporate fixed maturity securities was $1.5 billion, of which 95% were investment grade, with unrealized gains of $90 million at December 31, 2017.
We manage direct and indirect investment exposure in the selected countries and retail sectors through fundamental credit analysis and we continually monitor and adjust our level of investment exposure. We do not expect that our general account investments in these countries and retail sectors will have a material adverse effect on our results of operations or financial condition.
Current Environment Summary
All of these factors have had and could continue to have an adverse effect on the financial results of companies in the financial services industry, including us. Such global economic conditions, as well as the global financial markets, continue to impact our net investment income, net investment gains (losses), net derivative gains (losses), level of unrealized gains (losses) within the various asset classes in our investment portfolio, and our level of investment in lower yielding cash equivalents, short-term investments and government securities. See “— Industry Trends and Uncertainties” and “Risk Factors — Economic Environment and Capital Markets-Related Risks — We are exposed to significant financial and capital markets risks which may adversely affect our results of operations, financial condition and liquidity, and may cause our net investment income and net income to vary from period to period.”
Investment Portfolio Results
The table below presents the yield and adjusted net investment income for our investment portfolio. As described below, this table reflects certain differences from the presentation of net investment income presented in the GAAP statement of operations. This summary yield table presentation is consistent with how we measure our investment performance for management purposes, and we believe it enhances understanding of our investment portfolio results.
|
|
Years Ended December 31,
|
||||||||||||||||||||
|
|
2017
|
2016
|
2015
|
||||||||||||||||||
|
|
Yield% (1)
|
Amount
|
Yield% (1)
|
Amount
|
Yield% (1)
|
Amount
|
|||||||||||||||
|
|
(Dollars in millions)
|
||||||||||||||||||||
|
Investment income
|
4.59
|
%
|
$
|
3,319
|
|
4.93
|
%
|
$
|
3,609
|
|
5.12
|
%
|
$
|
3,413
|
|
||||||
|
Investment fees and expenses
|
(0.15
|
)
|
(109
|
)
|
(0.15
|
)
|
(107
|
)
|
(0.13
|
)
|
(85
|
)
|
|||||||||
|
Adjusted net investment income (2) (3)
|
4.44
|
%
|
$
|
3,210
|
|
4.78
|
%
|
$
|
3,502
|
|
4.99
|
%
|
$
|
3,328
|
|
||||||
_______________
|
(1)
|
Yields are calculated as investment income as a percent of average quarterly asset carrying values. Investment income excludes recognized gains and losses and reflects the adjustments presented in footnote (3) below to arrive at adjusted net investment income. Asset carrying values exclude unrealized gains (losses), collateral received in connection with our securities lending program, freestanding derivative assets, collateral received from derivative counterparties and the effects of consolidated securitization entities (“CSEs”).
|
|
(2)
|
Adjusted net investment income included in yield calculations includes Investment Hedge Adjustments.
|
|
(3)
|
Adjusted net investment income presented in the yield table varies from the most directly comparable GAAP measure due to certain reclassifications and adjustments and excludes the effects of CSEs, as presented below.
|
|
Years Ended December 31,
|
||||||||||||
|
|
2017
|
2016
|
2015
|
|||||||||
|
|
(In millions)
|
|||||||||||
|
Net investment income — GAAP consolidated statements of operations
|
$
|
3,078
|
|
$
|
3,207
|
|
$
|
3,099
|
|
|||
|
Investment hedge adjustments
|
131
|
|
298
|
|
237
|
|
||||||
|
Incremental net investment income from CSEs
|
1
|
|
(3
|
)
|
(8
|
)
|
||||||
|
Adjusted net investment income — in the above yield table
|
$
|
3,210
|
|
$
|
3,502
|
|
$
|
3,328
|
|
|||
See “— Results of Operations — Consolidated Results — Year Ended December 31,
2017
Compared with the Year Ended December 31,
2016
” and “— Results of Operations — Consolidated Results —Year Ended December 31,
2016
Compared with the Year Ended December 31,
2015
,” for an analysis of the year over year changes in net investment income.
128
Fixed Maturity and Equity Securities AFS
The following table presents fixed maturity and equity securities AFS by type (public or private) held at:
|
December 31, 2017
|
December 31, 2016
|
||||||||||||
|
Estimated Fair
Value
|
% of
Total
|
Estimated Fair
Value
|
% of
Total
|
||||||||||
|
(Dollars in millions)
|
|||||||||||||
|
Fixed maturity securities
|
|||||||||||||
|
Publicly-traded
|
$
|
54,332
|
|
83.6
|
%
|
$
|
51,437
|
|
83.8
|
%
|
|||
|
Privately-placed
|
10,659
|
|
16.4
|
|
9,951
|
|
16.2
|
|
|||||
|
Total fixed maturity securities
|
$
|
64,991
|
|
100.0
|
%
|
$
|
61,388
|
|
100.0
|
%
|
|||
|
Percentage of cash and invested assets
|
77.2
|
%
|
71.5
|
%
|
|||||||||
|
Equity securities
|
|||||||||||||
|
Publicly-traded
|
$
|
156
|
|
67.2
|
%
|
$
|
212
|
|
70.7
|
%
|
|||
|
Privately-held
|
76
|
|
32.8
|
|
88
|
|
29.3
|
|
|||||
|
Total equity securities
|
$
|
232
|
|
100.0
|
%
|
$
|
300
|
|
100.0
|
%
|
|||
|
Percentage of cash and invested assets
|
0.3
|
%
|
0.3
|
%
|
|||||||||
Valuation of Securities.
We engage MetLife Investment Advisors, LLC (“MLIA”), a related party investment manager, to execute on our valuation controls and policies to determine the estimated fair value of our investments. The estimated fair value of publicly-traded securities is determined after considering one of three primary sources of information: quoted market prices in active markets, independent pricing services, or independent broker quotations. The estimated fair value of privately-placed securities is determined after considering one of three primary sources of information: market standard internal matrix pricing, market standard internal discounted cash flow techniques, or independent pricing services (after the independent pricing services’ use of available observable market data is determined). For publicly-traded securities, the number of quotations obtained varies by instrument and depends on the liquidity of the particular instrument. Generally, prices are obtained from multiple pricing services to cover all asset classes and obtain multiple prices for certain securities, but ultimately use the price with the highest placement in the fair value hierarchy. Independent pricing services that value these instruments use market standard valuation methodologies based on data about market transactions and inputs from multiple pricing sources that are market observable or can be derived principally from or corroborated by observable market data. See
Note 8
of the Notes to the Consolidated and Combined Financial Statements for a discussion of the types of market standard valuation methodologies utilized and key assumptions and observable inputs used in applying these standard valuation methodologies. When a price is not available in the active market or through an independent pricing service, the security is priced primarily using non-binding quotations from independent brokers who are knowledgeable about these securities. Independent non-binding broker quotations use inputs that may be difficult to corroborate with observable market data. As shown in the following section, less than
1%
of our fixed maturity securities were valued using non-binding quotations from independent brokers at December 31,
2017
.
The Company is responsible for monitoring and providing the oversight over the valuation controls and policies, including reviewing and approving new transaction types and markets, for ensuring that observable market prices and market-based parameters are used for valuation, wherever possible, and for determining that valuation adjustments, when applied, are based upon established policies and are applied consistently over time. See
Note 8
of the Notes to the Consolidated and Combined Financial Statements for further information on our valuation controls and procedures including our formal process to challenge any prices received from independent pricing services that are not considered representative of estimated fair value.
We have reviewed the significance and observability of inputs used in the valuation methodologies to determine the appropriate fair value hierarchy level for each of our securities. Based on the results of this review and investment class analysis, each instrument is categorized as Level 1, 2 or 3 based on the lowest level significant input to its valuation. See
Note 8
of the Notes to the Consolidated and Combined Financial Statements for information regarding the valuation techniques and inputs by level within the three level fair value hierarchy by major classes of invested assets.
129
Fair Value of Fixed Maturity and Equity Securities – AFS
Fixed maturity and equity securities AFS measured at estimated fair value on a recurring basis and their corresponding fair value pricing sources are as follows:
|
|
December 31, 2017
|
December 31, 2016
|
||||||||||||||||||||||||||
|
|
Fixed Maturity Securities
|
Equity
Securities
|
Fixed Maturity Securities
|
Equity
Securities
|
||||||||||||||||||||||||
|
|
(Dollars in millions)
|
|||||||||||||||||||||||||||
|
Level 1
|
||||||||||||||||||||||||||||
|
Quoted prices in active markets for identical assets
|
$
|
8,304
|
|
12.8
|
%
|
$
|
18
|
|
7.8
|
%
|
$
|
6,210
|
|
10.1
|
%
|
$
|
39
|
|
13.0
|
%
|
||||||||
|
Level 2
|
||||||||||||||||||||||||||||
|
Independent pricing sources
|
52,847
|
|
81.3
|
|
90
|
|
38.8
|
|
50,654
|
|
82.5
|
|
124
|
|
41.3
|
|
||||||||||||
|
Internal matrix pricing or discounted cash flow techniques
|
608
|
|
0.9
|
|
—
|
|
—
|
|
405
|
|
0.7
|
|
—
|
|
—
|
|
||||||||||||
|
Significant other observable inputs
|
53,455
|
|
82.2
|
|
90
|
|
38.8
|
|
51,059
|
|
83.2
|
|
124
|
|
41.3
|
|
||||||||||||
|
Level 3
|
||||||||||||||||||||||||||||
|
Independent pricing sources
|
2,593
|
|
4.0
|
|
119
|
|
51.3
|
|
3,509
|
|
5.7
|
|
124
|
|
41.3
|
|
||||||||||||
|
Internal matrix pricing or discounted cash flow techniques
|
489
|
|
0.8
|
|
5
|
|
2.1
|
|
411
|
|
0.7
|
|
13
|
|
4.4
|
|
||||||||||||
|
Independent broker quotations
|
150
|
|
0.2
|
|
—
|
|
—
|
|
199
|
|
0.3
|
|
—
|
|
—
|
|
||||||||||||
|
Significant unobservable inputs
|
3,232
|
|
5.0
|
|
124
|
|
53.4
|
|
4,119
|
|
6.7
|
|
137
|
|
45.7
|
|
||||||||||||
|
Total estimated fair value
|
$
|
64,991
|
|
100.0
|
%
|
$
|
232
|
|
100.0
|
%
|
$
|
61,388
|
|
100.0
|
%
|
$
|
300
|
|
100.0
|
%
|
||||||||
See
Note 8
of the Notes to the Consolidated and Combined Financial Statements for the fixed maturity securities and equity securities AFS fair value hierarchy.
The composition of fair value pricing sources for and significant changes in Level 3 securities at December 31,
2017
are as follows:
|
•
|
The majority of the Level 3 fixed maturity and equity securities AFS were concentrated in three sectors: U.S. and foreign corporate securities and residential mortgage-backed securities (“RMBS”).
|
|
•
|
Level 3 fixed maturity securities are priced principally through market standard valuation methodologies, independent pricing services and, to a much lesser extent, independent non-binding broker quotations using inputs that are not market observable or cannot be derived principally from or corroborated by observable market data. Level 3 fixed maturity securities consist of less liquid securities with very limited trading activity or where less price transparency exists around the inputs to the valuation methodologies.
|
|
•
|
During the year ended December 31,
2017
, Level 3 fixed maturity securities decreased by $887 million, or 22%. The decrease was driven by net transfers out of Level 3 and sales in excess of purchases, partially offset by an increase in estimated fair value recognized in OCI.
|
See
Note 8
of the Notes to the Consolidated and Combined Financial Statements for a rollforward of the fair value measurements for fixed maturity securities and equity securities AFS measured at estimated fair value on a recurring basis using significant unobservable (Level 3) inputs; transfers into and/or out of Level 3; and further information about the valuation techniques and inputs by level by major classes of invested assets that affect the amounts reported above.
Fixed Maturity Securities AFS
See Notes
1
and
6
of the Notes to the Consolidated and Combined Financial Statements for information about fixed maturity securities AFS by sector, contractual maturities and continuous gross unrealized losses.
130
Fixed Maturity Securities Credit Quality — Ratings
The Securities Valuation Office of the NAIC evaluates the fixed maturity security investments of insurers for regulatory reporting and capital assessment purposes and assigns securities to one of six credit quality categories called “NAIC designations.” If no designation is available from the NAIC, then, as permitted by the NAIC, an internally developed designation is used. The NAIC designations are generally similar to the credit quality ratings of the NRSRO for fixed maturity securities, except for certain structured securities as described below. Rating agency ratings are based on availability of applicable ratings from rating agencies on the NAIC credit rating provider list, including Moody’s Investors Service, Inc. (“Moody’s”), S&P, Fitch, Dominion Bond Rating Service, A.M. Best, Kroll Bond Rating Agency, Egan Jones Ratings Company and Morningstar, Inc. (“Morningstar”). If no rating is available from a rating agency, then an internally developed rating is used.
The NAIC has adopted revised methodologies for certain structured securities comprised of non-agency RMBS, commercial mortgage-backed securities (“CMBS”) and asset backed securities (“ABS”). The NAIC’s objective with the revised methodologies for these structured securities was to increase the accuracy in assessing expected losses, and to use the improved assessment to determine a more appropriate capital requirement for such structured securities. The revised methodologies reduce regulatory reliance on rating agencies and allow for greater regulatory input into the assumptions used to estimate expected losses from structured securities. We apply the revised NAIC methodologies to structured securities held by our insurance subsidiaries that maintain the NAIC statutory basis of accounting. The NAIC’s present methodology is to evaluate structured securities held by insurers using the revised NAIC methodologies on an annual basis. If our insurance subsidiaries acquire structured securities that have not been previously evaluated by the NAIC, but are expected to be evaluated by the NAIC in the upcoming annual review, an internally developed designation is used until a final designation becomes available.
The following table presents total fixed maturity securities by NRSRO rating and the applicable NAIC designation from the NAIC published comparison of NRSRO ratings to NAIC designations, except for certain structured securities, which are presented using the revised NAIC methodologies, as well as the percentage, based on estimated fair value that each NAIC designation is comprised of at:
|
|
|
December 31, 2017
|
December 31, 2016
|
|||||||||||||||||||||||||||||
|
NAIC Designation
|
NRSRO Rating
|
Amortized
Cost
|
Unrealized
Gain (Loss)
|
Estimated Fair Value
|
% of
Total
|
Amortized
Cost
|
Unrealized
Gain (Loss)
|
Estimated Fair Value
|
% of
Total
|
|||||||||||||||||||||||
|
|
|
(Dollars in millions)
|
||||||||||||||||||||||||||||||
|
1
|
Aaa/Aa/A
|
$
|
42,098
|
|
$
|
3,631
|
|
$
|
45,729
|
|
70.4
|
%
|
$
|
41,070
|
|
$
|
2,112
|
|
$
|
43,182
|
|
70.3
|
%
|
|||||||||
|
2
|
Baa
|
15,137
|
|
1,113
|
|
16,250
|
|
25.0
|
|
14,730
|
|
547
|
|
15,277
|
|
24.9
|
|
|||||||||||||||
|
Subtotal investment grade
|
57,235
|
|
4,744
|
|
61,979
|
|
95.4
|
|
55,800
|
|
2,659
|
|
58,459
|
|
95.2
|
|
||||||||||||||||
|
3
|
Ba
|
2,102
|
|
63
|
|
2,165
|
|
3.3
|
|
2,156
|
|
10
|
|
2,166
|
|
3.5
|
|
|||||||||||||||
|
4
|
B
|
799
|
|
15
|
|
814
|
|
1.3
|
|
700
|
|
6
|
|
706
|
|
1.2
|
|
|||||||||||||||
|
5
|
Caa and lower
|
31
|
|
(2
|
)
|
29
|
|
—
|
|
54
|
|
(2
|
)
|
52
|
|
0.1
|
|
|||||||||||||||
|
6
|
In or near default
|
6
|
|
(2
|
)
|
4
|
|
—
|
|
5
|
|
—
|
|
5
|
|
—
|
|
|||||||||||||||
|
Subtotal below investment grade
|
2,938
|
|
74
|
|
3,012
|
|
4.6
|
|
2,915
|
|
14
|
|
2,929
|
|
4.8
|
|
||||||||||||||||
|
Total fixed maturity securities
|
$
|
60,173
|
|
$
|
4,818
|
|
$
|
64,991
|
|
100.0
|
%
|
$
|
58,715
|
|
$
|
2,673
|
|
$
|
61,388
|
|
100.0
|
%
|
||||||||||
131
The following tables present total fixed maturity securities, based on estimated fair value, by sector classification and by NRSRO rating and the applicable NAIC designations from the NAIC published comparison of NRSRO ratings to NAIC designations, except for certain structured securities, which are presented using the NAIC methodologies
as described above:
|
|
Fixed Maturity Securities — by Sector & Credit Quality Rating
|
||||||||||||||||||||||||||
|
NAIC Designation:
|
1
|
2
|
3
|
4
|
5
|
6
|
Total
Estimated
Fair Value
|
||||||||||||||||||||
|
NRSRO Rating:
|
Aaa/Aa/A
|
Baa
|
Ba
|
B
|
Caa and
Lower
|
In or Near
Default
|
|||||||||||||||||||||
|
|
(Dollars in millions)
|
||||||||||||||||||||||||||
|
December 31, 2017
|
|||||||||||||||||||||||||||
|
U.S. corporate
|
$
|
10,263
|
|
$
|
10,548
|
|
$
|
1,408
|
|
$
|
714
|
|
$
|
23
|
|
$
|
1
|
|
$
|
22,957
|
|
||||||
|
U.S. government and agency
|
16,111
|
|
181
|
|
—
|
|
—
|
|
—
|
|
—
|
|
16,292
|
|
|||||||||||||
|
RMBS
|
7,830
|
|
27
|
|
102
|
|
12
|
|
6
|
|
—
|
|
7,977
|
|
|||||||||||||
|
Foreign corporate
|
1,835
|
|
4,657
|
|
483
|
|
48
|
|
—
|
|
—
|
|
7,023
|
|
|||||||||||||
|
State and political subdivision
|
4,105
|
|
70
|
|
3
|
|
—
|
|
—
|
|
3
|
|
4,181
|
|
|||||||||||||
|
CMBS
|
3,423
|
|
—
|
|
—
|
|
—
|
|
—
|
|
—
|
|
3,423
|
|
|||||||||||||
|
ABS
|
1,538
|
|
258
|
|
33
|
|
—
|
|
—
|
|
—
|
|
1,829
|
|
|||||||||||||
|
Foreign government
|
624
|
|
509
|
|
136
|
|
40
|
|
—
|
|
—
|
|
1,309
|
|
|||||||||||||
|
Total fixed maturity securities
|
$
|
45,729
|
|
$
|
16,250
|
|
$
|
2,165
|
|
$
|
814
|
|
$
|
29
|
|
$
|
4
|
|
$
|
64,991
|
|
||||||
|
Percentage of total
|
70.4
|
%
|
25.0
|
%
|
3.3
|
%
|
1.3
|
%
|
—
|
%
|
—
|
%
|
100.0
|
%
|
|||||||||||||
|
December 31, 2016
|
|||||||||||||||||||||||||||
|
U.S. corporate
|
$
|
9,978
|
|
$
|
10,241
|
|
$
|
1,466
|
|
$
|
595
|
|
$
|
31
|
|
$
|
—
|
|
$
|
22,311
|
|
||||||
|
U.S. government and agency
|
12,920
|
|
170
|
|
—
|
|
—
|
|
—
|
|
—
|
|
13,090
|
|
|||||||||||||
|
RMBS
|
7,726
|
|
202
|
|
78
|
|
1
|
|
11
|
|
5
|
|
8,023
|
|
|||||||||||||
|
Foreign corporate
|
1,918
|
|
3,898
|
|
502
|
|
70
|
|
5
|
|
—
|
|
6,393
|
|
|||||||||||||
|
State and political subdivision
|
3,905
|
|
31
|
|
4
|
|
—
|
|
5
|
|
—
|
|
3,945
|
|
|||||||||||||
|
CMBS
|
3,812
|
|
—
|
|
—
|
|
—
|
|
—
|
|
—
|
|
3,812
|
|
|||||||||||||
|
ABS
|
2,343
|
|
278
|
|
31
|
|
—
|
|
—
|
|
—
|
|
2,652
|
|
|||||||||||||
|
Foreign government
|
580
|
|
457
|
|
85
|
|
40
|
|
—
|
|
—
|
|
1,162
|
|
|||||||||||||
|
Total fixed maturity securities
|
$
|
43,182
|
|
$
|
15,277
|
|
$
|
2,166
|
|
$
|
706
|
|
$
|
52
|
|
$
|
5
|
|
$
|
61,388
|
|
||||||
|
Percentage of total
|
70.3
|
%
|
24.9
|
%
|
3.5
|
%
|
1.2
|
%
|
0.1
|
%
|
—
|
%
|
100.0
|
%
|
|||||||||||||
U.S. and Foreign Corporate Fixed Maturity Securities
We maintain a diversified portfolio of corporate fixed maturity securities across industries and issuers. This portfolio does not have any exposure to any single issuer in excess of 1% of total investments and the top ten holdings in aggregate comprise 2% of total investments at both December 31, 2017 and 2016. The tables below present our U.S. and foreign corporate securities holdings by industry at:
|
|
December 31, 2017
|
December 31, 2016
|
|||||||||||
|
Estimated
Fair Value |
% of
Total |
Estimated
Fair
Value
|
% of
Total
|
||||||||||
|
(Dollars in millions)
|
|||||||||||||
|
Industrial
|
$
|
9,459
|
|
31.5
|
%
|
$
|
8,790
|
|
30.6
|
%
|
|||
|
Consumer
|
7,213
|
|
24.1
|
|
7,168
|
|
25.0
|
|
|||||
|
Finance
|
5,834
|
|
19.4
|
|
5,644
|
|
19.6
|
|
|||||
|
Utility
|
4,333
|
|
14.5
|
|
4,018
|
|
14.0
|
|
|||||
|
Communications
|
2,338
|
|
7.8
|
|
2,319
|
|
8.1
|
|
|||||
|
Other
|
803
|
|
2.7
|
|
765
|
|
2.7
|
|
|||||
|
Total
|
$
|
29,980
|
|
100.0
|
%
|
$
|
28,704
|
|
100.0
|
%
|
|||
132
Structured Securities
We held $13.2 billion and $14.5 billion of structured securities, at estimated fair value, at December 31, 2017 and 2016, respectively, as presented in the RMBS, CMBS and ABS sections below.
RMBS
The following table presents our RMBS holdings at:
|
|
December 31, 2017
|
December 31, 2016
|
||||||||||||||||||||
|
|
Estimated
Fair
Value
|
% of
Total
|
Net
Unrealized
Gains (Losses)
|
Estimated
Fair
Value
|
% of
Total
|
Net
Unrealized
Gains (Losses)
|
||||||||||||||||
|
|
(Dollars in millions)
|
|||||||||||||||||||||
|
By security type:
|
||||||||||||||||||||||
|
Collateralized mortgage obligations
|
$
|
4,623
|
|
58.0
|
%
|
$
|
219
|
|
$
|
5,505
|
|
68.6
|
%
|
$
|
49
|
|
||||||
|
Pass-through securities
|
3,354
|
|
42.0
|
|
9
|
|
2,518
|
|
31.4
|
|
13
|
|
||||||||||
|
Total RMBS
|
$
|
7,977
|
|
100.0
|
%
|
$
|
228
|
|
$
|
8,023
|
|
100.0
|
%
|
$
|
62
|
|
||||||
|
By risk profile:
|
||||||||||||||||||||||
|
Agency
|
$
|
5,439
|
|
68.1
|
%
|
$
|
46
|
|
$
|
4,771
|
|
59.5
|
%
|
$
|
8
|
|
||||||
|
Prime
|
333
|
|
4.2
|
|
22
|
|
389
|
|
4.8
|
|
16
|
|
||||||||||
|
Alt-A
|
1,185
|
|
14.9
|
|
93
|
|
1,585
|
|
19.8
|
|
21
|
|
||||||||||
|
Sub-prime
|
1,020
|
|
12.8
|
|
67
|
|
1,278
|
|
15.9
|
|
17
|
|
||||||||||
|
Total RMBS
|
$
|
7,977
|
|
100.0
|
%
|
$
|
228
|
|
$
|
8,023
|
|
100.0
|
%
|
$
|
62
|
|
||||||
|
Ratings profile:
|
||||||||||||||||||||||
|
Rated Aaa/AAA
|
$
|
5,553
|
|
69.6
|
%
|
$
|
4,955
|
|
61.8
|
%
|
||||||||||||
|
Designated NAIC 1
|
$
|
7,830
|
|
98.2
|
%
|
$
|
7,726
|
|
96.3
|
%
|
||||||||||||
See also “— Structured Securities — RMBS” for further information about collateralized mortgage obligations and pass-through mortgage-backed securities, as well as agency, prime, alternative residential mortgage loan and sub-prime RMBS.
Historically, we have managed our exposure to sub-prime RMBS holdings by focusing primarily on senior tranche securities, stress testing the portfolio with severe loss assumptions and closely monitoring the performance of the portfolio. Our sub-prime RMBS portfolio consists predominantly of securities that were purchased after 2012 at significant discounts to par value and discounts to the expected principal recovery value of these securities. The vast majority of these securities are investment grade under the NAIC designations (e.g., NAIC 1 and NAIC 2). The estimated fair value of our sub-prime RMBS holdings purchased since 2012 was $976 million and $1.2 billion at December 31, 2017 and 2016, respectively, with unrealized gains (losses) of $65 million and $17 million at December 31, 2017 and 2016, respectively.
133
CMBS
Our CMBS holdings are diversified by vintage year. The following tables present our CMBS holdings by rating agency rating and by vintage year at:
|
|
December 31, 2017
|
||||||||||||||||||||||||||||||||||||||||||||||
|
|
Aaa
|
Aa
|
A
|
Baa
|
Below Investment Grade
|
Total
|
|||||||||||||||||||||||||||||||||||||||||
|
|
Amortized
Cost
|
Estimated
Fair
Value
|
Amortized
Cost
|
Estimated
Fair
Value
|
Amortized
Cost
|
Estimated
Fair
Value
|
Amortized
Cost
|
Estimated
Fair
Value
|
Amortized
Cost
|
Estimated
Fair
Value
|
Amortized
Cost
|
Estimated
Fair
Value
|
|||||||||||||||||||||||||||||||||||
|
|
(Dollars in millions)
|
||||||||||||||||||||||||||||||||||||||||||||||
|
2003 - 2010
|
$
|
28
|
|
$
|
31
|
|
$
|
—
|
|
$
|
—
|
|
$
|
—
|
|
$
|
—
|
|
$
|
1
|
|
$
|
1
|
|
$
|
—
|
|
$
|
1
|
|
$
|
29
|
|
$
|
33
|
|
|||||||||||
|
2011
|
270
|
|
274
|
|
11
|
|
11
|
|
32
|
|
32
|
|
—
|
|
—
|
|
—
|
|
—
|
|
313
|
|
317
|
|
|||||||||||||||||||||||
|
2012
|
88
|
|
90
|
|
111
|
|
112
|
|
102
|
|
103
|
|
2
|
|
3
|
|
—
|
|
—
|
|
303
|
|
308
|
|
|||||||||||||||||||||||
|
2013
|
102
|
|
106
|
|
143
|
|
144
|
|
73
|
|
73
|
|
—
|
|
—
|
|
—
|
|
—
|
|
318
|
|
323
|
|
|||||||||||||||||||||||
|
2014
|
215
|
|
220
|
|
285
|
|
289
|
|
44
|
|
45
|
|
—
|
|
—
|
|
—
|
|
—
|
|
544
|
|
554
|
|
|||||||||||||||||||||||
|
2015
|
840
|
|
848
|
|
184
|
|
186
|
|
29
|
|
30
|
|
—
|
|
—
|
|
—
|
|
—
|
|
1,053
|
|
1,064
|
|
|||||||||||||||||||||||
|
2016
|
430
|
|
431
|
|
51
|
|
49
|
|
28
|
|
27
|
|
—
|
|
—
|
|
—
|
|
—
|
|
509
|
|
507
|
|
|||||||||||||||||||||||
|
2017
|
251
|
|
251
|
|
53
|
|
53
|
|
13
|
|
13
|
|
—
|
|
—
|
|
—
|
|
—
|
|
317
|
|
317
|
|
|||||||||||||||||||||||
|
Total
|
$
|
2,224
|
|
$
|
2,251
|
|
$
|
838
|
|
$
|
844
|
|
$
|
321
|
|
$
|
323
|
|
$
|
3
|
|
$
|
4
|
|
$
|
—
|
|
$
|
1
|
|
$
|
3,386
|
|
$
|
3,423
|
|
|||||||||||
|
Ratings Distribution
|
65.8
|
%
|
24.7
|
%
|
9.4
|
%
|
0.1
|
%
|
—
|
%
|
100.0
|
%
|
|||||||||||||||||||||||||||||||||||
|
|
December 31, 2016
|
||||||||||||||||||||||||||||||||||||||||||||||
|
|
Aaa
|
Aa
|
A
|
Baa
|
Below Investment Grade
|
Total
|
|||||||||||||||||||||||||||||||||||||||||
|
|
Amortized
Cost
|
Estimated
Fair
Value
|
Amortized
Cost
|
Estimated
Fair
Value
|
Amortized
Cost
|
Estimated
Fair
Value
|
Amortized
Cost
|
Estimated
Fair
Value
|
Amortized
Cost
|
Estimated
Fair
Value
|
Amortized
Cost
|
Estimated
Fair
Value
|
|||||||||||||||||||||||||||||||||||
|
|
(Dollars in millions)
|
||||||||||||||||||||||||||||||||||||||||||||||
|
2003 - 2010
|
$
|
93
|
|
$
|
95
|
|
$
|
15
|
|
$
|
15
|
|
$
|
—
|
|
$
|
1
|
|
$
|
—
|
|
$
|
—
|
|
$
|
3
|
|
$
|
3
|
|
$
|
111
|
|
$
|
114
|
|
|||||||||||
|
2011
|
273
|
|
279
|
|
12
|
|
12
|
|
32
|
|
32
|
|
—
|
|
—
|
|
—
|
|
—
|
|
317
|
|
323
|
|
|||||||||||||||||||||||
|
2012
|
111
|
|
114
|
|
121
|
|
123
|
|
102
|
|
104
|
|
2
|
|
2
|
|
—
|
|
—
|
|
336
|
|
343
|
|
|||||||||||||||||||||||
|
2013
|
156
|
|
160
|
|
147
|
|
149
|
|
71
|
|
70
|
|
—
|
|
—
|
|
—
|
|
—
|
|
374
|
|
379
|
|
|||||||||||||||||||||||
|
2014
|
316
|
|
319
|
|
323
|
|
327
|
|
54
|
|
54
|
|
—
|
|
—
|
|
—
|
|
—
|
|
693
|
|
700
|
|
|||||||||||||||||||||||
|
2015
|
1,051
|
|
1,048
|
|
238
|
|
237
|
|
51
|
|
51
|
|
—
|
|
—
|
|
—
|
|
—
|
|
1,340
|
|
1,336
|
|
|||||||||||||||||||||||
|
2016
|
536
|
|
529
|
|
64
|
|
62
|
|
28
|
|
26
|
|
—
|
|
—
|
|
—
|
|
—
|
|
628
|
|
617
|
|
|||||||||||||||||||||||
|
Total
|
$
|
2,536
|
|
$
|
2,544
|
|
$
|
920
|
|
$
|
925
|
|
$
|
338
|
|
$
|
338
|
|
$
|
2
|
|
$
|
2
|
|
$
|
3
|
|
$
|
3
|
|
$
|
3,799
|
|
$
|
3,812
|
|
|||||||||||
|
Ratings Distribution
|
66.7
|
%
|
24.2
|
%
|
8.9
|
%
|
0.1
|
%
|
0.1
|
%
|
100.0
|
%
|
|||||||||||||||||||||||||||||||||||
The tables above reflect rating agency ratings assigned by NRSROs, including Moody’s, S&P, Fitch and Morningstar. CMBS designated NAIC 1 were 100.0% of total CMBS at both December 31,
2017
and
2016
.
134
ABS
Our ABS are diversified both by collateral type and by issuer. The following table presents our ABS holdings at:
|
|
December 31, 2017
|
December 31, 2016
|
||||||||||||||||||||
|
|
Estimated
Fair
Value
|
% of
Total
|
Net
Unrealized
Gains (Losses)
|
Estimated
Fair
Value
|
% of
Total
|
Net
Unrealized
Gains (Losses)
|
||||||||||||||||
|
|
(Dollars in millions)
|
|||||||||||||||||||||
|
By collateral type:
|
||||||||||||||||||||||
|
Collateralized obligations
|
$
|
819
|
|
44.8
|
%
|
$
|
8
|
|
$
|
1,155
|
|
43.6
|
%
|
$
|
—
|
|
||||||
|
Consumer loans
|
262
|
|
14.3
|
|
3
|
|
319
|
|
12.0
|
|
(1
|
)
|
||||||||||
|
Automobile loans
|
189
|
|
10.3
|
|
—
|
|
356
|
|
13.4
|
|
1
|
|
||||||||||
|
Student loans
|
169
|
|
9.3
|
|
4
|
|
160
|
|
6.0
|
|
(4
|
)
|
||||||||||
|
Credit card loans
|
101
|
|
5.5
|
|
—
|
|
208
|
|
7.8
|
|
3
|
|
||||||||||
|
Other loans
|
289
|
|
15.8
|
|
4
|
|
454
|
|
17.2
|
|
(1
|
)
|
||||||||||
|
Total
|
$
|
1,829
|
|
100.0
|
%
|
$
|
19
|
|
$
|
2,652
|
|
100.0
|
%
|
$
|
(2
|
)
|
||||||
|
Ratings profile:
|
||||||||||||||||||||||
|
Rated Aaa/AAA
|
$
|
637
|
|
34.8
|
%
|
$
|
1,106
|
|
41.7
|
%
|
||||||||||||
|
Designated NAIC 1
|
$
|
1,538
|
|
84.1
|
%
|
$
|
2,343
|
|
88.3
|
%
|
||||||||||||
Evaluation of AFS Securities for OTTI and Evaluating Temporarily Impaired AFS Securities
See Note
6
of the Notes to the Consolidated and Combined Financial Statements for information about the evaluation of fixed maturity securities and equity securities AFS for OTTI and evaluation of temporarily impaired AFS securities.
OTTI Losses on Fixed Maturity and Equity Securities AFS Recognized in Earnings
See Note
6
of the Notes to the Consolidated and Combined Financial Statements for information about OTTI losses and gross gains and gross losses on AFS securities sold.
Overview of Fixed Maturity and Equity Security OTTI Losses Recognized in Earnings
Impairments of fixed maturity and equity securities were $5 million, $24 million and $34 million for the years ended December 31,
2017
,
2016
and
2015
, respectively. Impairments of fixed maturity securities were $1 million, $22 million and $31 million for the years ended December 31,
2017
,
2016
and
2015
, respectively. Impairments of equity securities were $4 million, $2 million and $3 million for the years ended December 31,
2017
,
2016
and
2015
, respectively.
Credit-related impairments of fixed maturity securities were $1 million, $20 million and $31 million for the years ended December 31,
2017
,
2016
and
2015
, respectively.
Explanations of changes in fixed maturity and equity securities impairments are as follows:
Year Ended December 31,
2017
Compared with the Year Ended December 31,
2016
Overall OTTI losses recognized in earnings on fixed maturity and equity securities were $5 million for the year ended December 31,
2017
as compared to $24 million for the year ended December 31,
2016
. A decrease of $16 million in OTTI losses on U.S. and foreign corporate industrial securities in the current period primarily reflects impairments on energy sector impairments in the prior period.
Year Ended December 31,
2016
Compared with the Year Ended December 31,
2015
Overall OTTI losses recognized in earnings on fixed maturity and equity securities were $24 million for the year ended December 31,
2016
as compared to $34 million for the year ended December 31,
2015
. A decrease of $8 million in OTTI losses on RMBS in the current period reflected the impact of improving economic and employment fundamentals.
Future Impairments
Future OTTI will depend primarily on economic fundamentals, issuer performance (including changes in the present value of future cash flows expected to be collected), and changes in credit ratings, collateral valuation, interest rates and credit spreads, as well as a change in our intention to hold or sell a security that is in an unrealized loss position. If economic fundamentals deteriorate or if there are adverse changes in the above factors, OTTI may be incurred in upcoming periods.
135
Securities Lending
We participate in a securities lending program whereby securities are loaned to third parties, primarily brokerage firms and commercial banks. We obtain collateral, usually cash, in an amount generally equal to 102% of the estimated fair value of the securities loaned, which is obtained at the inception of a loan and maintained at a level greater than or equal to 100% for the duration of the loan. We monitor the estimated fair value of the securities loaned on a daily basis with additional collateral obtained as necessary throughout the duration of the loan. Securities loaned under such transactions may be sold or repledged by the transferee. We are liable to return to our counterparties the cash collateral under our control. Security collateral received from counterparties may not be sold or repledged, unless the counterparty is in default, and is not reflected in the financial statements. These transactions are treated as financing arrangements and the associated cash collateral liability is recorded at the amount of the cash received.
See “— Liquidity and Capital Resources — The Company — Liquidity and Capital Uses — Securities Lending” and Note
6
of the Notes to the Consolidated and Combined Financial Statements for information regarding our securities lending program.
Mortgage Loans
Our mortgage loans are principally collateralized by commercial, agricultural and residential properties. Mortgage loans and the related valuation allowances are summarized as follows at:
|
|
December 31, 2017
|
December 31, 2016
|
||||||||||||||||||||||||||
|
|
Recorded
Investment |
% of
Total |
Valuation
Allowance |
% of
Recorded Investment |
Recorded
Investment |
% of
Total |
Valuation
Allowance |
% of
Recorded Investment |
||||||||||||||||||||
|
|
(Dollars in millions)
|
|||||||||||||||||||||||||||
|
Commercial
|
$
|
7,260
|
|
68.0
|
%
|
$
|
36
|
|
0.5
|
%
|
$
|
6,523
|
|
70.3
|
%
|
$
|
32
|
|
0.5
|
%
|
||||||||
|
Agricultural
|
2,276
|
|
21.3
|
|
7
|
|
0.3
|
%
|
1,892
|
|
20.4
|
|
5
|
|
0.3
|
%
|
||||||||||||
|
Residential
|
1,138
|
|
10.7
|
|
4
|
|
0.4
|
%
|
867
|
|
9.3
|
|
3
|
|
0.3
|
%
|
||||||||||||
|
Total
|
$
|
10,674
|
|
100.0
|
%
|
$
|
47
|
|
0.4
|
%
|
$
|
9,282
|
|
100.0
|
%
|
$
|
40
|
|
0.4
|
%
|
||||||||
The information presented in the tables herein exclude mortgage loans where we elected the fair value option (“FVO”). Such amounts are presented in Note
6
of the Notes to the Consolidated and Combined Financial Statements.
We diversify our mortgage loan portfolio by both geographic region and property type to reduce the risk of concentration. Of our commercial and agricultural mortgage loan portfolios, at December 31, 2017 and 2016, 97% and 96%, respectively, were collateralized by properties located in the U.S. and the remainder was collateralized by properties located outside of the U.S. The carrying value as a percentage of total commercial and agricultural mortgage loans for the top three states in the U.S. is as follows at:
|
December 31,
|
||||||
|
2017
|
2016
|
|||||
|
California
|
24
|
%
|
25
|
%
|
||
|
New York
|
15
|
%
|
15
|
%
|
||
|
Texas
|
9
|
%
|
9
|
%
|
||
Additionally, we manage risk when originating commercial and agricultural mortgage loans by generally lending up to 75% of the estimated fair value of the underlying real estate collateral.
136
We manage our residential mortgage loan portfolio in a similar manner to reduce risk of concentration. All residential mortgage loans were collateralized by properties located in the U.S. at both December 31, 2017 and 2016. The carrying value as a percentage of total residential mortgage loans for the top three states in the U.S. is as follows at:
|
December 31,
|
||||||
|
2017
|
2016
|
|||||
|
California
|
32
|
%
|
34
|
%
|
||
|
Florida
|
13
|
%
|
12
|
%
|
||
|
New York
|
8
|
%
|
8
|
%
|
||
Commercial Mortgage Loans by Geographic Region and Property Type.
Commercial mortgage loans are the largest component of the mortgage loan invested asset class. The tables below present the diversification across geographic regions and property types of commercial mortgage loans at:
|
|
December 31, 2017
|
December 31, 2016
|
|||||||||||
|
|
Amount
|
% of
Total
|
Amount
|
% of
Total
|
|||||||||
|
|
(Dollars in millions)
|
||||||||||||
|
Region
|
|||||||||||||
|
Pacific
|
$
|
1,955
|
|
26.9
|
%
|
$
|
1,748
|
|
26.8
|
%
|
|||
|
Middle Atlantic
|
1,699
|
|
23.4
|
|
1,445
|
|
22.1
|
|
|||||
|
South Atlantic
|
1,190
|
|
16.4
|
|
1,112
|
|
17.0
|
|
|||||
|
West South Central
|
777
|
|
10.7
|
|
686
|
|
10.5
|
|
|||||
|
East North Central
|
489
|
|
6.7
|
|
410
|
|
6.3
|
|
|||||
|
International
|
323
|
|
4.5
|
|
312
|
|
4.8
|
|
|||||
|
Mountain
|
266
|
|
3.7
|
|
258
|
|
4.0
|
|
|||||
|
New England
|
220
|
|
3.0
|
|
215
|
|
3.3
|
|
|||||
|
West North Central
|
130
|
|
1.8
|
|
102
|
|
1.6
|
|
|||||
|
East South Central
|
48
|
|
0.7
|
|
26
|
|
0.4
|
|
|||||
|
Multi-region and Other
|
163
|
|
2.2
|
|
209
|
|
3.2
|
|
|||||
|
Total recorded investment
|
7,260
|
|
100.0
|
%
|
6,523
|
|
100.0
|
%
|
|||||
|
Less: valuation allowances
|
36
|
|
32
|
|
|||||||||
|
Carrying value, net of valuation allowances
|
$
|
7,224
|
|
$
|
6,491
|
|
|||||||
|
Property Type
|
|||||||||||||
|
Office
|
$
|
3,246
|
|
44.7
|
%
|
$
|
2,975
|
|
45.6
|
%
|
|||
|
Retail
|
1,933
|
|
26.7
|
|
1,911
|
|
29.3
|
|
|||||
|
Apartment
|
968
|
|
13.3
|
|
630
|
|
9.7
|
|
|||||
|
Hotel
|
683
|
|
9.4
|
|
620
|
|
9.5
|
|
|||||
|
Industrial
|
385
|
|
5.3
|
|
339
|
|
5.2
|
|
|||||
|
Other
|
45
|
|
0.6
|
|
48
|
|
0.7
|
|
|||||
|
Total recorded investment
|
7,260
|
|
100.0
|
%
|
6,523
|
|
100.0
|
%
|
|||||
|
Less: valuation allowances
|
36
|
|
32
|
|
|||||||||
|
Carrying value, net of valuation allowances
|
$
|
7,224
|
|
$
|
6,491
|
|
|||||||
Mortgage Loan Credit Quality — Monitoring Process.
We monitor our mortgage loan investments on an ongoing basis, including a review of loans that are current, past due, restructured and under foreclosure. See Note
6
of the Notes to the Consolidated and Combined Financial Statements for information on mortgage loans by credit quality indicator, past due and nonaccrual mortgage loans, as well as impaired mortgage loans.
We review our commercial mortgage loans on an ongoing basis. These reviews may include an analysis of the property financial statements and rent roll, lease rollover analysis, property inspections, market analysis, estimated valuations of the underlying collateral, loan-to-value ratios, debt service coverage ratios and tenant creditworthiness. The monitoring process
137
focuses on higher risk loans, which include those that are classified as restructured, delinquent or in foreclosure, as well as loans with higher loan-to-value ratios and lower debt service coverage ratios. The monitoring process for agricultural mortgage loans is generally similar, with a focus on higher risk loans, such as loans with higher loan-to-value ratios, including reviews on a geographic and sector basis. We review our residential mortgage loans on an ongoing basis. See Note
6
of the Notes to the Consolidated and Combined Financial Statements for information on our evaluation of residential mortgage loans and related valuation allowance methodology.
Loan-to-value ratios and debt service coverage ratios are common measures in the assessment of the quality of commercial mortgage loans. Loan-to-value ratios are a common measure in the assessment of the quality of agricultural mortgage loans. Loan-to-value ratios compare the amount of the loan to the estimated fair value of the underlying collateral. A loan-to-value ratio greater than 100% indicates that the loan amount is greater than the collateral value. A loan-to-value ratio of less than 100% indicates an excess of collateral value over the loan amount. Generally, the higher the loan-to-value ratio, the higher the risk of experiencing a credit loss. The debt service coverage ratio compares a property’s net operating income to amounts needed to service the principal and interest due under the loan. Generally, the lower the debt service coverage ratio, the higher the risk of experiencing a credit loss. For our commercial mortgage loans, our average loan-to-value ratio was 51% and 49% at December 31, 2017 and 2016, respectively, and our average debt service coverage ratio was 2.3x and 2.2x at December 31, 2017 and 2016, respectively. The debt service coverage ratio, as well as the values utilized in calculating the ratio, is updated annually on a rolling basis, with a portion of the portfolio updated each quarter. In addition, the loan-to-value ratio is routinely updated for all but the lowest risk loans as part of our ongoing review of our commercial mortgage loan portfolio. For our agricultural mortgage loans, our average loan-to-value ratio was 43% and 40% at December 31, 2017 and 2016, respectively. The values utilized in calculating the agricultural mortgage loan loan-to-value ratio are developed in connection with the ongoing review of the agricultural loan portfolio and are routinely updated.
Mortgage Loan Valuation Allowances.
Our valuation allowances are established both on a loan specific basis for those loans considered impaired where a property specific or market specific risk has been identified that could likely result in a future loss, as well as for pools of loans with similar risk characteristics where a property specific or market specific risk has not been identified, but for which we expect to incur a loss. Accordingly, a valuation allowance is provided to absorb these estimated probable credit losses.
The determination of the amount of valuation allowances is based upon our periodic evaluation and assessment of known and inherent risks associated with our loan portfolios. Such evaluations and assessments are based upon several factors, including our experience for loan losses, defaults and loss severity, and loss expectations for loans with similar risk characteristics. These evaluations and assessments are revised as conditions change and new information becomes available, which can cause the valuation allowances to increase or decrease over time as such evaluations are revised. Negative credit migration, including an actual or expected increase in the level of problem loans, will result in an increase in the valuation allowance. Positive credit migration, including an actual or expected decrease in the level of problem loans, will result in a decrease in the valuation allowance.
See Notes
6
and
8
of the Notes to the Consolidated and Combined Financial Statements for information about how valuation allowances are established and monitored, activity in and balances of the valuation allowance, and the estimated fair value of impaired mortgage loans and related impairments included within net investment gains (losses) at and for the years ended December 31, 2017 and 2016.
Real Estate Joint Ventures
Real estate joint ventures is comprised of joint ventures with interests in single property income-producing real estate, and to a lesser extent joint ventures with interests in multi-property projects with varying strategies ranging from the development of properties to the operation of income-producing properties, as well as a runoff portfolio of real estate private equity funds. The carrying values of real estate joint ventures was $433 million and $215 million, or 0.5% and 0.3% of cash and invested assets, at December 31, 2017 and 2016, respectively.
The estimated fair value of the real estate joint venture investment portfolios was $594 million and $377 million at December 31, 2017 and 2016, respectively.
Other Limited Partnership Interests
Other limited partnership interests are comprised of private equity funds and hedge funds. The carrying value of other limited partnership interests was $1.7 billion and $1.6 billion at December 31, 2017 and 2016, respectively, which included $104 million and $210 million of hedge funds at December 31, 2017 and 2016, respectively. Cash distributions on these investments are generated from investment gains, operating income from the underlying investments of the funds and liquidation
138
of the underlying investments of the funds. We estimate that the underlying investments of the funds will typically be liquidated over the next two to 10 years.
Other Invested Assets
The following table presents the carrying value of our other invested assets by type at:
|
December 31, 2017
|
December 31, 2016
|
|||||||||||||
|
|
Carrying
Value
|
% of
Total
|
Carrying
Value
|
% of
Total
|
||||||||||
|
(Dollars in millions)
|
||||||||||||||
|
Freestanding derivatives with positive estimated fair values
|
$
|
2,254
|
|
92.6
|
%
|
$
|
3,622
|
|
73.9
|
%
|
||||
|
Loans to affiliates (primarily MetLife, Inc.) (1)
|
—
|
|
—
|
|
1,090
|
|
22.2
|
|
||||||
|
Tax credit and renewable energy partnerships
|
103
|
|
4.2
|
|
113
|
|
2.3
|
|
||||||
|
Leveraged leases, net of non-recourse debt
|
66
|
|
2.7
|
|
69
|
|
1.4
|
|
||||||
|
Other
|
13
|
|
0.5
|
|
10
|
|
0.2
|
|
||||||
|
Total
|
$
|
2,436
|
|
100.0
|
%
|
$
|
4,904
|
|
100.0
|
%
|
||||
_______________
|
(1)
|
In April 2017, MetLife, Inc. repaid its loans to the Company. See Note
6
of the Notes to the Consolidated and Combined Financial Statements.
|
Derivatives
Derivative Risks
We are exposed to various risks relating to our ongoing business operations, including interest rate, foreign currency exchange rate, credit and equity market. We use a variety of strategies to manage these risks, including the use of derivatives. See Note
7
of the Notes to the Consolidated and Combined Financial Statements:
|
•
|
A comprehensive description of the nature of our derivatives, including the strategies for which derivatives are used in managing various risks.
|
|
•
|
Information about the gross notional amount, estimated fair value, and primary underlying risk exposure of our derivatives by type of hedge designation, excluding embedded derivatives held at December 31, 2017, 2016 and 2015.
|
|
•
|
The statement of operations effects of derivatives in cash flow, fair value, or nonqualifying hedge relationships for the years ended December 31, 2017, 2016 and 2015.
|
See “Business — Segments and Corporate & Other — Annuities” and “Business — Risk Management Strategies — ULSG Market Risk Exposure Management” for more information about our use of derivatives by major hedge programs, as well as “— Results of Operations — Actuarial Assumption Review.”
Fair Value Hierarchy
See Note
7
of the Notes to the Consolidated and Combined Financial Statements for derivatives measured at estimated fair value on a recurring basis and their corresponding fair value hierarchy.
The valuation of Level 3 derivatives involves the use of significant unobservable inputs and generally requires a higher degree of management judgment or estimation than the valuations of Level 1 and Level 2 derivatives. Although Level 3 inputs are unobservable, management believes they are consistent with what other market participants would use when pricing such instruments and are considered appropriate given the circumstances. The use of different inputs or methodologies could have a material effect on the estimated fair value of Level 3 derivatives and could materially affect net income.
Derivatives categorized as Level 3 at December 31, 2017 include: credit default swaps priced using unobservable credit spreads, or that are priced through independent broker quotations; equity variance swaps with unobservable volatility inputs; and equity index options with unobservable correlation inputs. At December 31, 2017, 1% of the estimated fair value of our derivatives were priced through independent broker quotations.
See Note
8
of the Notes to Consolidated and Combined Financial Statements for a roll-forward of the fair value measurements for derivatives measured at estimated fair value on a recurring basis using significant unobservable (Level 3) inputs.
139
Credit Risk
See
Note 7
of the Notes to the Consolidated and Combined Financial Statements for information about how we manage credit risk related to derivatives and for the estimated fair value of our net derivative assets and net derivative liabilities after the application of master netting agreements and collateral.
Our policy is not to offset the fair value amounts recognized for derivatives executed with the same counterparty under the same master netting agreement. This policy applies to the recognition of derivatives on the balance sheets, and does not affect our legal right of offset.
Credit Derivatives
The following table presents the gross notional amount and estimated fair value of credit default swaps at:
|
December 31, 2017
|
December 31, 2016
|
|||||||||||||||
|
Gross Notional Amount
|
Estimated Fair Value
|
Gross Notional Amount
|
Estimated Fair Value
|
|||||||||||||
|
(In millions)
|
||||||||||||||||
|
Purchased
|
$
|
65
|
|
$
|
(1
|
)
|
$
|
37
|
|
$
|
—
|
|
||||
|
Written
|
1,900
|
|
40
|
|
1,913
|
|
28
|
|
||||||||
|
Total
|
$
|
1,965
|
|
$
|
39
|
|
$
|
1,950
|
|
$
|
28
|
|
||||
The maximum amount at risk related to our written credit default swaps is equal to the corresponding gross notional amount. In a replication transaction, we pair an asset on our balance sheet with a written credit default swap to synthetically replicate a corporate bond, a core asset holding of life insurance companies. Replications are entered into in accordance with the guidelines approved by insurance regulators and are an important tool in managing the overall corporate credit risk within the Company. In order to match our long-dated insurance liabilities, we will seek to buy long-dated corporate bonds. In some instances, these may not be readily available in the market, or they may be issued by corporations to which we already have significant corporate credit exposure. For example, by purchasing Treasury bonds (or other high-quality assets) and associating them with written credit default swaps on the desired corporate credit name, we, at times, can replicate the desired bond exposures and meet our ALM needs. In addition, given the shorter tenor of the credit default swaps (generally five-year tenors) versus a long-dated corporate bond, we have more flexibility in managing our credit exposures.
Embedded Derivatives
See
Note 8
of the Notes to the Consolidated and Combined Financial Statements for information about embedded derivatives measured at estimated fair value on a recurring basis and their corresponding fair value hierarchy.
See
Note 8
of the Notes to the Consolidated and Combined Financial Statements for a rollforward of the fair value measurements for net embedded derivatives measured at estimated fair value on a recurring basis using significant unobservable (Level 3) inputs.
See
Note 7
of the Notes to the Consolidated and Combined Financial Statements for information about the nonperformance risk adjustment included in the valuation of guaranteed minimum benefits accounted for as embedded derivatives.
See “— Summary of Critical Accounting Estimates — Derivatives” for further information on the estimates and assumptions that affect embedded derivatives.
Off-Balance Sheet Arrangements
Credit and Committed Facilities
On December 2, 2016, we entered into the Revolving Credit Facility and, on July 21, 2017, we entered into the 2017 Term Loan Facility. See
Note 9
of the Notes to the Consolidated and Combined Financial Statements for further information regarding the Revolving Credit Facility and the 2017 Term Loan Facility. For the classification of expenses on such credit and committed facilities and the nature of the associated liability for letters of credit issued and drawdowns on these credit and committed facilities, see
Note 9
of the Notes to the Consolidated and Combined Financial Statements.
Collateral for Securities Lending, Repurchase Programs and Derivatives
We participate in a securities lending program in the normal course of business for the purpose of enhancing the total return on our investment portfolio. Periodically we receive non-cash collateral for securities lending from counterparties, which cannot be sold or repledged, and which is not recorded on our balance sheets. The amount of this collateral was
$29 million
and
$27
140
million
at estimated fair value at December 31, 2017 and 2016, respectively. See
Note 6
of the Notes to the Consolidated and Combined Financial Statements, as well as “— Investments — Securities Lending” for discussion of our securities lending program, the classification of revenues and expenses, and the nature of the secured financing arrangement and associated liability.
From time to time we participate in repurchase and reverse repurchase programs. In connection with these transactions, we obtain fixed maturity securities as collateral from unaffiliated financial institutions, which can be repledged, and which are not recorded on our balance sheets. We had no pledged or repledged securities at either December 31, 2017 or December 31, 2016.
We enter into derivatives to manage various risks relating to our ongoing business operations. We have non-cash collateral from counterparties for derivatives, which can be sold or repledged subject to certain constraints, and which has not been recorded on our balance sheets. The amount of this non-cash collateral was
$368 million
and $564 million at December 31, 2017 and 2016, respectively. See
Note 7
of the Notes to the Consolidated and Combined Financial Statements and “— Liquidity and Capital Resources — The Company — Liquidity and Capital Uses — Pledged Collateral” for information regarding the earned income on and the gross notional amount, estimated fair value of assets and liabilities and primary underlying risk exposure of our derivatives.
Guarantees
See “Guarantees” in
Note 15
of the Notes to the Consolidated and Combined Financial Statements.
Other
Additionally, we enter into commitments in the normal course of business for the purpose of enhancing the total return on our investment portfolio: mortgage loan commitments and commitments to fund partnerships, bank credit facilities and private corporate bond investments. See “Net Investment Income” and “Net Investment Gains (Losses)” in
Note 6
of the Notes to the Consolidated and Combined Financial Statements for information on the investment income, investment expense, gains and losses from such investments. See also “— Investments — Fixed Maturity and Equity Securities AFS” and “— Investments — Mortgage Loans” for information on our investments in fixed maturity securities and mortgage loans. See “— Investments — Real Estate and Real Estate Joint Ventures” and “— Investments — Other Limited Partnership Interests” for information on our partnership investments.
Other than the commitments disclosed in
Note 15
of the Notes to the Consolidated and Combined Financial Statements, there are no other material obligations or liabilities arising from the commitments to fund mortgage loans, partnerships, bank credit facilities, and private corporate bond investments. For further information on commitments to fund partnership investments, mortgage loans, bank credit facilities and private corporate bond investments. See “— Liquidity and Capital Resources — The Company — Contractual Obligations.”
Policyholder Liabilities
We establish, and carry as liabilities, actuarially determined amounts that are calculated to meet policy obligations or to provide for future annuity payments. Amounts for actuarial liabilities are computed and reported in the financial statements in conformity with GAAP. For more details on policyholder liabilities. See “— Summary of Critical Accounting Estimates.”
Due to the nature of the underlying risks and the uncertainty associated with the determination of actuarial liabilities, we cannot precisely determine the amounts that will ultimately be paid with respect to these actuarial liabilities, and the ultimate amounts may vary from the estimated amounts, particularly when payments may not occur until well into the future.
We periodically review the assumptions supporting our estimates of actuarial liabilities for future policy benefits. We revise estimates, to the extent permitted or required under GAAP, if we determine that future expected experience differs from assumptions used in the development of actuarial liabilities. We charge or credit changes in our liabilities to expenses in the period the liabilities are established or re-estimated. If the liabilities originally established for future benefit payments prove inadequate, we must increase them. Such an increase could adversely affect our earnings and have a material adverse effect on our business, results of operations and financial condition.
We have experienced, and will likely in the future experience, catastrophe losses and possibly acts of terrorism, as well as turbulent financial markets that may have an adverse impact on our business, results of operations, and financial condition. Due to their nature, we cannot predict the incidence, timing, severity or amount of losses from catastrophes and acts of terrorism, but we make broad use of catastrophic and non-catastrophic reinsurance to manage risk from these perils.
Future Policy Benefits
We establish liabilities for amounts payable under insurance policies. See “— Summary of Critical Accounting Estimates — Liability for Future Policy Benefits” and Notes
1
and
3
of the Notes to the Consolidated and Combined Financial Statements. A discussion of future policy benefits by segment, as well as Corporate & Other follows.
141
Annuities
Future policy benefits for the annuities business are comprised mainly of liabilities for life-contingent income annuities, and liabilities for the variable annuity guaranteed minimum benefits accounted for as insurance.
Life
Future policy benefits for the life business are comprised mainly of liabilities for traditional life and for universal and variable life insurance contracts. In order to manage risk, we have often reinsured a portion of the mortality risk on life insurance policies. The reinsurance programs are routinely evaluated and this may result in increases or decreases to existing coverage. We have entered into various derivative positions, primarily interest rate swaps, to mitigate the risk that investment of premiums received and reinvestment of maturing assets over the life of the policy will be at rates below those assumed in the original pricing of these contracts.
Run-off
Future policy benefits primarily include liabilities for structured settlement annuities and pension risk transfers. There is no interest rate crediting flexibility on the liabilities for payout annuities. As a result, a sustained low interest rate environment could negatively impact earnings; however, we mitigate our risks by applying various ALM strategies, including the use of derivative positions, primarily interest rate swaps, to mitigate the risks associated with such a scenario.
Corporate & Other
Future policy benefits primarily include liabilities for certain run-off long-term care and workers’ compensation business. Additionally, future policy benefits historically included liabilities for variable annuity guaranteed minimum benefits assumed from a former operating joint venture in Japan that were accounted for as insurance prior to 2014.
Policyholder Account Balances
Policyholder account balances are generally equal to the account value, which includes accrued interest credited, but excludes the impact of any applicable charge that may be incurred upon surrender. See “— Variable Annuity Guarantees” and “Quantitative and Qualitative Disclosures About Market Risk — Market Risk — Fair Value Exposures — Interest Rates.” See Notes
1
and
3
of the Notes to the Consolidated and Combined Financial Statements for additional information for a discussion of policyholder account balances by segment, as well as Corporate & Other, follows.
Annuities
Policyholder account balances for annuities are held for fixed deferred annuities, the fixed account portion of variable annuities, and non-life contingent income annuities. Interest is credited to the policyholder’s account at interest rates we determine which are influenced by current market rates, subject to specified minimums. A sustained low interest rate environment could negatively impact earnings as a result of the minimum credited rate guarantees present in most of these policyholder account balances. We have various derivative positions, including interest rate floors, to partially mitigate the risks associated with such a scenario. Additionally, policyholder account balances are held for variable annuity guaranteed minimum living benefits that are accounted for as embedded derivatives.
The following table presents the breakdown of account value subject to minimum guaranteed crediting rates for Annuities at:
|
|
December 31, 2017
|
December 31, 2016
|
|||||||||||||
|
Account
Value (1)
|
Account Value at Guarantee (1)
|
Account
Value (1)
|
Account Value at Guarantee (1)
|
||||||||||||
|
|
(In millions)
|
||||||||||||||
|
Greater than 0% but less than 2%
|
$
|
1,436
|
|
$
|
915
|
|
$
|
1,535
|
|
$
|
1,047
|
|
|||
|
Equal to 2% but less than 4%
|
$
|
15,158
|
|
$
|
13,706
|
|
$
|
15,966
|
|
$
|
14,513
|
|
|||
|
Equal to or greater than 4%
|
$
|
544
|
|
$
|
544
|
|
$
|
571
|
|
$
|
571
|
|
|||
______________
|
(1)
|
These amounts are not adjusted for policy loans.
|
As a result of acquisitions, we establish additional liabilities known as excess interest reserves for policies with credited rates in excess of market rates as of the applicable acquisition dates. Excess interest reserves for Annuities were $297 million and $317 million at December 31, 2017 and 2016, respectively.
142
Life
Life policyholder account balances are held for retained asset accounts, universal life policies and the fixed account of universal variable life insurance policies. Interest is credited to the policyholder’s account at interest rates we determine which are influenced by current market rates, subject to specified minimums. A sustained low interest rate environment could negatively impact earnings as a result of the minimum credited rate guarantees present in most of these policyholder account balances. We have various derivative positions, including interest rate floors, to partially mitigate the risks associated with such a scenario.
The following table presents the breakdown of account value subject to minimum guaranteed crediting rates for Life at:
|
|
December 31, 2017
|
December 31, 2016
|
||||||||||||||
|
Account
Value (1)
|
Account Value at Guarantee (1)
|
Account
Value (1)
|
Account Value at Guarantee (1)
|
|||||||||||||
|
|
(In millions)
|
|||||||||||||||
|
Greater than 0% but less than 2%
|
$
|
128
|
|
$
|
128
|
|
$
|
185
|
|
$
|
185
|
|
||||
|
Equal to 2% but less than 4%
|
$
|
1,156
|
|
$
|
551
|
|
$
|
1,266
|
|
$
|
590
|
|
||||
|
Equal to or greater than 4%
|
$
|
1,963
|
|
$
|
1,963
|
|
$
|
2,035
|
|
$
|
1,668
|
|
||||
_______________
|
(1)
|
These amounts are not adjusted for policy loans.
|
As a result of acquisitions, we establish additional liabilities known as excess interest reserves for policies with credited rates in excess of market rates as of the applicable acquisition dates. Excess interest reserves for Life were $28 million and $27 million at December 31, 2017 and 2016, respectively.
Run-off
Policyholder account balances in Run-off are comprised of funding agreements and COLI. Interest crediting rates vary by type of contract, and can be fixed or variable. Variable interest crediting rates are generally tied to an external index, most commonly (one-month or three-month) London InterBank Offered Rate (“LIBOR”). We are exposed to interest rate risks, when guaranteeing payment of interest and return on principal at the contractual maturity date. We may invest in floating rate assets or enter into receive-floating rate swaps, also tied to external indices, as well as caps, to mitigate the impact of changes in market interest rates. We also mitigate our risks by applying various ALM strategies.
The following table presents the breakdown of account value subject to minimum guaranteed crediting rates for Run-off as of:
|
|
December 31, 2017
|
December 31, 2016
|
||||||||||||||
|
Account
Value (1)
|
Account Value at Guarantee (1)
|
Account
Value (1)
|
Account Value at Guarantee (1)
|
|||||||||||||
|
|
(In millions)
|
|||||||||||||||
|
Universal Life Secondary Guarantee
|
||||||||||||||||
|
Greater than 0% but less than 2%
|
$
|
—
|
|
$
|
—
|
|
$
|
—
|
|
$
|
—
|
|
||||
|
Equal to 2% but less than 4%
|
$
|
5,695
|
|
$
|
790
|
|
$
|
5,618
|
|
$
|
146
|
|
||||
|
Equal to or greater than 4%
|
$
|
591
|
|
$
|
591
|
|
$
|
633
|
|
$
|
102
|
|
||||
_______________
|
(1)
|
Th
ese amounts are not adjusted for policy loans.
|
As a result of acquisitions, we establish additional liabilities known as excess interest reserves for policies with credited rates in excess of market rates as of the applicable acquisition dates. Excess interest reserves for Run-off were $64 million and $73 million at December 31, 2017 and 2016, respectively.
Corporate & Other
Policyholder account balances were historically held for variable annuity guaranteed minimum benefits assumed from a former operating joint venture in Japan that were accounted for as embedded derivatives prior to 2014.
143
Variable Annuity Guarantees
We issue directly and assume from an affiliate through reinsurance certain variable annuity products with guaranteed minimum benefits that provide the policyholder a minimum return based on their initial deposit (i.e., the Benefit Base) less withdrawals. In some cases, the Benefit Base may be increased by additional deposits, bonus amounts, accruals or optional market value step-ups.
Certain of our variable annuity guarantee features are accounted for as insurance liabilities and recorded in future policy benefits while others are accounted for at fair value as embedded derivatives and recorded in policyholder account balances. Generally speaking, a guarantee is accounted for as an insurance liability if the guarantee is paid only upon either (i) the occurrence of a specific insurable event, or (ii) annuitization. Alternatively, a guarantee is accounted for as an embedded derivative if a guarantee is paid without requiring (i) the occurrence of specific insurable event, or (ii) the policyholder to annuitize, that is, the policyholder can receive the guarantee on a net basis. In certain cases, a guarantee may have elements of both an insurance liability and an embedded derivative and in such cases the guarantee is split and accounted for under both models. Further, changes in assumptions, principally involving behavior, can result in a change of expected future cash outflows of a guarantee between portions accounted for as insurance liabilities and portions accounted for as embedded derivatives.
Guarantees accounted for as insurance liabilities in future policy benefits include GMDBs, the life contingent portion of the GMWBs and the portion of the GMIBs that require annuitization, as well as the life contingent portion of the expected annuitization when the policyholder is forced into an annuitization upon depletion of their account value.
These insurance liabilities are accrued over the accumulation phase of the contract in proportion to actual and future expected policy assessments based on the level of guaranteed minimum benefits generated using multiple scenarios of separate account returns. The scenarios are based on best estimate assumptions consistent with those used to amortize DAC. When current estimates of future benefits exceed those previously projected or when current estimates of future assessments are lower than those previously projected, liabilities will increase, resulting in a current period charge to net income. The opposite result occurs when the current estimates of future benefits are lower than those previously projected or when current estimates of future assessments exceed those previously projected. At each reporting period, we update the actual amount of business remaining in-force, which impacts expected future assessments and the projection of estimated future benefits resulting in a current period charge or increase to earnings. See
Note 3
of the Notes to the Consolidated and Combined Financial Statements for additional details of guarantees accounted for as insurance liabilities.
Guarantees accounted for as embedded derivatives in policyholder account balances include the non-life contingent portion of GMWBs, GMABs, and for GMIBs the non-life contingent portion of the expected annuitization when the policyholder is forced into an annuitization upon depletion of their account value, as well as the Guaranteed Principal Option.
The estimated fair values of guarantees accounted for as embedded derivatives are determined based on the present value of projected future benefits minus the present value of projected future fees. At policy inception, we attribute to the embedded derivative a portion of the projected future guarantee fees to be collected from the policyholder equal to the present value of projected future guaranteed benefits. Any additional fees represent “excess” fees and are reported in universal life and investment-type product policy fees. In valuing the embedded derivative, the percentage of fees included in the fair value measurement is locked-in at inception.
The projections of future benefits and future fees require capital market and actuarial assumptions including expectations concerning policyholder behavior. A risk neutral valuation methodology is used to project the cash flows from the guarantees under multiple capital market scenarios to determine an economic liability. The reported estimated fair value is then determined by taking the present value of these risk-free generated cash flows using a discount rate that incorporates a spread over the risk-free rate to reflect our nonperformance risk and adding a risk margin. For more information on the determination of estimated fair value. See
Note 8
of the Notes to the Consolidated and Combined Financial Statements.
Liquidity and Capital Resources
Liquidity refers to our ability to generate adequate cash flows from our normal operations to meet the cash requirements of our operating, investing and financing activities. Capital refers to our long-term financial resources available to support our business operations and contribute to future growth. Our ability to generate and maintain sufficient liquidity and capital depends on the profitability of the businesses, timing of cash flows on investments and products, general economic conditions and access to the Revolving Credit Facility and the Term Loan Facility described below and access to the capital markets and the alternate sources of liquidity and capital described herein.
Parent Company
144
Liquidity
In evaluating liquidity it is important to distinguish the cash flow needs of the parent company, Brighthouse Financial, Inc., from the cash flow needs of the combined group of companies. Brighthouse Financial, Inc. is largely dependent on cash flows from its insurance subsidiaries to meet its obligations. The principal sources of funds available to Brighthouse Financial, Inc. will include dividends and returns of capital from its insurance and non-insurance subsidiaries, as well as its own cash and short-term investments. Such funds are paid to Brighthouse Financial, Inc. by BH Holdings, its direct wholly-owned holding company subsidiary. These sources of funds may also be supplemented by alternate sources of liquidity either directly or indirectly through our insurance subsidiaries. For example, we have established internal liquidity facilities to provide liquidity within and across our regulated and non-regulated entities to support our businesses. See Note 2 of the Schedule II — Condensed Financial Information (Parent Company Only).
Liquid Assets and Short-term Liquidity
An integral part of our liquidity management includes managing our levels of short-term liquidity and liquid assets. Short-term liquidity and liquid assets are made available from the issuance of the Senior Notes and from drawdowns under the 2017 Term Loan Facility. In addition, any undrawn capacity under our Revolving Credit Facility is a potential source of liquidity. In order to manage our capital more efficiently, we have also established internal liquidity facilities to provide liquidity within and across the combined group of companies. See Note 3 of the Notes to the Condensed Financial Information included in Schedule II.
At December 31, 2017 and 2016, Brighthouse Financial, Inc. and certain of its non-insurance subsidiaries had $656 million and $102 million, respectively, in liquid assets. Of these amounts, $563 million and $0 were held by Brighthouse Financial, Inc. at December 31, 2017 and 2016, respectively. Liquid assets include cash and cash equivalents, short-term investments and publicly-traded securities excluding assets that are pledged or otherwise committed. Assets pledged or otherwise committed include amounts received in connection with derivatives and collateral financing arrangements.
Non-insurance company liquid assets are generated through borrowings, as well as through dividends and returns of capital from insurance subsidiaries, offset by payments for certain services provided from our insurance and non-insurance subsidiaries, which include, but are not limited to, executive oversight, treasury, finance, legal, human resources, tax planning, internal audit, financial reporting, information technology, distribution services and investor relations. Insurance subsidiary dividends are subject to local insurance regulatory requirements, as discussed in “— The Company — Capital — Restrictions on Dividends and Returns of Capital from Insurance Subsidiaries.”
At December 31, 2017 and 2016, Brighthouse Financial, Inc. and certain of its non-insurance subsidiaries had $419 million and $122 million, respectively in short-term liquidity. Short-term liquidity includes cash and cash equivalents and short-term investments, excluding assets that are pledged or otherwise committed, including amounts received in connection with securities lending, repurchase agreements, derivatives and secured borrowings.
Constraints on Parent Company Liquidity
Constraints on Brighthouse Financial, Inc.’s liquidity may occur as a result of operational demands and/or as a result of compliance with regulatory requirements. For example, we may be constrained in the payment of dividends from our insurance subsidiaries pursuant to reserving requirements under actuarial guidelines whereby we are required to calculate the statutory reserves which support our variable annuity products in conformity with AG 43.
As previously discussed, we intend to support our variable annuity contracts with assets which are $2.0 billion to $3.0 billion in excess of the amount of assets required under CTE95, for which we anticipate that the assets we hold to support our variable annuity contracts at CTE95 under our Base Case Scenario will exceed the amount required by AG 43 in the near term. Under this scenario, we then anticipate that beginning in approximately 2021 under AG 43 as currently in effect the Standard Scenario Reserve Amount will exceed the amount that would be required to be held consistent with CTE95 (although still less than CTE95 plus $2.0 billion to $3.0 billion), and that the amount of such excess will increase materially in subsequent years.
During the period that the AG 43 reserving requirement materially exceeds CTE95, our insurance subsidiaries’ RBC ratios and surplus will be adversely affected to the extent we make distributions to our shareholders. Notwithstanding this impact, and although no assurances can be given, under our Base Case Scenario we believe that during this period our excess reserving requirements under the standard scenario will not impair our ability to make any such distributions as contemplated by our Base Case Scenario while still maintaining our Combined RBC ratio, surplus and financial strength ratings at levels necessary to market and sell our products in accordance with our business plan. Furthermore, if anticipated regulatory reform fails to bring
145
AG 43 calculations in line with CTE90 calculations, we may seek regulatory relief or engage in transactions, including restructuring or financing transactions, to mitigate the effect of the standard scenario on the surplus and RBC ratios of our insurance subsidiaries.
Capital
We expect to maintain adequate liquidity at Brighthouse Financial, Inc., a debt-to-capital ratio of approximately 25% and a funding of $2.0 billion to $3.0 billion of assets in excess of CTE95 to support our variable annuity contracts during normal markets. We monitor our financial leverage ratio based on an average of our key leverage calculations of A.M. Best, Fitch, Moody’s and S&P. At December 31, 2017, assets above CTE95 were $2.6 billion.
We may opportunistically look to pursue additional debt financing over time to reach our targeted debt-to-capital ratio of 25% and to refinance borrowings outstanding under our 2017 Term Loan Facility. Such debt financing may include the incurrence of term loans or the issuance of senior or subordinated debt securities. There can be no assurance that we will be able to complete any such debt financing transactions on terms and conditions favorable to us or at all.
We do not currently anticipate declaring or paying regular cash dividends or making other distributions on our common stock in the near term. Any future declaration and payment of dividends or other distributions of capital will be at the discretion of our Board of Directors and will depend on and be subject to our financial condition, results of operations, earnings, cash needs, regulatory and other constraints, capital requirements (including capital requirements of our subsidiaries), contractual restrictions and any other factors that our Board of Directors deems relevant in making such a determination, including, without limitation, the Company’s continued development as a standalone public company. Therefore, there can be no assurance that we will pay any dividends or make other distributions on our common stock, or as to the amount of any such dividends or distributions of capital.
See also “— The Company — Capital” for a discussion of how we manage our capital for the combined group of companies.
The Company
Sources and Uses of Liquidity and Capital
Our principal sources of liquidity are insurance premiums and annuity considerations, net investment income and proceeds from the maturity and sale of investments. The primary uses of these funds are investing activities, payments of policyholder benefits, commissions and operating expenses, and contract maturities, withdrawals and surrenders.
146
Summary of the Primary Sources and Uses of Liquidity and Capital
The following table presents a summary of the primary sources and uses of liquidity and capital:
|
Years Ended December 31,
|
|||||||||||
|
2017
|
2016
|
2015
|
|||||||||
|
(In millions)
|
|||||||||||
|
Sources:
|
|||||||||||
|
Operating activities, net
|
$
|
3,396
|
|
$
|
3,736
|
|
$
|
4,631
|
|
||
|
Investing activities, net
|
—
|
|
4,674
|
|
—
|
|
|||||
|
Changes in policyholder account balances, net
|
1,887
|
|
—
|
|
—
|
|
|||||
|
Changes in payables for collateral under securities loaned and other transactions, net
|
—
|
|
—
|
|
3,126
|
|
|||||
|
Long-term debt issued
|
3,588
|
|
—
|
|
175
|
|
|||||
|
Cash received from MetLife, Inc. in connection with shareholder’s net investment
|
293
|
|
1,833
|
|
406
|
|
|||||
|
Total sources
|
9,164
|
|
10,243
|
|
8,338
|
|
|||||
|
Uses:
|
|||||||||||
|
Investing activities, net
|
3,915
|
|
—
|
|
7,042
|
|
|||||
|
Changes in policyholder account balances, net
|
—
|
|
1,667
|
|
225
|
|
|||||
|
Changes in payables for collateral under securities loaned and other transactions, net
|
3,147
|
|
3,247
|
|
—
|
|
|||||
|
Long-term debt repaid
|
13
|
|
26
|
|
235
|
|
|||||
|
Collateral financing arrangement repaid
|
2,797
|
|
—
|
|
—
|
|
|||||
|
Financing element on certain derivative instruments and other derivative related transactions, net
|
149
|
|
1,011
|
|
96
|
|
|||||
|
Distribution to MetLife, Inc.
|
1,798
|
|
—
|
|
—
|
|
|||||
|
Cash paid to MetLife, Inc. in connection with shareholder’s net investment
|
668
|
|
634
|
|
771
|
|
|||||
|
Other, net
|
48
|
|
—
|
|
—
|
|
|||||
|
Effect of change in foreign currency exchange rates on cash and cash equivalents
|
—
|
|
—
|
|
2
|
|
|||||
|
Total uses
|
12,535
|
|
6,585
|
|
8,371
|
|
|||||
|
Net increase (decrease) in cash and cash equivalents
|
$
|
(3,371
|
)
|
$
|
3,658
|
|
$
|
(33
|
)
|
||
______________
Cash Flows from Operations.
The principal cash inflows from our insurance activities come from insurance premiums, net investment income and annuity considerations. The principal cash outflows relate to life insurance and annuity products and operating expenses, as well as interest expense.
Cash Flows from Investments.
The principal cash inflows from our investment activities come from repayments of principal, proceeds from maturities and sales of investments and settlements of freestanding derivatives. The principal cash outflows relate to purchases of investments and settlements of freestanding derivatives. We typically have a net cash outflow from investing activities because cash inflows from insurance operations are reinvested in accordance with our ALM discipline to fund insurance liabilities.
Cash Flows from Financing, Parent Company.
The principal cash inflows from parent company financing activities come from issuances of debt and other securities and dividends form subsidiaries. The principal cash outflows from parent company financing activities come from interest expense on and repayments of debt, and payment of dividends on and repurchases of common or preferred stock.
Cash Flows from Financing, The Company.
The principal cash inflows from our financing activities come from issuances of debt and other securities, deposits of funds associated with policyholder account balances and lending of securities. The principal cash outflows come from interest expense on and repayment of debt, withdrawals associated with policyholder account balances and the return of securities on loan.
147
Liquidity
Liquidity Management
Based upon our capitalization, expectations regarding maintaining our ratings, business mix and funding sources available to us, we believe we have sufficient liquidity to meet business requirements under current market conditions and certain stress scenarios. We continuously monitor and adjust our liquidity and capital plans in light of market conditions, as well as changing needs and opportunities.
We determine our liquidity needs based on a rolling 12-month forecast by portfolio of invested assets which we monitor daily. We adjust the general account asset and derivatives mix and general account asset maturities based on this rolling 12-month forecast. To support this forecast, we conduct cash flow and stress testing, which include various scenarios of the potential increase to post or return collateral, reduction to new business sales, and risk of early contract holder and policyholder withdrawals, and lapses and surrenders of existing policies and contracts. We include provisions limiting withdrawal rights on many of our products. Certain of these provisions prevent the customer from making withdrawals prior to the maturity date of the product. In the event of significant cash requirements beyond anticipated liquidity needs, we have various alternatives available depending on market conditions and the amount and timing of the liquidity need. These potential available alternative sources of liquidity include cash flows from operations, sales of liquid assets, internal liquidity facilities, collateralized borrowing arrangements, such as from FHLB, and any undrawn capacity under our Revolving Credit Facility.
Consolidated Liquid Assets and Short-term Liquidity
Consolidated liquid assets were $38.3 billion and $31.7 billion at December 31, 2017 and 2016, respectively. Consolidated short-term liquidity was $1.6 billion and $5.0 billion at December 31, 2017 and 2016, respectively.
Capital
We manage our capital position to maintain our financial strength and credit ratings. Our capital position will be supported by our ability to generate cash flows within our insurance companies, our ability to effectively manage the risk of our businesses and our expected ability to borrow funds, and raise additional capital to meet operating and growth needs in the event of adverse market and economic conditions.
Capital Management
Our Board of Directors and senior management are directly involved in the governance of the capital management process, including proposed changes to the annual capital plan and capital targets. In connection with the Separation, we undertook various capitalization activities. For example, we have eliminated intercompany financing arrangements with or guaranteed by MetLife. We are targeting a debt-to-total capitalization ratio commensurate with our parent company credit ratings and our insurance subsidiaries’ financial strength ratings.
Statutory Capital
Our insurance companies have statutory surplus above the level needed to meet current regulatory requirements.
At the date of the most recent annual statutory financial statements filed with insurance regulators, the total adjusted capital of each of these insurance subsidiaries subject to these requirements was in excess of each of those RBC levels.
Restrictions on Dividends and Returns of Capital from Insurance Subsidiaries
Our business is primarily conducted through our insurance subsidiaries. The insurance subsidiaries are subject to regulatory restrictions on the payment of dividends and other distributions imposed by the regulators of their respective state domiciles. See “Regulation
— Insurance Regulation — Holding Company Regulation
.”
Any requested payment of dividends by Brighthouse Life Insurance Company and NELICO to Brighthouse Financial, Inc., or by BHNY to Brighthouse Life Insurance Company, in excess of the
2018
limit on the permitted payment of dividends without approval would be considered an extraordinary dividend and would require prior approval from the Delaware Department of Insurance or the Massachusetts Division of Insurance, and the New York State Department of Financial Services, respectively. Statutory accounting practices, as prescribed by insurance regulators of various states in which we conduct business, differ in certain respects from accounting principles used in financial statements prepared in conformity with GAAP. The significant differences relate to the treatment of DAC, certain deferred income tax, required investment liabilities, statutory reserve calculation assumptions, goodwill and surplus notes.
The table below sets forth the dividends permitted to be paid by our insurance subsidiaries without insurance regulatory approval and the respective dividends paid.
148
|
|
2018
|
2017
|
2016
|
2015
|
||||||||||||||||||||||||
|
Permitted without Approval (1)
|
Paid (2)
|
Permitted without Approval (3)
|
Paid (2)
|
Permitted without Approval (3)
|
Paid (2)
|
Permitted without Approval (3)
|
||||||||||||||||||||||
|
|
(In millions)
|
|||||||||||||||||||||||||||
|
Brighthouse Life Insurance Company (4)
|
$
|
84
|
|
$
|
—
|
|
$
|
473
|
|
$
|
261
|
|
$
|
586
|
|
$
|
500
|
|
$
|
3,056
|
|
|||||||
|
New England Life Insurance Company (5)
|
$
|
65
|
|
$
|
106
|
|
$
|
106
|
|
$
|
295
|
|
$
|
156
|
|
$
|
199
|
|
$
|
199
|
|
|||||||
|
Brighthouse Life Insurance Company of NY (6)
|
$
|
21
|
|
$
|
—
|
|
$
|
—
|
|
$
|
—
|
|
$
|
16
|
|
$
|
—
|
|
$
|
10
|
|
|||||||
_______________
|
(1)
|
Reflects dividend amounts that may be paid during
2018
without prior regulatory approval. However, because dividend tests may be based on dividends previously paid over rolling 12-month periods, if paid before a specified date during
2018
, some or all of such dividends may require regulatory approval.
|
|
(2)
|
Reflects all amounts paid, including those requiring regulatory approval.
|
|
(3)
|
Reflects dividend amounts that could have been paid during the relevant year without prior regulatory approval.
|
|
(4)
|
Dividends paid by BLIC in 2016 and 2015 were paid to its former parent, MetLife, Inc.
|
|
(5)
|
Dividends paid by NELICO in 2016, including a $295 million extraordinary cash dividend, were paid to its former parent, MetLife, Inc. Dividends paid by NELICO in 2015 were paid to its former parent, MLIC.
|
|
(6)
|
Dividends are not anticipated to be paid by BHNY in 2018.
|
In addition to the amounts presented above, prior to the Separation, we made cash payments to certain MetLife affiliates related to a profit sharing agreement of $40 million, $78 million and $72 million, for the years ended
December 31, 2017
,
2016
and
2015
, respectively.
Brighthouse Financial, Inc. received a $50 million cash distribution from BH Holdings during the year ended
December 31, 2017
. There were no cash dividends or returns of capital paid by our non-insurance subsidiaries for the years ended December 31,
2016
and
2015
.
Rating Agencies
Rating agencies use an “outlook statement” of “positive,” “stable,” ‘‘negative’’ or “developing” to indicate a medium- or long-term trend in credit fundamentals which, if continued, may lead to a rating change. A rating may have a “stable” outlook to indicate that the rating is not expected to change; however, a “stable” rating does not preclude a rating agency from changing a rating at any time, without notice. Certain rating agencies assign rating modifiers such as “CreditWatch” or “under review” to indicate their opinion regarding the potential direction of a rating. These ratings modifiers are generally assigned in connection with certain events such as potential mergers, acquisitions, dispositions or material changes in a company’s results, in order for the rating agency to perform its analysis to fully determine the rating implications of the event.
The following financial strength ratings represent each rating agency’s opinion of our principal insurance subsidiaries’ ability to pay obligations under insurance policies and contracts in accordance with their terms and are not evaluations directed toward the protection of investors in our securities. Financial strength ratings are not statements of fact nor are they recommendations to purchase, hold or sell any security, contract or policy. Each rating should be evaluated independently of any other rating.
Our financial strength ratings at the date of this filing are indicated in the following table. All financial strength ratings have a stable outlook unless otherwise indicated.
149
|
A.M. Best
|
Fitch
|
Moody's
|
S&P
|
||||
|
“A++ (superior)” to “S (suspended)”
|
“AAA (exceptionally strong)” to “C (distressed)”
|
“Aaa (highest quality)” to “C (lowest rated)”
|
“AAA (extremely strong)” to “SD (Selective Default)” or “D (Default)”
|
||||
|
Brighthouse Life Insurance Company
|
A
|
A
|
A3
|
A+ (1)
|
|||
|
3rd of 16
|
6th of 19
|
7th of 21
|
5th of 22
|
||||
|
New England Life Insurance Company
|
A
|
A
|
A3
|
A+ (1)
|
|||
|
3rd of 16
|
6th of 19
|
7th of 21
|
5th of 22
|
||||
|
Brighthouse Life Insurance Company of NY
|
A
|
NR
|
NR
|
A+ (1)
|
|||
|
3rd of 16
|
5th of 22
|
||||||
_______________
|
(1)
|
Negative outlook.
|
Our long-term issuer credit ratings at the date of this filing are indicated in the following table. All long-term issuer credit ratings have a stable outlook unless otherwise indicated.
|
A.M. Best
|
Fitch
|
Moody's
|
S&P
|
||||
|
“aaa (Exceptional)” to “c (Poor)”
|
“AAA (highest rating)” to “D (default)”
|
“Aaa (highest quality)” to “C (lowest rated)”
|
“AAA (extremely strong)” to “SD (Selective Default)” or “D (Default)”
|
||||
|
Brighthouse Financial, Inc. (1)
|
bbb+
|
BBB+
|
Baa3
|
BBB+ (2)
|
|||
|
Brighthouse Holdings, LLC (1)
|
bbb+
|
BBB+
|
Baa3
|
BBB+ (2)
|
|||
_______________
|
(1)
|
Long-term Issuer Credit Rating refers to issuer credit rating, issuer default rating, long-term issuer rating and long-term counterparty credit rating for A.M. Best, Fitch Ratings, Moody’s and S&P Global Ratings, respectively.
|
|
(2)
|
Negative outlook.
|
Additional information about financial strength ratings and credit ratings can be found on the respective websites of the rating agencies.
Rating agencies may continue to review and adjust our ratings. A downgrade in the credit ratings of Brighthouse Financial, Inc., the parent company, would likely impact us in many ways, including the cost and availability of financing for Brighthouse Financial, Inc., and its subsidiaries. See
Note 7
of the Notes to the Consolidated and Combined Financial Statements. See also “Risk Factors — Risks Related to our Business — A downgrade or a potential downgrade in our financial strength or credit ratings could result in a loss of business and materially adversely affect our financial condition and results of operations” for an in-depth description of the impact of a ratings downgrade.
Downgrades in our financial strength ratings could have a material adverse effect on our financial condition and results of operations in many ways, including:
|
•
|
reducing new sales of insurance products and annuity products;
|
|
•
|
adversely affecting our relationships with independent sales intermediaries;
|
|
•
|
increasing the number or amount of policy surrenders and withdrawals by contract holders and policyholders;
|
|
•
|
requiring us to reduce prices for many of our products and services to remain competitive;
|
|
•
|
providing termination rights for the benefit of our derivative instrument counterparties;
|
|
•
|
triggering termination and recapture rights under certain of our ceded reinsurance agreements;
|
|
•
|
adversely affecting our ability to obtain reinsurance at reasonable prices, if at all;
|
|
•
|
requiring us to post additional collateral under certain of our financing and derivative transactions; and
|
|
•
|
subjecting us to potentially increased regulatory scrutiny.
|
150
Additionally, downgrades in the credit ratings of Brighthouse Financial, Inc. or financial strength ratings of our insurance subsidiaries would likely impact us in the following ways:
|
•
|
impact our ability to generate cash flows from the sale of funding agreements and other capital market products we offer; and
|
|
•
|
impact the cost and availability of financing for Brighthouse.
|
Reinsurance Financing Transactions
Our reinsurance subsidiary, BRCD, was formed to manage our capital and risk exposures and to support our various operations, through the use of affiliated reinsurance arrangements and related reserve financing. Simultaneously with the Reinsurance Merger in April 2017, certain existing reserve financing arrangements were terminated and replaced with a single financing arrangement supported by a pool of highly rated third-party reinsurers. This financing arrangement has a total capacity of $10.0 billion and consists of credit-linked notes that each have a term of 20 years. As of December 31, 2017, there were no drawdowns on this facility and there was $8.3 billion of funding available under this financing arrangement. See “Risk Factors — Risks Related to Our Business — We may not be able to take credit for reinsurance, our statutory life insurance reserve financings may be subject to cost increases and new financings may be subject to limited market capacity” for further information. In April 2017, in connection with the Reinsurance Merger, a $2.8 billion collateral financing arrangement was terminated and the obligation outstanding was extinguished utilizing $2.8 billion of assets held in trust, which had been repositioned into short-term investments and cash equivalents. The remaining assets held in trust of $590 million were returned to MetLife, Inc. See “— Outstanding Debt and Collateral Financing Arrangement.”
In connection with our reinsurance subsidiary restructuring, we were granted approval from the Delaware Department of Insurance to pay a dividend from BRCD to its parent, BLIC. The dividend consisted of (i) $535 million in cash, which was declared and paid in May 2017 and (ii) two surplus notes with an aggregate principal balance payable at maturity of $365 million, which have not yet been issued. All payments of principal and interest on these surplus notes would be subject to the prior approval of the Delaware Department of Insurance. BRCD can only make distributions of capital to BLIC over time and subject to the approval of the Delaware Department of Insurance.
BRCD is capitalized with cash and invested assets, including funds withheld (“Minimum Initial Target Assets”) at a level that is sufficient to satisfy all of its future cash obligations assuming a permanent level yield curve, consistent with NAIC cash flow testing scenarios. BRCD utilizes a financing program to cover the difference between full required statutory assets (i.e., XXX/AXXX reserves plus target RBC) and Minimum Initial Target Assets. An admitted deferred tax asset, if any, would also serve to reduce the amount of funding required under this financing program.
Primary Sources of Liquidity and Capital
Liquidity is provided by a variety of funding sources, including funding agreements. Capital is provided by a variety of funding sources, including long-term debt, credit facilities and reserve financing facilities. The diversity of our funding sources enhances our funding flexibility, limits dependence on any one market or source of funds and generally lowers the cost of funds.
In addition to senior note issuances, credit facilities and a reinsurance financing arrangement discussed in more detail in “— Outstanding Debt and Collateral Financing Arrangement,” our other funding sources include or have included:
Federal Home Loan Bank Funding Agreements, Reported in Policyholder Account Balances
BLIC is a member of the FHLB of Pittsburgh and has obligations outstanding with certain regional banks in the FHLB system. During the years ended
December 31, 2017
,
2016
and
2015
, we issued $25 million, $4.7 billion and $4.1 billion, respectively, and repaid $75 million, $5.9 billion and $3.3 billion, respectively, under funding agreements with certain regional FHLBs. At
December 31, 2017
and
2016
, total obligations outstanding under these funding agreements were $595 million and $645 million, respectively. See
Note 3
of the Notes to the Consolidated and Combined Financial Statements. Activity related to these funding agreements is reported in the Run-off segment.
We intend to maintain a funding agreement program with the FHLB to support our liquidity needs; whereas historically this program was used in the spread-based business.
151
Special Purpose Entity Funding Agreements, Reported in Policyholder Account Balances
BLIC issued fixed and floating rate funding agreements which are denominated in either U.S. dollars or foreign currencies, to certain special purpose entities that have issued either debt securities or commercial paper for which payment of interest and principal is secured by such funding agreements. During the years ended
December 31, 2017
,
2016
and
2015
, we issued $0, $1.4 billion and $13.0 billion, respectively, and repaid $6 million, $3.4 billion and $14.4 billion, respectively, under such funding agreements. At
December 31, 2017
and
2016
, total obligations outstanding under these funding agreements were
$141 million
and $127 million, respectively. See
Note 3
of the Notes to the Consolidated and Combined Financial Statements. Activity related to these funding agreements is reported in the Run-off segment.
We no longer maintain this funding agreement program to support our liquidity needs.
Federal Agricultural Mortgage Corporation Funding Agreements, Reported in Policyholder Account Balances
BLIC issued funding agreements to a subsidiary of the Federal Agricultural Mortgage Corporation. The obligations under all such funding agreements are secured by a pledge of certain eligible agricultural real estate mortgage loans. During the years ended
December 31, 2017
, 2016 and 2015, there were no issuances and we repaid $0, $0 and $200 million under such funding agreements, respectively. At
December 31, 2017
and
2016
, there were no obligations outstanding under these funding agreements. Activities related to these funding agreements are reported in the Run-off segment.
Outstanding Debt and Collateral Financing Arrangement
The following table summarizes our outstanding debt and collateral financing arrangement liability as of:
|
|
December 31,
|
||||||||||
|
|
Interest Rate
|
Maturity
|
2017
|
2016
|
|||||||
|
|
(Dollars in millions)
|
||||||||||
|
Senior notes — unaffiliated (1)
|
3.700%
|
2027
|
$
|
1,489
|
|
$
|
—
|
|
|||
|
Senior notes — unaffiliated (1)
|
4.700%
|
2047
|
1,477
|
|
—
|
|
|||||
|
Surplus notes — affiliated with MetLife, Inc.
|
8.595%
|
2038
|
—
|
|
750
|
|
|||||
|
Surplus note — affiliated with MetLife, Inc.
|
5.130%
|
2032
|
—
|
|
750
|
|
|||||
|
Surplus note — affiliated with MetLife, Inc.
|
6.000%
|
2033
|
—
|
|
350
|
|
|||||
|
Long-term debt — unaffiliated (2)
|
7.028%
|
2030
|
35
|
|
37
|
|
|||||
|
Term loan — unaffiliated
|
LIBOR plus 1.5%
|
2019
|
600
|
|
—
|
|
|||||
|
Total long-term debt (3)
|
$
|
3,601
|
|
$
|
1,887
|
|
|||||
|
|
|
||||||||||
|
Collateral financing arrangement
|
3-month LIBOR plus 0.70%
|
2037
|
$
|
—
|
|
$
|
2,797
|
|
|||
_______________
|
(1)
|
Includes unamortized debt issuance costs and debt discount totaling
$34 million
for the senior notes due 2027 and 2047 on a combined basis at December 31, 2017.
|
|
(2)
|
Represents non-recourse debt for which creditors have no access, subject to customary exceptions, to the general assets of the Company other than recourse to certain investment companies.
|
|
(3)
|
Excludes
$11 million
and
$23 million
of long-term debt related to CSEs at
December 31, 2017
and
2016
, respectively. See
Note 6
of the Notes to the Consolidated and Combined Financial Statements for more information regarding CSEs and
Note 9
of the Notes to the Consolidated and Combined Financial Statements for further information regarding long-term debt.
|
Senior Notes
On June 22, 2017, Brighthouse Financial, Inc. issued $1.5 billion of senior notes due June 2027, which bear interest at a fixed rate of 3.70%, payable semi-annually, and $1.5 billion of senior notes due June 2047, which bear interest at a fixed rate of 4.70%, payable semi-annually.
152
Surplus Notes
On June 16, 2017, MetLife, Inc. forgave Brighthouse Life Insurance Company’s obligation to pay the principal amount of $750 million,8.595% surplus notes held by MetLife, Inc., which were originally issued in 2008. The forgiveness of the surplus notes was treated as a capital transaction and recorded as an increase to additional paid-in-capital.
On April 28, 2017, two surplus note obligations due to MetLife, Inc. totaling
$1.1 billion
, which were originally issued in 2012 and 2013, were due on September 30, 2032 and December 31, 2033 and bore interest at
5.13%
and
6.00%
, respectively, were satisfied in a non-cash exchange for
$1.1 billion
of loans due from MetLife, Inc.
Credit Facilities
On December 2, 2016, Brighthouse Financial, Inc. entered into a $2.0 billion five-year senior unsecured Revolving Credit Facility and a $3.0 billion three-year term loan facility (the “2016 Term Loan Facility”) with a syndicate of banks.
On July 21, 2017, Brighthouse Financial, Inc. entered into a new term loan agreement (the “2017 Term Loan Agreement”) with respect to a new $600 million unsecured delayed draw term loan facility due December 2, 2019 (the “2017 Term Loan Facility”). Also on July 21, 2017, concurrently with entering into the 2017 Term Loan Agreement, the 2016 Term Loan Facility was terminated without penalty.
At December 31, 2017, there were no drawdowns under the Revolving Credit Facility and there was $600 million outstanding under the 2017 Term Loan Facility, resulting in unused commitments totaling $2.0 billion in comparison to the maximum capacity of $2.6 billion under these facilities.
Committed Facilities, Collateral Financing Arrangement and Reinsurance Financing Arrangement
The Company previously had access to an unsecured revolving credit facility and certain committed facilities through the Company’s former parent, MetLife, Inc. These facilities were used for collateral for certain of the Company’s affiliated reinsurance liabilities.
In connection with the Reinsurance Merger, effective April 28, 2017, MetLife, Inc.’s then existing affiliated reinsurance subsidiaries that supported the business interests of Brighthouse Financial, Inc. became a part of Brighthouse Financial, Inc. Simultaneously with the Reinsurance Merger, the existing reserve financing arrangements of the affected reinsurance subsidiaries, as well as Brighthouse Financial, Inc.’s access to MetLife Inc.’s revolving credit facility and certain committed facilities, including outstanding letters of credit, were terminated and replaced with a single reinsurance financing arrangement, which is discussed in more detail below. The terminated committed facilities included a $3.5 billion committed facility for the benefit of MetLife Reinsurance Company of South Carolina (“MRSC”) and a $4.3 billion committed facility for the benefit of a designated protected cell of MetLife Reinsurance Company of Vermont.
In 2007, MetLife, Inc. and MRSC entered into a 30-year collateral financing arrangement with an unaffiliated financial institution that provided up to $3.5 billion of statutory reserve support for MRSC associated with reinsurance obligations under affiliated reinsurance agreements. At December 31, 2016, the amount outstanding under this collateral financing arrangement was $2.8 billion. On April 28, 2017, MetLife, Inc. and MRSC terminated this collateral financing arrangement. As a result, the $2.8 billion collateral financing arrangement obligation outstanding was extinguished utilizing $2.8 billion of assets held in trust, which had been repositioned into short-term investments and cash equivalents. The remaining assets held in trust of $590 million were returned to MetLife, Inc. and reported as an increase to additional paid-in capital.
On April 28, 2017, BRCD entered into a new
$10.0 billion
financing arrangement with a pool of highly rated third-party reinsurers. This financing arrangement consists of credit-linked notes that each have a term of 20 years. At December 31, 2017, there were no drawdowns and there was $8.3 billion of funding available under this arrangement.
See
Note 9
of the Notes to the Consolidated and Combined Financial Statements for further information regarding the Company’s committed facilities, collateral financing arrangement and reinsurance financing arrangement.
Debt and Facility Covenants
Certain of the Company’s debt instruments, credit and committed facilities, and the reinsurance financing arrangement contain administrative, reporting, legal and financial covenants, including requirements to maintain a specified minimum consolidated net worth and to maintain a ratio of indebtedness to total capitalization not in excess of a specified percentage, and limitation on the dollar amount of indebtedness that may be incurred by our subsidiaries, which could restrict our operations and use of funds. The Company is not aware of any non-compliance with these financial covenants at
December 31, 2017
.
Debt Repurchases
We may from time to time seek to retire or purchase our outstanding debt through cash purchases and/or exchanges for other securities, in open market purchases, privately negotiated transactions or otherwise. Any such repurchases or exchanges will be dependent upon several factors, including our liquidity requirements, contractual restrictions, general market conditions, and
153
applicable regulatory, legal and accounting factors. Whether or not to repurchase any debt and the size and timing of any such repurchases will be determined at our discretion.
Liquidity and Capital Uses
In addition to the general description of liquidity and capital uses in “— Primary Sources of Liquidity and Capital,” and “— Contractual Obligations,” the following additional information is provided regarding our primary uses of liquidity and capital:
Debt Repayments
In April 2017, MetLife, Inc. and MRSC terminated the collateral financing arrangement and, as a result, the $2.8 billion obligation outstanding, under this arrangement was extinguished.
Insurance Liabilities
Liabilities arising from our insurance activities primarily relate to benefit payments under various life insurance products, and annuity products, as well as payments for policy surrenders, withdrawals and loans. For annuity or deposit type products, surrender or lapse behavior differs somewhat by segment. In the Annuities segment, lapses and surrenders tend to occur in the normal course of business. During the years ended
December 31, 2017
and
2016
, general account surrenders and withdrawals from annuity products were $1.8 billion and $1.9 billion, respectively.
Pledged Collateral
We pledge collateral to, and have collateral pledged to us by, counterparties in connection with our derivatives. At
December 31, 2017
and
2016
, counterparties were obligated to return cash collateral pledged by us of
$44 million
and
$765 million
, respectively. At
December 31, 2017
and
2016
, we were obligated to return cash collateral pledged to us by counterparties of
$379 million
and
$749 million
, respectively. See
Note 7
of the Notes to the Consolidated and Combined Financial Statements for additional information about pledged collateral.
We pledge collateral from time to time in connection with funding agreements.
Securities Lending
We participate in a securities lending program whereby securities are loaned to third parties, primarily brokerage firms and commercial banks. We obtain collateral, usually cash, from the borrower, which must be returned to the borrower when the loaned securities are returned to us. Under our securities lending program, we were liable for cash collateral under our control of
$3.8 billion
and
$6.6 billion
at
December 31, 2017
and
2016
, respectively. Of these amounts,
$1.6 billion
and
$2.1 billion
at
December 31, 2017
and
2016
, respectively, were on open, meaning that the related loaned security could be returned to us on the next business day requiring the immediate return of cash collateral we hold. The estimated fair value of the securities on loan related to the cash collateral on open at
December 31, 2017
was
$1.6 billion
,
all
of which were U.S. government and agency securities which, if put to us, could be immediately sold to satisfy the cash requirements to immediately return the cash collateral. See
Note 6
of the Notes to the Consolidated and Combined Financial Statements.
Litigation
Putative or certified class action litigation and other litigation, and claims and assessments against us, in addition to those discussed elsewhere herein and those otherwise provided for in the financial statements, have arisen in the course of our business, including, but not limited to, in connection with our activities as an insurer, employer, investor, investment advisor, and taxpayer. Further, state insurance regulatory authorities and other federal and state authorities regularly make inquiries and conduct investigations concerning our compliance with applicable insurance and other laws and regulations. See
Note 15
of the Notes to the Consolidated and Combined Financial Statements.
We establish liabilities for litigation and regulatory loss contingencies when it is probable that a loss has been incurred and the amount of the loss can be reasonably estimated. For material matters where a loss is believed to be reasonably possible but not probable, no accrual is made but we disclose the nature of the contingency and an aggregate estimate of the reasonably possible range of loss in excess of amounts accrued, when such an estimate can be made. It is not possible to predict or determine the ultimate outcome of all pending investigations and legal proceedings. In some of the matters referred to herein, very large and/or indeterminate amounts, including punitive and treble damages, are sought. Although in light of these considerations, it is possible that an adverse outcome in certain cases could have a material adverse effect upon our financial position, based on information currently known by us, in our opinion, the outcome of such pending investigations and legal proceedings are not likely to have such an effect. However, given the large and/or indeterminate amounts sought in certain of these matters and the inherent unpredictability of litigation, it is possible that an adverse outcome in certain matters could, from time to time, have a material adverse effect on our combined net income or cash flows in particular quarterly or annual periods.
154
Contractual Obligations
The following table summarizes our major contractual obligations at:
|
December 31, 2017
|
|||||||||||||||||||
|
Total
|
One Year
or Less |
More than
One Year to Three Years |
More than
Three Years to Five Years |
More than Five Years
|
|||||||||||||||
|
|
(In millions)
|
||||||||||||||||||
|
Insurance liabilities
|
$
|
76,524
|
|
$
|
7,788
|
|
$
|
5,134
|
|
$
|
5,235
|
|
$
|
58,367
|
|
||||
|
Policyholder account balances
|
59,683
|
|
1,740
|
|
4,062
|
|
4,298
|
|
49,583
|
|
|||||||||
|
Payables for collateral under securities loaned and other transactions
|
4,169
|
|
4,169
|
|
—
|
|
—
|
|
—
|
|
|||||||||
|
Debt
|
6,305
|
|
148
|
|
876
|
|
261
|
|
5,020
|
|
|||||||||
|
Investment commitments
|
1,813
|
|
1,722
|
|
78
|
|
13
|
|
—
|
|
|||||||||
|
Other
|
5,037
|
|
4,948
|
|
—
|
|
—
|
|
89
|
|
|||||||||
|
Total
|
$
|
153,531
|
|
$
|
20,515
|
|
$
|
10,150
|
|
$
|
9,807
|
|
$
|
113,059
|
|
||||
Insurance Liabilities
Insurance liabilities include future policy benefits and other policy-related balances, which are reported on the balance sheet and are more fully described in Notes
1
and
3
of the Notes to the Consolidated and Combined Financial Statements. The amounts presented reflect future estimated cash payments and (i) are based on mortality, morbidity, lapse and other assumptions comparable with our experience and expectations of future payment patterns; and (ii) consider future premium receipts on current policies in-force. All estimated cash payments presented are undiscounted as to interest, net of estimated future premiums on in-force policies and gross of any reinsurance recoverable. Additionally, the more than five years category includes estimated payments due for periods extending for more than 100 years.
The sum of the estimated cash flows shown for all years of
$76.5 billion
exceeds the liability amounts of $39.6 billion included on the balance sheet principally due to (i) the time value of money, which accounts for a substantial portion of the difference; and (ii) differences in assumptions, most significantly mortality, between the date the liabilities were initially established and the current date; and are partially offset by liabilities related to accounting conventions (such as interest reserves and unearned revenue), or which are not contractually due, which are excluded.
Actual cash payments may differ significantly from the liabilities as presented on the balance sheet and the estimated cash payments as presented due to differences between actual experience and the assumptions used in the establishment of these liabilities and the estimation of these cash payments.
For the majority of our insurance operations, estimated contractual obligations for future policy benefits and policyholder account balances, as presented, are derived from the annual asset adequacy analysis used to develop actuarial opinions of statutory reserve adequacy for state regulatory purposes. See “— Policyholder Account Balances.”
Policyholder Account Balances
See Notes
1
and
3
of the Notes to the Consolidated and Combined Financial Statements for a description of the components of policyholder account balances. See “— Insurance Liabilities” regarding the source and uncertainties associated with the estimation of the contractual obligations related to future policy benefits and policyholder account balances.
Amounts presented represent the estimated cash payments undiscounted as to interest and including assumptions related to the receipt of future premiums and deposits; withdrawals, including unscheduled or partial withdrawals; policy lapses; surrender charges; annuitization; mortality; future interest credited; policy loans and other contingent events as appropriate for the respective product type. Such estimated cash payments are also presented net of estimated future premiums on policies currently in-force and gross of any reinsurance recoverable.
155
The sum of the estimated cash flows shown for all years of
$59.7 billion
exceeds the liability amount of
$37.8 billion
included on the balance sheet principally due to (i) the time value of money, which accounts for a substantial portion of the difference; (ii) differences in assumptions, between the date the liabilities were initially established and the current date; and (iii) liabilities related to accounting conventions (such as interest reserves and embedded derivatives), or which are not contractually due, which are excluded.
Payables for Collateral Under Securities Loaned and Other Transactions
We have accepted cash collateral in connection with securities lending and derivatives. As the securities lending transactions expire within the next year and the timing of the return of the derivatives collateral is uncertain, the return of the collateral has been included in the one year or less category in the table. We also held non-cash collateral, which is not reflected as a liability on the balance sheet of $397 million at
December 31, 2017
.
Debt
The total amount presented for debt differs from the total amount presented on the consolidated and combined balance sheets due to the following: (i) the amounts presented herein do not include premiums or discounts upon issuance; (ii) the amounts presented herein include future interest on such obligations for the period from January 1, 2018 through maturity; and (iii) the amounts presented herein do not include
$11 million
at
December 31, 2017
of long-term debt relating to CSEs — FVO as such debt does not represent our contractual obligation. Future interest on variable rate debt was computed using prevailing rates at
December 31, 2017
and, as such, does not consider the impact of future rate movements. Future interest on fixed rate debt was computed using the stated rate on the obligations.
Investment Commitments
To enhance the return on our investment portfolio, we commit to lend funds under mortgage loans, bank credit facilities and private corporate bond investments and we commit to fund partnership investments. In the table, the timing of the funding of mortgage loans and private corporate bond investments is based on the expiration dates of the corresponding commitments. As it relates to commitments to fund partnerships and bank credit facilities, we anticipate that these amounts could be invested any time over the next five years; however, as the timing of the fulfillment of the obligation cannot be predicted, such obligations are generally presented in the one year or less category. See
Note 15
of the Notes to the Consolidated and Combined Financial Statements and “— Off-Balance Sheet Arrangements.”
Other
Other obligations presented are principally comprised of amounts due under reinsurance agreements, payables related to securities purchased but not yet settled, accrued interest on debt obligations, estimated fair value of derivative obligations, guaranty liabilities, and accruals and accounts payable due under contractual obligations, which are all reported in other liabilities on the balance sheet. If the timing of any of these other obligations is sufficiently uncertain, the amounts are included within the one year or less category. Items reported in other liabilities on the balance sheet that were excluded from the table represent accounting conventions or are not liabilities due under contractual obligations. Unrecognized tax benefits and related accrued interest totaling $25 million was excluded as the timing of payment cannot be reliably determined.
Separate account liabilities are excluded as they are fully funded by cash flows from the corresponding separate account assets and are set equal to the estimated fair value of separate account assets.
We also enter into agreements to purchase goods and services in the normal course of business; however, such amounts are excluded as these purchase obligations were not material to our results of operations or financial position.
Additionally, we have agreements in place for services we conduct, generally at cost, between companies relating to insurance, reinsurance, loans and capitalization. Intercompany transactions have been eliminated in combination. Intercompany transactions among insurance companies and affiliates have been approved by the appropriate insurance regulators as required.
156
GLOSSARY
Glossary of Selected Financial Terms
|
Account value
|
The amount of money in a policyholder’s account. The value increases with additional premiums and investment gains, and it decreases with withdrawals, investment losses and fees.
|
|
|
Adjusted earnings
|
See “Management’s Discussion and Analysis of Financial Condition and Results of Operations — Non-GAAP and Other Financial Disclosures.”
|
|
|
Alternative investments
|
General account invested assets in real estate joint ventures, other limited partnership interests and other invested assets.
|
|
|
Annualized new premium (“
ANP
”)
|
A sales term used to compare new business written in a year on a recurring basis. The annualization is determined by using 100% of annual recurring premium and 10% of single premiums or deposits.
|
|
|
Assets under management (“
AUM
”)
|
General account investments and separate account assets.
|
|
|
Conditional tail expectation (“
CTE
”)
|
Calculated as the average amount of total assets required to satisfy obligations over the life of the contract or policy in the worst [x]% of scenarios. Represented as CTE (100
less
x). Example: CTE95 represents the five worst percent of scenarios.
|
|
|
Credit loss
|
The difference between the amortized cost of the security and the present value of projected future cash flows expected to be collected is recognized as an OTTI in earnings.
|
|
|
Deferred acquisition cost (“
DAC
”)
|
Represents the incremental costs related directly to the successful acquisition of new and renewal insurance and annuity contracts and which have been deferred on the balance sheet as an asset.
|
|
|
Deferred sales inducements (“
DSI
”)
|
Represent amounts that are credited to a policyholder’s account balance that are higher than the expected crediting rates on similar contracts without such an inducement and that are an incentive to purchase a contract and also meet the accounting criteria to be deferred as an asset that is amortized over the life of the contract.
|
|
|
Deferred tax asset or deferred tax liability
|
Assets or liabilities that are recorded for the difference between book basis and tax basis of an asset or a liability.
|
|
|
General account assets
|
All insurance company assets not allocated to separate accounts.
|
|
|
Invested assets
|
General account investments. Includes fixed maturity securities, equity securities, mortgage loans, policy loans, alternative investments and short-term investments.
|
|
|
Investment Hedge Adjustments
|
Earned income on derivatives and amortization of premium on derivatives that are hedges of investments or that are used to replicate certain investments, but do not qualify for hedge accounting treatment.
|
|
|
Market Value Adjustments
|
Amounts associated with periodic crediting rate adjustments based on the total return of a contractually referenced pool of assets and market value adjustments associated with surrenders or terminations of contracts.
|
|
|
Minimum Initial Target Assets
|
Cash and invested assets, including funds withheld.
|
|
|
Net amount at risk (“
NAR
”)
|
Represents the difference between a claim amount payable if a specific event occurs and the amount set aside to support the claim. The calculation of NAR can differ by policy type and/or guarantee.
|
|
157
|
Net investment spread
|
See
“Management’s Discussion and Analysis of Financial Condition and Results of Operations — Non-GAAP and Other Financial Disclosures.”
|
|
|
Reinsurance
|
Insurance that an insurance company buys for its own protection. Reinsurance enables an insurance company to expand its capacity, stabilize its underwriting results, or finance its expanding volume.
|
|
|
Risk-based capital (“
RBC
”)
|
Rules to determine insurance company regulatory capital requirements. It is based on rules published by the National Association of Insurance Commissioners (“
NAIC
”).
|
|
|
Sales
|
See
“Management’s Discussion and Analysis of Financial Condition and Results of Operations — Non-GAAP and Other Financial Disclosures.”
|
|
|
Tax-deferral
|
An investment with earnings such as interest, dividends or capital gains that accumulate tax free until the investor withdraws and takes possession of them. The most common types of tax-deferred investments include those in individual retirement accounts and individual retirement annuities (collectively, “
IRAs
”) and deferred annuities.
|
|
|
Value of business acquired (“
VOBA
”)
|
Present value of projected future gross profits from in-force policies of acquired businesses.
|
|
Glossary of Product Terms
|
Accumulation phase
|
The phase of a variable annuity contract during which assets accumulate based on the policyholder’s lump sum or periodic deposits and reinvested interest, capital gains and dividends that are generally tax deferred.
|
|
|
Annuitant
|
The person who receives annuity payments or the person whose life expectancy determines the amount of variable annuity payments upon annuitization of a life contingent annuity.
|
|
|
Annuities
|
Long-term, tax deferred investments designed to help investors save for retirement.
|
|
|
Annuitization
|
The process of converting an annuity investment into a series of periodic income payments, generally for life.
|
|
|
Benefit Base
|
A notional amount (not actual cash value) used to calculate the owner’s guaranteed benefits within an annuity contract. The death benefit and living benefit within the same contract may not have the same Benefit Base.
|
|
|
Cash surrender value
|
The amount an insurance company pays (minus any surrender charge) to the variable annuity owner when the contract is voluntarily terminated prematurely.
|
|
|
Deferred annuity
|
An annuity purchased with premiums paid either over a period of years or as a lump sum, for which savings accumulate prior to annuitization or surrender, and upon annuitization, such savings are exchanged for either a future lump sum or periodic payments for a specific length of time or for a lifetime.
|
|
|
Dollar-for-dollar withdrawal
|
A method of calculating the reduction of a variable annuity Benefit Base after a withdrawal in which the benefit is reduced by one dollar for every dollar withdrawn.
|
|
|
Enhanced death benefit
|
An optional benefit that locks in investment gains annually, or every few years, or pays a minimum stated interest rate on purchase payments to the beneficiary.
|
|
|
Fixed annuity
|
An annuity that guarantees a set annual rate of return with interest at rates we determine, subject to specified minimums. Credited interest rates are guaranteed not to change for certain limited periods of time.
|
|
158
|
Future policy benefits
|
Future policy benefits for the annuities business are comprised mainly of liabilities for life-contingent income annuities, and liabilities for the variable annuity guaranteed minimum benefits accounted for as insurance.
|
|
|
Guaranteed minimum accumulation benefits (“
GMAB
”)
|
An optional benefit (available for an additional cost) which entitles an annuitant to a minimum payment, typically in lump-sum, after a set period of time, typically referred to as the accumulation period. The minimum payment is based on the Benefit Base, which could be greater than the underlying account value.
|
|
|
Guaranteed minimum death benefits (“
GMDB
”)
|
An optional benefit (available for an additional cost) that guarantees an annuitant’s beneficiaries are entitled to a minimum payment based on the Benefit Base, which could be greater than the underlying account value, upon the death of the annuitant.
|
|
|
Guaranteed minimum income benefits (“
GMIB
”)
|
An optional benefit (available for an additional cost) where an annuitant is entitled to annuitize the policy and receive a minimum payment stream based on the Benefit Base, which could be greater than the underlying account value.
|
|
|
Guaranteed minimum living benefits (“
GMLB
”)
|
A reference to all forms of guaranteed minimum living benefits, including GMIBs, GMWBs and GMABs (does not include GMDBs).
|
|
|
Guaranteed minimum withdrawal benefit for life (“
GMWBL
”)
|
An optional benefit (available for an additional cost) where an annuitant is entitled to withdraw a maximum amount of their Benefit Base each year, for the duration of the contract holder’s life, regardless of account performance.
|
|
|
Guaranteed minimum withdrawal benefit riders (“
GMLB Riders
”)
|
Changes in the carrying value of GMLB liabilities, related hedges and reinsurance; the fees earned directly from the GMLB liabilities; and related DAC offsets.
|
|
|
Guaranteed minimum withdrawal benefits (“
GMWB
”)
|
An optional benefit (available for an additional cost) where an annuitant is entitled to withdraw a maximum amount of their Benefit Base each year, for which cumulative payments to the annuitant could be greater than the underlying account value.
|
|
|
Guaranteed minimum benefits (“
GMxB
”)
|
A general reference to all forms of guaranteed minimum benefits, inclusive of living benefits and death benefits.
|
|
|
Immediate income annuity
|
A type of annuity for which the owner pays a lump sum and receives periodic payments immediately or soon after purchase.
Single premium immediate annuities (“
SPIAs
”) are single premium annuity products that provide a guaranteed level of income to the owner generally for a specified number of years and/or for the life of the annuitant.
Deferred income annuities (“
DIAs
”) provide a pension-like stream of income payments after a specified deferral period.
|
|
|
Index-linked annuities
|
An annuity that provides for asset accumulation and asset distribution needs with an ability to share in the upside from certain financial markets such as equity indices, or an interest rate benchmark. With an index-linked annuity, the customer’s account value can grow or decline due to various external financial market indices performance.
|
|
|
Living benefits
|
Optional benefits (available at an additional cost) that guarantee that the owner will get back at least his original investment when the money is withdrawn.
|
|
|
Mortality and expense risk fee (“
M&E fee
”)
|
A fee charged by insurance companies to compensate for the risk they take by issuing variable annuity contracts.
|
|
|
Net flows
|
Net change in customer account balances in a period including, but not limited to, new sales, full or partial exits and the net impact of clients utilizing or withdrawing their funds. It excludes the impact of markets on account balances.
|
|
|
Period certain annuity
|
Type of annuity that guarantees payment to the annuitant for a specified time period and to the beneficiary if the annuitant dies before the period ends.
|
|
159
|
Policyholder account balances
|
Annuities: Policyholder account balances are held for fixed deferred annuities, the fixed account portion of variable annuities, and non-life contingent income annuities. Interest is credited to the policyholder’s account at interest rates we determine which are influenced by current market rates, subject to specified minimums.
Life Insurance Policies: Policyholder account balances are held for retained asset accounts, universal life policies and the fixed account of universal variable life insurance policies. Interest is credited to the policyholder’s account at interest rates we determine which are influenced by current market rates, subject to specified minimums.
|
|
|
Rider
|
An optional feature or benefit that a variable annuity contract holder can purchase at an additional cost.
|
|
|
Roll-up rate
|
The guaranteed percentage that the Benefit Base increases by each year.
|
|
|
Separate account
|
An insurance company account, legally segregated from the general account, that holds the contract assets or subaccount investments that can be actively or passively managed and invest in stock, bonds or money market portfolios.
|
|
|
Step-up
|
An optional variable annuity feature (available at an additional cost) that can increase the Benefit Base amount if the variable annuity account value is higher than the Benefit Base on specified dates.
|
|
|
Surrender charge
|
A fee paid by a contract owner for the early withdrawal of an amount that exceeds a specific percentage or for cancellation of the contract within a specified amount of time after purchase.
|
|
|
Term life products
|
Term life products provide a fixed death benefit in exchange for a guaranteed level premium over a specified period of time, usually ten to thirty years. Generally, term life does not include any cash value, savings or investment components.
|
|
|
Total adjusted capital (“
TAC
”)
|
Primarily consists of statutory capital and surplus and the statutory asset valuation reserve.
|
|
|
Universal life products
|
Life insurance products that provide a death benefit in return for payment of specified annual policy charges that are generally related to specific costs, which may change over time. To the extent that the policyholder chooses to pay more than the charges required in any given year to keep the policy in-force, the excess premium will be placed into the account value of the policy and credited with a stated interest rate on a monthly basis.
|
|
|
Variable annuity
|
A type of annuity that offers guaranteed periodic payments for a defined period of time or for life and gives purchasers the ability to invest in various markets though the underlying investment options, which may result in potentially higher, but variable, returns.
|
|
|
Variable universal life
|
Universal life products where the excess amount paid over policy charges can be directed by the policyholder into a variety of separate account investment options. In the separate account investment options, the policyholder bears the entire risk and returns of the investment results.
|
|
|
Whole life products
|
Life insurance products that provide a guaranteed death benefit in exchange for a guaranteed level premium for a specified period of time in order to maintain coverage for the life of the insured. Whole life products also have guaranteed minimum cash surrender values. Although the primary purpose is protection, the policyholder can withdraw or borrow against the policy (sometimes on a tax favored basis).
|
|
160
Risk Management
We have an integrated process for managing risk exposures, which is coordinated among our Risk Management, Treasury, Actuarial and Investment Departments. The process is designed to assess and manage exposures on a consolidated, company-wide basis. Brighthouse Financial, Inc. has established a Balance Sheet and Financial Risk Committee (“BSFRC”). The BSFRC is responsible for periodically reviewing all material financial risks to us and, in the event risks exceed desired tolerances, informs the Finance and Risk Committee of the Board of Directors, considers possible courses of action and determines how best to resolve or mitigate such risks. In taking such actions, the BSFRC considers industry best practices and the current economic environment. The BSFRC also reviews and approves target investment portfolios in order to align them with our liability profile, and establishes guidelines and limits for various risk taking departments, such as the Investment Department. Our Treasury Department is responsible for coordinating our ALM strategies throughout the enterprise. The membership of the BSFRC is comprised of the following members of senior management: Chief Executive Officer, Chief Risk Officer, Chief Financial Officer, Chief Operating Officer, Chief Strategy Officer and Chief Investment Officer.
Our significant market risk management practices include, but are not limited to, the following:
Managing Interest Rate Risk
To manage interest rate risk, we employ product design, pricing and ALM strategies to mitigate the potential effects of interest rate movements. Product design and pricing strategies include the use of surrender charges or restrictions on withdrawals in some products and the ability to reset crediting rates for certain products. Our ALM strategies include the use of derivatives and duration mismatch limits.
We analyze interest rate risk using various models, including multi-scenario cash flow projection models that forecast cash flows of the liabilities and their supporting investments, including derivatives. These projections involve evaluating the potential gain or loss on most of our in-force business under various increasing and decreasing interest rate environments. State insurance department regulations require that we perform some of these analyses annually as part of our review of the sufficiency of our regulatory reserves. We measure relative sensitivities of the value of our assets and liabilities to changes in key assumptions using internal models. These models reflect specific product characteristics and include assumptions based on current and anticipated experience regarding lapse, mortality and interest crediting rates. In addition, these models include asset cash flow projections reflecting interest payments, sinking fund payments, principal payments, bond calls, prepayments and defaults.
We also use common industry metrics, such as duration and convexity, to measure the relative sensitivity of asset and liability values to changes in interest rates. In computing the duration of liabilities, we consider all policyholder guarantees and how indeterminate policy elements such as interest credits or dividends are set. Each asset portfolio has a duration target based on the liability duration and the investment objectives of that portfolio.
Managing Equity Market and Foreign Currency Risks
We manage equity market risk in a coordinated process across our Investment and Treasury Departments primarily by holding sufficient capital to permit us to absorb modest losses, which may be temporary, from changes in equity markets and interest rates without adversely affecting our financial strength ratings and through the use of derivatives, such as equity index options contracts, exchange-traded equity futures, equity variance swaps and equity total return swaps. We may also employ reinsurance strategies to manage these exposures. Key management objectives include limiting losses, minimizing exposures to significant risks and providing additional capital capacity for future growth. The Investment and Treasury Departments are also responsible for managing the exposure to foreign currency denominated investments. We use foreign currency swaps and forwards to mitigate the exposure, risk of loss and financial statement volatility associated with foreign currency denominated fixed income investments.
Market Risk - Fair Value Exposures
We regularly analyze our market risk exposure to interest rate, equity market, credit spread and foreign currency exchange rate risks. As a result of that analysis, we have determined that the estimated fair values of certain assets and liabilities are significantly exposed to changes in interest rates, and to a lesser extent, to changes in equity markets and foreign currency exchange rates. We have exposure to market risk through our insurance and annuity operations and general account investment activities. For purposes of this discussion, “market risk” is defined as changes in fair value resulting from changes in interest rates, equity markets, credit spread and foreign currency exchange rates. We may have additional financial impacts other than changes in fair value, which are beyond the scope of this discussion. See “Risk Factors” for additional disclosure regarding our market risk and related sensitivities.
161
Interest Rates
Our fair value exposure to changes in interest rates arises most significantly from our interest rate sensitive liabilities and our holdings of fixed maturity securities, mortgage loans and derivatives that are used to support our policyholder liabilities. Our interest rate sensitive liabilities include long-term debt, policyholder account balances related to certain investment type contracts, and embedded derivatives in variable annuity contracts with guaranteed minimum benefits. Our fixed maturity securities including U.S. and foreign government bonds, securities issued by government agencies, corporate bonds, mortgage-backed and other ABS, and our commercial, agricultural and residential mortgage loans, are exposed to changes in interest rates. We also use derivatives including swaps, caps, floors and options to mitigate the exposure related to interest rate risks from our product liabilities.
162
Equity Market
Along with investments in equity securities, we have fair value exposure to equity market risk through certain liabilities that involve long-term guarantees on equity performance such as embedded derivatives in variable annuity contracts with guaranteed minimum benefits, as well as certain policyholder account balances. In addition, we have exposure to equity markets through derivatives including futures, options and swaps that we enter into to mitigate potential equity market exposure from our product liabilities.
Foreign Currency Exchange Rates
Our fair value exposure to fluctuations in foreign currency exchange rates against the U.S. dollar results from our holdings in non-U.S. dollar denominated fixed maturity and equity securities, mortgage loans and certain liabilities. The principal currencies that create foreign currency exchange rate risk in our investment portfolios and liabilities are the Euro and the British pound. We economically hedge substantially all of our foreign currency exposure.
Risk Measurement: Sensitivity Analysis
In the following discussion and analysis, we measure market risk related to our market sensitive assets and liabilities based on changes in interest rates, equity market prices and foreign currency exchange rates using a sensitivity analysis. This analysis estimates the potential changes in estimated fair value based on a hypothetical 10% change (increase or decrease) in interest rates, equity market prices and foreign currency exchange rates. We believe that these changes in market rates and prices is reasonably possible in the near term. In performing the analysis summarized below, we used market rates as of December 31, 2017. We modeled the impact of changes in market rates and prices on the estimated fair values of our market sensitive assets and liabilities as follows:
|
•
|
the net present values of our interest rate sensitive exposures resulting from a 10% change (increase or decrease) in interest rates;
|
|
•
|
the estimated fair value of our equity positions due to a 10% change (increase or decrease) in equity market prices; and
|
|
•
|
the U.S. dollar equivalent of estimated fair values of our foreign currency exposures due to a 10% change (increase in the value of the U.S. dollar compared to the foreign currencies or decrease in the value of the U.S. dollar compared to the foreign currencies) in foreign currency exchange rates.
|
The sensitivity analysis is an estimate and should not be viewed as predictive of our future financial performance. Our actual losses in any particular period may vary from the amounts indicated in the table below. Limitations related to this sensitivity analysis include:
|
•
|
interest sensitive liabilities do not include $
39.6 billion
of insurance contracts, which are accounted for on a book value basis. Management believes that the changes in the economic value of those contracts under changing interest rates would offset a significant portion of the fair value changes of interest sensitive assets;
|
|
•
|
the market risk information is limited by the assumptions and parameters established in creating the related sensitivity analysis, including the impact of prepayment rates on mortgage loans;
|
|
•
|
foreign currency exchange rate risk is not isolated for certain embedded derivatives within host asset and liability contracts, as the risk on these instruments is reflected as equity;
|
|
•
|
for derivatives that qualify for hedge accounting, the impact on reported earnings may be materially different from the change in market values;
|
|
•
|
the analysis excludes limited partnership interests; and
|
|
•
|
the model assumes that the composition of assets and liabilities remains unchanged throughout the period.
|
Accordingly, we use such models as tools and not as substitutes for the experience and judgment of our management.
163
The table below illustrates the potential loss in estimated fair value of our interest sensitive financial instruments due to a 10% increase in the yield curve by type of asset and liability as of:
|
December 31, 2017
|
|||||||||||
|
Notional
Amount
|
Estimated
Fair
Value (1)
|
Assuming a
10% Increase
in the Yield
Curve
|
|||||||||
|
(In millions)
|
|||||||||||
|
Financial assets with interest rate risk
|
|||||||||||
|
Fixed maturity securities
|
$
|
64,991
|
|
$
|
(1,395
|
)
|
|||||
|
Mortgage loans
|
$
|
10,871
|
|
(126
|
)
|
||||||
|
Policy loans
|
$
|
1,740
|
|
(17
|
)
|
||||||
|
Premiums, reinsurance and other receivables
|
$
|
2,113
|
|
(61
|
)
|
||||||
|
Embedded derivatives within asset host contracts (2)
|
$
|
227
|
|
(22
|
)
|
||||||
|
Increase (decrease) in fair value of assets
|
(1,621
|
)
|
|||||||||
|
Financial liabilities with interest rate risk (3)
|
|||||||||||
|
Policyholder account balances
|
$
|
15,927
|
|
236
|
|
||||||
|
Long-term debt
|
$
|
3,639
|
|
93
|
|
||||||
|
Other liabilities
|
$
|
314
|
|
(20
|
)
|
||||||
|
Embedded derivatives within liability host contracts (2)
|
$
|
1,887
|
|
362
|
|
||||||
|
(Increase) decrease in fair value of liabilities
|
671
|
|
|||||||||
|
Derivative instruments with interest rate risk
|
|||||||||||
|
Interest rate contracts
|
$
|
47,968
|
|
$
|
275
|
|
(545
|
)
|
|||
|
Foreign currency contracts
|
$
|
3,072
|
|
$
|
47
|
|
(29
|
)
|
|||
|
Credit contracts
|
$
|
1,965
|
|
$
|
39
|
|
—
|
|
|||
|
Equity contracts
|
$
|
60,544
|
|
$
|
(1,236
|
)
|
(14
|
)
|
|||
|
Increase (decrease) in fair value of derivative instruments
|
(588
|
)
|
|||||||||
|
Net change
|
$
|
(1,538
|
)
|
||||||||
|
(1)
|
Separate account assets and liabilities, which are interest rate sensitive, are not included herein as any interest rate risk is borne by the contract holder.
|
|
(2)
|
Embedded derivatives are recognized in the consolidated balance sheet in the same caption as the host contract.
|
|
(3)
|
Excludes $
39.6 billion
of liabilities, at carrying value, pursuant to insurance contracts reported within future policy benefits and other policy-related balances.
Management believes that the changes in the economic value of those contracts under changing interest rates would offset a significant portion of the fair value changes of interest sensitive assets.
|
Sensitivity Summary
Sensitivity to rising interest rates decreased by $374 million, or 20%, to
$1.5 billion
as of December 31,
2017
from $1.9 billion as of December 31,
2016
. This change was primarily due to lower sensitivity of derivatives used by the Company as hedges against changes in interest rates.
Sensitivity to a 10% rise in equity prices decreased by $514 million, or 88%, to $70 million as of December 31, 2017 from $584 million at December 31, 2016. This change was primarily due to lower sensitivity of derivatives used by the Company as hedges against changes in equity prices.
Sensitivity to a 10% decrease in the U.S. dollar compared to all foreign currencies decreased by $27 million, or 32%, to $58 million as of December 31, 2017 from $85 million at December 31, 2016. This decrease was primarily due to an increase in the sensitivity of foreign currency sensitive assets that was more closely offset by an increase in the sensitivity of our derivative hedges.
164
Index to Consolidated and Combined Financial Statements, Notes and Schedules
|
|
Page
|
|
Financial Statements at December 31, 2017 and 2016 and for the Years Ended December 31, 2017, 2016 and 2015:
|
|
|
Financial Statement Schedules at December 31, 2017 and 2016 and for the Years Ended December 31, 2017, 2016 and 2015:
|
|
165
REPORT OF INDEPENDENT REGISTERED PUBLIC ACCOUNTING FIRM
To the stockholders and the Board of Directors of Brighthouse Financial, Inc.
Opinion on the Financial Statements
We have audited the accompanying consolidated and combined balance sheets of Brighthouse Financial, Inc. and subsidiaries (the “Company”) as of December 31, 2017 and 2016, and the related consolidated and combined statements of operations, comprehensive income (loss), equity, and cash flows for each of the three years in the period ended December 31, 2017, and the related notes and the schedules listed in the Index to the Financial Statements, Notes and Schedules (collectively referred to as the "financial statements"). In our opinion, the financial statements present fairly, in all material respects, the financial position of the Company as of December 31, 2017 and 2016, and the results of its operations and its cash flows for each of the three years in the period ended December 31, 2017, in conformity with accounting principles generally accepted in the United States of America.
Basis for Opinion
These financial statements are the responsibility of the Company’s management. Our responsibility is to express an opinion on the Company’s financial statements based on our audits. We are a public accounting firm registered with the Public Company Accounting Oversight Board (United States) (PCAOB) and are required to be independent with respect to the Company in accordance with the U.S. federal securities laws and applicable rules and regulations of the Securities and Exchange Commission and the PCAOB.
We conducted our audits in accordance with the standards of the PCAOB. Those standards require that we plan and perform the audit to obtain reasonable assurance about whether the financial statements are free of material misstatement, whether due to error or fraud. The Company is not required to have, nor were we engaged to perform, an audit of its internal control over financial reporting. As part of our audits, we are required to obtain an understanding of internal control over financial reporting but not for the purpose of expressing an opinion on the effectiveness of the Company’s internal control over financial reporting. Accordingly, we express no such opinion.
Our audits included performing procedures to assess the risks of material misstatement of the financial statements, whether due to error or fraud, and performing procedures to respond to those risks. Such procedures included examining, on a test basis, evidence regarding the amounts and disclosures in the financial statements. Our audits also included evaluating the accounting principles used and significant estimates made by management, as well as evaluating the overall presentation of the financial statements. We believe that our audits provide a reasonable basis for our opinion.
/s/ DELOITTE & TOUCHE LLP
Charlotte, North Carolina
March 15, 2018
We have served as the Company’s auditor since 2016.
166
Brighthouse Financial, Inc.
Consolidated and Combined Balance Sheets
December 31,
2017
and
2016
(In millions, except share and per share data)
|
2017
|
2016
|
|||||||
|
Assets
|
||||||||
|
Investments:
|
||||||||
|
Fixed maturity securities available-for-sale, at estimated fair value (amortized cost: $60,173 and $58,715, respectively; includes $0 and $3,413, respectively, relating to variable interest entities)
|
$
|
64,991
|
|
$
|
61,388
|
|
||
|
Equity securities available-for-sale, at estimated fair value (cost: $212 and $280, respectively)
|
232
|
|
300
|
|
||||
|
Mortgage loans (net of valuation allowances of $47 and $40, respectively; includes $115 and $136, respectively, at estimated fair value, relating to variable interest entities)
|
10,742
|
|
9,378
|
|
||||
|
Policy loans
|
1,523
|
|
1,517
|
|
||||
|
Real estate joint ventures
|
433
|
|
215
|
|
||||
|
Other limited partnership interests
|
1,669
|
|
1,642
|
|
||||
|
Short-term investments, principally at estimated fair value
|
312
|
|
1,288
|
|
||||
|
Other invested assets, principally at estimated fair value
|
2,436
|
|
4,904
|
|
||||
|
Total investments
|
82,338
|
|
80,632
|
|
||||
|
Cash and cash equivalents, principally at estimated fair value (includes $0 and $9, respectively, relating to variable interest entities)
|
1,857
|
|
5,228
|
|
||||
|
Accrued investment income (includes $1 and $1, respectively, relating to variable interest entities)
|
601
|
|
693
|
|
||||
|
Premiums, reinsurance and other receivables
|
13,525
|
|
14,647
|
|
||||
|
Deferred policy acquisition costs and value of business acquired
|
6,286
|
|
6,293
|
|
||||
|
Current income tax recoverable
|
740
|
|
778
|
|
||||
|
Other assets
|
588
|
|
616
|
|
||||
|
Separate account assets
|
118,257
|
|
113,043
|
|
||||
|
Total assets
|
$
|
224,192
|
|
$
|
221,930
|
|
||
|
Liabilities and Equity
|
||||||||
|
Liabilities
|
||||||||
|
Future policy benefits
|
$
|
36,616
|
|
$
|
33,372
|
|
||
|
Policyholder account balances
|
37,783
|
|
37,526
|
|
||||
|
Other policy-related balances
|
2,985
|
|
3,045
|
|
||||
|
Payables for collateral under securities loaned and other transactions
|
4,169
|
|
7,390
|
|
||||
|
Long-term debt (includes $11 and $23, respectively, at estimated fair value, relating to variable interest entities)
|
3,612
|
|
1,910
|
|
||||
|
Collateral financing arrangement
|
—
|
|
2,797
|
|
||||
|
Deferred income tax liability
|
927
|
|
2,056
|
|
||||
|
Other liabilities (includes $0 and $1, respectively, relating to variable interest entities)
|
5,263
|
|
5,929
|
|
||||
|
Separate account liabilities
|
118,257
|
|
113,043
|
|
||||
|
Total liabilities
|
209,612
|
|
207,068
|
|
||||
|
Contingencies, Commitments and Guarantees (Note 16)
|
|
|
||||||
|
Equity
|
||||||||
|
Brighthouse Financial, Inc.’s stockholders’ equity:
|
||||||||
|
Common stock, par value $0.01 per share; 1,000,000,000 and 100,000 shares authorized, respectively; 119,773,106 and 100,000 shares issued and outstanding, respectively
|
1
|
|
—
|
|
||||
|
Additional paid-in capital
|
12,432
|
|
—
|
|
||||
|
Retained earnings
|
406
|
|
—
|
|
||||
|
Shareholder's net investment
|
—
|
|
13,597
|
|
||||
|
Accumulated other comprehensive income (loss)
|
1,676
|
|
1,265
|
|
||||
|
Total Brighthouse Financial, Inc.’s stockholders’ equity
|
14,515
|
|
14,862
|
|
||||
|
Noncontrolling interests
|
65
|
|
—
|
|
||||
|
Total equity
|
14,580
|
|
14,862
|
|
||||
|
Total liabilities and equity
|
$
|
224,192
|
|
$
|
221,930
|
|
||
See accompanying notes to the consolidated and combined financial statements.
167
Brighthouse Financial, Inc.
For the Years Ended December 31,
2017
,
2016
and
2015
(In millions, except per share data)
|
2017
|
2016
|
2015
|
||||||||||
|
Revenues
|
||||||||||||
|
Premiums
|
$
|
863
|
|
$
|
1,222
|
|
$
|
1,679
|
|
|||
|
Universal life and investment-type product policy fees
|
3,898
|
|
3,782
|
|
4,010
|
|
||||||
|
Net investment income
|
3,078
|
|
3,207
|
|
3,099
|
|
||||||
|
Other revenues
|
651
|
|
736
|
|
422
|
|
||||||
|
Net investment gains (losses):
|
||||||||||||
|
Other-than-temporary impairments on fixed maturity securities
|
(1
|
)
|
(19
|
)
|
(23
|
)
|
||||||
|
Other-than-temporary impairments on fixed maturity securities transferred to other comprehensive income (loss)
|
—
|
|
(3
|
)
|
(8
|
)
|
||||||
|
Other net investment gains (losses)
|
(27
|
)
|
(56
|
)
|
38
|
|
||||||
|
Total net investment gains (losses)
|
(28
|
)
|
(78
|
)
|
7
|
|
||||||
|
Net derivative gains (losses)
|
(1,620
|
)
|
(5,851
|
)
|
(326
|
)
|
||||||
|
Total revenues
|
6,842
|
|
3,018
|
|
8,891
|
|
||||||
|
Expenses
|
||||||||||||
|
Policyholder benefits and claims
|
3,636
|
|
3,903
|
|
3,269
|
|
||||||
|
Interest credited to policyholder account balances
|
1,111
|
|
1,165
|
|
1,259
|
|
||||||
|
Amortization of deferred policy acquisition costs and value of business acquired
|
227
|
|
371
|
|
781
|
|
||||||
|
Other expenses
|
2,483
|
|
2,284
|
|
2,120
|
|
||||||
|
Total expenses
|
7,457
|
|
7,723
|
|
7,429
|
|
||||||
|
Income (loss) before provision for income tax
|
(615
|
)
|
(4,705
|
)
|
1,462
|
|
||||||
|
Provision for income tax expense (benefit)
|
(237
|
)
|
(1,766
|
)
|
343
|
|
||||||
|
Net income (loss)
|
$
|
(378
|
)
|
$
|
(2,939
|
)
|
$
|
1,119
|
|
|||
|
Earnings per common share
|
||||||||||||
|
Basic
|
$
|
(3.16
|
)
|
$
|
(24.54
|
)
|
$
|
9.34
|
|
|||
See accompanying notes to the consolidated and combined financial statements.
168
Brighthouse Financial, Inc.
Consolidated and Combined Statements of Comprehensive Income (Loss)
For the Years Ended December 31,
2017
,
2016
and
2015
(In millions)
|
2017
|
2016
|
2015
|
|||||||||
|
Net income (loss)
|
$
|
(378
|
)
|
$
|
(2,939
|
)
|
$
|
1,119
|
|
||
|
Other comprehensive income (loss):
|
|||||||||||
|
Unrealized investment gains (losses), net of related offsets
|
336
|
|
(421
|
)
|
(1,898
|
)
|
|||||
|
Unrealized gains (losses) on derivatives
|
(175
|
)
|
26
|
|
95
|
|
|||||
|
Foreign currency translation adjustments
|
10
|
|
1
|
|
(25
|
)
|
|||||
|
Defined benefit plans adjustment
|
(19
|
)
|
3
|
|
(6
|
)
|
|||||
|
Other comprehensive income (loss), before income tax
|
152
|
|
(391
|
)
|
(1,834
|
)
|
|||||
|
Income tax (expense) benefit related to items of other comprehensive income (loss)
|
259
|
|
133
|
|
642
|
|
|||||
|
Other comprehensive income (loss), net of income tax
|
411
|
|
(258
|
)
|
(1,192
|
)
|
|||||
|
Comprehensive income (loss)
|
$
|
33
|
|
$
|
(3,197
|
)
|
$
|
(73
|
)
|
||
See accompanying notes to the consolidated and combined financial statements.
169
Brighthouse Financial, Inc.
Consolidated and Combined Statements of Equity
For the Years Ended
December 31, 2017
,
2016
and
2015
(In millions)
|
Shareholder’s Net Investment
|
Common Stock
|
Additional Paid-in Capital
|
Retained Earnings
|
Accumulated
Other
Comprehensive
Income (Loss)
|
Brighthouse Financial, Inc.'s Stockholders’ Equity
|
Noncontrolling Interests
|
Total
Equity
|
|||||||||||||||||||||||||
|
Balance at December 31, 2014
|
$
|
14,810
|
|
$
|
—
|
|
$
|
—
|
|
$
|
—
|
|
$
|
2,715
|
|
$
|
17,525
|
|
$
|
—
|
|
$
|
17,525
|
|
||||||||
|
Change in net investment
|
(613
|
)
|
(613
|
)
|
(613
|
)
|
||||||||||||||||||||||||||
|
Net income (loss)
|
1,119
|
|
1,119
|
|
1,119
|
|
||||||||||||||||||||||||||
|
Other comprehensive income (loss), net of income tax
|
(1,192
|
)
|
(1,192
|
)
|
(1,192
|
)
|
||||||||||||||||||||||||||
|
Balance at December 31, 2015
|
15,316
|
|
—
|
|
—
|
|
—
|
|
1,523
|
|
16,839
|
|
—
|
|
16,839
|
|
||||||||||||||||
|
Change in net investment
|
1,220
|
|
1,220
|
|
1,220
|
|
||||||||||||||||||||||||||
|
Net income (loss)
|
(2,939
|
)
|
(2,939
|
)
|
(2,939
|
)
|
||||||||||||||||||||||||||
|
Other comprehensive income (loss), net of income tax
|
(258
|
)
|
(258
|
)
|
(258
|
)
|
||||||||||||||||||||||||||
|
Balance at December 31, 2016
|
13,597
|
|
—
|
|
—
|
|
—
|
|
1,265
|
|
14,862
|
|
—
|
|
14,862
|
|
||||||||||||||||
|
Issuance of common stock to MetLife, Inc.
|
1
|
|
1
|
|
1
|
|
||||||||||||||||||||||||||
|
Distribution to MetLife, Inc.
|
(1,798
|
)
|
(1,798
|
)
|
(1,798
|
)
|
||||||||||||||||||||||||||
|
Other Separation related transactions
|
1,718
|
|
1,718
|
|
1,718
|
|
||||||||||||||||||||||||||
|
Net income (loss)
|
(1,085
|
)
|
707
|
|
(378
|
)
|
(378
|
)
|
||||||||||||||||||||||||
|
Effect of change in accounting principle (Note 1)
|
(301
|
)
|
301
|
|
—
|
|
—
|
|
||||||||||||||||||||||||
|
Separation from MetLife, Inc.
|
(12,433
|
)
|
1
|
|
12,432
|
|
—
|
|
—
|
|
||||||||||||||||||||||
|
Change in noncontrolling interests
|
—
|
|
65
|
|
65
|
|
||||||||||||||||||||||||||
|
Other comprehensive income (loss), net of income tax
|
110
|
|
110
|
|
110
|
|
||||||||||||||||||||||||||
|
Balance at December 31, 2017
|
$
|
—
|
|
$
|
1
|
|
$
|
12,432
|
|
$
|
406
|
|
$
|
1,676
|
|
$
|
14,515
|
|
$
|
65
|
|
$
|
14,580
|
|
||||||||
See accompanying notes to the consolidated and combined financial statements.
170
Brighthouse Financial, Inc.
For the Years Ended
December 31, 2017
,
2016
and
2015
(In millions)
|
2017
|
2016
|
2015
|
||||||||||
|
Cash flows from operating activities
|
||||||||||||
|
Net income (loss)
|
$
|
(378
|
)
|
$
|
(2,939
|
)
|
$
|
1,119
|
|
|||
|
Adjustments to reconcile net income (loss) to net cash provided by (used in) operating activities:
|
||||||||||||
|
Depreciation and amortization expenses
|
17
|
|
17
|
|
26
|
|
||||||
|
Amortization of premiums and accretion of discounts associated with investments, net
|
(276
|
)
|
(235
|
)
|
(240
|
)
|
||||||
|
(Gains) losses on investments, net
|
28
|
|
78
|
|
(7
|
)
|
||||||
|
(Gains) losses on derivatives, net
|
3,000
|
|
7,093
|
|
1,221
|
|
||||||
|
(Income) loss from equity method investments, net of dividends and distributions
|
(46
|
)
|
(7
|
)
|
118
|
|
||||||
|
Interest credited to policyholder account balances
|
1,111
|
|
1,165
|
|
1,259
|
|
||||||
|
Universal life and investment-type product policy fees
|
(3,898
|
)
|
(3,782
|
)
|
(4,010
|
)
|
||||||
|
Goodwill impairment
|
—
|
|
161
|
|
—
|
|
||||||
|
Change in accrued investment income
|
(80
|
)
|
(33
|
)
|
1
|
|
||||||
|
Change in premiums, reinsurance and other receivables
|
197
|
|
40
|
|
(394
|
)
|
||||||
|
Change in deferred policy acquisition costs and value of business acquired, net
|
(33
|
)
|
38
|
|
382
|
|
||||||
|
Change in income tax
|
(117
|
)
|
(2,084
|
)
|
731
|
|
||||||
|
Change in other assets
|
2,254
|
|
2,240
|
|
2,348
|
|
||||||
|
Change in future policy benefits and other policy-related balances
|
1,418
|
|
2,438
|
|
2,295
|
|
||||||
|
Change in other liabilities
|
70
|
|
(586
|
)
|
(247
|
)
|
||||||
|
Other, net
|
129
|
|
132
|
|
29
|
|
||||||
|
Net cash provided by (used in) operating activities
|
3,396
|
|
3,736
|
|
4,631
|
|
||||||
|
Cash flows from investing activities
|
||||||||||||
|
Sales, maturities and repayments of:
|
||||||||||||
|
Fixed maturity securities
|
17,214
|
|
46,130
|
|
38,885
|
|
||||||
|
Equity securities
|
97
|
|
224
|
|
308
|
|
||||||
|
Mortgage loans
|
742
|
|
1,602
|
|
1,105
|
|
||||||
|
Real estate and real estate joint ventures
|
77
|
|
450
|
|
512
|
|
||||||
|
Other limited partnership interests
|
264
|
|
417
|
|
426
|
|
||||||
|
Purchases of:
|
||||||||||||
|
Fixed maturity securities
|
(18,782
|
)
|
(39,687
|
)
|
(44,058
|
)
|
||||||
|
Equity securities
|
(2
|
)
|
(58
|
)
|
(273
|
)
|
||||||
|
Mortgage loans
|
(2,041
|
)
|
(2,855
|
)
|
(2,570
|
)
|
||||||
|
Real estate and real estate joint ventures
|
(268
|
)
|
(75
|
)
|
(109
|
)
|
||||||
|
Other limited partnership interests
|
(263
|
)
|
(203
|
)
|
(233
|
)
|
||||||
|
Cash received in connection with freestanding derivatives
|
1,865
|
|
709
|
|
227
|
|
||||||
|
Cash paid in connection with freestanding derivatives
|
(3,831
|
)
|
(2,765
|
)
|
(871
|
)
|
||||||
|
Cash received under repurchase agreements
|
—
|
|
—
|
|
199
|
|
||||||
|
Cash paid under repurchase agreements
|
—
|
|
—
|
|
(199
|
)
|
||||||
|
Cash received under reverse repurchase agreements
|
—
|
|
—
|
|
199
|
|
||||||
|
Cash paid under reverse repurchase agreements
|
—
|
|
—
|
|
(199
|
)
|
||||||
|
Sale of loans to a former affiliate
|
—
|
|
—
|
|
26
|
|
||||||
|
Receipts on loans to a former affiliate
|
—
|
|
50
|
|
—
|
|
||||||
|
Net change in policy loans
|
(6
|
)
|
111
|
|
(77
|
)
|
||||||
|
Net change in short-term investments
|
1,030
|
|
616
|
|
(316
|
)
|
||||||
|
Net change in other invested assets
|
(13
|
)
|
8
|
|
(24
|
)
|
||||||
|
Other, net
|
2
|
|
—
|
|
—
|
|
||||||
|
Net cash provided by (used in) investing activities
|
$
|
(3,915
|
)
|
$
|
4,674
|
|
$
|
(7,042
|
)
|
|||
See accompanying notes to the consolidated and combined financial statements.
171
Brighthouse Financial, Inc.
Consolidated and Combined Statements of Cash Flows (continued)
For the Years Ended
December 31, 2017
,
2016
and
2015
(In millions)
|
2017
|
2016
|
2015
|
||||||||||
|
Cash flows from financing activities
|
||||||||||||
|
Policyholder account balances:
|
||||||||||||
|
Deposits
|
$
|
4,990
|
|
$
|
10,712
|
|
$
|
20,953
|
|
|||
|
Withdrawals
|
(3,103
|
)
|
(12,379
|
)
|
(21,178
|
)
|
||||||
|
Net change in payables for collateral under securities loaned and other transactions
|
(3,147
|
)
|
(3,247
|
)
|
3,126
|
|
||||||
|
Long-term debt issued
|
3,588
|
|
—
|
|
175
|
|
||||||
|
Long-term debt repaid
|
(13
|
)
|
(26
|
)
|
(235
|
)
|
||||||
|
Collateral financing arrangement repaid
|
(2,797
|
)
|
—
|
|
—
|
|
||||||
|
Distribution to MetLife, Inc.
|
(1,798
|
)
|
—
|
|
—
|
|
||||||
|
Cash received from MetLife, Inc. in connection with shareholder’s net investment
|
293
|
|
1,833
|
|
406
|
|
||||||
|
Cash paid to MetLife, Inc. in connection with shareholder’s net investment
|
(668
|
)
|
(634
|
)
|
(771
|
)
|
||||||
|
Financing element on certain derivative instruments and other derivative related transactions, net
|
(149
|
)
|
(1,011
|
)
|
(96
|
)
|
||||||
|
Other, net
|
(48
|
)
|
—
|
|
—
|
|
||||||
|
Net cash provided by (used in) financing activities
|
(2,852
|
)
|
(4,752
|
)
|
2,380
|
|
||||||
|
Effect of change in foreign currency exchange rates on cash and cash equivalents balances
|
—
|
|
—
|
|
(2
|
)
|
||||||
|
Change in cash and cash equivalents
|
(3,371
|
)
|
3,658
|
|
(33
|
)
|
||||||
|
Cash and cash equivalents, beginning of year
|
5,228
|
|
1,570
|
|
1,603
|
|
||||||
|
Cash and cash equivalents, end of year
|
$
|
1,857
|
|
$
|
5,228
|
|
$
|
1,570
|
|
|||
|
Supplemental disclosures of cash flow information
|
||||||||||||
|
Net cash paid (received) for:
|
||||||||||||
|
Interest
|
$
|
155
|
|
$
|
186
|
|
$
|
195
|
|
|||
|
Income tax
|
$
|
(637
|
)
|
$
|
189
|
|
$
|
(405
|
)
|
|||
|
Non-cash transactions:
|
||||||||||||
|
Transfer of fixed maturity securities from former affiliates
|
$
|
—
|
|
$
|
4,030
|
|
$
|
—
|
|
|||
|
Transfer of mortgage loans from former affiliates
|
$
|
—
|
|
$
|
662
|
|
$
|
—
|
|
|||
|
Transfer of short-term investments from former affiliates
|
$
|
—
|
|
$
|
94
|
|
$
|
—
|
|
|||
|
Transfer of fixed maturity securities to former affiliates
|
$
|
293
|
|
$
|
346
|
|
$
|
—
|
|
|||
|
Reduction of other invested assets in connection with affiliated reinsurance transactions
|
$
|
—
|
|
$
|
676
|
|
$
|
—
|
|
|||
|
Reduction of policyholder account balances in connection with reinsurance transactions
|
$
|
293
|
|
$
|
—
|
|
$
|
—
|
|
|||
See accompanying notes to the consolidated and combined financial statements.
172
Brighthouse Financial, Inc.
Notes to the Consolidated and Combined Financial Statements
1. Business, Basis of Presentation and Summary of Significant Accounting Policies
Business
“Brighthouse” and the “Company” refer to Brighthouse Financial, Inc. and its subsidiaries (formerly, MetLife U.S. Retail Separation Business). Brighthouse Financial, Inc. is a holding company formed to own the legal entities that historically operated a substantial portion of MetLife, Inc.’s former Retail segment. Brighthouse Financial, Inc. was incorporated in Delaware on August 1, 2016 in preparation for MetLife, Inc.’s separation of a substantial portion of its former Retail segment, as well as certain portions of its Corporate Benefit Funding segment (the “Separation”), which was completed on August 4, 2017.
The Company offers a range of individual annuities and individual life insurance products. The Company reports results through
three
segments:
Annuities, Life and Run-off. In addition, the Company reports certain of its results in Corporate & Other.
On January 12, 2016, MetLife, Inc. (MetLife, Inc., together with its subsidiaries and affiliates, “MetLife”) announced its plan to pursue the separation of a substantial portion of its former U.S. retail business. Additionally, on July 21, 2016, MetLife, Inc. announced that the separated business would be rebranded as “Brighthouse Financial.”
On October 5, 2016, Brighthouse Financial, Inc., which until the completion of the Separation on August 4, 2017, was a wholly-owned subsidiary of MetLife, Inc., filed a registration statement on Form 10 (as amended, the “Form 10”) with the U.S. Securities and Exchange Commission (“SEC”) that was declared effective by the SEC on July 6, 2017. The Form 10 disclosed MetLife, Inc.’s plans to undertake several actions, including an internal reorganization involving its U.S. retail business (the “Restructuring”) and include Brighthouse Life Insurance Company, Brighthouse Life Insurance Company of NY (“BHNY”), New England Life Insurance Company (“NELICO”), Brighthouse Reinsurance Company of Delaware (“BRCD”) and Brighthouse Investment Advisers, LLC in the planned separated business and distribute at least
80.1%
of the shares of Brighthouse Financial, Inc.’s common stock on a pro rata basis to the holders of MetLife, Inc. common stock. In connection with the Restructuring, effective April 2017, following receipt of applicable regulatory approvals, MetLife, Inc. contributed certain affiliated reinsurance companies and BHNY to Brighthouse Life Insurance Company. The affiliated reinsurance companies, which included MetLife Reinsurance Company of Delaware (“MRD”), MetLife Reinsurance Company of South Carolina (“MRSC”) and a designated protected cell of MetLife Reinsurance Company of Vermont (“MRV Cell”), were then merged into BRCD, a licensed reinsurance subsidiary of Brighthouse Life Insurance Company. On July 28, 2017, MetLife, Inc. contributed Brighthouse Holdings, LLC (“BH Holdings”) to Brighthouse Financial, Inc. See
Notes
10
and
14
.
On August 4, 2017, Brighthouse Financial, Inc. entered into the Master Separation Agreement with MetLife and MetLife, Inc. completed the Separation through a distribution of
80.8%
of MetLife, Inc.’s interest in Brighthouse Financial, Inc., to holders of MetLife, Inc.’s common stock and retained the remaining
19.2%
. As a result, Brighthouse Financial, Inc. is now an independent, publicly traded company on the Nasdaq Stock Market under the symbol “BHF.”
Basis of Presentation
The preparation of financial statements in conformity with accounting principles generally accepted in the United States of America (“GAAP”) requires management to adopt accounting policies and make estimates and assumptions that affect amounts reported on the consolidated financial statements. In applying these policies and estimates, management makes subjective and complex judgments that frequently require assumptions about matters that are inherently uncertain. Many of these policies, estimates and related judgments are common in the insurance and financial services industries; others are specific to the Company’s business and operations. Actual results could differ from these estimates.
Consolidation
The financial statements presented in this annual report for periods on or after the Separation are presented on a consolidated basis and
include the financial position, results of operations and cash flows of the Company. The accompanying consolidated financial statements include the accounts of Brighthouse Financial, Inc. and its subsidiaries, as well as partnerships and joint ventures in which the Company has control, and variable interest entities (“VIEs”) for which the Company is the primary beneficiary. Intercompany accounts and transactions have been eliminated.
The Company uses the equity method of accounting for equity securities when it has significant influence or at least 20% interest and for real estate joint ventures and other limited partnership interests (“investee”) when it has more than a minor ownership interest or more than a minor influence over the investee’s operations. The Company generally recognizes its share of the investee’s earnings on a three-month lag in instances where the investee’s financial information is not sufficiently timely or when the investee’s reporting period differs from the Company’s reporting period. The Company uses the cost method of accounting for investments in which it has virtually no influence over the investee’s operations.
173
Brighthouse Financial, Inc.
Notes to the Consolidated and Combined Financial Statements (continued)
1. Business, Basis of Presentation and Summary of Significant Accounting Policies (continued)
Combination
The financial statements for the periods prior to the Separation are presented on a combined basis and reflect the historical combined financial position, results of operations and cash flows. The combined balance sheets include the attribution of certain assets and liabilities that were historically held at the MetLife corporate level but which were specifically identifiable or attributable to the Company. Similarly, certain assets attributable to shared services managed at the MetLife corporate level were excluded from the combined balance sheets. The combined statements of operations reflect certain corporate expenses allocated to the Company by MetLife for certain corporate functions and for shared services provided by MetLife. These expenses were allocated to the Company based on direct usage or benefit where specifically identifiable, with the remainder allocated based upon other reasonable allocation measures. The Company considers the expense methodology and results to be reasonable for all periods presented.
See
Note 16
for further information on expenses allocated by MetLife.
The Company previously recorded affiliated transactions with certain MetLife subsidiaries which are not included in the combined financial statements of the Company.
The income tax amounts in these combined financial statements have been calculated based on a separate return methodology and presented as if each company was a separate taxpayer in its respective jurisdiction.
The historical financial results in the combined financial statements presented may not be indicative of the results that would have been achieved by the Company had it operated as a separate, stand-alone entity prior to the Separation. The combined financial statements presented do not reflect any changes that may occur in the Company’s financing and operations in connection with or as a result of the Separation. Management believes that the combined financial statements include all adjustments necessary for a fair presentation of the business.
Reclassifications
Certain amounts in the prior years’ combined financial statements and related footnotes thereto have been reclassified to conform with the current year presentation as discussed throughout the Notes to the Consolidated and Combined Financial Statements.
Summary of Significant Accounting Policies
The following are the Company’s significant accounting policies with references to notes providing additional information on such policies and critical accounting estimates relating to such policies.
|
Accounting Policy
|
Note
|
|
Insurance
|
3
|
|
Deferred Policy Acquisition Costs, Value of Business Acquired and Other Intangibles
|
4
|
|
Reinsurance
|
5
|
|
Investments
|
6
|
|
Derivatives
|
7
|
|
Fair Value
|
8
|
|
Income Tax
|
13
|
|
Litigation Contingencies
|
15
|
Insurance
Future Policy Benefit Liabilities and Policyholder Account Balances
The Company establishes liabilities for future amounts payable under insurance policies. Insurance liabilities are generally calculated as the present value of future expected benefits to be paid, reduced by the present value of future expected premiums. Such liabilities are established based on methods and underlying assumptions that are in accordance with GAAP and applicable actuarial standards. The principal assumptions used in the establishment of liabilities for future policy benefits are mortality, morbidity, benefit utilization and withdrawals, policy lapse, retirement, disability incidence, disability terminations, investment returns, inflation, expenses and other contingent events as appropriate to the respective product type.
174
Brighthouse Financial, Inc.
Notes to the Consolidated and Combined Financial Statements (continued)
1. Business, Basis of Presentation and Summary of Significant Accounting Policies (continued)
For traditional long duration insurance contracts (term and whole-life insurance and immediate annuities), assumptions are determined at issuance of the policy and remain “locked-in” unless a premium deficiency exists. A premium deficiency exists when the liability for future policy benefits plus the present value of expected future gross premiums are less than expected future benefits and expenses (based on current assumptions). When a premium deficiency exists, the Company will reduce any deferred acquisition costs and may also establish an additional liability to eliminate the deficiency. To assess whether a premium deficiency exists, the Company groups insurance contracts based on the manner acquired, serviced and the measurement of profitability. In applying the profitability criteria, groupings are limited by segment.
Liabilities for universal life insurance with secondary guarantees are determined by estimating the expected value of death benefits payable when the account balance is projected to be zero and recognizing those benefits ratably over the contract period based on total expected assessments. The assumptions used in estimating the secondary guarantee liabilities are consistent with those used for amortizing deferred policy acquisition costs (“DAC”), and are reviewed and updated at least annually. The assumptions of investment performance and volatility for variable products are consistent with historical experience of the appropriate underlying equity indices, such as the Standard & Poor’s Global Ratings (“S&P”) 500 Index. The benefits used in calculating the liabilities are based on the average benefits payable over a range of scenarios.
In certain cases, the liability for an insurance product may be sufficient in the aggregate, but the pattern of future earnings may result in profits followed by losses. In these situations, the Company may establish an additional liability to offset the losses that are expected to be recognized in later years.
Policyholder account balances relate to customer deposits on universal life insurance and fixed and variable deferred annuity contracts and are equal to the sum of deposits, plus interest credited, less charges and withdrawals.
See “— Variable Annuity Guarantees” for additional information on the Company’s variable annuity guarantee features that are accounted for as insurance liabilities and recorded in future policy benefits, as well as the guarantee features that are accounted for at fair value as embedded derivatives and recorded in policyholder account balances.
Recognition of Insurance Revenues and Deposits
Premiums related to traditional life insurance and annuity contracts with life contingencies are recognized as revenues when due from policyholders. When premiums are due over a significantly shorter period than the period over which policyholder benefits are incurred, any excess profit is deferred and recognized into earnings in proportion to insurance in-force or, for annuities, the amount of expected future policy benefit payments.
Deposits related to universal life insurance, fixed and variable deferred annuity contracts and investment-type products are credited to policyholder account balances. Revenues from such contracts consist of asset-based investment management fees, mortality charges, risk charges, policy administration fees and surrender charges. These fees are recognized when assessed to the contract holder and are included in universal life and investment-type product policy fees on the statements of operations.
Premiums, policy fees, policyholder benefits and expenses are presented net of reinsurance.
Deferred Policy Acquisition Costs, Value of Business Acquired and Other Intangibles
The Company incurs significant costs in connection with acquiring new and renewal insurance business. Costs that are related directly to the successful acquisition or renewal of insurance contracts are capitalized as DAC. Such costs include:
|
•
|
incremental direct costs of contract acquisition, such as commissions;
|
|
•
|
the portion of an employee’s total compensation and benefits related to time spent selling, underwriting or processing the issuance of new and renewal insurance business only with respect to actual policies acquired or renewed; and
|
|
•
|
other essential direct costs that would not have been incurred had a policy not been acquired or renewed.
|
All other acquisition-related costs, including those related to general advertising and solicitation, market research, agent training, product development, unsuccessful sales and underwriting efforts, as well as all indirect costs, are expensed as incurred.
175
Brighthouse Financial, Inc.
Notes to the Consolidated and Combined Financial Statements (continued)
1. Business, Basis of Presentation and Summary of Significant Accounting Policies (continued)
Value of business acquired (
“VOBA”
) is an intangible asset resulting from a business combination that represents the excess of book value over the estimated fair value of acquired insurance, annuity, and investment-type contracts in-force as of the acquisition date. The estimated fair value of the acquired liabilities is based on projections, by each block of business, of future policy and contract charges, premiums, mortality and morbidity, separate account performance, surrenders, operating expenses, investment returns, nonperformance risk adjustment and other factors. Actual experience on the purchased business may vary from these projections.
DAC and VOBA on traditional long-duration insurance contracts is amortized based on actual and expected future gross premiums while DAC and VOBA on fixed and variable universal life insurance and deferred annuities is amortized based on estimated gross profits. The recoverability of DAC and VOBA is dependent upon the future profitability of the related business. DAC and VOBA are aggregated on the financial statements for reporting purposes.
See Note
4
for additional information on DAC and VOBA amortization.
The Company also has deferred sales inducements (“DSI”) and value of distribution agreements (“VODA”) which are included in other assets. The Company defers sales inducements and amortizes them over the life of the policy using the same methodology and assumptions used to amortize DAC. The amortization of DSI is included in policyholder benefits and claims. VODA
represents the present value of expected future profits associated with the expected future business derived from the distribution agreements acquired as part of a business combination. The VODA associated with past business combinations is amortized over useful lives ranging from
10
to
40
years and such amortization is included in other expenses.
Each year, or more frequently if circumstances indicate a possible impairment exists, the Company reviews DSI and VODA to determine whether the assets are impaired.
Reinsurance
For each of its reinsurance agreements, the Company determines whether the agreement provides indemnification against loss or liability relating to insurance risk in accordance with applicable accounting standards. Cessions under reinsurance agreements do not discharge the Company’s obligations as the primary insurer. The Company reviews all contractual features, including those that may limit the amount of insurance risk to which the reinsurer is subject or features that delay the timely reimbursement of claims.
For reinsurance of existing in-force blocks of long-duration contracts that transfer significant insurance risk, the difference, if any, between the amounts paid (received), and the liabilities ceded (assumed) related to the underlying contracts is considered the net cost of reinsurance at the inception of the reinsurance agreement. The net cost of reinsurance is recorded as an adjustment to DAC when there is a gain at inception on the ceding entity and to other liabilities when there is a loss at inception. The net cost of reinsurance is recognized as a component of other expenses when there is a gain at inception and as policyholder benefits and claims when there is a loss and is subsequently amortized on a basis consistent with the methodology used for amortizing DAC related to the underlying reinsured contracts. Subsequent amounts paid (received) on the reinsurance of in-force blocks, as well as amounts paid (received) related to new business, are recorded as ceded (assumed) premiums and ceded (assumed) premiums, reinsurance and other receivables (future policy benefits) are established.
Amounts currently recoverable under reinsurance agreements are included in premiums, reinsurance and other receivables and amounts currently payable are included in other liabilities. Assets and liabilities relating to reinsurance agreements with the same reinsurer may be recorded net on the balance sheet, if a right of offset exists within the reinsurance agreement. If reinsurers do not meet their obligations to the Company under the terms of the reinsurance agreements, reinsurance recoverable balances could become uncollectible. In such instances, reinsurance recoverable balances are stated net of allowances for uncollectible reinsurance.
The funds withheld liability represents amounts withheld by the Company in accordance with the terms of the reinsurance agreements. Under certain reinsurance agreements, the Company withholds the funds rather than transferring the underlying investments and, as a result, records funds withheld liability within other liabilities. The Company recognizes interest on funds withheld, included in other expenses, at rates defined by the terms of the agreement which may be contractually specified or directly related to the investment portfolio.
176
Brighthouse Financial, Inc.
Notes to the Consolidated and Combined Financial Statements (continued)
1. Business, Basis of Presentation and Summary of Significant Accounting Policies (continued)
Premiums, fees and policyholder benefits and claims include amounts assumed under reinsurance agreements and are net of reinsurance ceded. Amounts received from reinsurers for policy administration are reported in other revenues. With respect to guaranteed minimum income benefits (“GMIBs”), a portion of the directly written GMIBs are accounted for as insurance liabilities, but the associated reinsurance agreements contain embedded derivatives. These embedded derivatives are included in premiums, reinsurance and other receivables with changes in estimated fair value reported in net derivative gains (losses).
If the Company determines that a reinsurance agreement does not expose the reinsurer to a reasonable possibility of a significant loss from insurance risk, the Company records the agreement using the deposit method of accounting. Deposits received are included in other liabilities and deposits made are included within premiums, reinsurance and other receivables. As amounts are paid or received, consistent with the underlying contracts, the deposit assets or liabilities are adjusted. Interest on such deposits is recorded as other revenues or other expenses, as appropriate. Periodically, the Company evaluates the adequacy of the expected payments or recoveries and adjusts the deposit asset or liability through other revenues or other expenses, as appropriate. Certain previously assumed non-life contingent portion of guaranteed minimum withdrawal benefits (“GMWBs”), guaranteed minimum accumulation benefits (“GMABs”) and GMIBs are also accounted for as embedded derivatives with changes in estimated fair value reported in net derivative gains (losses).
Variable Annuity Guarantees
The Company issues directly and previously assumed from a former affiliate through reinsurance certain variable annuity products with guaranteed minimum benefits that provide the policyholder a minimum return based on their initial deposit (the “Benefit Base”) less withdrawals. In some cases, the Benefit Base may be increased by additional deposits, bonus amounts, accruals or optional market value step-ups.
Certain of the Company’s variable annuity guarantee features are accounted for as insurance liabilities and recorded in future policy benefits while others are accounted for at fair value as embedded derivatives and recorded in policyholder account balances. Generally, a guarantee is accounted for as an insurance liability if the guarantee is paid only upon either (i) the occurrence of a specific insurable event, or (ii) annuitization. Alternatively, a guarantee is accounted for as an embedded derivative if a guarantee is paid without requiring (i) the occurrence of specific insurable event, or (ii) the policyholder to annuitize, that is, the policyholder can receive the guarantee on a net basis. In certain cases, a guarantee may have elements of both an insurance liability and an embedded derivative and in such cases the guarantee is split and accounted for under both models. Further, changes in assumptions, principally involving behavior, can result in a change of expected future cash outflows of a guarantee between portions accounted for as insurance liabilities and portions accounted for as embedded derivatives.
Guarantees accounted for as insurance liabilities in future policy benefits include guaranteed minimum death benefits (“GMDBs”), the life contingent portion of the GMWBs and the portion of the GMIBs that require annuitization, as well as the life contingent portion of the expected annuitization when the policyholder is forced into an annuitization upon depletion of their account value.
These insurance liabilities are accrued over the accumulation phase of the contract in proportion to actual and future expected policy assessments based on the level of guaranteed minimum benefits generated using multiple scenarios of separate account returns. The scenarios are based on best estimate assumptions consistent with those used to amortize DAC. When current estimates of future benefits exceed those previously projected or when current estimates of future assessments are lower than those previously projected, liabilities will increase, resulting in a current period charge to net income. The opposite result occurs when the current estimates of future benefits are lower than those previously projected or when current estimates of future assessments exceed those previously projected. At each reporting period, the actual amount of business remaining in-force is updated, which impacts expected future assessments and the projection of estimated future benefits resulting in a current period charge or increase to earnings. See
Note 3
for additional details of guarantees accounted for as insurance liabilities.
Guarantees accounted for as embedded derivatives in policyholder account balances include the non-life contingent portion of GMWBs,
GMABs,
and for GMIBs the non-life contingent portion of the expected annuitization when the policyholder is forced into an annuitization upon depletion of their account value, as well as the Guaranteed Principal Option.
177
Brighthouse Financial, Inc.
Notes to the Consolidated and Combined Financial Statements (continued)
1. Business, Basis of Presentation and Summary of Significant Accounting Policies (continued)
The estimated fair values of guarantees accounted for as embedded derivatives are determined based on the present value of projected future benefits minus the present value of projected future fees. At policy inception, the Company attributes to the embedded derivative a portion of the projected future guarantee fees to be collected from the policyholder equal to the present value of projected future guaranteed benefits. Any additional fees represent “excess” fees and are reported in universal life and investment-type product policy fees. In valuing the embedded derivative, the percentage of fees included in the fair value measurement is locked-in at inception.
The projections of future benefits and future fees require capital market and actuarial assumptions including expectations concerning policyholder behavior. A risk neutral valuation methodology is used to project the cash flows from the guarantees under multiple capital market scenarios to determine an economic liability. The reported estimated fair value is then determined by taking the present value of these risk-free generated cash flows using a discount rate that incorporates a spread over the risk-free rate to reflect the Company’s nonperformance risk and adding a risk margin. For more information on the determination of estimated fair value. See
Note 8
.
Investments
Net Investment Income and Net Investment Gains (Losses)
Income from investments is reported within net investment income, unless otherwise stated herein. Gains and losses on sales of investments, impairment losses and changes in valuation allowances are reported within net investment gains (losses), unless otherwise stated herein.
Fixed Maturity and Equity Securities
The Company’s fixed maturity and equity securities are classified as available-for-sale (“AFS”) and are reported at their estimated fair value. Unrealized investment gains and losses on these securities are recorded as a separate component of other comprehensive income (loss) (“OCI”), net of policy-related amounts and deferred income taxes. All security transactions are recorded on a trade date basis. Investment gains and losses on sales are determined on a specific identification basis.
Interest income and prepayment fees are recognized when earned. Interest income is recognized using an effective yield method giving effect to amortization of premiums and accretion of discounts and is based on the estimated economic life of the securities, which for residential mortgage-backed securities (“RMBS”), commercial mortgage-backed securities (“CMBS”) and asset-backed securities (“ABS”) (collectively, “Structured Securities”) considers the estimated timing and amount of prepayments of the underlying loans. The amortization of premium and accretion of discount of fixed maturity securities also takes into consideration call and maturity dates.
Amortization of premium and accretion of discount on Structured Securities considers the estimated timing and amount of prepayments of the underlying loans. Actual prepayment experience is periodically reviewed and effective yields are recalculated when differences arise between the originally anticipated and the actual prepayments received and currently anticipated. Prepayment assumptions for Structured Securities are estimated using inputs obtained from third-party specialists and based on management’s knowledge of the current market. For credit-sensitive Structured Securities and certain prepayment-sensitive securities, the effective yield is recalculated on a prospective basis. For all other Structured Securities, the effective yield is recalculated on a retrospective basis.
The Company periodically evaluates fixed maturity and equity securities for impairment. The assessment of whether impairments have occurred is based on management’s case-by-case evaluation of the underlying reasons for the decline in estimated fair value, as well as an analysis of the gross unrealized losses by severity and/or age. See
Note 6
“—Evaluation of AFS Securities for OTTI and Evaluating Temporarily Impaired AFS Securities.”
For fixed maturity securities in an unrealized loss position, an other-than-temporary impairment (“OTTI”) is recognized in earnings when it is anticipated that the amortized cost will not be recovered. When either: (i) the Company has the intent to sell the security; or (ii) it is more likely than not that the Company will be required to sell the security before recovery, the OTTI recognized in earnings is the entire difference between the security’s amortized cost and estimated fair value. If neither of these conditions exists, the difference between the amortized cost of the security and the present value of projected future cash flows expected to be collected is recognized as an OTTI in earnings (“credit loss”). If the estimated fair value is less than the present value of projected future cash flows expected to be collected, this portion of OTTI related to other-than-credit factors (“noncredit loss”) is recorded in OCI.
178
Brighthouse Financial, Inc.
Notes to the Consolidated and Combined Financial Statements (continued)
1. Business, Basis of Presentation and Summary of Significant Accounting Policies (continued)
Mortgage Loans
Mortgage loans are stated at unpaid principal balance, adjusted for any unamortized premium or discount, and any deferred fees or expenses, and are net of valuation allowances. Interest income and prepayment fees are recognized when earned. Interest income is recognized using an effective yield method giving effect to amortization of premiums and accretion of discounts. See
Note 6
for information on impairments on mortgage loans.
Also included in mortgage loans are commercial mortgage loans held by consolidated securitization entities (“CSEs”) for which the fair value option (“FVO”) was elected, which are stated at estimated fair value. Changes in estimated fair value are recognized in net investment gains (losses) for commercial mortgage loans held by CSEs.
Policy Loans
Policy loans are stated at unpaid principal balances. Interest income is recorded as earned using the contractual interest rate. Generally, accrued interest is capitalized on the policy’s anniversary date. Any unpaid principal and accrued interest is deducted from the cash surrender value or the death benefit prior to settlement of the insurance policy.
Real Estate Joint Ventures and Other Limited Partnership Interests
The Company uses the equity method of accounting for investments when it has more than a minor ownership interest or more than a minor influence over the investee’s operations; while the cost method is used when the Company has virtually no influence over the investee’s operations. The Company generally recognizes its share of the equity method investee’s earnings on a three-month lag in instances where the investee’s financial information is not sufficiently timely or when the investee’s reporting period differs from the Company’s reporting period; while distributions on cost method investments are recognized as earned or received.
The Company routinely evaluates such investments for impairment. For equity method investees, the Company considers financial and other information provided by the investee, other known information and inherent risks in the underlying investments, as well as future capital commitments, in determining whether an impairment has occurred. The Company considers its cost method investments for impairment when the carrying value of such investments exceeds the net asset value (
“NAV”
). The Company takes into consideration the severity and duration of this excess when determining whether the cost method investment is impaired.
Short-term Investments
Short-term investments include securities and other investments with remaining maturities of one year or less, but greater than three months, at the time of purchase and are stated at estimated fair value or amortized cost, which approximates estimated fair value. Short-term investments also include investments in affiliated money market pools.
Other Invested Assets
Other invested assets consist principally of freestanding derivatives with positive estimated fair values which are described in “—Derivatives” below.
Securities Lending Program
Securities lending transactions, whereby blocks of securities are loaned to third parties, primarily brokerage firms and commercial banks, are treated as financing arrangements and the associated liability is recorded at the amount of cash received. Income and expenses associated with securities lending transactions are reported as investment income and investment expense, respectively, within net investment income.
The Company obtains collateral at the inception of the loan, usually cash, in an amount generally equal to 102% of the estimated fair value of the securities loaned, and maintains it at a level greater than or equal to 100% for the duration of the loan. The Company monitors the estimated fair value of the securities loaned on a daily basis and additional collateral is obtained as necessary throughout the duration of the loan. Securities loaned under such transactions may be sold or repledged by the transferee. The Company is liable to return to the counterparties the cash collateral received.
179
Brighthouse Financial, Inc.
Notes to the Consolidated and Combined Financial Statements (continued)
1. Business, Basis of Presentation and Summary of Significant Accounting Policies (continued)
Derivatives
Freestanding Derivatives
Freestanding derivatives are carried on the Company’s balance sheet either as assets within other invested assets or as liabilities within other liabilities at estimated fair value. The Company does not offset the estimated fair value amounts recognized for derivatives executed with the same counterparty under the same master netting agreement.
Accruals on derivatives are generally recorded in accrued investment income or within other liabilities. However, accruals that are not scheduled to settle within one year are included with the derivatives carrying value in other invested assets or other liabilities.
If a derivative is not designated as an accounting hedge or its use in managing risk does not qualify for hedge accounting, changes in the estimated fair value of the derivative are reported in net derivative gains (losses) except for economic hedges of variable annuity guarantees which are presented in future policy benefits and claims and economic hedges of equity method investments in joint ventures which are presented in net investment income.
Hedge Accounting
The Company primarily designates derivatives as a hedge of a forecasted transaction or a variability of cash flows to be received or paid related to a recognized asset or liability (cash flow hedge). When a derivative is designated as a cash flow hedge and is determined to be highly effective, changes in fair value are recorded in OCI and subsequently reclassified into the statement of operations when the Company’s earnings are affected by the variability in cash flows of the hedged item. The Company also designates derivatives as a hedge of the estimated fair value of a recognized asset or liabilities (fair value hedge). When a derivative is designated as fair value hedge and is determined to be highly effective, changes in fair value are recorded in net derivative gains (losses), consistent with the change in estimated fair value of the hedged item attributable to the designated risk being hedged.
To qualify for hedge accounting, at the inception of the hedging relationship, the Company formally documents its risk management objective and strategy for undertaking the hedging transaction, as well as its designation of the hedge. In its hedge documentation, the Company sets forth how the hedging instrument is expected to hedge the designated risks related to the hedged item and sets forth the method that will be used to retrospectively and prospectively assess the hedging instrument’s effectiveness and the method that will be used to measure ineffectiveness. A derivative designated as a hedging instrument must be assessed as being highly effective in offsetting the designated risk of the hedged item. Hedge effectiveness is formally assessed at inception and at least quarterly throughout the life of the designated hedging relationship.
The Company discontinues hedge accounting prospectively when: (i) it is determined that the derivative is no longer highly effective in offsetting changes in the estimated fair value or cash flows of a hedged item; (ii) the derivative expires, is sold, terminated, or exercised; (iii) it is no longer probable that the hedged forecasted transaction will occur; or (iv) the derivative is de-designated as a hedging instrument.
When hedge accounting is discontinued because it is determined that the derivative is not highly effective in offsetting changes in the estimated fair value or cash flows of a hedged item, the derivative continues to be carried on the balance sheet at its estimated fair value, with changes in estimated fair value recognized in net derivative gains (losses). The carrying value of the hedged recognized asset or liability under a fair value hedge is no longer adjusted for changes in its estimated fair value due to the hedged risk, and the cumulative adjustment to its carrying value is amortized into income over the remaining life of the hedged item. Provided the hedged forecasted transaction is still probable of occurrence, the changes in estimated fair value of derivatives recorded in OCI related to discontinued cash flow hedges are released into the statement of operations when the Company’s earnings are affected by the variability in cash flows of the hedged item.
In all other situations in which hedge accounting is discontinued, the derivative is carried at its estimated fair value on the balance sheet, with changes in its estimated fair value recognized in the current period as net derivative gains (losses).
180
Brighthouse Financial, Inc.
Notes to the Consolidated and Combined Financial Statements (continued)
1. Business, Basis of Presentation and Summary of Significant Accounting Policies (continued)
Embedded Derivatives
The Company sells variable annuities and issues certain insurance products and investment contracts and is a party to certain reinsurance agreements that have embedded derivatives. The Company assesses each identified embedded derivative to determine whether it is required to be bifurcated. The embedded derivative is bifurcated from the host contract and accounted for as a freestanding derivative if:
|
•
|
the combined instrument is not accounted for in its entirety at estimated fair value with changes in estimated fair value recorded in earnings;
|
|
•
|
the terms of the embedded derivative are not clearly and closely related to the economic characteristics of the host contract; and
|
|
•
|
a separate instrument with the same terms as the embedded derivative would qualify as a derivative instrument.
|
Such embedded derivatives are carried on the balance sheet at estimated fair value with the host contract and changes in their estimated fair value are generally reported in net derivative gains (losses), except for those in policyholder benefits and claims related to ceded reinsurance of GMIB.
See “— Variable Annuity Guarantees” for additional information on the accounting policy for embedded derivatives bifurcated from variable annuity host contracts.
Fair Value
Fair value is defined as the price that would be received to sell an asset or paid to transfer a liability (an exit price) in the principal or most advantageous market for the asset or liability in an orderly transaction between market participants on the measurement date. In most cases, the exit price and the transaction (or entry) price will be the same at initial recognition.
In determining the estimated fair value of the Company’s investments, fair values are based on unadjusted quoted prices for identical investments in active markets that are readily and regularly obtainable. When such quoted prices are not available, fair values are based on quoted prices in markets that are not active, quoted prices for similar but not identical investments, or other observable inputs. If these inputs are not available, or observable inputs are not determinable, unobservable inputs and/or adjustments to observable inputs requiring management judgment are used to determine the estimated fair value of investments.
181
Brighthouse Financial, Inc.
Notes to the Consolidated and Combined Financial Statements (continued)
1. Business, Basis of Presentation and Summary of Significant Accounting Policies (continued)
Separate Accounts
Separate accounts underlying the Company’s variable life and annuity contracts are reported at fair value. Assets supporting the contract liabilities are legally insulated from the Company’s general account liabilities. Investments in these separate accounts are directed by the contract holder and all investment performance, net of contract fees and assessments, is passed through to the contract holder. Investment performance and the corresponding amounts credited to contract holders of such separate accounts are offset within the same line on the statements of operations.
Separate accounts that do not pass all investment performance to the contract holder, including those underlying the index-linked annuities, are combined on a line-by-line basis with the Company’s general account assets, liabilities, revenues and expenses. The accounting for investments in these separate accounts is consistent with the methodologies described herein for similar financial instruments held within the general account.
The Company receives asset-based distribution and service fees from mutual funds available to the variable life and annuity contract holders. These fees are recognized in the period in which the related services are performed and are included in other revenues in the statement of operations.
Income Tax
Income taxes as presented herein attribute current and deferred income taxes of MetLife, Inc., for periods up until the Separation, to Brighthouse Financial, Inc. and its subsidiaries in a manner that is systematic, rational and consistent with the asset and liability method prescribed by the Financial Accounting Standards Board (“FASB”) guidance Accounting Standards Codification 740 — Income Taxes (“ASC 740”). The Company’s income tax provision was prepared following the modified separate return method. The modified separate return method applies ASC 740 to the standalone financial statements of each member of the consolidated group as if the group member were a separate taxpayer and a standalone enterprise, after providing benefits for losses. The Company’s accounting for income taxes represents management’s best estimate of various events and transactions.
Deferred tax assets and liabilities resulting from temporary differences between the financial reporting and tax bases of assets and liabilities are measured at the balance sheet date using enacted tax rates expected to apply to taxable income in the years the temporary differences are expected to reverse.
The realization of deferred tax assets depends upon the existence of sufficient taxable income within the carryback or carryforward periods under the tax law in the applicable tax jurisdiction. Valuation allowances are established when management determines, based on available information, that it is more likely than not that deferred income tax assets will not be realized. Significant judgment is required in determining whether valuation allowances should be established, as well as the amount of such allowances. When making such determination, the Company considers many factors, including:
|
•
|
the nature, frequency, and amount of cumulative financial reporting income and losses in recent years;
|
|
•
|
the jurisdiction in which the deferred tax asset was generated;
|
|
•
|
the length of time that carryforward can be utilized in the various taxing jurisdiction;
|
|
•
|
future taxable income exclusive of reversing temporary differences and carryforwards;
|
|
•
|
future reversals of existing taxable temporary differences;
|
|
•
|
taxable income in prior carryback years; and
|
|
•
|
tax planning strategies.
|
The Company may be required to change its provision for income taxes when estimates used in determining valuation allowances on deferred tax assets significantly change or when receipt of new information indicates the need for adjustment in valuation allowances. Additionally, the effect of changes in tax laws, tax regulations, or interpretations of such laws or regulations, is recognized in net income tax expense (benefit) in the period of change.
182
Brighthouse Financial, Inc.
Notes to the Consolidated and Combined Financial Statements (continued)
1. Business, Basis of Presentation and Summary of Significant Accounting Policies (continued)
The Company determines whether it is more likely than not that a tax position will be sustained upon examination by the appropriate taxing authorities before any part of the benefit can be recorded on the financial statements. A tax position is measured at the largest amount of benefit that is greater than 50% likely of being realized upon settlement. Unrecognized tax benefits due to tax uncertainties that do not meet the threshold are included within other liabilities and are charged to earnings in the period that such determination is made.
The Company classifies interest recognized as interest expense and penalties recognized as a component of income tax expense.
On December 22, 2017, President Trump signed the Tax Cuts and Jobs Act (“the Tax Act”) into law. The Tax Act reduced the corporate tax rate to 21%, reduced interest expense deductibility, increased capitalization amounts for deferred acquisition costs, eliminated the corporate alternative minimum tax, provided for determining reserve deductions as 92.81% of statutory reserves, and reduced the dividend received deduction. Most of the changes in the Tax Act are effective as of January 1, 2018.
The reduction in the corporate rate required a one-time remeasurement of certain deferred tax items as of December 31, 2017. For the estimated impact of the Tax Act on the financial statements, including the estimated impact resulting from the remeasurement of deferred tax assets and liabilities. See Note 13 for more information. Actual results may materially differ from the Company’s current estimate due to, among other things, further guidance that may be issued by U.S. tax authorities or regulatory bodies and/or changes in interpretations and assumptions preliminarily made. The Company will continue to analyze the Tax Act to finalize its financial statement impact.
In December 2017, the SEC issued Staff Accounting Bulletin (“SAB”) 118, addressing the application of GAAP in situations when a registrant does not have necessary information available to complete the accounting for certain income tax effects of the Tax Act. SAB 118 provides guidance for registrants under three scenarios: (1) the measurement of certain income tax effects is complete, (2) the measurement of certain income tax effects can be reasonably estimated, and (3) the measurement of certain income tax effects cannot be reasonably estimated. SAB 118 provides that the measurement period is complete when a company’s accounting is complete. The measurement period cannot extend beyond one year from the enactment date. SAB 118 acknowledges that a company may be able to complete the accounting for some provisions earlier than others. As such, it may need to apply all three scenarios in determining the accounting for the Tax Act based on information that is available. The Company has not fully completed its accounting for the tax effects of the Tax Act, and thus certain items relating to accounting for the Tax Act are provisional, including accounting for reserves. However, it has recorded the effects of the Tax Act as reasonable estimates due to the need for further analysis of the provisions within the Tax Act and collection, preparation and analysis of relevant data necessary to complete the accounting.
The corporate rate reduction also left certain tax effects, which were originally recorded using the previous corporate rate, stranded in accumulated other comprehensive income (“AOCI”). The Company adopted new accounting guidance as of December 31, 2017 that allowed the Company to reclassify the stranded tax effects from AOCI into retained earnings. The Company elected to reclassify amounts based on the difference between the previously enacted federal corporate tax rate and the newly enacted rate as applied on an aggregate basis. See Note 13 for more information.
Litigation Contingencies
The Company is a party to a number of legal actions and is involved in a number of regulatory investigations. Given the inherent unpredictability of these matters, it is difficult to estimate the impact on the Company’s financial position. Liabilities are established when it is probable that a loss has been incurred and the amount of the loss can be reasonably estimated. Legal costs are recognized as incurred. On a quarterly and annual basis, the Company reviews relevant information with respect to liabilities for litigation, regulatory investigations and litigation-related contingencies to be reflected on the Company’s financial statements.
Other Accounting Policies
Cash and Cash Equivalents
The Company considers all highly liquid securities and other investments purchased with an original or remaining maturity of three months or less at the date of purchase to be cash equivalents. Cash equivalents are stated at amortized cost, which approximates estimated fair value.
183
Brighthouse Financial, Inc.
Notes to the Consolidated and Combined Financial Statements (continued)
1. Business, Basis of Presentation and Summary of Significant Accounting Policies (continued)
Employee Benefit Plans
Brighthouse Services, LLC (“Brighthouse Services”), an affiliate, sponsors qualified and nonqualified defined contribution plans, and NELICO sponsors certain frozen defined benefit pension and postretirement plans. NELICO recognizes the funded status of each of its pension plans, measured as the difference between the fair value of plan assets and the benefit obligation, which is the projected benefit obligation (“PBO”) for pension benefits in other assets or other liabilities.
Actuarial gains and losses result from differences between the actual experience and the assumed experience on plan assets or PBO during a particular period and are recorded in AOCI. To the extent such gains and losses exceed 10% of the greater of the PBO or the estimated fair value of plan assets, the excess is amortized into net periodic benefit costs over the average projected future lifetime of all plan participants or projected future working lifetime, as appropriate. Prior service costs (credit) are recognized in AOCI at the time of the amendment and then amortized into net periodic benefit costs over the average projected future lifetime of all plan participants or projected future working lifetime, as appropriate.
Net periodic benefit costs are determined using management estimates and actuarial assumptions; and are comprised of service cost, interest cost, expected return on plan assets, amortization of net actuarial (gains) losses, settlement and curtailment costs, and amortization of prior service costs (credit).
Through December 31, 2016, Metropolitan Life Insurance Company (“MLIC”), a former affiliate, provided and the Company contributed to defined benefit pension plans for its employees and retirees. The Company accounts for these plans as multiemployer benefit plans and as a result the assets, obligations and other comprehensive gains and losses of these benefit plans are not included on the consolidated balance sheet. Within its consolidated statement of operations, the Company has included expenses associated with its participants in these plans. These plans also include participants from other affiliates of MLIC. The Company’s participation in these plans ceased December 31, 2016.
Adoption of New Accounting Pronouncements
Changes to GAAP are established by the FASB in the form of accounting standards updates (“ASU”) to the FASB Accounting Standards Codification. The Company considers the applicability and impact of all ASUs. ASUs not listed below were assessed and determined to be either not applicable or are not expected to have a material impact on the Company’s consolidated financial statements. The following table provides a description of new ASUs issued by the FASB and the expected impact of the adoption on the Company’s consolidated financial statements.
184
Brighthouse Financial, Inc.
Notes to the Consolidated and Combined Financial Statements (continued)
1. Business, Basis of Presentation and Summary of Significant Accounting Policies (continued)
Except as noted below, the ASUs adopted by the Company during 2017 did not have a material impact on its consolidated financial statements.
|
Standard
|
Description
|
Effective Date
|
Impact on Financial Statements
|
|
ASU 2018-02, Reporting Comprehensive Income (Topic 220)-Reclassification of Certain Tax Effects from Accumulated Other Comprehensive Income
|
The amendments to Topic 220 provide an option to reclassify stranded tax effects within AOCI to retained earnings in each period in which the effect of the change in the U.S. federal corporate income tax rate in the Tax Act of 2017 (or portion thereof) is recorded.
|
January 1, 2019 applied in the period of adoption (with early adoption permitted)
|
The Company elected to early adopt the ASU as of December 31, 2017 and reclassified $301 million from AOCI into retained earnings related to the impact of the Tax Act of 2017. See Notes 10 and 13.
|
|
ASU 2017-12, Derivatives and Hedging (Topic 815): Targeted Improvements to Accounting for Hedging Activities
|
The amendments to Topic 815 (i) refine and expand the criteria for achieving hedge accounting on certain hedging strategies, (ii) require the earnings effect of the hedging instrument be presented in the same line item in which the earnings effect of the hedged item is reported, and (iii) eliminate the requirement to separately measure and report hedge ineffectiveness.
|
January 1, 2019 using modified retrospective method (with early adoption permitted)
|
The Company does not expect a material impact on its financial statements from adoption of the new guidance.
|
|
ASU 2016-13, Financial Instruments - Credit Losses (Topic 326): Measurement of Credit Losses on Financial Instruments
|
The amendments to Topic 326 replace the incurred loss impairment methodology for certain financial instruments with one that reflects expected credit losses based on historical loss information, current conditions, and reasonable and supportable forecasts. The new guidance also requires that an OTTI on a debt security will be recognized as an allowance going forward, such that improvements in expected future cash flows after an impairment will no longer be reflected as a prospective yield adjustment through net investment income, but rather a reversal of the previous impairment and recognized through realized investment gains and losses.
|
January 1, 2020 using the modified retrospective method (with early adoption permitted beginning January 1, 2019)
|
The Company is currently evaluating the impact of this guidance on its financial statements. The Company expects the most significant impacts to be earlier recognition of impairments on mortgage loan investments.
|
|
ASU 2016-02, Leases - Topic 842
|
The new guidance will require a lessee to recognize assets and liabilities for leases with lease terms of more than 12 months. Leases would be classified as finance or operating leases and both types of leases will be recognized on the balance sheet. Lessor accounting will remain largely unchanged from current guidance except for certain targeted changes. The amendments also require new qualitative and quantitative disclosures.
|
January 1, 2019 using the modified retrospective method (with early adoption permitted)
|
The Company is currently evaluating the impact of this guidance on its financial statements, with implementation efforts focused on the review of its existing lease contracts, as well as identification of other contracts that may fall under the scope of the new guidance.
|
|
ASU 2016-01, Financial Instruments - Overall: Recognition and Measurement of Financial Assets and Financial Liabilities
|
The new guidance changes the current accounting guidance related to (i) the classification and measurement of certain equity investments, (ii) the presentation of changes in the fair value of financial liabilities measured under the FVO that are due to instrument-specific credit risk, and (iii) certain disclosures associated with the fair value of financial instruments. Additionally, there will no longer be a requirement to assess equity securities for impairment since such securities will be measured at fair value through net income.
|
January 1, 2018 using the modified retrospective method
|
Effective January 1, 2018 the Company will carry available-for-sale equity securities and partnerships and joint ventures accounted for under the cost method at fair value with changes in fair value recognized in net income. The Company will reclassify unrealized gains related to equity securities of $19 million from AOCI to opening retained earnings. Additionally, the Company will adjust the carrying value of partnerships and joint ventures, previously accounted for under the cost method, from cost to fair value, resulting in a $9 million increase to retained earnings.
|
185
Brighthouse Financial, Inc.
Notes to the Consolidated and Combined Financial Statements (continued)
1. Business, Basis of Presentation and Summary of Significant Accounting Policies (continued)
|
Standard
|
Description
|
Effective Date
|
Impact on Financial Statements
|
|
ASU 2014-09 Revenue from Contracts with Customers (Topic 606)
|
For those contracts that are impacted, the guidance will require an entity to recognize revenue upon the transfer of promised goods or services to customers in an amount that reflects the consideration to which the entity expects to be entitled, in exchange for those goods or services.
|
January 1, 2018 using the modified retrospective method
|
No impact on the Company’s financial statements.
|
Other
Effective January 3, 2017, the Chicago Mercantile Exchange (“CME”) amended its rulebook, resulting in the characterization of variation margin transfers as settlement payments, as opposed to adjustments to collateral. These amendments impacted the accounting treatment of the Company’s centrally cleared derivatives, for which the CME serves as the central clearing party. As of the effective date, the application of the amended rulebook, reduced gross derivative assets by
$206 million
, gross derivative liabilities by
$927 million
, accrued investment income by
$30 million
, collateral receivables recorded within premiums, reinsurance and other receivables of
$765 million
, and collateral payables recorded within payables for collateral under securities loaned and other transactions of
$74 million
.
2. Segment Information
The Company is organized into
three
segments: Annuities; Life; and Run-off. In addition, the Company reports certain of its results of operations in Corporate & Other.
Annuities
The Annuities segment offers a variety of variable, fixed, index-linked and income annuities designed to address contract holders’ needs for protected wealth accumulation on a tax-deferred basis, wealth transfer and income security.
Life
The Life segment offers insurance products and services, including term, whole, universal and variable life products designed to address policyholders’ needs for financial security and protected wealth transfer, which may be provided on a tax-advantaged basis.
Run-off
The Run-off segment consists of products no longer actively sold and which are separately managed, including structured settlements, pension risk transfer contracts, certain company-owned life insurance policies, bank-owned life insurance policies, funding agreements and universal life with secondary guarantees (“ULSG”).
Corporate & Other
Corporate & Other contains the excess capital not allocated to the segments and interest expense related to the majority of the Company’s outstanding debt, as well as expenses associated with certain legal proceedings and income tax audit issues. Corporate & Other also includes the elimination of intersegment amounts,
long term care and workers compensation business reinsured through 100% quota share reinsurance agreements,
and term life insurance sold direct to consumers, which is no longer being offered for new sales.
Financial Measures and Segment Accounting Policies
Adjusted earnings is a financial measure used by management to evaluate performance, allocate resources and facilitate comparisons to industry results. Consistent with GAAP guidance for segment reporting, adjusted earnings is also used to measure segment performance. The Company believes the presentation of adjusted earnings, as the Company measures it for management purposes, enhances the understanding of its performance by the investor community. Adjusted earnings should not be viewed as a substitute for net income (loss).
186
Brighthouse Financial, Inc.
Notes to the Consolidated and Combined Financial Statements (continued)
2. Segment Information (continued)
Adjusted earnings, which may be positive or negative, focuses on the Company’s primary businesses principally by excluding the impact of market volatility, which could distort trends, as well as businesses that have been or will be sold or exited by the Company, referred to as divested businesses.
The following are the significant items excluded from total revenues in calculating adjusted earnings:
|
•
|
Net investment gains (losses);
|
|
•
|
Net derivative gains (losses) except earned income on derivatives and amortization of premium on derivatives that are hedges of investments or that are used to replicate certain investments, but do not qualify for hedge accounting treatment; and
|
|
•
|
Amortization of unearned revenue related to net investment gains (losses) and net derivative gains (losses) and certain variable annuity GMIB fees (“GMIB Fees”).
|
The following are the significant items excluded from total expenses in calculating adjusted earnings:
|
•
|
Amounts associated with benefits and hedging costs related to GMIBs (“GMIB Costs”);
|
|
•
|
Amounts associated with periodic crediting rate adjustments based on the total return of a contractually referenced pool of assets and market value adjustments associated with surrenders or terminations of contracts (“Market Value Adjustments”); and
|
|
•
|
Amortization of DAC and VOBA related to: (i) net investment gains (losses), (ii) net derivative gains (losses), (iii) GMIB Fees and GMIB Costs and (iv) Market Value Adjustments.
|
The tax impact of the adjustments mentioned above are calculated net of the U.S. statutory tax rate, which could differ from the Company’s effective tax rate.
Set forth in the tables below is certain financial information with respect to the Company’s segments, as well as Corporate & Other, for the years ended December 31,
2017
,
2016
and
2015
and at December 31,
2017
and
2016
. The segment accounting policies are the same as those used to prepare the Company’s consolidated and combined financial statements, except for the adjustments to calculate adjusted earnings described above. In addition, segment accounting policies include the historical method of capital allocation described below.
The internal capital model is a risk capital model that reflects management’s judgment and view of required capital to represent the measurement of the risk profile of the business, to meet the Company’s long term promises to clients, to service long-term obligations and to support the credit ratings of the Company. It accounts for the unique and specific nature of the risks inherent in the Company’s business. Management is responsible for the ongoing production and enhancement of the internal capital model and reviewed its approach periodically to ensure that it remained consistent with emerging industry practice standards.
Beginning in 2018, the Company will allocate equity to the segments based on its new statutory capital oriented internal capital allocation model, which considers capital requirements and aligns with emerging standards and consistent risk principles.
In 2017 and prior years, segment net investment income was credited or charged based on the level of allocated equity; however, changes in allocated equity do not impact the Company’s consolidated and combined net investment income, or net income (loss). Going forward, investment portfolios will be funded to support both liabilities and allocated surplus of each segment, requiring no allocated equity adjustments to net investment income. The impact to segment results is not expected to be material. Net investment income is based upon the actual results of each segment’s specifically identifiable investment portfolios adjusted for allocated equity. Other costs are allocated to each of the segments based upon: (i) a review of the nature of such costs; (ii) time studies analyzing the amount of employee time incurred by each segment; and (iii) cost estimates included in the Company’s product pricing.
187
Brighthouse Financial, Inc.
Notes to the Consolidated and Combined Financial Statements (continued)
2. Segment Information (continued)
|
Operating Results
|
||||||||||||||||||||
|
Year Ended December 31, 2017
|
Annuities
|
Life
|
Run-off
|
Corporate & Other
|
Total
|
|||||||||||||||
|
(In millions)
|
||||||||||||||||||||
|
Pre-tax adjusted earnings
|
$
|
1,386
|
|
$
|
7
|
|
$
|
147
|
|
$
|
57
|
|
$
|
1,597
|
|
|||||
|
Provision for income tax expense (benefit)
|
369
|
|
(9
|
)
|
43
|
|
274
|
|
677
|
|
||||||||||
|
Adjusted earnings
|
$
|
1,017
|
|
$
|
16
|
|
$
|
104
|
|
$
|
(217
|
)
|
920
|
|
||||||
|
Adjustments for:
|
||||||||||||||||||||
|
Net investment gains (losses)
|
(28
|
)
|
||||||||||||||||||
|
Net derivative gains (losses)
|
(1,620
|
)
|
||||||||||||||||||
|
Other adjustments to net income
|
(564
|
)
|
||||||||||||||||||
|
Provision for income tax (expense) benefit
|
914
|
|
||||||||||||||||||
|
Net income (loss)
|
$
|
(378
|
)
|
|||||||||||||||||
|
Interest revenue
|
$
|
1,277
|
|
$
|
342
|
|
$
|
1,399
|
|
$
|
192
|
|
|
|
||||||
|
Interest expense
|
$
|
—
|
|
$
|
—
|
|
$
|
23
|
|
$
|
132
|
|
|
|
||||||
|
Balance at December 31, 2017
|
Annuities
|
Life
|
Run-off
|
Corporate
& Other |
Total
|
|||||||||||||||
|
(In millions)
|
||||||||||||||||||||
|
Total assets
|
$
|
154,667
|
|
$
|
18,049
|
|
$
|
36,824
|
|
$
|
14,652
|
|
$
|
224,192
|
|
|||||
|
Separate account assets
|
$
|
109,888
|
|
$
|
5,250
|
|
$
|
3,119
|
|
$
|
—
|
|
$
|
118,257
|
|
|||||
|
Separate account liabilities
|
$
|
109,888
|
|
$
|
5,250
|
|
$
|
3,119
|
|
$
|
—
|
|
$
|
118,257
|
|
|||||
188
Brighthouse Financial, Inc.
Notes to the Consolidated and Combined Financial Statements (continued)
2. Segment Information (continued)
|
Operating Results
|
||||||||||||||||||||
|
Year Ended December 31, 2016
|
Annuities
|
Life
|
Run-off
|
Corporate & Other
|
Total
|
|||||||||||||||
|
(In millions)
|
||||||||||||||||||||
|
Pre-tax adjusted earnings
|
$
|
1,636
|
|
$
|
26
|
|
$
|
(834
|
)
|
$
|
39
|
|
$
|
867
|
|
|||||
|
Provision for income tax expense (benefit)
|
484
|
|
—
|
|
(295
|
)
|
(8
|
)
|
181
|
|
||||||||||
|
Adjusted earnings
|
$
|
1,152
|
|
$
|
26
|
|
$
|
(539
|
)
|
|
$
|
47
|
|
686
|
|
|||||
|
Adjustments for:
|
||||||||||||||||||||
|
Net investment gains (losses)
|
(78
|
)
|
||||||||||||||||||
|
Net derivative gains (losses)
|
(5,851
|
)
|
||||||||||||||||||
|
Other adjustments to net income
|
357
|
|
||||||||||||||||||
|
Provision for income tax (expense) benefit
|
1,947
|
|
||||||||||||||||||
|
Net income (loss)
|
$
|
(2,939
|
)
|
|||||||||||||||||
|
Interest revenue
|
$
|
1,451
|
|
$
|
371
|
|
$
|
1,441
|
|
$
|
239
|
|
||||||||
|
Interest expense
|
$
|
—
|
|
$
|
—
|
|
$
|
61
|
|
$
|
111
|
|
||||||||
|
Balance at December 31, 2016
|
Annuities
|
Life
|
Run-off
|
Corporate
& Other
|
Total
|
|||||||||||||||
|
(In millions)
|
||||||||||||||||||||
|
Total assets
|
$
|
152,146
|
|
$
|
17,150
|
|
$
|
40,007
|
|
$
|
12,627
|
|
$
|
221,930
|
|
|||||
|
Separate account assets
|
$
|
104,855
|
|
$
|
4,704
|
|
$
|
3,484
|
|
$
|
—
|
|
$
|
113,043
|
|
|||||
|
Separate account liabilities
|
$
|
104,855
|
|
$
|
4,704
|
|
$
|
3,484
|
|
$
|
—
|
|
$
|
113,043
|
|
|||||
|
Operating Results
|
||||||||||||||||||||
|
Year Ended December 31, 2015
|
Annuities
|
Life
|
Run-off
|
Corporate & Other
|
Total
|
|||||||||||||||
|
(In millions)
|
||||||||||||||||||||
|
Pre-tax adjusted earnings
|
$
|
1,452
|
|
$
|
21
|
|
$
|
717
|
|
$
|
(77
|
)
|
$
|
2,113
|
|
|||||
|
Provision for income tax expense (benefit)
|
363
|
|
1
|
|
249
|
|
(41
|
)
|
572
|
|
||||||||||
|
Adjusted earnings
|
$
|
1,089
|
|
$
|
20
|
|
$
|
468
|
|
|
$
|
(36
|
)
|
1,541
|
|
|||||
|
Adjustments for:
|
||||||||||||||||||||
|
Net investment gains (losses)
|
7
|
|
||||||||||||||||||
|
Net derivative gains (losses)
|
(326
|
)
|
||||||||||||||||||
|
Other adjustments to net income
|
(332
|
)
|
||||||||||||||||||
|
Provision for income tax (expense) benefit
|
229
|
|
||||||||||||||||||
|
Net income (loss)
|
$
|
1,119
|
|
|||||||||||||||||
|
Interest revenue
|
$
|
1,281
|
|
$
|
371
|
|
$
|
1,551
|
|
$
|
125
|
|
||||||||
|
Interest expense
|
$
|
—
|
|
$
|
—
|
|
$
|
60
|
|
$
|
101
|
|
||||||||
189
Brighthouse Financial, Inc.
Notes to the Consolidated and Combined Financial Statements (continued)
2. Segment Information (continued)
The following table presents total revenues with respect to the Company’s segments, as well as Corporate & Other:
|
Years Ended December 31,
|
|||||||||||
|
2017
|
2016
|
2015
|
|||||||||
|
(In millions)
|
|||||||||||
|
Annuities
|
$
|
4,370
|
|
$
|
4,958
|
|
$
|
5,229
|
|
||
|
Life
|
1,315
|
|
1,249
|
|
1,137
|
|
|||||
|
Run-off
|
2,147
|
|
2,343
|
|
2,367
|
|
|||||
|
Corporate & Other
|
510
|
|
401
|
|
415
|
|
|||||
|
Adjustments
|
(1,500
|
)
|
(5,933
|
)
|
(257
|
)
|
|||||
|
Total
|
$
|
6,842
|
|
$
|
3,018
|
|
$
|
8,891
|
|
||
The following table presents total premiums, universal life and investment-type product policy fees and other revenues by major product groups of the Company’s segments, as well as Corporate & Other:
|
Years Ended December 31,
|
|||||||||||
|
2017
|
2016
|
2015
|
|||||||||
|
(In millions)
|
|||||||||||
|
Annuity products
|
$
|
3,363
|
|
$
|
3,938
|
|
$
|
4,249
|
|
||
|
Life insurance products
|
1,822
|
|
1,745
|
|
1,726
|
|
|||||
|
Other products
|
227
|
|
57
|
|
136
|
|
|||||
|
Total
|
$
|
5,412
|
|
$
|
5,740
|
|
$
|
6,111
|
|
||
Substantially all of the Company’s premiums, universal life and investment-type product policy fees and other revenues originated in the U.S.
Revenues derived from any customer did not exceed 10% of premiums, universal life and investment-type product policy fees and other revenues for the years ended December 31,
2017
,
2016
and
2015
.
190
Brighthouse Financial, Inc.
Notes to the Consolidated and Combined Financial Statements (continued)
3. Insurance
Insurance Liabilities
Insurance liabilities, including affiliated insurance liabilities on reinsurance assumed and ceded, are comprised of future policy benefits, policyholder account balances and other policy-related balances. Information regarding insurance liabilities by segment, as well as Corporate & Other, was as follows at:
|
December 31,
|
||||||||
|
2017
|
2016
|
|||||||
|
(In millions)
|
||||||||
|
Annuities
|
$
|
34,281
|
|
$
|
33,155
|
|
||
|
Life
|
8,542
|
|
8,539
|
|
||||
|
Run-off
|
27,027
|
|
24,819
|
|
||||
|
Corporate & Other
|
7,534
|
|
7,430
|
|
||||
|
Total
|
$
|
77,384
|
|
$
|
73,943
|
|
||
See
Note 5
for discussion of affiliated reinsurance liabilities included in the table above.
Future policy benefits are measured as follows:
|
Product Type:
|
Measurement Assumptions:
|
|
Participating life insurance
|
Aggregate of (i) net level premium reserves for death and endowment policy benefits (calculated based upon the non-forfeiture interest rate, ranging from 4% to 5%, and mortality rates guaranteed in calculating the cash surrender values described in such contracts); and (ii) the liability for terminal dividends.
|
|
Nonparticipating life insurance
|
Aggregate of the present value of expected future benefit payments and related expenses less the present value of expected future net premiums. Assumptions as to mortality and persistency are based upon the Company’s experience when the basis of the liability is established. Interest rate assumptions for the aggregate future policy benefit liabilities range from 3% to 9%.
|
|
I
ndividual and group
fixed annuities
after annuitization
|
Present value of expected future payments. Interest rate assumptions used in establishing such liabilities range from 2% to 8%.
|
|
Long-term care and
disability insurance
active life reserves
|
The net level premium method and assumptions as to future morbidity, withdrawals and interest, which provide a margin for adverse deviation. Interest rate assumptions used in establishing such liabilities range from 4% to 7%.
|
|
Long-term care and
disability insurance
claim reserves
|
Present value of benefits method and experience assumptions as to claim terminations, expenses and interest. Interest rate assumptions used in establishing such liabilities range from 3% to 7%.
|
Participating business represented
3%
of the Company’s life insurance in-force at both December 31,
2017
and 2016. Participating policies represented
38%
,
42%
and
39%
of gross traditional life insurance premiums for the years ended December 31,
2017
,
2016
and
2015
, respectively.
Policyholder account balances are equal to: (i) policy account values, which consist of an accumulation of gross premium payments; (ii) credited interest, ranging from
0%
to
7%
, less expenses, mortality charges and withdrawals; and (iii) fair value adjustments relating to business combinations.
191
Brighthouse Financial, Inc.
Notes to the Consolidated and Combined Financial Statements (continued)
3. Insurance (continued)
Guarantees
The Company issues variable annuity products with guaranteed minimum benefits. GMABs, the non-life-contingent portion of GMWBs and the portion of certain GMIBs that do not require annuitization are accounted for as embedded derivatives in policyholder account balances and are further discussed in
Note 7
. Guarantees accounted for as insurance liabilities include:
|
Guarantee:
|
Measurement Assumptions:
|
||||
|
GMDBs
|
•
|
A return of purchase payment upon death even if the account value is reduced to zero.
|
•
|
Present value of expected death benefits in excess of the projected account balance recognizing the excess ratably over the accumulation period based on the present value of total expected assessments.
|
|
|
•
|
An enhanced death benefit may be available for an additional fee.
|
•
|
Assumptions are consistent with those used for amortizing DAC, and are thus subject to the same variability and risk.
|
||
|
•
|
Investment performance and volatility assumptions are consistent with the historical experience of the appropriate underlying equity index, such as the S&P 500 Index.
|
||||
|
•
|
Benefit assumptions are based on the average benefits payable over a range of scenarios.
|
||||
|
GMIBs
|
•
|
After a specified period of time determined at the time of issuance of the variable annuity contract, a minimum accumulation of purchase payments, even if the account value is reduced to zero, that can be annuitized to receive a monthly income stream that is not less than a specified amount.
|
•
|
Present value of expected income benefits in excess of the projected account balance at any future date of annuitization and recognizing the excess ratably over the accumulation period based on present value of total expected assessments.
|
|
|
•
|
Certain contracts also provide for a guaranteed lump sum return of purchase premium in lieu of the annuitization benefit.
|
•
|
Assumptions are consistent with those used for estimating GMDB liabilities.
|
||
|
•
|
Calculation incorporates an assumption for the percentage of the potential annuitizations that may be elected by the contract holder.
|
||||
|
GMWBs
|
•
|
A return of purchase payment via partial withdrawals, even if the account value is reduced to zero, provided that cumulative withdrawals in a contract year do not exceed a certain limit.
|
•
|
Expected value of the life contingent payments and expected assessments using assumptions consistent with those used for estimating the GMDB liabilities.
|
|
|
•
|
Certain contracts include guaranteed withdrawals that are life contingent.
|
||||
The Company also issues universal and variable life contracts where the Company contractually guarantees to the contract holder a secondary guarantee.
192
Brighthouse Financial, Inc.
Notes to the Consolidated and Combined Financial Statements (continued)
3. Insurance (continued)
Information regarding the liabilities for guarantees (excluding base policy liabilities and embedded derivatives) relating to annuity and universal and variable life contracts was as follows:
|
Annuity Contracts
|
Universal and Variable
Life Contracts |
||||||||||||||
|
GMDBs
|
GMIBs
|
Secondary
Guarantees |
Total
|
||||||||||||
|
(In millions)
|
|||||||||||||||
|
Direct
|
|||||||||||||||
|
Balance at January 1, 2015
|
$
|
630
|
|
$
|
1,649
|
|
$
|
2,374
|
|
$
|
4,653
|
|
|||
|
Incurred guaranteed benefits (1)
|
252
|
|
355
|
|
413
|
|
1,020
|
|
|||||||
|
Paid guaranteed benefits
|
(37
|
)
|
—
|
|
—
|
|
(37
|
)
|
|||||||
|
Balance at December 31, 2015
|
845
|
|
2,004
|
|
2,787
|
|
5,636
|
|
|||||||
|
Incurred guaranteed benefits
|
339
|
|
331
|
|
753
|
|
1,423
|
|
|||||||
|
Paid guaranteed benefits
|
(60
|
)
|
—
|
|
—
|
|
(60
|
)
|
|||||||
|
Balance at December 31, 2016
|
1,124
|
|
2,335
|
|
3,540
|
|
6,999
|
|
|||||||
|
Incurred guaranteed benefits
|
373
|
|
374
|
|
692
|
|
1,439
|
|
|||||||
|
Paid guaranteed benefits
|
(58
|
)
|
—
|
|
—
|
|
(58
|
)
|
|||||||
|
Balance at December 31, 2017
|
$
|
1,439
|
|
$
|
2,709
|
|
$
|
4,232
|
|
$
|
8,380
|
|
|||
|
Net Ceded/(Assumed)
|
|
||||||||||||||
|
Balance at January 1, 2015
|
$
|
(10
|
)
|
$
|
6
|
|
$
|
846
|
|
$
|
842
|
|
|||
|
Incurred guaranteed benefits (1)
|
24
|
|
3
|
|
161
|
|
188
|
|
|||||||
|
Paid guaranteed benefits
|
(34
|
)
|
1
|
|
—
|
|
(33
|
)
|
|||||||
|
Balance at December 31, 2015
|
(20
|
)
|
10
|
|
1,007
|
|
997
|
|
|||||||
|
Incurred guaranteed benefits
|
48
|
|
10
|
|
98
|
|
156
|
|
|||||||
|
Paid guaranteed benefits
|
(55
|
)
|
—
|
|
—
|
|
(55
|
)
|
|||||||
|
Balance at December 31, 2016
|
(27
|
)
|
20
|
|
1,105
|
|
1,098
|
|
|||||||
|
Incurred guaranteed benefits
|
101
|
|
(20
|
)
|
(160
|
)
|
(79
|
)
|
|||||||
|
Paid guaranteed benefits
|
(56
|
)
|
—
|
|
—
|
|
(56
|
)
|
|||||||
|
Balance at December 31, 2017
|
$
|
18
|
|
$
|
—
|
|
$
|
945
|
|
$
|
963
|
|
|||
|
Net
|
|
||||||||||||||
|
Balance at January 1, 2015
|
$
|
640
|
|
$
|
1,643
|
|
$
|
1,528
|
|
$
|
3,811
|
|
|||
|
Incurred guaranteed benefits (1)
|
228
|
|
352
|
|
252
|
|
832
|
|
|||||||
|
Paid guaranteed benefits
|
(3
|
)
|
(1
|
)
|
—
|
|
(4
|
)
|
|||||||
|
Balance at December 31, 2015
|
865
|
|
1,994
|
|
1,780
|
|
4,639
|
|
|||||||
|
Incurred guaranteed benefits
|
291
|
|
321
|
|
655
|
|
1,267
|
|
|||||||
|
Paid guaranteed benefits
|
(5
|
)
|
—
|
|
—
|
|
(5
|
)
|
|||||||
|
Balance at December 31, 2016
|
1,151
|
|
2,315
|
|
2,435
|
|
5,901
|
|
|||||||
|
Incurred guaranteed benefits
|
272
|
|
394
|
|
852
|
|
1,518
|
|
|||||||
|
Paid guaranteed benefits
|
(2
|
)
|
—
|
|
—
|
|
(2
|
)
|
|||||||
|
Balance at December 31, 2017
|
$
|
1,421
|
|
$
|
2,709
|
|
$
|
3,287
|
|
$
|
7,417
|
|
|||
(1) See Note 5.
193
Brighthouse Financial, Inc.
Notes to the Consolidated and Combined Financial Statements (continued)
3. Insurance (continued)
Information regarding the Company’s guarantee exposure was as follows at:
|
December 31,
|
|||||||||||||||||
|
2017
|
2016
|
||||||||||||||||
|
In the
Event of Death
|
At
Annuitization
|
In the
Event of Death
|
At
Annuitization
|
||||||||||||||
|
(Dollars in millions)
|
|||||||||||||||||
|
Annuity Contracts (1), (2)
|
|||||||||||||||||
|
Variable Annuity Guarantees
|
|||||||||||||||||
|
Total account value (3)
|
$
|
115,147
|
|
$
|
67,110
|
|
$
|
111,719
|
|
$
|
64,503
|
|
|||||
|
Separate account value
|
$
|
109,792
|
|
$
|
65,782
|
|
$
|
106,759
|
|
$
|
63,025
|
|
|||||
|
Net amount at risk
|
$
|
5,261
|
|
(4)
|
$
|
2,642
|
|
(5)
|
$
|
6,837
|
|
(4)
|
$
|
3,313
|
|
(5)
|
|
|
Average attained age of contract holders
|
68 years
|
|
68 years
|
|
67 years
|
|
67 years
|
|
|||||||||
|
December 31,
|
||||||||
|
2017
|
2016
|
|||||||
|
Secondary Guarantees
|
||||||||
|
(Dollars in millions)
|
||||||||
|
Universal Life Contracts
|
||||||||
|
Total account value (3)
|
$
|
6,244
|
|
$
|
6,216
|
|
||
|
Net amount at risk (6)
|
$
|
75,304
|
|
$
|
76,216
|
|
||
|
Average attained age of policyholders
|
64 years
|
|
63 years
|
|
||||
|
Variable Life Contracts
|
||||||||
|
Total account value (3)
|
$
|
3,379
|
|
$
|
3,110
|
|
||
|
Net amount at risk (6)
|
$
|
24,546
|
|
$
|
26,419
|
|
||
|
Average attained age of policyholders
|
49 years
|
|
48 years
|
|
||||
__________________
|
(1)
|
The Company’s annuity contracts with guarantees may offer more than one type of guarantee in each contract. Therefore, the amounts listed above may not be mutually exclusive.
|
|
(2)
|
Includes direct business, but excludes offsets from hedging or reinsurance, if any. Therefore, the net amount at risk presented reflects the economic exposures of living and death benefit guarantees associated with variable annuities, but not necessarily their impact on the Company.
See
Note 5
for a discussion of guaranteed minimum benefits which have been reinsured.
|
|
(3)
|
Includes the contract holder’s investments in the general account and separate account, if applicable.
|
|
(4)
|
Defined as the death benefit less the total account value, as of the balance sheet date. It represents the amount of the claim that the Company would incur if death claims were filed on all contracts on the balance sheet date and includes any additional contractual claims associated with riders purchased to assist with covering income taxes payable upon death.
|
|
(5)
|
Defined as the amount (if any) that would be required to be added to the total account value to purchase a lifetime income stream, based on current annuity rates, equal to the minimum amount provided under the guaranteed benefit. This amount represents the Company’s potential economic exposure to such guarantees in the event all contract holders were to annuitize on the balance sheet date, even though the contracts contain terms that allow annuitization of the guaranteed amount only after the 10th anniversary of the contract, which not all contract holders have achieved.
|
|
(6)
|
Defined as the guarantee amount less the account value, as of the balance sheet date. It represents the amount of the claim that the Company would incur if death claims were filed on all contracts on the balance sheet date.
|
194
Brighthouse Financial, Inc.
Notes to the Consolidated and Combined Financial Statements (continued)
3. Insurance (continued)
Account balances of contracts with guarantees were invested in separate account asset classes as follows at:
|
December 31,
|
||||||||
|
2017
|
2016
|
|||||||
|
(In millions)
|
||||||||
|
Fund Groupings:
|
||||||||
|
Balanced
|
$
|
56,979
|
|
$
|
54,371
|
|
||
|
Equity
|
47,571
|
|
44,750
|
|
||||
|
Bond
|
6,662
|
|
6,686
|
|
||||
|
Money Market
|
657
|
|
761
|
|
||||
|
Total
|
$
|
111,869
|
|
$
|
106,568
|
|
||
Obligations Under Funding Agreements
The Company has issued fixed and floating rate funding agreements, which are denominated in either U.S. dollars or foreign currencies, to certain special purpose entities that have issued either debt securities or commercial paper for which payment of interest and principal is secured by such funding agreements. During the years ended December 31,
2017
,
2016
and
2015
, the Company issued
$0
,
$1.4 billion
and
$13.0 billion
, respectively, and repaid
$6 million
,
$3.4 billion
and
$14.4 billion
, respectively, of such funding agreements. At December 31,
2017
and
2016
, liabilities for funding agreements outstanding, which are included in policyholder account balances, were
$141 million
and
$127 million
, respectively.
Brighthouse Life Insurance Company is a member of the Federal Home Loan Bank (“FHLB”) of Pittsburgh and holds common stock in certain regional banks in the FHLB system. Holdings of FHLB common stock carried at cost at December 31, 2017 and 2016 were
$71 million
and
$75 million
, respectively.
Brighthouse Life Insurance Company has also entered into funding agreements with FHLBs. The liabilities for these funding agreements are included in policyholder account balances. Information related to FHLB funding agreements was as follows at:
|
|
December 31,
|
|||||||
|
|
2017
|
2016
|
||||||
|
|
(In millions)
|
|||||||
|
Liabilities
|
$
|
595
|
|
$
|
645
|
|
||
Funding agreements are issued to FHLBs in exchange for cash. The FHLBs have been granted liens on certain assets, some of which are in their custody, including RMBS, to collateralize the Company’s obligations under the funding agreements. The Company is permitted to withdraw any portion of the collateral in the custody of the FHLBs as long as there is no event of default and the remaining qualified collateral is sufficient to satisfy the collateral maintenance level. Upon any event of default by the Company, the FHLBs recovery on the collateral is limited to the amount of the Company’s liabilities to the FHLBs.
4. Deferred Policy Acquisition Costs, Value of Business Acquired and Other Intangibles
See
Note 1
for a description of capitalized acquisition costs.
Traditional Life Insurance Contracts
The Company amortizes DAC and VOBA related to these contracts (primarily term insurance) over the appropriate premium paying period in proportion to the actual and expected future gross premiums that were set at contract issue. The expected premiums are based upon the premium requirement of each policy and assumptions for mortality, persistency and investment returns at policy issuance, or policy acquisition (as it relates to VOBA), include provisions for adverse deviation, and are consistent with the assumptions used to calculate future policy benefit liabilities. These assumptions are not revised after policy issuance or acquisition unless the DAC or VOBA balance is deemed to be unrecoverable from future expected profits. Absent a premium deficiency, variability in amortization after policy issuance or acquisition is caused only by variability in premium volumes.
195
Brighthouse Financial, Inc.
Notes to the Consolidated and Combined Financial Statements (continued)
4. Deferred Policy Acquisition Costs, Value of Business Acquired and Other Intangibles (continued)
Fixed and Variable Universal Life Contracts and Fixed and Variable Deferred Annuity Contracts
The Company amortizes DAC and VOBA related to these contracts over the estimated lives of the contracts in proportion to actual and expected future gross profits. The amortization includes interest based on rates in effect at inception or acquisition of the contracts. The amount of future gross profits is dependent principally upon returns in excess of the amounts credited to policyholders, mortality, persistency, benefit elections and withdrawals, interest crediting rates, expenses to administer the business, creditworthiness of reinsurance counterparties, the effect of any hedges used and certain economic variables, such as inflation. Of these factors, the Company anticipates that investment returns, expenses, persistency and benefit elections and withdrawals are reasonably likely to significantly impact the rate of DAC and VOBA amortization. Each reporting period, the Company updates the estimated gross profits with the actual gross profits for that period. When the actual gross profits change from previously estimated gross profits, the cumulative DAC and VOBA amortization is re-estimated and adjusted by a cumulative charge or credit to current operations. When actual gross profits exceed those previously estimated, the DAC and VOBA amortization will increase, resulting in a current period charge to earnings. The opposite result occurs when the actual gross profits are below the previously estimated gross profits. Each reporting period, the Company also updates the actual amount of business remaining in-force, which impacts expected future gross profits. When expected future gross profits are below those previously estimated, the DAC and VOBA amortization will increase, resulting in a current period charge to earnings. The opposite result occurs when the expected future gross profits are above the previously estimated expected future gross profits. Each period, the Company also reviews the estimated gross profits for each block of business to determine the recoverability of DAC and VOBA balances.
Factors Impacting Amortization
Separate account rates of return on variable universal life contracts and variable deferred annuity contracts affect in-force account balances on such contracts each reporting period, which can result in significant fluctuations in amortization of DAC and VOBA. Returns that are higher than the Company’s long-term expectation produce higher account balances, which increases the Company’s future fee expectations and decreases future benefit payment expectations on minimum death and living benefit guarantees, resulting in higher expected future gross profits. The opposite result occurs when returns are lower than the Company’s long-term expectation. The Company’s practice to determine the impact of gross profits resulting from returns on separate accounts assumes that long-term appreciation in equity markets is not changed by short-term market fluctuations, but is only changed when sustained interim deviations are expected. The Company monitors these events and only changes the assumption when its long-term expectation changes.
The Company also annually reviews other long-term assumptions underlying the projections of estimated gross profits. These assumptions primarily relate to investment returns, policyholder dividend scales, interest crediting rates, mortality, persistency, benefit elections and withdrawals and expenses to administer business. Management annually updates assumptions used in the calculation of estimated gross profits which may have significantly changed. If the update of assumptions causes expected future gross profits to increase, DAC and VOBA amortization will generally decrease, resulting in a current period increase to earnings. The opposite result occurs when the assumption update causes expected future gross profits to decrease.
Periodically, the Company modifies product benefits, features, rights or coverages that occur by the exchange of a contract for a new contract, or by amendment, endorsement, or rider to a contract, or by election or coverage within a contract. If such modification, referred to as an internal replacement, substantially changes the contract, the associated DAC or VOBA is written off immediately through income and any new deferrable costs associated with the replacement contract are deferred. If the modification does not substantially change the contract, the DAC or VOBA amortization on the original contract will continue and any acquisition costs associated with the related modification are expensed.
Amortization of DAC and VOBA is attributed to net investment gains (losses) and net derivative gains (losses), and to other expenses for the amount of gross profits originating from transactions other than investment gains and losses. Unrealized investment gains and losses represent the amount of DAC and VOBA that would have been amortized if such gains and losses had been recognized.
196
Brighthouse Financial, Inc.
Notes to the Consolidated and Combined Financial Statements (continued)
4. Deferred Policy Acquisition Costs, Value of Business Acquired and Other Intangibles (continued)
Information regarding DAC and VOBA was as follows:
|
Years Ended December 31,
|
|||||||||||
|
2017
|
2016
|
2015
|
|||||||||
|
(In millions)
|
|||||||||||
|
DAC:
|
|||||||||||
|
Balance at January 1,
|
$
|
5,652
|
|
$
|
5,679
|
|
$
|
5,819
|
|
||
|
Capitalizations
|
260
|
|
334
|
|
399
|
|
|||||
|
Amortization related to:
|
|||||||||||
|
Net investment gains (losses) and net derivative gains (losses)
|
258
|
|
1,400
|
|
109
|
|
|||||
|
Other expenses
|
(445
|
)
|
(1,656
|
)
|
(744
|
)
|
|||||
|
Total amortization
|
(187
|
)
|
(256
|
)
|
(635
|
)
|
|||||
|
Unrealized investment gains (losses)
|
(47
|
)
|
(56
|
)
|
96
|
|
|||||
|
Other
|
—
|
|
(49
|
)
|
—
|
|
|||||
|
Balance at December 31,
|
5,678
|
|
5,652
|
|
5,679
|
|
|||||
|
VOBA:
|
|||||||||||
|
Balance at January 1,
|
641
|
|
711
|
|
763
|
|
|||||
|
Amortization related to:
|
|||||||||||
|
Net investment gains (losses) and net derivative gains (losses)
|
(9
|
)
|
2
|
|
(19
|
)
|
|||||
|
Other expenses
|
(31
|
)
|
(117
|
)
|
(127
|
)
|
|||||
|
Total amortization
|
(40
|
)
|
(115
|
)
|
(146
|
)
|
|||||
|
Unrealized investment gains (losses)
|
7
|
|
45
|
|
94
|
|
|||||
|
Balance at December 31,
|
608
|
|
641
|
|
711
|
|
|||||
|
Total DAC and VOBA:
|
|||||||||||
|
Balance at December 31,
|
$
|
6,286
|
|
$
|
6,293
|
|
$
|
6,390
|
|
||
Information regarding total DAC and VOBA by segment, as well as Corporate & Other, was as follows at:
|
December 31,
|
|||||||
|
2017
|
2016
|
||||||
|
(In millions)
|
|||||||
|
Annuities
|
$
|
5,047
|
|
$
|
4,878
|
|
|
|
Life
|
1,106
|
|
1,261
|
|
|||
|
Run-off
|
5
|
|
6
|
|
|||
|
Corporate & Other
|
128
|
|
148
|
|
|||
|
Total
|
$
|
6,286
|
|
$
|
6,293
|
|
|
197
Brighthouse Financial, Inc.
Notes to the Consolidated and Combined Financial Statements (continued)
4. Deferred Policy Acquisition Costs, Value of Business Acquired and Other Intangibles (continued)
Information regarding other intangibles was as follows:
|
Years Ended December 31,
|
||||||||||||
|
2017
|
2016
|
2015
|
||||||||||
|
(In millions)
|
||||||||||||
|
DSI:
|
||||||||||||
|
Balance at January 1,
|
$
|
445
|
|
$
|
532
|
|
$
|
586
|
|
|||
|
Capitalization
|
2
|
|
3
|
|
4
|
|
||||||
|
Amortization
|
(5
|
)
|
(88
|
)
|
(76
|
)
|
||||||
|
Unrealized investment gains (losses)
|
(11
|
)
|
(2
|
)
|
18
|
|
||||||
|
Balance at December 31,
|
$
|
431
|
|
$
|
445
|
|
$
|
532
|
|
|||
|
VODA:
|
||||||||||||
|
Balance at January 1,
|
$
|
120
|
|
$
|
136
|
|
$
|
155
|
|
|||
|
Amortization
|
(15
|
)
|
(16
|
)
|
(19
|
)
|
||||||
|
Balance at December 31,
|
$
|
105
|
|
$
|
120
|
|
$
|
136
|
|
|||
|
Accumulated amortization
|
$
|
155
|
|
$
|
140
|
|
$
|
124
|
|
|||
The estimated future amortization expense to be reported in other expenses for the next five years is as follows:
|
|
VOBA
|
VODA
|
||||||
|
|
(In millions)
|
|||||||
|
2018
|
$
|
98
|
|
$
|
14
|
|
||
|
2019
|
$
|
84
|
|
$
|
13
|
|
||
|
2020
|
$
|
62
|
|
$
|
12
|
|
||
|
2021
|
$
|
53
|
|
$
|
10
|
|
||
|
2022
|
$
|
46
|
|
$
|
9
|
|
||
5. Reinsurance
The Company enters into reinsurance agreements primarily as a purchaser of reinsurance for its various insurance products and also as a provider of reinsurance for some insurance products issued by former affiliated and unaffiliated companies. The Company participates in reinsurance activities in order to limit losses, minimize exposure to significant risks and provide additional capacity for future growth.
Accounting for reinsurance requires extensive use of assumptions and estimates, particularly related to the future performance of the underlying business and the potential impact of counterparty credit risks. The Company periodically reviews actual and anticipated experience compared to the aforementioned assumptions used to establish assets and liabilities relating to ceded and assumed reinsurance and evaluates the financial strength of counterparties to its reinsurance agreements using criteria similar to that evaluated in the security impairment process discussed in
Note 6
.
Annuities and Life
For annuities, the Company reinsures portions of the living and death benefit guarantees issued in connection with certain variable annuities to unaffiliated reinsurers. Under these reinsurance agreements, the Company pays a reinsurance premium generally based on fees associated with the guarantees collected from policyholders, and receives reimbursement for benefits paid or accrued in excess of account values, subject to certain limitations. The value of embedded derivatives on the ceded risk is determined using a methodology consistent with the guarantees directly written by the Company with the exception of the input for nonperformance risk that reflects the credit of the reinsurer. The Company also reinsures
100%
of certain variable annuity risks to a former affiliate and assumed
100%
of the living and death benefit guarantees issued in connection with certain variable annuities issued by a former affiliate.
198
Brighthouse Financial, Inc.
Notes to the Consolidated and Combined Financial Statements (continued)
5. Reinsurance (continued)
For its life products, the Company has historically reinsured the mortality risk primarily on an excess of retention basis or on a quota share basis. The Company currently reinsures
90%
of the mortality risk in excess of
$2 million
for most products. In addition to reinsuring mortality risk as described above, the Company reinsures other risks, as well as specific coverages. Placement of reinsurance is done primarily on an automatic basis and also on a facultative basis for risks with specified characteristics. On a case by case basis, the Company may retain up to
$20 million
per life and reinsure
100%
of amounts in excess of the amount the Company retains. The Company also reinsures portions of the risk associated with certain whole life policies to a former affiliate and assumes certain term life policies and universal life policies with secondary death benefit guarantees issued by a former affiliate. The Company evaluates its reinsurance programs routinely and may increase or decrease its retention at any time.
Corporate & Other
The Company reinsures, through
100%
quota share reinsurance agreements certain run-off long-term care and workers’ compensation business written by the Company. At December 31, 2017, the Company had
$6.5 billion
of reinsurance recoverables associated with our reinsured long-term care business. The reinsurer has established trust accounts for our benefit to secure their obligations under the reinsurance agreements.
Catastrophe Coverage
The Company has exposure to catastrophes which could contribute to significant fluctuations in the Company’s results of operations. The Company uses excess of retention and quota share reinsurance agreements to provide greater diversification of risk and minimize exposure to larger risks.
Reinsurance Recoverables
The Company reinsures its business through a diversified group of reinsurers. The Company analyzes recent trends in arbitration and litigation outcomes in disputes, if any, with its reinsurers. The Company monitors ratings and evaluates the financial strength of its reinsurers by analyzing their financial statements. In addition, the reinsurance recoverable balance due from each reinsurer is evaluated as part of the overall monitoring process. Recoverability of reinsurance recoverable balances is evaluated based on these analyses. The Company generally secures large reinsurance recoverable balances with various forms of collateral, including secured trusts, funds withheld accounts and irrevocable letters of credit. These reinsurance recoverable balances are stated net of allowances for uncollectible reinsurance, which at both December 31,
2017
and
2016
, were not significant.
The Company has secured certain reinsurance recoverable balances with various forms of collateral, including secured trusts, funds withheld accounts and irrevocable letters of credit. The Company had
$2.6 billion
and
$2.7 billion
of unsecured reinsurance recoverable balances with third-party reinsurers at December 31,
2017
and
2016
, respectively.
At December 31,
2017
, the Company had
$9.3 billion
of net ceded reinsurance recoverables with third-parties. Of this total,
$8.0 billion
, or
86%
, were with the Company’s five largest ceded reinsurers, including
$1.4 billion
of net ceded reinsurance recoverables which were unsecured. At December 31,
2016
, the Company had
$9.3 billion
of net ceded reinsurance recoverables with third-parties. Of this total,
$7.8 billion
, or
84%
, were with the Company’s five largest ceded reinsurers, including
$1.5 billion
of net ceded reinsurance recoverables which were unsecured.
199
Brighthouse Financial, Inc.
Notes to the Consolidated and Combined Financial Statements (continued)
5. Reinsurance (continued)
The amounts on the consolidated and combined statements of operations include the impact of reinsurance. Information regarding the significant effects of reinsurance was as follows:
|
|
Years Ended December 31,
|
|||||||||||
|
|
2017
|
2016
|
2015
|
|||||||||
|
|
(In millions)
|
|||||||||||
|
Premiums
|
||||||||||||
|
Direct premiums
|
$
|
1,795
|
|
$
|
2,296
|
|
$
|
2,472
|
|
|||
|
Reinsurance assumed
|
11
|
|
79
|
|
297
|
|
||||||
|
Reinsurance ceded
|
(943
|
)
|
(1,153
|
)
|
(1,090
|
)
|
||||||
|
Net premiums
|
$
|
863
|
|
$
|
1,222
|
|
$
|
1,679
|
|
|||
|
Universal life and investment-type product policy fees
|
||||||||||||
|
Direct universal life and investment-type product policy fees
|
$
|
4,430
|
|
$
|
4,300
|
|
$
|
4,472
|
|
|||
|
Reinsurance assumed
|
96
|
|
119
|
|
132
|
|
||||||
|
Reinsurance ceded
|
(628
|
)
|
(637
|
)
|
(594
|
)
|
||||||
|
Net universal life and investment-type product policy fees
|
$
|
3,898
|
|
$
|
3,782
|
|
$
|
4,010
|
|
|||
|
Other revenues
|
||||||||||||
|
Direct other revenues
|
$
|
576
|
|
$
|
326
|
|
$
|
292
|
|
|||
|
Reinsurance assumed
|
28
|
|
87
|
|
—
|
|
||||||
|
Reinsurance ceded
|
47
|
|
323
|
|
130
|
|
||||||
|
Net other revenues
|
$
|
651
|
|
$
|
736
|
|
$
|
422
|
|
|||
|
Policyholder benefits and claims
|
||||||||||||
|
Direct policyholder benefits and claims
|
$
|
5,228
|
|
$
|
6,351
|
|
$
|
5,208
|
|
|||
|
Reinsurance assumed
|
31
|
|
123
|
|
298
|
|
||||||
|
Reinsurance ceded
|
(1,623
|
)
|
(2,571
|
)
|
(2,237
|
)
|
||||||
|
Net policyholder benefits and claims
|
$
|
3,636
|
|
$
|
3,903
|
|
$
|
3,269
|
|
|||
The amounts on the consolidated and combined balance sheets include the impact of reinsurance. Information regarding the significant effects of reinsurance was as follows at:
|
|
December 31,
|
||||||||||||||||||||||||||||||
|
|
2017
|
2016
|
|||||||||||||||||||||||||||||
|
|
Direct
|
Assumed
|
Ceded
|
Total
Balance
Sheet
|
Direct
|
Assumed
|
Ceded
|
Total
Balance
Sheet
|
|||||||||||||||||||||||
|
|
(In millions)
|
||||||||||||||||||||||||||||||
|
Assets
|
|||||||||||||||||||||||||||||||
|
Premiums, reinsurance and other receivables
|
$
|
647
|
|
$
|
27
|
|
$
|
12,851
|
|
$
|
13,525
|
|
$
|
1,152
|
|
$
|
21
|
|
$
|
13,474
|
|
$
|
14,647
|
|
|||||||
|
Liabilities
|
|||||||||||||||||||||||||||||||
|
Policyholder account balances
|
$
|
37,510
|
|
$
|
273
|
|
$
|
—
|
|
$
|
37,783
|
|
$
|
37,066
|
|
$
|
460
|
|
$
|
—
|
|
$
|
37,526
|
|
|||||||
|
Other policy-related balances
|
$
|
1,311
|
|
$
|
1,674
|
|
$
|
—
|
|
$
|
2,985
|
|
$
|
1,368
|
|
$
|
1,677
|
|
$
|
—
|
|
$
|
3,045
|
|
|||||||
|
Other liabilities
|
$
|
4,475
|
|
$
|
32
|
|
$
|
756
|
|
$
|
5,263
|
|
$
|
4,818
|
|
$
|
12
|
|
$
|
1,099
|
|
$
|
5,929
|
|
|||||||
Effective December 1, 2016, the Company terminated two agreements with an third-party reinsurer which covered
90%
of the liabilities on certain participating whole life insurance policies issued between April 1, 2000 and December 31, 2001 by MLIC. This termination resulted in a decrease in other invested assets of
$713 million
, a decrease in DAC and VOBA of
$95 million
, a decrease in future policy benefits of
$654 million
, and a decrease in other liabilities of
$43 million
. The Company recognized a loss of approximately
$72 million
, net of income tax, as a result of this transaction.
200
Brighthouse Financial, Inc.
Notes to the Consolidated and Combined Financial Statements (continued)
5. Reinsurance (continued)
Reinsurance agreements that do not expose the Company to a reasonable possibility of a significant loss from insurance risk are recorded using the deposit method of accounting. The deposit assets on reinsurance were
$1.6 billion
and
$2.0 billion
at December 31,
2017
and
2016
, respectively. The deposit liabilities on reinsurance were less than
$1 million
and
$1 million
at December 31,
2017
and
2016
, respectively.
Related Party Reinsurance Transactions
The Company has reinsurance agreements with certain MetLife, Inc. subsidiaries, including MLIC, General American Life Insurance Company, MetLife Europe d.a.c., MetLife Reinsurance Company of Vermont (“MRV”), Delaware American Life Insurance Company and American Life Insurance Company, all of which were related parties at
December 31, 2017
.
Information regarding the significant effects of reinsurance with former MetLife affiliates included on the consolidated and combined statements of operations was as follows:
|
Years Ended December 31,
|
|||||||||||
|
2017
|
2016
|
2015
|
|||||||||
|
(In millions)
|
|||||||||||
|
Premiums
|
|||||||||||
|
Reinsurance assumed
|
$
|
11
|
|
$
|
34
|
|
$
|
227
|
|
||
|
Reinsurance ceded
|
(537
|
)
|
(766
|
)
|
(687
|
)
|
|||||
|
Net premiums
|
$
|
(526
|
)
|
$
|
(732
|
)
|
$
|
(460
|
)
|
||
|
Universal life and investment-type product policy fees
|
|||||||||||
|
Reinsurance assumed
|
$
|
96
|
|
$
|
119
|
|
$
|
132
|
|
||
|
Reinsurance ceded
|
(14
|
)
|
(60
|
)
|
(59
|
)
|
|||||
|
Net universal life and investment-type product policy fees
|
$
|
82
|
|
$
|
59
|
|
$
|
73
|
|
||
|
Other revenues
|
|||||||||||
|
Reinsurance assumed
|
$
|
27
|
|
$
|
56
|
|
$
|
—
|
|
||
|
Reinsurance ceded
|
44
|
|
320
|
|
130
|
|
|||||
|
Net other revenues
|
$
|
71
|
|
$
|
376
|
|
$
|
130
|
|
||
|
Policyholder benefits and claims
|
|||||||||||
|
Reinsurance assumed
|
$
|
30
|
|
$
|
86
|
|
$
|
248
|
|
||
|
Reinsurance ceded
|
(420
|
)
|
(757
|
)
|
(678
|
)
|
|||||
|
Net policyholder benefits and claims
|
$
|
(390
|
)
|
$
|
(671
|
)
|
$
|
(430
|
)
|
||
201
Brighthouse Financial, Inc.
Notes to the Consolidated and Combined Financial Statements (continued)
5. Reinsurance (continued)
Information regarding the significant effects of reinsurance with former MetLife affiliates included on the consolidated and combined balance sheets was as follows at:
|
|
December 31,
|
||||||||||||||
|
|
2017
|
2016
|
|||||||||||||
|
|
Assumed
|
Ceded
|
Assumed
|
Ceded
|
|||||||||||
|
|
(In millions)
|
||||||||||||||
|
Assets
|
|||||||||||||||
|
Premiums, reinsurance and other receivables
|
$
|
18
|
|
$
|
3,410
|
|
$
|
21
|
|
$
|
4,020
|
|
|||
|
Liabilities
|
|||||||||||||||
|
Policyholder account balances
|
$
|
—
|
|
$
|
—
|
|
$
|
460
|
|
$
|
—
|
|
|||
|
Other policy-related balances
|
$
|
1,674
|
|
$
|
—
|
|
$
|
1,677
|
|
$
|
—
|
|
|||
|
Other liabilities
|
$
|
30
|
|
$
|
401
|
|
$
|
10
|
|
$
|
715
|
|
|||
The Company previously assumed risks from MLIC related to guaranteed minimum benefits written directly by MLIC. The assumed reinsurance agreement contained embedded derivatives and changes in the estimated fair value are also included within net derivative gains (losses). The embedded derivatives associated with the agreement are included within policyholder account balances and were
$0
and
$460 million
at
December 31, 2017
and
2016
, respectively. Net derivative gains (losses) associated with the embedded derivatives were
$110 million
,
($27) million
and
($34) million
for the years ended
December 31, 2017
,
2016
and
2015
, respectively.
I
n January 2017, MLIC recaptured these risks being reinsured by the Company. This recapture resulted in a decrease in investments and cash and cash equivalents of
$568 million
, a decrease in future policy benefits of
$106 million
, and a decrease in policyholder account balances of
$460 million
. In June 2017, there was an adjustment to the recapture amounts of this transaction, which resulted in an increase in premiums, reinsurance and other receivables of
$140 million
at June 30, 2017. The Company recognized a gain of
$89 million
, net of income tax, as a result of this transaction.
The Company cedes risks to MLIC related to guaranteed minimum benefits written directly by the Company. The ceded reinsurance agreement contains embedded derivatives and changes in the estimated fair value are also included within net derivative gains (losses). The embedded derivatives associated with the cessions are included within premiums, reinsurance and other receivables and were
$2 million
and
$390 million
at
December 31, 2017
and
2016
, respectively. Net derivative gains (losses) associated with the embedded derivatives were
($263) million
,
$62 million
and
$100 million
for the years ended
December 31, 2017
,
2016
and
2015
, respectively.
In May 2017, the Company recaptured from MLIC risks related to multiple life products ceded under yearly renewable term and coinsurance agreements. This recapture resulted in an increase in cash and cash equivalents of
$214 million
and a decrease in premiums, reinsurance and other receivables of
$189 million
. The Company recognized a gain of
$17 million
, net of income tax, as a result of reinsurance termination.
In January 2017, the Company executed a novation and assignment of reinsurance agreements under which MLIC reinsured certain variable annuities, including guaranteed minimum benefits, issued by BHNY and NELICO. As a result of the novation and assignment, the reinsurance agreements are now between Brighthouse Life Insurance Company, BHNY and NELICO. The transaction was treated as a termination of the existing reinsurance agreements with recognition of a loss and new reinsurance agreements with no recognition of a gain or loss. The transaction resulted in an increase in other liabilities of
$274 million
. The Company recognized a loss of
$178 million
, net of income tax, as a result of this transaction.
In December 2016, the Company recaptured level premium term business previously reinsured to MRV. This recapture resulted in a decrease in cash and cash equivalents of
$27 million
, a decrease in premiums, reinsurance and other receivables of
$94 million
and a decrease in other liabilities of
$158 million
. The Company recognized a gain of
$24 million
, net of income tax, as a result of this recapture.
In November 2016, the Company recaptured certain single premium deferred annuity contracts previously reinsured to MLIC. This recapture resulted in an increase in investments and cash and cash equivalents of
$933 million
and increase in DAC of
$23 million
, offset by a decrease in premiums, reinsurance and other receivables of
$923 million
. The Company recognized a gain of
$22 million
, net of income tax, as a result of this recapture.
202
Brighthouse Financial, Inc.
Notes to the Consolidated and Combined Financial Statements (continued)
5. Reinsurance (continued)
In April 2016, the Company recaptured risks related to certain single premium deferred annuity contracts previously reinsured to MLIC. As a result of this recapture, the significant effects to the Company were an increase in investments and cash and cash equivalents of
$4.3 billion
and an increase in DAC of
$87 million
, offset by a decrease in premiums, reinsurance and other receivables of
$4.0 billion
. The Company recognized a gain of
$246 million
, net of income tax, as a result of this recapture.
The Company has secured certain reinsurance recoverable balances with various forms of collateral, including secured trusts, funds withheld accounts and irrevocable letters of credit. The Company had
$2.6 billion
and
$3.2 billion
of unsecured related party reinsurance recoverable balances at
December 31, 2017
and
2016
, respectively.
Related party reinsurance agreements that do not expose the Company to a reasonable possibility of a significant loss from insurance risk are recorded using the deposit method of accounting. The deposit assets on related party reinsurance were
$1.4 billion
and
$1.7 billion
at
December 31, 2017
and
2016
, respectively. There were no deposit liabilities on related party reinsurance at both
December 31, 2017
and
2016
.
6. Investments
See
Note 8
for information about the fair value hierarchy for investments and the related valuation methodologies.
Fixed Maturity and Equity Securities AFS
Fixed Maturity and Equity Securities AFS by Sector
The following table presents the fixed maturity and equity securities AFS by sector at:
|
December 31, 2017
|
December 31, 2016
|
||||||||||||||||||||||||||||||||||||||
|
Cost or
Amortized
Cost
|
Gross Unrealized
|
Estimated
Fair
Value
|
Cost or
Amortized
Cost
|
Gross Unrealized
|
Estimated
Fair
Value
|
||||||||||||||||||||||||||||||||||
|
Gains
|
Temporary
Losses
|
OTTI
Losses (1) |
Gains
|
Temporary
Losses
|
OTTI
Losses (1) |
||||||||||||||||||||||||||||||||||
|
(In millions)
|
|||||||||||||||||||||||||||||||||||||||
|
Fixed maturity securities: (2)
|
|||||||||||||||||||||||||||||||||||||||
|
U.S. corporate
|
$
|
21,190
|
|
$
|
1,859
|
|
$
|
92
|
|
$
|
—
|
|
$
|
22,957
|
|
$
|
21,278
|
|
$
|
1,324
|
|
$
|
291
|
|
$
|
—
|
|
$
|
22,311
|
|
|||||||||
|
U.S. government and agency
|
14,548
|
|
1,862
|
|
118
|
|
—
|
|
16,292
|
|
12,032
|
|
1,294
|
|
236
|
|
—
|
|
13,090
|
|
|||||||||||||||||||
|
RMBS
|
7,749
|
|
285
|
|
60
|
|
(3
|
)
|
7,977
|
|
7,961
|
|
206
|
|
144
|
|
—
|
|
8,023
|
|
|||||||||||||||||||
|
Foreign corporate
|
6,703
|
|
386
|
|
66
|
|
—
|
|
7,023
|
|
6,343
|
|
230
|
|
180
|
|
—
|
|
6,393
|
|
|||||||||||||||||||
|
State and political subdivision
|
3,635
|
|
553
|
|
6
|
|
1
|
|
4,181
|
|
3,590
|
|
393
|
|
38
|
|
—
|
|
3,945
|
|
|||||||||||||||||||
|
CMBS
|
3,386
|
|
53
|
|
17
|
|
(1
|
)
|
3,423
|
|
3,799
|
|
44
|
|
32
|
|
(1
|
)
|
3,812
|
|
|||||||||||||||||||
|
ABS
|
1,810
|
|
21
|
|
2
|
|
—
|
|
1,829
|
|
2,654
|
|
12
|
|
14
|
|
—
|
|
2,652
|
|
|||||||||||||||||||
|
Foreign government
|
1,152
|
|
161
|
|
4
|
|
—
|
|
1,309
|
|
1,058
|
|
116
|
|
12
|
|
—
|
|
1,162
|
|
|||||||||||||||||||
|
Total fixed maturity securities
|
$
|
60,173
|
|
$
|
5,180
|
|
$
|
365
|
|
$
|
(3
|
)
|
$
|
64,991
|
|
$
|
58,715
|
|
$
|
3,619
|
|
$
|
947
|
|
$
|
(1
|
)
|
$
|
61,388
|
|
|||||||||
|
Equity securities (2)
|
$
|
212
|
|
$
|
21
|
|
$
|
1
|
|
$
|
—
|
|
$
|
232
|
|
$
|
280
|
|
$
|
29
|
|
$
|
9
|
|
$
|
—
|
|
$
|
300
|
|
|||||||||
__________________
|
(1)
|
Noncredit OTTI losses included in AOCI in an unrealized gain position are due to increases in estimated fair value subsequent to initial recognition of noncredit losses on such securities. See also “— Net Unrealized Investment Gains (Losses).”
|
|
(2)
|
Redeemable preferred stock is reported within U.S. corporate and foreign corporate fixed maturity securities and non-redeemable preferred stock is reported within equity securities. Included within fixed maturity securities are Structured Securities.
|
The Company held non-income producing fixed maturity securities with an estimated fair value of
$4 million
and
$5 million
with unrealized gains (losses) of
($2) million
and less than
$1 million
at December 31,
2017
and
2016
, respectively.
203
Brighthouse Financial, Inc.
Notes to the Consolidated and Combined Financial Statements (continued)
6. Investments (continued)
Maturities of Fixed Maturity Securities
The amortized cost and estimated fair value of fixed maturity securities, by contractual maturity date, were as follows at
December 31, 2017
:
|
Due in One Year or Less
|
Due After One Year Through Five Years
|
Due After Five Years Through Ten Years
|
Due After Ten Years
|
Structured Securities
|
Total Fixed Maturity Securities
|
||||||||||||||||||
|
(In millions)
|
|||||||||||||||||||||||
|
Amortized cost
|
$
|
1,871
|
|
$
|
10,548
|
|
$
|
11,478
|
|
$
|
23,331
|
|
$
|
12,945
|
|
$
|
60,173
|
|
|||||
|
Estimated fair value
|
$
|
1,876
|
|
$
|
10,890
|
|
$
|
11,816
|
|
$
|
27,180
|
|
$
|
13,229
|
|
$
|
64,991
|
|
|||||
Actual maturities may differ from contractual maturities due to the exercise of call or prepayment options. Fixed maturity securities not due at a single maturity date have been presented in the year of final contractual maturity. Structured Securities are shown separately, as they are not due at a single maturity.
Continuous Gross Unrealized Losses for Fixed Maturity and Equity Securities AFS by Sector
The following table presents the estimated fair value and gross unrealized losses of fixed maturity and equity securities AFS in an unrealized loss position, aggregated by sector and by length of time that the securities have been in a continuous unrealized loss position at:
|
December 31, 2017
|
December 31, 2016
|
||||||||||||||||||||||||||||||
|
Less than 12 Months
|
Equal to or Greater than 12 Months
|
Less than 12 Months
|
Equal to or Greater than 12 Months
|
||||||||||||||||||||||||||||
|
Estimated
Fair
Value
|
Gross
Unrealized
Losses
|
Estimated
Fair
Value
|
Gross
Unrealized
Losses
|
Estimated
Fair
Value
|
Gross
Unrealized
Losses
|
Estimated
Fair
Value
|
Gross
Unrealized
Losses
|
||||||||||||||||||||||||
|
(Dollars in millions)
|
|||||||||||||||||||||||||||||||
|
Fixed maturity securities:
|
|||||||||||||||||||||||||||||||
|
U.S. corporate
|
$
|
1,783
|
|
$
|
21
|
|
$
|
1,451
|
|
$
|
71
|
|
$
|
4,676
|
|
$
|
189
|
|
$
|
745
|
|
$
|
102
|
|
|||||||
|
U.S. government and agency
|
4,962
|
|
38
|
|
1,573
|
|
80
|
|
4,396
|
|
236
|
|
—
|
|
—
|
|
|||||||||||||||
|
RMBS
|
2,367
|
|
14
|
|
1,332
|
|
43
|
|
3,494
|
|
112
|
|
818
|
|
32
|
|
|||||||||||||||
|
Foreign corporate
|
637
|
|
8
|
|
603
|
|
58
|
|
1,466
|
|
66
|
|
633
|
|
114
|
|
|||||||||||||||
|
State and political subdivision
|
170
|
|
3
|
|
106
|
|
4
|
|
889
|
|
35
|
|
29
|
|
3
|
|
|||||||||||||||
|
CMBS
|
619
|
|
6
|
|
335
|
|
10
|
|
1,572
|
|
27
|
|
171
|
|
4
|
|
|||||||||||||||
|
ABS
|
170
|
|
—
|
|
74
|
|
2
|
|
478
|
|
6
|
|
461
|
|
8
|
|
|||||||||||||||
|
Foreign government
|
155
|
|
2
|
|
69
|
|
2
|
|
273
|
|
11
|
|
6
|
|
1
|
|
|||||||||||||||
|
Total fixed maturity securities
|
$
|
10,863
|
|
$
|
92
|
|
$
|
5,543
|
|
$
|
270
|
|
$
|
17,244
|
|
$
|
682
|
|
$
|
2,863
|
|
$
|
264
|
|
|||||||
|
Equity securities
|
$
|
17
|
|
$
|
—
|
|
$
|
10
|
|
$
|
1
|
|
$
|
57
|
|
$
|
2
|
|
$
|
40
|
|
$
|
7
|
|
|||||||
|
Total number of securities in an unrealized loss position
|
922
|
|
642
|
|
1,741
|
|
483
|
|
|||||||||||||||||||||||
204
Brighthouse Financial, Inc.
Notes to the Consolidated and Combined Financial Statements (continued)
6. Investments (continued)
Evaluation of AFS Securities for OTTI and Evaluating Temporarily Impaired AFS Securities
Evaluation and Measurement Methodologies
Management considers a wide range of factors about the security issuer and uses its best judgment in evaluating the cause of the decline in the estimated fair value of the security and in assessing the prospects for near-term recovery. Inherent in management’s evaluation of the security are assumptions and estimates about the operations of the issuer and its future earnings potential. Considerations used in the impairment evaluation process include, but are not limited to: (i) the length of time and the extent to which the estimated fair value has been below cost or amortized cost; (ii) the potential for impairments when the issuer is experiencing significant financial difficulties; (iii) the potential for impairments in an entire industry sector or sub-sector; (iv) the potential for impairments in certain economically depressed geographic locations; (v) the potential for impairments where the issuer, series of issuers or industry has suffered a catastrophic loss or has exhausted natural resources; (vi) with respect to fixed maturity securities, whether the Company has the intent to sell or will more likely than not be required to sell a particular security before the decline in estimated fair value below amortized cost recovers; (vii) with respect to Structured Securities, changes in forecasted cash flows after considering the quality of underlying collateral, expected prepayment speeds, current and forecasted loss severity, consideration of the payment terms of the underlying assets backing a particular security, and the payment priority within the tranche structure of the security; (viii) the potential for impairments due to weakening of foreign currencies on non-functional currency denominated fixed maturity securities that are near maturity; and (ix) other subjective factors, including concentrations and information obtained from regulators and rating agencies.
Current Period Evaluation
Based on the Company’s current evaluation of its AFS securities in an unrealized loss position in accordance with its impairment policy, and the Company’s current intentions and assessments (as applicable to the type of security) about holding, selling and any requirements to sell these securities, the Company concluded that these securities were not other-than-temporarily impaired at December 31,
2017
.
G
ross unrealized losses on fixed maturity securities decreased
$584 million
during the year ended December 31,
2017
to
$362 million
. The decrease in gross unrealized losses for the year ended December 31,
2017
, was primarily attributable to narrowing credit spreads and decreasing longer-term interest rates.
At December 31,
2017
,
$7 million
of the total
$362 million
of gross unrealized losses were from
10
fixed maturity securities with an unrealized loss position of
20%
or more of amortized cost for six months or greater, of which
$3 million
were from investment grade fixed maturity securities.
205
Brighthouse Financial, Inc.
Notes to the Consolidated and Combined Financial Statements (continued)
6. Investments (continued)
Mortgage Loans
Mortgage Loans by Portfolio Segment
Mortgage loans are summarized as follows at:
|
|
December 31,
|
||||||||||||
|
|
2017
|
2016
|
|||||||||||
|
Carrying
Value
|
% of
Total
|
Carrying
Value
|
% of
Total
|
||||||||||
|
|
(Dollars in millions)
|
||||||||||||
|
Mortgage loans:
|
|||||||||||||
|
Commercial
|
$
|
7,260
|
|
67.5
|
%
|
$
|
6,523
|
|
69.6
|
%
|
|||
|
Agricultural
|
2,276
|
|
21.2
|
|
1,892
|
|
20.2
|
|
|||||
|
Residential
|
1,138
|
|
10.6
|
|
867
|
|
9.2
|
|
|||||
|
Subtotal (1)
|
10,674
|
|
99.3
|
|
9,282
|
|
99.0
|
|
|||||
|
Valuation allowances (2)
|
(47
|
)
|
(0.4
|
)
|
(40
|
)
|
(0.4
|
)
|
|||||
|
Subtotal mortgage loans, net
|
10,627
|
|
98.9
|
|
9,242
|
|
98.6
|
|
|||||
|
Commercial mortgage loans held by CSEs — FVO
|
115
|
|
1.1
|
|
136
|
|
1.4
|
|
|||||
|
Total mortgage loans, net
|
$
|
10,742
|
|
100.0
|
%
|
$
|
9,378
|
|
100.0
|
%
|
|||
__________________
|
(1)
|
The Company purchases unaffiliated mortgage loans under a master participation agreement from a former affiliate, simultaneously with the former affiliate’s origination or acquisition of mortgage loans. The aggregate amount of unaffiliated mortgage loan participation interests purchased by the Company from the former affiliate during the years ended December 31,
2017
,
2016
and
2015
were
$1.2 billion
,
$2.4 billion
and
$2.0 billion
, respectively. In connection with the mortgage loan participations, the former affiliate collected mortgage loan principal and interest payments on the Company’s behalf and the former affiliate remitted such payments to the Company in the amount of
$946 million
,
$1.6 billion
and
$1.0 billion
during the years ended December 31,
2017
,
2016
and
2015
, respectively.
|
Purchases of mortgage loans from third parties were
$420 million
and
$619 million
for the years ended December 31,
2017
and
2016
, respectively, and were primarily comprised of residential mortgage loans.
|
(2)
|
The valuation allowances were primarily from collective evaluation (non-specific loan related).
|
See “— Variable Interest Entities” for discussion of CSEs.
Information on commercial, agricultural and residential mortgage loans is presented in the tables below. Information on residential — FVO and commercial mortgage loans held by CSEs — FVO is presented in
Note 8
. The Company elects the FVO for certain mortgage loans and related long-term debt that are managed on a total return basis.
206
Brighthouse Financial, Inc.
Notes to the Consolidated and Combined Financial Statements (continued)
6. Investments (continued)
Valuation Allowance Methodology
Mortgage loans are considered to be impaired when it is probable that, based upon current information and events, the Company will be unable to collect all amounts due under the loan agreement. Specific valuation allowances are established using the same methodology for all three portfolio segments as the excess carrying value of a loan over either (i) the present value of expected future cash flows discounted at the loan’s original effective interest rate, (ii) the estimated fair value of the loan’s underlying collateral if the loan is in the process of foreclosure or otherwise collateral dependent, or (iii) the loan’s observable market price. A common evaluation framework is used for establishing non-specific valuation allowances for all loan portfolio segments; however, a separate non-specific valuation allowance is calculated and maintained for each loan portfolio segment that is based on inputs unique to each loan portfolio segment. Non-specific valuation allowances are established for pools of loans with similar risk characteristics where a property-specific or market-specific risk has not been identified, but for which the Company expects to incur a credit loss. These evaluations are based upon several loan portfolio segment-specific factors, including the Company’s experience for loan losses, defaults and loss severity, and loss expectations for loans with similar risk characteristics. These evaluations are revised as conditions change and new information becomes available.
Credit Quality of Commercial Mortgage Loans
The credit quality of commercial mortgage loans was as follows at:
|
Recorded Investment
|
Estimated
Fair
Value
|
% of
Total
|
|||||||||||||||||||||||
|
Debt Service Coverage Ratios
|
Total
|
% of
Total
|
|||||||||||||||||||||||
|
> 1.20x
|
1.00x - 1.20x
|
< 1.00x
|
|||||||||||||||||||||||
|
(Dollars in millions)
|
|||||||||||||||||||||||||
|
December 31, 2017
|
|||||||||||||||||||||||||
|
Loan-to-value ratios:
|
|||||||||||||||||||||||||
|
Less than 65%
|
$
|
6,194
|
|
$
|
293
|
|
$
|
33
|
|
$
|
6,520
|
|
89.8
|
%
|
$
|
6,681
|
|
90.0
|
%
|
||||||
|
65% to 75%
|
642
|
|
—
|
|
14
|
|
656
|
|
9.0
|
|
658
|
|
8.9
|
|
|||||||||||
|
76% to 80%
|
42
|
|
—
|
|
9
|
|
51
|
|
0.7
|
|
50
|
|
0.7
|
|
|||||||||||
|
Greater than 80%
|
—
|
|
9
|
|
24
|
|
33
|
|
0.5
|
|
30
|
|
0.4
|
|
|||||||||||
|
Total
|
$
|
6,878
|
|
$
|
302
|
|
$
|
80
|
|
$
|
7,260
|
|
100.0
|
%
|
$
|
7,419
|
|
100.0
|
%
|
||||||
|
December 31, 2016
|
|||||||||||||||||||||||||
|
Loan-to-value ratios:
|
|||||||||||||||||||||||||
|
Less than 65%
|
$
|
5,744
|
|
$
|
230
|
|
$
|
167
|
|
$
|
6,141
|
|
94.1
|
%
|
$
|
6,222
|
|
94.3
|
%
|
||||||
|
65% to 75%
|
291
|
|
—
|
|
19
|
|
310
|
|
4.8
|
|
303
|
|
4.6
|
|
|||||||||||
|
76% to 80%
|
34
|
|
—
|
|
—
|
|
34
|
|
0.5
|
|
33
|
|
0.5
|
|
|||||||||||
|
Greater than 80%
|
24
|
|
14
|
|
—
|
|
38
|
|
0.6
|
|
37
|
|
0.6
|
|
|||||||||||
|
Total
|
$
|
6,093
|
|
$
|
244
|
|
$
|
186
|
|
$
|
6,523
|
|
100.0
|
%
|
$
|
6,595
|
|
100.0
|
%
|
||||||
Credit Quality of Agricultural Mortgage Loans
The credit quality of agricultural mortgage loans was as follows at:
|
December 31,
|
|||||||||||||
|
2017
|
2016
|
||||||||||||
|
Recorded
Investment
|
% of
Total
|
Recorded
Investment
|
% of
Total
|
||||||||||
|
(Dollars in millions)
|
|||||||||||||
|
Loan-to-value ratios:
|
|||||||||||||
|
Less than 65%
|
$
|
2,113
|
|
92.8
|
%
|
$
|
1,849
|
|
97.7
|
%
|
|||
|
65% to 75%
|
163
|
|
7.2
|
|
43
|
|
2.3
|
|
|||||
|
Total
|
$
|
2,276
|
|
100.0
|
%
|
$
|
1,892
|
|
100.0
|
%
|
|||
207
Brighthouse Financial, Inc.
Notes to the Consolidated and Combined Financial Statements (continued)
6. Investments (continued)
The estimated fair value of agricultural mortgage loans was
$2.3 billion
and
$1.9 billion
at December 31,
2017
and
2016
, respectively.
Credit Quality of Residential Mortgage Loans
The credit quality of residential mortgage loans was as follows at:
|
December 31,
|
|||||||||||||
|
2017
|
2016
|
||||||||||||
|
Recorded
Investment
|
% of
Total
|
Recorded
Investment
|
% of
Total
|
||||||||||
|
(Dollars in millions)
|
|||||||||||||
|
Performance indicators:
|
|||||||||||||
|
Performing
|
$
|
1,106
|
|
97.2
|
%
|
$
|
856
|
|
98.7
|
%
|
|||
|
Nonperforming
|
32
|
|
2.8
|
|
11
|
|
1.3
|
|
|||||
|
Total
|
$
|
1,138
|
|
100.0
|
%
|
$
|
867
|
|
100.0
|
%
|
|||
The estimated fair value of residential mortgage loans was
$1.2 billion
and
$867 million
at December 31,
2017
and
2016
, respectively.
Past Due, Nonaccrual and Modified Mortgage Loans
The Company has a high quality, well performing mortgage loan portfolio, with over
99%
of all mortgage loans classified as performing at both December 31,
2017
and
2016
. The Company defines delinquency consistent with industry practice, when mortgage loans are past due as follows: commercial and residential mortgage loans — 60 days and agricultural mortgage loans — 90 days. The Company had
no
commercial or agricultural mortgage loans past due and
no
commercial or agricultural mortgage loans in nonaccrual status at either December 31,
2017
or
2016
. The recorded investment of residential mortgage loans past due and in nonaccrual status was
$32 million
and
$11 million
at December 31,
2017
and
2016
, respectively. During the years ended December 31,
2017
and
2016
, the Company
did not
have a significant amount of mortgage loans modified in a troubled debt restructuring.
Other Invested Assets
Freestanding derivatives with positive estimated fair values and loans to affiliates comprise over
80%
of other invested assets. See
Note 7
for information about freestanding derivatives with positive estimated fair values and see “— Related Party Investment Transactions” for information regarding loans to affiliates. Other invested assets also includes tax credit and renewable energy partnerships and leveraged leases.
Leveraged Leases
Investment in leveraged leases consisted of the following at:
|
December 31,
|
|||||||
|
2017
|
2016
|
||||||
|
(In millions)
|
|||||||
|
Rental receivables, net
|
$
|
87
|
|
$
|
87
|
|
|
|
Estimated residual values
|
14
|
|
14
|
|
|||
|
Subtotal
|
101
|
|
101
|
|
|||
|
Unearned income
|
(35
|
)
|
(32
|
)
|
|||
|
Investment in leases, net of non-recourse debt
|
$
|
66
|
|
$
|
69
|
|
|
Rental receivables are generally due in periodic installments.
The payment periods for leveraged leases generally range from one to 15 years.
For rental receivables, the primary credit quality indicator is whether the rental receivable is performing or nonperforming, which is assessed monthly. The Company generally defines nonperforming rental receivables as those that are 90 days or more past due. At December 31,
2017
and
2016
,
all
leverage leases were performing.
208
Brighthouse Financial, Inc.
Notes to the Consolidated and Combined Financial Statements (continued)
6. Investments (continued)
The deferred income tax liability related to leveraged leases was
$43 million
and
$74 million
at December 31,
2017
and
2016
, respectively.
Cash Equivalents
The carrying value of cash equivalents, which includes securities and other investments with an original or remaining maturity of three months or less at the time of purchase, was
$1.4 billion
and
$4.8 billion
at December 31,
2017
and
2016
, respectively.
Net Unrealized Investment Gains (Losses)
Unrealized investment gains (losses) on fixed maturity and equity securities AFS and the effect on DAC, VOBA, DSI and future policy benefits, that would result from the realization of the unrealized gains (losses), are included in net unrealized investment gains (losses) in AOCI.
The components of net unrealized investment gains (losses), included in AOCI, were as follows:
|
Years Ended December 31,
|
|||||||||||
|
2017
|
2016
|
2015
|
|||||||||
|
(In millions)
|
|||||||||||
|
Fixed maturity securities
|
$
|
4,806
|
|
$
|
2,663
|
|
$
|
2,324
|
|
||
|
Fixed maturity securities with noncredit OTTI losses in AOCI
|
2
|
|
1
|
|
(23
|
)
|
|||||
|
Total fixed maturity securities
|
4,808
|
|
2,664
|
|
2,301
|
|
|||||
|
Equity securities
|
39
|
|
32
|
|
54
|
|
|||||
|
Derivatives
|
239
|
|
414
|
|
388
|
|
|||||
|
Short-term investments
|
—
|
|
(42
|
)
|
—
|
|
|||||
|
Other
|
(8
|
)
|
(26
|
)
|
5
|
|
|||||
|
Subtotal
|
5,078
|
|
3,042
|
|
2,748
|
|
|||||
|
Amounts allocated from:
|
|||||||||||
|
Future policy benefits
|
(2,626
|
)
|
(802
|
)
|
(126
|
)
|
|||||
|
DAC and VOBA related to noncredit OTTI losses recognized in AOCI
|
(2
|
)
|
(2
|
)
|
(1
|
)
|
|||||
|
DAC, VOBA and DSI
|
(265
|
)
|
(214
|
)
|
(202
|
)
|
|||||
|
Subtotal
|
(2,893
|
)
|
(1,018
|
)
|
(329
|
)
|
|||||
|
Deferred income tax benefit (expense) related to noncredit OTTI losses recognized in AOCI
|
—
|
|
—
|
|
9
|
|
|||||
|
Deferred income tax benefit (expense)
|
(459
|
)
|
(712
|
)
|
(855
|
)
|
|||||
|
Net unrealized investment gains (losses)
|
$
|
1,726
|
|
$
|
1,312
|
|
$
|
1,573
|
|
||
209
Brighthouse Financial, Inc.
Notes to the Consolidated and Combined Financial Statements (continued)
6. Investments (continued)
The changes in net unrealized investment gains (losses) were as follows:
|
Years Ended December 31,
|
||||||||||||
|
2017
|
2016
|
2015
|
||||||||||
|
(In millions)
|
||||||||||||
|
Balance at January 1,
|
$
|
1,312
|
|
$
|
1,573
|
|
$
|
2,745
|
|
|||
|
Fixed maturity securities on which noncredit OTTI losses have been recognized
|
1
|
|
24
|
|
15
|
|
||||||
|
Unrealized investment gains (losses) during the year
|
2,035
|
|
270
|
|
(2,513
|
)
|
||||||
|
Unrealized investment gains (losses) relating to:
|
||||||||||||
|
Future policy benefits
|
(1,824
|
)
|
(676
|
)
|
487
|
|
||||||
|
DAC and VOBA related to noncredit OTTI losses recognized in AOCI
|
—
|
|
(1
|
)
|
1
|
|
||||||
|
DAC, VOBA and DSI
|
(51
|
)
|
(12
|
)
|
207
|
|
||||||
|
Deferred income tax benefit (expense) related to noncredit OTTI losses recognized in AOCI
|
—
|
|
(9
|
)
|
(5
|
)
|
||||||
|
Deferred income tax benefit (expense)
|
253
|
|
143
|
|
636
|
|
||||||
|
Balance at December 31,
|
$
|
1,726
|
|
$
|
1,312
|
|
$
|
1,573
|
|
|||
|
Change in net unrealized investment gains (losses)
|
$
|
414
|
|
$
|
(261
|
)
|
$
|
(1,172
|
)
|
|||
Concentrations of Credit Risk
There were
no
investments in any counterparty that were greater than
10%
of the Company’s equity, other than the U.S. government and its agencies, at both December 31,
2017
and
2016
.
Securities Lending
Elements of the securities lending program are presented below at:
|
December 31,
|
|||||||
|
2017
|
2016
|
||||||
|
(In millions)
|
|||||||
|
Securities on loan: (1)
|
|||||||
|
Amortized cost
|
$
|
3,085
|
|
$
|
5,895
|
|
|
|
Estimated fair value
|
$
|
3,748
|
|
$
|
6,555
|
|
|
|
Cash collateral received from counterparties (2)
|
$
|
3,791
|
|
$
|
6,642
|
|
|
|
Security collateral received from counterparties (3)
|
$
|
29
|
|
$
|
27
|
|
|
|
Reinvestment portfolio — estimated fair value
|
$
|
3,823
|
|
$
|
6,571
|
|
|
__________________
|
(1)
|
Included within fixed maturity securities.
|
|
(2)
|
Included within payables for collateral under securities loaned and other transactions.
|
|
(3)
|
Security collateral received from counterparties may not be sold or re-pledged, unless the counterparty is in default, and is not reflected on the consolidated and combined financial statements.
|
210
Brighthouse Financial, Inc.
Notes to the Consolidated and Combined Financial Statements (continued)
6. Investments (continued)
The cash collateral liability by loaned security type and remaining tenor of the agreements were as follows at:
|
December 31, 2017
|
December 31, 2016
|
||||||||||||||||||||||||||||||
|
Remaining Tenor of Securities Lending Agreements
|
Remaining Tenor of Securities Lending Agreements
|
||||||||||||||||||||||||||||||
|
Open (1)
|
1 Month or Less
|
1 to 6 Months
|
Total
|
Open (1)
|
1 Month or Less
|
1 to 6 Months
|
Total
|
||||||||||||||||||||||||
|
(In millions)
|
|||||||||||||||||||||||||||||||
|
Cash collateral liability by loaned security type:
|
|||||||||||||||||||||||||||||||
|
U.S. government and agency
|
$
|
1,626
|
|
$
|
964
|
|
$
|
1,201
|
|
$
|
3,791
|
|
$
|
2,129
|
|
$
|
1,906
|
|
$
|
1,743
|
|
$
|
5,778
|
|
|||||||
|
U.S. corporate
|
—
|
|
—
|
|
—
|
|
—
|
|
—
|
|
480
|
|
—
|
|
480
|
|
|||||||||||||||
|
Agency RMBS
|
—
|
|
—
|
|
—
|
|
—
|
|
—
|
|
—
|
|
274
|
|
274
|
|
|||||||||||||||
|
Foreign corporate
|
—
|
|
—
|
|
—
|
|
—
|
|
—
|
|
58
|
|
—
|
|
58
|
|
|||||||||||||||
|
Foreign government
|
—
|
|
—
|
|
—
|
|
—
|
|
—
|
|
52
|
|
—
|
|
52
|
|
|||||||||||||||
|
Total
|
$
|
1,626
|
|
$
|
964
|
|
$
|
1,201
|
|
$
|
3,791
|
|
$
|
2,129
|
|
$
|
2,496
|
|
$
|
2,017
|
|
$
|
6,642
|
|
|||||||
__________________
|
(1)
|
The related loaned security could be returned to the Company on the next business day which would require the Company to immediately return the cash collateral.
|
If the Company is required to return significant amounts of cash collateral on short notice and is forced to sell securities to meet the return obligation, it may have difficulty selling such collateral that is invested in securities in a timely manner, be forced to sell securities in a volatile or illiquid market for less than what otherwise would have been realized under normal market conditions, or both. The estimated fair value of the securities on loan related to the cash collateral on open at
December 31, 2017
was
$1.6 billion
,
all
of which were U.S. government and agency securities which, if put back to the Company, could be immediately sold to satisfy the cash requirement.
The reinvestment portfolio acquired with the cash collateral consisted principally of fixed maturity securities (including agency RMBS, U.S. government and agency securities, ABS, U.S. and foreign corporate securities, and non-agency RMBS) with
59%
invested in agency RMBS, U.S. government and agency securities, cash equivalents, short-term investments or held in cash at
December 31, 2017
. If the securities on loan or the reinvestment portfolio become less liquid, the Company has the liquidity resources of most of its general account available to meet any potential cash demands when securities on loan are put back to the Company.
Invested Assets on Deposit, Held in Trust and Pledged as Collateral
Invested assets on deposit, held in trust and pledged as collateral are presented below at estimated fair value at:
|
December 31,
|
|||||||
|
2017
|
2016
|
||||||
|
(In millions)
|
|||||||
|
Invested assets on deposit (regulatory deposits) (1)
|
$
|
8,263
|
|
$
|
7,648
|
|
|
|
Invested assets held in trust (reinsurance agreements) (2)
|
2,634
|
|
9,054
|
|
|||
|
Invested assets pledged as collateral (3)
|
3,199
|
|
3,548
|
|
|||
|
Total invested assets on deposit, held in trust and pledged as collateral
|
$
|
14,096
|
|
$
|
20,250
|
|
|
__________________
|
(1)
|
The Company has assets, primarily fixed maturity securities, on deposit with governmental authorities relating to certain policy holder liabilities, of which
$34 million
of the assets on deposit balance represents restricted cash at both December 31,
2017
and
2016
.
|
|
(2)
|
The Company has assets, primarily fixed maturity securities, held in trust relating to certain reinsurance transactions.
$42 million
and
$15 million
of the assets held in trust balance represents restricted cash at December 31,
2017
and
2016
, respectively.
|
211
Brighthouse Financial, Inc.
Notes to the Consolidated and Combined Financial Statements (continued)
6. Investments (continued)
|
(3)
|
The Company has pledged invested assets in connection with various agreements and transactions, including funding agreements (see
Note 3
) and derivative transactions (see
Note 7
).
|
See “— Securities Lending” for information regarding securities on loan.
Purchased Credit Impaired Investments
Investments acquired with evidence of credit quality deterioration since origination and for which it is probable at the acquisition date that the Company will be unable to collect all contractually required payments are classified as purchased credit impaired (“PCI”) investments. For each investment, the excess of the cash flows expected to be collected as of the acquisition date over its acquisition date fair value is referred to as the accretable yield and is recognized as net investment income on an effective yield basis. If, subsequently, based on current information and events, it is probable that there is a significant increase in cash flows previously expected to be collected or if actual cash flows are significantly greater than cash flows previously expected to be collected, the accretable yield is adjusted prospectively. The excess of the contractually required payments (including interest) as of the acquisition date over the cash flows expected to be collected as of the acquisition date is referred to as the nonaccretable difference, and this amount is not expected to be realized as net investment income. Decreases in cash flows expected to be collected can result in OTTI.
The Company’s PCI fixed maturity securities were as follows at:
|
December 31,
|
|||||||
|
2017
|
2016
|
||||||
|
(In millions)
|
|||||||
|
Outstanding principal and interest balance (1)
|
$
|
1,270
|
|
$
|
1,497
|
|
|
|
Carrying value (2)
|
$
|
1,044
|
|
$
|
1,142
|
|
|
__________________
|
(1)
|
Represents the contractually required payments, which is the sum of contractual principal, whether or not currently due, and accrued interest.
|
|
(2)
|
Estimated fair value plus accrued interest.
|
The following table presents information about PCI fixed maturity securities acquired during the periods indicated:
|
Years Ended December 31,
|
|||||||
|
2017
|
2016
|
||||||
|
(In millions)
|
|||||||
|
Contractually required payments (including interest)
|
$
|
3
|
|
$
|
567
|
|
|
|
Cash flows expected to be collected (1)
|
$
|
3
|
|
$
|
490
|
|
|
|
Fair value of investments acquired
|
$
|
2
|
|
$
|
347
|
|
|
__________________
|
(1)
|
Represents undiscounted principal and interest cash flow expectations, at the date of acquisition.
|
212
Brighthouse Financial, Inc.
Notes to the Consolidated and Combined Financial Statements (continued)
6. Investments (continued)
The following table presents activity for the accretable yield on PCI fixed maturity securities for:
|
Years Ended December 31,
|
|||||||
|
2017
|
2016
|
||||||
|
(In millions)
|
|||||||
|
Accretable yield, January 1,
|
$
|
429
|
|
$
|
420
|
|
|
|
Investments purchased
|
1
|
|
143
|
|
|||
|
Accretion recognized in earnings
|
(69
|
)
|
(68
|
)
|
|||
|
Disposals
|
(10
|
)
|
(13
|
)
|
|||
|
Reclassification (to) from nonaccretable difference
|
34
|
|
(53
|
)
|
|||
|
Accretable yield, December 31,
|
$
|
385
|
|
$
|
429
|
|
|
Collectively Significant Equity Method Investments
The Company holds investments in real estate joint ventures, real estate funds and other limited partnership interests consisting of leveraged buy-out funds, hedge funds, private equity funds, joint ventures and other funds. The portion of these investments accounted for under the equity method had a carrying value of
$2.2 billion
at December 31,
2017
. The Company’s maximum exposure to loss related to these equity method investments is limited to the carrying value of these investments plus unfunded commitments of
$1.1 billion
at December 31,
2017
. Except for certain real estate joint ventures, the Company’s investments in real estate funds and other limited partnership interests are generally of a passive nature in that the Company does not participate in the management of the entities.
As described in
Note 1
, the Company generally records its share of earnings in its equity method investments using a three-month lag methodology and within net investment income. Aggregate net investment income from these equity method investments exceeded
10%
of the Company’s consolidated pre-tax income (loss) for two of the three most recent annual periods: 2017 and 2015. This aggregated summarized financial data does not represent the Company’s proportionate share of the assets, liabilities, or earnings of such entities.
The aggregated summarized financial data presented below reflects the latest available financial information and is as of and for the years ended December 31,
2017
,
2016
and
2015
. Aggregate total assets of these entities totaled
$329.2 billion
and
$285.3 billion
at December 31,
2017
and
2016
, respectively. Aggregate total liabilities of these entities totaled
$40.0 billion
and
$26.4 billion
at December 31,
2017
and
2016
, respectively. Aggregate net income (loss) of these entities totaled
$36.4 billion
,
$21.3 billion
and
$13.7 billion
for the years ended December 31,
2017
,
2016
and
2015
, respectively. Aggregate net income (loss) from the underlying entities in which the Company invests is primarily comprised of investment income, including recurring investment income and realized and unrealized investment gains (losses).
Variable Interest Entities
The Company has invested in legal entities that are VIEs. In certain instances, the Company holds both the power to direct the most significant activities of the entity, as well as an economic interest in the entity and, as such, is deemed to be the primary beneficiary or consolidator of the entity.
The determination of the VIE’s primary beneficiary requires an evaluation of the contractual and implied rights and obligations associated with each party’s relationship with or involvement in the entity, an estimate of the entity’s expected losses and expected residual returns and the allocation of such estimates to each party involved in the entity.
Consolidated VIEs
Creditors or beneficial interest holders of VIEs where the Company is the primary beneficiary have no recourse to the general credit of the Company, as the Company’s obligation to the VIEs is limited to the amount of its committed investment.
The following table presents the total assets and total liabilities relating to VIEs for which the Company has concluded that it is the primary beneficiary and which are consolidated at:
213
Brighthouse Financial, Inc.
Notes to the Consolidated and Combined Financial Statements (continued)
6. Investments (continued)
|
December 31,
|
|||||||||||||||
|
2017
|
2016
|
||||||||||||||
|
Total
Assets
|
Total
Liabilities
|
Total
Assets
|
Total
Liabilities
|
||||||||||||
|
(In millions)
|
|||||||||||||||
|
MRSC (collateral financing arrangement (primarily securities)) (1)
|
$
|
—
|
|
$
|
—
|
|
$
|
3,422
|
|
$
|
—
|
|
|||
|
CSEs (assets (primarily loans) and liabilities (primarily debt)) (2)
|
116
|
|
11
|
|
137
|
|
24
|
|
|||||||
|
Total
|
$
|
116
|
|
$
|
11
|
|
$
|
3,559
|
|
$
|
24
|
|
|||
__________________
|
(1)
|
In April 2017, these assets were liquidated and the proceeds were used to repay the MRSC collateral financing arrangement (see
Note 9
).
|
|
(2)
|
The Company consolidates entities that are structured as CMBS. The assets of these entities can only be used to settle their respective liabilities, and under no circumstances is the Company liable for any principal or interest shortfalls should any arise. The Company’s exposure was limited to that of its remaining investment in these entities of
$86 million
and
$95 million
at estimated fair value at December 31,
2017
and
2016
, respectively.
|
Unconsolidated VIEs
The carrying amount and maximum exposure to loss relating to VIEs in which the Company holds a significant variable interest but is not the primary beneficiary and which have not been consolidated were as follows at:
|
|
December 31,
|
||||||||||||||
|
|
2017
|
2016
|
|||||||||||||
|
|
Carrying
Amount
|
Maximum
Exposure
to Loss (1)
|
Carrying
Amount
|
Maximum
Exposure
to Loss (1)
|
|||||||||||
|
|
(In millions)
|
||||||||||||||
|
Fixed maturity securities AFS:
|
|||||||||||||||
|
Structured Securities (2)
|
$
|
11,461
|
|
$
|
11,461
|
|
$
|
13,062
|
|
$
|
13,062
|
|
|||
|
U.S. and foreign corporate
|
504
|
|
504
|
|
518
|
|
518
|
|
|||||||
|
Other limited partnership interests
|
1,511
|
|
2,463
|
|
1,495
|
|
2,292
|
|
|||||||
|
Other investments (3)
|
82
|
|
89
|
|
90
|
|
101
|
|
|||||||
|
Total
|
$
|
13,558
|
|
$
|
14,517
|
|
$
|
15,165
|
|
$
|
15,973
|
|
|||
__________________
|
(1)
|
The maximum exposure to loss relating to fixed maturity securities AFS is equal to their carrying amounts or the carrying amounts of retained interests. The maximum exposure to loss relating to other limited partnership interests and real estate joint ventures is equal to the carrying amounts plus any unfunded commitments. Such a maximum loss would be expected to occur only upon bankruptcy of the issuer or investee.
|
|
(2)
|
For these variable interests, the Company’s involvement is limited to that of a passive investor in mortgage-backed or asset-backed securities issued by trusts that do not have substantial equity.
|
|
(3)
|
Other investments are comprised of real estate joint ventures, other invested assets and non-redeemable preferred stock.
|
As described in
Note 15
, the Company makes commitments to fund partnership investments in the normal course of business. Excluding these commitments, the Company did not provide financial or other support to investees designated as VIEs during the years ended December 31,
2017
,
2016
and
2015
.
214
Brighthouse Financial, Inc.
Notes to the Consolidated and Combined Financial Statements (continued)
6. Investments (continued)
Net Investment Income
The components of net investment income were as follows:
|
Years Ended December 31,
|
|||||||||||
|
2017
|
2016
|
2015
|
|||||||||
|
(In millions)
|
|||||||||||
|
Investment income:
|
|||||||||||
|
Fixed maturity securities
|
$
|
2,420
|
|
$
|
2,642
|
|
$
|
2,478
|
|
||
|
Equity securities
|
12
|
|
19
|
|
19
|
|
|||||
|
Mortgage loans
|
446
|
|
401
|
|
373
|
|
|||||
|
Policy loans
|
73
|
|
78
|
|
78
|
|
|||||
|
Real estate and real estate joint ventures
|
53
|
|
32
|
|
108
|
|
|||||
|
Other limited partnership interests
|
184
|
|
163
|
|
134
|
|
|||||
|
Cash, cash equivalents and short-term investments
|
35
|
|
20
|
|
9
|
|
|||||
|
Other
|
25
|
|
16
|
|
12
|
|
|||||
|
Subtotal
|
3,248
|
|
3,371
|
|
3,211
|
|
|||||
|
Less: Investment expenses
|
178
|
|
176
|
|
128
|
|
|||||
|
Subtotal, net
|
3,070
|
|
3,195
|
|
3,083
|
|
|||||
|
FVO CSEs — interest income — commercial mortgage loans
|
8
|
|
12
|
|
16
|
|
|||||
|
Net investment income
|
$
|
3,078
|
|
$
|
3,207
|
|
$
|
3,099
|
|
||
See “— Variable Interest Entities” for discussion of CSEs.
See “— Related Party Investment Transactions” for discussion of related party net investment income and investment expenses.
215
Brighthouse Financial, Inc.
Notes to the Consolidated and Combined Financial Statements (continued)
6. Investments (continued)
Net Investment Gains (Losses)
Components of Net Investment Gains (Losses)
The components of net investment gains (losses) were as follows:
|
Years Ended December 31,
|
|||||||||||
|
2017
|
2016
|
2015
|
|||||||||
|
(In millions)
|
|||||||||||
|
Total gains (losses) on fixed maturity securities:
|
|||||||||||
|
Total OTTI losses recognized — by sector and industry:
|
|||||||||||
|
U.S. and foreign corporate securities — by industry:
|
|||||||||||
|
Industrial
|
$
|
—
|
|
$
|
(16
|
)
|
$
|
(3
|
)
|
||
|
Consumer
|
—
|
|
—
|
|
(8
|
)
|
|||||
|
Utility
|
—
|
|
—
|
|
(6
|
)
|
|||||
|
Total U.S. and foreign corporate securities
|
—
|
|
(16
|
)
|
(17
|
)
|
|||||
|
RMBS
|
—
|
|
(6
|
)
|
(14
|
)
|
|||||
|
State and political subdivision
|
(1
|
)
|
—
|
|
—
|
|
|||||
|
OTTI losses on fixed maturity securities recognized in earnings
|
(1
|
)
|
(22
|
)
|
(31
|
)
|
|||||
|
Fixed maturity securities — net gains (losses) on sales and disposals
|
(25
|
)
|
(40
|
)
|
(59
|
)
|
|||||
|
Total gains (losses) on fixed maturity securities
|
(26
|
)
|
(62
|
)
|
(90
|
)
|
|||||
|
Total gains (losses) on equity securities:
|
|||||||||||
|
OTTI losses on equity securities recognized in earnings
|
(4
|
)
|
(2
|
)
|
(3
|
)
|
|||||
|
Equity securities — net gains (losses) on sales and disposals
|
26
|
|
10
|
|
18
|
|
|||||
|
Total gains (losses) on equity securities
|
22
|
|
8
|
|
15
|
|
|||||
|
Mortgage loans
|
(9
|
)
|
6
|
|
(11
|
)
|
|||||
|
Real estate and real estate joint ventures
|
4
|
|
(34
|
)
|
98
|
|
|||||
|
Other limited partnership interests
|
(11
|
)
|
(7
|
)
|
(1
|
)
|
|||||
|
Other
|
(5
|
)
|
11
|
|
—
|
|
|||||
|
Subtotal
|
(25
|
)
|
(78
|
)
|
11
|
|
|||||
|
FVO CSEs:
|
|||||||||||
|
Commercial mortgage loans
|
(3
|
)
|
(2
|
)
|
(7
|
)
|
|||||
|
Long-term debt — related to commercial mortgage loans
|
1
|
|
1
|
|
4
|
|
|||||
|
Non-investment portfolio gains (losses)
|
(1
|
)
|
1
|
|
(1
|
)
|
|||||
|
Subtotal
|
(3
|
)
|
—
|
|
(4
|
)
|
|||||
|
Total net investment gains (losses)
|
$
|
(28
|
)
|
$
|
(78
|
)
|
$
|
7
|
|
||
See “— Variable Interest Entities” for discussion of CSEs.
See “— Related Party Investment Transactions” for discussion of related party net investment gains (losses) related to transfers of invested assets.
216
Brighthouse Financial, Inc.
Notes to the Consolidated and Combined Financial Statements (continued)
6. Investments (continued)
Sales or Disposals and Impairments of Fixed Maturity and Equity Securities
Investment gains and losses on sales of securities are determined on a specific identification basis. Proceeds from sales or disposals of fixed maturity and equity securities and the components of fixed maturity and equity securities net investment gains (losses) were as shown in the table below.
|
Years Ended December 31,
|
|||||||||||||||||||||||
|
2017
|
2016
|
2015
|
2017
|
2016
|
2015
|
||||||||||||||||||
|
Fixed Maturity Securities
|
Equity Securities
|
||||||||||||||||||||||
|
(In millions)
|
|||||||||||||||||||||||
|
Proceeds
|
$
|
12,665
|
|
$
|
39,800
|
|
$
|
32,524
|
|
$
|
68
|
|
$
|
48
|
|
$
|
80
|
|
|||||
|
Gross investment gains
|
$
|
59
|
|
$
|
266
|
|
$
|
190
|
|
$
|
27
|
|
$
|
10
|
|
$
|
26
|
|
|||||
|
Gross investment losses
|
(84
|
)
|
(306
|
)
|
(249
|
)
|
(1
|
)
|
—
|
|
(8
|
)
|
|||||||||||
|
OTTI losses
|
(1
|
)
|
(22
|
)
|
(31
|
)
|
(4
|
)
|
(2
|
)
|
(3
|
)
|
|||||||||||
|
Net investment gains (losses)
|
$
|
(26
|
)
|
$
|
(62
|
)
|
$
|
(90
|
)
|
$
|
22
|
|
$
|
8
|
|
$
|
15
|
|
|||||
Credit Loss Rollforward
The table below presents a rollforward of the cumulative credit loss component of OTTI loss recognized in earnings on fixed maturity securities still held for which a portion of the OTTI loss was recognized in OCI:
|
|
Years Ended December 31,
|
||||||
|
|
2017
|
2016
|
|||||
|
|
(In millions)
|
||||||
|
Balance at January 1,
|
$
|
28
|
|
$
|
66
|
|
|
|
Additions:
|
|||||||
|
Additional impairments — credit loss OTTI on securities previously impaired
|
—
|
|
5
|
|
|||
|
Reductions:
|
|||||||
|
Sales (maturities, pay downs or prepayments) of securities previously impaired as credit loss OTTI
|
(28
|
)
|
(42
|
)
|
|||
|
Increase in cash flows — accretion of previous credit loss OTTI
|
—
|
|
(1
|
)
|
|||
|
Balance at December 31,
|
$
|
—
|
|
$
|
28
|
|
|
Related Party Investment Transactions
The Company previously transferred fixed maturity securities, mortgage loans, real estate and real estate joint ventures, to and from former affiliates, which were as follows:
|
Years Ended December 31,
|
|||||||||||
|
2017
|
2016
|
2015
|
|||||||||
|
(In millions)
|
|||||||||||
|
Estimated fair value of invested assets transferred to former affiliates
|
$
|
292
|
|
$
|
1,517
|
|
$
|
185
|
|
||
|
Amortized cost of invested assets transferred to former affiliates
|
$
|
294
|
|
$
|
1,419
|
|
$
|
169
|
|
||
|
Net investment gains (losses) recognized on transfers
|
$
|
(2
|
)
|
$
|
27
|
|
$
|
16
|
|
||
|
Change in additional paid-in-capital recognized on transfers
|
$
|
—
|
|
$
|
71
|
|
$
|
—
|
|
||
|
Estimated fair value of invested assets transferred from former affiliates
|
$
|
—
|
|
$
|
5,582
|
|
$
|
928
|
|
||
In April 2016 and in November 2016, the Company received transfers of investments and cash and cash equivalents of
$5.2 billion
for the recapture of risks related to certain single premium deferred annuity contracts previously reinsured to MLIC, a former affiliate, which are included in the table above. See
Note 5
for additional information related to these transfers.
At December 31, 2016, the Company had
$1.1 billion
of loans due from MetLife, Inc., which were included in other invested assets. These loans were carried at fixed interest rates of
4.21%
and
5.10%
, payable semiannually, and were due on
September 30, 2032
and
December 31, 2033
, respectively. In April 2017, these loans were satisfied in a non-cash exchange for
$1.1 billion
of notes due to MetLife, Inc. See
Note 9
.
217
Brighthouse Financial, Inc.
Notes to the Consolidated and Combined Financial Statements (continued)
6. Investments (continued)
I
n January 2017, MLIC recaptured risks related to guaranteed minimum benefit guarantees on certain variable annuities being reinsured by the Company. The Company transferred investments and cash and cash equivalents which are included in the table above. See
Note 5
for additional information related to the transfer.
In March 2017, the Company sold an operating joint venture with a book value of
$89 million
to MLIC for
$286 million
. The operating joint venture was accounted for under the equity method and included in other invested assets. This sale resulted in an increase in additional paid-in capital, which is included in shareholder’s net investment (see
Note 10
), of
$202 million
in the first quarter of 2017.
The Company had affiliated loans outstanding to wholly owned real estate subsidiaries of MLIC which were fully repaid in cash by December
2015
. Net investment income and mortgage loan prepayment income earned from these affiliated loans was
$39 million
for the year ended December 31,
2015
.
The Company receives investment administrative services from MetLife Investment Advisors, LLC (“MLIA”), a related party investment manager. The related investment administrative service charges were
$95 million
,
$100 million
and
$81 million
for the years ended
December 31,
2017
,
2016
and
2015
, respectively.
7. Derivatives
Accounting for Derivatives
See
Note 1
for a description of the Company’s accounting policies for derivatives and
Note 8
for information about the fair value hierarchy for derivatives
Derivatives are financial instruments with values derived from interest rates, foreign currency exchange rates, credit spreads and/or other financial indices. Derivatives may be exchange-traded or contracted in the over-the-counter (“OTC”) market. Certain of the Company’s OTC derivatives are cleared and settled through central clearing counterparties (“OTC-cleared”), while others are bilateral contracts between two counterparties (“OTC-bilateral”). The types of derivatives the Company uses include swaps, forwards, futures and option contracts. To a lesser extent, the Company uses credit default swaps to synthetically replicate investment risks and returns which are not readily available in the cash markets.
Interest Rate Derivatives
The Company uses a variety of interest rate derivatives to reduce its exposure to changes in interest rates, including interest rate swaps, interest rate total return swaps, caps, floors, swaptions, futures and forwards.
Interest rate swaps are used by the Company primarily to reduce market risks from changes in interest rates and to alter interest rate exposure arising from mismatches between assets and liabilities (duration mismatches). In an interest rate swap, the Company agrees with another party to exchange, at specified intervals, the difference between fixed rate and floating rate interest amounts as calculated by reference to an agreed notional amount. The Company utilizes interest rate swaps in fair value, cash flow and nonqualifying hedging relationships.
Interest rate total return swaps are swaps whereby the Company agrees with another party to exchange, at specified intervals, the difference between the economic risk and reward of an asset or a market index and the London Interbank Offered Rate (“LIBOR”), calculated by reference to an agreed notional amount. No cash is exchanged at the outset of the contract. Cash is paid and received over the life of the contract based on the terms of the swap. These transactions are entered into pursuant to master agreements that provide for a single net payment to be made by the counterparty at each due date. Interest rate total return swaps are used by the Company to reduce market risks from changes in interest rates and to alter interest rate exposure arising from mismatches between assets and liabilities (duration mismatches). The Company utilizes interest rate total return swaps in nonqualifying hedging relationships.
The Company purchases interest rate caps and floors primarily to protect its floating rate liabilities against rises in interest rates above a specified level, and against interest rate exposure arising from mismatches between assets and liabilities, as well as to protect its minimum rate guarantee liabilities against declines in interest rates below a specified level, respectively. In certain instances, the Company locks in the economic impact of existing purchased caps and floors by entering into offsetting written caps and floors. The Company utilizes interest rate caps and floors in nonqualifying hedging relationships.
218
Brighthouse Financial, Inc.
Notes to the Consolidated and Combined Financial Statements (continued)
7. Derivatives (continued)
In exchange-traded interest rate (Treasury and swap) futures transactions, the Company agrees to purchase or sell a specified number of contracts, the value of which is determined by the different classes of interest rate securities, and to post variation margin on a daily basis in an amount equal to the difference in the daily market values of those contracts. The Company enters into exchange-traded futures with regulated futures commission merchants that are members of the exchange. Exchange-traded interest rate (Treasury and swap) futures are used primarily to hedge mismatches between the duration of assets in a portfolio and the duration of liabilities supported by those assets, to hedge against changes in value of securities the Company owns or anticipates acquiring, to hedge against changes in interest rates on anticipated liability issuances by replicating Treasury or swap curve performance, and to hedge minimum guarantees embedded in certain variable annuity products offered by the Company. The Company utilizes exchange-traded interest rate futures in nonqualifying hedging relationships.
Swaptions are used by the Company to hedge interest rate risk associated with the Company’s long-term liabilities and invested assets. A swaption is an option to enter into a swap with a forward starting effective date. In certain instances, the Company locks in the economic impact of existing purchased swaptions by entering into offsetting written swaptions. The Company pays a premium for purchased swaptions and receives a premium for written swaptions. The Company utilizes swaptions in nonqualifying hedging relationships. Swaptions are included in interest rate options.
Foreign Currency Exchange Rate Derivatives
The Company uses foreign currency swaps to reduce the risk from fluctuations in foreign currency exchange rates associated with its assets and liabilities denominated in foreign currencies. In a foreign currency swap transaction, the Company agrees with another party to exchange, at specified intervals, the difference between one currency and another at a fixed exchange rate, generally set at inception, calculated by reference to an agreed upon notional amount. The notional amount of each currency is exchanged at the inception and termination of the currency swap by each party. The Company utilizes foreign currency swaps in cash flow and nonqualifying hedging relationships.
To a lesser extent, the Company uses foreign currency forwards in nonqualifying hedging relationships.
Credit Derivatives
The Company enters into purchased credit default swaps to hedge against credit-related changes in the value of its investments. In a credit default swap transaction, the Company agrees with another party to pay, at specified intervals, a premium to hedge credit risk. If a credit event occurs, as defined by the contract, the contract may be cash settled or it may be settled gross by the delivery of par quantities of the referenced investment equal to the specified swap notional amount in exchange for the payment of cash amounts by the counterparty equal to the par value of the investment surrendered. Credit events vary by type of issuer but typically include bankruptcy, failure to pay debt obligations, repudiation, moratorium, involuntary restructuring or governmental intervention. In each case, payout on a credit default swap is triggered only after the Credit Derivatives Determinations Committee of the International Swaps and Derivatives Association, Inc. (“ISDA”) deems that a credit event has occurred. The Company utilizes credit default swaps in nonqualifying hedging relationships.
The Company enters into written credit default swaps to create synthetic credit investments that are either more expensive to acquire or otherwise unavailable in the cash markets. These transactions are a combination of a derivative and one or more cash instruments, such as U.S. government and agency securities or other fixed maturity securities. These credit default swaps are not designated as hedging instruments.
Equity Derivatives
The Company uses a variety of equity derivatives to reduce its exposure to equity market risk, including equity index options, equity variance swaps, exchange-traded equity futures and equity total return swaps.
Equity index options are used by the Company primarily to hedge minimum guarantees embedded in certain variable annuity products offered by the Company. To hedge against adverse changes in equity indices, the Company enters into contracts to sell the equity index within a limited time at a contracted price. The contracts will be net settled in cash based on differentials in the indices at the time of exercise and the strike price. Certain of these contracts may also contain settlement provisions linked to interest rates. In certain instances, the Company may enter into a combination of transactions to hedge adverse changes in equity indices within a pre-determined range through the purchase and sale of options. The Company utilizes equity index options in nonqualifying hedging relationships.
219
Brighthouse Financial, Inc.
Notes to the Consolidated and Combined Financial Statements (continued)
7. Derivatives (continued)
Equity variance swaps are used by the Company primarily to hedge minimum guarantees embedded in certain variable annuity products offered by the Company. In an equity variance swap, the Company agrees with another party to exchange amounts in the future, based on changes in equity volatility over a defined period. The Company utilizes equity variance swaps in nonqualifying hedging relationships.
In exchange-traded equity futures transactions, the Company agrees to purchase or sell a specified number of contracts, the value of which is determined by the different classes of equity securities, and to post variation margin on a daily basis in an amount equal to the difference in the daily market values of those contracts. The Company enters into exchange-traded futures with regulated futures commission merchants that are members of the exchange. Exchange-traded equity futures are used primarily to hedge minimum guarantees embedded in certain variable annuity products offered by the Company. The Company utilizes exchange-traded equity futures in nonqualifying hedging relationships.
In an equity total return swap, the Company agrees with another party to exchange, at specified intervals, the difference between the economic risk and reward of an asset or a market index and the LIBOR, calculated by reference to an agreed notional amount. No cash is exchanged at the outset of the contract. Cash is paid and received over the life of the contract based on the terms of the swap. The Company uses equity total return swaps to hedge its equity market guarantees in certain of its insurance products. Equity total return swaps can be used as hedges or to create synthetic investments. The Company utilizes equity total return swaps in nonqualifying hedging relationships.
220
Brighthouse Financial, Inc.
Notes to the Consolidated and Combined Financial Statements (continued)
7. Derivatives (continued)
Primary Risks Managed by Derivatives
The following table presents the primary underlying risk exposure, gross notional amount, and estimated fair value of the Company’s derivatives, excluding embedded derivatives, held at:
|
Primary Underlying Risk Exposure
|
December 31,
|
||||||||||||||||||||||||
|
2017
|
2016
|
||||||||||||||||||||||||
|
Estimated Fair Value
|
Estimated Fair Value
|
||||||||||||||||||||||||
|
Gross
Notional Amount |
Assets
|
Liabilities
|
Gross
Notional Amount |
Assets
|
Liabilities
|
||||||||||||||||||||
|
|
(In millions)
|
||||||||||||||||||||||||
|
Derivatives Designated as Hedging Instruments
|
|||||||||||||||||||||||||
|
Fair value hedges:
|
|||||||||||||||||||||||||
|
Interest rate swaps
|
Interest rate
|
$
|
175
|
|
$
|
44
|
|
$
|
—
|
|
$
|
310
|
|
$
|
41
|
|
$
|
—
|
|
||||||
|
Cash flow hedges:
|
|||||||||||||||||||||||||
|
Interest rate swaps
|
Interest rate
|
27
|
|
5
|
|
—
|
|
45
|
|
7
|
|
—
|
|
||||||||||||
|
Foreign currency swaps
|
Foreign currency exchange rate
|
1,827
|
|
94
|
|
75
|
|
1,493
|
|
202
|
|
11
|
|
||||||||||||
|
Subtotal
|
1,854
|
|
99
|
|
75
|
|
1,538
|
|
209
|
|
11
|
|
|||||||||||||
|
Total qualifying hedges
|
2,029
|
|
143
|
|
75
|
|
1,848
|
|
250
|
|
11
|
|
|||||||||||||
|
Derivatives Not Designated or Not Qualifying as Hedging Instruments
|
|||||||||||||||||||||||||
|
Interest rate swaps
|
Interest rate
|
20,213
|
|
922
|
|
774
|
|
28,175
|
|
1,928
|
|
1,687
|
|
||||||||||||
|
Interest rate floors
|
Interest rate
|
—
|
|
—
|
|
—
|
|
2,100
|
|
6
|
|
2
|
|
||||||||||||
|
Interest rate caps
|
Interest rate
|
2,671
|
|
7
|
|
—
|
|
12,042
|
|
25
|
|
—
|
|
||||||||||||
|
Interest rate futures
|
Interest rate
|
282
|
|
1
|
|
—
|
|
1,288
|
|
9
|
|
—
|
|
||||||||||||
|
Interest rate options
|
Interest rate
|
24,600
|
|
133
|
|
63
|
|
15,520
|
|
136
|
|
—
|
|
||||||||||||
|
Interest rate total return swaps
|
Interest rate
|
—
|
|
—
|
|
—
|
|
3,876
|
|
—
|
|
611
|
|
||||||||||||
|
Foreign currency swaps
|
Foreign currency exchange rate
|
1,115
|
|
71
|
|
42
|
|
1,261
|
|
155
|
|
4
|
|
||||||||||||
|
Foreign currency forwards
|
Foreign currency exchange rate
|
130
|
|
—
|
|
1
|
|
158
|
|
9
|
|
—
|
|
||||||||||||
|
Credit default swaps — purchased
|
Credit
|
65
|
|
—
|
|
1
|
|
37
|
|
—
|
|
—
|
|
||||||||||||
|
Credit default swaps — written
|
Credit
|
1,900
|
|
40
|
|
—
|
|
1,913
|
|
28
|
|
—
|
|
||||||||||||
|
Equity futures
|
Equity market
|
2,713
|
|
15
|
|
—
|
|
8,037
|
|
38
|
|
—
|
|
||||||||||||
|
Equity index options
|
Equity market
|
47,066
|
|
794
|
|
1,664
|
|
37,501
|
|
897
|
|
934
|
|
||||||||||||
|
Equity variance swaps
|
Equity market
|
8,998
|
|
128
|
|
430
|
|
14,894
|
|
140
|
|
517
|
|
||||||||||||
|
Equity total return swaps
|
Equity market
|
1,767
|
|
—
|
|
79
|
|
2,855
|
|
1
|
|
117
|
|
||||||||||||
|
Total non-designated or nonqualifying derivatives
|
111,520
|
|
2,111
|
|
3,054
|
|
129,657
|
|
3,372
|
|
3,872
|
|
|||||||||||||
|
Total
|
$
|
113,549
|
|
$
|
2,254
|
|
$
|
3,129
|
|
$
|
131,505
|
|
$
|
3,622
|
|
$
|
3,883
|
|
|||||||
Based on gross notional amounts, a substantial portion of the Company’s derivatives was not designated or did not qualify as part of a hedging relationship at both
December 31, 2017
and
2016
. The Company’s use of derivatives includes (i) derivatives that serve as macro hedges of the Company’s exposure to various risks and that generally do not qualify for hedge accounting due to the criteria required under the portfolio hedging rules; (ii) derivatives that economically hedge insurance liabilities that contain mortality or morbidity risk and that generally do not qualify for hedge accounting because the lack of these risks in the derivatives cannot support an expectation of a highly effective hedging relationship; (iii) derivatives that economically hedge embedded derivatives that do not qualify for hedge accounting because the changes in estimated fair value of the embedded derivatives are already recorded in net income; and (iv) written credit default swaps that are used to create synthetic credit investments and that do not qualify for hedge accounting because they do not involve a hedging relationship. For these nonqualified derivatives, changes in market factors can lead to the recognition of fair value changes on the statement of operations without an offsetting gain or loss recognized in earnings for the item being hedged.
221
Brighthouse Financial, Inc.
Notes to the Consolidated and Combined Financial Statements (continued)
7. Derivatives (continued)
The following table presents earned income on derivatives:
|
Years Ended December 31,
|
|||||||||||
|
2017
|
2016
|
2015
|
|||||||||
|
(In millions)
|
|||||||||||
|
Qualifying hedges:
|
|||||||||||
|
Net investment income
|
$
|
23
|
|
$
|
21
|
|
$
|
13
|
|
||
|
Interest credited to policyholder account balances
|
—
|
|
—
|
|
(2
|
)
|
|||||
|
Nonqualifying hedges:
|
|||||||||||
|
Net derivative gains (losses)
|
314
|
|
461
|
|
361
|
|
|||||
|
Policyholder benefits and claims
|
8
|
|
15
|
|
14
|
|
|||||
|
Total
|
$
|
345
|
|
$
|
497
|
|
$
|
386
|
|
||
The following tables present the amount and location of gains (losses) recognized for derivatives and gains (losses) pertaining to hedged items presented in net derivative gains (losses):
|
Year Ended December 31, 2017
|
|||||||||||||||||||
|
Net
Derivative
Gains
(Losses)
Recognized for
Derivatives (1)
|
Net
Derivatives
Gains (Losses)
Recognized for
Hedged Items (2)
|
Net
Investment
Income
(3)
|
Policyholder
Benefits and
Claims (4)
|
Amount of Gains (Losses) deferred in AOCI
|
|||||||||||||||
|
(In millions)
|
|||||||||||||||||||
|
Derivatives Designated as Hedging Instruments:
|
|||||||||||||||||||
|
Fair value hedges (5):
|
|||||||||||||||||||
|
Interest rate derivatives
|
$
|
2
|
|
$
|
(2
|
)
|
$
|
—
|
|
$
|
—
|
|
$
|
—
|
|
||||
|
Total fair value hedges
|
2
|
|
(2
|
)
|
—
|
|
—
|
|
—
|
|
|||||||||
|
Cash flow hedges (5):
|
|||||||||||||||||||
|
Interest rate derivatives
|
2
|
|
—
|
|
6
|
|
—
|
|
3
|
|
|||||||||
|
Foreign currency exchange rate derivatives
|
10
|
|
(9
|
)
|
—
|
|
—
|
|
(160
|
)
|
|||||||||
|
Total cash flow hedges
|
12
|
|
(9
|
)
|
6
|
|
—
|
|
(157
|
)
|
|||||||||
|
Derivatives Not Designated or Not Qualifying as Hedging Instruments:
|
|||||||||||||||||||
|
Interest rate derivatives
|
(324
|
)
|
—
|
|
—
|
|
8
|
|
—
|
|
|||||||||
|
Foreign currency exchange rate derivatives
|
(99
|
)
|
(33
|
)
|
—
|
|
—
|
|
—
|
|
|||||||||
|
Credit derivatives
|
21
|
|
—
|
|
—
|
|
—
|
|
—
|
|
|||||||||
|
Equity derivatives
|
(2,584
|
)
|
—
|
|
(1
|
)
|
(341
|
)
|
—
|
|
|||||||||
|
Embedded derivatives
|
1,082
|
|
—
|
|
—
|
|
(16
|
)
|
—
|
|
|||||||||
|
Total non-qualifying hedges
|
(1,904
|
)
|
(33
|
)
|
(1
|
)
|
(349
|
)
|
—
|
|
|||||||||
|
Total
|
$
|
(1,890
|
)
|
$
|
(44
|
)
|
$
|
5
|
|
$
|
(349
|
)
|
$
|
(157
|
)
|
||||
222
Brighthouse Financial, Inc.
Notes to the Consolidated and Combined Financial Statements (continued)
7. Derivatives (continued)
|
Year Ended December 31, 2016
|
|||||||||||||||||||
|
Net
Derivative
Gains
(Losses)
Recognized for
Derivatives (1)
|
Net
Derivatives
Gains (Losses)
Recognized for
Hedged Items (2)
|
Net
Investment
Income
(3)
|
Policyholder
Benefits and
Claims (4)
|
Amount of Gains (Losses) deferred in AOCI
|
|||||||||||||||
|
(In millions)
|
|||||||||||||||||||
|
Derivatives Designated as Hedging Instruments:
|
|||||||||||||||||||
|
Fair value hedges (5):
|
|||||||||||||||||||
|
Interest rate derivatives
|
$
|
1
|
|
$
|
(1
|
)
|
$
|
—
|
|
$
|
—
|
|
$
|
—
|
|
||||
|
Total fair value hedges
|
1
|
|
(1
|
)
|
—
|
|
—
|
|
—
|
|
|||||||||
|
Cash flow hedges (5):
|
|||||||||||||||||||
|
Interest rate derivatives
|
35
|
|
—
|
|
5
|
|
—
|
|
28
|
|
|||||||||
|
Foreign currency exchange rate derivatives
|
5
|
|
(3
|
)
|
—
|
|
—
|
|
43
|
|
|||||||||
|
Total cash flow hedges
|
40
|
|
(3
|
)
|
5
|
|
—
|
|
71
|
|
|||||||||
|
Derivatives Not Designated or Not Qualifying as Hedging Instruments:
|
|||||||||||||||||||
|
Interest rate derivatives
|
(2,872
|
)
|
—
|
|
—
|
|
(4
|
)
|
—
|
|
|||||||||
|
Foreign currency exchange rate derivatives
|
76
|
|
(15
|
)
|
—
|
|
—
|
|
—
|
|
|||||||||
|
Credit derivatives
|
10
|
|
—
|
|
—
|
|
—
|
|
—
|
|
|||||||||
|
Equity derivatives
|
(1,724
|
)
|
—
|
|
(6
|
)
|
(320
|
)
|
—
|
|
|||||||||
|
Embedded derivatives
|
(1,824
|
)
|
—
|
|
—
|
|
(4
|
)
|
—
|
|
|||||||||
|
Total non-qualifying hedges
|
(6,334
|
)
|
(15
|
)
|
(6
|
)
|
(328
|
)
|
—
|
|
|||||||||
|
Total
|
$
|
(6,293
|
)
|
$
|
(19
|
)
|
$
|
(1
|
)
|
$
|
(328
|
)
|
$
|
71
|
|
||||
223
Brighthouse Financial, Inc.
Notes to the Consolidated and Combined Financial Statements (continued)
7. Derivatives (continued)
|
Year Ended December 31, 2015
|
|||||||||||||||||||
|
Net
Derivative
Gains
(Losses)
Recognized for
Derivatives (1)
|
Net
Derivatives
Gains (Losses)
Recognized for
Hedged Items (2)
|
Net
Investment
Income
(3)
|
Policyholder
Benefits and
Claims (4)
|
Amount of Gains (Losses) deferred in AOCI
|
|||||||||||||||
|
(In millions)
|
|||||||||||||||||||
|
Derivatives Designated as Hedging Instruments:
|
|||||||||||||||||||
|
Fair value hedges (5):
|
|||||||||||||||||||
|
Interest rate derivatives
|
$
|
3
|
|
$
|
(1
|
)
|
$
|
—
|
|
$
|
—
|
|
$
|
—
|
|
||||
|
Total fair value hedges
|
3
|
|
(1
|
)
|
—
|
|
—
|
|
—
|
|
|||||||||
|
Cash flow hedges (5):
|
|||||||||||||||||||
|
Interest rate derivatives
|
3
|
|
—
|
|
3
|
|
—
|
|
17
|
|
|||||||||
|
Foreign currency exchange rate derivatives
|
—
|
|
1
|
|
—
|
|
—
|
|
85
|
|
|||||||||
|
Total cash flow hedges
|
3
|
|
1
|
|
3
|
|
—
|
|
102
|
|
|||||||||
|
Derivatives Not Designated or Not Qualifying as Hedging Instruments:
|
|||||||||||||||||||
|
Interest rate derivatives
|
(67
|
)
|
—
|
|
—
|
|
5
|
|
—
|
|
|||||||||
|
Foreign currency exchange rate derivatives
|
45
|
|
(6
|
)
|
—
|
|
—
|
|
—
|
|
|||||||||
|
Credit derivatives
|
(14
|
)
|
—
|
|
—
|
|
—
|
|
—
|
|
|||||||||
|
Equity derivatives
|
(476
|
)
|
—
|
|
(4
|
)
|
(25
|
)
|
—
|
|
|||||||||
|
Embedded derivatives
|
(175
|
)
|
—
|
|
—
|
|
21
|
|
—
|
|
|||||||||
|
Total non-qualifying hedges
|
(687
|
)
|
(6
|
)
|
(4
|
)
|
1
|
|
—
|
|
|||||||||
|
Total
|
$
|
(681
|
)
|
$
|
(6
|
)
|
$
|
(1
|
)
|
$
|
1
|
|
$
|
102
|
|
||||
______________
|
(1)
|
Includes gains (losses) reclassified from AOCI for cash flow hedges. Ineffective portion of the gains (losses) recognized in income is
not significant
.
|
|
(2)
|
Includes foreign currency transaction gains (losses) on hedged items in cash flow and nonqualifying hedging relationships. Hedged items in fair value hedging relationship includes fixed rate liabilities reported in policyholder account balances or future policy benefits and fixed maturity securities.
|
|
(3)
|
Includes changes in estimated fair value related to economic hedges of equity method investments in joint ventures and gains (losses) reclassified from AOCI for cash flow hedges.
|
|
(4)
|
Changes in estimated fair value related to economic hedges of variable annuity guarantees included in future policy benefits.
|
|
(5)
|
All components of each derivative's gain or loss were included in the assessment of hedge effectiveness.
|
In certain instances, the Company discontinued cash flow hedge accounting because the forecasted transactions were no longer probable of occurring. Because certain of the forecasted transactions also were not probable of occurring within two months of the anticipated date, the Company reclassified amounts from AOCI into net derivative gains (losses). These amounts were
$12 million
,
$1 million
and
$3 million
for the years ended December 31,
2017
,
2016
and
2015
, respectively.
At December 31,
2017
and
2016
, the maximum length of time over which the Company was hedging its exposure to variability in future cash flows for forecasted transactions did not exceed
two
years and
three
years, respectively.
At December 31,
2017
and
2016
, the balance in AOCI associated with cash flow hedges was
$239 million
and
$414 million
, respectively.
224
Brighthouse Financial, Inc.
Notes to the Consolidated and Combined Financial Statements (continued)
7. Derivatives (continued)
Credit Derivatives
In connection with synthetically created credit investment transactions, the Company writes credit default swaps for which it receives a premium to insure credit risk. Such credit derivatives are included within the nonqualifying derivatives and derivatives for purposes other than hedging table. If a credit event occurs, as defined by the contract, the contract may be cash settled or it may be settled gross by the Company paying the counterparty the specified swap notional amount in exchange for the delivery of par quantities of the referenced credit obligation. The Company can terminate these contracts at any time through cash settlement with the counterparty at an amount equal to the then current estimated fair value of the credit default swaps.
The following table presents the estimated fair value, maximum amount of future payments and weighted average years to maturity of written credit default swaps at:
|
December 31,
|
||||||||||||||||||||
|
2017
|
2016
|
|||||||||||||||||||
|
Rating Agency Designation of Referenced
Credit Obligations (1)
|
Estimated
Fair Value
of Credit
Default
Swaps
|
Maximum
Amount of Future Payments under Credit Default Swaps |
Weighted
Average Years to Maturity (2) |
Estimated
Fair Value
of Credit
Default
Swaps
|
Maximum
Amount of Future Payments under Credit Default Swaps |
Weighted
Average Years to Maturity (2) |
||||||||||||||
|
|
(Dollars in millions)
|
|||||||||||||||||||
|
Aaa/Aa/A
|
$
|
12
|
|
$
|
558
|
|
2.8
|
$
|
8
|
|
$
|
478
|
|
3.6
|
||||||
|
Baa
|
28
|
|
1,317
|
|
4.7
|
20
|
|
1,415
|
|
4.4
|
||||||||||
|
Ba
|
—
|
|
25
|
|
4.5
|
—
|
|
20
|
|
2.7
|
||||||||||
|
Total
|
$
|
40
|
|
$
|
1,900
|
|
4.1
|
$
|
28
|
|
$
|
1,913
|
|
4.2
|
||||||
__________________
|
(1)
|
Includes both single name credit default swaps that may be referenced to the credit of corporations, foreign governments, or state and political subdivisions and credit default swap referencing indices. T
he rating agency designations are based on availability and the midpoint of the applicable ratings among Moody’s Investors Service, Inc. (“Moody’s”), S&P and Fitch Ratings. If no rating is available from a rating agency, then an internally developed rating is used.
|
|
(2)
|
The weighted average years to maturity of the credit default swaps is calculated based on weighted average gross notional amounts.
|
Counterparty
Credit Risk
The Company may be exposed to credit-related losses in the event of nonperformance by its counterparties to derivatives. Generally, the current credit exposure of the Company’s derivatives is limited to the net positive estimated fair value of derivatives at the reporting date after taking into consideration the existence of master netting or similar agreements and any collateral received pursuant to such agreements.
The Company manages its credit risk related to derivatives by entering into transactions with creditworthy counterparties and establishing and monitoring exposure limits. The Company’s OTC-bilateral derivative transactions are generally governed by ISDA Master Agreements which provide for legally enforceable set-off and close-out netting of exposures to specific counterparties in the event of early termination of a transaction, which includes, but is not limited to, events of default and bankruptcy. In the event of an early termination, the Company is permitted to set off receivables from the counterparty against payables to the same counterparty arising out of all included transactions. Substantially all of the Company’s ISDA Master Agreements also include Credit Support Annex provisions which require both the pledging and accepting of collateral in connection with its OTC-bilateral derivatives.
The Company’s OTC-cleared derivatives are effected through central clearing counterparties and its exchange-traded derivatives are effected through regulated exchanges. Such positions are marked to market and margined on a daily basis (both initial margin and variation margin), and the Company has minimal exposure to credit-related losses in the event of nonperformance by counterparties to such derivatives.
See
Note 8
for a description of the impact of credit risk on the valuation of derivatives.
225
Brighthouse Financial, Inc.
Notes to the Consolidated and Combined Financial Statements (continued)
7. Derivatives (continued)
The estimated fair values of the Company’s net derivative assets and net derivative liabilities after the application of master netting agreements and collateral were as follows at:
|
December 31,
|
||||||||||||||||
|
2017
|
2016
|
|||||||||||||||
|
Derivatives Subject to a Master Netting Arrangement or a Similar Arrangement
|
Assets
|
Liabilities
|
Assets
|
Liabilities
|
||||||||||||
|
(In millions)
|
||||||||||||||||
|
Gross estimated fair value of derivatives:
|
||||||||||||||||
|
OTC-bilateral (1)
|
$
|
2,233
|
|
$
|
3,081
|
|
$
|
3,411
|
|
$
|
2,929
|
|
||||
|
OTC-cleared and Exchange-traded (1), (6)
|
70
|
|
40
|
|
315
|
|
905
|
|
||||||||
|
Total gross estimated fair value of derivatives (1)
|
2,303
|
|
3,121
|
|
3,726
|
|
3,834
|
|
||||||||
|
Amounts offset on the consolidated and combined balance sheets
|
—
|
|
—
|
|
—
|
|
—
|
|
||||||||
|
Estimated fair value of derivatives presented on the consolidated and combined balance sheets (1), (6)
|
2,303
|
|
3,121
|
|
3,726
|
|
3,834
|
|
||||||||
|
Gross amounts not offset on the consolidated and combined balance sheets:
|
||||||||||||||||
|
Gross estimated fair value of derivatives: (2)
|
||||||||||||||||
|
OTC-bilateral
|
(1,942
|
)
|
(1,942
|
)
|
(2,231
|
)
|
(2,231
|
)
|
||||||||
|
OTC-cleared and Exchange-traded
|
(1
|
)
|
(1
|
)
|
(165
|
)
|
(165
|
)
|
||||||||
|
Cash collateral: (3), (4)
|
||||||||||||||||
|
OTC-bilateral
|
(257
|
)
|
—
|
|
(653
|
)
|
—
|
|
||||||||
|
OTC-cleared and Exchange-traded
|
(28
|
)
|
(39
|
)
|
(92
|
)
|
(740
|
)
|
||||||||
|
Securities collateral: (5)
|
||||||||||||||||
|
OTC-bilateral
|
(31
|
)
|
(1,138
|
)
|
(429
|
)
|
(698
|
)
|
||||||||
|
OTC-cleared and Exchange-traded
|
—
|
|
—
|
|
—
|
|
—
|
|
||||||||
|
Net amount after application of master netting agreements and collateral
|
$
|
44
|
|
$
|
1
|
|
$
|
156
|
|
$
|
—
|
|
||||
__________________
|
(1)
|
At
December 31, 2017
and
2016
, derivative assets included income or (expense) accruals reported in accrued investment income or in other liabilities of
$49 million
and
$104 million
, respectively, and derivative liabilities included (income) or expense accruals reported in accrued investment income or in other liabilities of
($8) million
and
($49) million
, respectively.
|
|
(2)
|
Estimated fair value of derivatives is limited to the amount that is subject to set-off and includes income or expense accruals.
|
|
(3)
|
Cash collateral received by the Company for OTC-bilateral and OTC-cleared derivatives is included in cash and cash equivalents, short-term investments or in fixed maturity securities, and the obligation to return it is included in payables for collateral under securities loaned and other transactions on the balance sheet.
|
|
(4)
|
The receivable for the return of cash collateral provided by the Company is inclusive of initial margin on exchange-traded and OTC-cleared derivatives and is included in premiums, reinsurance and other receivables on the balance sheet. The amount of cash collateral offset in the table above is limited to the net estimated fair value of derivatives after application of netting agreements. At
December 31, 2017
and
2016
, the Company received excess cash collateral of
$94 million
and
$4 million
, respectively, and provided excess cash collateral of
$5 million
and
$25 million
, respectively, which is not included in the table above due to the foregoing limitation.
|
226
Brighthouse Financial, Inc.
Notes to the Consolidated and Combined Financial Statements (continued)
7. Derivatives (continued)
|
(5)
|
Securities collateral received by the Company is held in separate custodial accounts and is not recorded on the balance sheet. Subject to certain constraints, the Company is permitted by contract to sell or re-pledge this collateral, but at
December 31, 2017
,
none
of the collateral had been sold or re-pledged. Securities collateral pledged by the Company is reported in fixed maturity securities on the balance sheet. Subject to certain constraints, the counterparties are permitted by contract to sell or re-pledge this collateral. The amount of securities collateral offset in the table above is limited to the net estimated fair value of derivatives after application of netting agreements and cash collateral. At
December 31, 2017
and
2016
, the Company received excess securities collateral with an estimated fair value of
$337 million
and
$135 million
, respectively, for its OTC-bilateral derivatives, which are not included in the table above due to the foregoing limitation. At
December 31, 2017
and
2016
, the Company provided excess securities collateral with an estimated fair value of
$471 million
and
$108 million
, respectively, for its OTC-bilateral derivatives,
$427 million
and
$630 million
, respectively, for its OTC-cleared derivatives, and
$118 million
and
$453 million
, respectively, for its exchange-traded derivatives, which are not included in the table above due to the foregoing limitation.
|
|
(6)
|
Effective January 3, 2017, the CME amended its rulebook, resulting in the characterization of variation margin transfers as settlement payments, as opposed to adjustments to collateral. See
Note 1
for further information on the CME amendments.
|
The Company’s collateral arrangements for its OTC-bilateral derivatives generally require the counterparty in a net liability position, after considering the effect of netting agreements, to pledge collateral when the amount owed by that counterparty reaches a minimum transfer amount. A small number of these arrangements also include credit-contingent provisions that include a threshold above which collateral must be posted. Such agreements provide for a reduction of these thresholds (on a sliding scale that converges toward zero) in the event of downgrades in the credit ratings of the Company and/or the counterparty. In addition, substantially all of the Company’s netting agreements for derivatives contain provisions that require both the Company and the counterparty to maintain a specific investment grade credit rating from each of Moody’s and S&P. If a party’s financial strength or credit ratings were to fall below that specific investment grade credit rating, that party would be in violation of these provisions, and the other party to the derivatives could terminate the transactions and demand immediate settlement and payment based on such party’s reasonable valuation of the derivatives.
The following table presents the estimated fair value of the Company’s OTC-bilateral derivatives that are in a net liability position after considering the effect of netting agreements, together with the estimated fair value and balance sheet location of the collateral pledged. The Company’s collateral agreements require both parties to be fully collateralized, as such, the Company would not be required to post additional collateral as a result of a downgrade in its financial strength rating. OTC-bilateral derivatives that are not subject to collateral agreements are excluded from this table.
|
December 31,
|
||||||||
|
2017
|
2016
|
|||||||
|
(In millions)
|
||||||||
|
Estimated fair value of derivatives in a net liability position (1)
|
$
|
1,138
|
|
$
|
698
|
|
||
|
Estimated Fair Value of Collateral Provided:
|
||||||||
|
Fixed maturity securities
|
$
|
1,414
|
|
$
|
777
|
|
||
__________________
|
(1)
|
After taking into consideration the existence of netting agreements.
|
Embedded Derivatives
The Company issues certain products or purchases certain investments that contain embedded derivatives that are required to be separated from their host contracts and accounted for as freestanding derivatives. These host contracts principally include: variable annuities with guaranteed minimum benefits, including GMWBs, GMABs and certain GMIBs; related party ceded reinsurance of guaranteed minimum benefits related to GMWBs, GMABs and certain GMIBs; related party assumed reinsurance of guaranteed minimum benefits related to GMWBs and certain GMIBs; funds withheld on assumed and ceded reinsurance; assumed reinsurance on fixed deferred annuities; fixed annuities with equity-indexed returns; and certain debt and equity securities.
227
Brighthouse Financial, Inc.
Notes to the Consolidated and Combined Financial Statements (continued)
7. Derivatives (continued)
The following table presents the estimated fair value and balance sheet location of the Company’s embedded derivatives that have been separated from their host contracts at:
|
December 31,
|
||||||||||
|
Balance Sheet Location
|
2017
|
2016
|
||||||||
|
(In millions)
|
||||||||||
|
Embedded derivatives within asset host contracts:
|
||||||||||
|
Ceded guaranteed minimum benefits
|
Premiums, reinsurance and other receivables
|
$
|
227
|
|
$
|
628
|
|
|||
|
Options embedded in debt or equity securities
|
Investments
|
(52
|
)
|
(49
|
)
|
|||||
|
Embedded derivatives within asset host contracts
|
$
|
175
|
|
$
|
579
|
|
||||
|
Embedded derivatives within liability host contracts:
|
||||||||||
|
Direct guaranteed minimum benefits
|
Policyholder account balances
|
$
|
1,212
|
|
$
|
2,359
|
|
|||
|
Assumed reinsurance on fixed deferred annuities
|
Policyholder account balances
|
1
|
|
—
|
|
|||||
|
Assumed guaranteed minimum benefits
|
Policyholder account balances
|
—
|
|
460
|
|
|||||
|
Fixed annuities with equity indexed returns
|
Policyholder account balances
|
674
|
|
192
|
|
|||||
|
Embedded derivatives within liability host contracts
|
$
|
1,887
|
|
$
|
3,011
|
|
||||
The following table presents changes in estimated fair value related to embedded derivatives:
|
Years Ended December 31,
|
||||||||||||
|
2017
|
2016
|
2015
|
||||||||||
|
(In millions)
|
||||||||||||
|
Net derivative gains (losses) (1), (2)
|
$
|
1,082
|
|
$
|
(1,824
|
)
|
$
|
(175
|
)
|
|||
|
Policyholder benefits and claims
|
$
|
(16
|
)
|
$
|
(4
|
)
|
$
|
21
|
|
|||
__________________
|
(1)
|
The valuation of direct and assumed guaranteed minimum benefits includes a nonperformance risk adjustment. The amounts included in net derivative gains (losses) in connection with this adjustment were
$290 million
,
$246 million
and
$26 million
for the years ended December 31,
2017
,
2016
and
2015
, respectively. In addition, the valuation of ceded guaranteed minimum benefits includes a nonperformance risk adjustment. The amounts included in net derivative gains (losses) in connection with this adjustment, were less than
$1 million
,
($22) million
and
($5) million
for the years ended December 31, 2017, 2016 and 2015, respectively.
|
|
(2)
|
See
Note 5
for discussion of related party net derivative gains (losses).
|
228
Brighthouse Financial, Inc.
Notes to the Consolidated and Combined Financial Statements (continued)
8. Fair Value
When developing estimated fair values, the Company considers three broad valuation techniques: (i) the market approach, (ii) the income approach, and (iii) the cost approach. The Company determines the most appropriate valuation technique to use, given what is being measured and the availability of sufficient inputs, giving priority to observable inputs. The Company categorizes its assets and liabilities measured at estimated fair value into a three-level hierarchy, based on the significant input with the lowest level in its valuation. The input levels are as follows:
|
Level 1
|
Unadjusted quoted prices in active markets for identical assets or liabilities. The Company defines active markets based on average trading volume for equity securities. The size of the bid/ask spread is used as an indicator of market activity for fixed maturity securities.
|
|
Level 2
|
Quoted prices in markets that are not active or inputs that are observable either directly or indirectly. These inputs can include quoted prices for similar assets or liabilities other than quoted prices in Level 1, quoted prices in markets that are not active, or other significant inputs that are observable or can be derived principally from or corroborated by observable market data for substantially the full term of the assets or liabilities.
|
|
Level 3
|
Unobservable inputs that are supported by little or no market activity and are significant to the determination of estimated fair value of the assets or liabilities. Unobservable inputs reflect the reporting entity’s own assumptions about the assumptions that market participants would use in pricing the asset or liability.
|
229
Brighthouse Financial, Inc.
Notes to the Consolidated and Combined Financial Statements (continued)
8. Fair Value (continued)
Recurring Fair Value Measurements
The assets and liabilities measured at estimated fair value on a recurring basis and their corresponding placement in the fair value hierarchy, including those items for which the Company has elected the FVO, are presented below at:
|
December 31, 2017
|
||||||||||||||||
|
Fair Value Hierarchy
|
||||||||||||||||
|
Level 1
|
Level 2
|
Level 3
|
Total Estimated
Fair Value |
|||||||||||||
|
(In millions)
|
||||||||||||||||
|
Assets
|
||||||||||||||||
|
Fixed maturity securities:
|
||||||||||||||||
|
U.S. corporate
|
$
|
—
|
|
$
|
22,048
|
|
$
|
909
|
|
$
|
22,957
|
|
||||
|
U.S government and agency
|
8,304
|
|
7,988
|
|
—
|
|
16,292
|
|
||||||||
|
RMBS
|
—
|
|
6,989
|
|
988
|
|
7,977
|
|
||||||||
|
Foreign corporate
|
—
|
|
5,935
|
|
1,088
|
|
7,023
|
|
||||||||
|
State and political subdivision
|
—
|
|
4,181
|
|
—
|
|
4,181
|
|
||||||||
|
CMBS
|
—
|
|
3,287
|
|
136
|
|
3,423
|
|
||||||||
|
ABS
|
—
|
|
1,723
|
|
106
|
|
1,829
|
|
||||||||
|
Foreign government
|
—
|
|
1,304
|
|
5
|
|
1,309
|
|
||||||||
|
Total fixed maturity securities
|
8,304
|
|
53,455
|
|
3,232
|
|
64,991
|
|
||||||||
|
Equity securities
|
18
|
|
90
|
|
124
|
|
232
|
|
||||||||
|
Short-term investments
|
142
|
|
156
|
|
14
|
|
312
|
|
||||||||
|
Commercial mortgage loans held by CSEs — FVO
|
—
|
|
115
|
|
—
|
|
115
|
|
||||||||
|
Loans to MetLife, Inc.
|
—
|
|
—
|
|
—
|
|
—
|
|
||||||||
|
Derivative assets: (1)
|
||||||||||||||||
|
Interest rate
|
1
|
|
1,111
|
|
—
|
|
1,112
|
|
||||||||
|
Foreign currency exchange rate
|
—
|
|
165
|
|
—
|
|
165
|
|
||||||||
|
Credit
|
—
|
|
30
|
|
10
|
|
40
|
|
||||||||
|
Equity market
|
15
|
|
773
|
|
149
|
|
937
|
|
||||||||
|
Total derivative assets
|
16
|
|
2,079
|
|
159
|
|
2,254
|
|
||||||||
|
Embedded derivatives within asset host contracts (2)
|
—
|
|
—
|
|
227
|
|
227
|
|
||||||||
|
Separate account assets
|
410
|
|
117,842
|
|
5
|
|
118,257
|
|
||||||||
|
Total assets
|
$
|
8,890
|
|
$
|
173,737
|
|
$
|
3,761
|
|
$
|
186,388
|
|
||||
|
Liabilities
|
||||||||||||||||
|
Derivative liabilities: (1)
|
||||||||||||||||
|
Interest rate
|
$
|
—
|
|
$
|
837
|
|
$
|
—
|
|
$
|
837
|
|
||||
|
Foreign currency exchange rate
|
—
|
|
117
|
|
1
|
|
118
|
|
||||||||
|
Credit
|
—
|
|
1
|
|
—
|
|
1
|
|
||||||||
|
Equity market
|
—
|
|
1,736
|
|
437
|
|
2,173
|
|
||||||||
|
Total derivative liabilities
|
—
|
|
2,691
|
|
438
|
|
3,129
|
|
||||||||
|
Embedded derivatives within liability host contracts (2)
|
—
|
|
—
|
|
1,887
|
|
1,887
|
|
||||||||
|
Long-term debt of CSEs — FVO
|
—
|
|
11
|
|
—
|
|
11
|
|
||||||||
|
Total liabilities
|
$
|
—
|
|
$
|
2,702
|
|
$
|
2,325
|
|
$
|
5,027
|
|
||||
230
Brighthouse Financial, Inc.
Notes to the Consolidated and Combined Financial Statements (continued)
8. Fair Value (continued)
|
December 31, 2016
|
||||||||||||||||
|
Fair Value Hierarchy
|
||||||||||||||||
|
Level 1
|
Level 2
|
Level 3
|
Total Estimated
Fair Value
|
|||||||||||||
|
(In millions)
|
||||||||||||||||
|
Assets
|
||||||||||||||||
|
Fixed maturity securities:
|
||||||||||||||||
|
U.S. corporate
|
$
|
—
|
|
$
|
20,828
|
|
$
|
1,483
|
|
$
|
22,311
|
|
||||
|
U.S. government and agency
|
6,210
|
|
6,880
|
|
—
|
|
13,090
|
|
||||||||
|
RMBS
|
—
|
|
6,703
|
|
1,320
|
|
8,023
|
|
||||||||
|
Foreign corporate
|
—
|
|
5,485
|
|
908
|
|
6,393
|
|
||||||||
|
State and political subdivision
|
—
|
|
3,928
|
|
17
|
|
3,945
|
|
||||||||
|
CMBS
|
—
|
|
3,645
|
|
167
|
|
3,812
|
|
||||||||
|
ABS
|
—
|
|
2,428
|
|
224
|
|
2,652
|
|
||||||||
|
Foreign government
|
—
|
|
1,162
|
|
—
|
|
1,162
|
|
||||||||
|
Total fixed maturity securities
|
6,210
|
|
51,059
|
|
4,119
|
|
61,388
|
|
||||||||
|
Equity securities
|
39
|
|
124
|
|
137
|
|
300
|
|
||||||||
|
Short-term investments
|
718
|
|
568
|
|
2
|
|
1,288
|
|
||||||||
|
Commercial mortgage loans held by CSEs — FVO
|
—
|
|
136
|
|
—
|
|
136
|
|
||||||||
|
Loans to MetLife, Inc.
|
—
|
|
1,090
|
|
—
|
|
1,090
|
|
||||||||
|
Derivative assets: (1)
|
||||||||||||||||
|
Interest rate
|
9
|
|
2,143
|
|
—
|
|
2,152
|
|
||||||||
|
Foreign currency exchange rate
|
—
|
|
366
|
|
—
|
|
366
|
|
||||||||
|
Credit
|
—
|
|
20
|
|
8
|
|
28
|
|
||||||||
|
Equity market
|
38
|
|
859
|
|
179
|
|
1,076
|
|
||||||||
|
Total derivative assets
|
47
|
|
3,388
|
|
187
|
|
3,622
|
|
||||||||
|
Embedded derivatives within asset host contracts (2)
|
—
|
|
—
|
|
628
|
|
628
|
|
||||||||
|
Separate account assets
|
720
|
|
112,313
|
|
10
|
|
113,043
|
|
||||||||
|
Total assets
|
$
|
7,734
|
|
|
$
|
168,678
|
|
|
$
|
5,083
|
|
|
$
|
181,495
|
|
|
|
Liabilities
|
||||||||||||||||
|
Derivative liabilities: (1)
|
||||||||||||||||
|
Interest rate
|
$
|
—
|
|
$
|
1,689
|
|
$
|
611
|
|
$
|
2,300
|
|
||||
|
Foreign currency exchange rate
|
—
|
|
15
|
|
—
|
|
15
|
|
||||||||
|
Credit
|
—
|
|
—
|
|
—
|
|
—
|
|
||||||||
|
Equity market
|
—
|
|
1,038
|
|
530
|
|
1,568
|
|
||||||||
|
Total derivative liabilities
|
—
|
|
2,742
|
|
1,141
|
|
3,883
|
|
||||||||
|
Embedded derivatives within liability host contracts (2)
|
—
|
|
—
|
|
3,011
|
|
3,011
|
|
||||||||
|
Long-term debt of CSEs — FVO
|
—
|
|
23
|
|
—
|
|
23
|
|
||||||||
|
Total liabilities
|
$
|
—
|
|
$
|
2,765
|
|
$
|
4,152
|
|
$
|
6,917
|
|
||||
__________________
|
(1)
|
Derivative assets are presented within other invested assets on the consolidated and combined balance sheets and derivative liabilities are presented within other liabilities on the consolidated and combined balance sheets. The amounts are presented gross in the tables above to reflect the presentation on the consolidated and combined balance sheets, but are presented net for purposes of the rollforward in the Fair Value Measurements Using Significant Unobservable Inputs (Level 3) tables.
|
|
(2)
|
Embedded derivatives within asset host contracts are presented within premiums, reinsurance and other receivables and other invested assets on the consolidated and combined balance sheets. Embedded derivatives within liability host contracts are presented within policyholder account balances, on the consolidated and combined balance sheets. At
December 31, 2017
and
2016
, debt and equity securities also included embedded derivatives of
($52) million
and
($49) million
, respectively.
|
231
Brighthouse Financial, Inc.
Notes to the Consolidated and Combined Financial Statements (continued)
8. Fair Value (continued)
Valuation Controls and Procedures
The Company monitors and provides oversight of valuation controls and policies for securities, mortgage loans and derivatives, which are primarily executed by MLIA. The valuation methodologies used to determine fair values prioritize the use of observable market prices and market-based parameters and determines that judgmental valuation adjustments, when applied, are based upon established policies and are applied consistently over time. The valuation methodologies for securities, mortgage loans and derivatives are reviewed on an ongoing basis and revised when necessary, based on changing market conditions. In addition, the Chief Accounting Officer periodically reports to the Audit Committee of Brighthouse’s Board of Directors regarding compliance with fair value accounting standards.
The fair value of financial assets and financial liabilities is based on quoted market prices, where available. The Company assesses whether prices received represent a reasonable estimate of fair value through controls designed to ensure valuations represent an exit price. MLIA performs several controls, including certain monthly controls, which include, but are not limited to, analysis of portfolio returns to corresponding benchmark returns, comparing a sample of executed prices of securities sold to the fair value estimates, reviewing the bid/ask spreads to assess activity, comparing prices from multiple independent pricing services and ongoing due diligence to confirm that independent pricing services use market-based parameters. The process includes a determination of the observability of inputs used in estimated fair values received from independent pricing services or brokers by assessing whether these inputs can be corroborated by observable market data. Independent non-binding broker quotes, also referred to herein as “consensus pricing”, are used for non-significant portion of the portfolio. Prices received from independent brokers are assessed to determine if they represent a reasonable estimate of fair value by considering such pricing relative to the current market dynamics and current pricing for similar financial instruments. Fixed maturity securities priced using independent non-binding broker quotations represent less than
1%
of the total estimated fair value of fixed maturity securities and
5%
of the total estimated fair value of Level 3 fixed maturity securities at December 31, 2017.
MLIA also applies a formal process to challenge any prices received from independent pricing services that are not considered representative of estimated fair value. If prices received from independent pricing services are not considered reflective of market activity or representative of estimated fair value, independent non-binding broker quotations are obtained. If obtaining an independent non-binding broker quotation is unsuccessful, MLIA will use the last available price.
The Company reviews outputs of MLIA’s controls and performs additional controls, including certain monthly controls, which include but are not limited to, performing balance sheet analytics to assess reasonableness of period to period pricing changes, including any price adjustments. Price adjustments are applied if prices or quotes received from independent pricing services or brokers are not considered reflective of market activity or representative of estimated fair value. The Company did not have significant price adjustments during the year ended December 31, 2017.
Determination of Fair Value
Fixed maturities
The fair values for actively traded marketable bonds, primarily U.S. government and agency securities, are determined using the quoted market prices and are classified as Level 1 assets. For fixed maturities classified as Level 2 assets, fair values are determined using either a market or income approach and are valued based on a variety of observable inputs as described below.
U.S. corporate and foreign corporate securities:
Fair value is determined using third-party commercial pricing services, with the primary inputs being quoted prices in markets that are not active, benchmark yields, spreads off benchmark yields, new issuances, issuer rating, trades of identical or comparable securities, or duration. Privately-placed securities are valued using the additional key inputs: market yield curve, call provisions, observable prices and spreads for similar public or private securities that incorporate the credit quality and industry sector of the issuer, and delta spread adjustments to reflect specific credit-related issues.
U.S. government and agency, state and political subdivision and foreign government securities:
Fair value is determined using third-party commercial pricing services, with the primary inputs being quoted prices in markets that are not active, benchmark U.S. Treasury yield or other yields, spread off the U.S. Treasury yield curve for the identical security, issuer ratings and issuer spreads, broker dealer quotes, and comparable securities that are actively traded.
Structured securities:
Fair value is determined using third-party commercial pricing services, with the primary inputs being quoted prices in markets that are not active, spreads for actively traded securities, spreads off benchmark yields,
232
Brighthouse Financial, Inc.
Notes to the Consolidated and Combined Financial Statements (continued)
8. Fair Value (continued)
expected prepayment speeds and volumes, current and forecasted loss severity, ratings, geographic region, weighted average coupon and weighted average maturity, average delinquency rates and debt-service coverage ratios. Other issuance-specific information is also used, including, but not limited to; collateral type, structure of the security, vintage of the loans, payment terms of the underlying asset, payment priority within tranche, and deal performance.
Equity
securities, short-term investments, loans to MetLife, Inc., commercial mortgage loans held by CSEs ‑ FVO and long-term debt of CSEs - FVO
The fair value for actively traded equity and short-term investments are determined using quoted market prices and are classified as Level 1 assets. For financial instruments classified as Level 2 assets or liabilities, fair values are determined using a market approach and are valued based on a variety of observable inputs as described below.
Equity securities, short-term investments and loans to MetLife, Inc.:
Fair value is determined using third-party commercial pricing services, with the primary input being quoted prices in markets that are not active.
Commercial mortgage loans held by CSEs - FVO and long-term debt of CSEs - FVO:
Fair value is determined using third-party commercial pricing services, with the primary input being quoted securitization market price determined principally by independent pricing services using observable inputs or quoted prices or reported NAV provided by the fund managers.
Derivatives
The fair values for exchange-traded derivatives are determined using the quoted market prices and are classified as Level 1 assets. For OTC-bilateral derivatives and OTC-cleared derivatives classified as Level 2 assets or liabilities, fair values are determined using the income approach. Valuations of non-option-based derivatives utilize present value techniques, whereas valuations of option-based derivatives utilize option pricing models which are based on market standard valuation methodologies and a variety of observable inputs.
The significant inputs to the pricing models for most OTC-bilateral and OTC-cleared derivatives are inputs that are observable in the market or can be derived principally from, or corroborated by, observable market data. Certain OTC-bilateral and OTC-cleared derivatives may rely on inputs that are significant to the estimated fair value that are not observable in the market or cannot be derived principally from, or corroborated by, observable market data. These unobservable inputs may involve significant management judgment or estimation. Even though unobservable, these inputs are based on assumptions deemed appropriate given the circumstances and management believes they are consistent with what other market participants would use when pricing such instruments.
Most inputs for OTC-bilateral and OTC-cleared derivatives are mid-market inputs but, in certain cases, liquidity adjustments are made when they are deemed more representative of exit value. Market liquidity, as well as the use of different methodologies, assumptions and inputs, may have a material effect on the estimated fair values of the Company’s derivatives and could materially affect net income.
The credit risk of both the counterparty and the Company are considered in determining the estimated fair value for all OTC-bilateral and OTC-cleared derivatives, and any potential credit adjustment is based on the net exposure by counterparty after taking into account the effects of netting agreements and collateral arrangements. The Company values its OTC-bilateral and OTC-cleared derivatives using standard swap curves which may include a spread to the risk-free rate, depending upon specific collateral arrangements. This credit spread is appropriate for those parties that execute trades at pricing levels consistent with similar collateral arrangements. As the Company and its significant derivative counterparties generally execute trades at such pricing levels and hold sufficient collateral, additional credit risk adjustments are not currently required in the valuation process. The Company’s ability to consistently execute at such pricing levels is in part due to the netting agreements and collateral arrangements that are in place with all of its significant derivative counterparties. An evaluation of the requirement to make additional credit risk adjustments is performed by the Company each reporting period.
Embedded Derivatives
Embedded derivatives principally include certain direct, assumed and ceded variable annuity guarantees, equity or bond indexed crediting rates within certain annuity contracts, and those related to funds withheld on ceded reinsurance agreements. Embedded derivatives are recorded at estimated fair value with changes in estimated fair value reported in net income.
233
Brighthouse Financial, Inc.
Notes to the Consolidated and Combined Financial Statements (continued)
8. Fair Value (continued)
The Company issues certain variable annuity products with guaranteed minimum benefits. GMWBs, GMABs and certain GMIBs contain embedded derivatives, which are measured at estimated fair value separately from the host variable annuity contract, with changes in estimated fair value reported in net derivative gains (losses). These embedded derivatives are classified within policyholder account balances on the consolidated and combined balance sheets.
The Company’s actuarial department calculates the fair value of these embedded derivatives, which are estimated as the present value of projected future benefits minus the present value of projected future fees using actuarial and capital market assumptions including expectations concerning policyholder behavior. The calculation is based on in-force business, and is performed using standard actuarial valuation software which projects future cash flows from the embedded derivative over multiple risk neutral stochastic scenarios using observable risk-free rates.
Capital market assumptions, such as risk-free rates and implied volatilities, are based on market prices for publicly traded instruments to the extent that prices for such instruments are observable. Implied volatilities beyond the observable period are extrapolated based on observable implied volatilities and historical volatilities. Actuarial assumptions, including mortality, lapse, withdrawal and utilization, are unobservable and are reviewed at least annually based on actuarial studies of historical experience.
The valuation of these guarantee liabilities includes nonperformance risk adjustments and adjustments for a risk margin related to non-capital market inputs. The nonperformance adjustment is determined by taking into consideration publicly available information relating to spreads in the secondary market for Brighthouse Financial, Inc.’s debt. These observable spreads are then adjusted to reflect the priority of these liabilities and claims paying ability of the issuing insurance subsidiaries as compared to Brighthouse Financial, Inc.’s overall financial strength.
Risk margins are established to capture the non-capital market risks of the instrument which represent the additional compensation a market participant would require to assume the risks related to the uncertainties of such actuarial assumptions as annuitization, premium persistency, partial withdrawal and surrenders. The establishment of risk margins requires the use of significant management judgment, including assumptions of the amount and cost of capital needed to cover the guarantees. These guarantees may be more costly than expected in volatile or declining equity markets. Market conditions including, but not limited to, changes in interest rates, equity indices, market volatility and foreign currency exchange rates; changes in nonperformance risk; and variations in actuarial assumptions regarding policyholder behavior, mortality and risk margins related to non-capital market inputs, may result in significant fluctuations in the estimated fair value of the guarantees that could materially affect net income.
The Company recaptured from a former affiliate the risk associated with certain GMIBs. These embedded derivatives are included in policyholder account balances on the consolidated and combined balance sheets with changes in estimated fair value reported in net derivative gains (losses). The value of the embedded derivatives on these recaptured risks is determined using a methodology consistent with that described previously for the guarantees directly written by the Company.
The Company ceded to a former affiliate the risk associated with certain of the GMIBs, GMABs and GMWBs described above that are also accounted for as embedded derivatives. In addition to ceding risks associated with guarantees that are accounted for as embedded derivatives, the Company also ceded, to a former affiliate, certain directly written GMIBs that are accounted for as insurance (i.e., not as embedded derivatives), but where the reinsurance agreement contains an embedded derivative. These embedded derivatives are included within premiums, reinsurance and other receivables on the consolidated and combined balance sheets with changes in estimated fair value reported in net derivative gains (losses). The value of the embedded derivatives on the ceded risk is determined using a methodology consistent with that described previously for the guarantees directly written by the Company with the exception of the input for nonperformance risk that reflects the credit of the reinsurer.
The estimated fair value of the embedded derivatives within funds withheld related to certain ceded reinsurance is determined based on the change in estimated fair value of the underlying assets held by the Company in a reference portfolio backing the funds withheld liability. The estimated fair value of the underlying assets is determined as previously described in “— Securities, Short-term Investments, Loans to MetLife, Inc., and Long-term Debt of CSEs — FVO.” The estimated fair value of these embedded derivatives is included, along with their funds withheld hosts, in other liabilities on the consolidated and combined balance sheets with changes in estimated fair value recorded in net derivative gains (losses). Changes in the credit spreads on the underlying assets, interest rates and market volatility may result in significant fluctuations in the estimated fair value of these embedded derivatives that could materially affect net income.
234
Brighthouse Financial, Inc.
Notes to the Consolidated and Combined Financial Statements (continued)
8. Fair Value (continued)
The Company issues certain annuity contracts which allow the policyholder to participate in returns from equity indices. These equity indexed features are embedded derivatives which are measured at estimated fair value separately from the host fixed annuity contract, with changes in estimated fair value reported in net derivative gains (losses). These embedded derivatives are classified within policyholder account balances on the consolidated and combined balance sheets.
The estimated fair value of the embedded equity indexed derivatives, based on the present value of future equity returns to the policyholder using actuarial and present value assumptions including expectations concerning policyholder behavior, is calculated by the Company’s actuarial department. The calculation is based on in-force business and uses standard capital market techniques, such as Black-Scholes, to calculate the value of the portion of the embedded derivative for which the terms are set. The portion of the embedded derivative covering the period beyond where terms are set is calculated as the present value of amounts expected to be spent to provide equity indexed returns in those periods. The valuation of these embedded derivatives also includes the establishment of a risk margin, as well as changes in nonperformance risk.
Transfers between Levels
Overall, transfers between levels occur when there are changes in the observability of inputs and market activity. Transfers into or out of any level are assumed to occur at the beginning of the period.
Transfers between Levels 1 and 2:
For assets and liabilities measured at estimated fair value and still held at
December 31, 2017
and
2016
, transfers between Levels 1 and 2 were not significant.
Transfers into or out of Level 3:
Assets and liabilities are transferred into Level 3 when a significant input cannot be corroborated with market observable data. This occurs when market activity decreases significantly and underlying inputs cannot be observed, current prices are not available, and/or when there are significant variances in quoted prices, thereby affecting transparency. Assets and liabilities are transferred out of Level 3 when circumstances change such that a significant input can be corroborated with market observable data. This may be due to a significant increase in market activity, a specific event, or one or more significant input(s) becoming observable.
235
Brighthouse Financial, Inc.
Notes to the Consolidated and Combined Financial Statements (continued)
8. Fair Value (continued)
Assets and Liabilities Measured at Fair Value Using Significant Unobservable Inputs (Level 3)
The following table presents certain quantitative information about the significant unobservable inputs used in the fair value measurement, and the sensitivity of the estimated fair value to changes in those inputs, for the more significant asset and liability classes measured at fair value on a recurring basis using significant unobservable inputs (Level 3) at:
|
December 31, 2017
|
December 31, 2016
|
Impact of
Increase in Input on Estimated Fair Value (2) |
|||||||||||||||||
|
Valuation Techniques
|
Significant
Unobservable Inputs
|
Range
|
Weighted
Average (1) |
Range
|
Weighted
Average (1) |
||||||||||||||
|
Fixed maturity securities (3)
|
|||||||||||||||||||
|
U.S. corporate and foreign corporate
|
•
|
Matrix pricing
|
•
|
Offered quotes (4)
|
93
|
-
|
142
|
111
|
18
|
-
|
138
|
104
|
Increase
|
||||||
|
•
|
Market pricing
|
•
|
Quoted prices (4)
|
—
|
-
|
443
|
77
|
13
|
-
|
700
|
99
|
Increase
|
|||||||
|
•
|
Consensus pricing
|
•
|
Offered quotes (4)
|
|
|
|
|
37
|
-
|
109
|
85
|
Increase
|
|||||||
|
RMBS
|
•
|
Market pricing
|
•
|
Quoted prices (4)
|
3
|
-
|
107
|
95
|
38
|
-
|
111
|
91
|
Increase (5)
|
||||||
|
CMBS
|
•
|
Market pricing
|
•
|
Quoted prices (4)
|
8
|
-
|
104
|
88
|
20
|
-
|
104
|
104
|
Increase (5)
|
||||||
|
•
|
Consensus pricing
|
•
|
Offered quotes (4)
|
105
|
-
|
105
|
105
|
99
|
-
|
99
|
99
|
Increase (5)
|
|||||||
|
ABS
|
•
|
Market pricing
|
•
|
Quoted prices (4)
|
100
|
-
|
104
|
101
|
94
|
-
|
106
|
100
|
Increase (5)
|
||||||
|
•
|
Consensus pricing
|
•
|
Offered quotes (4)
|
100
|
-
|
100
|
100
|
98
|
-
|
100
|
99
|
Increase (5)
|
|||||||
|
Derivatives
|
|||||||||||||||||||
|
Interest rate
|
•
|
Present value techniques
|
•
|
Repurchase rates (7)
|
—
|
-
|
—
|
(44)
|
-
|
18
|
Decrease (6)
|
||||||||
|
Credit
|
•
|
Present value techniques
|
•
|
Credit spreads (8)
|
—
|
-
|
—
|
97
|
-
|
98
|
Decrease (6)
|
||||||||
|
•
|
Consensus pricing
|
•
|
Offered quotes (9)
|
||||||||||||||||
|
Equity market
|
•
|
Present value techniques or option pricing models
|
•
|
Volatility (10)
|
11%
|
-
|
31%
|
14%
|
-
|
32%
|
Increase (6)
|
||||||||
|
•
|
Correlation (11)
|
10%
|
-
|
30%
|
40%
|
-
|
40%
|
||||||||||||
|
Embedded derivatives
|
|||||||||||||||||||
|
Direct, assumed and ceded guaranteed minimum benefits
|
•
|
Option pricing techniques
|
•
|
Mortality rates:
|
|||||||||||||||
|
Ages 0 - 40
|
0%
|
-
|
0.09%
|
0%
|
-
|
0.09%
|
Decrease (12)
|
||||||||||||
|
Ages 41 - 60
|
0.04%
|
-
|
0.65%
|
0.04%
|
-
|
0.65%
|
Decrease (12)
|
||||||||||||
|
Ages 61 - 115
|
0.26%
|
-
|
100%
|
0.26%
|
-
|
100%
|
Decrease (12)
|
||||||||||||
|
•
|
Lapse rates:
|
||||||||||||||||||
|
Durations 1 - 10
|
0.25%
|
-
|
100%
|
0.25%
|
-
|
100%
|
Decrease (13)
|
||||||||||||
|
Durations 11 - 20
|
2%
|
-
|
100%
|
2%
|
-
|
100%
|
Decrease (13)
|
||||||||||||
|
Durations 21 - 116
|
2%
|
-
|
100%
|
2%
|
-
|
100%
|
Decrease (13)
|
||||||||||||
|
•
|
Utilization rates
|
0%
|
-
|
25%
|
0%
|
-
|
25%
|
Increase (14)
|
|||||||||||
|
•
|
Withdrawal rates
|
0.25%
|
-
|
10%
|
0.25%
|
-
|
10%
|
(15)
|
|||||||||||
|
•
|
Long-term equity volatilities
|
17.40%
|
-
|
25%
|
17.40%
|
-
|
25%
|
Increase (16)
|
|||||||||||
|
•
|
Nonperformance risk spread
|
0.64%
|
-
|
1.43%
|
0.04%
|
-
|
0.57%
|
Decrease (17)
|
|||||||||||
__________________
|
(1)
|
The weighted average for fixed maturity securities is determined based on the estimated fair value of the securities.
|
|
(2)
|
The impact of a decrease in input would have the opposite impact on estimated fair value. For embedded derivatives, changes to direct and assumed guaranteed minimum benefits are based on liability positions; changes to ceded guaranteed minimum benefits are based on asset positions.
|
|
(3)
|
Significant increases (decreases) in expected default rates in isolation would result in substantially lower (higher) valuations.
|
|
(4)
|
Range and weighted average are presented in accordance with the market convention for fixed maturity securities of dollars per hundred dollars of par.
|
|
(5)
|
Changes in the assumptions used for the probability of default is accompanied by a directionally similar change in the assumption used for the loss severity and a directionally opposite change in the assumptions used for prepayment rates.
|
236
Brighthouse Financial, Inc.
Notes to the Consolidated and Combined Financial Statements (continued)
8. Fair Value (continued)
|
(6)
|
Changes in estimated fair value are based on long U.S. dollar net asset positions and will be inversely impacted for short U.S. dollar net asset positions.
|
|
(7)
|
Ranges represent different repurchase rates utilized as components within the valuation methodology and are presented in basis points.
|
|
(8)
|
Represents the risk quoted in basis points of a credit default event on the underlying instrument. Credit derivatives with significant unobservable inputs are primarily comprised of written credit default swaps.
|
|
(9)
|
At
December 31, 2017
and
2016
, independent non-binding broker quotations were used in the determination of
1%
and
3%
of the total net derivative estimated fair value, respectively.
|
|
(10)
|
Ranges represent the underlying equity volatility quoted in percentage points. Since this valuation methodology uses a range of inputs across multiple volatility surfaces to value the derivative, presenting a range is more representative of the unobservable input used in the valuation.
|
|
(11)
|
Ranges represent the different correlation factors utilized as components within the valuation methodology. Presenting a range of correlation factors is more representative of the unobservable input used in the valuation. Increases (decreases) in correlation in isolation will increase (decrease) the significance of the change in valuations.
|
|
(12)
|
Mortality rates vary by age and by demographic characteristics such as gender. Mortality rate assumptions are based on company experience. A mortality improvement assumption is also applied. For any given contract, mortality rates vary throughout the period over which cash flows are projected for purposes of valuing the embedded derivative.
|
|
(13)
|
Base lapse rates are adjusted at the contract level based on a comparison of the actuarially calculated guaranteed values and the current policyholder account value, as well as other factors, such as the applicability of any surrender charges. A dynamic lapse function reduces the base lapse rate when the guaranteed amount is greater than the account value as in the money contracts are less likely to lapse. Lapse rates are also generally assumed to be lower in periods when a surrender charge applies. For any given contract, lapse rates vary throughout the period over which cash flows are projected for purposes of valuing the embedded derivative.
|
|
(14)
|
The utilization rate assumption estimates the percentage of contract holders with a GMIB or lifetime withdrawal benefit who will elect to utilize the benefit upon becoming eligible. The rates may vary by the type of guarantee, the amount by which the guaranteed amount is greater than the account value, the contract’s withdrawal history and by the age of the policyholder. For any given contract, utilization rates vary throughout the period over which cash flows are projected for purposes of valuing the embedded derivative.
|
|
(15)
|
The withdrawal rate represents the percentage of account balance that any given policyholder will elect to withdraw from the contract each year. The withdrawal rate assumption varies by age and duration of the contract, and also by other factors such as benefit type. For any given contract, withdrawal rates vary throughout the period over which cash flows are projected for purposes of valuing the embedded derivative. For GMWBs, any increase (decrease) in withdrawal rates results in an increase (decrease) in the estimated fair value of the guarantees. For GMABs and GMIBs, any increase (decrease) in withdrawal rates results in a decrease (increase) in the estimated fair value.
|
|
(16)
|
Long-term equity volatilities represent equity volatility beyond the period for which observable equity volatilities are available. For any given contract, long-term equity volatility rates vary throughout the period over which cash flows are projected for purposes of valuing the embedded derivative.
|
|
(17)
|
Nonperformance risk spread varies by duration and by currency. For any given contract, multiple nonperformance risk spreads will apply, depending on the duration of the cash flow being discounted for purposes of valuing the embedded derivative.
|
237
Brighthouse Financial, Inc.
Notes to the Consolidated and Combined Financial Statements (continued)
8. Fair Value (continued)
The following is a summary of the valuation techniques and significant unobservable inputs used in the fair value measurement of assets and liabilities classified within Level 3 that are not included in the preceding table. Generally, all other classes of securities classified within Level 3, including those within separate account assets and embedded derivatives within funds withheld related to certain assumed reinsurance, use the same valuation techniques and significant unobservable inputs as previously described for Level 3 securities. This includes matrix pricing and discounted cash flow methodologies, inputs such as quoted prices for identical or similar securities that are less liquid and based on lower levels of trading activity than securities classified in Level 2, as well as independent non-binding broker quotations. The sensitivity of the estimated fair value to changes in the significant unobservable inputs for these other assets and liabilities is similar in nature to that described in the preceding table.
238
Brighthouse Financial, Inc.
Notes to the Consolidated and Combined Financial Statements (continued)
8. Fair Value (continued)
The following tables summarize the change of all assets and (liabilities) measured at estimated fair value on a recurring basis using significant unobservable inputs (Level 3):
|
Fair Value Measurements Using Significant Unobservable Inputs (Level 3)
|
||||||||||||||||||||||||||||||||||||
|
Fixed Maturity Securities
|
||||||||||||||||||||||||||||||||||||
|
Corporate (1)
|
Structured Securities
|
State and
Political Subdivision |
Foreign
Government |
Equity
Securities |
Short Term Investments
|
Net Derivatives (2)
|
Net Embedded Derivatives (3)
|
Separate Account Assets (4)
|
||||||||||||||||||||||||||||
|
(In millions)
|
||||||||||||||||||||||||||||||||||||
|
Balance, January 1, 2016
|
$
|
2,485
|
|
$
|
2,032
|
|
$
|
13
|
|
$
|
26
|
|
$
|
97
|
|
$
|
47
|
|
$
|
(232
|
)
|
$
|
32
|
|
$
|
146
|
|
|||||||||
|
Total realized/unrealized gains (losses) included in net income (loss) (5) (6)
|
(11
|
)
|
30
|
|
—
|
|
—
|
|
—
|
|
—
|
|
(703
|
)
|
(1,842
|
)
|
—
|
|
||||||||||||||||||
|
Total realized/unrealized gains (losses) included in AOCI
|
(25
|
)
|
20
|
|
—
|
|
—
|
|
(11
|
)
|
—
|
|
4
|
|
—
|
|
—
|
|
||||||||||||||||||
|
Purchases (7)
|
603
|
|
601
|
|
—
|
|
—
|
|
—
|
|
3
|
|
10
|
|
—
|
|
2
|
|
||||||||||||||||||
|
Sales (7)
|
(448
|
)
|
(604
|
)
|
—
|
|
—
|
|
(26
|
)
|
(1
|
)
|
—
|
|
—
|
|
(134
|
)
|
||||||||||||||||||
|
Issuances (7)
|
—
|
|
—
|
|
—
|
|
—
|
|
—
|
|
—
|
|
—
|
|
—
|
|
—
|
|
||||||||||||||||||
|
Settlements (7)
|
—
|
|
—
|
|
—
|
|
—
|
|
—
|
|
—
|
|
(33
|
)
|
(573
|
)
|
—
|
|
||||||||||||||||||
|
Transfers into Level 3 (8)
|
120
|
|
12
|
|
9
|
|
—
|
|
131
|
|
—
|
|
—
|
|
—
|
|
—
|
|
||||||||||||||||||
|
Transfers out of Level 3 (8)
|
(333
|
)
|
(380
|
)
|
(5
|
)
|
(26
|
)
|
(54
|
)
|
(47
|
)
|
—
|
|
—
|
|
(4
|
)
|
||||||||||||||||||
|
Balance, December 31, 2016
|
2,391
|
|
1,711
|
|
17
|
|
—
|
|
137
|
|
2
|
|
(954
|
)
|
(2,383
|
)
|
10
|
|
||||||||||||||||||
|
Total realized/unrealized gains (losses) included in net income (loss) (5) (6)
|
(3
|
)
|
28
|
|
—
|
|
—
|
|
(3
|
)
|
—
|
|
92
|
|
1,078
|
|
—
|
|
||||||||||||||||||
|
Total realized/unrealized gains (losses) included in AOCI
|
131
|
|
52
|
|
—
|
|
—
|
|
—
|
|
—
|
|
—
|
|
—
|
|
—
|
|
||||||||||||||||||
|
Purchases (7)
|
441
|
|
107
|
|
—
|
|
5
|
|
3
|
|
14
|
|
4
|
|
—
|
|
2
|
|
||||||||||||||||||
|
Sales (7)
|
(223
|
)
|
(535
|
)
|
—
|
|
—
|
|
(13
|
)
|
(1
|
)
|
—
|
|
—
|
|
(4
|
)
|
||||||||||||||||||
|
Issuances (7)
|
—
|
|
—
|
|
—
|
|
—
|
|
—
|
|
—
|
|
—
|
|
—
|
|
—
|
|
||||||||||||||||||
|
Settlements (7)
|
—
|
|
—
|
|
—
|
|
—
|
|
—
|
|
—
|
|
579
|
|
(355
|
)
|
(1
|
)
|
||||||||||||||||||
|
Transfers into Level 3 (8)
|
178
|
|
11
|
|
—
|
|
—
|
|
—
|
|
—
|
|
—
|
|
—
|
|
2
|
|
||||||||||||||||||
|
Transfers out of Level 3 (8)
|
(918
|
)
|
(144
|
)
|
(17
|
)
|
—
|
|
—
|
|
(1
|
)
|
—
|
|
—
|
|
(4
|
)
|
||||||||||||||||||
|
Balance, December 31, 2017
|
$
|
1,997
|
|
$
|
1,230
|
|
$
|
—
|
|
$
|
5
|
|
$
|
124
|
|
$
|
14
|
|
$
|
(279
|
)
|
$
|
(1,660
|
)
|
$
|
5
|
|
|||||||||
|
Changes in unrealized gains (losses) included in net income (loss) for the instruments still held at December 31, 2015: (9)
|
$
|
11
|
|
$
|
21
|
|
$
|
—
|
|
$
|
—
|
|
$
|
—
|
|
$
|
—
|
|
$
|
(64
|
)
|
$
|
(248
|
)
|
$
|
—
|
|
|||||||||
|
Changes in unrealized gains (losses) included in net income (loss) for the instruments still held at December 31, 2016: (9)
|
$
|
2
|
|
$
|
29
|
|
$
|
—
|
|
$
|
—
|
|
$
|
—
|
|
$
|
—
|
|
$
|
(687
|
)
|
$
|
(1,952
|
)
|
$
|
—
|
|
|||||||||
|
Changes in unrealized gains (losses) included in net income (loss) for the instruments still held at December 31, 2017: (9)
|
$
|
1
|
|
$
|
23
|
|
$
|
—
|
|
$
|
—
|
|
$
|
—
|
|
$
|
—
|
|
$
|
(52
|
)
|
$
|
966
|
|
$
|
—
|
|
|||||||||
|
Gains (Losses) Data for the year ended December 31, 2015:
|
||||||||||||||||||||||||||||||||||||
|
Total realized/unrealized gains (losses) included in net income (loss) (5) (6)
|
$
|
16
|
|
$
|
22
|
|
$
|
—
|
|
$
|
—
|
|
$
|
11
|
|
$
|
—
|
|
$
|
(74
|
)
|
$
|
(133
|
)
|
$
|
(6
|
)
|
|||||||||
|
Total realized/unrealized gains (losses) included in AOCI
|
$
|
(123
|
)
|
$
|
(14
|
)
|
$
|
—
|
|
$
|
(3
|
)
|
$
|
(10
|
)
|
$
|
—
|
|
$
|
2
|
|
$
|
—
|
|
$
|
—
|
|
|||||||||
__________________
|
(1)
|
Comprised of U.S. and foreign corporate securities.
|
|
(2)
|
Freestanding derivative assets and liabilities are presented net for purposes of the rollforward.
|
239
Brighthouse Financial, Inc.
Notes to the Consolidated and Combined Financial Statements (continued)
8. Fair Value (continued)
|
(3)
|
Embedded derivative assets and liabilities are presented net for purposes of the rollforward.
|
|
(4)
|
Investment performance related to separate account assets is fully offset by corresponding amounts credited to contract holders within separate account liabilities. Therefore, such changes in estimated fair value are not recorded in net income (loss). For the purpose of this disclosure, these changes are presented within net investment gains (losses).
|
|
(5)
|
Amortization of premium/accretion of discount is included within net investment income. Impairments charged to net income (loss) on securities are included in net investment gains (losses). Lapses associated with net embedded derivatives are included in net derivative gains (losses).
Substantially all realized/unrealized gains (losses) included in net income (loss) for net derivatives and net embedded derivatives are reported in net derivatives gains (losses).
|
|
(6)
|
Interest and dividend accruals, as well as cash interest coupons and dividends received, are excluded from the rollforward.
|
|
(7)
|
Items purchased/issued and then sold/settled in the same period are excluded from the rollforward. Fees attributed to embedded derivatives are included in settlements.
|
|
(8)
|
Gains and losses, in net income (loss) and OCI, are calculated assuming transfers into and/or out of Level 3 occurred at the beginning of the period. Items transferred into and then out of Level 3 in the same period are excluded from the rollforward.
|
|
(9)
|
Changes in unrealized gains (losses) included in net income (loss) relate to assets and liabilities still held at the end of the respective periods. Substantially all changes in unrealized gains (losses) included in net income (loss) for net derivatives and net embedded derivatives are reported in net derivative gains (losses).
|
Fair Value Option
The following table presents information for certain assets and liabilities of CSEs, which are accounted for under the FVO. These assets and liabilities were initially measured at fair value.
|
December 31,
|
||||||||
|
2017
|
2016
|
|||||||
|
(In millions)
|
||||||||
|
Assets (1)
|
||||||||
|
Unpaid principal balance
|
$
|
70
|
|
$
|
88
|
|
||
|
Difference between estimated fair value and unpaid principal balance
|
45
|
|
48
|
|
||||
|
Carrying value at estimated fair value
|
$
|
115
|
|
$
|
136
|
|
||
|
Liabilities (1)
|
||||||||
|
Contractual principal balance
|
$
|
10
|
|
$
|
22
|
|
||
|
Difference between estimated fair value and contractual principal balance
|
1
|
|
1
|
|
||||
|
Carrying value at estimated fair value
|
$
|
11
|
|
$
|
23
|
|
||
__________________
|
(1)
|
These assets and liabilities are comprised of commercial mortgage loans and long-term debt. Changes in estimated fair value on these assets and liabilities and gains or losses on sales of these assets are recognized in net investment gains (losses). Interest income on commercial mortgage loans held by CSEs — FVO is recognized in net investment income. Interest expense from long-term debt of CSEs — FVO is recognized in other expenses.
|
Fair Value of Financial Instruments Carried at Other Than Fair Value
The following tables provide fair value information for financial instruments that are carried on the balance sheet at amounts other than fair value. These tables exclude the following financial instruments: cash and cash equivalents, accrued investment income, payables for collateral under securities loaned and other transactions, and those short-term investments that are not securities, such as time deposits, and therefore are not included in the three level hierarchy table disclosed in the “— Recurring Fair Value Measurements” section. The estimated fair value of the excluded financial instruments, which are primarily classified in Level 2, approximates carrying value as they are short-term in nature such that the Company believes there is minimal risk of material changes in interest rates or credit quality. All remaining balance sheet amounts excluded from the tables below are not considered financial instruments subject to this disclosure.
240
Brighthouse Financial, Inc.
Notes to the Consolidated and Combined Financial Statements (continued)
8. Fair Value (continued)
The carrying values and estimated fair values for such financial instruments, and their corresponding placement in the fair value hierarchy, are summarized as follows at:
|
December 31, 2017
|
||||||||||||||||||||
|
Fair Value Hierarchy
|
||||||||||||||||||||
|
Carrying
Value |
Level 1
|
Level 2
|
Level 3
|
Total
Estimated Fair Value |
||||||||||||||||
|
(In millions)
|
||||||||||||||||||||
|
Assets
|
||||||||||||||||||||
|
Mortgage loans
|
$
|
10,627
|
|
$
|
—
|
|
$
|
—
|
|
$
|
10,871
|
|
$
|
10,871
|
|
|||||
|
Policy loans
|
$
|
1,523
|
|
$
|
—
|
|
$
|
781
|
|
$
|
959
|
|
$
|
1,740
|
|
|||||
|
Real estate joint ventures
|
$
|
5
|
|
$
|
—
|
|
$
|
—
|
|
$
|
22
|
|
$
|
22
|
|
|||||
|
Other limited partnership interests
|
$
|
36
|
|
$
|
—
|
|
$
|
—
|
|
$
|
28
|
|
$
|
28
|
|
|||||
|
Premiums, reinsurance and other receivables
|
$
|
1,758
|
|
$
|
—
|
|
$
|
128
|
|
$
|
1,985
|
|
$
|
2,113
|
|
|||||
|
Liabilities
|
||||||||||||||||||||
|
Policyholder account balances
|
$
|
15,791
|
|
$
|
—
|
|
$
|
—
|
|
$
|
15,927
|
|
$
|
15,927
|
|
|||||
|
Long-term debt
|
$
|
3,601
|
|
$
|
—
|
|
$
|
3,039
|
|
$
|
600
|
|
$
|
3,639
|
|
|||||
|
Collateral financing arrangement
|
$
|
—
|
|
$
|
—
|
|
$
|
—
|
|
$
|
—
|
|
$
|
—
|
|
|||||
|
Other liabilities
|
$
|
314
|
|
$
|
—
|
|
$
|
100
|
|
$
|
214
|
|
$
|
314
|
|
|||||
|
Separate account liabilities
|
$
|
1,210
|
|
$
|
—
|
|
$
|
1,210
|
|
$
|
—
|
|
$
|
1,210
|
|
|||||
|
December 31, 2016
|
||||||||||||||||||||
|
Fair Value Hierarchy
|
||||||||||||||||||||
|
Carrying
Value
|
Level 1
|
Level 2
|
Level 3
|
Total
Estimated
Fair Value
|
||||||||||||||||
|
(In millions)
|
||||||||||||||||||||
|
Assets
|
||||||||||||||||||||
|
Mortgage loans
|
$
|
9,242
|
|
$
|
—
|
|
$
|
—
|
|
$
|
9,387
|
|
$
|
9,387
|
|
|||||
|
Policy loans
|
$
|
1,517
|
|
$
|
—
|
|
$
|
780
|
|
$
|
978
|
|
$
|
1,758
|
|
|||||
|
Real estate joint ventures
|
$
|
12
|
|
$
|
—
|
|
$
|
—
|
|
$
|
44
|
|
$
|
44
|
|
|||||
|
Other limited partnership interests
|
$
|
44
|
|
$
|
—
|
|
$
|
—
|
|
$
|
42
|
|
$
|
42
|
|
|||||
|
Premiums, reinsurance and other receivables
|
$
|
2,789
|
|
$
|
—
|
|
$
|
834
|
|
$
|
2,449
|
|
$
|
3,283
|
|
|||||
|
Liabilities
|
||||||||||||||||||||
|
Policyholder account balances
|
$
|
16,226
|
|
$
|
—
|
|
$
|
—
|
|
$
|
17,457
|
|
$
|
17,457
|
|
|||||
|
Long-term debt
|
$
|
1,887
|
|
$
|
—
|
|
$
|
2,117
|
|
$
|
—
|
|
$
|
2,117
|
|
|||||
|
Collateral financing arrangement
|
$
|
2,797
|
|
$
|
—
|
|
$
|
—
|
|
$
|
2,797
|
|
$
|
2,797
|
|
|||||
|
Other liabilities
|
$
|
323
|
|
$
|
—
|
|
$
|
110
|
|
$
|
213
|
|
$
|
323
|
|
|||||
|
Separate account liabilities
|
$
|
1,114
|
|
$
|
—
|
|
$
|
1,114
|
|
$
|
—
|
|
$
|
1,114
|
|
|||||
The methods, assumptions and significant valuation techniques and inputs used to estimate the fair value of financial instruments are summarized as follows:
Mortgage Loans
The estimated fair value of mortgage loans is primarily determined by estimating expected future cash flows and discounting them using current interest rates for similar mortgage loans with similar credit risk, or is determined from pricing for similar loans.
241
Brighthouse Financial, Inc.
Notes to the Consolidated and Combined Financial Statements (continued)
8. Fair Value (continued)
Policy Loans
Policy loans with fixed interest rates are classified within Level 3. The estimated fair values for these loans are determined using a discounted cash flow model applied to groups of similar policy loans determined by the nature of the underlying insurance liabilities. These cash flows are discounted using current risk-free interest rates with no adjustment for borrower credit risk, as these loans are fully collateralized by the cash surrender value of the underlying insurance policy. Policy loans with variable interest rates are classified within Level 2 and the estimated fair value approximates carrying value due to the absence of borrower credit risk and the short time period between interest rate resets, which presents minimal risk of a material change in estimated fair value due to changes in market interest rates.
Real Estate Joint Ventures and Other Limited Partnership Interests
The estimated fair values of these cost method investments are generally based on the Company’s share of the NAV as provided on the financial statements of the investees. In certain circumstances, management may adjust the NAV by a premium or discount when it has sufficient evidence to support applying such adjustments.
Premiums, Reinsurance and Other Receivables
Premiums, reinsurance and other receivables are principally comprised of certain amounts recoverable under reinsurance agreements, amounts on deposit with financial institutions to facilitate daily settlements related to certain derivatives and amounts receivable for securities sold but not yet settled.
Amounts recoverable under ceded reinsurance agreements, which the Company has determined do not transfer significant risk such that they are accounted for using the deposit method of accounting, have been classified as Level 3. The valuation is based on discounted cash flow methodologies using significant unobservable inputs.
The amounts on deposit for derivative settlements, classified within Level 2, essentially represent the equivalent of demand deposit balances and amounts due for securities sold are generally received over short periods such that the estimated fair value approximates carrying value.
Policyholder Account Balances
These policyholder account balances include investment contracts which primarily include certain funding agreements, fixed deferred annuities, modified guaranteed annuities, fixed term payout annuities and total control accounts. The valuation of these investment contracts is based on discounted cash flow methodologies using significant unobservable inputs. The estimated fair value is determined using current market risk-free interest rates adding a spread to reflect the nonperformance risk in the liability.
The estimated fair values of long-term debt and the collateral financing arrangement are principally determined using market standard valuation methodologies.
Valuations of instruments classified as Level 2 are based primarily on quoted prices in markets that are not active or using matrix pricing that use standard market observable inputs such as quoted prices in markets that are not active and observable yields and spreads in the market.
Valuations of instruments classified as Level 3 are based primarily on discounted cash flow methodologies that utilize unobservable discount rates that can vary significantly based upon the specific terms of each individual arrangement. The determination of estimated fair value of the collateral financing arrangement incorporates valuations obtained from the counterparties to the arrangement, as part of the collateral management process.
Other Liabilities
Other liabilities consist primarily of interest payable, amounts due for securities purchased but not yet settled, and funds withheld amounts payable, which are contractually withheld by the Company in accordance with the terms of the reinsurance agreements. The Company evaluates the specific terms, facts and circumstances of each instrument to determine the appropriate estimated fair values, which are not materially different from the carrying values.
242
Brighthouse Financial, Inc.
Notes to the Consolidated and Combined Financial Statements (continued)
8. Fair Value (continued)
Separate Account Liabilities
Since separate account liabilities are fully funded by cash flows from the separate account assets which are recognized at estimated fair value as described in the section “— Recurring Fair Value Measurements,” the value of those assets approximates the estimated fair value of the related separate account liabilities. The valuation techniques and inputs for separate account liabilities are similar to those described for separate account assets.
9. Long-term Debt and Collateral Financing Arrangement
Long-term debt and collateral financing arrangement outstanding were as follows:
|
December 31,
|
||||||||||||
|
Interest Rate
|
Maturity
|
2017
|
2016
|
|||||||||
|
(In millions)
|
||||||||||||
|
Senior notes — unaffiliated (1)
|
3.700%
|
2027
|
$
|
1,489
|
|
$
|
—
|
|
||||
|
Senior notes — unaffiliated (1)
|
4.700%
|
2047
|
1,477
|
|
—
|
|
||||||
|
Surplus notes — affiliated with MetLife, Inc.
|
8.595%
|
2038
|
—
|
|
750
|
|
||||||
|
Surplus note — affiliated with MetLife, Inc.
|
5.130%
|
2032
|
—
|
|
750
|
|
||||||
|
Surplus note — affiliated with MetLife, Inc.
|
6.000%
|
2033
|
—
|
|
350
|
|
||||||
|
Long-term debt — unaffiliated (2)
|
7.028%
|
2030
|
35
|
|
37
|
|
||||||
|
Term loan — unaffiliated (3)
|
LIBOR plus 1.5%
|
2019
|
600
|
|
—
|
|
||||||
|
Total long-term debt
|
$
|
3,601
|
|
$
|
1,887
|
|
||||||
|
Collateral financing arrangement
|
3-month LIBOR plus 0.70%
|
2037
|
$
|
—
|
|
$
|
2,797
|
|
||||
__________________
|
(1)
|
Includes unamortized debt issuance costs and debt discount totaling
$34 million
for the senior notes due 2027 and 2047 on a combined basis at December 31, 2017.
|
|
(2)
|
Represents non-recourse debt for which creditors have no access, subject to customary exceptions, to the general assets of the Company other than recourse to certain investment companies.
|
|
(3)
|
Excludes
$11 million
and
$23 million
of long-term debt related to CSEs at December 31,
2017
and
2016
, respectively. See Note
6
for more information regarding CSEs.
|
The aggregate maturities of long-term debt at December 31,
2017
were
$2 million
in
2018
,
$602 million
in
2019
,
$2 million
in each of
2020
,
2021
and
2022
, and
$3.0 billion
thereafter.
Interest expense related to long-term debt of
$135 million
,
$133 million
and
$134 million
for the years ended December 31,
2017
,
2016
and
2015
, respectively, is included in other expenses.
Certain of the Company’s debt instruments, credit and committed facilities, and the reinsurance financing arrangement contain administrative, reporting, legal and financial covenants, including requirements to maintain specified minimum consolidated net worth and to maintain a ratio of indebtedness to total capitalization not in excess of a specified percentage and limitations on the dollar amount of indebtedness that may be incurred by subsidiaries of Brighthouse Financial, Inc. The Company is not aware of any non-compliance with these covenants at
December 31, 2017
.
Senior Notes
On June 22, 2017, Brighthouse Financial, Inc. issued
$1.5 billion
of senior notes due June 2027, which bear interest at a fixed rate of
3.70%
, payable semi-annually, and
$1.5 billion
of senior notes due June 2047, which bear interest at a fixed rate of
4.70%
, payable semi-annually (collectively, the “Senior Notes”). In connection with the issuance of the Senior Notes, Brighthouse Financial, Inc. capitalized debt issuance costs of
$23 million
and debt discounts of
$12 million
, which are amortized over the term of the related debt instrument as a component of interest expense.
243
Brighthouse Financial, Inc.
Notes to the Consolidated and Combined Financial Statements (continued)
9. Long-term Debt and Collateral Financing Arrangement (continued)
Surplus Notes
On June 16, 2017, MetLife, Inc. forgave Brighthouse Life Insurance Company’s obligation to pay the principal amount of
$750 million
,
8.595%
surplus notes held by MetLife, Inc., which were originally issued in 2008. The forgiveness of the surplus notes was treated as a capital transaction and recorded as an increase to additional paid-in-capital.
On April 28, 2017, two surplus note obligations due to MetLife, Inc. totaling
$1.1 billion
, which were originally issued in 2012 and 2013, were due on September 30, 2032 and December 31, 2033 and bore interest at
5.13%
and
6.00%
, respectively, were satisfied in a non-cash exchange for
$1.1 billion
of loans due from MetLife, Inc.
Credit Facilities
On December 2, 2016, Brighthouse Financial, Inc. entered into a
$2.0 billion
five
-year senior unsecured revolving credit facility (the “Revolving Credit Facility”) and a
$3.0 billion
three
-year term loan facility (the “2016 Term Loan Facility”) with a syndicate of banks. In connection with entering into these credit facilities, MetLife, Inc. paid
$16 million
of debt issuance costs on the Company’s behalf. The Company capitalized these costs, which are included in other assets, and reimbursed MetLife, Inc. in 2017. Such debt issuance costs are amortized over the terms of the facilities, which is included in other expenses.
On July 21, 2017, Brighthouse Financial, Inc. entered into a new term loan agreement (the “2017 Term Loan Agreement”) with respect to a new
$600 million
unsecured delayed draw term loan facility due December 2, 2019 (the “2017 Term Loan Facility”). Debt issuance costs incurred related to the 2017 Term Loan Facility were not significant. On August 2, 2017, Brighthouse Financial, Inc. borrowed
$500 million
under the 2017 Term Loan Facility in connection with the Separation. On August 14, 2017, Brighthouse Financial, Inc. borrowed the remaining
$100 million
available under the 2017 Term Loan Facility.
On July 21, 2017, concurrently with entering into the 2017 Term Loan Agreement, the 2016 Term Loan Facility was terminated without penalty. As a result of this termination,
$7 million
of unamortized debt issuance costs were written off and included in other expenses.
At December 31, 2017, there were
no
drawdowns under the Revolving Credit Facility and there was
$600 million
outstanding under the 2017 Term Loan Facility, resulting in unused commitments totaling
$2.0 billion
in comparison to the maximum capacity of
$2.6 billion
under these facilities.
Committed Facilities, Collateral Financing Arrangement and Reinsurance Financing Arrangement
The Company previously had access to an unsecured revolving credit facility and certain committed facilities through the Company’s former parent, MetLife, Inc. These facilities were used for collateral for certain of the Company’s affiliated reinsurance liabilities.
In connection with the affiliated reinsurance company restructuring, effective April 28, 2017, MetLife, Inc.’s then existing affiliated reinsurance subsidiaries that supported the business interests of Brighthouse Financial, Inc. became a part of Brighthouse Financial, Inc. Simultaneously with the affiliated reinsurance company restructuring, the existing reserve financing arrangements of the affected reinsurance subsidiaries, as well as Brighthouse Financial, Inc.’s access to MetLife Inc.’s revolving credit facility and certain committed facilities, including outstanding letters of credit, were terminated and replaced with a single reinsurance financing arrangement, which is discussed in more detail below. The terminated committed facilities included a
$3.5 billion
committed facility for the benefit of MRSC and a
$4.3 billion
committed facility for the benefit of MRV Cell.
For the years ended December 31, 2017, 2016 and 2015, the Company recognized fees of
$19 million
,
$55 million
and
$61 million
, respectively, in other expenses associated with these committed facilities.
In 2007, MetLife, Inc. and MRSC entered into a 30-year collateral financing arrangement with an unaffiliated financial institution that provided up to
$3.5 billion
of statutory reserve support for MRSC associated with reinsurance obligations under affiliated reinsurance agreements. Proceeds from this collateral financing arrangement, which resulted in a drawdown of
$2.8 billion
on the aforementioned
$3.5 billion
committed facility, were placed in trusts to support MRSC’s statutory obligations associated with the reinsurance of secondary guarantees (see
Note 6
for additional information regarding MRSC invested assets). At December 31, 2016, the amount outstanding under this collateral financing arrangement was
$2.8 billion
. On April 28, 2017, MetLife, Inc. and MRSC terminated this collateral financing arrangement. As a result, the
$2.8 billion
collateral financing arrangement obligation outstanding was extinguished utilizing
$2.8 billion
of assets held in trust, which had been repositioned into short-term investments and cash equivalents. The remaining assets held in trust of
$590 million
were returned to MetLife, Inc., resulting in a decrease in shareholder’s net investment.
244
Brighthouse Financial, Inc.
Notes to the Consolidated and Combined Financial Statements (continued)
9. Long-term Debt and Collateral Financing Arrangement (continued)
For the years ended December 31, 2017, 2016 and 2015, the Company recognized interest expense of
$19 million
,
$39 million
and
$28 million
, respectively, related to this collateral financing arrangement, which is included in other expenses.
On April 28, 2017, BRCD entered into a new
$10.0 billion
financing arrangement with a pool of highly rated third-party reinsurers. This financing arrangement consists of credit-linked notes that each have a term of
20
years. At
December 31, 2017
, there were
no
drawdowns on this facility and there was
$8.3 billion
of funding available under this arrangement. Fees associated with this financing arrangement were not significant.
10. Equity
Shareholder’s Net Investment Transactions
The following sections summarize certain transactions that occurred prior to and including the Separation and affected shareholder’s net investment.
In connection with the Separation, on August 4, 2017, the Company reclassified
$12.4 billion
from shareholder’s net investment to common stock and additional paid-in capital.
Common Stock
On August 4, 2017, Brighthouse Financial, Inc. issued an additional
119,673,106
shares of common stock to MetLife, Inc. Also on August 4, 2017, MetLife, Inc. distributed
96,776,670
of its
119,773,106
shares of Brighthouse Financial, Inc. common stock, representing
80.8%
of MetLife Inc.’s interest in Brighthouse Financial, Inc., to holders of MetLife, Inc. common stock. MetLife, Inc. retained the remaining
22,996,436
shares, representing
19.2%
of Brighthouse Financial, Inc.’s common stock.
Capital Contributions
During the third quarter of 2017, the Company recognized a
$1.1 billion
non-cash tax charge and corresponding capital contribution from MetLife, Inc. This tax obligation was in connection with the Separation and MetLife, Inc. is responsible for this obligation through a Tax Separation Agreement. See Note 13.
During the second quarter of 2017, MetLife, Inc. forgave Brighthouse Life Insurance Company’s obligation to pay the principal amount of
$750 million
of surplus notes held by MetLife, Inc. The forgiveness of these notes was a non-cash capital contribution. See
Note 9
.
During the first quarter of 2017, the Company sold an operating joint venture to a former affiliate and the resulting
$202 million
gain was treated as a cash capital contribution. See
Note 6
.
During the years ended December 31,
2016
and
2015
, the Company received cash capital contributions of
$1.6 billion
and
$10 million
, respectively, from MetLife, Inc.
In December 2015 and 2014, the Company accrued capital contributions from MetLife, Inc. of
$120 million
and
$385 million
, respectively, in premiums, reinsurance and other receivables and shareholder’s net investment, which were settled for cash in 2016 and 2015, respectively.
MetLife, Inc. has made payments and received collections on behalf of the Company. Such net amounts, as well as amortization of deferred credit and committed facility structuring costs and debt issuance costs incurred by MetLife, Inc. on behalf of the Company, are recorded as non-cash net contributions of capital. During the years ended
December 31, 2017
,
2016
and
2015
, MetLife, Inc. made non-cash net capital contributions of
$60 million
,
$47 million
and
$14 million
, respectively, in the forms of payment of letters of credit fees and amortization of deferred credit and committed facility structuring costs and debt issuance costs incurred on the Company’s behalf, partially offset by investment income, net of interest expense, related to the MRSC collateral financing arrangement collected on the Company’s behalf. See
Note 9
.
Prior to the Separation, certain transactions related to expense allocations were settled through shareholder’s net investment.
Cash Distributions
On August 3, 2017, Brighthouse Financial, Inc. made a cash distribution in an aggregate amount of
$1.8 billion
to MetLife, Inc., the sole holder of Brighthouse Financial, Inc. common stock as of the record date for the distribution.
In April 2017, MetLife, Inc. and MRSC terminated a collateral financing arrangement and the obligation outstanding was extinguished utilizing assets held in trust. The remaining assets held in trust of
$590 million
were returned to MetLife, Inc., resulting in a decrease in shareholder’s net investment. See Note 9.
245
Brighthouse Financial, Inc.
Notes to the Consolidated and Combined Financial Statements (continued)
10. Equity (continued)
During the years ended December 31, 2017, 2016 and 2015, dividends totaling
$0
,
$556 million
and
$699 million
, respectively, were paid to MetLife, Inc. or one of its subsidiaries by Brighthouse Life Insurance Company and NELICO, resulting in a decrease in shareholder’s net investment.
The Company paid cash distributions to certain MetLife affiliates related to a profit sharing agreement with Brighthouse Advisers of
$40 million
,
$78 million
and
$72 million
, for the years ended
December 31, 2017
,
2016
and
2015
, respectively.
Noncontrolling Interests
On June 20, 2017, BH Holdings issued
$50 million
aggregate liquidation preference of fixed rate cumulative preferred units to MetLife, Inc., which MetLife subsequently resold to unaffiliated third parties. These preferred units are reported as noncontrolling interests on the consolidated and combined balance sheets.
On April 28, 2017, BRCD issued
$15 million
of fixed to floating rate cumulative preferred stock, Series A preferred stock, to an affiliate of MetLife, Inc. These Series A preferred stock are reported as noncontrolling interests on the consolidated and combined balance sheets.
Stock-Based Compensation Plans
The Company does not currently issue equity awards. However, on August 9, 2017, equity awards were authorized to be made to the Company’s executive officers, independent non-employee members of the Board of Directors and certain other employees of the Company, which were converted into a number of restricted stock units based upon the closing price of the Company’s common stock on September 8, 2017 (the “Founders’ Grants”). All long-term equity awards, including the Founders’ Grants, were made pursuant to an equity compensation plan that is subject to approval of the Company’s stockholders. No compensation expense has been recognized for these awards.
Statutory Equity and Income
The states of domicile of the Company’s insurance subsidiaries impose risk-based capital (
“RBC”
) requirements that were developed by the National Association of Insurance Commissioners (
“NAIC”
). Regulatory compliance is determined by a ratio of a company’s total adjusted capital, calculated in the manner prescribed by the NAIC (
“TAC”
) to its authorized control level RBC, calculated in the manner prescribed by the NAIC (
“ACL RBC”
), based on the statutory-based filed financial statements. Companies below specific trigger levels or ratios are classified by their respective levels, each of which requires specified corrective action. The minimum level of TAC before corrective action commences is twice ACL RBC. The RBC ratios for the Company’s insurance subsidiaries were each
in excess of 400%
for all periods presented.
The Company’s insurance subsidiaries prepare statutory-basis financial statements in accordance with statutory accounting practices prescribed or permitted by the insurance department of the state of domicile.
Statutory accounting principles differ from GAAP primarily by charging policy acquisition costs to expense as incurred, establishing future policy benefit liabilities using different actuarial assumptions, reporting of reinsurance agreements and valuing investments and deferred tax assets on a different basis. The Company’s insurance subsidiaries have no material state prescribed accounting practices.
The tables below present amounts from the Company’s insurance subsidiaries, which are derived from the statutory-basis financial statements as filed with the insurance regulators.
Statutory net income (loss) was as follows:
|
Years Ended December 31,
|
||||||||||||||
|
Company
|
State of Domicile
|
2017
|
2016
|
2015
|
||||||||||
|
(In millions)
|
||||||||||||||
|
Brighthouse Life Insurance Company
|
Delaware
|
$
|
(425
|
)
|
$
|
1,186
|
|
$
|
(1,022
|
)
|
||||
|
New England Life Insurance Company
|
Massachusetts
|
$
|
68
|
|
$
|
109
|
|
$
|
157
|
|
||||
246
Brighthouse Financial, Inc.
Notes to the Consolidated and Combined Financial Statements (continued)
10. Equity (continued)
Statutory capital and surplus was as follows at:
|
December 31,
|
||||||||
|
Company
|
2017
|
2016
|
||||||
|
(In millions)
|
||||||||
|
Brighthouse Life Insurance Company
|
$
|
5,594
|
|
$
|
4,374
|
|
||
|
New England Life Insurance Company
|
$
|
483
|
|
$
|
455
|
|
||
The Company has a reinsurance subsidiary, BRCD that was formed in 2017 as the result of the merger of certain other affiliated captive reinsurance subsidiaries. BRCD reinsures risks including level premium term life and ULSG assumed from other Brighthouse Life Insurance Company subsidiaries. BRCD, with the explicit permission of the Delaware Commissioner, has included, as admitted assets, the value of credit-linked notes, serving as collateral, which resulted in higher statutory capital and surplus of
$8.3 billion
for the year ended December 31, 2017. BRCD’s RBC would have triggered a regulatory event without the use of the state prescribed practice.
Prior to the formation of BRCD and related merger, the legacy MetLife captive reinsurance subsidiaries included in the statutory merger and formation of BRCD had certain state prescribed accounting practices. MRV Cell with the explicit permission of the Commissioner of Insurance of the State of Vermont, included, as admitted assets, the value of letters of credit serving as collateral for reinsurance credit taken by various affiliated cedants, in connection with reinsurance agreements entered into between MRV Cell and the various affiliated cedants, which resulted in higher statutory capital and surplus of
$3.0 billion
for the year ended December 31, 2016. MRV Cell’s RBC would have triggered a regulatory event without the use of the state prescribed practice. MRD, with the explicit permission of the Delaware Commissioner, previously included, as admitted assets, the value of letters of credit issued to MRD, serving as collateral, which resulted in higher statutory capital and surplus of
$260 million
for the year ended December 31, 2016. MRD’s RBC would not have triggered a regulatory event without the use of the state prescribed practice.
The statutory net income (loss) of the Company’s affiliate reinsurance companies was
($1.6) billion
,
($363) million
and
($372) million
for the years ended December 2017, 2016 and 2015, respectively, and the combined statutory capital and surplus, including the aforementioned prescribed practices, were
$972 million
and
$2.6 billion
at December 31, 2017 and 2016, respectively.
Dividend Restrictions
The table below sets forth the dividends permitted to be paid by the Company’s insurance companies without insurance regulatory approval and dividends paid:
|
2018
|
2017
|
2016
|
||||||||||||
|
Company
|
Permitted Without
Approval (1)
|
Paid (2)
|
Paid (2)
|
|||||||||||
|
(In millions)
|
||||||||||||||
|
Brighthouse Life Insurance Company
|
$
|
84
|
|
$
|
—
|
$
|
261
|
|
||||||
|
New England Life Insurance Company
|
$
|
65
|
|
$
|
106
|
$
|
295
|
|
(3)
|
|||||
______________
|
(1)
|
Reflects dividend amounts that may be paid during 2018 without prior regulatory approval. However, because dividend tests may be based on dividends previously paid over rolling 12-month periods, if paid before a specified date during 2018, some or all of such dividends may require regulatory approval.
|
|
(2)
|
Reflects all amounts paid, including those requiring regulatory approval.
|
|
(3)
|
An extraordinary cash dividend paid to its former parent, MetLife, Inc.
|
Under the Delaware Insurance Code, Brighthouse Life Insurance Company is permitted, without prior insurance regulatory clearance, to pay a stockholder dividend as long as the amount of the dividend when aggregated with all other dividends in the
247
Brighthouse Financial, Inc.
Notes to the Consolidated and Combined Financial Statements (continued)
10. Equity (continued)
preceding 12 months does not exceed the greater of: (i) 10% of its surplus to policyholders as of the end of the immediately preceding calendar year; or (ii) its net statutory gain from operations for the immediately preceding calendar year (excluding realized capital gains), not including pro rata distributions of Brighthouse Life Insurance Company’s own securities. Brighthouse Life Insurance Company will be permitted to pay a stockholder dividend in excess of the greater of such two amounts only if it files notice of the declaration of such a dividend and the amount thereof with the Delaware Commissioner and the Delaware Commissioner either approves the distribution of the dividend or does not disapprove the distribution within 30 days of its filing. In addition, any dividend that exceeds earned surplus (defined as “unassigned funds (surplus)”) as of the immediately preceding calendar year requires insurance regulatory approval. Under the Delaware Insurance Code, the Delaware Commissioner has broad discretion in determining whether the financial condition of a stock life insurance company would support the payment of such dividends to its stockholders.
Under the Massachusetts State Insurance Law, NELICO is permitted, without prior insurance regulatory clearance, to pay a stockholder dividend as long as the aggregate amount of the dividend, when aggregated with all other dividends paid in the preceding 12 months, does not exceed the greater of: (i) 10% of its surplus to policyholders as of the end of the immediately preceding calendar year; or (ii) its statutory net gain from operations for the immediately preceding calendar year, not including pro rata distributions of NELICO’s own securities. NELICO will be permitted to pay a dividend in excess of the greater of such two amounts only if it files notice of the declaration of such a dividend and the amount thereof with the Massachusetts Commissioner of Insurance (the “Massachusetts Commissioner”) and the Massachusetts Commissioner either approves the distribution of the dividend or does not disapprove the distribution within 30 days of its filing. In addition, any dividend that exceeds earned surplus (defined as “unassigned funds (surplus)”) as of the last filed annual statutory statement requires insurance regulatory approval. Under the Massachusetts State Insurance Law, the Massachusetts Commissioner has broad discretion in determining whether the financial condition of a stock life insurance company would support the payment of such dividends to its stockholders.
Under BRCD’s plan of operations, no dividend or distribution may be made by BRCD without the prior approval of the Delaware Commissioner. During the year ended December 31, 2017, BRCD paid an extraordinary cash dividend of
$535 million
to Brighthouse Life Insurance Company.
248
Brighthouse Financial, Inc.
Notes to the Consolidated and Combined Financial Statements (continued)
10. Equity (continued)
Accumulated Other Comprehensive Income (Loss)
Information regarding changes in the balances of each component of AOCI was as follows:
|
Unrealized
Investment Gains
(Losses), Net of
Related Offsets (1)
|
Unrealized
Gains (Losses)
on Derivatives
|
Foreign
Currency
Translation
Adjustments
|
Defined Benefit Plans Adjustment
|
Total
|
|||||||||||||||
|
(In millions)
|
|||||||||||||||||||
|
Balance at December 31, 2014
|
$
|
2,555
|
|
$
|
190
|
|
$
|
(15
|
)
|
$
|
(15
|
)
|
$
|
2,715
|
|
||||
|
OCI before reclassifications
|
(1,975
|
)
|
102
|
|
(25
|
)
|
(10
|
)
|
(1,908
|
)
|
|||||||||
|
Deferred income tax benefit (expense)
|
692
|
|
(36
|
)
|
8
|
|
4
|
|
668
|
|
|||||||||
|
AOCI before reclassifications, net of income tax
|
1,272
|
|
256
|
|
(32
|
)
|
(21
|
)
|
1,475
|
|
|||||||||
|
Amounts reclassified from AOCI
|
77
|
|
(7
|
)
|
—
|
|
4
|
|
74
|
|
|||||||||
|
Deferred income tax benefit (expense)
|
(27
|
)
|
2
|
|
—
|
|
(1
|
)
|
(26
|
)
|
|||||||||
|
Amounts reclassified from AOCI, net of income tax
|
50
|
|
(5
|
)
|
—
|
|
3
|
|
48
|
|
|||||||||
|
Balance at December 31, 2015
|
1,322
|
|
|
251
|
|
|
(32
|
)
|
|
(18
|
)
|
|
1,523
|
|
|||||
|
OCI before reclassifications
|
(465
|
)
|
71
|
|
1
|
|
2
|
|
(391
|
)
|
|||||||||
|
Deferred income tax benefit (expense)
|
158
|
|
(25
|
)
|
—
|
|
(1
|
)
|
132
|
|
|||||||||
|
AOCI before reclassifications, net of income tax
|
1,015
|
|
297
|
|
(31
|
)
|
(17
|
)
|
1,264
|
|
|||||||||
|
Amounts reclassified from AOCI
|
44
|
|
(45
|
)
|
—
|
|
1
|
|
—
|
|
|||||||||
|
Deferred income tax benefit (expense)
|
(15
|
)
|
16
|
|
—
|
|
—
|
|
1
|
|
|||||||||
|
Amounts reclassified from AOCI, net of income tax
|
29
|
|
(29
|
)
|
—
|
|
1
|
|
1
|
|
|||||||||
|
Balance at December 31, 2016
|
1,044
|
|
268
|
|
(31
|
)
|
(16
|
)
|
1,265
|
|
|||||||||
|
OCI before reclassifications
|
276
|
|
(157
|
)
|
10
|
|
(19
|
)
|
110
|
|
|||||||||
|
Deferred income tax benefit (expense)
|
(94
|
)
|
55
|
|
(3
|
)
|
14
|
|
(28
|
)
|
|||||||||
|
AOCI before reclassifications, net of income tax
|
1,226
|
|
166
|
|
(24
|
)
|
(21
|
)
|
1,347
|
|
|||||||||
|
Amounts reclassified from AOCI
|
60
|
|
(18
|
)
|
—
|
|
—
|
|
42
|
|
|||||||||
|
Deferred income tax benefit (expense) (2)
|
286
|
|
6
|
|
—
|
|
(5
|
)
|
287
|
|
|||||||||
|
Amounts reclassified from AOCI, net of income tax
|
346
|
|
(12
|
)
|
—
|
|
(5
|
)
|
329
|
|
|||||||||
|
Balance at December 31, 2017
|
$
|
1,572
|
|
$
|
154
|
|
$
|
(24
|
)
|
$
|
(26
|
)
|
$
|
1,676
|
|
||||
__________________
|
(1)
|
See
Note 6
for information on offsets to investments related to future policy benefits, DAC, VOBA and DSI.
|
|
(2)
|
Includes the
$306 million
and
($5) million
impacts of the Tax Act related to unrealized investments gains (losses), net of related offsets and defined benefit plans adjustment, respectively. See
Note 1
for more information.
|
249
Brighthouse Financial, Inc.
Notes to the Consolidated and Combined Financial Statements (continued)
10. Equity (continued)
Information regarding amounts reclassified out of each component of AOCI was as follows:
|
AOCI Components
|
Amounts Reclassified from AOCI
|
Consolidated and Combined Statements of Operations and Comprehensive Income (Loss) Locations
|
||||||||||||
|
Years Ended December 31,
|
||||||||||||||
|
2017
|
2016
|
2015
|
||||||||||||
|
(In millions)
|
`
|
|||||||||||||
|
Net unrealized investment gains (losses):
|
||||||||||||||
|
Net unrealized investment gains (losses)
|
$
|
(15
|
)
|
$
|
(51
|
)
|
$
|
(79
|
)
|
Net investment gains (losses)
|
||||
|
Net unrealized investment gains (losses)
|
3
|
|
3
|
|
13
|
|
Net investment income
|
|||||||
|
Net unrealized investment gains (losses)
|
(48
|
)
|
4
|
|
(11
|
)
|
Net derivative gains (losses)
|
|||||||
|
Net unrealized investment gains (losses), before income tax
|
(60
|
)
|
(44
|
)
|
(77
|
)
|
||||||||
|
Income tax (expense) benefit
|
(286
|
)
|
15
|
|
27
|
|
||||||||
|
Net unrealized investment gains (losses), net of income tax
|
$
|
(346
|
)
|
$
|
(29
|
)
|
$
|
(50
|
)
|
|||||
|
Unrealized gains (losses) on derivatives - cash flow hedges:
|
||||||||||||||
|
Interest rate swaps
|
$
|
—
|
|
$
|
33
|
|
$
|
1
|
|
Net derivative gains (losses)
|
||||
|
Interest rate swaps
|
3
|
|
3
|
|
1
|
|
Net investment income
|
|||||||
|
Interest rate forwards
|
2
|
|
2
|
|
2
|
|
Net derivative gains (losses)
|
|||||||
|
Interest rate forwards
|
3
|
|
2
|
|
2
|
|
Net investment income
|
|||||||
|
Foreign currency swaps
|
10
|
|
5
|
|
—
|
|
Net derivative gains (losses)
|
|||||||
|
Credit forwards
|
—
|
|
—
|
|
1
|
|
Net investment income
|
|||||||
|
Gains (losses) on cash flow hedges, before income tax
|
18
|
|
45
|
|
7
|
|
||||||||
|
Income tax (expense) benefit
|
(6
|
)
|
(16
|
)
|
(2
|
)
|
||||||||
|
Gains (losses) on cash flow hedges, net of income tax
|
$
|
12
|
|
$
|
29
|
|
$
|
5
|
|
|||||
|
Defined benefit plans adjustment:
|
||||||||||||||
|
Amortization of net actuarial gains (losses)
|
$
|
—
|
|
$
|
(1
|
)
|
$
|
(2
|
)
|
|||||
|
Amortization of prior service (costs) credit
|
—
|
|
—
|
|
(2
|
)
|
||||||||
|
Amortization of defined benefit plan items, before income tax
|
—
|
|
(1
|
)
|
(4
|
)
|
||||||||
|
Income tax (expense) benefit
|
5
|
|
—
|
|
1
|
|
||||||||
|
Amortization of defined benefit plan items, net of income tax
|
5
|
|
(1
|
)
|
(3
|
)
|
||||||||
|
Total reclassifications, net of income tax
|
$
|
(329
|
)
|
$
|
(1
|
)
|
$
|
(48
|
)
|
|||||
250
Brighthouse Financial, Inc.
Notes to the Consolidated and Combined Financial Statements (continued)
11. Other Expenses
Information on other expenses was as follows:
|
|
Years Ended December 31,
|
|||||||||||
|
|
2017
|
2016
|
2015
|
|||||||||
|
|
(In millions)
|
|||||||||||
|
Compensation
|
$
|
287
|
|
$
|
400
|
|
$
|
455
|
|
|||
|
Commissions
|
806
|
|
637
|
|
715
|
|
||||||
|
Volume-related costs
|
486
|
|
562
|
|
552
|
|
||||||
|
Related party expenses on ceded and assumed reinsurance
|
36
|
|
22
|
|
17
|
|
||||||
|
Capitalization of DAC
|
(260
|
)
|
(334
|
)
|
(399
|
)
|
||||||
|
Interest expense on debt
|
153
|
|
175
|
|
170
|
|
||||||
|
Goodwill impairment (1)
|
—
|
|
161
|
|
—
|
|
||||||
|
Premium taxes, licenses and fees
|
64
|
|
63
|
|
76
|
|
||||||
|
Professional services
|
292
|
|
89
|
|
65
|
|
||||||
|
Rent and related expenses
|
13
|
|
47
|
|
56
|
|
||||||
|
Other
|
606
|
|
462
|
|
413
|
|
||||||
|
Total other expenses
|
$
|
2,483
|
|
$
|
2,284
|
|
$
|
2,120
|
|
|||
__________________
|
(1)
|
Based on a quantitative analysis performed for the Run-off reporting unit, it was determined that the goodwill associated with this reporting unit was not recoverable and resulted in the impairment of the entire goodwill balance.
|
Capitalization of DAC
See
Note 4
for additional information on the capitalization of DAC.
Interest Expense on Debt
See Note
9
for attribution of interest expense by debt issuance. Interest expense on debt includes interest expense related to CSEs.
Related Party Expenses
See
Note
16
for a discussion of related party expenses included in the table above.
12. Employee Benefit Plans
Pension
NELICO sponsors a qualified and a nonqualified defined benefit pension plan, as well as unfunded other postretirement benefit plans. Effective December 31, 2014, the NELICO sponsored pension and other postretirement plans were amended to eliminate benefit accruals prosp
ectively and are closed to new entrants.
All benefit payments related to the nonqualified defined benefit pension plan and other postretirement benefit plans are subject to reimbursement annually, on an after tax basis, by MetLife.
Formerly, the Company’s employees, sales representatives and retirees participated in defined benefit pension plans sponsored by MLIC, a former affiliate. The Company also provided postemployment and postretirement medical and life insurance benefits for certain retired employees through plans sponsored by MLIC. Participation in these plans ended December 31, 2016. These plans also included participants from other affiliates of MLIC. The Company accounted for these plans as multiemployer benefit plans and as a result the assets, obligations and other comprehensive gains and losses of these benefit plans were not included in the accompanying combined balance sheets or the additional disclosure below. The Company’s share of pension expense was
$0
,
$31 million
and
$24 million
for the years ended
December 31, 2017
,
2016
and
2015
, respectively. The
pension expense associated with its employees that participate in the plans is included in other expenses.
251
Brighthouse Financial, Inc.
Notes to the Consolidated and Combined Financial Statements (continued)
12. Employee Benefit Plans (continued)
Obligations and Funded Status
|
December 31,
|
|||||||||||||||
|
2017
|
2016
|
||||||||||||||
|
Pension
Benefits (1) |
Other Postretirement Benefits
|
Pension
Benefits (1)
|
Other Postretirement Benefits
|
||||||||||||
|
(In millions)
|
|||||||||||||||
|
Change in benefit obligations:
|
|||||||||||||||
|
Benefit obligations at January 1,
|
$
|
219
|
|
$
|
37
|
|
$
|
213
|
|
$
|
32
|
|
|||
|
Interest costs
|
9
|
|
2
|
|
9
|
|
2
|
|
|||||||
|
Plan participants’ contributions
|
—
|
|
3
|
|
—
|
|
2
|
|
|||||||
|
Net actuarial (gains) losses
|
11
|
|
6
|
|
5
|
|
(2
|
)
|
|||||||
|
Change in benefits and other
|
5
|
|
—
|
|
—
|
|
9
|
|
|||||||
|
Benefits paid
|
(11
|
)
|
(8
|
)
|
(8
|
)
|
(6
|
)
|
|||||||
|
Benefit obligations at December 31,
|
233
|
|
40
|
|
219
|
|
37
|
|
|||||||
|
Change in plan assets:
|
|||||||||||||||
|
Estimated fair value of plan assets at January 1,
|
155
|
|
—
|
|
148
|
|
—
|
|
|||||||
|
Actual return on plan assets
|
17
|
|
—
|
|
11
|
|
—
|
|
|||||||
|
Plan participants’ contributions
|
—
|
|
3
|
|
—
|
|
2
|
|
|||||||
|
Employer contributions
|
4
|
|
5
|
|
4
|
|
4
|
|
|||||||
|
Benefits paid
|
(11
|
)
|
(8
|
)
|
(8
|
)
|
(6
|
)
|
|||||||
|
Estimated fair value of plan assets at December 31,
|
165
|
|
—
|
|
155
|
|
—
|
|
|||||||
|
Over (under) funded status at December 31,
|
$
|
(68
|
)
|
$
|
(40
|
)
|
$
|
(64
|
)
|
$
|
(37
|
)
|
|||
|
Amounts recognized in the consolidated balance sheets:
|
|||||||||||||||
|
Other assets
|
$
|
3
|
|
$
|
—
|
|
$
|
2
|
|
$
|
—
|
|
|||
|
Other liabilities
|
(71
|
)
|
(40
|
)
|
(66
|
)
|
(37
|
)
|
|||||||
|
Net amount recognized
|
$
|
(68
|
)
|
$
|
(40
|
)
|
$
|
(64
|
)
|
$
|
(37
|
)
|
|||
|
AOCI:
|
|||||||||||||||
|
Net actuarial (gains) losses
|
$
|
31
|
|
$
|
3
|
|
$
|
28
|
|
$
|
(3
|
)
|
|||
|
Prior service costs (credit)
|
—
|
|
—
|
|
—
|
|
—
|
|
|||||||
|
AOCI, before income tax
|
$
|
31
|
|
$
|
3
|
|
$
|
28
|
|
$
|
(3
|
)
|
|||
|
Accumulated benefit obligation
|
$
|
233
|
|
N/A
|
|
$
|
219
|
|
N/A
|
|
|||||
__________________
|
(1)
|
Includes nonqualified unfunded plan, for which the aggregate projected benefit obligation (PBO) was
$71 million
and
$66 million
at
December 31, 2017
and
2016
, respectively.
|
Information for pension plans with accumulated benefit obligations in excess of plan assets was as follows at:
|
December 31,
|
|||||||
|
2017
|
2016
|
||||||
|
(In millions)
|
|||||||
|
Projected benefit obligations
|
$
|
71
|
|
$
|
66
|
|
|
|
Accumulated benefit obligations
|
$
|
71
|
|
$
|
66
|
|
|
|
Estimated fair value of plan assets
|
$
|
—
|
|
$
|
—
|
|
|
The PBO exceeded assets for only the nonqualified unfunded pension plan at both December 31,
2017
and
2016
.
252
Brighthouse Financial, Inc.
Notes to the Consolidated and Combined Financial Statements (continued)
12. Employee Benefit Plans (continued)
The estimated net actuarial (gains) losses and prior service costs (credit) for the defined benefit pension plans and other postretirement benefit plans that will be amortized from AOCI into net periodic benefit costs over the next year are not significant.
Assumptions
The assumptions used in determining benefit obligations were
3.9%
and
4.3%
at December 31, 2017 and 2016, respectively, using the weighted average discount rate.
Assumptions used in determining net periodic benefit costs were as follows:
|
Years Ended December 31,
|
||||||
|
Pension Benefits
|
2017
|
2016
|
2015
|
|||
|
Weighted average discount rate
|
4.30%
|
4.42%
|
4.10%
|
|||
|
Weighted average expected rate of return on plan assets (1)
|
5.75%
|
5.75%
|
5.75%
|
|||
|
Rate of compensation increase
|
N/A
|
N/A
|
N/A
|
|||
__________________
|
(1)
|
T
he weighted expected return on plan assets is currently anticipated to be between
4.75%
and
5.75%
, which will be determined when the Brighthouse benefit plan investment committee reviews and approves the entirety of the investment policy including the future investment allocation targets on a post-Separation basis.
|
The weighted average discount rate is determined annually based on the yield, measured on a yield to worst basis, of a hypothetical portfolio constructed of high quality debt instruments available on the valuation date, which would provide the necessary future cash flows to pay the aggregate PBO when due.
The weighted average expected rate of return on plan assets is based on anticipated performance of the various asset sectors in which the plan invests, weighted by target allocation percentages. Anticipated future performance is based on long-term historical returns of the plan assets by sector, adjusted for the Company’s long-term expectations on the performance of the markets. While the precise expected rate of return derived using this approach will fluctuate from year to year, the Company’s policy is to hold this long-term assumption constant as long as it remains within reasonable tolerance from the derived rate.
Plan Assets
The asset of the qualified pension plan (the “Invested Plan”) are managed by MetLife Separate Accounts in accordance with investment policies consistent with the longer-term nature of related benefit obligations and within prudent risk parameters. Specifically, investment policies are oriented toward (i) maximizing the Invested Plan’s funded status; (ii) minimizing the volatility of the Invested Plan’s funded status; (iii) generating asset returns that exceed liability increases; and (iv) targeting rates of return in excess of a custom benchmark and industry standards over appropriate reference time periods. These goals are expected to be met through identifying appropriate and diversified asset classes and allocations, ensuring adequate liquidity to pay benefits and expenses when due and controlling the costs of administering and managing the Invested Plan’s investments. Independent investment consultants are periodically used to evaluate the investment risk of Invested Plan’s assets relative to liabilities, analyze the economic and portfolio impact of various asset allocations and management strategies and to recommend asset allocations.
253
Brighthouse Financial, Inc.
Notes to the Consolidated and Combined Financial Statements (continued)
12. Employee Benefit Plans (continued)
Derivative contracts may be used to reduce investment risk, to manage duration and to replicate the risk/return profile of an asset or asset class. Derivatives may not be used to leverage a portfolio in any manner, such as to magnify exposure to an asset, asset class, interest rates or any other financial variable. Derivatives are also prohibited for use in creating exposures to securities, currencies, indices or any other financial variable that is otherwise restricted. The table below summarizes the actual weighted average allocation of the estimated fair value of total plan assets by asset class at December 31 for the years indicated and the approved target allocation by major asset class at
December 31, 2017
for the Invested Plan:
|
December 31,
|
|||||||||
|
2017
|
2016
|
||||||||
|
Target (1)
|
Actual
Allocation |
Actual
Allocation
|
|||||||
|
Asset Class
|
|||||||||
|
Fixed maturity securities
|
80
|
%
|
100
|
%
|
79
|
%
|
|||
|
Equity securities
|
20
|
%
|
—
|
%
|
21
|
%
|
|||
|
Total assets
|
100
|
%
|
100
|
%
|
100
|
%
|
|||
__________________
|
(1)
|
In an effort to limit variability during the Separation, MetLife changed the actual allocation to
100%
fixed maturity securities, which was permitted under the approved investment policy so long as the change did not remain in place without action by the appropriate governing body with respect thereto for a period of more than one year. Brighthouse’s benefit plan investment committee is in the process of reviewing the entirety of the investment policy including the future investment allocation targets on a post-Separation basis and update the policy as appropriate.
|
Estimated Fair Value
The pension benefit plan assets are categorized into a three-level fair value hierarchy, as described in
Note 8
.
The pension plan assets measured at estimated fair value on a recurring basis and their corresponding placement in the fair value hierarchy are summarized as follows:
|
December 31, 2017
|
|||||||||||||||
|
Fair Value Hierarchy
|
|||||||||||||||
|
Level 1
|
Level 2
|
Level 3
|
Total
Estimated Fair Value |
||||||||||||
|
(In millions)
|
|||||||||||||||
|
Assets
|
|||||||||||||||
|
Interest in insurance company separate accounts
|
$
|
45
|
|
$
|
102
|
|
$
|
—
|
|
$
|
147
|
|
|||
|
Insurance company general accounts
|
—
|
|
—
|
|
18
|
|
18
|
|
|||||||
|
Total assets
|
$
|
45
|
|
|
$
|
102
|
|
|
$
|
18
|
|
|
$
|
165
|
|
254
Brighthouse Financial, Inc.
Notes to the Consolidated and Combined Financial Statements (continued)
12. Employee Benefit Plans (continued)
|
December 31, 2016
|
|||||||||||||||
|
Fair Value Hierarchy
|
|||||||||||||||
|
Level 1
|
Level 2
|
Level 3
|
Total
Estimated Fair Value |
||||||||||||
|
(In millions)
|
|||||||||||||||
|
Assets
|
|||||||||||||||
|
Interest in insurance company separate accounts
|
$
|
72
|
|
$
|
83
|
|
$
|
—
|
|
$
|
155
|
|
|||
|
Insurance company general accounts
|
—
|
|
—
|
|
—
|
|
—
|
|
|||||||
|
Total assets
|
$
|
72
|
|
|
$
|
83
|
|
|
$
|
—
|
|
|
$
|
155
|
|
For each of the years ended
December 31, 2017
and
2016
, the changes to pension plan assets invested in insurance company separate and general accounts measured at estimated fair value on a recurring basis using significant unobservable (Level 3) inputs were
$18 million
and not significant, respectively.
Expected Future Contributions and Benefit Payments
It is the Company’s practice to make contributions to the qualified pension plan to comply with minimum funding requirements of ERISA, the Pension Protection Act of 2006, the Code and the applicable rules and regulations. In accordance with such practice,
no
contributions are required for
2018
. The Company expects to make
no
discretionary contributions to the qualified pension plan in 2018. For information on employer contributions, see “— Obligations and Funded Status.”
Benefit payments due under the nonqualified pension and unfunded postretirement plans are primarily funded from the Company’s general assets as they become due under the provision of the plans. As a result, benefit payments equal employer and employee contributions for these plans. The Company does not expect contributions to be material in
2018
. As stated above, all benefit payments related to the nonqualified defined pension plan and other postretirement benefit plans are subject to reimbursement annually, on an after tax basis, by MetLife.
Gross benefit payments for the next 10 years before MetLife reimbursement on an after tax basis are expected to be as follows:
|
Pension Benefits
|
Other Postretirement Benefits
|
||||||
|
(In millions)
|
|||||||
|
2018
|
$
|
11
|
|
$
|
4
|
|
|
|
2019
|
$
|
11
|
|
$
|
4
|
|
|
|
2020
|
$
|
12
|
|
$
|
4
|
|
|
|
2021
|
$
|
13
|
|
$
|
4
|
|
|
|
2022
|
$
|
13
|
|
$
|
3
|
|
|
|
2023-2027
|
$
|
68
|
|
$
|
14
|
|
|
Defined Contribution Plans
Brighthouse Services sponsors qualified and nonqualified defined contribution plans. For the year ended December 31, 2017 the total employer match for the qualified defined contribution plan was
$8 million
and the total accrual for the nonqualified deferred compensation plan was
$2 million
.
255
Brighthouse Financial, Inc.
Notes to the Consolidated and Combined Financial Statements (continued)
13. Income Tax
The provision for income tax was as follows:
|
Years Ended December 31,
|
|||||||||||
|
2017
|
2016
|
2015
|
|||||||||
|
(In millions)
|
|||||||||||
|
Current:
|
|||||||||||
|
Federal
|
$
|
406
|
|
$
|
(305
|
)
|
$
|
33
|
|
||
|
State and local
|
6
|
|
—
|
|
—
|
|
|||||
|
Foreign
|
18
|
|
—
|
|
—
|
|
|||||
|
Subtotal
|
430
|
|
(305
|
)
|
33
|
|
|||||
|
Deferred:
|
|||||||||||
|
Federal
|
(667
|
)
|
(1,461
|
)
|
310
|
|
|||||
|
State and local
|
—
|
|
—
|
|
—
|
|
|||||
|
Foreign
|
—
|
|
—
|
|
—
|
|
|||||
|
Subtotal
|
(667
|
)
|
(1,461
|
)
|
310
|
|
|||||
|
Provision for income tax expense (benefit)
|
$
|
(237
|
)
|
$
|
(1,766
|
)
|
$
|
343
|
|
||
The reconciliation of the income tax provision at the U.S. statutory rate to the provision for income tax as reported was as follows:
|
Years Ended December 31,
|
|||||||||||
|
2017
|
2016
|
2015
|
|||||||||
|
(In millions)
|
|||||||||||
|
Tax provision at U.S. statutory rate
|
$
|
(215
|
)
|
$
|
(1,647
|
)
|
$
|
511
|
|
||
|
Tax effect of:
|
|||||||||||
|
Excess loss account - Separation from MetLife (1)
|
1,088
|
|
—
|
|
—
|
|
|||||
|
Rate revaluation due to tax reform (2)
|
(803
|
)
|
—
|
|
—
|
|
|||||
|
Sale of subsidiaries
|
(138
|
)
|
—
|
|
—
|
|
|||||
|
Dividend received deduction
|
(130
|
)
|
(123
|
)
|
(144
|
)
|
|||||
|
Other tax credits
|
(30
|
)
|
(18
|
)
|
(13
|
)
|
|||||
|
Goodwill impairment
|
—
|
|
4
|
|
—
|
|
|||||
|
Other, net
|
(9
|
)
|
18
|
|
(11
|
)
|
|||||
|
Provision for income tax expense (benefit)
|
$
|
(237
|
)
|
$
|
(1,766
|
)
|
$
|
343
|
|
||
__________________
|
(1)
|
For the year ended December 31, 2017, the Company recognized a
$1.1 billion
non-cash charge to provision for income tax expense and corresponding capital contribution from MetLife. This tax obligation was in connection with the Separation and MetLife, Inc. is responsible for this obligation through a Tax Separation Agreement.
|
|
(2)
|
For the year ended December 31, 2017, the Company recognized a
$725 million
benefit in net income from remeasurement of net deferred tax liabilities in connection with the Tax Act discussed in Note 1. Additionally, as a result of the reduction in the statutory tax rate under the Tax Act, the liability to MetLife under the Tax Receivables Agreement (as defined below) was reduced by
$222 million
, which is included in other revenues and is non-taxable. As the Company completes the analysis of data relevant to the Tax Act, as well as interprets any additional guidance issued by the Internal Revenue Service (“IRS”), U.S. Department of the Treasury, or other relevant organizations, it may make adjustments to these amounts.
|
256
Brighthouse Financial, Inc.
Notes to the Consolidated and Combined Financial Statements (continued)
13. Income Tax (continued)
Deferred income tax represents the tax effect of the differences between the book and tax bases of assets and liabilities. Net deferred income tax assets and liabilities consisted of the following at:
|
December 31,
|
|||||||
|
2017
|
2016
|
||||||
|
(In millions)
|
|||||||
|
Deferred income tax assets:
|
|||||||
|
Tax credit carryforwards
|
$
|
202
|
|
$
|
199
|
|
|
|
Net operating loss carryforwards
|
422
|
|
—
|
|
|||
|
Employee benefit
|
3
|
|
54
|
|
|||
|
Intangibles
|
227
|
|
2
|
|
|||
|
Investments, including derivatives
|
302
|
|
347
|
|
|||
|
Other
|
95
|
|
72
|
|
|||
|
Total deferred income tax assets
|
1,251
|
|
674
|
|
|||
|
Less: valuation allowance
|
11
|
|
—
|
|
|||
|
Total net deferred income tax assets
|
1,240
|
|
674
|
|
|||
|
Deferred income tax liabilities:
|
|||||||
|
Policyholder liabilities and receivables
|
819
|
|
525
|
|
|||
|
Net unrealized investment gains
|
459
|
|
712
|
|
|||
|
DAC
|
889
|
|
1,493
|
|
|||
|
Total deferred income tax liabilities
|
2,167
|
|
2,730
|
|
|||
|
Net deferred income tax asset (liability)
|
$
|
(927
|
)
|
$
|
(2,056
|
)
|
|
At December 31, 2017, the Company had net operating loss carryforwards of approximately
$2.0 billion
and the Company had recorded a related deferred tax asset of
$422 million
which expires in years
2033
-
2037
.
The following table sets forth the general business credits, foreign tax credits, and other credit carryforwards for tax purposes at December 31, 2017.
|
Tax Credit Carryforwards
|
||||||||||||
|
General Business Credits
|
Foreign Tax Credits
|
Other
|
||||||||||
|
(In millions)
|
||||||||||||
|
Expiration
|
||||||||||||
|
2018-2022
|
$
|
—
|
|
$
|
—
|
|
$
|
—
|
|
|||
|
2023-2027
|
—
|
|
14
|
|
—
|
|
||||||
|
2028-2032
|
—
|
|
—
|
|
—
|
|
||||||
|
2033-2037
|
10
|
|
—
|
|
—
|
|
||||||
|
Indefinite
|
—
|
|
—
|
|
178
|
|
||||||
|
$
|
10
|
|
$
|
14
|
|
$
|
178
|
|
||||
The Company’s liability for unrecognized tax benefits may increase or decrease in the next 12 months. A reasonable estimate of the increase or decrease cannot be made at this time. However, the Company continues to believe that the ultimate resolution of the pending issues will not result in a material change to its combined and consolidated financial statements, although the resolution of income tax matters could impact the Company’s effective tax rate for a particular future period.
257
Brighthouse Financial, Inc.
Notes to the Consolidated and Combined Financial Statements (continued)
13. Income Tax (continued)
A reconciliation of the beginning and ending amount of unrecognized tax benefits was as follows:
|
|
Years Ended December 31,
|
||||||||||
|
|
2017
|
2016
|
2015
|
||||||||
|
|
(In millions)
|
||||||||||
|
Balance at January 1,
|
$
|
58
|
|
$
|
64
|
|
$
|
60
|
|
||
|
Additions for tax positions of prior years
|
—
|
|
2
|
|
5
|
|
|||||
|
Reductions for tax positions of prior years
|
(4
|
)
|
(9
|
)
|
—
|
|
|||||
|
Additions for tax positions of current year
|
3
|
|
5
|
|
3
|
|
|||||
|
Reductions for tax positions of current year
|
(2
|
)
|
—
|
|
—
|
|
|||||
|
Settlements with tax authorities
|
(32
|
)
|
(4
|
)
|
(4
|
)
|
|||||
|
Balance at December 31,
|
$
|
23
|
|
$
|
58
|
|
$
|
64
|
|
||
|
Unrecognized tax benefits that, if recognized would impact the effective rate
|
$
|
23
|
|
$
|
58
|
|
$
|
53
|
|
||
The Company classifies interest accrued related to unrecognized tax benefits in interest expense, included within other expenses, while penalties are included in income tax expense. Interest related to unrecognized tax benefits was not significant. The Company had no penalties for each of the years ended Decemb
er 31,
2017
,
2016
and
2015
.
The d
ividend received deduction
reduces the amount of dividend income subject to tax and is a significant component of the difference between the actual tax expense and expected amount determined using the federal statutory tax rate
. The Tax Act has changed the
d
ividend received deduction amount applicable to insurance companies to a
70%
company share and a
50%
dividend received deduction for eligible dividends.
For the years ended December 31,
2017
,
2016
, and
2015
, the Company recognized an income tax benefit of
$137 million
,
$101 million
and
$154 million
, respectively, related to the separate account d
ividend received deduction
. The
2017
benefit included a benefit of
$7 million
related to a true-up of the
2016
tax return. The
2016
benefit included an expense of
$21 million
related to a true-up of the
2015
tax return. The
2015
benefit included a benefit of
$11 million
related to a true-up of the
2014
tax return
.
The Company is under continuous examination by the IRS and other tax authorities in jurisdictions in which the Company has significant business operations. The income tax years under examination vary by jurisdiction and subsidiary. The Company is no longer subject to U.S. federal, state or local income tax examinations for years prior to 2007, except for 2006 where the IRS disallowance relates to policyholder liability deductions and the Company is engaged with IRS appeals. Management believes it has established adequate tax liabilities, and final resolution of the audit for the years 2006 and forward is not expected to have a material impact on the Company’s combined and consolidated financial statements.
Tax Sharing Agreements
For the periods prior to the Separation from MetLife, Brighthouse Financial, Inc. and its subsidiaries will file a consolidated U.S. life and non-life federal income tax return in accordance with the provisions of the Internal Revenue Code of 1986, as amended (the “Code”). Current taxes (and the benefits of tax attributes such as losses) are allocated to Brighthouse Financial, Inc., and its includable subsidiaries, under the consolidated tax return regulations and a tax sharing agreement with MetLife. This tax sharing agreement states that federal taxes will be computed on a modified separate return basis with benefits for losses.
For periods after the Separation, Brighthouse Financial, Inc. and its subsidiaries entered into two separate tax sharing agreements. Brighthouse Life Insurance Company and any directly owned life insurance and reinsurance subsidiaries (including BHNY and BRCD) entered in a tax sharing agreement to join a life consolidated federal income tax return. Brighthouse Financial, Inc. and its includable subsidiaries entered into a tax sharing agreement to join a nonlife consolidated federal income tax return. NELICO and the nonlife subsidiaries of Brighthouse Life Insurance Company will file their own U.S. federal income tax returns. The tax sharing agreements state that federal taxes are generally allocated to the Company as if each entity were filing its own separate company tax return, except that net operating losses and certain other tax attributes are characterized as realized (or realizable) when those tax attributes are realized (or realizable) by the Company.
258
Brighthouse Financial, Inc.
Notes to the Consolidated and Combined Financial Statements (continued)
13. Income Tax (continued)
Related Party Income Tax Transactions
In connection with the Separation, the Company entered into a tax receivables agreement (the “Tax Receivables Agreement”) with MetLife that provides MetLife with the right to receive as partial consideration for its contribution of assets to Brighthouse Financial, Inc. future payments from Brighthouse Financial, Inc., equal to
86%
of the amount of cash savings, if any, in U.S. federal income tax that Brighthouse Financial, Inc. and its subsidiaries actually, or are deemed to, realize as a result of the utilization of Brighthouse Financial, Inc. and its subsidiaries’ net operating losses, capital losses, tax basis and amortization or depreciation deductions in respect of certain tax benefits it may realize as a result of certain transactions involved in the Separation. In the third quarter of 2017, in connection with the Tax Receivables Agreement, the Company recorded a payable to MetLife of
$553 million
in other liabilities, offset with a decrease to additional paid-in capital.
As a result of the reduction in the statutory tax rates under the Tax Act, the liability to MetLife under the Tax Receivables Agreement was reduced to
$331 million
at December 31, 2017.
The Company also entered into a tax separation agreement with MetLife (the “Tax Separation Agreement”). Among other things, the Tax Separation Agreement governs the allocation between MetLife and us of the responsibility for the taxes of the MetLife group. The Tax Separation Agreement also allocates rights, obligations and responsibilities in connection with certain administrative matters relating to the preparation of tax returns and control of tax audits and other proceedings relating to taxes. In October 2017, MetLife paid
$729 million
to Brighthouse under the Tax Separation Agreement. At December 31, 2017, the current income tax recoverable included
$873 million
related to this agreement.
14. Earnings Per Common Share
The following table sets forth the calculation of basic earnings per share (“EPS”) based on net income (loss) divided by the basic weighted average number of common shares.
|
Years Ended December 31,
|
|||||||||||
|
2017
|
Pro forma
2016 (1)
|
Pro forma
2015 (1)
|
|||||||||
|
(In millions, except share and per share data)
|
|||||||||||
|
Net income (loss)
|
$
|
(378
|
)
|
$
|
(2,939
|
)
|
$
|
1,119
|
|
||
|
Weighted average common shares outstanding:
|
|||||||||||
|
Basic
|
119,773,106
|
|
119,773,106
|
|
119,773,106
|
|
|||||
|
Earnings per common share:
|
|||||||||||
|
Basic
|
$
|
(3.16
|
)
|
$
|
(24.54
|
)
|
$
|
9.34
|
|
||
__________________
|
(1)
|
On August 4, 2017, following the completion of the Separation,
119,773,106
shares of Brighthouse Financial, Inc. common stock were outstanding. This number of shares remained outstanding at December 31, 2017 and is utilized to calculate EPS for the years ended December 31, 2016 and 2015.
|
259
Brighthouse Financial, Inc.
Notes to the Consolidated and Combined Financial Statements (continued)
15. Contingencies, Commitments and Guarantees
Contingencies
Litigation
The Company is a defendant in a number of litigation matters. In some of the matters, large and/or indeterminate amounts, including punitive and treble damages, are sought. Modern pleading practice in the U.S. permits considerable variation in the assertion of monetary damages or other relief. Jurisdictions may permit claimants not to specify the monetary damages sought or may permit claimants to state only that the amount sought is sufficient to invoke the jurisdiction of the trial court. In addition, jurisdictions may permit plaintiffs to allege monetary damages in amounts well exceeding reasonably possible verdicts in the jurisdiction for similar matters. This variability in pleadings, together with the actual experience of the Company in litigating or resolving through settlement numerous claims over an extended period of time, demonstrates to management that the monetary relief which may be specified in a lawsuit or claim bears little relevance to its merits or disposition value.
Due to the vagaries of litigation, the outcome of a litigation matter and the amount or range of potential loss at particular points in time may normally be difficult to ascertain. Uncertainties can include how fact finders will evaluate documentary evidence and the credibility and effectiveness of witness testimony, and how trial and appellate courts will apply the law in the context of the pleadings or evidence presented, whether by motion practice, or at trial or on appeal. Disposition valuations are also subject to the uncertainty of how opposing parties and their counsel will themselves view the relevant evidence and applicable law.
The Company establishes liabilities for litigation and regulatory loss contingencies when it is probable that a loss has been incurred and the amount of the loss can be reasonably estimated. It is possible that some matters could require the Company to pay damages or make other expenditures or establish accruals in amounts that could not be estimated at December 31,
2017
.
Matters as to Which an Estimate Can Be Made
For some loss contingency matters, the Company is able to estimate a reasonably possible range of loss. For such matters where a loss is believed to be reasonably possible, but not probable, no accrual has been made. As of December 31,
2017
, the Company estimates the aggregate range of reasonably possible losses in excess of amounts accrued for these matters to be
$0
to
$10 million
.
Matters as to Which an Estimate Cannot Be Made
For other matters, the Company is not currently able to estimate the reasonably possible loss or range of loss. The Company is often unable to estimate the possible loss or range of loss until developments in such matters have provided sufficient information to support an assessment of the range of possible loss, such as quantification of a damage demand from plaintiffs, discovery from other parties and investigation of factual allegations, rulings by the court on motions or appeals, analysis by experts, and the progress of settlement negotiations. On a quarterly and annual basis, the Company reviews relevant information with respect to litigation contingencies and updates its accruals, disclosures and estimates of reasonably possible losses or ranges of loss based on such reviews.
Diversified Lending Group Litigations
Hartshorne v. NELICO, et al. (Los Angeles County Superior Court, filed March 25, 2015)
Plaintiffs have named NELICO, MetLife, Inc. and MetLife Securities, Inc. in twelve related lawsuits in California state court alleging various causes of action including multiple negligence and statutory claims relating to the Diversified Lending Group Ponzi scheme. All but one of the plaintiffs have resolved their claims with the defendants. The Company intends to vigorously defend the remaining claim.
Sales Practices Claims
Over the past several years, the Company has faced claims and regulatory inquiries and investigations, alleging improper marketing or sales of individual life insurance policies, annuities, mutual funds or other products. The Company continues to defend vigorously against the claims in these matters. The Company believes adequate provision has been made in its combined and consolidated financial statements for all probable and reasonably estimable losses for sales practices matters.
260
Brighthouse Financial, Inc.
Notes to the Consolidated and Combined Financial Statements (continued)
15. Contingencies, Commitments and Guarantees (continued)
Unclaimed Property Litigation
Total Asset Recovery Services, LLC on its own behalf and on behalf of the State of New York v. Brighthouse Financial, Inc. et al (Supreme Court, New York County, NY, second amended complaint filed November 17, 2017). Total Asset Recovery Services, LLC. (the “Relator”) has brought a qui tam action against Brighthouse Financial, Inc. and its subsidiaries and affiliates under the New York False Claims Act seeking to recover damages on behalf of the State of New York. The action originally was filed under seal on or about December 3, 2010. The State of New York declined to intervene in the action, and the Relator is now prosecuting the action. The Relator alleges that from on or about April 1, 1986 and continuing annually through on or about September 10, 2017, the defendants violated New York State Finance Law Section 189 (1) (g) by failing to timely report and deliver unclaimed insurance property to the State of New York. The Relator is seeking, among other things, treble damages, penalties, expenses and attorneys’ fees and prejudgment interest. No specific dollar amount of damages is specified by the Relator who also is suing numerous insurance companies and John Doe defendants. The Brighthouse defendants intend to defend this action vigorously.
Summary
Various litigation, claims and assessments against the Company, in addition to those discussed previously and those otherwise provided for in the Company’s combined and consolidated financial statements, have arisen in the course of the Company’s business, including, but not limited to, in connection with its activities as an insurer, investor and taxpayer. Further, state insurance regulatory authorities and other federal and state authorities regularly make inquiries and conduct investigations concerning the Company’s compliance with applicable insurance and other laws and regulations.
It is not possible to predict the ultimate outcome of all pending investigations and legal proceedings. In some of the matters referred to previously, large and/or indeterminate amounts, including punitive and treble damages, are sought. Although in light of these considerations it is possible that an adverse outcome in certain cases could have a material effect upon the Company’s financial position, based on information currently known by the Company’s management, in its opinion, the outcomes of such pending investigations and legal proceedings are not likely to have such an effect. However, given the large and/or indeterminate amounts sought in certain of these matters and the inherent unpredictability of litigation, it is possible that an adverse outcome in certain matters could, from time to time, have a material effect on the Company’s combined and consolidated net income or cash flows in particular quarterly or annual periods.
Insolvency Assessments
Most of the jurisdictions in which the Company is admitted to transact business require insurers doing business within the jurisdiction to participate in guaranty associations, which are organized to pay contractual benefits owed pursuant to insurance policies issued by impaired, insolvent or failed insurers. These associations levy assessments, up to prescribed limits, on all member insurers in a particular state on the basis of the proportionate share of the premiums written by member insurers in the lines of business in which the impaired, insolvent or failed insurer engaged. Some states permit member insurers to recover assessments paid through full or partial premium tax offsets.
Assets and liabilities held for insolvency assessments were as follows:
|
December 31,
|
|||||||
|
2017
|
2016
|
||||||
|
(In millions)
|
|||||||
|
Other Assets:
|
|||||||
|
Premium tax offset for future discounted and undiscounted assessments
|
$
|
14
|
|
$
|
13
|
|
|
|
Premium tax offsets currently available for paid assessments
|
5
|
|
9
|
|
|||
|
Total
|
$
|
19
|
|
$
|
22
|
|
|
|
Other Liabilities:
|
|||||||
|
Insolvency assessments
|
$
|
18
|
|
$
|
17
|
|
|
261
Brighthouse Financial, Inc.
Notes to the Consolidated and Combined Financial Statements (continued)
15. Contingencies, Commitments and Guarantees (continued)
Commitments
Mortgage Loan Commitments
The Company commits to lend funds under mortgage loan commitments. The amounts of these mortgage loan commitments were
$388 million
and
$348 million
at December 31,
2017
and
2016
, respectively.
Commitments to Fund Partnership Investments, Bank Credit Facilities, Bridge Loans and Private Corporate Bond Investments
The Company commits to fund partnership investments and to lend funds under bank credit facilities and private corporate bond investments. The amounts of these unfunded commitments were
$1.4 billion
and
$1.3 billion
at December 31,
2017
and
2016
, respectively.
Other Commitments
The Company had entered into collateral arrangements with former affiliates, which required the transfer of collateral in connection with secured demand notes. These arrangements expired during the first quarter of 2017 and the Company is no longer transferring collateral to custody accounts. At December 31,
2016
, the Company had agreed to fund up to
$20 million
of cash upon the request by these former affiliates and had transferred collateral consisting of various securities with a fair market value of
$25 million
to custody accounts to secure the demand notes. Each of these former affiliates was permitted by contract to sell or re-pledge this collateral.
Guarantees
In the normal course of its business, the Company has provided certain indemnities, guarantees and commitments to third parties such that it may be required to make payments now or in the future. In the context of acquisition, disposition, investment and other transactions, the Company has provided indemnities and guarantees, including those related to tax, environmental and other specific liabilities and other indemnities and guarantees that are triggered by, among other things, breaches of representations, warranties or covenants provided by the Company. In addition, in the normal course of business, the Company provides indemnifications to counterparties in contracts with triggers similar to the foregoing, as well as for certain other liabilities, such as third-party lawsuits. These obligations are often subject to time limitations that vary in duration, including contractual limitations and those that arise by operation of law, such as applicable statutes of limitation. In some cases, the maximum potential obligation under the indemnities and guarantees is subject to a contractual limitation ranging from less than
$1 million
to
$203 million
, with a cumulative maximum of
$209 million
, while in other cases such limitations are not specified or applicable. Since certain of these obligations are not subject to limitations, the Company does not believe that it is possible to determine the maximum potential amount that could become due under these guarantees in the future. Management believes that it is unlikely the Company will have to make any material payments under these indemnities, guarantees, or commitments.
In addition, the Company indemnifies its directors and officers as provided in its charters and by-laws. Also, the Company indemnifies its agents for liabilities incurred as a result of their representation of the Company’s interests. Since these indemnities are generally not subject to limitation with respect to duration or amount, the Company does not believe that it is possible to determine the maximum potential amount that could become due under these indemnities in the future.
The Company’s recorded liabilities were
$2 million
at both December 31,
2017
and
2016
for indemnities, guarantees and commitments.
16. Related Party Transactions
The Company had not historically operated as a standalone business prior to the Separation, and as a result had various existing arrangements with MetLife for services necessary to conduct its activities. Subsequent to the Separation, certain of such services continued, as provided for under a master service agreement and various transition services agreements entered into in connection with the Separation.
262
Brighthouse Financial, Inc.
Notes to the Consolidated and Combined Financial Statements (continued)
16. Related Party Transactions (continued)
Non-Broker-Dealer Transactions
The following table summarizes income and expense from transactions with MetLife (excluding broker-dealer transactions) for the years indicated:
|
Years Ended December 31,
|
|||||||||||
|
2017
|
2016
|
2015
|
|||||||||
|
(In millions)
|
|||||||||||
|
Income
|
$
|
(606
|
)
|
$
|
(280
|
)
|
$
|
(178
|
)
|
||
|
Expense
|
$
|
378
|
|
$
|
332
|
|
$
|
802
|
|
||
The following table summarizes assets and liabilities from transactions with MetLife (excluding broker-dealer transactions) at:
|
December 31,
|
|||||||
|
2017
|
2016
|
||||||
|
(In millions)
|
|||||||
|
Assets
|
$
|
2,907
|
|
$
|
4,805
|
|
|
|
Liabilities
|
$
|
2,178
|
|
$
|
7,763
|
|
|
The material arrangements between the Company and MetLife are as follows:
Reinsurance Agreements
The Company has reinsurance agreements with certain of MetLife, Inc.’s subsidiaries. See
Note 5
for further discussion of the related party reinsurance agreements.
Financing Arrangements
Prior to the Separation, the Company had surplus notes outstanding to MetLife, Inc., as well as a collateral financing arrangement with a third party that involved MetLife, Inc. See
Note 9
for more information.
Investment Transactions
Prior to the Separation, the Company had extended loans to certain subsidiaries of MetLife, Inc. Additionally, in the ordinary course of business, the Company had previously transferred invested assets, primarily consisting of fixed maturity securities, to and from former affiliates. See
Note 6
for further discussion of the related party investment transactions.
Shared Services and Overhead Allocations
MetLife provides the Company certain services, which include, but are not limited to, treasury, financial planning and analysis, legal, human resources, tax planning, internal audit, financial reporting, and information technology. In 2017, the Company is charged for these services through a transition services agreement and allocated to the legal entities and products within the Company. When specific identification to a particular legal entity and/or product is not practicable, an allocation methodology based on various performance measures or activity-based costing, such as sales, new policies/contracts issued, reserves, and in-force policy counts is used. The bases for such charges are modified and adjusted by management when necessary or appropriate to reflect fairly and equitably the actual incidence of cost incurred by the Company and/or affiliate. Management believes that the methods used to allocate expenses under these arrangements are reasonable. Expenses incurred with MetLife related to these arrangements, recorded in other expenses, were
$390 million
,
$868 million
and
$1.1 billion
for the years ended
December 31, 2017
,
2016
and
2015
, respectively.
Employee Matters Agreement
On August 4, 2017, an employee matters agreement (“EMA”) between Brighthouse Financial, Inc. and MetLife, Inc. became effective. Under this agreement, MetLife, Inc. has agreed to reimburse Brighthouse Financial, Inc. on an annual basis for any and all payments of benefits required by underfunded plans made by any legal entity owned by Brighthouse Financial, Inc. related to certain NELICO employee benefit plan liabilities. At December 31, 2017, the Company’s receivable from MetLife, Inc. under the EMA was
$192 million
, and is included in premiums, reinsurance and other receivables.
263
Brighthouse Financial, Inc.
Notes to the Consolidated and Combined Financial Statements (continued)
16. Related Party Transactions (continued)
Broker-Dealer Transactions
Beginning in March 2017, Brighthouse Securities, LLC, a registered broker-dealer affiliate, began distributing certain of the Company’s existing and future variable insurance products, and the MetLife broker-dealers discontinued such distributions. Prior to March 2017, the Company recognized related party revenues and expenses arising from transactions with MetLife broker-dealers that previously sold the Company’s variable annuity and life products. The related party expense for the Company was commissions collected on the sale of variable products by the Company and passed through to the broker-dealer. The related party revenue for the Company was fee income from trusts and mutual funds whose shares serve as investment options of policyholders of the Company.
The following table summarizes income and expense from transactions with MetLife broker-dealers for the years indicated:
|
Years Ended December 31,
|
|||||||||||
|
2017
|
2016
|
2015
|
|||||||||
|
(In millions)
|
|||||||||||
|
Fee income
|
$
|
43
|
|
$
|
216
|
|
$
|
235
|
|
||
|
Commission expense
|
$
|
129
|
|
$
|
649
|
|
$
|
652
|
|
||
The following table summarizes assets and liabilities from transactions with MetLife broker-dealers at:
|
December 31,
|
|||||||
|
2017
|
2016
|
||||||
|
(In millions)
|
|||||||
|
Fee income receivables
|
$
|
—
|
|
$
|
21
|
|
|
|
Secured demand notes
|
$
|
—
|
|
$
|
20
|
|
|
17. Quarterly Results of Operations (Unaudited)
The unaudited quarterly results of operations for
2017
and
2016
are summarized in the table below:
|
Three Months Ended
|
|||||||||||||||
|
March 31,
|
June 30,
|
September 30,
|
December 31,
|
||||||||||||
|
(In millions, except per share data)
|
|||||||||||||||
|
2017
|
|||||||||||||||
|
Total revenues
|
$
|
965
|
|
$
|
2,025
|
|
$
|
1,972
|
|
$
|
1,880
|
|
|||
|
Total expenses
|
$
|
1,555
|
|
$
|
1,704
|
|
$
|
2,096
|
|
$
|
2,102
|
|
|||
|
Net income (loss)
|
$
|
(349
|
)
|
$
|
246
|
|
$
|
(943
|
)
|
$
|
668
|
|
|||
|
Basic earnings per common share (1)
|
$
|
(2.91
|
)
|
$
|
2.05
|
|
$
|
(7.87
|
)
|
$
|
5.57
|
|
|||
|
2016
|
|||||||||||||||
|
Total revenues
|
$
|
2,389
|
|
$
|
(584
|
)
|
$
|
1,766
|
|
$
|
(553
|
)
|
|||
|
Total expenses
|
$
|
1,825
|
|
$
|
1,656
|
|
$
|
2,018
|
|
$
|
2,224
|
|
|||
|
Net income (loss)
|
$
|
407
|
|
$
|
(1,423
|
)
|
$
|
(158
|
)
|
$
|
(1,765
|
)
|
|||
|
Basic earnings per common share (1)
|
$
|
3.40
|
|
$
|
(11.88
|
)
|
$
|
(1.32
|
)
|
$
|
(14.74
|
)
|
|||
__________________
(1) See
Note 14
for additional information on the calculation of EPS.
264
Brighthouse Financial, Inc.
Schedule I
Consolidated and Combined Summary of Investments —
Other Than Investments in Related Parties
December 31,
2017
(In millions)
|
Types of Investments
|
Cost or
Amortized Cost (1) |
Estimated Fair Value
|
Amount at
Which Shown on Balance Sheet |
||||||||
|
Fixed maturity securities:
|
|||||||||||
|
Bonds:
|
|||||||||||
|
U.S. government and agency securities
|
$
|
14,548
|
|
$
|
16,292
|
|
$
|
16,292
|
|
||
|
State and political subdivision securities
|
3,635
|
|
4,181
|
|
4,181
|
|
|||||
|
Public utilities
|
2,145
|
|
2,447
|
|
2,447
|
|
|||||
|
Foreign government securities
|
1,152
|
|
1,309
|
|
1,309
|
|
|||||
|
All other corporate bonds
|
25,510
|
|
27,190
|
|
27,190
|
|
|||||
|
Total bonds
|
46,990
|
|
51,419
|
|
51,419
|
|
|||||
|
Mortgage-backed and asset-backed securities
|
12,945
|
|
13,229
|
|
13,229
|
|
|||||
|
Redeemable preferred stock
|
238
|
|
343
|
|
343
|
|
|||||
|
Total fixed maturity securities
|
60,173
|
|
$
|
64,991
|
|
64,991
|
|
||||
|
Equity securities:
|
|||||||||||
|
Non-redeemable preferred stock
|
129
|
|
$
|
138
|
|
138
|
|
||||
|
Common stock:
|
|||||||||||
|
Industrial, miscellaneous and all other
|
83
|
|
92
|
|
92
|
|
|||||
|
Public utilities
|
—
|
|
2
|
|
2
|
|
|||||
|
Total equity securities
|
212
|
|
$
|
232
|
|
232
|
|
||||
|
Mortgage loans
|
10,742
|
|
10,742
|
|
|||||||
|
Policy loans
|
1,523
|
|
1,523
|
|
|||||||
|
Real estate joint ventures
|
433
|
|
433
|
|
|||||||
|
Other limited partnership interests
|
1,669
|
|
1,669
|
|
|||||||
|
Short-term investments
|
312
|
|
312
|
|
|||||||
|
Other invested assets
|
2,436
|
|
2,436
|
|
|||||||
|
Total investments
|
$
|
77,500
|
|
$
|
82,338
|
|
|||||
______________
|
(1)
|
Cost or amortized cost for fixed maturity securities and mortgage loans represents original cost reduced by repayments, valuation allowances and impairments from other-than-temporary declines in estimated fair value that are charged to earnings and adjusted for amortization of premiums or accretion of discounts; for equity securities, cost represents original cost reduced by impairments from other-than-temporary declines in estimated fair value; for real estate joint ventures and other limited partnership interests, cost represents original cost reduced for impairments or original cost adjusted for equity in earnings and distributions.
|
265
Brighthouse Financial, Inc.
Schedule II
Condensed Financial Information
(Parent Company Only)
December 31,
2017
and
2016
(In thousands, except share and per share data)
|
2017
|
2016
|
|||||||
|
Condensed Balance Sheets
|
||||||||
|
Assets
|
||||||||
|
Investments:
|
||||||||
|
Fixed maturity securities available-for-sale, at estimated fair value (amortized cost: $238,948 and $0, respectively)
|
$
|
236,946
|
|
$
|
—
|
|
||
|
Investment in subsidiaries
|
17,810,226
|
|
—
|
|
||||
|
Total investments
|
18,047,172
|
|
—
|
|
||||
|
Cash and cash equivalents
|
325,528
|
|
1
|
|
||||
|
Accrued investment income
|
945
|
|
—
|
|
||||
|
Receivable from former affiliate
|
191,570
|
|
—
|
|
||||
|
Current income tax recoverable
|
20,714
|
|
306
|
|
||||
|
Other assets
|
8,205
|
|
15,870
|
|
||||
|
Total assets
|
$
|
18,594,134
|
|
$
|
16,177
|
|
||
|
Liabilities and Stockholders’ Equity
|
||||||||
|
Liabilities
|
||||||||
|
Long-term and short-term debt
|
$
|
3,702,071
|
|
$
|
—
|
|
||
|
Payable to former affiliate
|
333,148
|
|
16,745
|
|
||||
|
Deferred income tax liability
|
33,166
|
|
—
|
|
||||
|
Other liabilities
|
10,083
|
|
—
|
|
||||
|
Total liabilities
|
4,078,468
|
|
16,745
|
|
||||
|
Stockholders’ Equity
|
||||||||
|
Common stock, par value $0.01 per share; 1,000,000,000 and 100,000 shares authorized, respectively; 119,773,106 and 100,000 shares issued and outstanding, respectively
|
1,198
|
|
1
|
|
||||
|
Additional paid-in capital
|
12,432,449
|
|
—
|
|
||||
|
Retained earnings (deficit)
|
405,853
|
|
(569
|
)
|
||||
|
Accumulated other comprehensive income (loss)
|
1,676,166
|
|
—
|
|
||||
|
Total stockholders’ equity
|
14,515,666
|
|
(568
|
)
|
||||
|
Total liabilities and stockholders’ equity
|
$
|
18,594,134
|
|
$
|
16,177
|
|
||
See accompanying notes to the condensed financial information.
266
Brighthouse Financial, Inc.
Schedule II
Condensed Financial Information (continued)
(Parent Company Only)
For the Year Ended December 31,
2017
, and
For the Period from August 1,
2016
(Date of Inception) to December 31, 2016
(In thousands)
|
2017
|
2016
|
|||||||
|
Condensed Statements of Operations
|
||||||||
|
Revenues
|
||||||||
|
Equity in earnings (losses) of subsidiaries
|
$
|
(565,979
|
)
|
$
|
—
|
|
||
|
Net investment income
|
5,573
|
|
—
|
|
||||
|
Other revenues
|
221,834
|
|
—
|
|
||||
|
Net investment gains (losses)
|
(237
|
)
|
—
|
|
||||
|
Net derivative gains (losses)
|
1,729
|
|
—
|
|
||||
|
Total revenues
|
(337,080
|
)
|
—
|
|
||||
|
Expenses
|
||||||||
|
Credit facility fees
|
16,014
|
|
875
|
|
||||
|
Other expenses
|
75,921
|
|
—
|
|
||||
|
Total expenses
|
91,935
|
|
875
|
|
||||
|
Income (loss) before provision for income tax
|
(429,015
|
)
|
(875
|
)
|
||||
|
Provision for income tax expense (benefit)
|
(50,897
|
)
|
(306
|
)
|
||||
|
Net income (loss)
|
$
|
(378,118
|
)
|
$
|
(569
|
)
|
||
|
Comprehensive income (loss)
|
$
|
33,000
|
|
$
|
(569
|
)
|
||
See accompanying notes to the condensed financial information.
267
Brighthouse Financial, Inc.
Schedule II
Condensed Financial Information (continued)
(Parent Company Only)
For the Year Ended
December 31, 2017
, and
For the Period from August 1, 2016 (Date of Inception) to December 31,
2016
(In thousands)
|
2017
|
2016
|
|||||||
|
Condensed Statements of Cash Flows
|
||||||||
|
Cash flows from operating activities
|
||||||||
|
Net income (loss)
|
$
|
(378,118
|
)
|
$
|
(569
|
)
|
||
|
Equity in (earnings) losses of subsidiaries
|
565,979
|
|
—
|
|
||||
|
Distribution from subsidiary
|
50,000
|
|
—
|
|
||||
|
Other, net
|
(252,310
|
)
|
569
|
|
||||
|
Net cash provided by (used in) operating activities
|
(14,449
|
)
|
|
—
|
|
|||
|
Cash flows from investing activities
|
||||||||
|
Sales of fixed maturity securities
|
509,814
|
|
—
|
|
||||
|
Purchases of fixed maturity securities
|
(748,972
|
)
|
—
|
|
||||
|
Capital contributions to subsidiaries
|
(1,300,000
|
)
|
—
|
|
||||
|
Net cash provided by (used in) investing activities
|
(1,539,158
|
)
|
|
—
|
|
|||
|
Cash flows from financing activities
|
||||||||
|
Long-term and short-term debt issued
|
3,724,375
|
|
—
|
|
||||
|
Debt issuance costs
|
(39,187
|
)
|
—
|
|
||||
|
Issuance of common stock
|
—
|
|
1
|
|
||||
|
Distribution to MetLife, Inc.
|
(1,798,000
|
)
|
—
|
|
||||
|
Credit facility fees
|
(8,054
|
)
|
—
|
|
||||
|
Net cash provided by (used in) financing activities
|
1,879,134
|
|
|
1
|
|
|||
|
Change in cash and cash equivalents
|
325,527
|
|
|
1
|
|
|||
|
Cash and cash equivalents, beginning of period
|
1
|
|
—
|
|
||||
|
Cash and cash equivalents, end of period
|
$
|
325,528
|
|
|
$
|
1
|
|
|
|
Supplemental disclosures of cash flow information
|
||||||||
|
Net cash paid (received) for:
|
||||||||
|
Interest
|
$
|
67,135
|
|
$
|
—
|
|
||
|
Income tax:
|
||||||||
|
Cash received from MetLife, Inc. for income tax
|
$
|
(40
|
)
|
$
|
—
|
|
||
|
Income tax paid by Brighthouse Financial, Inc.
|
888
|
|
—
|
|
||||
|
Net cash paid (received) for income tax
|
$
|
848
|
|
$
|
—
|
|
||
See accompanying notes to the condensed financial information.
268
Brighthouse Financial, Inc.
Schedule II
Notes to the Condensed Financial Information
(Parent Company Only)
1. Basis of Presentation
The condensed financial information of Brighthouse Financial, Inc. (the “Parent Company”) should be read in conjunction with the consolidated financial statements of Brighthouse Financial, Inc. and its subsidiaries and the notes thereto (the “Consolidated Financial Statements”). These condensed unconsolidated financial statements reflect the results of operations, financial position and cash flows for Brighthouse Financial, Inc. Investments in subsidiaries are accounted for using the equity method of accounting.
The preparation of these condensed unconsolidated financial statements in conformity with GAAP requires management to adopt accounting policies and make certain estimates and assumptions. The most important of these estimates and assumptions relate to the fair value measurements, identifiable intangible assets and the provision for potential losses that may arise from litigation and regulatory proceedings and tax audits, which may affect the amounts reported in the condensed unconsolidated financial statements and accompanying notes. Actual results could differ from these estimates.
2. Investment in Subsidiaries
Contribution of Brighthouse Holdings, LLC
On July 28, 2017, MetLife, Inc. contributed to Brighthouse Financial, Inc. all of the common interests in BH Holdings in exchange for (i) the assumption by Brighthouse Financial, Inc. of certain liabilities of MetLife, Inc. including, among other things, liabilities relating to the operation of Brighthouse Financial, Inc.’s business (including from periods prior to the separation) and certain liabilities related to Brighthouse Financial, Inc.’s employees, liabilities relating to Brighthouse Financial, Inc.’s assets and outstanding contractual and non-contractual relationships with customers, vendors and others (including obligations under leases for Brighthouse Financial, Inc.’s corporate headquarters in Charlotte, North Carolina, as well as certain other locations), and liabilities relating to certain historical operations of MetLife, Inc.; (ii) a cash distribution; (iii) the issuance of additional shares of Brighthouse Financial, Inc. common stock; and (iv) the entry into certain other agreements between MetLife, Inc. and Brighthouse Financial, Inc.
During the year ended December 31, 2017, Brighthouse Financial, Inc. paid cash capital contributions of
$1.3 billion
to BH Holdings.
During the year ended December 31, 2017, Brighthouse Financial, Inc. received a
$50 million
cash distribution from BH Holdings.
3. Long-term and Short-term Debt
Long-term and short-term debt outstanding was as follows:
|
December 31,
|
||||||||||||
|
Interest Rate
|
Maturity
|
2017
|
2016
|
|||||||||
|
(In millions)
|
||||||||||||
|
Senior notes — unaffiliated (1)
|
3.70%
|
2027
|
$
|
1,489
|
|
$
|
—
|
|
||||
|
Senior notes — unaffiliated (1)
|
4.70%
|
2047
|
1,477
|
|
—
|
|
||||||
|
Term loan — unaffiliated
|
LIBOR plus 1.5%
|
2019
|
600
|
|
—
|
|
||||||
|
Total long-term debt
|
3,566
|
|
—
|
|
||||||||
|
Short-term intercompany loans
|
136
|
|
—
|
|
||||||||
|
Total long-term and short-term debt
|
$
|
3,702
|
|
$
|
—
|
|
||||||
_______________
|
(1)
|
Includes unamortized debt issuance costs and debt discount totaling
$34 million
for the senior notes due 2027 and 2047 on a combined basis at December 31, 2017.
|
Interest expense related to long-term and short-term debt of
$75 million
for the year ended
December 31, 2017
is included in other expenses.
269
Brighthouse Financial, Inc.
Schedule II
Notes to the Condensed Financial Information (continued)
(Parent Company Only)
The aggregate maturities of long-term and short-term debt at December 31,
2017
for the next five years and thereafter are
$136 million
in 2018,
$600 million
in 2019,
$0
in each of 2020, 2021 and 2022, and
$3.0 billion
thereafter.
Senior Notes
See Note
9
of the Notes to the Consolidated and Combined Financial Statements for information regarding the unaffiliated senior notes.
Credit Facilities
See Note
9
of the Notes to the Consolidated and Combined Financial Statements for information regarding Brighthouse Financial, Inc.’s credit facilities, including the unaffiliated term loan.
At
December 31, 2016
, Brighthouse Financial, Inc. owed MetLife, Inc.
$17 million
for debt issuance costs and credit facility fees paid on Brighthouse Financial Inc.’s behalf, which is included in payable to former affiliate. Brighthouse Financial, Inc. reimbursed MetLife, Inc. for such costs during 2017.
Short-term Intercompany Loans
On October 23, 2017, Brighthouse Financial, Inc., as borrower, entered into a short-term intercompany loan agreement with certain of its non-insurance subsidiaries, as lenders, for the purposes of facilitating the management of the available cash of the borrower and the lenders on a consolidated basis. Each loan entered into under this intercompany loan agreement has a term not more than 364 days and bears interest on the unpaid principal amount at a variable rate, payable monthly.
During the fourth quarter of 2017, Brighthouse Financial, Inc. borrowed
$80 million
aggregate principal amount from Brighthouse Services, and
$56 million
aggregate principal amount from BH Holdings. The weighted average interest rate on these short-term intercompany loans was
0.73%
at
December 31, 2017
and interest expense was not significant for the year ended December 31, 2017.
Intercompany Liquidity Facilities
We have established an intercompany liquidity facility with certain of our insurance and non-insurance company subsidiaries to provide short-term liquidity within and across the combined group of companies. Under the facility, which is comprised of a series of revolving loan agreements among Brighthouse Financial, Inc. and its participating subsidiaries, each company may lend to or borrow from each other, subject to certain maximum limits for a term not more than 364 days. For each insurance subsidiary, the borrowing and lending limit is
3%
of the respective insurance subsidiary’s statutory admitted assets as of the previous year end. For Brighthouse Financial, Inc. and each non-insurance subsidiary, the borrowing and lending limit is based on a formula tied to the statutory admitted assets of the respective non-insurance subsidiaries. Brighthouse Financial, Inc. made no loans to, and received no borrowings from, any of its subsidiaries under this liquidity facility during the year ended
December 31, 2017
.
4. Income Tax
In connection with the Separation, the Company entered into a tax receivable agreement (the “Tax Receivables Agreement”) with MetLife that provides MetLife with the right to receive as partial consideration for its contribution of assets to Brighthouse Financial, Inc. future payments from Brighthouse Financial, Inc., equal to
86%
of the amount of cash savings, if any, in U.S. federal income tax that Brighthouse Financial, Inc. and its subsidiaries actually, or are deemed to, realize as a result of the utilization of Brighthouse Financial, Inc. and its subsidiaries’ net operating losses, capital losses, tax basis and amortization or depreciation deductions in respect of certain tax benefits it may realize as a result of certain transactions involved in the Separation. In the third quarter of 2017, in connection with the Tax Receivables Agreement, the Company recorded a payable to MetLife of
$553 million
in other liabilities, offset with a decrease to additional paid-in capital.
In the fourth quarter of 2017, as a result of the reduction in the statutory tax rates under the Tax Act, the liability to MetLife under the Tax Receivables Agreement was reduced by
$222 million
, which is included in other revenues.
At December 31, 2017 and 2016, Brighthouse Financial, Inc. owed MetLife
$333 million
and
$0
, respectively, included in payable to former affiliate, primarily in connection with the Tax Receivables Agreement.
270
Brighthouse Financial, Inc.
Schedule II
Notes to the Condensed Financial Information — (continued)
(Parent Company Only)
5. Related Party Transactions
MetLife, Inc. provides Brighthouse Financial, Inc. certain services, which include, but are not limited to, treasury, financial planning and analysis, legal, human resources, tax planning, internal audit, financial reporting and information technology. In 2017, the Company is charged for these services through a transition services agreement and allocated to the products within the Company. When specific identification is not practicable, an allocation methodology based on various performance measures or activity-based costing, such as sales, new policies/contracts issued, reserves, and in-force policy counts is used. The bases for such charges are modified and adjusted by management when necessary or appropriate to reflect fairly and equitably the actual incidence of cost incurred by Brighthouse Financial, Inc. Management believes that the methods used to allocate expenses under these arrangements are reasonable. Expenses incurred with MetLife, Inc. related to these arrangements, recorded in other expenses, were
$4 million
for the year ended December 31, 2017. There were
no
expenses related to these arrangements for the period from August 1, 2016 (date of inception) to December 31, 2016.
At December 31, 2017 and 2016, MetLife, Inc. owed Brighthouse Financial, Inc.
$192 million
and
$0
, respectively, included in receivable from former affiliate, related to employee benefit plan liabilities. See
Note 16
of the Notes to the Consolidated and Combined Financial Statements for information regarding this agreement.
271
Brighthouse Financial, Inc.
Schedule III
Consolidated and Combined Supplementary Insurance Information
December 31,
2017
and
2016
(In millions)
|
Segment
|
DAC
and VOBA |
Future Policy Benefits and Other Policy-Related
Balances |
Policyholder
Account Balances |
Unearned
Premiums (1)(2)
|
Unearned
Revenue (1) |
|||||||||||||||
|
2017
|
||||||||||||||||||||
|
Annuities
|
$
|
5,047
|
|
$
|
8,347
|
|
$
|
25,934
|
|
$
|
—
|
|
$
|
96
|
|
|||||
|
Life
|
1,106
|
|
5,200
|
|
3,342
|
|
14
|
|
278
|
|
||||||||||
|
Run-off
|
5
|
|
18,521
|
|
8,506
|
|
—
|
|
95
|
|
||||||||||
|
Corporate & Other
|
128
|
|
7,533
|
|
1
|
|
5
|
|
—
|
|
||||||||||
|
Total
|
$
|
6,286
|
|
$
|
39,601
|
|
$
|
37,783
|
|
$
|
19
|
|
$
|
469
|
|
|||||
|
2016
|
||||||||||||||||||||
|
Annuities
|
$
|
4,878
|
|
$
|
7,724
|
|
$
|
25,431
|
|
$
|
—
|
|
$
|
89
|
|
|||||
|
Life
|
1,261
|
|
4,951
|
|
3,588
|
|
14
|
|
363
|
|
||||||||||
|
Run-off
|
6
|
|
16,313
|
|
8,506
|
|
—
|
|
79
|
|
||||||||||
|
Corporate & Other
|
148
|
|
7,429
|
|
1
|
|
6
|
|
—
|
|
||||||||||
|
Total
|
$
|
6,293
|
|
$
|
36,417
|
|
$
|
37,526
|
|
$
|
20
|
|
$
|
531
|
|
|||||
______________
|
(1)
|
Amounts are included within the future policy benefits and other policy-related balances column.
|
|
(2)
|
Includes premiums received in advance.
|
272
Brighthouse Financial, Inc.
Schedule III
Consolidated and Combined Supplementary Insurance Information (continued)
December 31,
2017
,
2016
and
2015
(In millions)
|
Segment
|
Premiums and
Universal Life and Investment-Type Product Policy Fees |
Net
Investment Income (1) |
Policyholder Benefits and Claims and
Interest Credited to Policyholder Account Balances |
Amortization of
DAC and VOBA |
Other
Expenses |
|||||||||||||||
|
2017
|
||||||||||||||||||||
|
Annuities
|
$
|
3,000
|
|
$
|
1,252
|
|
$
|
2,130
|
|
$
|
(23
|
)
|
$
|
1,565
|
|
|||||
|
Life
|
951
|
|
327
|
|
820
|
|
223
|
|
265
|
|
||||||||||
|
Run-off
|
714
|
|
1,358
|
|
1,735
|
|
7
|
|
279
|
|
||||||||||
|
Corporate & Other
|
96
|
|
141
|
|
62
|
|
20
|
|
374
|
|
||||||||||
|
Total
|
$
|
4,761
|
|
$
|
3,078
|
|
$
|
4,747
|
|
$
|
227
|
|
$
|
2,483
|
|
|||||
|
2016
|
||||||||||||||||||||
|
Annuities
|
$
|
3,259
|
|
$
|
1,329
|
|
$
|
2,347
|
|
$
|
(896
|
)
|
$
|
1,248
|
|
|||||
|
Life
|
739
|
|
350
|
|
681
|
|
282
|
|
273
|
|
||||||||||
|
Run-off
|
878
|
|
1,341
|
|
1,953
|
|
961
|
|
437
|
|
||||||||||
|
Corporate & Other
|
128
|
|
187
|
|
87
|
|
24
|
|
326
|
|
||||||||||
|
Total
|
$
|
5,004
|
|
$
|
3,207
|
|
$
|
5,068
|
|
$
|
371
|
|
$
|
2,284
|
|
|||||
|
2015
|
||||||||||||||||||||
|
Annuities
|
$
|
3,856
|
|
$
|
1,156
|
|
$
|
2,359
|
|
$
|
523
|
|
$
|
1,301
|
|
|||||
|
Life
|
752
|
|
352
|
|
650
|
|
169
|
|
276
|
|
||||||||||
|
Run-off
|
793
|
|
1,461
|
|
1,301
|
|
65
|
|
284
|
|
||||||||||
|
Corporate & Other
|
288
|
|
130
|
|
218
|
|
24
|
|
259
|
|
||||||||||
|
Total
|
$
|
5,689
|
|
$
|
3,099
|
|
$
|
4,528
|
|
$
|
781
|
|
$
|
2,120
|
|
|||||
______________
|
(1)
|
See
Note 2
of the Notes to the Consolidated and Combined Financial Statements for the basis of allocation of net investment income.
|
273
Brighthouse Financial, Inc.
Schedule IV
Consolidated and Combined Reinsurance
December 31, 2017
,
2016
and
2015
(Dollars in millions)
|
Gross Amount
|
Ceded
|
Assumed
|
Net Amount
|
% Amount Assumed to Net
|
||||||||||||||
|
2017
|
||||||||||||||||||
|
Life insurance in-force
|
$
|
629,367
|
|
$
|
206,304
|
|
$
|
6,879
|
|
$
|
429,942
|
|
1.6%
|
|||||
|
Insurance premium
|
|
|||||||||||||||||
|
Life insurance (1)
|
$
|
1,557
|
|
$
|
711
|
|
$
|
11
|
|
$
|
857
|
|
1.3%
|
|||||
|
Accident & health insurance
|
238
|
|
232
|
|
—
|
|
6
|
|
—%
|
|||||||||
|
Total insurance premium
|
$
|
1,795
|
|
$
|
943
|
|
$
|
11
|
|
$
|
863
|
|
1.3%
|
|||||
|
2016
|
|
|||||||||||||||||
|
Life insurance in-force
|
$
|
653,270
|
|
$
|
465,841
|
|
$
|
7,006
|
|
$
|
194,435
|
|
3.6%
|
|||||
|
Insurance premium
|
|
|||||||||||||||||
|
Life insurance (1)
|
$
|
2,067
|
|
$
|
929
|
|
$
|
76
|
|
$
|
1,214
|
|
6.3%
|
|||||
|
Accident & health insurance
|
229
|
|
224
|
|
3
|
|
8
|
|
37.5%
|
|||||||||
|
Total insurance premium
|
$
|
2,296
|
|
$
|
1,153
|
|
$
|
79
|
|
$
|
1,222
|
|
6.5%
|
|||||
|
2015
|
|
|||||||||||||||||
|
Life insurance in-force
|
$
|
637,410
|
|
$
|
483,569
|
|
$
|
94,863
|
|
$
|
248,704
|
|
38.1%
|
|||||
|
Insurance premium
|
|
|||||||||||||||||
|
Life insurance (1)
|
$
|
2,229
|
|
$
|
855
|
|
288
|
|
$
|
1,662
|
|
17.3%
|
||||||
|
Accident & health insurance
|
243
|
|
235
|
|
9
|
|
17
|
|
52.9%
|
|||||||||
|
Total insurance premium
|
$
|
2,472
|
|
$
|
1,090
|
|
$
|
297
|
|
$
|
1,679
|
|
17.7%
|
|||||
______________
|
(1)
|
Includes annuities with life contingencies.
|
For the year ended
December 31, 2017
, reinsurance ceded and assumed included related party transactions for life insurance in-force of
$17.1 billion
and
$6.9 billion
, respectively, and life insurance premiums of
$537 million
and
$11 million
, respectively. For the year ended
December 31, 2016
, reinsurance ceded and assumed included related party transactions for life insurance in-force of
$266.4 billion
and
$7.0 billion
, respectively, and life insurance premiums of
$766 million
and
$34 million
, respectively. For the year ended
December 31, 2015
, reinsurance ceded and assumed included related party transactions for life insurance in-force of
$278.5 billion
and
$86.4 billion
, respectively, and life insurance premiums of
$687 million
and
$227 million
, respectively.
274
None.
Management, with the participation of the Chief Executive Officer and Chief Financial Officer, has evaluated the effectiveness of the design and operation of the Company’s disclosure controls and procedures as defined in Rule 13a-15(e) under the Exchange Act, as of the end of the period covered by this report. Based on that evaluation, the Chief Executive Officer and Chief Financial Officer have concluded that these disclosure controls and procedures were effective as of December 31, 2017.
Historically, the Company relied on certain financial, administrative and other resources of MetLife, Inc. to operate our business until the Separation on August 4, 2017. In connection with the Separation, the Company redesigned several business processes and continues to change business processes as a standalone entity. The Company identifies, documents and evaluates controls to ensure controls over our financial reporting are effective. MetLife, through services agreements, continues to provide certain services on a transitional basis. We consider these to be a material change in our internal control over financial reporting.
Other than as noted above, there were no changes to the Company’s internal control over financial reporting (as defined in Rules 13a-15(f) and 15d-15(f) under the Exchange Act) that occurred during the quarter ended December 31, 2017 that have materially affected, or are reasonably likely to materially affect, these internal controls over financial reporting.
Due to its inherent limitations, internal control over financial reporting may not prevent or detect misstatements. Also, projections of any evaluation of effectiveness to future periods are subject to the risk that controls may become inadequate because of changes in conditions, or that the degree of compliance with the policies or procedures may deteriorate.
This annual report does not include a report of management’s assessment regarding internal control over financial reporting or an attestation report of the Company’s registered public accounting firm due to a transition period established by rules of the SEC for newly public companies.
275
None.
Information about our Directors is incorporated by reference from the discussion under the heading Proposal 1
—
Election of three (3) Class I Directors for a two-year term ending at the 2020 Annual Meeting of Stockholders in Brighthouse Financial, Inc.’s Proxy Statement for the 2018 Annual Meeting of Stockholders (the “2018 Proxy Statement”).
Information about compliance with Section 16(a) of the Exchange Act is incorporated by reference from the discussion under the heading Security Ownership of Directors and Executive Officers
—
Section 16(a) Beneficial Ownership Reporting Compliance in our 2018 Proxy Statement.
Information about the Brighthouse Financial, Inc. Code of Conduct for Financial Management (the “Financial Management Code”), which applies to any employee that may obtain access to any financial records covered by the Financial Management Code, including the Chief Executive Officer, the Chief Financial Officer and the Chief Accounting Officer, as well as the Brighthouse Financial, Inc. Code of Conduct for Directors, which applies to all members of our Board of Directors, including the Chief Executive Officer, and the Brighthouse Financial, Inc. Code of Conduct for Employees, which applies to all of our employees and officers, including our Chief Executive Officer, Chief Financial Officer and Chief Accounting Officer is incorporated by reference from the discussions under the heading Board and Corporate Governance Practices
—
Codes of Conduct in our 2018 Proxy Stateme
nt. The Ethics Codes are available on the Company’s website at http://investor.brighthousefinancial.com/corporate-governance/governance-overview. We intend to disclose future amendments to certain provisions of the Code, or waivers of such provisions granted to executive officers and directors, on the Company’s website at the address given above within five business days following the date of such amendment or waiver.
Information regarding the procedures by which our stockholders may recommend nominees to our Board of Directors is incorporated by reference from the discussion under the headings “Board and Corporate Governance Practices
—
Building our Board of Directors” and “The Annual Meeting, Voting and Other Information
—
Other Information
—
Proposals for the 2019 Annual Meeting of Stockholders” in our 2018 Proxy Statement.
Information about our Audit Committee, including the members of the Committee, and our Audit Committee financial expert, is incorporated by reference from the discussion under the heading Board and Corporate Governance Practices
—
Information about our Board Committees
—
Audit Committee in our 2018 Proxy Statement.
The information called for by this Item pertaining to Executive Officers appears in “Business
— Executive Officers” in
this Annual Report on Form 10-K.
NOTE: Terms defined in the Compensation Discussion and Analysis and accompanying tables relate only to the disclosure included in the Compensation Discussion and Analysis and accompanying tables and not to any other disclosure included elsewhere in this Annual Report on Form 10-K.
Compensation Discussion and Analysis
The Compensation Discussion and Analysis (“CD&A”) describes Brighthouse Financial, Inc.’s (“Brighthouse,” “the Company,” “we,” “us,” or “our”) executive compensation philosophy, policies, practices and objectives in the context of our compensation decisions for our named executive officers (the “NEOs”) for the period from August 5, 2017, the first day following the date MetLife, Inc. (“MetLife”) distributed our common stock, through December 31, 2017. We refer to this period as “Fiscal 2017” throughout the CD&A. Prior to August 5, 2017, compensation to our NEOs and all other employees was paid by one of MetLife’s subsidiaries. Following the completion of MetLife’s spin-off of Brighthouse through the distribution of approximately 80.8% of MetLife’s interest in Brighthouse to holders of MetLife common stock (the “Separation”), our NEOs and other employees were compensated by Brighthouse Services, LLC (“Brighthouse Services”) as a subsidiary of Brighthouse and not a subsidiary of MetLife. Brighthouse Services is a payroll and services company and is the employer of all our NEOs and other employees. Please note that, except to the extent an amount is specified as relating to calendar year 2017, all compensation figures and amounts reported in this CD&A, and in the tabular disclosures following, reflect compensation paid and/or granted during Fiscal 2017 only and does not include compensation paid prior to the Separation.
276
For Fiscal 2017, our NEOs are comprised of our Chief Executive Officer, Chief Financial Officer and the next three most highly compensated executive officers whose names appear below:
|
Name
|
Title
|
|
|
Eric T. Steigerwalt
|
President and Chief Executive Officer
|
|
|
Anant Bhalla
|
Executive Vice President and Chief Financial Officer
|
|
|
John L. Rosenthal
|
Executive Vice President and Chief Investment Officer
|
|
|
Peter M. Carlson
|
Executive Vice President and Chief Operating Officer
|
|
|
Christine M. DeBiase
|
Executive Vice President, General Counsel and Corporate Secretary (*)
|
|
_______________
|
(*)
|
Effective February 2, 2018, Ms. DeBiase’s title was changed to Executive Vice President, Chief Administrative Officer and General Counsel. As of that date, Ms. DeBiase ceased serving as the Company’s Corporate Secretary.
|
The CD&A is organized into four sections:
|
•
|
Section 1 — Executive Summary
|
|
•
|
Section 2 — Features of our Fiscal 2017 Executive Compensation Program
|
|
•
|
Section 3 — The Brighthouse Vision and Strategy — Establishing the 2018 Executive Compensation Program
|
|
•
|
Section 4 — Additional Compensation Practices and Policies
|
Section 1 — Executive Summary
The Brighthouse Story
Brighthouse became an independent, publicly-traded company following the completion of the Separation on August 4, 2017, culminating with the listing of Brighthouse’s stock on the NASDAQ Stock Market on August 7, 2017. Since our first day as an independent company, we have been a major provider of life insurance and annuity solutions in the United States. Our mission is to assist our customers to achieve financial security by offering annuity and life insurance solutions.
Compensation Approach
Prior to the Separation, our executive officers were officers or employees of MetLife and its subsidiaries, although some or all of the work they performed prior to the Separation related to us or our subsidiaries.
On August 9, 2017, at its first meeting after the Separation, the Compensation Committee of our Board of Directors (the “Board”) met and determined the compensation arrangements for our NEOs. The Compensation Committee approved compensation arrangements for our NEOs that are rooted in a pay-for-performance philosophy.
Our executive compensation program has been designed to:
|
•
|
Provide competitive “Target Total Compensation” opportunities (defined as base salary plus short- and long-term incentive compensation opportunities) to enable Brighthouse to attract, motivate and retain high-performing executives;
|
|
•
|
Align our compensation plans and programs with our short- and long-term business strategies and objectives;
|
|
•
|
Align the interests of our NEOs with those of our stockholders by delivering a substantial portion of our NEO’s compensation in the form of variable, at-risk incentives, with a particular emphasis on stock-based incentives, where payouts are based on Company and individual performance. The Company intends to seek stockholder approval of the Brighthouse Financial, Inc. 2017 Stock and Incentive Compensation Plan (the “Employee Plan”) at Brighthouse’s first annual meeting of stockholders in 2018 (the “2018 Annual Meeting”); and
|
|
•
|
Incorporate strong risk management practices to avoid creating incentives for executives to take excessive risks, encourage prudent decision-making, and capture the results of risk-based decisions in awards and payouts.
|
Our pay-for-performance philosophy is intended to align the interests and incentives of our NEOs with those of our stockholders by tying a substantial portion of our NEO’s compensation to the achievement of performance metrics that are aligned with the core elements of our strategy.
277
Fiscal 2017 Compensation Highlights
Calendar year 2017 was a year of transformation for Brighthouse. Throughout 2017, our employees were focused on completing the Separation and establishing Brighthouse as an independent public company. Accordingly, the Fiscal 2017 compensation program was established to support these objectives.
Highlights of our Fiscal 2017 compensation program are described below.
|
Compensation Highlight
|
Synopsis
|
Rationale
|
|
Base Salary and Target Total Compensation
|
Post-Separation base salaries and Target Total Compensation opportunities were established.
|
Base salaries and Target Total Compensation opportunities were determined by reference to the market median of the Comparator Group (as defined below) and established to reflect the NEO’s responsibilities as top executives of a standalone public company.
|
|
Annual Variable Incentive Plan (“AVIP”)
|
AVIP pool for calendar year 2017 was funded at 105% of target level, with NEO payout percentages determined based on individual performance.
|
AVIP is our annual cash incentive plan. The AVIP award pool was approved at slightly above target levels to reflect the Compensation Committee’s quantitative and qualitative assessment of management’s success in accomplishing the Separation.
|
|
Separation Bonus
|
A one-time 25% bonus enhancement for all Brighthouse employees eligible for AVIP awards.
|
Based on the successful Separation, our NEOs and other employees received an additional cash incentive bonus equal to 25% of his or her respective calendar year 2017 bonus payout under AVIP (“Separation Bonus”). The Separation Bonus was based upon the Company’s achievement of critical post-Separation transition milestones and reflects the extraordinary efforts by all employees to effectuate the Separation.
|
|
Founders’ Grants
|
Shortly following the Separation, these Brighthouse equity awards were issued to all employees of the Company who participate in the Employee Plan. Awards were issued as Restricted Stock Units (“RSUs”) that 100% cliff vest a short time after the anniversary of the grant date, subject to the achievement of one or more performance goals. Founders’ Grants are subject to stockholder approval of the Employee Plan at the 2018 Annual Meeting.
|
Founders’ Grants were used to accelerate Brighthouse equity ownership by our officers and to immediately align our NEOs’ interests with those of our stockholders.
|
|
Temporary Incentive Deferred Compensation
|
Deferred compensation credits under the Temporary Incentive Deferred Compensation Plan (the “Temporary Plan”) to our NEOs as a “make-whole” for equity-based compensation that was forfeited or otherwise forgone as a result of the Separation. Credits under the Temporary Plan are subject to achievement of one or more performance goals. The material terms of the performance goals for certain credits under the Temporary Plan are subject to stockholder approval at the 2018 Annual Meeting.
|
Our NEOs and other employees received deferred compensation credits under the Temporary Plan to retain and motivate the participating employees through the Separation. These credits were equal to the sum of: (i) outstanding MetLife equity awards that were forfeited upon the Separation, if any, and (ii) 2017 MetLife equity grants that were forgone in light of the planned Separation.
|
See “Section 3 — The Brighthouse Vision and Strategy — Establishing the 2018 Executive Compensation Program,” for an overview of the key elements of our strategy and the ways in which our compensation program for 2018 is designed to promote and reward achievement of goals that are central to our strategy.
Section 2 — Features of Our Fiscal 2017 Executive Compensation Program
Since the Separation, the Compensation Committee has been responsible for overseeing the development and implementation of our executive compensation program. The Compensation Committee is guided by the following general principles and practices:
|
•
|
paying for performance: variable compensation should be based on Company and individual performance and results that drive stockholder value;
|
278
|
•
|
aligning executives’ interests with stockholders’: a significant portion of our NEOs’ Target Total Compensation will be delivered in the form of stock-based incentives;
|
|
•
|
encouraging long-term decision-making: our long-term incentive compensation programs should include awards with multi-year, overlapping incentive performance or restriction periods;
|
|
•
|
avoiding problematic pay practices: we do not provide excessive perquisites, excessive change-in-control severance pay, or excise tax gross-ups, and we will not reprice stock options without stockholder approval; and
|
|
•
|
reinforcing strong risk management: our compensation programs are intended to avoid incentives to take excessive risks.
|
Key Executive Compensation Practices
Our executive compensation program reflects the following:
|
WHAT WE DO
|
|
|
P
|
Pay for Performance.
A substantial portion of our NEOs’ Target Total Compensation is in the form of variable, at-risk elements that reward our executives only if we achieve performance goals that create stockholder value.
|
|
P
|
Stock Ownership Guidelines.
We have established stock ownership and retention guidelines to encourage our NEOs to obtain and maintain significant stock ownership, thereby aligning their interests with those of our stockholders.
|
|
P
|
Minimum Vesting Requirements.
Full value equity awards to our employees are generally subject to minimum vesting periods of one year for awards subject to achievement of performance goals and three years (at a rate of not greater than 1/3rd per year) for awards that vest based solely on continued service.
|
|
P
|
Stockholder Engagement.
Since the Separation, we have actively engaged with our stockholders on various topics, including our executive compensation program. We recognize the importance of our stockholders’ perspectives in the compensation setting process and intend to incorporate their feedback into the design of our compensation programs.
|
|
P
|
Independent Compensation Consultant.
Our Compensation Committee retained Semler Brossy Consulting Group (“SBCG”) as its independent compensation consultant to advise on all aspects of our executive compensation program.
|
|
WHAT WE DON’T DO
|
|
|
O
|
Gross-ups on Excise Taxes.
We do not provide tax gross up benefits in connection with a change in control.
|
|
O
|
Reprice Stock Options.
Our equity incentive plans prohibit us from repricing stock options or stock appreciation rights without stockholder approval.
|
|
O
|
Excessive Perquisites.
We provide limited perquisites to our executive officers.
|
|
O
|
Hedging and Pledging.
Our insider trading policy prohibits all employees and directors from engaging in hedging or pledging transactions.
|
Fiscal 2017 Compensation Setting Process
Prior to the Separation, we were a subsidiary of MetLife and our NEOs and all other employees were compensated by a subsidiary of MetLife based on MetLife’s compensation program for similarly-situated employees of MetLife and its subsidiaries. In addition, because we were not yet an independent public company, we did not have a compensation committee comprised of independent directors prior to the Separation. We and MetLife believed it would be appropriate for our post-Separation Compensation Committee and Board to make determinations and decisions about how our NEOs should be compensated.
Because the Separation occurred more than half-way through calendar year 2017, we believed it was appropriate for our Human Resources department, in consultation with Willis Towers Watson (“WTW”), to be primarily responsible for preparing compensation recommendations for Fiscal 2017 for our NEOs and other members of our senior management, which we collectively refer to as the Senior Leadership Management Group (the “SLMG”). As described below, shortly after the Separation, our newly formed Compensation Committee considered the compensation recommendations prepared in the period leading up to the Separation and ultimately determined to adopt such recommendations for the NEOs and other members of the SLMG. Going forward, our Compensation Committee, with input from Semler Brossy Consulting Group, will be primarily responsible for reviewing and determining all elements of Total Compensation for our NEOs and other members of the SLMG.
Our executive compensation program and accompanying pay positioning strategy have been designed to provide Target Total Compensation that uses market median as an important reference point, but recognize that the positioning of individual executives may vary from that strategy with consideration to a variety of factors, including criticality of role, skills, experience, and strategic priorities. For compensation benchmarking purposes, we use a group of peer companies within
279
our industry that are similar to us in terms of assets and revenues and with which we compete for executive talent (the “Comparator Group”).
In anticipation of the Separation, our Human Resources department and WTW constructed the Comparator Group and used the companies in the Comparator Group as the market reference for developing pay recommendations for our NEOs and other members of the SLMG. The Comparator Group consists of fourteen publicly-traded companies in the insurance industry with assets between 0.25 to 2.0 times those of Brighthouse and/or revenues between 0.4 to 2.5 times those of Brighthouse. As Brighthouse markets its products solely in the U.S., comparably-sized insurers with significant global operations (e.g., MetLife) were excluded from the Comparator Group.
In August 2017, shortly after the Separation, our Human Resources department recommended and the Compensation Committee approved the following Comparator Group:
|
Aflac Incorporated
|
Lincoln National Corp.
|
|
American Equity Investment Life Holding Company
|
Principal Financial Group, Inc.
|
|
American National Insurance Company
|
Reinsurance Group of America, Inc.
|
|
Ameriprise Financial, Inc.
|
Sun Life Financial Inc.
|
|
Assurant, Inc.
|
Torchmark Corp.
|
|
CNO Financial Group, Inc.
|
Unum Group
|
|
Genworth Financial, Inc.
|
Voya Financial, Inc.
|
In connection with the construction of the Comparator Group, our Human Resources department consulted with WTW to gather compensation data that was used to prepare Target Total Compensation recommendations for the SLMG, including the NEOs. Target Total Compensation recommendations were prepared for each member of the SLMG by reference to the compensation data and presented to the Compensation Committee at its first meeting on August 9, 2017. The Compensation Committee reviewed the recommendation for our Chief Executive Officer and recommended that the independent members of the Board approve the Target Total Compensation for our Chief Executive Officer, Mr. Steigerwalt. The independent members of the Board, on the recommendation of the Compensation Committee, approved Mr. Steigerwalt’s Target Total Compensation at their meeting on August 9, 2017. The Compensation Committee reviewed and approved the compensation recommendations for all other members of the SLMG, including our NEOs. Our Chief Executive Officer was involved in discussions with our Human Resources department and our Compensation Committee regarding Target Total Compensation recommendations for members of the SLMG other than himself.
In November 2017, the Compensation Committee retained SBCG as its independent compensation consultant. From such date, SBCG has advised, and will continue to advise, the Compensation Committee on the Company’s overall executive compensation program, including executive pay levels and mix, design of our short- and long-term incentive programs, and competitiveness of the Company’s executive compensation. See “Role of the Compensation Committee and Others in Determining Compensation — Compensation Consultant’s Role,” below, for additional information regarding SBCG’s role in our executive compensation program.
Fiscal 2017 Target Total Compensation Opportunities
The table below shows the post-Separation base salary, target annual incentive opportunity (as a percentage of base salary) and target long-term equity incentive opportunity (as a percentage of base salary) for each NEO that the independent members of the Board (for Mr. Steigerwalt) and the Compensation Committee (for all other NEOs) approved in August 2017. The base salary amounts became effective on August 15, 2017. The AVIP payouts, Separation Bonuses and Founders’ Grants values for our NEOs were based on the amounts in the below table.
|
Name
|
Annual Base Salary
|
Target Annual Incentive (as % of base salary)
|
Target Long-Term Incentive (as % of Base Salary)
|
Target Total Compensation
|
||||
|
Eric T. Steigerwalt
|
$900,000
|
200%
|
500%
|
$7,200,000
|
||||
|
Anant Bhalla
|
$600,000
|
140%
|
175%
|
$2,490,000
|
||||
|
John L. Rosenthal
|
$550,000
|
195%
|
200%
|
$2,722,500
|
||||
|
Peter M. Carlson
|
$600,000
|
150%
|
200%
|
$2,700,000
|
||||
|
Christine M. DeBiase
|
$575,000
|
110%
|
175%
|
$2,213,750
|
||||
280
The amount of each element of Target Total Compensation for our NEOs was informed by market data regarding senior executive compensation at companies within the Comparator Group, as well as survey data from WTW’s proprietary database of executive compensation at large diversified insurers. In preparing the recommendations, our Human Resources department sought to provide Target Total Compensation to members of the SLMG, including the NEOs, based on Brighthouse’s median pay positioning strategy and individual factors (including criticality of role, skills, experience, and strategic priorities) that may influence positioning relative to the median. The Human Resources department did not specifically target individual elements or overall levels of compensation at a specific percentage of the median. Instead, the Human Resources department considered ranges for each element of compensation because it viewed market data as an approximation for the overall market for a particular position, with ultimate recommendations based on the factors referenced above.
The Compensation Committee expects to periodically assess the competitiveness of our NEOs’ Target Total Compensation against the Comparator Group and periodically review the composition of the Comparator Group to assess whether it remains an appropriate source of comparison.
As shown in the graphs below, our CEO’s Target Total Compensation and the average Target Total Compensation for our other NEOs as set in August 2017 is heavily weighted towards variable, at-risk elements.
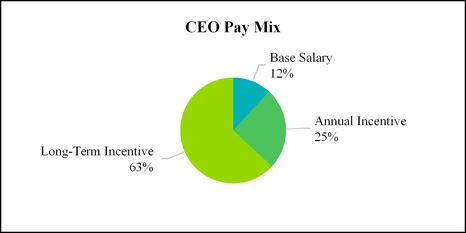
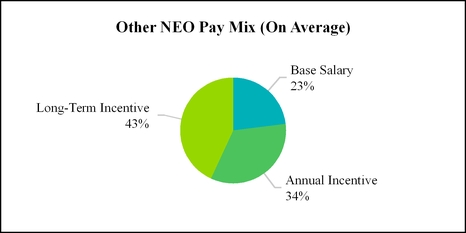
281
Elements of Fiscal 2017 Compensation
The elements of Fiscal 2017 compensation are as follows, each as discussed in greater detail below:
|
Component
|
Form
|
Purpose
|
|
Base Salary
|
Cash (Fixed)
|
Base salary is intended to provide a fixed amount of compensation for services during the year. Base salary is determined based upon a variety of factors, including scope of responsibilities, individual performance, and market data.
|
|
AVIP
|
Cash (Variable)
|
AVIP awards, which are annual cash incentive awards, were the primary compensation arrangement for recognizing and rewarding each NEO’s contribution to the Company’s overall performance in calendar year 2017. Payouts were based upon the Company’s achievement of performance goals tied to the Separation and establishment of Brighthouse as an independent publicly-traded company. See discussion below for additional information regarding AVIP.
|
|
Separation Bonus
|
Cash (Variable); Non-Recurring
|
Our NEOs and other employees received a Separation Bonus equal to 25% of his or her calendar year 2017 payout under AVIP. The Separation Bonus was based upon the Company’s achievement of critical post-Separation transition milestones. See discussion below for additional information regarding the Separation Bonus.
|
|
Founders’ Grants
|
Equity (Variable); Non-Recurring
|
Founders’ Grants were awarded under the Employee Plan to our NEOs and other employees eligible to participate in the Employee Plan in recognition of their leadership through the Separation. In addition, Founders’ Grants are intended to align our NEOs’ interests with those of our stockholders by providing them with an equity interest in Brighthouse. Founders’ Grants are subject to stockholder approval of the Employee Plan. See discussion below for additional information regarding Founders’ Grants.
|
|
Temporary Incentive Deferred Compensation
|
Cash (Variable)
|
We provided deferred compensation credits to our NEOs and other employees to compensate them for forfeiting and/or forgoing MetLife equity awards as a result of the Separation. The deferred compensation credits are intended to retain and motivate our NEOs during the process that culminated in the Separation. The material terms of the performance goals for certain credits under the Temporary Plan are subject to stockholder approval at the 2018 Annual Meeting. See discussion below for additional information about the Temporary Plan.
|
Base Salary
Base salary is intended to provide our NEOs a fixed level of compensation for their services during the year. Our Target Total Compensation has been structured so that base salary is the smallest component.
Annual Incentives
Annual incentive awards are the primary compensation arrangement for differentiating and rewarding individual performance during the year. For 2017, annual incentive awards were paid pursuant to the Brighthouse Services, LLC Amended and Restated Annual Variable Incentive Plan. The purpose of AVIP is to align total annual pay with business results, provide competitive levels of pay for performance and make a substantial portion of Target Total Compensation variable based on both Company and individual performance. The amount of the payouts is tied to the Company’s and the employee’s achievement of annual performance goals that contribute to our long-term success without creating an incentive to take excessive risk.
Because 2017 was a year of transformation for the Company, the pre-Separation board of directors recognized it would be difficult to establish performance goals for AVIP for the 2017 calendar year that related to traditional performance metrics. In establishing performance goals for 2017, it was necessary to set qualitative goals that could be objectively measured but also not expected to be unduly affected by the Separation. In addition, as further discussed under “Tax Considerations” below, we intended to structure our 2017 AVIP awards to qualify for the then-available performance-based compensation deduction under Section 162(m) of the Internal Revenue Code, which limited our ability to make adjustments or reflect changing circumstances. Therefore, the performance goals established for AVIP awards focused on measuring the Company’s overall performance during the pre- and post-Separation portions of calendar year 2017, with a particular emphasis on successfully separating from MetLife and establishing Brighthouse as a standalone public company.
At its first post-Separation meeting in August 2017, the Compensation Committee ratified the performance goals adopted by the pre-Separation board of directors.
282
In order for AVIP funding to occur for 2017, the Company needed to achieve one or more of the pre-established performance goals outlined below:
|
•
|
Positive GAAP Operating Earnings (we now refer to Operating Earnings as “Adjusted Earnings”);
|
|
•
|
Positive GAAP Operating ROE (we now refer to Operating ROE as “Adjusted ROE”);
|
|
•
|
Improvement in Variable Annuity (“VA”) Target Funding adequacy level;
|
|
•
|
Combined Risk Based Capital Ratio of at least 400% on an authorized control level;
|
|
•
|
Positive Value of New Business for Annuity Segment; or
|
|
•
|
Insurer financial strength ratings of at least “A-” from one or more credit rating agencies.
|
In January 2018, the Compensation Committee certified that the Company achieved an insurer financial strength rating of A- from one or more credit rating agencies, allowing the AVIP to be funded.
In determining the actual AVIP funding level, the Compensation Committee considered the Company’s performance against the pre-established performance goals above, the Company’s performance overall and the efforts made by our NEOs and employees to effectuate the Separation. Although the Separation ultimately occurred in August 2017, multiple potential Separation dates were considered beginning in 2016. As a consequence of the uncertain timing, there were many internal processes and engagements that were established, periodically paused, and then restarted throughout the period leading up to the Separation.
In addition, the Compensation Committee considered several other factors that it viewed as integral to the Company’s future success, including developing relationships with key distributors of our products, implementing an overall risk management framework for our business, and establishing and implementing the Brighthouse culture.
With consideration to these factors, our Human Resources department recommended, and the Compensation Committee ultimately approved, funding of the AVIP at 105% of target to reflect both the work required to complete the Separation, but also the financial, operational, and strategic results achieved despite the additional workstreams associated with the transition to a standalone public company.
Separation Bonus
In addition to awards under AVIP, our NEOs and all other administrative (non-wholesaler) employees were eligible to receive a Separation Bonus equal to 25% of each employee’s calendar year 2017 AVIP award based upon the Company’s achievement of performance goals and milestones in connection with the Separation and the establishment of Brighthouse as a standalone public company. The Separation Bonus was awarded to all NEOs based upon the determination by the Head of Compensation and Benefits that Brighthouse achieved each of the following pre-established objectives during the period from the Separation through December 31, 2017:
|
•
|
Achieved investor community confidence through an insurer financial strength rating of at least “A-”;
|
|
•
|
Met at least 90% of expected Transition Services Agreement (“TSA”) transition targets scheduled for 2017;
|
|
•
|
Implemented separate Human Resources and payroll systems by January 1, 2018; and
|
|
•
|
Implemented key risk mitigation measures.
|
Fiscal 2017 AVIP and Separation Bonus Decisions for Our NEOs
Prior to the Separation, Mr. Steigerwalt and members of our Human Resources department established general performance goals that would be used to assess Mr. Steigerwalt’s performance during calendar year 2017, and in particular, Fiscal 2017. These goals were reviewed and ratified by our Compensation Committee in November 2017 following the Separation. For Fiscal 2017, Mr. Steigerwalt’s goals were a mix of strategic and operational objectives that were intended to assess Mr. Steigerwalt’s performance in leading the Company through the Separation and establishing Brighthouse as an independent public company.
In November, the Compensation Committee ratified the following 2017 calendar year goals for Mr. Steigerwalt:
|
•
|
Separate and stabilize Brighthouse as an independent company;
|
|
•
|
Increase relevance within value-creating distribution channels;
|
|
•
|
Grow book value;
|
283
|
•
|
Oversee implementation of Brighthouse’s risk management framework;
|
|
•
|
Establish the Brighthouse culture and core values; and
|
|
•
|
Complete recruitment and hiring of senior leadership team.
|
In February 2018, the Compensation Committee and the independent members of our Board considered the Company’s performance overall, Mr. Steigerwalt’s performance against the performance goals listed above, as well as a self-assessment of accomplishments provided by Mr. Steigerwalt. In completing the recruitment of his SLMG, Mr. Steigerwalt was able to drive the Company toward the following accomplishments:
|
•
|
Successfully separated and established Brighthouse as an independent public company;
|
|
•
|
Increased relevance within value-creating distribution channels, despite a Fitch ratings downgrade and other inherent challenges associated with the Separation, during which period annuity sales outpaced planned target by approximately 11%;
|
|
•
|
Protected and grew book value to approximately $12.4 billion (excluding accumulated other comprehensive income, or AOCI), by increased annuity sales, maintaining positive adjusted earnings, and modifying the hedging program to enhance downside protection;
|
|
•
|
Implemented a risk management framework; and
|
|
•
|
Established Brighthouse culture and values, by implementing ongoing coaching and feedback training programs, launching a performance management program, and consistent communication efforts to substantiate our culture and values across the organization.
|
Based on the foregoing achievements, the Compensation Committee recommended, and the independent members of the Board approved, the following AVIP and Separation Bonus payments to Mr. Steigerwalt:
|
Name
|
AVIP Payout Percentage
|
Calendar Year 2017 AVIP Payment
|
Fiscal 2017 AVIP Payment (1)
|
Separation Bonus Payment (1)
|
||||
|
Eric T. Steigerwalt
|
105%
|
$1,890,000
|
$771,534
|
$472,500
|
||||
|
(1)
|
This amount represents the portion of Mr. Steigerwalt’s AVIP payout earned in respect of service during Fiscal 2017 (i.e., the period post-Separation). The Separation bonus represents 25% of Mr. Steigerwalt’s calendar year 2017 AVIP payout. See the footnotes and narrative disclosure accompanying the Summary Compensation Table for additional information about the AVIP payment made to Mr. Steigerwalt.
|
Beginning in 2018, the Compensation Committee with SBCG’s input and assistance expects to establish qualitative and quantitative goals against which Mr. Steigerwalt’s performance will be assessed.
Also in February 2018, the Compensation Committee considered the overall performance of each of the other NEOs, including against their 2017 performance goals referenced below. Mr. Steigerwalt also provided the Compensation Committee with his assessment of the NEOs’ 2017 performance, including the material performance highlights summarized below.
Anant Bhalla, Executive Vice President and Chief Financial Officer:
2017 Goals
|
•
|
Execute on separation from MetLife and establishment of Brighthouse;
|
|
•
|
Establish and run standalone finance processes for Brighthouse;
|
|
•
|
Build new capabilities; and
|
|
•
|
Embed the Brighthouse culture and develop talent.
|
2017 Performance Highlights
|
•
|
Demonstrated strong financial skills, analytics, and innovative financial modeling that supported the successful separation effort;
|
|
•
|
Effectively managed the challenges that rose from the Separation, including regulatory and reserve matters; and
|
|
•
|
Drove the establishment of a new hedging strategy and played an important role in our successful initial debt offering.
|
284
John L. Rosenthal, Executive Vice President and Chief Investment Officer:
2017 Goals
|
•
|
Establish robust asset management capability;
|
|
•
|
Deliver foundational components of the target operating model;
|
|
•
|
Partner with finance and product to create an effective asset liability management and pricing process;
|
|
•
|
Capital preservation;
|
|
•
|
Partner with risk and finance functions;
|
|
•
|
Ensure appropriate risk-based returns; and
|
|
•
|
Build a cohesive investments department.
|
2017 Performance Highlights
|
•
|
Established an appropriate Investments department structure and determined where to build versus outsource;
|
|
•
|
Effectively partnered with Treasury on VA hedging strategy; and
|
|
•
|
Made strategic asset allocation decisions for Brighthouse and continues to oversee the Asset Manager selection process.
|
Peter M. Carlson, Executive Vice President and Chief Operating Officer:
2017 Goals
|
•
|
Serve as the primary liaison with MetLife Senior Management for post-Separation activities;
|
|
•
|
Serve as Lead Director of the New England Life Insurance Company and Brighthouse Life Insurance Company of New York subsidiary boards;
|
|
•
|
Establish solid processes for all critical finance functions;
|
|
•
|
Define an efficient and effective operating model to oversee operations through MetLife and outsourced partners;
|
|
•
|
Ensure compliance with the Brighthouse Board process; and
|
|
•
|
Reinforce Brighthouse cultural values through the Chief Operating Officer organization.
|
2017 Performance Highlights
|
•
|
Provided strategic oversight and leadership guidance over the Finance department;
|
|
•
|
Spearheaded partnering effort with MetLife and Mr. Steigerwalt on oversight of the multiple work streams involved in disaffiliation; and
|
|
•
|
Played an integral role in TSA negotiation and management to facilitate Separation from MetLife.
|
Christine M. DeBiase, Executive Vice President, General Counsel and Corporate Secretary (during 2017):
2017 Goals
|
•
|
Establish the Law Group;
|
|
•
|
Develop and temporarily lead the Human Resource function;
|
|
•
|
Advise and facilitate the legal separation from MetLife;
|
|
•
|
Advise on stabilizing and establishing an independent public company;
|
|
•
|
Embed the Brighthouse culture and develop Law Group associates; and
|
|
•
|
Support the product development through legal advice and government relations activities.
|
2017 Performance Highlights
|
•
|
Strong collaboration with the senior leadership team during the Separation;
|
285
|
•
|
Assumed management of Human Resources in addition to her other groups during a critical time for the company: Legal, Compliance, Office of Corporate Secretary, Corporate Communications, and Government Relations; and
|
|
•
|
Proactive leadership in the General Counsel capacity throughout the Separation.
|
The Compensation Committee considered the foregoing accomplishments and, based on Mr. Steigerwalt’s recommendations, approved the following AVIP and Separation Bonus payments to our other NEOs:
|
Name
|
AVIP Payout Percentage
|
Calendar Year 2017 AVIP Payment
|
Fiscal 2017 AVIP Payment (1)
|
Separation Bonus Payment (1)
|
||||
|
Anant Bhalla
|
100%
|
$840,000
|
$342,904
|
$210,000
|
||||
|
John L. Rosenthal
|
105%
|
$1,126,000
|
$459,655
|
$281,500
|
||||
|
Peter M. Carlson
|
99%
|
$891,000
|
$363,723
|
$222,750
|
||||
|
Christine M. DeBiase
|
112%
|
$709,000
|
$289,427
|
$177,250
|
||||
_______________
|
(1)
|
The amounts in this column represent the portion of each NEO’s AVIP payout in respect of service during Fiscal 2017 (i.e., the period post-Separation). The Separation Bonus represents 25% of each NEO’s calendar year 2017 AVIP payout. See the footnotes and narrative disclosure accompanying the Summary Compensation Table for additional information about the AVIP payment made to the NEOs.
|
The AVIP and Separation Bonus amounts paid to all of our NEOs in respect of Fiscal 2017 are reported in the “Non-Equity Incentive Compensation Plan” column of the Summary Compensation Table on page 294.
Founders’ Grants
In Fiscal 2017, each NEO received a Founders’ Grant in the form of RSUs under the Employee Plan. The Founders’ Grants were authorized on August 9, 2017. The number of RSUs awarded was based on the amount of value being delivered, divided by the closing price of the Company’s common stock on September 8, 2017 (the first Friday after one month of public trading), which was $54.54. The September 8, 2017 award date was established at the August 9, 2017, meeting and was determined to be the appropriate award date for the Founders’ Grants given the uncertainty of our stock performance immediately following the Separation. Founders’ Grants are subject to and conditioned upon stockholder approval of the Employee Plan, which the Company intends to seek at the 2018 Annual Meeting.
The Compensation Committee determined that it was appropriate to award Founders’ Grants in order to both align the interests of our NEOs with those of our stockholders, and to reward NEOs and other employees for their contributions toward the successful Separation and establishment of Brighthouse as an independent public company. The Founders’ Grant awarded to each NEO is equal to two times the NEO’s target long-term equity incentive opportunity approved for each NEO in August 2017. Awarding Founders’ Grants with a value equal to two-times each NEO’s target annual long-term incentive opportunity was intended to provide our NEOs with the ability to acquire a substantial ownership interest in Brighthouse, while also delivering a substantial amount of Fiscal 2017 Total Compensation in the form of stock-based incentives.
The table below shows the value of each NEO’s Founders’ Grant approved in August 2017 as well as the number of the RSUs into which the value was converted based on the closing price of the Company’s common stock on September 8, 2017.
|
Name
|
Founders’ Grant Value
|
Number of RSUs
|
||
|
Eric T. Steigerwalt
|
$9,000,000
|
165,016
|
||
|
Anant Bhalla
|
$2,100,000
|
38,503
|
||
|
John L. Rosenthal
|
$2,200,000
|
40,337
|
||
|
Peter M. Carlson
|
$2,400,000
|
44,004
|
||
|
Christine M. DeBiase
|
$2,012,500
|
36,899
|
||
Founders’ Grants awarded to our NEOs are subject to the Company’s achievement of one or more performance criteria during the performance period that began on September 8, 2017 and ends on September 30, 2018 (the “Performance Period”). The performance criteria, which are listed below, were established in order to qualify the Founders’ Grants as performance-based compensation under Section 162(m) of the Internal Revenue Code.
286
|
•
|
Improvement in the Company’s Statutory Surplus position over the Performance Period;
|
|
•
|
Combined Risk Based Capital ratio of at least 400% as of the end of the Performance Period on an Authorized Control Level;
|
|
•
|
Positive GAAP Operating ROE as of the end of the Performance Period;
|
|
•
|
Insurer Financial Strength Rating of at least “A-” from one or more credit rating agencies as of the end of the Performance Period;
|
|
•
|
Positive Value of New Business sold during the Performance Period for the annuity segment of the Company measured as of the end of the Performance Period; and
|
|
•
|
Variable Annuity funding at a level of CTE 95 or above as of the end of the Performance Period.
|
In the event we achieve one or more of the foregoing performance goals, and subject further to stockholder approval of the Employee Plan at the 2018 Annual Meeting, the RSUs subject to the Founders’ Grants will vest on September 30, 2018.
Founders’ Grants are not reported in the Summary Compensation Table, Grants of Plan-Based Awards Table or Outstanding Equity Awards at Fiscal Year End Table because Founders’ Grants are subject to stockholder approval of the Employee Plan, which the Company intends to seek at the 2018 Annual Meeting. If stockholders approve the Employee Plan, the Founders’ Grants will be reported under Securities and Exchange Commission rules as compensation to our NEOs for the fiscal year ending December 31, 2018. However, Founders’ Grants were intended to be a one-time award and were a central element of the Total Compensation delivered to our NEOs in Fiscal 2017.
Temporary Incentive Deferred Compensation Plan
Prior to the Separation, many of our employees, including all of our NEOs, were employees of an affiliate of MetLife and participated in benefit and compensation programs sponsored by MetLife or an affiliate. Certain employees, including our NEOs, received equity awards from MetLife during their employment.
In anticipation of the Separation, certain employees, including all of our NEOs, who had been eligible to receive equity awards from MetLife, ceased participating in MetLife’s equity compensation plan as of December 31, 2016 and, therefore, did not receive long-term equity awards from MetLife during 2017. In addition, certain employees, including some of our NEOs, forfeited their outstanding and unvested MetLife equity awards upon the Separation because these employees did not satisfy certain age and service requirements under MetLife’s equity compensation plan that would have allowed such employees’ outstanding equity awards to continue to vest.
As a result of the foregoing, and in order to attract, retain and motivate our employees who forfeited MetLife equity awards and/or did not receive such awards in 2017, the Temporary Plan was established prior to the Separation. The Temporary Plan allows us to provide affected employees, including our NEOs, cash-based deferred compensation credits in respect of forgone 2017 MetLife equity awards and forfeited MetLife equity awards. Credits for forgone awards under the Temporary Plan were established at the level consistent with the equity award the recipient would have been eligible to receive from MetLife. Deferred compensation credited in respect of forgone 2017 MetLife equity awards vests over three years from the grant date at a rate of one-third per year. Deferred compensation credited in respect of forfeited MetLife equity is subject to the same vesting schedule as the forfeited award. Credits in respect of forfeited RSUs vest one-third per year from the date of grant by MetLife, while credits in respect of forfeited stock options and forfeited performance shares cliff vest on the third anniversary of the date of grant by MetLife. Amounts credited under the Temporary Plan earn interest based upon the 120%AFR/Long Term/Monthly rate, which is reset effective December 1. For calendar year 2017, including Fiscal 2017, amounts under the Temporary Plan were credited with interest at a rate of 3.2%. In the event of a change of control, no amendments can be made to the Temporary Plan after a change of control that would decrease the amount of deferred compensation credited to participants under the Temporary Plan as of the date of the change of control or modify the time or form of distributions under the Temporary Plan.
287
The table below shows the amount of each type of deferred compensation credited to each NEO under the Temporary Plan:
|
Name
|
Credit in Lieu of 2017 MetLife Equity Award
|
Credit for Forfeited MetLife Equity Awards - Performance Shares
|
Credit for Forfeited MetLife Equity Awards - RSUs
|
Credit for Forfeited MetLife Equity Awards - Stock Options
|
Total Temporary Plan Credits
|
|||||
|
Eric T. Steigerwalt
|
$1,200,000
|
$—
|
$—
|
$—
|
$1,200,000
|
|||||
|
Anant Bhalla
|
$368,000
|
$300,000
|
$150,000
|
$—
|
$818,000
|
|||||
|
John L. Rosenthal
|
$700,200
|
$—
|
$—
|
$—
|
$700,200
|
|||||
|
Peter M. Carlson
|
$—
|
$1,187,500
|
$398,000
|
$507,373
|
$2,092,873
|
|||||
|
Christine M. DeBiase
|
$307,100
|
$—
|
$—
|
$—
|
$307,100
|
|||||
Awards to our NEOs under the Temporary Plan are further subject to the achievement of one or more performance goals, which were established in order to qualify such awards as performance-based compensation under Section 162(m) of the Internal Revenue Code. For the performance period ended December 31, 2017, the performance goals were:
|
•
|
Positive Operating GAAP Earnings;
|
|
•
|
Positive GAAP Operating ROE;
|
|
•
|
Improvement in Variable Annuity Target Funding adequacy level;
|
|
•
|
Combined Risk Based Capital Ratio of at least 400% on an authorized control level;
|
|
•
|
Positive Value of New Business for Annuity Segment;
|
|
•
|
Termination of at least 20% of TSAs with MetLife measured by expenses; and
|
|
•
|
Insurer financial strength ratings of at least “A-” from one or more credit rating agencies.
|
In January 2018, the Compensation Committee certified that the Company maintained an insurer financial strength rating of at least A- from one or more credit rating agencies for the 2017 performance period. As a result, we made payments to our NEOs under the Temporary Plan in respect of Fiscal 2017. The payments in respect of Fiscal 2017 made to our NEOs under the Temporary Plan are reported in the “Non-Equity Incentive Compensation Plan” column of the Summary Compensation Table on page 294. In addition, payments under the Temporary Plan may be made to our NEOs in connection with certain terminations of employment. See the Potential Payments Upon Termination or Change in Control table and accompanying narrative disclosure below for additional information.
At the 2018 Annual Meeting, we intend to seek stockholder approval of the material terms of the performance goals under the Temporary Plan for credits to our NEOs under the Temporary Plan paid after our annual meeting of stockholders in 2019.
Role of the Compensation Committee and Others in Determining Compensation
Compensation Committee’s Role
The Compensation Committee is responsible for establishing and implementing our executive compensation philosophy. Pursuant to its written charter, the responsibilities of the Compensation Committee include, among other things:
|
•
|
Assisting the Board in fulfilling its responsibility to oversee the development and administration of compensation programs for our executives and other employees;
|
|
•
|
Approving the goals and objectives relevant to our CEO’s compensation, evaluating at least annually our CEO’s performance in light of such goals and objectives, and endorsing, for approval by the independent directors, the CEO’s annual compensation based on such evaluation;
|
|
•
|
Reviewing and approving on an annual basis the compensation of the other executive officers of the Company (as determined by the Compensation Committee);
|
|
•
|
Reviewing and approving our equity and non-equity incentive compensation plans and arrangements, and where appropriate or required, recommending such plans and arrangements to the Board for approval, including by stockholders of the Company; and
|
288
|
•
|
Reviewing incentive compensation arrangements to confirm that incentive pay does not encourage unnecessary risk‐taking and reviewing and discussing the relationship between risk management policies and practices, corporate strategy and senior executive compensation.
|
As discussed above, in November 2017, the Compensation Committee retained SBCG as its independent compensation consultant. The Compensation Committee assessed SBCG’s independence in light of SEC standards and determined that no conflicts of interest or independence concerns exist. SBCG reports directly to the Compensation Committee, and the Compensation Committee has the sole authority to approve the fees and other terms of the retention of SBCG as its independent compensation consultant. SBCG is expected to attend all Compensation Committee meetings and to provide advice to the Compensation Committee on all aspects of the Company’s executive compensation program, including the form, mix and amount of Target Total Compensation.
Management’s Role
As discussed above, prior to the Separation, members of our Human Resources department worked with the Company’s compensation consultant, WTW, to gather and review compensation information from companies within the Comparator Group, as well as data from WTW’s proprietary diversified insurance survey database. Based on information from WTW, the Human Resources department prepared compensation recommendations for each member of the SLMG, including each NEO. Given that the Separation occurred more than half way through 2017, and also due to the fact that we did not have a Compensation Committee comprised of independent directors until the Separation, our Human Resources department, with assistance from WTW, was primarily responsible for preparing Fiscal 2017 compensation recommendations for all members of the SLMG, including each NEO. The compensation recommendations were provided to the members of our Compensation Committee in advance of its first post-Separation meeting in August 2017, and the Compensation Committee ultimately adopted the recommendations at its first post-Separation meeting in August 2017.
As part of our year-end compensation process that began in December 2017, our Chief Executive Officer met with each of our other NEOs and members of the SLMG to review performance during calendar year 2017. Based on the CEO’s assessment of each of our other NEO’s performance, he provided recommendations to the Compensation Committee as to the amount and form of the compensation of our NEOs other than himself.
Compensation Consultant’s Role
Under its written charter, the Compensation Committee has the authority to retain advisers to assist it in the discharge of its duties. Since its retention in November 2017 shortly after the Separation, SBCG has attended Compensation Committee meetings and assisted the Compensation Committee in its implementation of our compensation principles and practices. SBCG has advised the Compensation Committee on the development of the Company’s 2018 short- and long-term incentive compensation arrangements, including the short- and long-term incentive plan metrics for 2018 and the forms of equity-based incentives awarded to members of the SLMG in 2018. See “2018 Compensation-Setting Process — 2018 Compensation Decisions,” below, for additional information.
In 2017, our Human Resources department retained WTW to provide assistance related to our executive compensation program that was implemented in August 2017 in connection with the Separation. It is expected that WTW will continue to advise our Human Resources department on matters related to our executive compensation program. Details of WTW’s role are set forth above under the heading “Management’s Role.”
Section 3 — The Brighthouse Vision and Strategy — Establishing the 2018 Executive Compensation Program
Brighthouse Financial is a focused provider of annuities and life insurance products. Brighthouse’s mission is to help people achieve financial security. The products that we offer, particularly annuities, have historically been considered complex and costly. We intend to achieve our mission by offering simpler, more transparent, and valuable protection solutions. Our business goal is to build a focused, best-in-cost culture that creates value. We believe that by embedding best-in-cost into our culture at the outset of our existence as an independent public company, we will drive value for all our stakeholders, including our stockholders, community, employees, insurance customers, and our distribution partners.
On February 2, 2018, the Board and senior management, including our NEOs, engaged in constructive dialogue and feedback regarding our strategic and financial plan. The topics discussed covered all aspects of our business, including our mission and vision, our best-in-cost culture, the competitive landscape, our sales strategy and growth projections, our annuity and life insurance product strategy, our business process outsourcing strategy, our path to expense optimization, our capital return goals, and our financial plan through 2020 in a variety of economic scenarios.
As a result of these strategic sessions, on February 2, 2018, the Compensation Committee focused on establishing performance metrics that aligned all aspects of the Company’s strategy: sales, expense management, and cashflow. Adjusted
289
Statutory Earnings was deemed an appropriate 2018 short-term incentive (“STI”) award metric that aligns to our ability as an independent company to return cash to stockholders. These conversations became the basis for establishing our 2018 compensation program. On February 16, 2018, the Compensation Committee approved the 2018 compensation program that applies to the NEOs and the SLMG. The 2018 compensation program will be discussed in detail in the proxy statement related to the 2019 annual meeting of stockholders. Due to the mid-year timing of the Separation, the 2018 compensation program is the first compensation program for Brighthouse that relates to a full annual performance period(s) as an independent public company. Accordingly, we believe it is appropriate to preview the 2018 compensation program and articulate the alignment to the Company’s strategic and financial plan.
2018 Short-Term Incentive Metrics
The Compensation Committee approved metrics for the 2018 STI award that directly align with Brighthouse’s strategic plans. This is consistent with our pay-for-performance philosophy and will ensure that the NEOs are compensated relative to the achievement of the business goals set forth in the strategic plan. A brief summary of each of the three equally-weighted metrics and the rationale for selecting each follow.
|
2018 STI Metric
|
Weighting
|
Performance Link
|
|
TSA Exits
|
1/3rd
|
Exiting our TSAs with MetLife is a key driver in 2018 of establishing a cost-competitive company. We also believe that TSA Exits in 2018 represent a key directional indicator for reducing corporate expenses in 2019 and 2020.
|
|
Annuity Sales
|
1/3rd
|
Annuity sales are vital to our growth prospects and franchise stability.
|
|
Adjusted Statutory Earnings
|
1/3rd
|
Adjusted Statutory Earnings measure Brighthouse’s ability to pay future distributions and are reflective of whether our hedging program functions as intended. As an STI metric, it also reflects factors that the broad population of STI participants are most able to directly impact and influence.
|
Each 2018 STI metric has a threshold (50%), target (100%) and maximum (150%) level of performance. Short-term incentive plan payouts, if any, will be based upon the Company’s achievement of the metrics specified above, as well as qualitative factors the Compensation Committee deems appropriate, including each SLMG member’s accomplishments during 2018. We believe the underlying goals for each STI metric are appropriately rigorous. If earned, STI awards for 2018 will be paid in calendar year 2019.
2018 Long-Term Incentive Awards
In February 2018, the independent members of the Board, on the recommendation of the Compensation Committee, approved a long-term equity incentive (“LTI”) award for Mr. Steigerwalt, and the Compensation Committee approved LTI awards for our other NEOs. The table below shows the breakdown of award vehicles chosen for 2018 long-term equity incentive awards.
|
Type of Award
|
Percentage of Total LTI Value
|
Vesting
|
|
Performance Share Units (“PSUs”)
|
1/3rd
|
Cliff vest after year 3, subject to achievement of pre-established performance goals over the 2018-2020 performance period
|
|
Nonqualified Stock Options
|
1/3rd
|
Ratable vesting over 3 years (1/3rd vests at each anniversary; 10-year term; exercise price is closing price on grant date)
|
|
Restricted Stock Units
|
1/3rd
|
Ratable vesting over 3 years (1/3rd vests at each anniversary)
|
The decision to use PSUs, and the mix of PSUs relative to the other long-term equity elements, was carefully considered by the Compensation Committee in light of the challenges of setting long-term performance goals as a new public company. The Compensation Committee will consider a heavier weighting of PSUs in future awards as the Company matures and gains historical data that makes long-term goal setting more precise. The 2018 long-term equity incentive awards are subject to stockholder approval of the Employee Plan, which will be presented at the 2018 Annual Meeting.
The 2018 PSUs measure Brighthouse’s performance over the 2018-2020 performance period. The actual number of shares issued, if any, at the end of the performance period will depend on the Company’s actual performance. We believe the underlying goals for each PSU metric are appropriately rigorous. A brief summary of the PSU metrics, the weighting and the rationale for each follow.
290
|
2018 PSU Metrics
|
Weighting
|
Performance Link
|
|
Corporate Expense Reduction
|
60%
|
Expense reduction by 2020 aligns with Brighthouse’s outlook, as previously disclosed in public filings. As a result of Brighthouse’s mid-year separation from MetLife, the comparative measurement period is July 1, 2017 - June 30, 2018 versus annualized expenses from July 1, 2020 - December 31, 2020.
|
|
Capital Return
|
40%
|
Capital returns are a key metric evaluated by stockholders. Capital return is often the best way to demonstrate alignment to stockholders’ interests, especially if the stock trades below book value. Return on stockholders’ capital, in the form of dividends or stock buybacks, for example, would demonstrate such an alignment, and goals will align with stockholder communications.
|
2018 Target Total Compensation Opportunities
With the exception of the changes described below to Ms. DeBiase’s Target Total Compensation opportunity, no adjustments were made to the Target Total Compensation opportunities of the CEO or any of the other NEOs. In February 2018, Ms. DeBiase was named the Company’s Chief Administrative Officer, in addition to her position as the Company’s General Counsel. In connection with Ms. DeBiase’s expanded role as the Chief Administrative Officer, the Compensation Committee adjusted Ms. DeBiase’s base salary to $600,000 from $575,000 and also increased Ms. DeBiase’s target annual incentive opportunity to 120% of her base salary from 110%. Her long-term incentive opportunity was unchanged.
Section 4 — Additional Compensation Practices and Policies
Stock Ownership and Retention Guidelines
We have implemented stock ownership and retention guidelines for members of the SLMG, including our NEOs, effective January 1, 2018. The guidelines are intended to align the interests of the SLMG members with those of our stockholders by requiring the executives subject to the guidelines to obtain and maintain significant ownership in our stock. The ownership guidelines are set as a multiple of the executive’s base salary as in effect on January 1, 2018, which is then converted into a number of shares of common stock based upon the closing price of our common stock on January 2, 2018, which was $57.67. The ownership levels applicable to our NEOs are as follows.
|
Name
|
Multiple of Base Salary
|
Number of Shares
|
||||||
|
Eric T. Steigerwalt
|
6x
|
93,637
|
||||||
|
Anant Bhalla
|
3x
|
31,213
|
||||||
|
John L. Rosenthal
|
3x
|
28,612
|
||||||
|
Peter M. Carlson
|
3x
|
31,213
|
||||||
|
Christine M. DeBiase
|
3x
|
29,912
|
||||||
Executives subject to the guidelines must retain at least 50% of the net after-tax shares acquired from settlement or exercise of stock-based awards until the applicable ownership level is achieved. Executives are expected to meet the applicable stock ownership guideline within five years of becoming subject to the guidelines. Shares that are included in determining an executive’s stock ownership level include shares owned outright (or jointly with a spouse or in a trust over which an executive has investment control), net shares received from exercise and/or settlement of stock-based awards under the Employee Plan, and shares acquired pursuant to the Company’s Employee Stock Purchase Plan. Shares underlying unvested equity awards are not included in determining an executive’s ownership level.
Benefit Plans
Brighthouse Savings Plan and Auxiliary Savings Plan
Our employees, including our NEOs, are eligible to participate in the Brighthouse Services, LLC Savings Plan and Trust (the “Brighthouse Savings Plan”), which is a tax-qualified 401(k) plan. In addition, certain of our employees, including our NEOs, are eligible to participate in the Brighthouse Services, LLC Auxiliary Savings Plan (the “Auxiliary Plan”). Participants in the Auxiliary Plan receive company matching and profit sharing contributions that would have been made to the Brighthouse Savings Plan except that the participant’s compensation exceeds certain tax qualified plan limits imposed under the Internal Revenue Code. Employees who elect to participate in the Brighthouse Savings Plan and who also elect to participate in the Brighthouse Services, LLC Voluntary Deferred Compensation Plan (“VDCP”) will be eligible to receive matching contributions in the Auxiliary Plan on amounts deferred into the VDCP equal to the amount of matching contributions that would have been made to the Brighthouse Savings Plan. As explained below, the VDCP was not in effect during Fiscal 2017. For the Company matching and profit sharing contributions made under the
291
Brighthouse Savings Plan and Auxiliary Plan in respect of Fiscal 2017, see the “All Other Compensation” column in the Summary Compensation Table, below. Company matching and profit sharing contributions in the Brighthouse Savings Plan and the Auxiliary Plan become 100% vested after the participant completes two years of service. Under the Auxiliary Plan, in the event of a change of control, all participants will be fully vested in all contributions, including earnings, under the Auxiliary Plan. In addition, no amendments can be made to the Auxiliary Plan after a change of control that would decrease the value of benefits accrued to any participant under the Auxiliary Plan as of the date of the change of control or change the time or form of distribution under the Auxiliary Plan to eliminate lump sum distributions or further defer the time of payment.
Voluntary Deferred Compensation Plan
In December 2017, Brighthouse Services adopted the VDCP, which is a non-qualified deferred compensation plan. Effective January 1, 2018, the VDCP allows a select group of management the opportunity to defer between 10% and 50% of eligible base salary and from 10% to 80% of STI awards. Amounts deferred are notionally invested in investment tracking funds selected by the participant. Participants can elect to have deferred compensation accounts paid, or begin to be paid, in a specific year, which cannot be earlier than May of the third calendar year following the year the compensation was earned, and may elect to receive distributions in either a single lump sum or up to 15 annual installments. In the event of a participant’s death before distributions commence or are completed, the participant’s account balance will be paid in a single lump sum to the participant’s beneficiary. In the event of a change of control, no amendments can be made to the VDCP after a change of control that would decrease the amount in a participant’s deferred compensation account accrued under the VDCP as of the date of the change of control or modify the time or form of distributions under the VDCP.
Termination and Change in Control Benefits
As of December 31, 2017, we had no employment agreements or offer letters with any of our NEOs that provide for severance or change in control benefits. As we previously disclosed, we intend to provide severance pay and related benefits to employees discontinued due to job elimination in order to encourage a focus on transition to other opportunities and allow us to obtain a release of employment-related claims, and to adopt change-in-control arrangements in order to retain senior executive officers while a transaction is pending and encourage them to act in the best interests of stockholders, promoting maximum stockholder value without impinging on flexibility to engage in a transaction.
During Fiscal 2017, we did not have any outstanding equity awards because we did not have a stockholder-approved equity compensation plan. We intend to submit the Employee Plan for stockholder approval at the 2018 Annual Meeting. Awards under the Employee Plan may become payable in the event of an NEO’s termination, retirement, or death, or upon the occurrence of a change in control of Brighthouse. Under the Auxiliary Plan, in the event of a change of control, all participants will be fully vested in all contributions, including earnings, under the Auxiliary Plan. As of December 31, 2017, all of our NEOs were fully vested in their account balances under the Auxiliary Plan. See the Fiscal 2017 Nonqualified Deferred Compensation table on page 297 for each NEO’s aggregate account balance as of December 31, 2017.
Certain amounts credited to our NEOs under the Temporary Plan may vest and become payable in the event of the NEO’s death or termination on or following the date the NEO satisfies the “rule of 65” (generally, an age and service requirement). See the Potential Payments Upon Termination or Change in Control table, below, for additional information about amounts that would be payable to our NEOs under the Temporary Plan.
Stock-Based Award Timing Practices
Stock-based long-term incentive awards are expected to be granted on an annual basis to our executive officers, including the NEOs, in connection with Board and Compensation Committee meetings occurring in the first quarter of each year, although stock-based awards may be granted from time-to-time in connection with the hiring or change in responsibilities of an executive officer.
Tax Deductibility of Executive Compensation
For 2017, Section 162(m) of the Internal Revenue Code placed a $1 million limit on the compensation that could be deducted for our chief executive officer and next three most highly compensated NEOs, except for compensation that qualified as performance-based compensation under Section 162(m). Certain elements of the compensation we provided in 2017 were intended to qualify for the performance-based compensation exception to Section 162(m), although the Compensation Committee retained discretion to pay non-deductible compensation if it determined doing so was in our best interest. The Tax Cuts and Jobs Act (TCJA), which was signed into law on December 22, 2017, eliminated the exception for performance based compensation under Section 162(m), although the TCJA does include a provision that grandfathers
292
certain binding contracts in effect on November 2, 2017 that are not materially modified after that date. In light of the change in law, beginning in 2018 any compensation paid to our NEOs in excess of $1 million will not be deductible, except with respect to such grandfathered contracts.
Hedging and Pledging Prohibition
Our insider trading policy prohibits all directors and employees, including our NEOs, from engaging in short sales, hedging, and trading in put and call options, with respect to the Company’s securities. The insider trading policy also prohibits directors and employees, including our NEOs, from pledging Company securities.
Clawback Policy
We expect to adopt a performance-based compensation recoupment policy that would allow us to seek recoupment of performance-based compensation if an employee engages in or contributes to fraudulent or other wrongful conduct that causes financial or reputational harm to Brighthouse or its affiliates. All awards granted under our Employee Plan are subject to any performance-based compensation recoupment policy in effect from time to time.
Risk Assessment
At its March 2018 meeting, the Compensation Committee reviewed the results of a 2017 annual compensation risk assessment prepared by SBCG and developed in consultation with management. Such assessment highlighted the inherently risk-balancing and risk-mitigating nature of the Company’s largely discretionary compensation program in 2017, other risk-mitigating features of the compensation program (such as caps on incentive payouts and balance in pay mix), and the associated compensation governance policies and Board-level controls in place to manage compensation-related risk. Following a discussion of such assessment and findings, the Compensation Committee concluded that the risks arising from the Company’s compensation programs are not reasonably likely to have a material adverse impact on the Company.
Compensation Committee Report
The Compensation Committee has reviewed the Compensation Discussion and Analysis and discussed the CD&A with management. Based on the Compensation Committee’s review and discussion with management, the Compensation Committee recommended to the Board that the CD&A be included in the Company’s annual report on Form 10-K and in the Company’s Proxy Statement.
This report is provided by the following independent members of the Board, who comprise the Compensation Committee:
Diane E. Offereins, Chair
Irene Chang Britt
Paul M. Wetzel
Fiscal 2017 Compensation Tables
The information reported in the Summary Compensation Table is for the period from August 5, 2017, which is the first day following the Separation, to December 31, 2017. We refer to this period as “Fiscal 2017.” The footnotes to the Summary Compensation Table and the accompanying narrative disclosure discuss the manner in which the Fiscal 2017 compensation for our NEOs was calculated.
293
Fiscal 2017 Summary Compensation Table
|
Name and Title
|
Year
|
Salary (1)
|
Non-Equity Incentive Plan Compensation (2)(3)
|
All Other Compensation (4)
|
Total
|
|||||
|
Eric T. Steigerwalt, President and Chief Executive Officer
|
2017
|
$349,049
|
$1,507,192
|
$115,853
|
$1,972,094
|
|||||
|
Anant Bhalla, Executive Vice President and Chief Financial Officer
|
2017
|
$233,641
|
$688,444
|
$63,574
|
$985,659
|
|||||
|
John L. Rosenthal, Executive Vice President and Chief Investment Officer
|
2017
|
$218,109
|
$894,708
|
$75,297
|
$1,188,114
|
|||||
|
Peter M. Carlson, Executive Vice President and Chief Operating Officer
|
2017
|
$237,862
|
$771,139
|
$55,045
|
$1,064,046
|
|||||
|
Christine M. DeBiase, Executive Vice President, General Counsel and Corporate Secretary (*)
|
2017
|
$224,232
|
$534,024
|
$50,041
|
$808,297
|
|||||
_______________
|
(*)
|
Effective February 2, 2018, Ms. DeBiase’s title was changed to Executive Vice President, Chief Administrative Officer and General Counsel. As of that date, Ms. DeBiase ceased serving as the Company’s Corporate Secretary.
|
|
(1)
|
The amounts in this column report the actual amount of base salary paid to each NEO during Fiscal 2017. Each NEO’s base salary as approved on August 9, 2017 is $900,000 for Mr. Steigerwalt, $600,000 for Mr. Bhalla, $550,000 for Mr. Rosenthal, $600,000 for Mr. Carlson, and $575,000 for Ms. DeBiase.
|
|
(2)
|
The amount in this column includes (i) the portion of each NEO’s award under the Brighthouse Services, LLC Amended and Restated Annual Variable Incentive Plan earned in respect of each NEO’s service to Brighthouse during Fiscal 2017, (ii) the Separation Bonus paid to each NEO, and (iii) the pro-rated portion of the aggregate payments, including interest, received by each NEO under the Temporary Plan in respect of service to Brighthouse during Fiscal 2017. The terms of AVIP and the Separation Bonus are summarized under “Compensation Discussion and Analysis — Elements of Compensation — Annual Variable Incentive Plan” and “Separation Bonus” above. The terms of the Temporary Plan are summarized below in the narrative disclosure accompanying the “Grants of Plan-Based Awards” table.
|
The table below shows the amount earned by each NEO in Fiscal 2017 under the AVIP, the Separation Bonus and the Temporary Plan.
|
Name
|
Annual Variable Incentive Plan
|
Separation Bonus
|
Temporary Incentive Deferred Compensation Plan
|
|||
|
Eric T. Steigerwalt
|
$771,534
|
$472,500
|
$263,158
|
|||
|
Anant Bhalla
|
$342,904
|
$210,000
|
$135,540
|
|||
|
John L. Rosenthal
|
$459,655
|
$281,500
|
$153,553
|
|||
|
Peter M. Carlson
|
$363,723
|
$222,750
|
$184,666
|
|||
|
Christine M. DeBiase
|
$289,427
|
$177,250
|
$67,347
|
|||
294
The table below shows the amount, including interest, paid to each NEO for Fiscal 2017 in respect of the different types of credits under the Temporary Plan.
|
Name
|
Fiscal 2017 Payment for Credit in Lieu of 2017 MetLife Equity Award
|
Fiscal 2017 Payment for Credit for Forfeited MetLife Equity Awards - Performance Shares
|
Fiscal 2017 Payment for Credit for Forfeited MetLife Equity Awards - RSUs
|
Fiscal 2017 Payment for Credit for Forfeited MetLife Equity Awards - Stock Options
|
||||
|
Eric T. Steigerwalt
|
$263,158
|
$—
|
$—
|
$—
|
||||
|
Anant Bhalla
|
$80,702
|
$29,796
|
$24,726
|
$—
|
||||
|
John L. Rosenthal
|
$153,553
|
$—
|
$—
|
$—
|
||||
|
Peter M. Carlson
|
$—
|
$76,973
|
$71,378
|
$36,315
|
||||
|
Christine M. DeBiase
|
$67,347
|
$—
|
$—
|
$—
|
||||
|
(3)
|
The full amount received by each NEO under the Temporary Plan for calendar year 2017, including interest, is $409,712 for Mr. Steigerwalt, $378,815 for Mr. Bhalla, $239,067 for Mr. Rosenthal, $777,964 for Mr. Carlson, and $104,852 for Ms. DeBiase. The full amount of each NEO’s AVIP award for calendar year 2017 is $1,890,000 for Mr. Steigerwalt, $840,000 for Mr. Bhalla, $1,126,000 for Mr. Rosenthal, $891,000 for Mr. Carlson, and $709,000 for Ms. DeBiase.
|
|
(4)
|
The amounts reported in this column include for each NEO Company contributions in respect of Fiscal 2017 to the Brighthouse Savings Plan and the Auxiliary Plan, in the following amounts:
|
|
Name
|
Brighthouse Savings Plan
|
Auxiliary Plan
|
||
|
Eric T. Steigerwalt
|
$7,221
|
$93,637
|
||
|
Anant Bhalla
|
$12,214
|
$31,213
|
||
|
John L. Rosenthal
|
$9,061
|
$28,612
|
||
|
Peter M. Carlson
|
$12,384
|
$31,213
|
||
|
Christine M. DeBiase
|
$8,895
|
$29,912
|
||
Fiscal 2017 Grants of Plan-Based Awards
Prior to the Separation, many of our employees, including all of our NEOs, were employees of MetLife. In anticipation of the Separation, we established the Temporary Plan to provide a means of compensating such employees in respect of forgone 2017 equity awards from MetLife and/or MetLife equity awards that were forfeited due to the Separation. The amounts credited to our NEOs under the Temporary Plan for Fiscal 2017 are reported in the table below.
The dollar value reported in the Non-Equity Incentive Plan column of the Summary Compensation Table for payments under the Temporary Plan has been pro-rated to show the portion of such payments that were made in respect of our NEOs service during Fiscal 2017. Prior to August 5, 2017, Brighthouse Services, which is the entity that employs our employees, was a wholly-owned subsidiary of MetLife, and as a result, compensation received prior to August 5, 2017 is not reportable under Securities and Exchange Commission rules as compensation paid by Brighthouse. The total Temporary Plan credits awarded to our NEOs is disclosed above under the heading “Compensation Discussion and Analysis — Features of our Fiscal 2017 Executive Compensation Program — Elements of Fiscal 2017 Compensation — Temporary Incentive Deferred Compensation Plan.”
The amounts reported in the table below awarded under the Temporary Plan are not subject to stockholder approval due to the spin-off transition rules under Section 162(m) of the Internal Revenue Code. We intend to submit the material terms of the performance goals for certain future tranches payable under the Temporary Plan for stockholder approval at the 2018 Annual Meeting.
295
|
Name
|
Grant Type
|
Grant Date
|
Estimated future payouts under
non-equity incentive plan awards
|
|||||||
|
Threshold
|
Target
|
Maximum
|
||||||||
|
Eric T. Steigerwalt
|
AVIP
|
$—
|
$1,800,000
|
$7,000,000
|
||||||
|
Separation Bonus
|
$—
|
$450,000
|
$—
|
|||||||
|
Temporary Plan - Credit in Lieu of 2017 MetLife Equity Award
|
8/9/17
|
$—
|
$263,158(1)
|
$—
|
||||||
|
Anant Bhalla
|
AVIP
|
$—
|
$840,000
|
$7,000,000
|
||||||
|
Separation Bonus
|
$—
|
$210,000
|
$—
|
|||||||
|
Temporary Plan - Credit in Lieu of 2017 MetLife Equity Award
|
3/28/17
|
$—
|
$80,702(1)
|
$—
|
||||||
|
Temporary Plan - Credit for Forfeited 2015 MetLife RSUs
|
8/7/17
|
$—
|
$9,932(2)
|
$—
|
||||||
|
Temporary Plan - Credit for Forfeited 2016 MetLife RSUs
|
8/7/17
|
$—
|
$14,794(3)
|
$—
|
||||||
|
Temporary Plan - Credit for Forfeited 2015 MetLife Performance Shares
|
8/7/17
|
$—
|
$29,796(4)
|
$—
|
||||||
|
John L. Rosenthal
|
AVIP
|
$—
|
$1,072,500
|
$7,000,000
|
||||||
|
Separation Bonus
|
$—
|
$268,125
|
$—
|
|||||||
|
Temporary Plan - Credit in Lieu of 2017 MetLife Equity Award
|
3/28/17
|
$—
|
$153,553(1)
|
$—
|
||||||
|
Peter M. Carlson
|
AVIP
|
$—
|
$900,000
|
$7,000,000
|
||||||
|
Separation Bonus
|
$—
|
$225,000
|
$—
|
|||||||
|
Temporary Plan - Credit for Forfeited 2015 MetLife RSUs
|
8/7/17
|
$—
|
$12,832(2)
|
$—
|
||||||
|
Temporary Plan - Credit for Forfeited 2016 MetLife RSUs
|
8/7/17
|
$—
|
$19,735(3)
|
$—
|
||||||
|
Temporary Plan - Credit for Forfeited 2017 MetLife RSUs
|
8/7/17
|
$—
|
$38,811(5)
|
$—
|
||||||
|
Temporary Plan - Credit for Forfeited 2015 MetLife Performance Shares
|
8/7/17
|
$—
|
$76,973(4)
|
$—
|
||||||
|
Temporary Plan - Credit for Forfeited 2015 MetLife Stock Options
|
8/7/17
|
$—
|
$36,315(6)
|
$—
|
||||||
|
Christine M. DeBiase
|
AVIP
|
$—
|
$632,500
|
$7,000,000
|
||||||
|
Separation Bonus
|
$—
|
$177,250
|
$—
|
|||||||
|
Temporary Plan - Credit in Lieu of 2017 MetLife Equity Award
|
3/28/17
|
$—
|
$67,347(1)
|
$—
|
||||||
_______________
|
(1)
|
Represents a pro-rated portion, including interest, of the credit under the Temporary Plan awarded in respect of forgone 2017 equity awards from MetLife. This first tranche of the credit vests on March 28, 2018 and was subject to the achievement of one or more performance goals established for purposes of Section 162(m) of the Code.
|
|
(2)
|
Represents a pro-rated portion, including interest, of the credit under the Temporary Plan award in respect of a MetLife restricted stock unit award granted by MetLife in 2015 that was forfeited as a result of the Separation. This credit vested on February 24, 2018 and was subject to the achievement of one or more performance goals established for purposes of Section 162(m) of the Code.
|
|
(3)
|
Represents a pro-rated portion, including interest, of the credit under the Temporary Plan award in respect of a MetLife restricted stock unit award granted by MetLife in 2016 that was forfeited as a result of the Separation. This portion of the credit in respect of this award vested on March 1, 2018 and was subject to the achievement of one or more performance goals established for purposes of Section 162(m) of the Code.
|
|
(4)
|
Represents a pro-rated portion, including interest, of the credit under the Temporary Plan award in respect of MetLife performance shares granted by MetLife in 2015 that were forfeited as a result of the Separation. This credit vested on
|
296
February 24, 2018 and was subject to the achievement of one or more performance goals established for purposes of Section 162(m) of the Code.
|
(5)
|
Represents the pro-rated portion, including interest, of the credit under the Temporary Plan award in respect of a MetLife restricted stock unit award granted by MetLife in 2017 that was forfeited as a result of the Separation. This portion of the credit vested on March 1, 2018 and was subject to the achievement of one or more performance goals established for purposes of Section 162(m) of the Code.
|
|
(6)
|
Represents a pro-rated portion, including interest, of the credit under the Temporary Plan awarded in respect of a MetLife stock option award granted by MetLife in 2015 that was forfeited as a result of the Separation. This credit vested on February 24, 2018 and was subject to the achievement of one or more performance goals established for purposes of Section 162(m) of the Code.
|
Fiscal 2017 Nonqualified Deferred Compensation
|
Name
|
Plan Name
|
Executive contributions in last Fiscal Year
|
Registrant contributions in last Fiscal Year (1)
|
Aggregate earnings in last Fiscal Year
|
Aggregate withdrawals/ distributions
|
Aggregate balance at last Fiscal Year end
|
||||||
|
Eric T. Steigerwalt
|
Auxiliary Plan
|
$—
|
$108,632
|
$2,110
|
$—
|
$257,469
|
||||||
|
Anant Bhalla
|
Auxiliary Plan
|
$—
|
$51,539
|
$1,536
|
$—
|
$100,018
|
||||||
|
John L. Rosenthal
|
Auxiliary Plan
|
$—
|
$66,236
|
$1,367
|
$—
|
$177,677
|
||||||
|
Peter M. Carlson
|
Auxiliary Plan
|
$—
|
$42,660
|
$209
|
$—
|
$74,775
|
||||||
|
Christine M. DeBiase
|
Auxiliary Plan
|
$—
|
$41,146
|
$610
|
$—
|
$80,164
|
||||||
_______________
|
(1)
|
Amounts in this column are reported as components of employer contributions to the Auxiliary Plan for Fiscal 2017 in the “All Other Compensation” column of the Summary Compensation Table above.
|
Auxiliary Plan
NEOs and other eligible employees who elected to contribute a portion of their eligible compensation under the tax-qualified Brighthouse Savings Plan in 2017 received a Company matching contribution which is equal to 100% of the first 6% of their eligible compensation in that plan in 2017. In addition, a non-elective Company contribution equal to 3% of the compensation is allocated to eligible employees in that plan in 2017. Amounts reported in the Nonqualified Deferred Compensation table have been pro-rated to reflect the portion of the employer contributions to the Auxiliary Plan that relate to each NEO’s service during Fiscal 2017.
The U.S. Internal Revenue Code limits compensation that is eligible for employer contributions under the Brighthouse Savings Plan. In 2017, the Company could not make contributions based on compensation over $270,000. NEOs and other eligible employees who elected to participate in the Brighthouse Savings Plan during 2017 were credited with a percentage of their eligible compensation beyond that limit. The Company contribution, both the matching and non-elective contribution, was determined using the same employee contribution rate and Company contribution rate as applied under the Brighthouse Savings Plan. This Company contribution is credited to an account established for the employee under the nonqualified Auxiliary Plan.
Auxiliary Plan balances are paid in a lump sum as soon as administratively practicable after termination of employment.
Amounts in the Auxiliary Plan are subject to the requirements of Section 409A. Payments to the top 50 highest paid officers that are due upon separation from service are delayed for six months following their separation, in compliance with Section 409A.
Employees may choose from a number of simulated investments for their Auxiliary Plan accounts. These simulated investments were identical to the core funds offered under the Brighthouse Savings Plan in 2017. Employees may change the simulated investments for new Company contributions to their Auxiliary Plan accounts at any time.
297
The following table shows the simulated investment return for each of the alternatives under the Auxiliary Plan for calendar year 2017.
|
Fund Name
|
2017 Return
|
|
|
Schwab Government Money Fund - Investor Shares
|
0.50%
|
|
|
Western Asset Core Bond Fund Class Investor Shares
|
5.23%
|
|
|
Vanguard Inflation-Protected Securities Fund Admiral Shares
|
2.91%
|
|
|
Vanguard Value Index Fund Admiral Shares
|
17.13%
|
|
|
Vanguard 500 Index Fund Admiral Shares
|
21.79%
|
|
|
Vanguard Mid-Cap Index Fund Admiral Shares
|
19.25%
|
|
|
Vanguard Small Cap Index Fund Admiral Shares
|
16.24%
|
|
|
Fidelity Nasdaq Composite Index
|
29.25%
|
|
|
Fidelity Overseas Fund
|
29.65%
|
|
|
Vanguard Emerging Markets Stock Index Fund Admiral Shares
|
31.38%
|
|
|
Cohen & Steers Real Estate Securities Fund, Inc. Class Institutional
|
8.09%
|
|
|
American Funds 2010 Target Date Retirement Fund - Class R6
|
10.41%
|
|
|
American Funds 2015 Target Date Retirement Fund - Class R6
|
11.19%
|
|
|
American Funds 2020 Target Date Retirement Fund - Class R6
|
12.87%
|
|
|
American Funds 2025 Target Date Retirement Fund - Class R6
|
15.33%
|
|
|
American Funds 2030 Target Date Retirement Fund - Class R6
|
18.40%
|
|
|
American Funds 2035 Target Date Retirement Fund - Class R6
|
21.04%
|
|
|
American Funds 2040 Target Date Retirement Fund - Class R6
|
21.98%
|
|
|
American Funds 2045 Target Date Retirement Fund - Class R6
|
22.44%
|
|
|
American Funds 2050 Target Date Retirement Fund - Class R6
|
22.61%
|
|
|
American Funds 2055 Target Date Retirement Fund - Class R6
|
22.63%
|
|
|
American Funds 2060 Target Date Retirement Fund - Class R6
|
22.49%
|
|
Potential Payments Upon Termination or Change in Control
Temporary Incentive Deferred Compensation Plan
Our NEOs may be eligible to receive payments under the Temporary Plan in the event of a termination of employment under certain circumstances, as described below.
Credits in Respect of Forfeited MetLife Equity Awards
The following provisions apply to NEOs who received credits under the Temporary Plan in respect of MetLife equity awards that were forfeited as a result of the Separation:
Termination followed by entry into a separation agreement with Brighthouse Services.
If Brighthouse Services agrees to enter into a separation agreement with the NEO under a severance program of Brighthouse Services and the separation agreement is effective no later than March 15
th
of the year after the separation agreement is offered to the NEOs, the NEO’s outstanding Temporary Plan credits in respect of forfeited MetLife equity awards will vest when the separation agreement becomes final. Payments will be made as soon as administratively practicable following the original vesting date(s), subject to the achievement of the Section 162(m) performance metrics established for each year. There is currently no, and during Fiscal 2017 there was no, severance program in which our NEOs are eligible to participate.
Death.
In the event of an NEO’s termination due to death, the NEO’s credits in respect of forfeited MetLife equity awards will vest immediately prior to such termination. Payments in respect of such credits will be made as soon as administratively practicable following the original vesting date(s), without regard to the requirement that the Section 162(m) performance metrics established for each year are achieved.
All other terminations.
In the event of an NEO’s termination for any other reason, all unvested credits in respect of forfeited MetLife equity awards will be forfeited, provided that if an NEO is terminated for “Cause,” all outstanding credits, whether vested or unvested, will be forfeited.
298
Credits in Respect of Forgone 2017 MetLife Equity Awards
The following provisions apply to NEOs who received credits under the Temporary Plan in respect of forgone 2017 equity awards from MetLife:
Rule of 65.
If an NEO’s employment terminates on or after the NEO’s “Rule of 65 Date” (other than a termination for “Cause”), the tranche(s) of the credits in respect of forgone 2017 MetLife equity awards that have not yet vested will become vested as of immediately after the termination, and will be paid as soon as administratively practicable after six months following the original vesting date for each such tranche, subject to the achievement of the Section 162(m) performance metrics established for such tranche. “Rule of 65 Date” means the date that the sum of a participant’s age plus years of service equals or exceed 65, provided the participant has at least five (5) years of service.
Termination followed by entry into a separation agreement with Brighthouse Services.
If Brighthouse Services agrees to enter into a separation agreement with the NEO under a severance program of Brighthouse Services and the separation agreement is effective no later than March 15
th
of the year after the separation agreement is offered to the NEOs, the tranche(s) of the credits in respect of forgone 2017 MetLife equity awards that have not yet vested will become vested when the separation agreement becomes final, and will be paid as soon as administratively practicable after six months following the original vesting date(s) for each such tranche, subject to the achievement of the Section 162(m) performance metrics established for each year. There is currently no, and during Fiscal 2017 there was no, severance program in which our NEOs are eligible to participate.
Death.
In the event of an NEO’s termination due to death, all unvested tranche(s) of the credits in respect of forgone 2017 MetLife equity awards that have not yet vested will become vested as of immediately after the termination. Payment will be made as soon as administratively practicable following the original vesting date(s), without regard to the requirement that the Section 162(m) performance metrics established for each year are achieved.
All other terminations.
In the event of an NEO’s termination for any other reason, all unvested credits in respect of forgone 2017 MetLife equity awards will be forfeited provided that if an NEO is terminated for “Cause,” all outstanding credits, whether vested or unvested, will be forfeited.
Under the Temporary Plan, “Cause” generally means: (i) willful failure to substantially perform duties (other than due to physical or mental illness) after reasonable notice of such failure; (ii) engaging in serious misconduct that is injurious to Brighthouse or any affiliate in any way, including damage to reputation or standing; (iii) being convicted of, or entering a plea of nolo contendere to, a felony; or (iv) breach of any written covenant or agreement with Brighthouse or any affiliate not to disclose or misuse any information pertaining to, or misuse and property of Brighthouse or any affiliate or not to complete or interfere with Brighthouse or any affiliate.
The Temporary Plan does not provide for any payments upon or following the occurrence of a change in control of Brighthouse or any of its affiliates, including Brighthouse Services.
The following table summarizes estimated payments and benefits that would be provided to our NEOs under the Temporary Plan in connection with a termination of employment under various scenarios described above, assuming such event occurred on December 31, 2017.
|
Credits in Respect of Forfeited MetLife Equity Awards
|
||
|
Name
|
Trigger and Amount
|
|
|
Anant Bhalla
|
Death - $450,000, plus interest
|
|
|
Peter M. Carlson
|
Death - $2,092,873, plus interest
|
|
|
Credits in Respect of Forgone 2017 MetLife Equity Awards
|
||
|
Name
|
Trigger and Amount
|
|
|
Eric T. Steigerwalt
|
Rule of 65 - $400,000, plus interest
Death - $1,200,000, plus interest
|
|
|
Anant Bhalla
|
Death - $368,000, plus interest
|
|
|
John L. Rosenthal
|
Rule of 65 - $233,400, plus interest
Death - $700,200, plus interest
|
|
|
Christine M. DeBiase
|
Rule of 65 - $102,367, plus interest
Death - $307,100, plus interest
|
|
299
Director Compensation
In August 2017, shortly after the completion of the Separation, the Board, on the recommendation of the Nominating and Governance Committee, established a compensation program for the independent members of the Board. In establishing this compensation program, the Board considered benchmarking data for non-management director compensation at companies in our Comparator Group provided by the Company’s compensation consultant, Willis Towers Watson, prior to the Separation.
Our director compensation program is intended to compensate our independent directors fairly for their work as members of the Board and to align their interests with those of our stockholders by delivering half of the annual retainer in the form of equity-based awards. Annual equity-based awards are expected to be granted at the Board meeting held around the time of the annual meeting of stockholders and will be eligible to vest on the earlier of the first anniversary of the grant date and the date of the next annual meeting of stockholders.
The table below sets forth the details of the compensation program for independent members of the Board. Each element of the program is described in greater detail in the narrative following the table.
|
Description
|
Amount
|
Form
|
||
|
Pay for Board Service:
|
||||
|
Annual retainer
|
$240,000
|
50% cash and 50% equity
|
||
|
Pay for Service as Chair of the Board or a Board Committee:
|
||||
|
Chairman of the Board retainer
|
$200,000
|
50% cash and 50% equity
|
||
|
Audit Committee
|
$22,500
|
100% cash
|
||
|
Compensation Committee
|
$17,500
|
100% cash
|
||
|
Nominating and Corporate Governance Committee
|
$17,500
|
100% cash
|
||
|
Finance and Risk Committee
|
$17,500
|
100% cash
|
||
|
Investment Committee
|
$17,500
|
100% cash
|
||
Annual Equity Awards: In connection with the approval of our independent director compensation program, the Board approved annual RSU awards for our independent members of the Board. Beginning in 2018, each independent member of the Board continuing in service at the annual meeting of stockholders will receive an award of RSUs. Annual awards to independent members of the Board generally vest on the earlier of the first anniversary of the grant date and the date of the next annual meeting of stockholders. The number of RSUs to be granted to each independent member of the Board will be determined by dividing the value of the equity portion of the annual retainer ($120,000) by the closing price of the Company’s common stock on the date of grant. The annual RSU grants will be made pursuant to the Brighthouse Financial, Inc. 2017 Non-Management Director Stock Compensation Plan (the “Director Plan”), subject to stockholder approval of the Director Plan, which the Company intends to seek at the 2018 Annual Meeting.
Director Founders’ Grants: To further align the interests of our independent directors with our stockholders, the Board, on the recommendation of the Nominating and Corporate Governance Committee, authorized an equity award in the form of RSUs to each of the six independent members of the Board (the “Director Founders’ Grants”) on August 9, 2017. The number of RSUs subject to each Director Founders’ Grant was determined by dividing $120,000 by the closing price of Brighthouse common stock on September 8, 2017 ($54.54), resulting in each independent member of the Board receiving 2,200 RSUs. The Director Founders’ Grants were made pursuant to the Director Plan and are subject to stockholder approval of the Director Plan. If stockholders approve the Director Plan, the RSUs granted pursuant to the Director Founders’ Grants will vest on September 30, 2018. If stockholders do not approve the Director Plan, the Director Founders’ Grants will be void.
300
Fiscal 2017 Director Compensation Table
|
Name
|
Fees Earned or Paid in Cash
|
Stock Awards (1)
|
All Other Compensation
|
Total
|
||||
|
Irene Chang Britt
|
$68,750
|
$—
|
$—
|
$68,750
|
||||
|
C. Edward (“Chuck”) Chaplin
|
$118,750
|
$—
|
$—
|
$118,750
|
||||
|
Diane E. Offereins
|
$68,750
|
$—
|
$—
|
$68,750
|
||||
|
Patrick J. Shouvlin
|
$71,250
|
$—
|
$—
|
$71,250
|
||||
|
William F. Wallace
|
$68,750
|
$—
|
$—
|
$68,750
|
||||
|
Paul M. Wetzel
|
$60,000
|
$—
|
$—
|
$60,000
|
||||
_______________
|
(1)
|
On August 9, 2017, the Board authorized a Director Founders’ Grant to each of the six independent members of the Board. The number of RSUs subject to the Director Founders’ Grants was 2,200, which was determined by dividing $120,000 (which is equal to 50% of the annual retainer for independent members of the Board) by the closing price of Brighthouse common stock on September 8, 2017, which was $54.54. The Director Founders’ Grants were made pursuant to the Director Plan and are subject to stockholder approval of the Director Plan at the 2018 Annual Meeting. Because the Director Founders’ Grants are subject to stockholder approval and will be void if stockholder approval is not obtained, no value is included in the Stock Awards column since the grant date fair value calculated under ASC Topic 718 cannot be determined.
|
Fees Earned or Paid in Cash
Each of the six independent members of the Board is entitled to receive an annual cash retainer of $120,000. We provide additional retainers to the Chairman of the Board and to each director who serves as the Chair of a standing Board committee, the amounts of which are set forth above under the heading “Director Compensation.” All cash retainers are paid in quarterly installments in arrears. For Fiscal 2017, each independent member of the Board received two installments of the annual cash retainer, and if applicable, the additional retainer.
Director Stock Ownership Guidelines
In February 2018, the Board, on the recommendation of the Nominating and Corporate Governance Committee, established stock ownership and retention guidelines for the independent members of the Board. Pursuant to the guidelines, each independent director is expected to acquire ownership of a number of shares of our common stock equal to at least four times the equity portion of the director’s annual retainer, including for Mr. Chaplin the portion of his annual Chairman of the Board retainer paid in the form of RSUs. Directors are expected to achieve the applicable ownership level within five years from the later of the date the guidelines became effective (January 1, 2018) and the date the director commences service. Directors are expected to retain at least 50% of the net shares acquired upon vesting of equity awards until the ownership guideline is satisfied.
The information required by this Item will be set forth in the 2018 Proxy Statement, which information is hereby incorporated by reference.
The Separation from MetLife
On August 4, 2017, MetLife completed the spin-off of Brighthouse Financial, Inc. through a distribution of 96,776,670 of the 119,773,106 shares of the Company’s common stock, representing 80.8% of MetLife’s interest in Brighthouse, to holders of MetLife common stock.
Relationship with MetLife Following the Separation and Distribution
Prior to the completion of the Distribution, we were a wholly-owned subsidiary of MetLife, Inc., and were part of MetLife’s consolidated business operations. Following the Distribution, MetLife, Inc. and its affiliates held approximately 19.2% of our outstanding common stock. Under the Master Separation Agreement, MetLife granted us a proxy to vote the shares of our common stock that MetLife retains immediately after the Distribution and that are distributed to certain of its subsidiaries in the Distribution in proportion to the votes cast by our other stockholders. This proxy, however, will be automatically revoked as to a particular share upon any sale or transfer of such share from MetLife to a person other than MetLife, and neither the agreement setting forth this arrangement nor the proxy will limit or prohibit any such sale or transfer. We have in effect a written related
301
person transaction approval policy pursuant to which the Nominating and Corporate Governance Committee of our Board, or for so long as any member of the Nominating and Corporate Governance Committee is not an “independent director,” a committee of our Board consisting of the independent members of the Nominating and Corporate Governance Committee, will review and approve or take such other action as it may deem appropriate with respect to related person transactions, including transactions involving MetLife for so long as MetLife owns more than 5% of our outstanding common stock. See “— Related Person Transaction Approval Policy.”
Agreements Between Us and MetLife
As part of the Distribution, we entered into a Master Separation Agreement and several other agreements with MetLife to effect the Separation and to provide a framework for our relationship with MetLife after the Distribution. These agreements include, among others, the agreements described below. See “Risk Factors — Risks Related to Our Separation from, and Continuing Relationship with, MetLife — We have agreed under the Master Separation Agreement with MetLife to indemnify MetLife, its directors, officers and employees and certain of its agents for liabilities relating to, arising out of or resulting from certain events relating to our business.”
Certain of the agreements summarized in this section have been filed with the SEC, and the following summaries of those agreements are qualified in their entirety by reference to those agreements.
Master Separation Agreement
On August 4, 2017, we entered into a Master Separation Agreement with MetLife, which sets forth our agreements with MetLife relating to the ownership of certain assets and the allocation of certain liabilities in connection with the Separation of Brighthouse from MetLife. It also sets forth other agreements governing our relationship with MetLife after the Distribution, including certain payment obligations between the parties.
The separation of our business
The Master Separation Agreement generally allocates certain assets and liabilities between us and MetLife according to the business to which such assets and liabilities primarily relate, which is consistent with the basis of presentation of our historical financial statements. To the extent not previously transferred to us or one of our subsidiaries prior to the completion of the Distribution, the Master Separation Agreement provides that MetLife would transfer and assign to us certain assets related to our business owned by them. The Master Separation Agreement also provides that we would transfer and assign to MetLife certain assets related to its business owned by us. We will perform, discharge and fulfill certain liabilities related to our businesses (which, in the case of tax matters, are governed in part by the Tax Separation Agreement and Tax Receivables Agreement (each, as described below)). The Master Separation Agreement also provides for the transfer of certain information and records among us and MetLife and rights to, and access to, certain information and records following the Separation. Additionally, the Master Separation Agreement grants us (i) a transitional license to use the “MetLife” name for a limited period of time following the Distribution, in certain limited circumstances for use as part of a marketing tag line in connection with the sale and marketing of our products, and (ii) the option, for up to eighteen (18) months following our entry into the Master Separation Agreement, to purchase through one of our subsidiaries from the applicable subsidiary of MetLife certain telecommunications equipment.
Except as expressly set forth in the Master Separation Agreement or in any other agreement entered into in connection with the Separation (the “transaction documents”), neither we nor MetLife made any representation or warranty as to:
|
•
|
any assets or liabilities allocated under the Master Separation Agreement;
|
|
•
|
the value of or freedom from any security interests of, or any other matter concerning, any assets or liabilities of such party;
|
|
•
|
the legal sufficiency of any assignment, document or instrument to convey title to any asset;
|
|
•
|
any consents or approvals required in connection with any transfer of assets or assumptions of liabilities; or
|
|
•
|
the absence of any defenses or right of set-off or freedom from counterclaim with respect to any claim of either us or MetLife.
|
Except as expressly set forth in any transaction document, in connection with the transactions through which we were formed, all assets were transferred to us on an “as is,” “where is” basis, and we have agreed to bear the economic and legal risks that any conveyance was insufficient to vest in us good title, free and clear of any security interest, and that any necessary consents or approvals were not or are not obtained or that any requirements of law or judgments were not or are not complied with.
302
Provisions relating to indemnification and liability insurance
The Master Separation Agreement includes certain provisions related to indemnification of (i) MetLife and certain affiliated persons by us and (ii) us and certain of our affiliated persons by MetLife. The Master Separation Agreement also includes certain provisions related to the procurement of certain liability insurance coverage.
Subject to certain exceptions, we agreed to indemnify, hold harmless and defend MetLife (excluding any member of Brighthouse) and certain related persons from and against all liabilities relating to, arising out of or resulting from:
|
•
|
us, including the operations, liabilities and obligations of our business, or the failure by us to pay, perform or otherwise promptly discharge any liabilities or contractual obligations of our businesses, in each case arising before or after the completion of the Distribution other than the specified liabilities described below;
|
|
•
|
except to the extent it relates to a liability assumed by MetLife, any guarantee, indemnification obligation, surety bond or other credit support arrangement by MetLife for our benefit that survived the Distribution;
|
|
•
|
certain specified liabilities including liabilities relating to certain historical businesses, liabilities for our products or distribution and sales thereof, certain employee related liabilities and certain other specified liabilities, as well as our share of certain shared liabilities;
|
|
•
|
any breach by us of the Master Separation Agreement, the other transaction documents, or documents entered into in connection with the Restructuring or our certificate of incorporation or bylaws;
|
|
•
|
any untrue statement of, or omission to state, a material fact in MetLife’s public filings to the extent it was as a result of information that we, or certain persons who, following the Distribution, were our employees, furnished to MetLife or which MetLife incorporated by reference from our public filings, if that statement or omission was made or occurred after the completion of the Distribution;
|
|
•
|
any distribution or servicing agreements assigned, in whole or in part (and if in part, solely relating to, arising out of or resulting from such part), to us by MetLife in connection with the Distribution, from and after the effective date of such assignment;
|
|
•
|
any untrue statement of, or omission to state, a material fact in the Form 10, except to the extent the statement was made or omitted in reliance upon information provided to us by MetLife or (other than certain of MetLife’s employees became our employees at or prior to the Distribution) expressly for use in such Form 10;
|
|
•
|
any losses related to liabilities assumed by us from MetLife pursuant to the terms of the Master Separation Agreement or the failure by us to obtain any required consent, approval, release, substitution or amendment in connection with the novation of assumed liabilities;
|
|
•
|
any liabilities of MetLife under or relating to the applicable NELICO Plans, including pursuant to any guarantee made by MetLife thereunder or in respect thereof; provided that we may set off against any such indemnification obligation thereunder any unpaid amounts due from MetLife in respect of the payments by MetLife with respect to NELICO Plans as contemplated by one of the transaction documents;
|
|
•
|
in the case of any applicable NELICO Plan where services continue to be provided by a third party through a contract with MetLife after Separation, any breach by us of such third party contract;
|
|
•
|
the failure by us to timely provide employment termination information to MetLife, as required by one of the transaction agreements, but only where such failure results in the imposition of penalties under Section 409A of the Code; and
|
|
•
|
the provision of certain information by MetLife to us pursuant to
the employee matters agreement (“EMA”).
|
Subject to certain exceptions, MetLife agreed to indemnify, hold harmless and defend us, and certain related persons from and against all liabilities relating to, arising out of or resulting from:
|
•
|
MetLife and its affiliates (other than Brighthouse), including the operations, liabilities and obligations of their businesses, or the failure by MetLife or its affiliates (other than Brighthouse) to pay, perform or otherwise promptly discharge any liabilities or contractual obligations of MetLife’s or its affiliates’ (other than Brighthouse) businesses, in each case arising before or after the completion of the Distribution other than the specified liabilities described below;
|
|
•
|
except to the extent it relates to a liability assumed by us, any guarantee, indemnification obligation, surety bond or other credit support arrangement by us for MetLife’s benefit that survived the Distribution;
|
303
|
•
|
certain specified liabilities including liabilities relating to certain historical businesses, liabilities for MetLife’s products or distribution and sales thereof, certain employee related liabilities relating to MetLife providing administrative services and other services for certain benefit plans and specified statutory obligations, and certain other specified liabilities, as well as MetLife’s share of certain shared liabilities;
|
|
•
|
any breach by MetLife or any of its affiliates (other than Brighthouse) of the Master Separation Agreement, any of the other transaction documents or documents entered into in connection with the Restructuring or its certificate of incorporation or bylaws;
|
|
•
|
any untrue statement of, or omission to state, a material fact in our public filings to the extent it was as a result of information that MetLife, or certain persons who, following the Distribution, were MetLife’s employees, furnished to us or which we incorporated by reference from MetLife’s public filings, if that statement or omission was made or occurred after the completion of the Distribution;
|
|
•
|
any losses related to liabilities to be retained by MetLife pursuant to the terms of the Master Separation Agreement or the failure by MetLife to obtain any required consent, approval, release, substitution or amendment in connection with such retained liabilities;
|
|
•
|
any untrue statement of, or omission to state, a material fact in the Form 10, except to the extent the statement was made or omitted in reliance upon information provided to MetLife by us (other than certain of our employees who became our employees at or prior to the Distribution) expressly for use in such Form 10;
|
|
•
|
the failure by MetLife to timely provide or to provide timely access, in each case as required by the Master Separation Agreement, to us of the applicable records of the applicable NELICO Plans and certain other plans as provided in the Master Separation Agreement;
|
|
•
|
the provision of certain information by us to MetLife pursuant to the EMA;
|
|
•
|
the sale of Brighthouse Life Insurance Company’s interest in a Chinese joint venture (“ML China”) to MLIC;
|
|
•
|
any obligation pursuant to any abandoned property, unclaimed property, escheatment or similar law in connection with, relating to, arising out of, or resulting from the delivery of the shares of our common stock distributed in the Distribution, due to a determination by an unclaimed property regulator or a court that the dormancy period applicable to the underlying MetLife common stock, as opposed to the issue date of our common stock, should have been applied to the shares of our common stock distributed in the Distribution; and
|
|
•
|
any action in respect of any event or series of events occurring prior to the completion of the Distribution brought by any insurance regulatory authority with jurisdiction over Brighthouse Life Insurance Company related to the simplified issue term business sold through MetLife’s U.S. direct business organization and issued by Brighthouse Life Insurance Company prior to the to the completion of the Distribution.
|
The Master Separation Agreement also requires us to procure a dedicated six year run-off tail policy for (i) any director, officer or employee of MetLife, (ii) any person designated by MetLife as a director and who serves in such capacity, (iii) such individuals, directly or indirectly engaged by MetLife as its agent on a project basis with respect to a distribution of securities of Brighthouse during the term of the Master Separation Agreement and having a binding, written agreement with MetLife that obligates MetLife to indemnify such individual on the terms set forth in clauses (x) and (y) below, as applicable, or (iv) any person who, with such person’s consent, is named in any registration statement of Brighthouse under the Securities Act as about to become a director of Brighthouse in respect of: (a) director and officer liability coverage; (b) coverage for liabilities under U.S. federal and state securities laws, (c) fiduciary liability coverage in respect of pension plans covering employees; and (d) professional liability/errors & omission liability coverage including cyber liability and employment practices liability coverage in respect of our operations, assets and liabilities; provided that in any event such tail insurance policy will provide for (x) policy limits in an amount no less than, and (y) deductible or retentions in an amount no higher than, an aggregate of $200 million and $25 million, respectively, in the case of the clauses (a) and (b) together, $20 million and $500,000, respectively, in the case of clause (c), and $100 million and $10 million, respectively, in the case of clause (d).
Claims
The Master Separation Agreement provides for the allocation between MetLife and us of known claims, and allocates responsibility among the parties with respect to any claims (including litigation or regulatory actions or investigations) in a manner generally consistent, subject to certain modifications, with the indemnification obligations described above. The Master Separation Agreement also provides for certain procedural requirements between MetLife and us in connection with any such claim.
304
Dispute resolution procedures
The Master Separation Agreement provides that neither party will commence any court action to resolve any dispute or claim arising out of or relating to the Master Separation Agreement or the other transaction documents (excluding the Registration Rights Agreement, the Tax Receivables Agreement and the Tax Separation Agreement). Instead, any dispute that is not resolved in the normal course of business will be submitted to mediation by written notice. If a dispute subject to the mediation process has not been resolved within a specified period after the date of the written notice beginning the mediation process, the dispute shall be resolved by binding arbitration.
Each party shall bear its own costs in both the mediation and the arbitration; however, the parties shall share the fees and expenses of both the mediators and the arbitrators equally.
These dispute resolution procedures do not apply to any dispute or claim arising under a registration rights agreement we entered into with Metlife to provide MetLife with registration rights relating to shares of our common stock held by MetLife (the “Registration Rights Agreement”), including any dispute related to MetLife’s rights as a holder of our common stock and both parties will submit to the exclusive jurisdiction of the Delaware courts for resolution of any such dispute. In addition, both parties are permitted to seek injunctive or other equitable relief from any court with jurisdiction over the parties in the event of any actual or threatened breach of the provisions of the Master Separation Agreement or the other transaction documents (excluding the Registration Rights Agreement, the Tax Receivables Agreement and the Tax Separation Agreement).
Release under certain agreements
Except for each party’s obligations under the Master Separation Agreement, the other transaction documents and certain other specified agreements and liabilities, we and MetLife, on behalf of ourselves and each of our respective affiliates, released and discharged the other and its respective affiliates from all liabilities existing or arising between us on or before the completion of the Distribution, in connection with intercompany agreements terminated in connection with the Separation (as well as a release by MetLife in favor of us under the agreements relating to the investment in ML China). Except as specified in the Master Separation Agreement, the release does not extend to obligations or liabilities under any agreements between us and MetLife that remain in effect following the Distribution, including ordinary course liabilities for products and services.
Restrictive covenants
Subject to earlier termination in the case of MetLife in connection with certain transformational transactions at Brighthouse, until eighteen (18) months after the date of the Master Separation Agreement, neither MetLife nor Brighthouse will solicit any then current employee of the other party or any of its affiliates with a title of vice president or higher or similar position based on practices in effect at the time of the Distribution with respect to employment by such party; provided that nothing will preclude either MetLife or Brighthouse from soliciting any such employee of the other party (i) who has ceased to be employed by such other party or its affiliates prior to commencement of the earlier of such solicitation or employment discussions between the first party and such employee, (ii) pursuant to a generalized solicitation for employees through the use of media advertisements, professional search firms or otherwise that does not target or have the effect of targeting such employees, or (iii) who contacts a party on such person’s own initiative and without any prohibited solicitation.
Credit support obligations
In the ordinary course of our business, we enter into agreements (including leases) which require guarantees, indemnification obligations, other credit support or other support obligations (collectively the “Credit Support Obligations”). Prior to the Distribution, MetLife agreed to be primary obligor on most of our currently outstanding Credit Support Obligations. We and MetLife will cooperate to replace certain Credit Support Obligations and we will secure the release or replacement of the liability of MetLife, as applicable and necessary, under certain Credit Support Obligations that were not novated prior to completion of the Distribution and, subject to applicable regulatory approval or non-objection, within a certain period following the date of the Master Separation Agreement, release MetLife of its obligations under certain guarantees with third parties.
To the extent that the Credit Support Obligations were not novated prior to completion of the Distribution, MetLife will maintain in full force and effect each Credit Support Obligation which was issued and outstanding as of the date of the Distribution until the earlier of: (i) such time as the contract, or all of the obligations of us or our applicable affiliate(s) thereunder, to which such Credit Support Obligation relates, terminates; and (ii) such time as such Credit Support Obligation expires in accordance with its terms or is otherwise released.
Covenants relating to existing agreements
Pursuant to the Master Separation Agreement, each of MetLife and we agreed that, for a period of one year after the Separation, each party will not take or fail to take any actions that reasonably could result in the other party (or its respective subsidiaries) being in breach of or in default under any agreement (i) that provides that actions of one party or its subsidiaries
305
may result in breach of or default under such agreement by the other party or its subsidiaries, (ii) to which MetLife or we are a party or (iii) under which MetLife or we have performed any obligations on or prior to the date of the Master Separation Agreement.
We agreed to, and to cause our subsidiaries to, provide any services, facilities, equipment or software pursuant to the Transition Services Agreement entered into in connection with the sale of the MPCG and MetLife Securities to MassMutual, to the extent we or our subsidiaries provided such prior to the date of the Master Separation Agreement. The Master Separation Agreement provides that MetLife will, upon our request and at our expense, seek to enforce any obligation of MassMutual for our benefit under that certain purchase agreement entered into in connection with the sale of the MPCG and MetLife Securities.
In addition, the Master Separation Agreement provides for reimbursements between us and MetLife, as applicable, for payments of renewal commissions or trail commissions to former producers of the other party pursuant to previously existing contractual obligations, and that we and MetLife shall work together to make any such payments through a registered broker-dealer and member of FINRA. The Master Separation Agreement also includes provisions for agreement among us and MetLife on how to process bundled payments received from an unaffiliated registered investment company by one of our or MetLife’s insurance company subsidiaries that include proceeds for the other party’s insurance company subsidiaries, in connection with investments of contract owners’ assets in separate accounts in such a company by either our or MetLife’s insurance company subsidiaries. The Master Separation Agreement includes provisions providing requirements that (i) we will perform all of our obligations under certain reinsurance agreements with third party reinsurers that reinsure our liabilities arising under policies reinsured by MetLife or which inure to the benefit of the reinsured arrangement, and (ii) MetLife will perform all of its obligations under certain reinsurance agreements with third party reinsurers that reinsure MetLife’s liabilities arising under policies reinsured by us or which inure to the benefit of the reinsured arrangement.
Covenants relating to General American Life Insurance Company
The Master Separation Agreement contains certain provisions relating to the guarantee by General American Life Insurance Company (“GALIC’) of certain policies and products of certain of our insurance company subsidiaries, including relating to the future release of the guarantee or assignment to an entity having sufficient financial strength, credit-worthiness, or claims-paying ability rating, procedures for delivery of financial and other information necessary for our public filings, and cooperation with a potential future buyback or exchange of affected products.
Investment Management Agreements
On January 1, 2017, MLIA, a subsidiary of MetLife, entered into investment management agreements with our insurance company subsidiaries, pursuant to which MLIA manages the investment of the assets comprising the general account portfolio of such insurance company subsidiaries and provides certain portfolio management services, including services relating to the use of derivatives. MLIA also entered into an investment management agreement with Brighthouse Financial, Inc. and certain of its non-insurance company subsidiaries, including Brighthouse Services, and separately entered into an investment management agreement with BRCD. In return for providing such services, MLIA is entitled to receive a management fee determined generally by the amount of the assets under management and is also entitled to reimbursement for certain expenses. Each agreement has an initial term that continues until 18 months after the date on which MetLife ceases to own at least fifty percent (50%) or more of our common stock, after which period either party to the agreement is permitted to terminate upon notice to the other party (although termination prior to the end of the initial term is permitted under certain circumstances). MLIA also entered into related investment finance services agreements with each of the entities described above, including BRCD, pursuant to which MLIA provides, or will provide, certain investment finance and reporting services in respect of the assets allocated to it under each respective investment management agreement.
On January 1, 2017, MLIA also entered into separate investment management agreements with certain of the same entities described above, pursuant to which MLIA provides investment and portfolio management services, including services relating to the use of derivatives, in respect of certain separate account assets of each respective entity. The terms of each separate account investment management agreement are substantially similar to those contained in the general account investment management agreements. MLIA also provides investment finance and reporting services under related investment finance services agreements with each insurer in respect of the separate account assets allocated to it under each respective separate account investment management agreement.
Registration Rights Agreement
We entered the Registration Rights Agreement to provide MetLife with registration rights relating to shares of our common stock held by MetLife. MetLife and its permitted transferees may require us to register under the Securities Act, all or any portion of these shares, a so-called “demand request.” The demand request is subject to certain limitations as to minimum value and frequency.
306
MetLife and its permitted transferees also have “piggyback” registration rights, such that MetLife and its permitted transferees may include their respective shares in any future registrations of our equity securities, whether or not that registration relates to a primary offering by us or a secondary offering by or on behalf of any of our shareholders. The demand registration rights and piggyback registration rights are each subject to market cut-back exceptions.
The Registration Rights Agreement sets forth customary registration procedures, including an agreement by us to make our management reasonably available to participate in road show presentations in connection with any underwritten offerings. We also agreed to indemnify MetLife and its permitted transferees with respect to liabilities resulting from untrue statements or omissions in any registration statement used in any such registration, other than untrue statements or omissions resulting from information furnished to us for use in a registration statement by MetLife or any permitted transferee.
The rights of MetLife and its permitted transferees under the Registration Rights Agreement will remain in effect with respect to the shares covered by the agreement until those shares:
|
•
|
have been sold pursuant to an effective registration statement under the Securities Act;
|
|
•
|
have been sold to the public pursuant to Rule 144 under the Securities Act;
|
|
•
|
have been transferred in a transaction where subsequent public distribution of the shares would not require registration under the Securities Act; or
|
|
•
|
are no longer outstanding.
|
In addition, the registration rights under the agreement will cease to apply to a holder when such holder holds less than a certain threshold of the then outstanding common shares and such shares are eligible for sale without restriction pursuant to Rule 144 under the Securities Act.
Transition Services Agreement
Prior to the Distribution, Brighthouse Services, Brighthouse Financial, Inc. (but only with respect to certain provisions), MetLife Services and Solutions, LLC (“MSS”), a direct, wholly-owned subsidiary of MetLife, and MetLife, Inc. (but only with respect to certain provisions) entered into a transition services agreement effective as of January 1, 2017 (the “Transition Services Agreement”). Each of Brighthouse Financial, Inc. and MetLife, Inc. is a party to the Transition Services Agreement solely with respect to taking actions necessary to cause their respective affiliates to perform obligations under the Transition Services Agreement to the extent required thereunder. Under the Transition Services Agreement, for a transitional period, generally up to thirty-six months, with certain services to be made available for several years, MSS has agreed to perform, directly or through affiliates with which it has an arrangement, a range of administrative and other services that Brighthouse Services and we require in support of our operations. Among other services, MSS has agreed to perform certain finance, treasury, compliance, operations, call center and technology support services. Moreover, MSS has agreed to provide facilities and equipment to the extent requested by Brighthouse Services for its own benefit or ours. Brighthouse Services agreed to pay MSS fees to be calculated in accordance with schedules to the Transition Services Agreement, which vary depending on the nature of the services and facilities and equipment provided. Brighthouse Services, in turn, allocates to us any expense incurred under the Transition Services Agreement for the benefit of subsidiaries or affiliates of Brighthouse. In addition to the services that MSS provides to Brighthouse Services, Brighthouse Services performs a more limited scope of services for the benefit of MSS and its affiliates.
Other Services Agreements
Prior to the Distribution, Brighthouse Life Insurance Company and NELICO entered into an Administrative Services Agreement with MLIC (the “MLIC TPA Agreement”) and entered into a Global Services Agreement with MSS, as billing intermediary, for certain third-party administration services (“TPA Services”) performed by MetLife Global Operations Support Center Private Limited (“MGOSC”) (the “MSS Global Services Agreement”). Under the MLIC TPA Agreement and the MSS Global Services Agreement, once MLIC and MGOSC cease to be affiliates of Brighthouse Life Insurance Company, MLIC and MGOSC (by way of MSS as billing intermediary) will continue to perform certain TPA Services that Brighthouse Life Insurance Company and NELICO may require in support of their operations for a transitional period. Such TPA Services may include, but are not limited to, claims processing, premium collection and underwriting.
MSS is currently in the process of obtaining all necessary licenses to directly perform TPA Services. When MSS is properly licensed and otherwise capable of providing such services, the MLIC TPA Agreement will terminate and MSS will provide certain TPA Services to Brighthouse Life Insurance Company and NELICO for a transitional period. Brighthouse Life Insurance Company and NELICO will enter into Administrative Services Agreements with MSS (the “MSS TPA Agreement”). Under the MSS TPA Agreement, MSS will agree to perform TPA Services that Brighthouse Life Insurance Company and NELICO may require in support of their operations.
307
Prior to the Distribution, various Brighthouse and MetLife entities entered into additional services agreements providing for the provision of support services, including, among other things, an administrative services agreement among Brighthouse Advisers and MetLife’s insurance company subsidiaries and participation agreements between Brighthouse Securities and our insurance company subsidiaries. One such agreement is the Long-term Data Access Agreement, which sets forth standards for the access to and maintenance of data that was and will continue to be exchanged by Brighthouse and MetLife prior to and following the Separation.
As of January 1, 2017, Brighthouse Services provided certain services to our insurance company subsidiaries, including providing instruction and direction to MLIA as to MLIA’s services under the Investment Management Agreements between MLIA and our insurance subsidiaries (“Subsidiary IMAs”). Additionally, Brighthouse Services provides instruction and direction to MLIA as to MLIA’s services under the Investment Management Agreement among MLIA and Brighthouse Financial, Inc. and certain of its non-insurance company subsidiaries (the “Brighthouse IMA”). Brighthouse Services is not a party to the Subsidiary IMAs and is not obligated to compensate MLIA for services under the Subsidiary IMAs. However, Brighthouse Services is a party to the Brighthouse IMA and is obligated to compensate MLIA for services thereunder.
All agreements between or among MetLife, Brighthouse and their respective affiliates that took effect prior to the Separation and required the approval of applicable insurance regulatory authorities were approved by such regulatory authorities. Affiliate transaction approvals were sought prior to the Separation for those agreements that took effect at the Separation to the extent that such agreements required such approval. These agreements include third-party administrative service agreements and tax allocation agreements.
Intellectual Property Arrangements
Intellectual Property License Agreement
We and MLIC entered into the Intellectual Property License Agreement, pursuant to which we granted each other a non-exclusive, royalty-free, paid-up license for the U.S., to certain intellectual property rights that we each own. The intellectual property rights being licensed (with no rights to sublicense except as described below) under the Intellectual Property License Agreement may include invention disclosures, patents, patent applications, statutory invention registrations, copyrights, mask work rights, database rights and design rights, trade secrets, trademarks, service marks, trade dress, logos, other source identifiers or domain names, intellectual property made available under the Transition Services Agreement, and limited rights to certain policies and materials owned by MLIC or its affiliates. The license allows us and MLIC and its affiliates to have access to and to use certain intellectual property necessary for operations of our respective businesses. Brighthouse has agreed to sublicense its rights in certain MetLife trademarks to market, sell, distribute and service products and services in connection with its business as operated immediately following the Separation. MLIC has agreed to sublicense its rights in certain Brighthouse trademarks in connection with providing services to Brighthouse pursuant to the transaction documents. Each party has agreed to only sublicense its right in other intellectual property for (i) non-public distribution, dissemination or disclosure restricted to employees of the licensee, its affiliates or their respective third party vendors under written obligations of confidentiality at least as stringent as those required under the Intellectual Property License Agreement and/or (ii) public distribution, dissemination or disclosure of such materials only to the extent such materials were publicly distributed, disseminated or disclosed prior to the distribution. Each party can only assign its license rights to another party other than an affiliate upon the prior written consent of the other party to the agreement. The Intellectual Property License Agreement with respect to trademarks continues until non-use of a particular mark and is perpetual with respect to other intellectual property other than upon, material breach.
Tax Agreements
Due to a particular U.S. tax consolidation provision, Brighthouse Life Insurance Company and its subsidiaries cannot immediately be included with Brighthouse in a consolidated tax group. Instead, following the Distribution (the “tax deconsolidation date”), Brighthouse Life Insurance Company and any directly owned life insurance and reinsurance company subsidiaries (including BHNY and BRCD) are expected to be included in Brighthouse Life Insurance Company’s consolidated federal income tax return until 2023. In addition, following the tax deconsolidation date, NELICO will not be included in the Brighthouse Life Insurance Company, consolidated federal income tax return and is expected to file its own U.S. federal income tax return until 2023. Current taxes (and the benefits of tax attributes such as losses) of Brighthouse Life Insurance Company and its life insurance/reinsurance company subsidiaries will be allocated among Brighthouse Life Insurance Company and its subsidiaries under consolidated tax return regulations and a tax sharing agreement. Beginning in 2023, Brighthouse Life Insurance Company, its directly owned life insurance and reinsurance company subsidiaries and NELICO are expected to join our U.S. consolidated federal income tax return. Because Brighthouse Life Insurance Company, its directly owned life insurance and reinsurance company subsidiaries and NELICO are not able to join our U.S. consolidated federal income tax return until 2023, our U.S. consolidated federal income tax group and the separate groups of Brighthouse Life Insurance Company and NELICO may owe more taxes than they would have owed if they had all been a single group immediately after the distribution.
308
Tax Receivables Agreement
Immediately prior to the closing of the Distribution, we entered into a Tax Receivables Agreement with MetLife that provides MetLife with the right to receive as partial consideration for its contribution of assets to us future payments from us, equal to 86% of the amount of cash savings, if any, in U.S. federal income tax that we and our subsidiaries actually realize (or are deemed to realize in the case of an early termination by us, a breach of material obligations under the Tax Receivables Agreement, a change of control or certain subsidiary dispositions, as discussed below) as a result of the utilization of our and our subsidiaries’ net operating losses, capital losses, tax basis and amortization or depreciation deductions in respect of certain tax benefits we may realize as a result of certain transactions involved in the Separation together with interest accrued at a rate of one-year LIBOR plus 100 basis points from the date the applicable tax return is due (without extension) until the date the applicable payment is due. To the extent that we fail to make payments when due under the Tax Receivables Agreement for any reason, other than as a result of certain exceptions, discussed below, such payments will accrue interest at a rate of one-year LIBOR plus 650 basis points per annum until paid. These payment obligations are our obligations and we are obligated to use commercially reasonable actions to cause our subsidiaries to pay dividends to us to the extent necessary for us to make payments under the Tax Receivables Agreement.
For purposes of the Tax Receivables Agreement, cash savings in income tax are computed by comparing our actual income tax liability to the amount of such taxes that we would have been required to pay had we not been able to utilize the tax benefits subject to the Tax Receivables Agreement. The term of the Tax Receivables Agreement commenced upon the Separation and will continue until all relevant tax benefits have been utilized or have expired.
Estimating the amount of payments that may be made under the Tax Receivables Agreement is by its nature imprecise, insofar as the calculation of amounts payable depends on a variety of factors. The actual amount and utilization of net operating losses, tax basis and other tax attributes, as well as the amount and timing of any payments under the Tax Receivables Agreement, will vary depending upon a number of factors, including the amount, character and timing of our and our subsidiaries’ taxable income in the future.
If we undergo a change of control, the Tax Receivables Agreement will terminate, and we will be required to make a lump sum payment equal to the present value of future payments under the Tax Receivables Agreement, which payment would be based on certain assumptions (the “valuation assumptions”), including those relating to our and our subsidiaries’ future taxable income. Additionally, if we or a direct or indirect subsidiary transfers any asset to a corporation with which we do not file a consolidated tax return, we will be treated as having sold that asset in a taxable transaction for purposes of determining the cash savings in income tax under the Tax Receivables Agreement. If we sell or otherwise dispose of any of our subsidiaries in a transaction that is not a change of control, we will be required to make a lump sum payment equal to the present value of future payments under the Tax Receivables Agreement attributable to the tax benefits of such subsidiary that is sold or disposed of, applying the valuation assumptions. Any such payment resulting from a change of control, asset transfer or subsidiary disposition could be substantial and could exceed our actual cash tax savings.
The Tax Receivables Agreement provides that in the event that we breach any of our material obligations under it, whether as a result of our failure to make any payment when due (subject to a three-month cure period), failure to honor any other material obligation under it or by operation of law as a result of the rejection of it in a case commenced under the United States Bankruptcy Code or otherwise, then all our payment and other obligations under the Tax Receivables Agreement will be accelerated and will become due and payable, applying the same valuation assumptions discussed above, including those relating to our future taxable income. Such payments could be substantial and could exceed our actual cash tax savings. Additionally, we generally have the right to terminate the Tax Receivables Agreement. If we terminate the Tax Receivables Agreement, our payment and other obligations under the Tax Receivables Agreement will be accelerated and will become due and payable, also applying the valuation assumptions discussed above. Such payments could be substantial and could exceed our actual cash tax savings.
Tax Separation Agreement
Immediately prior to the Distribution, we entered into a tax separation agreement with MetLife (the “Tax Separation Agreement”). Among other things, the Tax Separation Agreement governs the allocation between MetLife and us of the responsibility for the taxes of the MetLife group. The Tax Separation Agreement also allocates rights, obligations and responsibilities in connection with certain administrative matters relating to the preparation of tax returns and control of tax audits and other proceedings relating to taxes.
Under the Tax Separation Agreement, MetLife is generally responsible for any and all taxes due with respect to any (i) tax return filed on a consolidated, combined or unitary basis that includes at least one member of the MetLife group and one member of Brighthouse Financial, Inc. and its subsidiaries and affiliates (“the Brighthouse group”) (a “Joint Return”) and (ii) any stand-alone tax return filed by any member of the MetLife group that does not include any member of the Brighthouse group. However, under the terms of the Tax Separation Agreement, we will pay to MetLife or receive a payment from MetLife with respect to
309
taxes attributable to the Brighthouse group determined under the principles of MetLife’s current tax sharing agreement for taxable periods ending on or prior to the Distribution for which tax returns have not been filed by such date. In addition, for pre-Distribution taxable periods we are generally be responsible for (x) taxes attributable to the members of the Brighthouse group arising from any audit of any Joint Return, as determined under the principles of MetLife’s current tax sharing agreement as in effect for the relevant taxable period, and (y) any and all taxes due with respect to any stand-alone tax returns filed by any member of the Brighthouse group that does not include any member of the MetLife group.
The Tax Separation Agreement generally allocates the right to refunds of taxes to the party that would be liable under the Tax Separation Agreement for the underlying taxes that are refunded.
The Tax Separation Agreement allocates between the parties the right to control, and to participate in, the preparation and filing of tax returns and defense of tax audits or other proceedings relating to taxes, and requires the parties to cooperate with each other in connection with preparing and filing tax returns and defending tax audits and other tax proceedings.
With the exception of obligations under other agreements entered into between MetLife and us in connection with the Distribution (such as the Tax Receivables Agreement), upon entering into the Tax Separation Agreement, all other formal or informal tax sharing arrangements between MetLife and us were terminated and the Tax Separation Agreement now generally governs all of our relationship with MetLife relating to tax returns and tax liabilities.
The Tax Separation Agreement generally allocates to MetLife any income taxes incurred in connection with the failure to qualify for tax-free treatment of the Distribution and certain related preliminary internal transactions. Additionally, MetLife is liable for tax losses that occur from a failure to qualify for tax free treatment if the failure to qualify for tax-free treatment results from any action or inaction after the completion of the Distribution that is within MetLife’s control or if the failure results from any direct or indirect transfer of MetLife’s stock after the Distribution. Under the Tax Separation Agreement, such income taxes will generally be allocated to us if the failure to qualify for tax-free treatment results from any action or inaction after the completion of the Distribution that is within our control or if the failure results from any direct or indirect transfer of our stock after the Distribution. The Tax Separation Agreement includes a provision generally prohibiting us after the completion of the Distribution from taking any action or failing to take action within our control that would cause the failure of such tax-free treatment.
In addition, for the two-year period following the Separation, we agreed to continue to actively conduct the portion of our business relied upon to qualify the Distribution as a tax-free transaction and we have agreed that in a single transaction or series of transactions we will not:
|
•
|
enter into or, to the extent we have the right to prohibit it, permit any transaction to occur, as a result of which one or more persons would (directly or indirectly) acquire, or have the right to acquire, a number of shares of stock that would, when combined with certain other changes in ownership of our stock, comprise 45% or more of the value or total combined voting power of all of our outstanding shares of stock;
|
|
•
|
liquidate, merge or consolidate with any other person (whether that other person or such affiliate is the survivor) that was not already wholly-owned by a member of our group prior to such transaction;
|
|
•
|
sell or transfer all or substantially all of the assets that were transferred to us as part of our formation or sell or transfer (or cause or permit to be transferred) 33% or more of the gross assets of the business relied upon to qualify the Distribution as a tax-free transaction or 33% or more of our consolidated gross assets;
|
|
•
|
redeem or otherwise repurchase (directly or through an affiliate) any of our stock, or rights to acquire our stock, except to the extent such repurchases satisfy certain IRS guidelines;
|
|
•
|
amend our certificate of incorporation (or other organizational documents), or take any other action, whether through a stockholder vote or otherwise, affecting the voting rights of our stock; or
|
|
•
|
take any other action or actions which in the aggregate would be reasonably likely to have the effect of causing or permitting one or more persons (whether or not acting in concert) to acquire directly or indirectly stock representing a 50% or more of the voting power or value of our stock or otherwise jeopardize the intended tax treatment of the Distribution and certain steps that were part of the Separation.
|
We may, however, take the actions enumerated above during such two-year period if (a) we provide MetLife either a ruling from the IRS or an unqualified tax opinion in form and substance reasonably satisfactory to MetLife to the effect that such action will not negatively affect the applicable intended tax treatment of the Separation and Distribution transactions or (b) MetLife waives the requirement to obtain such IRS ruling or tax opinion. Whether a ruling from the IRS or an unqualified tax opinion would be forthcoming depends on the facts and circumstances of the applicable actions. For example, the Treasury Regulations provide that an acquisition of our stock would not be considered to be “part of a plan” with the Distribution (and therefore would
310
not cause there to be gain recognition under Code Section 355(e)) if there was no agreement, understanding, arrangement or substantial negotiations regarding the acquisition or a similar acquisition at any time during the two-year period prior to the Distribution.
We have agreed to indemnify MetLife and its affiliates against any and all tax-related liabilities incurred by them relating to the Distribution to the extent caused by the actions summarized above. This indemnification applies even if MetLife has permitted us to take an action that would otherwise have been prohibited under the tax-related restrictions as described above. Any income taxes incurred in connection with the failure to qualify for tax-free treatment of the Distribution which are jointly caused by us and MetLife shall be allocated between MetLife and us equally.
Collateral Agreement
Prior to the Distribution, we entered into a reinsurance trust agreement with GALIC pursuant to which Brighthouse Life Insurance Company and GALIC collateralize their net exposure to one another under the following two reinsurance agreements between such parties: (i) a reinsurance agreement whereby Brighthouse Life Insurance Company provides reinsurance coverage to GALIC with respect to certain term and universal life policies issued by GALIC; and (ii) a reinsurance agreement whereby GALIC provides reinsurance coverage to Brighthouse Life Insurance Company with respect to certain whole life policies issued by Brighthouse Life Insurance Company.
Sublease Agreements
At or prior to the Distribution, we entered into arms-length sublease agreements with MetLife for our corporate headquarters in Charlotte, North Carolina, as well as certain other locations.
Other Related Person Transactions
The Separation
We and MetLife have engaged, and expects to engage, in certain transactions in connection with the Separation, including transactions that took place prior to the Distribution and transactions that will continue in effect after the completion of the Distribution.
Reinsurance Arrangements
We have entered into reinsurance agreements with MetLife affiliated companies primarily as a cedent of insurance and also as a reinsurer of some insurance products issued by those affiliated companies. We participate in reinsurance activities in order to limit losses, minimize exposure to significant risks and provide additional capacity for future growth. While we terminated certain of these arrangements in connection with the Separation, we retained and expect to retain certain of the reinsurance agreements with MetLife affiliated companies following the Separation.
We currently benefit from a financing arrangement MetLife has with a third-party financial institution that is used to support a MetLife reinsurance subsidiary’s obligations arising under a reinsurance agreement with Brighthouse Life Insurance Company. Pursuant to the Master Separation Agreement, we pay MetLife 60% of the fees owed to the third party financial institution for this financing arrangement.
Investment Transactions
Prior to the Distribution we extended loans and transferred certain invested assets, primarily consisting of fixed maturity securities, to certain MetLife affiliates. At this time, there are no longer any outstanding loans between the companies and we have stopped transferring invested assets between Brighthouse and MetLife affiliates
Shared Services and Overhead Allocations
Prior to the Separation, MetLife provided us certain services, which included, but were not limited to, executive oversight, treasury, finance, legal, human resources, tax planning, internal audit, financial reporting, information technology, sourcing/procurement and investor relations. MetLife continues to provide certain of these services following the Separation under the Transition Services Agreement. The financial information in this Annual Report on Form 10-K does not necessarily include all the expenses that would have been incurred had we been a separate, standalone entity prior to the Distribution. MetLife charges us for these services based on direct and indirect costs. When specific identification is not practicable, an allocation methodology is used, primarily based on sales, in-force liabilities, or headcount.
Sourcing/Procurement
Prior to the Distribution, MetLife contracted for most of our strategic sourcing and procurement needs. Pursuant to a services agreement, MetLife agreed, to the extent requested by an affiliated recipient, to perform certain services and make available its
311
facilities and equipment, including participating in and/or benefiting from arrangements made by MetLife with any of its affiliated or third-party vendors. In consideration for these services, we are required reimburse MetLife for its expenses attributable to each affiliated recipient of ours for services provided to it under these arrangements. These arrangements cover a variety of sourcing needs, including software licenses, information technology service and support, audit services and market data services. We do not directly benefit from these arrangements following the Distribution, and we entered into direct contracts with vendors at or prior to the Distribution, other than in respect of service to be provided under the Transition Services Agreement.
Stock-Based Compensation Plans
Prior to the Separation, our executive officers participated in MetLife stock-based compensation plans, the costs of which were allocated to the Company and recorded in the combined statements of operations. The Separation constituted the end of our employees’ employment with MetLife and its affiliates. Any MetLife stock compensation awards held by our employees immediately prior to the Separation were retained or forfeited in accordance with their terms.
The Company has established a nonqualified deferred compensation plan to pay cash compensation, (the “Temporary Plan”) to employees of the Company who forfeited MetLife stock compensation awards as a result of the Separation and/or did not receive stock compensation awards from MetLife in 2017. The cash compensation for employees who forfeited MetLife stock compensation awards is subject to service requirements that generally replicate the service requirements for the awards that were forfeited as a result of the Separation. In addition, for our executive officers, cash compensation for forfeited awards is subject to achievement of Company-specific performance criteria. The cash compensation for employees who did not receive stock compensation awards from MetLife in 2017 is subject to service requirements and, for our executive officers, the achievement of Company-specific performance criteria. The Company intends to seek shareholder approval of the material terms of the performance goals under the Temporary Plan. The cost for this cash compensation is not expected to be material.
Broker-Dealer Transactions
Prior to the Distribution, we accrued related party revenues and expenses arising from interactions with MetLife’s broker-dealers whereby the MetLife broker-dealers sell our variable annuity and life products. The affiliated revenue for us is fee income from trusts and mutual funds whose shares serve as investment options of our policyholders. The affiliated expense for us is commissions collected on the sale of variable products by us and passed through to the broker-dealer.
Revenues and Expenses Associated with Related Person Transactions
The approximate net earned revenues and incurred (expenses), or intercompany charges, for our various arrangements with MetLife and its affiliates are presented in the table below.
|
|
Years Ended December 31,
|
|||||||||||
|
|
2017
|
2016
|
2015
|
|||||||||
|
|
(In millions)
|
|||||||||||
|
Types of Related Persons Transactions
|
|
|
|
|||||||||
|
Financing arrangements
|
$
|
(69
|
)
|
$
|
(195
|
)
|
$
|
(186
|
)
|
|||
|
Transition services agreements with affiliates
|
(330
|
)
|
—
|
|
—
|
|
||||||
|
Advisory and portfolio management agreement fees
|
(159
|
)
|
(99
|
)
|
(80
|
)
|
||||||
|
Reinsurance transactions
|
(300
|
)
|
487
|
|
208
|
|
||||||
|
Investment transactions
|
16
|
|
50
|
|
93
|
|
||||||
|
Stock-based compensation plans
|
—
|
|
(10
|
)
|
(8
|
)
|
||||||
|
Broker-dealer transactions
|
(206
|
)
|
(434
|
)
|
(417
|
)
|
||||||
|
Other administrative services overhead allocations
|
(60
|
)
|
(868
|
)
|
(1,059
|
)
|
||||||
|
Total
|
$
|
(1,108
|
)
|
$
|
(1,069
|
)
|
$
|
(1,449
|
)
|
|||
Related Person Transaction Approval Policy
The Brighthouse Board has adopted a written related person transaction approval policy pursuant to which our Nominating and Corporate Governance Committee, or for so long as any member of such committee is not an “independent director,” a committee of the Brighthouse Board consisting of the independent members of the Nominating and Corporate Governance Committee, will review and approve or take such other action as it may deem appropriate with respect to certain transactions.
312
The information required by this Item will be set forth in the 2018 Proxy Statement, which information is hereby incorporated by reference.
313
|
(a)
|
The following documents are filed as part of this report:
|
|
1.
|
Financial Statements: See “Index to Consolidated and Combined Financial Statements, Notes and Schedules.”
|
|
2.
|
Financial Statement Schedules: See “Index to Consolidated and Combined Financial Statements, Notes and Schedules.”
|
|
3.
|
Exhibits: The exhibits are listed in the “Exhibit Index” below. Entries marked by the symbol # next to the exhibit’s number identify management contracts or compensation plans or arrangements.
|
314
Exhibit Index
(Note Regarding Reliance on Statements in Our Contracts:
In reviewing the agreements included as exhibits to this Annual Report on Form 10-K, please remember that they are included to provide you with information regarding their terms and are not intended to provide any other factual or disclosure information about Brighthouse Financial, Inc. and its subsidiaries or affiliates, or the other parties to the agreements. The agreements contain representations and warranties by each of the parties to the applicable agreement. These representations and warranties have been made solely for the benefit of the other parties to the applicable agreement and (i) should not in all instances be treated as categorical statements of fact, but rather as a way of allocating the risk to one of the parties if those statements prove to be inaccurate; (ii) have been qualified by disclosures that were made to the other party in connection with the negotiation of the applicable agreement, which disclosures are not necessarily reflected in the agreement; (iii) may apply standards of materiality in a way that is different from what may be viewed as material to investors; and (iv) were made only at the date of the applicable agreement or such other date or dates as may be specified in the agreement and are subject to more recent developments. Accordingly, these representations and warranties may not describe the actual state of affairs at the date they were made or at any other time. Additional information about Brighthouse Financial, Inc. and its subsidiaries and affiliates may be found elsewhere in this Annual Report on Form 10-K and Brighthouse Financial, Inc.’s other public filings, which are available without charge through the U.S. Securities and Exchange Commission website at www.sec.gov.)
|
Exhibit No.
|
Description
|
|
|
2.1
|
||
|
3.1
|
||
|
3.2
|
||
|
4.1
|
||
|
4.2
|
||
|
4.3
|
||
|
10.1
|
||
|
10.2
|
||
|
10.3
|
||
|
10.4
|
||
|
10.5
|
||
|
10.6
|
||
315
|
10.7
|
||
|
10.8
|
||
|
10.9#
|
||
|
10.9.1#
|
||
|
10.9.2#*
|
||
|
10.10#
|
||
|
10.11#
|
||
|
10.11.1#*
|
|
|
|
21.1*
|
||
|
31.1*
|
||
|
31.2*
|
||
|
32.1*
|
||
|
32.2*
|
||
|
101.INS*
|
XBRL Instance Document.
|
|
|
101.SCH*
|
XBRL Taxonomy Extension Schema Document.
|
|
|
101.CAL*
|
XBRL Taxonomy Extension Calculation Linkbase Document.
|
|
|
101.LAB*
|
XBRL Taxonomy Extension Label Linkbase Document.
|
|
|
101.PRE*
|
XBRL Taxonomy Extension Presentation Linkbase Document.
|
|
|
101.DEF*
|
XBRL Taxonomy Extension Definition Linkbase Document.
|
|
# Denotes management contracts or compensation plans or arrangements.
316
SIGNATURES
Pursuant to the requirements of Section 13 or 15(d) of the Securities Exchange Act of 1934, the registrant has duly caused this report to be signed on its behalf by the undersigned, thereunto duly authorized.
|
Brighthouse Financial, Inc.
|
|||
|
By
|
/s/ Anant Bhalla
|
||
|
Name:
|
Anant Bhalla
|
||
|
Title:
|
Executive Vice President and Chief Financial Officer
|
||
|
Date:
|
March 15, 2018
|
||
Pursuant to the requirements of the Securities Exchange Act of 1934, this report has been signed below by the following persons on behalf of the registrant and in the capacities and on the dates indicated.
|
Signature
|
Title
|
Date
|
|
/s/ Eric T. Steigerwalt
|
Director, President and Chief Executive Officer
(Principal Executive Officer)
|
March 15, 2018
|
|
/s/ Anant Bhalla
|
Executive Vice President and Chief Financial Officer
(Principal Financial Officer)
|
March 15, 2018
|
|
/s/ Lynn A. Dumais
|
Chief Accounting Officer
(Principal Accounting Officer)
|
March 15, 2018
|
|
/s/ Irene Chang Britt
|
Director
|
March 15, 2018
|
|
/s/ C. Edward Chaplin
|
Chairman of the Board of Directors
|
March 15, 2018
|
|
/s/ John D. McCallion
|
Director
|
March 15, 2018
|
|
/s/ Diane E. Offereins
|
Director
|
March 15, 2018
|
|
/s/ Patrick J. Shouvlin
|
Director
|
March 15, 2018
|
|
/s/
William F. Wallace
|
Director
|
March 15, 2018
|
|
/s/
Paul M. Wetzel
|
Director
|
March 15, 2018
|
317
TABLE OF CONTENTS
Part IItem 1. BusinessItem 1A. Risk FactorsItem 1B. Unresolved Staff CommentsItem 2. PropertiesItem 3. Legal ProceedingsItem 4. Mine Safety DisclosuresPart IIItem 5. Market For Registrant S Common Equity, Related Stockholder Matters and Issuer Purchases Of Equity SecuritiesItem 6. Selected Financial DataItem 7. Management S Discussion and Analysis Of Financial Condition and Results Of OperationsItem 7A. Quantitative and Qualitative Disclosures About Market RiskItem 8. Financial Statements and Supplementary DataItem 9. Changes in and Disagreements with Accountants on Accounting and Financial DisclosureItem 9A. Controls and ProceduresItem 9B. Other InformationPart IIIItem 10. Directors, Executive Officers and Corporate GovernanceItem 11. Executive CompensationItem 12. Security Ownership Of Certain Beneficial Owners and Management and Related Stockholder MattersItem 13. Certain Relationships and Related Person TransactionsItem 14. Principal Accountant Fees and ServicesPart IVItem 15. Exhibits and Financial Statement Schedules