BRAEMAR HOTELS & RESORTS INC.
10-Ks and 10-Qs
|
|
|
|
|
|
|
|
|
|
|
|
|
|
|
|
|
|
|
|
|
|
|
|
|
|
|
|
|
|
|
|
|
|
|
|
|
|
|
|
|
|
|
|
UNITED STATES
SECURITIES AND EXCHANGE COMMISSION
WASHINGTON, D.C. 20549
FORM 10-K
|
þ
|
ANNUAL REPORT PURSUANT TO SECTION 13 OR 15(d) OF THE SECURITIES EXCHANGE ACT OF 1934
|
For the fiscal year ended
December 31, 2017
OR
|
¨
|
TRANSITION REPORT PURSUANT TO SECTION 13 OR 15(d) OF THE SECURITIES EXCHANGE ACT OF 1934
|
For the transition period from
to
Commission file number: 001-35972
ASHFORD HOSPITALITY PRIME, INC.
(Exact name of registrant as specified in its charter)
|
Maryland
|
46-2488594
|
|
|
(State or other jurisdiction of incorporation or organization)
|
(IRS employer identification number)
|
|
|
14185 Dallas Parkway, Suite 1100
Dallas, Texas
|
75254
|
|
|
(Address of principal executive offices)
|
(Zip code)
|
|
(972) 490-9600
(Registrant’s telephone number, including area code)
Securities registered pursuant to Section 12(b) of the Act:
|
Title of each class
|
Name of each exchange on which registered
|
|
|
Common Stock
|
New York Stock Exchange
|
|
|
Preferred Stock, Series B
|
New York Stock Exchange
|
|
Securities registered pursuant to Section 12(g) of the Act:
None
Indicate by check mark if the registrant is a well-known seasoned issuer, as defined in Rule 405 of the Securities Act.
¨
Yes
þ
No
Indicate by check mark if the registrant is not required to file reports pursuant to Section 13 or Section 15(d) of the Act.
¨
Yes
þ
No
Indicate by check mark whether the registrant (1) has filed all reports required to be filed by Section 13 or 15(d) of the Securities Exchange Act of 1934 during the preceding 12 months (or for such shorter period that the registrant was required to file such reports), and (2) has been subject to such filing requirements for the past 90 days.
þ
Yes
¨
No
Indicate by check mark whether the registrant has submitted electronically and posted on its corporate Web site, if any, every Interactive Data File required to be submitted and posted pursuant to Rule 405 of Regulation S-T (§232.405 of this chapter) during the preceding 12 months (or for such shorter period that the registrant was required to submit and post such files)
þ
Yes
¨
No
Indicate by check mark if disclosure of delinquent filers pursuant to Item 405 of Regulation S-K (§229.405 of this chapter) is not contained herein, and will not be contained, to the best of registrant’s knowledge, in definitive proxy or information statements incorporated by reference in Part III of this Form 10-K or any amendment to this Form 10-K.
¨
Indicate by check mark whether the registrant is a large accelerated filer, an accelerated filer, a non-accelerated filer, a smaller reporting company, or an emerging growth company. See the definitions of “large accelerated filer,” “accelerated filer,” “small reporting company,” and “emerging growth company” in Rule 12b-2 of the Exchange Act.
|
Large accelerated filer
|
o
|
Accelerated filer
|
þ
|
|
|
Non-accelerated filer
|
o
|
(Do not check if a smaller reporting company)
|
Smaller reporting company
|
o
|
|
Emerging growth company
|
þ
|
|||
If an emerging growth company, indicate by check mark if the registrant has elected not to use the extended transition period for complying with any new or revised financial accounting standards provided pursuant to Section 13(a) if the Exchange Act.
¨
Indicate by check mark whether the registrant is a shell company (as defined in Rule 12b-2 of the Exchange Act).
¨
Yes
þ
No
As of June 30,
2017
, the aggregate market value of
30,566,005
shares of the registrant’s common stock held by non-affiliates was approximately
$314,524,000
.
As of
March 12, 2018
, the registrant had
32,120,210
shares of common stock outstanding
.
DOCUMENTS INCORPORATED BY REFERENCE
Portions of the registrant’s definitive Proxy Statement pertaining to the
2018
Annual Meeting of Stockholders are incorporated herein by reference into Part III of this Form 10-K.
ASHFORD HOSPITALITY PRIME, INC.
YEAR ENDED
DECEMBER 31, 2017
INDEX TO FORM 10-K
|
Page
|
||
|
PART I
|
||
|
Item 1.
|
||
|
Item 1A.
|
||
|
Item 1B.
|
||
|
Item 2.
|
||
|
Item 3.
|
||
|
Item 4.
|
||
|
PART II
|
||
|
Item 5.
|
||
|
Item 6.
|
||
|
Item 7.
|
||
|
Item 7A.
|
||
|
Item 8.
|
||
|
Item 9.
|
||
|
Item 9A.
|
||
|
Item 9B.
|
||
|
PART III
|
||
|
Item 10.
|
||
|
Item 11.
|
||
|
Item 12.
|
||
|
Item 13.
|
||
|
Item 14.
|
||
|
PART IV
|
||
|
Item 15.
|
||
|
Item 16.
|
||
1
As used in this Annual Report on Form 10-K, unless the context otherwise indicates, the references to “we,” “us,” “our,” the “Company” or “Ashford Prime” refer to Ashford Hospitality Prime, Inc., a Maryland corporation, and, as the context may require, its consolidated subsidiaries, including Ashford Hospitality Prime Limited Partnership, a Delaware limited partnership, which we refer to as “our operating partnership” or “Ashford Prime OP.” “Ashford Trust” or “AHT” refers to Ashford Hospitality Trust, Inc., a Maryland corporation, and, as the context may require, its consolidated subsidiaries, including Ashford Hospitality Limited Partnership, a Delaware limited partnership and Ashford Trust’s operating partnership, which we refer to as “Ashford Trust OP.” “Ashford LLC” refers to Ashford Hospitality Advisors LLC, a Delaware limited liability company and a wholly-owned subsidiary of Ashford Inc. “Remington Lodging” refers to Remington Lodging and Hospitality LLC, a Delaware limited liability company, a property management company owned by Mr. Monty J. Bennett, chairman of our board of directors, and his father, Mr. Archie Bennett, Jr., chairman emeritus of Ashford Trust. “Our TRSs” refers to our taxable REIT subsidiaries, including Ashford Prime TRS Corporation, a Delaware corporation, which we refer to as “Ashford Prime TRS,” and its subsidiaries, together with the two taxable REIT subsidiaries that lease our two hotels held in a consolidated joint venture and are wholly-owned by the joint venture and the U.S. Virgin Islands’ (“USVI”) taxable REIT subsidiary that owns the Ritz-Carlton St. Thomas hotel.
This Annual Report on Form 10-K contains registered trademarks that are the exclusive property of their respective owners, which are companies other than us, including Marriott International®, Hilton Worldwide®, Sofitel®, Hyatt® and Accor®.
FORWARD-LOOKING STATEMENTS
Throughout this Annual Report on Form 10-K and documents incorporated herein by reference, we make forward-looking statements that are subject to risks and uncertainties. Forward-looking statements are generally identifiable by use of forward-looking terminology such as “may,” “will,” “should,” “potential,” “intend,” “expect,” “anticipate,” “estimate,” “approximately,” “believe,” “could,” “project,” “predict,” or other similar words or expressions. Additionally, statements regarding the following subjects are forward-looking by their nature:
|
•
|
our business and investment strategy;
|
|
•
|
our projected operating results and dividend rates;
|
|
•
|
our ability to obtain future financing arrangements;
|
|
•
|
our understanding of our competition;
|
|
•
|
market trends;
|
|
•
|
projected capital expenditures;
|
|
•
|
anticipated acquisitions or dispositions; and
|
|
•
|
the impact of technology on our operations and business.
|
Forward-looking statements are based on certain assumptions, discuss future expectations, describe future plans and strategies, contain financial and operating projections or state other forward-looking information. Our ability to predict results or the actual effect of future events, actions, plans or strategies is inherently uncertain. Although we believe that the expectations reflected in our forward-looking statements are based on reasonable assumptions, taking into account all information currently available to us, our actual results and performance could differ materially from those set forth in our forward-looking statements. Factors that could have a material adverse effect on our forward-looking statements include, but are not limited to:
|
•
|
factors referenced, including those set forth under the section captioned “Item 1. Business,” “Item 1A. Risk Factors,” “Item 2. Properties,” and “Item 7. Management’s Discussion and Analysis of Financial Conditions and Results of Operations;”
|
|
•
|
general volatility of the capital markets, the general economy or the hospitality industry, whether the result of market events or otherwise;
|
|
•
|
our ability to deploy capital and raise additional capital at reasonable costs to repay debts, invest in our properties and fund future acquisitions;
|
|
•
|
unanticipated increases in financing and other costs, including a rise in interest rates;
|
|
•
|
the degree and nature of our competition;
|
|
•
|
actual and potential conflicts of interest with Ashford Trust, Ashford LLC, Ashford Inc., Remington Lodging, our executive officers and our non-independent directors;
|
|
•
|
changes in personnel of Ashford LLC or the lack of availability of qualified personnel;
|
|
•
|
changes in governmental regulations, accounting rules, tax rates and similar matters;
|
|
•
|
legislative and regulatory changes, including changes to the Internal Revenue Code and related rules, regulations and interpretations governing the taxation of real estate investment trusts (“REITs”); and
|
2
|
•
|
limitations imposed on our business and our ability to satisfy complex rules in order for us to qualify as a REIT for U.S. federal income tax purposes.
|
When considering forward-looking statements, you should keep in mind the risk factors and other cautionary statements in this Annual Report on Form 10-K. The matters summarized under “Item 1A. Risk Factors”, and elsewhere, could cause our actual results and performance to differ significantly from those contained in our forward-looking statements. Accordingly, we cannot guarantee future results or performance. Readers are cautioned not to place undue reliance on any of these forward-looking statements, which reflect our views as of the date of this Annual Report on Form 10-K. Furthermore, we do not intend to update any of our forward-looking statements after the date of this Annual Report on Form 10-K to conform these statements to actual results and performance, except as may be required by applicable law.
3
Our Company
We are an externally-advised Maryland corporation that was formed in April 2013 and became a public company on November 19, 2013 when Ashford Trust, a NYSE-listed REIT, completed the spin-off of our company through the distribution of our outstanding common stock to the Ashford Trust stockholders. We invest primarily in high revenue per available room (“RevPAR”) luxury hotels and resorts. High RevPAR, for purposes of our investment strategy, means RevPAR of at least twice the then-current U.S. national average RevPAR for all hotels as determined by Smith Travel Research. Two times the U.S. national average RevPar was
$167
for the year ended
December 31, 2017
. We have elected to be taxed as a REIT under the Internal Revenue Code beginning in the year ended December 31, 2013. We conduct our business and own substantially all of our assets through our operating partnership, Ashford Prime OP.
We operate in the direct hotel investment segment of the hotel lodging industry. As of
March 12, 2018
, we owned interests in
twelve
hotel properties in six states, the District of Columbia and St. Thomas, U.S. Virgin Islands with
3,574
total rooms, or
3,339
net rooms, excluding those attributable to our joint venture partner. The hotel properties in our current portfolio are predominantly located in U.S. urban and resort locations with favorable growth characteristics resulting from multiple demand generators. We own ten of our hotel properties directly, and the remaining two hotel properties through an investment in a majority-owned consolidated entity.
We are advised by Ashford LLC, a subsidiary of Ashford Inc., through an advisory agreement. All of the hotel properties in our portfolio are currently asset-managed by Ashford LLC.
We do not have any employees. All of the services that might be provided by employees are provided to us by Ashford LLC.
Our Investment and Growth Strategies
Our principal business objectives are to generate attractive returns on our invested capital and long-term growth in cash flow to maximize total returns to our stockholders. To achieve our objectives, we pursue the following strategies:
Focused Investment Strategy
. Our strategy is to invest in premium branded and high quality independent luxury hotels and resorts that are anticipated to generate RevPAR at least twice the average RevPAR for the U.S. lodging industry, as determined by Smith Travel Research and are located predominantly in North America.
We intend to concentrate our investments in markets where we believe there are significant growth opportunities, taking into consideration the risk of additional supply. In determining anticipated RevPAR for a particular asset, we may take into account forecasts and other considerations, including without limitation, conversions or repositioning of assets, capital plans, brand changes and other factors which may reasonably be forecasted to raise RevPAR after stabilization. Stabilization with respect to a hotel, after the completion of an initiative such as a capital plan, conversion or change of brand name or change of the business mix or other operating characteristics, is generally expected to occur within 12 to 24 months after the completion of the related renovation, repositioning or brand change.
In connection with this investment strategy, we frequently evaluate opportunities to acquire additional hotel properties, either through direct ownership, joint ventures, partnership participations or similar arrangements. We may use cash or issue common units in Ashford Prime OP as currency for a transaction. Some or all of these acquisitions, if completed, may be material to our company, individually or in the aggregate. We may, from time to time, be party to letters of intent, term sheets and other non-binding agreements relating to potential acquisitions. We cannot assure you that we will enter into definitive acquisition agreements with respect to any potential acquisitions.
Active Asset Management Strategy
.
We rely on Ashford LLC to asset-manage the hotel properties in our portfolio, and will rely on Ashford LLC to asset-manage any hotel properties we may acquire in the future, to help maximize the operating performance, cash flow and value of each hotel. Asset management is intended to include actively “managing” the third-party property managers and holding them accountable to drive industry leading top line and bottom line operating performance. Ashford LLC aims to achieve this goal by benchmarking each asset’s performance compared to similar hotel properties within our portfolio. Ashford LLC also closely monitors all hotel operating expenses, as well as third-party vendor and service contracts. If expense levels are not commensurate with the property revenues, Ashford LLC works with the property manager to implement cost cutting initiatives. Ashford LLC is also very active in evaluating and proposing improved strategies for the sales, marketing and revenue management initiatives of the property manager as well as its ability to drive ancillary hotel revenues (for example, spa, food and beverage, parking, and Internet). In addition to supervising and directing the property manager, Ashford LLC works with the brands and
4
management companies to negotiate favorable franchise agreement and property management agreement terms. Ashford LLC also actively participates in brand advisory committee meetings to provide feedback and input on new hotel brand initiatives.
Asset management functions include acquisition, renovation, financing and disposition of assets, operational accountability of managers, budget review, capital expenditures and property-level strategies as compared to the day-to-day management of our hotel properties, which is performed by our property managers. Additionally, Ashford LLC and Ashford Inc. have agreed, from time to time, to make mutually agreed upon “key money investments” in our company, our subsidiaries or affiliates to facilitate our acquisition of one or more properties, if our independent directors and Ashford Inc.’s independent directors determine that without such an investment, the acquisition of such property would be uneconomic to us. See discussion on “key money investments” under the section “The Advisory Agreement.”
Disciplined Capital Allocation Strategy
.
We intend to pursue a disciplined capital allocation strategy as it relates to the acquisition, operation, disposition and financing of assets in our portfolio and those that we may acquire in the future. Ashford LLC utilizes its extensive industry experience and capital markets expertise to influence the timing of capital deployment and recycling, and we may selectively sell hotel properties that are no longer consistent with our investment strategy or as to which returns appear to have been maximized. To the extent we sell hotel properties, we generally intend to redeploy the capital into investment opportunities that we believe will achieve higher returns or buy back our common stock.
Our Hotels
As of
March 12, 2018
, we own interests in a high-quality, geographically diverse portfolio of
twelve
hotel properties located in six states, the District of Columbia and St. Thomas, U.S. Virgin Islands comprising
3,574
total rooms, or
3,339
net rooms, excluding those attributable to our joint venture partner. All of the hotel properties in our portfolio are located in top U.S. and U.S. territory markets that exhibit strong growth characteristics resulting from multiple demand generators or strong resort markets. Seven of the
twelve
hotel properties in our portfolio operate under premium brands affiliated with Marriott International, Inc. (“Marriott”) and Hilton Worldwide, Inc. (“Hilton”). One hotel property is managed by Accor Business and Leisure Management, LLC (“Accor”), one is managed by Hyatt Hotels Corporation (“Hyatt”) and three hotel properties are managed by Remington Lodging. The material terms of these agreements are described below in “Certain Agreements—Hotel Management Agreements.” Each of our hotel properties is encumbered by loans as described in “Management’s Discussion and Analysis of Financial Condition and Results of Operations—Indebtedness.” For the year ended December 31,
2017
, approximately
73%
of the rooms revenue was generated by transient business; approximately
25%
was group sales and
2%
was contract sales.
5
The following tables set forth additional information for our hotel properties (dollars in thousands, except ADR and RevPAR) for the year ended December 31,
2017
:
|
Year Ended December 31, 2017
|
|||||||||||||||||||||||
|
Hotel Property
|
Location
|
Total
Rooms
|
%
Owned
|
Occupancy
|
ADR
|
RevPAR
|
Hotel
EBITDA
(1)
|
||||||||||||||||
|
Hilton La Jolla Torrey Pines
(2)
|
La Jolla, CA
|
394
|
|
75
|
%
|
83.65
|
%
|
$
|
205.19
|
|
$
|
171.64
|
|
$
|
14,740
|
|
|||||||
|
The Capital Hilton
|
Washington, D.C.
|
550
|
|
75
|
%
|
88.63
|
%
|
237.87
|
|
210.83
|
|
17,672
|
|
||||||||||
|
Seattle Marriott Waterfront
|
Seattle, WA
|
361
|
|
100
|
%
|
87.99
|
%
|
272.19
|
|
239.50
|
|
16,209
|
|
||||||||||
|
Courtyard San Francisco Downtown
|
San Francisco, CA
|
408
|
|
100
|
%
|
79.93
|
%
|
270.38
|
|
216.12
|
|
12,737
|
|
||||||||||
|
Courtyard Philadelphia Downtown
|
Philadelphia, PA
|
499
|
|
100
|
%
|
81.83
|
%
|
176.71
|
|
144.60
|
|
12,221
|
|
||||||||||
|
Renaissance Tampa International Plaza
(3)
|
Tampa, FL
|
293
|
|
100
|
%
|
81.96
|
%
|
192.34
|
|
157.65
|
|
7,002
|
|
||||||||||
|
Chicago Sofitel Magnificent Mile
|
Chicago, IL
|
415
|
|
100
|
%
|
80.92
|
%
|
202.66
|
|
164.00
|
|
5,778
|
|
||||||||||
|
Pier House Resort
|
Key West, FL
|
142
|
|
100
|
%
|
77.07
|
%
|
430.59
|
|
331.87
|
|
10,982
|
|
||||||||||
|
Bardessono Hotel
(4)
|
Yountville, CA
|
62
|
|
100
|
%
|
76.96
|
%
|
770.19
|
|
592.77
|
|
4,441
|
|
||||||||||
|
Ritz-Carlton St. Thomas
(6)
|
St. Thomas, U.S. Virgin Islands
|
180
|
|
100
|
%
|
79.94
|
%
|
553.27
|
|
442.26
|
|
10,595
|
|
||||||||||
|
Park Hyatt Beaver Creek
(7)
|
Beaver Creek, CO
|
190
|
|
100
|
%
|
53.94
|
%
|
310.52
|
|
167.51
|
|
2,419
|
|
||||||||||
|
Hotel Yountville
(8)
|
Yountville, CA
|
80
|
|
100
|
%
|
71.78
|
%
|
603.21
|
|
433.00
|
|
3,924
|
|
||||||||||
|
Total / Weighted Average
(5)
|
3,574
|
|
81.77
|
%
|
$
|
260.75
|
|
$
|
213.22
|
|
$
|
118,720
|
|
||||||||||
__________________
|
(1)
|
See “Management’s Discussion and Analysis of Financial Condition and Results of Operations—Non-GAAP Financial Measures” for a reconciliation of Hotel EBITDA by property. We own the Hilton La Jolla Torrey Pines and The Capital Hilton in a joint venture. The Hotel EBITDA represents the total amount for each hotel during our period of ownership, not our pro rata amount based on our ownership percentage.
|
|
(2)
|
Subject to a ground lease that expires in 2067.
|
|
(3)
|
Subject to a ground lease that expires in 2080.
|
|
(4)
|
Subject to a ground lease that initially expires in 2055. The ground lease contains two 25-year extension options, at our election.
|
|
(5)
|
Calculated on a portfolio basis for the
twelve
hotel properties in our portfolio as of December 31,
2017
.
|
|
(6)
|
Due to the impact from hurricanes Irma and Maria, the Ritz-Carlton St. Thomas total rooms count was reduced to 74 at December 31, 2017. The hotel had 180 total rooms in service prior to the hurricanes. The applicable total rooms, with out-of-service exclusion, for each month following the hurricanes were: 77 in September, 61 in October, 72 in November and 74 in December.
|
|
(7)
|
Period from our acquisition on March 31, 2017 through December 31, 2017.
|
|
(8)
|
Period from our acquisition on May 11, 2017 through December 31, 2017
|
Hilton La Jolla Torrey Pines, La Jolla, CA
We own a 75% partnership interest in Ashford HHC Partners III LP, which is subject to a ground lease in the Hilton La Jolla Torrey Pines expiring in 2067. CHH Torrey Pines Hotel Partners LP, a subsidiary of Ashford HHC Partners III LP, leases the Hilton La Jolla Torrey Pines hotel to CHH Torrey Pines Tenant Corp. The remaining 25% partnership interest in Ashford HHC Partners III LP is owned by Park Hotels & Resorts, Inc. The hotel opened in 1989 and is comprised of 394 guest rooms, including 232 king rooms, 152 queen/queen rooms and 10 suites. Approximately
$26.5 million
was spent on capital expenditures since the acquisition of the property by Ashford HHC Partners III LP in 2007, which included lobby, restaurant, meeting space and room renovations.
The hotel’s location attracts all three major demand segments: corporate transient, group meetings and leisure transient. The famous Torrey Pines Golf Course, located on the property’s western boundary, appeals to each demand segment. Each room has a private balcony or patio with ocean, garden or golf course views. In addition to the attraction of the golf course, the hotel is located within walking distance of the Torrey Pines State Nature Reserve with access to a number of outdoor activities and Pacific Ocean beaches. Numerous hospitals and research facilities are located within close proximity of the hotel.
Additional property highlights include:
|
•
|
Meeting Space
: Approximately 60,000 square feet of meeting space, including:
|
|
•
|
21,000 square feet of function space in 21 rooms to accommodate up to 1,500 people;
|
|
•
|
over 32,000 square feet of outdoor function space; and
|
|
•
|
the 6,203 square foot Fairway Pavilion Ballroom overlooking the 18th fairway of Torrey Pines Golf Course South Course.
|
|
•
|
Food and Beverage
: The Hilton La Jolla Torrey Pines hosts the Torreyana Grill and Lounge, an all-purpose three-meal restaurant with 205 seats and the Horizons Lounge. Both outlets overlook the golf course and the Pacific Ocean.
|
|
•
|
Other Amenities
: The hotel has a fitness center, outdoor pool, outdoor whirlpool, tennis courts, basketball court, business center, valet parking and a gift shop.
|
6
Location and Access.
The hotel is located near the Pacific Ocean in a secluded area of the famous Torrey Pines golf course. The hotel is approximately 15 miles from the San Diego International Airport—Lindbergh Field.
Operating History.
The following table shows certain historical information regarding the Hilton La Jolla Torrey Pines since
2013
:
|
Year Ended December 31,
|
|||||||||||||||||||
|
2017
|
2016
|
2015
|
2014
|
2013
|
|||||||||||||||
|
Rooms
|
394
|
|
394
|
|
394
|
|
394
|
|
394
|
|
|||||||||
|
Occupancy
|
83.7
|
%
|
83.8
|
%
|
85.4
|
%
|
84.5
|
%
|
78.2
|
%
|
|||||||||
|
ADR
|
$
|
205.19
|
|
$
|
194.93
|
|
$
|
191.16
|
|
$
|
178.35
|
|
$
|
168.43
|
|
||||
|
RevPAR
|
$
|
171.64
|
|
$
|
163.41
|
|
$
|
163.15
|
|
$
|
150.71
|
|
$
|
131.76
|
|
||||
Selected Financial Information.
The following tables show certain selected financial information regarding the Hilton La Jolla Torrey Pines since
2015
(dollars in thousands):
|
Year Ended December 31,
|
|||||||||||
|
2017
|
2016
|
2015
|
|||||||||
|
Total Revenue
|
$
|
43,949
|
|
$
|
42,058
|
|
$
|
40,541
|
|
||
|
Rooms Revenue
|
24,683
|
|
23,564
|
|
23,463
|
|
|||||
|
Hotel EBITDA
(1)
|
14,740
|
|
12,922
|
|
12,520
|
|
|||||
|
EBITDA Margin
|
33.5
|
%
|
30.7
|
%
|
30.9
|
%
|
|||||
__________________
|
(1)
|
See “Management’s Discussion and Analysis of Financial Condition and Results of Operations—Non-GAAP Financial Measures” for a reconciliation of net income (loss) to Hotel EBITDA by property. We own the Hilton La Jolla Torrey Pines in a joint venture. The Hotel EBITDA amount for this hotel represents the total amount for this hotel, not our pro rata amount based on our 75% ownership percentage.
|
The Capital Hilton, Washington, D.C.
We own a 75% partnership interest in Ashford HHC Partners III LP, which has a fee simple interest in The Capital Hilton. CHH Capital Hotel Partners LP, a subsidiary of Ashford HHC Partners III LP, leases the Capital Hilton to CHH Capital Tenant Corp. The remaining 25% partnership interest in Ashford HHC Partners III LP is owned by Park Hotels & Resorts, Inc. The hotel opened in 1943 and is comprised of
550
guest rooms, including 286 king rooms, 93 queen/queen rooms, 91 double/double rooms, 78 single queen rooms and two parlor suites. Approximately
$51.5 million
was spent on capital expenditures since the acquisition of the property by Ashford HHC Partners III LP in 2007, which included renovations to the guest rooms, public space, meeting space, lobby and restaurant and executive lounge. The hotel was one of the early adopters in relocating the executive (or concierge) lounge to the lobby level, allowing the hotel to offer additional concierge room types and adding room keys back into inventory.
The hotel is strategically located at 16th and K Street, in close proximity to the White House and other government facilities. The hotel has significant historical connotations and is located near numerous Washington, D.C. attractions including the National Mall. The offices of a number of legal firms and national associations are located within walking distance of the property.
Additional property highlights include:
|
•
|
Meeting Space
: Approximately 31,000 square feet of contiguous meeting space located on the same floor.
|
|
•
|
Food and Beverage
: The Capital Hilton hosts (i) the Northgate Grill, a full service restaurant with 130 seats and (ii) the Statler Lounge, a lobby bar with 72 seats.
|
|
•
|
Other Amenities
: The hotel has the MINT Health Club and Day Spa, gift shop, business center, valet parking and an executive lounge.
|
Location and Access
. The hotel is conveniently located in the center of Washington, D.C., north of the White House and near the National Mall and numerous tourist attractions. By virtue of its size and clear signage, it is visible from both directions on 16th street. The hotel is approximately five miles from Ronald Reagan Washington National Airport.
7
Operating History
. The following table shows certain historical information regarding The Capital Hilton hotel since
2013
:
|
Year Ended December 31,
|
|||||||||||||||||||
|
2017
|
2016
|
2015
|
2014
|
2013
|
|||||||||||||||
|
Rooms
|
550
|
|
550
|
|
550
|
|
547
|
|
544
|
|
|||||||||
|
Occupancy
|
88.6
|
%
|
88.6
|
%
|
85.4
|
%
|
84.8
|
%
|
83.7
|
%
|
|||||||||
|
ADR
|
$
|
237.87
|
|
$
|
230.69
|
|
$
|
222.26
|
|
$
|
219.56
|
|
$
|
216.40
|
|
||||
|
RevPAR
|
$
|
210.83
|
|
$
|
204.36
|
|
$
|
189.88
|
|
$
|
186.11
|
|
$
|
181.03
|
|
||||
Selected Financial Information
. The following tables show certain selected financial information regarding The Capital Hilton hotel since
2015
(dollars in thousands):
|
Year Ended December 31,
|
|||||||||||
|
2017
|
2016
|
2015
|
|||||||||
|
Total Revenue
|
$
|
59,316
|
|
$
|
58,612
|
|
$
|
54,423
|
|
||
|
Rooms Revenue
|
42,325
|
|
41,137
|
|
38,045
|
|
|||||
|
Hotel EBITDA
(1)
|
17,672
|
|
17,422
|
|
15,297
|
|
|||||
|
EBITDA Margin
|
29.8
|
%
|
29.7
|
%
|
28.1
|
%
|
|||||
__________________
|
(1)
|
See “Management’s Discussion and Analysis of Financial Condition and Results of Operations—Non-GAAP Financial Measures” for a reconciliation of net income (loss) to Hotel EBITDA by property. We own The Capital Hilton in a joint venture. The Hotel EBITDA amount for this hotel represents the total amount for this hotel, not our pro rata amount based on our 75% ownership percentage.
|
Seattle Marriott Waterfront, Seattle, WA
Our subsidiary, Ashford Seattle Waterfront LP, owns a fee simple interest in the Seattle Marriott Waterfront hotel. The hotel opened in 2003 and is comprised of 348 guestrooms and 13 suites, including 204 king rooms, 155 double/double rooms and two murphy beds. About half of the hotel’s guest rooms have water views overlooking Elliott Bay. Approximately
$11.7 million
was spent on capital expenditures since acquisition by Ashford Trust in 2007. Capital improvements for 2017 included the relocation of the M Club from the eighth floor to the lobby level, which recaptured three guestrooms.
The hotel is located on the Seattle Waterfront within walking distance of Pike Place Market, a unique retail experience and a major Seattle tourist attraction. Numerous food vendors providing locally produced food, retail shops offering a variety of merchandise and the original Starbucks Coffee Shop complement the venue. The Seattle Great Wheel, one of the tallest Ferris wheels in the western United States, and the Seattle Aquarium are located along Alaskan Way in close proximity to the hotel. The hotel is also located directly across from the Pier 66 cruise terminal, a strong leisure demand generator during the six month long cruise season.
Additional property highlights include:
|
•
|
Meeting Space
: Approximately 7,700 square feet of meeting space.
|
|
•
|
Food and Beverage
: The Seattle Marriott Waterfront hosts (i) Hook and Plow, a full-service restaurant with 192 seats; (ii) Lobby Bar/Library with 120 seats; and (iii) the “Market” offering snacks, drinks and sundry items.
|
|
•
|
Other Amenities
: The hotel has a fitness center, indoor/outdoor connected pool, business center, guest laundry facilities, valet parking and electric charging stations.
|
Location and Access
. The hotel is conveniently located on the Seattle waterfront, just off of Highway 99 / Alaskan Way Viaduct. The hotel is approximately 15 miles from the Seattle/Tacoma International Airport.
8
Operating History
. The following table shows certain historical information regarding the Seattle Marriott Waterfront hotel since
2013
:
|
Year Ended December 31,
|
|||||||||||||||||||
|
2017
|
2016
|
2015
|
2014
|
2013
|
|||||||||||||||
|
Rooms
|
361
|
|
358
|
|
358
|
|
358
|
|
358
|
|
|||||||||
|
Occupancy
|
88.0
|
%
|
83.1
|
%
|
82.2
|
%
|
79.7
|
%
|
77.8
|
%
|
|||||||||
|
ADR
|
$
|
272.19
|
|
$
|
264.10
|
|
$
|
255.20
|
|
$
|
240.56
|
|
$
|
219.09
|
|
||||
|
RevPAR
|
$
|
239.50
|
|
$
|
219.40
|
|
$
|
209.84
|
|
$
|
191.66
|
|
$
|
170.45
|
|
||||
Selected Financial Information
. The following tables show certain selected financial information regarding the Seattle Marriott Waterfront hotel since
2015
(dollars in thousands):
|
Year Ended December 31,
|
|||||||||||
|
2017
|
2016
|
2015
|
|||||||||
|
Total Revenue
|
$
|
40,714
|
|
$
|
37,648
|
|
$
|
36,144
|
|
||
|
Rooms Revenue
|
31,409
|
|
28,748
|
|
27,419
|
|
|||||
|
Hotel EBITDA
(1)
|
16,209
|
|
15,115
|
|
14,662
|
|
|||||
|
EBITDA Margin
|
39.8
|
%
|
40.1
|
%
|
40.6
|
%
|
|||||
__________________
|
(1)
|
See “Management’s Discussion and Analysis of Financial Condition and Results of Operations—Non-GAAP Financial Measures” for a reconciliation of net income (loss) to Hotel EBITDA by property.
|
Courtyard San Francisco Downtown, San Francisco, CA
Our subsidiary, Ashford San Francisco II LP, owns a fee simple interest in the Courtyard San Francisco Downtown. The hotel opened in 2001 and is comprised of 408 guestrooms, including 196 king rooms, 184 queen/queen rooms and 30 suites. Approximately
$30.5 million
was spent on capital expenditures since acquisition by Ashford Trust in 2007, which included a restaurant renovation, a guestroom soft goods renovation and a meeting space renovation. In early 2017, the hotel began an extensive custom designed approximate $23 million guestroom renovation. As part of this renovation we increased the room count from 405 to 410 rooms utilizing former conference suites. Upon completion in early 2018, the Courtyard San Francisco Downtown will boast sophisticated guestrooms that represent the hotel’s ideal location in the new and evolving SoMa neighborhood. Bold vibrant colors with calming grey undertones mimic the stunning visual beauty expressed in the iconic city of San Francisco. Innovative smart technology combined with comfort and luxury to provide travelers with an intriguing and unique experience.
On November 1, 2017, we announced plans to convert the San Francisco Courtyard Downtown into an Autograph Collection property, which will include a complete redesign of the lobby, public areas and façade. The reimaged public space and modern guest rooms will merge to elevate this property within the Distinctive Premium market. We expect the conversion to be completed in December 2019.
The hotel is located conveniently downtown in the heart of the SOMA district of San Francisco. The hotel is located near numerous businesses and attractions, including the Moscone Convention Center, AT&T Park, Union Square and the Metreon Complex.
Additional property highlights include:
|
•
|
Meeting Space
: Approximately 11,000 square feet of meeting space.
|
|
•
|
Food and Beverage
: The Courtyard San Francisco Downtown hosts (i) Whispers Bar and Grill, a dinner only restaurant with 50 seats, (ii) Jasmine’s, a breakfast only restaurant with 100 seats and (iii) a Starbucks coffee shop with nine seats.
|
|
•
|
Other Amenities
: The hotel has a fitness center, indoor pool and whirlpool, valet parking and a 50 seat outdoor courtyard. The outdoor courtyard is a popular venue for receptions. The courtyard’s creatively designed outdoor fire feature allows the hotel to sell this space in both winter and summer.
|
Location and Access
. The hotel is located in downtown San Francisco and is easily accessible from Interstate 80 and US 101. The hotel is approximately 14 miles from the San Francisco International Airport.
9
Operating History
. The following table shows certain historical information regarding the Courtyard San Francisco Downtown since
2013
:
|
Year Ended December 31,
|
|||||||||||||||||||
|
2017
|
2016
|
2015
|
2014
|
2013
|
|||||||||||||||
|
Rooms
|
408
|
|
405
|
|
405
|
|
405
|
|
405
|
|
|||||||||
|
Occupancy
|
79.9
|
%
|
89.6
|
%
|
91.1
|
%
|
89.9
|
%
|
88.4
|
%
|
|||||||||
|
ADR
|
$
|
270.38
|
|
$
|
273.07
|
|
$
|
267.24
|
|
$
|
255.75
|
|
$
|
226.92
|
|
||||
|
RevPAR
|
$
|
216.12
|
|
$
|
244.54
|
|
$
|
243.45
|
|
$
|
229.90
|
|
$
|
200.58
|
|
||||
Selected Financial Information
. The following tables show certain selected financial information regarding the Courtyard San Francisco Downtown since
2015
(dollars in thousands):
|
Year Ended December 31,
|
|||||||||||
|
2017
|
2016
|
2015
|
|||||||||
|
Total Revenue
|
$
|
36,929
|
|
$
|
41,365
|
|
$
|
41,938
|
|
||
|
Rooms Revenue
|
32,109
|
|
36,249
|
|
35,988
|
|
|||||
|
Hotel EBITDA
(1)
|
12,737
|
|
12,790
|
|
13,695
|
|
|||||
|
EBITDA Margin
|
34.5
|
%
|
30.9
|
%
|
32.7
|
%
|
|||||
__________________
|
(1)
|
See “Management’s Discussion and Analysis of Financial Condition and Results of Operations—Non-GAAP Financial Measures” for a reconciliation of net income (loss) to Hotel EBITDA by property.
|
Courtyard Philadelphia Downtown, Philadelphia, PA
Our subsidiary, Ashford Philadelphia Annex LP, owns a fee simple interest in the Courtyard Philadelphia Downtown. The hotel opened in 1999 and is comprised of
499
guestrooms, including 311 king rooms, 109 queen/queen rooms, 77 double/double rooms and two Parlor Suites. Approximately
$25.8 million
has been spent on capital expenditures since its acquisition in 2007, which included a lobby bistro renovation and extensive guest rooms repositioning, bathrooms, suites and hallways renovation. An extensive meeting space renovation started during the fourth quarter of 2016 was completed in February 2017.
On June 20, 2017, we announced that we have entered into an agreement with Marriott to convert the Philadelphia Courtyard into an Autograph Collection property. We expect the conversion to be completed in June 2019.
The hotel is located in the center of Philadelphia’s downtown business district, across the street from city hall and a block away from the Philadelphia Convention Center. The hotel is a historic landmark itself, on the national register of historic places, and is convenient to the historical district, the University of Pennsylvania and Independence Hall.
Additional property highlights include:
|
•
|
Meeting Space
: Approximately 10,000 square feet of meeting space.
|
|
•
|
Food and Beverage
: The Courtyard Philadelphia Downtown hosts (i) Nineteen 26, an all-purpose restaurant and (ii) a Starbucks coffee shop.
|
|
•
|
Other Amenities
: The hotel has a fitness center, sundries shop/market, business center, guest laundry facilities and valet parking.
|
Location and Access
. The hotel is located in downtown Philadelphia and is accessible from Interstate 676. The hotel’s corner location and clear signage make it easily visible from both directions on Juniper Street. The hotel is approximately 10 miles from the Philadelphia International Airport.
10
Operating History
. The following table shows certain historical information regarding the Courtyard Philadelphia Downtown since
2013
:
|
Year Ended December 31,
|
|||||||||||||||||||
|
2017
|
2016
|
2015
|
2014
|
2013
|
|||||||||||||||
|
Rooms
|
499
|
|
499
|
|
499
|
|
499
|
|
498
|
|
|||||||||
|
Occupancy
|
81.8
|
%
|
81.8
|
%
|
82.6
|
%
|
79.4
|
%
|
76.6
|
%
|
|||||||||
|
ADR
|
$
|
176.71
|
|
$
|
182.46
|
|
$
|
175.85
|
|
$
|
166.01
|
|
$
|
165.02
|
|
||||
|
RevPAR
|
$
|
144.60
|
|
$
|
149.26
|
|
$
|
145.28
|
|
$
|
131.81
|
|
$
|
126.33
|
|
||||
Selected Financial Information
. The following tables show certain selected financial information regarding the Courtyard Philadelphia Downtown since
2015
(dollars in thousands):
|
Year Ended December 31,
|
|||||||||||
|
2017
|
2016
|
2015
|
|||||||||
|
Total Revenue
|
$
|
31,862
|
|
$
|
32,643
|
|
$
|
32,044
|
|
||
|
Rooms Revenue
|
26,337
|
|
27,260
|
|
26,461
|
|
|||||
|
Hotel EBITDA
(1)
|
12,221
|
|
12,557
|
|
12,525
|
|
|||||
|
EBITDA Margin
|
38.4
|
%
|
38.5
|
%
|
39.1
|
%
|
|||||
__________________
|
(1)
|
See “Management’s Discussion and Analysis of Financial Condition and Results of Operations—Non-GAAP Financial Measures” for a reconciliation of net income (loss) to Hotel EBITDA by property.
|
Renaissance Tampa International Plaza, Tampa, FL
We are subject to a ground lease in the Renaissance Tampa International Plaza which expires in 2080. The hotel opened in 2004 and is comprised of 293 guestrooms, including 174 king rooms, 113 double/double rooms and six suites. Approximately
$12.5 million
was spent on capital expenditures since acquisition by Ashford Trust in 2007, which included a meeting space and lobby renovation, a fitness center expansion and an extensive guestrooms renovation.
On November 1, 2017, we announced that we listed the Tampa Renaissance for sale.
The hotel is located within Tampa International Plaza, which provides many fine dining and retail options immediately adjacent to the hotel. The hotel is also located near the shopping of the Westshore business market.
Additional property highlights include:
|
•
|
Meeting Space
: Approximately 12,000 square feet of meeting space.
|
|
•
|
Food and Beverage
: The Renaissance Tampa International Plaza hosts (i) the Pelagia Trattoria, an all-purpose restaurant and (ii) Gabriella’s, a lobby bar and restaurant.
|
|
•
|
Other Amenities
: The hotel has a fitness center, outdoor pool and whirlpool, a gift shop, valet parking and a business center.
|
Location and Access
. The hotel is in Tampa International Plaza and is approximately five miles from the Tampa International Airport.
Operating History
. The following table shows certain historical information regarding the Renaissance Tampa International Plaza since
2013
:
|
Year Ended December 31,
|
|||||||||||||||||||
|
2017
|
2016
|
2015
|
2014
|
2013
|
|||||||||||||||
|
Rooms
|
293
|
|
293
|
|
293
|
|
293
|
|
293
|
|
|||||||||
|
Occupancy
|
82.0
|
%
|
81.2
|
%
|
78.0
|
%
|
80.4
|
%
|
77.6
|
%
|
|||||||||
|
ADR
|
$
|
192.34
|
|
$
|
188.12
|
|
$
|
175.40
|
|
$
|
161.82
|
|
$
|
153.70
|
|
||||
|
RevPAR
|
$
|
157.65
|
|
$
|
152.79
|
|
$
|
136.75
|
|
$
|
130.07
|
|
$
|
119.31
|
|
||||
11
Selected Financial Information
. The following tables show certain selected financial information regarding the Renaissance Tampa International Plaza since
2015
(dollars in thousands):
|
Year Ended December 31,
|
|||||||||||
|
2017
|
2016
|
2015
|
|||||||||
|
Total Revenue
|
$
|
24,125
|
|
$
|
23,881
|
|
$
|
21,934
|
|
||
|
Rooms Revenue
|
16,859
|
|
16,384
|
|
14,625
|
|
|||||
|
Hotel EBITDA
(1)
|
7,002
|
|
6,777
|
|
5,800
|
|
|||||
|
EBITDA Margin
|
29.0
|
%
|
28.4
|
%
|
26.4
|
%
|
|||||
__________________
|
(1)
|
See “Management’s Discussion and Analysis of Financial Condition and Results of Operations—Non-GAAP Financial Measures” for a reconciliation of net income (loss) to Hotel EBITDA by property.
|
The Chicago Sofitel Magnificent Mile, Chicago, IL
On February 24, 2014, we acquired a fee simple interest in the
Chicago Sofitel Magnificent Mile
. The hotel opened in 2002 and is comprised of 415 guestrooms, including 63 suites.
Approximately
$9.7 million
was spent on capital expenditures since acquisition by us in 2014. The fitness center and lobby bar were extensively renovated in the first quarter of 2017. A comprehensive guestroom and corridor renovation began in the fourth quarter of 2017 and is expected to be completed in the second quarter of 2018.
The hotel is located one block west of Chicago’s Magnificent Mile on a 0.6 acre parcel in an area of Chicago known as the Gold Coast. The 32-story building was designed by French architect Jean-Paul Viguier and has views of Lake Michigan and the Chicago skyline. It is located in the heart of the Gold Coast neighborhood, proximate to some of Chicago’s largest leisure demand generators, on the corner of Chestnut Street and Wabash Avenue.
Additional property highlights include:
|
•
|
Meeting Space
: Approximately 12,500 square feet of conference space.
|
|
•
|
Food and Beverage
: The Chicago Sofitel Magnificent Mile includes (i) the Café des Architectes, an 82 seat contemporary, Michelin Guide recommended restaurant featuring modern French cuisine; (ii) Le Bar, a 45 seat modern cocktail lounge; (iii) La Tarrasse, a 40 seat outdoor patio and lounge serving the cuisine of Café des Architectes; and (iv) Cigale, a restaurant space featuring an exhibition kitchen and frontage on Wabash Avenue overlooking Connors Park (currently utilized only for event space).
|
|
•
|
Other Amenities
: The hotel has a fitness center, a business center and valet parking.
|
Location and Access
. The hotel is located one block west of Chicago’s Magnificent Mile on a 0.6 acre parcel in an area of Chicago known as the Gold Coast. The hotel has easy access to the Chicago “L” train and is located approximately 18 miles from O’Hare International Airport and 13 miles from Midway International Airport.
Operating History
. The following table shows certain historical information regarding the
Chicago Sofitel Magnificent Mile
since
2013
:
|
Year Ended December 31,
|
Period from February 24, 2014 through December 31, 2014
|
Period from January 1, 2014 through February 23, 2014
|
Year Ended December 31, 2013
|
||||||||||||||||||||
|
2017
|
2016
|
2015
|
|||||||||||||||||||||
|
Rooms
|
415
|
|
415
|
|
415
|
|
415
|
|
415
|
|
415
|
|
|||||||||||
|
Occupancy
|
80.9
|
%
|
82.4
|
%
|
80.0
|
%
|
84.2
|
%
|
58.8
|
%
|
82.0
|
%
|
|||||||||||
|
ADR
|
$
|
202.66
|
|
$
|
215.89
|
|
$
|
222.55
|
|
$
|
234.93
|
|
$
|
139.20
|
|
$
|
222.06
|
|
|||||
|
RevPAR
|
$
|
164.00
|
|
$
|
177.93
|
|
$
|
178.11
|
|
$
|
197.84
|
|
$
|
81.87
|
|
$
|
182.13
|
|
|||||
12
Selected Financial Information
. The following table shows certain selected financial information regarding the
Chicago Sofitel Magnificent Mile
since
2015
(dollars in thousands):
|
Year Ended December 31,
|
|||||||||||
|
2017
|
2016
|
2015
|
|||||||||
|
Total Revenue
|
$
|
33,302
|
|
$
|
36,879
|
|
$
|
37,322
|
|
||
|
Rooms Revenue
|
24,841
|
|
27,026
|
|
26,980
|
|
|||||
|
Hotel EBITDA
(1)
|
5,778
|
|
8,400
|
|
8,360
|
|
|||||
|
Hotel EBITDA Margin
|
17.4
|
%
|
22.8
|
%
|
22.4
|
%
|
|||||
__________________
|
(1)
|
See “Management’s Discussion and Analysis of Financial Condition and Results of Operations—Non-GAAP Financial Measures” for a reconciliation of net income (loss) to Hotel EBITDA by property.
|
The hotel operating results for the period from February 24, 2014 through December 31, 2014, represent the operating results since our acquisition on February 24, 2014. The hotel operating results for the period from January 1, 2014 through February 23, 2014 and for the year ended December 31, 2013 represent periods before our ownership and were obtained from the prior owner. The Company performed a limited review of the information as part of its analysis of the acquisition. The financial statements as of and for the nine months ended September 30, 2013 were reviewed and included in amendment number one to our registration statement on Form S-11 filed on January 21, 2014. No financial statements were prepared, audited or reviewed as of and for the year ended December 31, 2013 or as of February 23, 2014 and for the period from January 1, 2014 through February 23, 2014.
The Pier House Resort, Key West, FL
On March 1, 2014, we acquired a fee simple interest in the Pier House Resort from Ashford Trust pursuant to an option agreement that we entered into in connection with the spin-off. The hotel opened in 1968 and is comprised of 142 guestrooms, including 76 king rooms, 43 queen/queen rooms and 23 suites. Approximately
$5.9 million
was spent on capital expenditures since acquisition by Ashford Trust in May 2013, which included spa, fitness center and select guestrooms refresh renovations.
The hotel is located on a six acre compound in Key West, Florida. In addition to its secluded private beach, the hotel is well situated at the north end of Duval Street providing easy access to the heart of Key West and its many demand generators.
Additional property highlights include:
|
•
|
Meeting Space
: Approximately 2,600 square feet of conference space and 2,000 square feet of wedding space overlooking the Gulf of Mexico.
|
|
•
|
Food and Beverage
: The Pier House Resort provides an al fresco beach bar, the 152 seat One Duval Restaurant as well as the 18 seat Chart Room.
|
|
•
|
Other Amenities
: The hotel has a full service spa, a private beach, a heated outdoor pool and a private dock for charter pick-ups.
|
Location and Access
. The hotel is located on a six acre compound in the historic district of Key West, Florida, on Duval Street, at the Gulf of Mexico. Key West, which is the southernmost point of the Florida peninsula, is 160 miles south of Miami. Key West International Airport is approximately four miles from the property and the Marathon and Miami airports are all within driving distance.
Operating History
. The following table shows certain historical information regarding the Pier House Resort since
2013
:
|
Year Ended December 31,
|
Period from March 1, 2014 through December 31, 2014
|
Period from January 1, 2014 through February 28, 2014
|
Year Ended December 31, 2013
|
||||||||||||||||||||
|
2017
|
2016
|
2015
|
|||||||||||||||||||||
|
Rooms
|
142
|
|
142
|
|
142
|
|
142
|
|
142
|
|
142
|
|
|||||||||||
|
Occupancy
|
77.1
|
%
|
87.9
|
%
|
90.2
|
%
|
85.2
|
%
|
93.6
|
%
|
84.6
|
%
|
|||||||||||
|
ADR
|
$
|
430.59
|
|
$
|
410.79
|
|
$
|
396.99
|
|
$
|
374.92
|
|
$
|
435.51
|
|
$
|
357.86
|
|
|||||
|
RevPAR
|
$
|
331.87
|
|
$
|
361.08
|
|
$
|
357.88
|
|
$
|
319.37
|
|
$
|
407.75
|
|
$
|
302.76
|
|
|||||
13
Selected Financial Information
. The following table shows certain selected financial information regarding the Pier House Resort since
2015
(dollars in thousands):
|
Year Ended December 31,
|
|||||||||||
|
2017
|
2016
|
2015
|
|||||||||
|
Total Revenue
|
$
|
23,232
|
|
$
|
23,435
|
|
$
|
23,192
|
|
||
|
Rooms Revenue
|
17,202
|
|
18,766
|
|
18,549
|
|
|||||
|
Hotel EBITDA
(1)
|
10,982
|
|
10,229
|
|
9,730
|
|
|||||
|
EBITDA Margin
|
47.3
|
%
|
43.6
|
%
|
42.0
|
%
|
|||||
__________________
|
(1)
|
See “Management’s Discussion and Analysis of Financial Condition and Results of Operations—Non-GAAP Financial Measures” for a reconciliation of net income (loss) to Hotel EBITDA by property.
|
The hotel operating results for the period from March 1, 2014 through December 31, 2014, represent the operating results since our acquisition on March 1, 2014. The hotel operating results for the period from January 1, 2014 through February 28, 2014 and for the year ended December 31, 2013, represent periods before our ownership and were obtained from the prior owner. The Company performed a limited review of the information as part of its analysis of the acquisition. The financial statements as of May 14, 2013, and for the period from January 1 through May 13, 2013, and as of September 30, 2013, and for the period from May 14 through September 30, 2013, were reviewed and included in amendment number one to our registration statement on Form S-11 filed on January 21, 2014. No financial statements were prepared, audited or reviewed as of and for the year ended December 31, 2013 or as of February 28, 2014 and for the period from January 1, 2014 through February 28, 2014.
Bardessono Hotel, Yountville, CA
On July 9, 2015, we acquired a 100% leasehold interest in the Bardessono Hotel in Yountville, California, which is subject to a ground lease that initially expires in 2055, with two 25-year extension options. The Bardessono Hotel was built in 2009, has 62 luxurious rooms and suites and is in outstanding physical condition. Built and operated with a primary focus on green practices, the hotel is the only LEED Platinum certified hotel in California and one of only 3 LEED Platinum certified hotels in the U.S. In addition to a meeting space renovation, in 2016 we received approval to construct a 4,000 sq. ft. Presidential Villa. The villa will be built on an undeveloped adjacent parcel of land owned by the Bardessono family. The luxurious villa will consist of 3 large keys, a hospitality suite and private auto court. The construction of the villa is currently targeted to start during 2018. Current capital plans entail the conversion of the existing fitness center into two guest rooms and constructing a new fitness center adjacent to the swimming pool.
Approximately
$1.4 million
has been spent on capital expenditures since our acquisition in July 2015.
The hotel is located in Yountville, California and enjoys a central location in the heart of Napa Valley. It offers exceptional amenities, including large, well-appointed guestrooms and suites with private patios/balconies. Guestrooms have fireplaces and oversized bathrooms, many featuring steam showers and a second shower located outdoors in a private garden.
Additional property highlights include:
|
•
|
Meeting Space
: Approximately 2,100 square feet of indoor and outdoor meeting space.
|
|
•
|
Food and Beverage
: The Bardessono Hotel offers the acclaimed 84 seat Lucy restaurant and bar.
|
|
•
|
Other Amenities
: The hotel offers on-site spa, fitness center, outdoor amenities include a rooftop pool, a vegetable garden, carbon fiber bicycles and Lexus Hybrid vehicles are also available for guest use.
|
Location and Access
. The hotel is approximately 60 miles north of San Francisco, approximately 68 miles from the San Francisco International Airport and approximately 60 miles from the Oakland International Airport. The hotel is located within the quaint town of Yountville, offering numerous retail and restaurant establishments including the famed French Laundry. Yountville is in the heart of the Napa Valley, a premier wine and culinary destination with over 450 wineries. In addition to the valley’s traditional wine and dining attractions, the region is also known as a popular leisure destination for hiking, biking, golfing, shopping and festivals.
14
Operating History
. The following table shows certain historical information regarding the Bardessono Hotel since 2014:
|
Year Ended December 31,
|
Period from July 9, 2015 through December 31, 2015
|
Period from January 1, 2015 through July 8, 2015
|
Year Ended December 31, 2014
|
||||||||||||||||
|
2017
|
2016
|
||||||||||||||||||
|
Rooms
|
62
|
|
62
|
|
62
|
|
62
|
|
62
|
|
|||||||||
|
Occupancy
|
77.0
|
%
|
84.4
|
%
|
79.7
|
%
|
77.8
|
%
|
79.1
|
%
|
|||||||||
|
ADR
|
$
|
770.19
|
|
$
|
733.66
|
|
$
|
788.25
|
|
$
|
648.53
|
|
$
|
677.44
|
|
||||
|
RevPAR
|
$
|
592.77
|
|
$
|
619.02
|
|
$
|
628.17
|
|
$
|
504.69
|
|
$
|
535.76
|
|
||||
Selected Financial Information
. The following table shows certain selected financial information regarding the Bardessono Hotel since
2015
(dollars in thousands):
|
Year Ended December 31,
|
Period from July 9, 2015 through December 31, 2015
|
Period from January 1, 2015 through July 8, 2015
|
|||||||||||||
|
2017
|
2016
|
||||||||||||||
|
Total Revenue
|
$
|
17,701
|
|
$
|
18,934
|
|
$
|
9,684
|
|
$
|
8,806
|
|
|||
|
Rooms Revenue
|
13,414
|
|
14,047
|
|
6,855
|
|
5,914
|
|
|||||||
|
Hotel EBITDA
(1)
|
4,441
|
|
5,029
|
|
2,900
|
|
1,054
|
|
|||||||
|
EBITDA Margin
|
25.1
|
%
|
26.6
|
%
|
30.0
|
%
|
12.0
|
%
|
|||||||
__________________
|
(1)
|
See “Management’s Discussion and Analysis of Financial Condition and Results of Operations—Non-GAAP Financial Measures” for a reconciliation of net income (loss) to Hotel EBITDA by property.
|
The hotel operating results for the period from July 9, 2015 through December 31, 2015 represent the operating results since our acquisition on July 9, 2015. The hotel operating results for the period from January 1, 2015 through July 8, 2015 and for the year ended December 31, 2014 represent periods before our ownership and was obtained from the prior owner. The Company performed a limited review of the information as part of its analysis of the acquisition. The financial statements as of and for the years ended December 31, 2014 and 2013 were audited and included in our Current Report on Form 8-K filed on July 15, 2015 and as of and for the six months ended June 30, 2015 were reviewed and included in an amendment to our Current Report on Form 8-K filed on February 3, 2016. No financial statements were prepared, audited or reviewed for the period from July 1, 2015 through July 8, 2015.
The Ritz-Carlton Hotel, St. Thomas, U.S. Virgin Islands
On December 15, 2015, we acquired a 100% interest in the Ritz-Carlton St. Thomas in St. Thomas, U.S. Virgin Islands. The Ritz-Carlton St. Thomas opened in 1996 and has 155 luxurious guest rooms and 25 suites all featuring a spacious private balcony with ocean or resort views. The resort completed a comprehensive $22.0 million renovation of the guest rooms and public space prior to our acquisition of the resort, and approximately
$6.6 million
has been spent on capital expenditures since our acquisition in December 2015. Capital investment is focused on remediation and reconstruction effort due to damage sustained after Hurricane Irma. The hotel is currently closed to guests; however, there are currently 83 guest rooms available for sale to groups assisting with relief efforts.
Additional property highlights include:
|
•
|
Meeting Space
: The property has more than 10,000 square feet of indoor and outdoor meeting and function space offering stunning views of Great Bay and neighboring St. John.
|
|
•
|
Food and Beverage
: The property features (i) the signature 163 seat Bleuwater Restaurant; (ii) Essenza, a 164 seat Italian restaurant; (iii) Sails, a 155 seat beachside restaurant and bar; (iv) Coconut Cove, a second beachside 118 seat restaurant, on the grounds of the adjacent Ritz Carlton Residences; and (v) Zest, a coffee/frozen yogurt shop.
|
|
•
|
Other Amenities
: The resort offers a beachfront infinity-edge pool as well as a children’s pool and hot tub, a 7,500 square foot full-service award-winning spa and a 2,000 square foot fitness center. The resort also offers Jean-Michel Cousteau’s Ambassadors of the Environment eco adventures for children and adults and a comprehensive aquatic center.
|
Location and Access
. The hotel is located on 30 pristine oceanfront acres along Great Bay, St. Thomas, U.S. Virgin Islands. It is 1.6 miles from Urman Victor Fredericks Marine Terminal, 11 miles from Cyril E. King Airport and 4 miles from Coki Beach.
15
Operating History
. The following table shows certain historical information regarding the Ritz-Carlton St. Thomas since 2014:
|
Year Ended December 31,
|
Period from December 15, 2015 through December 31, 2015
|
Period from January 1, 2015 through December 14, 2015
|
Year Ended December 31, 2014
|
||||||||||||||||
|
2017
|
2016
|
||||||||||||||||||
|
Rooms
|
180
|
|
180
|
|
180
|
|
180
|
|
180
|
|
|||||||||
|
Occupancy
|
79.9
|
%
|
78.5
|
%
|
73.2
|
%
|
80.0
|
%
|
67.9
|
%
|
|||||||||
|
ADR
|
$
|
553.27
|
|
$
|
537.75
|
|
$
|
1,179.85
|
|
$
|
523.57
|
|
$
|
542.82
|
|
||||
|
RevPAR
|
$
|
442.26
|
|
$
|
421.90
|
|
$
|
863.30
|
|
$
|
418.91
|
|
$
|
368.54
|
|
||||
Selected Financial Information
. The following table shows certain selected financial information regarding the Ritz-Carlton St. Thomas since
2015
(dollars in thousands):
|
Year Ended December 31,
|
Period from December 15, 2015 through December 31, 2015
|
Period from January 1, 2015 through December 14, 2015
|
|||||||||||||
|
2017
|
2016
|
||||||||||||||
|
Total Revenue
|
$
|
43,957
|
|
$
|
50,278
|
|
$
|
3,884
|
|
$
|
48,379
|
|
|||
|
Rooms Revenue
|
23,171
|
|
27,795
|
|
2,642
|
|
26,240
|
|
|||||||
|
Hotel EBITDA
(1)
|
10,595
|
|
8,813
|
|
1,489
|
|
7,667
|
|
|||||||
|
EBITDA Margin
|
24.1
|
%
|
17.5
|
%
|
38.3
|
%
|
15.9
|
%
|
|||||||
__________________
|
(1)
|
See “Management’s Discussion and Analysis of Financial Condition and Results of Operations—Non-GAAP Financial Measures” for a reconciliation of net income (loss) to Hotel EBITDA by property.
|
The hotel operating results for the period from December 15, 2015 through December 31, 2015, represent the operating results since our acquisition on December 15, 2015. The hotel operating results for the period from January 1, 2015 through December 14, 2015 and for the year ended December 31, 2014 represent periods before our ownership and were obtained from the prior owner. The Company performed a limited review of the information as part of its analysis of the acquisition. The financial statements as of and for the year ended December 31, 2014 were audited and as of and for the nine months ended September 30, 2015 were reviewed and included in an amendment to our Current Report on Form 8-K filed on February 26, 2016. No financial statements were prepared, audited or reviewed for the period from October 1, 2015 through December 14, 2015.
The Park Hyatt Beaver Creek, Beaver Creek, CO
On March 31, 2017, we acquired a 100% interest in the 190-room Park Hyatt Beaver Creek in Beaver Creek, Colorado. Located in the heart of Beaver Creek Village, the Park Hyatt Beaver Creek is ideally positioned in the most prestigious location within the Vail Valley which is approximately 90 miles west of Denver and is one of the most exclusive resort destinations in North America. The Park Hyatt Beaver Creek was built in 1989 and has 190 luxurious and spacious rooms, including 77 king rooms, 65 double/double rooms, 20 double/queen rooms, five suite parlors and 23 suites. The hotel property is in excellent physical condition after having received over
$7.5 million
in capital improvements over the past few years prior to our acquisition. Capital plans estimated at $7.6 million over the next two years include the addition of seven guest rooms and one suite (using space from former offices and excess spa square footage), a full lobby renovation, renovation of existing suite parlors and the addition of a private concierge/ski club with ski locker facilities. Approximately
$608,000
has been spent on capital expenditures since our acquisition in March 2017.
Additional property highlights include:
|
•
|
Meeting Space
: The property has over 20,000 sq. ft. of flexible indoor meeting space.
|
|
•
|
Food and Beverage
: The property has four food and beverage outlets, including the world-class 8100 Mountainside Bar & Grill, the Antler Hall (lobby) Bar, the Café and Powder 8 Kitchen & Tap, serving the Beaver Creek community and hotel guests during the ski season.
|
|
•
|
Other Amenities
: The resort offers an array of amenities, including the award-winning 30,000 sq. ft. Allegria Spa, a heated outdoor pool beneath a mountain waterfall, 24-hour state-of-the-art fitness club, ski valet service, outdoor fire pits and access to two championship golf courses and the Beaver Creek Tennis Center. The Property also features over 18,800 sq. ft. of fully leased, highly visible retail space in the heart of Beaver Creek.
|
Location and Access
. Located in the heart of Beaver Creek Village, Colorado, the Park Hyatt is positioned as the leading resort in one of North America's most renowned luxury resort destinations. Beyond the world-class hotel, guests have easy access
16
to Beaver Creek's famous amenities, including exceptional dining and shops, the 535-seat Vilar Performing Arts Center, and an outdoor ice skating rink. While the Vail Valley is home to some of the top ski areas in the world and is a top winter destination, it is also very popular as a summer destination as it boasts many diverse leisure activities, including hiking, biking, horseback riding, white water rafting, fishing, golfing, shopping and festivals.
Operating History
. The following table shows certain historical information regarding the Park Hyatt Beaver Creek since 2016:
|
Period from March 31, 2017 through
December 31, 2017
|
Period from January 1, 2017 through March 30, 2017
|
Year Ended December 31, 2016
|
|||||||||
|
Rooms
|
190
|
|
190
|
|
190
|
|
|||||
|
Occupancy
|
53.9
|
%
|
83.7
|
%
|
62.0
|
%
|
|||||
|
ADR
|
$
|
310.52
|
|
$
|
700.74
|
|
$
|
435.33
|
|
||
|
RevPAR
|
$
|
167.51
|
|
$
|
586.82
|
|
$
|
270.02
|
|
||
Selected Financial Information
. The following table shows certain selected financial information regarding the Park Hyatt Beaver Creek since 2016 (dollars in thousands):
|
Period from March 31, 2017
through
December 31, 2017
|
Period from January 1, 2017 through March 30, 2017
|
Year Ended December 31, 2016
|
|||||||||
|
Total Revenue
|
$
|
21,969
|
|
$
|
18,810
|
|
$
|
40,149
|
|
||
|
Rooms Revenue
|
8,753
|
|
10,034
|
|
18,777
|
|
|||||
|
Hotel EBITDA
(1)
|
2,419
|
|
6,968
|
|
9,700
|
|
|||||
|
EBITDA Margin
|
11.0
|
%
|
37.0
|
%
|
24.2
|
%
|
|||||
__________________
|
(1)
|
See “Management’s Discussion and Analysis of Financial Condition and Results of Operations—Non-GAAP Financial Measures” for a reconciliation of net income (loss) to Hotel EBITDA by property.
|
The hotel operating results for the period from March 31, 2017 through December 31, 2017, represent the operating results since our acquisition on March 31, 2017. The hotel operating results for the period from January 1, 2017 through March 30, 2017 and for the year ended December 31, 2016 represent periods before our ownership and was obtained from the prior owner. The Company performed a limited review of the information as part of its analysis of the acquisition. The financial statements as of and for the year ended December 31, 2016 were audited and included in an amendment to our Current Report on Form 8-K filed on June 13, 2017. No financial statements were prepared, audited or reviewed for the period from January 1, 2017 through March 30, 2017.
Hotel Yountville, Yountville, CA
On May 11, 2017, we acquired a 100% interest in the 80-room Hotel Yountville in Yountville, California. The Hotel Yountville was originally built in 1998 and, in 2011, underwent an extensive expansion and renovation that upgraded all guestrooms, adding 29 new guestrooms, and added a restaurant, spa, meeting and event space, an outdoor pool, and lounge patio. Currently, the property has 80 luxury rooms consisting of 62 king rooms, eight double/queen rooms and 10 suites and is in excellent physical condition. Approximately
$168,000
has been spent on capital expenditures since acquisition by us in May 2017.
Additional property highlights include:
|
•
|
Meeting Space
: The property has 4,392 square feet of indoor and outdoor meeting space.
|
|
•
|
Food and Beverage
: The property has the acclaimed 46-seat Hopper Creek Kitchen restaurant and bar, in-room dining service and complimentary wine tastings.
|
|
•
|
Other Amenities
: The property offers well-appointed guestrooms and suites with private patios/balconies and a 6,500 square foot on-site spa. Its outdoor amenities are notable as well, including a resort-style outdoor heated pool and lounge, landscaping and water features, and the availability of complimentary bicycles for guest use.
|
Location and Access
. Located in the heart of Yountville, CA, the Hotel Yountville is approximately 60 miles north of San Francisco and enjoys a central location in the heart of the Napa Valley, widely acclaimed as the continent's premier wine and culinary destination with over 450 wineries. Known as the "Culinary Capital of the Napa Valley," Yountville boasts an array of restaurants by famed chefs, earning more Michelin stars per capita than any other place in North America. In addition to the valley's
17
traditional wine and dining attractions, the region is also known as a popular leisure destination for hiking, biking, golfing, shopping and festivals.
Operating History
. The following table shows certain historical information regarding the Hotel Yountville since 2016:
|
Period from May 11, 2017 through
December 31, 2017
|
Period from January 1, 2017 through May 10, 2017
|
Year Ended December 31, 2016
|
|||||||||
|
Rooms
|
80
|
|
80
|
|
80
|
|
|||||
|
Occupancy
|
71.8
|
%
|
75.5
|
%
|
86.4
|
%
|
|||||
|
ADR
|
$
|
603.21
|
|
$
|
442.11
|
|
$
|
541.31
|
|
||
|
RevPAR
|
$
|
433.00
|
|
$
|
333.88
|
|
$
|
467.82
|
|
||
Selected Financial Information
. The following table shows certain selected financial information regarding the Hotel Yountville since 2016 (dollars in thousands):
|
Period from May 11, 2017 through
December 31, 2017
|
Period from January 1, 2017 through May 10, 2017
|
Year Ended December 31, 2016
|
|||||||||
|
Total Revenue
|
$
|
9,599
|
|
$
|
4,276
|
|
$
|
16,410
|
|
||
|
Rooms Revenue
|
8,140
|
|
3,473
|
|
13,698
|
|
|||||
|
Hotel EBITDA
(1)
|
3,924
|
|
1,233
|
|
6,960
|
|
|||||
|
EBITDA Margin
|
40.9
|
%
|
28.8
|
%
|
42.4
|
%
|
|||||
__________________
|
(1)
|
See “Management’s Discussion and Analysis of Financial Condition and Results of Operations—Non-GAAP Financial Measures” for a reconciliation of net income (loss) to Hotel EBITDA by property.
|
The hotel operating results for the period from May 11, 2017 through December 31, 2017, represent the operating results since our acquisition on May 11, 2017. The hotel operating results for the period from January 1, 2017 through May 11, 2017 and for the year ended December 31, 2016 represent periods before our ownership and was obtained from the prior owner. The Company performed a limited review of the information as part of its analysis of the acquisition. The financial statements as of and for the years ended September 30, 2016 and 2015 were audited and as of and for the three months ended December 31, 2016 were reviewed and included in an amendment to our Current Report on Form 8-K filed on July 17, 2017. No financial statements were prepared, audited or reviewed for the period from April 1, 2017 through May 10, 2017.
Asset Management
The senior management team, provided to us by Ashford LLC, facilitated all asset management services for our hotel properties prior to the spin-off and continues to do so, including for the properties we acquired after the spin-off. The team of professionals provided by Ashford LLC proactively works with our third-party hotel management companies to maximize profitability at each of our hotel properties. The asset management team monitors the performance of our hotel properties on a daily basis and holds frequent ownership meetings with personnel at the hotel properties and key executives with the brands and management companies. The asset management team works closely with our third-party hotel management companies on key aspects of each hotel’s operation, including, among others, revenue management, market positioning, cost structure, capital and operational budgeting as well as the identification of return on investment initiatives and overall business strategy. In addition, we retain approval rights on key staffing positions at many of our hotel properties, such as the hotel’s general manager and director of sales. We believe that our strong asset management process helps to ensure that each hotel is being operated to our and our franchisors’ standards, that our hotel properties are being adequately maintained in order to preserve the value of the asset and the safety of the hotel to customers, and that our hotel management companies are maximizing revenue and enhancing operating margins. See “Certain Agreements—The Advisory Agreement.”
Third-Party Agreements
Hotel Management Agreements
. Nine of our hotel properties are operated pursuant to a hotel management agreement with one of four brand hotel management companies. Each hotel management company receives a base management fee and is also eligible to receive an incentive management fee if hotel operating income, as defined in the respective management agreement, exceeds certain thresholds. The incentive management fee is generally calculated as a percentage of hotel operating income after we have received a priority return on our investment in the hotel. See “Certain Agreements—Hotel Management Agreements.”
18
Franchise Agreements
. None of our hotel properties operate under franchise agreements. The hotel management agreements with Marriott, Hilton, Hyatt or Accor allow nine of our hotel properties to operate under the Marriott, Hilton, Hyatt or Sofitel brand names, as applicable, and provide benefits typically associated with franchise agreements and licenses, including, among others, the use of the Courtyard, Marriott, Renaissance, Ritz-Carlton, Hilton, Hyatt or Sofitel, as applicable, reservation system and guest loyalty and reward program. Any intellectual property and trademarks of Marriott, Hilton Hyatt or Accor, as applicable, are exclusively owned and controlled by the applicable manager or an affiliate of such manager which grants the manager rights to use such intellectual property or trademarks with respect to the applicable hotel.
Licensing Agreement.
The Ritz Carlton St. Thomas is subject to a License and Royalty Agreement (the “Royalty Agreement”) which allows us to use the Ritz-Carlton brand for fifty years with Marriott having two ten-year extension options. The Royalty Agreement is coterminous with the Management Agreement. In connection with our ability to use the Ritz-Carlton brand, we are obligated to pay a royalty fee of 2.6% of gross revenues and an incentive royalty of 20% of operating profit in excess of owner’s priority.
In addition, we are a party to a Mutual Exclusivity Agreement and a Master Management Agreement with Remington Lodging. See “Certain Agreements—Remington Master Management Agreement” and “Mutual Exclusivity Agreement.”
Ground Leases
Three of our hotel properties are subject to ground leases that cover all of the land underlying the respective hotel. See “Certain Agreements—Ground Leases” for more information related to our ground leases.
Our Financing Strategy
As part of our separation from Ashford Trust, we assumed mortgage indebtedness secured by the eight hotel properties we acquired in the spin-off, which totaled $621.9 million (including the indebtedness secured by the two hotel properties we own through a consolidated joint venture) as of December 31, 2013. We partially financed the acquisition of the Chicago Sofitel Magnificent Mile through a mortgage loan of $80.0 million. In connection with our acquisition of the Pier House Resort, we assumed $69.0 million of property level debt from Ashford Trust. We also acquired a 100% leasehold interest in the Bardessono Hotel with proceeds from a privately placed convertible preferred stock offering and cash on hand totaling $85.0 million. On November 23, 2015, we completed the financing of a $40.0 million mortgage loan, which is secured by the Bardessono Hotel. In addition, we partially financed the acquisitions of the Ritz-Carlton St. Thomas through a mortgage loan of $42.0 million, the Park Hyatt Beaver Creek through a mortgage loan of
$67.5 million
and the Hotel Yountville through a mortgage loan of
$51.0 million
.
As of
December 31, 2017
, our property-level indebtedness was approximately
$826.2 million
, with a weighted average interest rate of
4.32%
per annum. As of
December 31, 2017
, approximately
99.0%
of our mortgage debt bears interest at the variable rate of LIBOR plus
2.67%
and the remaining
1.0%
bears interest at a fixed rate of
12.85
%. We intend to continue to use a mix of fixed and variable-rate debt, and we may, if appropriate, enter into interest rate hedges.
We intend to finance our long-term growth and liquidity needs with operating cash flow, equity issuances of both common and preferred stock, joint ventures, a revolving line of credit and secured and unsecured debt financings having staggered maturities. We target leverage of 45% net debt to gross assets. We may also issue common units in our operating partnership to acquire properties from sellers who seek a tax-deferred transaction. We may also from time to time receive additional capital from our advisor in the form of key money.
We may use the proceeds from any borrowings for working capital, consistent with industry practice, to:
|
•
|
purchase interests in partnerships or joint ventures;
|
|
•
|
finance the origination or purchase of debt investments; or
|
|
•
|
finance acquisitions, expand, redevelop or improve existing properties, or develop new properties or other uses.
|
Certain Agreements
The Advisory Agreement
We are advised by Ashford LLC, a subsidiary of Ashford Inc. Pursuant to our advisory agreement, Ashford LLC acts as our advisor, responsible for implementing our investment strategies and decisions and the management of our day-to-day operations, subject to the supervision and oversight of our board. We rely on Ashford LLC to provide, or obtain on our behalf, the personnel and services necessary for us to conduct our business, and we have no employees of our own. All of our officers are also employees of Ashford LLC. The executive offices of Ashford LLC are located at 14185 Dallas Parkway, Suite 1100, Dallas, Texas 75254, and the telephone number of Ashford LLC’s executive offices is (972) 490-9600.
19
Pursuant to the terms of our advisory agreement, Ashford LLC and its affiliates provide us with our management team, along with appropriate support personnel as Ashford LLC deems reasonably necessary. Ashford LLC and its affiliates are not obligated to dedicate any of their respective employees exclusively to us, nor are Ashford LLC, its affiliates or any of their employees obligated to dedicate any specific portion of its or their time to our business except as necessary to perform the service required of them in their capacity as our advisor. Ashford LLC is at all times subject to the supervision and oversight of our board. So long as Ashford LLC is our advisor, our governing documents require us to include two persons designated by Ashford LLC as candidates for election as director at any stockholder meeting at which directors are to be elected. Such nominees may be executive officers of our advisor. If the size of our board of directors is increased at any time to more than seven directors, Ashford LLC’s right to nominate shall be increased by such number of directors as shall be necessary to maintain the ratio of directors nominated by Ashford LLC to the directors otherwise nominated, as nearly as possible (rounding to the next larger whole number), equal to the ratio that would have existed if our board of directors consisted of seven members. The advisory agreement requires Ashford LLC to manage our business affairs in conformity with the policies and the guidelines that are approved and monitored by our board. Additionally, Ashford LLC must refrain from taking any action that would (a) adversely affect our status as a REIT, (b) subject us to regulation under the Investment Company Act of 1940, as amended (the “Investment Company Act”), (c) knowingly and intentionally violate any law, rule or regulation of any governmental body or agency having jurisdiction over us, (d) violate any of the rules or regulations of any exchange on which our securities are listed or (e) violate our charter, bylaws or resolutions of our board of directors, all as in effect from time to time.
Duties of Ashford LLC.
Subject to the supervision of our board of directors, Ashford LLC is responsible for our day-to-day operations, including all of our subsidiaries and joint ventures, and shall perform (or cause to be performed) all services necessary to operate our business as outlined in the advisory agreement. Those services include sourcing and evaluating hotel acquisition and disposition opportunities, asset managing the hotel properties in our portfolio and overseeing the property managers, handling all of our accounting, treasury and financial reporting requirements, and negotiating terms of loan documents for our debt financings, as well as other duties and services outlined in the advisory agreement.
Any increase in the scope of duties or services to be provided by Ashford LLC must be jointly approved by us and Ashford LLC and will be subject to additional compensation as outlined in the advisory agreement.
Ashford LLC is our exclusive asset manager; provided, that if our independent directors and Ashford Inc.’s independent directors determine that a proposed acquisition of property would be uneconomic to us without additional incentives, we will have the option of utilizing Ashford LLC as the asset manager or engaging a third party as the asset manager.
Ashford LLC also has the power to delegate all or any part of its rights and powers to manage and control our business and affairs to such officers, employees, affiliates, agents and representatives of Ashford LLC or our Company as it may deem appropriate. Any authority delegated by Ashford LLC to any other person is subject to the limitations on the rights and powers of our advisor specifically set forth in the advisory agreement or our charter.
Ashford LLC and Ashford Inc. have agreed, from time to time, to make mutually agreed upon “key money investments” in our Company, our subsidiaries or affiliates to facilitate our acquisition of one or more properties, if our independent directors and Ashford Inc. determine that without such an investment, the acquisition of such property would be uneconomic to us. Any such assets are referred to as “key money assets.” Any key money investment will be in the form of, but not limited to, cash, notes, equity of Ashford Inc., the acquisition of furniture, fixture and equipment (“FF&E”) for use at the subject hotel, or as agreed at the time a key money investment is made. Upon any such key money investment, we will engage Ashford LLC as the asset manager for the related key money asset and will pay the key money asset management fees which are included in the base fees. We may also agree to additional incentive fees based on the performance of any key money asset. We will be obligated to pay Ashford LLC the “key money clawback amount,” which is equal to the difference between a per annum return of 5% on a key money asset together with the initial key money investment amount and the amount actually received by Ashford LLC (through key money asset management fees and key money incentive fees, if applicable) related to such key money asset, if the advisory agreement (or the applicable asset management agreement) is terminated by us for any reason or we dispose of such key money asset (calculated on an investment by investment basis).
Ashford LLC also acknowledges receipt of our code of business conduct and ethics, code of conduct for the chief executive officer, chief financial officer and chief accounting officer and policy on insider trading and agrees to require its employees who provide services to us to comply with the codes and the policy.
Limitations on Liability and Indemnification.
The advisory agreement provides that Ashford LLC has no responsibility other than to render the services and take the actions described in the advisory agreement in good faith and with the exercise of due care and will not be responsible for any action our board of directors takes in following or declining to follow any of Ashford LLC’s advice or recommendations. The advisory agreement provides that Ashford LLC (including its officers, directors, managers, employees and members) will not be liable for any act or omission by it (or them) performed in accordance with and pursuant to
20
the advisory agreement, except by reason of acts constituting gross negligence, bad faith, willful misconduct or reckless disregard of duties under the advisory agreement.
We have agreed to indemnify and hold harmless Ashford LLC (including its partners, directors, officers, stockholders, managers, members, agents, employees and each other person or entity, if any, controlling Ashford LLC) to the full extent lawful, from and against any and all losses, claims, damages or liabilities of any nature whatsoever with respect to or arising from Ashford LLC’s acts or omission (including ordinary negligence) in its capacity as such, except with respect to losses, claims, damages or liabilities with respect to or arising out of Ashford LLC’s gross negligence, bad faith or willful misconduct, or reckless disregard of its duties under the advisory agreement (for which Ashford LLC will indemnify us).
Term and Termination.
The term of our advisory agreement is 10 years from the effective date of the advisory agreement, with up to seven successive additional ten-year terms upon Ashford LLC’s written notice to us not less than 210 days prior to the expiration of the then current term of Ashford LLC’s election to extend the term of our advisory agreement.
We may terminate the advisory agreement at any time, including during the 10-year initial term, without the payment of a termination fee under the following circumstances:
|
•
|
immediately upon providing written notice to Ashford LLC, following its conviction (including a plea or nolo contendere) of a felony;
|
|
•
|
immediately upon providing written notice to Ashford LLC, if it commits an act of fraud against us, misappropriates our funds or acts in a manner constituting willful misconduct, gross negligence or reckless disregard in the performance of its material duties under the advisory agreement (including a failure to act); provided, however, that if any such actions or omissions are caused by an employee and/or an officer of Ashford LLC (or an affiliate of Ashford LLC) and Ashford LLC takes all reasonable necessary and appropriate action against such person and cures the damage caused by such actions or omissions within 45 days of Ashford LLC’s actual knowledge of its commission or omission, we will not have the right to terminate the advisory agreement;
|
|
•
|
immediately, upon the commencement of an action for dissolution of our advisor; or
|
|
•
|
(i) upon the entry by a court of competent jurisdiction of a final non-appealable order awarding monetary damages to us based on a finding that our advisor committed a material breach or default of a material term, condition, obligation or covenant of the advisory agreement, which breach or default had a material adverse effect on us, but only where our advisor fails to pay the monetary damages in full within 60 days of the date when the monetary judgment becomes final and non-appealable; provided, however, that if our advisor notified us that our advisor is unable to pay any judgment for monetary damages in full within 60 days of when the judgment becomes final and non-appealable, we may not terminate the advisory agreement if, within the 60-day period, our advisor delivers a promissory note to us having a principal amount equal to the unpaid balance of the judgment and bearing interest at 8.00% per annum, which note shall mature on the 12 month anniversary of the date that the judgment becomes final and non-appealable; and (ii) upon no less than 60 days’ written notice to our advisor, prior to initiating any proceeding claiming a material breach or default by our advisor, of the nature of the default or breach and providing our advisor with an opportunity to cure the default or breach, or if the default or breach is not reasonably susceptible to cure within 60 days, an additional cure period as is reasonably necessary to cure the default or breach so long as our advisor is diligently and in good faith pursuing the cure.
|
Either party may also terminate the advisory agreement, with the payment of a termination fee, upon the occurrence of a change of control of the Company, provided that the party desiring to terminate the advisory agreement shall give written notice to the other party on a date (i) no earlier than the date on which: (1) we enter into a change of control agreement; (2) our board of directors recommends that our stockholders accept the offer made in a change of control tender; or (3) a voting control event occurs; and (ii) no later than two days after the closing of a transaction contemplated by a change of control agreement, completion of a change of control tender, or occurrence of a voting control event.
In connection with a termination due to a Company change of control event, our advisor may agree, in its sole discretion, to provide transition services agreed to by the parties for a period of up to 30 days.
Immediately upon the termination of our advisory agreement, our advisor has the right to repurchase any outstanding shares of our advisor’s common stock and any units of our advisor’s operating company held by us at a price equal to the average of the VWAP of our advisor’s common stock for the 10 consecutive trading days immediately preceding the date the repurchase option is exercised.
21
Fees and Expenses.
|
•
|
Base Fee.
The total monthly base fee is in an amount equal to 1/12th of 0.70% of the sum of (i) the total market capitalization of our company for the prior month, and (ii) the Key Money Gross Asset Value (defined in our advisory agreement as, with respect to our key money assets of any date, the undepreciated carrying value of our key money assets and capitalized leases and any furniture, fixture and equipment leased to us pursuant to any key money investment as reflected on our most recent balance sheet filed with the SEC or prepared by our advisor consistent with its performance of its duties under the advisory agreement without giving effect to any impairments plus the contract purchase price of any key money assets acquired after the date of such most recent balance sheet and all capital expenditures made (to the extent not already reflected in the carrying value of the key money assets) with respect to any key money asset since the date of its acquisition for any improvements or for additions thereto, that have a useful life of more than one year and that are required to be capitalized under GAAP), if any, on the last day of the prior month during which our advisory agreement was in effect; provided, however in no event shall the base fee for any month be less than the minimum base fee as provided by our advisory agreement. The base fee is payable on the 5th business day of each month.
|
|
•
|
Incentive Fee.
In each year that (i) our common stock is listed for trading on a national securities exchange for each day of the applicable year; and (ii) our total shareholder return (“TSR”) exceeds the “average TSR of our peer group” we have agreed to pay an incentive fee.
|
For purposes of this calculation, our TSR means the sum, expressed as a percentage, of (i) the change in our common stock price during the applicable period, plus (ii) the dividend yield paid during the applicable period (determined by dividing dividends paid during the applicable period by our common stock price at the beginning of the applicable period and including the value of any dividends or distributions with respect to common stock not paid in cash valued in the reasonable discretion of our advisor.
The annual incentive fee is calculated as (i) 5% of the amount (expressed as a percentage but in no event greater than 25%) by which our annual TSR exceeds the average TSR for our peer group, multiplied by (ii) the fully diluted equity value of our company at December 31 of the applicable year. To determine the fully diluted equity value, we will assume that all units in our operating partnership, including long-term incentive plan (“LTIP”) units that have achieved economic parity with the common units, if any, are redeemed for our common stock and that the per share value of each share of our common stock is equal to the closing price of our stock on the last trading day of the year.
The incentive fee, if any, subject to the FCCR Condition (defined below), is payable in arrears in three equal annual installments with the first installment payable on January 15 following the applicable year for which the incentive fee relates and on January 15 of the next two successive years. Notwithstanding the foregoing, upon any termination of the advisory agreement for any reason, any unpaid incentive fee (including any incentive fee installment for the stub period ending on the termination date) will become fully earned and immediately due and payable without regard to the FCCR Condition defined below. Except in the case when the incentive fee is payable on the date of termination of the advisory agreement, up to 50% of the incentive fee may be paid in our common stock or in common units of our operating partnership, at our discretion, with the balance payable in cash unless at the time for payment of the incentive fee, Ashford LLC owns common stock or common units in an amount greater than or equal to three times the base fee for the preceding four quarters or payment in such securities would cause the advisor to be subject to the provision of the Investment Company Act of 1940, or payment in such securities would not be legally permissible for any reason, in which case the entire incentive fee will be payable in cash.
Upon the determination of the incentive fee, except in the case of any termination of the advisory agreement in which case the incentive fee for the stub period and all unpaid installments of an incentive fee shall be deemed earned and fully due and payable, each one-third installment of the incentive fee shall not be deemed earned by the advisor or otherwise payable by us unless we, as of the December 31 immediately preceding the due date for the payment of the incentive fee installment, have a FCCR of 0.20x or greater (the “FCCR Condition”). For purposes of this calculation, “FCCR” means our fixed charge coverage ratio, which is the ratio of adjusted EBITDA for the previous four consecutive fiscal quarters to fixed charges, which includes all (i) our and our subsidiaries’ interest expense, (ii) our and our subsidiaries’ regularly scheduled principal payments, other than balloon or similar principal payments which repay indebtedness in full and payments under cash flow mortgages applied to principal, and (iii) preferred dividends paid by us.
|
•
|
Equity Compensation.
To incentivize employees, officers, consultants, non-employee directors, affiliates and representatives of Ashford LLC to achieve our goals and business objectives, as established by our board of directors, in addition to the base fee and the incentive fee described above, our board of directors has the authority to make annual equity awards to Ashford LLC or directly to employees, officers, consultants and non-employee directors of Ashford LLC, based on our achievement of certain financial and other hurdles established by our board of directors. These annual equity awards are intended to provide an incentive to Ashford LLC and its employees to promote the success of our business. The compensation committee of our board of directors has full discretion regarding the grant of any annual equity awards to be provided to Ashford LLC and its employees, and other than the overall limitation on the total number
|
22
of shares that are authorized to be granted under the 2013 Equity Incentive Plan and the Advisor Equity Incentive Plan, there are no limitations on the amount of these annual equity awards.
|
•
|
Expense Reimbursement.
Ashford LLC is responsible for all wages, salaries, cash bonus payments and benefits related to its employees providing services to us (including any of our officers who are also officers of Ashford LLC), with the exception of any equity compensation that may be awarded by us to the employees of Ashford LLC who provide services to us, the provision of certain internal audit, asset management and risk management services and the international office expenses described below. We are responsible to pay or reimburse Ashford LLC monthly for all other costs incurred by it on our behalf or in connection with the performance of its services and duties to us, including, without limitation, tax, legal, accounting advisory, investment banking and other third party professional fees, director fees and insurance (including errors and omissions insurance and any other insurance required pursuant to the terms of the advisory agreement), debt service, taxes, insurance, underwriting, brokerage, reporting, registration, listing fees and charges, travel and entertainment expenses, conference sponsorships, transaction diligence and closing costs, dead deal costs, dividends, office space, the cost of all equity awards or compensation plans established by us, including the value of awards made by us to Ashford LLC’s employees, and any other costs which are reasonably necessary for the performance by Ashford LLC of its duties and functions. In addition, we pay a pro rata share of Ashford LLC’s office overhead and administrative expenses incurred in the performance of its duties and functions under the advisory agreement. There is no specific limitation on the amount of such reimbursements.
|
In addition to the expenses described above, we are required to reimburse Ashford LLC monthly for our pro rata share (as reasonably agreed to between Ashford LLC and a majority of our independent directors or our audit committee, chairman of our audit committee or lead director) of (i) employment expenses of Ashford LLC’s internal audit managers, insurance advisory and other Ashford LLC employees who are actively engaged in providing internal audit services to us, (ii) the reasonable travel and other out-of-pocket expenses of Ashford LLC relating to the activities of its internal audit employees and the reasonable third-party expenses which Ashford LLC incurs in connection with its provision of internal audit services to us and (iii) all reasonable international office expenses, overhead, personnel costs, travel and other costs directly related to Ashford LLC’s non-executive personnel who are located internationally or that oversee the operations of international assets or related to our advisor’s personnel that source, investigate or provide diligence services in connection with possible acquisitions or investments internationally. Such expenses shall include but are not limited to salary, wage payroll taxes and the cost of employee benefit plans.
|
•
|
Additional Services.
If, and to the extent that, we request Ashford LLC to render services on our behalf other than those required to be rendered by it under the advisory agreement, such additional services shall be compensated separately at market rates, as defined in the advisory agreement.
|
Assignment.
Ashford LLC may assign its rights under the agreement without our approval to any affiliate under the control of Ashford Inc.
The Ashford Trademark.
Ashford LLC and its affiliates have a proprietary interest in the “Ashford” trademark, and Ashford LLC agreed to license its use to us. If at any time we cease to retain Ashford LLC or one of its affiliates to perform advisory services for us, within 60 days following receipt of written request from Ashford LLC, we must cease to conduct business under or use the “Ashford” name or logo, as well as change our name and the names of any of our subsidiaries to a name that does not contain the name “Ashford.”
Relationship with the Advisor.
Ashford LLC is a subsidiary of Ashford Inc. and advises us and Ashford Trust. As of
December 31, 2017
, we held approximately
9.3%
of the equity of Ashford Inc., Ashford LLC’s parent company, and Ashford Trust held approximately
28.5%
of the equity of Ashford Inc., on a fully diluted basis. Ashford LLC, its equity holders and employees are permitted to have other advisory clients, which may include other REITs operating in the real estate industry. If we materially revise our initial investment guidelines without the express written consent of Ashford LLC, Ashford LLC will use its best judgment to allocate investment opportunities to us and other entities it advises, taking into account such factors as it deems relevant, in its discretion, subject to any then existing obligations of Ashford LLC to such other entities. We have agreed that we will not revise our initial investment guidelines to be directly competitive with the investment guidelines of Ashford Trust as of November 19, 2013. The advisory agreement gives us the right to equitable treatment with respect to other clients of Ashford LLC, but does not give us the right to preferential treatment, except that Ashford LLC and Ashford Trust have agreed that, so long as we have not materially changed our initial investment guidelines without the express consent of Ashford LLC, any individual hotel investment opportunities that satisfy our investment focus will be presented to our board of directors, who will have up to 10 business days to accept such opportunity prior to it being available to Ashford Trust or any other entity advised by Ashford LLC.
To minimize conflict between us and Ashford Trust, the advisory agreement requires us to designate an investment focus by targeted RevPAR, segments, markets and other factors or financial metrics. After consultation with Ashford LLC, we may modify or supplement our investment guidelines from time to time by giving written notice to Ashford LLC; however, if we materially change our investment guidelines without the express consent of Ashford LLC, Ashford LLC will use its best judgment to allocate
23
investment opportunities to us and Ashford Trust, taking into account such factors as it deems relevant, in its discretion, subject to any then existing obligations of Ashford LLC to other entities. In the advisory agreement, we declared our initial investment guidelines to be hotel real estate assets primarily consisting of equity or ownership interests, as well as debt investments when such debt is acquired with the intent of obtaining an equity or ownership interest, in:
|
•
|
full service hotels and resorts with trailing 12 month average RevPAR or anticipated 12 month average RevPAR of at least twice the then-current U.S. national average RevPAR for all hotels as determined with reference to the most current Smith Travel Research reports, generally in the 20 most populous metropolitan statistical areas, as estimated by the United States Census Bureau and delineated by the U.S. Office of Management and Budget;
|
|
•
|
luxury hotels and resorts meeting the RevPAR criteria set forth above and situated in markets that may be generally recognized as resort markets; and
|
|
•
|
international hospitality assets predominantly focused in areas that are general destinations or in close proximity to major transportation hubs or business centers, such that the area serves as a significant entry or departure point to a foreign country or region of a foreign country for business or leisure travelers and meet the RevPAR criteria set forth above (after any applicable currency conversion to U.S. dollars).
|
When determining whether an asset satisfies our investment guidelines, Ashford LLC must make a good faith determination of projected RevPAR, taking into account historical RevPAR as well as such additional considerations as conversions or reposition of assets, capital plans, brand changes and other factors that may reasonably be forecasted to raise RevPAR after stabilization of such initiative.
If we elect to spin-off, carve-out, split-off or otherwise consummate a transfer of a division or subset of assets for the purpose of forming a joint venture, a newly created private platform or a new publicly traded company to hold such division or subset of assets constituting a distinct asset type and/or investment guidelines, we have agreed that any such new entity will be advised by Ashford LLC pursuant to an advisory agreement containing substantially the same material terms set forth in our advisory agreement.
If we desire to engage a third party for services or products (other than services exclusively required to be provided by our property managers), Ashford LLC has the exclusive right to provide such services or products at typical market rates provided that we are able to control the award of the applicable contract. Ashford LLC will have at least 20 days after we give notice of the terms and specifications of the products or services that we intend to solicit to provide such services or products at market rates, as determined by reference to fees charged by third-party providers who are not discounting their fees as a result of fees generated from other sources. If a majority of our independent directors determine that Ashford LLC’s pricing proposal is not at market rates, we are required to engage a consultant to determine the market rate for the services or products in question. We will be required to pay for the services of the consultant and to engage Ashford LLC at the market rates determined by the consultant if the consultant finds that the proposed pricing of Ashford LLC was at or below market rates. Alternatively, Ashford LLC will pay the consultant’s fees and will have the option to provide the services or product at the market rates determined by the consultant should the consultant find that the proposed pricing was above market rates.
To minimize conflicts between us and Ashford LLC on matters arising under the advisory agreement, the Company's Corporate Governance Guidelines provide that any waiver, consent, approval, modification, enforcement matters or elections which the Company may make pursuant to the terms of the advisory agreement shall be within the exclusive discretion and control of a majority of the Independent Directors (or higher vote thresholds specifically set forth in such agreements). In addition, our board of directors has established a Related Party Transaction Committee (Conflicts Committee) comprised solely of independent directors to review all related party transactions that involve conflicts which committee may make recommendations to the independent members of our board (including rejection of any proposed transaction).
\
Hotel Management Agreements
For us to qualify as a REIT, we cannot directly or indirectly operate any of our hotel properties. Third parties must operate our hotel properties. Our hotel properties are leased to TRS lessees (except for the Ritz-Carlton St. Thomas, which is owned by a TRS), which in turn have engaged property managers to manage our hotel properties. Each of our hotel properties other than the Pier House Resort, the Bardessono Hotel and Hotel Yountville are operated pursuant to a hotel management agreement with one of four independent hotel management companies: (1) Hilton Management LLC, (2) Marriott Hotel Services, Inc. or its affiliates, Courtyard Management Corporation, Ritz-Carlton (Virgin Islands), Inc. and Renaissance Hotel Management Company, LLC, (3) Accor and (4) Hyatt Hotels Corporation. Courtyard by Marriott, Ritz-Carlton and Renaissance are registered trademarks of affiliates of Marriott. The Pier House Resort, the Bardessono Hotel and Hotel Yountville are operated by Remington Lodging.
24
The terms of each of the hotel management agreements as well as any remaining extension, are set forth in the table below:
|
Hotel
|
Effective Date
|
Expiration
Date
|
Extension Options By Manager
|
|||
|
Hilton La Jolla Torrey Pines
|
12/17/2003
|
12/31/2023
|
three 10-year options
|
|||
|
The Capital Hilton
|
12/17/2003
|
12/31/2023
|
three 10-year options
|
|||
|
Seattle Marriott Waterfront
|
5/23/2003
|
12/31/2028
|
five 10-year options
|
|||
|
Courtyard San Francisco Downtown
|
6/7/2002
|
12/31/2027
|
five 5-year options
|
|||
|
Courtyard Philadelphia Downtown
|
12/3/2011
|
12/31/2041
|
two 10-year options
|
|||
|
Renaissance Tampa International Plaza
|
4/9/2003, with 8/9/2004 opening date
|
12/28/2029
|
five 10-year options
|
|||
|
Chicago Sofitel Magnificent Mile
|
3/30/2006
|
12/31/2030
|
three 10-year options
|
|||
|
Pier House Resort
|
3/1/2015
|
03/01/2025
|
three 7-year options and one 4-year option
|
|||
|
Bardessono Hotel
|
7/10/2015
|
07/10/2025
|
three 7-year options and one 4-year option
|
|||
|
Ritz-Carlton St. Thomas
|
12/15/2015
|
12/31/2065
|
two 10-year options
|
|||
|
Park Hyatt Beaver Creek
|
3/31/2017
|
12/31/2019
|
two 10-year options
|
|||
|
Hotel Yountville
|
5/11/2017
|
05/11/2027
|
three 7-year options and one 4-year option
|
|||
Each hotel management company receives a base management fee (expressed as a percentage of gross revenues) ranging from 3.0%–7.0%, as well as an incentive management fee calculated as a percentage of hotel operating income, in certain cases after funding of certain requirements, including the capital renewal reserve, and in certain cases after we have received a priority return on our investment in the hotel (referred to as the owner’s priority), as summarized in the chart below:
|
Hotel
|
Management Fee
(1)
|
Incentive Fee
|
Marketing Fee
|
Owner’s Priority
(2)
|
Owner’s
Investment
(2)
|
|||||||
|
Hilton La Jolla Torrey Pines
|
3%
|
20% of operating cash flow (after deduction for capital renewals reserve and owner’s priority)
|
Reimbursement of hotel’s pro rata share of group services
|
11.5% of owner’s total investment
|
|
$117,465,746
|
|
|||||
|
The Capital Hilton
|
3%
|
20% of operating cash flow (after deduction for capital renewals reserve and owner’s priority)
|
Reimbursement of hotel’s pro rata share of group services
|
11.5% of owner’s total investment
|
|
$132,100,000
|
|
|||||
|
Seattle Marriott Waterfront
(3)
|
3%
|
After payment of owner’s 1st priority, remaining operating profit is split between owner and manager, such that manager receives 30% of remaining operating profit that is less than the sum of $15,133,000 plus 10.75% of owner- funded capital expenses, and 50% of the operating profit in excess of such sum.
|
Reimbursement of the hotel’s pro rata share of chain services, capped at 2.2% of gross revenues per fiscal year
|
Owner’s 1st Priority: 10.75% of owner’s investment
Owner’s 2nd Priority: After payment of the owner’ 1st priority, remaining operating profit is split between owner and manager, such that owner receives 70% of remaining operating profit that is less than the sum of $15,133,000 plus 10.75% of owner- funded capital expenses, and 50% of the operating profit in excess of such sum.
|
|
$89,232,634
|
|
|||||
|
Courtyard San Francisco Downtown
|
7%
|
50% of the excess of operating profit (after deduction for contributions to the FF&E reserve) over owner’s priority
|
System wide contribution to the marketing fund (2% of guest room revenues on the effective date).
|
$9,500,000 plus 11.5% of owner funded capital expenses
|
Not applicable
|
|
||||||
|
Courtyard Philadelphia Downtown
|
6.5%
|
20% of the excess of operating profit (after deduction for contributions to the FF&E reserve) over owner’s priority
|
System wide contribution to the marketing fund (2% of guest room revenues on the effective date).
|
2011-$5 million
2012-$5.5 million 2013-$6 million
2014-$6.5 million Thereafter-$7 million Plus 10.25% of owner funded capital expenses after the beginning of 2016.
|
Not applicable
|
|
||||||
25
|
Hotel
|
Management Fee
(1)
|
Incentive Fee
|
Marketing Fee
|
Owner’s Priority
(2)
|
Owner’s
Investment
(2)
|
|||||||
|
Renaissance Tampa International Plaza
|
3.5%
|
First Incentive Fee: 100% of operating profit (after deduction for contributions to the FF&E reserve) after Owner’s First Priority until an aggregate amount of $2 million is paid to manager. Second Incentive Fee: After payment of owner’s 1st priority and manager’s first incentive fee, remaining operating profit is split between owner and manager, such that manager receives 30% of remaining operating profit that is less than the sum of 6,675,000 plus 15% of owner-funded capital expenses, and 40% of the operating profit in excess of such sum.
|
Reimbursement of the hotel’s pro rata share of chain services, capped at 2.8% of gross revenues per fiscal year
|
Owner’s 1st Priority: 11.25% of owner’s investment
Owner’s 2nd Priority: After payment of the owner’s 1st priority and manager’s fee, remaining operating profit is split between owner and manager, such that owner receives 70% of remaining operating profit that is less than the sum of $6,675,000 plus 15% of owner- funded capital expenses, and 60% of the operating profit in excess of such sum.
|
|
$44,610,212
|
|
|||||
|
Chicago Sofitel Magnificent Mile
|
3%
|
20% of the amount by which the hotel’s annual net operating income exceeds a threshold amount (equal to 8% of our total investment in the hotel), capped at 2.5% of gross hotel revenues.
|
2% of gross hotel revenues
|
Not applicable
|
Not applicable
|
|
||||||
|
Pier House Resort
|
Greater of $13,504.42 monthly or 3%
|
The lesser of 1% of gross revenues or the amount by which actual house profit exceeds budgeted house profit.
|
Not applicable
|
Not applicable
|
Not applicable
|
|
||||||
|
Bardessono Hotel
|
Greater of $13,504.42 monthly or 3%
|
The lesser of 1% of gross revenues or the amount by which actual house profit exceeds budgeted house profit.
|
Not applicable
|
Not applicable
|
Not applicable
|
|
||||||
|
Ritz-Carlton St. Thomas
|
3.0%, comprised of a management fee of 0.4% and a royalty fee of 2.6%
|
20% of the excess, if any, of Operating Profit for such Fiscal Year over Owner’s Priority for such Fiscal Year.
|
1.0% of gross revenues
|
$5,440,000 plus 10.25% of the amount of Owner-Funded Capital Expenditures.
|
Not applicable
|
|
||||||
|
Park Hyatt Beaver Creek
|
Greater of 3.0% and $1,594,341 (increased by lesser of CPI and 8%)
|
12.5% Profit plus 15% of Profit less the Base Fee that is in excess of $4 million
|
Not applicable
|
Not applicable
|
Not applicable
|
|
||||||
|
Hotel Yountville
|
Greater of $13,504.42 monthly or 3%
|
The lesser of 1% of gross revenues or the amount by which actual house profit exceeds budgeted house profit.
|
Not applicable
|
Not applicable
|
Not applicable
|
|
||||||
__________________
|
(1)
|
Management fee is expressed as a percentage of gross hotel revenue.
|
|
(2)
|
Owner’s priority and owner’s investment amounts disclosed in the table are based on the most recent certification provided to us by the applicable manager. These amounts will continue to increase over time by the amount of additional owner-funded capital expenses.
|
|
(3)
|
The Management fee at this hotel is subject to reduction in the event specific Marriott branded hotels open.
|
The hotel management agreements allow each hotel to operate under the Courtyard, Marriott, Renaissance, Hilton or Sofitel brand names, as applicable, and provide benefits typically associated with franchise agreements, including, among others, the use of the Marriott, Hilton or Sofitel, as applicable, reservation system and guest loyalty and reward program. Any intellectual property and trademarks of Marriott, Hilton or Accor, as applicable, are exclusively owned and controlled by the applicable manager or an affiliate of such manager who grants the manager rights to use such intellectual property or trademarks with respect to the applicable hotel.
26
Below is a summary of the principal terms of the hotel management agreements with Marriott, Hilton and Accor.
Marriott Management Agreements
Term.
The remaining base term of each of our five Marriott management agreements ranges from approximately 9 to 47 years, expiring between December 31, 2027 and December 31, 2065. Each of these agreements has remaining automatic extension options at the discretion of the manager, ranging from two 10-year extension to five 10-year extensions.
Events of Default.
An “Event of Default” under the Marriott hotel management agreements is generally defined to include the bankruptcy or insolvency of either party, the failure to make a payment under the hotel management agreement and failure to cure such non-payment after due notice, and a breach by either party of any other covenants or obligations in the hotel management agreement which continues beyond the applicable notice and cure period.
Termination Upon Event of Default.
A non-defaulting party may terminate the hotel management agreement upon an Event of Default (as defined in the applicable hotel management agreement) generally after the expiration of any notice and cure periods; provided, however, the hotel management agreement may not be terminated by the non-defaulting party unless and until such Event of Default has a material adverse effect on the non-defaulting party. In the case of the Courtyard Philadelphia Downtown, if the defaulting party contests such Event of Default or such material adverse effect, we may not terminate unless a court of competent jurisdiction has issued a final, binding and non-appealable order finding that the Event of Default has occurred and that the default resulted in a material adverse effect.
Early Termination for Casualty
. The termination provisions for our hotel properties in the event of casualty are summarized as follows:
|
•
|
Courtyard Philadelphia Downtown: If damage or destruction to the hotel from any cause materially and adversely affects the operation of the hotel and we fail to promptly commence and complete the repair, rebuilding or replacement of the same to bring it back to substantially its prior condition, manager may, at its option, terminate the management agreement by written notice.
|
|
•
|
Courtyard San Francisco Downtown; Seattle Marriott Waterfront; Renaissance Tampa International Plaza and Ritz-Carlton St. Thomas: If the hotel suffers a total casualty (meaning the cost of the damage to be repaired or replaced would be equal to 30% (60% for Ritz-Carlton St. Thomas) or more of the then total replacement cost of the hotel), then either party may terminate the hotel management agreement.
|
Early Termination for Condemnation.
If all or substantially all of the hotel is taken in any condemnation or similar proceeding, or a portion of the hotel is so taken, and the result is that it is unreasonable to continue to operate the hotel in accordance with the hotel management agreement, the hotel management agreement shall terminate.
Performance Termination.
All of the Marriott hotel management agreements are structured to provide us with a right to terminate the hotel management agreement without the payment of a termination fee if the manager fails to achieve certain criteria relating to the performance of the hotel managed by Marriott. The performance period is measured with respect to any two consecutive fiscal years, except that for the Courtyard Philadelphia Downtown, the performance period will not include any fiscal year prior to 2015. The performance criteria generally includes each of the following: (i) operating profit for each such fiscal year is less than the applicable performance termination threshold (as defined in the hotel management agreement) which ranges from 9.5% to 10.25% of the approximate total investment in the hotel, and in the case of the Courtyard Philadelphia Downtown is 85% of the owner’s priority return (as defined in the hotel management agreement), (ii) the RevPAR penetration index of the hotel during each such fiscal year is less than the revenue index threshold (as such terms are defined in the hotel management agreements) which range from 0.85 to 1.00, and (iii) the fact that the criteria set forth in (i) or (ii) is not the result of an extraordinary event or force majeure, any major renovation of the hotel adversely affecting a material portion of the income generating areas (or any major renovation with respect to the Courtyard Philadelphia Downtown), or any default by us under the hotel management agreement. The manager has a right to avoid a performance termination by paying to us the total amount by which the operating profit for each of the fiscal years in question was less than the performance termination threshold for such fiscal years, or in the case of Courtyard Philadelphia Downtown, by waiving base management fees until such time as the total amount of waived base management fees equals the shortfall of operating profit for each of the fiscal years in question to the performance termination threshold for such fiscal years.
Limitation on Termination Rights.
Our ability to exercise termination rights is subject to certain limitations if the manager or any of its affiliates are providing certain credit enhancements, loans or fundings as described in the hotel management agreement, or in certain cases, if manager’s incentive management fee is outstanding.
Assignment and Sale.
Each Marriott management agreement provides that we cannot sell the applicable hotel property to any unrelated third party or engage in certain change of control actions if (i) we are in default under the hotel management
27
agreement, (ii) such party is known to be of bad moral character or has been convicted of a felony or is in control of or controlled by persons who have been convicted of felonies, (iii) such party does not (in the reasonable judgment of manager) have sufficient financial resources and liquidity to fulfill our obligations under the hotel management agreement, (iv) such party has an ownership interest, either directly or indirectly, in a brand or group of hotels totaling at least 10 hotels and such brand or group competes with the manager or Marriott or any affiliate thereof, or (v) with respect to the Courtyard Philadelphia Downtown, such party is a “specially designated national or blocked person” as designated by the applicable governmental entity. Any sale of the property (which includes any equity transfer, whether directly or indirectly) is subject to certain conditions, including the provision of notice of such sale to the manager.
Right of First Offer.
All of the Marriott management agreements provide Marriott with a right of first negotiation with respect to a sale of the hotel (which includes the equity transfer of a controlling interest in the owner of the hotel property, whether directly or indirectly). A sale or transfer to an affiliate is specifically excluded from this right. After notice of a proposed sale to the manager, we have a specified time period, ranging from 20 to 45 days, to negotiate an acceptable purchase and sale agreement. If after such time period no agreement is signed, we are free to sell or lease the hotel to a third party, subject to certain conditions, such as providing notice of sale to the manager (with certain details regarding the terms of sale). The manager then has a specified time period, ranging from 20 to 45 days, depending on our compliance with the assignment and sale provisions above, to either consent to such sale or not consent to such sale. If the manager does not timely respond or does not consent to such sale, certain of the management agreements provide that the sale must occur 180 days after provision of the notice of sale or the notice of sale is deemed void and we must provide a new notice to the manager.
Hilton Management Agreements
Term
. The base term of each of our two Hilton management agreements was 10 years, expiring December 31, 2013. Each of these agreements has been extended through December 31, 2023 and has three 10-year automatic extension options remaining, at the discretion of the manager.
Events of Default.
An “Event of Default” under the Hilton hotel management agreements is generally defined to include the bankruptcy or insolvency of either party, the failure to make a payment under the hotel management agreement and failure to cure such non-payment after due notice, a breach by either party of any other covenants or obligations in the hotel management agreement which continues beyond the applicable notice and grace period, failure to maintain certain alcohol licenses and permits under certain circumstances, failure by us to provide manager with sufficient working capital to operate the hotel after due notice and a termination of our operating lease due to our default under the operating lease.
Termination Upon Event of Default.
If an event of default occurs and continues beyond any applicable notice and cure periods set forth in the hotel management agreement, the non-defaulting party generally has, among other remedies, the option of terminating the applicable hotel management agreement upon written notice to the defaulting party.
Performance Termination.
Each of the Hilton management agreements provide us with a right to terminate the hotel management agreement without the payment of a termination fee if the manager fails to achieve certain criteria relating to the performance of the hotel managed by Hilton. The performance period is measured with respect to any two consecutive fiscal years. The performance criteria are: (i) the hotel’s operating cash flow (before deducting our priority return) does not equal or exceed 85% of the our priority return (as defined in the hotel management agreement); and (ii) the hotel’s yield index is below the base yield index (as such terms are defined in the hotel management agreement), which is 90%. The manager has a right to avoid a performance termination by paying to us an amount within 30 days of due notice equal to the deficiency set forth in (i) above to cure such performance default, but in no event may the manager exercise such cure with respect to more than four full operating years during the initial term or with respect to more than four full operating years during any single extension term. The amount of any shortfall payable by manager to us shall be reduced to the extent of any portion attributable to a force majeure event, performance of certain capital renewals and major capital improvements adversely affecting a material portion of the income generating areas of the hotel, or certain uncontrollable expenses that could not have been reasonably anticipated by the manager.
Early Termination for Casualty.
In the event the applicable hotel is substantially damaged by fire or other casualty such that it cannot be restored within 240 days, or in the event our lender doesn’t provide adequate insurance proceeds to restore the hotel, we may terminate the hotel management agreement. If we undertake to restore the hotel or if we are required to restore the hotel because it was not substantially damaged and fail to commence such repairs within 60 days of receiving sufficient insurance proceeds to complete such work, or fail to complete such repairs within 240 days of the casualty, the manager may terminate the agreement. We have no obligation to restore the premises, however, if the casualty occurs in the last five years of the third renewal term or thereafter.
Early Termination for Condemnation.
If all or substantially all of the applicable hotel is taken in any condemnation or similar proceeding which, in our reasonable opinion, makes it infeasible to restore or continue to operate the hotel in accordance with the hotel management agreement, the hotel management agreement shall terminate. If it is reasonably feasible to restore the premises
28
and operate the hotel and we fail to complete the restoration within two years of the taking, the manager may terminate the agreement. We have no obligation to restore the premises, however, if the taking occurs in the last five years of the third renewal term or thereafter.
Assignment and Sale.
Each Hilton management agreement provides that we cannot sell the applicable hotel to any unrelated third party, which includes the transfer of an equity interest, or engage in certain change of control actions (i) if such party has an ownership interest, either directly or indirectly, in a brand of hotels totaling at least 10 hotels and such brand competes with the manager or Hilton or any affiliate thereof; (ii) if such party is known to be of ill repute or an unsuitable business associate (per gaming industry regulations where the manager holds a gaming license); (iii) if such party does not have the ability to fulfill our financial obligations under the hotel management agreement; or (iv) if certain conditions are not satisfied, including cure of any existing or potential defaults, receipt of evidence of proper insurance coverage, payment of fees and expenses which will accrue to the manager through the date of closing, and provision of sufficient notice of the contemplated sale to the manager.
Right of First Offer.
Each of the Hilton management agreements provides the manager with a right of first negotiation with respect to a sale of the hotel (which includes any equity transfer, whether directly or indirectly) or lease of the hotel (if applicable). After notice of a proposed sale or lease to the manager, the manager has 30 days to elect or decline to exercise its right to purchase or lease. If the manager makes an election to purchase or lease, the parties have 30 days to execute an agreement for purchase (or lease, if applicable) and an additional 30 days to consummate the purchase or lease (if applicable). If the manager declines to exercise its right to purchase or lease, the sale or lease must occur within 180 days at greater than 90% of the price or the notice of sale must be renewed to manager.
Accor Management Agreement
In connection with our acquisition of the Chicago Sofitel Magnificent Mile, our TRS lessee, as lessee of the hotel, assumed a management agreement with Accor that allows us to operate under the Sofitel brand name and utilize Accor’s services and experience in connection with the management and operation of the Chicago Sofitel Magnificent Mile. The material terms of the agreement are summarized as follows:
Term.
The initial term of the management agreement expires on December 31, 2030 and automatically renews for three consecutive 10-year renewal terms, unless the manager terminates the agreement by written notice at least 180 days prior to the expiration of the then-current term.
Events of Default.
An “Event of Default” is generally defined to include the failure to make a payment under the management agreement and failure to cure such non-payment after the applicable notice and cure period, the bankruptcy or insolvency of either party, a failure by either party to maintain at all times all of the insurance required to be maintained by such party and failure to cure such default after the applicable notice and cure period, the failure by either party to perform any of the material covenants in the hotel management agreement which continues beyond the applicable notice and cure period and a transfer of the agreement by either party in violation of the provisions of the agreement. The occurrence of an Event of Default prevents the defaulting party from transferring the agreement without the consent of the non-defaulting party.
Termination.
A non-defaulting party may terminate the hotel management agreement if the defaulting party (i) has breached any material representation or fails to perform any material provision of the agreement or (ii) becomes insolvent or bankrupt, in each case after the expiration of any applicable notice and cure period. In addition, the manager may terminate the agreement if we default under a mortgage relating to the hotel and fail to cure such default within the times provided.
Performance Termination.
We have the right to terminate the hotel management agreement without the payment of a termination fee if the manager fails to achieve certain criteria relating to the performance of the hotel managed by Accor. The performance period is measured with respect to any two consecutive operating years. The performance criteria are: (i) the RevPAR for the hotel is less than 90% of the RevPAR for the hotel’s competitive set for each such operating year and (ii) the adjusted net operating income less the hurdle amount of $9.0 million plus 8% of any amounts we spent on capital expenditures is a negative number (i.e. less than zero) for each such operating year, provided that for any operating year in which the operation of the hotel is materially and adversely affected by a force majeure event, a refurbishing program or major capital improvements, the RevPAR for the hotel and the adjusted net operating income for such operating years shall be adjusted equitably. The manager will have a right up to three times in any eight-year period to avoid a performance termination by paying to us a cure amount that equals, for any operating year, the lower of (i) the amount by which the adjusted net operating income is less than zero and (ii) the amount that we would have been entitled to receive as a distribution from the hotel had the hotel not had a RevPAR shortfall.
Early Termination for Condemnation.
If all of the hotel, or a portion of the hotel that in our reasonable opinion makes it imprudent or unsuitable to use and operate the remaining portion of the hotel in accordance with the standards maintained by the Sofitel brand, is taken in any condemnation or similar proceeding, we may terminate the agreement.
29
Early Termination for Casualty
. If a material part of the hotel is damaged or destroyed by fire or other casualty, then we may terminate the agreement and elect not to restore the hotel. If we elect to restore the hotel, we must commence such process within 120 days after the date of the casualty and diligently proceed with the restoration of the hotel so that it meets the standards maintained by the Sofitel brand. If we fail to complete the restoration within two years after the date of the casualty, then for so long as such failure continues, the manager may terminate the management agreement. If we or the manager terminate the management agreement because of a casualty, if we have not restored the hotel and desire to lease or sell it, we must first offer to sell the hotel to the manager. If we repair, rebuild or replace the premises within five years, the manager may reinstate the agreement.
Assignment and Sale.
So long as we are not in default under the management agreement and any advances made by the manager on our behalf would be repaid in connection with the sale, we may sell the Chicago Sofitel Magnificent Mile and assign the management agreement (including as a result of a change of control) without the consent of the manager to any of our affiliates or to any person that (i) is not a competitor of the manager (as defined in the management agreement), (ii) is not generally recognized in the community as being a person of ill repute or with whom a prudent business person would not wish to associate in a commercial venture and (iii) has a minimum net worth required by the management agreement, if the assignee expressly assumes the management agreement.
Hyatt Beaver Creek Management Agreement
Term
. The base term of our Hyatt Beaver Creek management agreement is 30 years, expiring December 31, 2019 and has two 10-year extension options remaining, at the discretion of the manager.
Events of Default.
An “Event of Default” under the Hyatt Beaver Creek hotel management agreement is generally defined to include the failure to make a payment under the hotel management agreement and failure to cure such non-payment after due notice and a breach by either party of any other covenants or obligations in the hotel management agreement which continues beyond the applicable notice and grace period.
Termination Upon Event of Default.
If an event of default occurs and continues beyond any applicable notice and cure periods set forth in the hotel management agreement, the non-defaulting party generally has, among other remedies, the option of terminating the applicable hotel management agreement upon fifteen days’ written notice to the defaulting party.
Early Termination for Casualty.
In the event the applicable hotel is substantially damaged by fire or other casualty, and if, in connection with any casualty, the cost of restoring the hotel equals or exceeds 25% of the replacement cost of the hotel in the case that the casualty is covered by insurance, or 10% of the replacement cost of the hotel in the case that the casualty is not covered by insurance, then we may elect, by providing notice to Hyatt within 90 days of the occurrence of the casualty to not restore the hotel and to terminate the agreement.
Early Termination for Eminent Domain.
If all or substantially all of the hotel is taken in any eminent domain procedure so as to render the hotel untenantable, we have the right to terminate the agreement upon 90 days’ prior written notice to Hyatt.
Assignment and Sale.
The agreement provides that we cannot sell or assign our interest in the hotel without the prior approval of Hyatt, which shall not be unreasonably withheld. Hyatt’s approval of a sale or assignment is based on the following factors: (i) the ability of the prospective assignee to fulfill the financial obligations of the owner of the hotel; (ii) the integrity and business reputation of the prospective assignee; and (iii) any potential conflicts of interest which may arise in connection with the assignment. Pursuant to the agreement, an assignment is deemed to have occurred if more than 40% of the beneficial ownership of the owner of the hotel is transferred.
Remington Master Management Agreement
As described below under “Mutual Exclusivity Agreement,” we entered into a mutual exclusivity agreement with Remington Lodging upon completion of the spin-off. Remington Lodging manages the Pier House Resort, the Bardessono Hotel and Hotel Yountville. Remington Lodging is owned 100% by Mr. Monty J. Bennett, chairman of our board of directors and the chief executive officer and chairman of the board of directors of Ashford Trust, and his father, Mr. Archie Bennett, Jr. Pursuant to this agreement, we have agreed to engage Remington Lodging for the property management, project management, development and certain other work for all hotels we acquire, unless our independent directors either (i) unanimously vote not to engage Remington Lodging, or (ii) based on special circumstances or past performance, by a majority vote elect not to engage Remington Lodging because, in their reasonable business judgment, they have determined that it would be in our best interest not to engage Remington Lodging or that another manager or developer could perform the duties materially better. We believe Remington Lodging to be one of the premier third-party property managers in the country, and our mutual exclusivity agreement with Remington Lodging offers us a unique competitive advantage over other lodging REITs.
30
The following summarizes the terms of the master management agreement that we have agreed will control to the extent that Remington Lodging manages future properties that we acquire and that will control with respect to the project management of each of our properties, unless otherwise provided for in a hotel’s management agreement, including our eight initial properties contributed to us in connection with the spin-off. This summary is qualified in its entirety by reference to the master management agreement filed as an exhibit to this Annual Report on Form 10-K.
Term.
The master management agreement provides for an initial term of 10 years as to each hotel governed by the agreement. The term may be renewed by Remington Lodging, at its option, subject to certain performance tests, for three successive periods of seven years each and, thereafter, a final term of four years, provided that at the time the option to renew is exercised, Remington Lodging is not then in default under the master management agreement. If at the time of the exercise of any renewal period, Remington Lodging is in default, then the exercise of the renewal option will be conditional on timely cure of such default, and if such default is not timely cured, then our TRS lessee may terminate the management agreement regardless of the exercise of such option and without the payment of any fee or liquidated damages. If Remington Lodging desires to exercise any option to renew, it must give our TRS lessee written notice of its election to renew the master management agreement no less than 90 days before the expiration of the then current term of the master management agreement.
Amounts Payable under the Remington Master Management Agreement.
Remington Lodging receives a base management fee, and if the hotels meet and exceed certain thresholds, an additional incentive fee. The base management fee for each hotel will be due monthly and will be equal to the greater of:
|
•
|
$13,504.42 (increased annually based on consumer price index adjustments); or
|
|
•
|
3% of the gross revenues associated with that hotel for the related month.
|
The incentive management fee, if any, for each hotel will be due annually in arrears within 90 days of the end of the fiscal year and will be equal to the lesser of (i) 1% of gross revenues and (ii) the amount by which the actual house profit (gross operating profit of the applicable hotel before deducting management fees or franchise fees) exceeds the target house profit as set forth in the annual operating budget approved for the applicable fiscal year. If, however, based on actual operations and revised forecasts from time to time, it is reasonably anticipated that the incentive fee is reasonably expected to be earned, the applicable TRS lessee will consider payment of the incentive fee pro rata on a quarterly basis.
The incentive fee is designed to encourage Remington Lodging to generate higher house profit at each hotel by increasing the fee due to Remington Lodging when the hotels generate house profit above certain threshold levels. Any increased revenues will generate increased lease payments under the percentage leases and should thereby benefit our stockholders.
Termination.
The master management agreement may be terminated as to one or more of the hotels earlier than the stated term if certain events occur, including:
|
•
|
a sale of a hotel;
|
|
•
|
the failure of Remington Lodging to satisfy certain performance standards;
|
|
•
|
for the convenience of our TRS lessee;
|
|
•
|
in the event of a casualty to, condemnation of, or force majeure involving a hotel; or
|
|
•
|
upon a default by Remington Lodging or us that is not cured prior to the expiration of any applicable cure periods.
|
In certain cases of early termination of the master management agreement with respect to one or more of the hotels, we must pay Remington Lodging termination fees, plus any amounts otherwise due to Remington Lodging pursuant to the terms of the master management agreement. We will be obligated to pay termination fees in the circumstances described below, provided that Remington Lodging is not then in default, subject to certain cure and grace periods:
|
•
|
Sale.
If any hotel subject to the Remington master management agreement is sold during the first 12 months of the date such hotel becomes subject to the master management agreement, our TRS lessee may terminate the master management agreement with respect to such sold hotel, provided that it pays to Remington Lodging an amount equal to the management fee (both base fees and incentive fees) estimated to be payable to Remington Lodging with respect to the applicable hotel pursuant to the then current annual operating budget for the balance of the first year of the term. If any hotel subject to the Remington master management agreement is sold at any time after the first year of the term and the TRS lessee terminates the master management agreement with respect to such hotel, our TRS lessee will have no obligation to pay any termination fees.
|
31
|
•
|
Casualty.
If any hotel subject to the Remington master management agreement is the subject of a casualty during the first year of the initial 10-year term and the TRS lessee elects not to rebuild, then we must pay to Remington Lodging the termination fee, if any, that would be owed if the hotel had been sold. However, after the first year of the initial 10-year term, if a hotel is the subject of a casualty and the TRS lessee elects not to rebuild the hotel even though sufficient casualty insurance proceeds are available to do so, then the TRS lessee must pay to Remington Lodging a termination fee equal to the product obtained by multiplying (i) 65% of the aggregate management fees (both base fees and incentive fees) estimated to be paid to Remington Lodging with respect to the applicable hotel pursuant to the then current annual operating budget (but in no event less than the management fees for the preceding full fiscal year) by (ii) nine.
|
|
•
|
Condemnation or Force Majeure.
In the event of a condemnation of, or the occurrence of any force majeure event with respect to, any of the hotels, the TRS lessee has no obligation to pay any termination fees if the master management agreement terminates as to those hotels.
|
|
•
|
Failure to Satisfy Performance Test.
If any hotel subject to the Remington master management agreement fails to satisfy a certain performance test, the TRS lessee may terminate the master management agreement with respect to such hotel, and in such case, the TRS lessee must pay to Remington Lodging an amount equal to 60% of the product obtained by multiplying (i) 65% of the aggregate management fees (both base fees and incentive fees) estimated to be paid to Remington Lodging with respect to the applicable hotel pursuant to the then current annual operating budget (but in no event less than the management fees for the preceding full fiscal year) by (ii) nine. Remington Lodging will have failed the performance test with respect to a particular hotel if during any fiscal year during the term (i) such hotel’s gross operating profit margin for such fiscal year is less than 75% of the average gross operating profit margins of comparable hotels in similar markets and geographical locations, as reasonably determined by Remington Lodging and the TRS lessee, and (ii) such hotel’s RevPAR yield penetration is less than 80%. Upon a performance test failure, the TRS lessee must give Remington Lodging two years to cure. If, after the first year, the performance test failure has not been cured, then the TRS lessee may, in order not to waive any such failure, require Remington Lodging to engage a consultant with significant hotel lodging experience reasonably acceptable to both Remington Lodging and the TRS lessee, to make a determination as to whether or not another management company could manage the hotel in a materially more efficient manner. If the consultant’s determination is in the affirmative, then Remington Lodging must engage such consultant to assist with the cure of such performance failure for the second year of the cure period after that failure. If the consultant’s determination is in the negative, then Remington Lodging will be deemed not to be in default under the performance test. The cost of such consultant will be shared by the TRS lessee and Remington Lodging equally. If Remington Lodging fails the performance test for the second year of the cure period and, after that failure, the consultant again makes a finding that another management company could manage the hotel in a materially more efficient manner than Remington Lodging, then the TRS lessee has the right to terminate the management agreement with respect to such hotel upon 45 days’ written notice to Remington Lodging and to pay to Remington Lodging the termination fee described above. Further, if any hotel subject to the Remington management agreement is within a cure period due to a failure of the performance test, an exercise of a renewal option shall be conditioned upon timely cure of the performance test failure, and if the performance failure is not timely cured, the TRS lessee may elect to terminate the management agreement without paying any termination fee.
|
|
•
|
For Convenience.
With respect to any hotel managed by Remington Lodging pursuant to the Remington master management agreement, if the TRS lessee elects for convenience to terminate the management of such hotel, at any time, including during any renewal term, the TRS lessee must pay a termination fee to Remington Lodging, equal to the product of (i) 65% of the aggregate management fees for such hotel (both base fees and incentive fees) estimated to be payable to Remington Lodging with respect to the applicable hotel pursuant to the then current annual operating budget (but in no event less than the management fees for the preceding full fiscal year) and (ii) nine. With respect to any non-managed hotel for which services are provided pursuant to the Remington master management agreement, if the TRS lessee elects for convenience to terminate the master management agreement with respect to such non-managed hotel, at any time, including during any renewal term, the TRS lessee must pay a termination fee to Remington Lodging, equal to the product of (i) 65% of the aggregate project management fees and market service fees estimated for the non-managed hotel for the then current fiscal year in which such termination is to occur (but in no event less than the project management fees and market service fees for the preceding full fiscal year) by (ii) nine.
|
If the master management agreement terminates as to all of the hotels covered in connection with a default under the master management agreement, the mutual exclusivity agreement can also be terminated at the non-defaulting party’s election. See “Mutual Exclusivity Agreement.”
Maintenance and Modifications.
Remington Lodging must maintain each hotel in good repair and condition and make such routine maintenance, repairs and minor alterations as it deems reasonably necessary. The cost of all such maintenance, repairs and alterations will be paid by the TRS lessee.
32
Insurance.
Remington Lodging must coordinate with the TRS lessee the procurement and maintenance of all workers’ compensation, employer’s liability, and other appropriate and customary insurance related to its operations as a property manager, the cost of which is the responsibility of the TRS lessee.
Assignment and Subleasing.
Neither Remington Lodging nor the TRS lessee may assign or transfer the master management agreement without the other party’s prior written consent. However, Remington Lodging may assign its rights and obligations to an affiliate that satisfies the eligible independent contractor requirements and is “controlled” by Mr. Monty J. Bennett, his father Mr. Archie Bennett, Jr., or their respective family partnerships or trusts, the sole members or beneficiaries of which are at all times lineal descendants of Messrs. Monty or Archie Bennett, Jr. (including step children) and spouses. “Controlled” means (i) the possession of a majority of the capital stock (or ownership interest) and voting power of such affiliate, directly or indirectly, or (ii) the power to direct or cause the direction of the management and policies of such affiliate in the capacity of chief executive officer, president, chairman, or other similar capacity where they are actively engaged or involved in providing such direction or control and spend a substantial amount of time managing such affiliate. No assignment will release Remington Lodging from any of its obligations under the master management agreement.
Damage to Hotels.
If any of our insured properties is destroyed or damaged, the TRS lessee is obligated, subject to the requirements of the underlying lease, to repair or replace the damaged or destroyed portion of the hotel to the same condition as existed prior to such damage or destruction. If the lease relating to such damaged hotel is terminated pursuant to the terms of the lease, the TRS lessee has the right to terminate the master management agreement with respect to such damaged hotel upon 60 days’ written notice. In the event of a termination, neither the TRS lessee nor Remington Lodging will have any further liabilities or obligations under the master management agreement with respect to such damaged hotel, except that we may be obligated to pay to Remington Lodging a termination fee, as described above. If the management agreement remains in effect with respect to such damaged hotel, and the damage does not result in a reduction of gross revenues at the hotel, the TRS lessee’s obligation to pay management fees will be unabated. If, however, the master management agreement remains in effect with respect to such damaged hotel, but the damage does result in a reduction of gross revenues at the hotel, the TRS lessee will be entitled to partial, pro rata abatement of the management fees while the hotel is being repaired.
Condemnation of a Property or Force Majeure.
If all or substantially all of a hotel is subject to a total condemnation or a partial taking that prevents use of the property as a hotel, the Remington master management agreement, with respect to such hotel, will terminate, subject to the requirements of the applicable lease. In the event of termination, neither the TRS lessee nor Remington Lodging will have any further rights, remedies, liabilities or obligations under the Remington master management agreement with respect to such hotel. If any partial taking of a property does not make it unreasonable to continue to operate the hotel, there is no right to terminate the master management agreement. If there is an event of force majeure or any other cause beyond the control of Remington Lodging that directly involves a hotel and has a significant adverse effect upon the continued operations of that hotel, then the Remington management agreement may be terminated by the TRS lessee. In the event of such a termination, neither the TRS lessee nor Remington Lodging will have any further rights, remedies, liabilities or obligations under the Remington master management agreement with respect to such hotel.
Annual Operating Budget.
The master management agreement provides that not less than 45 days prior to the beginning of each fiscal year during the term of the master management agreement, Remington Lodging will submit to the TRS lessee for each of the hotels, an annual operating budget setting forth in detail an estimated profit and loss statement for each of the next 12 months (or for the balance of the fiscal year in the event of a partial first fiscal year), including a schedule of hotel room rentals and other rentals and a marketing and business plan for each of the hotels. The budget is subject to the TRS lessee approval, which may not be unreasonably withheld. The budget may be revised from time to time, taking into account such circumstances as the TRS lessee deems appropriate or as business and operating conditions shall demand, subject to the reasonable approval of Remington Lodging.
Capital Improvement Budget.
Remington Lodging must prepare a capital improvement budget of the expenditures necessary for replacement of furniture, fixtures and equipment and building repairs for the hotels during the following fiscal year and provide such budget to the relevant TRS lessee and landlord for approval at the same time Remington Lodging submits the proposed annual operating budget for approval by TRS lessee. Remington Lodging will, in accordance with the capital improvement budget, make such substitutions and replacements of or renewals to furniture, fixtures and equipment and non-routine repairs and maintenance as it deems necessary to maintain our hotels. Remington Lodging may not make any other expenditures for these items without the relevant TRS lessee and landlord approval, except expenditures which are provided in the capital improvements budget or are required by reason of any (i) emergency, (ii) applicable legal requirements, (iii) the terms of any franchise agreement or (iv) are otherwise required for the continued safe and orderly operation of our hotels. The cost of all such changes, repairs, alterations, improvements, renewals, or replacements will be paid from the capital improvement reserve or other monies advanced by the TRS lessee.
33
Service and Project Management Fees.
The master management agreement provides that each TRS lessee will pay Remington Lodging a project management fee equal to 4% of the total project costs associated with the implementation of the approved capital improvement budget for a hotel until such time that the capital improvement budget and/or renovation project costs involve expenditures in excess of 5% of gross revenues of such hotel, whereupon the project management fee will be 3% of total project costs in excess of the 5% of gross revenue threshold. In addition, each TRS lessee will pay Remington Lodging additional fees at then-current market rates for other services beyond managing the hotels or implementing the capital improvement budget. These other services include: (i) construction management, (ii) interior design assistance involved in implementing the capital improvement budget, (iii) managing architects for the implementation of the capital improvement budget, overseeing all conceptual designs and reviewing plans, drawings, shop drawings and other matters necessary for the proper implementation of the capital improvement budget, (iv) purchasing of furniture, fixtures, and equipment, (v) managing freight selection and shipping processes of furniture, fixtures, and equipment, (vi) the warehousing of goods delivered at the job site, inspection of materials delivered, and the filing of claims associated with the delivery of defective or damaged goods and (vii) management and oversight of the installation of furniture, fixtures and equipment.
The fees for the additional services will be consistent with the approved capital improvement budget and will be deemed approved by the TRS lessee and landlord unless a majority of our independent directors determine that such fees for the additional services are not in line with market rates for similar services. In the event that the majority of our independent directors determine that the fees for the additional services are not market, the TRS lessee and Remington Lodging will engage a consultant reasonably satisfactory to both parties to provide then current market information with respect to the proposed fees and a written recommendation as to whether such fees are market rates or not. If the consultant determines that such fees as proposed by Remington Lodging are market, then the landlord will pay any consultant fees incurred by such consultant in making the determination. If the consultant’s recommendation does not support the fees as proposed by Remington Lodging, then Remington Lodging will pay the consultant’s fees incurred in connection with the determination and may, at its election, perform such service for fees consistent with the market research and recommendation of the consultant or elect not to provide such services and no termination fee will be payable. If Remington Lodging elects not to provide project related services for a non-managed hotel, no termination fee will be payable.
If the TRS lessee elects, for convenience, to terminate the project management and other market services being provided by Remington Lodging with respect to a hotel property (not taking into consideration any property management services), we must pay a termination fee to Remington Lodging equal to the product of (i) 65% of the project management fees and market service fees estimated to be payable to Remington Lodging with respect to the applicable hotel pursuant to the then current capital budget (but in no event less than the aggregate project management fees and market services fees for the preceding full fiscal year) and (ii) nine.
Indemnity Provisions.
Remington Lodging has agreed to indemnify each TRS lessee against all damages not covered by insurance that arise from: (i) the fraud, willful misconduct or gross negligence of Remington Lodging subject to certain limitations; (ii) infringement by Remington Lodging of any third party’s intellectual property rights; (iii) employee claims based on a substantial violation by Remington Lodging of employment laws or that are a direct result of the corporate policies of Remington Lodging; (iv) the knowing or reckless placing, discharge, leakage, use or storage of hazardous materials in violation of applicable environmental laws on or in any of our hotels by Remington Lodging; or (v) the breach by Remington Lodging of the master management agreement, including action taken by Remington Lodging beyond the scope of its authority under the master management agreement, which is not cured.
Except to the extent indemnified by Remington Lodging as described in the preceding paragraph, each TRS lessee will indemnify Remington Lodging against all damages not covered by insurance and that arise from: (i) the performance of Remington Lodging’s services under the master management agreement; (ii) the condition or use of our hotels; (iii) certain liabilities to which Remington Lodging is subjected, including pursuant to the WARN Act, in connection with the termination of the master management agreement; (iv) all employee cost and expenses; or (v) any claims made by an employee of Remington Lodging against Remington Lodging that are based on a violation or alleged violation of the employment laws.
Events of Default.
Events of default under the Remington master management agreement include:
|
•
|
The TRS lessee or Remington Lodging files a voluntary bankruptcy petition, or experiences a bankruptcy-related event not discharged within 90 days.
|
|
•
|
The TRS lessee or Remington Lodging fails to make any payment due under the master management agreement, subject to a 10-day notice and cure period.
|
|
•
|
The TRS lessee or Remington Lodging fails to observe or perform any other term of the management agreement, subject to a 30-day notice and cure period. There are certain instances in which the 30-day notice and cure period can be extended to up to 120 days.
|
34
|
•
|
Remington Lodging does not qualify as an “eligible independent contractor” as such term is defined in Section 856(d)(9) of the Internal Revenue Code.
|
If an event of default occurs and continues beyond any grace period, the non-defaulting party will have the option of terminating the Remington management agreement, on 30 days’ notice to the other party.
To minimize conflicts between us and Remington Lodging on matters arising under the Remington Management Agreement, the Company's Corporate Governance Guidelines provide that any waiver, consent, approval, modification, enforcement matters or elections which the Company may make pursuant to the terms of the Remington Management Agreement shall be within the exclusive discretion and control of a majority of the Independent Directors (or higher vote thresholds specifically set forth in such agreements). In addition, our board of directors has established a Related Party Transaction Committee (Conflicts Committee) comprised solely of independent directors to review all related party transactions that involve conflicts which committee may make recommendations to the independent members of our board (including rejection of any proposed transaction).
Right of First Offer Agreement
The right of first offer agreement provides us the first right to acquire each of the subject hotels, to the extent the board of directors of Ashford Trust determines to market and sell the hotel, subject to any prior rights of the managers of the hotel or other third parties and the limitation noted in the footnote to the table above with respect to hotels in a joint venture. In addition, so long as we do not materially change our initial investment guidelines without the express consent of Ashford LLC, the right of first offer agreement extends to hotels later acquired by Ashford Trust that satisfy our initial investment guidelines. We believe this right of first offer provides us with significant external growth opportunities.
If Ashford Trust decides to offer for sale an asset that fits our investment guidelines, it must give us a written notice describing the sale terms and granting us the right to purchase the asset at a purchase price equal to the price set forth in the offer. We will have 30 days to agree to the terms of the sale. If terms are not met, Ashford Trust will be free to sell the asset to any person upon substantially the same terms as those contained in the written notice for 180 days, but not for a price less than 95% of the offered purchase price. If during such 180-day period, Ashford Trust desires to accept an offer that is not on substantially the same terms as those contained in the written notice or that is less than 95% of the offered purchase price, Ashford Trust must give us written notice of the new terms and we will have 10 days in which to agree to the terms of the sale. If Ashford Trust does not close on the sale or refinancing of the asset within 180 days following the expiration of the initial 30-day period, the right to purchase the asset will be reinstated on the same terms.
Likewise, we have agreed to give Ashford Trust a right of first offer with respect to any properties that we acquire in a portfolio transaction, to the extent our board of directors determines it is appropriate to market and sell such assets and we control the disposition, provided such assets satisfy Ashford Trust’s investment guidelines. Any such right of first offer granted to Ashford Trust will be subject to certain prior rights, if any, granted to the managers of the related properties or other third parties.
The right of first offer agreement has an initial term of 10 years and is subject to automatic one year renewal periods unless one party notifies the other at least 180 days prior to the expiration of the current term that it does not intend to renew the agreement. The agreement may be terminated by either party (i) upon a default of the other party upon giving notice of such default and the defaulting party fails to cure within 45, or in some circumstances up to 90, days subject to certain exclusions, and (ii) if the other party experiences specified bankruptcy events. Also, if we materially modify our initial investment guidelines without consent of Ashford Trust (which consent may be withheld in its sole discretion), our right of first refusal for any assets owned or later acquired by Ashford Trust and its affiliates, other than the initial assets subject to the right of first offer agreement, will terminate unless otherwise agreed by the parties. Further, the agreement will automatically terminate upon a termination of our advisory agreement or upon a change of control of either us or Ashford Trust, excluding any change of control that may occur as a result of a spin-off, carve-out, split-off or other similar event.
TRS Leases
Four of the hotels we acquired from Ashford Trust in connection with the spin-off are owned by our operating partnership and leased to subsidiaries of Ashford Prime TRS. Two of our hotels are held in a joint venture in which we have a 75% equity interest. The two hotels owned by the joint venture are leased to subsidiaries of the joint venture, which two subsidiaries we have elected to treat as TRSs. In 2014, Ashford Prime TRS formed two new subsidiaries to lease the two hotels acquired during the year. Similarly in 2015, Ashford Prime TRS formed an additional new subsidiary to lease one of the hotels acquired during the year. Ashford Prime TRS has elected to be treated as a TRS. In 2017, two more subsidiaries were formed to lease the hotels acquired during the year. Generally, we intend to lease all hotels we acquire in the future, other than pursuant to sale-leaseback transactions with unrelated third parties, to a TRS lessee, pursuant to the terms of leases that are generally similar to the terms of the existing leases, unless not appropriate based on relevant regulatory factors. Ashford LLC will negotiate the terms and provisions of each
35
future lease, considering such things as the purchase price paid for the hotel, then current economic conditions and any other factors deemed relevant at the time.
Term.
The leases for all of our hotel properties include a term of five years, which began on January 1, 2018 and expires on December 31, 2022, except in the case of the Chicago Sofitel Magnificent Mile, which began on February 24, 2014 and expires on March 31, 2019, the Bardessono Hotel, which began on July 9, 2015 and expires on December 31, 2019, the Park Hyatt Beaver Creek, which began on March 31, 2017 and expires on December 31, 2021 and the Hotel Yountville, which began on May 11, 2017 and expires on December 31, 2021. The leases may be terminated earlier than the stated term if certain events occur, including specified damages to the related hotel, a condemnation of the related hotel or the sale of the related hotel, or an
event of default that is not cured within any applicable cure or grace periods. The lessor must pay a termination fee to the TRS lessee if and to the extent the TRS lessee is obligated to pay a termination fee to the managers as a result of the termination of the lease.
Amounts Payable Under Leases.
The leases generally provide for each TRS lessee to pay in each calendar month the base rent plus, in each calendar quarter, percentage rent, if any. The percentage rent for each hotel equals: (i) an agreed percentage of gross revenue that exceeds a threshold amount, less (ii) all prior percentage rent payments.
Maintenance and Modifications.
Each TRS lessee is required to establish and fund, in respect of each fiscal year during the terms of the leases, a reserve account, in the amount of at least 4% of gross revenues per year to cover the cost of capital expenditures, which costs will be paid by our operating partnership. Each TRS lessee shall be required to make (at our sole cost and expense) all capital expenditures required in connection with emergency situations, legal requirements, maintenance of the applicable franchise agreement, the performance by lessee of its obligations under the lease and other permitted additions to the leased property. We also have the right to make additions, modifications or improvements so long as our actions do not significantly alter the character or purposes of the property, significantly detract from the value or operating efficiency of the property, significantly impair the revenue producing capability of the property or affect the ability of the lessee to comply with the terms of their lease. All capital expenditures relating to material structural components involving expenditures of $1 million or more are subject to the approval of our operating partnership. Each TRS lessee is responsible for all routine repair and maintenance of the hotels, and our operating partnership will be responsible for non-routine capital expenditures.
We own substantially all personal property (other than inventory, linens, key money furniture, fixtures and equipment and other nondepreciable personal property) not affixed to, or deemed a part of, the real estate or improvements on our hotels, unless ownership of such personal property would cause the rent under a lease not to qualify as “rents from real property” for REIT income test purposes. See “Federal Income Tax Consequences of Our Status as a REIT—Income Tests.”
Insurance and Property Taxes.
We pay real estate and personal property taxes on the hotels (except to the extent that personal property associated with the hotels is owned by the applicable TRS lessee). We pay for property and casualty insurance relating to the hotel properties and any personal property owned by us. Each TRS lessee pays for all insurance on its personal property, comprehensive general public liability, workers’ compensation, vehicle, and other appropriate and customary insurance. Each TRS lessee must name us as an additional insured on any policies it carries.
Assignment and Subleasing.
The TRS lessees are not permitted to sublet any part of the hotels or assign their respective interests under any of the leases without our prior written consent, which cannot be unreasonably withheld. No assignment or subletting will release any TRS lessee from any of its obligations under the leases.
Damage to Hotels.
If any of our insured hotels is destroyed or damaged, whether or not such destruction or damage prevents use of the property as a hotel, the applicable TRS lessee will have the obligation, but only to the extent of insurance proceeds that are made available, to restore the hotel. All insurance proceeds will be paid to our operating partnership (except such proceeds payable for loss or damage to the TRS lessee’s personal property) and be paid to the applicable TRS lessee for the reasonable costs of restoration or repair. Any excess insurance proceeds remaining after the cost of repair or restoration will be retained by us. If the insurance proceeds are not sufficient to restore the hotel, the TRS lessee or we have the right to terminate the lease upon written notice. In that event, neither we nor the TRS lessee will have any further liabilities or obligations under the lease, except that, if we terminate the lease, we have to pay the TRS lessee termination fees, if any, within 45 days that become due under the management agreement. If the lease is so terminated, we will keep all insurance proceeds received as a result of such destruction or damage. If the lease is terminated by a TRS lessee, we have the right to reject the termination of the lease and to require the TRS lessee to restore the hotel, provided we agree to pay for
all restoration costs in excess of available insurance proceeds. In that event, the related lease will not terminate and we will pay all insurance proceeds to the TRS lessee.
If the cost of restoration exceeds the amount of insurance proceeds, we will contribute any excess amounts necessary to complete the restoration to the TRS lessee before requiring the work to begin. In the event of damage or destruction not covered by insurance, our obligations, as well as those of the applicable TRS lessee, will be the same as in the case of inadequate insurance proceeds. However, regardless of insurance coverage, if damage or destruction rendering the property unsuitable for its primary intended purpose occurs within 24 months of the end of the lease term, we may terminate the lease with 30 days’ notice. If the
36
lease remains in effect and the damage does not result in a reduction of gross revenues at the hotel, the TRS lessee’s obligation to pay rent will be unabated. If, however, the lease remains in effect but the damage does result in a reduction of gross revenues at the hotel, the TRS lessee will be entitled to a certain amount of rent abatement while the hotel is being repaired. We will keep all proceeds from loss of income insurance.
Condemnation.
If any of our hotels is subject to a total condemnation or a partial taking that prevents use of the property as a hotel, we and the TRS lessee each have the option to terminate the related lease. We will share in the condemnation award with the TRS lessee in accordance with the provisions of the related lease. If any partial taking of a hotel does not prevent use of the property as a hotel, the TRS lessee is obligated to restore the untaken portion of the hotel to a complete architectural unit but only to the extent of any available condemnation award. If the condemnation award is not sufficient to restore the hotel, the TRS lessee or we have the right to terminate the lease upon written notice. If the lease is terminated by the TRS lessee, we have the right to reject the termination of the lease within 30 days and to require the TRS lessee to restore the hotel, provided we agree to pay for all restoration costs in excess of the available condemnation award. We will contribute the cost of such restoration to the TRS lessee. If a partial taking occurs, the base rent will be abated to some extent, taking into consideration, among other factors, the number of usable rooms, the amount of square footage, or the revenues affected by the partial taking.
Events of Default.
Events of Default under the leases include:
|
•
|
The TRS lessee fails to pay rent or other amounts due under the lease, provided that the TRS lessee has a 10-day cure period after receiving a written notice from us that such amounts are due and payable before an event of default would occur.
|
|
•
|
The TRS lessee does not observe or perform any other term of a lease, provided that the TRS lessee has a 30-day cure period after receiving a written notice from us that a term of the lease has been violated before an event of default of default would occur. There are certain instances in which the 30-day grace period can be extended to a maximum of 120 days.
|
|
•
|
The TRS lessee is the subject of a bankruptcy, reorganization, insolvency, liquidation or dissolution event.
|
|
•
|
The TRS lessee voluntarily ceases operations of the hotels for a period of more than 30 days, except as a result of damage, destruction, condemnation, or certain specified unavoidable delays.
|
|
•
|
The default of the TRS lessee under the management agreement for the related hotel because of any action or failure to act by the TRS lessee and the TRS lessee has failed to cure the default within 30 days.
|
If an event of default occurs and continues beyond any grace period, we have the option of terminating the related lease. If we decide to terminate a lease, we must give the TRS lessee 10 days’ written notice. Unless the event of default is cured before the termination date we specify in the termination notice, the lease will terminate on the specified termination notice. In that event, the TRS lessee will be required to surrender possession of the related hotel and pay liquidated damages at our option, as provided by the applicable lease.
Termination of Leases.
Our operating partnership generally has the right to terminate any lease prior to the expiration date so long as we pay a termination fee. The termination fee is equal to any termination fee due to a manager under the management agreement.
Indemnification.
Each TRS lessee is required to indemnify us for claims arising out of (i) accidents occurring on or about the leased property, (ii) any past, present or future use or condition of the hotel by TRS lessee or any of its agents, employees or invitees, (iii) any impositions that are the obligation of the TRS hotel by lessee, (iv) any failure of the TRS lessee to perform under the lease, and (v) the non-performance of obligations under any sub-lease by the landlord thereunder. We are required to indemnify each TRS lessee for any claim arising out of our gross negligence or willful misconduct arising in connection with the lease and for any failure to perform our obligations under the lease. All indemnification amounts must be paid within 10 days of a determination of liability.
Breach by Us.
If we breach any of the leases, we will have 30 days from the time we receive written notice of the breach from the TRS lessee to cure the breach. This cure period may be extended in the event of certain specified, unavoidable delays.
Ground Leases
Three of our hotels are subject to ground leases that cover the land underlying the respective hotels.
Renaissance Tampa International Plaza.
The Renaissance Tampa International Plaza is subject to a land sublease with an initial term that expires December 30, 2080. We paid minimum rent of $300,000 per year through July 31, 2014, and effective as of August 1, 2014, our annual rent increased to $350,000 per year. In addition, we paid percentage rent in the amount of 2% of gross revenues (less the minimum rent paid) through July 31, 2014 and this amount increased to 3% beginning August 1, 2014. The lease may be assigned at any time to an affiliate, a successor corporation by merger, or a third party which has a net worth of
37
at least $10 million, provided that we give landlord notice of any such assignment, which notice shall include the name of the assignee.
Hilton La Jolla Torrey Pines.
The Hilton La Jolla Torrey Pines is subject to a ground lease with the City of San Diego and expires May 31, 2067. The lease term may be extended by either 10 years or 20 years depending on the amount of capital spent at the hotel. If 5% of gross income is spent on capital expenditures during the lease term, the term may be extended by 10 years. If 6% of gross income is spent on capital expenditures during the lease term, the term may be extended by 20 years. Rent is payable monthly and is the greater of minimum rent or percentage rent, determined monthly, with an annual true-up. Commencing January 1, 1993 and every five years thereafter, minimum rent is adjusted to be 80% of the annual average of actual rents paid or accrued during the preceding five-year period, but in no event may such rent be adjusted downwards. Percentage rent is determined from a percentage of room and banquet rental revenue, food and beverage sales, alcohol sales, lobby, gift shop and coin operated machine and telephone sales and other authorized uses. Percentage rent is adjusted at least six months prior to the end of (December 31, 2027) and thereafter at least six months prior to each 10th year by mutual agreement to provide fair rental to landlord. The lease may be assigned with the landlord’s prior written consent. Upon any assignment or a sublease of a majority of the Premises, 2% of the gross amounts paid for the assignment or sublease are payable to the Landlord except in the instances of a transfer to an affiliate or a mortgage foreclosure. In addition, 2% of the net proceeds are payable to the Landlord in the event of a refinancing.
Bardessono Hotel.
The Bardessono Hotel is subject to a ground lease with Bardessono Brothers LLC and expires October 31, 2055, with two 25-year extension options. Rent is payable monthly and is the greater of minimum rent or percentage rent with an annual true-up on October 1. Each year, annual base minimum rent is increased (but never decreased) by an amount equal to the percentage increase in CPI Index during the prior 12-month period that starts on September 1 and ends on August 31. In no event will the index percentage be less than 101.5% nor more than 103.5% multiplied by the annual base minimum rent payable by tenant during the lease year just ending. A percentage rent, which is calculated on the positive difference (if any) between the greater of 8% of net room revenues OR 4.5% of net operating revenues and the aggregate base minimum rent actually paid by the tenant during the same calendar year will be paid on a calendar year basis. Within 90 days after end of calendar year tenant must provide landlord an officer’s certificate containing tenant’s financial statements and percentage rent payment, if any. The lease may be assigned with the landlord’s prior written consent at least 60 days but not more than 90 days before the effective date of the proposed assignment. Tenant must submit to landlord a statement containing contact and financial information, operating and property ownership history, and other information with respect to the proposed assignee or subtenant as landlord may reasonably require, the type of use proposed for the inn parcel or resort, and all of the principal terms of the proposed assignment; copy of proposed assignment; and a copy of the landlord’s consent to assignment. In August of 2016, the lease was amended to allow for the expansion of the leased premises by 10,000 square feet to accommodate construction of presidential villas. Upon issuance of a building permit for the villas, the lease term will be extended by 10 years and the existing minimum base rent will increase on a prorata basis.
Mutual Exclusivity Agreement
Upon completion of the spin-off, we and Ashford Prime OP entered into a mutual exclusivity agreement with Remington Lodging that was consented and agreed to by Mr. Monty J. Bennett, regarding lodging investment opportunities any of us identifies in the future.
Term.
The initial term of the mutual exclusivity agreement is 10 years. This term automatically extends for three additional renewal periods of seven years each and a final renewal period of four years, for a total of up to 35 years. The agreement may be sooner terminated because of:
|
•
|
an event of default (see “Events of Default”),
|
|
•
|
a party’s early termination rights (see “Early Termination”), or
|
|
•
|
a termination of all Remington management agreements between the TRS lessee and Remington Lodging because of an event of default under the management agreements that affects all properties (see “Relationship with Management Agreement”).
|
Modification of Investment Guidelines.
In the event that we materially modify our initial investment guidelines without the written consent of Remington Lodging, which consent may be withheld at its sole and absolute discretion, and may further be subject to the consent of Ashford Trust parties, the Remington Lodging parties will have no obligation to present or offer us investment opportunities at any time thereafter. Instead, the Remington Lodging parties, subject to the superior rights of the Ashford Trust parties or any other party with which the Remington Lodging parties may have an existing agreement, shall use their reasonable discretion to determine how to allocate investment opportunities it
identifies. In the event we materially modify our investment guidelines without the written consent of Remington Lodging, the Ashford Trust parties will have superior rights to investment opportunities identified by the Remington Lodging parties, and we will no longer retain preferential treatment to
38
investment opportunities identified by the Remington Lodging parties. A material modification for this purpose means any modification of our initial investment guidelines to be competitive with Ashford Trust’s investment guidelines.
Our Exclusivity Rights.
Remington Lodging and Mr. Monty Bennett have granted us a first right of refusal to pursue certain lodging investment opportunities identified by Remington Lodging or its affiliates (including Mr. Bennett), including opportunities to buy hotel properties, to buy land and build hotels, or to otherwise invest in hotel properties that satisfy our initial investment guidelines and are not considered excluded transactions pursuant to the mutual exclusivity agreement. If investment opportunities are identified and are subject to the mutual exclusivity agreement, and we have not materially modified our initial investment guidelines without the written consent of Remington Lodging, then Remington Lodging, Mr. Bennett and their affiliates, as the case may be, will not pursue those opportunities (except as described below) and will give us a written notice and description of the investment opportunity, and we will have 10 business days to either accept or reject the investment opportunity. If we reject the opportunity, Remington Lodging may then pursue such investment opportunity, subject to a right of first refusal in favor of Ashford Trust pursuant to an existing agreement between Ashford Trust and Remington Lodging, on materially the same terms and conditions as offered to us. If the terms of such investment opportunity materially change, then Remington Lodging must offer the revised investment opportunity to us, whereupon we will have 10 business days to either accept or reject the opportunity on the revised terms.
Reimbursement of Costs.
If we accept an investment opportunity from Remington Lodging, we will be obligated to reimburse Remington Lodging or its affiliates for the actual out-of-pocket and third-party costs and expenses paid by Remington Lodging or its affiliates in connection with such investment opportunity, including any earnest money deposits, but excluding any finder’s fee, brokerage fee, development fee or other compensation paid by Remington Lodging or its affiliates. Remington Lodging must submit to us an accounting of the costs in reasonable detail.
Exclusivity Rights of Remington Lodging.
If we elect to pursue an investment opportunity that consists of the management and operation of a hotel property, and/or the construction, development, project management or the performance of project related services, we will hire Remington Lodging to provide such services unless our independent directors either (i) unanimously elect not to engage Remington Lodging, or (ii) by a majority vote, elect not to engage Remington Lodging because they have determined, in their reasonable business judgment, (A) special circumstances exist such that it would be in our best interest not to engage Remington Lodging for the particular hotel, or (B) based on the prior performance of Remington Lodging, another manager or developer could perform the duties materially better than Remington Lodging for the particular hotel. In return, Remington Lodging has agreed that it will provide those services.
Excluded Investment Opportunities.
The following are excluded from the mutual exclusivity agreement and are not subject to any exclusivity rights or right of first refusal:
|
•
|
With respect to Remington Lodging, an investment opportunity where our independent directors have unanimously voted not to engage Remington Lodging as the manager or developer.
|
|
•
|
With respect to Remington Lodging, an investment opportunity where our independent directors, by a majority vote, have elected not to engage Remington Lodging as the manager or developer based on their determination, in their reasonable business judgment, that special circumstances exist such that it would be in our best interest not to engage Remington Lodging with respect to the particular hotel.
|
|
•
|
With respect to Remington Lodging, an investment opportunity where our independent directors, by a majority vote, have elected not to engage Remington Lodging as the manager or developer because they have determined, in their reasonable business judgment, that another manager or developer could perform the management, development or other duties materially better than Remington Lodging for the particular hotel, based on Remington Lodging’s prior performance.
|
|
•
|
Existing hotel investments of Remington Lodging or its affiliates with any of their existing joint venture partners, investors or property owners.
|
|
•
|
Existing bona fide arm’s length third-party management arrangements (or arrangements for other services such as project management) of Remington Lodging or any of its affiliates with third parties other than us and our affiliates.
|
|
•
|
Like-kind exchanges made pursuant to existing contractual obligations by any of the existing joint venture partners, investors or property owners in which Remington Lodging or its affiliates have an ownership interest, provided that Remington Lodging provides us with notice 10 days’ prior to such transaction.
|
|
•
|
Any hotel investment that does not satisfy our initial investment guidelines.
|
Management or Development.
If we hire Remington Lodging to manage or operate a hotel or construct hotel improvements, it will be pursuant to the terms of the form of management agreement agreed to between us and Remington Lodging. If we hire Remington Lodging to develop and construct a hotel, the terms of the development and construction will be pursuant to a form of development agreement that has been agreed to by us and Remington Lodging.
39
Events of Default.
Each of the following is a default under the mutual exclusivity agreement:
|
•
|
we or Remington Lodging experience a bankruptcy-related event;
|
|
•
|
we fail to reimburse Remington Lodging as described under “Reimbursement of Costs,” subject to a 30-day cure period; and
|
|
•
|
we or Remington Lodging does not observe or perform any other term of the agreement, subject to a 30-day cure period (which may be increased to a maximum of 120 days in certain instances).
|
If a default occurs, the non-defaulting party will have the option of terminating the mutual exclusivity agreement subject to 30 days’ written notice and pursuing its rights and remedies under applicable law.
Early Termination.
Remington Lodging has the right to terminate the exclusivity rights granted to us if:
|
•
|
Mr. Monty J. Bennett is removed as our chief executive officer or as chairman of our board of directors or is not re-appointed to either position, or he resigns as chief executive officer or chairman of our board of directors;
|
|
•
|
we terminate the Remington Lodging exclusivity rights pursuant to the terms of the mutual exclusivity agreement; or
|
|
•
|
our advisory agreement with Ashford LLC is terminated for any reason pursuant to its terms and Mr. Monty J. Bennett is no longer serving as our chief executive officer and chairman of our board of directors.
|
We may terminate the exclusivity rights granted to Remington Lodging if:
|
•
|
Remington Lodging fails to qualify as an “eligible independent contractor” as defined in Section 856(d)(9) of the Internal Revenue Code and for that reason, we terminate the master management agreement with Remington Lodging;
|
|
•
|
Remington Lodging is no longer “controlled” by Mr. Monty Bennett or his father Mr. Archie Bennett, Jr. or their respective family partnership or trusts, the sole members of which are at all times lineal descendants of Mr. Archie Bennett, Jr. or Mr. Monty Bennett (including step children) and spouses;
|
|
•
|
we experience a change in control and terminate the master management agreement between us and Remington Lodging and have paid a termination fee equal to the greater of (a) the product of (i) 65% of the aggregate management fees for such hotel (both base fees and incentive fees) estimated to be payable to Remington Lodging with respect to the applicable hotel pursuant to the then current annual operating budget (but in no event less than the management fees for the preceding full fiscal year) and (ii) nine, or (b) the product of (i) 65% of the project management fees and market services fees estimated to be payable to Remington Lodging with respect to the applicable hotel pursuant to the then current capital improvement budget (but in no event less than the aggregate project management fees and market service fees, for the preceding full fiscal year) and (ii) nine;
|
|
•
|
the Remington Lodging parties terminate our exclusivity rights pursuant to the terms of the mutual exclusivity agreement; or
|
|
•
|
our advisory agreement with Ashford LLC is terminated for any reason pursuant to its terms and Mr. Monty J. Bennett is no longer serving as our chief executive officer and chairman of our board of directors.
|
Assignment.
The mutual exclusivity agreement may not be assigned by any of the parties to the agreement without the prior written consent of the other parties, provided that Remington Lodging can assign its interest in the mutual exclusivity agreement, without the written consent of the other parties, to a “manager affiliate entity” as that term is defined in the agreement, so long as such affiliate qualifies as an “eligible independent contractor” at the time of such transfer.
Relationship with Management Agreement.
The rights provided to us and to Remington Lodging in the mutual exclusivity agreement may be terminated if the master management agreement between us and Remington Lodging terminates in its entirety because of an event of default as to all of the then-managed properties. A termination of Remington Lodging’s management rights with respect to one or more hotels (but not all hotels) does not terminate the mutual exclusivity agreement. A termination of the mutual exclusivity agreement does not terminate any management agreement either in part or in whole, and the management agreements would continue in accordance with their terms as to the hotels covered, despite a termination of the mutual exclusivity agreement.
Licensing Agreement
Upon completion of the spin-off, we entered into a licensing agreement with Ashford Trust pursuant to which Ashford Trust has granted us a non-exclusive, perpetual, royalty-free license to use certain trademarks associated with the “Ashford Hospitality Prime, Inc.” name. The license agreement terminates immediately if we end our advisory relationship with Ashford LLC or one of its affiliates.
Relationship with Our Chairman of our Board of Directors, Executive Officers and Ashford LLC.
Mr. Monty J. Bennett owns 25% of AIM Performance Holdco, L.P. (“AIM Performance Holdco”), a Delaware limited partnership that owns a 99.99%
40
limited partnership interest in the general partner of the private investment funds managed by AIM. Mr. J. Robison Hays III owns 15% of AIM Performance Holdco. Ashford LLC holds the remaining equity interests in AIM Performance Holdco and owns 100% of AIM Management Holdco, LLC (“AIM Management Holdco”), a Delaware limited liability company that is the sole member of AIM. The collective 40% equity interest held by Messrs. Bennett and Hays in AIM Performance Holdco results in an indirect ownership of a 40% equity interest in the general partner of the private investment funds managed by AIM, or any affiliates that are created by Ashford LLC to serve as the general partner of such private investment funds. The equity interests held by Messrs. Bennett and Hays are economically equivalent to the equity interests held by Ashford LLC in such entities.
Regulation
General
Our hotels are subject to various U.S. federal, state and local laws, ordinances and regulations, including regulations relating to common areas and fire and safety requirements. We believe that each of our hotels has the necessary permits and approvals to operate its business.
Americans with Disabilities Act
Our hotels must comply with applicable provisions of the Americans with Disabilities Act of 1990 (the “ADA”), to the extent that such hotels are “public accommodations” as defined by the ADA. The ADA may require removal of structural barriers to access by persons with disabilities in certain public areas of our hotels where such removal is readily achievable as well as the provision to persons with disabilities of services equivalent to those provide to guests without disabilities. We believe that our hotels are in substantial compliance with the ADA and that we will not be required to make substantial capital expenditures to address the requirements of the ADA. However, non-compliance with the ADA could result in imposition of fines or an award of damages to private litigants. The obligation to make readily achievable accommodations is an ongoing one, and we will continue to assess our hotels and to make alterations as appropriate in this respect.
Environmental Matters
Under various laws relating to the protection of the environment, a current or previous owner or operator (including tenants) of real estate may be liable for contamination resulting from the presence or discharge of hazardous or toxic substances at that property and may be required to investigate and clean up such contamination at that property or emanating from that property. These costs could be substantial and liability under these laws may attach without regard to whether the owner or operator knew of, or was responsible for, the presence of the contaminants, and the liability may be joint and several. The presence of contamination or the failure to remediate contamination at our hotels may expose us to third-party liability or materially and adversely affect our ability to sell, lease or develop the real estate or to incur debt using the real estate as collateral.
Our hotels are subject to various federal, state, and local environmental, health and safety laws and regulations that address a wide variety of issues, including, but not limited to, storage tanks, air emissions from emergency generators, storm water and wastewater discharges, lead-based paint, mold and mildew and waste management. Our hotels incur costs to comply with these laws and regulations and could be subject to fines and penalties for non-compliance.
Some of our hotels may contain or develop harmful mold or suffer from other adverse conditions, which could lead to liability for adverse health effects and costs of remediation. The presence of significant mold or other airborne contaminants at any of our hotels could require us to undertake a costly remediation program to contain or remove the mold or other airborne contaminants from the affected hotel or increase indoor ventilation. In addition, the presence of significant mold or other airborne contaminants could expose us to liability from guests or employees at our hotels and others if property damage or health concerns arise.
Insurance
We carry comprehensive general liability, “All Risk” property, business interruption, rental loss coverage and umbrella liability coverage on all of our hotels and earthquake, wind, flood and hurricane coverage on hotels in areas where we believe such coverage is warranted, in each case with limits of liability that we deem adequate. Similarly, we are insured against the risk of direct physical damage in amounts we believe to be adequate to reimburse us, on a replacement basis, for costs incurred to repair or rebuild each hotel, including loss of rental income during the reconstruction period. We have selected policy specifications and insured limits which we believe to be appropriate given the relative risk of loss, the cost of the coverage and industry practice. We do not carry insurance for generally uninsured losses, including, but not limited to losses caused by riots, war or acts of God. In the opinion of our management, our hotels are adequately insured.
41
Competition
The hotel industry is highly competitive and the hotels in which we invest are subject to competition from other hotels for guests. Competition is based on a number of factors, most notably convenience of location, brand affiliation, price, range of services, guest amenities or accommodations offered and quality of customer service. Competition is often specific to the individual markets in which our properties are located and includes competition from existing and new hotels. We believe that hotels, such as our hotels that are affiliated with leading national brands, such as the Marriott, Hilton, Hyatt or Accor brands, will enjoy the competitive advantages associated with operating under such brands. Increased competition could have a material adverse effect on the occupancy rate, average daily room rate and rooms revenue per available room of our hotels or may require us to make capital improvements that we otherwise would not have to make, which may result in decreases in our profitability.
Our principal competitors include other hotel operating companies, ownership companies (including hotel REITs) and national and international hotel brands. We face increased competition from providers of less expensive accommodations, such as select service hotels or independent owner-managed hotels, during periods of economic downturn when leisure and business travelers become more sensitive to room rates. We may also experience competition from alternative types of accommodations such as Airbnb.
We face competition for the acquisition of hotels from institutional pension funds, private equity funds, REITs, hotel companies and others who are engaged in the acquisition of hotels. Some of these competitors have substantially greater financial and operational resources and access to capital than we have and may have greater knowledge of the markets in which we seek to invest. This competition may reduce the number of suitable investment opportunities offered to us and decrease the attractiveness of the terms on which we may acquire our targeted hotel investments, including the cost thereof.
Employees
We have no employees. Our appointed officers and employees are provided by Ashford LLC. Services which would otherwise be provided by employees are provided by Ashford LLC and by our executive officers. Ashford LLC has approximately 102 full time employees. These employees directly or indirectly perform various acquisition, development, asset management, capital markets, accounting, tax, risk management, legal, redevelopment, and corporate management functions pursuant to the terms of our advisory agreement.
Seasonality
Our properties’ operations historically have been seasonal as certain properties maintain higher occupancy rates during the summer months and some during the winter months. This seasonality pattern can cause fluctuations in our quarterly lease revenue under our percentage leases. We anticipate that our cash flows from the operations of our properties will be sufficient to enable us to make quarterly distributions to maintain our REIT status. To the extent that cash flows from operations are insufficient during any quarter due to temporary or seasonal fluctuations in lease revenue, we expect to utilize other cash on hand or borrowings to fund required distributions. However, we cannot make any assurances that we will make distributions in the future.
Access to Reports and Other Information
We maintain a website at www.ahpreit.com. On our website, we make available free of charge our annual reports on Form 10-K, quarterly reports on Form 10-Q, current reports on Form 8-K, and other reports filed or furnished pursuant to Section 13(a) or 15(d) of the Securities Exchange Act of 1934, as amended (the “Exchange Act”), as soon as reasonably practicable after we electronically file such material with the Securities and Exchange Commission (“SEC”). In addition, our Code of Business Conduct and Ethics, Code of Ethics for the Chief Executive Officer, Chief Financial Officer, and Chief Accounting Officer, Corporate Governance Guidelines, and Board Committee Charters are also available free-of-charge on our website or can be made available in print upon request.
All reports filed with the SEC may also be read and copied at the SEC’s Public Reference Room at 100 F Street, N.E. Washington, D.C. 20549-1090. Further information regarding the operation of the Public Reference Room may be obtained by calling 1-800-SEC-0330. In addition, all of our filed reports can be obtained at the SEC’s website at www.sec.gov.
42
Item 1A.
Risk Factors
Risks Related to Our Business and Properties
Our business is significantly influenced by the economies and other conditions in the specific markets in which we operate, particularly in the metropolitan areas where we have high concentrations of hotels.
Our hotels are located in the Washington D.C., San Francisco, San Diego, Seattle, Philadelphia, Tampa, Chicago, Key West, Vail/Beaver Creek and St. Thomas metropolitan areas. As a result, we are particularly susceptible to adverse market conditions in these areas and any additional areas in which we may acquire assets in the future, including industry downturns, relocation of businesses and any oversupply of hotel rooms or a reduction in lodging demand. Adverse economic developments in the markets in which we have a concentration of hotels, or in any of the other markets in which we operate, or any increase in hotel supply or decrease in lodging demand resulting from the local, regional or national business climate, could adversely affect our business, operating results and prospects.
Our investments are concentrated in the hotel industry, and our business would be adversely affected by an economic downturn in that sector.
Our investments are concentrated in the hotel industry. This concentration may expose us to the risk of economic downturns in the hotel real estate sector to a greater extent than if our properties were more diversified across other sectors of the real estate industry.
A financial crisis or economic slowdown may harm the operating performance of the hotel industry generally. If such events occur, we may be impacted by declines in occupancy, average daily room rates and/or other operating revenues.
The performance of the lodging industry has been closely linked with the performance of the general economy and, specifically, growth in the U.S. GDP. We invest in hotels that are classified as luxury. In an economic downturn, these types of hotels may be more susceptible to a decrease in revenue, as compared to hotels in other categories that have lower room rates. This characteristic may result from the fact that luxury hotels generally target business and high-end leisure travelers. In periods of economic difficulties, business and leisure travelers may seek to reduce travel costs by limiting travel or seeking to reduce costs on their trips. Any economic recession will likely have an adverse effect on our business, operating results and prospects.
We face risks related to changes in the global economic and political environment, including capital and credit markets.
Our business may be harmed by global economic conditions, which recently have been volatile. Political crises in individual countries or regions, including sovereign risk related to a deterioration in the creditworthiness of or a default by local governments, has contributed to this volatility. If the global economy experiences continued volatility or significant disruptions, such disruptions or volatility could hurt the U.S. economy and our business. More specifically, in addition to experiencing reduced demand for business and leisure travel because of a slow-down in the general economy, we could be harmed by disruptions resulting from tighter credit markets or by illiquidity resulting from an inability to access credit markets to obtain cash to support operations or make distributions to our stockholders as a result of global or international developments.
Failure of the hotel industry to exhibit sustained improvement or to improve as expected may adversely affect us.
A substantial part of our business plan is based on our belief that the lodging markets in which we invest will experience improving economic fundamentals in the future, despite the fact that fundamentals have already substantially improved over the last several years. In particular, our business strategy is dependent on our expectation that key industry performance indicators, especially RevPAR, will continue to improve. However, hotel industry fundamentals may not continue to improve and could deteriorate. In the event conditions in the industry do not sustain improvement or improve as we expect, or deteriorate, we may be adversely affected.
We invest in the luxury segments of the lodging market, which are highly competitive and generally subject to greater volatility than most other market segments and could negatively affect our profitability.
The luxury segments of the hotel business are highly competitive. Our hotel properties compete on the basis of location, room rates, quality, amenities, service levels, reputation and reservations systems, among many factors. There are many competitors in the luxury segments, and many of these competitors may have substantially greater marketing and financial resources than we have. This competition could reduce occupancy levels and rooms revenue at our hotels. Over-building in the lodging industry may increase the number of rooms available and may decrease occupancy and room rates. In addition, in periods of weak demand, as may occur during a general economic recession, our profitability may be negatively affected by the relatively high fixed costs of operating luxury hotels. If our hotels cannot compete effectively for guests, they will earn less revenue, which would result in lower cash available for us to meet debt service obligations, operating expenses, and make requisite distributions to stockholders.
43
Because we depend upon Ashford LLC and its affiliates to conduct our operations, any adverse changes in the financial condition of Ashford LLC or its affiliates or our relationship with them could hinder our operating performance.
We depend on Ashford LLC to manage our assets and operations. Any adverse changes in the financial condition of Ashford LLC, or its affiliates or our relationship with Ashford LLC could hinder its ability to manage us successfully.
We depend on Ashford LLC’s key personnel with long-standing business relationships. The loss of Ashford LLC’s key personnel could threaten our ability to operate our business successfully.
Our future success depends, to a significant extent, upon the continued services of Ashford LLC’s management team. In particular, the hotel industry experience of Messrs. Monty J. Bennett, Richard J. Stockton, David A. Brooks, Deric S. Eubanks, Jeremy Welter, Mark L. Nunneley, and J. Robison Hays III, and the extent and nature of the relationships they have developed with hotel franchisors, operators, and owners and hotel lending and other financial institutions are critically important to the success of our business. The loss of services of one or more members of Ashford LLC’s management team could harm our business and our prospects.
The aggregate amount of fees and expense reimbursements paid to our advisor will exceed the average of internalized expenses of our industry peers (as provided in our advisory agreement), as a percentage of total market capitalization. As a part of these fees, we must pay a minimum advisory fee to our advisor regardless of our performance.
Pursuant to the advisory agreement between us and our advisor, we must pay our advisor a monthly base management fee (subject to a minimum fee described below) in an amount equal to 1/12th of 0.70% of the sum of (i) the total market capitalization of our company for the prior month, and (ii) the Key Money Gross Asset Value (as defined in our advisory agreement), an annual incentive fee that will be based on our achievement of certain minimum performance thresholds and certain expense reimbursements. The monthly minimum base management fee will be equal to the greater of (i) 90% of the base fee paid for the same month in the prior year; and (ii) 1/12th of the “G&A Ratio” for the most recently completed fiscal quarter multiplied by the Total Market Capitalization (as defined in our advisory agreement) on the last balance sheet date included in the most recent Quarterly Report on Form 10-Q or Annual Report on Form 10-K filed by the Company with the SEC. The “G&A Ratio” will be calculated as the simple average of the ratios of total general and administrative expenses paid, less any non-cash expenses but including any dead-deal costs, in the applicable quarter by each member of a select peer group, divided by the total market capitalization of such peer group member (as provided in our advisory agreement). Since the base management fee is subject to this minimum amount and because a portion of such fees are contingent on our performance, the fees we pay to our advisor may fluctuate over time. However, regardless of our advisor’s performance, the total amount of fees and reimbursements paid to our advisor as a percentage of market capitalization will never be less than the average of internalized expenses of our industry peers (as provided in our advisory agreement), and there may be times when the total amount of fees and incentives paid to our advisor greatly exceeds the average of internalized expenses of our industry peers.
Our advisor’s entitlement to non-performance-based compensation, including the minimum base management fee, might reduce its incentive to devote its time and effort to seeking investments that provide attractive risk-adjusted returns for our portfolio. Further, our incentive fee structure may induce our advisor to encourage us to acquire certain assets, including speculative or high risk assets, or to acquire assets with increased leverage, which could increase the risk to our portfolio.
Our business strategy depends on acquiring additional hotel properties on attractive terms and the failure to do so or to otherwise manage our planned growth successfully may adversely affect our business and operating results.
We intend to acquire additional hotel properties in the future. We face significant competition for attractive investment opportunities from other well-capitalized investors, some of which have greater financial resources and greater access to debt and equity capital than we have. This competition increases as investments in real estate become increasingly attractive relative to other forms of investment. This competition could limit the number of suitable investment opportunities offered to us. It may also increase the bargaining power of property owners seeking to sell to us, making it more difficult for us to acquire new properties on attractive terms or on the terms contemplated in our business plan. As a result of such competition, we may be unable to acquire hotel properties that we deem attractive at prices that we consider appropriate or on terms that are satisfactory to us. If we do identify an appropriate acquisition candidate, we may not be able to successfully negotiate the terms of the acquisition. In addition, we expect to finance future acquisitions through a combination of borrowings under our secured revolving credit facility, the use of retained cash flows, property-level debt, and offerings of equity and debt securities, which may result in additional leverage or dilution to our stockholders. Any delay or failure on our part to identify, negotiate, finance on favorable terms, consummate and integrate such acquisitions could materially impede our growth.
In addition, we expect to compete to sell hotel properties. Availability of capital, the number of hotel properties available for sale and market conditions, all affect prices. We may not be able to sell hotel assets at our targeted price.
44
There is no guarantee that Ashford Trust will sell us any of the properties that are subject to the right of first offer agreement.
We may not be able to acquire any of the properties that are subject to the right of first offer agreement, either because Ashford Trust does not elect to sell such properties or we are not in a position to acquire the properties when Ashford Trust elects to sell. Further, if we materially change our investment guidelines without the express consent of Ashford LLC, no hotels acquired by Ashford Trust after the date of such change will be subject to the right of first offer.
We may be unable to successfully integrate and operate acquired properties, which may have a material adverse effect on our business and operating results.
Even if we are able to make acquisitions on favorable terms, we may not be able to successfully integrate and operate them. We may be required to invest significant capital and resources after an acquisition to maintain or grow the properties that we acquire. In addition, we may need to adapt our management, administrative, accounting, and operational systems, or hire and retain sufficient operational staff, to integrate and manage successfully any future acquisitions of additional assets. These and other integration efforts may disrupt our operations, divert Ashford LLC’s attention away from day-to-day operations and cause us to incur unanticipated costs. The difficulties of integration may be increased by the necessity of coordinating operations in geographically dispersed locations. Our failure to integrate successfully any acquisitions into our portfolio could have a material adverse effect on our business and operating results. Further, acquired properties may have liabilities or adverse operating issues that we fail to discover through due diligence prior to the acquisition. The failure to discover such issues prior to such acquisition could have a material adverse effect on our business and results of operations.
Because our board of directors and Ashford LLC have broad discretion to make future investments, we may make investments that result in returns that are substantially below expectations or in net operating losses. In addition, our investment policies may be revised from time to time at the discretion of our board of directors, without a vote of our stockholders. Such discretion could result in investments with yield returns inconsistent with stockholders’ expectations.
Our joint venture investments could be adversely affected by our lack of sole decision-making authority, our reliance on a co-venturer’s financial condition and disputes between us and our co-venturers.
We own interests in two hotels through a joint venture and we do not have sole decision-making authority regarding these two properties. In addition, we may continue to co-invest with third parties through partnerships, joint ventures or other entities, acquiring controlling or noncontrolling interests in, or sharing responsibility for, managing the affairs of a property, partnership, joint venture or other entity. We may not be in a position to exercise sole decision-making authority regarding any future properties that we may hold in a partnership or joint venture. Investments in partnerships, joint ventures or other entities may, under certain circumstances, involve risks not present were a third party not involved, including the possibility that partners or co-venturers might become bankrupt, suffer a deterioration in their financial condition or fail to fund their share of required capital contributions. Partners or co-venturers may have economic or other business interests or goals which are inconsistent with our business interests or goals, and may be in a position to take actions contrary to our policies or objectives. Such investments may also have the potential risk of impasses on decisions, such as a sale, budgets, or financing, because neither we nor the partner or co-venturer have full control over the partnership or joint venture. Disputes between us and partners or co-venturers may result in litigation or arbitration that would increase our expenses and prevent our officers and/or directors from focusing their time and effort on our business. Consequently, actions by, or disputes with, partners or co-venturers might result in subjecting properties owned by the partnership or joint venture to additional risk. In addition, we may in certain circumstances be liable for the actions of our third-party partners or co-venturers.
Hotel franchise management agreement requirements or the loss of such an agreement could adversely affect us.
We must comply with operating standards, terms, and conditions imposed by the franchisors or managers of the hotel brands under which our hotels operate. Franchisors periodically inspect their licensed hotels to confirm adherence to their operating standards. The failure of a hotel to maintain these standards could result in the loss or cancellation of a franchise license or other authority pursuant to which our hotels are branded and operated. With respect to operational standards, we rely on our property managers to conform to such standards. Franchisors or managers may also require us to make certain capital improvements to maintain the hotel in accordance with system standards, the cost of which can be substantial. A franchisor or manager could condition the continuation of branding and operational support based on the completion of capital improvements that Ashford LLC or our board of directors determines is not economically feasible in light of general economic conditions, the operating results or prospects of the affected hotel or other circumstances. In that event, Ashford LLC or our board of directors may elect to allow the franchise or management agreement to lapse or be terminated, which could result in a termination charge as well as a change in branding or operation of the hotel as an independent hotel. In addition, when the term of such agreement expires there is no obligation to issue a new franchise.
45
The loss of a franchise or management agreement could have a material adverse effect on the operations and/or the underlying value of the affected hotel because of the loss of associated name recognition, marketing support and centralized reservation systems provided by the franchisor or manager. Any such material adverse effect on one or more of our hotels may, in turn, have a material adverse effect on our business and operating results.
Our reliance on third-party property managers, including Remington Lodging, to operate our hotels and for a substantial majority of our cash flow may adversely affect us.
Because federal income tax laws restrict REITs and their subsidiaries from operating or managing hotels, third parties must operate our hotels. A REIT may lease its hotels to taxable REIT subsidiaries in which the REIT can own up to a 100% interest. A TRS pays corporate-level income tax and may retain any after-tax income. A REIT must satisfy certain conditions to use the TRS structure. One of those conditions is that the TRS must hire, to manage the hotels, an “eligible independent contractor” (“EIC”) that is actively engaged in the trade or business of managing hotels for parties other than the REIT. An EIC cannot (i) own more than 35% of the REIT, (ii) be owned more than 35% by persons owning more than 35% of the REIT, or (iii) provide any income to the REIT (i.e., the EIC cannot pay fees to the REIT, and the REIT cannot own any debt or equity securities of the EIC). Accordingly, while we may lease hotels to a TRS that we own, the TRS must engage a third-party operator to manage the hotels. Thus, our ability to direct and control how our hotels are operated is less than if we were able to manage our hotels directly.
We are parties to hotel management agreements under which unaffiliated third-party property managers manage our hotels. We have also entered into a mutual exclusivity agreement with Remington Lodging contemplating Remington Lodging’s management of hotels we acquire in the future, pursuant to which Remington Lodging currently manages the Pier House Resort. We do not supervise any of the property managers or their respective personnel on a day-to-day basis. Without such supervision, our property managers may not manage our properties in a manner that is consistent with their respective obligations under the applicable management agreement or our obligations under our hotel management agreements, which are similar to franchise agreements, be negligent in their performance, engage in criminal or fraudulent activity, or otherwise default on their respective management obligations to us. If any of these events occur, our relationships with any managers may be damaged, we may be in breach of our management agreement, and we could incur liabilities resulting from loss or injury to our property or to persons at our properties. In addition, from time to time, disputes may arise between us and our third-party managers regarding their performance or compliance with the terms of the hotel management agreements, which in turn could adversely affect us. If we are unable to resolve such disputes through discussions and negotiations, we may choose to terminate our management agreement, litigate the dispute or submit the matter to third-party dispute resolution, the expense of which may be material and the outcome of which may harm our business, operating results or prospects.
Our management agreements could adversely affect our ability to sell or finance our hotel properties.
Our management agreements do not allow us to replace hotel managers on relatively short notice or with limited cost and also contain other restrictive covenants. We may enter into additional such agreements or acquire properties subject to such agreements in the future. For example, the terms of a management agreement may restrict our ability to sell a property unless the purchaser is not a competitor of the manager, assumes the management agreement and meets other conditions. Also, the terms of a long-term management agreement encumbering our property may reduce the value of the property. When we enter into or acquire properties subject to any such management agreements, we may be precluded from taking actions that we believe to be in our best interest and could incur substantial expense as a result.
Seven of our hotels currently operate under Marriott or Hilton brands; therefore, we are subject to risks associated with concentrating our portfolio in just two brand families.
Seven of our twelve hotels utilize brands owned by Marriott or Hilton. As a result, our success is dependent in part on the continued success of Marriott and Hilton and their respective brands. We believe that building brand value is critical to increase demand and build customer loyalty. Consequently, if market recognition or the positive perception of Marriott and/or Hilton is reduced or compromised, the goodwill associated with the Marriott- and Hilton-branded hotels in our portfolio may be adversely affected. Furthermore, if our relationship with Marriott or Hilton were to deteriorate as a result of disputes regarding the management of our hotels or for other reasons, Marriott and/or Hilton might terminate its current management agreements or franchise licenses with us or decline to manage or provide franchise licenses for hotels we may acquire in the future.
If we cannot obtain additional capital, our growth will be limited.
We are required to distribute to our stockholders at least 90% of our REIT taxable income, excluding net capital gains, each year to qualify and maintain our qualification as a REIT. As a result, our retained earnings, if any, available to fund acquisitions, development, or other capital expenditures are nominal. As such, we rely upon the availability of additional debt or equity capital to fund these activities. Our long-term ability to grow through acquisitions or development, which is an important strategy for us,
46
will be limited if we cannot obtain additional financing or equity capital. Market conditions may make it difficult to obtain financing or equity capital, and we may not be able to obtain additional debt or equity financing or obtain it on favorable terms.
Three of our hotels are subject to ground leases; if we are found to be in breach of a ground lease or are unable to renew a ground lease, our business could be materially and adversely affected.
Three of our hotels are on land subject to ground leases. Accordingly, we only own a long-term leasehold or similar interest in those three hotels. If we are found to be in breach of a ground lease, we could lose the right to use the hotel. In addition, unless we can purchase a fee interest in the underlying land and improvements or extend the terms of these leases before their expiration, we will lose our right to operate these properties and our interest in the improvements upon expiration of the leases. We may not be able to renew any ground lease upon its expiration. Our ability to exercise any extension options relating to our ground leases is subject to the condition that we are not in default under the terms of the ground lease at the time that we exercise such options. If we lose the right to use a hotel due to a breach or non-renewal of the ground lease, we would be unable to derive income from such hotel and would be required to purchase an interest in another hotel to attempt to replace that income, which could materially and adversely affect our business, operating results and prospects.
We will not recognize any increase in the value of the land or improvements subject to our ground leases and may only receive a portion of compensation paid in any eminent domain proceeding with respect to the hotel.
Unless we purchase a fee interest in the land and improvements subject to our ground leases, we will not have any economic interest in the land or improvements at the expiration of our ground leases. As a result, we will not share in any increase in value of the land or improvements beyond the term of a ground lease, notwithstanding our capital outlay to purchase our interest in the hotel or fund improvements thereon, and will lose our right to use the hotel. Furthermore, if the state or federal government seizes a hotel subject to a ground lease under its eminent domain power, we may only be entitled to a portion of any compensation awarded for the seizure.
The expansion of our business into new markets outside of the United States will expose us to risks relating to owning hotels in those international markets.
As part of our business strategy, we may acquire hotels that meet our investment criteria and are located in international markets. We may have difficulty managing our expansion into new geographic markets where we have limited knowledge and understanding of the local economy, an absence of business relationships in the area, or unfamiliarity with local governmental and permitting procedures and regulations. There are risks inherent in conducting business outside of the United States, which include risks related to:
|
•
|
foreign employment laws and practices, which may increase the reimbursable costs incurred under our advisory agreement associated with international employees;
|
|
•
|
foreign tax laws, which may provide for income or other taxes or tax rates that exceed those of the U.S. and which may provide that foreign earnings that are repatriated, directly or indirectly, are subject to dividend withholding tax requirements or other restrictions;
|
|
•
|
compliance with and unexpected changes in regulatory requirements or monetary policy;
|
|
•
|
the willingness of domestic or international lenders to provide financing and changes in the availability, cost and terms of such financing;
|
|
•
|
adverse changes in local, political, economic and market conditions;
|
|
•
|
increased costs of insurance coverage related to terrorist events;
|
|
•
|
changes in interest rates and/or currency exchange rates;
|
|
•
|
regulations regarding the incurrence of debt; and
|
|
•
|
difficulties in complying with U.S. rules governing REITs while operating outside of the United States.
|
Any of these factors could affect adversely our ability to obtain all of the intended benefits of expanding internationally. If we do not effectively manage this expansion and successfully integrate the international hotels into our organization, our operating results and financial condition may be adversely affected.
Compliance with international laws and regulations may require us to incur substantial costs.
The operations of our international properties, if any, will be subject to a variety of U.S. and international laws and regulations, including the United States Foreign Corrupt Practices Act (“FCPA”). Before we invest in international markets, we will adopt policies and procedures designed to promote compliance with the FCPA and other anti-corruption laws, but we may not continue to be found to be operating in compliance with, or be able to detect violations of, any such laws or regulations. In addition, we
47
cannot predict the nature, scope or effect of future regulatory requirements to which our international properties might be subject and the manner in which existing laws might be administered or interpreted.
Exchange rate fluctuations could affect adversely our financial results.
If we acquire hotels or conduct operations in an international jurisdiction, currency exchange rate fluctuations could adversely affect our results of operations and financial position. If we have international operations, a portion of our revenue and expenses could be generated in foreign currencies such as the Euro, the Canadian dollar and the British pound sterling. Any steps we take to reduce our exposure to fluctuations in the value of foreign currencies, such as entering into foreign exchange agreements or currency exchange hedging arrangements will not eliminate such risk entirely. To the extent that we are unable to match revenue received in foreign currencies with expenses paid in the same currency, exchange rate fluctuations could have a negative impact on our results of operations and financial condition. Additionally, because our consolidated financial results are reported in U.S. dollars, if we generate revenues or earnings in other currencies, the conversion of such amounts into U.S. dollars can result in an increase or decrease in the amount of our revenues or earnings.
For as long as we are an emerging growth company, we will not be required to comply with certain reporting requirements, including those relating to accounting standards and disclosure about our executive compensation, that apply to other public companies.
Upon the completion of the spin-off, we became subject to reporting and other obligations under the Exchange Act. In April 2012, the Jump Start Our Business Startups Act (the “JOBS Act”) was enacted into law. The JOBS Act contains provisions that, among other things, relax certain reporting requirements for “emerging growth companies,” including certain requirements relating to accounting standards and compensation disclosure. We are an “emerging growth company” as defined in the JOBS Act. For as long as we are an emerging growth company, which may be up to five full fiscal years, unlike other public companies, we will not be required to:
|
•
|
provide an auditor’s attestation report on management’s assessment of the effectiveness of our system of internal control over financial reporting pursuant to Section 404 of the Sarbanes-Oxley Act;
|
|
•
|
comply with any new or revised financial accounting standards applicable to public companies until such standards are also applicable to private companies under Section 102(b)(1) of the JOBS Act;
|
|
•
|
comply with any new requirements adopted by the Public Company Accounting Oversight Board (the “PCAOB”) requiring mandatory audit firm rotation or a supplement to the auditor’s report in which the auditor would be required to provide additional information about the audit and the financial statements of the issuer;
|
|
•
|
comply with any new audit rules adopted by the PCAOB after April 5, 2012 unless the SEC determines otherwise;
|
|
•
|
provide certain disclosure regarding executive compensation; or
|
|
•
|
hold stockholder advisory votes on executive compensation.
|
Because we are an "emerging growth company" under the JOBS Act, our independent registered public accounting firm is not required to attest to the effectiveness of our internal control over financial reporting.
For as long as we are an “emerging growth company” under the JOBS Act, our independent registered public accounting firm will not be required to attest to the effectiveness of our internal control over financial reporting pursuant to Section 404(b). We could be an emerging growth company for up to five years. An independent assessment of the effectiveness of our internal controls could detect problems that our management’s assessment might not. Undetected material weaknesses in our internal controls could lead to financial statement restatements and require us to incur the expense of remediation.
Our status as an “emerging growth company” under the JOBS Act may make it more difficult to raise capital as and when we need it.
Because of the exemptions from various reporting requirements provided to us as an “emerging growth company” and because we will have an extended transition period for complying with accounting standards that are newly issued or revised after April 5, 2012, our common stock may be less attractive to investors and it may be difficult for us to raise additional capital as and when we need it. Investors may be unable to compare our business with other companies in our industry if they believe that our financial accounting is not as transparent as other companies in our industry. Without access to additional capital, we may not be able to expand our business or take other actions we determine to be in our best interests. If we are unable to raise additional capital as and when we need it, our financial condition and results of operations may be materially and adversely affected.
48
We are increasingly dependent on information technology, and potential cyber-attacks, security problems or other disruption and expanding social media vehicles present new risks.
Ashford LLC and our hotel managers rely on information technology networks and systems, including the Internet, to process, transmit and store electronic information, and to manage or support a variety of business processes, including financial transactions and records, personal identifying information, reservations, billing and operating data. Ashford LLC and our hotel managers may purchase some of our information technology from vendors, on whom our systems will depend, and Ashford LLC relies on commercially available systems, software, tools and monitoring to provide security for processing, transmission and storage of confidential operator and other customer information. We depend upon the secure transmission of this information over public networks. Ashford LLC’s and hotel managers’ networks and storage applications could be subject to unauthorized access by hackers or others through cyber-attacks, which are rapidly evolving and becoming increasingly sophisticated, or by other means, or may be breached due to operator error, malfeasance or other system disruptions. In some cases, it will be difficult to anticipate or immediately detect such incidents and the damage they cause. Any significant breakdown, invasion, destruction, interruption or leakage of information from Ashford LLC’s or hotel managers’ systems could harm our reputation and business.
In addition, the use of social media could cause us to suffer brand damage or information leakage. Negative posts or comments about us, our hotel managers or our hotels on any social networking website could damage our or our hotels’ reputations. In addition, employees or others might disclose non-public sensitive information relating to our business through external media channels. The continuing evolution of social media will present us with new challenges and risks.
Changes in laws, regulations or policies may adversely affect our business.
The laws and regulations governing our business or the regulatory or enforcement environment at the federal level or in any of the states in which we operate may change at any time and may have an adverse effect on our business. For example, the Patient Protection and Affordable Care Act of 2010, as it is phased in over time, will significantly affect the administration of health care services and could significantly impact our hotel managers’ cost of providing employees with health care insurance. We are unable to predict how this or any other future legislative or regulatory proposals or programs will be administered or implemented or in what form, or whether any additional or similar changes to statutes or regulations, including the interpretation or implementation thereof, will occur in the future. Any such action could affect us in substantial and unpredictable ways and could have an adverse effect on our results of operations and financial condition. Our inability to remain in compliance with regulatory requirements in a particular jurisdiction could have a material adverse effect on our operations in that market and on our reputation generally. Applicable laws or regulations may be amended or construed differently and new laws and regulations may be adopted, either of which could materially adversely affect our business, financial condition, or results of operations.
We may from time to time be subject to litigation, which could have a material adverse effect on our financial condition, results of operations, cash flow and trading price of our common stock.
We may from time to time be subject to litigation. Some of these claims may result in defense costs, settlements, fines or judgments against us, some of which may not be covered by insurance. Payment of any such costs, settlements, fines or judgments that are not insured could have a material adverse impact on our financial position and results of operations. Negative publicity regarding claims or judgments made against us or involving our hotels may damage our, or our hotels’, reputations. In addition, certain litigation or the resolution of certain litigation may affect the availability or cost of some of our insurance coverage, which could adversely impact our results of operations and cash flows, expose us to increased risks that would be uninsured, and/or adversely impact our ability to attract officers and directors.
Increases in interest rates could increase our debt payments.
As of
December 31, 2017
, we had approximately
$826.2 million
of outstanding indebtedness, including approximately
$818.1 million
of variable interest rate debt, and we expect to incur additional indebtedness, including additional variable-rate debt. Increases in interest rates increase our interest costs on our variable-rate debt as well as any future fixed rate debt we may incur at higher interest rates, and interest we pay reduces our cash available for distributions, expansion, working capital and other uses. Moreover, periods of rising interest rates heighten the risks described immediately below under “We may be unable to make required payments on our debt, and our charter and bylaws do not limit the amount of debt we may incur.”
We may be unable to make required payments on our debt, and our charter and bylaws do not limit the amount of debt we may incur.
Our charter and bylaws do not limit the amount or percentage of indebtedness that we may incur, and we are subject to risks normally associated with debt financing, including the risk that we may not be able to meet our debt service obligations or refinance
49
our debt as it becomes due. We may not be able to refinance any maturing indebtedness, and any such refinancing may not be on terms as favorable as the terms of the maturing indebtedness. In addition, we may not be able to obtain funds by selling assets or raising equity to repay maturing indebtedness.
If we do not meet our debt service obligations, we risk the loss of some or all of our assets to foreclosure. For tax purposes, a foreclosure of any of our properties would be treated as a sale of the property for a purchase price equal to the outstanding balance of the debt secured by the mortgage. If the outstanding balance of the debt secured by the mortgage exceeds our tax basis in the property, we would recognize taxable income on the foreclosure but would not receive any cash proceeds. As a result, we may be required to identify and utilize other sources of cash for distributions to our stockholders of that income.
Our future indebtedness may be cross-collateralized and, consequently, a default on any such indebtedness could cause us to lose part or all of our investment in multiple properties.
Under our advisory agreement, Ashford LLC is entitled to receive a monthly base fee in an amount equal to 1/12th of 0.70% of the sum of (i) the total market capitalization of our company for the prior month, and (ii) the Key Money Gross Asset Value, which is defined in the advisory agreement to include our indebtedness and other factors. This fee increases as the aggregate principal amount of our consolidated indebtedness (including our proportionate share of debt of any entity that is not consolidated but excluding our joint venture partners’ proportionate share of consolidated debt) increases. As a result, any increase in our consolidated indebtedness will also increase the fees we pay to Ashford LLC. The structure of this fee may incentivize Ashford LLC to increase our indebtedness, thereby increasing the fee, when it is not in the best interest of our stockholders to do so.
In addition, changes in economic conditions, our financial condition or operating results or prospects could:
|
•
|
result in higher interest rates on our variable-rate debt,
|
|
•
|
reduce the availability of debt financing generally or debt financing at favorable rates,
|
|
•
|
reduce cash available for distribution to stockholders, or
|
|
•
|
increase the risk that we could be forced to liquidate assets to repay debt.
|
Covenants, “cash trap” provisions or other terms in our mortgage loans and our secured revolving credit facility, as well as any future credit facility, could limit our flexibility and adversely affect our financial condition or our qualification as a REIT.
Some of our loan agreements and our secured revolving credit facility contain financial and other covenants. If we violate covenants in any debt agreements, we could be required to repay all or a portion of our indebtedness before maturity at a time when we might be unable to arrange financing for such repayment on attractive terms, if at all. Violations of certain debt covenants may also prohibit us from borrowing unused amounts under our lines of credit, even if repayment of some or all the borrowings is not required. In addition, financial covenants under our current or future debt obligations could impair our planned business strategies by limiting our ability to borrow beyond certain amounts or for certain purposes.
Some of our loan agreements also contain cash trap provisions that are triggered if the performance of our hotels decline. When these provisions are triggered, substantially all of the profit generated by our hotels is deposited directly into lockbox accounts and then swept into cash management accounts for the benefit of our various lenders. Cash is not distributed to us at any time after the cash trap provisions have been triggered until we have cured performance issues. This could affect our liquidity and our ability to make distributions to our stockholders. If we are not able to make distributions to our stockholders, we may not qualify as a REIT.
Our hedging strategies may not be successful in mitigating our risks associated with interest rates and could reduce the overall returns on an investment in our company.
We use various derivative financial instruments to protect us against interest rate risks. The use of derivative financial instruments to hedge against such risk involves numerous uncertainties, such as the risk that the counterparties fail to honor their obligations under these arrangements, that these arrangements may not be effective in reducing our exposure to interest rate changes and that a court could rule that such agreements are not legally enforceable. These instruments may also generate income that may not be treated as qualifying REIT income. In addition, the nature and timing of hedging transactions may influence the effectiveness of our hedging strategies. Poorly designed strategies or improperly executed transactions could actually increase our risk and losses. Moreover, hedging strategies involve transaction and other costs. Our hedging strategy and the derivatives that we use may not adequately offset the risk of interest rate volatility and our hedging transactions could result in losses that may reduce the overall return on our stockholders’ investment in our company.
50
Risks Related to Conflicts of Interest
Our separation and distribution agreement, our advisory agreement, the mutual exclusivity agreement, the master management agreement and other agreements entered into in connection with the spin-off, as well as the investment management agreement, were not negotiated on an arm’s-length basis, and we may pursue less vigorous enforcement of their terms because of conflicts of interest with certain of our executive officers and directors and key employees of Ashford LLC.
Because our officers and one of our directors are also key employees of Ashford LLC or its affiliates and have ownership interests in Ashford Trust, our separation and distribution agreement, our advisory agreement, mutual exclusivity agreement and other agreements entered into in connection with the spin-off, as well as our investment management agreement, were not negotiated on an arm’s-length basis, and we did not have the benefit of arm’s-length negotiations of the type normally conducted with an unaffiliated third party. Due to the subsequent spin-off of Ashford Inc., the parent company of Ashford LLC in November 2014, these officers and directors also have ownership interests in the parent company of Ashford LLC and its subsidiaries, including AIM. As a result of our affiliations with Ashford Trust, Ashford LLC and Remington Lodging, the terms, including fees and other amounts payable, of agreements between us and Ashford Trust, Ashford LLC, AIM or Remington Lodging may not be as favorable to us as the terms under an arm’s-length agreement. Furthermore, we may choose not to enforce, or to enforce less vigorously, our rights under these agreements because of our desire to maintain our ongoing relationship with Ashford Trust, Ashford LLC, AIM and Remington Lodging.
Ashford LLC may also manage other entities or assets in the future. Our officers and certain of our directors may also be key officers or directors of such future entities or their affiliates and may have ownership interests in such entities. Any such positions or interests could present additional conflicts of interest for our officers and certain of our directors.
Ashford LLC was a subsidiary of Ashford Trust until its spin-off and may be able to direct attractive investment opportunities to Ashford Trust and away from us.
Until its spin-off on November 12, 2014, Ashford LLC was a subsidiary of Ashford Trust, a publicly-traded hotel REIT, with investment objectives that are similar to ours. As of
December 31, 2017
, Ashford Trust holds approximately
28.5%
of the equity of Ashford Inc., Ashford LLC’s parent company, on a fully diluted basis. So long as Ashford LLC is our external advisor, our governing documents require us to include two persons designated by Ashford LLC as candidates for election as director at any stockholder meeting at which directors are to be elected. If the size of our board of directors is increased at any time to more than seven directors, the Ashford LLC’s right to nominate shall be increased by such number of directors as shall be necessary to maintain the ratio of directors nominated by Ashford LLC to the directors otherwise nominated, as nearly as possible (rounding to the next larger whole number), equal to the ratio that would have existed if our board of directors consisted of seven members. Each of our executive officers and two of our directors also serve as key employees and as officers of Ashford LLC and Ashford Trust. Furthermore, Mr. Monty J. Bennett, our previous chief executive officer and current chairman, is also the chairman of Ashford Trust. Our advisory agreement requires Ashford LLC to present investments that satisfy our investment guidelines to us before presenting them to Ashford Trust or any future client of Ashford LLC. Our board may modify or supplement our investment guidelines from time to time so long as we do not change our investment guidelines in such a way as to be directly competitive with all or any portion of Ashford Trust’s investment guidelines as of the date of the advisory agreement. If we materially change our investment guidelines without the express consent of Ashford LLC, then Ashford LLC will not have an obligation to present investment opportunities to us and instead Ashford LLC will use its best judgment to allocate investment opportunities and other entities it advises, taking into account such factors as Ashford LLC deems relevant, in its discretion, subject to any then existing obligations of Ashford LLC to such other entities.
However, some portfolio investment opportunities may include hotels that satisfy our investment objectives as well as hotels that satisfy the investment objectives of Ashford Trust or other entities advised by Ashford LLC. If the portfolio cannot be equitably divided, Ashford LLC will necessarily have to make a determination as to which entity will be presented with the opportunity. In such a circumstance, our advisory agreement requires Ashford LLC to allocate portfolio investment opportunities between us and Ashford Trust or other entities advised by Ashford LLC in a fair and equitable manner, consistent with our, Ashford Trust’s and such other entities’ investment objectives. In making this determination, Ashford LLC, using substantial discretion, is required to consider the investment strategy and guidelines of each entity with respect to acquisition of properties, portfolio concentrations, tax consequences, regulatory restrictions, liquidity requirements, leverage and other factors deemed appropriate. In making the allocation determination, Ashford LLC has no obligation to make any such investment opportunity available to us. Ashford LLC and Ashford Trust have agreed that any new investment opportunities that satisfy our investment guidelines will be presented to our board of directors; however, our board will have only ten business days to make a determination with respect to such opportunity prior to it being available to Ashford Trust. The above mentioned dual responsibilities may create conflicts of interest for our officers that could result in decisions or allocations of investments that may benefit Ashford Trust more than they benefit our company, and Ashford Trust may compete with us with respect to certain investments that we may want to acquire.
51
Ashford LLC and its key employees, who are our executive officers, face competing demands relating to their time and this may adversely affect our operations.
We rely on Ashford LLC, its subsidiaries and its employees for the day-to-day operation of our business and management of our assets. Until its spin-off, Ashford LLC was wholly-owned by Ashford Trust. Ashford LLC is led by our current management team, which is also the current management team of Ashford Trust. Because Ashford LLC’s key employees have duties to Ashford Trust as well as to our company, we do not have their undivided attention and they face conflicts in allocating their time and resources between our company and Ashford Trust. If Ashford LLC advises and/or leads any additional entities, or manages additional assets, in the future, this could present additional conflicts with respect to the allocation of the time and resources of our management team. As a result of the spin-off of Ashford LLC, its employees have additional responsibilities relating to Ashford Inc.'s status as a public company. During turbulent market conditions or other times when we need focused support and assistance from Ashford LLC, other entities for which Ashford LLC also acts as an external advisor or Ashford Trust may likewise require greater focus and attention, placing competing high levels of demand on the limited time and resources of Ashford LLC’s key employees. We may not receive the necessary support and assistance we require or would otherwise receive if we were internally managed by persons working exclusively for us.
Conflicts of interest with Remington Lodging could result in our hotel-level management acting other than in our stockholders’ best interest.
Remington Lodging currently manages the Pier House Resort, the Bardessono Hotel and the Hotel Yountville. We expect Remington Lodging will manage certain of the hotels we acquire in the future. Conflicts of interest in general and specifically relating to Remington Lodging may lead to management decisions that are not in our stockholders’ best interest. The chairman of our board, Mr. Monty J. Bennett, serves as the chief executive officer of Remington Lodging. Mr. Monty J. Bennett and his father, Mr. Archie Bennett, Jr., beneficially own 100% of Remington Lodging.
We have entered into a mutual exclusivity agreement and a master management agreement with Remington Lodging. To the extent we have the right or control the right to direct such matters, the exclusivity agreement requires us to engage Remington Lodging to provide certain project management and development services for our properties and to engage Remington Lodging to provide, under the master management agreement, property management, project management and development services for all future properties that we acquire, unless our independent directors either (i) unanimously vote not to hire Remington Lodging, or (ii) based on special circumstances or past performance, by a majority vote, elect not to engage Remington Lodging because they have determined, in their reasonable business judgment, that it would be in our best interest not to engage Remington Lodging or that another manager or developer could perform the duties materially better. As one of the two beneficial owners of Remington Lodging, which would receive any property management, project management, development and termination fees payable by us under the master management agreement, Mr. Monty J. Bennett may influence our decisions to sell, acquire, or develop hotels when it is not in the best interest of our stockholders to do so.
Mr. Monty J. Bennett’s ownership interests in and management obligations to Remington Lodging present him with conflicts of interest in making management decisions related to the commercial arrangements between us and Remington Lodging, and his management obligations to Remington Lodging reduce the time and effort he spends managing our company. Our board of directors has adopted a policy that requires all material approvals, actions or decisions which we have the right to make under the master management agreement with Remington Lodging be approved by a majority or, in certain circumstances, all, of our independent directors. However, given the authority and/or operational latitude provided to Remington Lodging under the master management agreement, Mr. Monty J. Bennett, as the chief executive officer of Remington Lodging, could take actions or make decisions that are not in our stockholders’ best interest or that are otherwise inconsistent with his obligations to us under the master management agreement or our obligations under the applicable franchise agreements.
Remington Lodging’s ability to exercise significant influence over the determination of the competitive set for any hotels managed by Remington Lodging could artificially enhance the perception of the performance of a hotel, making it more difficult to use managers other than Remington Lodging for future properties.
Under our master management agreement with Remington Lodging, we have the right to terminate Remington Lodging based on the performance of the applicable hotel, subject to the payment of a termination fee. The determination of performance is based on the applicable hotel’s gross operating profit margin and its RevPAR penetration index, which provides the relative revenue per room generated by a specified property as compared to its competitive set. For each hotel managed by Remington Lodging, its competitive set consists of a small group of hotels in the relevant market that we and Remington Lodging believe are comparable for purposes of benchmarking the performance of such hotel. Remington Lodging has significant influence over the determination of the competitive set for any of our hotels that it manages. Remington Lodging could artificially enhance the perception of the performance of a hotel by selecting a competitive set that is not performing well or is not comparable to the Remington Lodging-managed hotel, thereby making it more difficult for us to elect not to use Remington Lodging for future hotel management.
52
Remington Lodging may be able to pursue lodging investment opportunities that compete with us.
Pursuant to the terms of our mutual exclusivity agreement with Remington Lodging, if investment opportunities that satisfy our investment criteria are identified by Remington Lodging or its affiliates, Remington Lodging will give us a written notice and description of the investment opportunity. We will have 10 business days to either accept or reject the investment opportunity. If we reject the opportunity, Remington Lodging may then pursue such investment opportunity, subject to a right of first refusal in favor of Ashford Trust pursuant to an existing agreement between Ashford Trust and Remington Lodging, on materially the same terms and conditions as offered to us. If we reject such an investment opportunity, either Ashford Trust or Remington Lodging could pursue the opportunity and compete with us. In such a case, Mr. Monty J. Bennett, chairman of our board, in his capacity as chairman and chief executive officer of Ashford Trust or as chief executive officer of Remington Lodging could be in a position of directly competing with us, and Remington Lodging may compete with us with respect to certain investments that we may want to acquire.
Our fiduciary duties as the general partner of our operating partnership could create conflicts of interest, which may impede business decisions that could benefit our stockholders.
As the general partner of our operating partnership, we have fiduciary duties to the other limited partners in our operating partnership, the discharge of which may conflict with the interests of our stockholders. The limited partners of our operating partnership have agreed that, in the event of a conflict in the fiduciary duties owed by us to our stockholders and, in our capacity as general partner of our operating partnership, to such limited partners, we are under no obligation to give priority to the interests of such limited partners. In addition, persons holding common units have the right to vote on certain amendments to the operating partnership agreement (which require approval by a majority in interest of the limited partners, including us) and individually to approve certain amendments that would adversely affect their rights. These voting rights may be exercised in a manner that conflicts with the interests of our stockholders. For example, we cannot modify the rights of limited partners to receive distributions as set forth in the operating partnership agreement in a manner that adversely affects their rights without their consent, even though such modification might be in the best interest of our stockholders.
In addition, conflicts may arise when the interests of our stockholders and the limited partners of our operating partnership diverge, particularly in circumstances in which there may be an adverse tax consequence to the limited partners. Tax consequences to holders of common units upon a sale or refinancing of our properties may cause the interests of Ashford Trust or the key employees of Ashford LLC (who are executive officers of Ashford Trust and have ownership interests in Ashford Trust) to differ from our stockholders. As a result of unrealized built-in gain attributable to contributed property at the time of contribution, some holders of common units, including Ashford Trust, may suffer different and more adverse tax consequences than holders of our common stock upon the sale or refinancing of the properties owned by our operating partnership, including disproportionately greater allocations of items of taxable income and gain upon a realization event. As those holders will not receive a correspondingly greater distribution of cash proceeds, they may have different objectives regarding the appropriate pricing, timing and other material terms of any sale or refinancing of certain properties, or whether to sell or refinance such properties at all. As a result, Ashford LLC may cause us to sell, not sell or refinance certain properties, even if such actions or inactions might be financially advantageous to our stockholders, or to enter into tax deferred exchanges with the proceeds of such sales when such a reinvestment might not otherwise be in our best interest.
Our conflicts of interest policy may not adequately address all of the conflicts of interest that may arise with respect to our activities.
We have adopted a conflicts of interest policy to address specifically some of the conflicts relating to our activities which requires the approval of a majority of our disinterested directors to approve any transaction, agreement or relationship in which any of our directors or officers, Ashford LLC or its employees or Ashford Trust has an interest. This policy may not be adequate to address all of the conflicts that may arise. In addition, it may not address such conflicts in a manner that is favorable to us.
The potential for conflicts of interest as a result of our management structure may provoke dissident stockholder activities that result in significant costs.
Other REITs, particularly following periods of volatility in the overall market or declines in the market price of the company’s securities, have been targets of stockholder litigation, stockholder director nominations and stockholder proposals by dissident stockholders that allege conflicts of interest in business dealings with affiliated and related persons and entities. Our relationships with Ashford LLC, Ashford Inc., Ashford Trust, AIM, Remington Lodging, the other businesses and entities to which Ashford LLC, Ashford Inc., AIM and Remington Lodging provide management or other services, Mr. Monty J. Bennett, Mr. Archie Bennett, Jr. and with other related parties of Ashford Inc. and Ashford Trust may precipitate such activities. These activities, if instituted against us, could result in substantial costs and a diversion of our management’s attention even if the action is unfounded.
53
Responding to actions by activist investors can be costly and time-consuming, disrupting our operations and diverting the attention of management and our employees. Stockholder activism could create perceived uncertainties as to our future direction, which could result in the loss of potential business opportunities and make it more difficult for our advisor to attract and retain qualified personnel and business partners. Furthermore, the election of individuals to our board of directors with a specific agenda could adversely affect our ability to effectively and timely implement our strategic plans. See “Risk Factors- Our business could be adversely affected as a result of the proxy contest and related stockholder litigation.”
Risks Related to Hotel Investments
We are subject to general risks associated with operating hotels.
We own hotel properties, which have different economic characteristics than many other real estate assets and a hotel REIT is structured differently than many other types of REITs. A typical office property, for example, has long-term leases with third-party tenants, which provides a relatively stable long-term stream of revenue. Hotels, on the other hand, generate revenue from guests that typically stay at the hotel for only a few nights, which causes the room rate and occupancy levels at each of our hotels to change every day, and results in earnings that can be highly volatile.
In addition, our hotels are subject to various operating risks common to the hotel industry, many of which are beyond our control, including, among others, the following:
|
•
|
competition from other hotel properties in our markets;
|
|
•
|
over-building of hotels in our markets, which results in increased supply and adversely affects occupancy and revenues at our hotels;
|
|
•
|
dependence on business and commercial travelers and tourism;
|
|
•
|
increases in operating costs due to inflation, increased energy costs and other factors that may not be offset by increased room rates;
|
|
•
|
changes in interest rates and in the availability, cost and terms of debt financing;
|
|
•
|
increases in assessed property taxes from changes in valuation or real estate tax rates;
|
|
•
|
increases in the cost of property insurance;
|
|
•
|
changes in governmental laws and regulations, fiscal policies and zoning ordinances and the related costs of compliance;
|
|
•
|
unforeseen events beyond our control, such as terrorist attacks, travel related health concerns which could reduce travel, including pandemics and epidemics such as Ebola, H1N1 influenza (swine flu), avian bird flu, SARS and the Zika virus, imposition of taxes or surcharges by regulatory authorities, travel-related accidents, travel infrastructure interruptions and unusual weather patterns, including natural disasters such as hurricanes, tsunamis or earthquakes;
|
|
•
|
adverse effects of international, national, regional and local economic and market conditions and increases in energy costs or labor costs and other expenses affecting travel, which may affect travel patterns and reduce the number of business and commercial travelers and tourists;
|
|
•
|
adverse effects of a downturn in the lodging industry; and
|
|
•
|
risks generally associated with the ownership of hotel properties and real estate, as we discuss in more detail below.
|
These factors could adversely affect our hotel revenues and expenses, which in turn could adversely affect our financial condition, results of operations, the market price of our common stock and our ability to make distributions to our stockholders.
We may have to make significant capital expenditures to maintain our hotel properties, and any development activities we undertake may be more costly than we anticipate.
Our hotels have an ongoing need for renovations and other capital improvements, including replacements, from time to time, of furniture, fixtures, and equipment. Managers or franchisors of our hotels also require that we make periodic capital improvements pursuant to our management agreements or as a condition of maintaining franchise licenses. Generally, we are responsible for the cost of these capital improvements. As part of our long-term growth strategy, we may also develop hotels. Hotel renovation and development involves substantial risks, including:
|
•
|
construction cost overruns and delays;
|
|
•
|
the disruption of operations and displacement of revenue at operating hotels, including revenue lost while rooms, restaurants or meeting space under renovation are out of service;
|
|
•
|
the cost of funding renovations or developments and inability to obtain financing on attractive terms;
|
|
•
|
the return on our investment in these capital improvements or developments failing to meet expectations;
|
|
•
|
inability to obtain all necessary zoning, land use, building, occupancy, and construction permits;
|
54
|
•
|
loss of substantial investment in a development project if a project is abandoned before completion;
|
|
•
|
environmental problems; and
|
|
•
|
disputes with franchisors or property managers regarding compliance with relevant franchise agreements or management agreements.
|
If we have insufficient cash flow from operations to fund needed capital expenditures, then we will need to borrow, sell assets or sell additional equity securities to fund future capital improvements.
The hotel business is seasonal, which affects our results of operations from quarter to quarter.
The hotel industry is seasonal in nature. This seasonality can cause quarterly fluctuations in our financial condition and operating results, including in the amount available for distributions on our common stock. Our quarterly operating results may be adversely affected by factors outside our control, including weather conditions and poor economic factors in certain markets in which we operate. Our cash flows may not be sufficient to offset any shortfalls that occur as a result of these fluctuations. As a result, we may have to reduce distributions or enter into short-term borrowings in certain quarters in order to make distributions to our stockholders. Such borrowings may not be available on favorable terms, if at all.
The cyclical nature of the lodging industry may cause fluctuations in our operating performance, which could have a material adverse effect on our business and operating results.
The lodging industry historically has been highly cyclical in nature. Fluctuations in lodging demand and, therefore, hotel operating performance, are caused largely by general economic and local market conditions, which subsequently affect levels of business and leisure travel. In addition to general economic conditions, new hotel room supply is an important factor that can affect the lodging industry’s performance, and overbuilding has the potential to further exacerbate the negative impact of an economic recession. Room rates and occupancy, and thus RevPAR, tend to increase when demand growth exceeds supply growth. An adverse change in lodging fundamentals could result in returns that are substantially below our expectations or result in losses, which could have a material adverse effect on our business and operating results.
Many of our real estate-related costs are fixed, and will not decrease even if revenue from our hotels decreases.
Many costs, such as real estate taxes, insurance premiums and maintenance costs, generally are not reduced even when a hotel is not fully occupied, room rates decrease or other circumstances cause a reduction in revenues. In addition, newly acquired or renovated hotels may not produce the revenues we anticipate immediately, or at all, and the hotel’s operating cash flow may be insufficient to pay the operating expenses and debt service associated with these new hotels. If we are unable to offset real estate costs with sufficient revenues across our portfolio, our operating results and our ability to make distributions to our stockholders may be adversely affected.
The increasing use of Internet travel intermediaries by consumers may adversely affect our profitability.
Some of our hotel rooms are booked through Internet travel intermediaries, including, but not limited to, Travelocity.com, Expedia.com and Priceline.com. As Internet bookings increase, these intermediaries may be able to obtain higher commissions, reduced room rates or other significant contract concessions from our management companies. Moreover, some of these Internet travel intermediaries are attempting to offer hotel rooms as a commodity, by increasing the importance of price and general indicators of quality (such as “three-star downtown hotel”) at the expense of brand identification. These intermediaries hope that consumers will eventually develop brand loyalties to their reservations system rather than to the brands under which our properties are franchised. If the amount of sales made through Internet intermediaries increases significantly and results in a decrease in consumer loyalty to the brands under which our hotels are franchised, our rooms revenues may be lower than expected, and our profitability may be adversely affected.
Our revenues and profitability may be adversely affected by increased use of business-related technology, which may reduce the need for business-related travel.
The increased use of teleconference and video-conference technology by businesses could result in decreased business travel as companies increase the use of technologies that allow multiple parties from different locations to participate at meetings without traveling to a centralized meeting location. To the extent that such technologies play an increased role in day-to-day business and the necessity for business-related travel decreases, hotel room demand may decrease and our revenues, profitability and ability to make distributions to our stockholders may be adversely affected.
55
Future terrorist attacks or changes in terror alert levels could materially and adversely affect our business.
Previous terrorist attacks and subsequent terrorist alerts have adversely affected the U.S. travel and hospitality industries since 2001, often disproportionately to the effect on the overall economy. The extent of the impact that actual or threatened terrorist attacks in the U.S. or elsewhere could have on domestic and international travel and our business in particular cannot be determined, but any such attacks or the threat of such attacks could have a material adverse effect on travel and hotel demand, our ability to finance our business and our ability to insure our hotels. Any of these events could materially and adversely affect our business, our operating results and our prospects.
We are subject to risks associated with the employment of hotel personnel, particularly with respect to hotels that employ unionized labor.
Our third-party managers are responsible for hiring and maintaining the labor force at each of our hotels. Although we do not directly employ or manage employees at our hotels, we still are subject to many of the costs and risks generally associated with the hotel labor force, particularly with respect to hotels with unionized labor. From time to time, hotel operations may be disrupted as a result of strikes, lockouts, public demonstrations or other negative actions and publicity. We also may incur increased legal costs and indirect labor costs as a result of contract disputes or other events. The resolution of labor disputes or re-negotiated labor contracts could lead to increased labor costs, either by increases in wages or benefits or by changes in work rules that raise hotel operating costs. We do not have the ability to affect the outcome of these disputes.
Risks Related to the Real Estate Industry
Illiquidity of real estate investments could significantly impede our ability to respond to adverse changes in the performance of our hotel properties and harm our financial condition.
Because real estate investments are relatively illiquid, our ability to sell promptly one or more hotel properties for reasonable prices in response to changing economic, financial, and investment conditions is limited.
The real estate market is affected by many factors that are beyond our control, including:
|
•
|
adverse changes in international, national, regional and local economic and market conditions;
|
|
•
|
changes in interest rates and in the availability, cost, and terms of debt financing;
|
|
•
|
changes in governmental laws and regulations, fiscal policies, and zoning and other ordinances, and the related costs of compliance with laws and regulations, fiscal policies and zoning and other ordinances;
|
|
•
|
the ongoing need for capital improvements, particularly in older structures;
|
|
•
|
changes in operating expenses; and
|
|
•
|
civil unrest, acts of war or terrorism, and acts of God, including earthquakes, floods and other natural disasters, which may result in uninsured and underinsured losses.
|
We may decide to sell hotel properties in the future. We cannot predict whether we will be able to sell any hotel property for the price or on the terms set by us, or whether any price or other terms offered by a prospective purchaser would be acceptable to us. We also cannot predict the length of time needed to find a willing purchaser and to close the sale of a hotel property.
We may be required to expend funds to correct defects or to make improvements before a property can be sold. We may not have funds available to correct those defects or to make those improvements. In addition, when we acquire a hotel property, we may agree to lock-out provisions that materially restrict us from selling that property for a period of time or impose other restrictions, such as a limitation on the amount of debt that can be placed or repaid on that property. These and other factors could impede our ability to respond to adverse changes in the performance of our hotel properties or a need for liquidity.
Increases in property taxes would increase our operating costs, reduce our income and adversely affect our ability to make distributions to our stockholders.
Each of our hotel properties is subject to real and personal property taxes. These taxes may increase as tax rates change and as the properties are assessed or reassessed by taxing authorities. If property taxes increase, our financial condition, results of operations and our ability to make distributions to our stockholders could be materially and adversely affected and the market price of our common stock could decline.
The costs of compliance with or liabilities under environmental laws may harm our operating results.
Operating expenses at our hotels could be higher than anticipated due to the cost of complying with existing or future environmental laws and regulations. In addition, our hotel properties may be subject to environmental liabilities. An owner or
56
operator of real property can face liability for environmental contamination created by the presence or discharge of hazardous substances on the property. We may face liability regardless of:
|
•
|
our knowledge of the contamination;
|
|
•
|
the timing of the contamination;
|
|
•
|
the cause of the contamination; or
|
|
•
|
the party responsible for the contamination.
|
There may be environmental problems associated with our hotel properties of which we are unaware. Some of our hotel properties use, or may have used in the past, underground tanks for the storage of petroleum-based or waste products that could create a potential for release of hazardous substances. If environmental contamination exists on a hotel property, we could become subject to strict, joint and several liabilities for the contamination if we own the property.
The discovery of material environmental liabilities at our properties could subject us to unanticipated significant costs. The presence of hazardous substances on a property may adversely affect our ability to sell the property on favorable terms or at all, and we may incur substantial remediation costs.
Our environmental insurance policies may not provide sufficient coverage for any environmental liabilities at our properties. In addition, if environmental liabilities are discovered during the underwriting of the insurance policies for any property that we acquire in the future, we may be unable to obtain insurance coverage for the liabilities at commercially reasonable rates or at all. We may experience losses as a result of any of these events.
Numerous treaties, laws and regulations have been enacted to regulate or limit carbon emissions. Changes in the regulations and legislation relating to climate change, and complying with such laws and regulations, may require us to make significant investments in our hotels and could result in increased energy costs at our properties.
Our properties may contain or develop harmful mold, which could lead to liability for adverse health effects and costs of remediating the problem.
When excessive moisture accumulates in buildings or on building materials, mold growth may occur, particularly if the moisture problem remains undiscovered or is not addressed over a period of time. Some molds may produce airborne toxins or irritants. Concern about indoor exposure to mold has been increasing as exposure to mold may cause a variety of adverse health effects and symptoms, including allergic or other reactions. Some of the properties in our portfolio may contain microbial matter such as mold and mildew. As a result, the presence of significant mold at any of our properties could require us to undertake a costly remediation program to contain or remove the mold from the affected property. In addition, the presence of significant mold could expose us to liability from hotel guests, hotel employees, and others if property damage or health concerns arise.
Compliance with the Americans with Disabilities Act and fire, safety, and other regulations may require us to incur substantial costs.
All of our properties are required to comply with the Americans with Disabilities Act of 1990, as amended (the “ADA”). The ADA requires that “public accommodations,” such as hotels, be made accessible to people with disabilities. Compliance with the ADA’s requirements could require removal of access barriers and non-compliance could result in imposition of fines by the U.S. government or an award of damages to private litigants, or both. In addition, we are required to operate our properties in compliance with fire and safety regulations, building codes, and other land use regulations as they may be adopted by governmental agencies and bodies and become applicable to our properties. Any requirement to make substantial modifications to our hotel properties, whether to comply with the ADA or other changes in governmental rules and regulations, could be costly.
We may experience uninsured or underinsured losses.
We maintain property and casualty insurance with respect to our hotel properties and other insurance, in each case, with loss limits and coverage thresholds deemed reasonable by our management team (and to satisfy the requirements of lenders and franchisors). In doing so, we make decisions with respect to what deductibles, policy limits, and terms are reasonable based on management’s experience, our risk profile, the loss history of our property managers and our properties, the nature of our properties and our businesses, our loss prevention efforts, and the cost of insurance.
Various types of catastrophic losses may not be insurable or may not be economically insurable. In the event of a substantial loss, our insurance coverage may not cover the full current market value or replacement cost of our lost investment. Inflation, changes in building codes and ordinances, environmental considerations, and other factors might cause insurance proceeds to be insufficient to fully replace or renovate a hotel after it has been damaged or destroyed. Accordingly, it is possible that:
57
|
•
|
the insurance coverage thresholds that we have obtained may not fully protect us against insurable losses (i.e., losses may exceed coverage limits);
|
|
•
|
we may incur large deductibles that adversely affect our earnings;
|
|
•
|
we may incur losses from risks that are not insurable or that are not economically insurable; and
|
|
•
|
current coverage thresholds may not continue to be available at reasonable rates.
|
In the future, we may choose not to maintain terrorism insurance on any of our properties. As a result, one or more large uninsured or underinsured losses could have a material adverse effect on our business, operating results and financial condition.
Each of our current lenders requires us to maintain certain insurance coverage thresholds. If a lender does not believe we have complied with these requirements, the lender could obtain additional coverage thresholds and seek payment from us, or declare us in default under the loan documents. In the former case, we could spend more for insurance than we otherwise deem reasonable or necessary or, in the latter case, the hotels collateralizing one or more loans could be foreclosed upon. In addition, a material casualty to one or more hotels collateralizing loans may result in the insurance company applying to the outstanding loan balance insurance proceeds that otherwise would be available to repair the damage caused by the casualty, which would require us to fund the repairs through other sources. The lender may also foreclose on the hotels if there is a material loss that is not insured.
Risks Related to Derivative Transactions
We are subject to the risk of default or insolvency by the hospitality entities underlying our investments.
The leveraged capital structure of the hospitality entities underlying our investments will increase their exposure to adverse economic factors (such as rising interest rates, competitive pressures, downturns in the economy or deterioration in the condition of the real estate industry) and to the risk of unforeseen events. If an underlying entity cannot generate adequate cash flow to meet such entity’s debt obligations (which may include leveraged obligations in excess of its aggregate assets), it may default on its loan agreements or be forced into bankruptcy. As a result, we may suffer a partial or total loss of the capital we have invested in the securities and other investments of such entity.
Risks Related to Investments in Securities
Our earnings are dependent, in part, upon the performance of our investment portfolio.
To the extent permitted by the Internal Revenue Code, we may invest in and own securities of other public companies and REITs (including Ashford Inc.). To the extent that the value of those investments declines or those investments do not provide an attractive return, our earnings and cash flow could be adversely affected.
Our prior investment performance is not indicative of future results.
The performance of our prior investments is not necessarily indicative of the results that can be expected for the investments to be made by our investment subsidiary. On any given investment, total loss of the investment is possible. Although our management team has experience and has had success in making investments in real estate-related lodging debt and hotel assets, the past performance of these investments is not necessarily indicative of the results of our future investments.
Our investment portfolio will contain investments concentrated in a single industry and will not be fully diversified.
Currently, our only investment is in Ashford Inc. and to the extent we seek other investments, we would expect that they will be in lodging-related entities. As such, our investment portfolio will contain investments concentrated in a single industry and may not be fully diversified by asset class, geographic region or other criteria, which will expose us to significant loss due to concentration risk. Investors have no assurance that the degree of diversification in our investment portfolio will increase at any time in the future.
Risks Related to Our Organization and Structure
Our charter contains provisions that may delay or prevent a change of control transaction.
Our charter contains 9.8% ownership limits. For the purpose of preserving our REIT qualification, our charter prohibits direct or constructive ownership by any person of more than:
|
•
|
9.8% of the lesser of the total number or value of the outstanding shares of our common stock, or
|
|
•
|
9.8% of the lesser of the total number or value of the outstanding shares of any class or series of our preferred stock or any other stock of our company, unless our board of directors grants a waiver.
|
58
Our charter’s constructive ownership rules are complex and may cause stock owned actually or constructively by a group of related individuals and/or entities to be deemed to be constructively owned by one individual or entity. As a result, the acquisition of less than 9.8% of our common stock by an individual or entity could nevertheless cause that individual or entity to own constructively in excess of 9.8% of the outstanding common stock, and thus be subject to our charter’s ownership limit. Any attempt to own or transfer shares of our common stock in excess of the ownership limit without the consent of our board of directors will be void, and could result in the shares being automatically transferred to a charitable trust.
Our board of directors may create and issue a class or series of preferred stock without stockholder approval.
Our charter authorizes our board of directors to issue preferred stock in one or more classes and to establish the preferences and rights of any class of preferred stock issued. Subject to the terms of any outstanding classes or series of preferred stock, these actions can be taken without obtaining stockholder approval. Our preferred stock issuances could have the effect of delaying or preventing someone from taking control of us, even if our stockholders believe that a change in control was in their best interests.
Certain provisions in the partnership agreement for our operating partnership may delay or prevent unsolicited acquisitions of us.
Provisions in the partnership agreement of our operating partnership may delay or make more difficult unsolicited acquisitions of us or changes in our control. These provisions could discourage third parties from making proposals involving an unsolicited acquisition of us or change of our control, although some stockholders might consider such proposals, if made, desirable. These provisions include, among others:
|
•
|
redemption rights of qualifying parties;
|
|
•
|
transfer restrictions on our common units;
|
|
•
|
the ability of the general partner in some cases to amend the partnership agreement without the consent of the limited partners; and
|
|
•
|
the right of the limited partners to consent to transfers of the general partnership interest and mergers of the operating partnership under specified circumstances.
|
Certain provisions of Maryland law could inhibit changes in control.
Certain provisions of the Maryland General Corporation Law (the “MGCL”) may have the effect of inhibiting a third party from making a proposal to acquire us or impeding a change of control under circumstances that otherwise could provide our stockholders with the opportunity to realize a premium over the then-prevailing market price of our common stock, including:
|
•
|
“business combination” provisions that, subject to limitations, prohibit certain business combinations between us and an “interested stockholder” (defined generally as any person who beneficially owns 10% or more of the voting power of our shares or an affiliate thereof) for five years after the most recent date on which the stockholder becomes an interested stockholder, and thereafter impose special stockholder voting requirements on these business combinations, unless certain fair price requirements set forth in the MGCL are satisfied; and
|
|
•
|
“control share” provisions that provide that “control shares” of our company (defined as shares which, when aggregated with other shares controlled by the stockholder, entitle the stockholder to exercise one of three increasing ranges of voting power in electing directors) acquired in a “control share acquisition” (defined as the direct or indirect acquisition of ownership or control of outstanding “control shares”) have no voting rights except to the extent approved by our stockholders by the affirmative vote of at least two-thirds of all the votes entitled to be cast on the matter, excluding all interested shares.
|
Our charter opts out of each of these requirements, but we may later amend our charter, with stockholder approval, to modify or eliminate these opt-out provisions.
Our charter provides that a director may be removed only for cause and only upon the affirmative vote of a majority of the votes entitled to be cast in the election of directors. Our charter defines cause to mean, with respect to any particular director, conviction of a felony or a final judgment of court of competent jurisdiction holding that such director caused demonstrable, material harm to us through bad faith or active deliberate dishonesty. Subtitle 8 of Title 3 of the MGCL permits a Maryland corporation with a class of equity securities registered under the Exchange Act and at least three independent directors to elect to be subject, notwithstanding any contrary provision in the charter or bylaws, to any or all of the following five provisions: a classified board; a two-thirds stockholder vote requirement for removal of a director; a requirement that the number of directors be fixed only by vote of the directors; a requirement that a vacancy on the board of directors be filled only by the remaining directors and for the remainder of the full term of the class of directors in which the vacancy occurred; and a requirement that the holders of at least a majority of all votes entitled to be cast request a special meeting of stockholders. Through provisions in our charter and bylaws unrelated to Subtitle 8, we already require that the number of directors be fixed only by our board of directors and require,
59
unless called by the Chairman of our board of directors, our president or chief executive officer or a majority of our board of directors, the written request of stockholders entitled to cast not less than a majority of all votes entitled to be cast at such meeting to call a special meeting. Our board of directors has made an election that prohibits us from making any of the elections permitted by Subtitle 8 unless such election is first approved by a stockholder vote.
Our charter, bylaws, the partnership agreement for our operating partnership and Maryland law contain other provisions that may delay, deter or prevent a transaction or a change of control that might involve a premium price for our common stock or otherwise be in the best interest of our stockholders.
Our board of directors can take many actions without stockholder approval.
Our board of directors has overall authority to oversee our business and affairs and determine our major corporate policies. This authority includes significant flexibility. For example, our board of directors can do the following without stockholder approval:
|
•
|
terminate Ashford LLC under certain conditions pursuant to our advisory agreement;
|
|
•
|
amend or revise at any time and from time to time our investment, financing, borrowing and dividend policies and our policies with respect to all other activities, including growth, debt, capitalization and operations;
|
|
•
|
amend our policies with respect to conflicts of interest provided that such changes are consistent with applicable legal requirements;
|
|
•
|
subject to the terms of our charter, prevent the ownership, transfer and/or accumulation of shares in order to protect our status as a REIT or for any other reason deemed to be in the best interests of us and our stockholders;
|
|
•
|
subject to the terms of any outstanding classes or series of preferred stock, issue additional shares without obtaining stockholder approval, which could dilute the ownership of our then-current stockholders;
|
|
•
|
subject to the terms of any outstanding classes or series of preferred stock, amend our charter to increase or decrease the aggregate number of shares of stock or the number of shares of stock of any class or series, without obtaining stockholder approval;
|
|
•
|
subject to the terms of any outstanding classes or series of preferred stock, classify or reclassify any unissued shares of our common stock or preferred stock and set the preferences, rights and other terms of such classified or reclassified shares, including provisions that may have an anti-takeover effect, without obtaining stockholder approval;
|
|
•
|
employ and compensate affiliates;
|
|
•
|
direct our resources toward investments that do not ultimately appreciate over time; and
|
|
•
|
determine that it is no longer in our best interests to attempt to qualify, or to continue to qualify, as a REIT.
|
Any of these actions could increase our operating expenses, impact our ability to make distributions or reduce the value of our assets without giving our stockholders the right to vote on whether we should take such actions.
Our rights and the rights of our stockholders to take action against our directors and officers are limited.
Maryland law provides that a director or officer has no liability in that capacity if he or she performs his or her duties in good faith, in a manner he or she reasonably believes to be in our best interests and with the care that an ordinarily prudent person in a like position would use under similar circumstances. In addition, our charter eliminates our directors’ and officers’ liability to us and our stockholders for money damages except for liability resulting from actual receipt of an improper benefit or profit in money, property or services or a judgment of active and deliberate dishonesty that was material to the cause of action. Our charter requires us to indemnify our directors and officers to the maximum extent permitted by Maryland law for liability actually incurred in connection with any proceeding to which they may be made, or threatened to be made, a party, except to the extent that the act or omission of the director or officer was material to the matter giving rise to the proceeding and was either committed in bad faith or was the result of active and deliberate dishonesty, the director or officer actually received an improper personal benefit in money, property or services, or, in the case of any criminal proceeding, the director or officer had reasonable cause to believe that the act or omission was unlawful. As a result, we and our stockholders may have more limited rights against our directors and officers than might otherwise exist under common law. In addition, we may be obligated to advance the defense costs incurred by our directors and officers, prior to any determination regarding the availability of indemnification if actions are taken against them in their capacity as directors and officers.
Future issuances of securities, including our common stock and preferred stock, could reduce existing investors’ relative voting power and percentage of ownership and may dilute our share value.
Our charter authorizes the issuance of up to 200,000,000 shares of common stock and 50,000,000 shares of preferred stock. As of
March 12, 2018
, we had
32,120,210
shares of our common stock issued and outstanding and
4,965,850
shares of our 5.50%
60
Series B Cumulative Convertible Preferred Stock (the “Series B Preferred Stock”) outstanding. No shares of our Series C Preferred Stock (the “Series C Preferred Stock”) were outstanding as of
March 12, 2018
. Accordingly, we may issue up to an additional
167,879,790
shares of common stock and
45,034,150
shares of preferred stock, including up to 4,750,000 shares of our Series C Preferred Stock.
Each limited partner of Ashford Prime OP and each person that becomes a limited partner of Ashford Prime OP has the right to purchase at any time one share of Series C Preferred Stock for each share of common stock of the Company that the Partnership Units (as defined herein) held by such limited partner may be converted into. Limited partners of Ashford Prime OP that elect to purchase shares of Series C Preferred Stock are required to pay the applicable subscription price of $0.01 per share of Series C Preferred Stock and deliver to the Company an executed subscription agreement in the form provided by the Company. Ashford Prime OP limited partners collectively hold Partnership Units representing approximately
13.0%
of Ashford Prime’s outstanding common stock on a fully-diluted, as-converted basis.
Future issuances of common stock or preferred stock, including our Series C Preferred Stock, could decrease the relative voting power of our common stock or preferred stock and may cause substantial dilution in the ownership percentage of our then existing holders of common or preferred stock. We may value any common stock or preferred stock issued in the future on an arbitrary basis including for services or acquisitions or other corporate actions that may have the effect of reducing investors' relative voting power and/or diluting the net tangible book value of the shares held by our stockholders, and might have an adverse effect on any trading market for our securities. Our board of directors may designate the rights, terms and preferences of our authorized but unissued preferred shares at its discretion, including conversion and voting preferences without notice to our stockholders. See “Item 7. Management’s Discussion and Analysis of Financial Condition and Results of Operations-Recent Developments-Second Amended and Restated Partnership Agreement” and note 15 to our consolidated financial statements as of
December 31, 2017
.
Risks Related to Our Status as a REIT
Failure to qualify as a REIT, or failure to remain qualified as a REIT, would cause us to be taxed as a regular corporation, which would substantially reduce funds available for distributions to our stockholders.
We operate in a manner intended to allow us to qualify as a REIT for U.S. federal income tax purposes. We believe that our organization and current and proposed method of operation will enable us to meet the requirements for qualification and taxation as a REIT commencing with our taxable year ended December 31, 2013. However, we may not qualify or remain qualified as a REIT.
If we fail to qualify as a REIT in any taxable year, we will face serious tax consequences that will substantially reduce the funds available for distributions to our stockholders because:
|
•
|
we would not be allowed a deduction for dividends paid to stockholders in computing our taxable income and would be subject to U.S. federal income tax at regular corporate rates;
|
|
•
|
we could be subject to the federal alternative minimum tax for the taxable years beginning before January 1, 2018, and possibly increased state and local income taxes; and
|
|
•
|
unless we are entitled to relief under certain U.S. federal income tax laws, we could not re-elect REIT status until the fifth calendar year after the year in which we failed to qualify as a REIT.
|
In addition, if we fail to qualify as a REIT, we will no longer be required to make distributions. As a result of all these factors, our failure to qualify as a REIT could impair our ability to expand our business and raise capital, make distributions to our stockholders and it would adversely affect the value of our securities.
If Ashford Trust failed to qualify as a REIT in any of its 2009 through 2013 taxable years, we would be prevented from electing to qualify as a REIT under applicable Treasury Regulations until the fifth year after such failure.
Under applicable Treasury Regulations, if Ashford Trust failed to qualify as a REIT in any of its 2009 through 2013 taxable years, unless Ashford Trust’s failure to qualify as a REIT was subject to relief under U.S. federal income tax laws, we would be prevented from electing to qualify as a REIT prior to the fifth calendar year following the year in which Ashford Trust failed to qualify.
Even if we qualify and remain qualified as a REIT, we may face other tax liabilities that reduce our cash flow.
Even if we qualify and remain qualified for taxation as a REIT, we may be subject to certain federal, state, and local taxes on our income and assets, as well as foreign taxes to the extent that we own assets or conduct operations in international jurisdictions. For example:
61
|
•
|
We will be required to pay tax on undistributed REIT taxable income.
|
|
•
|
If we have net income from the disposition of foreclosure property held primarily for sale to customers in the ordinary course of business or other non-qualifying income from foreclosure property, we must pay tax on that income at the highest corporate rate.
|
|
•
|
If we sell a property in a “prohibited transaction,” our gain from the sale would be subject to a 100% penalty tax.
|
|
•
|
Each of our taxable REIT subsidiaries is a fully taxable corporation and will be subject to federal and state taxes on its income.
|
|
•
|
We may experience increases in our state and local income tax burden. Over the past several years, certain state and local taxing authorities have significantly changed their income tax regimes in order to raise revenues. The changes enacted include the taxation of modified gross receipts (as opposed to net taxable income), the suspension of and/or limitation on the use of net operating loss deductions, increases in tax rates and fees, the addition of surcharges, and the taxation of our partnership income at the entity level. Facing mounting budget deficits, more state and local taxing authorities have indicated that they are going to revise their income tax regimes in this fashion and/or eliminate certain federally allowed tax deductions such as the REIT dividends paid deduction.
|
Failure to make required distributions would subject us to U.S. federal corporate income tax.
We intend to operate in a manner so as to qualify as a REIT for U.S. federal income tax purposes. In order to qualify as a REIT, we generally are required to distribute at least 90% of our REIT taxable income, determined without regard to the dividends paid deduction and excluding any net capital gain, each year to our stockholders. To the extent that we satisfy this distribution requirement, but distribute less than 100% of our REIT taxable income, we will be subject to U.S. federal corporate income tax on our undistributed taxable income. In addition, we will be subject to a 4% nondeductible excise tax if the actual amount that we pay out to our stockholders in a calendar year is less than a minimum amount specified under the Internal Revenue Code.
Our TRS structure increases our overall tax liability.
Our TRSs are subject to federal, state and local income tax on their taxable income, which consists of the revenues from the hotel properties leased by our TRS lessees, or, in the case of the Ritz Carlton St. Thomas hotel, owned by our TRS, net of the operating expenses for such hotel properties and, in the case of hotel properties leased by our TRS lessees, rent payments to us. Accordingly, although our ownership of our TRS allows us to participate in the operating income from our hotel properties in addition to receiving rent, the net operating income is fully subject to income tax. The after-tax net income of our TRS is available for distribution to us, subject to any applicable withholding requirements.
If our leases with our TRS lessees are not respected as true leases for federal income tax purposes, we would fail to qualify as a REIT.
To qualify as a REIT, we are required to satisfy two gross income tests, pursuant to which specified percentages of our gross income must be passive income, such as rent. For the rent paid pursuant to the hotel leases with our TRS lessees, which constitutes substantially all of our gross income, to qualify for purposes of the gross income tests, the leases must be respected as true leases for federal income tax purposes and must not be treated as service contracts, joint ventures or some other type of arrangement. We have structured our leases, and intend to structure any future leases, so that the leases will be respected as true leases for federal income tax purposes, but the IRS may not agree with this characterization. If the leases were not respected as true leases for federal income tax purposes, we would not be able to satisfy either of the two gross income tests applicable to REITs and likely would fail to qualify as a REIT.
Our ownership of TRSs is limited and our transactions with our TRSs will cause us to be subject to a 100% penalty tax on certain income or deductions if those transactions are not conducted on arm’s-length terms.
A REIT may own up to 100% of the stock of one or more TRSs. A TRS may hold assets and earn income that would not be qualifying assets or income if held or earned directly by a REIT, including gross operating income from hotels that are operated by eligible independent contractors pursuant to hotel management agreements. Both the subsidiary and the REIT must jointly elect to treat the subsidiary as a TRS. A corporation of which a TRS directly or indirectly owns more than 35% of the voting power or value of the stock will automatically be treated as a TRS. Overall, no more than 25% (20% with respect to taxable years beginning after December 31, 2017) of the value of a REIT’s assets may consist of stock or securities of one or more TRSs. In addition, the TRS rules limit the deductibility of interest paid or accrued by a TRS to its parent REIT to assure that the TRS is subject to an appropriate level of corporate taxation. The rules also impose a 100% excise tax on certain transactions between a TRS and its parent REIT that are not conducted on an arm’s-length basis. Finally, for taxable years ending after December 31, 2015, the 100% excise tax also applies to the underpricing of services by a TRS to its parent REIT in contexts where the services are unrelated to services for REIT tenants.
62
Our TRSs are subject to federal, foreign, state and local income tax on their taxable income, and their after-tax net income is available for distribution to us but is not required to be distributed to us. We believe that the aggregate value of the stock and securities of our TRSs is less than 20% of the value of our total assets (including our TRS stock and securities).
We monitor the value of our respective investments in our TRSs for the purpose of ensuring compliance with TRS ownership limitations. In addition, we scrutinize all of our transactions with our TRSs to ensure that they are entered into on arm’s-length terms to avoid incurring the 100% excise tax described above. For example, in determining the amounts payable by our TRSs under our leases, we engaged a third party to prepare transfer pricing studies to ascertain whether the lease terms we established are on an arm’s-length basis as required by applicable Treasury Regulations. However, the receipt of a transfer pricing study does not prevent the IRS from challenging the arm’s length nature of the lease terms between a REIT and its TRS lessees. Consequently, we may not be able to avoid application of the 100% excise tax discussed above. Moreover, the IRS may impose excise taxes and penalties based on transactions that occurred prior to the spin-off.
If our hotel managers do not qualify as “eligible independent contractors,” we would fail to qualify as a REIT.
Rent paid by a lessee that is a “related party tenant” of ours will not be qualifying income for purposes of the two gross income tests applicable to REITs. We lease all of our hotels to our TRS lessees, except for the Ritz-Carlton St. Thomas hotel, which is owned by one of our TRSs. A TRS lessee will not be treated as a “related party tenant,” and will not be treated as directly operating a lodging facility, which is prohibited, to the extent the TRS lessee leases properties from us that are managed by an “eligible independent contractor.”
We believe that the rent paid by our TRS lessees is qualifying income for purposes of the REIT gross income tests and that our TRSs qualify to be treated as taxable REIT subsidiaries for U.S. federal income tax purposes, but the IRS could challenge this treatment and a court could sustain such a challenge. If the IRS were successful in challenging this treatment, it is possible that we would fail to meet the asset tests applicable to REITs and substantially all of our income would fail to qualify for the gross income tests. If we failed to meet either the asset or gross income tests, we would likely lose our REIT qualification for federal income tax purposes, unless certain relief provisions applied. If our hotel managers do not qualify as “eligible independent contractors,” we would fail to qualify as a REIT. Each of the hotel management companies that enters into a management contract with our TRS lessees must qualify as an “eligible independent contractor” under the REIT rules in order for the rent paid to us by our TRS lessees to be qualifying income for our REIT income test requirements. Among other requirements, in order to qualify as an eligible independent contractor a manager must not own more than 35% of our outstanding shares (by value) and no person or group of persons can own more than 35% of our outstanding shares and the ownership interests of the manager, taking into account only owners of more than 5% of our shares and, with respect to ownership interests in such managers that are publicly-traded, only holders of more than 5% of such ownership interests. Complex ownership attribution rules apply for purposes of these 35% thresholds. Although we intend to monitor ownership of our shares by our property managers and their owners, it is possible that these ownership levels could be exceeded.
Complying with REIT requirements may cause us to forego otherwise attractive opportunities.
To qualify as a REIT for federal income tax purposes, we must continually satisfy tests concerning, among other things, the sources of our income, the nature and diversification of our assets, the amounts we distribute to our stockholders and the ownership of our shares of beneficial interest. In order to meet these tests, we may be required to forego investments we might otherwise make. Thus, compliance with the REIT requirements may have a material adverse effect on our performance.
Complying with REIT requirements may force us to liquidate otherwise attractive investments.
To qualify as a REIT, we must also ensure that at the end of each calendar quarter at least 75% of the value of our assets consists of cash, cash items, government securities, and qualified REIT real estate assets. The remainder of our investment in securities (other than government securities and qualified real estate assets) generally cannot include more than 10% of the outstanding voting securities of any one issuer or more than 10% of the total value of the outstanding securities of any one issuer. In addition, in general, no more than 5% of the value of our assets (other than government securities and qualified real estate assets) can consist of the securities of any one issuer, no more than 25% (20% with respect to taxable years beginning after December 31, 2017) of the value of our total assets can be represented by securities of one or more taxable REIT subsidiaries and, beginning after December 31, 2015, no more than 25% of the value of our total assets can be represented by certain publicly offered REIT debt instruments.
If we fail to comply with these requirements at the end of any calendar quarter, we must correct such failure within 30 days after the end of the calendar quarter to avoid losing our REIT status and suffering adverse tax consequences. As a result, we may be required to liquidate otherwise attractive investments.
63
Complying with REIT requirements may force us to borrow to make distributions to stockholders.
As a REIT, we must distribute at least 90% of our annual REIT taxable income, excluding net capital gains, (subject to certain adjustments) to our stockholders. To the extent that we satisfy the distribution requirement, but distribute less than 100% of our taxable income, we will be subject to federal corporate income tax on our undistributed taxable income. In addition, we will be subject to a 4% nondeductible excise tax if the actual amount that we pay out to our stockholders in a calendar year is less than a minimum amount specified under federal tax laws.
From time to time, we may generate taxable income greater than our net income for financial reporting purposes or our taxable income may be greater than our cash flow available for distribution to stockholders. If we do not have other funds available in these situations, we could be required to borrow funds, sell investments at disadvantageous prices, or find another alternative source of funds to make distributions sufficient to enable us to pay out enough of our taxable income to satisfy the distribution requirement and to avoid corporate income tax and the 4% excise tax in a particular year. These alternatives could increase our costs or reduce the value of our equity.
We may elect to pay dividends on our common stock in cash or a combination of cash and shares of securities as permitted under U.S. federal income tax laws governing REIT distribution requirements. To the extent that we make distributions in excess of our current and accumulated earnings and profits (as determined for federal income tax purposes), such distributions would generally be considered a return of capital for U.S. federal income tax purposes to the extent of the holder's adjusted tax basis in its shares. A return of capital is not taxable, but it has the effect of reducing the holder's adjusted tax basis in its investment. To the extent that distributions exceed the adjusted tax basis of a holder's shares, they will be treated as gain from the sale or exchange of such stock.
We may pay taxable dividends in our common stock and cash, in which case stockholders may sell our common stock to pay tax on such dividends, placing downward pressure on the market price of our common stock.
We may distribute taxable dividends that are payable in cash and common stock at the election of each stockholder subject to certain limitations, including that the cash portion be at least 20% of the total distribution.
If we make a taxable dividend payable in cash and common stock, taxable stockholders receiving such dividends will be required to include the full amount of the dividend as ordinary income to the extent of our current and accumulated earnings and profits, as determined for U.S. federal income tax purposes. As a result, stockholders may be required to pay income tax with respect to such dividends in excess of the cash dividends received. If a U.S. stockholder sells the common stock that it receives as a dividend in order to pay this tax, the sales proceeds may be less than the amount included in income with respect to the dividend, depending on the market price of our common stock at the time of the sale. Furthermore, with respect to certain non-U.S. stockholders, we may be required to withhold U.S. federal income tax with respect to such dividends, including in respect of all or a portion of such dividend that is payable in common stock. If we made a taxable dividend payable in cash and our common stock and a significant number of our stockholders determine to sell shares of our common stock in order to pay taxes owed on dividends, it may put downward pressure on the trading price of our common stock. We do not currently intend to pay taxable dividends of our common stock and cash, although we may choose to do so in the future.
The prohibited transactions tax may limit our ability to dispose of our properties.
A REIT’s net income from prohibited transactions is subject to a 100% tax. In general, prohibited transactions are sales or other dispositions of property, other than foreclosure property, held primarily for sale to customers in the ordinary course of business. We may be subject to the prohibited transaction tax equal to 100% of net gain upon a disposition of real property. We may not be able to comply with the safe harbor to the characterization of the sale of real property by a REIT as a prohibited transaction. Consequently, we may choose not to engage in certain sales of our properties or we may conduct such sales through our TRS, which would be subject to federal and state income taxation.
The ability of our board of directors to revoke our REIT qualification without stockholder approval may cause adverse consequences to our stockholders.
Our charter provides that our board of directors may revoke or otherwise terminate our REIT election, without the approval of our stockholders, if it determines that it is no longer in our best interest to continue to qualify as a REIT. If we cease to qualify as a REIT, we would become subject to U.S. federal and state and local income taxes on our taxable income and would no longer be required to distribute most of our taxable income to our stockholders, which may have adverse consequences on the total return received by our stockholders.
64
Dividends payable by REITs do not qualify for the reduced tax rates available for some dividends.
The maximum federal income tax rate applicable to “qualified dividend income” payable to U.S. stockholders that are taxed at individual rates is 20%. Dividends payable by REITs, however, generally are not eligible for this reduced maximum rate on qualified dividend income. However, under the Tax Cuts and Jobs Act a non-corporate taxpayer may deduct 20% of ordinary REIT dividends that are not “capital gain dividends” or “qualified dividend income” resulting in an effective maximum federal income tax rate of 29.6%. Individuals, trusts and estates whose income exceeds certain thresholds are also subject to a 3.8% Medicare tax on dividends received from us. The more favorable rates applicable to regular corporate qualified dividends could cause investors who are taxed at individual rates to perceive investments in REITs to be relatively less attractive than investments in the stocks of non-REIT corporations that pay dividends, which could adversely affect the value of the shares of REITs, including our stock.
We may be subject to adverse legislative or regulatory tax changes that could reduce the market price of our securities.
At any time, the U.S. federal income tax laws governing REITs or the administrative interpretations of those laws may be amended. We cannot predict when or if any new U.S. federal income tax law, regulation or administrative interpretation, or any amendment to any existing U.S. federal income tax law, regulation or administrative interpretation, will be adopted, promulgated or become effective and any such law, regulation, or interpretation may take effect retroactively. We and our stockholders could be adversely affected by any such change in the U.S. federal income tax laws, regulations or administrative interpretations. The Tax Cuts and Jobs Act signed into law by the President on December 22, 2017 made significant changes to the U.S. federal income tax rules for taxation of individuals and corporations. The Tax Cuts and Jobs Act makes numerous other changes to the tax rules that do not affect REITs directly but may affect our shareholders and may indirectly affect us. These changes could have an adverse effect on an investment in our shares or on the market value or the resale potential of our assets. It is possible that future legislation would result in a REIT having fewer advantages, and it could become more advantageous for a company that invests in real estate to elect to be taxed, for federal income tax purposes, as a corporation.
If our operating partnership failed to qualify as a partnership for federal income tax purposes, we would cease to qualify as a REIT and suffer other adverse consequences.
We believe that our operating partnership will be treated as a partnership for federal income tax purposes. As a partnership, our operating partnership is not subject to federal income tax on its income. Instead, each of its partners, including us, is allocated, and may be required to pay tax with respect to, its share of our operating partnership’s income. The IRS could challenge the status of our operating partnership or any other subsidiary partnership in which we own an interest as a partnership for federal income tax purposes, and a court could sustain such a challenge. If the IRS were successful in treating our operating partnership or any such other subsidiary partnership as an entity taxable as a corporation for federal income tax purposes, we would fail to meet the gross income tests and certain of the asset tests applicable to REITs and, accordingly, we would likely cease to qualify as a REIT. Also, the failure of our operating partnership or any subsidiary partnerships to qualify as a partnership could cause it to become subject to federal and state corporate income tax, which would reduce significantly the amount of cash available for debt service and for distribution to its partners, including us.
Note that although partnerships have traditionally not been subject to federal income tax at the entity level as described above, new audit rules, currently scheduled to become effective for tax years ending after December 31, 2017, will generally apply to the partnership. Under the new rules, unless an entity elects otherwise, taxes arising from audit adjustments are required to be paid by the entity rather than by its partners or members. We will have the authority to utilize, and intend to utilize, any exceptions available under the new provisions (including any changes) and Treasury Regulations so that the partners, to the fullest extent possible, rather than the partnership itself, will be liable for any taxes arising from audit adjustments to the issuing entity’s taxable income. It is unclear to what extent these elections will be available to the partnership and how any such elections may affect the procedural rules available to challenge any audit adjustment that would otherwise be available in the absence of any such elections. Proposed temporary and final Treasury Regulations have been promulgated implementing portions of these new partnership audit rules, but questions remain as to the application of the rules.
Qualifying as a REIT involves highly technical and complex provisions of the Internal Revenue Code.
Qualification as a REIT involves the application of highly technical and complex Internal Revenue Code provisions for which, in certain instances, only limited judicial and administrative authorities exist. Even a technical or inadvertent violation could jeopardize our REIT qualification. Our qualification as a REIT will depend on our satisfaction of certain asset, income, organizational, distribution, stockholder ownership and other requirements on a continuing basis. New legislation, court decisions or administrative guidance, in each case possibly with retroactive effect, may make it more difficult or impossible for us to qualify as a REIT. The Protecting Americans from Tax Hikes Act of 2015 (the “PATH Act”) contained a number of changes to the Internal Revenue Code provisions applicable to REITs (with various effective dates), including, among others, (1) a reduction from 25% to 20% of the maximum permitted value of a REIT’s assets that can consist of stock or securities of one or more TRSs, (2) treatment of debt instruments issued by publicly offered REITs as “real estate assets” (however, unless such a debt instrument is secured by
65
a mortgage or otherwise would have qualified as a real estate asset under prior law, (i) interest income and gain from such a debt instrument is not qualifying income for purposes of one of the REIT gross income tests, the 75% gross income test, and (ii) all such debt instruments may represent no more than 25% of the value of a REIT’s assets), and (3) a new 100% excise tax that applies to the extent it is determined that a REIT has been undercharged for certain services provided by a taxable REIT subsidiary. We expect that the changes will not materially impact our operations, but will continue to monitor as regulatory guidance is issued. We strongly urge our stockholders to consult their tax advisors concerning the effects of federal, state, and local income tax law on an investment in our stock.
Declines in the values of our investments may make it more difficult for us to maintain our qualification as a REIT or exemption from the Investment Company Act.
If the market value or income potential of real estate-related investments declines as a result of increased interest rates or other factors, we may need to increase our real estate-related investments and income or liquidate our non-qualifying assets in order to maintain our REIT qualification or exemption from the Investment Company Act of 1940 (the “Investment Company Act”). If the decline in real estate asset values and/or income occurs quickly, this may be especially difficult to accomplish. This difficulty may be exacerbated by the illiquid nature of any non-qualifying assets that we may own. We may have to make investment decisions that we otherwise would not make absent the REIT and Investment Company Act considerations.
Risks Related to our Common Stock
Broad market fluctuations could negatively impact the market price of our stock.
The market price of our common stock may be volatile. In addition, the trading volume in our common stock may fluctuate and cause significant price variations to occur. Some of the factors that could affect our stock price or result in fluctuations in the price or trading volume of our common stock include:
|
•
|
actual or anticipated variations in our quarterly operating results;
|
|
•
|
changes in our operations or earnings estimates or publication of research reports about us or the industry;
|
|
•
|
changes in market valuations of similar companies;
|
|
•
|
adverse market reaction to any increased indebtedness we incur in the future;
|
|
•
|
additions or departures of key management personnel;
|
|
•
|
actions by institutional stockholders;
|
|
•
|
failure to meet and maintain REIT qualification;
|
|
•
|
speculation in the press or investment community; and
|
|
•
|
general market and economic conditions.
|
In addition, the stock market has experienced price and volume fluctuations that have affected the market prices of many companies in industries similar or related to ours and may have been unrelated to operating performances of these companies. These broad market fluctuations could reduce the market price of our common stock.
Future offerings of debt securities, which would be senior to our common stock upon liquidation, and future offerings of equity securities, which would dilute our existing stockholders and may be senior to our common stock for the purposes of dividend and liquidating distributions, may adversely affect the market price of our common stock.
In the future, we may attempt to increase our capital resources by making offerings of debt or equity securities, including commercial paper, medium-term notes, senior or subordinated notes, convertible securities, and classes of preferred stock or common stock or classes of preferred units. Upon liquidation, holders of our debt securities and preferred stock or preferred units and lenders with respect to other borrowings will receive a distribution of our available assets prior to the holders of our common stock. Equity offerings may dilute the holdings of our existing stockholders or reduce the market price of our common stock, or both. Preferred stock and preferred units, if issued, could have a preference on liquidating distributions or a preference on dividend payments that could limit our ability to make a distribution to the holders of our common stock. Because our decision to issue securities in any future offering will depend on market conditions and other factors beyond our control, we cannot predict or estimate the amount, timing, or nature of our future offerings. Thus, our stockholders bear the risk of our future offerings reducing the market price of our securities and diluting their securities holdings in us.
66
The number of shares available for future sale could adversely affect the per share trading price of our common stock.
We cannot predict whether future issuances of shares of our common stock or the availability of shares for resale in the open market will decrease the per share trading price of our common stock. The issuance of substantial numbers of shares of our common stock in the public market, or upon exchange of common units of our operating partnership, or the perception that such issuances might occur, could adversely affect the per share trading price of our common stock. Sales of substantial amounts of shares of our common stock in the public market, or upon exchange of the common units, or speculation that such sales might occur, could adversely affect the liquidity of the market for our common stock or the prevailing market price of our common stock. In addition, the exchange of common units for common stock, the exercise of any stock options or the vesting of any restricted stock granted under the 2013 Equity Incentive Plan and the Advisor Equity Incentive Plan, the issuance of our common stock or common units in connection with property, portfolio or business acquisitions and other issuances of our common stock or common units could adversely affect the market price of our common stock. As of
March 12, 2018
, we have
4,789,729
common units outstanding, representing
13.0%
of our Company on a fully diluted basis, and our directors and executive officers as a group own
2,861,769
common units representing
7.8%
of our Company, on a fully diluted basis. Such common units may be redeemed by the holders for cash or, at our option, shares of our common stock on a one-for-one basis. The holders of these common units may sell shares issued to them, if any, upon redemption of the common units. So long as the holders of common units retain significant ownership in us and are able to sell such shares in the public markets, the market price of our common stock may be adversely affected. Moreover, the existence of shares of our common stock reserved for issuance as restricted shares or upon exchange of options or common units may adversely affect the terms upon which we may be able to obtain additional capital through the sale of equity securities. Any future sales by us of our common stock or securities convertible into common stock may be dilutive to existing stockholders.
Our cash available for distribution to stockholders may be insufficient to pay distributions at any particular levels or in amounts sufficient to maintain our REIT qualification, and we may borrow funds to make distributions.
As a REIT, we are required to distribute at least 90% of our REIT taxable income each year, excluding net capital gains, to our stockholders. However, all distributions will be authorized and determined by our board of directors in its sole discretion out of funds legally available therefor and will depend upon a number of factors, including restrictions under applicable law, actual and projected financial condition, liquidity, EBITDA, which is defined as our net income (loss) before interest expense and amortization of loan costs, interest income, income taxes, depreciation and amortization, and redeemable noncontrolling interests in our operating partnership, funds from operations, or FFO, and results of operations, the revenue we actually receive from our properties, our operating expenses, our debt service requirements, our capital expenditures, prohibitions and other limitations under our financing arrangements, our REIT taxable income, the annual REIT distribution requirements and such other factors as our board deems relevant. Our ability to make distributions may be adversely affected by the risk factors included herein.
In the event of downturns in our financial condition or operating results, economic conditions or otherwise, we may be unable to declare or pay distributions to our stockholders to the extent required to maintain our REIT qualification. We may be required either to fund distributions from borrowings under our secured revolving credit facility or to reduce our distributions. If we borrow to fund distributions, our interest costs would increase, thereby reducing our earnings and cash available for distribution from what they otherwise would have been.
The market price of our common stock could be adversely affected by our level of cash distributions.
The market value of the equity securities of a REIT is based primarily upon the market's perception of the REIT's growth potential and its current and potential future cash distributions, whether from operations, sales or refinancings, and is secondarily based upon the real estate market value of the underlying assets. For that reason, our common stock may trade at prices that are higher or lower than our net asset value per share. To the extent we retain operating cash flow for investment purposes, working capital reserves or other purposes, these retained funds, while increasing the value of our underlying assets, may not correspondingly increase the market price of our common stock. Our failure to meet the market's expectations with regard to future earnings and cash distributions likely would adversely affect the market price of our common stock.
Our stock repurchase program could increase the volatility of the price of our common stock.
Our board of directors has approved a share repurchase program under which we may purchase up to $50 million of our common stock from time to time. The specific timing, manner, price, amount and other terms of the repurchases, if any, will be at management's discretion and will depend on market conditions, corporate and regulatory requirements and other factors. We are not required to repurchase shares under the repurchase program, and the board of directors may modify, suspend or terminate the repurchase program at any time for any reason. As of
March 12, 2018
,
$50.0 million
remains available for repurchases under the current stock repurchase program. We cannot predict the impact that future repurchases, if any, of our common stock under this program will have on our stock price or earnings per share. Important factors that could cause us to discontinue or decrease our share repurchases include, among others, unfavorable market conditions, the market price of our common stock, the nature
67
of other investment or strategic opportunities presented to us from time to time, the rate of dilution of our equity compensation programs, our ability to make appropriate, timely, and beneficial decisions as to when, how, and whether to purchase shares under the stock repurchase program, and the availability of funds necessary to continue purchasing stock. If we curtail our repurchase program, our stock price may be negatively affected.
Item 1B.
Unresolved Staff Comments
None.
Item 2.
Properties
Offices
We lease our headquarters located at 14185 Dallas Parkway, Suite 1100, Dallas, Texas 75254.
Hotel Properties
As of
December 31, 2017
, we had ownership interests in twelve hotel properties that were included in our consolidated operations, which included direct ownership in ten hotel properties and 75% ownership in two hotel properties through equity investments with our partner. Currently, eleven of our hotel properties are located in the United States and one is located in the U.S. Virgin Islands. Each of the twelve hotel properties is encumbered by loans as described in “Management’s Discussion and Analysis of Financial Condition and Results of Operations—Indebtedness.”
The following table presents certain information related to our hotel properties:
|
Hotel Property
|
Location
|
Service Type
|
Total Rooms
|
% Owned
|
Owned Rooms
|
Year Ended December 31, 2017
|
||||||||||||||||||
|
Occupancy
|
ADR
|
RevPAR
|
||||||||||||||||||||||
|
Fee Simple Properties
|
||||||||||||||||||||||||
|
Hilton
|
Washington D.C.
|
Full
|
550
|
|
75
|
%
|
413
|
|
88.63
|
%
|
$
|
237.87
|
|
$
|
210.83
|
|
||||||||
|
Marriott
|
Seattle, WA
|
Full
|
361
|
|
100
|
%
|
361
|
|
87.99
|
%
|
272.19
|
|
239.50
|
|
||||||||||
|
Courtyard by Marriott
(1)
|
Philadelphia, PA
|
Select
|
499
|
|
100
|
%
|
499
|
|
81.83
|
%
|
176.71
|
|
144.60
|
|
||||||||||
|
Courtyard by Marriott
(1)
|
San Francisco, CA
|
Select
|
408
|
|
100
|
%
|
408
|
|
79.93
|
%
|
270.38
|
|
216.12
|
|
||||||||||
|
Chicago Sofitel Magnificent Mile
|
Chicago, IL
|
Full
|
415
|
|
100
|
%
|
415
|
|
80.92
|
%
|
202.66
|
|
164.00
|
|
||||||||||
|
Pier House Resort
|
Key West, FL
|
Full
|
142
|
|
100
|
%
|
142
|
|
77.07
|
%
|
430.59
|
|
331.87
|
|
||||||||||
|
Ritz-Carlton St. Thomas
(2)
|
St. Thomas, USVI
|
Full
|
180
|
|
100
|
%
|
180
|
|
79.94
|
%
|
553.27
|
|
442.26
|
|
||||||||||
|
Park Hyatt Beaver Creek
(3)
|
Beaver Creek, CO
|
Full
|
190
|
|
100
|
%
|
190
|
|
53.94
|
%
|
310.52
|
|
167.51
|
|
||||||||||
|
Hotel Yountville
(4)
|
Yountville, CA
|
Full
|
80
|
|
100
|
%
|
80
|
|
71.78
|
%
|
603.21
|
|
433.00
|
|
||||||||||
|
Ground Lease Properties
|
||||||||||||||||||||||||
|
Hilton
(5)
|
La Jolla, CA
|
Full
|
394
|
|
75
|
%
|
296
|
|
83.65
|
%
|
205.19
|
|
171.64
|
|
||||||||||
|
Renaissance
(6)
|
Tampa, FL
|
Full
|
293
|
|
100
|
%
|
293
|
|
81.96
|
%
|
192.34
|
|
157.65
|
|
||||||||||
|
Bardessono
(7)
|
Yountville, CA
|
Full
|
62
|
|
100
|
%
|
62
|
|
76.96
|
%
|
770.19
|
|
592.77
|
|
||||||||||
|
Total
|
3,574
|
|
3,339
|
|
81.77
|
%
|
$
|
260.75
|
|
$
|
213.22
|
|
||||||||||||
________
|
(1)
|
Announced plans to convert into Autograph Collection properties in 2019.
|
|
(2)
|
Due to the impact from hurricanes Irma and Maria the Ritz-Carlton St. Thomas total rooms count was reduced to 74 at December 31, 2017. The hotel had 180 total rooms in service prior to the hurricanes. The applicable total rooms, with out-of-service exclusion, for each month following the hurricanes were: 77 in September, 61 in October, 72 in November and 74 in December.
|
|
(3)
|
Period from our acquisition on March 31, 2017 through December 31, 2017.
|
|
(4)
|
Period from our acquisition on May 11, 2017 through December 31, 2017.
|
|
(5)
|
The ground lease expires in 2067.
|
|
(6)
|
The ground lease expires in 2080.
|
|
(7)
|
The initial ground lease expires in 2055. The ground lease contains two 25-year extension options, at our election.
|
Item 3.
Legal Proceedings
Jesse Small v. Monty J. Bennett, et al., Case No. 24-C-16006020 (Md. Cir. Ct.)
On November 16, 2016, Jesse Small, a purported shareholder of Ashford Prime, commenced a derivative action in Maryland Circuit Court for Baltimore City asserting causes of action for breach of fiduciary duty, corporate waste, and declaratory relief against the members of the Ashford Prime board of directors, David Brooks (collectively, the “Individual Defendants”), Ashford Inc. and Ashford LLC. Ashford Prime is named as
68
a nominal defendant. The complaint alleges that the Individual Defendants breached their fiduciary duties to Ashford Prime by negotiating and approving the termination fee provision set forth in Ashford Prime’s advisory agreement with Ashford LLC, that Ashford Inc. and Ashford LLC aided and abetted the Individual Defendants’ fiduciary duty breaches, and that the Ashford Prime board of directors committed corporate waste in connection with Ashford Prime’s purchase of 175,000 shares of Ashford Inc. common stock. The complaint seeks monetary damages and declaratory and injunctive relief, including a declaration that the termination fee provision is unenforceable. The defendants filed motions to dismiss the complaint on March 24, 2017. On June 6, 2017, the plaintiff notified the court that the plaintiff intends to dismiss the action as moot and seek a mootness fee and costs. On July 25, 2017, the action was dismissed with prejudice as to the plaintiff. A hearing on the plaintiff’s fee petition was held on October 25, 2017. On February 5, 2018, the court denied the plaintiff’s fee petition.
We are engaged in other various legal proceedings which have arisen but have not been fully adjudicated. The likelihood of loss from these legal proceedings, based on definitions within contingency accounting literature, ranges from remote to reasonably possible and to probable. Based on estimates of the range of potential losses associated with these matters, management does not believe the ultimate resolution of these proceedings, either individually or in the aggregate, will have a material adverse effect on our consolidated financial position or results of operations. However, the final results of legal proceedings cannot be predicted with certainty and if we fail to prevail in one or more of these legal matters, and the associated realized losses exceed our current estimates of the range of potential losses, our consolidated financial position or results of operations could be materially adversely affected in future periods.
Item 4.
Mine Safety Disclosures
Not Applicable
Item 5.
Market for Registrant’s Common Equity, Related Stockholder Matters, and Issuer Purchases of Equity Securities
Market Price and Dividend Information
Our common stock has been listed and traded on the NYSE under the symbol “AHP” since November 20, 2013. Prior to that time, there was no public market for our common stock. On
March 12, 2018
, there were
389
holders of record. In order to comply with certain requirements related to our qualification as a REIT, our charter limits the number of shares of capital stock that may be owned by any single person or affiliated group without our permission to 9.8% of the outstanding shares of any class of our capital stock.
The following table sets forth the range of high and low sales prices of our common stock for the period beginning on January 1,
2016
through December 31,
2017
:
|
First Quarter
|
Second Quarter
|
Third Quarter
|
Fourth Quarter
|
||||||||||||
|
2017
|
|||||||||||||||
|
High
|
$
|
14.87
|
|
$
|
11.17
|
|
$
|
11.34
|
|
$
|
10.50
|
|
|||
|
Low
|
9.83
|
|
9.28
|
|
9.02
|
|
8.74
|
|
|||||||
|
Close
|
10.61
|
|
10.29
|
|
9.50
|
|
9.73
|
|
|||||||
|
Cash dividends declared per share
|
0.16
|
|
0.16
|
|
0.16
|
|
0.16
|
|
|||||||
|
2016
|
|||||||||||||||
|
High
|
$
|
14.53
|
|
$
|
17.34
|
|
$
|
17.64
|
|
$
|
14.73
|
|
|||
|
Low
|
8.37
|
|
10.21
|
|
13.91
|
|
12.17
|
|
|||||||
|
Close
|
11.67
|
|
14.14
|
|
14.10
|
|
13.65
|
|
|||||||
|
Cash dividends declared per share
|
0.10
|
|
0.12
|
|
0.12
|
|
0.12
|
|
|||||||
Distributions and Our Distribution Policy
For the years ended December 31,
2017
, and
2016
, we declared dividends of $0.64 per share and $0.46 per share, respectively. In December 2017, the board of directors approved our dividend policy for 2018 and we expect to pay a quarterly dividend of $0.16 per share for 2018. The adoption of a dividend policy does not commit our board of directors to declare future dividends or
69
the amount thereof. The board of directors will continue to review our dividend policy on a quarterly basis. For income tax purposes, distributions paid consist of ordinary income, capital gains, return of capital or a combination thereof.
We intend to make quarterly distributions to our common stockholders. To qualify as a REIT, we must distribute to our stockholders an amount at least equal to:
|
(i)
|
90% of our REIT taxable income, determined before the deduction for dividends paid and excluding any net capital gain (which does not necessarily equal net income as calculated in accordance with GAAP); plus
|
|
(ii)
|
90% of the excess of our net income from foreclosure property over the tax imposed on such income by the Internal Revenue Code; less
|
|
(iii)
|
any excess non-cash income (as determined under the Internal Revenue Code).
|
Distributions made by us are authorized and determined by our board of directors in its sole discretion out of funds legally available therefor and are dependent upon a number of factors, including restrictions under applicable law, actual and projected financial condition, liquidity, EBITDA, FFO and results of operations, the revenue we actually receive from our properties, our operating expenses, our debt service requirements, our capital expenditures, prohibitions and other limitations under our financing arrangements, our REIT taxable income, the annual REIT distribution requirements and such other factors as our board of directors deems relevant. For more information regarding risk factors that could materially and adversely affect our ability to make distributions. See “Risk Factors-Risks Related to Our Status as a REIT.” We expect that, at least initially, our distributions may exceed our net income under GAAP because of non-cash expenses included in net income. To the extent that our cash available for distribution is less than 90% of our REIT taxable income, we may consider various means to cover any such shortfall, including borrowing under our secured revolving credit facility or other loans, selling certain of our assets or using a portion of the net proceeds we receive from future offerings of equity, equity-related or debt securities or declaring taxable stock dividends. In addition, our charter allows us to issue preferred stock that could have a preference on distributions, and, if we elect such issuance, the distribution preference on the preferred stock could limit our ability to make distributions to the holders of our common stock. We cannot assure our stockholders that our distribution policy will not change in the future.
Characterization of Distributions
For income tax purposes, distributions paid consist of ordinary income or capital gains. Distributions paid per share were characterized as follows:
|
2017
|
2016
|
2015
|
|||||||||||||||||||||
|
Amount
|
%
|
Amount
|
%
|
Amount
|
%
|
||||||||||||||||||
|
Common Stock (cash):
|
|||||||||||||||||||||||
|
Ordinary income
|
$
|
0.1338
|
|
(3)
|
27.8755
|
%
|
$
|
—
|
|
—
|
%
|
$
|
0.3500
|
|
(1)
|
100.00
|
%
|
||||||
|
Capital gain
|
0.0297
|
|
(3)
|
6.1817
|
|
0.1658
|
|
(2)
|
36.0510
|
|
—
|
|
—
|
|
|||||||||
|
Unrecaptured 1250 gain
|
0.0671
|
|
(3)
|
13.9757
|
|
0.2942
|
|
(2)
|
63.9490
|
|
—
|
|
—
|
|
|||||||||
|
Return of capital
|
0.2494
|
|
(3)
|
51.9671
|
|
—
|
|
—
|
|
—
|
|
—
|
|
||||||||||
|
Total
|
$
|
0.4800
|
|
100.0000
|
%
|
$
|
0.4600
|
|
100.0000
|
%
|
$
|
0.3500
|
|
100.0000
|
%
|
||||||||
|
Preferred Stock – Series A:
|
|||||||||||||||||||||||
|
Ordinary income
|
$
|
—
|
|
—
|
%
|
$
|
—
|
|
—
|
%
|
$
|
0.7181
|
|
(1)
|
100.00
|
%
|
|||||||
|
Capital gain
|
—
|
|
—
|
|
—
|
|
—
|
|
—
|
|
—
|
|
|||||||||||
|
Total
|
$
|
—
|
|
—
|
%
|
$
|
—
|
|
—
|
%
|
$
|
0.7181
|
|
100.00
|
%
|
||||||||
|
Preferred Stock – Series B:
|
|||||||||||||||||||||||
|
Ordinary income
|
$
|
0.7981
|
|
(4)
|
58.0341
|
%
|
$
|
—
|
|
—
|
%
|
$
|
0.0458
|
|
(1)
|
100.00
|
%
|
||||||
|
Capital gain
|
0.1770
|
|
(4)
|
12.8698
|
|
0.4957
|
|
(2)
|
36.0510
|
|
—
|
|
—
|
|
|||||||||
|
Unrecaptured 1250 gain
|
0.4001
|
|
(4)
|
29.0961
|
|
0.8793
|
|
(2)
|
63.9490
|
|
—
|
|
—
|
|
|||||||||
|
Return of capital
|
—
|
|
(4)
|
—
|
|
—
|
|
—
|
|
—
|
|
—
|
|
||||||||||
|
Total
|
$
|
1.3752
|
|
100.0000
|
%
|
$
|
1.3750
|
|
100.0000
|
%
|
$
|
0.0458
|
|
100.0000
|
%
|
||||||||
____________________
|
(1)
|
The fourth quarter
2015
distributions paid January 15,
2016
to stockholders of record as of December 31, 2015 are treated as 2015 distributions for tax purposes.
|
|
(2)
|
The fourth quarter
2016
distributions paid January 17,
2017
to stockholders of record as of December 30, 2016 are treated as 2016 distributions for tax purposes.
|
70
|
(3)
|
The fourth quarter
2017
distributions paid January 16,
2018
to stockholders of record as of December 29, 2017 are treated as 2018 distributions for tax purposes.
|
|
(4)
|
The fourth quarter
2017
distributions paid January 16,
2018
to stockholders of record as of December 29, 2017 are treated as 2017 distributions for tax purposes.
|
Equity Compensation Plan Information
The following table sets forth certain information with respect to securities authorized and available for issuance under our equity compensation plans.
|
Number of Securities to be Issued Upon Exercise of
Outstanding Options, Warrants and Rights |
Weighted-Average Exercise Price Of Outstanding Options, Warrants, And Rights
|
Number of Securities Remaining Available for Future Issuance
|
||||||
|
Equity compensation plans approved by security holders
|
None
|
N/A
|
2,420,882
|
|
(1)
|
|||
|
Equity compensation plans not approved by security holders
|
None
|
N/A
|
None
|
|
||||
|
Total
|
None
|
N/A
|
2,420,882
|
|
||||
____________________
(1)
As of December 31,
2017
,
820,882
shares of our common stock, or securities convertible into
820,882
shares of our common stock, remained available for issuance under our 2013 Equity Incentive Plan and
1,600,000
shares of our common stock, or securities convertible into
1,600,000
shares of our common stock, remained available for issuance under our Advisor Equity Incentive Plan.
Purchases of Equity Securities by the Issuer
On October 27, 2014, our board of directors approved a share repurchase program under which the Company may purchase up to $100 million of the Company’s common stock from time to time. The repurchase program does not have an expiration date. The specific timing, manner, price, amount and other terms of the repurchases are at management’s discretion and depend on market conditions, corporate and regulatory requirements and other factors. The Company is not required to repurchase shares under the repurchase program, and may modify, suspend or terminate the repurchase program at any time for any reason.
On December 5, 2017, our board of directors reapproved the stock repurchase program pursuant to which the Board granted a repurchase authorization to acquire shares of the Company’s common stock, par value $0.01 per share having an aggregate value of up to
$50 million
. The Board’s authorization replaced any previous repurchase authorizations. In addition, on December 11, 2017, the Company established an “at-the-market” equity distribution program pursuant to which it may, from time to time, sell shares of its Common Stock having an aggregate offering price of up to
$50 million
.
No shares were purchased during the
year ended
December 31, 2017
, pursuant to the authorization. As of
December 31, 2017
, we have purchased a cumulative
4.3 million
shares of our common stock, for approximately
$63.2 million
, since the program’s inception on November 4, 2014.
The following table provides the information with respect to purchases of our common stock during each of the months in the quarter ended December 31,
2017
:
|
Period
|
Total Number of Shares Purchased
|
Average Price Paid Per Share
|
Total Number of Shares Purchased as Part of a Publicly Announced Plan
(3)
|
Maximum Dollar Value of Shares That May Yet Be Purchased Under the Plan
|
||||||||||
|
Common stock:
|
||||||||||||||
|
October 1 to October 31
|
282
|
|
(1)
|
$
|
9.82
|
|
(2)
|
—
|
|
$
|
36,787,500
|
|
||
|
November 1 to November 30
|
20,559
|
|
(1)
|
$
|
9.98
|
|
(2)
|
—
|
|
$
|
36,787,500
|
|
||
|
December 1 to December 31
|
170
|
|
(1)
|
$
|
9.25
|
|
(2)
|
—
|
|
$
|
50,000,000
|
|
||
|
Total
|
21,011
|
|
$
|
9.98
|
|
—
|
|
|||||||
__________________
|
(1)
|
Includes 14, 28 and 14 shares in October, November and December, respectively that were repurchased from Ashford Trust when former Ashford Trust employees who held restricted shares of Ashford Prime common stock they received in the spin-off, forfeited the shares to Ashford Trust upon termination of employment.
|
71
|
(2)
|
There is no cost associated with the forfeiture of restricted shares of 268, 459 and 156 of our common stock in October, November and December, respectively.
|
|
(3)
|
On December 5, 2017, our board of directors reapproved the stock repurchase program pursuant to which the Board granted a repurchase authorization to acquire shares of the Company’s common stock, par value $0.01 per share having an aggregate value of up to
$50 million
. The Board’s authorization replaced any previous repurchase authorizations.
|
Performance Graph
The following graph compares the percentage change in the cumulative total stockholder return on our common stock with the cumulative total return of the S&P 500 Stock Index and the FTSE NAREIT Lodging & Resorts Index for the period from November 20, 2013, the date our stock began trading on the NYSE through December 31,
2017
, assuming an initial investment of $100 in stock on November 20, 2013 with reinvestment of dividends. The NAREIT Lodging Resorts Index is not a published index; however, we believe the companies included in this index provide a representative example of enterprises in the lodging resort line of business in which we engage. Stockholders who wish to request a list of companies in the FTSE NAREIT Lodging & Resorts Index may send written requests to Ashford Hospitality Prime, Inc., Attention: Investor Relations, 14185 Dallas Parkway, Suite 1100, Dallas, Texas 75254.
The stock price performance shown below on the graph is not necessarily indicative of future stock price performance.
COMPARISON OF CUMULATIVE TOTAL RETURNS
Among Ashford Hospitality Prime, Inc., the S&P Index and the FTSE NAREIT Lodging & Resorts Index
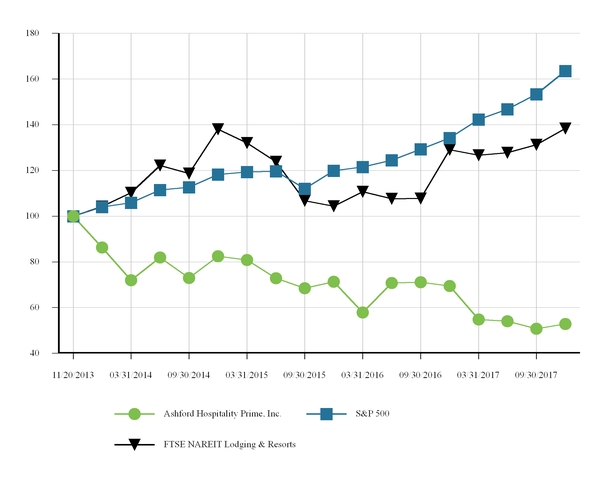
72
Item 6.
Selected Financial Data
The following sets forth our selected consolidated financial and operating information on a historical basis and should be read together with “Item 7. Management’s Discussion and Analysis of Financial Condition and Results of Operations” and our consolidated financial statements and notes thereto, which are included in “Item 8. Financial Statements and Supplementary Data.”
The selected historical consolidated financial information as of December 31,
2017
and
2016
, and for each of the three years in the period ended December 31,
2017
has been derived from the audited financial statements appearing elsewhere in this Annual Report on Form 10-K. The selected historical combined consolidated financial information as of December 31, 2015, 2014 and 2013 and for each of the two years in the period ended December 31, 2014 and 2013 have been derived from the related audited financial statements not included in this Annual Report on Form 10-K. The selected historical information in this section is not intended to replace these audited financial statements.
The selected financial information for 2013 below does not necessarily reflect what our results of operations, financial position and cash flows would have been if we had operated our initial eight hotel properties as a stand-alone publicly traded company during 2013, and, accordingly, this historical information should not be relied upon as an indicator of our future performance.
|
Year Ended December 31,
|
|||||||||||||||||||
|
2017
|
2016
|
2015
|
2014
|
2013
|
|||||||||||||||
|
(in thousands, except per share amounts)
|
|||||||||||||||||||
|
|
|||||||||||||||||||
|
Total revenue
|
$
|
414,063
|
|
$
|
405,857
|
|
$
|
349,545
|
|
$
|
307,308
|
|
$
|
233,496
|
|
||||
|
Total operating expenses
|
$
|
375,221
|
|
$
|
358,716
|
|
$
|
303,569
|
|
$
|
263,558
|
|
$
|
214,086
|
|
||||
|
Operating income
|
$
|
38,842
|
|
$
|
47,141
|
|
$
|
45,976
|
|
$
|
43,750
|
|
$
|
19,410
|
|
||||
|
Net income (loss)
|
$
|
28,324
|
|
$
|
24,320
|
|
$
|
(4,691
|
)
|
$
|
3,538
|
|
$
|
(17,928
|
)
|
||||
|
Net income (loss) attributable to the Company
|
$
|
23,022
|
|
$
|
19,316
|
|
$
|
(6,712
|
)
|
$
|
1,939
|
|
$
|
(11,782
|
)
|
||||
|
Diluted income (loss) per common share
|
$
|
0.51
|
|
$
|
0.55
|
|
$
|
(0.34
|
)
|
$
|
0.07
|
|
$
|
(0.73
|
)
|
||||
|
Weighted average diluted common shares
|
34,706
|
|
31,195
|
|
25,888
|
|
33,325
|
|
16,045
|
|
|||||||||
|
December 31,
|
|||||||||||||||||||
|
2017
|
2016
|
2015
|
2014
|
2013
|
|||||||||||||||
|
(in thousands)
|
|||||||||||||||||||
|
|
|||||||||||||||||||
|
Investments in hotel properties, gross
|
$
|
1,403,110
|
|
$
|
1,258,412
|
|
$
|
1,315,621
|
|
$
|
1,179,345
|
|
$
|
925,507
|
|
||||
|
Accumulated depreciation
|
$
|
(257,268
|
)
|
$
|
(243,880
|
)
|
$
|
(224,142
|
)
|
$
|
(189,042
|
)
|
$
|
(160,181
|
)
|
||||
|
Investments in hotel properties, net
|
$
|
1,145,842
|
|
$
|
1,014,532
|
|
$
|
1,091,479
|
|
$
|
990,303
|
|
$
|
765,326
|
|
||||
|
Cash and cash equivalents
|
$
|
137,522
|
|
$
|
126,790
|
|
$
|
105,039
|
|
$
|
171,439
|
|
$
|
143,776
|
|
||||
|
Restricted cash
|
$
|
47,820
|
|
$
|
37,855
|
|
$
|
33,135
|
|
$
|
29,646
|
|
$
|
5,951
|
|
||||
|
Note receivable
|
$
|
8,098
|
|
$
|
8,098
|
|
$
|
8,098
|
|
$
|
8,098
|
|
$
|
8,098
|
|
||||
|
Total assets
|
$
|
1,423,819
|
|
$
|
1,256,997
|
|
$
|
1,352,750
|
|
$
|
1,226,005
|
|
$
|
960,189
|
|
||||
|
Indebtedness, net
|
$
|
820,959
|
|
$
|
764,616
|
|
$
|
835,592
|
|
$
|
761,727
|
|
$
|
619,652
|
|
||||
|
Total stockholders’ equity of the Company
|
$
|
381,305
|
|
$
|
308,796
|
|
$
|
338,859
|
|
$
|
278,904
|
|
$
|
146,027
|
|
||||
73
|
Year Ended December 31,
|
|||||||||||||||||||
|
2017
|
2016
|
2015
|
2014
|
2013
|
|||||||||||||||
|
(in thousands, except per share amounts)
|
|||||||||||||||||||
|
Other Data:
|
|||||||||||||||||||
|
Cash provided by (used in) operating activities
|
$
|
70,608
|
|
$
|
58,607
|
|
$
|
8,972
|
|
$
|
56,145
|
|
$
|
23,145
|
|
||||
|
Cash provided by (used in) investing activities
|
$
|
(173,942
|
)
|
$
|
103,489
|
|
$
|
(179,347
|
)
|
$
|
(190,359
|
)
|
$
|
(28,354
|
)
|
||||
|
Cash provided by (used in) financing activities
|
$
|
124,031
|
|
$
|
(135,625
|
)
|
$
|
107,464
|
|
$
|
185,572
|
|
$
|
117,732
|
|
||||
|
Cash dividends declared per common share
|
$
|
0.64
|
|
$
|
0.46
|
|
$
|
0.35
|
|
$
|
0.20
|
|
$
|
0.05
|
|
||||
|
EBITDA (unaudited)
(1)
|
$
|
110,378
|
|
$
|
104,908
|
|
$
|
70,383
|
|
$
|
78,187
|
|
$
|
42,332
|
|
||||
|
Hotel EBITDA (unaudited)
(1)
|
$
|
128,300
|
|
$
|
124,239
|
|
$
|
114,469
|
|
$
|
103,287
|
|
$
|
77,907
|
|
||||
|
Funds From Operations (FFO) (unaudited)
(1)
|
$
|
44,897
|
|
$
|
34,050
|
|
$
|
31,859
|
|
$
|
39,928
|
|
$
|
8,829
|
|
||||
____________________
(1)
A more detailed description and computation of EBITDA, Hotel EBITDA and FFO is contained in the “Non-GAAP Financial Measures” section of Management’s Discussion and Analysis of Financial Condition and Results of Operations in Item 7.
Item 7.
Management’s Discussion and Analysis of Financial Condition and Results of Operations
The following Management’s Discussion and Analysis (“MD&A”) is intended to help the reader understand our results of operations and financial condition. This MD&A is provided as a supplement to, and should be read in conjunction with, our audited consolidated financial statements and the accompanying notes thereto included in Item 8. In addition to historical financial information, the following discussion and analysis contains forward-looking statements that involve risks, uncertainties and assumptions. Our results and the timing of selected events may differ materially from those anticipated in these forward-looking statements as a result of many factors, including those discussed under “Item 1A. Risk Factors” and elsewhere in this Annual Report on Form 10-K. See “Forward-Looking Statements.”
Overview
We are a Maryland corporation formed in April 2013. We became a public company on November 19, 2013 when Ashford Trust, a NYSE-listed REIT, completed the spin-off of our company through the distribution of our outstanding common stock to the Ashford Trust stockholders. We invest primarily in high revenue per available room (“RevPAR”), luxury hotels and resorts. High RevPAR, for purposes of our investment strategy, means RevPAR of at least twice the then-current U.S. national average RevPAR for all hotels as determined by Smith Travel Research. Two times the U.S. national average was
$167
for the year ended
December 31, 2017
. We have elected to be taxed as a REIT under the Internal Revenue Code beginning in the year ended December 31, 2013. We conduct our business and own substantially all of our assets through our operating partnership, Ashford Prime OP.
We operate in the direct hotel investment segment of the hotel lodging industry. As of
March 12, 2018
, we own interests in
twelve
hotel properties in six states, the District of Columbia and St. Thomas, U.S. Virgin Islands with
3,574
total rooms, or
3,339
net rooms, excluding those attributable to our joint venture partner. The hotel properties in our current portfolio are predominantly located in U.S. urban markets and resort locations with favorable growth characteristics resulting from multiple demand generators. We own ten of our hotel properties directly, and the remaining two hotel properties through an investment in a majority-owned consolidated entity.
We are advised by Ashford LLC, a subsidiary of Ashford Inc., through an advisory agreement. All of the hotel properties in our portfolio are currently asset-managed by Ashford LLC.
We do not have any employees. All of the services that might be provided by employees are provided to us by Ashford LLC.
Pursuant to the termination provisions of the Fourth Amended and Restated Advisory Agreement, the revenues and expenses used to calculate Net Earnings (as defined) for the twelve months ended
December 31, 2017
, are as follows (in thousands):
|
Revenues
|
$
|
11,353
|
|
|
Expenses
|
2,212
|
|
|
|
Net Earnings
|
$
|
9,141
|
|
74
Recent Developments
On January 18, 2017, we refinanced three mortgage loans with existing outstanding balances totaling approximately
$333.7 million
and a final maturity dates in April 2017. The new mortgage loan totaled $365.0 million, is interest only with a floating rate of LIBOR + 2.58% and has stated maturity of February 2019 with five one-year extension options, subject to the satisfaction of certain conditions. On November 1, 2017, we completed the sale of the Plano Marriott Legacy Town Center for $104.0 million in cash and repaid approximately
$87.4 million
on the mortgage loan that was previously secured in part by the hotel property. The mortgage loan is secured by
four
hotel properties: Seattle Marriott Waterfront, Tampa Renaissance, San Francisco Courtyard Downtown and Philadelphia Courtyard Downtown.
On January 24, 2017, the Company announced refinements to its strategy in an effort to enhance shareholder value. The refinements, which have been unanimously endorsed by the board of directors, include the following:
|
•
|
Focused Portfolio:
Going forward, the Company will be predominantly focused on investing in the luxury chain scale segment. Empirical evidence has shown the luxury segment has had greater RevPAR growth over the long term. The Company will continue to target acquisitions of hotels with a RevPAR of at least 2.0x the national average. As a result, four hotel properties have been designated as non-core to the portfolio, including the Courtyard Philadelphia Downtown Hotel, Courtyard San Francisco Downtown Hotel, Renaissance Tampa Hotel and Marriott Legacy Center Hotel in Plano, Texas. To date, the Company has sold the Marriott Legacy Center Hotel, announced plans to convert the Courtyard Philadelphia Downtown Hotel and the Courtyard San Francisco Downtown to Autograph Collection properties, listed the Renaissance Tampa Hotel for sale and announced that we are acquiring the Ritz-Carlton in Sarasota, Florida. The Company will also simultaneously pursue new acquisitions in order to grow the portfolio consistent with its stated strategy. Luxury hotels have proven to have superior long-term RevPAR growth versus other chain scales, and the Company believes its exclusive focus of investing in luxury hotels should generate attractive returns for its shareholders;
|
|
•
|
Increased Dividend:
The Company's 2017 dividend policy was amended commencing with the first quarter by increasing the expected quarterly cash dividend for the Company's common stock by 33%, from $0.12 per diluted share to $0.16 per diluted share;
|
|
•
|
Reaffirming Conservative Leverage:
The Company continues to target conservative leverage, with a target leverage level of 45% net debt to gross assets;
|
|
•
|
Strong Liquidity:
The Company continues to focus on having access to liquidity for both opportunistic investments and as a hedge against economic uncertainty. The Company targets holding 10-15% of its gross debt balance in cash.
|
On January 24, 2017, we entered into an amended and restated advisory agreement with Ashford Inc. (the “Fourth Amended and Restated Advisory Agreement”) that amends and restates our advisory agreement discussed herein. On June 9, 2017, our stockholders approved the Fourth Amended and Restated Advisory Agreement which became effective on June 21, 2017. The material terms of the Fourth Amended and Restated Advisory Agreement include:
|
•
|
we made a cash payment to Ashford LLC of
$5.0 million
on June 21, 2017, at which time the Fourth Amended and Restated Advisory Agreement became effective;
|
|
•
|
the termination fee payable to Ashford LLC has been amended by eliminating the
1.1x
multiplier and tax gross up components of the fee;
|
|
•
|
Ashford Inc. will disclose publicly the revenues and expenses used to calculate “Net Earnings” on a quarterly basis which is used to calculate the termination fee; Ashford LLC will retain an accounting firm to provide a quarterly report to us on the reasonableness of Ashford LLC’s determination of expenses, which will be binding on the parties;
|
|
•
|
the right of Ashford LLC to appoint a “Designated CEO” has been eliminated;
|
|
•
|
the right of Ashford LLC to terminate the advisory agreement due to a change in a majority of the “Company Incumbent Board” (as defined in the current advisory agreement) has been eliminated;
|
|
•
|
we will be incentivized to grow our assets under a “growth covenant” in the Fourth Amended and Restated Advisory Agreement under which we will receive a deemed credit against a base amount of
$45.0 million
for:
3.75%
of the total purchase price of each hotel acquired after the date of the Fourth Amended and Restated Advisory Agreement that was recommended by Ashford LLC, netted against
3.75%
of the total sale price of each hotel sold after the date of the Fourth Amended and Restated Advisory Agreement. The difference between
$45.0 million
and such net credit, if any, is referred to as the “Uninvested Amount.” If the Fourth Amended and Restated Advisory Agreement is terminated, other than due to certain acts by Ashford LLC, we must pay Ashford LLC the Uninvested Amount, in addition to any termination fee payable under the Fourth Amended and Restated Advisory Agreement;
|
|
•
|
the Fourth Amended and Restated Advisory Agreement requires us to maintain a net worth of not less than
$390 million
plus
75%
of the equity proceeds from the sale of securities by us after December 31, 2016 and a covenant prohibiting us
|
75
from paying dividends except as required to maintain our REIT status if paying the dividend would reduce our net worth below the required minimum net worth;
|
•
|
the initial term of the Fourth Amended and Restated Advisory Agreement ends on the 10th anniversary of its effective date, subject to renewal by Ashford LLC for up to
seven
additional successive
10
-year terms;
|
|
•
|
the base management fee payable to Ashford LLC will be fixed at
0.70%
, and the fee will be payable on a monthly basis;
|
|
•
|
reimbursements of expenses to Ashford LLC will be made monthly in advance, based on an annual expense budget, with a quarterly true-up for actual expenses;
|
|
•
|
our right to terminate the advisory agreement due to a change of control of Ashford LLC has been eliminated;
|
|
•
|
our rights to terminate the advisory agreement at the end of each term upon payment of the termination fee based on the parties being unable to agree on new market-based fees or advisor’s performance have been eliminated; however, the Fourth Amended and Restated Advisory Agreement provides a mechanism for the parties to renegotiate the fees payable to Ashford LLC at the end of each term based on then prevailing market conditions, subject to floors and caps on the changes;
|
|
•
|
if a Change of Control (as defined in the Fourth Amended and Restated Advisory Agreement) is pending, we have agreed to deposit not less than
50%
, and in certain cases
100%
, of the applicable termination fee in escrow, with the payment of any remaining amounts owed to Ashford LLC secured by a letter of credit and/or first priority lien on certain assets;
|
|
•
|
our ability to terminate the Fourth Amended and Restated Advisory Agreement due to a material default by Ashford LLC is limited to instances where a court finally determines that the default had a material adverse effect on us and Ashford LLC fails to pay monetary damages in accordance with the Fourth Amended and Restated Advisory Agreement; and
|
|
•
|
if we repudiate the Fourth Amended and Restated Advisory Agreement through actions or omissions that constitute a repudiation as determined by a final non-appealable order from a court of competent jurisdiction, we will be liable to Ashford LLC for a liquidated damages amount.
|
On March 1, 2017, we commenced an underwritten public offering of approximately
5.8 million
shares of common stock at
$12.15
per share for gross proceeds of
$69.9 million
. The offering closed on March 7, 2017. The net proceeds from the sale of the shares after underwriting discounts and offering expense were approximately
$66.4 million
On March 7, 2017, we closed an offering of approximately
2.0 million
shares of our 5.5% Series B Cumulative Convertible Preferred Stock (the “Series B Preferred Stock”) at
$20.19
per share for gross proceeds of
$39.9 million
. The net proceeds, after underwriting discounts and offering expenses were approximately
$38.2 million
. Dividends on the Series B Preferred Stock accrue at a rate of
5.50%
on the liquidation preference of
$25.00
per share. On March 31, 2017, the underwriters partially exercised their over-allotment option and purchased an additional
100,000
shares of the Series B Preferred Stock, which closed on April 5, 2017. The net proceeds from the partially exercised over-allotment option after underwriting discounts were approximately
$1.9 million
.
On March 31, 2017, we acquired a 100% interest in the Park Hyatt Beaver Creek in Beaver Creek, Colorado for total consideration of
$145.5 million
. Concurrent with the closing of the acquisition, we completed the financing of a
$67.5 million
mortgage loan. This mortgage loan is interest only and provides for a floating interest rate of LIBOR +
2.75%
. The stated maturity date of the mortgage loan is April 2019, with
three
one
-year extension options. The mortgage loan is secured by the Park Hyatt Beaver Creek.
On April 27, 2017, Mr. Douglas A. Kessler resigned from the board of directors of Ashford Prime and no longer is President of Ashford Prime as a result of being appointed Chief Executive Officer of Ashford Trust.
On May 11, 2017, we acquired a 100% interest in the Hotel Yountville in Yountville, California for total consideration of
$96.5 million
. Concurrent with the closing of the acquisition, we completed the financing of a
$51.0 million
mortgage loan. This mortgage loan is interest only and provides for a floating interest rate of LIBOR +
2.55%
. The stated maturity date of the mortgage loan is
May 2022
. The mortgage loan is secured by the Hotel Yountville.
On June 20, 2017, we announced that we have entered into an agreement with Marriott to convert the Philadelphia Courtyard to an Autograph Collection property.
On August 18, 2017, we refinanced our existing
$40.0 million
mortgage loan with a final maturity date in December 2020 with a new
$40.0 million
mortgage loan that is interest only, provides for a floating interest rate of LIBOR +
2.55%
and a stated maturity date of August 2022. The mortgage loan is secured by the Bardessono Hotel.
On November 1, 2017, we completed the sale of the 404-room Plano Marriott Legacy Town Center for $104.0 million in cash. We repaid approximately
$87.4 million
on the mortgage loan that was previously secured in part by the hotel property.
76
On November 1, 2017, we announced plans to convert the San Francisco Courtyard Downtown to an Autograph Collection property and that we listed the Tampa Renaissance for sale.
On December 5, 2017, our board of directors reapproved the stock repurchase program pursuant to which the Board granted a repurchase authorization to acquire shares of the Company’s common stock, par value $0.01 per share having an aggregate value of up to
$50 million
. The Board’s authorization replaced any previous repurchase authorizations. On December 11, 2017, we entered into equity distribution agreements with Morgan Stanley & Co. LLC and UBS Securities LLC, each acting as a sales agent (the “Equity Distribution Agreements”). Pursuant to the Equity Distribution Agreements, we may sell from time to time through the sales agents shares of our common stock having an aggregate offering price of up to $50.0 million. Sales of shares of our common stock, if any, may be made in negotiated transactions or transactions that are deemed to be “at-the-market” offerings as defined in Rule 415 of the Securities Act, including sales made directly on the New York Stock Exchange, the existing trading market for our common stock, or sales made to or through a market maker other than on an exchange or through an electronic communications network. We will pay each of the sales agents a commission, which in each case shall not be more than 2.0% of the gross sales price of the shares of our common stock sold through such sales agent. As of December 31, 2017, no shares of our common stock have been sold under this program.
On February 12, 2018, we entered into a definitive agreement to acquire the 266-room Ritz-Carlton Sarasota in Sarasota, Florida for $171.0 million and a 22 acre plot of vacant land for $9.7 million. The acquisitions are expected to close on April 3, 2018.
Key Indicators of Operating Performance
We use a variety of operating and other information to evaluate the operating performance of our business. These key indicators include financial information that is prepared in accordance with GAAP as well as other financial measures that are non-GAAP measures. In addition, we use other information that may not be financial in nature, including statistical information and comparative data. We use this information to measure the operating performance of our individual hotels, groups of hotels and/or business as a whole. We also use these metrics to evaluate the hotels in our portfolio and potential acquisitions to determine each hotel’s contribution to cash flow and its potential to provide attractive long-term total returns. These key indicators include:
|
•
|
Occupancy-Occupancy means the total number of hotel rooms sold in a given period divided by the total number of rooms available. Occupancy measures the utilization of our hotels’ available capacity. We use occupancy to measure demand at a specific hotel or group of hotels in a given period.
|
|
•
|
ADR-ADR means average daily rate and is calculated by dividing total hotel rooms revenues by total number of rooms sold in a given period. ADR measures average room price attained by a hotel and ADR trends provide useful information concerning the pricing environment and the nature of the customer base of a hotel or group of hotels. We use ADR to assess the pricing levels that we are able to generate.
|
|
•
|
RevPAR-RevPAR means revenue per available room and is calculated by multiplying ADR by the average daily occupancy. RevPAR is one of the commonly used measures within the hotel industry to evaluate hotel operations. RevPAR does not include revenues from food and beverage sales or parking, telephone or other non-rooms revenues generated by the property. Although RevPAR does not include these ancillary revenues, it is generally considered the leading indicator of core revenues for many hotels. We also use RevPAR to compare the results of our hotels between periods and to analyze results of our comparable hotels (comparable hotels represent hotels we have owned for the entire period). RevPAR improvements attributable to increases in occupancy are generally accompanied by increases in most categories of variable operating costs. RevPAR improvements attributable to increases in ADR are generally accompanied by increases in limited categories of operating costs, such as management fees and franchise fees.
|
RevPAR changes that are primarily driven by changes in occupancy have different implications for overall revenues and profitability than changes that are driven primarily by changes in ADR. For example, an increase in occupancy at a hotel would lead to additional variable operating costs (including housekeeping services, utilities and room supplies) and could also result in increased other operating department revenue and expense. Changes in ADR typically have a greater impact on operating margins and profitability as they do not have a substantial effect on variable operating costs.
Occupancy, ADR and RevPAR are commonly used measures within the lodging industry to evaluate operating performance. RevPAR is an important statistic for monitoring operating performance at the individual hotel level and across our entire business. We evaluate individual hotel RevPAR performance on an absolute basis with comparisons to budget and prior periods, as well as on a regional and company-wide basis. ADR and RevPAR include only rooms revenue. Rooms revenue comprised approximately
69%
of our total hotel revenue for the year ended
December 31, 2017
and is dictated by demand (as measured by occupancy), pricing (as measured by ADR) and our available supply of hotel rooms.
We also use FFO, AFFO, EBITDA, Adjusted EBITDA and Hotel EBITDA as measures of the operating performance of our business. See “Non-GAAP Financial Measures.”
77
Principal Factors Affecting Our Results of Operations
The principal factors affecting our operating results include overall demand for hotel rooms compared to the supply of available hotel rooms, and the ability of our third-party management companies to increase or maintain revenues while controlling expenses.
Demand
. The demand for lodging, including business travel, is directly correlated to the overall economy; as GDP increases, lodging demand typically increases. Historically, periods of declining demand are followed by extended periods of relatively strong demand, which typically occurs during the growth phase of the lodging cycle.
Following the recession that commenced in 2008, the lodging industry has experienced improvement in fundamentals, including demand, which has continued through
2017
. We believe that industry fundamentals continue to show growth albeit at a slower pace.
Supply
. The development of new hotels is driven largely by construction costs, the availability of financing and expected performance of existing hotels. Short-term supply is also expected to be below long-term averages. While the industry is expected to have supply growth below historical averages, we may experience supply growth, in certain markets, in excess of national averages that may negatively impact performance.
We expect that our ADR, occupancy and RevPAR performance will be impacted by macroeconomic factors such as national and local employment growth, personal income and corporate earnings, GDP, consumer confidence, office vacancy rates and business relocation decisions, airport and other business and leisure travel, new hotel construction, the pricing strategies of competitors and currency fluctuations. In addition, our ADR, occupancy and RevPAR performance are dependent on the continued success of the Marriott, Hilton and Sofitel brands.
Revenue
. Substantially all of our revenue is derived from the operation of hotels. Specifically, our revenue is comprised of:
|
•
|
Rooms revenue-Occupancy and ADR are the major drivers of rooms revenue. Rooms revenue accounts for the substantial majority of our total revenue.
|
|
•
|
Food and beverage revenue-Occupancy and the type of customer staying at the hotel are the major drivers of food and beverage revenue (i.e., group business typically generates more food and beverage business through catering functions when compared to transient business, which may or may not utilize the hotel’s food and beverage outlets or meeting and banquet facilities).
|
|
•
|
Other hotel revenue-Occupancy and the nature of the property are the main drivers of other ancillary revenue, such as telecommunications, parking and leasing services.
|
Hotel Operating Expenses
. The following presents the components of our hotel operating expenses:
|
•
|
Rooms expense-These costs include housekeeping wages and payroll taxes, reservation systems, room supplies, laundry services and front desk costs. Like rooms revenue, occupancy is the major driver of rooms expense and, therefore, rooms expense has a significant correlation to rooms revenue. These costs can increase based on increases in salaries and wages, as well as the level of service and amenities that are provided.
|
|
•
|
Food and beverage expense-These expenses primarily include food, beverage and labor costs. Occupancy and the type of customer staying at the hotel (i.e., catered functions generally are more profitable than restaurant, bar or other on-property food and beverage outlets) are the major drivers of food and beverage expense, which correlates closely with food and beverage revenue.
|
|
•
|
Management fees-Base management fees are computed as a percentage of gross revenue. Incentive management fees generally are paid when operating profits exceed certain threshold levels.
|
|
•
|
Other hotel expenses-These expenses include labor and other costs associated with the other operating department revenues, as well as labor and other costs associated with administrative departments, franchise fees, sales and marketing, repairs and maintenance and utility costs.
|
Most categories of variable operating expenses, including labor costs such as housekeeping, fluctuate with changes in occupancy. Increases in occupancy are accompanied by increases in most categories of variable operating expenses, while increases in ADR typically only result in increases in limited categories of operating costs and expenses, such as franchise fees, management fees and credit card processing fee expenses which are based on hotel revenues. Thus, changes in ADR have a more significant impact on operating margins than changes in occupancy.
78
RESULTS OF OPERATIONS
Year Ended December 31,
2017
Compared to Year Ended December 31,
2016
The following table summarizes the changes in key line items from our consolidated statements of operations for the years ended December 31,
2017
and
2016
(in thousands except percentages):
|
Year Ended December 31,
|
Favorable (Unfavorable)
|
|||||||||||||
|
2017
|
2016
|
$ Change
|
% Change
|
|||||||||||
|
Revenue
|
||||||||||||||
|
Rooms
|
$
|
286,006
|
|
$
|
287,844
|
|
$
|
(1,838
|
)
|
(0.6
|
)%
|
|||
|
Food and beverage
|
96,415
|
|
95,618
|
|
797
|
|
0.8
|
|
||||||
|
Other
|
31,484
|
|
22,267
|
|
9,217
|
|
41.4
|
|
||||||
|
Total hotel revenue
|
413,905
|
|
405,729
|
|
8,176
|
|
2.0
|
|
||||||
|
Other
|
158
|
|
128
|
|
30
|
|
23.4
|
|
||||||
|
Total revenue
|
414,063
|
|
405,857
|
|
8,206
|
|
2.0
|
|
||||||
|
Expenses
|
||||||||||||||
|
Hotel operating expenses:
|
||||||||||||||
|
Rooms
|
65,731
|
|
65,541
|
|
(190
|
)
|
(0.3
|
)
|
||||||
|
Food and beverage
|
68,469
|
|
68,471
|
|
2
|
|
—
|
|
||||||
|
Other expenses
|
122,322
|
|
113,114
|
|
(9,208
|
)
|
(8.1
|
)
|
||||||
|
Management fees
|
15,074
|
|
15,456
|
|
382
|
|
2.5
|
|
||||||
|
Total hotel expenses
|
271,596
|
|
262,582
|
|
(9,014
|
)
|
(3.4
|
)
|
||||||
|
Property taxes, insurance and other
|
21,337
|
|
20,539
|
|
(798
|
)
|
(3.9
|
)
|
||||||
|
Depreciation and amortization
|
52,262
|
|
45,897
|
|
(6,365
|
)
|
(13.9
|
)
|
||||||
|
Impairment charges
|
1,068
|
|
—
|
|
(1,068
|
)
|
|
|
||||||
|
Advisory services fee
|
9,134
|
|
14,955
|
|
5,821
|
|
38.9
|
|
||||||
|
Contract modification cost
|
5,000
|
|
—
|
|
(5,000
|
)
|
||||||||
|
Transaction costs
|
6,678
|
|
457
|
|
(6,221
|
)
|
(1,361.3
|
)
|
||||||
|
Corporate general and administrative
|
8,146
|
|
14,286
|
|
6,140
|
|
43.0
|
|
||||||
|
Total expenses
|
375,221
|
|
358,716
|
|
(16,505
|
)
|
(4.6
|
)
|
||||||
|
Operating income (loss)
|
38,842
|
|
47,141
|
|
(8,299
|
)
|
(17.6
|
)
|
||||||
|
Equity in earnings (loss) of unconsolidated entity
|
—
|
|
(2,587
|
)
|
2,587
|
|
100.0
|
|
||||||
|
Interest income
|
690
|
|
167
|
|
523
|
|
313.2
|
|
||||||
|
Gain (loss) on sale of hotel property
|
23,797
|
|
26,359
|
|
(2,562
|
)
|
(9.7
|
)
|
||||||
|
Other income (expense)
|
(377
|
)
|
(165
|
)
|
(212
|
)
|
(128.5
|
)
|
||||||
|
Interest expense and amortization of loan costs
|
(38,937
|
)
|
(40,881
|
)
|
1,944
|
|
4.8
|
|
||||||
|
Write-off of loan costs and exit fees
|
(3,874
|
)
|
(2,595
|
)
|
(1,279
|
)
|
(49.3
|
)
|
||||||
|
Unrealized gain (loss) on investment in Ashford Inc.
|
9,717
|
|
(1,970
|
)
|
11,687
|
|
593.2
|
|
||||||
|
Unrealized gain (loss) on derivatives
|
(2,056
|
)
|
425
|
|
(2,481
|
)
|
(583.8
|
)
|
||||||
|
Income (loss) before income taxes
|
27,802
|
|
25,894
|
|
1,908
|
|
7.4
|
|
||||||
|
Income tax (expense) benefit
|
522
|
|
(1,574
|
)
|
2,096
|
|
133.2
|
|
||||||
|
Net income (loss)
|
28,324
|
|
24,320
|
|
4,004
|
|
16.5
|
|
||||||
|
(Income) loss from consolidated entities attributable to noncontrolling interests
|
(3,264
|
)
|
(3,105
|
)
|
(159
|
)
|
(5.1
|
)
|
||||||
|
Net (income) loss attributable to redeemable noncontrolling interests in operating partnership
|
(2,038
|
)
|
(1,899
|
)
|
(139
|
)
|
(7.3
|
)
|
||||||
|
Net income (loss) attributable to the Company
|
$
|
23,022
|
|
$
|
19,316
|
|
$
|
3,706
|
|
19.2
|
%
|
|||
79
All hotel properties owned during the years ended December 31, 2017 and 2016 have been included in our results of operations during the respective periods in which they were owned. Based on when a hotel property was acquired or disposed of, operating results for certain hotel properties are not comparable for the years ended December 31, 2017 and 2016. The hotel properties listed below are not comparable hotel properties for the periods indicated and all other hotel properties are considered comparable hotel properties. The following acquisitions and dispositions affect reporting comparability related to our consolidated financial statements:
|
Hotel Properties
|
Location
|
Acquisition/Disposition
|
Acquisition/Disposition Date
|
|||
|
Seattle Courtyard Downtown
|
Seattle, WA
|
Disposition
|
July 1, 2016
|
|||
|
Park Hyatt Beaver Creek
(1)
|
Beaver Creek, CO
|
Acquisition
|
March 31, 2017
|
|||
|
Hotel Yountville
(1)
|
Yountville, CA
|
Acquisition
|
May 11, 2017
|
|||
|
Marriott Legacy Town Center
|
Plano, TX
|
Disposition
|
November 1, 2017
|
|||
________
|
(1)
|
The operating results of these hotel properties have been included in our results of operations as of their acquisition dates.
|
The following table illustrates the key performance indicators of our hotel properties for the periods indicated:
|
Year Ended December 31,
|
|||||||
|
2017
|
2016
|
||||||
|
Occupancy
|
80.97
|
%
|
82.94
|
%
|
|||
|
ADR (average daily rate)
|
$
|
254.92
|
|
$
|
247.83
|
|
|
|
RevPAR (revenue per available room)
|
$
|
206.42
|
|
$
|
205.54
|
|
|
|
Rooms revenue (in thousands)
|
$
|
286,006
|
|
$
|
287,844
|
|
|
|
Total hotel revenue (in thousands)
|
$
|
413,905
|
|
$
|
405,729
|
|
|
The following table illustrates the key performance indicators of the ten comparable hotel properties that were included for the entire years ended
December 31, 2017
and
2016
:
|
Year Ended December 31,
|
|||||||
|
2017
|
2016
|
||||||
|
Occupancy
|
83.15
|
%
|
84.42
|
%
|
|||
|
ADR (average daily rate)
|
$
|
254.67
|
|
$
|
256.11
|
|
|
|
RevPAR (revenue per available room)
|
$
|
211.76
|
|
$
|
216.21
|
|
|
|
Rooms revenue (in thousands)
|
$
|
252,350
|
|
$
|
260,977
|
|
|
|
Total hotel revenue (in thousands)
|
$
|
355,087
|
|
$
|
365,733
|
|
|
Net income (loss) attributable to the Company.
Net income attributable to the Company increased
$3.7 million
, to
$23.0 million
for the
year ended December 31, 2017
(“
2017
”) compared to
$19.3 million
for the
year ended December 31, 2016
(“
2016
”) as a result of the factors discussed below.
Rooms Revenue
.
Rooms revenue from our hotel properties
de
creased
$1.8 million
, or
0.6%
to
$286.0 million
during
2017
compared to
2016
. During
2017
, we experienced a
197
basis point decrease in occupancy and a
2.9%
in
crease in room rates. Rooms revenue from our ten comparable hotel properties decreased
$8.6 million
due a
127
basis point decrease in occupancy and lower room rates of
0.6%
. Rooms revenue decreased (i)
$7.0 million
at the
Seattle Courtyard Downtown
as a result of its sale on July 1, 2016; (ii)
$4.6 million
at the
Ritz-Carlton, St. Thomas
due to the negative impact caused by Hurricanes Irma and Maria; (iii)
$4.1 million
at the
San Francisco Courtyard Downtown
from
1.0%
lower room rates and a
962
basis point decrease in occupancy due to renovations at the hotel; (iv)
$3.1 million
at the
Plano Marriott Legacy Town Center
as a result of its sale on November 1, 2017; (v)
$2.2 million
at the
Chicago Sofitel Magnificent Mile
from
6.1%
lower room rates and a
149
basis point decrease in occupancy due to renovations at the hotel; (vi) $
1.6 million
at the
Key West Pier House
as a result of
1,083
basis point decrease in occupancy, partially offset by
4.8%
higher room rates at the hotel. The results of operations of the hotel were negatively impacted by Hurricane Irma; (vii) $
923,000
at the
Philadelphia Courtyard
as a result of
3.2%
lower room rates, partially offset by a
3
basis point increase in occupancy due to a major renovation at the hotel during 2017; and (viii)
$632,000
at the
Bardessono Hotel
as a result of a
741
basis point decrease in occupancy due to the California wildfires partially offset by
5.0%
higher room rates at the hotel. These decreases were partially offset by increases of (i)
$8.8 million
at the
Park Hyatt Beaver Creek
as a result of its
80
acquisition on March 31, 2017; (ii)
$8.1 million
at the
Hotel Yountville
as a result its acquisition on May 11, 2017; (iii)
$2.7 million
at the
Seattle Marriott Waterfront
as a result of
3.1%
higher room rates and a
492
basis point increase in occupancy at the hotel; (iv)
$1.2 million
at the
Capital Hilton
as a result of
3.1%
higher room rates and a
5
basis point increase in occupancy at the hotel; (v)
$1.1 million
at the
Hilton La Jolla Torrey Pines
as a result of
5.3%
higher room rates partially offset by a
19
basis point decrease in occupancy at the hotel; and (vi)
$475,000
at the
Tampa Renaissance
as a result of
2.2%
higher room rates and a
75
basis point increase in occupancy at the hotel.
Food and Beverage Revenue
.
Food and beverage revenue from our hotel properties
in
creased
$797,000
, or
0.8%
, to
$96.4 million
in
2017
as compared to
2016
. This
in
crease is primarily attributable to increases of
$6.9 million
at the
Park Hyatt Beaver Creek
and
$881,000
at the
Hotel Yountville
as a result of their acquisitions in 2017. We experienced an additional aggregate increase in food and beverage revenue of
$649,000
at the
Seattle Marriott Waterfront
,
Philadelphia Courtyard
and
Key West Pier House
. These increases were partially offset by lower food and beverage revenue of
$2.8 million
at the
Ritz-Carlton, St. Thomas
as a result of the hurricanes,
$1.4 million
at the
Chicago Sofitel Magnificent Mile
as a result of its renovation, lower aggregate food and beverage revenue of
$1.4 million
at the
Hilton La Jolla Torrey Pines
,
Capital Hilton
,
Bardessono Hotel
,
San Francisco Courtyard Downtown
and
Tampa Renaissance
and
$1.9 million
at the
Plano Marriott Legacy Town Center
and
Seattle Courtyard Downtown
due to their sales on November 1, 2017 and July 1, 2016, respectively.
Other Hotel Revenue
.
Other hotel revenue, which consists mainly of telecommunications, parking, spa and rentals,
in
creased
$9.2 million
, or
41.4%
, to
$31.5 million
in
2017
as compared to
2016
. This
in
crease is attributable to an increase of
$6.3 million
at the
Park Hyatt Beaver Creek
and
$578,000
at the
Hotel Yountville
due to their acquisitions in 2017. There was also an aggregate increase of
$3.7 million
at the
Hilton La Jolla Torrey Pines
,
Key West Pier House
,
Ritz-Carlton, St. Thomas
,
Seattle Marriott Waterfront
and
Chicago Sofitel Magnificent Mile
. These increases were partially offset by lower aggregate other hotel revenue of
$635,000
at the
Bardessono Hotel
,
San Francisco Courtyard Downtown
,
Capital Hilton
,
Tampa Renaissance
and
Philadelphia Courtyard
and
$703,000
at the
Seattle Courtyard Downtown
and
Plano Marriott Legacy Town Center
due their sales on July 1, 2016 and November 1, 2017, respectively.
Other Non-Hotel Revenue
.
Other non-hotel revenue
in
creased
$30,000
, or
23.4%
, to
$158,000
in
2017
as compared to
2016
. The increase is attributable to higher Texas margin tax recoveries from guests.
Rooms Expense
.
Rooms expense
in
creased
$190,000
, or
0.3%
, to
$65.7 million
in
2017
as compared to
2016
. The increase is primarily attributable to an increase in rooms revenue at the
Park Hyatt Beaver Creek
and
Hotel Yountville
due to their acquisitions in 2017. This increase was partially offset by lower aggregate rooms expense from our ten comparable hotel properties and the
Seattle Courtyard Downtown
and
Plano Marriott Legacy Town Center
due to their sales on July 1, 2016 and November 1, 2017, respectively. Rooms expense included $243,000 of hurricane related costs at the Ritz-Carlton, St. Thomas.
Food and Beverage Expense
.
Food and beverage expense
de
creased
$2,000
to
$68.5 million
during
2017
as compared to
2016
. The
de
crease is attributable to an aggregate
de
crease of
$4.9 million
from our ten comparable hotel properties and
$1.2 million
from the
Seattle Courtyard Downtown
and
Plano Marriott Legacy Town Center
due to their sales on July 1, 2016 and November 1, 2017, respectively. These decreases were partially offset by an aggregate increase of
$6.2 million
from our 2017 acquisitions. Food and beverage expense included $476,000 of hurricane related costs at the Ritz-Carlton, St. Thomas.
Other Operating Expenses
.
Other operating expenses
in
creased
$9.2 million
, or
8.1%
, to
$122.3 million
in
2017
as compared to
2016
. Hotel operating expenses consist of direct expenses from departments associated with revenue streams and indirect expenses associated with support departments and incentive management fees. We experienced an
in
crease of
$2.4 million
in direct expenses and an
in
crease of
$6.3 million
in indirect expenses and incentive management fees in
2017
as compared to
2016
. Direct expenses were
2.3%
of total hotel revenue in
2017
and
1.7%
in
2016
. The increase in direct expenses is comprised of an increase of a
$3.4 million
as a result of the acquisitions of the
Park Hyatt Beaver Creek
and
Hotel Yountville
in 2017 partially offset by decreases of
$851,000
at our ten comparable hotel properties and
$91,000
from the sales of the
Seattle Courtyard Downtown
and
Plano Marriott Legacy Town Center
on July 1, 2016 and November 1, 2017, respectively. Direct expenses included $109,000 of hurricane related costs at the Ritz-Carlton, St. Thomas. The increase in indirect expenses is primarily attributable to increases in (i) general and administrative costs of
$7.0 million
, including
$3.7 million
from our ten comparable hotel properties, of which $2.7 million was related to the hurricanes and
$4.4 million
from the two hotel properties acquired in 2017, partially offset by a decrease of
$1.1 million
from the sold hotel properties; (ii) energy costs of
$1.2 million
, comprised of
$889,000
from our two acquired hotel properties and
$540,000
from our ten comparable hotel properties, of which $111,000 was related to the hurricanes, partially offset by a decrease of
$270,000
from the sold hotel properties; (iii) marketing costs of
$1.0 million
, comprised of
$2.1 million
from the two acquired hotel properties and $73,000 related to the hurricanes, partially offset by a decrease of
$918,000
from the sold hotel properties and
$241,000
from our ten comparable hotel properties; and (iv) lease expense of
$150,000
, comprised of
$89,000
from our ten comparable hotel properties and
$71,000
from our two acquired hotel properties, partially offset by a decrease of
$10,000
from the sold hotel properties. These increases were partially offset by a decreases in (i) incentive management fees of
$2.9 million
which is comprised of
$1.4 million
from our ten comparable hotel properties,
$997,000
from
81
our sold hotel properties as well as
$541,000
from our two acquired hotel properties; and (ii) repairs and maintenance of
$161,000
, including
$914,000
from our ten comparable hotel properties and
$352,000
from the sold hotel properties partially offset by an increase of
$1.1 million
from our two acquired hotel properties and $82,000 related to the hurricanes.
Management Fees
.
Base management fees
de
creased
$382,000
, or
2.5%
, to
$15.1 million
in
2017
as compared to
2016
. The
de
crease is comprised of a
de
crease of
$778,000
attributable to
Seattle Courtyard Downtown
and
Plano Marriott Legacy Town Center
due to their sales on July 1, 2016 and November 1, 2017, respectively and $311,000 associated with the lower hotel revenue at the San Francisco Courtyard Downtown due to a major renovation and an aggregate decrease of $189,000 from our remaining comparable hotel properties. These decreases are partially offset by an aggregate increase of
$896,000
from the Park Hyatt Beaver Creek and Hotel Yountville.
Property Taxes, Insurance and Other
.
Property taxes, insurance and other
in
creased
$798,000
, or
3.9%
, to
$21.3 million
in
2017
as compared to
2016
, which is comprised of an increase of
$3.3 million
from the two acquired hotel properties, partially offset by a decrease of
$2.2 million
from our ten comparable hotel properties and
$550,000
from the two sold hotel properties.
Depreciation and Amortization
.
Depreciation and amortization
in
creased
$6.4 million
, or
13.9%
, to
$52.3 million
in
2017
as compared to
2016
. The increase is due to
$4.1 million
of depreciation and amortization associated with the acquisitions of the Park Hyatt Beaver Creek and Hotel Yountville in 2017 and an aggregate increase of
$3.6 million
at our ten comparable hotel properties, partially offset by a decrease of
$1.4 million
from
Seattle Courtyard Downtown
and
Plano Marriott Legacy Town Center
as a result of their sales.
Impairment Charges.
We recorded impairment charges of
$1.1 million
in
2017
related to Hurricanes Irma and Maria damages incurred at the Ritz-Carlton, St. Thomas, Key West Pier House and Tampa Renaissance. See note 5 to our consolidated financial statements.
Advisory Services Fee.
Advisory services fee decreased
$5.8 million
, or
38.9%
, to
$9.1 million
in
2017
as compared to
2016
as a result of a decrease in equity-based compensation of
$5.5 million
and reimbursable expenses of
$781,000
. These decreases were partially offset by an increase of
$457,000
in the base advisory fee. In 2017, we recorded an advisory services fee of
$9.1 million
, which included a base advisory fee of
$8.8 million
, reimbursable expenses of
$2.0 million
and a credit to equity-based compensation expense of
$1.7 million
associated with equity grants of our common stock and LTIP units awarded to the officers and employees of Ashford Inc. The credit to equity-based compensation expense is a result of lower fair values of the awards at December 31, 2017 as compared to December 31, 2016. In 2016, we incurred an advisory services fee of
$15.0 million
, which included a base advisory fee of
$8.3 million
, equity-based compensation of
$3.8 million
associated with equity grants of our common stock and LTIP units awarded to the officers and employees of Ashford Inc. and reimbursable expenses of
$2.8 million
.
Contract Modification Cost.
In 2017, we recorded a $5.0 million one-time payment to Ashford LLC upon entering into the Fourth Amended and Restated Advisory Agreement.
Transaction Costs.
In
2017
, we recorded transaction costs of
$6.7 million
primarily related to the acquisitions of the Park Hyatt Beaver Creek and Hotel Yountville and transfer taxes. In
2016
, we recorded transaction costs of
$457,000
related to payments of transfer taxes.
Corporate General and Administrative
.
Corporate general and administrative expenses
de
creased
$6.1 million
, or
43.0%
, to
$8.1 million
in
2017
as compared to
2016
as a result of lower professional fees of
$6.4 million
, primarily related to the proxy contest and litigation in 2016. partially offset by higher miscellaneous expenses of
$331,000
.
Equity in Earnings (Loss) of unconsolidated entity.
We recorded equity in loss of unconsolidated entity of
$2.6 million
in
2016
related to our investment in the AQUA U.S. Fund. We did not have any equity in earnings (loss) in 2017 as this investment was liquidated in June 2016.
Interest Income
.
Interest income
in
creased
$523,000
, or
313.2%
, to
$690,000
in
2017
as compared to
2016
.
Gain (Loss) on Sale of Hotel Property.
In
2017
, we recorded a gain of
$23.8 million
related the sale of the
Plano Marriott Legacy Town Center
on November 1, 2017. In 2016, we recorded a gain of
$26.4 million
related the sale of the Seattle Courtyard Downtown on July 1, 2016.
Other Income (Expense).
Other expense increased
$212,000
, or
128.5%
to
$377,000
in
2017
compared to
2016
. In
2017
, we recognized a realized loss of $271,000 related to the maturity of options on futures contracts and expense of $106,000 related to CMBX premiums and usage fees. In 2016, we recognized a realized loss of $156,000 related to the maturity of options on futures contracts and $10,000 of commissions paid upon purchasing options on futures contracts.
82
Interest Expense and Amortization of Loan Costs
.
Interest expense and amortization of loan costs
de
creased
$1.9 million
, or
4.8%
, to
$38.9 million
in
2017
compared
2016
. The
de
crease is primarily due to lower interest expense from the sales of the Seattle Courtyard Downtown on July 1, 2016 and the sale of
Plano Marriott Legacy Town Center
on November 1, 2017, as well as the refinancing of four mortgage loans, partially offset by higher interest expense and amortization of loan costs associated with the new mortgage loans associated with the acquisitions of the Park Hyatt Beaver Creek and Hotel Yountville as well as a higher average LIBOR rate. The average LIBOR rates in 2017 and 2016 were 1.11% and 0.45%, respectively.
Unrealized Gain (Loss) on Investment in Ashford Inc.
Unrealized gain (loss) on investment in Ashford Inc. changed
$11.7 million
, or
593.2%
, from an unrealized loss of
$2.0 million
in 2016 to an unrealized gain of
$9.7 million
in
2017
. The fair value is based on the closing market price of Ashford Inc. common stock at the end of the period.
Write-off of Loan Costs and Exit Fees
.
Write-off of loan costs and exit fees was
$3.9 million
in
2017
, resulting from the write-off of unamortized loan costs of $295,000 and exit costs of $2.7 million associated with the refinancing of four mortgage loans, including the refinancing of three mortgage loans maturing April 2017 and the refinancing of the Bardessono Hotel mortgage loan, as well as the sale of
Plano Marriott Legacy Town Center
on November 1, 2017. Write-off of loan costs and exit costs was
$2.6 million
in 2016, resulting from the write-off of unamortized loan costs of $2.5 million and exit costs of $108,000 related to the sale of the Seattle Courtyard Downtown.
Unrealized Gain (Loss) on Derivatives
.
Unrealized loss on derivatives of
$2.1 million
in 2017 consisted of a $1.1 million unrealized loss on interest rate floors, a $371,000 unrealized loss on interest rate caps and a $785,000 unrealized loss associated with CMBX tranches, partially offset by an unrealized gain of $213,000 associated with the reclassification to other income (expense) for maturities of options on futures contracts. Unrealized gain on derivatives of
$425,000
in 2016 consisted of a $513,000 unrealized gain on interest rate floors, partially offset by a $17,000 unrealized loss on options on futures contracts and an unrealized loss on interest rate caps of $71,000. The fair value of interest rate caps and floors is primarily based on movements in the LIBOR forward curve and the passage of time. The fair value of options on futures contracts is the last reported settlement price as of the measurement date. The fair value of credit default swaps is based on the change in value of CMBX indices.
Income Tax (Expense) Benefit
.
Income tax (expense) benefit changed
$2.1 million
, or
133.2%
, from income tax expense of
$1.6 million
in
2016
to income tax benefit of
$522,000
in
2017
. This decrease was primarily due to a decrease in the profitability of the Company’s taxable REIT subsidiaries in
2017
compared to
2016
as well as a $216,000 deferred tax benefit resulting from the revaluation of our net deferred tax liabilities related to the Tax Cuts and Jobs Act of 2017.
Income (Loss) from Consolidated Entities Attributable to Noncontrolling Interests
.
Our noncontrolling interest partner in consolidated entities was allocated income of
$3.3 million
and
$3.1 million
in
2017
and
2016
, respectively. The noncontrolling interest in consolidated entities represented an ownership interest of 25% in two hotel properties held by one entity.
Net (Income) Loss Attributable to Redeemable Noncontrolling Interests in Operating Partnership.
Noncontrolling interests in operating partnership were allocated net income of
$2.0 million
and
$1.9 million
in 2017 and 2016, respectively. Redeemable noncontrolling interests represented ownership interests in Ashford Prime OP of
11.43%
and
13.90%
as of December 31, 2017 and 2016, respectively.
83
Year Ended December 31,
2016
Compared to Year Ended December 31,
2015
The following table summarizes the changes in key line items from our consolidated statements of operations for the years ended
December 31, 2016
and
2015
(in thousands except percentages):
|
Year Ended December 31,
|
Favorable (Unfavorable)
|
|||||||||||||
|
2016
|
2015
|
$ Change
|
% Change
|
|||||||||||
|
Revenue
|
||||||||||||||
|
Rooms
|
$
|
287,844
|
|
$
|
255,443
|
|
$
|
32,401
|
|
12.7
|
%
|
|||
|
Food and beverage
|
95,618
|
|
79,894
|
|
15,724
|
|
19.7
|
|
||||||
|
Other
|
22,267
|
|
14,061
|
|
8,206
|
|
58.4
|
|
||||||
|
Total hotel revenue
|
405,729
|
|
349,398
|
|
56,331
|
|
16.1
|
|
||||||
|
Other
|
128
|
|
147
|
|
(19
|
)
|
(12.9
|
)
|
||||||
|
Total revenue
|
405,857
|
|
349,545
|
|
56,312
|
|
16.1
|
|
||||||
|
Expenses
|
||||||||||||||
|
Hotel operating expenses:
|
||||||||||||||
|
Rooms
|
65,541
|
|
56,341
|
|
(9,200
|
)
|
(16.3
|
)
|
||||||
|
Food and beverage
|
68,471
|
|
53,535
|
|
(14,936
|
)
|
(27.9
|
)
|
||||||
|
Other expenses
|
113,114
|
|
93,742
|
|
(19,372
|
)
|
(20.7
|
)
|
||||||
|
Management fees
|
15,456
|
|
14,049
|
|
(1,407
|
)
|
(10.0
|
)
|
||||||
|
Total hotel expenses
|
262,582
|
|
217,667
|
|
(44,915
|
)
|
20.6
|
|
||||||
|
Property taxes, insurance and other
|
20,539
|
|
18,517
|
|
(2,022
|
)
|
(10.9
|
)
|
||||||
|
Depreciation and amortization
|
45,897
|
|
43,824
|
|
(2,073
|
)
|
(4.7
|
)
|
||||||
|
Advisory services fee
|
14,955
|
|
17,889
|
|
2,934
|
|
16.4
|
|
||||||
|
Transaction costs
|
457
|
|
538
|
|
81
|
|
15.1
|
|
||||||
|
Corporate general and administrative
|
14,286
|
|
5,134
|
|
(9,152
|
)
|
(178.3
|
)
|
||||||
|
Total expenses
|
358,716
|
|
303,569
|
|
(55,147
|
)
|
(18.2
|
)
|
||||||
|
Operating income (loss)
|
47,141
|
|
45,976
|
|
1,165
|
|
2.5
|
|
||||||
|
Equity in earnings (loss) of unconsolidated entity
|
(2,587
|
)
|
(2,927
|
)
|
340
|
|
11.6
|
|
||||||
|
Interest income
|
167
|
|
34
|
|
133
|
|
391.2
|
|
||||||
|
Gain (loss) on sale of hotel property
|
26,359
|
|
—
|
|
26,359
|
|
|
|
||||||
|
Other income (expense)
|
(165
|
)
|
1,233
|
|
(1,398
|
)
|
(113.4
|
)
|
||||||
|
Interest expense and amortization of loan costs
|
(40,881
|
)
|
(37,829
|
)
|
(3,052
|
)
|
(8.1
|
)
|
||||||
|
Write-off of loan costs and exit fees
|
(2,595
|
)
|
(54
|
)
|
(2,541
|
)
|
(4,705.6
|
)
|
||||||
|
Unrealized gain (loss) on investment in Ashford Inc.
|
(1,970
|
)
|
(7,609
|
)
|
5,639
|
|
74.1
|
|
||||||
|
Unrealized gain (loss) on derivatives
|
425
|
|
(3,252
|
)
|
3,677
|
|
113.1
|
|
||||||
|
Income (loss) before income taxes
|
25,894
|
|
(4,428
|
)
|
30,322
|
|
684.8
|
|
||||||
|
Income tax (expense) benefit
|
(1,574
|
)
|
(263
|
)
|
(1,311
|
)
|
(498.5
|
)
|
||||||
|
Net income (loss)
|
24,320
|
|
(4,691
|
)
|
29,011
|
|
618.4
|
|
||||||
|
(Income) loss from consolidated entities attributable to noncontrolling interests
|
(3,105
|
)
|
(2,414
|
)
|
(691
|
)
|
(28.6
|
)
|
||||||
|
Net (income) loss attributable to redeemable noncontrolling interests in operating partnership
|
(1,899
|
)
|
393
|
|
(2,292
|
)
|
(583.2
|
)
|
||||||
|
Net income (loss) attributable to the Company
|
$
|
19,316
|
|
$
|
(6,712
|
)
|
$
|
26,028
|
|
387.8
|
%
|
|||
84
All hotel properties owned during the years ended December 31,
2016
and
2015
have been included in our results of operations during the respective periods in which they were owned. Based on when a hotel property was acquired or disposed of, operating results for certain hotel properties are not comparable for the years ended December 31,
2016
and
2015
. The hotel properties listed below are not comparable hotel properties for the periods indicated and all other hotel properties are considered comparable hotel properties. The following acquisitions and dispositions affect reporting comparability related to our consolidated financial statements:
|
Hotel Properties
|
Location
|
Acquisition/Disposition
|
Acquisition/Disposition Date
|
|||
|
Bardessono Hotel
|
Yountville, CA
|
Acquisition
|
July 9, 2015
|
|||
|
Ritz-Carlton, St. Thomas
|
St. Thomas, USVI
|
Acquisition
|
December 15, 2015
|
|||
|
Seattle Courtyard Downtown
|
Seattle, WA
|
Disposition
|
July 1, 2016
|
|||
The following table illustrates the key performance indicators of our hotel properties for the periods indicated:
|
Year Ended December 31,
|
|||||||
|
2016
|
2015
|
||||||
|
Occupancy
|
82.94
|
%
|
82.32
|
%
|
|||
|
ADR (average daily rate)
|
$
|
247.83
|
|
$
|
226.87
|
|
|
|
RevPAR (revenue per available room)
|
$
|
205.54
|
|
$
|
186.76
|
|
|
|
Rooms revenue (in thousands)
|
$
|
287,844
|
|
$
|
255,443
|
|
|
|
Total hotel revenue (in thousands)
|
$
|
405,729
|
|
$
|
349,398
|
|
|
The following table illustrates the key performance indicators of the nine comparable hotel properties that were included for the entire years ended
December 31, 2016
and
2015
:
|
Year Ended December 31,
|
|||||||
|
2016
|
2015
|
||||||
|
Occupancy
|
83.11
|
%
|
82.58
|
%
|
|||
|
ADR (average daily rate)
|
$
|
227.11
|
|
$
|
222.33
|
|
|
|
RevPAR (revenue per available room)
|
$
|
188.76
|
|
$
|
183.60
|
|
|
|
Rooms revenue (in thousands)
|
$
|
239,034
|
|
$
|
231,793
|
|
|
|
Total hotel revenue (in thousands)
|
$
|
328,522
|
|
$
|
319,571
|
|
|
Net income (loss) attributable to the Company.
Net income attributable to the Company increased $26.0 million, to $19.3 million for the year ended December 31, 2016 (“2016”) compared to a net loss attributable to the Company of $6.7 million for the year ended December 31, 2015 (“2015”) as a result of the factors discussed below.
Rooms Revenue
.
Rooms revenue from our hotel properties increased $32.4 million, or 12.7% to $287.8 million during 2016 compared to 2015. During 2016, we experienced a 62 basis point increase in occupancy and a 9.2% increase in room rates. Rooms revenue from our nine comparable hotel properties increased $7.2 million due to higher room rates of 2.1% and a 53 basis point increase in occupancy.
Rooms revenue increased (i) $25.2 million at the Ritz-Carlton, St. Thomas as a result of its acquisition in December 2015; (ii) $7.2 million at the Bardessono Hotel as a result of its acquisition in July 2015; (iii) $3.1 million at the Capital Hilton as a result of 3.8% higher room rates and a 315 basis point increase in occupancy at the hotel; (iv) $1.8 million at the Tampa Renaissance as a result of 7.3% higher room rates and a 325 basis point increase in occupancy at the hotel; (v) $1.3 million at the Seattle Marriott Waterfront as a result of 3.5% higher room rates as well as an 85 basis point increase in occupancy at the hotel; (vi) $799,000 at the Philadelphia Courtyard as a result of 3.8% higher room rates partially offset by a 81 basis point decrease in occupancy at the hotel; (vii) $260,000 at the San Francisco Courtyard Downtown as a result of 2.2% higher room rates partially offset by a 154 basis point decrease in occupancy at the hotel; (viii) $217,000 at the Key West Pier House as a result of 3.5% higher room rates partially offset by a 225 basis point decrease in occupancy at the hotel; and (iv) $101,000 at the Hilton La Jolla Torrey Pines as a result of 2.0% higher room rates partially offset by a 152 basis point decrease in occupancy at the hotel; and (x) $46,000 at the Chicago Sofitel Magnificent Mile as a result of a 239 basis point increase in occupancy partially offset by a 3.0% decrease in room rates at the hotel. These increases were partially offset by decreases of (i) $7.2 million at the Seattle Courtyard Downtown as a result of the sale of the hotel property on July 1, 2016 and (ii) $364,000 at the Plano Marriott Legacy Town Center as a result of 1.4% lower room rates as well as a 46 basis point decrease in occupancy at the hotel.
85
Food and Beverage Revenue
.
Food and beverage revenues from our hotel properties increased $15.7 million, or 19.7%, to $95.6 million in 2016 as compared to 2015. This increase is primarily attributable to increases of $13.8 million at the Ritz-Carlton, St. Thomas and $1.3 million at the Bardessono Hotel as a result of their acquisitions in 2015. We experienced an additional aggregate increase in food and beverage revenue of $2.3 million at the Capital Hilton, Hilton La Jolla Torrey Pines, Chicago Sofitel Magnificent Mile, Seattle Marriott Waterfront, Key West Pier House, Tampa Renaissance and Plano Marriott Legacy Town Center. These increases were partially offset by a lower aggregate food and beverage revenue of $1.1 million at the San Francisco Courtyard Downtown and Philadelphia Courtyard as well as lower food and beverage revenue of $555,000 at the Seattle Courtyard Downtown due to its sale on July 1, 2016.
Other Hotel Revenue
.
Other hotel revenue, which consists mainly of telecommunications, parking, spa and rentals, increased $8.2 million, or 58.4%, to $22.3 million in 2016 as compared to 2015. This increase is attributable to an increase of $7.5 million at the Ritz-Carlton, St. Thomas and $725,000 at the Bardessono Hotel due to their acquisitions in 2015. There was also an aggregate increase of $1.5 million at the Hilton La Jolla Torrey Pines, Plano Marriott Legacy Town Center, Tampa Renaissance, Philadelphia Courtyard and Seattle Marriott Waterfront. These increases were partially offset by lower aggregate other hotel revenue at the Chicago Sofitel Magnificent Mile, Key West Pier House, San Francisco Courtyard Downtown and Capital Hilton of approximately $923,000 and of $526,000 at the Seattle Courtyard Downtown due to its sale on July 1, 2016.
Other Non-Hotel Revenue
.
Other non-hotel revenue decreased $19,000, or 12.9%, to $128,000 in 2016 as compared to 2015. The decrease is attributable to lower Texas margin tax recoveries from guests.
Rooms Expense
.
Rooms expense increased $9.2 million, or 16.3%, to $65.5 million in 2016 as compared to 2015. The increase is primarily attributable to an increase in rooms revenue at our nine comparable hotel properties and the acquisitions of the Ritz-Carlton St. Thomas and the Bardessono Hotel in 2015, partially offset by lower rooms expense at the Seattle Courtyard Downtown due to its sale on July 1, 2016.
Food and Beverage Expense
.
Food and beverage expense increased $14.9 million, or 27.9%, to $68.5 million during 2016 as compared to 2015. The increase is primarily attributable to the acquisitions of the Bardessono Hotel and the Ritz-Carlton St. Thomas in 2015 and higher revenue at our nine comparable hotel properties. These increases were partially offset by the sale of Seattle Courtyard Downtown.
Other Operating Expenses
.
Other operating expenses increased $19.4 million, or 20.7%, to $113.1 million in 2016 as compared to 2015. Other operating expenses consist of direct expenses from departments associated with revenue streams and indirect expenses associated with support departments and incentive management fees. We experienced an increase of $2.6 million in direct expenses and an increase of $16.8 million in indirect expenses and incentive management fees in 2016 as compared to 2015. Direct expenses were 1.7% of total hotel revenue for 2016 and 1.3% for 2015. The increase in direct expenses is comprised of an increase of a $3.8 million as a result of the acquisitions of the Bardessono Hotel and the Ritz-Carlton St. Thomas in 2015 partially offset by decreases of $1.2 million at our nine comparable hotel properties and $47,000 from the sale of Seattle Courtyard Downtown on July 1, 2016. The increase in indirect expenses is primarily attributable to increases in (i) general and administrative costs of $8.1 million, including $2.2 million from our nine comparable hotel properties and $6.4 million from the two hotel properties acquired in 2015, partially offset by a decrease of $483,000 from the sold hotel property; (ii) marketing costs of $3.5 million, comprised of $889,000 from our nine comparable hotel properties and $3.2 million from the two acquired hotel properties, partially offset by a decrease of $563,000 from the sold hotel property; (iii) repairs and maintenance of $2.9 million, including $3.4 million from our two acquired hotel properties partially offset by a decrease of $199,000 from our nine comparable hotel properties and $229,000 from the sold hotel property; (iv) lease expense of $1.0 million, comprised of $1.0 million from our two acquired hotel properties and $33,000 from our nine comparable hotel properties, partially offset by a decrease of $5,000 from the sold hotel property; and (v) energy costs of $2.0 million, comprised of $2.2 million from our two acquired hotel properties, partially offset by a decrease of $84,000 from our nine comparable hotel properties as well as $156,000 from the sold hotel property. These increases were partially offset by a decrease in incentive management fees of $736,000 which is comprised of $863,000 from our sold hotel property and $78,000 from our two acquired hotel properties, partially offset by an increase of $205,000 from our nine comparable hotel properties.
Management Fees
.
Base management fees increased $1.4 million, or 10.0%, to $15.5 million in 2016 as compared to 2015. The increase is comprised of an increase of $1.7 million as a result of the acquisitions of the Bardessono Hotel and the Ritz-Carlton St. Thomas in 2015 and $245,000 from our nine comparable hotel properties due to higher hotel revenue in 2016, partially offset by a decrease of $579,000 from the sale of Seattle Courtyard Downtown on July 1, 2016.
Property Taxes, Insurance and Other
.
Property taxes, insurance and other increased $2.0 million, or 10.9%, to $20.5 million in 2016 as compared to 2015, which is comprised of an increase of $1.3 million from the two acquired hotel properties and $933,000 from our nine comparable hotel properties, partially offset by a decrease of $294,000 from the sale of Seattle Courtyard Downtown on July 1, 2016.
86
Depreciation and Amortization
.
Depreciation and amortization increased $2.1 million, or 4.7%, to $45.9 million in 2016 as compared to 2015. The increase is due to $4.3 million of depreciation and amortization associated with the acquisitions of the Bardessono Hotel and the Ritz-Carlton St. Thomas in 2015 and higher depreciation of $1.7 million attributable to capital expenditures that have occurred during 2016, partially offset by lower depreciation of $2.6 million as a result of fully depreciated furniture, fixtures and equipment and $1.3 million from the sale of the Seattle Courtyard Downtown on July 1, 2016.
Advisory Services Fee.
Advisory services fee decreased $2.9 million, or 16.4%, to $15.0 million in 2016 as compared to 2015 as a result of a decrease in the incentive fee of $3.8 million and base advisory fee of $305,000, partially offset by increases in reimbursable expenses of $971,000 and equity-based compensation of $222,000. In 2016, we recorded an advisory services fee of $15.0 million which included a base advisory fee of $8.3 million, reimbursable expenses of $2.8 million and equity-based compensation of $3.8 million associated with equity grants of our common stock and LTIP units awarded to the officers and employees of Ashford Inc. in connection with providing advisory services. In 2015, we incurred an advisory services fee of $17.9 million, which included a base advisory fee of $8.6 million, reimbursable expenses of $1.8 million, equity-based compensation of $3.6 million associated with equity grants of our common stock and LTIP units awarded to the officers and employees of Ashford Inc. in connection with providing advisory services and an incentive fee of $3.8 million.
Transaction Costs.
In 2016, we recorded transaction costs of $457,000 related to payment of transfer taxes. In 2015, we recorded transaction costs of $538,000 related to the acquisition of the Bardessono Hotel and Ritz-Carlton St. Thomas.
Corporate General and Administrative
.
Corporate general and administrative expenses increased $9.2 million, or 178.3%, to $14.3 million in 2016 as compared to 2015 as a result of increases in professional fees of $13.9 million, primarily related to the proxy contest and litigation, legal settlement of $2.5 million, higher public company costs of $84,000 and higher equity-based compensation to non-employee directors of $17,000. These increases were partially offset by insurance recoveries of $5.3 million related to the proxy contest and litigation and $2.0 million related to the legal settlement and lower miscellaneous expenses of $62,000. For more information on the proxy contest, litigation and settlement, please see “Item 3. Legal Proceedings” herein.
Equity in Earnings (Loss) of unconsolidated entity.
We recorded equity in loss of unconsolidated entity of $2.6 million in 2016 and $2.9 million in 2015 related to our investment in the AQUA U.S. Fund. This investment was liquidated in April 2016.
Interest Income
.
Interest income increased $133,000, or 391.2%, to $167,000 in 2016 as compared to 2015.
Gain (Loss) on sale of hotel property.
In 2016, we recorded a gain of $26.4 million related the sale of the Seattle Courtyard Downtown on July 1, 2016.
Other Income (Expense).
Other income (expense) changed $1.4 million, from other income of $1.2 million in 2015 to other expense of $165,000 in 2016. In 2016, we recognized a realized loss of $156,000 related to the maturity of options on futures contracts and $9,000 of commissions paid upon purchasing options on futures contracts. In 2015, we recognized a realized gain of $1.2 million comprised of a realized gain on marketable securities of $1.1 million and $218,000 of dividends related to marketable securities, partially offset by $59,000 of commissions paid upon purchasing options on futures contracts.
Interest Expense and Amortization of Loan Costs
.
Interest expense and amortization of loan costs increased $3.1 million, or 8.1%, to $40.9 million in 2016 as a result of the increase in interest expense and amortization of loan costs from the financings associated with the acquisitions of the Bardessono Hotel and Ritz-Carlton St. Thomas in 2015, partially offset by lower interest expense and amortization of loan costs from the sale of Seattle Courtyard Downtown on July 1, 2016. The average LIBOR rates for 2016 and 2015 were 0.45% and 0.20%, respectively.
Unrealized Gain (Loss) on Investment in Ashford Inc.
Unrealized loss on investment in Ashford Inc. decreased $5.6 million, or 74.1%, to $2.0 million for 2016 compared to 2015. The fair value is based on the closing market price of Ashford Inc. common stock at the end of the period.
Write-off of Loan Costs and Exit Fees
.
Write-off of loan costs and exit fees was $2.6 million for 2016, resulting from the write-off of unamortized loan costs of $2.5 million and exit fees of $108,000 related to the sale of the Seattle Courtyard Downtown. In 2015, we incurred fees of $54,000 in connection with the refinancing of our $69.0 million mortgage loan due September 2015, which had an outstanding balance of $69.0 million. The mortgage loan was replaced with a $70.0 million mortgage loan due March 2017.
Unrealized Gain (Loss) on Derivatives
.
Unrealized gain (loss) on derivatives was an unrealized gain of $425,000 and an unrealized loss of $3.3 million for 2016 and 2015, respectively. In 2016, we had an unrealized gain of $513,000 on interest floors, a $78,000 unrealized gain associated with the maturity of options on futures contracts, partially offset by unrealized losses of $71,000 and $95,000 on interest rate caps and options on futures contracts, respectively. In 2015, we had an unrealized loss of $3.3 million that consisted of a $3.0 million unrealized loss on interest rate floors, an unrealized loss on interest rate caps of $94,000
87
and a $195,000 unrealized loss on options on futures contracts. The fair value of the interest rate caps and floors are primarily based on movements in the LIBOR forward curve and the passage of time. The fair value of options on futures contracts is the last reported settlement price as of the measurement date.
Income Tax (Expense) Benefit
.
Income tax expense increased $1.3 million, or 498.5%, to $1.6 million in 2016 as compared to 2015. The increase in income tax expense in 2016 is primarily due to the partial release of the valuation allowance for our wholly-owned TRS in 2015 that was previously recorded on the deferred tax assets of the TRS, and that resulted in a non-cash deferred tax benefit in 2015.
Income (Loss) from Consolidated Entities Attributable to Noncontrolling Interests
.
The noncontrolling interest partner in consolidated entities was allocated income of $3.1 million and $2.4 million for 2016 and 2015, respectively. The noncontrolling interest in consolidated entities represented an ownership interest of 25% in two hotel properties held by one entity.
Net (Income) Loss Attributable to Redeemable Noncontrolling Interests in Operating Partnership.
Noncontrolling interests in operating partnership were allocated net income of $1.9 million and net loss of $393,000 for 2016 and 2015, respectively. Redeemable noncontrolling interests represented ownership interests in Ashford Prime OP of 13.90% and 12.75% as of December 31, 2016 and 2015, respectively.
Indebtedness
As of December 31,
2017
, gross outstanding indebtedness was approximately
$826.2 million
. The following table sets forth our indebtedness (in thousands):
|
Loan/Property(ies)
|
Number of
Assets
Encumbered
|
Outstanding
Balance at
December 31, 2017
|
Interest Rate at
December 31, 2017
|
Amortization
Period
(Years)
|
Maturity
Date
(7)
|
Fully Extended Maturity Date
|
|||||||||
|
Aareal Capital Corporation
(1)
|
2
|
|
$
|
190,010
|
|
4.21
|
%
|
30
(8)
|
Nov-2019
|
Nov-2021
|
|||||
|
The Capital Hilton, Washington, D.C.
|
|||||||||||||||
|
Hilton La Jolla Torrey Pines, La Jolla, CA
|
|||||||||||||||
|
Morgan Stanley
(10)
|
4
|
|
277,628
|
|
4.14
|
%
|
Interest only
|
Feb-2019
|
Feb-2024
|
||||||
|
Courtyard Philadelphia Downtown,
Philadelphia, PA
|
|||||||||||||||
|
Courtyard San Francisco Downtown, San Francisco, CA
|
|||||||||||||||
|
Seattle Marriott Waterfront, Seattle, WA
|
|||||||||||||||
|
Renaissance Tampa International Plaza, Tampa, FL
|
|||||||||||||||
|
Credit Agricole
(2)
|
1
|
|
70,000
|
|
3.81
|
%
|
Interest only
|
Mar-2018
|
Mar-2020
|
||||||
|
Pier House Resort, Key West, FL
|
|||||||||||||||
|
GACC
(3)
|
1
|
|
80,000
|
|
3.86
|
%
|
Interest only
|
Mar-2018
|
Mar-2019
|
||||||
|
Chicago Sofitel Magnificent Mile, Chicago, IL
|
|||||||||||||||
|
TIF Loan
(4)
|
—
|
|
8,098
|
|
12.85
|
%
|
Interest only
(9)
|
Jun-2018
|
Jun-2018
|
||||||
|
Courtyard Philadelphia Downtown, Philadelphia, PA
|
|||||||||||||||
|
BAML
(5)
|
1
|
|
40,000
|
|
4.11
|
%
|
Interest only
|
Aug-2022
|
Aug-2022
|
||||||
|
Bardessono Hotel, Yountville, CA
|
|||||||||||||||
|
Apollo
(6)
|
1
|
|
42,000
|
|
6.51
|
%
|
Interest only
|
Dec-2018
|
Dec-2020
|
||||||
|
Ritz-Carlton, St. Thomas, USVI
|
|||||||||||||||
|
JPMorgan
(11)
|
1
|
|
67,500
|
|
4.31
|
%
|
Interest only
|
Apr-2019
|
Apr-2022
|
||||||
|
Park Hyatt Beaver Creek, Beaver Creek, CO
|
|||||||||||||||
|
BAML
(12)
|
1
|
|
51,000
|
|
4.11
|
%
|
Interest only
|
May-2022
|
May-2022
|
||||||
|
Hotel Yountville, Yountville, CA
|
|||||||||||||||
|
Total/Weighted Average
|
12
|
|
$
|
826,236
|
|
4.32
|
%
|
||||||||
__________________
|
(1)
|
Interest rate is variable at LIBOR plus 2.65%. This loan requires that we maintain an interest rate cap agreement with a counterparty, and the terms of that agreement provide for a LIBOR cap of 7.5% for 75% of the loan balance. This loan includes two one-year extension options, subject to the satisfaction of certain conditions.
|
|
(2)
|
Interest rate is variable at LIBOR plus 2.25%. This loan requires that we maintain an interest rate cap agreement with a counterparty, and the terms of that agreement provide for a LIBOR cap of 4.0% for 80% of the loan balance. This loan includes three one-year extension options, subject to the satisfaction of certain conditions, of which the first extension option was exercised in March 2017.
|
88
|
(3)
|
Interest rate is variable at LIBOR plus 2.30%. This loan requires that we maintain an interest rate cap agreement with a counterparty, and the terms of that agreement provide for a LIBOR cap of 5.35%. This loan includes three one-year extension options, subject to the satisfaction of certain conditions, of which the second extension option was exercised in March 2017.
|
|
(4)
|
This loan relates to a tax increment financing district in the City of Philadelphia with respect to which we also hold a note receivable in the same principal amount and on the same terms.
|
|
(5)
|
Interest rate is variable at LIBOR plus 2.55%. This loan requires that we maintain an interest rate cap agreement with a counterparty, and the terms of that agreement provide for a LIBOR cap of 3.5%.
|
|
(6)
|
Interest rate is variable at LIBOR plus 4.95%. This loan requires that we maintain an interest rate cap agreement with a counterparty, and the terms of that agreement provide for a LIBOR cap of 11.61%. This loan includes three one-year extension options, of which the first was exercised in December 2017.
|
|
(7)
|
Maturity date assumes no future extensions.
|
|
(8)
|
Principal amortization based on 6% interest rate.
|
|
(9)
|
Principal amortization to the extent of excess tax revenues.
|
|
(10)
|
Interest rate is variable at LIBOR plus 2.58%. This loan requires that we maintain an interest rate cap agreement with a counterparty, and the terms of that agreement provide for a LIBOR cap of 3.0%. This loan includes five one-year extension options, subject to the satisfaction of certain conditions.
|
|
(11)
|
Interest rate is variable at LIBOR plus 2.75%. This loan requires that we maintain an interest rate cap agreement with a counterparty, and the terms of that agreement provide for a LIBOR cap of 3.0%
.
This loan includes three one-year extension options subject to satisfaction of certain conditions.
|
|
(12)
|
Interest rate is variable at LIBOR plus 2.55%. This loan requires that we maintain an interest rate cap agreement with a counterparty, and the terms of that agreement provide for a LIBOR cap of 3.5%
.
|
On January 18, 2017, we refinanced three mortgage loans with existing outstanding balances totaling approximately
$333.7 million
and a final maturity dates in April 2017. The new mortgage loan totaled $365.0 million, is interest only with a floating rate of LIBOR + 2.58% and has stated maturity of February 2019 with five one-year extension options, subject to the satisfaction of certain conditions. On November 1, 2017, we completed the sale of the Plano Marriott Legacy Town Center for $104.0 million in cash and repaid approximately
$87.4 million
on the mortgage loan that was previously secured in part by the hotel property. The mortgage loan is secured by
four
hotel properties: Seattle Marriott Waterfront, Tampa Renaissance, San Francisco Courtyard Downtown and Philadelphia Courtyard Downtown.
On March 31, 2017, in connection with the acquisition of the Park Hyatt Beaver Creek, we completed the financing of a
$67.5 million
mortgage loan. This mortgage loan is interest only and provides for a floating interest rate of LIBOR +
2.75%
. The stated maturity date of the mortgage loan is April 2019, with
three
one
-year extension options, subject to the satisfaction of certain conditions. The mortgage loan is secured by the Park Hyatt Beaver Creek.
On May 11, 2017, in connection with the acquisition of the Hotel Yountville, we completed the financing of a
$51.0 million
mortgage loan. This mortgage loan is interest only and provides for a floating interest rate of LIBOR +
2.55%
. The stated maturity date of the mortgage loan is
May 2022
. The mortgage loan is secured by the Hotel Yountville.
On August 18, 2017, we refinanced our existing
$40.0 million
mortgage loan with a final maturity date in December 2020 with a new
$40.0 million
mortgage loan that is interest only, provides for a floating interest rate of LIBOR +
2.55%
and has a stated maturity date of August 2022. The mortgage loan is secured by the Bardessono Hotel.
The following loans include various financial cash trap triggers. The Aareal Capital Corporation loan and Credit Agricole loan both have a 1.25x debt service coverage ratio requirement. The BAML Bardessono loan and the BAML Yountville loan both have a 1.20x debt service coverage ratio requirement. The GACC loan has a 7.1% debt yield requirement, the Morgan Stanley loan and the JPMorgan loan both have a 9.0% debt yield requirement and the Apollo loan has a 12.0% debt yield requirement. When these provisions are triggered, substantially all of the profit generated by the hotel properties securing such loan is deposited directly into lockbox accounts and then swept into cash management accounts for the benefit of our various lenders.
89
LIQUIDITY AND CAPITAL RESOURCES
Our short-term liquidity requirements consist primarily of funds necessary to pay for operating expenses and other expenditures directly associated with our hotel properties, including:
|
•
|
advisory fees payable to Ashford LLC;
|
|
•
|
recurring maintenance necessary to maintain our hotel properties in accordance with brand standards;
|
|
•
|
interest expense and scheduled principal payments on outstanding indebtedness, including our secured revolving credit facility (see “Contractual Obligations and Commitments”);
|
|
•
|
distributions, in the form of dividends on our common stock, necessary to qualify for taxation as a REIT;
|
|
•
|
dividends on preferred stock; and
|
|
•
|
capital expenditures to improve our hotel properties.
|
We expect to meet our short-term liquidity requirements generally through net cash provided by operations, existing cash balances and, if necessary, short-term borrowings under our secured revolving credit facility.
Our long-term liquidity requirements consist primarily of funds necessary to pay for the costs of acquiring additional hotel properties and redevelopments, renovations, expansions and other capital expenditures that need to be made periodically with respect to our hotel properties and scheduled debt payments. We expect to meet our long-term liquidity requirements through various sources of capital, including our secured revolving credit facility and future equity and preferred equity issuances, existing working capital, net cash provided by operations, proceeds from insurance claims, hotel mortgage indebtedness and other secured and unsecured borrowings. However, there are a number of factors that may have a material adverse effect on our ability to access these capital sources, including the state of overall equity and credit markets, our degree of leverage, our unencumbered asset base and borrowing restrictions imposed by lenders (including as a result of any failure to comply with financial covenants in our existing and future indebtedness), general market conditions for REITs, our operating performance and liquidity and market perceptions about us. The success of our business strategy will depend, in part, on our ability to access these various capital sources.
Our hotel properties will require periodic capital expenditures and renovation to remain competitive. In addition, acquisitions, redevelopments or expansions of hotel properties may require significant capital outlays. We may not be able to fund such capital improvements solely from net cash provided by operations because we must distribute annually at least 90% of our REIT taxable income, determined without regard to the deductions for dividends paid and excluding net capital gains, to qualify and maintain our qualification as a REIT, and we are subject to tax on any retained income and gains. As a result, our ability to fund capital expenditures, acquisitions or hotel redevelopment through retained earnings is very limited. Consequently, we expect to rely heavily upon the availability of debt or equity capital for these purposes. If we are unable to obtain the necessary capital on favorable terms, or at all, our financial condition, liquidity, results of operations and prospects could be materially and adversely affected.
Certain of our loan agreements contain cash trap provisions that may be triggered if the performance of our hotel properties decline. When these provisions are triggered, substantially all of the profit generated by the hotel properties securing such loan is deposited directly into lockbox accounts and then swept into cash management accounts for the benefit of our various lenders. This could affect our liquidity and our ability to make distributions to our stockholders until such time that a cash trap is no longer in effect for such loan.
On October 27, 2014, our board of directors approved a share repurchase program under which the Company may purchase up to $100 million of the Company’s common stock from time to time. The repurchase program does not have an expiration date. The specific timing, manner, price, amount and other terms of the repurchases are at management’s discretion and depend on market conditions, corporate and regulatory requirements and other factors. The Company is not required to repurchase shares under the repurchase program, and may modify, suspend or terminate the repurchase program at any time for any reason. On April 8, 2016, our board of directors authorized utilizing up to $50 million to repurchase common stock. No shares were repurchased during the year ended December 31, 2017, pursuant to this authorization. As of
December 31, 2017
, we have purchased a cumulative
4.3 million
shares of our common stock, for approximately
$63.2 million
, since the program’s inception on November 4, 2014.
On January 18, 2017, we refinanced three mortgage loans with existing outstanding balances totaling approximately
$333.7 million
and a final maturity dates in April 2017. The new mortgage loan totaled $365.0 million, is interest only with a floating rate of LIBOR + 2.58% and has stated maturity of February 2019 with five one-year extension options, subject to the satisfaction of certain conditions. On November 1, 2017, we completed the sale of the Plano Marriott Legacy Town Center for $104.0 million in cash and repaid approximately
$87.4 million
on the mortgage loan that was previously secured in part by the hotel property. The mortgage loan is secured by
four
hotel properties: Seattle Marriott Waterfront, Tampa Renaissance, San Francisco Courtyard Downtown and Philadelphia Courtyard Downtown.
90
On March 1, 2017, we commenced an underwritten public offering of approximately
5.8 million
shares of common stock at
$12.15
per share for gross proceeds of
$69.9 million
. The offering closed on March 7, 2017. The net proceeds from the sale of the shares after underwriting discounts and offering expense were approximately
$66.4 million
.
On March 7, 2017, we closed an offering of approximately
2.0 million
shares of our Series B Preferred Stock at
$20.19
per share for gross proceeds of
$39.9 million
. The net proceeds, after underwriting discounts and offering expenses were approximately
$38.2 million
. Dividends on the Series B Preferred Stock accrue at a rate of
5.50%
on the liquidation preference of
$25.00
per share. On March 31, 2017, the underwriters partially exercised their over-allotment option and purchased an additional
100,000
shares of the Series B Preferred Stock, which closed on April 5, 2017. The net proceeds from the partial exercise of the over-allotment option after underwriting discounts were approximately
$1.9 million
.
On March 31, 2017, in connection with the acquisition of Park Hyatt Beaver Creek, we completed the financing of a
$67.5 million
mortgage loan. This mortgage loan is interest only and provides for a floating interest rate of LIBOR +
2.75%
. The stated maturity date of the mortgage loan is April 2019, with
three
one
-year extension options. The mortgage loan is secured by the Park Hyatt Beaver Creek.
On May 11, 2017, in connection with the acquisition of Hotel Yountville, we completed the financing of a
$51.0 million
mortgage loan. This mortgage loan is interest only and provides for a floating interest rate of LIBOR +
2.55%
. The stated maturity date of the mortgage loan is
May 2022
. The mortgage loan is secured by the Hotel Yountville.
On August 18, 2017, we refinanced our existing
$40.0 million
mortgage loan with a final maturity date in December 2020 with a new
$40.0 million
mortgage loan that is interest only, provides for a floating interest rate of LIBOR +
2.55%
and a stated maturity date of August 2022. The mortgage loan is secured by the Bardessono Hotel.
On December 5, 2017, our board of directors reapproved the stock repurchase program pursuant to which the Board granted a repurchase authorization to acquire shares of the Company’s common stock, par value $0.01 per share having an aggregate value of up to
$50 million
. The Board’s authorization replaced any previous repurchase authorizations. On December 11, 2017, we entered into equity distribution agreements with Morgan Stanley & Co. LLC and UBS Securities LLC, each acting as a sales agent (the “Equity Distribution Agreements”). Pursuant to the Equity Distribution Agreements, we may sell from time to time through the sales agents shares of our common stock having an aggregate offering price of up to $50.0 million. Sales of shares of our common stock, if any, may be made in negotiated transactions or transactions that are deemed to be “at-the-market” offerings as defined in Rule 415 of the Securities Act, including sales made directly on the New York Stock Exchange, the existing trading market for our common stock, or sales made to or through a market maker other than on an exchange or through an electronic communications network. We will pay each of the sales agents a commission, which in each case shall not be more than 2.0% of the gross sales price of the shares of our common stock sold through such sales agent. As of December 31, 2017, no shares of our common stock have been sold under this program.
For more information, please see “Management’s Discussion and Analysis of Financial Condition and Results of Operations—Indebtedness” herein.
Secured Revolving Credit Facility
We have a three-year, senior secured revolving credit facility in the amount of $100 million. It includes $15 million available in letters of credit and $15 million available in swingline loans. We believe the secured revolving credit facility will provide us with significant financial flexibility to fund future acquisitions and hotel redevelopments.
The secured credit facility is provided by a syndicate of financial institutions with Bank of America, N.A., serving as the administrative agent to Ashford Prime OP, as the borrower. We and certain of our subsidiaries guarantee the secured revolving credit facility, which is secured by a pledge of 100% of the equity interests we hold in Ashford Prime OP and 100% of the equity interest issued by any guarantor (other than Ashford Prime) or any other subsidiary of ours that is not restricted under its loan documents or organizational documents from having its equity pledged (subject to certain exclusions), all mortgage receivables held by the borrower or any guarantor, and certain deposit accounts and securities accounts held by the borrower and any guarantor. The proceeds of the secured revolving credit facility may be used for working capital, capital expenditures, property acquisitions, and any other lawful purposes.
The secured revolving credit facility also contains customary terms, covenants, negative covenants, events of default, limitations and other conditions for credit facilities of this type. Subject to certain exceptions, we are subject to restrictions on incurring additional indebtedness, mergers and fundamental changes, sales or other dispositions of property, changes in the nature of our business, investments and capital expenditures.
91
We also are subject to certain financial covenants, as set forth below, which are tested by the borrower on a consolidated basis (net of the amounts attributable to the non-controlling interest held by our partner in a majority-owned consolidated entity) and include, but are not limited to, the following:
|
•
|
Consolidated indebtedness (less cash and cash equivalents in excess of $10,000,000) to total asset value (based on property capitalization rates defined within the secured revolving credit facility agreement) not to exceed 60%. Our ratio was 45.1% at
December 31, 2017
.
|
|
•
|
Consolidated recourse indebtedness other than the secured revolving credit facility not to exceed $50,000,000.
|
|
•
|
Consolidated fixed charge coverage ratio not less than 1.40x initially, with such ratio being increased beginning October 1, 2017 to 1.50x. This ratio was 2.14x at
December 31, 2017
.
|
|
•
|
Indebtedness of the consolidated parties that accrues interest at a variable rate (other than the secured revolving credit facility) that is not subject to a “cap,” “collar,” or other similar arrangement not to exceed 25% of consolidated indebtedness.
|
|
•
|
Consolidated tangible net worth not less than 75% of the consolidated tangible net worth on the closing date of the secured revolving credit facility plus 75% of the net proceeds of any future equity issuances.
|
|
•
|
Secured debt that is secured by real property not to exceed 70% of the as-is appraised value of such real property.
|
All financial covenants are tested and certified by the borrower on a quarterly basis. We were in compliance with all covenants at
December 31, 2017
.
The secured revolving credit facility includes customary events of default and the occurrence of an event of default will permit the lenders to terminate commitments to lend under the secured revolving credit facility and accelerate payment of all amounts outstanding thereunder. If a default occurs and is continuing, we will be precluded from making distributions on our shares of common stock (other than those required to allow us to qualify and maintain our status as a REIT, so long as such default does not arise from a payment default or event of insolvency).
Borrowings under the secured revolving credit facility bear interest, at our option, at either LIBOR for a designated interest period plus an applicable margin, or the base rate (as defined in the credit agreement) plus an applicable margin. The applicable margin for borrowings under the secured revolving credit facility for base rate loans range from 1.25% to 2.50% per annum and the applicable margin for borrowings under the secured revolving credit facility for LIBOR loans range from 2.25% to 3.50% per annum, depending on the ratio of consolidated indebtedness to EBITDA described above, with the lowest rate applying if such ratio is less than 4x and the highest rate applying if such ratio is greater than 6.5x.
The secured revolving credit facility is a three-year interest-only facility with all outstanding principal being due at maturity on November 10, 2019, subject to two one-year extension options if certain terms and conditions are satisfied and a 0.25% extension fee. The secured revolving credit facility has an accordion feature whereby the aggregate commitments may be increased up to $250 million, subject to certain terms. No amounts were drawn under the secured revolving credit facility as of
December 31, 2017
.
We intend to repay any indebtedness incurred under our secured revolving credit facility from time to time out of net cash provided by operations and from the net proceeds of issuances of additional equity and debt securities, as market conditions permit.
Sources and Uses of Cash
As of December 31,
2017
, we had
$137.5 million
of cash and cash equivalents compared to
$126.8 million
at December 31,
2016
. We anticipate that our principal sources of funds to meet our cash requirements will include cash on hand, positive cash flow from operations and capital market activities. We anticipate using funds to pay for (i) capital expenditures for our
twelve
hotel properties, estimated to be approximately
$79.9 million
through
2018
and (ii) debt interest and principal payments estimated to be approximately
$38.6 million
through
2018
.
Net Cash Flows Provided by (Used in) Operating Activities
. Net cash flows provided by operating activities were
$70.6 million
and
$58.6 million
for the years ended December 31,
2017
and
2016
, respectively. Cash flows from operations are impacted by changes in hotel operations of our ten comparable hotel properties, the sale of the Seattle Courtyard Downtown on July 1, 2016 and the sale of the
Plano Marriott Legacy Town Center
on November 1, 2017 as well as the acquisitions of the Park Hyatt Beaver Creek on March 31, 2017 and Hotel Yountville on May 11, 2017. Cash flows from operations are also impacted by the timing of working capital cash flows such as collecting receivables from hotel guests, paying vendors, settling with derivative counterparties, settling with related parties and settling with hotel managers.
Net Cash Flows Provided by (Used in) Investing Activities
. For the year ended December 31,
2017
, net cash flows used in investing activities were
$173.9 million
. These cash outflows were primarily attributable to
$248.2 million
for acquisitions and
$43.0 million
of capital improvements made to various hotel properties, partially offset by
$103.1 million
of net cash proceeds
92
from the sale of the
Plano Marriott Legacy Town Center
,
$11.9 million
of insurance proceeds received related to the hurricanes and
$2.3 million
of proceeds received from the liquidation of our investment in the AQUA U.S. Fund. For the year ended December 31,
2016
, net cash flows provided by investing activities were
$103.5 million
. These cash inflows primarily attributable to
$82.7 million
of net cash proceeds received from the sale of Seattle Courtyard Downtown,
$43.5 million
of net proceeds received from the liquidation of our investment in the AQUA U.S. Fund and
$691,000
of proceeds from property insurance claims. These cash inflows were partially offset by
$23.4 million
of capital improvements made to various hotel properties.
Net Cash Flows Provided by (Used in) Financing Activities.
For the year ended December 31,
2017
, net cash flows provided by financing activities were
$124.0 million
. Cash inflows primarily consisted of borrowings on indebtedness of
$523.5 million
, proceeds of
$66.4 million
from the issuance of common stock and
$40.2 million
from the issuance of convertible preferred stock. These cash inflows were partially offset by
$464.2 million
for repayments of indebtedness,
$27.1 million
for payments of dividends and distributions,
$11.3 million
for payments of loan costs and exit fees and
$2.7 million
for distributions to the holder of a noncontrolling interest in consolidated entities. For the
year ended
December 31, 2016
, net cash flows used in financing activities were
$135.6 million
. Cash outflows primarily consisted of
$73.3 million
for repayments of indebtedness,
$39.2 million
for the repurchase of common stock under our share repurchase program,
$16.9 million
for payments of dividends and distributions,
$6.4 million
for distributions to the holder of a noncontrolling interest in consolidated entities and
$4.1 million
for payments of loan costs and exit fees. These cash outflows were partially offset by cash inflows related to proceeds from the issuance of preferred stock of
$4.2 million
Inflation
We rely entirely on the performance of our properties and the ability of the properties’ managers to increase revenues to keep pace with inflation. Hotel operators can generally increase room rates rather quickly, but competitive pressures may limit their ability to raise rates faster than inflation. Our general and administrative costs, real estate and personal property taxes, property and casualty insurance, and utilities are subject to inflation as well.
Off-Balance Sheet Arrangements
In the normal course of business, we may form or invest in partnerships or joint ventures. We evaluate each partnership and joint venture to determine whether the entity is a variable interest entity (“VIE”). If the entity is determined to be a VIE we assess whether we are the primary beneficiary and need to consolidate the entity. For further discussion see note 2 to our consolidated financial statements. We have no other off-balance sheet arrangements.
Contractual Obligations and Commitments
The table below summarizes future obligations for principal and estimated interest payments on our debt and future minimum lease payments on our operating leases, each as of December 31,
2017
(in thousands):
|
Payments Due by Period
|
||||||||||||||||||||
|
< 1 Year
|
1-3 Years
|
3-5 Years
|
> 5 Years
|
Total
|
||||||||||||||||
|
Contractual obligations excluding extension options:
|
||||||||||||||||||||
|
Long-term debt obligations
|
$
|
203,274
|
|
$
|
531,962
|
|
$
|
91,000
|
|
$
|
—
|
|
$
|
826,236
|
|
|||||
|
Estimated interest obligations
(1)
|
28,369
|
|
14,865
|
|
5,559
|
|
—
|
|
48,793
|
|
||||||||||
|
Operating lease obligations
|
3,449
|
|
6,872
|
|
6,927
|
|
158,176
|
|
175,424
|
|
||||||||||
|
Capital commitments
|
22,251
|
|
—
|
|
—
|
|
—
|
|
22,251
|
|
||||||||||
|
Total contractual obligations
|
$
|
257,343
|
|
$
|
553,699
|
|
$
|
103,486
|
|
$
|
158,176
|
|
$
|
1,072,704
|
|
|||||
|
(1)
|
For variable-rate indebtedness, interest obligations are estimated based on the LIBOR interest rate as of December 31,
2017
.
|
In addition to the amounts discussed above, we also have management agreements which require us to pay monthly management fees, incentive fees, group service fees and other general fees, if required. These management agreements expire from December 2019 through December 2065. See “Item 1. Business - Hotel Management Agreements.”
Some of our loan agreements contain financial and other covenants. If we violate these covenants, we could be required to repay a portion of our indebtedness before maturity at a time when we might be unable to arrange financing for such repayment on attractive terms, if at all. We were in compliance with all covenants at
December 31, 2017
.
93
Critical Accounting Policies
Our accounting policies are fully described in note 2 to our consolidated financial statements included in “Item 8. Financial Statements and Supplementary Data.” We believe that the following discussion addresses our most critical accounting policies, representing those policies considered most vital to the portrayal of our financial condition and results of operations and require management’s most difficult, subjective and complex judgments.
Investments in Hotel Properties
.
Hotel properties are generally stated at cost. For hotel properties owned through our majority-owned entities, the carrying basis attributable to the partners’ minority ownership is recorded at historical cost, net of any impairment charges, while the carrying basis attributable to our majority ownership is recorded based on the allocated purchase price of our ownership interests in the entities. All improvements and additions which extend the useful life of the hotel properties are capitalized.
Impairment of Investments in Hotel Properties.
Hotel properties are reviewed for impairment whenever events or changes in circumstances indicate that their carrying amounts may not be recoverable. Recoverability of the hotel is measured by comparison of the carrying amount of the hotel to the estimated future undiscounted cash flows, which take into account current market conditions and our intent with respect to holding or disposing of the hotel. If our analysis indicates that the carrying value of the hotel is not recoverable on an undiscounted cash flow basis, we recognize an impairment charge for the amount by which the property’s net book value exceeds its estimated fair value, less cost to sell. In evaluating the impairment of hotel properties, we make many assumptions and estimates, including projected cash flows, expected holding period and expected useful life. Fair value is determined through various valuation techniques, including internally developed undiscounted cash flow models, comparable market transactions and third-party appraisals, where considered necessary. Asset write-downs resulting from property damage are recorded up to the amount of the allocable property insurance deductible in the period that the property damage occurs. During the year ended
December 31, 2017
, the Company recognized impairment charges, net of anticipated insurance recoveries of
$1.1 million
. During the years ended December 31,
2016
and
2015
, we did not record any impairment charges.
Depreciation and Amortization Expense
.
Depreciation expense is based on the estimated useful life of the assets, while amortization expense for leasehold improvements is based on the shorter of the lease term or the estimated useful life of the related assets. Presently, hotel properties are depreciated using the straight-line method over lives which range from 7.5 to 39 years for buildings and improvements and 1.5 to 5 years for furniture, fixtures and equipment. While we believe our estimates are reasonable, a change in estimated lives could affect depreciation expense and net income (loss) as well as resulting gains or losses on potential hotel sales.
Income Taxes
.
At December 31,
2017
and
2016
, we had a valuation allowance of approximately $15.4 million and $27.0 million, respectively, to partially reserve our deferred tax assets. At each reporting date, we evaluate whether it is more likely than not that we will utilize all or a portion of our deferred tax assets. We consider all available positive and negative evidence, including historical results of operations, projected future taxable income, carryback potential and scheduled reversals of deferred tax liabilities. In evaluating the objective evidence that historical results provide, we consider three years of consolidated cumulative operating income (loss). At December 31,
2017
, we had net operating loss carry forwards for federal income tax purposes of $57.2 million, $2.7 million of which are attributable to the subsidiaries conveyed to us in the spin-off and begin to expire in 2023 and $54.5 million of which are attributable to the USVI TRS acquired in 2015 that begin to expire in 2027. The loss carry forwards may be available to offset future taxable income, if any, through 2023 and 2027, respectively; however, there could be substantial limitations on their use imposed by the Internal Revenue Code. Management determined that it is more likely than not that $15.4 million of our net deferred tax assets will not be realized and a valuation allowance has been recorded accordingly.
The “Income Taxes” Topic of the Financial Accounting Standards Board’s (“FASB”) Accounting Standards Codification addresses the accounting for uncertainty in income taxes recognized in an enterprise’s financial statements. The guidance requires us to determine whether tax positions we have taken or expect to take in a tax return are more likely than not to be sustained upon examination by the appropriate taxing authority based on the technical merits of the positions. Tax positions that do not meet the more likely than not threshold would be recorded as additional tax expense in the current period. We analyze all open tax years, as defined by the statute of limitations for each jurisdiction, which includes the federal jurisdiction and various states. We classify interest and penalties related to underpayment of income taxes as income tax expense. We and our subsidiaries file income tax returns in the U.S. federal jurisdiction and various states and cities. Tax years 2013 through
2017
remain subject to potential examination by certain federal and state taxing authorities.
On December 22, 2017, President Trump signed the Tax Cuts and Jobs Act (“Tax Reform”) into legislation. Under ASC 740, the effects of changes in tax rates and laws are recognized in the period in which the new legislation is enacted. In the case of U.S. federal income taxes, the enactment date is the date the bill becomes law (i.e., upon presidential signature). With respect to this legislation, we expect a one-time tax benefit of approximately $216,000, due to a revaluation of our net deferred tax liabilities resulting from the decrease in the corporate federal income tax rate from 35% to 21%. We are in the process of analyzing certain
94
other provisions of this legislation which may impact our effective tax rate. Additionally on December 22, 2017, the SEC staff issued Staff Accounting Bulletin No. 118 (“SAB 118”) to address the application of U.S. GAAP in situations when a registrant does not have the necessary information available, prepared, or analyzed (including computations) in reasonable detail to complete the accounting for certain income tax effects of the Tax Reform Act. The Company has recognized the provisional tax impacts related to the revaluation of deferred tax assets and liabilities and included these amounts in its consolidated financial statements for the year ended December 31, 2017. The ultimate impact may differ from these provisional amounts, due to, among other things, additional analysis, changes in interpretations and assumptions the Company has made, additional regulatory guidance that may be issued and actions the Company may take as a result of the Tax Reform Act. The accounting is expected to be complete on or before the date the 2017 U.S. income tax returns are filed in 2018.
Investment in Unconsolidated Entity.
We hold approximately
195,000
shares of Ashford Inc. common stock, which represented an approximate
9.3%
ownership interest in Ashford Inc. and had a fair value of
$18.1 million
at
December 31, 2017
. This investment would typically be accounted for under the equity method of accounting, under ASC 323-10 -
Investments - Equity Method and Joint Ventures
. However, we have elected to record our investment in Ashford Inc. using the fair value option under ASC 825-10 -
Fair Value Option - Financial Assets and Financial Liabilities
.
RECENTLY ADOPTED ACCOUNTING STANDARDS
In November 2016, the
Financial Accounting Standards Board (“
FASB”) issued ASU 2016-18,
Statement of Cash Flows (Topic 230): Restricted Cash
(“ASU 2016-18”), which clarifies the presentation of restricted cash and restricted cash equivalents in the statements of cash flows. Under ASU 2016-18 restricted cash and restricted cash equivalents are included with cash and cash equivalents when reconciling the beginning-of-period and end-of-period total amounts shown on the statements of cash flows. ASU 2016-18 is effective for fiscal years beginning after December 15, 2017, and interim periods within those fiscal years. Early adoption is permitted. We adopted this standard effective January 1, 2017 on a retrospective basis. The adoption of this standard resulted in the inclusion of restricted cash with cash and cash equivalents when reconciling the beginning-of-period and end-of-period total amounts shown on the statements of cash flows for all periods presented. As a result, net cash provided by operating activities increased
$1.5 million
and net cash provided by investing activities increased
$3.2 million
for the year ended December 31,
2016
. For the year ended December 31, 2015, net cash provided by operating activities decreased
$418,000
and net cash used in investing activities decreased
$3.9 million
. Our beginning-of-period cash, cash equivalents and restricted cash increased
$37.9 million
,
$33.1 million
and
$29.6 million
in 2017, 2016 and 2015, respectively.
RECENTLY ISSUED ACCOUNTING STANDARDS
In May 2014, the FASB issued ASU
2014-09,
Revenue from Contracts with Customers
(“ASU 2014-09”). ASU 2014-09 is a comprehensive new revenue recognition model, which requires a company to recognize revenue to depict the transfer of promised goods or services to a customer in an amount that reflects the consideration the company expects to receive in exchange for those goods or services. The update will replace most existing revenue recognition guidance in U.S. GAAP when it becomes effective. In August 2015, the FASB issued ASU 2015-14,
Revenue From Contracts With Customers (Topic 606): Deferral of the Effective Date
, which defers the effective date to fiscal periods beginning after December 15, 2017. The standard permits the use of either the retrospective or cumulative effect (modified) transition method. Based on our assessment of this standard, it will not materially affect the amount or timing of revenue recognition for revenues from room, food and beverage, and other hotel level sales. Additionally, we have historically disposed of hotel properties for cash sales with no contingencies and no future involvement in the hotel operations. Therefore, ASU No. 2014-09 will not impact the recognition of hotel sales. We have selected the modified retrospective method. We continue to evaluate the related disclosure requirements.
In January 2016, the FASB issued ASU 2016-01,
Recognition and Measurement of Financial Assets and Financial Liabilities
(“ASU 2016-01”), which requires an entity to: (i) measure equity investments at fair value through net income, with certain exceptions; (ii) present in OCI the changes in instrument-specific credit risk for financial liabilities measured using the fair value option; (iii) present financial assets and financial liabilities by measurement category and form of financial asset; (iv) calculate the fair value of financial instruments for disclosure purposes based on an exit price and; (v) assess a valuation allowance on deferred tax assets related to unrealized losses of available-for-sale (“AFS”) debt securities in combination with other deferred tax assets. ASU 2016-01 provides an election to subsequently measure certain nonmarketable equity investments at cost less any impairment and adjusted for certain observable price changes. It also requires a qualitative impairment assessment of such equity investments and amends certain fair value disclosure requirements. ASU 2016-01 is effective for fiscal years beginning after December 15, 2017, including interim periods within those fiscal years. Certain provisions of ASU 2016-01 are eligible for early adoption. We do not expect that ASU 2016-01 will have a material impact on our consolidated financial statements and related disclosures.
In February 2016, the FASB issued ASU 2016-02,
Leases
(“ASU 2016-02”). The new standard establishes a right-of-use (“ROU”) model that requires a lessee to record a ROU asset and a lease liability on the balance sheet for all leases with terms
95
longer than 12 months. Leases will be classified as either finance or operating, with classification affecting the pattern of expense recognition in the income statement. ASU 2016-02 is effective for fiscal years beginning after December 15, 2018, including interim periods within those fiscal years. Early adoption is permitted. A modified retrospective transition approach is required for lessees for capital and operating leases existing at, or entered into after, the beginning of the earliest comparative period presented in the financial statements, with certain practical expedients available. The accounting for leases under which we are the lessor remains largely unchanged. While we are currently in the initial stages of assessing the impact that ASU 2016-02 will have on our consolidated financial statements, we expect the primary impact to our consolidated financial statements upon adoption will be the recognition, on a discounted basis, of our future minimum rentals due under our hotel ground leases and other noncancelable leases on our consolidated balance sheets resulting in the recording of ROU assets and lease obligations.
In June 2016, the FASB issued ASU 2016-13,
Financial Instruments - Credit Losses (Topic 326): Measurement of Credit Losses on Financial Instruments
("ASU 2016-13"). The ASU sets forth an “expected credit loss” impairment model to replace the current “incurred loss” method of recognizing credit losses. The standard requires measurement and recognition of expected credit losses for most financial assets held. The ASU is effective for fiscal years beginning after December 15, 2019, including interim periods within those fiscal years. Early adoption is permitted for periods beginning after December 15, 2018. We are currently evaluating the impact that ASU 2016-13 will have on our consolidated financial statements and related disclosures.
In August 2016, the FASB issued ASU 2016-15,
Statement of Cash Flows (Topic 230): Classification of Certain Cash Receipts and Cash Payments - a consensus of the Emerging Issues Task Force
(“ASU 2016-15”). The new guidance is intended to reduce diversity in practice in how certain transactions are classified in the statement of cash flows. Certain issues addressed in this guidance include - debt payments or debt extinguishment costs, contingent consideration payments made after a business combination, proceeds from the settlement of insurance claims, distributions received from equity method investments and beneficial interests in securitization transactions. ASU 2016-15 is effective for fiscal years beginning after December 15, 2017, and interim periods within those fiscal years. Early adoption is permitted. We are currently evaluating the impact that ASU 2016-15 will have on our consolidated financial statements and related disclosures.
In January 2017, the FASB issued ASU 2017-01,
Business Combinations (Topic 805) - Clarifying the Definition of a Business
(“ASU 2017-01”), which clarifies the definition of a business with the objective of adding guidance to assist entities with evaluating whether a transaction should be accounted for as an acquisition (or disposal) of an asset or a business. ASU 2017-01 is effective for fiscal years beginning after December 15, 2017. Early adoption is permitted. While we are currently evaluating the potential impact of the standard, we currently expect that certain future hotel acquisitions may be considered asset acquisitions rather than business combinations, which would affect capitalization of acquisitions costs (such costs are expensed for business combinations and capitalized for asset acquisitions).
In February 2017, the FASB issued ASU 2017-05,
Other Income-Gains and Losses from the Derecognition of Nonfinancial Assets (Subtopic 610-20): Clarifying the Scope of Asset Derecognition Guidance and Accounting for Partial Sales of Nonfinancial Assets
(ASU “2017-05”), which clarifies the scope of ASC Subtopic 610-20,
Other Income-Gains and Losses from the Derecognition of Nonfinancial Assets
and adds guidance for partial sales of nonfinancial assets. ASU 2017-05 is effective for fiscal years beginning after December 15, 2017. Early adoption is permitted. An entity may elect to apply ASU 2017-05 under a retrospective or modified retrospective approach. We are evaluating the impact that ASU 2017-05 will have on our consolidated financial statements and related disclosures.
Non-GAAP Financial Measures
The following non-GAAP presentations of EBITDA, Adjusted EBITDA, Hotel EBITDA, Funds From Operations (“FFO”) and Adjusted FFO (“AFFO”) are made to help our investors evaluate our operating performance.
EBITDA is defined as net income (loss) attributable to the Company before interest expense and amortization of loan costs, interest income, depreciation and amortization, income taxes and redeemable noncontrolling interests in the operating partnership. We adjust EBITDA to exclude certain additional items such as amortization of favorable (unfavorable) contract assets (liabilities), transaction and management conversion costs, (gain) loss on sale of hotel property, write-off of loan costs and exit fees, (gain) loss on insurance settlements, legal, advisory and settlement costs, contract modification cost, software implementation costs, impairment and uninsured hurricane related costs, other (income) expense and non-cash items such as unrealized (gain) loss on investments, unrealized (gain) loss on derivatives, stock/unit-based compensation and the Company’s portion of unrealized (gain) loss of investment in securities investment fund. Unless otherwise indicated, EBITDA and Adjusted EBITDA exclude amounts attributable to the portion of a partnership owned by the third party. We present EBITDA and Adjusted EBITDA because we believe they reflect more accurately the ongoing performance of our hotel assets and other investments and provide more useful information to investors as they are indicators of our ability to meet our future debt payment requirements, working capital requirements and they provide an overall evaluation of our financial condition. EBITDA and Adjusted EBITDA as calculated by us may not be comparable to EBITDA and Adjusted EBITDA reported by other companies that do not define EBITDA and Adjusted
96
EBITDA exactly as we define the terms. EBITDA and Adjusted EBITDA do not represent cash generated from operating activities determined in accordance with GAAP, and should not be considered as an alternative to operating income or net income determined in accordance with GAAP as an indicator of performance or as an alternative to cash flows from operating activities as determined by GAAP as an indicator of liquidity.
The following table reconciles net income (loss) to EBITDA and Adjusted EBITDA (in thousands)(unaudited):
|
Year Ended December 31,
|
|||||||||||
|
2017
|
2016
|
2015
|
|||||||||
|
Net income (loss)
|
$
|
28,324
|
|
$
|
24,320
|
|
$
|
(4,691
|
)
|
||
|
(Income) loss from consolidated entities attributable to noncontrolling interest
|
(3,264
|
)
|
(3,105
|
)
|
(2,414
|
)
|
|||||
|
Net (income) loss attributable to redeemable noncontrolling interests in operating partnership
|
(2,038
|
)
|
(1,899
|
)
|
393
|
|
|||||
|
Net income (loss) attributable to the Company
|
23,022
|
|
19,316
|
|
(6,712
|
)
|
|||||
|
Interest income
(1)
|
(683
|
)
|
(167
|
)
|
(34
|
)
|
|||||
|
Interest expense and amortization of loan costs
(1)
|
37,029
|
|
39,232
|
|
36,309
|
|
|||||
|
Depreciation and amortization
(1)
|
49,361
|
|
43,054
|
|
40,950
|
|
|||||
|
Income tax expense (benefit)
(1)
|
(389
|
)
|
1,574
|
|
263
|
|
|||||
|
Net income (loss) attributable to redeemable noncontrolling interests in operating partnership
|
2,038
|
|
1,899
|
|
(393
|
)
|
|||||
|
EBITDA available to the Company and OP unitholders
|
110,378
|
|
104,908
|
|
70,383
|
|
|||||
|
Amortization of favorable (unfavorable) contract assets (liabilities)
|
180
|
|
106
|
|
(158
|
)
|
|||||
|
Transaction and management conversion costs
|
6,774
|
|
457
|
|
633
|
|
|||||
|
Other (income) expense
|
377
|
|
165
|
|
(1,233
|
)
|
|||||
|
(Gain) loss on insurance settlements
|
—
|
|
—
|
|
(21
|
)
|
|||||
|
(Gain) loss on sale of hotel property
|
(23,797
|
)
|
(26,359
|
)
|
—
|
|
|||||
|
Write-off of loan costs and exit fees
|
3,874
|
|
2,595
|
|
54
|
|
|||||
|
Unrealized (gain) loss on investment in Ashford Inc.
|
(9,717
|
)
|
1,970
|
|
7,609
|
|
|||||
|
Unrealized (gain) loss on derivatives
(1)
|
2,053
|
|
(427
|
)
|
3,248
|
|
|||||
|
Non-cash stock/unit-based compensation
|
(1,327
|
)
|
4,156
|
|
3,846
|
|
|||||
|
Legal, advisory and settlement costs
|
3,711
|
|
11,194
|
|
973
|
|
|||||
|
Contract modification cost
|
5,000
|
|
—
|
|
—
|
|
|||||
|
Software implementation costs
|
79
|
|
—
|
|
—
|
|
|||||
|
Impairment and uninsured hurricane related costs
|
4,889
|
|
—
|
|
—
|
|
|||||
|
Company’s portion of unrealized (gain) loss of investment in securities investment fund
|
—
|
|
2,587
|
|
2,927
|
|
|||||
|
Adjusted EBITDA available to the Company and OP unitholders
|
$
|
102,474
|
|
$
|
101,352
|
|
$
|
88,261
|
|
||
|
(1)
|
Net of adjustment for noncontrolling interest in consolidated entities. The following table presents the amounts of the adjustments for noncontrolling interest for each line item:
|
|
Year Ended December 31,
|
|||||||||||
|
2017
|
2016
|
2015
|
|||||||||
|
Interest expense and amortization of loan costs
|
$
|
(1,908
|
)
|
$
|
(1,649
|
)
|
$
|
(1,520
|
)
|
||
|
Depreciation and amortization
|
(2,901
|
)
|
(2,843
|
)
|
(2,874
|
)
|
|||||
|
Interest income
|
7
|
|
—
|
|
—
|
|
|||||
|
Unrealized gain (loss) on derivatives
|
(3
|
)
|
(2
|
)
|
(4
|
)
|
|||||
|
Income tax expense (benefit)
|
133
|
|
—
|
|
—
|
|
|||||
97
The following table reconciles net income (loss) to EBITDA attributable to the Company and OP unitholders on a property-by-property basis for each of our hotel properties owned and on a corporate basis during the year ended December 31,
2017
. The results of the Park Hyatt Beaver Creek and Hotel Yountville are included since their acquisition dates through December 31, 2017, and the results of the Plano Marriott Legacy Town Center are excluded since its disposition date (in thousands) (unaudited):
|
Year Ended December 31, 2017
|
|||||||||||||||||||||||||||||||||||||||||||||||||||||||||||||||||||
|
The Capital Hilton Washington D.C.
|
La Jolla Hilton Torrey Pines
|
Chicago Sofitel Magnificent Mile
|
Bardessono Hotel & Spa
|
Key West Pier House Resort
|
Hotel Yountville
|
Park Hyatt Beaver Creek
|
Philadelphia Courtyard Downtown
|
Plano Marriott Legacy Town Center
|
San Francisco Courtyard Downtown
|
Seattle Courtyard Downtown
|
Seattle Marriott Waterfront
|
St. Thomas Ritz-Carlton
|
Tampa Renaissance
|
Hotel Total
|
Corporate / Allocated
(1)
|
Ashford Hospitality Prime, Inc.
|
|||||||||||||||||||||||||||||||||||||||||||||||||||
|
Net income (loss)
|
$
|
10,489
|
|
$
|
9,333
|
|
$
|
(1,613
|
)
|
$
|
640
|
|
$
|
6,235
|
|
$
|
803
|
|
$
|
(2,546
|
)
|
$
|
5,884
|
|
$
|
29,398
|
|
$
|
7,275
|
|
$
|
10
|
|
$
|
11,999
|
|
$
|
1,329
|
|
$
|
3,233
|
|
$
|
82,469
|
|
$
|
(54,145
|
)
|
$
|
28,324
|
|
||||||||||||||||
|
(Income) loss from consolidated entities attributable to noncontrolling interest
|
(2,754
|
)
|
(2,422
|
)
|
—
|
|
—
|
|
—
|
|
—
|
|
—
|
|
—
|
|
—
|
|
—
|
|
—
|
|
—
|
|
—
|
|
—
|
|
(5,176
|
)
|
1,912
|
|
(3,264
|
)
|
|||||||||||||||||||||||||||||||||
|
Net (income) loss attributable to redeemable noncontrolling interests in operating partnership
|
—
|
|
—
|
|
—
|
|
—
|
|
—
|
|
—
|
|
—
|
|
—
|
|
—
|
|
—
|
|
—
|
|
—
|
|
—
|
|
—
|
|
—
|
|
(2,038
|
)
|
(2,038
|
)
|
|||||||||||||||||||||||||||||||||
|
Net income (loss) attributable to the Company
|
7,735
|
|
6,911
|
|
(1,613
|
)
|
640
|
|
6,235
|
|
803
|
|
(2,546
|
)
|
5,884
|
|
29,398
|
|
7,275
|
|
10
|
|
11,999
|
|
1,329
|
|
3,233
|
|
77,293
|
|
(54,271
|
)
|
23,022
|
|
|||||||||||||||||||||||||||||||||
|
Non-property adjustments
(2)
|
—
|
|
—
|
|
—
|
|
—
|
|
823
|
|
—
|
|
—
|
|
—
|
|
(23,797
|
)
|
—
|
|
—
|
|
—
|
|
252
|
|
10
|
|
(22,712
|
)
|
22,712
|
|
—
|
|
|||||||||||||||||||||||||||||||||
|
Interest income
|
(17
|
)
|
(12
|
)
|
—
|
|
—
|
|
—
|
|
—
|
|
—
|
|
(1
|
)
|
—
|
|
(4
|
)
|
—
|
|
(12
|
)
|
(4
|
)
|
(1
|
)
|
(51
|
)
|
(639
|
)
|
(690
|
)
|
|||||||||||||||||||||||||||||||||
|
Interest expense
|
—
|
|
—
|
|
2,738
|
|
573
|
|
—
|
|
1,249
|
|
2,032
|
|
54
|
|
—
|
|
—
|
|
—
|
|
—
|
|
2,568
|
|
—
|
|
9,214
|
|
24,820
|
|
34,034
|
|
|||||||||||||||||||||||||||||||||
|
Amortization of loan costs
|
—
|
|
—
|
|
—
|
|
46
|
|
—
|
|
78
|
|
388
|
|
—
|
|
—
|
|
—
|
|
—
|
|
—
|
|
506
|
|
—
|
|
1,018
|
|
3,885
|
|
4,903
|
|
|||||||||||||||||||||||||||||||||
|
Depreciation and amortization
|
6,510
|
|
5,976
|
|
4,578
|
|
2,533
|
|
2,850
|
|
1,674
|
|
2,456
|
|
6,082
|
|
3,796
|
|
4,918
|
|
—
|
|
4,081
|
|
2,949
|
|
3,755
|
|
52,158
|
|
104
|
|
52,262
|
|
|||||||||||||||||||||||||||||||||
|
Income tax expense (benefit)
|
—
|
|
(532
|
)
|
(1
|
)
|
—
|
|
—
|
|
—
|
|
—
|
|
22
|
|
(1
|
)
|
—
|
|
—
|
|
—
|
|
—
|
|
—
|
|
(512
|
)
|
(10
|
)
|
(522
|
)
|
|||||||||||||||||||||||||||||||||
|
Non-Hotel EBITDA ownership expense (income)
|
690
|
|
(25
|
)
|
76
|
|
649
|
|
1,074
|
|
120
|
|
89
|
|
180
|
|
174
|
|
548
|
|
—
|
|
141
|
|
2,995
|
|
5
|
|
6,716
|
|
(6,716
|
)
|
—
|
|
|||||||||||||||||||||||||||||||||
|
(Income) loss from consolidated entities attributable to noncontrolling interest
|
2,754
|
|
2,422
|
|
—
|
|
—
|
|
—
|
|
—
|
|
—
|
|
—
|
|
—
|
|
—
|
|
—
|
|
—
|
|
—
|
|
—
|
|
5,176
|
|
(5,176
|
)
|
—
|
|
|||||||||||||||||||||||||||||||||
|
EBITDA including amounts attributable to consolidated noncontrolling interest
|
17,672
|
|
14,740
|
|
5,778
|
|
4,441
|
|
10,982
|
|
3,924
|
|
2,419
|
|
12,221
|
|
9,570
|
|
12,737
|
|
10
|
|
16,209
|
|
10,595
|
|
7,002
|
|
128,300
|
|
(15,291
|
)
|
113,009
|
|
|||||||||||||||||||||||||||||||||
|
Less: EBITDA adjustments attributable to consolidated noncontrolling interest
|
(1,664
|
)
|
(1,263
|
)
|
—
|
|
—
|
|
—
|
|
—
|
|
—
|
|
—
|
|
—
|
|
—
|
|
—
|
|
—
|
|
—
|
|
—
|
|
(2,927
|
)
|
(1,742
|
)
|
(4,669
|
)
|
|||||||||||||||||||||||||||||||||
|
(Income) loss from consolidated entities attributable to noncontrolling interest
|
(2,754
|
)
|
(2,422
|
)
|
—
|
|
—
|
|
—
|
|
—
|
|
—
|
|
—
|
|
—
|
|
—
|
|
—
|
|
—
|
|
—
|
|
—
|
|
(5,176
|
)
|
5,176
|
|
—
|
|
|||||||||||||||||||||||||||||||||
|
Net income (loss) attributable to redeemable noncontrolling interest in operating partnership
|
—
|
|
—
|
|
—
|
|
—
|
|
—
|
|
—
|
|
—
|
|
—
|
|
—
|
|
—
|
|
—
|
|
—
|
|
—
|
|
—
|
|
—
|
|
2,038
|
|
2,038
|
|
|||||||||||||||||||||||||||||||||
|
EBITDA attributable to the Company and OP unitholders
|
$
|
13,254
|
|
$
|
11,055
|
|
$
|
5,778
|
|
$
|
4,441
|
|
$
|
10,982
|
|
$
|
3,924
|
|
$
|
2,419
|
|
$
|
12,221
|
|
$
|
9,570
|
|
$
|
12,737
|
|
$
|
10
|
|
$
|
16,209
|
|
$
|
10,595
|
|
$
|
7,002
|
|
$
|
120,197
|
|
$
|
(9,819
|
)
|
$
|
110,378
|
|
||||||||||||||||
|
(1)
|
Represents expenses not recorded at the individual hotel property level.
|
|
(2)
|
Includes allocated amounts which were not specific to hotel properties, such as gain on sale of hotel property, corporate taxes, insurance and legal expenses.
|
98
The following table reconciles net income (loss) to EBITDA attributable to the Company and OP unitholders on a property-by-property basis for each of our hotel properties owned and on a corporate basis for the year ended December 31, 2016. The results of the Seattle Courtyard Downtown sold on July 1, 2016 are included from January 1, 2016 through June 30, 2016 (in thousands) (unaudited):
|
Year Ended December 31, 2016
|
|||||||||||||||||||||||||||||||||||||||||||||||||||||||||||
|
The Capital Hilton Washington D.C.
|
La Jolla Hilton Torrey Pines
|
Chicago Sofitel Magnificent Mile
|
Bardessono Hotel & Spa
|
Key West Pier House Resort
|
Philadelphia Courtyard Downtown
|
Plano Marriott Legacy Town Center
|
San Francisco Courtyard Downtown
|
Seattle Courtyard Downtown
|
Seattle Marriott Waterfront
|
St. Thomas Ritz-Carlton
|
Tampa Renaissance
|
Hotel Total
|
Corporate / Allocated
(1)
|
Ashford Hospitality Prime, Inc.
|
|||||||||||||||||||||||||||||||||||||||||||||
|
Net income (loss)
|
$
|
11,234
|
|
$
|
6,883
|
|
$
|
1,766
|
|
$
|
1,942
|
|
$
|
7,511
|
|
$
|
4,434
|
|
$
|
6,649
|
|
$
|
10,091
|
|
$
|
28,725
|
|
$
|
11,288
|
|
$
|
2,661
|
|
$
|
3,019
|
|
$
|
96,203
|
|
$
|
(71,883
|
)
|
$
|
24,320
|
|
||||||||||||||
|
(Income) loss from consolidated entities attributable to noncontrolling interest
|
(2,940
|
)
|
(1,816
|
)
|
—
|
|
—
|
|
—
|
|
—
|
|
—
|
|
—
|
|
—
|
|
—
|
|
—
|
|
—
|
|
(4,756
|
)
|
1,651
|
|
(3,105
|
)
|
|||||||||||||||||||||||||||||
|
Net (income) loss attributable to redeemable noncontrolling interests in operating partnership
|
—
|
|
—
|
|
—
|
|
—
|
|
—
|
|
—
|
|
—
|
|
—
|
|
—
|
|
—
|
|
—
|
|
—
|
|
—
|
|
(1,899
|
)
|
(1,899
|
)
|
|||||||||||||||||||||||||||||
|
Net income (loss) attributable to the Company
|
8,294
|
|
5,067
|
|
1,766
|
|
1,942
|
|
7,511
|
|
4,434
|
|
6,649
|
|
10,091
|
|
28,725
|
|
11,288
|
|
2,661
|
|
3,019
|
|
91,447
|
|
(72,131
|
)
|
19,316
|
|
|||||||||||||||||||||||||||||
|
Non-property adjustments
(2)
|
—
|
|
—
|
|
—
|
|
—
|
|
—
|
|
—
|
|
—
|
|
—
|
|
(26,359
|
)
|
—
|
|
43
|
|
—
|
|
(26,316
|
)
|
26,316
|
|
—
|
|
|||||||||||||||||||||||||||||
|
Interest income
|
(1
|
)
|
(1
|
)
|
—
|
|
—
|
|
—
|
|
(3
|
)
|
(2
|
)
|
(15
|
)
|
—
|
|
(10
|
)
|
(3
|
)
|
—
|
|
(35
|
)
|
(132
|
)
|
(167
|
)
|
|||||||||||||||||||||||||||||
|
Interest expense
|
—
|
|
—
|
|
2,261
|
|
—
|
|
—
|
|
1,977
|
|
—
|
|
—
|
|
—
|
|
—
|
|
2,319
|
|
—
|
|
6,557
|
|
31,155
|
|
37,712
|
|
|||||||||||||||||||||||||||||
|
Amortization of loan costs
|
—
|
|
—
|
|
119
|
|
—
|
|
—
|
|
31
|
|
—
|
|
—
|
|
—
|
|
—
|
|
504
|
|
—
|
|
654
|
|
2,515
|
|
3,169
|
|
|||||||||||||||||||||||||||||
|
Depreciation and amortization
|
6,269
|
|
6,008
|
|
4,152
|
|
2,398
|
|
2,703
|
|
5,853
|
|
4,324
|
|
2,676
|
|
834
|
|
3,803
|
|
3,147
|
|
3,730
|
|
45,897
|
|
—
|
|
45,897
|
|
|||||||||||||||||||||||||||||
|
Income tax expense (benefit)
|
29
|
|
(121
|
)
|
—
|
|
—
|
|
—
|
|
18
|
|
—
|
|
—
|
|
—
|
|
—
|
|
(16
|
)
|
—
|
|
(90
|
)
|
1,664
|
|
1,574
|
|
|||||||||||||||||||||||||||||
|
Non-Hotel EBITDA ownership expense (income)
|
(109
|
)
|
153
|
|
102
|
|
689
|
|
15
|
|
247
|
|
50
|
|
38
|
|
(36
|
)
|
34
|
|
158
|
|
28
|
|
1,369
|
|
(1,369
|
)
|
—
|
|
|||||||||||||||||||||||||||||
|
(Income) loss from consolidated entities attributable to noncontrolling interest
|
2,940
|
|
1,816
|
|
—
|
|
—
|
|
—
|
|
—
|
|
—
|
|
—
|
|
—
|
|
—
|
|
—
|
|
—
|
|
4,756
|
|
(4,756
|
)
|
—
|
|
|||||||||||||||||||||||||||||
|
EBITDA including amounts attributable to consolidated noncontrolling interest
|
17,422
|
|
12,922
|
|
8,400
|
|
5,029
|
|
10,229
|
|
12,557
|
|
11,021
|
|
12,790
|
|
3,164
|
|
15,115
|
|
8,813
|
|
6,777
|
|
124,239
|
|
(16,738
|
)
|
107,501
|
|
|||||||||||||||||||||||||||||
|
Less: EBITDA adjustments attributable to consolidated noncontrolling interest
|
(1,415
|
)
|
(1,415
|
)
|
—
|
|
—
|
|
—
|
|
—
|
|
—
|
|
—
|
|
—
|
|
—
|
|
—
|
|
—
|
|
(2,830
|
)
|
(1,662
|
)
|
(4,492
|
)
|
|||||||||||||||||||||||||||||
|
(Income) loss from consolidated entities attributable to noncontrolling interest
|
(2,940
|
)
|
(1,816
|
)
|
—
|
|
—
|
|
—
|
|
—
|
|
—
|
|
—
|
|
—
|
|
—
|
|
—
|
|
—
|
|
(4,756
|
)
|
4,756
|
|
—
|
|
|||||||||||||||||||||||||||||
|
Net income (loss) attributable to redeemable noncontrolling interest in operating partnership
|
—
|
|
—
|
|
—
|
|
—
|
|
—
|
|
—
|
|
—
|
|
—
|
|
—
|
|
—
|
|
—
|
|
—
|
|
—
|
|
1,899
|
|
1,899
|
|
|||||||||||||||||||||||||||||
|
EBITDA attributable to the Company and OP unitholders
|
$
|
13,067
|
|
$
|
9,691
|
|
$
|
8,400
|
|
$
|
5,029
|
|
$
|
10,229
|
|
$
|
12,557
|
|
$
|
11,021
|
|
$
|
12,790
|
|
$
|
3,164
|
|
$
|
15,115
|
|
$
|
8,813
|
|
$
|
6,777
|
|
$
|
116,653
|
|
$
|
(11,745
|
)
|
$
|
104,908
|
|
||||||||||||||
__________________
|
(1)
|
Represents expenses not recorded at the individual hotel property level.
|
|
(2)
|
Includes allocated amounts which were not specific to hotel properties, such as gain on sale of hotel property, corporate taxes, insurance and legal expenses.
|
99
The following table reconciles net income (loss) to EBITDA attributable to the Company and OP unitholders on a property-by-property basis for each of our hotel properties owned and on a corporate basis for the year ended December 31, 2015. The Bardessono Hotel is included from July 9, 2015, through December 31, 2015, and the Ritz-Carlton St. Thomas is included from December 15, 2015, through December 31, 2015 (in thousands) (unaudited):
|
Year Ended December 31, 2015
|
|||||||||||||||||||||||||||||||||||||||||||||||||||||||||||
|
The Capital Hilton Washington D.C.
|
La Jolla Hilton Torrey Pines
|
Chicago Sofitel Magnificent Mile
|
Bardessono Hotel & Spa
|
Key West Pier House Resort
|
Philadelphia Courtyard Downtown
|
Plano Marriott Legacy Town Center
|
San Francisco Courtyard Downtown
|
Seattle Courtyard Downtown
|
Seattle Marriott Waterfront
|
St. Thomas Ritz-Carlton
|
Tampa Renaissance
|
Hotel Total
|
Corporate / Allocated
(1)
|
Ashford Hospitality Prime, Inc.
|
|||||||||||||||||||||||||||||||||||||||||||||
|
Net income (loss)
|
$
|
8,222
|
|
$
|
6,684
|
|
$
|
(714
|
)
|
$
|
1,358
|
|
$
|
7,124
|
|
$
|
4,691
|
|
$
|
6,854
|
|
$
|
11,415
|
|
$
|
4,453
|
|
$
|
10,441
|
|
$
|
1,032
|
|
$
|
2,820
|
|
$
|
64,380
|
|
$
|
(69,071
|
)
|
$
|
(4,691
|
)
|
||||||||||||||
|
(Income) loss from consolidated entities attributable to noncontrolling interest
|
(2,173
|
)
|
(1,766
|
)
|
—
|
|
—
|
|
—
|
|
—
|
|
—
|
|
—
|
|
—
|
|
—
|
|
—
|
|
—
|
|
(3,939
|
)
|
1,525
|
|
(2,414
|
)
|
|||||||||||||||||||||||||||||
|
Net (income) loss attributable to redeemable noncontrolling interests in operating partnership
|
—
|
|
—
|
|
—
|
|
—
|
|
—
|
|
—
|
|
—
|
|
—
|
|
—
|
|
—
|
|
—
|
|
—
|
|
—
|
|
393
|
|
393
|
|
|||||||||||||||||||||||||||||
|
Net income (loss) attributable to the Company
|
6,049
|
|
4,918
|
|
(714
|
)
|
1,358
|
|
7,124
|
|
4,691
|
|
6,854
|
|
11,415
|
|
4,453
|
|
10,441
|
|
1,032
|
|
2,820
|
|
60,441
|
|
(67,153
|
)
|
(6,712
|
)
|
|||||||||||||||||||||||||||||
|
Non-property adjustments
(2)
|
(19
|
)
|
(1
|
)
|
(1
|
)
|
1
|
|
—
|
|
—
|
|
—
|
|
1
|
|
(1
|
)
|
(2
|
)
|
4
|
|
1
|
|
(17
|
)
|
17
|
|
—
|
|
|||||||||||||||||||||||||||||
|
Interest income
|
(1
|
)
|
(2
|
)
|
—
|
|
—
|
|
—
|
|
(2
|
)
|
(1
|
)
|
(13
|
)
|
—
|
|
(7
|
)
|
—
|
|
(2
|
)
|
(28
|
)
|
(6
|
)
|
(34
|
)
|
|||||||||||||||||||||||||||||
|
Interest expense
|
—
|
|
—
|
|
2,022
|
|
—
|
|
—
|
|
2,013
|
|
—
|
|
—
|
|
—
|
|
—
|
|
104
|
|
—
|
|
4,139
|
|
31,115
|
|
35,254
|
|
|||||||||||||||||||||||||||||
|
Amortization of loan costs
|
—
|
|
—
|
|
698
|
|
—
|
|
—
|
|
32
|
|
—
|
|
—
|
|
—
|
|
—
|
|
10
|
|
—
|
|
740
|
|
1,835
|
|
2,575
|
|
|||||||||||||||||||||||||||||
|
Depreciation and amortization
|
6,524
|
|
5,819
|
|
6,296
|
|
1,177
|
|
2,629
|
|
5,761
|
|
4,109
|
|
2,278
|
|
2,091
|
|
4,004
|
|
114
|
|
3,022
|
|
43,824
|
|
—
|
|
43,824
|
|
|||||||||||||||||||||||||||||
|
Income tax expense (benefit)
|
69
|
|
(25
|
)
|
—
|
|
—
|
|
—
|
|
16
|
|
—
|
|
—
|
|
—
|
|
—
|
|
37
|
|
—
|
|
97
|
|
166
|
|
263
|
|
|||||||||||||||||||||||||||||
|
Non-Hotel EBITDA ownership expense (income)
|
502
|
|
45
|
|
59
|
|
364
|
|
(23
|
)
|
14
|
|
126
|
|
14
|
|
(140
|
)
|
226
|
|
188
|
|
(41
|
)
|
1,334
|
|
(1,334
|
)
|
—
|
|
|||||||||||||||||||||||||||||
|
(Income) loss from consolidated entities attributable to noncontrolling interest
|
2,173
|
|
1,766
|
|
—
|
|
—
|
|
—
|
|
—
|
|
—
|
|
—
|
|
—
|
|
—
|
|
—
|
|
—
|
|
3,939
|
|
(3,939
|
)
|
—
|
|
|||||||||||||||||||||||||||||
|
EBITDA including amounts attributable to consolidated noncontrolling interest
|
15,297
|
|
12,520
|
|
8,360
|
|
2,900
|
|
9,730
|
|
12,525
|
|
11,088
|
|
13,695
|
|
6,403
|
|
14,662
|
|
1,489
|
|
5,800
|
|
114,469
|
|
(39,299
|
)
|
75,170
|
|
|||||||||||||||||||||||||||||
|
Less: EBITDA adjustments attributable to consolidated noncontrolling interest
|
(1,650
|
)
|
(1,365
|
)
|
—
|
|
—
|
|
—
|
|
—
|
|
—
|
|
—
|
|
—
|
|
—
|
|
—
|
|
—
|
|
(3,015
|
)
|
(1,379
|
)
|
(4,394
|
)
|
|||||||||||||||||||||||||||||
|
(Income) loss from consolidated entities attributable to noncontrolling interest
|
(2,173
|
)
|
(1,766
|
)
|
—
|
|
—
|
|
—
|
|
—
|
|
—
|
|
—
|
|
—
|
|
—
|
|
—
|
|
—
|
|
(3,939
|
)
|
3,939
|
|
—
|
|
|||||||||||||||||||||||||||||
|
Net income (loss) attributable to redeemable noncontrolling interest in operating partnership
|
—
|
|
—
|
|
—
|
|
—
|
|
—
|
|
—
|
|
—
|
|
—
|
|
—
|
|
—
|
|
—
|
|
—
|
|
—
|
|
(393
|
)
|
(393
|
)
|
|||||||||||||||||||||||||||||
|
EBITDA attributable to the Company and OP unitholders
|
$
|
11,474
|
|
$
|
9,389
|
|
$
|
8,360
|
|
$
|
2,900
|
|
$
|
9,730
|
|
$
|
12,525
|
|
$
|
11,088
|
|
$
|
13,695
|
|
$
|
6,403
|
|
$
|
14,662
|
|
$
|
1,489
|
|
$
|
5,800
|
|
$
|
107,515
|
|
$
|
(37,132
|
)
|
$
|
70,383
|
|
||||||||||||||
|
(1)
|
Represents expenses not recorded at the individual hotel property level.
|
|
(2)
|
Includes allocated amounts which were not specific to hotel properties, such as corporate taxes, insurance and legal expenses.
|
100
We calculate FFO and AFFO in the following table. FFO is calculated on the basis defined by NAREIT, which is net income (loss) attributable to the Company, computed in accordance with GAAP, excluding gains or losses on sales of hotel properties and extraordinary items as defined by GAAP, plus impairment charges on real estate, depreciation and amortization of real estate assets, and after redeemable noncontrolling interests in the operating partnership. NAREIT developed FFO as a relative measure of performance of an equity REIT to recognize that income-producing real estate historically has not depreciated on the basis determined by GAAP. Our calculation of AFFO excludes preferred dividends, transaction and management conversion costs, write-off of loan costs and exit fees, (gain) loss on insurance settlements, legal, advisory and settlement costs, contract modification cost, software implementation costs, uninsured hurricane related costs, other (income) expense, tax reform and non-cash items such as unrealized (gain) loss on investments, unrealized (gain) loss on derivatives, stock/unit-based compensation and the Company’s portion of unrealized (gain) loss of investment in securities investment fund. FFO and AFFO exclude amounts attributable to the portion of a partnership owned by the third party. We consider FFO and AFFO to be appropriate measures of our ongoing normalized operating performance as a REIT. We compute FFO in accordance with our interpretation of standards established by NAREIT, which may not be comparable to FFO reported by other REITs that either do not define the term in accordance with the current NAREIT definition or interpret the NAREIT definition differently than us. FFO and AFFO do not represent cash generated from operating activities as determined by GAAP and should not be considered as an alternative to GAAP net income or loss as an indication of our financial performance or GAAP cash flows from operating activities as a measure of our liquidity. FFO and AFFO are also not indicative of funds available to satisfy our cash needs, including our ability to make cash distributions. However, to facilitate a clear understanding of our historical operating results, we believe that FFO and AFFO should be considered along with our net income or loss and cash flows reported in our consolidated financial statements.
101
The following table reconciles net income (loss) to FFO and Adjusted FFO (in thousands) (unaudited):
|
Year Ended December 31,
|
|||||||||||
|
2017
|
2016
|
2015
|
|||||||||
|
Net income (loss)
|
$
|
28,324
|
|
$
|
24,320
|
|
$
|
(4,691
|
)
|
||
|
Income from consolidated entities attributable to noncontrolling interest
|
(3,264
|
)
|
(3,105
|
)
|
(2,414
|
)
|
|||||
|
Net (Income) loss attributable to redeemable noncontrolling interests in operating partnership
|
(2,038
|
)
|
(1,899
|
)
|
393
|
|
|||||
|
Preferred dividends
|
(6,795
|
)
|
(3,860
|
)
|
(1,986
|
)
|
|||||
|
Net income (loss) attributable to common stockholders
|
16,227
|
|
15,456
|
|
(8,698
|
)
|
|||||
|
Depreciation and amortization on real estate
(1)
|
49,361
|
|
43,054
|
|
40,950
|
|
|||||
|
Impairment charges on real estate
|
1,068
|
|
—
|
|
—
|
|
|||||
|
Net income (loss) attributable to redeemable noncontrolling interests in operating partnership
|
2,038
|
|
1,899
|
|
(393
|
)
|
|||||
|
(Gain) loss on sale of hotel property
|
(23,797
|
)
|
(26,359
|
)
|
—
|
|
|||||
|
FFO available to common stockholders and OP unitholders
|
44,897
|
|
34,050
|
|
31,859
|
|
|||||
|
Preferred dividends
|
6,795
|
|
3,860
|
|
1,986
|
|
|||||
|
Transaction and management conversion costs
|
6,774
|
|
457
|
|
633
|
|
|||||
|
Other (income) expense
|
377
|
|
165
|
|
(1,233
|
)
|
|||||
|
(Gain) loss on insurance settlements
|
—
|
|
—
|
|
(21
|
)
|
|||||
|
Write-off of loan costs and exit fees
|
3,874
|
|
2,595
|
|
54
|
|
|||||
|
Unrealized (gain) loss on investment in Ashford Inc.
|
(9,717
|
)
|
1,970
|
|
7,609
|
|
|||||
|
Unrealized (gain) loss on derivatives
(1)
|
2,053
|
|
(427
|
)
|
3,248
|
|
|||||
|
Non-cash stock/unit-based compensation
|
(1,327
|
)
|
4,156
|
|
3,846
|
|
|||||
|
Legal, advisory and settlement costs
|
3,711
|
|
11,194
|
|
973
|
|
|||||
|
Contract modification cost
|
5,000
|
|
—
|
|
—
|
|
|||||
|
Software implementation costs
|
79
|
|
—
|
|
—
|
|
|||||
|
Uninsured hurricane related costs
|
3,821
|
|
—
|
|
—
|
|
|||||
|
Tax reform
(1)
|
(161
|
)
|
—
|
|
—
|
|
|||||
|
Company’s portion of unrealized (gain) loss of investment in securities investment fund
|
—
|
|
2,587
|
|
2,927
|
|
|||||
|
AFFO available to the Company and OP unitholders
|
$
|
66,176
|
|
$
|
60,607
|
|
$
|
51,881
|
|
||
____________________
|
(1)
|
Net of adjustment for noncontrolling interests in consolidated entities. The following table presents the amounts of the adjustments for noncontrolling interests for each line item:
|
|
Year Ended December 31,
|
|||||||||||
|
2017
|
2016
|
2015
|
|||||||||
|
Depreciation and amortization on real estate
|
$
|
(2,901
|
)
|
$
|
(2,843
|
)
|
$
|
(2,874
|
)
|
||
|
Unrealized gain (loss) on derivatives
|
(3
|
)
|
(2
|
)
|
(4
|
)
|
|||||
|
Tax reform
|
55
|
|
—
|
|
—
|
|
|||||
102
Our primary market risk exposure consists of changes in interest rates on borrowings under our debt instruments that bear interest at variable rates that fluctuate with market interest rates. To the extent that we acquire assets or conduct operations in an international jurisdiction, we will also have currency exchange risk. We may enter into certain hedging arrangements in order to manage interest rate and currency fluctuations. The analysis below presents the sensitivity of the market value of our financial instruments to selected changes in market interest rates.
At December 31,
2017
, our total indebtedness of
$826.2 million
included
$818.1 million
of variable-rate debt. The impact on the results of operations of a 25-basis point change in interest rate on the outstanding balance of variable-rate debt at December 31,
2017
, would be approximately
$2.0 million
per year. Interest rate changes will have no impact on the remaining
$8.1 million
of fixed rate debt.
The above amounts were determined based on the impact of hypothetical interest rates on our borrowings and assume no changes in our capital structure. The information presented above includes those exposures that existed at December 31,
2017
, but it does not consider exposures or positions that could arise after that date. Accordingly, the information presented herein has limited predictive value. As a result, the ultimate realized gain or loss with respect to interest rate fluctuations will depend on exposures that arise during the period, the hedging strategies at the time, and the related interest rates.
We use credit default swaps, tied to the CMBX index, to hedge financial and capital market risk. We have entered into credit default swap transactions with notional amounts totaling
$50.0 million
to hedge financial and capital market risk for upfront costs of
$888,000
, which were subsequently returned to us as collateral by our counterparties. A credit default swap is a derivative contract that functions like an insurance policy against the credit risk of an entity or obligation. The seller of protection assumes the credit risk of the reference obligation from the buyer (us) of protection in exchange for annual premium payments. If a default or a loss, as defined in the credit default swap agreements, occurs on the underlying bonds, then the buyer of protection is protected against those losses. The only liability for us, the buyer, is the annual premium and any change in value of the underlying CMBX index (if the trade is terminated prior to maturity). For all CMBX trades completed to date, we were the buyer of protection. Credit default swaps are subject to master-netting settlement arrangements and credit support annexes. Assuming the underlying bonds pay off at par over their remaining average life, our estimated total exposure for these trades was approximately
$2.4 million
at
December 31, 2017
.
We hold interest rate floors with notional amounts totaling
$6.9 billion
and strike rates ranging from
-0.25%
to
1.50%
. Our total exposure is capped at our initial total cost of
$3.7 million
. These instruments have termination dates ranging from
March 2019
to
July 2020
.
103
Item 8.
Financial Statements and Supplementary Data
Index to Consolidated Financial Statements
104
Report of Independent Registered Public Accounting Firm
Board of Directors and Stockholders
Ashford Hospitality Prime, Inc.
Dallas, Texas
Opinion on the Consolidated Financial Statements
We have audited the accompanying consolidated balance sheets of Ashford Hospitality Prime, Inc. (the “Company”) and subsidiaries as of December 31, 2017 and 2016, the related consolidated statements of operations, comprehensive income (loss), equity, and cash flows for each of the three years in the period ended December 31, 2017, and the related notes and schedule listed in the index at Item 15(a) (collectively referred to as the “consolidated financial statements”). In our opinion, the consolidated financial statements present fairly, in all material respects, the financial position of the Company and subsidiaries at December 31, 2017 and 2016, and the results of their operations and their cash flows for each of the three years in the period ended December 31, 2017
,
in conformity with accounting principles generally accepted in the United States of America.
Change in Accounting Principle
As is discussed in Note 2 to the consolidated financial statements, on January 1, 2017, the Company has adopted on a retrospective basis, Financial Accounting Standards Board Accounting Standards Update No. 2016-18, “Statement of Cash Flows (Topic 230): Restricted Cash”, which requires the inclusion of restricted cash with cash and cash equivalents when reconciling the beginning-of-period and end-of-period total amounts shown on the statements of cash flows.
Basis for Opinion
These consolidated financial statements are the responsibility of the Company’s management. Our responsibility is to express an opinion on the Company’s consolidated financial statements based on our audits. We are a public accounting firm registered with the Public Company Accounting Oversight Board (United States) (“PCAOB”) and are required to be independent with respect to the Company in accordance with the U.S. federal securities laws and the applicable rules and regulations of the Securities and Exchange Commission and the PCAOB.
We conducted our audits in accordance with the standards of the PCAOB. Those standards require that we plan and perform the audit to obtain reasonable assurance about whether the consolidated financial statements are free of material misstatement, whether due to error or fraud. The Company is not required to have, nor were we engaged to perform, an audit of its internal control over financial reporting. As part of our audits we are required to obtain an understanding of internal control over financial reporting but not for the purpose of expressing an opinion on the effectiveness of the Company’s internal control over financial reporting. Accordingly, we express no such opinion.
Our audits included performing procedures to assess the risks of material misstatement of the consolidated financial statements, whether due to error or fraud, and performing procedures that respond to those risks. Such procedures included examining, on a test basis, evidence regarding the amounts and disclosures in the consolidated financial statements. Our audits also included evaluating the accounting principles used and significant estimates made by management, as well as evaluating the overall presentation of the consolidated financial statements. We believe that our audits provide a reasonable basis for our opinion.
/s/ BDO USA, LLP
We have served as the Company's auditor since 2015.
Dallas, Texas
March 14, 2018
105
ASHFORD HOSPITALITY PRIME, INC. AND SUBSIDIARIES
CONSOLIDATED BALANCE SHEETS
(in thousands, except share and per share amounts)
|
December 31,
|
|||||||
|
2017
|
2016
|
||||||
|
ASSETS
|
|||||||
|
Investments in hotel properties, gross
|
1,403,110
|
|
1,258,412
|
|
|||
|
Accumulated depreciation
|
(257,268
|
)
|
(243,880
|
)
|
|||
|
Investments in hotel properties, net
|
$
|
1,145,842
|
|
$
|
1,014,532
|
|
|
|
Cash and cash equivalents
|
137,522
|
|
126,790
|
|
|||
|
Restricted cash
|
47,820
|
|
37,855
|
|
|||
|
Accounts receivable, net of allowance of $94 and $96, respectively
|
14,334
|
|
18,194
|
|
|||
|
Insurance receivable
|
8,825
|
|
—
|
|
|||
|
Inventories
|
1,425
|
|
1,479
|
|
|||
|
Note receivable
|
8,098
|
|
8,098
|
|
|||
|
Deferred costs, net
|
656
|
|
1,020
|
|
|||
|
Prepaid expenses
|
3,670
|
|
3,669
|
|
|||
|
Investment in Ashford Inc., at fair value
|
18,124
|
|
8,407
|
|
|||
|
Derivative assets
|
594
|
|
1,149
|
|
|||
|
Other assets
|
9,426
|
|
2,249
|
|
|||
|
Intangible assets, net
|
22,545
|
|
22,846
|
|
|||
|
Due from Ashford Trust OP, net
|
—
|
|
488
|
|
|||
|
Due from AQUA U.S. Fund
|
—
|
|
2,289
|
|
|||
|
Due from related party, net
|
349
|
|
377
|
|
|||
|
Due from third-party hotel managers
|
4,589
|
|
7,555
|
|
|||
|
Total assets
|
$
|
1,423,819
|
|
$
|
1,256,997
|
|
|
|
LIABILITIES AND EQUITY
|
|||||||
|
Liabilities:
|
|||||||
|
Indebtedness, net
|
$
|
820,959
|
|
$
|
764,616
|
|
|
|
Accounts payable and accrued expenses
|
56,803
|
|
44,791
|
|
|||
|
Dividends and distributions payable
|
8,146
|
|
5,038
|
|
|||
|
Due to Ashford Inc.
|
1,703
|
|
5,085
|
|
|||
|
Due to affiliate
|
—
|
|
2,500
|
|
|||
|
Due to third-party hotel managers
|
1,709
|
|
973
|
|
|||
|
Intangible liability, net
|
3,569
|
|
3,625
|
|
|||
|
Other liabilities
|
1,628
|
|
1,432
|
|
|||
|
Total liabilities
|
894,517
|
|
828,060
|
|
|||
|
Commitments and contingencies (note 13)
|
|
|
|||||
|
5.50% Series B cumulative convertible preferred stock, $0.01 par value, 4,965,850 and 2,890,850 shares issued and outstanding at December 31, 2017 and 2016, respectively
|
106,123
|
|
65,960
|
|
|||
|
Redeemable noncontrolling interests in operating partnership
|
46,627
|
|
59,544
|
|
|||
|
Equity:
|
|||||||
|
Common stock, $0.01 par value, 200,000,000 shares authorized, 32,120,210 and 26,021,552 shares issued and outstanding at December 31, 2017 and 2016, respectively
|
321
|
|
260
|
|
|||
|
Additional paid-in capital
|
469,791
|
|
401,790
|
|
|||
|
Accumulated deficit
|
(88,807
|
)
|
(93,254
|
)
|
|||
|
Total stockholders’ equity of the Company
|
381,305
|
|
308,796
|
|
|||
|
Noncontrolling interest in consolidated entities
|
(4,753
|
)
|
(5,363
|
)
|
|||
|
Total equity
|
376,552
|
|
303,433
|
|
|||
|
Total liabilities and equity
|
$
|
1,423,819
|
|
$
|
1,256,997
|
|
|
See Notes to Consolidated Financial Statements.
106
ASHFORD HOSPITALITY PRIME, INC. AND SUBSIDIARIES
CONSOLIDATED STATEMENTS OF OPERATIONS
(in thousands)
|
Year Ended December 31,
|
|||||||||||
|
2017
|
2016
|
2015
|
|||||||||
|
REVENUE
|
|||||||||||
|
Rooms
|
$
|
286,006
|
|
$
|
287,844
|
|
$
|
255,443
|
|
||
|
Food and beverage
|
96,415
|
|
95,618
|
|
79,894
|
|
|||||
|
Other
|
31,484
|
|
22,267
|
|
14,061
|
|
|||||
|
Total hotel revenue
|
413,905
|
|
405,729
|
|
349,398
|
|
|||||
|
Other
|
158
|
|
128
|
|
147
|
|
|||||
|
Total revenue
|
414,063
|
|
405,857
|
|
349,545
|
|
|||||
|
EXPENSES
|
|||||||||||
|
Hotel operating expenses:
|
|||||||||||
|
Rooms
|
65,731
|
|
65,541
|
|
56,341
|
|
|||||
|
Food and beverage
|
68,469
|
|
68,471
|
|
53,535
|
|
|||||
|
Other expenses
|
122,322
|
|
113,114
|
|
93,742
|
|
|||||
|
Management fees
|
15,074
|
|
15,456
|
|
14,049
|
|
|||||
|
Total hotel expenses
|
271,596
|
|
262,582
|
|
217,667
|
|
|||||
|
Property taxes, insurance and other
|
21,337
|
|
20,539
|
|
18,517
|
|
|||||
|
Depreciation and amortization
|
52,262
|
|
45,897
|
|
43,824
|
|
|||||
|
Impairment charges
|
1,068
|
|
—
|
|
—
|
|
|||||
|
Advisory services fee
|
9,134
|
|
14,955
|
|
17,889
|
|
|||||
|
Contract modification cost
|
5,000
|
|
—
|
|
—
|
|
|||||
|
Transaction costs
|
6,678
|
|
457
|
|
538
|
|
|||||
|
Corporate general and administrative
|
8,146
|
|
14,286
|
|
5,134
|
|
|||||
|
Total expenses
|
375,221
|
|
358,716
|
|
303,569
|
|
|||||
|
OPERATING INCOME (LOSS)
|
38,842
|
|
47,141
|
|
45,976
|
|
|||||
|
Equity in earnings (loss) of unconsolidated entity
|
—
|
|
(2,587
|
)
|
(2,927
|
)
|
|||||
|
Interest income
|
690
|
|
167
|
|
34
|
|
|||||
|
Gain (loss) on sale of hotel property
|
23,797
|
|
26,359
|
|
—
|
|
|||||
|
Other income (expense)
|
(377
|
)
|
(165
|
)
|
1,233
|
|
|||||
|
Interest expense and amortization of loan costs
|
(38,937
|
)
|
(40,881
|
)
|
(37,829
|
)
|
|||||
|
Write-off of loan costs and exit fees
|
(3,874
|
)
|
(2,595
|
)
|
(54
|
)
|
|||||
|
Unrealized gain (loss) on investment in Ashford Inc.
|
9,717
|
|
(1,970
|
)
|
(7,609
|
)
|
|||||
|
Unrealized gain (loss) on derivatives
|
(2,056
|
)
|
425
|
|
(3,252
|
)
|
|||||
|
INCOME (LOSS) BEFORE INCOME TAXES
|
27,802
|
|
25,894
|
|
(4,428
|
)
|
|||||
|
Income tax (expense) benefit
|
522
|
|
(1,574
|
)
|
(263
|
)
|
|||||
|
NET INCOME (LOSS)
|
28,324
|
|
24,320
|
|
(4,691
|
)
|
|||||
|
(Income) loss from consolidated entities attributable to noncontrolling interests
|
(3,264
|
)
|
(3,105
|
)
|
(2,414
|
)
|
|||||
|
Net (income) loss attributable to redeemable noncontrolling interests in operating partnership
|
(2,038
|
)
|
(1,899
|
)
|
393
|
|
|||||
|
NET INCOME (LOSS) ATTRIBUTABLE TO THE COMPANY
|
$
|
23,022
|
|
$
|
19,316
|
|
$
|
(6,712
|
)
|
||
|
Preferred dividends
|
(6,795
|
)
|
(3,860
|
)
|
(1,986
|
)
|
|||||
|
NET INCOME (LOSS) ATTRIBUTABLE TO COMMON STOCKHOLDERS
|
$
|
16,227
|
|
$
|
15,456
|
|
$
|
(8,698
|
)
|
||
|
INCOME (LOSS) PER SHARE - BASIC:
|
|||||||||||
|
Net income (loss) attributable to common stockholders
|
$
|
0.52
|
|
$
|
0.57
|
|
$
|
(0.34
|
)
|
||
|
Weighted average common shares outstanding – basic
|
30,473
|
|
26,648
|
|
25,888
|
|
|||||
|
INCOME (LOSS) PER SHARE - DILUTED:
|
|||||||||||
|
Net income (loss) attributable to common stockholders
|
$
|
0.51
|
|
$
|
0.55
|
|
$
|
(0.34
|
)
|
||
|
Weighted average common shares outstanding – diluted
|
34,706
|
|
31,195
|
|
25,888
|
|
|||||
|
Dividends declared per common share
|
$
|
0.64
|
|
$
|
0.46
|
|
$
|
0.35
|
|
||
See Notes to Consolidated Financial Statements.
107
ASHFORD HOSPITALITY PRIME, INC. AND SUBSIDIARIES
CONSOLIDATED STATEMENTS OF COMPREHENSIVE INCOME (LOSS)
(in thousands)
|
Year Ended December 31,
|
|||||||||||
|
2017
|
2016
|
2015
|
|||||||||
|
NET INCOME (LOSS)
|
$
|
28,324
|
|
$
|
24,320
|
|
$
|
(4,691
|
)
|
||
|
OTHER COMPREHENSIVE INCOME (LOSS), NET OF TAX
|
|||||||||||
|
Total other comprehensive income (loss)
|
—
|
|
—
|
|
—
|
|
|||||
|
TOTAL COMPREHENSIVE INCOME (LOSS)
|
28,324
|
|
24,320
|
|
(4,691
|
)
|
|||||
|
Comprehensive (income) loss attributable to noncontrolling interests in consolidated entities
|
(3,264
|
)
|
(3,105
|
)
|
(2,414
|
)
|
|||||
|
Comprehensive (income) loss attributable to redeemable noncontrolling interests in operating partnership
|
(2,038
|
)
|
(1,899
|
)
|
393
|
|
|||||
|
COMPREHENSIVE INCOME (LOSS) ATTRIBUTABLE TO THE COMPANY
|
$
|
23,022
|
|
$
|
19,316
|
|
$
|
(6,712
|
)
|
||
See Notes to Consolidated Financial Statements.
108
ASHFORD HOSPITALITY PRIME, INC. AND SUBSIDIARIES
CONSOLIDATED STATEMENTS OF EQUITY
(in thousands)
|
Common Stock
|
Additional Paid-in Capital
|
Accumulated Deficit
|
Noncontrolling
Interests in
Consolidated
Entities
|
Total
|
Redeemable Noncontrolling Interest in Operating Partnership
|
|||||||||||||||||||||
|
Shares
|
Amount
|
|||||||||||||||||||||||||
|
Balance at January 1, 2015
|
24,464
|
|
$
|
245
|
|
$
|
376,869
|
|
$
|
(98,210
|
)
|
$
|
(4,461
|
)
|
$
|
274,443
|
|
$
|
149,555
|
|
||||||
|
Purchase of common stock
|
(479
|
)
|
(4
|
)
|
(7,336
|
)
|
(876
|
)
|
—
|
|
(8,216
|
)
|
—
|
|
||||||||||||
|
Equity-based compensation
|
—
|
|
—
|
|
2,416
|
|
—
|
|
—
|
|
2,416
|
|
1,431
|
|
||||||||||||
|
Issuance of common stock
|
200
|
|
2
|
|
3,102
|
|
—
|
|
—
|
|
3,104
|
|
—
|
|
||||||||||||
|
Issuance of restricted shares/units
|
44
|
|
—
|
|
—
|
|
—
|
|
—
|
|
—
|
|
—
|
|
||||||||||||
|
Forfeiture of restricted common shares
|
(2
|
)
|
—
|
|
(5
|
)
|
(5
|
)
|
—
|
|
(10
|
)
|
—
|
|
||||||||||||
|
Dividends declared – common stock
|
—
|
|
—
|
|
—
|
|
(9,428
|
)
|
—
|
|
(9,428
|
)
|
—
|
|
||||||||||||
|
Dividends declared – preferred stock
|
—
|
|
—
|
|
—
|
|
(1,986
|
)
|
—
|
|
(1,986
|
)
|
—
|
|
||||||||||||
|
Distributions to noncontrolling interests
|
—
|
|
—
|
|
—
|
|
—
|
|
(3,766
|
)
|
(3,766
|
)
|
(2,170
|
)
|
||||||||||||
|
Redemption/conversion of operating partnership units
|
4,245
|
|
42
|
|
63,301
|
|
—
|
|
—
|
|
63,343
|
|
(69,198
|
)
|
||||||||||||
|
Net income (loss)
|
—
|
|
—
|
|
—
|
|
(6,712
|
)
|
2,414
|
|
(4,298
|
)
|
(393
|
)
|
||||||||||||
|
Redemption value adjustment
|
—
|
|
—
|
|
—
|
|
17,444
|
|
—
|
|
17,444
|
|
(17,444
|
)
|
||||||||||||
|
Balance at December 31, 2015
|
28,472
|
|
$
|
285
|
|
$
|
438,347
|
|
$
|
(99,773
|
)
|
$
|
(5,813
|
)
|
$
|
333,046
|
|
$
|
61,781
|
|
||||||
|
Purchase of common stock
|
(2,893
|
)
|
(29
|
)
|
(39,199
|
)
|
—
|
|
—
|
|
(39,228
|
)
|
—
|
|
||||||||||||
|
Equity-based compensation
|
—
|
|
—
|
|
721
|
|
—
|
|
—
|
|
721
|
|
3,435
|
|
||||||||||||
|
Issuance of restricted shares/units
|
309
|
|
3
|
|
(3
|
)
|
—
|
|
—
|
|
—
|
|
35
|
|
||||||||||||
|
Forfeiture of restricted common shares
|
(3
|
)
|
—
|
|
—
|
|
—
|
|
—
|
|
—
|
|
—
|
|
||||||||||||
|
Dividends declared – common stock
|
—
|
|
—
|
|
—
|
|
(12,287
|
)
|
—
|
|
(12,287
|
)
|
—
|
|
||||||||||||
|
Dividends declared – preferred stock
|
—
|
|
—
|
|
—
|
|
(3,860
|
)
|
—
|
|
(3,860
|
)
|
—
|
|
||||||||||||
|
Distributions to noncontrolling interests
|
—
|
|
—
|
|
—
|
|
—
|
|
(2,655
|
)
|
(2,655
|
)
|
(2,331
|
)
|
||||||||||||
|
Redemption/conversion of operating partnership units
|
137
|
|
1
|
|
1,924
|
|
(341
|
)
|
—
|
|
1,584
|
|
(1,584
|
)
|
||||||||||||
|
Net income (loss)
|
—
|
|
—
|
|
—
|
|
19,316
|
|
3,105
|
|
22,421
|
|
1,899
|
|
||||||||||||
|
Redemption value adjustment
|
—
|
|
—
|
|
—
|
|
3,691
|
|
—
|
|
3,691
|
|
(3,691
|
)
|
||||||||||||
|
Balance at December 31, 2016
|
26,022
|
|
$
|
260
|
|
$
|
401,790
|
|
$
|
(93,254
|
)
|
$
|
(5,363
|
)
|
$
|
303,433
|
|
$
|
59,544
|
|
||||||
|
Purchase of common stock
|
(37
|
)
|
—
|
|
(395
|
)
|
—
|
|
—
|
|
(395
|
)
|
—
|
|
||||||||||||
|
Equity-based compensation
|
—
|
|
—
|
|
(166
|
)
|
—
|
|
—
|
|
(166
|
)
|
(1,161
|
)
|
||||||||||||
|
Issuance of common stock
|
5,750
|
|
57
|
|
66,385
|
|
—
|
|
—
|
|
66,442
|
|
—
|
|
||||||||||||
|
Issuance of restricted shares/units
|
197
|
|
2
|
|
(2
|
)
|
—
|
|
—
|
|
—
|
|
21
|
|
||||||||||||
|
Forfeiture of restricted common shares
|
(6
|
)
|
—
|
|
—
|
|
—
|
|
—
|
|
—
|
|
—
|
|
||||||||||||
|
Dividends declared – common stock
|
—
|
|
—
|
|
—
|
|
(20,623
|
)
|
—
|
|
(20,623
|
)
|
—
|
|
||||||||||||
|
Dividends declared – preferred stock
|
—
|
|
—
|
|
—
|
|
(6,795
|
)
|
—
|
|
(6,795
|
)
|
—
|
|
||||||||||||
|
Distributions to noncontrolling interests
|
—
|
|
—
|
|
—
|
|
—
|
|
(2,654
|
)
|
(2,654
|
)
|
(2,791
|
)
|
||||||||||||
|
Redemption/conversion of operating partnership units
|
194
|
|
2
|
|
2,179
|
|
—
|
|
—
|
|
2,181
|
|
(2,181
|
)
|
||||||||||||
|
Net income (loss)
|
—
|
|
—
|
|
—
|
|
23,022
|
|
3,264
|
|
26,286
|
|
2,038
|
|
||||||||||||
|
Redemption value adjustment
|
—
|
|
—
|
|
—
|
|
8,843
|
|
—
|
|
8,843
|
|
(8,843
|
)
|
||||||||||||
|
Balance at December 31, 2017
|
32,120
|
|
$
|
321
|
|
$
|
469,791
|
|
$
|
(88,807
|
)
|
$
|
(4,753
|
)
|
$
|
376,552
|
|
$
|
46,627
|
|
||||||
See Notes to Consolidated Financial Statements.
109
ASHFORD HOSPITALITY PRIME, INC.
AND SUBSIDIARIES
(in thousands)
|
Year Ended December 31,
|
|||||||||||
|
2017
|
2016
|
2015
|
|||||||||
|
CASH FLOWS FROM OPERATING ACTIVITIES
|
|||||||||||
|
Net income (loss)
|
$
|
28,324
|
|
$
|
24,320
|
|
$
|
(4,691
|
)
|
||
|
Adjustments to reconcile net income (loss) to net cash flows provided by (used in) operating activities:
|
|||||||||||
|
Depreciation and amortization
|
52,262
|
|
45,897
|
|
43,824
|
|
|||||
|
Equity-based compensation
|
(1,327
|
)
|
4,156
|
|
3,847
|
|
|||||
|
Bad debt expense
|
256
|
|
217
|
|
117
|
|
|||||
|
Amortization of loan costs
|
4,903
|
|
3,169
|
|
2,575
|
|
|||||
|
Write-off of loan costs and exit fees
|
3,874
|
|
2,595
|
|
54
|
|
|||||
|
Amortization of intangibles
|
180
|
|
107
|
|
(106
|
)
|
|||||
|
(Gain) loss on sale of hotel property
|
(23,797
|
)
|
(27,150
|
)
|
—
|
|
|||||
|
Impairment charges
|
1,068
|
|
—
|
|
—
|
|
|||||
|
Realized and unrealized (gain) loss on derivatives
|
2,327
|
|
(269
|
)
|
3,252
|
|
|||||
|
Realized (gain) loss on marketable securities
|
—
|
|
—
|
|
(1,068
|
)
|
|||||
|
Unrealized (gain) loss on investment in Ashford Inc.
|
(9,717
|
)
|
1,970
|
|
7,609
|
|
|||||
|
Purchases of trading securities
|
—
|
|
—
|
|
(105,878
|
)
|
|||||
|
Sales of trading securities
|
—
|
|
—
|
|
55,654
|
|
|||||
|
Net settlement of trading derivatives
|
(1,397
|
)
|
—
|
|
—
|
|
|||||
|
Equity in (earnings) loss of unconsolidated entity
|
—
|
|
2,587
|
|
2,927
|
|
|||||
|
Deferred tax expense (benefit)
|
615
|
|
1,089
|
|
(1,093
|
)
|
|||||
|
Payments for derivatives
|
—
|
|
(114
|
)
|
(3,853
|
)
|
|||||
|
Changes in operating assets and liabilities, exclusive of the effect of hotel acquisitions and dispositions:
|
|||||||||||
|
Accounts receivable and inventories
|
6,901
|
|
(5,617
|
)
|
1,923
|
|
|||||
|
Insurance receivable
|
3,580
|
|
—
|
|
—
|
|
|||||
|
Prepaid expenses and other assets
|
(846
|
)
|
(933
|
)
|
(338
|
)
|
|||||
|
Accounts payable and accrued expenses
|
782
|
|
3,277
|
|
5,416
|
|
|||||
|
Due to/from related party, net
|
41
|
|
(27
|
)
|
191
|
|
|||||
|
Due to affiliate
|
(2,500
|
)
|
2,500
|
|
—
|
|
|||||
|
Due to/from third-party hotel managers
|
7,777
|
|
2,882
|
|
(5,014
|
)
|
|||||
|
Due to/from Ashford Trust OP, net
|
488
|
|
(1,016
|
)
|
(119
|
)
|
|||||
|
Due to Ashford Inc.
|
(3,382
|
)
|
(1,284
|
)
|
3,823
|
|
|||||
|
Other liabilities
|
196
|
|
251
|
|
(80
|
)
|
|||||
|
Net cash provided by (used in) operating activities
|
70,608
|
|
58,607
|
|
8,972
|
|
|||||
|
CASH FLOWS FROM INVESTING ACTIVITIES
|
|||||||||||
|
Proceeds from property insurance
|
11,918
|
|
691
|
|
24
|
|
|||||
|
Net proceeds from sale of hotel property
|
103,094
|
|
82,732
|
|
—
|
|
|||||
|
Proceeds from sale of furniture, fixtures and equipment
|
—
|
|
—
|
|
206
|
|
|||||
|
Proceeds from liquidation of AQUA U.S. Fund
|
2,289
|
|
43,489
|
|
—
|
|
|||||
|
Acquisition of hotel properties, net of cash and restricted cash acquired
|
(248,199
|
)
|
—
|
|
(143,632
|
)
|
|||||
|
Investment in Ashford Inc.
|
—
|
|
—
|
|
(16,623
|
)
|
|||||
|
Improvements and additions to hotel properties
|
(43,044
|
)
|
(23,423
|
)
|
(19,322
|
)
|
|||||
|
Net cash provided by (used in) investing activities
|
(173,942
|
)
|
103,489
|
|
(179,347
|
)
|
|||||
|
CASH FLOWS FROM FINANCING ACTIVITIES
|
|||||||||||
|
Borrowings on indebtedness
|
523,500
|
|
—
|
|
152,000
|
|
|||||
|
Repayments of indebtedness
|
(464,228
|
)
|
(73,268
|
)
|
(76,998
|
)
|
|||||
|
Payments of loan costs and exit fees
|
(11,342
|
)
|
(4,062
|
)
|
(3,317
|
)
|
|||||
|
Payments for derivatives
|
(375
|
)
|
(13
|
)
|
(117
|
)
|
|||||
|
Purchase of common stock
|
(395
|
)
|
(39,228
|
)
|
(8,876
|
)
|
|||||
|
Payments for dividends and distributions
|
(27,101
|
)
|
(16,879
|
)
|
(11,819
|
)
|
|||||
|
Issuance of preferred stock
|
40,163
|
|
4,211
|
|
62,290
|
|
|||||
|
Issuance of common stock
|
66,442
|
|
—
|
|
3,104
|
|
|||||
110
|
Year Ended December 31,
|
|||||||||||
|
2017
|
2016
|
2015
|
|||||||||
|
Forfeiture of restricted shares/units
|
—
|
|
—
|
|
(10
|
)
|
|||||
|
Redemption of operating partnership units
|
—
|
|
—
|
|
(5,855
|
)
|
|||||
|
Distributions to noncontrolling interest in consolidated entities
|
(2,654
|
)
|
(6,421
|
)
|
(2,938
|
)
|
|||||
|
Other
|
21
|
|
35
|
|
—
|
|
|||||
|
Net cash provided by (used in) financing activities
|
124,031
|
|
(135,625
|
)
|
107,464
|
|
|||||
|
Net change in cash, cash equivalents and restricted cash
|
20,697
|
|
26,471
|
|
(62,911
|
)
|
|||||
|
Cash, cash equivalents and restricted cash at beginning of year
|
164,645
|
|
138,174
|
|
201,085
|
|
|||||
|
Cash, cash equivalents and restricted cash at end of year
|
$
|
185,342
|
|
$
|
164,645
|
|
$
|
138,174
|
|
||
|
SUPPLEMENTAL CASH FLOW INFORMATION
|
|||||||||||
|
Interest paid
|
$
|
34,267
|
|
$
|
37,800
|
|
$
|
34,687
|
|
||
|
Income taxes paid
|
803
|
|
380
|
|
2,145
|
|
|||||
|
SUPPLEMENTAL DISCLOSURE OF NON-CASH INVESTING AND FINANCING ACTIVITIES
|
|||||||||||
|
Investment in unconsolidated entity
|
$
|
—
|
|
$
|
—
|
|
$
|
51,292
|
|
||
|
Dividends and distributions declared but not paid
|
8,146
|
|
5,038
|
|
3,439
|
|
|||||
|
Capital expenditures accrued but not paid
|
4,430
|
|
1,574
|
|
549
|
|
|||||
|
Non-cash consideration from sale of property, plant and equipment
|
—
|
|
—
|
|
1,363
|
|
|||||
|
Investment in Ashford Inc.
|
—
|
|
—
|
|
1,363
|
|
|||||
|
Receivable related to liquidation of AQUA U.S. Fund
|
—
|
|
2,289
|
|
—
|
|
|||||
|
Distributions declared but not paid to noncontrolling interest in consolidated entities
|
—
|
|
—
|
|
3,766
|
|
|||||
|
Accrued preferred stock offering expenses
|
—
|
|
—
|
|
42
|
|
|||||
|
Non-cash preferred stock offering expense
|
—
|
|
479
|
|
—
|
|
|||||
|
SUPPLEMENTAL DISCLOSURE OF CASH, CASH EQUIVALENTS AND RESTRICTED CASH
|
|||||||||||
|
Cash and cash equivalents at beginning of period
|
$
|
126,790
|
|
$
|
105,039
|
|
$
|
171,439
|
|
||
|
Restricted cash at beginning of period
|
37,855
|
|
33,135
|
|
29,646
|
|
|||||
|
Cash, cash equivalents and restricted cash at beginning of period
|
$
|
164,645
|
|
$
|
138,174
|
|
$
|
201,085
|
|
||
|
Cash and cash equivalents at end of period
|
$
|
137,522
|
|
$
|
126,790
|
|
$
|
105,039
|
|
||
|
Restricted cash at end of period
|
47,820
|
|
37,855
|
|
33,135
|
|
|||||
|
Cash, cash equivalents and restricted cash at end of period
|
$
|
185,342
|
|
$
|
164,645
|
|
$
|
138,174
|
|
||
See Notes to Consolidated Financial Statements.
111
ASHFORD HOSPITALITY PRIME, INC. AND SUBSIDIARIES
NOTES TO CONSOLIDATED FINANCIAL STATEMENTS
1. Organization and Description of Business
Ashford Hospitality Prime, Inc., together with its subsidiaries (“Ashford Prime”), is a Maryland corporation that invests primarily in high revenue per available room (“RevPAR”) luxury hotels and resorts. High RevPAR, for purposes of our investment strategy, means RevPAR of at least twice the then-current U.S. national average RevPAR for all hotels as determined by Smith Travel Research. Ashford Prime has elected to be taxed as a real estate investment trust (“REIT”) under the Internal Revenue Code. Ashford Prime conducts its business and owns substantially all of its assets through its operating partnership, Ashford Hospitality Prime Limited Partnership (“Ashford Prime OP”). In this report, the terms “the Company,” “we,” “us” or “our” refers to Ashford Hospitality Prime, Inc. and, as the context may require, all entities included in its consolidated financial statements.
We are advised by Ashford LLC through an advisory agreement. Ashford LLC is a subsidiary of Ashford Inc., which was spun-off from Ashford Trust. All of the hotel properties in our portfolio are currently asset-managed by Ashford LLC.
We do not have any employees. All of the services that might be provided by employees are provided to us by Ashford LLC.
As of
December 31, 2017
, Remington Lodging, which is beneficially wholly-owned by Mr. Monty J. Bennett, Chairman of our board of directors, and Mr. Archie Bennett, Jr., Chairman Emeritus of Ashford Trust, managed
three
of our
twelve
hotel properties. Third-party management companies managed the remaining hotel properties.
The accompanying consolidated financial statements include the accounts of such wholly-owned and majority owned subsidiaries of Ashford Prime OP that as of
December 31, 2017
, own and operate
twelve
hotel properties in
six
states, the District of Columbia and the U.S. Virgin Islands. The portfolio includes
ten
wholly-owned hotel properties and
two
hotel properties that are owned through a partnership in which Ashford Prime OP has a controlling interest. These hotel properties represent
3,574
total rooms, or
3,339
net rooms, excluding those attributable to our partner. As a REIT, Ashford Prime needs to comply with limitations imposed by the Internal Revenue Code related to operating hotels. As of
December 31, 2017
,
eleven
of our
twelve
hotel properties were leased by wholly-owned or majority-owned subsidiaries that are treated as taxable REIT subsidiaries (“TRS”) for federal income tax purposes (collectively the TRS entities are referred to as “Prime TRS”).
One
hotel property located in the U.S. Virgin Islands is owned by our USVI TRS. Prime TRS then engages third-party or affiliated hotel management companies to operate the hotel properties under management contracts. Hotel operating results related to the hotel properties are included in our consolidated statements of operations. As of
December 31, 2017
,
nine
of the
twelve
hotel properties were leased by Ashford Prime’s wholly-owned TRS and
two
hotel properties majority-owned through a consolidated partnership were leased to a TRS wholly-owned by such consolidated partnership. Each leased hotel is leased under a percentage lease that provides for each lessee to pay in each calendar month the base rent plus, in each calendar quarter, percentage rent, if any, based on hotel revenues. Lease revenue from Prime TRS is eliminated in consolidation. The hotel properties are operated under management contracts with Marriott International, Inc. (“Marriott”), Hilton Worldwide (“Hilton”), Accor Business and Leisure Management, LLC (“Accor”), Hyatt Hotels Corporation (“Hyatt”), Ritz-Carlton, Inc. (“Ritz-Carlton”) and Remington Lodging, which are eligible independent contractors under the Internal Revenue Code.
2. Significant Accounting Policies
Basis of Presentation and Principles of Consolidation
—The accompanying consolidated financial statements include the accounts of Ashford Hospitality Prime, Inc., its majority-owned subsidiaries, and its majority-owned entities in which it has a controlling interest. All significant intercompany accounts and transactions between consolidated entities have been eliminated in these consolidated financial statements.
Ashford Prime OP is considered to be a variable interest entity (“VIE”), as defined by authoritative accounting guidance. A VIE must be consolidated by a reporting entity if the reporting entity is the primary beneficiary because it has (i) the power to direct the VIE’s activities that most significantly impact the VIE’s economic performance and (ii) the obligation to absorb losses of the VIE or the right to receive benefits from the VIE. All major decisions related to Ashford Prime OP that most significantly impact its economic performance, including but not limited to operating procedures with respect to business affairs and any acquisitions, dispositions, financings, restructurings or other transactions with sellers, purchasers, lenders, brokers, agents and other applicable representatives, are subject to the approval of our wholly-owned subsidiary, Ashford Prime OP General Partner LLC, its general partner. As such, we consolidate Ashford Prime OP.
112
ASHFORD HOSPITALITY PRIME, INC. AND SUBSIDIARIES
NOTES TO CONSOLIDATED FINANCIAL STATEMENTS (continued)
The following items affect reporting comparability of our historical consolidated financial statements:
|
•
|
On July 9, 2015, we acquired the Bardessono Hotel, and on December 15, 2015, we acquired the Ritz-Carlton St. Thomas, USVI (“Ritz-Carlton St. Thomas”). The operating results of these hotel properties are included in our results of operations as of their acquisition dates.
|
|
•
|
On July 1, 2016, we sold the Courtyard Seattle Downtown.
|
|
•
|
On March 31, 2017, we acquired the Park Hyatt Beaver Creek and on May 11, 2017, we acquired the Hotel Yountville. The operating results of these hotel properties have been included in our results of operations as of their acquisition dates.
|
|
•
|
On November 1, 2017, we sold the Plano Marriott Legacy Town Center.
|
Use of Estimates
—The preparation of these consolidated financial statements in accordance with accounting principles generally accepted in the United States requires management to make estimates and assumptions that affect the reported amounts of assets and liabilities and disclosure of contingent assets and liabilities at the date of the financial statements and the reported amounts of revenue and expenses during the reporting period. Actual results could differ from those estimates.
Cash and Cash Equivalents
—Cash and cash equivalents include cash on hand or held in banks and short-term investments with an initial maturity of
three
months or less at the date of purchase.
Restricted Cash
—Restricted cash includes reserves for debt service, real estate taxes, and insurance, as well as excess cash flow deposits and reserves for furniture, fixtures, and equipment replacements of approximately
4%
to
5%
of property revenue for certain hotels, as required by certain management or mortgage debt agreement restrictions and provisions. We early adopted Accounting Standards Updates (“ASU”) 2016-18,
Statement of Cash Flows (Topic 230): Restricted Cash
effective January 1, 2017. See discussion in recently adopted accounting standards below.
Accounts Receivable
—Accounts receivable consists primarily of meeting and banquet room rental and hotel guest receivables. We generally do not require collateral. We maintain an allowance for doubtful accounts for estimated losses resulting from the inability of guests to make required payments for services. The allowance is maintained at a level believed adequate to absorb estimated receivable losses. The estimate is based on past receivable loss experience, known and inherent credit risks, current economic conditions, and other relevant factors, including specific reserves for certain accounts.
Inventories
—Inventories, which primarily consist of food, beverages, and gift store merchandise, are stated at the lower of cost or market value. Cost is determined using the first-in, first-out method.
Investments in Hotel Properties, net
—Hotel properties are generally stated at cost. For hotel properties owned through our majority-owned entities, the carrying basis attributable to the partners’ minority ownership is recorded at historical cost, net of any impairment charges, while the carrying basis attributable to our majority ownership is recorded based on the allocated purchase price of our ownership interests in the entities. All improvements and additions which extend the useful life of the hotel properties are capitalized.
Impairment of Investments in Hotel Properties
—Hotel properties are reviewed for impairment whenever events or changes in circumstances indicate that their carrying amounts may not be recoverable. Recoverability of the hotel is measured by comparison of the carrying amount of the hotel to the estimated future undiscounted cash flows, which take into account current market conditions and our intent with respect to holding or disposing of the hotel. If our analysis indicates that the carrying value of the hotel is not recoverable on an undiscounted cash flow basis, we recognize an impairment charge for the amount by which the property’s net book value exceeds its estimated fair value, or fair value, less cost to sell. In evaluating the impairment of hotel properties, we make many assumptions and estimates, including projected cash flows, expected holding period and expected useful life. Fair value is determined through various valuation techniques, including internally developed discounted cash flow models, comparable market transactions and third-party appraisals, where considered necessary. Asset write-downs resulting from property damage are recorded up to the amount of the allocable property insurance deductible in the period that the property damage occurs. See note 3.
Assets Held for Sale and Discontinued Operations
—We classify assets as held for sale when we have obtained a firm commitment from a buyer, and consummation of the sale is considered probable and expected within one year. The related operations of assets held for sale are reported as discontinued if the disposal is a component of an entity or group of components that represents a strategic shift that has (or will have) a major effect on our operations and cash flows.
Investment in Unconsolidated Entity and Ashford Inc.
—We held an investment in an unconsolidated entity, in which we had an ownership interest of
45.3%
that was accounted for under the equity method of accounting by recording the initial investment
113
ASHFORD HOSPITALITY PRIME, INC. AND SUBSIDIARIES
NOTES TO CONSOLIDATED FINANCIAL STATEMENTS (continued)
and our percentage of interest in the entity’s net income/loss. We liquidated our investment in April 2016. We review the investment in unconsolidated entity for impairment in each reporting period pursuant to the applicable authoritative accounting guidance. An investment is impaired when its estimated fair value is less than the carrying amount of our investment. Any impairment is recorded in equity in loss in unconsolidated entity.
No
such impairment was recorded in the years ended December 31, 2016 and 2015. We also hold approximately
195,000
shares of Ashford Inc. common stock, which represented an approximate
9.3%
ownership interest in Ashford Inc. and had a fair value of
$18.1 million
at
December 31, 2017
. This investment would typically be accounted for under the equity method of accounting, under Accounting Standard Codification (“ASC”) 323-10 -
Investments - Equity Method and Joint Ventures
since we exercise significant influence. However, we have elected to record our investment in Ashford Inc. using the fair value option under ASC 825-10 -
Fair Value Option - Financial Assets and Financial Liabilities
.
Deferred Costs, net
—Debt issuance costs are reflected as a direct reduction to the related debt obligation. Additionally, debt issuance costs associated with our secured revolving credit facility are presented as an asset on our consolidated balance sheets. Deferred loan costs are recorded at cost and amortized over the terms of the related indebtedness using the effective interest method. Deferred franchise fees are amortized on a straight-line basis over the terms of the related franchise agreements.
Intangible Assets and Intangible Liabilities
—Intangible assets and liabilities represent the assets and liabilities recorded on certain hotel properties’ ground lease contracts that were below or above market rates at the date of acquisition. These assets and liabilities are amortized using the straight-line method over the remaining terms of the respective lease contracts. See note 8.
Derivative Instruments
—We use interest rate derivatives to hedge our risks and to capitalize on the historical correlation between changes in LIBOR (London Interbank Offered Rate) and RevPAR. Interest rate derivatives could include swaps, caps, floors and flooridors. We also use credit default swaps to hedge financial and capital market risk. All of our derivatives are subject to master- netting settlement arrangements and the credit default swaps are subject to credit support annexes. For credit default swaps, cash collateral is posted by us as well as our counterparty. We offset the fair value of the derivative and the obligation/right to return/reclaim cash collateral. We also purchase options on Eurodollar futures as a hedge against our cash flows. Eurodollar futures prices reflect market expectations for interest rates on three month Eurodollar deposits for specific dates in the future, and the final settlement price is determined by three month LIBOR on the last trading day. Options on Eurodollar futures provide the ability to limit losses while maintaining the possibility of profiting from favorable changes in the futures prices. As the purchaser, our maximum potential loss is limited to the initial premium paid for the Eurodollar option contracts, while our potential gain has no limit. These exchange-traded options are centrally cleared, and a clearinghouse stands in between all trades to ensure that the obligations involved in the trades are satisfied.
All derivatives are recorded at fair value in accordance with the applicable authoritative accounting guidance. Interest rate derivatives, credit default swaps and options on futures contracts are reported as “derivative assets, net” in our consolidated balance sheets. For interest rate derivatives, credit default swaps and options on futures contracts, changes in fair value and realized gains and losses are recognized in earnings as “unrealized gain (loss) on derivatives” and “other income (expense)”, respectively, in our consolidated statements of operations.
Due to/from Related Party, net
—Due to/from related party, net, represents current receivables related to advances for project management services and payables resulting from transactions related to hotel management, project management and market services with a related party. These receivables and payables are generally settled within a period not exceeding
one year
.
Due to Ashford Inc.
—Due to Ashford Inc. primarily represents payables related to the advisory services fee, including reimbursable expenses. These payables are generally settled within a period not exceeding
one year
. See note 21
Due to/from Third-Party Hotel Managers
—Due from third-party hotel managers primarily consists of amounts due from Marriott related to cash reserves held at the Marriott corporate level related to operating, real estate taxes, and other items, as well as current receivables and payables resulting from transactions with other third-party managers related to hotel management.
Noncontrolling Interests
—The redeemable noncontrolling interests in the operating partnership represent the limited partners’ proportionate share of equity in earnings/losses of the operating partnership, which is an allocation of net income/loss attributable to the common unitholders based on the weighted average ownership percentage of these limited partners’ common unit holdings throughout the period. The redeemable noncontrolling interests in our operating partnership is classified in the mezzanine section of our consolidated balance sheets as these redeemable operating partnership units do not meet the requirements for permanent equity classification prescribed by the authoritative accounting guidance because these redeemable operating partnership units may be redeemed by the holder for cash or registered shares in certain cases outside of the Company’s control. The carrying value of the noncontrolling interests in the operating partnership is based on the greater of the accumulated historical cost or the redemption value.
114
ASHFORD HOSPITALITY PRIME, INC. AND SUBSIDIARIES
NOTES TO CONSOLIDATED FINANCIAL STATEMENTS (continued)
The noncontrolling interest in consolidated entities represents an ownership interest of
25%
in
two
hotel properties at
December 31, 2017
and
2016
, and is reported in equity in our consolidated balance sheets.
Net income/loss attributable to redeemable noncontrolling interests in operating partnership and income/loss from consolidated entities attributable to noncontrolling interests in our consolidated entities are reported as deductions/additions from/to net income/loss. Comprehensive income/loss attributable to these noncontrolling interests is reported as reductions/additions from/to comprehensive income/loss.
Revenue Recognition
—Hotel revenues, including room, food, beverage, and ancillary revenues such as long-distance telephone service, laundry, parking and space rentals, are recognized when services have been rendered. Taxes collected from customers and submitted to taxing authorities are not recorded in revenue.
Other Expenses
—Other expenses include telephone charges, guest laundry, valet parking, hotel-level general and administrative expenses, sales and marketing expenses, repairs and maintenance, franchise fees and utility costs. They are expensed as incurred.
Advertising Costs
—Advertising costs are charged to expense as incurred. For the years ended December 31,
2017
,
2016
and
2015
, we incurred advertising costs of
$3.4 million
,
$3.1 million
and
$2.3 million
, respectively. Advertising costs are included in “Other expenses” in our consolidated statements of operations.
Equity-Based Compensation
—Stock/unit-based compensation for non-employees is accounted for at fair value based on the market price of the shares at period end in accordance with applicable authoritative accounting guidance that results in recording expense, included in “advisory services fee” and “management fees,” equal to the fair value of the award in proportion to the requisite service period satisfied during the period. Performance stock units (“PSUs”) and performance-based Long-Term Incentive Plan (“LTIP”) units granted to certain executive officers are accounted for at fair value at period end based on a Monte Carlo simulation valuation model that results in recording expense, included in “advisory services fee,” equal to the fair value of the award in proportion to the requisite service period satisfied during the period. Stock/unit grants to independent directors are recorded at fair value based on the market price of the shares at grant date, which amount is fully expensed as the grants of stock/units are fully vested on the date of grant and included in “corporate general and administrative” expense in our consolidated statements of operations.
Depreciation and Amortization
—Hotel properties are depreciated over the estimated useful life of the assets and leasehold improvements are amortized over the shorter of the lease term or the estimated useful life of the related assets. Presently, hotel properties are depreciated using the straight-line method over lives ranging from
7.5
to
39 years
for buildings and improvements and
1.5
to
5 years
for furniture, fixtures and equipment. While we believe our estimates are reasonable, a change in estimated useful lives could affect depreciation expense and net income (loss) as well as resulting gains or losses on potential hotel sales.
Income Taxes
—As a REIT, we generally are not subject to federal corporate income tax on the portion of our net income (loss) that does not relate to taxable REIT subsidiaries. However, Prime TRS and our USVI TRS are treated as taxable REIT subsidiaries for federal income tax purposes. In accordance with authoritative accounting guidance, we account for income taxes related to our TRSs using the asset and liability method under which deferred tax assets and liabilities are recognized for future tax consequences attributable to differences between the financial statement carrying amounts of existing assets and liabilities and their respective tax bases. In addition, the analysis utilized by us in determining our deferred tax asset valuation allowance involves considerable management judgment and assumptions.
The entities that own
eleven
of our
twelve
hotel properties are considered partnerships for federal income tax purposes. Partnerships are not subject to U.S. federal income taxes. The partnerships’ revenues and expenses pass through to and are taxed on the owners. The states and cities where the partnerships operate follow the U.S. federal income tax treatment, with the exception of the District of Columbia, Texas, and the city of Philadelphia. Accordingly, we provide for income taxes in these jurisdictions for the partnerships. The consolidated entities that operate the
twelve
hotel properties are considered taxable corporations for U.S. federal, foreign, state, and city income tax purposes and have elected to be taxable REIT subsidiaries of Ashford Prime. The entities that operate the
two
hotel properties owned by a consolidated partnership elected to be treated as taxable REIT subsidiaries of Ashford Trust in April 2007, when the partnership was acquired by Ashford Trust. As a result of Ashford Trust’s distribution of its remaining common units of Ashford Prime OP and shares of common stock of Ashford Prime on July 27, 2015, the Prime TRSs revoked their elections to be taxable REIT subsidiaries of Ashford Trust effective July 29, 2015. The Prime TRSs remain taxable REIT subsidiaries of Ashford Prime.
115
ASHFORD HOSPITALITY PRIME, INC. AND SUBSIDIARIES
NOTES TO CONSOLIDATED FINANCIAL STATEMENTS (continued)
The “Income Taxes” Topic of the Financial Accounting Standards Board’s (“FASB”) Accounting Standards Codification addresses the accounting for uncertainty in income taxes recognized in an enterprise’s financial statements. The guidance requires us to determine whether tax positions we have taken or expect to take in a tax return are more likely than not to be sustained upon examination by the appropriate taxing authority based on the technical merits of the positions. Tax positions that do not meet the more likely than not threshold would be recorded as additional tax expense in the current period. We analyze all open tax years, as defined by the statute of limitations for each jurisdiction, which includes the federal jurisdiction and various states. We classify interest and penalties related to underpayment of income taxes as income tax expense. We and our subsidiaries file income tax returns in the U.S. federal jurisdiction and various states and cities. Tax years 2013 through 2017 remain subject to potential examination by certain federal and state taxing authorities.
Income (Loss) Per Share
—Basic income (loss) per common share is calculated by dividing net income (loss) attributable to common stockholders by the weighted average common shares outstanding during the period using the two-class method prescribed by applicable authoritative accounting guidance. Diluted income (loss) per common share is calculated using the two-class method, or the treasury stock method, if more dilutive. Diluted income (loss) per common share reflects the potential dilution that could occur if securities or other contracts to issue common shares were exercised or converted into common shares, whereby such exercise or conversion would result in lower income per share.
Recently Adopted Accounting Standards
—In November 2016, the FASB issued ASU 2016-18,
Statement of Cash Flows (Topic 230): Restricted Cash
(“ASU 2016-18”), which clarifies the presentation of restricted cash and restricted cash equivalents in the statements of cash flows. Under ASU 2016-18 restricted cash and restricted cash equivalents are included with cash and cash equivalents when reconciling the beginning-of-period and end-of-period total amounts shown on the statements of cash flows. ASU 2016-18 is effective for fiscal years beginning after December 15, 2017, and interim periods within those fiscal years. Early adoption is permitted. We adopted this standard effective January 1, 2017 on a retrospective basis. The adoption of this standard resulted in the inclusion of restricted cash with cash and cash equivalents when reconciling the beginning-of-period and end-of-period total amounts shown on the statements of cash flows for all periods presented. As a result, for the year ended December 31, 2016, net cash provided by operating activities increased
$1.5 million
and net cash provided by investing activities increased
$3.2 million
and for the year ended December 31, 2015, net cash provided by operating activities decreased
$418,000
and net cash used in investing activities decreased
$3.9 million
. Our beginning-of-period cash, cash equivalents and restricted cash increased
$37.9 million
,
$33.1 million
and
$29.6 million
in 2017, 2016 and 2015, respectively.
Recently Issued Accounting Standards
—
In May 2014, the FASB issued ASU
2014-09,
Revenue from Contracts with Customers
(“ASU 2014-09”). ASU 2014-09 is a comprehensive new revenue recognition model, which requires a company to recognize revenue to depict the transfer of promised goods or services to a customer in an amount that reflects the consideration the company expects to receive in exchange for those goods or services. The update will replace most existing revenue recognition guidance in U.S. GAAP when it becomes effective. In August 2015, the FASB issued ASU 2015-14,
Revenue From Contracts With Customers (Topic 606): Deferral of the Effective Date
, which defers the effective date to fiscal periods beginning after December 15, 2017. The standard permits the use of either the retrospective or cumulative effect (modified) transition method. Based on our assessment of this standard, it will not materially affect the amount or timing of revenue recognition for revenues from room, food and beverage, and other hotel level sales. Additionally, we have historically disposed of hotel properties for cash sales with no contingencies and no future involvement in the hotel operations. Therefore, ASU No. 2014-09 will not impact the recognition of hotel sales. We have selected the modified retrospective method. We continue to evaluate the related disclosure requirements.
In January 2016, the FASB issued ASU 2016-01,
Recognition and Measurement of Financial Assets and Financial Liabilities
(“ASU 2016-01”), which requires an entity to: (i) measure equity investments at fair value through net income, with certain exceptions; (ii) present in OCI the changes in instrument-specific credit risk for financial liabilities measured using the fair value option; (iii) present financial assets and financial liabilities by measurement category and form of financial asset; (iv) calculate the fair value of financial instruments for disclosure purposes based on an exit price and; (v) assess a valuation allowance on deferred tax assets related to unrealized losses of available-for-sale (“AFS”) debt securities in combination with other deferred tax assets. ASU 2016-01 provides an election to subsequently measure certain nonmarketable equity investments at cost less any impairment and adjusted for certain observable price changes. It also requires a qualitative impairment assessment of such equity investments and amends certain fair value disclosure requirements. ASU 2016-01 is effective for fiscal years beginning after December 15, 2017, including interim periods within those fiscal years. Certain provisions of ASU 2016-01 are eligible for early adoption. We do not expect that ASU 2016-01 will have a material impact on our consolidated financial statements and related disclosures.
116
ASHFORD HOSPITALITY PRIME, INC. AND SUBSIDIARIES
NOTES TO CONSOLIDATED FINANCIAL STATEMENTS (continued)
In February 2016, the FASB issued ASU 2016-02,
Leases
(“ASU 2016-02”). The new standard establishes a right-of-use (“ROU”) model that requires a lessee to record a ROU asset and a lease liability on the balance sheet for all leases with terms longer than 12 months. Leases will be classified as either finance or operating, with classification affecting the pattern of expense recognition in the income statement. ASU 2016-02 is effective for fiscal years beginning after December 15, 2018, including interim periods within those fiscal years. Early adoption is permitted. A modified retrospective transition approach is required for lessees for capital and operating leases existing at, or entered into after, the beginning of the earliest comparative period presented in the financial statements, with certain practical expedients available. The accounting for leases under which we are the lessor remains largely unchanged. While we are currently in the initial stages of assessing the impact that ASU 2016-02 will have on our consolidated financial statements, we expect the primary impact to our consolidated financial statements upon adoption will be the recognition, on a discounted basis, of our future minimum rentals due under our hotel ground leases and other noncancelable leases on our consolidated balance sheets resulting in the recording of ROU assets and lease obligations.
In June 2016, the FASB issued ASU 2016-13,
Financial Instruments - Credit Losses (Topic 326): Measurement of Credit Losses on Financial Instruments
("ASU 2016-13"). The ASU sets forth an “expected credit loss” impairment model to replace the current “incurred loss” method of recognizing credit losses. The standard requires measurement and recognition of expected credit losses for most financial assets held. The ASU is effective for fiscal years beginning after December 15, 2019, including interim periods within those fiscal years. Early adoption is permitted for periods beginning after December 15, 2018. We are currently evaluating the impact that ASU 2016-13 will have on our consolidated financial statements and related disclosures.
In August 2016, the FASB issued ASU 2016-15,
Statement of Cash Flows (Topic 230): Classification of Certain Cash Receipts and Cash Payments - a consensus of the Emerging Issues Task Force
(“ASU 2016-15”). The new guidance is intended to reduce diversity in practice in how certain transactions are classified in the statement of cash flows. Certain issues addressed in this guidance include - debt payments or debt extinguishment costs, contingent consideration payments made after a business combination, proceeds from the settlement of insurance claims, distributions received from equity method investments and beneficial interests in securitization transactions. ASU 2016-15 is effective for fiscal years beginning after December 15, 2017, and interim periods within those fiscal years. Early adoption is permitted. We are currently evaluating the impact that ASU 2016-15 will have on our consolidated financial statements and related disclosures.
In January 2017, the FASB issued ASU 2017-01,
Business Combinations (Topic 805) - Clarifying the Definition of a Business
(“ASU 2017-01”), which clarifies the definition of a business with the objective of adding guidance to assist entities with evaluating whether a transaction should be accounted for as an acquisition (or disposal) of an asset or a business. ASU 2017-01 is effective for fiscal years beginning after December 15, 2017. Early adoption is permitted. While we are currently evaluating the potential impact of the standard, we currently expect that certain future hotel acquisitions may be considered asset acquisitions rather than business combinations, which would affect capitalization of acquisitions costs (such costs are expensed for business combinations and capitalized for asset acquisitions).
In February 2017, the FASB issued ASU 2017-05,
Other Income-Gains and Losses from the Derecognition of Nonfinancial Assets (Subtopic 610-20): Clarifying the Scope of Asset Derecognition Guidance and Accounting for Partial Sales of Nonfinancial Assets
(ASU “2017-05”), which clarifies the scope of ASC Subtopic 610-20, Other Income-Gains and Losses from the Derecognition of Nonfinancial Assets and adds guidance for partial sales of nonfinancial assets. ASU 2017-05 is effective for fiscal years beginning after December 15, 2017. Early adoption is permitted. An entity may elect to apply ASU 2017-05 under a retrospective or modified retrospective approach. We are evaluating the impact that ASU 2017-05 will have on our consolidated financial statements and related disclosures.
117
ASHFORD HOSPITALITY PRIME, INC. AND SUBSIDIARIES
NOTES TO CONSOLIDATED FINANCIAL STATEMENTS (continued)
3. Investments in Hotel Properties, net
Investments in hotel properties, net consisted of the following (in thousands):
|
December 31,
|
|||||||
|
2017
|
2016
|
||||||
|
Land
|
$
|
344,937
|
|
$
|
210,696
|
|
|
|
Buildings and improvements
|
962,478
|
|
972,412
|
|
|||
|
Furniture, fixtures and equipment
|
87,796
|
|
70,922
|
|
|||
|
Construction in progress
|
7,899
|
|
4,382
|
|
|||
|
Total cost
|
1,403,110
|
|
1,258,412
|
|
|||
|
Accumulated depreciation
|
(257,268
|
)
|
(243,880
|
)
|
|||
|
Investments in hotel properties, net
|
$
|
1,145,842
|
|
$
|
1,014,532
|
|
|
The cost of land and depreciable property, net of accumulated depreciation, for federal income tax purposes was approximately
$1.2 billion
and
$1.0 billion
as of
December 31, 2017
and
2016
, respectively.
For the years ended
December 31, 2017
,
2016
and
2015
, depreciation expense was
$52.1 million
,
$45.7 million
and
$43.6 million
, respectively.
Park Hyatt Beaver Creek
On March 31, 2017, we acquired a
100%
interest in the Park Hyatt Beaver Creek in Beaver Creek, Colorado for total consideration of
$145.5 million
. Concurrent with the closing of the acquisition, we completed the financing of a
$67.5 million
mortgage loan. See note 9.
We prepared the purchase price allocation of the assets acquired and liabilities assumed. The final purchase price allocation was completed with the assistance of a third party appraisal firm during the three months ended June 30, 2017. The final purchase price allocation resulted in adjustments to land, buildings and improvements and furniture, fixtures and equipment. These adjustments did not result in any changes to depreciation expense as the acquisition closed on March 31, 2017. This valuation is considered a Level 3 valuation technique.
The following table summarizes the estimated fair value of the assets acquired in the acquisition (in thousands):
|
Preliminary Allocations as of March 31, 2017
|
Adjustments
|
Final Allocations as of June 30, 2017
|
|||||||||
|
Land
|
$
|
92,470
|
|
$
|
(3,353
|
)
|
$
|
89,117
|
|
||
|
Buildings and improvements
|
47,724
|
|
3,545
|
|
51,269
|
|
|||||
|
Furniture, fixtures and equipment
|
5,306
|
|
(192
|
)
|
5,114
|
|
|||||
|
$
|
145,500
|
|
$
|
—
|
|
$
|
145,500
|
|
|||
|
Net other assets (liabilities)
|
$
|
4,528
|
|
$
|
(721
|
)
|
$
|
3,807
|
|
||
The results of operations of the hotel property have been included in our results of operations since the acquisition date. For the year ended
December 31, 2017
, we have included total revenue of
$22.0 million
and net loss of
$2.5 million
in our consolidated statements of operations. The unaudited pro forma results of operations as if the acquisition had occurred on January 1, 2016 are included below under “Pro Forma Financial Results.”
Hotel Yountville
On May 11, 2017, we acquired a
100%
interest in the Hotel Yountville in Yountville, California for total consideration of
$96.5 million
. Concurrent with the closing of the acquisition, we completed the financing of a
$51.0 million
mortgage loan. See note 9.
118
ASHFORD HOSPITALITY PRIME, INC. AND SUBSIDIARIES
NOTES TO CONSOLIDATED FINANCIAL STATEMENTS (continued)
We prepared a purchase price allocation of the assets acquired and liabilities assumed. The final purchase price allocation was prepared with the assistance of a third-party appraisal firm during the three months ended September 30, 2017. The property level working capital balances amounted to a net liability of
$2.1 million
. This valuation is considered a Level 3 valuation technique.
The following table summarizes the estimated fair value of the assets acquired in the acquisition (in thousands):
|
Final Allocations as of September 30, 2017
|
|||
|
Land
|
$
|
47,849
|
|
|
Buildings and improvements
|
41,216
|
|
|
|
Furniture, fixtures and equipment
|
7,351
|
|
|
|
96,416
|
|
||
|
Inventories
|
84
|
|
|
|
$
|
96,500
|
|
|
The results of operations of the hotel property have been included in our results of operations as of the acquisition date. For the year ended
December 31, 2017
, we have included total revenue of
$9.6 million
and net income of
$803,000
in our consolidated statements of operations. The unaudited pro forma results of operations as if the acquisition had occurred on January 1, 2016 are included below.
Pro Forma Financial Results
The following table reflects the unaudited pro forma results of operations for the years ended December 31, 2017 and 2016 as if the acquisitions had occurred and the applicable indebtedness was incurred on January 1, 2016, and the removal of
$5.3 million
of non-recurring transaction costs directly attributable to the acquisitions for the year ended
December 31, 2017
(in thousands):
|
Year Ended December 31,
|
|||||||
|
2017
|
2016
|
||||||
|
Total revenue
|
$
|
437,149
|
|
$
|
462,416
|
|
|
|
Net income (loss)
|
38,535
|
|
30,437
|
|
|||
|
Net income (loss) attributable to common stockholders
|
25,132
|
|
20,823
|
|
|||
|
Pro Forma income per share:
|
|||||||
|
Basic
|
$
|
0.81
|
|
$
|
0.77
|
|
|
|
Diluted
|
$
|
0.81
|
|
$
|
0.74
|
|
|
|
Weighted average common shares outstanding (in thousands):
|
|||||||
|
Basic
|
30,473
|
|
26,648
|
|
|||
|
Diluted
|
34,706
|
|
31,195
|
|
|||
Impairment Charges and Insurance Recoveries
In September 2017, the Ritz-Carlton, St. Thomas located in St. Thomas, USVI, Key West Pier House located in Key West, FL and Tampa Renaissance located in Tampa, FL were impacted by the effects of Hurricanes Irma and Maria. The Company holds insurance policies that provide coverage for property damage and business interruption after meeting certain deductibles at all of its hotel properties. During the year ended
December 31, 2017
, the Company recognized impairment charges, net of anticipated insurance recoveries of
$1.1 million
. Additionally, the Company recognized remediation and other costs, net of anticipated insurance recoveries of
$3.8 million
, included primarily in other hotel operating expenses. As of
December 31, 2017
, the Company has recorded an insurance receivable of
$8.8 million
, net of deductibles of
$4.9 million
, related to the anticipated insurance recoveries. During the year ended December 31, 2017, the Company received proceeds of
$11.1 million
for business interruption losses associated with lost profits, of which
$4.1 million
has been recorded as “other” hotel revenue in our consolidated statement of operations,
$3.3 million
represented reimbursement of incurred expenses in excess of the deductible of
$1.1 million
and
$3.7
119
ASHFORD HOSPITALITY PRIME, INC. AND SUBSIDIARIES
NOTES TO CONSOLIDATED FINANCIAL STATEMENTS (continued)
million
was recorded as a reduction to insurance receivable. The Company will not record an insurance recovery receivable for business interruption losses associated with lost profits until the amount for such recoveries is known and the amount is realizable.
4. Hotel Dispositions
On July 1, 2016, the Company sold the Courtyard Seattle Downtown for
$84.5 million
in cash. The sale resulted in a gain of
$26.4 million
for the year ended December 31, 2016 and is included in “gain on sale of hotel property” in our consolidated statements of operations.
On November 1, 2017, the Company sold the Plano Marriott Legacy Town Center for
$104.0 million
in cash. The sale resulted in a gain of
$23.8 million
for the year ended
December 31, 2017
and is included in “gain on sale of hotel property” in our consolidated statements of operations.
Since the sales of the hotel properties did not represent a strategic shift that has (or will have) a major effect on our operations or financial results, its results of operations were not reported as discontinued operations in our consolidated financial statements.
We included the results of operations for these assets through the date of disposition in net income (loss) as shown in our consolidated statements of operations for the years ended
December 31,
2017
,
2016
and
2015
, respectively
.
The following table includes the condensed financial information from these hotel properties (in thousands):
|
Year Ended December 31,
|
|||||||||||
|
2017
|
2016
|
2015
|
|||||||||
|
Total hotel revenue
|
$
|
27,250
|
|
$
|
39,995
|
|
$
|
48,292
|
|
||
|
Total hotel operating expenses
|
(16,673
|
)
|
(24,106
|
)
|
(28,820
|
)
|
|||||
|
Operating income (loss)
|
10,577
|
|
15,889
|
|
19,472
|
|
|||||
|
Property taxes, insurance and other
|
(1,171
|
)
|
(1,717
|
)
|
(1,966
|
)
|
|||||
|
Depreciation and amortization
|
(3,796
|
)
|
(5,157
|
)
|
(6,200
|
)
|
|||||
|
Gain (loss) on sale of hotel property
|
23,797
|
|
26,359
|
|
—
|
|
|||||
|
Interest expense and amortization of loan costs
|
(2,303
|
)
|
(6,308
|
)
|
(8,181
|
)
|
|||||
|
Write-off of loan costs and exit fees
|
(607
|
)
|
(2,595
|
)
|
—
|
|
|||||
|
Income before income taxes
|
26,497
|
|
26,471
|
|
3,125
|
|
|||||
|
(Income) loss before income taxes attributable to redeemable noncontrolling interests in operating partnership
|
(3,029
|
)
|
(3,679
|
)
|
(398
|
)
|
|||||
|
Income (loss) before income taxes attributable to the Company
|
$
|
23,468
|
|
$
|
22,792
|
|
$
|
2,727
|
|
||
5. Note Receivable
As of
December 31, 2017
and
2016
, we held a note receivable of
$8.1 million
from the city of Philadelphia, Pennsylvania. The note bears interest at a rate of
12.85%
and matures in 2018. The interest income recorded on the note receivable is offset against the interest expense recorded on the TIF loan of the same amount. See note 9.
6. Investment in Unconsolidated Entity
Ashford Inc.
On July 31, 2015, we entered into a block trade with an unaffiliated third party pursuant to a sale arrangement between the Company, Ashford Inc. and Ashford Trust. The block trade included the purchase from a third party of approximately
175,000
shares of Ashford Inc. common stock at
$95.00
per share, which approximated the
120
-day volume weighted average share price, for a total cost of approximately
$16.6 million
. The sale arrangement and block trade were evaluated and approved by the independent members of our board of directors. The block trade purchase price and other terms of the sale arrangement were the result of negotiations with the third party, and the board of directors received a fairness opinion from an independent financial advisor that the price paid for the Ashford Inc. shares by the Company was fair to the Company. We did not receive any concessions or economic benefits from Ashford Inc. pertaining to our current contractual arrangements with Ashford Inc. in connection with this block trade. The block trade settled on August 4, 2015, and the loss resulting from the block trade is recorded within “unrealized loss on investment in Ashford Inc.” in our consolidated statement of operations for the year ended December 31, 2015.
120
ASHFORD HOSPITALITY PRIME, INC. AND SUBSIDIARIES
NOTES TO CONSOLIDATED FINANCIAL STATEMENTS (continued)
Separately, on September 14, 2015, we received
19,897
shares of Ashford Inc. common stock from Ashford Inc. as part of our acquisition of the Bardessono Hotel. As of
December 31, 2017
and
2016
, we held approximately
195,000
shares of Ashford Inc. common stock, which represented an approximate
9.3%
and
9.7%
ownership interest, respectively, and a fair value of
$18.1 million
and
$8.4 million
, respectively. See notes 11 and 12.
We have elected to use the fair value option, under the applicable accounting guidance, to account for our investment in Ashford Inc. as the fair value is readily available since Ashford Inc. common stock is traded on a national exchange. The fair value of our investment in Ashford Inc. is included in “investment in Ashford Inc., at fair value” on our consolidated balance sheets, and changes in market value are included in “unrealized loss on investment in Ashford Inc.” on our consolidated statements of operations.
The following tables summarize the condensed balance sheets as of
December 31, 2017
and
2016
, and the condensed statements of operations for the years ended
December 31, 2017
,
2016
and
2015
, of Ashford Inc. (in thousands):
Ashford Inc.
Condensed Consolidated Balance Sheets
|
December 31, 2017
|
December 31, 2016
|
|||||||
|
Total assets
|
$
|
114,810
|
|
$
|
129,797
|
|
||
|
Total liabilities
|
78,742
|
|
38,168
|
|
||||
|
Redeemable noncontrolling interests
|
5,111
|
|
1,480
|
|
||||
|
Total stockholders’ equity of Ashford Inc.
|
30,185
|
|
37,377
|
|
||||
|
Noncontrolling interests in consolidated entities
|
772
|
|
52,772
|
|
||||
|
Total equity
|
30,957
|
|
90,149
|
|
||||
|
Total liabilities and equity
|
$
|
114,810
|
|
$
|
129,797
|
|
||
|
Our investment in Ashford Inc., at fair value
|
$
|
18,124
|
|
$
|
8,407
|
|
||
Ashford Inc.
Condensed Consolidated Statements of Operations
|
Year Ended December 31,
|
||||||||||||
|
2017
|
2016
|
2015
|
||||||||||
|
Total revenue
|
$
|
81,573
|
|
$
|
67,607
|
|
$
|
58,981
|
|
|||
|
Total operating expenses
|
(92,095
|
)
|
(70,064
|
)
|
(60,332
|
)
|
||||||
|
Operating loss
|
(10,522
|
)
|
(2,457
|
)
|
(1,351
|
)
|
||||||
|
Realized and unrealized gain (loss) on investment in unconsolidated entity
|
—
|
|
(1,460
|
)
|
(2,141
|
)
|
||||||
|
Realized and unrealized gain (loss) on investments
|
(91
|
)
|
(7,787
|
)
|
(7,600
|
)
|
||||||
|
Other
|
142
|
|
81
|
|
1,114
|
|
||||||
|
Income tax (expense) benefit
|
(9,723
|
)
|
(780
|
)
|
(2,066
|
)
|
||||||
|
Net income (loss)
|
(20,194
|
)
|
(12,403
|
)
|
(12,044
|
)
|
||||||
|
(Income) loss from consolidated entities attributable to noncontrolling interests
|
358
|
|
8,860
|
|
10,852
|
|
||||||
|
Net (income) loss attributable to redeemable noncontrolling interests
|
1,484
|
|
1,147
|
|
2
|
|
||||||
|
Net gain (loss) attributable to Ashford Inc.
|
$
|
(18,352
|
)
|
$
|
(2,396
|
)
|
$
|
(1,190
|
)
|
|||
|
Our unrealized gain (loss) on investment in Ashford Inc.
|
$
|
9,717
|
|
$
|
(1,970
|
)
|
$
|
(7,609
|
)
|
|||
121
ASHFORD HOSPITALITY PRIME, INC. AND SUBSIDIARIES
NOTES TO CONSOLIDATED FINANCIAL STATEMENTS (continued)
7. Deferred Costs, net
Deferred costs, net consisted of the following (in thousands):
|
December 31,
|
|||||||
|
2017
|
2016
|
||||||
|
Deferred loan costs
|
$
|
1,074
|
|
$
|
1,074
|
|
|
|
Accumulated amortization
|
(418
|
)
|
(54
|
)
|
|||
|
Deferred costs, net
|
$
|
656
|
|
$
|
1,020
|
|
|
8. Intangible Assets, net and Intangible Liability, net
Intangible assets, net and intangible liability, net consisted of the following (in thousands):
|
Intangible Assets, net
|
Intangible Liability, net
|
||||||||||||||
|
December 31,
|
December 31,
|
||||||||||||||
|
2017
|
2016
|
2017
|
2016
|
||||||||||||
|
Cost
|
$
|
24,050
|
|
$
|
24,050
|
|
$
|
4,179
|
|
$
|
4,179
|
|
|||
|
Accumulated amortization
|
(1,505
|
)
|
(1,204
|
)
|
(610
|
)
|
(554
|
)
|
|||||||
|
$
|
22,545
|
|
$
|
22,846
|
|
$
|
3,569
|
|
$
|
3,625
|
|
||||
Intangible assets represents favorable market-rate leases which relate to the acquisitions of the Hilton La Jolla Torrey Pines hotel in La Jolla, CA and the Bardessono Hotel in Yountville, CA, which are being amortized over the lease terms with expiration dates of 2067 and 2105, respectively. The intangible liability represents an unfavorable market-rate lease which relates to the acquisition of the Renaissance Tampa International Plaza in Tampa, FL, which is being amortized over the remaining initial lease term that expires in 2080.
For the years ended December 31,
2017
,
2016
and
2015
, amortization related to intangible assets was
$301,000
,
$314,000
and
$199,000
, respectively, and amortization related to the intangible liability was
$56,000
,
$57,000
and
$57,000
, respectively.
Estimated future amortization expense for intangible assets and intangible liabilities for each of the next five years is as follows (in thousands):
|
Intangible
Assets
|
Intangible
Liability
|
||||||
|
2018
|
$
|
277
|
|
$
|
57
|
|
|
|
2019
|
277
|
|
57
|
|
|||
|
2020
|
277
|
|
57
|
|
|||
|
2021
|
277
|
|
57
|
|
|||
|
2022
|
277
|
|
57
|
|
|||
|
Thereafter
|
21,160
|
|
3,284
|
|
|||
|
Total
|
$
|
22,545
|
|
$
|
3,569
|
|
|
122
ASHFORD HOSPITALITY PRIME, INC. AND SUBSIDIARIES
NOTES TO CONSOLIDATED FINANCIAL STATEMENTS (continued)
9. Indebtedness, net
Indebtedness and the carrying values of related collateral were as follows (in thousands):
|
December 31, 2017
|
December 31, 2016
|
|||||||||||||||||||||
|
Indebtedness
|
Collateral
|
Maturity
|
Interest
Rate
|
Debt
Balance
|
Book Value of
Collateral
|
Debt
Balance |
Book Value of
Collateral |
|||||||||||||||
|
Secured revolving credit facility
(3)
|
None
|
November 2019
|
Base Rate
(2)
+ 1.25% to 2.50% or LIBOR
(1)
+ 2.25% to 3.50%
|
$
|
—
|
|
$
|
—
|
|
$
|
—
|
|
$
|
—
|
|
|||||||
|
Mortgage loan
(4) (5)
|
1 hotel
|
April 2017
|
5.91%
|
—
|
|
—
|
|
32,879
|
|
89,443
|
|
|||||||||||
|
Mortgage loan
(4)
|
1 hotel
|
April 2017
|
5.95%
|
—
|
|
—
|
|
55,915
|
|
84,492
|
|
|||||||||||
|
Mortgage loan
(4)
|
3 hotels
|
April 2017
|
5.95%
|
—
|
|
—
|
|
245,307
|
|
257,465
|
|
|||||||||||
|
Mortgage loan
(6)
|
1 hotel
|
December 2017
|
LIBOR
(1)
+ 4.95%
|
—
|
|
—
|
|
40,000
|
|
59,521
|
|
|||||||||||
|
Mortgage loan
(7)
|
1 hotel
|
March 2018
|
LIBOR
(1)
+ 2.30%
|
80,000
|
|
142,374
|
|
80,000
|
|
139,560
|
|
|||||||||||
|
Mortgage loan
(8)
|
1 hotel
|
March 2018
|
LIBOR
(1)
+ 2.25%
|
70,000
|
|
87,334
|
|
70,000
|
|
88,923
|
|
|||||||||||
|
TIF loan
(5) (9)
|
1 hotel
|
June 2018
|
12.85%
|
8,098
|
|
—
|
|
8,098
|
|
—
|
|
|||||||||||
|
Mortgage loan
(10)
|
1 hotel
|
December 2018
|
LIBOR
(1)
+ 4.95%
|
42,000
|
|
40,024
|
|
42,000
|
|
63,306
|
|
|||||||||||
|
Mortgage loan
(4) (5) (11)
|
4 hotels
|
February 2019
|
LIBOR
(1)
+ 2.58%
|
277,628
|
|
353,853
|
|
—
|
|
—
|
|
|||||||||||
|
Mortgage loan
(12)
|
1 hotel
|
April 2019
|
LIBOR
(1)
+ 2.75%
|
67,500
|
|
143,652
|
|
—
|
|
—
|
|
|||||||||||
|
Mortgage loan
(13)
|
2 hotels
|
November 2019
|
LIBOR
(1)
+ 2.65%
|
190,010
|
|
225,904
|
|
192,765
|
|
231,822
|
|
|||||||||||
|
Mortgage loan
|
1 hotel
|
May 2022
|
LIBOR
(1)
+ 2.55%
|
51,000
|
|
94,910
|
|
—
|
|
—
|
|
|||||||||||
|
Mortgage loan
(6)
|
1 hotel
|
August 2022
|
LIBOR
(1)
+ 2.55%
|
40,000
|
|
57,791
|
|
—
|
|
—
|
|
|||||||||||
|
826,236
|
|
1,145,842
|
|
766,964
|
|
1,014,532
|
|
|||||||||||||||
|
Deferred loan costs, net
|
(5,277
|
)
|
—
|
|
(2,348
|
)
|
—
|
|
||||||||||||||
|
Indebtedness, net
|
$
|
820,959
|
|
$
|
1,145,842
|
|
$
|
764,616
|
|
$
|
1,014,532
|
|
||||||||||
__________________
|
(1)
|
LIBOR rates were
1.564%
and
0.772%
at
December 31, 2017
and
2016
, respectively.
|
|
(2)
|
Base Rate, as defined in the secured revolving credit facility agreement, is the greater of (i) the prime rate set by Bank of America, or (ii) federal funds rate +
0.5%
, or (iii) LIBOR +
1.0%
.
|
|
(3)
|
Our borrowing capacity under our secured revolving credit facility is
$100.0 million
. We have an option, subject to lender approval, to further increase the borrowing capacity to an aggregate of
$250.0 million
. We may use up to
$15.0 million
for standby letters of credit. The secured revolving credit facility has
two
one
-year extension options subject to advance notice, satisfaction of certain conditions and a
0.25%
extension fee.
|
|
(4)
|
On January 18, 2017, we refinanced
three
mortgage loans totaling
$333.7 million
set to mature in April 2017 with a new
$365.0 million
mortgage loan with a
two
-year initial term and
five
one
-year extension options subject to the satisfaction of certain conditions. The new loan is interest only and bears interest at a rate of LIBOR +
2.58%
.
|
|
(5)
|
These loans are collateralized by the same hotel property. This hotel property is now included in the
$277.6 million
mortgage loan.
|
|
(6)
|
On August 18, 2017, we refinanced our
$40.0 million
mortgage loan with a final maturity date in December 2020 with a new
$40.0 million
mortgage loan that is interest only at a rate of LIBOR +
2.55%
and has a
five
-year term.
|
|
(7)
|
This mortgage loan has
three
one
-year extension options, subject to satisfaction of certain conditions, of which the second was exercised in March 2017.
|
|
(8)
|
This mortgage loan has
three
one
-year extension options, subject to satisfaction of certain conditions, of which the first was exercised in March 2017.
|
|
(9)
|
The interest expense from the TIF loan is offset against interest income recorded on the note receivable of the same amount. See note 5.
|
|
(10)
|
This mortgage loan has
three
one
-year extension options, subject to satisfaction of certain conditions, of which the first was exercised in December 2017.
|
|
(11)
|
This mortgage loan had an
$87.4 million
pay down of principal in connection with the sale of the Marriott Plano Legacy Town Center on November 1, 2017. See Note 4.
|
|
(12)
|
This mortgage loan has three one-year extension options, subject to satisfaction of certain conditions.
|
|
(13)
|
This mortgage loan has
two
one
-year extension options, subject to satisfaction of certain conditions.
|
123
ASHFORD HOSPITALITY PRIME, INC. AND SUBSIDIARIES
NOTES TO CONSOLIDATED FINANCIAL STATEMENTS (continued)
Maturities and scheduled amortization of indebtedness as of
December 31, 2017
for each of the following five years and thereafter are as follows (in thousands):
|
2018
|
$
|
203,274
|
|
|
2019
|
531,962
|
|
|
|
2020
|
—
|
|
|
|
2021
|
—
|
|
|
|
2022
|
91,000
|
|
|
|
Thereafter
|
—
|
|
|
|
Total
|
$
|
826,236
|
|
On January 18, 2017, we refinanced
three
mortgage loans with existing outstanding balances totaling approximately
$333.7 million
and final maturity dates in April 2017. The new mortgage loan totaled
$277.6 million
, is interest only with a floating rate of LIBOR +
2.58%
and has a stated maturity of February 2019 with
five
one
-year extension options, subject to the satisfaction of certain conditions. On November 1, 2017, we completed the sale of the Plano Marriott Legacy Town Center for
$104.0 million
in cash. We repaid approximately
$87.4 million
on the mortgage loan that was previously secured in part by the hotel property. The mortgage loan is secured by
four
hotel properties: Seattle Marriott Waterfront, Tampa Renaissance, San Francisco Courtyard Downtown and Philadelphia Courtyard Downtown.
On March 31, 2017, in connection with the acquisition of the Park Hyatt Beaver Creek, we completed the financing of a
$67.5 million
mortgage loan. This mortgage loan is interest only and provides for a floating interest rate of LIBOR +
2.75%
. The stated maturity date of the mortgage loan is April 2019, with
three
one
-year extension options, subject to the satisfaction of certain conditions. The mortgage loan is secured by the Park Hyatt Beaver Creek.
On May 11, 2017, in connection with the acquisition of the Hotel Yountville, we completed the financing of a
$51.0 million
mortgage loan. This mortgage loan is interest only and provides for a floating interest rate of LIBOR +
2.55%
. The stated maturity date of the mortgage loan is
May 2022
. The mortgage loan is secured by the Hotel Yountville.
On August 18, 2017, we refinanced our existing
$40.0 million
mortgage loan with a final maturity date in December 2020 with a new
$40.0 million
mortgage loan that is interest only, provides for a floating interest rate of LIBOR +
2.55%
and has a stated maturity date of August 2022. The mortgage loan is secured by the Bardessono Hotel.
We are required to maintain certain financial ratios under our secured revolving credit facility. If we violate covenants in any debt agreement, we could be required to repay all or a portion of our indebtedness before maturity at a time when we might be unable to arrange financing for such repayment on attractive terms, if at all. Violations of certain debt covenants may result in our inability to borrow unused amounts under our line of credit, even if repayment of some or all of our borrowings is not required. The assets of certain of our subsidiaries are pledged under non-recourse indebtedness and are not available to satisfy the debts and other obligations of the consolidated group. As of
December 31, 2017
, we were in compliance in all material respects with all covenants or other requirements set forth in our debt agreements as amended.
10. Derivative Instruments
Interest Rate Derivatives
—We are exposed to risks arising from our business operations, economic conditions and financial markets. To manage these risks, we primarily use interest rate derivatives to hedge our debt and our cash flows. The interest rate derivatives include interest rate caps and interest rate floors, which are subject to master netting settlement arrangements. All derivatives are recorded at fair value.
During the year ended
December 31, 2017
, we entered into interest rate caps with notional amounts totaling
$844.2 million
and strike rates ranging from
3.00%
to
11.61%
. These interest rate caps had effective dates from
January 2017
to
December 2017
, maturity dates from
March 2018
to
September 2019
, and a total cost of
$375,000
. These instruments were not designated as cash flow hedges. We also entered into interest rate floors with notional amounts of
$3.9 billion
and strike rates ranging from
1.00%
to
1.50%
. These interest rate floors had effective dates from
September 2017
to
December 2017
and maturity dates from
March 2019
to
June 2019
and a total cost of
$140,000
.
124
ASHFORD HOSPITALITY PRIME, INC. AND SUBSIDIARIES
NOTES TO CONSOLIDATED FINANCIAL STATEMENTS (continued)
During the year ended December 31, 2016, we entered into interest rate caps with notional amounts totaling
$224.5 million
and strike rates ranging from
5.43%
to
5.78%
. These interest rate caps had effective dates from
March 2016
to
December 2016
, maturity dates from
March 2017
to
December 2017
and total costs of
$13,000
. These instruments were not designated as cash flow hedges.
As of
December 31, 2017
, we held interest rate caps with notional amounts totaling
$887.7 million
and strike rates ranging from
2.00%
to
11.61%
. These instruments cap the interest rates on our mortgage loans with an aggregate principal balances of
$818.1 million
and maturity dates from
March 2018
to
August 2022
. These instruments have maturity dates ranging from
January 2018
to
September 2019
.
As of
December 31, 2017
, we held interest rate floors with notional amounts totaling
$6.9 billion
and strike rates ranging from
-0.25%
to
1.50%
. These instruments have maturity dates ranging from
March 2019
to
July 2020
.
Credit Default Swap Derivatives
—We use credit default swaps, tied to the CMBX index, to hedge financial and capital market risk. A credit default swap is a derivative contract that functions like an insurance policy against the credit risk of an entity or obligation. The seller of protection assumes the credit risk of the reference obligation from the buyer (us) of protection in exchange for annual premium payments. If a default or a loss, as defined in the credit default swap agreements, occurs on the underlying bonds, then the buyer of protection is protected against those losses. The only liability for us, the buyer, is the annual premium and any change in value of the underlying CMBX index (if the trade is terminated prior to maturity). For all CMBX trades completed to date, we were the buyer of protection. Credit default swaps are subject to master-netting settlement arrangements and credit support annexes. As of
December 31, 2017
, we held a credit default swap with a notional amount of
$50.0 million
, an effective date of August 2017 and an expected maturity date of October 2026. Assuming the underlying bonds pay off at par over their remaining average life, our estimated total exposure for these trades was approximately
$2.4 million
as of
December 31, 2017
. Cash collateral is posted by us as well as our counterparties. We offset the fair value of the derivative and the obligation/right to return/reclaim cash collateral. The change in market value of credit default swaps is settled net through posting cash collateral or reclaiming cash collateral between us and our counterparties when such change in market value is over
$250,000
.
Options on Futures Contracts
—During the year ended December 31, 2016, we purchased an option on Eurodollar futures for a total cost of
$124,000
and a maturity date of June 2017. During the year ended
December 31, 2017
, we made
no
such purchases.
11. Fair Value Measurements
Fair Value Hierarchy
—Our financial instruments measured at fair value either on a recurring or a non-recurring basis are classified in a hierarchy for disclosure purposes consisting of three levels based on the observability of inputs in the market place as discussed below:
|
•
|
Level 1: Fair value measurements that are quoted prices (unadjusted) in active markets that we have the ability to access for identical assets or liabilities. Market price data generally is obtained from exchange or dealer markets.
|
|
•
|
Level 2: Fair value measurements based on inputs other than quoted prices included in Level 1, that are observable for the asset or liability, either directly or indirectly. Level 2 inputs include quoted prices for similar assets and liabilities in active markets, and inputs other than quoted prices that are observable for the asset or liability, such as interest rates and yield curves that are observable at commonly quoted intervals.
|
|
•
|
Level 3: Fair value measurements based on valuation techniques that use significant inputs that are unobservable. The circumstances for using these measurements include those in which there is little, if any, market activity for the asset or liability.
|
The fair value of interest rate caps is determined using the market standard methodology of discounting the future expected cash receipts that would occur if variable interest rates rise above the strike rates of the caps. The variable interest rates used in the calculation of projected receipts on the caps are based on an expectation of future interest rates derived from observable market interest rate curves (LIBOR forward curves) and volatilities (the Level 2 inputs). We also incorporate credit valuation adjustments (the Level 3 inputs) to appropriately reflect both our own non-performance risk and the respective counterparty’s non-performance risk.
Fair value of credit default swaps are obtained from a third party who publishes various information including the index composition and price data (Level 2 inputs). The fair value of credit default swaps does not contain credit-risk-related adjustments as the change in fair value is settled net through posting cash collateral or reclaiming cash collateral between us and our counterparty.
The fair value of interest rate floors is calculated using a third-party discounted cash flow model based on future cash flows that are expected to be received over the remaining life of the floor. These expected future cash flows are probability-weighted
125
ASHFORD HOSPITALITY PRIME, INC. AND SUBSIDIARIES
NOTES TO CONSOLIDATED FINANCIAL STATEMENTS (continued)
projections based on the contract terms, accounting for both the magnitude and likelihood of potential payments, which are both computed using the appropriate LIBOR forward curve and market implied volatilities as of the valuation date (Level 2 inputs).
The fair value of options on futures contracts is determined based on the last reported settlement price as of the measurement date (Level 1 inputs). These exchange-traded options are centrally cleared, and a clearinghouse stands in between all trades to ensure that the obligations involved in the trades are satisfied.
When a majority of the inputs used to value our derivatives fall within Level 2 of the fair value hierarchy, the derivative valuations in their entirety are classified in Level 2 of the fair value hierarchy. However, when the valuation adjustments associated with our derivatives utilize Level 3 inputs, such as estimates of current credit spreads, to evaluate the likelihood of default by us and our counter-parties, which we consider significant (
10%
or more) to the overall valuation of our derivatives, the derivative valuations in their entirety are classified in Level 3 of the fair value hierarchy. Transfers of inputs between levels are determined at the end of each reporting period. In determining the fair values of our derivatives at
December 31, 2017
, the LIBOR interest rate forward curve (Level 2 inputs) assumed an uptrend from
1.564%
to
2.184%
for the remaining term of our derivatives. Credit spreads (Level 3 inputs) used in determining the fair values of hedge and non-hedge designated derivatives assumed an uptrend in nonperformance risk for us and all of our counterparties through the maturity dates.
Assets and Liabilities Measured at Fair Value on a Recurring Basis
The following tables present our assets and liabilities measured at fair value on a recurring basis aggregated by the level within which measurements fall in the fair value hierarchy (in thousands):
|
Quoted Market Prices (Level 1)
|
Significant Other
Observable Inputs
(Level 2)
|
Significant Unobservable Inputs
(Level 3)
|
Counterparty and Cash Collateral Netting
(1)
|
Total
|
||||||||||||||||
|
December 31, 2017
|
||||||||||||||||||||
|
Assets
|
||||||||||||||||||||
|
Derivative assets:
|
||||||||||||||||||||
|
Interest rate derivatives - floors
|
$
|
—
|
|
$
|
118
|
|
$
|
—
|
|
$
|
12
|
|
$
|
130
|
|
|||||
|
Interest rate derivatives - caps
|
—
|
|
4
|
|
—
|
|
—
|
|
4
|
|
||||||||||
|
Credit default swaps
|
—
|
|
102
|
|
—
|
|
358
|
|
460
|
|
||||||||||
|
—
|
|
224
|
|
—
|
|
370
|
|
$
|
594
|
|
(2)
|
|||||||||
|
Non-derivative assets:
|
||||||||||||||||||||
|
Investment in Ashford Inc.
|
18,124
|
|
—
|
|
—
|
|
—
|
|
18,124
|
|
||||||||||
|
Total
|
$
|
18,124
|
|
$
|
224
|
|
$
|
—
|
|
$
|
370
|
|
$
|
18,718
|
|
|||||
|
Quoted Market Prices (Level 1)
|
Significant Other
Observable Inputs
(Level 2)
|
Significant Unobservable Inputs
(Level 3)
|
Counterparty and Cash Collateral Netting
(1)
|
Total
|
||||||||||||||||
|
December 31, 2016
|
||||||||||||||||||||
|
Assets
|
||||||||||||||||||||
|
Derivative assets:
|
||||||||||||||||||||
|
Interest rate derivatives - floors
|
$
|
—
|
|
$
|
1,091
|
|
$
|
—
|
|
$
|
—
|
|
$
|
1,091
|
|
|||||
|
Options on futures contracts
|
58
|
|
—
|
|
—
|
|
—
|
|
58
|
|
||||||||||
|
58
|
|
1,091
|
|
—
|
|
—
|
|
1,149
|
|
(2)
|
||||||||||
|
Non-derivative assets:
|
||||||||||||||||||||
|
Investment in Ashford Inc.
|
8,407
|
|
—
|
|
—
|
|
—
|
|
8,407
|
|
||||||||||
|
Total
|
$
|
8,465
|
|
$
|
1,091
|
|
$
|
—
|
|
$
|
—
|
|
$
|
9,556
|
|
|||||
__________________
|
(1)
|
Represents net cash collateral posted between us and our counterparties.
|
|
(2)
|
Reported as “derivative assets” in our consolidated balance sheets.
|
126
ASHFORD HOSPITALITY PRIME, INC. AND SUBSIDIARIES
NOTES TO CONSOLIDATED FINANCIAL STATEMENTS (continued)
Effect of Fair Value Measured Assets and Liabilities on Consolidated Statements of Operations
The following table summarizes the effect of fair value measured assets and liabilities on our consolidated statements of operations (in thousands):
|
Gain (Loss) Recognized in Income (Loss)
|
||||||||||||
|
Year Ended December 31,
|
||||||||||||
|
2017
|
2016
|
2015
|
||||||||||
|
Assets
|
||||||||||||
|
Derivative assets:
|
||||||||||||
|
Interest rate derivatives - floors
|
$
|
(1,113
|
)
|
$
|
513
|
|
$
|
(2,963
|
)
|
|||
|
Interest rate derivatives - caps
|
(371
|
)
|
(71
|
)
|
(94
|
)
|
||||||
|
Credit default swaps
|
(785
|
)
|
(1)
|
—
|
|
—
|
|
|||||
|
Equity put options
|
—
|
|
—
|
|
(1,017
|
)
|
||||||
|
Equity call options
|
—
|
|
—
|
|
23
|
|
||||||
|
Options on futures contracts
|
(58
|
)
|
(173
|
)
|
(195
|
)
|
||||||
|
Non-derivative assets:
|
||||||||||||
|
Investment in Ashford Inc.
|
9,717
|
|
(1,970
|
)
|
(7,609
|
)
|
||||||
|
Equity - American Depositary Receipt
|
—
|
|
—
|
|
(75
|
)
|
||||||
|
Equity securities
|
—
|
|
—
|
|
560
|
|
||||||
|
U.S. treasury securities
|
—
|
|
—
|
|
53
|
|
||||||
|
Total
|
7,390
|
|
(1,701
|
)
|
(11,317
|
)
|
||||||
|
Liabilities
|
||||||||||||
|
Derivative liabilities:
|
||||||||||||
|
Short equity put options
|
—
|
|
—
|
|
680
|
|
||||||
|
Short equity call options
|
—
|
|
—
|
|
844
|
|
||||||
|
Net
|
$
|
7,390
|
|
$
|
(1,701
|
)
|
$
|
(9,793
|
)
|
|||
|
Total combined
|
||||||||||||
|
Interest rate derivatives - floors
|
$
|
(1,113
|
)
|
$
|
513
|
|
$
|
(2,963
|
)
|
|||
|
Interest rate derivatives - caps
|
(371
|
)
|
(71
|
)
|
(94
|
)
|
||||||
|
Credit default swaps
|
(785
|
)
|
—
|
|
—
|
|
||||||
|
Options on futures contracts
|
213
|
|
(17
|
)
|
(195
|
)
|
||||||
|
Unrealized gain (loss) on derivatives
|
(2,056
|
)
|
425
|
|
(3,252
|
)
|
||||||
|
Realized gain (loss) on options on futures contracts
|
(271
|
)
|
(2)
|
(156
|
)
|
(2)
|
—
|
|
||||
|
Unrealized gain (loss) on investment in Ashford Inc.
|
9,717
|
|
(1,970
|
)
|
(7,609
|
)
|
||||||
|
Realized gain (loss) on marketable securities
|
—
|
|
—
|
|
1,068
|
|
(2)
|
|||||
|
Net
|
$
|
7,390
|
|
$
|
(1,701
|
)
|
$
|
(9,793
|
)
|
|||
__________________
|
(1)
|
Excludes costs of
$106
associated with credit default swaps for the year ended December 31, 2017 included in “other income (expense)” in our consolidated statements of operations.
|
|
(2)
|
Included in “other income (expense)” in our consolidated statements of operations.
|
12. Summary of Fair Value of Financial Instruments
Determining the estimated fair values of certain financial instruments such as notes receivable and indebtedness requires considerable judgment to interpret market data. The use of different market assumptions and/or estimation methodologies may have a material effect on the estimated fair value amounts. Accordingly, the estimates presented are not necessarily indicative of the amounts at which these instruments could be purchased, sold or settled.
127
ASHFORD HOSPITALITY PRIME, INC. AND SUBSIDIARIES
NOTES TO CONSOLIDATED FINANCIAL STATEMENTS (continued)
The carrying amounts and estimated fair values of financial instruments were as follows (in thousands):
|
December 31, 2017
|
December 31, 2016
|
|||||||||||||||
|
Carrying
Value
|
Estimated
Fair Value
|
Carrying
Value |
Estimated
Fair Value |
|||||||||||||
|
Financial assets and liabilities measured at fair value:
|
||||||||||||||||
|
Investment in Ashford Inc.
|
$
|
18,124
|
|
$
|
18,124
|
|
$
|
8,407
|
|
$
|
8,407
|
|
||||
|
Derivative assets
|
594
|
|
594
|
|
1,149
|
|
1,149
|
|
||||||||
|
Financial assets not measured at fair value:
|
||||||||||||||||
|
Cash and cash equivalents
|
$
|
137,522
|
|
$
|
137,522
|
|
$
|
126,790
|
|
$
|
126,790
|
|
||||
|
Restricted cash
|
47,820
|
|
47,820
|
|
37,855
|
|
37,855
|
|
||||||||
|
Accounts receivable, net
|
14,334
|
|
14,334
|
|
18,194
|
|
18,194
|
|
||||||||
|
Insurance receivable
|
8,825
|
|
8,825
|
|
—
|
|
—
|
|
||||||||
|
Note receivable
|
8,098
|
|
8,020 to 8,864
|
|
8,098
|
|
8,511 to 9,407
|
|
||||||||
|
Due from Ashford Trust OP, net
|
—
|
|
—
|
|
488
|
|
488
|
|
||||||||
|
Due from AQUA U.S. Fund
|
—
|
|
—
|
|
2,289
|
|
2,289
|
|
||||||||
|
Due from related party, net
|
349
|
|
349
|
|
377
|
|
377
|
|
||||||||
|
Due from third-party hotel managers
|
4,589
|
|
4,589
|
|
7,555
|
|
7,555
|
|
||||||||
|
Financial liabilities not measured at fair value:
|
||||||||||||||||
|
Indebtedness
|
$
|
826,236
|
|
$780,243 to $862,372
|
|
$
|
766,964
|
|
$726,774 to $803,276
|
|
||||||
|
Accounts payable and accrued expenses
|
56,803
|
|
56,803
|
|
44,791
|
|
44,791
|
|
||||||||
|
Dividends and distributions payable
|
8,146
|
|
8,146
|
|
5,038
|
|
5,038
|
|
||||||||
|
Due to Ashford Inc.
|
1,703
|
|
1,703
|
|
5,085
|
|
5,085
|
|
||||||||
|
Due to affiliate
|
—
|
|
—
|
|
2,500
|
|
2,500
|
|
||||||||
|
Due to third-party hotel managers
|
1,709
|
|
1,709
|
|
973
|
|
973
|
|
||||||||
Cash, cash equivalents and restricted cash
. These financial assets have maturities of less than
90 days
and most bear interest at market rates. The carrying value approximates fair value due to their short-term nature. This is considered a Level 1 valuation technique.
Accounts receivable, net, insurance receivable, due from AQUA U.S. Fund, due from related party, net, accounts payable and accrued expenses, dividends and distributions payable, due to/from Ashford Trust OP, net, due to Ashford Inc., due to affiliate and due to/from third-party hotel managers
. The carrying values of these financial instruments approximate their fair values due to the short-term nature of these financial instruments. This is considered a Level 1 valuation technique.
Note receivable
. Fair value of the note receivable was determined by using similar loans with similar collateral. Since there is very little to no trading activity, we relied on our internal analysis of what we believe a willing buyer would pay for this note at
December 31, 2017
and
2016
. We estimated the fair value of the note receivable to be approximately
1.0%
lower to
9.5%
higher than the carrying value of
$8.1 million
at
December 31, 2017
, and approximately
5.1%
to
16.2%
higher than the carrying value of
$8.1 million
at
December 31, 2016
. This is considered a Level 2 valuation technique.
Investment in Ashford Inc.
Fair value of the investment in Ashford Inc. is based on the quoted closing price on the balance sheet date. This is considered a Level 1 valuation technique.
Derivative assets
. Fair value of interest rate derivatives is determined using the net present value of expected cash flows of each derivative based on the market-based interest rate curve and adjusted for credit spreads of us and our counterparties. Fair value of credit default swaps are obtained from a third party who publishes the CMBX index composition and price data. Fair values of interest rate floors are calculated using a third-party discounted cash flow model based on future cash flows that are expected to be received over the remaining life of the floor. The fair value of options on futures contracts is valued at the last reported settlement price as of the measurement date. See notes 2, 10 and 11 for a complete description of the methodology and assumptions utilized in determining fair values.
128
ASHFORD HOSPITALITY PRIME, INC. AND SUBSIDIARIES
NOTES TO CONSOLIDATED FINANCIAL STATEMENTS (continued)
Indebtedness
. Fair value of indebtedness is determined using future cash flows discounted at current replacement rates for these instruments. Cash flows are determined using a forward interest rate yield curve. The current replacement rates are determined by using the U.S. Treasury yield curve or the index to which these financial instruments are tied, and adjusted for the credit spreads. Credit spreads take into consideration general market conditions, maturity and collateral. We estimated the fair value of the total indebtedness to be approximately
94.4%
to
104.4%
of the carrying value of
$826.2 million
at
December 31, 2017
, and approximately
94.8%
to
104.7%
of the carrying value of
$767.0 million
at
December 31, 2016
. This is considered a Level 2 valuation technique.
13. Commitments and Contingencies
Restricted Cash
—Under certain management and debt agreements for our hotel properties existing at
December 31, 2017
, escrow payments are required for insurance, real estate taxes, and debt service. In addition, for certain properties based on the terms of the underlying debt and management agreements, we escrow
4%
to
5%
of gross revenues for capital improvements.
Management Fees
—Under management agreements for our hotel properties existing at
December 31, 2017
, we pay a) monthly property management fees equal to the greater of
$13,000
(increased annually based on consumer price index adjustments) or
3%
of gross revenues, or in some cases
2%
to
7%
of gross revenues, as well as annual incentive management fees, if applicable, b) market service fees on approved capital improvements, including project management fees of up to
4%
of project costs, for certain hotels, and c) other general fees at current market rates as approved by our independent directors, if required. These management agreements expire from December 2019 through December 2065, excluding renewal options. If we terminate a management agreement prior to its expiration, we may be liable for estimated management fees through the remaining term, liquidated damages or, in certain circumstances, we may substitute a new management agreement.
Leases
—We lease land under
three
non-cancelable operating ground leases, which expire in 2067, 2080 and 2055, related to our hotel properties in La Jolla, CA, Tampa, FL and Yountville, CA, respectively. The lease in Yountville, CA contains
two
25
-year extension options. These leases are subject to base rent plus contingent rent based on the related property’s financial results and escalation clauses. For the years ended
December 31, 2017
,
2016
and
2015
, we recognized rent expense of
$5.9 million
,
$5.7 million
and
$4.7 million
, respectively, which included contingent rent of
$2.2 million
,
$2.0 million
and
$1.8 million
, respectively. Rent expense is included in “other” hotel expenses in our consolidated statements of operations. Future minimum rentals due under non-cancelable leases are as follows for each of the years ending December 31, (in thousands):
|
2018
|
$
|
3,449
|
|
|
2019
|
3,423
|
|
|
|
2020
|
3,449
|
|
|
|
2021
|
3,458
|
|
|
|
2022
|
3,469
|
|
|
|
Thereafter
|
158,176
|
|
|
|
Total
|
$
|
175,424
|
|
Capital Commitments
—At
December 31, 2017
, we had capital commitments of
$22.3 million
relating to general capital improvements that are expected to be paid in the next
twelve months
.
Litigation
—
Jesse Small v. Monty J. Bennett, et al., Case No. 24-C-16006020 (Md. Cir. Ct.)
On November 16, 2016, Jesse Small, a purported shareholder of Ashford Prime, commenced a derivative action in Maryland Circuit Court for Baltimore City asserting causes of action for breach of fiduciary duty, corporate waste, and declaratory relief against the members of the Ashford Prime board of directors, David Brooks (collectively, the “Individual Defendants”), Ashford Inc. and Ashford LLC. Ashford Prime is named as a nominal defendant. The complaint alleges that the Individual Defendants breached their fiduciary duties to Ashford Prime by negotiating and approving the termination fee provision set forth in Ashford Prime’s advisory agreement with Ashford LLC, that Ashford Inc. and Ashford LLC aided and abetted the Individual Defendants’ fiduciary duty breaches, and that the Ashford Prime board of directors committed corporate waste in connection with Ashford Prime’s purchase of
175,000
shares of Ashford Inc. common stock. The complaint seeks monetary damages and declaratory and injunctive relief, including a declaration that the termination fee provision is unenforceable. The defendants filed motions to dismiss the complaint on March 24, 2017. On June 6, 2017, the plaintiff notified the court that the plaintiff intends to dismiss the action as moot and seek a mootness fee and costs. On July 25, 2017, the action was dismissed with prejudice as to the plaintiff. A hearing on the plaintiff’s fee petition was held on October 25, 2017. On February 5, 2018, the court denied the plaintiff’s fee petition.
129
ASHFORD HOSPITALITY PRIME, INC. AND SUBSIDIARIES
NOTES TO CONSOLIDATED FINANCIAL STATEMENTS (continued)
We are engaged in other various legal proceedings which have arisen but have not been fully adjudicated. The likelihood of loss from these legal proceedings, based on definitions within contingency accounting literature, ranges from remote to reasonably possible and to probable. Based on estimates of the range of potential losses associated with these matters, management does not believe the ultimate resolution of these proceedings, either individually or in the aggregate, will have a material adverse effect on our consolidated financial position or results of operations. However, the final results of legal proceedings cannot be predicted with certainty and if we fail to prevail in one or more of these legal matters, and the associated realized losses exceed our current estimates of the range of potential losses, our consolidated financial position or results of operations could be materially adversely affected in future periods.
Income Taxes
—We and our subsidiaries file income tax returns in the federal jurisdiction and various states and cities. Tax years 2013 through 2017 remain subject to potential examination by certain federal and state taxing authorities.
14. Redeemable Noncontrolling Interests in Operating Partnership
Redeemable noncontrolling interests in the operating partnership represents the limited partners’ proportionate share of equity and their allocable share of equity in earnings/losses of Ashford Prime OP, which is an allocation of net income/loss attributable to the common unitholders based on the weighted average ownership percentage of these limited partners’ common units of limited partnership interest in the operating partnership (“common units”) and units issued under our Long-Term Incentive Plan (the “LTIP units”) that are vested. Beginning one year after issuance, each common unit may be redeemed, by the holder, for either cash or, at our sole discretion, up to one share of our REIT common stock, which is either (i) issued pursuant to an effective registration statement; (ii) included in an effective registration statement providing for the resale of such common stock; or (iii) issued subject to a registration rights agreement.
LTIP units, which are issued to certain executives and employees of Ashford LLC as compensation, have vesting periods of
three years
. Additionally, certain independent members of the board of directors have elected to receive LTIP units as part of their compensation, which are fully vested upon grant. Upon reaching economic parity with common units, each vested LTIP unit can be converted by the holder into one common unit which can then be redeemed for cash or, at our election, settled in our common stock. An LTIP unit will achieve parity with the common units upon the sale or deemed sale of all or substantially all of the assets of our operating partnership at a time when our stock is trading at a level in excess of the price it was trading on the date of the LTIP issuance. More specifically, LTIP units will achieve full economic parity with common units in connection with (i) the actual sale of all or substantially all of the assets of our operating partnership or (ii) the hypothetical sale of such assets, which results from a capital account revaluation, as defined in the partnership agreement, for our operating partnership.
The compensation committee of the board of directors of the Company approves performance-based LTIP units to certain executive officers from time to time. The award agreements provide for the grant of a target number of performance-based LTIP units that will be settled in common units of Ashford Prime OP, if and when the applicable vesting criteria have been achieved following the end of the performance and service period. The target number of performance-based LTIP units may be adjusted from
0%
to
200%
of the target number based on achievement of a specified relative total stockholder return based on the formula determined by the Company’s Compensation Committee on the grant date. As of
December 31, 2017
, there are approximately
593,000
performance-based LTIP units, representing
200%
of the target, outstanding. The performance criteria for the performance-based LTIP units are based on market conditions under the relevant literature, and the performance-based LTIP units were granted to non-employees. During the year ended
December 31, 2017
, approximately
389,000
performance-based LTIP units were forfeited due to the market condition criteria not being met.
The unamortized fair value of performance-based LTIP units of
$799,000
at
December 31, 2017
will be expensed over a period of
2.0 years
, subject to future mark to market adjustments. We recorded a credit to compensation expense of
$1.6 million
for the year ended
December 31, 2017
due to lower fair values as compared to prior periods. For the year ended December 31, 2016, compensation expense was
$975,000
.
No
compensation expense was recorded for the year ended December 31, 2015. The related amounts are included in “advisory services fee” on our consolidated statements of operations.
As of
December 31, 2017
, we have issued a total of
1.1 million
LTIP units (including performance-based LTIP units), net of forfeitures, all of which, other than approximately
3,000
units issued in March 2015,
6,000
units issued in May 2015,
312,000
issued in October 2016,
141,000
LTIP units issued in April 2017,
281,000
performance-based LTIP units issued in April 2017 and
6,000
LTIP units issued in June 2017, respectively, had reached full economic parity with, and are convertible into, common units. For the years ended
December 31, 2017
,
2016
and
2015
, compensation expense of
$405,000
,
$1.4 million
and
$1.3 million
was recorded related to LTIP units issued to Ashford LLC’s employees, respectively, and is included in “advisory services fee.” Compensation expense of
$64,000
,
$44,000
and
$101,000
associated with LTIP units issued to our independent directors was recorded for the years ended
December 31, 2017
,
2016
and
2015
, respectively, and is included in “corporate general and
130
ASHFORD HOSPITALITY PRIME, INC. AND SUBSIDIARIES
NOTES TO CONSOLIDATED FINANCIAL STATEMENTS (continued)
administrative” expense in our consolidated statements of operations. The fair value of the unrecognized cost of LTIP units of
$1.1 million
at December 31,
2017
, will be amortized over a period of
2.3 years
, subject to future mark to market adjustments.
During the
year ended
December 31, 2017
, approximately
194,000
common units with an aggregate redemption fair value of
$1.8 million
were redeemed by the holders and, at our election, we issued shares of our common stock to satisfy the redemption price. During the
year ended
December 31, 2016
, approximately
137,000
common units with an aggregate fair value of
$1.9 million
at redemption were redeemed by the holders and, at our election, we issued shares of our common stock to satisfy the redemption price. During the year ended December 31, 2015, approximately
345,000
common units with an aggregate fair value of
$5.9 million
at redemption were redeemed by the holders and, at our election, we issued cash to satisfy the redemption price. Excluding the Ashford Trust redemption of our OP common units, during the
year ended
December 31, 2015
, approximately
100,000
common units with an aggregate fair value of
$1.6 million
at redemption were redeemed by the holders and, at our election, we issued shares of our common stock to satisfy the redemption price.
Redeemable noncontrolling interests in Ashford Prime OP as of December 31,
2017
and
2016
, were
$46.6 million
and
$59.5 million
, respectively, which represented ownership of our operating partnerships of
11.43%
and
13.90%
, respectively. The carrying value of redeemable noncontrolling interests as of December 31,
2017
and
2016
, included adjustments of
$0 million
and
$8.9 million
, respectively, to reflect the excess of redemption value over the accumulated historical cost. For the years ended December 31,
2017
,
2016
and
2015
, we allocated net income of
$2.0 million
, net income of
$1.9 million
, and net loss of
$393,000
to the redeemable noncontrolling interests, respectively. We declared aggregate cash distributions to holders of common units and holders of LTIP units of
$2.8 million
,
$2.3 million
and
$2.2 million
for the years ended December 31,
2017
,
2016
and
2015
, respectively. These distributions are recorded as a reduction of redeemable noncontrolling interests in operating partnership.
A summary of the activity of the units in our operating partnership is as follows (in thousands):
|
Year Ended December 31,
|
||||||||
|
2017
|
2016
|
2015
|
||||||
|
Units outstanding at beginning of year
|
4,943
|
|
4,375
|
|
8,955
|
|
||
|
LTIP units issued
|
149
|
|
4
|
|
10
|
|
||
|
Performance-based LTIP units issued
|
281
|
|
701
|
|
—
|
|
||
|
Units redeemed for shares of common stock
|
(194
|
)
|
(137
|
)
|
(4,245
|
)
|
||
|
Units redeemed for cash of $5,856 in 2015
|
—
|
|
—
|
|
(345
|
)
|
||
|
Performance-based LTIP units forfeited
|
(389
|
)
|
—
|
|
—
|
|
||
|
Units outstanding at end of year
|
4,790
|
|
4,943
|
|
4,375
|
|
||
|
Units convertible/redeemable at end of year
|
4,028
|
|
4,083
|
|
3,967
|
|
||
Ashford Trust Distribution of Ashford Prime Common Stock and Ashford Prime OP Common Units
—On July 13, 2015, Ashford Trust announced that its board of directors had declared the distribution (1) to its stockholders of approximately
4.1 million
shares of common stock of Ashford Prime to be received by Ashford Trust upon redemption of Ashford Prime OP common units and (2) to the common unit holders of Ashford Hospitality Trust Limited Partnership of its remaining common units of Ashford Prime OP. The distribution occurred on July 27, 2015, to stockholders and common unit holders of record as of the close of business of the New York Stock Exchange on July 20, 2015. The distribution had an aggregate fair value of approximately
$61.7 million
at redemption. As a result of the distribution, Ashford Trust has
no
ownership interest in Ashford Prime.
15. Equity
Equity Offering
—On March 1, 2017, we commenced an underwritten public offering of approximately
5.8 million
shares of common stock at
$12.15
per share for gross proceeds of
$69.9 million
. The offering closed on March 7, 2017. The net proceeds from the sale of the shares after underwriting discounts and offering expense were approximately
$66.4 million
.
On June 9, 2015, we commenced a private placement of
200,000
shares of common stock at
$15.52
per share for gross proceeds of
3.1 million
. The offering closed on June 11, 2015. The net proceeds from the sale of the shares after discounts and offering expenses were approximately
$3.1 million
.
Dividends
—Common stock dividends declared for the years ended December 31,
2017
,
2016
and
2015
were
$20.6 million
,
$12.3 million
and
$9.4 million
, respectively.
131
ASHFORD HOSPITALITY PRIME, INC. AND SUBSIDIARIES
NOTES TO CONSOLIDATED FINANCIAL STATEMENTS (continued)
Stock Repurchases
—On October 27, 2014, our board of directors approved a share repurchase program under which the Company may purchase up to
$100 million
of the Company’s common stock from time to time. The repurchase program does not have an expiration date. The specific timing, manner, price, amount and other terms of the repurchases is at management’s discretion and depends on market conditions, corporate and regulatory requirements and other factors. The Company is not required to repurchase shares under the repurchase program, and may modify, suspend or terminate the repurchase program at any time for any reason. On April 8, 2016, our board of directors authorized utilizing up to
$50 million
to repurchase common stock.
On December 5, 2017, our board of directors reapproved the stock repurchase program pursuant to which the Board granted a repurchase authorization to acquire shares of the Company’s common stock, par value
$0.01
per share having an aggregate value of up to
$50 million
. The Board’s authorization replaced any previous repurchase authorizations.
No
shares were repurchased during the year ended
December 31, 2017
. During the years ended
December 31, 2016
and 2015, we repurchased
2.9 million
shares of our common stock for approximately
$39.0 million
and
471,000
shares of our common stock for approximately
$8.1 million
, respectively. As of
December 31, 2017
, we have purchased a cumulative
4.3 million
shares of our common stock, for approximately
$63.2 million
, since the program’s inception on November 4, 2014.
On December 11, 2017, the Company established an “at-the-market” equity distribution program pursuant to which it may, from time to time, sell shares of its Common Stock having an aggregate offering price of up to
$50 million
.
Noncontrolling Interest in Consolidated Entities
—A partner had noncontrolling ownership interests of
25%
in
two
hotel properties with a total carrying value of
$(4.8) million
and
$(5.4) million
at December 31,
2017
and
2016
, respectively. Income from consolidated entities attributable to these noncontrolling interests was
$3.3 million
,
$3.1 million
and
$2.4 million
for the years ended December 31,
2017
,
2016
and
2015
, respectively.
16. Stock-Based Compensation
Under the 2013 Equity Incentive Plan, as amended, we are authorized to grant
3.3 million
restricted stock units or performance stock units of our common stock as incentive stock awards. At December 31,
2017
,
820,882
shares were available for future issuance under the 2013 Equity Incentive Plan.
Restricted Stock Units
—Stock-based compensation expense of
$916,000
,
$597,000
and
$343,000
was recognized for the years ended December 31,
2017
,
2016
and
2015
, respectively, in connection with restricted stock units awarded to employees of Ashford LLC and is included in “advisory services fee” on our consolidated statements of operations. Expense of
$92,000
,
$71,000
and
$0
was recognized for the years ended December 31,
2017
,
2016
and
2015
, respectively, in connection with restricted shares granted to certain employees of Remington Lodging, and is recorded as a component of “management fees” on our consolidated statements of operations. Additionally,
$201,000
, $
227,000
and $
153,000
of stock-based compensation expense was recognized for the years ended December 31,
2017
,
2016
and
2015
, respectively, in connection with common stock issued to our independent directors, which vested immediately, and is included in “corporate general and administrative” expense on our consolidated statements of operations. At December 31,
2017
, the outstanding restricted shares had a fair value of
$4.1 million
. At December 31,
2017
, the unamortized cost of the unvested shares of restricted stock was
$3.3 million
, which is expected to be recognized over a period of
3.8 years
, subject to future mark to market adjustments, and have vesting dates between
February 2018
and
November 2021
.
132
ASHFORD HOSPITALITY PRIME, INC. AND SUBSIDIARIES
NOTES TO CONSOLIDATED FINANCIAL STATEMENTS (continued)
A summary of our restricted stock activity is as follows (shares in thousands):
|
Year Ended December 31,
|
||||||||||||||||||||
|
2017
|
2016
|
2015
|
||||||||||||||||||
|
Restricted Shares
|
Weighted Average
Price at Grant
|
Restricted Shares
|
Weighted Average
Price at Grant
|
Restricted Shares
|
Weighted Average
Price at Grant
|
|||||||||||||||
|
Outstanding at beginning of year
|
360
|
|
$
|
12.90
|
|
140
|
|
$
|
16.01
|
|
94
|
|
$
|
18.11
|
|
|||||
|
Restricted shares granted
|
198
|
|
10.78
|
|
309
|
|
12.34
|
|
45
|
|
16.50
|
|
||||||||
|
Restricted shares issued in connection with Ashford Trust’s distribution
|
—
|
|
—
|
|
—
|
|
—
|
|
60
|
|
14.90
|
|
||||||||
|
Restricted shares vested
|
(131
|
)
|
13.05
|
|
(84
|
)
|
15.98
|
|
(57
|
)
|
18.66
|
|
||||||||
|
Restricted shares forfeited
|
(7
|
)
|
11.81
|
|
(5
|
)
|
13.82
|
|
(2
|
)
|
17.50
|
|
||||||||
|
Outstanding at end of year
|
420
|
|
$
|
11.87
|
|
360
|
|
$
|
12.90
|
|
140
|
|
$
|
16.01
|
|
|||||
Performance Stock Units
— The compensation committee of the board of directors of the Company approve grants of PSUs to certain executive officers from time to time. The award agreements provide for the grant of a target number of PSUs that will be settled in shares of common stock of the Company, if and when the applicable vesting criteria have been achieved following the end of the performance and service period of
three years
from the issuance date. The target number of PSUs may be adjusted from
0%
to
200%
based on achievement of a specified relative total stockholder return based on the formula determined by the Company’s Compensation Committee on the grant date. The performance criteria for the PSUs are based on market conditions under the relevant literature, and the PSUs were granted to non-employees. At
December 31, 2017
, the outstanding PSUs had a fair value of
$1.1 million
. We recorded a credit to compensation expense of
$1.4 million
for the year ended
December 31, 2017
due to the lower fair values of the PSUs. We recorded expense of
$813,000
and
$1.9 million
, respectively, for the years ended December 31, 2016 and 2015. These are included in “advisory services fee” on our consolidated statements of operations. During the year ended
December 31, 2017
,
155,000
PSUs were forfeited due to the market condition criteria not being met. As of
December 31, 2017
, the unamortized cost of PSUs was
$755,000
, and is expected to be recognized over a period of
2.0
years, subject to future mark to market adjustments.
A summary of our PSU activity is as follows (shares in thousands):
|
Year Ended December 31,
|
||||||||||||||||||||
|
2017
|
2016
|
2015
|
||||||||||||||||||
|
PSUs
|
Weighted Average Price at Grant
|
PSUs
|
Weighted Average Price at Grant
|
PSUs
|
Weighted Average Price at Grant
|
|||||||||||||||
|
Outstanding at beginning of year
|
417
|
|
$
|
14.80
|
|
155
|
|
$
|
18.40
|
|
—
|
|
$
|
—
|
|
|||||
|
PSUs granted
|
119
|
|
10.42
|
|
262
|
|
12.67
|
|
155
|
|
18.40
|
|
||||||||
|
PSUs vested
|
—
|
|
—
|
|
—
|
|
—
|
|
—
|
|
—
|
|
||||||||
|
PSUs forfeited
|
(155
|
)
|
18.40
|
|
—
|
|
—
|
|
—
|
|
—
|
|
||||||||
|
Outstanding at end of year
|
381
|
|
$
|
11.97
|
|
417
|
|
$
|
14.80
|
|
155
|
|
$
|
18.40
|
|
|||||
17. 5.50% Series B Cumulative Convertible Preferred Stock
Each share of Series B Preferred Stock is convertible at any time, at the option of the holder, into a number of whole shares of common stock at an initial conversion price of
$18.90
(which represents an initial conversion rate of
1.3228
shares of our common stock, subject to certain adjustments). The Series B Preferred Stock is also subject to conversion upon certain events constituting a change of control. Holders of the Series B Preferred Stock have no voting rights, subject to certain exceptions.
The Company may, at its option, cause the Series B Preferred Stock to be converted in whole or in part, on a pro rata basis, into fully paid and nonassessable shares of the Company’s common stock at the conversion price, provided that the “Closing Bid Price” (as defined in the Articles Supplementary) of the Company’s common stock shall have equaled or exceeded
110%
of the
133
ASHFORD HOSPITALITY PRIME, INC. AND SUBSIDIARIES
NOTES TO CONSOLIDATED FINANCIAL STATEMENTS (continued)
conversion price for the immediately preceding
45
consecutive trading days ending
three days
prior to the date of notice of conversion. In the event of such mandatory conversion, the Company shall pay holders of the Series B Preferred Stock any additional dividend payment to make the holder whole on dividends expected to be received through June 11, 2019, in an amount equal to the net present value, where the discount rate is the dividend rate on the Series B Preferred Stock, of the difference between (i) the annual dividend payments the holders of Series B Preferred Stock would have received in cash from the date of the mandatory conversion to June 11, 2019, and (ii) the common stock quarterly dividend payments the holders of Series B Preferred Stock would have received over the same time period had such holders held common stock.
On April 26, 2016, in connection with a previously announced required public offering, we issued
290,850
shares of our Series B Preferred Stock at
$17.24
per share for gross proceeds of
$5.0 million
. The Series B Preferred Stock offering includes accrued and unpaid dividends since April 15, 2016. The offering closed on April 29, 2016. The net proceeds, after deducting underwriting discounts, advisory fees, commissions and other estimated offering expenses payable by the company, were approximately
$4.2 million
. Dividends on the Series B Preferred Stock accrue at a rate of
5.50%
on the liquidation preference of
$25.00
per share.
On March 7, 2017, we closed an offering of approximately
2.0 million
shares of our Series B Preferred Stock at
$20.19
per share for gross proceeds of
$39.9 million
. The net proceeds to us, after underwriting discounts and offering expenses were approximately
$38.2 million
. Dividends on the Series B Preferred Stock accrue at a rate of
5.50%
on the liquidation preference of
$25.00
per share. On March 31, 2017, the underwriters partially exercised their over-allotment option and purchased an additional
100,000
shares of the Series B Preferred Stock, which closed on April 5, 2017. The net proceeds from the partial exercise of the over-allotment option after underwriting discounts were approximately
$1.9 million
.
At
December 31, 2017
, we had
5.0 million
outstanding shares of Series B Preferred Stock that do not meet the requirements for permanent equity classification prescribed by the authoritative guidance because of certain cash redemption features that are outside our control. As such, the Series B Preferred Stock is classified outside of permanent equity.
The Series B Preferred Stock dividend for all issued and outstanding shares is set at
$1.375
per annum per share. For the years ended
December 31, 2017
,
2016
and
2015
, we declared dividends of
$6.8 million
,
$3.9 million
and
$2.0 million
, respectively, with respect to shares of Series A and Series B Preferred Stock.
18. Income Taxes
For federal income tax purposes, we elected to be taxed as a REIT under the Internal Revenue Code. To qualify as a REIT, we must meet certain organizational and operational stipulations, including a requirement that we distribute at least 90% of our REIT taxable income, excluding net capital gains, to our stockholders. We currently intend to adhere to these requirements and maintain our REIT status. If we fail to qualify as a REIT in any taxable year, we will be subject to federal income taxes at regular corporate rates (including any applicable alternative minimum tax) and may not qualify as a REIT for four subsequent taxable years. Even if we qualify for taxation as a REIT, we may be subject to certain state and local taxes as well as to federal income and excise taxes on our undistributed taxable income.
At
December 31, 2017
,
eleven
of our hotel properties were leased to TRS lessees TRS and the Ritz-Carlton St. Thomas hotel was owned by our USVI TRS. The TRS entities recognized net book income before income taxes of
$27,000
,
$5.5 million
and
$6.0 million
for the years ended December 31,
2017
,
2016
and
2015
, respectively.
134
ASHFORD HOSPITALITY PRIME, INC. AND SUBSIDIARIES
NOTES TO CONSOLIDATED FINANCIAL STATEMENTS (continued)
The following table reconciles the income tax expense at statutory rates to the actual income tax expense recorded (in thousands):
|
Year Ended December 31,
|
|||||||||||
|
2017
|
2016
|
2015
|
|||||||||
|
Income tax (expense) benefit at federal statutory income tax rate of 35%
|
$
|
10
|
|
$
|
(1,928
|
)
|
$
|
(1,727
|
)
|
||
|
State income tax (expense) benefit, net of federal income tax benefit
|
(100
|
)
|
(172
|
)
|
(117
|
)
|
|||||
|
Revaluation of deferred tax assets and liabilities related to the 2017 Tax Act
(1)
|
(10,974
|
)
|
—
|
|
—
|
|
|||||
|
State and local income tax (expense) benefit on pass-through entity subsidiaries
|
(87
|
)
|
(62
|
)
|
(86
|
)
|
|||||
|
Gross receipts and margin taxes
|
(143
|
)
|
(98
|
)
|
(170
|
)
|
|||||
|
Benefit of USVI Economic Development Commission credit
|
181
|
|
619
|
|
—
|
|
|||||
|
Other
|
89
|
|
58
|
|
(40
|
)
|
|||||
|
Valuation allowance
|
11,546
|
|
9
|
|
1,877
|
|
|||||
|
Total income tax (expense) benefit
|
$
|
522
|
|
$
|
(1,574
|
)
|
$
|
(263
|
)
|
||
________
(1)
Partially offset within change in valuation allowance.
The components of income tax expense are as follows (in thousands):
|
Year Ended December 31,
|
|||||||||||
|
2017
|
2016
|
2015
|
|||||||||
|
Current:
|
|||||||||||
|
Federal
|
$
|
1,354
|
|
$
|
(231
|
)
|
$
|
(1,067
|
)
|
||
|
State
|
(217
|
)
|
(269
|
)
|
(252
|
)
|
|||||
|
Foreign
|
—
|
|
15
|
|
(37
|
)
|
|||||
|
Total current
|
1,137
|
|
(485
|
)
|
(1,356
|
)
|
|||||
|
Deferred:
|
|||||||||||
|
Federal
|
(461
|
)
|
(1,049
|
)
|
953
|
|
|||||
|
State
|
(154
|
)
|
(40
|
)
|
140
|
|
|||||
|
Foreign
|
—
|
|
—
|
|
—
|
|
|||||
|
Total deferred
|
(615
|
)
|
(1,089
|
)
|
1,093
|
|
|||||
|
Total income tax (expense) benefit
|
$
|
522
|
|
$
|
(1,574
|
)
|
$
|
(263
|
)
|
||
For the years ended December 31,
2017
,
2016
and
2015
, income tax expense included interest and penalties paid to taxing authorities of
$7
,
$0
and
$0
, respectively. At December 31,
2017
and
2016
, we determined that there were
no
amounts to accrue for interest and penalties due to taxing authorities.
135
ASHFORD HOSPITALITY PRIME, INC. AND SUBSIDIARIES
NOTES TO CONSOLIDATED FINANCIAL STATEMENTS (continued)
At December 31,
2017
and
2016
, our net deferred tax asset, included in “other assets,” and net deferred tax liability, included in “accounts payable and accrued expenses,” respectively, on our consolidated balance sheets, consisted of the following (in thousands):
|
December 31,
|
|||||||
|
2017
|
2016
|
||||||
|
Deferred tax assets:
|
|||||||
|
Tax intangibles basis greater than book basis
|
$
|
957
|
|
$
|
1,227
|
|
|
|
Allowance for doubtful accounts
|
20
|
|
30
|
|
|||
|
Unearned income
|
54
|
|
92
|
|
|||
|
Unfavorable management contract liability
|
—
|
|
28
|
|
|||
|
Federal and state net operating losses
|
13,911
|
|
22,866
|
|
|||
|
Other
|
28
|
|
80
|
|
|||
|
Accrued expenses
|
336
|
|
349
|
|
|||
|
Tax property basis greater than book basis
|
1,381
|
|
4,117
|
|
|||
|
Prepaid expenses
|
(2,379
|
)
|
(2,320
|
)
|
|||
|
Net deferred tax asset
|
14,308
|
|
26,469
|
|
|||
|
Valuation allowance
|
(15,422
|
)
|
(26,968
|
)
|
|||
|
Net deferred tax asset (liability)
|
$
|
(1,114
|
)
|
$
|
(499
|
)
|
|
At December 31,
2017
and
2016
, we recorded a valuation allowance of
$15.4 million
and
$27.0 million
, respectively, to partially reserve the deferred tax assets of our TRSs. Ashford Prime’s wholly-owned domestic TRS generated taxable income in the years ending December 31,
2017
and
2016
, and there continues to be carryback potential of certain deferred tax assets as of December 31, 2017. Primarily as a result of the limitation imposed by the Internal Revenue Code on the utilization of net operating losses of acquired subsidiaries and the history of losses of our USVI TRS, we believe it is more likely than not that
$15.4 million
of our deferred tax assets will not be realized, and therefore, have provided a valuation allowance to reserve against the balances.
At December 31,
2017
, the TRSs had net operating loss carryforwards for federal income tax purposes of
$57.2 million
that are available to offset future taxable income, if any.
$54.5 million
of net operating loss carryforwards is attributable to acquired subsidiaries and is subject to substantial limitation on its use. We do not recognize deferred tax assets and a valuation allowance for the REIT since the REIT distributes its taxable income as dividends to stockholders, and in turn, the stockholders incur income taxes on those dividends.
The following table summarizes the changes in the valuation allowance (in thousands):
|
Year Ended December 31,
|
|||||||||||
|
2017
|
2016
|
2015
|
|||||||||
|
Balance at beginning of year
|
$
|
26,968
|
|
$
|
27,022
|
|
$
|
3,939
|
|
||
|
Additions
|
104
|
|
31
|
|
25,043
|
|
|||||
|
Deductions
|
(11,650
|
)
|
(85
|
)
|
(1,960
|
)
|
|||||
|
Balance at end of year
|
$
|
15,422
|
|
$
|
26,968
|
|
$
|
27,022
|
|
||
The USVI TRS operates under a tax holiday in the U.S. Virgin Islands, which is effective through December 31, 2018, and may be extended if certain additional requirements are satisfied. The tax holiday is conditional upon our meeting certain employment and investment thresholds. The impact of this tax holiday decreased current foreign taxes by
$20,000
,
$126,000
and
$332,000
for the years ended
December 31, 2017
,
2016
and
2015
, respectively. The benefit of the tax holiday on net income (loss) per share was approximately,
$0.00
,
$0.01
and
$0.01
for the years ended December 31,
2017
,
2016
and
2015
, respectively.
On December 22, 2017, President Trump signed the Tax Cuts and Jobs Act (“Tax Reform”) into legislation. Under ASC 740, the effects of changes in tax rates and laws are recognized in the period in which the new legislation is enacted. In the case of U.S. federal income taxes, the enactment date is the date the bill becomes law (i.e., upon presidential signature). With respect to this legislation, we expect a one-time tax benefit of approximately
$216,000
, due to a revaluation of our net deferred tax liabilities resulting from the decrease in the corporate federal income tax rate from 35% to 21%. We are in the process of analyzing certain
136
ASHFORD HOSPITALITY PRIME, INC. AND SUBSIDIARIES
NOTES TO CONSOLIDATED FINANCIAL STATEMENTS (continued)
other provisions of this legislation which may impact our effective tax rate. Additionally, on December 22, 2017, the SEC staff issued Staff Accounting Bulletin No. 118 (“SAB 118”) to address the application of U.S. GAAP in situations when a registrant does not have the necessary information available, prepared, or analyzed (including computations) in reasonable detail to complete the accounting for certain income tax effects of the Tax Reform Act. The Company has recognized the provisional tax impacts related to the revaluation of deferred tax assets and liabilities and included these amounts in its consolidated financial statements for the year ended December 31, 2017. The ultimate impact may differ from these provisional amounts, due to, among other things, additional analysis, changes in interpretations and assumptions the Company has made, additional regulatory guidance that may be issued, and actions the Company may take as a result of the Tax Reform Act. The accounting is expected to be complete on or before the date the 2017 U.S. income tax returns are filed in 2018.
19. Income (Loss) Per Share
The following table reconciles the amounts used in calculating basic and diluted income (loss) per share (in thousands, except per share amounts):
|
Year Ended December 31,
|
|||||||||||
|
2017
|
2016
|
2015
|
|||||||||
|
Net income (loss) attributable to common stockholders—Basic and diluted:
|
|||||||||||
|
Net income (loss) attributable to the Company
|
$
|
23,022
|
|
$
|
19,316
|
|
$
|
(6,712
|
)
|
||
|
Less: Dividends on preferred stocks
|
(6,795
|
)
|
(3,860
|
)
|
(1,986
|
)
|
|||||
|
Less: Dividends on common stock
|
(20,179
|
)
|
(12,170
|
)
|
(9,282
|
)
|
|||||
|
Less: Dividends on unvested performance stock units
|
(138
|
)
|
(122
|
)
|
(105
|
)
|
|||||
|
Less: Dividends on unvested restricted shares
|
(267
|
)
|
(77
|
)
|
(41
|
)
|
|||||
|
Less: Net (income) loss allocated to unvested performance stock units
|
—
|
|
(27
|
)
|
—
|
|
|||||
|
Less: Net (income) loss allocated to unvested restricted shares
|
—
|
|
(38
|
)
|
—
|
|
|||||
|
Undistributed net income (loss) allocated to common stockholders
|
(4,357
|
)
|
3,022
|
|
(18,126
|
)
|
|||||
|
Add back: Dividends on common stock
|
20,179
|
|
12,170
|
|
9,282
|
|
|||||
|
Distributed and undistributed net income (loss)—basic
|
$
|
15,822
|
|
$
|
15,192
|
|
$
|
(8,844
|
)
|
||
|
Net income (loss) attributable to redeemable noncontrolling interests in operating partnership
|
2,038
|
|
1,899
|
|
—
|
|
|||||
|
Distributed and undistributed net income (loss)—diluted
|
$
|
17,860
|
|
$
|
17,091
|
|
$
|
(8,844
|
)
|
||
|
Weighted average common shares outstanding:
|
|||||||||||
|
Weighted average common shares outstanding
—
basic
|
30,473
|
|
26,648
|
|
25,888
|
|
|||||
|
Effect of assumed conversion of operating partnership units
|
4,233
|
|
4,470
|
|
—
|
|
|||||
|
Incentive fee shares
|
—
|
|
77
|
|
—
|
|
|||||
|
Weighted average common shares outstanding
—
diluted
|
34,706
|
|
31,195
|
|
25,888
|
|
|||||
|
Income (loss) per share—basic:
|
|||||||||||
|
Net income (loss) allocated to common stockholders per share
|
$
|
0.52
|
|
$
|
0.57
|
|
$
|
(0.34
|
)
|
||
|
Income (loss) per share—diluted:
|
|||||||||||
|
Net income (loss) allocated to common stockholders per share
|
$
|
0.51
|
|
$
|
0.55
|
|
$
|
(0.34
|
)
|
||
137
ASHFORD HOSPITALITY PRIME, INC. AND SUBSIDIARIES
NOTES TO CONSOLIDATED FINANCIAL STATEMENTS (continued)
Due to their anti-dilutive effect, the computation of diluted income (loss) per share does not reflect the adjustments for the following items (in thousands):
|
Year Ended December 31,
|
|||||||||||
|
2017
|
2016
|
2015
|
|||||||||
|
Net income (loss) allocated to common stockholders is not adjusted for:
|
|||||||||||
|
Income (loss) allocated to unvested restricted shares
|
$
|
267
|
|
$
|
115
|
|
$
|
41
|
|
||
|
Income (loss) allocated to unvested performance stock units
|
138
|
|
149
|
|
105
|
|
|||||
|
Income (loss) attributable to redeemable noncontrolling interests in operating partnership
|
—
|
|
—
|
|
(393
|
)
|
|||||
|
Dividends on preferred stock
|
6,795
|
|
3,860
|
|
1,986
|
|
|||||
|
Total
|
$
|
7,200
|
|
$
|
4,124
|
|
$
|
1,739
|
|
||
|
Weighted average diluted shares are not adjusted for:
|
|||||||||||
|
Effect of unvested restricted shares
|
77
|
|
87
|
|
51
|
|
|||||
|
Effect of unvested performance stock units
|
—
|
|
55
|
|
52
|
|
|||||
|
Effect of assumed conversion of operating partnership units
|
—
|
|
—
|
|
6,642
|
|
|||||
|
Effect of assumed conversion of preferred stock
|
6,064
|
|
3,662
|
|
1,909
|
|
|||||
|
Total
|
6,141
|
|
3,804
|
|
8,654
|
|
|||||
20. Segment Reporting
We operate in
one
business segment within the hotel lodging industry: direct hotel investments. Direct hotel investments refer to owning hotel properties through either acquisition or new development. We report operating results of direct hotel investments on an aggregate basis as substantially all of our hotel investments have similar economic characteristics and exhibit similar long-term financial performance. As of December 31,
2017
and
2016
, all of our hotel properties were in the U.S. and its territories.
21. Related Party Transactions
We have management agreements with Remington Lodging, a related party, which is owned by our Chairman of our board of directors and Ashford Trust’s Chairman Emeritus. Under the agreements, we pay the related party a) monthly property management fees equal to the greater of
$13,000
(increased annually based on consumer price index adjustments) or
3%
of gross revenues as well as annual incentive management fees, if certain operational criteria are met, b) project management fees of up to
4%
of project costs, c) market service fees including purchasing, design and construction management not to exceed
16.5%
of project budget cumulatively, including project management fees, and d) other general and administrative expense reimbursements, approved by our independent directors, including accounting services. This related party allocates such charges to us based on various methodologies, including headcount and actual amounts incurred.
At
December 31, 2017
, Remington Lodging managed
three
of our
twelve
hotel properties and we incurred the following fees related to the management agreements with the related party (in thousands):
|
Year Ended December 31,
|
|||||||||||
|
2017
|
2016
|
2015
|
|||||||||
|
Property management fees, including incentive property management fees
|
$
|
1,748
|
|
$
|
1,503
|
|
$
|
1,313
|
|
||
|
Market service and project management fees
|
3,972
|
|
2,453
|
|
1,645
|
|
|||||
|
Corporate general and administrative expenses
|
286
|
|
136
|
|
98
|
|
|||||
|
Total
|
$
|
6,006
|
|
$
|
4,092
|
|
$
|
3,056
|
|
||
Management agreements with Remington Lodging include exclusivity clauses that require us to engage Remington Lodging, unless our independent directors either (i) unanimously vote to hire a different manager or developer or (ii) by a majority vote elect not to engage Remington because either special circumstances exist such that it would be in our best interest not to engage Remington, or, based on Remington’s prior performance, it is believed that another manager or developer could perform the management, development or other duties materially better.
138
ASHFORD HOSPITALITY PRIME, INC. AND SUBSIDIARIES
NOTES TO CONSOLIDATED FINANCIAL STATEMENTS (continued)
Ashford LLC, a subsidiary of Ashford Inc., acts as our advisor, and as a result, we pay advisory fees to Ashford LLC. We are required to pay Ashford LLC a monthly base fee that is 1/12th of
0.70%
of our total market capitalization plus the Key Money Asset Management Fee (defined in our advisory agreement as the aggregate gross asset value of all key money assets multiplied by 1/12th of
0.70%
), subject to a minimum monthly base fee, as payment for managing our day-to-day operations in accordance with our investment guidelines. Total market capitalization includes the aggregate principal amount of our consolidated indebtedness (including our proportionate share of debt of any entity that is not consolidated but excluding our joint venture partners’ proportionate share of consolidated debt). We are also required to pay Ashford LLC an incentive fee that is measured annually. Each year that our annual total stockholder return exceeds the average annual total stockholder return for our peer group we will pay Ashford LLC an incentive fee over the following
three years
, subject to the Fixed Charge Coverage Ratio (“FCCR”) Condition, as defined in the advisory agreement. We also reimburse Ashford LLC for certain reimbursable overhead and internal audit, insurance claims advisory and asset management services, as specified in the advisory agreement. We also record equity-based compensation expense for equity grants of common stock and LTIP units awarded to our officers and employees of Ashford LLC in connection with providing advisory services equal to the fair value of the award in proportion to the requisite service period satisfied during the period.
On January 24, 2017, we entered into an amended and restated advisory agreement with Ashford Inc. (the “Fourth Amended and Restated Advisory Agreement”) that amends and restates our advisory agreement discussed herein. On June 9, 2017, our stockholders approved the Fourth Amended and Restated Advisory Agreement which became effective on June 21, 2017. The material terms of the Fourth Amended and Restated Advisory Agreement include:
|
•
|
we made a cash payment to Ashford LLC of
$5.0 million
on June 21, 2017, which is included in “contract modification cost” on our consolidated statements of operations for year ended
December 31, 2017
, at which time the Fourth Amended and Restated Advisory Agreement became effective;
|
|
•
|
the termination fee payable to Ashford LLC has been amended by eliminating the
1.1x
multiplier and tax gross up components of the fee;
|
|
•
|
Ashford Inc. will disclose publicly the revenues and expenses used to calculate “Net Earnings” on a quarterly basis which is used to calculate the termination fee; Ashford LLC will retain an accounting firm to provide a quarterly report to us on the reasonableness of Ashford LLC’s determination of expenses, which will be binding on the parties;
|
|
•
|
the right of Ashford LLC to appoint a “Designated CEO” has been eliminated;
|
|
•
|
the right of Ashford LLC to terminate the advisory agreement due to a change in a majority of the “Company Incumbent Board” (as defined in the current advisory agreement) has been eliminated;
|
|
•
|
we will be incentivized to grow our assets under a “growth covenant” in the Fourth Amended and Restated Advisory Agreement under which we will receive a deemed credit against a base amount of
$45.0 million
for:
3.75%
of the total purchase price of each hotel acquired after the date of the Fourth Amended and Restated Advisory Agreement that was recommended by Ashford LLC, netted against
3.75%
of the total sale price of each hotel sold after the date of the Fourth Amended and Restated Advisory Agreement. The difference between
$45.0 million
and such net credit, if any, is referred to as the “Uninvested Amount.” If the Fourth Amended and Restated Advisory Agreement is terminated, other than due to certain acts by Ashford LLC, we must pay Ashford LLC the Uninvested Amount, in addition to any termination fee payable under the Fourth Amended and Restated Advisory Agreement;
|
|
•
|
the Fourth Amended and Restated Advisory Agreement requires us to maintain a net worth of not less than
$390 million
plus
75%
of the equity proceeds from the sale of securities by us after December 31, 2016 and a covenant prohibiting us from paying dividends except as required to maintain our REIT status if paying the dividend would reduce our net worth below the required minimum net worth;
|
|
•
|
the initial term of the Fourth Amended and Restated Advisory Agreement ends on the 10th anniversary of its effective date, subject to renewal by Ashford LLC for up to
seven
additional successive
10
-year terms;
|
|
•
|
the base management fee payable to Ashford LLC will be fixed at
0.70%
, and the fee will be payable on a monthly basis;
|
|
•
|
reimbursements of expenses to Ashford LLC will be made monthly in advance, based on an annual expense budget, with a quarterly true-up for actual expenses;
|
|
•
|
our right to terminate the advisory agreement due to a change of control of Ashford LLC has been eliminated;
|
|
•
|
our rights to terminate the advisory agreement at the end of each term upon payment of the termination fee based on the parties being unable to agree on new market-based fees or advisor’s performance have been eliminated; however, the Fourth Amended and Restated Advisory Agreement provides a mechanism for the parties to renegotiate the fees payable to Ashford LLC at the end of each term based on then prevailing market conditions, subject to floors and caps on the changes;
|
139
ASHFORD HOSPITALITY PRIME, INC. AND SUBSIDIARIES
NOTES TO CONSOLIDATED FINANCIAL STATEMENTS (continued)
|
•
|
if a Change of Control (as defined in the Fourth Amended and Restated Advisory Agreement) is pending, we have agreed to deposit not less than
50%
, and in certain cases
100%
, of the applicable termination fee in escrow, with the payment of any remaining amounts owed to Ashford LLC secured by a letter of credit and/or first priority lien on certain assets;
|
|
•
|
our ability to terminate the Fourth Amended and Restated Advisory Agreement due to a material default by Ashford LLC is limited to instances where a court finally determines that the default had a material adverse effect on us and Ashford LLC fails to pay monetary damages in accordance with the Fourth Amended and Restated Advisory Agreement; and
|
|
•
|
if we repudiate the Fourth Amended and Restated Advisory Agreement through actions or omissions that constitute a repudiation as determined by a final non-appealable order from a court of competent jurisdiction, we will be liable to Ashford LLC for a liquidated damages amount.
|
The following table summarizes the advisory services fees incurred (in thousands):
|
Year Ended December 31,
|
|||||||||||
|
2017
|
2016
|
2015
|
|||||||||
|
Advisory services fee
|
|||||||||||
|
Base advisory fee
|
$
|
8,800
|
|
$
|
8,343
|
|
$
|
8,648
|
|
||
|
Reimbursable expenses
(1)
|
2,017
|
|
2,798
|
|
1,827
|
|
|||||
|
Equity-based compensation
(2)
|
(1,683
|
)
|
3,814
|
|
3,592
|
|
|||||
|
Incentive fee
|
—
|
|
—
|
|
3,822
|
|
|||||
|
$
|
9,134
|
|
$
|
14,955
|
|
$
|
17,889
|
|
|||
________
|
(1)
|
Reimbursable expenses include overhead, internal audit, insurance claims advisory and asset management services.
|
|
(2)
|
Equity-based compensation is associated with equity grants of Ashford Prime’s common stock, PSUs, LTIP units and Performance LTIP units awarded to officers and employees of Ashford LLC.
|
In accordance with our advisory agreement, our advisor, or entities in which our advisor has an interest, have a right to provide products or services to our hotel properties, provided such transactions are evaluated and approved by our independent directors. The following table summarizes the entities in which our advisor has an interest with which we or our hotel properties contracted for products and services, the fees paid by us for those services, the applicable classification on our consolidated financial statements and the amount payable to each entity (included in “due to Ashford Inc.”) (in thousands):
|
Year Ended December 31, 2017
|
As of
December 31, 2017
|
||||||||||||||||||
|
Company
|
Product or Service
|
Transaction Amount
|
Investments in Hotel Properties, net
(1)
|
Indebtedness, net
(2)
|
Other Hotel Expenses
|
Due to
Ashford Inc. |
|||||||||||||
|
OpenKey
|
Mobile key app
|
$
|
10
|
|
$
|
—
|
|
$
|
—
|
|
$
|
10
|
|
$
|
4
|
|
|||
|
Pure Rooms
|
“Allergy friendly” premium rooms
|
45
|
|
45
|
|
—
|
|
—
|
|
45
|
|
||||||||
|
Lismore Capital
|
Mortgage placement services
|
224
|
|
—
|
|
(224
|
)
|
—
|
|
—
|
|
||||||||
________
|
(1)
|
Recorded in furniture, fixtures and equipment and depreciated over the estimated useful life.
|
|
(2)
|
Recorded as deferred loan costs, which are included in “indebtedness, net” on our consolidated balance sheets and amortized over the initial term of the applicable loan agreement.
|
At December 31,
2016
, the balance in “due from Ashford Trust OP, net” of
$488,000
was associated with certain expenses. At
December 31, 2017
and
2016
, the balances in “due to Ashford Inc.” of
$1.7 million
and
$5.1 million
, respectively, is primarily associated with advisory services and hotel services fees payable. In addition, at December 31, 2016, we held a receivable from the AQUA U.S. Fund of
$2.3 million
, associated with the
5%
hold back from the AQUA U.S. Fund.
In connection with the acquisition of the Bardessono Hotel in 2015 and Ashford Inc.’s engagement to provide hotel advisory services to us, Ashford Inc. agreed to provide
$2.0 million
of key money consideration in the form of furniture, fixtures and equipment to be used by Ashford Prime. The hotel advisory services and the lease are considered a multiple element arrangement, in accordance with the applicable accounting guidance. As such, a portion of the base advisory fee will be allocated to lease expense equal to the estimated fair value of the lease payments that would have been made. Lease expense of
$335,000
,
$335,000
and
140
ASHFORD HOSPITALITY PRIME, INC. AND SUBSIDIARIES
NOTES TO CONSOLIDATED FINANCIAL STATEMENTS (continued)
$99,000
was recognized for the years ended
December 31, 2017
,
2016
and
2015
, respectively and was included in “other” hotel expense in the consolidated statements of operations.
Certain employees of Remington Lodging, who perform work on behalf of Ashford Prime, were granted approximately
22,000
shares of restricted stock under the Ashford Prime Stock Plan
in both 2017 and 2016
. These share grants were accounted for under the applicable accounting guidance related to share-based payments granted to non-employees and are recorded as a component of “management fees” in our consolidated statements of operations. Expense of
$92,000
,
$71,000
and
$0
was recognized for the years ended December 31,
2017
,
2016
and
2015
, respectively. The unamortized fair value of these grants was
$228,000
as of
December 31, 2017
, which will be recognized over a period of
1.3 years
.
On July 31, 2015, we entered into a block trade with an unaffiliated third party pursuant to a sale arrangement between the Company, Ashford Inc. and Ashford Trust. The block trade included the purchase from the third party of approximately
175,000
shares of Ashford Inc. common stock at a price of
$95.00
per share, which approximated the
120
-day volume weighted average price, for a total cost of approximately
$16.6 million
. The sale arrangement and block trade were evaluated and approved by the independent members of our board of directors. The block trade purchase price and other terms of the sale arrangement were the result of negotiations with the third party, and the board of directors received a fairness opinion from an independent financial advisor that the price paid for the Ashford Inc. shares by the Company was fair to the Company. We did not receive any concessions or economic benefits from Ashford Inc. pertaining to our current contractual arrangements with Ashford Inc. in connection with this block trade. The block trade settled on August 4, 2015, and the loss resulting from the block trade is recorded within “unrealized loss on investment in Ashford Inc.” in our consolidated statement of operations for the year ended December 31, 2015.
22. Concentration of Risk
Our investments are all concentrated within the hotel industry. All of our hotel properties are located within the U.S. and its territories. For the year ended December 31,
2017
,
three
of our hotel properties generated revenues in excess of 10% of total hotel revenue amounting to
36%
of total hotel revenue.
Financial instruments that potentially subject us to significant concentrations of credit risk consist principally of cash and cash equivalents. We are exposed to credit risk with respect to cash held at various financial institutions and amounts due or payable under our derivative contracts. Our counterparties to our derivative contracts are investment grade financial institutions.
141
ASHFORD HOSPITALITY PRIME, INC. AND SUBSIDIARIES
NOTES TO CONSOLIDATED FINANCIAL STATEMENTS (continued)
23. Selected Financial Quarterly Data (Unaudited)
The following is a summary of the quarterly results of operations for the years ended December 31,
2017
and
2016
(in thousands, except per share data):
|
First
Quarter
|
Second
Quarter
|
Third
Quarter
|
Fourth
Quarter
|
Full
Year
|
|||||||||||||||||
|
2017
|
|||||||||||||||||||||
|
Total revenue
|
$
|
97,296
|
|
$
|
116,092
|
|
$
|
108,119
|
|
$
|
92,556
|
|
$
|
414,063
|
|
||||||
|
Total operating expenses
|
90,046
|
|
103,685
|
|
98,533
|
|
82,957
|
|
375,221
|
|
|||||||||||
|
Operating income (loss)
|
7,250
|
|
12,407
|
|
9,586
|
|
9,599
|
|
38,842
|
|
|||||||||||
|
Net income (loss)
|
(289
|
)
|
386
|
|
(217
|
)
|
28,444
|
|
28,324
|
|
|||||||||||
|
Net income (loss) attributable to the Company
|
(13
|
)
|
(885
|
)
|
(1,000
|
)
|
24,920
|
|
23,022
|
|
|||||||||||
|
Net income (loss) attributable to common stockholders
|
(1,686
|
)
|
(2,592
|
)
|
(2,707
|
)
|
23,212
|
|
16,227
|
|
|||||||||||
|
Diluted income (loss) attributable to common stockholders per share
|
$
|
(0.07
|
)
|
$
|
(0.09
|
)
|
$
|
(0.09
|
)
|
$
|
0.65
|
|
$
|
0.51
|
|
(1
|
)
|
||||
|
Weighted average diluted common shares
|
27,267
|
|
31,469
|
|
31,483
|
|
38,178
|
|
34,706
|
|
|||||||||||
|
2016
|
|||||||||||||||||||||
|
Total revenue
|
$
|
99,797
|
|
$
|
112,432
|
|
$
|
99,651
|
|
$
|
93,977
|
|
$
|
405,857
|
|
||||||
|
Total operating expenses
|
88,344
|
|
101,917
|
|
88,404
|
|
80,051
|
|
358,716
|
|
|||||||||||
|
Operating income (loss)
|
11,453
|
|
10,515
|
|
11,247
|
|
13,926
|
|
47,141
|
|
|||||||||||
|
Net income (loss)
|
(139
|
)
|
2,292
|
|
21,322
|
|
845
|
|
24,320
|
|
|||||||||||
|
Net income (loss) attributable to the Company
|
(134
|
)
|
2,188
|
|
16,858
|
|
404
|
|
19,316
|
|
|||||||||||
|
Net income (loss) attributable to common stockholders
|
(1,028
|
)
|
1,210
|
|
15,864
|
|
(590
|
)
|
15,456
|
|
|||||||||||
|
Diluted income (loss) attributable to common stockholders per share
|
$
|
(0.04
|
)
|
$
|
0.04
|
|
$
|
0.55
|
|
$
|
(0.03
|
)
|
$
|
0.55
|
|
(1
|
)
|
||||
|
Weighted average diluted common shares
|
28,343
|
|
32,418
|
|
33,874
|
|
25,532
|
|
31,195
|
|
|||||||||||
_________________
(1)
The sum of the diluted income (loss) from continuing operations attributable to common stockholders per share for the four quarters in 2017 and 2016 differs from the annual diluted income (loss) from continuing operations attributable to common stockholders per share due to the required method of computing the weighted average diluted common shares in the respective periods.
24. Subsequent Event
On February 12, 2018, we entered into a definitive agreement to acquire the
266
-room Ritz-Carlton Sarasota in Sarasota, Florida for
$171.0 million
and a
22
acre plot of vacant land for
$9.7 million
. The acquisitions are expected to close on April 3, 2018.
142
Item 9.
Changes in and Disagreements with Accountants on Accounting and Financial Disclosure
None.
Item 9A.
Controls and Procedures
Evaluation of Disclosure Controls and Procedures
Under the supervision and with the participation of our Chief Executive Officer and Chief Financial Officer, our management has evaluated the effectiveness of the design and operation of our disclosure controls and procedures (as defined in Rules 13a-15(e) and 15d-15(e) under the Exchange Act) as of
December 31, 2017
. Based upon that evaluation, the Chief Executive Officer and Chief Financial Officer concluded that, as of
December 31, 2017
,
our disclosure controls and procedures are effective to ensure that (i) information required to be disclosed in reports that we file or submit under the Exchange Act is recorded, processed, summarized and reported within the time periods specified in the SEC’s rules and forms and (ii) information required to be disclosed in the reports that we file or submit under the Exchange Act is accumulated and communicated to management, including our Chief Executive Officer and Chief Financial Officer, to allow timely decisions regarding required disclosures.
Management’s Report on Internal Control over Financial Reporting
Management is responsible for establishing and maintaining adequate internal control over financial reporting and for the assessment of the effectiveness of our internal control over financial reporting. The internal control over financial reporting is a process designed to provide reasonable assurance regarding the reliability of financial reporting and the preparation of financial statements for external purposes in accordance with GAAP. Our internal control over financial reporting includes those policies and procedures that (i) pertain to the maintenance of records that, in reasonable detail, accurately and fairly reflect the transactions and dispositions of our assets; (ii) provide reasonable assurance that transactions are recorded as necessary to permit preparation of financial statements in accordance with GAAP, and that receipts and our expenditures are being made only in accordance with authorizations of management and our directors and (iii) provide reasonable assurance regarding prevention or timely detection of unauthorized acquisition, use, or disposition of our assets that could have a material effect on the financial statements.
Management assessed the effectiveness of our internal control over financial reporting as of
December 31, 2017
. In making the assessment of the effectiveness of our internal control over financial reporting, management has utilized the criteria established in Internal Control — Integrated Framework issued by the Committee of Sponsoring Organizations of the Treadway Commission, (2013 framework) (“COSO”).
Based on management’s assessment of these criteria, we concluded that, as of
December 31, 2017
, our internal control over financial reporting is effective.
Changes in Internal Control over Financial Reporting
There were no changes in our internal controls over financial reporting during our most recent fiscal quarter that have materially affected, or are reasonably likely to materially affect, our internal controls over financial reporting.
Item 9B.
Other Information
None.
Item 10.
Directors, Executive Officer, and Corporate Governance
The information required in response to this Item 10 is incorporated herein by reference to our definitive proxy statement to be filed with the SEC pursuant to Regulation 14A promulgated under the Exchange Act not later than 120 days after the end of the fiscal year covered by this Annual Report on Form 10-K.
Item 11.
Executive Compensation
The information required in response to this Item 11 is incorporated herein by reference to our definitive proxy statement to be filed with the SEC pursuant to Regulation 14A promulgated under the Exchange Act not later than 120 days after the end of the fiscal year covered by this Annual Report on Form 10-K.
143
Item 12.
Security Ownership of Certain Beneficial Owners and Management and Related Stockholder Matters
The information required in response to this Item 12 is incorporated herein by reference to our definitive proxy statement to be filed with the SEC pursuant to Regulation 14A promulgated under the Exchange Act not later than 120 days after the end of the fiscal year covered by this Annual Report on Form 10-K.
The information required in response to this Item 13 is incorporated herein by reference to our definitive proxy statement to be filed with the SEC pursuant to Regulation 14A promulgated under the Exchange Act not later than 120 days after the end of the fiscal year covered by this Annual Report on Form 10-K.
Item 14.
Principal Accountant Fees and Services
The information required in response to this Item 14 is incorporated herein by reference to our definitive proxy statement to be filed with the SEC pursuant to Regulation 14A promulgated under the Exchange Act not later than 120 days after the end of the fiscal year covered by this Annual Report on Form 10-K.
Item 15.
Financial Statement Schedules and Exhibits
(a), (c) Financial Statements and Schedules
See “Item 8. Financial Statements and Supplementary Data,” on pages 104 through 142 hereof, for a list of our consolidated financial statements and report of independent registered public accounting firm.
The following financial statement schedule is included herein on page 146 through page 147 hereof.
Schedule III – Real Estate and Accumulated Depreciation
All other financial statement schedules have been omitted because such schedules are not required under the related instructions, such schedules are not significant, or the required information has been disclosed elsewhere in the consolidated financial statements and related notes thereto.
The financial statements of Ashford Inc. are incorporated by reference to Ashford Inc.’s Annual Report on Form 10-K (File No. 1-36400) for the year ended December 31, 2016 in Exhibit 99.1 of this Annual Report pursuant to Rule 3-09 of Regulation S-X.
(b) Exhibits
Exhibits required by Item 601 of Regulation S-K: The exhibits filed in response to this item are listed in the Exhibit Index.
Item 16.
10-K Summary
None.
144
SIGNATURES
Pursuant to the requirements of Section 13 or 15(d) of the Securities Exchange Act of 1934, the Registrant has duly caused this report to be signed on its behalf by the undersigned, thereunto duly authorized, on
March 14, 2018
.
|
ASHFORD HOSPITALITY PRIME, INC.
|
||
|
By:
|
/s/ RICHARD J. STOCKTON
|
|
|
Richard J. Stockton
|
||
|
President and Chief Executive Officer
|
||
Pursuant to the requirements of Section 13 or 15(d) of the Securities Exchange Act of 1934, this report has been signed below on behalf of the Registrant in the capacities and on the dates indicated.
|
Signature
|
Title
|
|
Date
|
|
|
/s/
MONTY J. BENNETT
|
Chairman of the Board of Directors
|
March 14, 2018
|
||
|
Monty J. Bennett
|
||||
|
/s/ RICHARD J. STOCKTON
|
President and Chief Executive Officer
(Principal Executive Officer)
|
March 14, 2018
|
||
|
Richard J. Stockton
|
||||
|
/s/
DERIC S. EUBANKS
|
Chief Financial Officer
(Principal Financial Officer)
|
March 14, 2018
|
||
|
Deric S. Eubanks
|
||||
|
/s/
MARK L. NUNNELEY
|
Chief Accounting Officer
(Principal Accounting Officer)
|
March 14, 2018
|
||
|
Mark L. Nunneley
|
||||
|
/s/ STEFANI D. CARTER
|
Director
|
March 14, 2018
|
||
|
Stefani D. Carter
|
||||
|
/s/ CURTIS B. MCWILLIAMS
|
Director
|
March 14, 2018
|
||
|
Curtis B. McWilliams
|
||||
|
/s/
MATTHEW D. RINALDI
|
Director
|
March 14, 2018
|
||
|
Matthew D. Rinaldi
|
||||
|
/s/ KENNETH H. FEARN, JR.
|
Director
|
March 14, 2018
|
||
|
Kenneth H. Fearn, Jr.
|
||||
|
/s/ ABTEEN VAZIRI
|
Director
|
March 14, 2018
|
||
|
Abteen Vaziri
|
||||
145
SCHEDULE III
ASHFORD HOSPITALITY PRIME, INC. AND SUBSIDIARIES
REAL ESTATE AND ACCUMULATED DEPRECIATION
December 31, 2017
(in thousands)
|
Column A
|
Column B
|
Column C
|
Column D
|
Column E
|
Column F
|
Column G
|
Column H
|
Column I
|
|||||||||||||||||||||||||||||||||||||
|
Initial Cost
|
Costs Capitalized
Since Acquisition
|
Gross Carrying Amount
At Close of Period
|
|||||||||||||||||||||||||||||||||||||||||||
|
Hotel Property
|
Location
|
Encumbrances
|
Land
|
FF&E,
Buildings and
improvements
|
Land
|
FF&E,
Buildings and
improvements
|
Land
|
FF&E,
Buildings and
improvements
|
Total
|
Accumulated
Depreciation
|
Construction
Date
|
Acquisition
Date
|
Income
Statement
|
||||||||||||||||||||||||||||||||
|
Hilton
|
Washington D.C.
|
$
|
123,578
|
|
$
|
45,721
|
|
$
|
106,245
|
|
$
|
—
|
|
$
|
32,996
|
|
$
|
45,721
|
|
$
|
139,241
|
|
$
|
184,962
|
|
$
|
47,278
|
|
—
|
|
04/2007
|
(1),(2),(3)
|
|||||||||||||
|
Hilton
|
La Jolla, CA
|
66,432
|
|
—
|
|
114,614
|
|
—
|
|
18,597
|
|
—
|
|
133,211
|
|
133,211
|
|
44,992
|
|
—
|
|
04/2007
|
(1),(2),(3)
|
||||||||||||||||||||||
|
Marriott
|
Seattle, WA
|
85,833
|
|
31,888
|
|
112,176
|
|
—
|
|
7,633
|
|
31,888
|
|
119,809
|
|
151,697
|
|
34,599
|
|
—
|
|
04/2007
|
(1),(2),(3)
|
||||||||||||||||||||||
|
Courtyard by Marriott
|
Philadelphia, PA
|
77,471
|
|
9,814
|
|
94,029
|
|
—
|
|
21,808
|
|
9,814
|
|
115,837
|
|
125,651
|
|
40,598
|
|
—
|
|
04/2007
|
(1),(2),(3)
|
||||||||||||||||||||||
|
Courtyard by Marriott
|
San Francisco, CA
|
87,163
|
|
22,653
|
|
72,731
|
|
—
|
|
25,525
|
|
22,653
|
|
98,256
|
|
120,909
|
|
24,450
|
|
—
|
|
04/2007
|
(1),(2),(3)
|
||||||||||||||||||||||
|
Pier House Resort
|
Key West, FL
|
70,000
|
|
59,731
|
|
33,011
|
|
—
|
|
4,323
|
|
59,731
|
|
37,334
|
|
97,065
|
|
9,731
|
|
—
|
|
03/2014
|
(1),(2),(3)
|
||||||||||||||||||||||
|
Chicago Sofitel Magnificent Mile
|
Chicago, IL
|
80,000
|
|
12,631
|
|
140,369
|
|
—
|
|
4,200
|
|
12,631
|
|
144,569
|
|
157,200
|
|
14,824
|
|
—
|
|
02/2014
|
(1),(2),(3)
|
||||||||||||||||||||||
|
Renaissance
|
Tampa, FL
|
35,259
|
|
—
|
|
69,179
|
|
—
|
|
10,466
|
|
—
|
|
79,645
|
|
79,645
|
|
24,403
|
|
—
|
|
04/2007
|
(1),(2),(3)
|
||||||||||||||||||||||
|
Bardessono
(4)
|
Yountville, CA
|
40,000
|
|
—
|
|
64,184
|
|
—
|
|
(359
|
)
|
—
|
|
63,825
|
|
63,825
|
|
6,034
|
|
—
|
|
07/2015
|
(1),(2),(3)
|
||||||||||||||||||||||
|
Hotel Yountville
|
Yountville, CA
|
51,000
|
|
47,849
|
|
48,567
|
|
—
|
|
168
|
|
47,849
|
|
48,735
|
|
96,584
|
|
1,674
|
|
—
|
|
05/2017
|
(1),(2),(3)
|
||||||||||||||||||||||
|
Park Hyatt Beaver Creek
|
Beaver Creek, CO
|
67,500
|
|
89,117
|
|
56,383
|
|
—
|
|
608
|
|
89,117
|
|
56,991
|
|
146,108
|
|
2,456
|
|
—
|
|
03/2017
|
(1),(2),(3)
|
||||||||||||||||||||||
|
Ritz-Carlton
|
St. Thomas, USVI
|
42,000
|
|
25,533
|
|
38,467
|
|
—
|
|
(17,747
|
)
|
25,533
|
|
20,720
|
|
46,253
|
|
6,229
|
|
—
|
|
12/2015
|
(1),(2),(3)
|
||||||||||||||||||||||
|
Total
|
$
|
826,236
|
|
$
|
344,937
|
|
$
|
949,955
|
|
$
|
—
|
|
$
|
108,218
|
|
$
|
344,937
|
|
$
|
1,058,173
|
|
$
|
1,403,110
|
|
$
|
257,268
|
|
||||||||||||||||||
__________________
|
(1)
|
Estimated useful life for buildings is
39 years
.
|
|
(2)
|
Estimated useful life for building improvements is
7.5 years
.
|
|
(3)
|
Estimated useful life for furniture and fixtures is
1.5
to
5 years
.
|
|
(4)
|
Amount includes transfer of FF&E to Ashford Inc. in return for the key money consideration.
|
146
|
Year Ended December 31,
|
|||||||||||
|
2017
|
2016
|
2015
|
|||||||||
|
Investment in Real Estate:
|
|||||||||||
|
Beginning balance
|
$
|
1,258,412
|
|
$
|
1,315,621
|
|
$
|
1,179,345
|
|
||
|
Additions
|
287,871
|
|
24,280
|
|
146,828
|
|
|||||
|
Write-offs
|
(6,935
|
)
|
(11,977
|
)
|
(8,609
|
)
|
|||||
|
Impairment
|
(25,391
|
)
|
—
|
|
—
|
|
|||||
|
Sales/Disposals
|
(110,847
|
)
|
(69,512
|
)
|
(1,943
|
)
|
|||||
|
Ending balance
|
1,403,110
|
|
1,258,412
|
|
1,315,621
|
|
|||||
|
Accumulated Depreciation:
|
|||||||||||
|
Beginning balance
|
243,880
|
|
224,142
|
|
189,042
|
|
|||||
|
Depreciation expense
|
52,135
|
|
45,716
|
|
43,780
|
|
|||||
|
Impairment
|
—
|
|
—
|
|
—
|
|
|||||
|
Write-offs
|
(6,935
|
)
|
(11,977
|
)
|
(8,609
|
)
|
|||||
|
Sales/Disposals
|
(31,812
|
)
|
(14,001
|
)
|
(71
|
)
|
|||||
|
Ending balance
|
257,268
|
|
243,880
|
|
224,142
|
|
|||||
|
Investment in Real Estate, net
|
$
|
1,145,842
|
|
$
|
1,014,532
|
|
$
|
1,091,479
|
|
||
147
EXHIBIT INDEX
|
Exhibit
Number
|
Exhibit Description
|
|
|
2.1
|
||
|
2.2
|
||
|
2.3
|
||
|
3.1
|
||
|
3.1.1
|
||
|
3.2
|
||
|
3.3
|
||
|
3.4
|
||
|
3.5
|
||
|
3.6
|
||
|
3.7
|
||
|
3.8
|
||
|
4.1
|
||
|
4.2
|
||
|
4.3
|
||
|
4.4
|
||
|
10.1
|
||
|
10.1.1
|
||
|
10.2
|
||
148
|
Exhibit
Number
|
Exhibit Description
|
|
|
10.3
|
||
|
10.4
|
||
|
10.5†
|
||
|
10.6
|
||
|
10.7
|
||
|
10.8
|
||
|
10.9
|
||
|
10.10
|
||
|
10.11
|
||
|
10.12
|
||
|
10.12a
|
||
|
10.13
|
||
|
10.14
|
||
|
10.15
|
||
149
|
Exhibit
Number
|
Exhibit Description
|
|
|
10.16
|
||
|
10.17
|
||
|
10.18
|
||
|
10.19
|
||
|
10.20
|
||
|
10.21
|
||
|
10.22
|
||
|
10.23
|
||
|
10.24
|
||
|
10.25
|
||
|
10.26
|
||
|
10.27
|
||
|
10.28
|
||
|
10.29
|
||
|
10.30
|
||
150
|
Exhibit
Number
|
Exhibit Description
|
|
|
10.31
|
||
|
10.32
|
||
|
10.33
|
||
|
10.34
|
||
|
10.35
|
||
|
10.36†
|
||
|
10.37†
|
||
|
10.38
|
||
|
10.39
|
||
|
10.40
|
||
|
10.41†
|
||
|
10.41.1†
|
||
|
10.42
|
||
|
10.43†
|
||
|
10.44†
|
||
|
10.45†
|
||
|
10.46†
|
||
|
10.47
|
||
151
|
Exhibit
Number
|
Exhibit Description
|
|
|
10.48
|
||
|
10.49
|
||
|
10.50
|
||
|
10.50.1
|
||
|
10.50.2
|
||
|
10.51
|
||
|
10.51.1
|
||
|
10.52
|
||
|
12*
|
||
|
16.1
|
||
|
16.2
|
||
|
21.1*
|
||
|
21.2*
|
||
|
23.1*
|
||
|
23.2*
|
||
|
31.1*
|
||
|
31.2*
|
||
|
32.1*
|
||
|
32.2*
|
||
_________________________
* Filed herewith.
† Management contract or compensatory plan or arrangement.
152
The following materials from the Company’s Annual Report on Form 10-K for the year ended
December 31, 2017
are formatted in XBRL (Extensible Business Reporting Language): (i) Consolidated Balance Sheets; (ii) Consolidated Statements of Operations; (iii) Consolidated Statements Comprehensive Income (Loss); (iii) Consolidated Statements of Equity;(iv)Consolidated Statements of Cash Flows; and (v) Notes to Consolidated Financial Statements. In accordance with Rule 402 of Regulation S-T, the XBRL related information in Exhibit 101 to this Annual Report on Form 10-K shall not be deemed to be “filed” for purposes of Section 18 of the Securities Exchange Act of 1934, as amended (the “Exchange Act”), or otherwise subject to the liability of that section, and shall not be part of any registration statement or other document filed under the Securities Act of 1933, as amended, or the Exchange Act, except as shall be expressly set forth by specific reference in such filing.
|
101.INS
|
XBRL Instance Document
|
Submitted electronically with this report.
|
|
|
101.SCH
|
XBRL Taxonomy Extension Schema Document.
|
Submitted electronically with this report.
|
|
|
101.CAL
|
XBRL Taxonomy Calculation Linkbase Document.
|
Submitted electronically with this report.
|
|
|
101.DEF
|
XBRL Taxonomy Extension Definition Linkbase Document.
|
Submitted electronically with this report.
|
|
|
101.LAB
|
XBRL Taxonomy Label Linkbase Document.
|
Submitted electronically with this report.
|
|
|
101.PRE
|
XBRL Taxonomy Presentation Linkbase Document.
|
Submitted electronically with this report.
|
|
153
TABLE OF CONTENTS
Part IItem 1. BusinessItem 1A. Risk FactorsItem 1B. Unresolved Staff CommentsItem 2. PropertiesItem 3. Legal ProceedingsItem 4. Mine Safety DisclosuresPart IIItem 5. Market For Registrant S Common Equity, Related Stockholder Matters, and Issuer Purchases Of Equity SecuritiesItem 6. Selected Financial DataItem 7. Management S Discussion and Analysis Of Financial Condition and Results Of OperationsItem 7A. Quantitative and Qualitative Disclosures About Market RiskItem 8. Financial Statements and Supplementary DataItem 9. Changes in and Disagreements with Accountants on Accounting and Financial DisclosureItem 9A. Controls and ProceduresItem 9B. Other InformationPart IIIItem 10. Directors, Executive Officer, and Corporate GovernanceItem 11. Executive CompensationItem 12. Security Ownership Of Certain Beneficial Owners and Management and Related Stockholder MattersItem 13. Certain Relationships and Related Transactions, and Director IndependenceItem 14. Principal Accountant Fees and ServicesPart IVItem 15. Financial Statement Schedules and ExhibitsItem 16. 10-k Summary