BIG LOTS INC
10-Ks and 10-Qs
|
|
|
|
|
|
|
|
|
|
|
|
|
|
|
|
|
|
|
|
|
|
|
|
|
|
|
|
|
|
|
|
|
|
|
|
|
|
|
|
|
|
|
|
|
|
|
|
|
|
UNITED STATES
SECURITIES AND EXCHANGE COMMISSION
Washington, D.C. 20549
FORM 10-K
þ
ANNUAL REPORT PURSUANT TO SECTION 13 OR 15(d) OF THE
SECURITIES EXCHANGE ACT OF 1934
For the fiscal year ended
January 28, 2012
or
o
TRANSITION REPORT PURSUANT TO SECTION 13 OR 15(d) OF THE
SECURITIES EXCHANGE ACT OF 1934
For the transition period from __________ to __________
Commission File Number 1-8897
BIG LOTS, INC.
(Exact name of registrant as specified in its charter)
|
Ohio
|
|
06-1119097
|
|
(State or other jurisdiction of incorporation or organization)
|
|
(I.R.S. Employer Identification No.)
|
|
300 Phillipi Road, P.O. Box 28512, Columbus, Ohio
|
|
43228-5311
|
|
(Address of principal executive offices)
|
|
(Zip Code)
|
|
(614) 278-6800
|
||
|
(Registrant’s telephone number, including area code)
|
||
|
Securities registered pursuant to Section 12(b) of the Act:
|
||
|
Title of each class
|
Name of each exchange on which registered
|
|
|
Common Shares $0.01 par value
|
New York Stock Exchange
|
|
Indicate by check mark whether the registrant (1) has filed all reports required to be filed by Section 13 or 15(d) of the Securities Exchange Act of 1934 during the preceding 12 months (or for such shorter period that the registrant was required to file such reports), and (2) has been subject to such filing requirements for the past 90 days. Yes
þ
No
o
Indicate by check mark whether the registrant has submitted electronically and posted on its corporate Web site, if any, every Interactive Data File required to be submitted and posted pursuant to Rule 405 of Regulation S-T (§ 232.405 of this chapter) during the preceding 12 months (or for such shorter period that the registrant was required to submit and post such files). Yes
þ
No
o
Indicate by check mark whether the registrant is a large accelerated filer, an accelerated filer, a non-accelerated filer, or a smaller reporting company. See the definitions of “large accelerated filer,” “accelerated filer” and “smaller reporting company” in Rule 12b-2 of the Exchange Act.
|
Large accelerated filer
þ
|
Accelerated filer
o
|
Non-accelerated filer
o
|
Smaller reporting company
o
|
Indicate by check mark whether the registrant is a shell company (as defined in Rule 12b-2 of the Exchange Act). Yes
o
No
þ
The aggregate market value of the Common Shares held by non-affiliates of the Registrant (assuming for these purposes that all executive officers and directors are “affiliates” of the Registrant) was
2,376,326,661
on
July 30, 2011
, the last business day of the Registrant's most recently completed second fiscal quarter (based on the closing price of the Registrant's Common Shares on such date as reported on the New York Stock Exchange).
The number of the registrant’s common shares, $0.01 par value, outstanding as of
March 21, 2012
, wa
s
65,754,099
.
Documents Incorporated by Reference
Portions of the registrant's Proxy Statement for its 2012 Annual Meeting of Shareholders are incorporated by reference into Part III of this Annual Report on Form 10-K.
BIG LOTS, INC.
FORM 10-K
FOR THE FISCAL YEAR ENDED
JANUARY 28, 2012
TABLE OF CONTENTS
|
|
Part I
|
Page
|
|
Item 1.
|
||
|
Item 1A.
|
||
|
Item 1B.
|
||
|
Item 2.
|
||
|
Item 3.
|
||
|
Item 4.
|
||
|
|
Part II
|
|
|
Item 5.
|
||
|
Item 6.
|
||
|
Item 7.
|
||
|
Item 7A.
|
||
|
Item 8.
|
||
|
Item 9.
|
||
|
Item 9A.
|
||
|
Item 9B.
|
||
|
|
Part III
|
|
|
Item 10.
|
||
|
Item 11.
|
||
|
Item 12.
|
||
|
Item 13.
|
||
|
Item 14.
|
||
|
|
|
|
|
Part IV
|
||
|
Item 15.
|
||
1
The Company
Big Lots, Inc., an Ohio corporation, through its wholly owned subsidiaries (collectively referred to herein as “we,” “us,” and “our” except as used in the reports of our independent registered public accounting firm included in Item 8 of this Annual Report for Form 10-K (“Form 10-K”)), is North America's largest broadline closeout retailer (see the discussion below under the caption “Closeout Retailing”). At
January 28, 2012
, we operated a total of
1,533
stores in two countries: the United States of America ("U.S.") and Canada. Our goal is to strengthen and build upon our leadership position in broadline closeout retailing by providing our customers with great savings on brand-name closeouts and other value-priced merchandise. You can locate us on the Internet at
www.biglots.com
. The contents of our websites are not part of this report.
Similar to many other retailers, our fiscal year ends on the Saturday nearest to January 31, which results in some fiscal years being comprised of 52 weeks and some being comprised of 53 weeks. Unless otherwise stated, references to years in this Form 10-K relate to fiscal years rather than calendar years. The following table provides a summary of our fiscal year calendar and the associated number of weeks in the fiscal year:
|
Fiscal Year
|
Number of Weeks
|
Year Begin Date
|
Year End Date
|
|||
|
2012
|
53
|
January 29, 2012
|
February 2, 2013
|
|||
|
2011
|
52
|
January 30, 2011
|
January 28, 2012
|
|||
|
2010
|
52
|
January 31, 2010
|
January 29, 2011
|
|||
|
2009
|
52
|
February 1, 2009
|
January 30, 2010
|
|||
|
2008
|
52
|
February 3, 2008
|
January 31, 2009
|
|||
|
2007
|
52
|
February 4, 2007
|
February 2, 2008
|
|||
We manage our broadline closeout retailing business geographically on the basis of two segments: U.S. and Canada. Please refer to the consolidated financial statements and related notes in this Form 10-K for our financial information. In our U.S. segment, we evaluate and report overall sales and merchandise performance based on the following key merchandising categories: Consumables, Furniture, Home, Seasonal, Play n' Wear, and Hardlines & Other. The Consumables category includes the food, health and beauty, plastics, paper, chemical, and pet departments. The Furniture category includes the upholstery, mattresses, ready-to-assemble, and case goods departments. The Home category includes the domestics, stationery, and home decorative departments. The Seasonal category includes the lawn & garden, Christmas, summer, and other holiday departments. The Play n' Wear category includes the electronics, toys, jewelry, infant accessories, and apparel departments. The Hardlines & Other category includes the appliances, tools, paint, and home maintenance departments, as well as the results of certain large closeout deals that we typically acquire through our alternate product sourcing operations. See note 15 to the accompanying consolidated financial statements for the net sales results of our segments and these categories for
2011
,
2010
, and
2009
.
In May 2001, Big Lots, Inc. was incorporated in Ohio and was the surviving entity in a merger with Consolidated Stores Corporation, a Delaware corporation. By virtue of the merger, Big Lots, Inc. succeeded to all the business, properties, assets, and liabilities of Consolidated Stores Corporation. In 2009 and 2010, all of our operations were located within the U.S. In July 2011, we expanded our operations internationally into Canada with the acquisition of 100% of the outstanding shares of Liquidation World Inc. (now known as Big Lots Canada, Inc.).
Our principal executive offices are located at 300 Phillipi Road, Columbus, Ohio 43228, and our telephone number is (614) 278‑6800.
2
Closeout Retailing
Closeout merchandise generally results from production overruns, packaging changes, discontinued products, liquidations, returns, and other disruptions in the supply chain of manufacturers. As a result, we can generally purchase closeout merchandise at lower costs than would be paid by traditional discount retailers, and offer closeout merchandise at lower prices than those offered by traditional discount retailers. We attempt to maximize the amount of closeout merchandise available in our stores. We work closely with our vendors to obtain name brand merchandise that is easily recognizable by our customers. In addition to closeout merchandise, we stock many products on a consistent basis at our stores that we believe provide great value to our customers. These recurring products may not always be the same brand or may be off-brand because we attempt to provide our customers with merchandise at a price that we believe represents a great value. For net sales by merchandise category and as a percent of total net sales, see the discussion below under the captions “
2011
Compared To
2010
” and “
2010
Compared To
2009
” in “Item 7. Management's Discussion and Analysis of Financial Condition and Results of Operations” (“MD&A”) of this Form 10-K.
Real Estate
The following table compares the number of our stores in operation, by segment, at the beginning and end of each of the last five fiscal years:
|
2011
|
2010
|
2009
|
2008
|
2007
|
|||||||||||
|
U.S.
|
|
|
|
|
|
||||||||||
|
Stores open at the beginning of the year
|
1,398
|
|
1,361
|
|
1,339
|
|
1,353
|
|
1,375
|
|
|||||
|
Stores opened during the year
|
92
|
|
80
|
|
52
|
|
21
|
|
7
|
|
|||||
|
Stores acquired during the year
|
—
|
|
—
|
|
—
|
|
—
|
|
—
|
|
|||||
|
Stores closed during the year
|
(39
|
)
|
(43
|
)
|
(30
|
)
|
(35
|
)
|
(29
|
)
|
|||||
|
Stores open at the end of the year
|
1,451
|
|
1,398
|
|
1,361
|
|
1,339
|
|
1,353
|
|
|||||
|
Canada
|
|||||||||||||||
|
Stores open at the beginning of the year
|
—
|
|
—
|
|
—
|
|
—
|
|
—
|
|
|||||
|
Stores opened during the year
|
—
|
|
—
|
|
—
|
|
—
|
|
—
|
|
|||||
|
Stores acquired during the year
|
89
|
|
—
|
|
—
|
|
—
|
|
—
|
|
|||||
|
Stores closed during the year
|
(7
|
)
|
—
|
|
—
|
|
—
|
|
—
|
|
|||||
|
Stores open at the end of the year
|
82
|
|
—
|
|
—
|
|
—
|
|
—
|
|
|||||
|
Consolidated
|
|||||||||||||||
|
Stores open at the beginning of the year
|
1,398
|
|
1,361
|
|
1,339
|
|
1,353
|
|
1,375
|
|
|||||
|
Stores opened during the year
|
92
|
|
80
|
|
52
|
|
21
|
|
7
|
|
|||||
|
Stores acquired during the year
|
89
|
|
—
|
|
—
|
|
—
|
|
—
|
|
|||||
|
Stores closed during the year
|
(46
|
)
|
(43
|
)
|
(30
|
)
|
(35
|
)
|
(29
|
)
|
|||||
|
Stores open at the end of the year
|
1,533
|
|
1,398
|
|
1,361
|
|
1,339
|
|
1,353
|
|
|||||
During 2009, the U.S. commercial real estate market softened and, as a result, we successfully negotiated a number of new store leases as the availability of space improved, rental rates eased, and our sales and profitability improved at the store level. This trend continued into 2010. In addition, during 2009 and 2010, we were able to favorably negotiate renewals for certain store leases which, prior to 2009, may have resulted in store closures. In 2011, we continued our new store expansion activities in the U.S., and also acquired 89 stores in Canada as the result of our acquisition of Liquidation World Inc. For additional information about our real estate strategy, see the discussion under the caption “Operating Strategy - Real Estate” in the accompanying MD&A in this Form 10-K.
3
The following table details our U.S. stores by state at
January 28, 2012
:
|
Alabama
|
28
|
|
Maine
|
7
|
|
Ohio
|
108
|
|
||
|
Arizona
|
36
|
|
Maryland
|
19
|
|
Oklahoma
|
17
|
|
||
|
Arkansas
|
13
|
|
Massachusetts
|
20
|
|
Oregon
|
13
|
|
||
|
California
|
174
|
|
Michigan
|
48
|
|
Pennsylvania
|
70
|
|
||
|
Colorado
|
20
|
|
Minnesota
|
7
|
|
Rhode Island
|
1
|
|
||
|
Connecticut
|
11
|
|
Mississippi
|
14
|
|
South Carolina
|
34
|
|
||
|
Delaware
|
4
|
|
Missouri
|
28
|
|
South Dakota
|
1
|
|
||
|
Florida
|
109
|
|
Montana
|
2
|
|
Tennessee
|
47
|
|
||
|
Georgia
|
60
|
|
Nebraska
|
4
|
|
Texas
|
117
|
|
||
|
Idaho
|
6
|
|
Nevada
|
12
|
|
Utah
|
11
|
|
||
|
Illinois
|
34
|
|
New Hampshire
|
7
|
|
Vermont
|
4
|
|
||
|
Indiana
|
46
|
|
New Jersey
|
18
|
|
Virginia
|
37
|
|
||
|
Iowa
|
3
|
|
New Mexico
|
12
|
|
Washington
|
23
|
|
||
|
Kansas
|
9
|
|
New York
|
54
|
|
West Virginia
|
18
|
|
||
|
Kentucky
|
40
|
|
North Carolina
|
68
|
|
Wisconsin
|
10
|
|
||
|
Louisiana
|
23
|
|
North Dakota
|
2
|
|
Wyoming
|
2
|
|
||
|
Total stores
|
1,451
|
|
||||||||
|
Number of states
|
48
|
|
||||||||
The following table details our Canadian stores by province at
January 28, 2012
:
|
Alberta
|
13
|
|
New Brunswick
|
2
|
|
Saskatchewan
|
6
|
|
||
|
British Columbia
|
16
|
|
Nova Scotia
|
4
|
|
|
|
|
||
|
Manitoba
|
4
|
|
Ontario
|
37
|
|
|
|
|
||
|
Total stores
|
82
|
|
||||||||
|
Number of provinces
|
7
|
|
||||||||
Of our
1,533
stores,
33%
operate in four states: California, Texas, Ohio, and Florida, and net sales from stores in these states represented 36% of our 2011 net sales.
Associates
At
January 28, 2012
, we had approximately 37,400 active associates comprised of 13,200 full‑time and 24,200 part‑time associates. Temporary associates hired during the fall and winter holiday selling season increased the number of associates to a peak of approximately 43,000 in
2011
. Approximately 65% of the associates employed throughout the year are employed on a part‑time basis. We consider our relationship with our associates to be good, and we are not a party to any labor agreements.
Competition
We operate in the highly competitive retail industry and face strong sales competition from other general merchandise, discount, food, furniture, arts and crafts, and dollar store retailers. Additionally, we compete with a number of companies for retail site locations, to attract and retain quality employees, and to acquire our broad assortment of closeout merchandise from vendors.
4
Purchasing
An integral part of our business is the sourcing and purchasing of quality brand-name merchandise directly from manufacturers and other vendors typically at prices below those paid by traditional retailers. We believe that we have built strong relationships with many brand-name vendors and we have capitalized on our purchasing power in the closeout marketplace, including our ability to pay timely and source merchandise that provides exceptional value to our customers. We have the ability to source and purchase significant quantities of a vendor's closeout merchandise in specific product categories and to control distribution in accordance with vendor instructions. We believe this ability provides a high level of service and convenience to our vendors. We supplement our traditional brand-name closeout purchases with various direct import and domestically-sourced merchandise, which represents merchandise that our customers consistently expect us to have in our stores or merchandise that we believe offers our customers a significant value. Our sourcing channels also include bankruptcies, liquidations, and insurance claims. We expect that the unpredictability of the retail and manufacturing environments coupled with what we believe is our dominant purchasing power position will continue to support our ability to source quality closeout merchandise at competitive prices.
We have a merchandising team with extensive closeout purchasing experience, which we believe has enabled us to develop successful long‑term relationships with many of the largest and most recognized vendors in North America. As a result of our relationships and our experience and reputation in the closeout industry, we believe many vendors offer buying opportunities to us prior to attempting to dispose of their merchandise through other channels.
Our merchandise is purchased from a broad and growing vendor base of more than 3,000 domestic and foreign vendors. In
2011
, our top ten vendors accounted for approximately 15% of total purchases (at cost) while the largest vendor accounted for approximately 4% of total purchases (at cost).
During
2011
, we purchased approximately 26% of our merchandise directly from overseas vendors, including approximately 23% from vendors located in China. Additionally, a significant amount of our domestically-purchased merchandise is manufactured abroad. As a result, a significant portion of our merchandise supply is subject to certain risks as described further in “Item 1A. Risk Factors” of this Form 10-K.
Warehouse and Distribution
The majority of the merchandise we sell is received and processed for retail sale and distributed to the retail locations from our seven regional distribution centers. Our U.S. segment is serviced by regional distribution centers located in Pennsylvania, Ohio, Alabama, Oklahoma, and California. Our Canadian segment is serviced by regional distribution centers located in British Columbia and Ontario. While a select few of our merchandise vendors deliver merchandise directly to our stores, the large majority of our inventory is managed through our our distribution centers to facilitate the prompt and efficient distribution of merchandise to our stores in order to maximize sales and our inventory turnover rate. We selected the locations of our distribution centers in the U.S. in an effort to minimize transportation costs and the distance from distribution centers to our stores.
In addition to the regional distribution centers that handle merchandise, we operate a warehouse in Ohio that distributes store fixtures and supplies and wholesale inventory for our U.S. segment.
For additional information regarding our warehouses and distribution facilities and related initiatives, see the discussion under the caption “Warehouse and Distribution” in “Item 2. Properties” of this Form 10-K and the discussion under the caption “Operating Strategy - Cost Structure” in the accompanying MD&A in this Form 10-K.
Advertising and Promotion
Our brand image is an important part of our marketing program. Our principal trademarks, including the Big Lots
®
family of trademarks, have been registered with the U.S. Patent and Trademark Office and the Canadian Intellectual Property Office. We use a variety of marketing approaches to promote our brand and retail position through television, internet, in-store point of purchase, and print media.
5
The centerpiece of our U.S. marketing efforts is our television campaign which combines elements of strategic branding and promotion. These same elements are also used in most of our other marketing media. Our highly-targeted media placement strategy uses national cable as the foundation of our television buys which is then supplemented with commercials placed with broadcast networks in key markets. In all markets served by our U.S. stores, we design and distribute printed advertising circulars, through a combination of newspaper insertions and mailings. In
2011
, we distributed multi-page circulars covering 27 weeks which was consistent with our approach in
2010
and
2009
. We create regional versions of these circulars to take advantage of market differences caused by product availability, climate, and customer preferences. In addition, we use in-store promotional materials, including in‑store signage, to emphasize special bargains and significant values offered to our customers.
Since the date we acquired Liquidation World Inc., our marketing efforts in Canada have been limited to in-store promotional materials. Our focus in Canada has been on building inventory assortments to optimal levels and enhancing the presentation of our stores. Once these goals are accomplished, we will evaluate which marketing strategies (e.g., branding and promotional advertising) best fit our operational goals.
Our customer list, which we refer to as the Buzz Club
®
in the U.S., is an important marketing tool which allows us to communicate in a cost effective manner with our customers, including e-mail delivery of our circulars. In addition to the Buzz Club
®
, in August of 2009, we started the Buzz Club Rewards
®
program (“Rewards”), which has grown rapidly from 1.2 million members at the end of 2009 to 11.5 million members at the end of 2011. Members of the Buzz Club Rewards
®
program use a membership card when making purchases and earn discounts on future purchases when they meet certain thresholds. Buzz Club Rewards
®
members may also receive other targeted promotions. We continue to use our website (
www.biglots.com
) as a key avenue to communicate with our customers through special catalogs and online advertising, attracting approximately 1.3 million unique visitors each week. Total advertising expense as a percentage of total net sales was 1.9% in
2011
, 1.9% in
2010
, and 2.0% in
2009
.
Seasonality
We have historically experienced, and expect to continue to experience, seasonal fluctuations in our sales and profitability, with a larger percentage of our net sales and operating profit realized in the fourth fiscal quarter. In addition, our quarterly net sales and operating profits can be affected by the timing of new store openings and store closings, the timing of television and circular advertising, and the timing of certain holidays. We historically receive a higher proportion of merchandise, carry higher inventory levels, and incur higher outbound shipping and payroll expenses as a percentage of sales in the third fiscal quarter in anticipation of increased sales activity during the fourth fiscal quarter. The fourth fiscal quarter typically includes a leveraging effect on operating results because net sales are higher and certain of our costs, such as rent and depreciation, are fixed and do not vary as sales levels escalate.
The seasonality of our net sales and related merchandise inventory requirements influences our availability of and demand for cash or access to credit. We historically have drawn upon our credit facility to assist in funding our working capital requirements, which typically peak near the end of our third fiscal quarter. We historically have higher net sales, operating profits, and cash flow provided by operations in the fourth fiscal quarter which allows us to substantially repay our seasonal borrowings. In 2011, our total indebtedness (outstanding borrowings and letters of credit) peaked in early December 2011 at approximately $400 million under our $700 million unsecured credit facility entered into in July 2011 (“2011 Credit Agreement”). At
January 28, 2012
, our total indebtedness under the 2011 Credit Agreement was
$121.1 million
, which included
$65.9 million
in borrowings and
$55.2 million
in outstanding letters of credit. We expect that borrowings will vary throughout 2012 depending on various factors, including our seasonal need to acquire merchandise inventory prior to peak selling seasons, the timing and amount of sales to our customers, the working capital needs of our Canadian segment, and the potential impact of shares repurchased under our authorized share repurchase program. For additional information on our current share repurchase program, the 2011 Credit Agreement, and a discussion of our sources and uses of funds, see “Item 5. Market for Registrant's Common Equity, Related Stockholder Matters and Issuer Purchases of Equity Securities” and the discussion under the caption “Capital Resources and Liquidity” in the accompanying MD&A, in this Form 10-K.
Available Information
We make available, free of charge, through the “Investor Relations” section of our website (
www.biglots.com
) under the “SEC Filings” caption, our Annual Reports on Form 10-K, Quarterly Reports on Form 10-Q, Current Reports on Form 8-K, and amendments to those reports filed or furnished pursuant to Section 13 or 15(d) of the Securities Exchange Act of 1934, as amended (“Exchange Act”), as soon as reasonably practicable after we file such material with, or furnish it to, the Securities and Exchange Commission (“SEC”).
6
In this Form 10-K, we incorporate by reference certain information from parts of our Proxy Statement for our 2012 Annual Meeting of Shareholders (“2012 Proxy Statement”).
In the “Investor Relations” section of our website (
www.biglots.com
) under the “Corporate Governance” and “SEC Filings” captions, the following information relating to our corporate governance may be found: Corporate Governance Guidelines; charters of our Board of Directors' Audit, Compensation, Nominating/Corporate Governance, Strategic Planning, and Public Policy and Environmental Affairs Committees; Code of Business Conduct and Ethics; Code of Ethics for Financial Professionals; Chief Executive Officer and Chief Financial Officer certifications related to our SEC filings; the means by which shareholders may communicate with our Board of Directors; and transactions in our securities by our directors and executive officers. The Code of Business Conduct and Ethics applies to all of our associates, including our directors and our principal executive officer, principal financial officer, and principal accounting officer. The Code of Ethics for Financial Professionals applies to our Chief Executive Officer and all other Senior Financial Officers (as that term is defined therein) and contains provisions specifically applicable to the individuals serving in those positions. We intend to post amendments to and waivers from, if any, our Code of Business Conduct and Ethics (to the extent applicable to our directors and executive officers) and our Code of Ethics for Financial Professionals in the “Investor Relations” section of our website (
www.biglots.com
) under the “Corporate Governance” caption. We will provide any of the foregoing information without charge upon written request to our Corporate Secretary. The contents of our websites are not part of this report.
The statements in this section describe the material risks to our business and should be considered carefully. In addition, these statements constitute cautionary statements under the Private Securities Litigation Reform Act of 1995.
Our disclosure and analysis in this Form 10-K and in our
2011
Annual Report to Shareholders contain some forward-looking statements that set forth anticipated results based on management's plans and assumptions. From time to time, we also provide forward-looking statements in other materials we release to the public as well as oral forward-looking statements. Such statements give our current expectations or forecasts of future events; they do not relate strictly to historical or current facts. Such statements are commonly identified by using words such as “anticipate,” “estimate,” “expect,” “objective,” “goal,” “project,” “intend,” “plan,” “believe,” “will,” “should,” “may,” “target,” “forecast,” “guidance,” “outlook,” and similar expressions in connection with any discussion of future operating or financial performance. In particular, forward-looking statements include statements relating to future actions, future performance, or results of current and anticipated products, sales efforts, expenses, interest rates, the outcome of contingencies, such as legal proceedings, and financial results.
We cannot guarantee that any forward-looking statement will be realized. Achievement of future results is subject to risks, uncertainties, and potential inaccurate assumptions. Should known or unknown risks or uncertainties materialize, or should underlying assumptions prove inaccurate, actual results could differ materially from past results and those anticipated, estimated, or projected results set forth in the forward-looking statements. You should bear this in mind as you consider forward-looking statements.
You are cautioned not to place undue reliance on forward-looking statements, which speak only as of the date thereof. We undertake no obligation to publicly update forward-looking statements, whether as a result of new information, future events, or otherwise. You are advised, however, to consult any further disclosures we make on related subjects in our Quarterly Reports on Form 10-Q and Current Reports on Form 8-K filed with the SEC.
Also note that we provide the following cautionary discussion of material risks, uncertainties, and assumptions relevant to our businesses. There can be no assurances that we have correctly and completely identified, assessed, and accounted for all factors that do or may affect our business, financial condition, results of operations, and liquidity. These are factors that, individually or in the aggregate, we think could cause our actual results to differ materially from expected and historical results. Additional risks not presently known to us or that we presently believe to be immaterial also may adversely impact us. Should any risks or uncertainties develop into actual events, these developments could have material adverse effects on our business, financial condition, results of operations, and liquidity. Consequently, all of the forward-looking statements are qualified by these cautionary statements, and there can be no assurance that the results or developments we anticipate will be realized or that they will have the expected effects on our business or operations. We note these factors for investors as permitted by the Private Securities Litigation Reform Act of 1995. You should understand that it is not possible to predict or identify all such factors. Consequently, you should not consider the following to be a complete discussion of all potential risks or uncertainties.
7
Our ability to achieve the results contemplated by forward-looking statements is subject to a number of factors, any one, or a combination, of which could materially affect our business, financial condition, results of operations, or liquidity. These factors may include, but are not limited to:
The current economic conditions (including commodity price fluctuations, bankruptcies, and reduced access to credit) give rise to risks and uncertainties that may adversely affect our capital resources, financial condition, results of operations, and liquidity including, but not limited to the following:
|
•
|
Fluctuating commodity prices, including but not limited to diesel fuel and other fuels used to generate power by utilities, may affect our gross profit and operating profit margins.
|
|
•
|
Our expectations regarding the demand for our merchandise may be inaccurate, which could cause us to under buy or over buy certain categories or departments of merchandise, which could result in customer dissatisfaction or require excessive markdowns to sell through the merchandise.
|
|
•
|
The reaction of our competitors to the marketplace, including the level of liquidations occurring at bankrupt retailers, may drive our competitors, some of whom are better capitalized than us, to offer significant discounts or promotions on their merchandise, which could negatively affect our sales and profit margins.
|
|
•
|
Our vendors may be negatively impacted by current economic conditions due to insufficient availability of credit to fund their operations or insufficient demand for their products, which may affect their ability to fulfill their obligations to us.
|
|
•
|
A downgrade in our credit rating could negatively affect our ability to access capital or could increase the borrowing rates we pay.
|
If we are unable to continue to successfully execute our operating strategies in our U.S. segment, our operating performance could be significantly impacted.
There is a risk that we will be unable to continue to meet or exceed our operating performance targets and goals in the future if our strategies and initiatives are unsuccessful. In 2010, we announced operating performance targets and goals as part of an updated strategic plan that we intend to use as our roadmap for the near future. That plan includes a growth phase and a continued focus on merchandising, real estate, and cost structure. Overall, for our U.S. segment, both our actual 2011 operating performance and our 2012 operating performance outlook are materially consistent with the operating performance targets outlined in the strategic plan announced in 2010 but there can be no assurance we will be able to continue to successfully execute our operating strategies. See the accompanying MD&A in this Form 10-K for additional information concerning our operating strategy.
If we are unable to successfully implement our operating strategies in our Canadian segment, our operating performance could be significantly impacted.
During 2011, we acquired Liquidation World Inc. as an avenue for entry into the Canadian retail market, which was not specifically included in the strategic plan announced in 2010, but fell within the growth phase goals of our overall plan. The Company's intent is to implement an operating strategy in Canada similar to that of our U.S. segment. If we are unable to successfully implement this strategy in Canada, such failure could have a material adverse affect on the consolidated operating performance and the value of our goodwill and intangibles assets associated with the Canadian segment could be negatively affected. See the accompanying MD&A in this Form 10-K for additional information concerning our operating strategy.
If we are unable to compete effectively in the highly competitive discount retail industry, our business and results of operations may be materially adversely affected.
The discount retail business is highly competitive. As discussed in Item 1 of this Form 10-K, we compete for customers, employees, products, real estate, and other aspects of our business with a number of other companies. Certain of our competitors have greater financial, distribution, marketing, and other resources than us. It is possible that increased competition or improved performance by our competitors may reduce our market share, gross margin, and operating margin, and may materially adversely affect our business and results of operations in other ways.
8
Changes by vendors related to the management of their inventories may reduce the quantity and quality of brand-name closeout merchandise available to us or may increase our cost to acquire brand-name closeout merchandise, either of which may materially adversely affect our revenues and gross margin.
The products we sell are sourced from a variety of vendors. The portion of our merchandise assortment that is pre-planned and made for us consists of imported merchandise (primarily merchandise in our furniture, seasonal, and home categories along with merchandise in certain other departments like toys) or merchandise that we can re-order upon demand. However, for the closeout component of our business, we do not control the supply, design, function, availability, or cost of many of the products that we offer for sale. Our ability to meet or exceed our operating performance targets for gross margin depends upon the sufficient availability of closeout merchandise that we can acquire and offer at prices that represent a value to our customers. In addition, we rely on our vendors to provide us with quality merchandise. To the extent that certain of our vendors are better able to manage their inventory levels and reduce the amount of their excess inventory, the amount of closeout merchandise available to us could be materially reduced. Shortages or disruptions in the availability of closeout merchandise of a quality acceptable to our customers and us would likely have a material adverse effect on our sales and gross margin and may result in customer dissatisfaction.
We rely on vendors located in foreign countries for significant amounts of merchandise and a significant amount of our domestically-purchased merchandise is manufactured abroad. Our business may be materially adversely affected by risks associated with international trade.
Global sourcing of many of the products we sell is an important factor in driving higher gross margin. During
2011
, we purchased approximately 26% of our products directly from overseas vendors including 23% from vendors located in China. Our ability to identify qualified vendors and to access products in a timely and efficient manner is a significant challenge, especially with respect to goods sourced outside of North America. Global sourcing and foreign trade involve numerous factors and uncertainties beyond our control including increased shipping costs, increased import duties, more restrictive quotas, loss of "most favored nation" trading status, currency and exchange rate fluctuations, work stoppages, transportation delays, economic uncertainties such as inflation, foreign government regulations, political unrest, natural disasters, war, terrorism, trade restrictions (including retaliation by the United States against foreign practices), political instability, the financial stability of vendors, merchandise quality issues, and tariffs. These and other issues affecting our international vendors could materially adversely affect our business and financial performance.
Disruption to our distribution network, the capacity of our distribution centers, and the timely receipt of merchandise inventory could adversely affect our operating performance.
We rely on the ability to replenish depleted merchandise inventory through deliveries to our distribution centers and from the distribution centers to our stores by various means of transportation, including shipments by sea, rail and truck carriers. A decrease in the capacity of carriers and/or labor strikes or shortages in the transportation industry could negatively affect our distribution network, the timely receipt of merchandise and transportation costs. In addition, long-term disruptions to North American and international transportation infrastructure from wars, political unrest, terrorism, natural disasters and other significant events that lead to delays or interruptions of service could adversely affect our business. Also, a fire, earthquake, or other disaster at one of our distribution centers could disrupt our timely receiving, processing and shipment of merchandise to our stores which could adversely affect our business. As we continue to expand our operations, we may face increased or unexpected demands on distribution center operations, as well as unexpected demands on our distribution network. In addition, new store locations receiving shipments that are increasingly further away from our distribution centers will increase transportation costs, driven by rising fuel prices, and may create transportation scheduling strains.
Our inability to properly manage our inventory levels and offer merchandise that our customers want may materially adversely impact our business and financial performance.
We must maintain sufficient inventory levels to operate our business successfully. However, we also must seek to avoid accumulating excess inventory in order to maintain appropriate in-stock levels. As stated above, we obtain approximately one quarter of our merchandise from vendors outside of North America. These foreign vendors often require lengthy advance notice of our requirements in order to be able to supply products in the quantities that we request. This usually requires us to order merchandise and enter into purchase order contracts for the purchase and manufacture of such merchandise well in advance of the time these products are offered for sale. As a result, we may experience difficulty in responding to a changing retail environment, which makes us vulnerable to changes in price and in consumer preferences. In addition, we attempt to maximize our gross margin and operating efficiency by delivering proper quantities of merchandise to our stores in a timely manner. If we do not accurately anticipate future demand for a particular product or the time it will take to replenish inventory levels, our inventory levels may not be appropriate and our results of operations may be negatively impacted.
9
Declines in general economic condition, consumer spending levels, and other conditions could lead to reduced consumer demand for our merchandise thereby materially adversely affecting our revenues and gross margin.
Our results of operations can be directly impacted by the health of the economies of the United States and Canada. Our business and financial performance may be adversely impacted by current and future economic conditions, including factors that may restrict or otherwise negatively impact consumer financing, disposable income levels, unemployment levels, energy costs, interest rates, recession, inflation, the impact of natural disasters and terrorist activities, and other matters that influence consumer spending. The economies of four states (Ohio, Texas, California, and Florida) are particularly important as approximately 33% of our current stores operate in these states and 36% of our
2011
net sales occurred in these states.
Changes in federal or state/provincial legislation and regulations, including the effects of legislation and regulations on product safety, could increase our cost of doing business and adversely affect our operating performance.
We are exposed to the risk that new federal or state/provincial legislation, including new product safety laws and regulations, may negatively impact our operations and adversely affect our operating performance. Additional changes in product safety legislation or regulations may lead to product recalls and the disposal or write-off of merchandise, as well as fines or penalties and reputational damage. If our merchandise, including food and consumable products, do not meet applicable governmental safety standards or our customers' expectations regarding quality or safety, we could experience lost sales, increased costs and be exposed to legal and reputational risk. Our inability to comply on a timely basis with regulatory requirements, or execute product recalls in a timely manner, could result in fines or penalties which could have a material adverse effect on our financial results. In addition, negative customer perceptions regarding the safety of the products we sell could cause us to lose market share to our competitors. If this occurs, it may be difficult for us to regain lost sales.
We may be subject to periodic litigation and regulatory proceedings, including Fair Labor Standards Act and state wage and hour class action lawsuits, which may adversely affect our business and financial performance.
From time to time, we may be involved in lawsuits and regulatory actions, including various collective or class action lawsuits that are brought against us for alleged violations of the Fair Labor Standards Act and state wage and hour laws. Due to the inherent uncertainties of litigation, we may not be able to accurately determine the impact on us of any future adverse outcome of such proceedings. The ultimate resolution of these matters could have a material adverse impact on our financial condition, results of operations, and liquidity. In addition, regardless of the outcome, these proceedings could result in substantial cost to us and may require us to devote substantial resources to defend ourselves. For a description of certain current legal proceedings, see note 10 to the accompanying consolidated financial statements.
Our current insurance program may expose us to unexpected costs and negatively affect our financial performance.
Our insurance coverage reflects deductibles, self-insured retentions, limits of liability and similar provisions that we believe are prudent based on the dispersion of our operations. However, there are types of losses we may incur but against which we cannot be insured or which we believe are not economically reasonable to insure, such as losses due to acts of war, employee and certain other crime and some natural disasters. If we incur these losses and they are material, our business could suffer. Certain material events may result in sizable losses for the insurance industry and adversely impact the availability of adequate insurance coverage or result in excessive premium increases. To offset negative insurance market trends, we may elect to self-insure, accept higher deductibles or reduce the amount of coverage in response to these market changes. In addition, we self-insure a significant portion of expected losses under our workers' compensation, general liability, including automobile, and group health insurance programs. Unanticipated changes in any applicable actuarial assumptions and management estimates underlying our recorded liabilities for these losses, including expected increases in medical and indemnity costs, could result in materially different amounts of expense than expected under these programs, which could have a material adverse effect on our financial condition and results of operations. Although we continue to maintain property insurance for catastrophic events, we are effectively self-insured for losses up to the amount of our deductibles. If we experience a greater number of these losses than we anticipate, our financial performance could be adversely affected.
10
A significant decline in our operating profit and taxable income may impair our ability to realize the value of our long-lived assets and deferred tax assets.
We are required by accounting rules to periodically assess our property and equipment, goodwill, intangible assets, and deferred tax assets for impairment and recognize an impairment loss or valuation charge, if necessary. In performing these assessments in our U.S. segment, we use our historical financial performance to determine whether we have potential impairments or valuation concerns and as evidence to support our assumptions about future financial performance. In relation to our recently acquired Canadian segment, we use our estimate of future financial performance in performing these assessments as we do not believe pre-acquisition performance is indicative of the future performance of the segment. If our financial performance significantly declines, it could negatively affect the results of our assessments of the recoverability of our property and equipment, goodwill, intangible assets, and our deferred tax assets. There is a risk that if our future operating results significantly decline, it could impair our ability to recover the value of these assets. Impairment or valuation charges taken against property and equipment, goodwill, intangible assets, and deferred tax assets could be material and could have a material adverse impact on our capital resources, financial condition, results of operations, and liquidity (see the discussion under the caption “Critical Accounting Policies and Estimates” in the accompanying MD&A in this Form 10-K for additional information regarding our accounting policies for long-lived assets, goodwill, and income taxes).
Our inability, if any, to comply with the terms of the 2011 Credit Agreement may have a material adverse effect on our capital resources, financial condition, results of operations, and liquidity.
We have the ability to borrow funds under the 2011 Credit Agreement and we utilize this ability at various times depending on operating or other cash flow requirements. The 2011 Credit Agreement contains financial and other covenants, including, but not limited to, limitations on indebtedness, liens, and investments, as well as the maintenance of two financial ratios - a leverage ratio and a fixed charge coverage ratio. A violation of these covenants may permit the lenders to restrict our ability to further access loans and letters of credit and may require the immediate repayment of any outstanding loans. If we do not comply with these covenants, it may have a material adverse effect on our capital resources, financial condition, results of operations, and liquidity.
If we are unable to maintain or upgrade our information systems and software programs or if we are unable to convert to alternate systems in an efficient and timely manner, our operations may be disrupted or become less efficient.
We depend on a variety of information systems for the efficient functioning of our business. We rely on certain software vendors to maintain and periodically upgrade many of these systems so that we can continue to support our business. The software programs supporting many of our systems were licensed to us by independent software developers. Costs and potential interruptions associated with the implementation of new or upgraded systems and technology or with maintenance or adequate support of our existing systems could disrupt or reduce the efficiency of our business.
If we are unable to successfully execute our SAP
®
for Retail system implementation, our operations may be disrupted or become less efficient.
In January 2008, we announced our plans to implement SAP
®
for Retail solutions over the next few years. New financial systems, including general ledger, accounts payable and fixed assets, were developed and tested during 2008 and 2009. The new financial systems were placed in service in the first quarter of 2010. A new core merchandising system was developed and placed in service in the first quarter of 2012. The implementation of these systems is expected to have a pervasive impact on our information systems and across a significant portion of our general office operations, including merchandising, technology, and finance. If we are unable to successfully complete the transition to SAP
®
for Retail, it may have an adverse effect on our capital resources, financial condition, results of operations, and liquidity.
If we are unable to retain existing and secure suitable new store locations under favorable lease terms, our financial performance may be negatively affected.
We lease almost all of our stores and a significant number of these leases expire or are up for renewal each year, as noted below in “Item 2. Properties” to this Form 10-K. Our strategy to improve our financial performance includes sales growth while managing the occupancy cost of each of our stores. A significant component of our sales growth strategy is to open new store locations. If the commercial real estate market tightens and we are not able to negotiate favorable new store leases and lease renewals, our financial position, results of operations, and liquidity may be negatively affected.
11
If we are unable to attract, train and retain highly qualified associates while also controlling our labor costs, our financial performance may be negatively affected.
Our customers expect a positive shopping experience, which is driven by a high level of customer service from our associates and a quality presentation of our merchandise. To meet the needs and expectations of our customers, we must attract, train and retain a large and growing number of highly qualified associates, as we continue to grow our operations, while at the same time control labor costs. We compete with other retail businesses for many of our associates in hourly and part-time positions. These positions have historically had high turnover rates, which can lead to increased training and retention costs. In addition, our ability to control labor costs is subject to numerous external factors, including prevailing wage rates, the impact of legislation or regulations governing labor relations or benefits, and health insurance costs.
If we lose key personnel, it may have a material adverse impact on our future results of operations.
We believe that we benefit substantially from the leadership and experience of our senior executives. The loss of services of any of these individuals could have a material adverse impact on our business. Competition for key personnel in the retail industry is intense and our future success will also depend on our ability to recruit, train, and retain our senior executives and other qualified personnel.
Changes in accounting guidance could significantly affect our results of operations and the presentation of those results.
Changes in accounting standards, including new interpretations and applications of accounting standards, may have adverse effects on our financial condition, results of operations, and liquidity. The governing accounting bodies, specifically the Financial Accounting Standards Board (“FASB”) and the International Accounting Standards Board (“IASB”), have proposed numerous significant changes to current accounting standards. This proposed new guidance could significantly change the presentation of financial information and results of operations. Additionally, the new guidance may require us to make systems and other changes that could increase our operating costs. Specifically, implementing future accounting guidance related to leases and other areas impacted by the current convergence project between the FASB and IASB could require us to make significant changes to our lease management system or other accounting systems.
If we are unable to secure customer, employee, and company data, our reputation could be damaged and we could be subject to penalties or lawsuits.
The protection of our customer, employee, and company data is critical to us. The regulatory environment surrounding information security and privacy is increasingly demanding, with frequent imposition of new and constantly changing requirements across our business. In addition, our customers have a high expectation that we will adequately protect their personal information. A significant breach of customer, employee, or company data could damage our reputation and result in lost sales, fines, and/or lawsuits.
The price of our common shares as traded on the New York Stock Exchange may be volatile.
Our stock price may fluctuate substantially as a result of factors beyond our control, including but not limited to, general economic and stock market conditions, risks relating to our business and industry as discussed above, strategic actions by us or our competitors, variations in our quarterly operating performance, our future sales or purchases of our common shares, and investor perceptions of the investment opportunity associated with our common shares relative to other investment alternatives.
The bankruptcy of our formerly owned KB Toys business may adversely affect our financial performance.
In December 2000, we sold the KB Toys business to KB Acquisition Corporation. On January 14, 2004, KB Acquisition Corporation and certain affiliated entities (collectively “KB-I”) filed for bankruptcy protection pursuant to Chapter 11 of title 11 of the United States Code. On August 30, 2005, in connection with the acquisition by an affiliate of Prentice Capital Management of majority ownership of KB-I, KB-I emerged from their January 14, 2004 bankruptcy (the KB Toys business that emerged from bankruptcy is hereinafter referred to as “KB-II”). On December 11, 2008, KB-II filed for bankruptcy protection pursuant to Chapter 11 of title 11 of the United States Code. Based on information we have received subsequent to the December 11, 2008 bankruptcy filing, we believe we still may have indemnification and guarantee obligations (“KB-II Bankruptcy Lease Obligations”) with respect to 29 KB Toys store leases and a lease for a former KB corporate office. Because of uncertainty inherent in the assumptions used to estimate this liability, our estimated liability could ultimately prove to be understated and could result in a material adverse impact on our financial condition, results of operations, and liquidity. For additional information regarding the KB Toys bankruptcies, see note 13 to the accompanying consolidated financial statements.
12
We also may be subject to a number of other factors which may, individually or in the aggregate, materially or adversely affect our business. These factors include, but are not limited to:
|
•
|
Changes in governmental laws and regulations;
|
|
•
|
Events or circumstances could occur which could create bad publicity for us or for types of merchandise offered in our stores which may negatively impact our business results including sales;
|
|
•
|
Infringement of our intellectual property, including the Big Lots trademarks, could dilute our value;
|
|
•
|
Our ability to establish effective advertising, marketing, and promotional programs; and
|
|
•
|
Other risks described from time to time in our filings with the SEC.
|
None.
Retail Operations
All of our stores are located in North America, predominantly in strip shopping centers, and have an average store size of approximately 29,900 square feet, of which an average of 21,600 square feet is selling square feet. The average cost to open a new store in a leased facility during 2011 was approximately $1.2 million, including cost of inventory. Except for 54 owned sites in our U.S. segment, all of our stores are leased. In 2011, we acquired one store property for $2.5 million. The associated store has not yet opened for operation, and therefore is excluded from our store counts at January 28, 2012. The 54 owned stores are located in the following states:
|
State
|
Stores Owned
|
|
|
Arizona
|
3
|
|
|
California
|
39
|
|
|
Colorado
|
3
|
|
|
Florida
|
2
|
|
|
Louisiana
|
1
|
|
|
New Mexico
|
2
|
|
|
Ohio
|
1
|
|
|
Texas
|
3
|
|
|
Total
|
54
|
|
Store leases generally obligate us for fixed monthly rental payments plus the payment, in most cases, of our applicable portion of real estate taxes, common area maintenance costs (“CAM”), and property insurance. Some leases require the payment of a percentage of sales in addition to minimum rent. Such payments generally are required only when sales exceed a specified level. Our typical store lease is for an initial minimum term of five to ten years with multiple five-year renewal options.
Eighty store leases have sales termination clauses which can result in our exiting a location at our option if certain sales volume results are not achieved.
13
The following table summarizes the number of store lease expirations in each of the next five fiscal years and the total thereafter. In addition, as stated above, many of our store leases have renewal options. The table also includes the number of leases that are scheduled to expire each year that do not have a renewal option. The information includes stores with more than one lease and leases for stores not yet open. It excludes 15 month-to-month leases and 54 owned locations.
|
Fiscal Year:
|
Expiring Leases
|
Leases Without Options
|
||
|
2012
|
247
|
|
39
|
|
|
2013
|
303
|
|
41
|
|
|
2014
|
287
|
|
31
|
|
|
2015
|
229
|
|
27
|
|
|
2016
|
241
|
|
35
|
|
|
Thereafter
|
208
|
|
8
|
|
Warehouse and Distribution
At January 28, 2012, we owned or leased approximately
9.4 million
square feet of distribution center and warehouse space. We own and operate five regional distribution centers strategically placed across the United States in Ohio, California, Alabama, Oklahoma, and Pennsylvania. We lease and operate two regional distribution centers in Canada located in British Columbia and Ontario. The regional distribution centers in our U.S. segment utilize warehouse management technology, which enables high accuracy and efficient processing of merchandise from vendors to our retail stores. The combined output of our regional distribution centers was approximately 2.7 million cartons per week in 2011. Certain vendors deliver merchandise directly to our stores when it supports our operational goal to move merchandise from our vendors to the sales floor in the most efficient manner.
The number of owned and leased distribution centers and warehouse space and the corresponding square footage of the facilities by state and province at January 28, 2012, were as follows:
|
Square Footage
|
||||||
|
State / Province
|
Owned
|
Leased
|
Total
|
Owned
|
Leased
|
Total
|
|
(Square footage in thousands)
|
||||||
|
U.S. segment:
|
||||||
|
Ohio
|
1
|
—
|
1
|
3,559
|
—
|
3,559
|
|
California
|
1
|
—
|
1
|
1,423
|
—
|
1,423
|
|
Alabama
|
1
|
—
|
1
|
1,411
|
—
|
1,411
|
|
Oklahoma
|
1
|
—
|
1
|
1,297
|
—
|
1,297
|
|
Pennsylvania
|
1
|
—
|
1
|
1,295
|
—
|
1,295
|
|
Sub-total
|
5
|
—
|
5
|
8,985
|
—
|
8,985
|
|
Canadian segment:
|
||||||
|
British Columbia
|
—
|
1
|
1
|
—
|
105
|
105
|
|
Ontario
|
—
|
1
|
1
|
—
|
261
|
261
|
|
Sub-total
|
—
|
2
|
2
|
—
|
366
|
366
|
|
Total
|
5
|
2
|
7
|
8,985
|
366
|
9,351
|
Corporate Offices
We own the facility in Columbus, Ohio that serves as our general office for our U.S. associates. We lease the facility in Brantford, Ontario that serves as our general office for Big Lots Canada.
14
No response is required under Item 103 of Regulation S-K. For a discussion of certain litigated matters, s
ee note 10 to
the accompanying consolidated financial statements.
None.
Supplemental Item. Executive Officers of the Registrant
Our executive officers at
January 28, 2012
were as follows:
|
Name
|
Age
|
Offices Held
|
Officer Since
|
|
Steven S. Fishman
|
60
|
Chairman, Chief Executive Officer and President
|
2005
|
|
Lisa M. Bachmann
|
50
|
Executive Vice President, Supply Chain Management and Chief Information Officer
|
2002
|
|
Joe R. Cooper
|
54
|
Executive Vice President and Chief Financial Officer; President of Big Lots Canada, Inc.
|
2000
|
|
Charles W. Haubiel II
|
46
|
Executive Vice President, Legal and Real Estate, General Counsel and Corporate Secretary
|
1999
|
|
John C. Martin
|
61
|
Executive Vice President, Administration
|
2003
|
|
Douglas N. Wurl
|
50
|
Executive Vice President, Merchandising
|
2011
|
|
Robert C. Claxton
|
57
|
Senior Vice President, Marketing
|
2005
|
|
Timothy A. Johnson
|
44
|
Senior Vice President, Finance
|
2004
|
|
Norman J. Rankin
|
55
|
Senior Vice President, Big Lots Capital and Wholesale
|
1998
|
|
Robert S. Segal
|
57
|
Senior Vice President, General Merchandise Manager
|
2005
|
|
Steven R. Smart
|
52
|
Senior Vice President, General Merchandise Manager
|
2003
|
|
Paul A. Schroeder
|
46
|
Vice President, Controller
|
2005
|
Steven S. Fishman
became Chairman, Chief Executive Officer and President in July 2005. Before joining us, Mr. Fishman was President, Chief Executive Officer and Chief Restructuring Officer of Rhodes, Inc., a furniture retailer which filed for bankruptcy on November 4, 2004; Chairman and Chief Executive Officer of Frank's Nursery & Crafts, Inc., a lawn and garden specialty retailer which filed for bankruptcy on September 8, 2004; and President and Founder of SSF Resources, Inc., an investment and consulting firm.
Lisa M. Bachmann
is responsible for information technology, merchandise planning and allocation, and distribution and transportation services. Ms. Bachmann was promoted to Executive Vice President in March 2010, and assumed responsibility for distribution and transportation services. Ms. Bachman assumed the responsibility for information technology in August 2005. Ms. Bachman joined us as Senior Vice President of Merchandise Planning, Allocation and Presentation in March 2002. Prior to joining us, Ms. Bachmann was Senior Vice President of Planning and Allocation of Ames Department Stores, Inc., a discount retailer.
Joe R. Cooper
is responsible for our Canadian operations and our treasury, tax, investor relations, loss prevention and risk management, as well as the reporting, planning, and control functions of the business. Mr. Cooper was appointed President of Big Lots Canada, Inc. in July 2011. Mr. Cooper was promoted to Executive Vice President in March 2010, and assumed responsibility for loss prevention and risk management. Prior to that Mr. Cooper was promoted to Senior Vice President and Chief Financial Officer in February 2004. Mr. Cooper joined us as Vice President of Strategic Planning and Investor Relations in May 2000. In July 2000, he assumed responsibility for the treasury department and was appointed Vice President, Treasurer.
Charles W. Haubiel II
is responsible for legal and real estate affairs. He was promoted to Executive Vice President in March 2010 and assumed responsibility for real estate in January 2008. Prior to that, Mr. Haubiel was promoted to Senior Vice President, General Counsel and Corporate Secretary in November 2004. Mr. Haubiel joined us in 1997 as Senior Staff Counsel and was promoted to Director, Corporate Counsel and Assistant Secretary in 1999, and to Vice President, General Counsel and Corporate Secretary in 2000.
15
John C. Martin
is responsible for store operations and human resources. Mr. Martin assumed his current position of Executive Vice President, Administration in April 2011. Prior to that Mr. Martin was Executive Vice President, Merchandising, where he was responsible for merchandising. Prior to joining us in 2003, Mr. Martin was President of Garden Ridge Corporation, an arts and crafts retailer which filed for bankruptcy on February 2, 2004. Mr. Martin also served as President and Chief Operating Officer of Michaels Stores, Inc., an arts and crafts retailer, and President, Retail Stores Division of OfficeMax Incorporated, an office supply retailer.
Douglas N. Wurl
is responsible for merchandising. Mr. Wurl joined us in April of 2011. Prior to joining us, Mr. Wurl was the Vice President, General Merchandise Manager, Business Unit President, SHC Home Division at Sears Holding Corporation, a retailer. Mr. Wurl also served as Senior Vice President, General Merchandise Manager at Shopko Operating Co., LLC, a discount retailer.
Robert C. Claxton
is responsible for marketing, merchandise presentation, and sales promotion. Prior to joining us in 2005, Mr. Claxton served as General Manager and Executive Vice President of Initiative Media, an advertising and communications company, and Chief Marketing Officer and Senior Vice President of Montgomery Ward, a retailer.
Timothy A. Johnson
is responsible for accounting and financial control, tax, internal audit, financial planning and analysis, and investor relations. Mr. Johnson was promoted to Senior Vice President, Finance in July 2011. Prior to that Mr. Johnson was promoted to Vice President, Strategic Planning and Investor Relations in February 2004. He joined us in 2000 as Director of Strategic Planning.
Norman J. Rankin
is responsible for alternative product sourcing and wholesale operations. He assumed his current role in January 2008, after serving as Senior Vice President, General Merchandise Manager with responsibility for consumables and hardware. Mr. Rankin joined us in 1998 as Vice President, Consumables upon our merger with Mac Frugal's Bargains Close-outs, Inc., a discount retailer. In 1999, Mr. Rankin was promoted to Senior Vice President.
Robert S. Segal
is responsible for merchandising in the furniture, home, and seasonal categories. Mr. Segal joined us in 2004 as Vice President, Divisional Merchandise Manager, Furniture, and was promoted to Senior Vice President, General Merchandise Manager for the furniture and home categories in January 2008. He assumed responsibility for the seasonal category in March 2010. Prior to joining us, Mr. Segal served as Divisional Vice President, Housewares and Home of Shopko Operating Co., LLC, a discount retailer, from 1995 to 2004.
Steven R. Smart
is responsible for merchandising in the consumables, play n' wear and hardlines & other categories. Mr. Smart joined us in May 2003 as Vice President, Divisional Merchandise Manager, Consumables and was promoted to his current role in March 2010. Prior to joining us, Mr. Smart served as Senior Vice President, Retail of Fleming, a wholesaler, which filed for bankruptcy in 2003.
Paul A. Schroeder
is responsible for internal and external financial reporting and accounting operations including payroll, accounts payable, and inventory control. Mr. Schroeder joined us as Director, Accounting Operations in April 2005, and was promoted to Vice President, Controller in September 2005. Prior to joining us, Mr. Schroeder was Director of Finance of American Signature, Inc., a furniture retailer, and held various finance positions with Limited Brands, Inc., a retailer.
16
|
Item 5.
|
Market for Registrant's Common Equity, Related Stockholder Matters and Issuer Purchases of Equity Securities
|
Our common shares are listed on the New York Stock Exchange (“NYSE”) under the symbol “BIG.” The following table reflects the high and low sales prices per common share for our common shares as reported on the NYSE composite tape for the fiscal periods indicated:
|
2011
|
2010
|
||||||||||||||
|
High
|
Low
|
High
|
Low
|
||||||||||||
|
First Quarter
|
$
|
44.44
|
|
$
|
31.57
|
|
$
|
41.42
|
|
$
|
28.51
|
|
|||
|
Second Quarter
|
41.42
|
|
30.83
|
|
38.92
|
|
31.27
|
|
|||||||
|
Third Quarter
|
38.91
|
|
28.89
|
|
35.25
|
|
30.02
|
|
|||||||
|
Fourth Quarter
|
$
|
41.81
|
|
$
|
35.65
|
|
$
|
32.78
|
|
$
|
27.82
|
|
|||
Our Board of Directors historically has authorized reinvesting available cash in capital expenditures for growth opportunities, improving the Company's information systems, and maintaining our assets. After making such investments, the Company has utilized its excess cash for share repurchase programs. We historically have not paid dividends and our Board of Directors is not currently considering any change in this policy. In the event that we change our policy, any future cash dividend payments would be determined by our Board of Directors taking into account business conditions then existing, including our earnings, financial requirements and condition, opportunities for reinvesting cash, and other factors.
On December 4, 2009, our Board of Directors authorized a share repurchase program providing for the repurchase of up to $150.0 million of our common shares. On March 2, 2010, our Board of Directors authorized a $250.0 million increase to our repurchase program bringing the total authorization to $400.0 million (collectively the “2010 Repurchase Program”). On May 25, 2011, our Board of Directors authorized a share repurchase program providing for the repurchase of up to $400.0 million of our common shares ("2011 Repurchase Program"). During the 2011, we purchased
11.0 million
common shares having an aggregate cost of
$359.3 million
with a volume weighted average price paid per share of
$32.79
. As a result of the repurchases during 2011, the 2010 Repurchase Program was exhausted.
Our remaining repurchase authorization under the 2011 Repurchase Program was approximately
$98.5 million
at
January 28, 2012
, and is available to be utilized to repurchase shares in the open market and/or in privately negotiated transactions at our discretion, subject to market conditions and other factors.
The repurchased common shares were placed into treasury and may be used for general corporate purposes including the issuance of shares related to equity compensation plans.
The following table sets forth information regarding our repurchase of our common shares during the fourth fiscal quarter of
2011
:
|
(In thousands, except price per share data)
|
|||||||||||
|
Period
|
(a) Total Number of Shares Purchased
|
(b) Average Price Paid per Share
|
(c) Total Number of Shares Purchased as Part of Publicly Announced Plans or Programs
|
(d) Approximate Dollar Value of Shares that May Yet Be Purchased Under the Plans or Programs
|
|||||||
|
October 30, 2011 - November 26, 2011
|
—
|
|
$
|
—
|
|
—
|
|
$
|
144,737
|
|
|
|
November 27, 2011 - December 24, 2011
|
1,257
|
|
36.79
|
|
1,257
|
|
98,501
|
|
|||
|
December 25, 2011 - January 28, 2012
|
—
|
|
|
—
|
|
—
|
|
98,501
|
|
||
|
Total
|
1,257
|
|
$
|
36.79
|
|
1,257
|
|
$
|
98,501
|
|
|
17
At the close of trading on the NYSE on March 21,
2012
, there were approximately 940 registered holders of record of our common shares.
The following graph and table compares, for the five fiscal years ended
January 28, 2012
, the cumulative total shareholder return for our common shares, the S&P 500 Index, and the S&P 500 Retailing Index. Measurement points are the last trading day of each of our fiscal years ended
February 2, 2008
,
January 31, 2009
,
January 30, 2010
,
January 29, 2011
and
January 28, 2012
. The graph and table assume that $100 was invested on
February 3, 2007
, in each of our common shares, the S&P 500 Index, and the S&P 500 Retailing Index and reinvestment of any dividends. The stock price performance on the following graph and table is not necessarily indicative of future stock price performance.
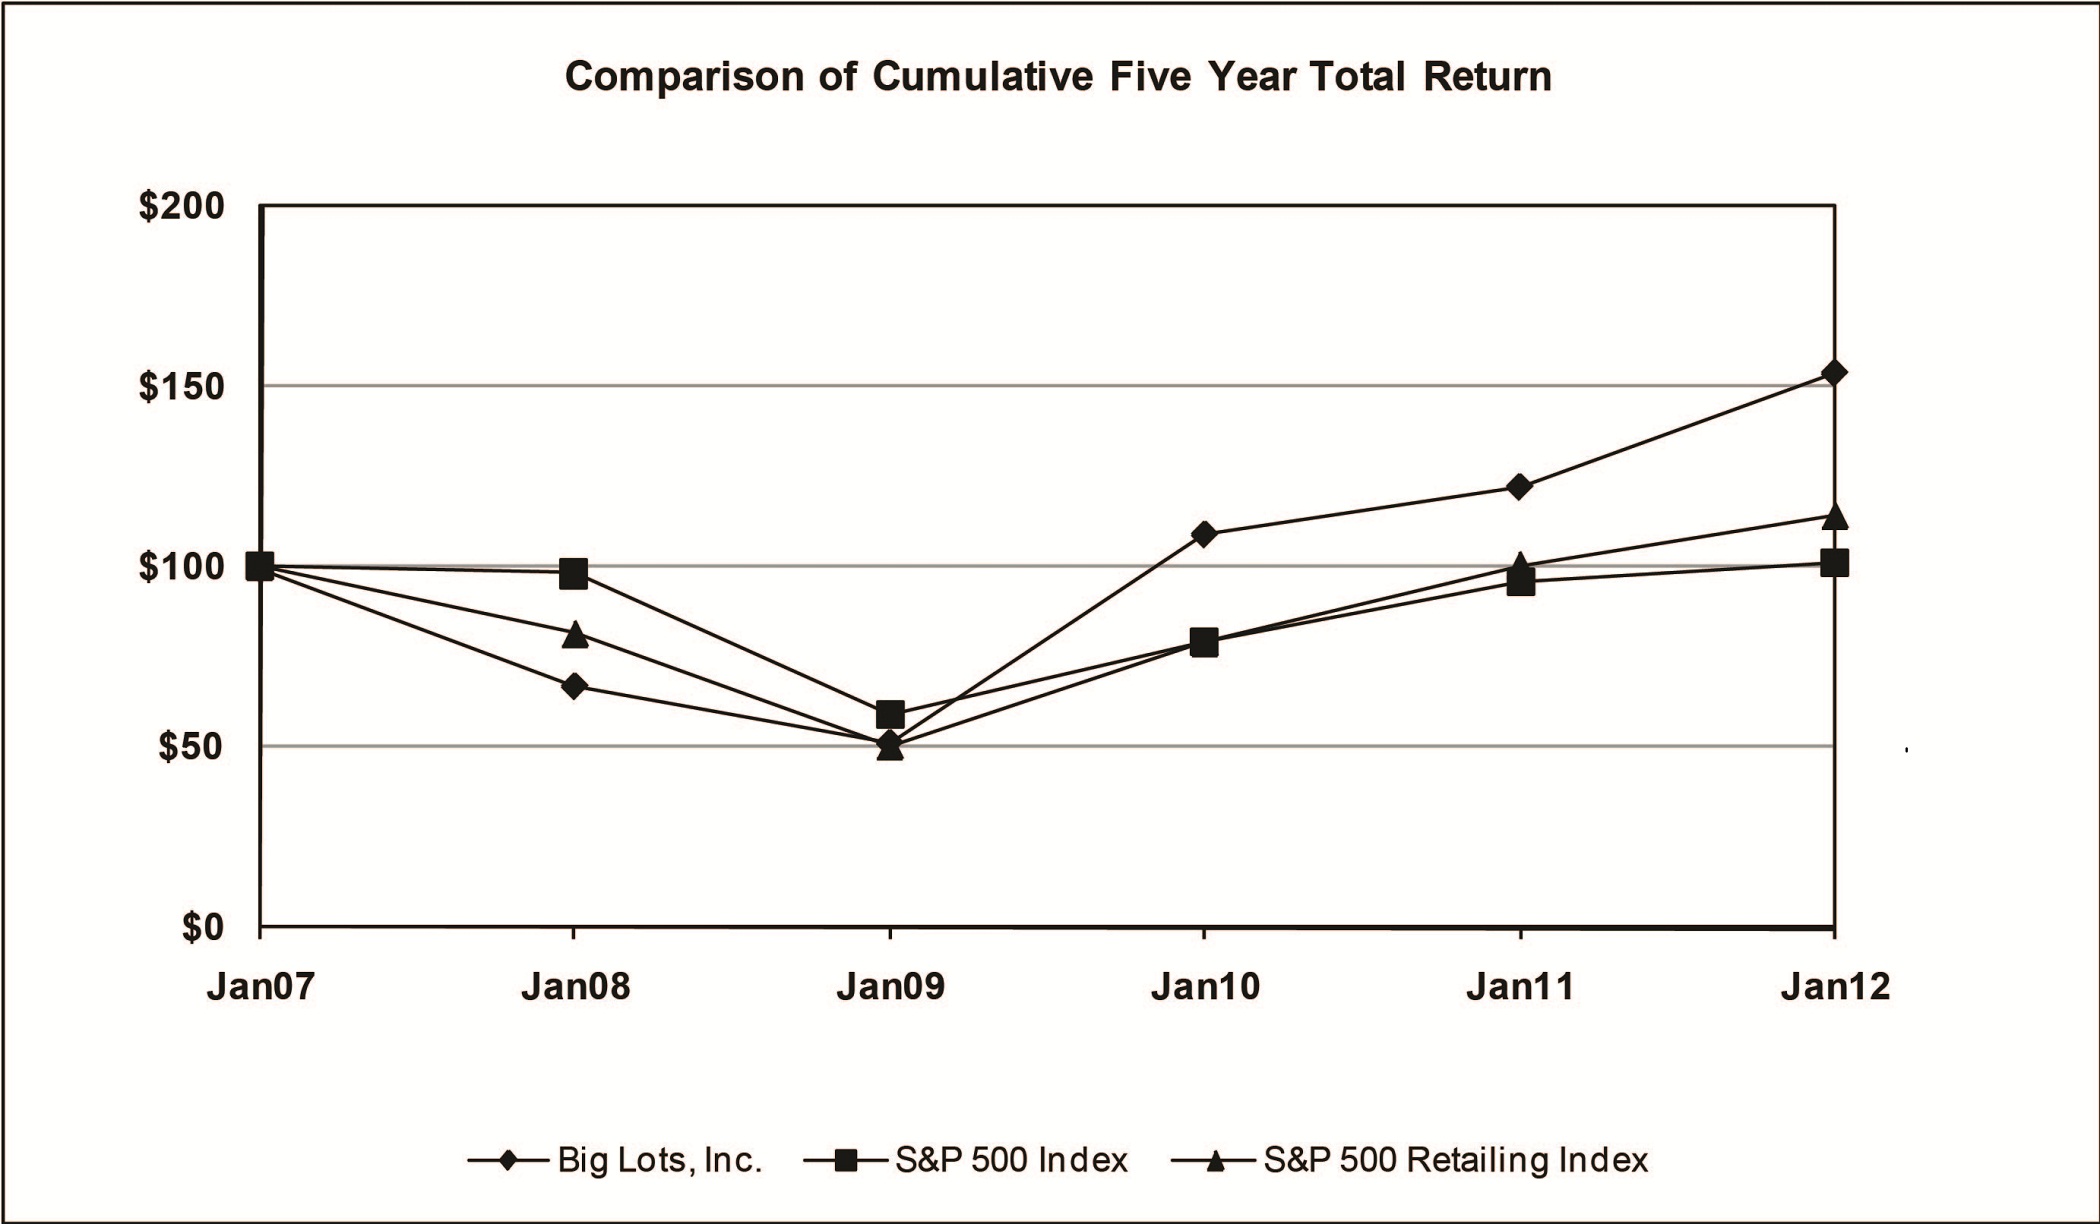
|
Indexed Returns
|
||||||||||||||||||
|
Years Ended
|
||||||||||||||||||
|
Base
|
||||||||||||||||||
|
Period
|
||||||||||||||||||
|
January
|
January
|
January
|
January
|
January
|
January
|
|||||||||||||
|
Company / Index
|
2007
|
2008
|
2009
|
2010
|
2011
|
2012
|
||||||||||||
|
Big Lots, Inc.
|
$
|
100.00
|
|
$
|
67.35
|
|
$
|
51.73
|
|
$
|
109.27
|
|
$
|
122.38
|
|
$
|
153.85
|
|
|
S&P 500 Index
|
100.00
|
|
98.20
|
|
59.54
|
|
79.27
|
|
96.12
|
|
101.24
|
|
||||||
|
S&P 500 Retailing Index
|
$
|
100.00
|
|
$
|
81.62
|
|
$
|
50.84
|
|
$
|
79.07
|
|
$
|
100.55
|
|
$
|
114.05
|
|
18
The following statements of operations and balance sheet data have been derived from our consolidated financial statements and should be read in conjunction with MD&A and the consolidated financial statements and related notes included herein.
|
Fiscal Year
(a)
|
|||||||||||||||
|
2011
(e)
|
2010
|
2009
|
2008
(b)
|
2007
(c)
|
|||||||||||
|
(In thousands, except per share amounts and store counts)
|
|||||||||||||||
|
Net sales
|
$
|
5,202,269
|
|
$
|
4,952,244
|
|
$
|
4,726,772
|
|
$
|
4,645,283
|
|
$
|
4,656,302
|
|
|
Cost of sales (exclusive of depreciation expense shown separately below)
|
3,131,862
|
|
2,939,793
|
|
2,807,466
|
|
2,787,854
|
|
2,815,959
|
|
|||||
|
Gross margin
|
2,070,407
|
|
2,012,451
|
|
1,919,306
|
|
1,857,429
|
|
1,840,343
|
|
|||||
|
Selling and administrative expenses
|
1,634,532
|
|
1,576,500
|
|
1,532,356
|
|
1,523,882
|
|
1,515,379
|
|
|||||
|
Depreciation expense
|
90,280
|
|
78,606
|
|
74,904
|
|
78,624
|
|
88,484
|
|
|||||
|
Gain on sale of real estate
|
—
|
|
—
|
|
(12,964
|
)
|
—
|
|
—
|
|
|||||
|
Operating profit
|
345,595
|
|
357,345
|
|
325,010
|
|
254,923
|
|
236,480
|
|
|||||
|
Interest expense
|
(3,530
|
)
|
(2,573
|
)
|
(1,840
|
)
|
(5,282
|
)
|
(2,513
|
)
|
|||||
|
Other income (expense)
|
(173
|
)
|
612
|
|
175
|
|
65
|
|
5,236
|
|
|||||
|
Income from continuing operations before income taxes
|
341,892
|
|
355,384
|
|
323,345
|
|
249,706
|
|
239,203
|
|
|||||
|
Income tax expense
|
134,657
|
|
132,837
|
|
121,975
|
|
94,908
|
|
88,023
|
|
|||||
|
Income from continuing operations
|
207,235
|
|
222,547
|
|
201,370
|
|
154,798
|
|
151,180
|
|
|||||
|
Income (loss) from discontinued operations, net of tax
|
(171
|
)
|
(23
|
)
|
(1,001
|
)
|
(3,251
|
)
|
7,281
|
|
|||||
|
Net income
|
$
|
207,064
|
|
$
|
222,524
|
|
$
|
200,369
|
|
$
|
151,547
|
|
$
|
158,461
|
|
|
Earnings per common share - basic:
|
|||||||||||||||
|
Continuing operations
|
$
|
3.03
|
|
$
|
2.87
|
|
$
|
2.47
|
|
$
|
1.91
|
|
$
|
1.49
|
|
|
Discontinued operations
|
—
|
|
—
|
|
(0.01
|
)
|
(0.04
|
)
|
0.07
|
|
|||||
|
$
|
3.03
|
|
$
|
2.87
|
|
$
|
2.45
|
|
$
|
1.87
|
|
$
|
1.56
|
|
|
|
Earnings per common share - diluted:
|
|
||||||||||||||
|
Continuing operations
|
$
|
2.99
|
|
$
|
2.83
|
|
$
|
2.44
|
|
$
|
1.89
|
|
$
|
1.47
|
|
|
Discontinued operations
|
—
|
|
—
|
|
(0.01
|
)
|
(0.04
|
)
|
0.07
|
|
|||||
|
$
|
2.98
|
|
$
|
2.83
|
|
$
|
2.42
|
|
$
|
1.85
|
|
$
|
1.55
|
|
|
|
Weighted-average common shares outstanding:
|
|||||||||||||||
|
Basic
|
68,316
|
|
77,596
|
|
81,619
|
|
81,111
|
|
101,393
|
|
|||||
|
Diluted
|
69,419
|
|
78,581
|
|
82,681
|
|
82,076
|
|
102,542
|
|
|||||
|
Balance sheet data:
|
|||||||||||||||
|
Total assets
|
$
|
1,641,310
|
|
$
|
1,619,599
|
|
$
|
1,669,493
|
|
$
|
1,432,458
|
|
$
|
1,443,815
|
|
|
Working capital
(d)
|
421,836
|
|
509,788
|
|
580,446
|
|
355,776
|
|
390,766
|
|
|||||
|
Cash and cash equivalents
|
68,547
|
|
177,539
|
|
283,733
|
|
34,773
|
|
37,131
|
|
|||||
|
Long-term obligations under bank credit facility
|
65,900
|
|
—
|
|
—
|
|
—
|
|
163,700
|
|
|||||
|
Shareholders’ equity
|
$
|
823,233
|
|
$
|
946,793
|
|
$
|
1,001,412
|
|
$
|
774,845
|
|
$
|
638,486
|
|
|
Cash flow data:
|
|||||||||||||||
|
Cash provided by operating activities
|
$
|
318,471
|
|
$
|
315,257
|
|
$
|
392,026
|
|
$
|
211,063
|
|
$
|
307,932
|
|
|
Cash used in investing activities
|
$
|
(120,712
|
)
|
$
|
(114,552
|
)
|
$
|
(77,937
|
)
|
$
|
(88,192
|
)
|
$
|
(58,764
|
)
|
|
Store data:
|
|||||||||||||||
|
Total gross square footage
|
45,780
|
|
42,037
|
|
40,591
|
|
39,888
|
|
40,195
|
|
|||||
|
Total selling square footage
|
33,119
|
|
30,210
|
|
29,176
|
|
28,674
|
|
28,902
|
|
|||||
|
Stores opened during the fiscal year
|
92
|
|
80
|
|
52
|
|
21
|
|
7
|
|
|||||
|
Stores acquired during the fiscal year
|
89
|
|
—
|
|
—
|
|
—
|
|
—
|
|
|||||
|
Stores closed during the fiscal year
|
(46
|
)
|
(43
|
)
|
(30
|
)
|
(35
|
)
|
(29
|
)
|
|||||
|
Stores open at end of the fiscal year
|
1,533
|
|
1,398
|
|
1,361
|
|
1,339
|
|
1,353
|
|
|||||
19
|
(a)
|
All periods presented are comprised of 52 weeks.
|
|
(b)
|
We adopted the measurement date provisions of guidance under Financial Accounting Standards Board Accounting Standards Codification (“ASC”) 715-30-35,
Defined Benefit Plans-Pension
(Statement of Financial Accounting Standard (“SFAS”) No. 158,
Employers' Accounting for Defined Benefit Pension and Other Postretirement Plans)
in 2008, which resulted in an adjustment to accumulated other comprehensive loss of $66 ($40 net of tax).
|
|
(c)
|
We adopted guidance under ASC 740,
Income Taxes
(FIN No. 48,
Accounting for Uncertainty in Income Taxes an interpretation of SFAS No. 109),
in the first fiscal quarter of 2007, on a prospective basis.
|
|
(d)
|
For 2008, working capital included $61.7 million for current maturities under bank credit facility because the 2004 Credit Agreement terminated in 2009.
|
|
(e)
|
On July 18, 2011, the Company completed its acquisition of Liquidation World Inc., whose results are included in the consolidated results since that date.
|
Overview
The discussion and analysis presented below should be read in conjunction with the accompanying consolidated financial statements and related notes. Please refer to “Item 1A. Risk Factors” of this Form 10-K for a discussion of forward-looking statements and certain risk factors that may have a material adverse effect on our business, financial condition, results of operations, and/or liquidity.
Our fiscal year ends on the Saturday nearest to January 31, which results in some fiscal years with 52 weeks and some with 53 weeks. Fiscal years
2011
,
2010
, and
2009
were each comprised of 52 weeks. Fiscal year 2012 will be comprised of 53 weeks.
Operating Results Summary
The following are the results from
2011
that we believe are key indicators of both our consolidated and segment operating performance when compared to
2010
.
Consolidated Highlights
|
•
|
Net sales increased $250.0 million, or 5.0%.
|
|
•
|
Diluted earnings per share from continuing operations increased from $2.83 per share to $2.99 per share.
|
|
•
|
Inventory increased by 8.3%, or $63.1 million, to $825.2 million from
2010
.
|
|
•
|
We acquired Liquidation World Inc.
|
|
•
|
We acquired 11.0 million of our outstanding common shares for $359.3 million under the 2011 Repurchase Program.
|
U.S. Segment Highlights
|
•
|
Comparable store sales for stores open at least two years at the beginning of
2011
increased 0.1%.
|
|
•
|
Gross margin dollars increased $33.6 million, while gross margin rate decreased 80 basis points from 40.6% to 39.8% of sales.
|
|
•
|
Selling and administrative expenses increased $23.3 million. As a percentage of net sales, selling and administrative expenses improved by decreasing 70 basis points to 31.1% of sales.
|
|
•
|
Operating profit rate decreased 20 basis points to 7.0%.
|
Canadian Segment Highlights
|
•
|
Net sales from the date of acquisition (July 18, 2012) through January 28, 2012 were $62.1 million.
|
|
•
|
Operating loss was $12.2 million.
|
20
The following table compares components of our consolidated statements of operations as a percentage of net sales:
|
2011
|
2010
|
2009
|
||||
|
Net sales
|
100.0
|
%
|
100.0
|
%
|
100.0
|
%
|
|
Cost of sales (exclusive of depreciation expense shown separately below)
|
60.2
|
|
59.4
|
|
59.4
|
|
|
Gross margin
|
39.8
|
|
40.6
|
|
40.6
|
|
|
Selling and administrative expenses
|
31.4
|
|
31.8
|
|
32.4
|
|
|
Depreciation expense
|
1.7
|
|
1.6
|
|
1.6
|
|
|
Gain on sale of real estate
|
0.0
|
|
0.0
|
|
(0.3
|
)
|
|
Operating profit
|
6.6
|
|
7.2
|
|
6.9
|
|
|
Interest expense
|
(0.1
|
)
|
(0.1
|
)
|
(0.0
|
)
|
|
Other income (expense)
|
(0.0
|
)
|
0.0
|
|
0.0
|
|
|
Income from continuing operations before income taxes
|
6.6
|
|
7.2
|
|
6.8
|
|
|
Income tax expense
|
2.6
|
|
2.7
|
|
2.6
|
|
|
Income from continuing operations
|
4.0
|
|
4.5
|
|
4.3
|
|
|
Loss from discontinued operations, net of tax
|
(0.0
|
)
|
(0.0
|
)
|
(0.0
|
)
|
|
Net income
|
4.0
|
%
|
4.5
|
%
|
4.2
|
%
|
See the discussion below under the captions “2011 Compared To 2010” and “2010 Compared To 2009” for additional details regarding the specific components of our operating results.
Selling and administrative expenses in 2009 were increased by $4.0 million (10 basis points), pretax, due to a legal settlement agreement. In addition, the sale in 2009 of a company-owned and operated store in California resulted in a pretax gain of $13.0 million (30 basis points).
Seasonality
As discussed in “Item 1. Business - Seasonality” of this Form 10-K, our financial results fluctuate from quarter to quarter depending on various factors such as timing of new or closed stores, timing and extent of advertisements and promotions, and timing of holidays. We expect the Christmas holiday selling season to continue to produce a significant portion of our sales and operating profits. If our sales performance is significantly better or worse during the Christmas holiday selling season, we would expect a more pronounced impact on our annual financial results than if our sales performance is significantly better or worse in a different season.
The following table sets forth the seasonality of net sales and operating profit for
2011
,
2010
, and
2009
by fiscal quarter:
|
First
|
Second
|
Third
|
Fourth
|
|||||
|
Fiscal Year 2011
|
||||||||
|
Net sales as a percentage of full year
|
23.6
|
%
|
22.4
|
%
|
21.9
|
%
|
32.1
|
%
|
|
Operating profit as a percentage of full year
|
25.0
|
|
17.3
|
|
2.6
|
|
55.1
|
|
|
Fiscal Year 2010
|
||||||||
|
Net sales as a percentage of full year
|
24.9
|
%
|
23.1
|
%
|
21.3
|
%
|
30.7
|
%
|
|
Operating profit as a percentage of full year
|
25.2
|
|
17.7
|
|
7.5
|
|
49.6
|
|
|
Fiscal Year 2009
|
||||||||
|
Net sales as a percentage of full year
|
24.1
|
%
|
23.0
|
%
|
21.9
|
%
|
31.0
|
%
|
|
Operating profit as a percentage of full year
|
18.5
|
|
14.7
|
|
14.6
|
|
52.2
|
|
21
Operating Strategy
In 2005, Mr. Fishman joined the Company as its Chief Executive Officer and introduced our current operating strategy, the What's Important Now Strategy (“WIN Strategy”). The WIN Strategy focuses on three key elements of our business: merchandising, real estate, and cost structure. The WIN Strategy was designed to increase the operating profit performance of our existing store base, which has occurred from 2007 to 2011. In 2009, driven by both the improvements in our store productivity and the softening of the commercial real estate market, we expanded our WIN Strategy to also include the pursuit of net new store growth. In 2011, our Board of Directors approved the purchase of Liquidation World Inc., a Canadian closeout retailer, with the expectation that the management team could implement the key elements of the WIN Strategy to turn around its performance. The acquisition was part of the net store growth component of the WIN Strategy. Over the past three years, we have generated approximately $1,026 million of cash of which approximately $316 million was reinvested in our business through capital expenditures or investments in our acquired subsidiary and $701 million was returned to shareholders through publicly announced share repurchase programs.
In 2012, we anticipate the key elements of the WIN Strategy will remain consistent, including the net store growth phase. We anticipate that the commercial real estate market will continue to provide us with real estate opportunities at prices that are appropriate for our financial model and return on capital requirements. Given the strength of our financial performance and the availability of real estate in markets we serve, we believe we will continue to open new stores.
In 2012, we anticipate:
|
•
|
Earnings per diluted share from continuing operations to be $3.35 to $3.45, including the expected impact of a non-cash, non-recurring charge of $0.05 per diluted share related to a change in accounting principle associated with the implementation of our new retail inventory systems in the U.S. during the first quarter of 2012.
|
|
•
|
Net sales increase in both the U.S. and Canada:
|
|
◦
|
U.S. comparable stores sales increase of 2% to 3% and an increase of 8% to 9% in total net sales in the U.S.
|
|
◦
|
Canada sales of $140 million to $150 million, a $78 million to $88 million increase from 2011, which was a partial year.
|
|
•
|
Opening 90 new stores and closing 45 stores, for net growth of 45 stores or 3%, in the U.S.
|
|
•
|
Cash provided by operating activities of approximately $330 million to $335 million less capital expenditures of approximately $130 million to $135 million resulting in approximately $200 million of cash available for further investment in our business.
|
|
•
|
The remaining $98.5 million of share purchase authorization under the 2011 Repurchase Program may be utilized in the open market and/or in privately negotiated transactions at our discretion, subject to market conditions and other factors.
|
The following sections provide additional discussion and analysis of our WIN Strategy with respect to merchandising, real estate, and cost structure in our U.S. segment and the testing and implementation of the WIN Strategy in our Canadian segment. The “2011 Compared To 2010” section below provides additional discussion and analysis of the impact of these strategies on our financial performance and the assumptions and expectations upon which we are basing our guidance for our future results.
U.S. Segment
Merchandising
From a merchandising perspective, our competitive positioning as the largest broadline closeout retailer in the U.S. affords us a strategic advantage when sourcing merchandise for our stores. We source our merchandise in three key ways:
|
•
|
Manufacturers and vendors have closeout merchandise for a number of different reasons including other retailers canceling orders, other retailers going out of business, marketing or packaging changes, a new product launch that has failed, and various other reasons. In these situations, we are able to source product at a discounted cost and offer significant value to our customers. We currently have thousands of vendor relationships for closeout inventory that have been developed over many years. We believe these relationships and the size and financial strength of our company limit the opportunities for other competitors to enter our retail segment.
|
22
|
•
|
For certain merchandise categories, there is not always an abundant supply of closeout inventory. In these situations, we may work with vendors to develop product, some of which is imported. Imports total approximately 25% to 30%
of our merchandise sales annually. Categories with the highest concentration of imports include Seasonal, Furniture, and to a lesser extent the Home category and the toys department.
|
|
•
|
Our merchandise mix also includes replenishable and private or captive label products. This type of merchandise is consistently available, and as a result, it can be offered in our stores on a regular basis. This merchandise has many of the same characteristics as our closeout merchandise but is reorderable upon demand. Our prices for replenishable and private or captive label products are generally positioned below our competition, but to a lesser extent than our closeout sourced merchandise.
|
We offer six major merchandise categories in our store: Consumables, Furniture, Home, Seasonal, Play 'n Wear, and Hardlines & Other. Consumables is the largest category at 30.6% of sales in 2011 and Hardlines & Other is the smallest category at 8.3% of sales in 2011. In the third quarter of 2011, we realigned our merchandise categories to be consistent with the realignment of our merchandising team and changes to our management reporting. Prior to the third quarter of 2011, we reported sales in the former Hardlines category and the former Other category. We moved the electronics department out of the former Hardlines category and repositioned it in the former Other category, which was renamed Play n' Wear. We also moved the results of certain large closeout deals that are typically acquired through our alternate product sourcing operations out of the former Other category and repositioned them in the former Hardlines category, which was renamed Hardlines & Other.
In recent years, our merchandising strategies to increase sales have been predominantly focused on increasing the average transaction value. We have employed two primary methods to accomplish this goal: (1) drive more units per transaction, and (2) grow the average item retail price by offering our customers better quality merchandise, better values, and more prominent brand name products. This approach is consistent with our customer research that suggests that our core customer recognizes quality and brands and is willing to pay a higher retail price, so long as the value or cost savings is significant compared to what other retailers are offering. This strategy has resulted in fewer cartons processed by our distribution centers and stores and has achieved positive comparable store sales on an annual basis.
While executing our WIN Strategy, we have made measurable progress towards our goals of growing sales per selling square foot (which increased from $146 per square foot in 2005 to $166 per square foot in 2011, for our U.S. segment) and increasing gross margin dollars (which increased from $1,732 million in 2005 to $2,046 million in 2011).
From a merchandising perspective, our goal in 2012 is to continue to provide extreme value, improved quality, and expand the presence of recognizable brand name merchandise in our stores. We expect our major merchandise categories will remain the same as in prior years but the percentage of business by category may fluctuate based on customer demand and the availability of compelling deals that we are able to acquire. Strategically, we anticipate that opportunities exist to continue to grow the basket through the same successful initiatives that benefited results over the last few years.
Our marketing efforts involve a mix of printed circulars, in-store marketing, television, email and online advertising. Much of our marketing is based on information that we have learned about our customers, principally through customer surveys and information gathered through our rewards program. Based on this information, we believe over 70% of our core customers come to our stores without a shopping list or without a specific item or brand in mind to purchase. We believe value dominates top of mind awareness as our customers look to us for savings. In 2011, we made investments to improve our in-store signage and merchandising displays, with a focus on our comparative pricing to competitors. We expect to continue to develop these efforts in 2012.
We continue to market to our Buzz Club members, by offering a free online membership and alerting them to new merchandise and offerings in our stores. In 2009, we launched our Buzz Club Rewards program, which is our first true loyalty card program. After enrolling in the Buzz Club Rewards program, the customer receives a loyalty card which may be presented and scanned at the register at time of purchase. After making the required number of qualifying purchases, the Buzz Club Rewards member earns a coupon on their account for a future discount in our stores. Additionally, members may receive marketing information and other targeted promotional materials.
23
From a marketing perspective in 2012, there are four primary programs designed to continue to grow sales:
|
•
|
First, using our printed advertising circulars and promotional pricing to create excitement surrounding the deals that we offer. The excitement created by such deals is predominantly achieved through price but the uniqueness of an item may also be a factor.
|
|
•
|
Second, through the use of television commercials displayed nationwide on both national and cable networks, we will promote our brand and, from time to time, promote items or special discounts in our stores.
|
|
•
|
Next, our signage initiatives that focus on value and extreme price savings are designed to continue our effort to reinforce our niche in low everyday price retailing.
|
|
•
|
Finally, the use of our Buzz Club Rewards program is a key driver to furthering our focus on our core shoppers and expanding our customer base. We believe we are gaining insights about communication with this customer segment and will increase our digital communication in 2012 through weekend specials or shop early offers to enjoy early discounts. Additionally, we continue to pursue new customer sign-ups at our stores in order to grow our base of members. At January 28, 2012, our Buzz Club Rewards program membership totaled 11.5 million members.
|
From a store operations perspective, we began the company-wide rollout of our “Ready for Business” program in 2009. The program focuses primarily on servicing our customers and creating operational efficiencies, based on certain performance criteria and standards centered on improving the consistency of visual presentation, merchandise recovery efforts, and overall store cleanliness. “Ready for Business” also focuses on development of our field management team and improving our training programs, which is key to our store growth strategy. As we continue to expand the number of our stores, we have been working to develop the depth of our field management team in order to internally promote and provide opportunities to qualified internal candidates who have a strong understanding of our business model. We believe our focus on standards and investments made in talent development have improved the performance of our new stores during their initial months of operation.
In 2012, we have three significant training and development programs, which are either new or being tested, designed to identify and develop the management ranks within our store operations at all levels: assistant store manager, store manager, and district manager. We will continue to refine our “Ready for Business” standards through streamlining our communications, monitoring our field management span of control, and continuing to review our store layouts in order to enhance our customer service levels.
Real Estate
We strategically chose to enter a store growth phase in 2009, as a result of improvements in our store productivity, increased profitability at a consolidated level as a result of the WIN Strategy and the softening of the real estate market. Since the beginning of 2009, we have opened 224 new stores, and closed 112 stores, which has resulted in a net increase of 112 stores, or 8%. The majority of our store openings were what we refer to as traditional stores, meaning stores in secondary locations and primarily in retail strip centers. In 2009, we began a new initiative that we refer to as “A” locations, which are stores with a higher occupancy cost, but that are generally located in the one of the best retail centers within a given market with either a better co-tenant mix, better income demographics, or both. We had 66 "A" locations in operation at January 28, 2012.
In 2012, we plan to continue our store growth efforts by maintaining the level of new store openings at approximately 90 new stores and closing approximately 45 stores, or a 3% increase to the current store base. We anticipate approximately 70 to 75 of our store openings this year will be traditional stores and approximately 15 to 20 of our store openings this year will be “A” location stores, based on expected market availability for our type and size of locations.
As discussed in “Item 2. Properties,” of this Form 10-K, we have 247 store leases which will expire in 2012. During 2012, we anticipate closing approximately 45 of those locations. The majority of these closings will be the result of our choice to relocate the store to an improved location nearby. The balance of the closings will be the result of either a lack of renewal options or our belief that we can no longer generate an acceptable financial return in the location. For our remaining store locations with fiscal 2012 lease expirations, we expect to exercise our renewal option or negotiate more favorable lease renewal terms sufficient enough to continue to enable us to achieve an acceptable return on our investment.
24
Cost Structure
Our goal each year is to continue to generate expense leverage (lower expenses as a percent of net sales). We believe that several operational changes we have made, which we continue to refine, have significantly contributed to the achievement of our expense leverage goal. Some of the operational changes made include:
|
•
|
Controlled inventory levels at our stores and regional distribution centers.
|
|
•
|
Purchased and distributed merchandise to our stores in more optimal quantities and pack sizes to minimize handling in our distribution centers and stores.
|
|
•
|
Timed receipt of merchandise in stores closer to the expected display dates in order to avoid excessive handling of merchandise.
|
|
•
|
Increased the percentage of merchandise that arrives in our stores pre-ticketed and pre-packaged for efficient display and sale.
|
|
•
|
Refined our staffing and payroll scheduling models in our stores.
|
|
•
|
Invested in energy management systems to actively control utility costs, while reducing energy consumption.
|
|
•
|
Implemented several initiatives which lowered our distribution and outbound transportation expenses, including re-negotiating carrier contracts or changing carriers and expanding our back haul volumes.
|
As a result of these operational changes and certain other initiatives in the business, our overall expenses as a percent of sales have declined by 570 basis points since 2005 (2011 expense rate of 32.8% versus 2005 expense rate of 38.5%).
Canadian Segment
As our Canadian segment is also a broadline closeout retailer, we will be implementing merchandising strategies similar to those in our U.S. segment. Accordingly, while our strategy from a merchandise mix perspective will be fairly similar with our U.S. segment, the percent mix may vary based on seasonality, availability of product, and adjustments made for local markets. We believe the merchandising categories of goods sold in our U.S. segment have been core to our success, and consumers in Canada will respond to our extreme value proposition. Additionally, many of the vendors with whom we have strong relationships in the U.S. also have Canadian operations in need of an established closeout partner; therefore, we believe we have potential access to similar merchandise offerings in order to execute this strategy.
During 2012, we will be focused on: (1) continuing to increase our inventory to the appropriate levels, while developing a broad assortment of merchandise; (2) building and training our store teams; (3) assessing the real estate and cost structure elements of our new business as we prepare for new store growth currently planned to begin in 2013; and (4) executing certain test and learn activities to facilitate key strategic initiatives.
Discontinued Operations
We continue to incur an insignificant amount of costs on the 130 stores we closed in 2005 that we have classified as discontinued operations. We also report certain activity related to our prior ownership of the KB Toys business in discontinued operations. Se
e note 13 t
o the accompanying consolidated financial statements for a more detailed discussion of all of our discontinued operations.
Share Repurchase Program
In December 2009, our Board of Directors authorized a share repurchase program providing for the repurchase of up to $150.0 million of our common shares. On March 2, 2010, our Board of Directors authorized a $250.0 million increase to our repurchase program bringing the total authorization to $400.0 million. During 2010, we acquired 10.5 million of our outstanding common shares for $342.2 million under the 2010 Repurchase Program. On May 25, 2011, our Board of Directors authorized a share repurchase program providing for the repurchase of up to $400.0 million of our common shares. During 2011, we acquired 11.0 million of our outstanding common shares in the open market for approximately $359.3 million, at a volume weighted average price of $32.79. As a result of the repurchases in 2011, we exhausted our authorization under the 2010 Repurchase Program and utilized $301.5 million under the 2011 Repurchase Program.
25
Our remaining repurchase authorization under the 2011 Repurchase Program was approximately $98.5 million at
January 28, 2012
, and is available to be utilized to repurchase shares in the open market and/or in privately negotiated transactions at our discretion, subject to market conditions and other factors. Common shares acquired through the 2011 Repurchase Program are held in treasury at cost and are available to meet obligations under equity compensation plans and for general corporate purposes. The 2011 Repurchase Program has no scheduled termination date and will be funded with cash and cash equivalents, cash generated from operations or, if needed, by drawing on our 2011 Credit Agreement.
2011
COMPARED TO
2010
U.S. Segment
Net Sales
Net sales by merchandise category, in dollars and as a percentage of total net sales, and net sales change in dollars and percentage in
2011
compared to
2010
were as follows:
|
2011
|
2010
|
Change
|
|||||||||||||||
|
($ in thousands)
|
|||||||||||||||||
|
Consumables
|
$
|
1,571,771
|
|
30.6
|
%
|
$
|
1,452,783
|
|
29.3
|
%
|
$
|
118,988
|
|
8.2
|
%
|
||
|
Furniture
|
883,341
|
|
17.2
|
|
829,725
|
|
16.8
|
|
53,616
|
|
6.5
|
|
|||||
|
Home
|
799,494
|
|
15.5
|
|
783,860
|
|
15.8
|
|
15,634
|
|
2.0
|
|
|||||
|
Play n' Wear
|
776,445
|
|
15.1
|
|
811,750
|
|
16.4
|
|
(35,305
|
)
|
(4.3
|
)
|
|||||
|
Seasonal
|
683,498
|
|
13.3
|
|
642,220
|
|
13.0
|
|
41,278
|
|
6.4
|
|
|||||
|
Hardlines & Other
|
425,615
|
|
8.3
|
|
431,906
|
|
8.7
|
|
(6,291
|
)
|
(1.5
|
)
|
|||||
|
Net sales
|
$
|
5,140,164
|
|
100.0
|
%
|
$
|
4,952,244
|
|
100.0
|
%
|
$
|
187,920
|
|
3.8
|
%
|
||
In the third quarter of 2011, we realigned our merchandise categories to be consistent with the realignment of our merchandising team and changes to our management reporting. Fiscal 2011, 2010, and 2009 sales results have been reclassified to reflect the realignment.
Net sales increased
$187.9 million
or
3.8%
to
$5,140.2 million
in
2011
, compared to
$4,952.2 million
in
2010
. The increase in net sales was principally due to the net addition of 53 stores since the end of
2010
, which increased net sales by $179.6 million and a 0.1% increase in comparable store sales, which increased net sales by $8.3 million. Our comparable store sales are calculated by using all stores that were open for at least two fiscal years as of the beginning of the current fiscal year. The Consumables category experienced increases in nearly all departments, in particular food, as customers continue to respond to our new assortments and specialty offerings. The primary drivers of the sales increase in the Furniture category were the upholstery and mattresses departments, partially offset by a decrease in case goods as
2010
benefited from a few large closeout deals. The Seasonal category increase was driven by strong sales of Christmas trim and summer related merchandise, partially offset by a decrease in our fall seasonal departments. The Home category experienced growth in the domestics department, where new merchandising initiatives positively impacted sales throughout the majority of the year. The growth in the domestics department was partially offset by comparable store sales declines in most other departments. The decrease in the Play n' Wear category was primarily driven by lower sales in toys and the apparel departments, partially offset by an increase in the electronics department. We allocated less space and reduced our assortment of toys and apparel during 2011, and allocated a portion of this space to electronics based on customer demand. The decrease in the Hardlines & Other category was driven by decreases in our tools and paint departments as less selling square footage was allocated to these departments in 2011 as compared to 2010. In addition, the Hardlines & Other category was impacted by the absence of certain drugstore closeout deals in 2011.
For 2012, we expect sales to increase 8% to 9%, driven by net store growth of approximately 3%, comparable store sales growth of 2% to 3%, and the positive impact on sales of one additional week in 2012, as 2012 is a 53-week fiscal year.
26
Gross Margin
Gross margin dollars increased $33.6 million or 1.7% to
$2,046.1 million
in
2011
, compared to $
2,012.5 million
in
2010
. The increase in gross margin dollars was principally due to the increase in net sales which increased gross margin dollars by approximately $76.4 million. Partially offsetting the increase in net sales was the decrease in gross margin rate which decreased gross margin dollars by approximately $42.8 million. Gross margin as a percentage of net sales decreased 80 basis points to 39.8% in
2011
compared to 40.6% in
2010
. The gross margin rate decrease was principally due to the unfavorable merchandise mix impact caused by the strong sales of our lower margin Consumables category and electronics department, lower initial mark-up on merchandise receipts, and higher shrink costs.
For 2012, we expect our gross margin rate to be slightly higher than 2011, as we anticipate slightly lower levels of markdowns will be necessary to achieve our planned sales volume.
Selling and Administrative Expenses
Selling and administrative expenses were
$1,599.8 million
in
2011
, compared to
$1,576.5 million
in
2010
. The increase of $23.3 million or 1.5% was primarily due to increases in rent expense of $14.7 million, store payroll expense of $9.3 million, advertising expense of $6.1 million, and outbound transportation expense of $4.2 million, partially offset by lower bonus expense of $17.1 million. Store payroll and store rents increased primarily due to the net increase of 53 stores compared to the end of
2010
. The increase in advertising expense was driven by increased print distribution costs associated with new store growth, the roll out of new in-store point-of-purchase presentations, and support for promotional events. The increase in outbound transportation costs was largely driven by the net increase of 53 stores along with higher diesel fuel prices. The decrease in bonus expense was directly related to lower financial performance during 2011 as compared to the targets in our 2011 operating plan and to 2010, which outperformed the targets in our 2010 operating plan.
As a percentage of net sales, selling and administrative expenses decreased by 70 basis points to 31.1% in
2011
compared to 31.8% in
2010
. The decrease of 0.7% was primarily due to the effect of the increase in sales of 3.8% as selling and administrative expense dollars only increased 1.5% as discussed above. Our future selling and administrative expense as a percentage of net sales rate is dependent upon many factors including our level of net sales, our ability to implement additional efficiencies, principally in our store and distribution center operations, and fluctuating commodity prices, such as diesel fuel, which directly affects our outbound transportation cost. For 2012, we are forecasting an expense rate similar to or slightly higher than the rate achieved in 2011. Store expenses, distribution and transportation expenses, utilities, and credit card fees are expected to leverage as dollar growth in these areas is forecasted to be at a slower rate than our anticipated sales growth. Additionally, expenses are forecasted to leverage from the one additional week in 2012, which is a 53-week fiscal year. Offsetting this leverage, we believe costs will increase and deleverage in areas such as depreciation, incentive bonus expense, and share-based compensation expense.
Depreciation Expense
Depreciation expense increased $9.9 million to
$88.5 million
in
2011
compared to
$78.6 million
in
2010
. The increase is directly related to our new store growth, investments in systems, and capital spending to support and maintain our stores and distribution centers. Depreciation expense as a percentage of net sales increased by 10 basis points compared to
2010
.
For 2012, we expect capital expenditures of approximately $130 million to $135 million, which includes opening 90 new stores. Using this assumption and the run rate of depreciation on our existing property and equipment, we expect 2012 depreciation expense to be approximately $105 million, which would represent an increase from the $88.5 million of depreciation expense in 2011.
Canadian Segment
We consolidated the results of our Canadian segment from the date of acquisition (July 18, 2011) through the end of the year. Our Canadian segment's net sales were $62.1 million, which exceeded our original expectations, as customers responded to fresh, new merchandise with an improved value proposition, particularly in furniture, electronics, toys, and Christmas trim. The higher than expected net sales resulted in a smaller than expected operating loss of $12.2 million.
27
Other Performance Factors
Interest Expense
Interest expense increased $0.9 million to
$3.5 million
in
2011
compared to
$2.6 million
in
2010
. The increase in interest expense was primarily due to prepayment fees incurred in connection with our repayment of the notes payable we assumed in the acquisition of Liquidation World Inc. We had total average borrowings (including capital leases) of $88.2 million in
2011
compared to total average borrowings of $24.0 million in
2010
. Borrowings increased as a result of our execution of the 2011 Repurchase Program and the acquisition of Liquidation World Inc.
Income Taxes
The effective income tax rate in
2011
and
2010
for income from continuing operations was 39.4% and 37.4%, respectively. The higher rate in 2011 is primarily due to a valuation allowance relative to the deferred tax benefit of the loss generated by our Canadian segment, the effect of U.S. income taxes on a lower pretax income base (driven by the loss generated by our Canadian segment) and a net decrease in favorable discrete income tax items.
2010 COMPARED TO 2009
Net Sales
Net sales by merchandise category, in dollars and as a percentage of total net sales, and net sales change in dollars and percentage from 2010 compared to 2009 were as follows:
|
|
2010
|
2009
|
Change
|
||||||||||||||
|
(in thousands)
|
|
|
|
|
|
|
|||||||||||
|
Consumables
|
$
|
1,452,783
|
|
29.3
|
%
|
$
|
1,456,370
|
|
30.8
|
%
|
$
|
(3,587
|
)
|
(0.2
|
)%
|
||
|
Furniture
|
829,725
|
|
16.8
|
|
716,785
|
|
15.2
|
|
112,940
|
|
15.8
|
|
|||||
|
Play n' Wear
|
811,750
|
|
16.4
|
|
806,247
|
|
17.1
|
|
5,503
|
|
0.7
|
|
|||||
|
Home
|
783,860
|
|
15.8
|
|
717,744
|
|
15.2
|
|
66,116
|
|
9.2
|
|
|||||
|
Seasonal
|
642,220
|
|
13.0
|
|
591,321
|
|
12.5
|
|
50,899
|
|
8.6
|
|
|||||
|
Hardlines & Other
|
431,906
|
|
8.7
|
|
438,305
|
|
9.2
|
|
(6,399
|
)
|
(1.5
|
)
|
|||||
|
Net sales
|
$
|
4,952,244
|
|
100.0
|
%
|
$
|
4,726,772
|
|
100.0
|
%
|
$
|
225,472
|
|
4.8
|
%
|
||
Net sales increased $225.5 million or 4.8% to $4,952.2 million in 2010 compared to $4,726.8 million in 2009. The increase in net sales was principally driven by the increase in net stores in 2010, which increased net sales by $114.3 million, and a 2.5% increase in comparable store sales, which increased net sales by $111.1 million. The average number of stores in operation throughout 2010 and 2009 was approximately 1,380 stores and 1,354 stores, respectively. The Furniture, Home, and Seasonal categories had the largest sales gains in 2010. Sales increased in all departments of the Furniture category driven by sales of new styles introduced during the year, improvement in the quality of goods, and successful promotional events targeted around certain holiday selling periods. The Home category sales increased across most of its departments with the largest gain in domestics, as we have improved the value proposition and quality of our product offerings. The Seasonal category increase was due to higher sales of Christmas, lawn & garden, and summer merchandise as customers responded to both our updated Christmas assortment and the value and newness offered in certain of our lawn & garden and summer items. The Play n' Wear category sales improvement was primarily driven by the electronics department in the first half of 2010 through the sales of video games, which we began selling in the third fiscal quarter of 2009, partially offset by declining sales trends of toys. The Consumables category decrease was primarily due to lower food sales, as customers did not respond as expected to our offerings and assortment during the second half of 2010. The decrease in the Hardlines & Other category was primarily driven by the absences of certain drugstore closeout deals in 2010 that occurred in 2009.
Gross Margin
Gross margin dollars increased $93.2 million, or 4.9%, to $2,012.5 million in 2010 compared to $1,919.3 million in 2009. Gross margin as a percentage of net sales was 40.6% in both 2010 and 2009. The primary contributor to the increased gross margin dollars was higher net sales of $225.5 million, which increased gross margin dollars by approximately $91.6 million. The gross margin rate remained flat at 40.6% in 2010 as compared to 2009. In 2010, we experienced positive trends with lower markdowns, lower shrink costs, and the impact of favorable merchandise mix, which were offset by higher inbound freight costs and lower initial markups on certain items sold during the Christmas selling season. Lower markdowns and favorable merchandise mix impact were the result of strong sales in our higher margin Seasonal and Home categories. Our lower shrink
28
rates were driven by positive results in our annual physical inventories. The increase in inbound freight costs was primarily driven by higher diesel fuel costs and higher domestic carrier costs.
Selling and Administrative Expenses
Selling and administrative expenses increased $44.1 million, or 2.9%, to $1,576.5 million in 2010 compared to $1,532.4 million in 2009. The increase was primarily due to higher sales and a net increase of 37 stores in 2010. Compared to 2009, the largest increases were store payroll costs of $24.5 million, credit card/bank fees of $10.3 million, store rent expense of $9.1 million, and store facility and operation costs of $8.0 million. Partially offsetting these items was a decrease in advertising expenses of $4.2 million. The increase in store payroll was principally due to the incremental number of stores, store pre-opening costs, and higher sales. The increase in credit card/bank fees was the result of higher rates charged by debit card network providers, which were increased at the end of the first quarter of 2010, and from increased sales. Store rents increased primarily due to the incremental number of stores. Store facility and operation costs increased due to the incremental number of stores, increased store pre-opening costs (resulting from 80 store openings in 2010 as compared to 52 store openings in 2009), and increased repair costs primarily associated with our store refresh program. Advertising expense decreased primarily due to lower printing and distribution costs along with more efficient spending on our broadcast promotions.
Selling and administrative expenses as a percentage of net sales were 31.8% in 2010 compared to 32.4% in 2009. The decrease of 0.6% was primarily due to the effect of the increase in sales of 4.8% as selling and administrative expense dollars only increased 2.9% as discussed above.
Depreciation Expense
Depreciation expense increased $3.7 million, or 4.9%, to $78.6 million in 2010 compared to $74.9 million for 2009. Depreciation expense as a percentage of sales was flat compared to 2009 at 160 basis points. The increase in depreciation expense was primarily related to our stores and was principally due to new store openings. During 2010, the Company opened 80 new stores, including relocations.
Interest Expense
Interest expense increased $0.8 million to $2.6 million in 2010 compared to $1.8 million in 2009. The increase in interest expense was principally due to higher average borrowings (including capital leases) of $24.0 million in 2010 compared to average borrowings of $8.6 million in 2009. The higher average borrowings was primarily driven by the timing of share repurchases under the 2010 Repurchase Program.
Other Income (Expense)
Other income (expense) increased $0.4 million in 2010 to $0.6 million compared to $0.2 million in 2009. The increase in interest and investment income was caused by the increase in funds available to invest in 2010 compared to 2009, partly offset by a decrease in investment yield. Our average invested amount in 2010 was $132.9 million compared to $68.9 million in 2009. In 2010, we invested primarily in deposits with financial institutions and highly liquid investments, including money market funds and variable rate demand notes. We held $126.1 million of investments at the end of 2010.
Income Taxes
Our effective income tax rate on income from continuing operations was 37.4% for 2010 compared to 37.7% for 2009. The lower rate in 2010 was principally due to the recognition of benefits resulting primarily from the recording of a deferred tax asset for net state credits, principally obtained during the third quarter of 2010, partially offset by (1) lower year-over-year tax benefits related to the settlement of uncertain tax positions and (2) the release of a valuation allowance on unrealized capital losses in 2009.
Discontinued Operations
There was minimal activity in discontinued operations in 2010 compared to a loss of $1.0 million, net of tax, in 2009. The 2009 loss from discontinued operations was primarily due to the KB-II Bankruptcy Lease Obligations (see note 13 to the accompanying consolidated financial statements). In the fourth fiscal quarter of 2009, we obtained assignment of a lease for the former KB-II corporate office and recorded a charge of $0.7 million, net of tax, in loss from discontinued operations. The remaining $0.3 million loss from discontinued operations, net of tax, in 2009 pertained to other KB-II Bankruptcy Lease Obligations.
29
Capital Resources and Liquidity
On July 22, 2011, we entered into the 2011 Credit Agreement. The 2011 Credit Agreement is scheduled to expire on July 22, 2016. In connection with our entry into the 2011 Credit Agreement, we paid bank fees and other expenses in the aggregate amount of
$3.0 million
, which are being amortized over the term of the agreement. Borrowings under the 2011 Credit Agreement are available for general corporate purposes, working capital, and to repay certain of our indebtedness, including amounts due under the 2009 Credit Agreement. The 2011 Credit Agreement includes a $10 million Canadian swing loan sublimit, a $30 million U.S. swing loan sublimit, a $150 million letter of credit sublimit and a $200 million Canadian revolving credit loan subfacility. The interest rates, pricing and fees under the 2011 Credit Agreement fluctuate based on our debt rating. The 2011 Credit Agreement allows us to select our interest rate for each borrowing from multiple interest rate options. The interest rate options are generally derived from the prime rate, LIBOR, or CDOR. We may prepay revolving loans made under the 2011 Credit Agreement. The 2011 Credit Agreement contains financial and other covenants, including, but not limited to, limitations on indebtedness, liens and investments, as well as the maintenance of two financial ratios – a leverage ratio and a fixed charge coverage ratio. A violation of any of the covenants could result in a default under the 2011 Credit Agreement that would permit the lenders to restrict our ability to further access the 2011 Credit Agreement for loans and letters of credit and require the immediate repayment of any outstanding loans under the 2011 Credit Agreement. At
January 28, 2012
, we were in compliance with the covenants of the 2011 Credit Agreement.
We use the 2011 Credit Agreement, as necessary, to provide funds for ongoing and seasonal working capital, capital expenditures, share repurchase programs, and other expenditures. In addition, we use the 2011 Credit Agreement to provide letters of credit for various operating and regulatory requirements, a significant portion of which consists of letters of credit required as a result of our self-funded insurance programs. Given the seasonality of our business, the amount of borrowings under the 2011 Credit Agreement may fluctuate materially depending on various factors, including our operating financial performance, the time of year, and our need to increase merchandise inventory levels prior to the peak selling season.
The primary source of our liquidity is cash flows from operations and, as necessary, borrowings under the 2011 Credit Agreement. Our net income and, consequently, our cash provided by operations are impacted by net sales volume, seasonal sales patterns, and operating profit margins. Our net sales are typically highest during the nine-week Christmas selling season in our fourth fiscal quarter. Generally, our working capital requirements peak late in our third fiscal quarter or early in our fourth fiscal quarter. We have typically funded those requirements with borrowings under our credit facility. In 2011, our total indebtedness (outstanding borrowings and letters of credit) peaked at approximately $400 million in November. At
January 28, 2012
, we had
$65.9 million
in borrowings under the 2011 Credit Agreement and the borrowings available under the 2011 Credit Agreement were
$578.9 million
, after taking into account the reduction in availability resulting from outstanding letters of credit totaling
$55.2 million
. We anticipate that total indebtedness under the 2011 Credit Agreement through June 15, 2012 will peak at less than $100 million, which includes outstanding letters of credit and the estimated impact of cash needs of Big Lots Canada, but excludes the impact of any potential share repurchase activity under the 2011 Repurchase Program. Working capital was
$421.8 million
at
January 28, 2012
.
Whenever our liquidity position requires us to borrow funds under the 2011 Credit Agreement, we typically repay and/or borrow on a daily basis. The daily activity is a net result of our liquidity position, which is generally driven by the following components of our operations: 1) cash inflows such as cash or credit card receipts collected from stores for merchandise sales and other miscellaneous deposits; and 2) cash outflows such as check clearings for the acquisition of merchandise, wire and other electronic transactions for the acquisition of merchandise, payroll and other operating expenses, income and other taxes, employee benefits, and other miscellaneous disbursements.
Cash provided by operating activities increased by $3.2 million to
$318.5 million
in
2011
compared to
$315.3 million
in
2010
. The increase was primarily driven by the change in our accounts payable leverage ratio, which resulted in a $14.9 million increase, and higher depreciation and amortization expense, partially offset by our net income of $207.1 million in 2011, which was $15.4 million lower than our net income in 2010. At
January 28, 2012
, our accounts payable leverage ratio (accounts payable divided by inventory) increased to 42% from 40% at
January 29, 2011
, therefore driving an increase of $14.9 million. Net income in 2011 included $13.3 million of net loss generated by our Canadian segment.
30
Cash used in investing activities increased by $6.1 million to
$120.7 million
in
2011
compared to
$114.6 million
in
2010
. The increase was primarily due to an increase of $23.7 million in capital expenditures to $131.3 million in 2011 compared to $107.6 million in 2010, as more stores were opened in 2011 as compared to 2010. The increase was partially offset by the return of our $8.0 million deposit with an insurance carrier from a restricted account in the second quarter of 2011 that was initially deposited in the second quarter of 2010; therefore generating a $16.0 million change in cash flow from 2010 to 2011.
Cash used in financing activities decreased by $0.6 million to
$306.3 million
in
2011
compared to
$306.9 million
in
2010
. The primary driver of cash used in financing activities in
2011
and
2010
was our share repurchase activities. In 2011, we acquired $359.3 million of our common shares ($57.8 million under the 2010 Repurchase Program and $301.5 million under the 2011 Repurchase Program), as compared to the $342.2 million of our common shares we acquired in 2010 under the 2010 Repurchase Program. In addition, during the second quarter of 2011, we used $16.7 million to repay the outstanding notes payable we assumed in connection with our acquisition of Liquidation World Inc. In 2011 and 2010, we received proceeds from the exercise of stock options of $10.4 million and $32.5 million, respectively, which also generated excess tax benefits of $2.7 million and $13.8 million, respectively. Lastly, in 2011, we borrowed $65.9 million under the 2011 Credit Agreement to partially fund our share repurchases.
Based on historical and expected financial results, we believe that we have or, if necessary, have the ability to obtain, adequate resources to fund ongoing and seasonal working capital requirements, proposed capital expenditures, new projects, and currently maturing obligations.
Contractual Obligations
The following table summarizes payments due under our contractual obligations at
January 28, 2012
:
|
Payments Due by Period
(1)
|
|||||||||||||||
|
Less than
|
More than
|
||||||||||||||
|
Total
|
1 year
|
1 to 3 years
|
3 to 5 years
|
5 years
|
|||||||||||
|
(In thousands)
|
|||||||||||||||
|
Obligations under bank credit facility
(2)
|
$
|
65,975
|
|
$
|
75
|
|
$
|
—
|
|
$
|
65,900
|
|
$
|
—
|
|
|
Operating lease obligations
(3) (4)
|
1,208,513
|
|
311,751
|
|
481,978
|
|
257,859
|
|
156,925
|
|
|||||
|
Capital lease obligations
(4)
|
3,162
|
|
1,340
|
|
1,791
|
|
31
|
|
—
|
|
|||||
|
Purchase obligations
(4) (5)
|
815,971
|
|
713,495
|
|
84,932
|
|
17,544
|
|
—
|
|
|||||
|
Other long-term liabilities
(6)
|
48,190
|
|
5,307
|
|
5,391
|
|
11,017
|
|
26,475
|
|
|||||
|
Total contractual obligations
(7)
|
$
|
2,141,811
|
|
$
|
1,031,968
|
|
$
|
574,092
|
|
$
|
352,351
|
|
$
|
183,400
|
|
|
(1)
|
The disclosure of contractual obligations in this table is based on assumptions and estimates that we believe to be reasonable as of the date of this report. Those assumptions and estimates may prove to be inaccurate; consequently, the amounts provided in the table may differ materially from those amounts that we ultimately incur. Variables that may cause the stated amounts to vary from the amounts actually incurred include, but are not limited to: the termination of a contractual obligation prior to its stated or anticipated expiration; fees or damages incurred as a result of the premature termination or breach of a contractual obligation; the acquisition of more or less services or goods under a contractual obligation than are anticipated by us as of the date of this report; fluctuations in third party fees, governmental charges, or market rates that we are obligated to pay under contracts we have with certain vendors; and the exercise of renewal options under, or the automatic renewal of, contracts that provide for the same.
|
|
(2)
|
Obligations under the bank credit facility consist of the borrowings outstanding under the 2011 Credit Agreement, and the associated accrued interest of $0.1 million. In addition, we had outstanding letters of credit totaling
$55.2 million
at
January 28, 2012
. Approximately $51.3 million of the outstanding letters of credit represent stand-by letters of credit and we do not expect to meet the conditions requiring significant cash payments on these letters of credit; accordingly, they have been excluded from this table. The remaining outstanding letters of credit represent commercial letters of credit whereby the related obligation is included in the purchase obligations. For a further discussion, see
|
31
|
(3)
|
Operating lease obligations include, among other items, leases for retail stores, warehouse space, offices, and certain computer and other business equipment. The future minimum commitments for retail store, office, and warehouse space operating leases are
$927.4 million
. For a further discussion of leases, see note 5 to the accompanying consolidated financial statements. Many of the store lease obligations require us to pay for our applicable portion of CAM, real estate taxes, and property insurance. In connection with our store lease obligations, we estimated that future obligations for CAM, real estate taxes, and property insurance were $269.5 million at
January 28, 2012
. We have made certain assumptions and estimates in order to account for our contractual obligations relative to CAM, real estate taxes, and property insurance. Those assumptions and estimates include, but are not limited to: use of historical data to estimate our future obligations; calculation of our obligations based on comparable store averages where no historical data is available for a particular leasehold; and assumptions related to average expected increases over historical data. The remaining lease obligation of $11.6 million relates primarily to operating leases for computer and other business equipment, including data center related costs.
|
|
(4)
|
For purposes of the lease and purchase obligation disclosures, we have assumed that we will make all payments scheduled or reasonably estimated to be made under those obligations that have a determinable expiration date, and we disregarded the possibility that such obligations may be prematurely terminated or extended, whether automatically by the terms of the obligation or by agreement between us and the counterparty, due to the speculative nature of premature termination or extension. Where an operating lease or purchase obligation is subject to a month-to-month term or another automatically renewing term, we included in the table our minimum commitment under such obligation, such as one month in the case of a month-to-month obligation and the then-current term in the case of another automatically renewing term, due to the uncertainty of future decisions to exercise options to extend or terminate any existing leases.
|
|
(5)
|
Purchase obligations include outstanding purchase orders for merchandise issued in the ordinary course of our business that are valued at
$514.0 million
, the entirety of which represents obligations due within one year of
January 28, 2012
. In addition, we have a purchase commitment for future inventory purchases totaling
$80.8 million
at
January 28, 2012
. While we are not required to meet any periodic minimum purchase requirements under this commitment, we have included, for purposes of this tabular disclosure, the value of the purchases that we anticipate making during each of the reported periods as purchases that will count toward our fulfillment of the aggregate obligation. The remaining
$221.2 million
of purchase obligations is primarily related to distribution and transportation, information technology, print advertising, energy procurement, and other store security, supply, and maintenance commitments.
|
|
(6)
|
Other long-term liabilities include $23.8 million for expected contributions to the Pension Plan and our nonqualified, unfunded supplemental defined benefit pension plan (“Supplemental Pension Plan”), $20.4 million for obligations related to our nonqualified deferred compensation plan, $2.3 million for unrecognized tax benefits, and $0.6 million for closed store lease termination costs related to stores closed in 2011. Pension contributions are equal to expected benefit payments for the nonqualified plan plus expected contributions to the qualified plan using actuarial estimates and assuming that we only make the minimum required contributions (see note 8 to the accompanying consolidated financial statements for additional information about our employee benefit plans). We have estimated the payments due by period for the nonqualified deferred compensation plan based on an average of historical distributions. We have included unrecognized tax benefits of $1.5 million for payments expected in 2012 and $0.8 million of timing-related income tax uncertainties anticipated to reverse in 2012. Unrecognized tax benefits in the amount of $20.2 million have been excluded from the table because we are unable to make a reasonably reliable estimate of the timing of future payments. Our closed store lease termination cost payments are based on contractual terms.
|
|
(7)
|
The obligations disclosed in this table are exclusive of the contingent liabilities, guarantees, and indemnities related to the KB Toys business. For further discussion, see note 13 to the accompanying consolidated financial statements.
|
32
Off-Balance Sheet Arrangements
For a discussion of the KB Bankruptcy Lease Obligations, see
note 13 t
o the accompanying consolidated financial statements. Because the KB Toys business filed for bankruptcy again in December 2008 and liquidated all of its store operations, we accrued a contingent liability on our balance sheet at January 30, 2010, in the amount of $4.8 million for 31 KB Toys store leases for which we may have an indemnification or guarantee obligation and a former KB Toys corporate office lease for which we took an assignment in 2009. At
January 28, 2012
, our contingent liability related to this matter was $3.1 million. Because of uncertainty inherent in the assumptions used to estimate this liability, our estimated liability could ultimately prove to be understated and could result in a material adverse impact on our financial condition, results of operations, and liquidity.
CRITICAL ACCOUNTING POLICIES AND ESTIMATES
The preparation of financial statements in conformity with accounting principles generally accepted in the United States of America (“GAAP”) requires management to make estimates, judgments, and assumptions that affect the reported amounts of assets and liabilities at the date of the financial statements and the reported amounts of revenues and expenses during the reporting period, as well as the related disclosure of contingent assets and liabilities at the date of the financial statements. The use of estimates, judgments, and assumptions creates a level of uncertainty with respect to reported or disclosed amounts in our consolidated financial statements or accompanying notes. On an ongoing basis, management evaluates its estimates, judgments, and assumptions, including those that management considers critical to the accurate presentation and disclosure of our consolidated financial statements and accompanying notes. Management bases its estimates, judgments, and assumptions on historical experience, current trends, and various other factors that management believes are reasonable under the circumstances. Because of the inherent uncertainty in using estimates, judgments, and assumptions, actual results may differ from these estimates.
Our significant accounting policies, including the recently adopted accounting standards and recent accounting standards - future adoptions, if any, are described in note 1 to the accompanying consolidated financial statements. We believe the following assumptions and estimates are the most critical to understanding and evaluating our reported financial results. Management has reviewed these critical accounting estimates and related disclosures with the Audit Committee of our Board of Directors.
Merchandise Inventories
Merchandise inventories are valued at the lower of cost or market using the average cost retail inventory method. Market is determined based on the estimated net realizable value, which generally is the merchandise selling price at or near the end of the reporting period. The average cost retail inventory method requires management to make judgments and contains estimates, such as the amount and timing of markdowns to clear slow-moving inventory, the estimated allowance for shrinkage, and the estimated amount of excess or obsolete inventory, which may impact the ending inventory valuation and prior or future gross margin. These estimates are based on historical experience and current information.
When management determines the salability of merchandise inventories is diminished, markdowns for clearance activity and the related cost impact are recorded at the time the price change decision is made. Factors considered in the determination of markdowns include current and anticipated demand, customer preferences, the age of merchandise, and seasonal trends. Timing of holidays within fiscal periods, weather, and customer preferences could cause material changes in the amount and timing of markdowns from year to year.
The inventory allowance for shrinkage is recorded as a reduction to inventories, charged to cost of sales, and calculated as a percentage of sales for the period from the last physical inventory date to the end of the reporting period. Such estimates are based on both our current year and historical inventory results. Independent physical inventory counts are taken at each store once a year. During calendar 2012, the majority of these counts will occur between January and September. As physical inventories are completed, actual results are recorded and new go-forward shrink accrual rates are established based on individual store historical results. Thus, the shrink accrual rates will be adjusted throughout the January through September inventory cycle based on actual results. At
January 28, 2012
, a 10% difference in our shrink reserve would have affected gross margin, operating profit and income from continuing operations before income taxes by approximately $3.6 million. While it is not possible to quantify the impact from each cause of shrinkage, we have loss prevention programs and policies aimed at minimizing shrinkage.
33
Long-Lived Assets
Our long-lived assets primarily consist of property and equipment. We perform annual impairment reviews of our long-lived assets at the store level. Generally, all other property and equipment is reviewed for impairment at the enterprise level. When we perform the annual impairment reviews, we first determine which stores had impairment indicators present. We use actual historical cash flows to determine which stores had negative cash flows within the past two years. For each store with negative cash flows, we obtain future cash flow estimates based on operating performance estimates specific to each store's operations that are based on assumptions currently being used to develop our company level operating plans. If the net book value of a store's long-lived assets is not recoverable through the expected future cash flows of the store, we estimate the fair value of the store's assets and recognize an impairment charge for the excess net book value of the store's long-lived assets over their fair value. The fair value of store assets is estimated based on information available in the marketplace for similar assets.
We recognized impairment charges of less than $0.1 million and $0.4 million in 2010 and 2009, respectively. We did not recognize an impairment charge in 2011, related to our stores. We believe that our impairment charges are trending lower because we have been closing underperforming stores over the past 5 years (primarily through non-renewal of leases), and our store productivity continues to improve. In our U.S. segment, we only identified one store with impairment indicators as a result of our annual store impairment tests in 2011 and that store was planned to be, and was, closed by the end of 2011. Therefore, we do not believe that varying the assumptions used to test for recoverability to estimate fair value of our long-lived assets would have a material impact on the impairment charges we incurred in 2011. In our Canadian segment, we did not note any significant impairment indicators. Further, the assets were recorded at fair value upon the acquisition of Liquidation World Inc.
If our future operating results decline significantly, we may be exposed to impairment losses that could be material (for additional discussion of this risk, see “Item 1A. Risk Factors - A significant decline in our operating profit and taxable income may impair our ability to realize the value of our long lived assets and deferred tax assets.”).
In addition to our annual store impairment reviews, we evaluate our other long-lived assets at each reporting period to determine whether impairment indicators are present. In 2011, we reviewed our operational needs surrounding travel and determined that we needed to replace an aircraft due in part to the repair costs and declining reliability of the aging aircraft. As a result of this decision, we both purchased a new aircraft to meet our needs and placed an older aircraft in the market as available-for-sale. We recorded a $2.2 million impairment charge on the held-for-sale aircraft, based on market conditions at the time the decision was executed.
Goodwill
Goodwill as of the acquisition date is measured as the excess of consideration transferred and the net of the acquisition date fair values of the assets acquired and the liabilities assumed. While we use our best estimates and assumptions as a part of the purchase price allocation process to accurately value assets acquired and liabilities assumed at the acquisition date, our estimates are inherently uncertain and subject to refinement. As a result, during the measurement period, which may be up to one year from the acquisition date, we may record adjustments to the assets acquired and liabilities assumed, with the corresponding offset to goodwill. Upon the conclusion of the measurement period or final determination of the values of assets acquired or liabilities assumed, whichever comes first, any subsequent adjustments are recorded to our consolidated statements of operations.
On an annual basis, we must review our goodwill for potential impairment. We will conduct an impairment review which consists of preparing an estimate of the fair value of our reporting segments using an income approach and a market approach. Determining the fair value of a reporting segment involves the use of significant estimates and assumptions. These estimates and assumptions include revenue growth rates and operating margins used to calculate projected future cash flows, risk-adjusted discount rates, future economic and market conditions and determination of appropriate market comparables. We will base our estimates of fair value on assumptions we believe to be reasonable but that are unpredictable and inherently uncertain. Actual future results may differ from those estimates. We will perform our annual impairment testing during our second fiscal quarter of each year.
34
Share-Based Compensation
We grant stock options and performance-based non-vested restricted stock to our employees under shareholder approved incentive plans. Share-based compensation expense was
$25.0 million
,
$24.6 million
, and
$20.3 million
in
2011
,
2010
, and
2009
, respectively. Future share-based compensation expense for performance-based non-vested restricted stock is dependent upon the future number of awards, fair value of our common shares on the grant date, and the estimated vesting period. Future share-based compensation expense for stock options is dependent upon the number and terms of future stock option awards and many estimates, judgments and assumptions used in arriving at the fair value of stock options. Future share-based compensation expense related to performance-based non-vested restricted stock and stock options may vary materially from the currently amortizing awards.
We estimate the fair value of our stock options using a binomial model. The binomial model takes into account estimates, assumptions, and judgments about our stock price volatility, our dividend yield rate, the risk-free rate of return, the contractual term of the option, the probability that the option will be exercised prior to the end of its contractual life, and the probability of retirement of the option holder in computing the value of the option. Expected volatility is based on historical and current implied volatilities from traded options on our common shares and those of our peers. The dividend yield rate on our common shares is assumed to be zero since we have not paid dividends and have no current plans to do so. The risk-free rate is based on U.S. Treasury security yields at the time of the grant. The expected life is determined from the application of the binomial model and includes assumptions such as the expected employee exercise behavior and our expected forfeiture rate, which is based on analysis of historical data.
Compensation expense for performance-based non-vested restricted stock awards is recorded over the estimated vesting period based on the estimated achievement date of the performance criteria. An estimated target achievement date is determined at the time of the award based on historical and forecasted performance of similar measures. We monitor the achievement of the performance targets at each reporting period and make adjustments to the estimated vesting period when our models indicate that the estimated achievement date differs from the date being used to amortize expense. Any change in the estimated vesting date results in a prospective change to the related expense by charging the remaining unamortized expense over the remaining expected vesting period at the date the estimate was changed.
Income Taxes
The determination of our income tax expense, refunds receivable, income taxes payable, deferred tax assets and liabilities and financial statement recognition, de-recognition and/or measurement of uncertain tax benefits (for positions taken or to be taken on income tax returns) requires significant judgment, the use of estimates, and the interpretation and application of complex accounting and multi-jurisdictional income tax laws.
The effective income tax rate in any period may be materially impacted by the overall level of income (loss) before income taxes, the jurisdictional mix and magnitude of income (loss), changes in the income tax laws (which may be retroactive to the beginning of the fiscal year), subsequent recognition, de-recognition and/or measurement of an uncertain tax benefit, changes in deferred tax asset valuation allowances and adjustments of a deferred tax asset or liability for enacted changes in tax laws or rates. Although we believe that our estimates are reasonable, actual results could differ from these estimates resulting in a final tax outcome that may be materially different from that which is reflected in our consolidated financial statements.
We evaluate our ability to recover our deferred tax assets within the jurisdiction from which they arise. We consider all available positive and negative evidence including recent financial results, projected future pretax accounting income from continuing operations and tax planning strategies (when necessary). This evaluation requires us to make assumptions that require significant judgment about the forecasts of future pretax accounting income. The assumptions that we use in this evaluation are consistent with the assumptions and estimates used to develop our consolidated operating financial plans. If we determine that a portion of our deferred tax assets, which principally represent expected future deductions or benefits, are not likely to be realized, we recognize a valuation allowance for our estimate of these benefits which we believe are not likely recoverable. Additionally, changes in tax laws, apportionment of income for state and provincial tax purposes, and rates could also affect recorded deferred tax assets.
35
We evaluate the uncertainty of income tax positions taken or to be taken on income tax returns. When a tax position meets the more-likely-than-not threshold, we recognize economic benefits associated with the position on our consolidated financial statements. The more-likely-than-not recognition threshold is a positive assertion that an enterprise believes it is entitled to economic benefits associated with a tax position. When a tax position does not meet the more-likely-than-not threshold, or in the case of those positions that do meet the threshold but are measured at less than the full benefit taken on the return, we recognize tax liabilities (or de-recognize tax assets, as the case may be). A number of years may elapse before a particular matter, for which we have derecognized a tax benefit, is audited and fully resolved or clarified. We adjust unrecognized tax benefits and the income tax provision in the period in which an uncertain tax position is effectively or ultimately settled, the statute of limitations expires for the relevant taxing authority to examine the tax position, or as a result of the evaluation of new information that becomes available.
Pension
Actuarial valuations are used to calculate the estimated expenses and obligations for our Pension Plan and Supplemental Pension Plan. Inherent in the actuarial valuations are several assumptions including discount rate and expected return on plan assets. We review external data and historical trends to help determine the discount rate and expected long-term rate of return. Our objective in selecting a discount rate is to identify the best estimate of the rate at which the benefit obligations would be settled on the measurement date. In making this estimate, we review rates of return on high-quality, fixed-income investments available at the measurement date and expected to be available during the period to maturity of the benefits. This process includes a review of the bonds available on the measurement date with a quality rating of Aa or better. The expected long-term rate of return on assets is derived from detailed periodic studies, which include a review of asset allocation strategies, anticipated future long-term performance of individual asset classes, risks (standard deviations) and correlations of returns among the asset classes that comprise the plan's asset mix. While the studies give appropriate consideration to recent plan performance and historical returns, the assumption is primarily a long-term, prospective rate of return. The weighted average discount rate used to determine the net periodic pension cost for 2011 was 5.7%. A 1.0% decrease in the discount rate would increase net periodic pension cost by $0.8 million. The long-term rate of return on assets used to determine net periodic pension cost in 2011 was 8.0%. A 1.0% decrease in the expected long-term rate of return on plan assets would increase the net periodic pension cost by $0.6 million.
During 2011, we reclassified $1.1 million, net of tax, from other comprehensive income to expense in our consolidated statement of operations. We recognized a benefit of $0.2 million, net of tax, to other comprehensive income in 2011, which was principally driven by the recognition of $0.3 million (pretax) in settlement charges as participants elected more lump sum payments than originally estimated. At January 28, 2012, the accumulated other comprehensive income amount associated with the plans, which was principally unrealized actuarial loss, was $14.5 million loss, net of tax. During 2012, and in future periods, we expect to reclassify approximately $2.7 million from other comprehensive income to expense, assuming we achieve our estimated rate of return on pension plan investments in future periods. Additionally, in the event that we have future settlements, as occurred in 2011 and 2010, we would expect that the pretax expense related to future settlements would be between the $0.3 million and $1.8 million charges in 2011 and 2010, respectively.
Insurance and Insurance-Related Reserves
We are self-insured for certain losses relating to property, general liability, workers' compensation, and employee medical and dental benefit claims, a portion of which is funded by employees. We purchase stop-loss coverage from third party insurance carriers to limit individual or aggregate loss exposure in these areas. Accrued insurance liabilities and related expenses are based on actual claims reported and estimates of claims incurred but not reported. The estimated loss accruals for claims incurred but not paid are determined by applying actuarially-based calculations taking into account historical claims payment results and known trends such as claims frequency and claims severity. Management makes estimates, judgments, and assumptions with respect to the use of these actuarially-based calculations, including but not limited to, estimated health care cost trends, estimated lag time to report and pay claims, average cost per claim, network utilization rates, network discount rates, and other factors. A 10% change in our self-insured liabilities at January 28, 2012 would have affected selling and administrative expenses, operating profit, and income from continuing operations before income taxes by approximately $8 million.
General liability and workers' compensation liabilities are recorded at our estimate of their net present value, using a 4.0% discount rate, while other liabilities for insurance reserves are not discounted. A 1.0% change in the discount rate on these liabilities would have affected selling and administrative expenses, operating profit, and income from continuing operations before income taxes by approximately $1.8 million.
36
Lease Accounting
In order to recognize rent expense on our leases, we evaluate many factors to identify the lease term such as the contractual term of the lease, our assumed possession date of the property, renewal option periods, and the estimated value of leasehold improvement investments that we are required to make. Based on this evaluation, our lease term is typically the minimum contractually obligated period over which we have control of the property. This term is used because although many of our leases have renewal options, we typically do not incur an economic or contractual penalty in the event of non-renewal. Therefore, we typically use the initial minimum lease term for purposes of calculating straight-line rent, amortizing deferred rent, and recognizing depreciation expense on our leasehold improvements.
Commitments
For a discussion on certain of our commitments, refer to note 3, note 5, note 10, and note 13 to the accompanying consolidated financial statements.
We are subject to market risk from exposure to changes in interest rates on investments and on borrowings under the 2011 Credit Agreement that we make from time to time. We had borrowings of
$65.9 million
under the 2011 Credit Agreement at
January 28, 2012
. An increase of 1.0% in our variable interest rate on our investments and expected future borrowings would not have a material effect on our financial condition, results of operations, or liquidity.
Through the operations of Big Lots Canada, we are subject to market risks associated with foreign currency exchange rate fluctuations between the Canadian Dollar and the U.S. Dollar. An increase or decrease of 1% in foreign currency exchange rates would not have a material effect on our financial condition, results of operations, or liquidity.
37
REPORT OF INDEPENDENT REGISTERED PUBLIC ACCOUNTING FIRM
To the Board of Directors and Shareholders of Big Lots, Inc.
Columbus, Ohio
We have audited the internal control over financial reporting of Big Lots, Inc. and subsidiaries (the "Company") as of January 28, 2012, based on criteria established in
Internal Control - Integrated Framework
issued by the Committee of Sponsoring Organizations of the Treadway Commission. As described in Management’s Report on Internal Control over Financial Reporting, management excluded from its assessment the internal control over financial reporting at Liquidation World Inc., which was acquired on July 18, 2011 and whose financial statements constitute 3% of total assets, 1% of revenues, and 6% of net income of the consolidated financial statement amounts as of and for the year ended January 28, 2012. Accordingly, our audit did not include the internal control over financial reporting at Liquidation World Inc. The Company's management is responsible for maintaining effective internal control over financial reporting and for its assessment of the effectiveness of internal control over financial reporting, included in the accompanying Management's Report on Internal Control over Financial Reporting in Item 9A. Our responsibility is to express an opinion on the Company's internal control over financial reporting based on our audit.
We conducted our audit in accordance with the standards of the Public Company Accounting Oversight Board (United States). Those standards require that we plan and perform the audit to obtain reasonable assurance about whether effective internal control over financial reporting was maintained in all material respects. Our audit included obtaining an understanding of internal control over financial reporting, assessing the risk that a material weakness exists, testing and evaluating the design and operating effectiveness of internal control based on the assessed risk, and performing such other procedures as we considered necessary in the circumstances. We believe that our audit provides a reasonable basis for our opinion.
A company's internal control over financial reporting is a process designed by, or under the supervision of, the company's principal executive and principal financial officers, or persons performing similar functions, and effected by the company's board of directors, management, and other personnel to provide reasonable assurance regarding the reliability of financial reporting and the preparation of financial statements for external purposes in accordance with generally accepted accounting principles. A company's internal control over financial reporting includes those policies and procedures that (1) pertain to the maintenance of records that, in reasonable detail, accurately and fairly reflect the transactions and dispositions of the assets of the company; (2) provide reasonable assurance that transactions are recorded as necessary to permit preparation of financial statements in accordance with generally accepted accounting principles, and that receipts and expenditures of the company are being made only in accordance with authorizations of management and directors of the company; and (3) provide reasonable assurance regarding prevention or timely detection of unauthorized acquisition, use, or disposition of the company's assets that could have a material effect on the financial statements.
Because of the inherent limitations of internal control over financial reporting, including the possibility of collusion or improper management override of controls, material misstatements due to error or fraud may not be prevented or detected on a timely basis. Also, projections of any evaluation of the effectiveness of the internal control over financial reporting to future periods are subject to the risk that the controls may become inadequate because of changes in conditions, or that the degree of compliance with the policies or procedures may deteriorate.
In our opinion, the Company maintained, in all material respects, effective internal control over financial reporting as of January 28, 2012, based on the criteria established in
Internal Control - Integrated Framework
issued by the Committee of Sponsoring Organizations of the Treadway Commission.
We have also audited, in accordance with the standards of the Public Company Accounting Oversight Board (United States), the consolid
ated financial statements as of and for the year ended January 28, 2012, of the Company, and our report dated March 26, 2012, expressed an unqualified opinion on those financial statements.
/s/ DELOITTE & TOUCHE LLP
Dayton, Ohio
March 26, 2012
38
REPORT OF INDEPENDENT REGISTERED PUBLIC ACCOUNTING FIRM
To the Board of Directors and Shareholders of Big Lots, Inc.
Columbus, Ohio
We have audited the accompanying consolidated balance sheets of Big Lots, Inc. and subsidiaries (the "Company") as of January 28, 2012 and January 29, 2011, and the related consolidated statements of operations, shareholders' equity, and cash flows for each of the three years in the period ended January 28, 2012. These consolidated financial statements are the responsibility of the Company's management. Our responsibility is to express an opinion on these consolidated financial statements based on our audits.
We conducted our audits in accordance with the standards of the Public Company Accounting Oversight Board (United States). Those standards require that we plan and perform the audit to obtain reasonable assurance about whether the financial statements are free of material misstatement. An audit includes examining, on a test basis, evidence supporting the amounts and disclosures in the financial statements. An audit also includes assessing the accounting principles used and significant estimates made by management, as well as evaluating the overall financial statement presentation. We believe that our audits provide a reasonable basis for our opinion.
In our opinion, such consolidated financial statements present fairly, in all material respects, the financial position of Big Lots, Inc. and subsidiaries at January 28, 2012 and January 29, 2011, and the results of their operations and their cash flows for each of the three years in the period ended January 28, 2012, in conformity with accounting principles generally accepted in the United States of America.
We have also audited, in accordance with the standards of the Public Company Accounting Oversight Board (United States), the Company's
internal control over financial reporting as of January 28, 2012, based on criteria established in
Internal Control
-
Integrated Framework
issued by the Committee of Sponsoring Organizations of the Treadway Commission and our report dated March 26, 2012, expressed an unqualified opinion on the Company's internal control over financial reporting.
/s/ DELOITTE & TOUCHE LLP
Dayton, Ohio
March 26, 2012
39
|
Consolidated Statements of Operations (In thousands, except per share amounts) |
|
|
2011
|
2010
|
2009
|
||||||
|
Net sales
|
$
|
5,202,269
|
|
$
|
4,952,244
|
|
$
|
4,726,772
|
|
|
Cost of sales (exclusive of depreciation expense shown separately below)
|
3,131,862
|
|
2,939,793
|
|
2,807,466
|
|
|||
|
Gross margin
|
2,070,407
|
|
2,012,451
|
|
1,919,306
|
|
|||
|
Selling and administrative expenses
|
1,634,532
|
|
1,576,500
|
|
1,532,356
|
|
|||
|
Depreciation expense
|
90,280
|
|
78,606
|
|
74,904
|
|
|||
|
Gain on sale of real estate
|
—
|
|
—
|
|
(12,964
|
)
|
|||
|
Operating profit
|
345,595
|
|
357,345
|
|
325,010
|
|
|||
|
Interest expense
|
(3,530
|
)
|
(2,573
|
)
|
(1,840
|
)
|
|||
|
Other income (expense)
|
(173
|
)
|
612
|
|
175
|
|
|||
|
Income from continuing operations before income taxes
|
341,892
|
|
355,384
|
|
323,345
|
|
|||
|
Income tax expense
|
134,657
|
|
132,837
|
|
121,975
|
|
|||
|
Income from continuing operations
|
207,235
|
|
222,547
|
|
201,370
|
|
|||
|
Loss from discontinued operations, net of tax benefit of $112, $14 and $656 in fiscal years 2011, 2010 and 2009, respectively
|
(171
|
)
|
(23
|
)
|
(1,001
|
)
|
|||
|
Net income
|
$
|
207,064
|
|
$
|
222,524
|
|
$
|
200,369
|
|
|
Earnings per common share - basic
|
|
|
|
|
|
|
|||
|
Continuing operations
|
$
|
3.03
|
|
$
|
2.87
|
|
$
|
2.47
|
|
|
Discontinued operations
|
—
|
|
—
|
|
(0.01
|
)
|
|||
|
|
$
|
3.03
|
|
$
|
2.87
|
|
$
|
2.45
|
|
|
Earnings per common share - diluted
|
|
|
|
|
|
|
|||
|
Continuing operations
|
$
|
2.99
|
|
$
|
2.83
|
|
$
|
2.44
|
|
|
Discontinued operations
|
—
|
|
—
|
|
(0.01
|
)
|
|||
|
|
$
|
2.98
|
|
$
|
2.83
|
|
$
|
2.42
|
|
The accompanying notes are an integral part of these consolidated financial statements.
40
|
Consolidated Balance Sheets
(In thousands, except par value)
|
|
|
January 28, 2012
|
January 29, 2011
|
|||||
|
ASSETS
|
|
|
|||||
|
Current assets:
|
|
|
|||||
|
Cash and cash equivalents
|
$
|
68,547
|
|
$
|
177,539
|
|
|
|
Inventories
|
825,195
|
|
762,146
|
|
|||
|
Deferred income taxes
|
42,784
|
|
50,252
|
|
|||
|
Other current assets
|
70,130
|
|
61,782
|
|
|||
|
Total current assets
|
1,006,656
|
|
1,051,719
|
|
|||
|
Property and equipment - net
|
572,767
|
|
524,906
|
|
|||
|
Deferred income taxes
|
6,549
|
|
6,666
|
|
|||
|
Restricted cash
|
—
|
|
8,000
|
|
|||
|
Goodwill
|
12,282
|
|
—
|
|
|||
|
Other assets
|
43,056
|
|
28,308
|
|
|||
|
Total assets
|
$
|
1,641,310
|
|
$
|
1,619,599
|
|
|
|
LIABILITIES AND SHAREHOLDERS’ EQUITY
|
|
|
|
|
|||
|
Current liabilities:
|
|
|
|
|
|||
|
Accounts payable
|
$
|
350,117
|
|
$
|
302,818
|
|
|
|
Property, payroll, and other taxes
|
74,396
|
|
75,401
|
|
|||
|
Accrued operating expenses
|
56,088
|
|
53,771
|
|
|||
|
Insurance reserves
|
35,159
|
|
37,741
|
|
|||
|
KB bankruptcy lease obligation
|
3,115
|
|
3,552
|
|
|||
|
Accrued salaries and wages
|
29,170
|
|
43,433
|
|
|||
|
Income taxes payable
|
36,775
|
|
25,215
|
|
|||
|
Total current liabilities
|
584,820
|
|
541,931
|
|
|||
|
Long-term obligations
|
65,900
|
|
—
|
|
|||
|
Deferred rent
|
59,320
|
|
42,037
|
|
|||
|
Insurance reserves
|
49,794
|
|
46,145
|
|
|||
|
Unrecognized tax benefits
|
18,681
|
|
19,142
|
|
|||
|
Other liabilities
|
39,562
|
|
23,551
|
|
|||
|
Shareholders’ equity:
|
|
|
|
|
|||
|
Preferred shares - authorized 2,000 shares; $0.01 par value; none issued
|
—
|
|
—
|
|
|||
|
Common shares - authorized 298,000 shares; $0.01 par value; issued 117,495 shares; outstanding 63,609 shares and 73,894 shares, respectively
|
1,175
|
|
1,175
|
|
|||
|
Treasury shares - 53,886 shares and 43,601 shares, respectively, at cost
|
(1,423,524
|
)
|
(1,079,130
|
)
|
|||
|
Additional paid-in capital
|
542,160
|
|
523,341
|
|
|||
|
Retained earnings
|
1,718,941
|
|
1,511,877
|
|
|||
|
Accumulated other comprehensive loss
|
(15,519
|
)
|
(10,470
|
)
|
|||
|
Total shareholders' equity
|
823,233
|
|
946,793
|
|
|||
|
Total liabilities and shareholders' equity
|
$
|
1,641,310
|
|
$
|
1,619,599
|
|
|
The accompanying notes are an integral part of these consolidated financial statements.
41
|
BIG LOTS, INC. AND SUBSIDIARIES
Consolidated Statements of Shareholders’ Equity (In thousands) |
|
|
Common
|
Treasury
|
Additional
Paid-In
Capital
|
Retained Earnings
|
Accumulated Other Comprehensive Loss
|
|
||||||||||||||||
|
|
Shares
|
Amount
|
Shares
|
Amount
|
Total
|
|||||||||||||||||
|
Balance - January 31, 2009
|
81,315
|
|
$
|
1,175
|
|
36,180
|
|
$
|
(804,561
|
)
|
$
|
504,552
|
|
$
|
1,088,984
|
|
$
|
(15,305
|
)
|
$
|
774,845
|
|
|
Net income
|
—
|
|
—
|
|
—
|
|
—
|
|
—
|
|
200,369
|
|
—
|
|
200,369
|
|
||||||
|
Other comprehensive income:
|
|
|
|
|
|
|
|
|
|
|
|
|
|
|
|
|
||||||
|
Amortization of pension, net of tax of $(1,105)
|
—
|
|
—
|
|
—
|
|
—
|
|
—
|
|
—
|
|
1,740
|
|
1,740
|
|
||||||
|
Valuation of adjustment of pensions, net of tax of $(273)
|
—
|
|
—
|
|
—
|
|
—
|
|
—
|
|
—
|
|
430
|
|
430
|
|
||||||
|
Comprehensive income
|
—
|
|
—
|
|
—
|
|
—
|
|
—
|
|
—
|
|
—
|
|
202,539
|
|
||||||
|
Purchases of common shares
|
(87
|
)
|
—
|
|
87
|
|
(1,849
|
)
|
—
|
|
—
|
|
—
|
|
(1,849
|
)
|
||||||
|
Exercise of stock options
|
362
|
|
—
|
|
(362
|
)
|
8,045
|
|
(3,114
|
)
|
—
|
|
—
|
|
4,931
|
|
||||||
|
Restricted shares vested
|
328
|
|
—
|
|
(328
|
)
|
7,291
|
|
(7,291
|
)
|
—
|
|
—
|
|
—
|
|
||||||
|
Tax benefit from share-based awards
|
—
|
|
—
|
|
—
|
|
—
|
|
559
|
|
—
|
|
—
|
|
559
|
|
||||||
|
Share activity related to deferred compensation plan
|
4
|
|
—
|
|
(4
|
)
|
32
|
|
80
|
|
—
|
|
—
|
|
112
|
|
||||||
|
Share-based employee compensation expense
|
—
|
|
—
|
|
—
|
|
—
|
|
20,275
|
|
—
|
|
—
|
|
20,275
|
|
||||||
|
Balance - January 30, 2010
|
81,922
|
|
1,175
|
|
35,573
|
|
(791,042
|
)
|
515,061
|
|
1,289,353
|
|
(13,135
|
)
|
1,001,412
|
|
||||||
|
Net income
|
—
|
|
—
|
|
—
|
|
—
|
|
—
|
|
222,524
|
|
—
|
|
222,524
|
|
||||||
|
Other comprehensive income:
|
|
|
|
|
|
|
|
|
|
|
|
|
|
|
|
|
||||||
|
Amortization of pension, net of tax of $(869)
|
—
|
|
—
|
|
—
|
|
—
|
|
—
|
|
—
|
|
1,328
|
|
1,328
|
|
||||||
|
Valuation adjustment of pension, net of tax of $(876)
|
—
|
|
—
|
|
—
|
|
—
|
|
—
|
|
—
|
|
1,337
|
|
1,337
|
|
||||||
|
Comprehensive income
|
—
|
|
—
|
|
—
|
|
—
|
|
—
|
|
—
|
|
—
|
|
225,189
|
|
||||||
|
Purchases of common shares
|
(10,686
|
)
|
—
|
|
10,686
|
|
(350,823
|
)
|
—
|
|
—
|
|
—
|
|
(350,823
|
)
|
||||||
|
Exercise of stock options
|
1,808
|
|
—
|
|
(1,808
|
)
|
42,285
|
|
(9,773
|
)
|
—
|
|
—
|
|
32,512
|
|
||||||
|
Restricted shares vested
|
847
|
|
—
|
|
(847
|
)
|
20,437
|
|
(20,437
|
)
|
—
|
|
—
|
|
—
|
|
||||||
|
Tax benefit from share-based awards
|
—
|
|
—
|
|
—
|
|
—
|
|
13,779
|
|
—
|
|
—
|
|
13,779
|
|
||||||
|
Share activity related to deferred compensation plan
|
3
|
|
—
|
|
(3
|
)
|
13
|
|
83
|
|
—
|
|
—
|
|
96
|
|
||||||
|
Share-based employee compensation expense
|
—
|
|
—
|
|
—
|
|
—
|
|
24,628
|
|
—
|
|
—
|
|
24,628
|
|
||||||
|
Balance - January 29, 2011
|
73,894
|
|
1,175
|
|
43,601
|
|
(1,079,130
|
)
|
523,341
|
|
1,511,877
|
|
(10,470
|
)
|
946,793
|
|
||||||
|
Net income
|
—
|
|
—
|
|
—
|
|
—
|
|
—
|
|
207,064
|
|
—
|
|
207,064
|
|
||||||
|
Other comprehensive income (loss):
|
|
|
|
|
|
|
|
|
|
|
|
|
|
|
|
|
||||||
|
Foreign currency translation
|
—
|
|
—
|
|
—
|
|
—
|
|
—
|
|
—
|
|
(1,050
|
)
|
(1,050
|
)
|
||||||
|
Amortization of pension, net of tax of $(703)
|
—
|
|
—
|
|
—
|
|
—
|
|
—
|
|
—
|
|
1,066
|
|
1,066
|
|
||||||
|
Valuation adjustment of pension, net of tax of $3,337
|
—
|
|
—
|
|
—
|
|
—
|
|
—
|
|
—
|
|
(5,065
|
)
|
(5,065
|
)
|
||||||
|
Comprehensive income
|
—
|
|
—
|
|
—
|
|
—
|
|
—
|
|
—
|
|
—
|
|
202,015
|
|
||||||
|
Purchases of common shares
|
(11,063
|
)
|
—
|
|
11,063
|
|
(363,957
|
)
|
—
|
|
—
|
|
—
|
|
(363,957
|
)
|
||||||
|
Exercise of stock options
|
500
|
|
—
|
|
(500
|
)
|
12,800
|
|
(2,391
|
)
|
—
|
|
—
|
|
10,409
|
|
||||||
|
Restricted shares vested
|
271
|
|
—
|
|
(271
|
)
|
6,731
|
|
(6,731
|
)
|
—
|
|
—
|
|
—
|
|
||||||
|
Tax benefit from share-based awards
|
—
|
|
—
|
|
—
|
|
—
|
|
2,701
|
|
—
|
|
—
|
|
2,701
|
|
||||||
|
Share activity related to deferred compensation plan
|
7
|
|
—
|
|
(7
|
)
|
32
|
|
247
|
|
—
|
|
—
|
|
279
|
|
||||||
|
Share-based employee compensation expense
|
—
|
|
—
|
|
—
|
|
—
|
|
24,993
|
|
—
|
|
—
|
|
24,993
|
|
||||||
|
Balance - January 28, 2012
|
63,609
|
|
$
|
1,175
|
|
53,886
|
|
$
|
(1,423,524
|
)
|
$
|
542,160
|
|
$
|
1,718,941
|
|
$
|
(15,519
|
)
|
$
|
823,233
|
|
The accompanying notes are an integral part of these consolidated financial statements.
42
|
Consolidated Statements of Cash Flows (In thousands) |
|
2011
|
2010
|
2009
|
|||||||||
|
Operating activities:
|
|||||||||||
|
Net income
|
$
|
207,064
|
|
$
|
222,524
|
|
$
|
200,369
|
|
||
|
Adjustments to reconcile net income to net cash provided by operating activities:
|
|
|
|
|
|||||||
|
Depreciation and amortization expense
|
82,851
|
|
74,041
|
|
71,501
|
|
|||||
|
Deferred income taxes
|
10,456
|
|
20,485
|
|
18,014
|
|
|||||
|
KB Toys matters
|
—
|
|
—
|
|
409
|
|
|||||
|
Non-cash share-based compensation expense
|
24,993
|
|
24,628
|
|
20,275
|
|
|||||
|
Excess tax benefit from share-based awards
|
(2,701
|
)
|
(13,779
|
)
|
(1,568
|
)
|
|||||
|
Non-cash impairment charge
|
2,242
|
|
18
|
|
358
|
|
|||||
|
Loss on disposition of equipment
|
1,376
|
|
639
|
|
1,072
|
|
|||||
|
Gain on sale of real estate
|
—
|
|
—
|
|
(12,964
|
)
|
|||||
|
Pension
|
2,023
|
|
4,479
|
|
(5,193
|
)
|
|||||
|
Change in assets and liabilities, excluding effects of acquisition:
|
|
|
|
|
|||||||
|
Inventories
|
(54,512
|
)
|
(30,809
|
)
|
5,279
|
|
|||||
|
Accounts payable
|
31,555
|
|
(7,045
|
)
|
73,889
|
|
|||||
|
Current income taxes
|
10,293
|
|
12,043
|
|
(2,791
|
)
|
|||||
|
Other current assets
|
(6,082
|
)
|
(5,250
|
)
|
(2,177
|
)
|
|||||
|
Other current liabilities
|
(16,465
|
)
|
(5,816
|
)
|
18,064
|
|
|||||
|
Other assets
|
(4,098
|
)
|
(2,988
|
)
|
(5,285
|
)
|
|||||
|
Other liabilities
|
29,476
|
|
22,087
|
|
12,774
|
|
|||||
|
Net cash provided by operating activities
|
318,471
|
|
315,257
|
|
392,026
|
|
|||||
|
Investing activities:
|
|
|
|
|
|
|
|||||
|
Capital expenditures
|
(131,293
|
)
|
(107,563
|
)
|
(78,708
|
)
|
|||||
|
Cash proceeds from sale of property and equipment
|
867
|
|
1,301
|
|
861
|
|
|||||
|
Acquisition
|
1,835
|
|
—
|
|
—
|
|
|||||
|
Return from (Deposit in) restricted account
|
8,000
|
|
(8,000
|
)
|
—
|
|
|||||
|
Other
|
(121
|
)
|
(290
|
)
|
(90
|
)
|
|||||
|
Net cash used in investing activities
|
(120,712
|
)
|
(114,552
|
)
|
(77,937
|
)
|
|||||
|
Financing activities:
|
|
|
|
|
|
|
|||||
|
Net proceeds from borrowings under bank credit facility
|
65,900
|
|
—
|
|
(61,700
|
)
|
|||||
|
Payment of notes payable
|
(16,664
|
)
|
—
|
|
—
|
|
|||||
|
Payment of capital lease obligations
|
(1,953
|
)
|
(2,463
|
)
|
(2,612
|
)
|
|||||
|
Proceeds from the exercise of stock options
|
10,409
|
|
32,512
|
|
4,931
|
|
|||||
|
Excess tax benefit from share-based awards
|
2,701
|
|
13,779
|
|
1,568
|
|
|||||
|
Payment for treasury shares acquired
|
(363,957
|
)
|
(350,823
|
)
|
(1,849
|
)
|
|||||
|
Deferred bank credit facility fees paid
|
(2,970
|
)
|
—
|
|
(5,579
|
)
|
|||||
|
Other
|
279
|
|
96
|
|
112
|
|
|||||
|
Net cash used in financing activities
|
(306,255
|
)
|
(306,899
|
)
|
(65,129
|
)
|
|||||
|
Impact of foreign currency on cash
|
(496
|
)
|
—
|
|
—
|
|
|||||
|
(Decrease) Increase in cash and cash equivalents
|
(108,992
|
)
|
(106,194
|
)
|
248,960
|
|
|||||
|
Cash and cash equivalents:
|
|
|
|
|
|
|
|||||
|
Beginning of year
|
177,539
|
|
283,733
|
|
34,773
|
|
|||||
|
End of year
|
$
|
68,547
|
|
$
|
177,539
|
|
$
|
283,733
|
|
||
The accompanying notes are an integral part of these consolidated financial statements.
43
|
BIG LOTS, INC. AND SUBSIDIARIES
Notes to Consolidated Financial Statements |
Description of Business
We are North America’s largest broadline closeout retailer. At
January 28, 2012
, we operated
1,533
stores in
two
countries: the United States of America ("U.S.") and Canada. Our goal is to strengthen and build upon our leadership position in broadline closeout retailing by providing our customers with great savings on brand-name closeouts and other value-priced merchandise. You can locate us on the Internet at www.biglots.com. The contents of our websites are not part of this report.
Basis of Presentation
The consolidated financial statements include Big Lots, Inc. and all of its subsidiaries, have been prepared in accordance with accounting principles generally accepted in the United States of America (“GAAP”), and include all of our accounts. We consolidate all majority-owned and controlled subsidiaries. All intercompany accounts and transactions have been eliminated.
Management Estimates
The preparation of financial statements in conformity with GAAP requires management to make estimates, judgments, and assumptions that affect the reported amounts of assets and liabilities at the date of the financial statements and the reported amounts of revenues and expenses during the reporting period, as well as the related disclosure of contingent assets and liabilities at the date of the financial statements. The use of estimates, judgments, and assumptions creates a level of uncertainty with respect to reported or disclosed amounts in our consolidated financial statements or accompanying notes. On an ongoing basis, management evaluates its estimates, judgments, and assumptions, including those that management considers critical to the accurate presentation and disclosure of our consolidated financial statements and accompanying notes. Management bases its estimates, judgments, and assumptions on historical experience, current trends, and various other factors that it believes are reasonable under the circumstances. Because of the inherent uncertainty in using estimates, judgments, and assumptions, actual results may differ from these estimates.
Fiscal Periods
Our fiscal year ends on the Saturday nearest to January 31, which results in fiscal years consisting of
52 or 53 weeks
. Unless otherwise stated, references to years in this report relate to fiscal years rather than calendar years. Fiscal year
2011
(“
2011
”) is comprised of the 52 weeks that began on January 30, 2011 and ended on
January 28, 2012
. Fiscal year
2010
(“
2010
”) was comprised of the 52 weeks that began on January 31, 2010 and ended on
January 29, 2011
. Fiscal year
2009
(“
2009
”)was comprised of the 52 weeks that began on February 1, 2009 and ended on
January 30, 2010
.
Segment Reporting
We manage our broadline closeout retailing business based on two segments: the U.S. and Canada. At the end of
2010
and
2009
, we operated only one segment as all of our operations were located within the U.S. at those times.
Cash and Cash Equivalents
Cash and cash equivalents primarily consist of amounts on deposit with financial institutions, outstanding checks, credit and debit card receivables, and highly liquid investments, including money market funds and variable rate demand notes, which are unrestricted to withdrawal or use and which have an original maturity of three months or less. We review cash and cash equivalent balances on a bank by bank basis in order to identify book overdrafts. Book overdrafts occur when the amount of outstanding checks exceed the cash deposited at a given bank. We reclassify book overdrafts, if any, to accounts payable on our consolidated balance sheets. Amounts due from banks for credit and debit card transactions are typically settled in less than seven days, and at
January 28, 2012
and
January 29, 2011
, totaled
$34.5 million
and
$29.4 million
, respectively.
Restricted Cash
Our restricted cash served as collateral, in place of an irrevocable stand-by letter of credit, to provide financial assurance that we would fulfill our obligations with respect to cash requirements associated with self-insurance, as discussed in note 10. The cash was on deposit with our insurance carrier.
44
Investments
Investment securities are classified as available-for-sale, held-to-maturity, or trading at the date of purchase. Investments are recorded at fair value as either current assets or non-current assets based on the stated maturity or our plans to either hold or sell the investment. Unrealized holding gains and losses on trading securities are recognized in earnings. Unrealized holding gains and losses on available-for-sale securities are recognized in other comprehensive income, until realized. We did not own any held-to-maturity or available-for-sale securities as of
January 28, 2012
and
January 29, 2011
.
Merchandise Inventories
Merchandise inventories are valued at the lower of cost or market using the average cost retail inventory method. Cost includes any applicable inbound shipping and handling costs associated with the receipt of merchandise into our distribution centers (See the discussion below under the caption “Selling and Administrative Expenses” for additional information regarding outbound shipping and handling costs to our stores). Market is determined based on the estimated net realizable value, which generally is the merchandise selling price. Under the average cost retail inventory method, inventory is segregated into departments of merchandise having similar characteristics at its current retail selling value. Current retail selling values are converted to a cost basis by applying an average cost factor to each specific merchandise department's retail selling value. Cost factors represent the average cost-to-retail ratio computed using beginning inventory and all fiscal year-to-date purchase activity specific to each merchandise department.
Under the average cost retail inventory method, permanent sales price markdowns result in cost reductions in inventory. Our permanent sales price markdowns are typically related to end of season clearance events and are recorded as a charge to cost of sales in the period of management's decision to initiate sales price reductions with the intent not to return the price to regular retail. Promotional markdowns are recorded as a charge to net sales in the period the merchandise is sold. Promotional markdowns are typically related to specific marketing efforts with respect to products maintained continuously in our stores or products that are only available in limited quantities but represent substantial value to our customers. Promotional markdowns are principally used to drive higher sales volume during a defined promotional period.
We record a reduction to inventories and charge to cost of sales for a shrinkage inventory allowance. The shrinkage allowance is calculated as a percentage of sales for the period from the last physical inventory date to the end of the reporting period. Such estimates are based on our historical and current year experience based on physical inventory results.
We record a reduction to inventories and charge to cost of sales for any excess or obsolete inventory. The excess or obsolete inventory is estimated based on a review of our aged inventory and takes into account any items that have already received a cost reduction as a result of the permanent markdown process discussed above. We estimate the reduction for excess or obsolete inventory based on historical sales trends, age and quantity of product on hand, and anticipated future sales.
Payments Received from Vendors
Payments received from vendors relate primarily to rebates and reimbursement for markdowns and are recognized in our consolidated statements of operations as a reduction to cost of inventory purchases in the period that the rebate or reimbursement is earned or realized and, consequently, result in a reduction in cost of sales when the related inventory is sold.
Store Supplies
When opening a new store, a portion of the initial shipment of supplies (including primarily display materials, signage, security-related items, and miscellaneous store supplies) is capitalized at the store opening date. These capitalized supplies represent more durable types of items for which we expect to receive future economic benefit. Subsequent replenishments of capitalized store supplies are expensed. The consumable/non-durable type items for which the future economic benefit is less measurable are expensed upon shipment to the store. Capitalized store supplies are adjusted periodically for changes in estimated quantities or costs and are included in other current assets in our consolidated balance sheets.
45
Property and Equipment - Net
Depreciation and amortization expense of property and equipment are recorded on a straight‑line basis using estimated service lives. The estimated service lives of our property and equipment by major asset category were as follows:
|
Land improvements
|
15 years
|
|
Buildings
|
40 years
|
|
Leasehold improvements
|
5 years
|
|
Store fixtures and equipment
|
5 years
|
|
Distribution and transportation fixtures and equipment
|
5 - 15 years
|
|
Office and computer equipment
|
5 years
|
|
Computer software costs
|
5 - 8 years
|
|
Company vehicles
|
3 years
|
Leasehold improvements are amortized on a straight-line basis using the shorter of their estimated service lives or the lease term. Because the majority of our leasehold improvements are placed in service at the time we open a store and the majority of our leases have an initial term of five years, we estimate the useful life of leasehold improvements at five years. This amortization period is consistent with the amortization period for any lease incentives that we would typically receive when initially entering into a new lease that are recognized as deferred rent and amortized over the initial lease term.
Depreciation estimates are revised prospectively to reflect the remaining depreciation or amortization of the asset over the shortened estimated service life when a decision is made to dispose of property and equipment prior to the end of its previously estimated service life. The cost of assets sold or retired and the related accumulated depreciation are removed from the accounts with any resulting gain or loss included in selling and administrative expenses. Major repairs that extend service lives are capitalized. Maintenance and repairs are charged to expense as incurred. Capitalized interest was not significant in any period presented.
Long-Lived Assets
Our long-lived assets primarily consist of property and equipment - net. In order to determine if impairment indicators are present for store property and equipment, we review historical operating results at the store level on an annual basis, or when other impairment indicators are present. Generally, all other property and equipment is reviewed for impairment at the enterprise level. If the net book value of a store's long-lived assets is not recoverable by the expected future cash flows of the store, we estimate the fair value of the store's assets and recognize an impairment charge for the excess net book value of the store's long-lived assets over their fair value. Our assumptions related to estimates of future cash flows are based on historical results of cash flows adjusted for management projections for future periods. We estimate the fair value of our long-lived assets using readily available market information for similar assets.
Goodwill
Instead of being amortized, goodwill is tested for impairment annually and whenever events or changes in circumstances indicate the carrying value of the asset may not be recoverable. We use an income approach and a market approach in determining fair value for purposes of goodwill impairment tests. We will perform our annual impairment testing during our second fiscal quarter of each year.
Closed Store Accounting
We recognize an obligation for the fair value of lease termination costs when we cease using the leased property in our operations. In measuring fair value of these lease termination obligations, we consider the remaining minimum lease payments, estimated sublease rentals that could be reasonably obtained, and other potentially mitigating factors. We discount the estimated obligation using the applicable credit adjusted interest rate, resulting in accretion expense in periods subsequent to the period of initial measurement. We monitor the estimated obligation for lease termination liabilities in subsequent periods and revise any estimated liabilities, if necessary. Severance and benefits associated with terminating employees from employment are recognized ratably from the communication date through the estimated future service period, unless the estimated future service period is less than 60 days, in which case we recognize the impact at the communication date. Generally all other store closing costs are recognized when incurred.
46
We classify the results of operations of closed stores to discontinued operations when the operations and cash flows of the stores have been (or will be) eliminated from ongoing operations and we no longer have any significant continuing involvement in the operations associated with the stores after closure. We generally meet the second criteria on all closed stores as, upon closure, operations cease and we have no continuing involvement. To determine if cash flows have been (or will be) eliminated from ongoing operations, we evaluate a number of qualitative and quantitative factors, including, but not limited to, proximity of a closing store to any remaining open stores and the estimated sales migration from the closed store to any stores remaining open. The estimated sales migration is based on historical estimates of our sales migration upon opening or closing a store in a similar market. For purposes of reporting closed stores as discontinued operations, we report net sales, gross margin, and related operating costs that are directly related to and specifically identifiable with respect to the stores' operations identified as discontinued operations. Certain corporate-level charges, such as general office cost, field operations, national advertising, fixed distribution costs, and interest cost are not allocated to closed stores' discontinued operations because we believe that these costs are not specific to the stores' operations.
Income Taxes
We account for income taxes under the asset and liability method, which requires the recognition of deferred tax assets and liabilities for the expected future tax consequences of events that have been included in the financial statements. Under this method, deferred tax assets and liabilities are determined based on the differences between the financial statement basis and tax basis of assets and liabilities using enacted law and tax rates in effect for the year in which the differences are expected to reverse. The effect of a change in tax rates on deferred tax assets and liabilities is recognized in income in the period that includes the enactment date.
We assess the adequacy and need for a valuation allowance for deferred tax assets. In making such determination, we consider all available positive and negative evidence, including scheduled reversals of deferred tax liabilities, projected future taxable income, tax planning strategies and recent financial operations. We have established a valuation allowance to reduce our deferred tax assets to the balance that is more likely than not to be realized.
We recognize interest and penalties related to unrecognized tax benefits within the income tax expense line in the accompanying consolidated statements of operations. Accrued interest and penalties are included within the related tax liability line in the accompanying consolidated balance sheets.
The effective income tax rate in any period may be materially impacted by the overall level of income (loss) before income taxes, the jurisdictional mix and magnitude of income (loss), changes in the income tax laws (which may be retroactive to the beginning of the fiscal year), subsequent recognition, de-recognition and/or measurement of an uncertain tax benefit, changes in a deferred tax valuation allowance, and adjustments of a deferred tax asset or liability for enacted changes in tax laws or rates.
Pension
Pension assumptions are evaluated each year. Actuarial valuations are used to calculate the estimated expenses and obligations related to our pension plans. We review external data and historical trends to help determine the discount rate and expected long-term rate of return. Our objective in selecting a discount rate is to identify the best estimate of the rate at which the benefit obligations would be settled on the measurement date. In making this estimate, we review rates of return on high-quality, fixed-income investments available at the measurement date and expected to be available during the period to maturity of the benefits. This process includes a review of the bonds available on the measurement date with a quality rating of Aa or better. The expected long-term rate of return on assets is derived from detailed periodic studies, which include a review of asset allocation strategies, anticipated future long-term performance of individual asset classes, risks (standard deviations), and correlations of returns among the asset classes that comprise the plan's asset mix. While the studies give appropriate consideration to recent plan performance and historical returns, the assumption for the expected long-term rate of return is primarily based on our expectation of a long-term, prospective rate of return.
Insurance and Insurance-Related Reserves
We are self-insured for certain losses relating to property, general liability, workers' compensation, and employee medical and dental benefit claims, a portion of which is paid by employees. We purchase stop-loss coverage to limit significant exposure in these areas. Accrued insurance-related liabilities and related expenses are based on actual claims filed and estimates of claims incurred but not reported. The estimated accruals are determined by applying actuarially-based calculations. General liability and workers' compensation liabilities are recorded at our estimate of their net present value, using a 4% discount rate, while other liabilities for insurance-related reserves are not discounted.
47
Fair Value of Financial Instruments
The fair value hierarchy prioritizes the inputs to valuation techniques used to measure fair value. The hierarchy, as defined below, gives the highest priority to unadjusted quoted prices in active markets for identical assets or liabilities and the lowest priority to unobservable inputs.
Level 1, defined as observable inputs such as unadjusted quoted prices in active markets for identical assets or liabilities.
Level 2, defined as observable inputs other than Level 1 inputs. These include quoted prices for similar assets or liabilities in an active market, quoted prices for identical assets and liabilities in markets that are not active, or other inputs that are observable or can be corroborated by observable market data for substantially the full term of the assets or liabilities.
Level 3, defined as unobservable inputs in which little or no market data exists, therefore requiring an entity to develop its own assumptions.
The carrying value of cash equivalents, accounts receivable, accounts payable, and accrued expenses approximates fair value because of the relatively short maturity of these items.
Commitments and Contingencies
We are subject to various claims and contingencies including legal actions and other claims arising out of the normal course of business. In connection with such claims and contingencies, we estimate the likelihood and amount of any potential obligation, where it is possible to do so, using management's judgment. Management used various internal and external specialists to assist in the estimating process. We accrue, if material, a liability if the likelihood of an adverse outcome is probable and the amount is estimable. If the likelihood of an adverse outcome is only reasonably possible (as opposed to probable), or if it is probable but an estimate is not determinable, disclosure of a material claim or contingency is made in the notes to our consolidated financial statements and no accrual is made.
Revenue Recognition
We recognize sales at the time the customer takes possession of the merchandise. Sales are recorded net of discounts and estimated returns and exclude any sales tax. The reserve for merchandise returns is estimated based on our prior return experience.
We sell gift cards in our stores and issue merchandise credits, typically as a result of customer returns, on stored value cards. We do not charge administrative fees on unused gift card or merchandise credit balances and our gift cards and merchandise credits do not expire. We recognize sales revenue from gift cards and merchandise credits when (1) the gift card or merchandise credit is redeemed in a sales transaction by the customer or (2) breakage occurs. We recognize gift card and merchandise credit breakage when we estimate that the likelihood of the card or credit being redeemed by the customer is remote and we determine that we do not have a legal obligation to remit the value of unredeemed cards or credits to the relevant regulatory authority. We estimate breakage based upon historical redemption patterns. For
2011
,
2010
, and
2009
, we recognized in net sales on our consolidated statements of operations breakage of
$0.6 million
,
$0.7 million
, and
$0.6 million
, respectively, related to unredeemed gift card and merchandise credit balances that had aged at least four years beyond the end of their original issuance month. The liability for the unredeemed cash value of gift cards and merchandise credits is recorded in accrued operating expenses.
We offer price hold contracts on merchandise. Revenue for price hold contracts is recognized when the customer makes the final payment and takes possession of the merchandise. Amounts paid by customers under price hold contracts are recorded in accrued operating expenses until a sale is consummated.
Cost of Sales
Cost of sales includes the cost of merchandise, net of cash discounts and rebates, markdowns, and inventory shrinkage. Cost of merchandise includes related inbound freight to our distribution centers, duties, and commissions. We classify warehousing and outbound distribution and transportation costs as selling and administrative expenses. Due to this classification, our gross margin rates may not be comparable to those of other retailers that include warehousing and outbound distribution and transportation costs in cost of sales.
48
Selling and Administrative Expenses
Selling and administrative expenses include store expenses (such as payroll and occupancy costs) and costs related to warehousing, distribution, outbound transportation to our stores, advertising, purchasing, insurance and insurance-related, non-income taxes, and overhead. Selling and administrative expense rates may not be comparable to those of other retailers that include warehousing, distribution, and outbound transportation costs in cost of sales. Distribution and outbound transportation costs included in selling and administrative expenses were
$161.3 million
,
$154.3 million
, and
$158.4 million
for
2011
,
2010
, and
2009
, respectively.
Rent Expense
Rent expense is recognized over the term of the lease and is included in selling and administrative expenses. We recognize minimum rent starting when possession of the property is taken from the landlord, which normally includes a construction or set-up period prior to store opening. When a lease contains a predetermined fixed escalation of the minimum rent, we recognize the related rent expense on a straight-line basis and record the difference between the recognized rental expense and the amounts payable under the lease as deferred incentive rent. We also receive tenant allowances, which are recorded in deferred incentive rent and are amortized as a reduction to rent expense over the term of the lease.
Our leases generally obligate us for our applicable portion of real estate taxes, common area maintenance (“CAM”), and property insurance that has been incurred by the landlord with respect to the leased property. We maintain accruals for our estimated applicable portion of real estate taxes, CAM, and property insurance incurred but not settled at each reporting date. We estimate these accruals based on historical payments made and take into account any known trends. Inherent in these estimates is the risk that actual costs incurred by landlords and the resulting payments by us may be higher or lower than the amounts we have recorded on our books.
Certain of our leases provide for contingent rents that are not measurable at the lease inception date. Contingent rent includes rent based on a percentage of sales that are in excess of a predetermined level. Contingent rent is excluded from minimum rent and is included in the determination of total rent expense when it is probable that the expense has been incurred and the amount is reasonably estimable.
Advertising Expense
Advertising costs, which are expensed as incurred, consist primarily of television and print advertising, internet marketing and advertising, and in-store point-of-purchase presentations. Advertising expenses are included in selling and administrative expenses. Advertising expenses were
$99.0 million
,
$92.0 million
, and
$96.2 million
for
2011
,
2010
, and
2009
, respectively.
Store Pre-opening Costs
Pre-opening costs incurred during the construction periods for new store openings are expensed as incurred.
Share-Based Compensation
Share-based compensation expense is recognized in selling and administrative expense in our consolidated statements of operations for all options that we expect to vest. We estimate forfeitures based on historical information. We value and expense stock options with graded vesting as a single award with an average estimated life over the entire term of the award. The expense for options with graded vesting is recorded straight-line over the vesting period. We estimate the fair value of stock options using a binomial model. The binomial model takes into account variables such as volatility, dividend yield rate, risk-free rate, contractual term of the option, the probability that the option will be exercised prior to the end of its contractual life, and the probability of retirement of the option holder in computing the value of the option. Expected volatility is based on historical and current implied volatilities from traded options on our common shares. The dividend yield on our common shares is assumed to be zero since we have not paid dividends and have no current plans to do so in the future. The risk-free rate is based on U.S. Treasury security yields at the time of the grant. The expected life is determined from the binomial model, which incorporates exercise and post-vesting forfeiture assumptions based on analysis of historical data.
Compensation expense for performance-based non-vested restricted stock awards is recorded based on fair value of the award on the grant date and the estimated achievement date of the performance criteria. An estimated target achievement date is determined at the time of the award based on historical and forecasted performance of similar measures. We monitor the projected achievement of the performance targets at each reporting period and make prospective adjustments to the estimated vesting period when our internal models indicate that the estimated achievement date differs from the date being used to amortize expense.
49
Earnings per Share
Basic earnings per share is based on the weighted-average number of shares outstanding during each period. Diluted earnings per share is based on the weighted-average number of shares outstanding during each period and the additional dilutive effect of stock options and non-vested restricted stock awards, calculated using the treasury stock method.
Guarantees
We have lease guarantees which were issued prior to January 1, 2003. We record a liability for these lease guarantees in the period when it becomes probable that the obligor will fail to perform its obligation and if the amount of our guarantee obligation is estimable.
Foreign Currency Translation
The functional currency of our international subsidiary is the local currency of the country in which the subsidiary is located. We have one foreign subsidiary domiciled in Canada. Foreign currency denominated assets and liabilities are translated into U.S. Dollars using the exchange rate in effect at the consolidated balance sheet date. Results of operations and cash flows are translated using the average exchange rates throughout the period. The effect of exchange rate fluctuations on translation of assets and liabilities is included as a component of shareholders’ equity in accumulated other comprehensive income (loss). Gains and losses from foreign currency transactions, which are included in other income (expense), were
$(0.4) million
for 2011.
Other Comprehensive Income
Our other comprehensive income includes the impact of the amortization of our pension actuarial loss, net of tax, the revaluation of our pension actuarial loss, net of tax, and the impact of foreign currency translation.
Supplemental Cash Flow Disclosures
The following table provides supplemental cash flow information for
2011
,
2010
, and
2009
:
|
2011
|
2010
|
2009
|
|||||||||
|
(In thousands)
|
|||||||||||
|
Supplemental disclosure of cash flow information:
|
|
|
|
|
|
|
|||||
|
Cash paid for interest, including capital leases
|
$
|
2,742
|
|
$
|
830
|
|
$
|
277
|
|
||
|
Cash paid for income taxes, excluding impact of refunds
|
$
|
114,406
|
|
$
|
100,973
|
|
$
|
105,961
|
|
||
|
Non-cash activity:
|
|
|
|
|
|
|
|||||
|
Assets acquired under capital leases
|
$
|
2,925
|
|
$
|
—
|
|
$
|
—
|
|
||
|
Accrued property and equipment
|
$
|
8,711
|
|
$
|
9,449
|
|
$
|
3,901
|
|
||
|
Notes payable assumed in acquisition
|
$
|
16,664
|
|
$
|
—
|
|
$
|
—
|
|
||
During 2011, our gross proceeds from borrowings under the bank credit facility were
$846.3 million
and our gross repayments of borrowings under the bank credit facility were
$780.4 million
.
Reclassifications
In the third quarter of 2011, we realigned the merchandise categories in our U.S. segment to be consistent with the realignment of our merchandising team and changes to our management reporting. Prior to the third quarter of 2011, we reported sales in the former Hardlines category and the former Other category. We moved the electronics department out of the former Hardlines category and repositioned it in the former Other category, which was renamed Play n' Wear. We also moved the results of certain large closeout deals that are typically acquired through our alternate product sourcing operations out of the former Other category and repositioned them in the former Hardlines category, which was renamed Hardlines & Other. Additionally, we reclassified the results of all periods presented to reflect this realignment of our merchandise categories.
We reclassified the impact of the excess tax benefit from share-based awards in cash flows from operating activities from the change in assets and liabilities associated with current income taxes to a separate line within the cash flows from operating activities.
50
Recent Accounting Standards - Future Adoptions
Other Comprehensive Income
In June 2011, the Financial Accounting Standards Board (“FASB”) issued Accounting Standard Update (“ASU”) 2011-05,
Comprehensive Income (Topic 220) - Presentation of Comprehensive Income
, which provides new guidance on the presentation of comprehensive income. Specifically, ASU 2011-05 allows an entity to present components of net income and other comprehensive income in one continuous statement, referred to as the statement of comprehensive income, or in two separate, but consecutive statements. ASU 2011-05 eliminates the current option to report other comprehensive income and its components in the statement of shareholders' equity. While the new guidance changes the presentation of comprehensive income, there are no changes to the components that are recognized in net income or other comprehensive income under current accounting guidance. This new guidance is effective for fiscal years and interim periods beginning after December 15, 2011. Separately, in November 2011, the FASB issued ASU 2011-12 which amended the guidance under ASU 2011-05 to defer certain proposed changes to the presentation of reclassification adjustments. We do not believe our adoption of this guidance in the first quarter of 2012 will have a material effect on our financial condition, results of operations, or liquidity.
Subsequent Events
We have evaluated events and transactions subsequent to the balance sheet date. Based on this evaluation, we are not aware of any events or transactions (other than those disclosed elsewhere) that occurred subsequent to the balance sheet date but prior to filing that would require recognition or disclosure in our consolidated financial statements.
Property and equipment - net consist of:
|
January 28, 2012
|
January 29, 2011
|
|||||
|
(In thousands)
|
||||||
|
Land and land improvements
|
$
|
45,130
|
|
$
|
45,104
|
|
|
Buildings and leasehold improvements
|
768,074
|
|
734,578
|
|
||
|
Fixtures and equipment
|
637,658
|
|
605,492
|
|
||
|
Computer software costs
|
87,290
|
|
84,738
|
|
||
|
Transportation equipment
|
35,604
|
|
21,652
|
|
||
|
Construction-in-progress
|
38,230
|
|
20,592
|
|
||
|
Property and equipment - cost
|
1,611,986
|
|
1,512,156
|
|
||
|
Less accumulated depreciation and amortization
|
1,039,219
|
|
987,250
|
|
||
|
Property and equipment - net
|
$
|
572,767
|
|
$
|
524,906
|
|
Property and equipment - cost includes
$5.8 million
and
$7.3 million
at
January 28, 2012
and
January 29, 2011
, respectively, to recognize assets from capital leases. Accumulated depreciation and amortization includes
$2.7 million
and
$5.2 million
at
January 28, 2012
and
January 29, 2011
, respectively, related to capital leases.
During
2011
and
2010
, respectively, we invested
$131.3 million
and
$107.6 million
of cash in capital expenditures and we recorded
$90.3 million
and
$78.6 million
of depreciation expense.
We incurred
$2.2 million
, less than
$0.1 million
, and
$0.4 million
in asset impairment charges in
2011
,
2010
, and
2009
, respectively. The charges in
2011
relate to asset impairments from the valuation of the Company's oldest airplane. The charges in
2010
and
2009
principally related to the write-down of long-lived assets at one and four stores identified as part of our annual store impairment review in
2010
and
2009
, respectively. There were no charges in
2011
related to the Company's annual store impairment review.
Asset impairment charges are included in selling and administrative expenses in our accompanying consolidated statements of operations. We perform annual impairment reviews of our long-lived assets at the store level. When we perform the annual impairment reviews, we first determine which stores had impairment indicators present. We use actual historical cash flows to determine which stores had negative cash flows within the past two years. For each store with negative cash flows, we obtain future cash flow estimates based on operating performance estimates specific to each store's operations that are based on
51
assumptions currently being used to develop our company level operating plans. If the net book value of a store's long-lived assets is not recoverable by the expected future cash flows of the store, we estimate the fair value of the store's assets and recognize an impairment charge for the excess net book value of the store's long-lived assets over their fair value. The fair value of store assets is estimated based on information available in the marketplace for similar assets.
On July 22, 2011, we entered into a new
$700 million
five-year unsecured credit facility ("2011 Credit Agreement"). The 2011 Credit Agreement replaced the
$500 million
three-year unsecured credit facility we entered into on April 28, 2009 (“2009 Credit Agreement”). The 2009 Credit Agreement was scheduled to expire on April 28, 2012, but was terminated concurrently with our entry into the 2011 Credit Agreement. We did not incur any material termination penalties in connection with the termination of the 2009 Credit Agreement.
The 2011 Credit Agreement expires on July 22, 2016. In connection with our entry into the 2011 Credit Agreement, we paid bank fees and other expenses in the aggregate amount of
$3.0 million
, which are being amortized over the term of the agreement. Borrowings under the 2011 Credit Agreement are available for general corporate purposes, working capital, and to repay certain of our indebtedness, including amounts due under the 2009 Credit Agreement. The 2011 Credit Agreement includes a
$10 million
Canadian swing loan sublimit, a
$30 million
U.S. swing loan sublimit, a
$150 million
letter of credit sublimit and a
$200 million
Canadian revolving credit loan subfacility. The interest rates, pricing and fees under the 2011 Credit Agreement fluctuate based on our debt rating. The 2011 Credit Agreement allows us to select our interest rate for each borrowing from multiple interest rate options. The interest rate options are generally derived from the prime rate, LIBOR, or CDOR. We may prepay revolving loans made under the 2011 Credit Agreement. The 2011 Credit Agreement contains financial and other covenants, including, but not limited to, limitations on indebtedness, liens and investments, as well as the maintenance of two financial ratios – a leverage ratio and a fixed charge coverage ratio. A violation of any of the covenants could result in a default under the 2011 Credit Agreement that would permit the lenders to restrict our ability to further access the 2011 Credit Agreement for loans and letters of credit and require the immediate repayment of any outstanding loans under the 2011 Credit Agreement. At
January 28, 2012
, we had borrowings of
$65.9 million
and
$55.2 million
was committed to outstanding letters of credit, leaving
$578.9 million
available under the 2011 Credit Agreement.
In connection with our nonqualified deferred compensation plan, we had mutual fund investments of
$19.6 million
and
$19.2 million
at
January 28, 2012
and
January 29, 2011
, respectively, which were recorded in other assets. These investments were classified as trading securities and were recorded at their fair value. The fair values of mutual fund investments were Level 1 valuations under the fair value hierarchy because each fund’s quoted market value per share was available in an active market.
Included in cash and cash equivalents were amounts on deposit with financial institutions totaling
$60.3 million
at
January 29, 2011
, stated at cost, which approximates fair value. We had
no
such deposits at
January 28, 2012
.
At
January 28, 2012
and
January 29, 2011
, cash and cash equivalents carried at fair value was comprised of the following:
|
|
January 28, 2012
|
|||||||||||
|
(In thousands)
|
Total
|
Level 1
|
Level 2
|
Level 3
|
||||||||
|
Money market funds
|
$
|
—
|
|
$
|
—
|
|
$
|
—
|
|
$
|
—
|
|
|
Variable rate demand notes
|
—
|
|
—
|
|
—
|
|
—
|
|
||||
|
Total
|
$
|
—
|
|
$
|
—
|
|
$
|
—
|
|
$
|
—
|
|
|
|
January 29, 2011
|
|||||||||||
|
(In thousands)
|
Total
|
Level 1
|
Level 2
|
Level 3
|
||||||||
|
Money market funds
|
$
|
40,800
|
|
$
|
40,800
|
|
$
|
—
|
|
$
|
—
|
|
|
Variable rate demand notes
|
25,000
|
|
—
|
|
25,000
|
|
—
|
|
||||
|
Total
|
$
|
65,800
|
|
$
|
40,800
|
|
$
|
25,000
|
|
$
|
—
|
|
52
Variable rate demand notes are issued by various corporate, non-profit and governmental entities that are of high credit quality with many being secured by direct-pay letters of credit from a major financial institution. In addition, variable rate demand notes can be tendered for sale upon notice (generally no longer than seven days) to the original issuer, at par plus accrued interest.
Leased property consisted primarily of
1,479
of our retail stores,
0.4 million
square feet of warehouse space, and certain transportation equipment, and information technology and other office equipment. Many of the store leases obligate us to pay for our applicable portion of real estate taxes, CAM, and property insurance. Certain store leases provide for contingent rents, have rent escalations, and have tenant allowances or other lease incentives. Many of our leases contain provisions for options to renew or extend the original term for additional periods.
Total rent expense, including real estate taxes, CAM, and property insurance, charged to continuing operations for operating leases consisted of the following:
|
2011
|
2010
|
2009
|
|||||||
|
(In thousands)
|
|||||||||
|
Minimum leases
|
$
|
285,081
|
|
$
|
261,197
|
|
$
|
254,054
|
|
|
Contingent leases
|
637
|
|
587
|
|
313
|
|
|||
|
Total rent expense
|
$
|
285,718
|
|
$
|
261,784
|
|
$
|
254,367
|
|
Future minimum rental commitments for leases, excluding closed store leases, real estate taxes, CAM, and property insurance, at
January 28, 2012
, were as follows:
|
Fiscal Year
|
|||
|
(In thousands)
|
|||
|
2012
|
$
|
238,087
|
|
|
2013
|
207,276
|
|
|
|
2014
|
162,867
|
|
|
|
2015
|
117,745
|
|
|
|
2016
|
80,548
|
|
|
|
Thereafter
|
120,861
|
|
|
|
Total leases
|
$
|
927,384
|
|
We have obligations for capital leases for office equipment, included in accrued operating expenses and other liabilities on our consolidated balance sheet. Scheduled payments for all capital leases at
January 28, 2012
, were as follows:
|
Fiscal Year
|
|||
|
(In thousands)
|
|||
|
2012
|
$
|
1,340
|
|
|
2013
|
998
|
|
|
|
2014
|
793
|
|
|
|
2015
|
29
|
|
|
|
2016
|
2
|
|
|
|
Thereafter
|
—
|
|
|
|
Total lease payments
|
$
|
3,162
|
|
|
Less amount to discount to present value
|
(125
|
)
|
|
|
Capital lease obligation per balance sheet
|
$
|
3,037
|
|
53
Earnings per Share
There were no adjustments required to be made to weighted-average common shares outstanding for purposes of computing basic and diluted earnings per share and there were no securities outstanding in any year presented, which were excluded from the computation of earnings per share other than antidilutive employee and director stock options and non-vested restricted stock awards. At the end of
2011
,
2010
, and
2009
, stock options outstanding of
1.5 million
,
0.9 million
, and
2.9 million
, respectively, were excluded from the diluted share calculation because their impact was antidilutive. Antidilutive options are excluded from the calculation because they decrease the number of diluted shares outstanding under the treasury stock method. Antidilutive options are generally outstanding options where the exercise price per share is greater than the weighted-average market price per share for our common shares for each period. The number of shares of non-vested restricted stock that were antidilutive, as determined under the treasury stock method, is immaterial for all years presented.
A reconciliation of the number of weighted-average common shares outstanding used in the basic and diluted earnings per share computations is as follows:
|
2011
|
2010
|
2009
|
||||
|
(in thousands)
|
||||||
|
Weighted-average common shares outstanding:
|
||||||
|
Basic
|
68,316
|
|
77,596
|
|
81,619
|
|
|
Dilutive effect of stock options and restricted common shares
|
1,103
|
|
985
|
|
1,062
|
|
|
Diluted
|
69,419
|
|
78,581
|
|
82,681
|
|
Share Repurchase Programs
In December 2009, our Board of Directors authorized a share repurchase program providing for the repurchase of up to
$150.0 million
of our common shares. On March 2, 2010, our Board of Directors authorized a
$250.0 million
increase to our repurchase program bringing the total authorization to
$400.0 million
(collectively, the “2010 Repurchase Program”). On May 25, 2011, our Board of Directors authorized a share repurchase program providing for the repurchase of up to an additional
$400.0 million
of our common shares (“2011 Repurchase Program”).
During
2011
, we acquired approximately
11.0 million
of our outstanding common shares for
$359.3 million
, which exhausted the authorization under the 2010 Repurchase Program and also included repurchases under the 2011 Repurchase Program.
Our remaining repurchase authorization under the 2011 Repurchase Program was approximately
$98.5 million
at
January 28, 2012
, and is available to be utilized in the open market and/or in privately negotiated transactions at our discretion, subject to market conditions and other factors. Common shares acquired through the repurchase programs are held in treasury at cost and are available to meet obligations under equity compensation plans and for general corporate purposes. The 2011 Repurchase Program has no scheduled termination date and will be funded with cash and cash equivalents, cash generated from operations or, if needed, by drawing on the 2011 Credit Agreement.
54
Our shareholders initially approved our existing equity compensation plan, the Big Lots 2005 Long-Term Incentive Plan (“2005 LTIP”) in May 2005, approved an amendment in May 2008, and approved the amended and restated 2005 LTIP effective May 27, 2010. The 2005 LTIP authorizes the issuance of incentive and nonqualified stock options, restricted stock, restricted stock units, performance units, and stock appreciation rights. We have not issued incentive stock options, restricted stock units, performance units, or stock appreciation rights under the 2005 LTIP. The number of common shares available for issuance under the 2005 LTIP consists of: 1) an initial allocation of
1,250,000
common shares; 2)
2,001,142
common shares, the number of common shares that were available under the predecessor Big Lots, Inc. 1996 Performance Incentive Plan (“1996 LTIP”) upon its expiration; 3)
2,100,000
common shares approved by our shareholders in May 2008; and 4) an annual increase equal to
0.75%
of the total number of issued common shares (including treasury shares) as of the start of each of our fiscal years during which the 2005 LTIP is in effect. The Compensation Committee of our Board of Directors (“Committee”), which is charged with administering the 2005 LTIP, has the authority to determine the terms of each award. Nonqualified stock options granted to employees under the 2005 LTIP, the exercise price of which may not be less than the fair market value of the underlying common shares on the grant date, generally expire on the earlier of: 1) the
seven
year term set by the Committee; or 2)
one
year following termination of employment, death, or disability. The nonqualified stock options generally vest ratably over a
four
-year period; however, upon a change in control, all awards outstanding automatically vest.
In addition to the 2005 LTIP, we previously maintained the Big Lots Director Stock Option Plan ("Director Stock Option Plan") for non-employee directors. The Director Stock Option Plan was administered by the Committee pursuant to an established formula. Neither the Board of Directors nor the Committee exercised any discretion in administration of the Director Stock Option Plan. Grants were made annually at an exercise price equal to the fair market value of the underlying common shares on the date of grant. The annual grants to each non-employee director of an option to acquire
10,000
of our common shares became fully exercisable over a
three
‑year period:
20%
of the shares on the first anniversary,
60%
on the second anniversary, and
100%
on the third anniversary. Stock options granted to non-employee directors expire on the earlier of: 1)
10
years plus one month; 2)
one
year following death or disability; or 3) at the end of our next trading window one year following termination. In connection with the amendment to the 2005 LTIP in May 2008, our Board of Directors amended the Director Stock Option Plan so that no additional awards may be made under that plan. Our non-employee directors did not receive any stock options in
2011
,
2010
, and
2009
, but did, as discussed below, receive restricted stock awards under the 2005 LTIP.
Share-based compensation expense was
$25.0 million
,
$24.6 million
and
$20.3 million
in
2011
,
2010
, and
2009
, respectively. We use a binomial model to estimate the fair value of stock options on the grant date. The binomial model takes into account variables such as volatility, dividend yield rate, risk-free rate, contractual term of the option, the probability that the option will be exercised prior to the end of its contractual life, and the probability of retirement of the option holder in computing the value of the option. Expected volatility is based on historical and current implied volatilities from traded options on our common shares. The dividend yield on our common shares is assumed to be zero since we have not paid dividends and have no current plans to do so in the future. The risk-free rate is based on U.S. Treasury security yields at the time of the grant. The expected life is determined from the binomial model, which incorporates exercise and post-vesting forfeiture assumptions based on analysis of historical data.
The weighted-average fair value of stock options granted and assumptions used in the stock option pricing model for each of the respective periods were as follows:
|
|
2011
|
2010
|
2009
|
||||||
|
Weighted-average fair value of stock options granted
|
$
|
14.43
|
|
$
|
13.64
|
|
$
|
7.89
|
|
|
Risk-free interest rates
|
1.8
|
%
|
2.2
|
%
|
1.7
|
%
|
|||
|
Expected life (years)
|
4.2
|
|
4.2
|
|
4.3
|
|
|||
|
Expected volatility
|
41.7
|
%
|
45.6
|
%
|
56.0
|
%
|
|||
|
Expected annual forfeiture rate
|
1.5
|
%
|
1.5
|
%
|
1.5
|
%
|
|||
55
The following table summarizes information about our stock options outstanding and exercisable at
January 28, 2012
:
|
Range of Prices
|
Options Outstanding
|
Options Exercisable
|
||||||||||||||||||
|
Greater Than
|
Less Than or Equal to
|
Options Outstanding
|
Weighted-Average Remaining Life (Years)
|
Weighted-Average Exercise Price
|
Options Exercisable
|
Weighted-Average Exercise Price
|
||||||||||||||
|
$
|
10.01
|
|
$
|
20.00
|
|
1,071,948
|
|
3.4
|
|
$
|
16.45
|
|
668,198
|
|
$
|
15.83
|
|
|||
|
20.01
|
|
30.00
|
|
991,850
|
|
2.8
|
|
24.95
|
|
784,349
|
|
25.92
|
|
|||||||
|
30.01
|
|
40.00
|
|
837,125
|
|
5.2
|
|
35.76
|
|
211,625
|
|
35.82
|
|
|||||||
|
$
|
40.01
|
|
$
|
50.00
|
|
775,500
|
|
6.1
|
|
41.20
|
|
2,500
|
|
41.14
|
|
|||||
|
3,676,423
|
|
4.2
|
|
$
|
28.36
|
|
1,666,672
|
|
$
|
23.16
|
|
|||||||||
A summary of the annual stock option activity for fiscal years
2009
,
2010
, and
2011
is as follows:
|
|
Number of Options
|
Weighted Average Exercise Price Per Share
|
Weighted Average Remaining Contractual Term (years)
|
Aggregate Intrinsic Value (000's)
|
||||||
|
Outstanding stock options at January 31, 2009
|
3,960,568
|
|
$
|
19.42
|
|
|||||
|
Granted
|
967,500
|
|
17.62
|
|
||||||
|
Exercised
|
(361,560
|
)
|
13.64
|
|
||||||
|
Forfeited
|
(69,875
|
)
|
21.80
|
|
||||||
|
Outstanding stock options at January 30, 2010
|
4,496,633
|
|
$
|
19.46
|
|
|||||
|
Granted
|
997,500
|
|
35.92
|
|
||||||
|
Exercised
|
(1,807,850
|
)
|
17.98
|
|
||||||
|
Forfeited
|
(107,600
|
)
|
26.10
|
|
||||||
|
Outstanding stock options at January 29, 2011
|
3,578,683
|
|
$
|
24.59
|
|
|||||
|
Granted
|
918,500
|
|
40.85
|
|
||||||
|
Exercised
|
(500,085
|
)
|
20.81
|
|
||||||
|
Forfeited
|
(320,675
|
)
|
33.84
|
|
||||||
|
Outstanding stock options at January 28, 2012
|
3,676,423
|
|
$
|
28.36
|
|
4.2
|
|
$
|
43,724
|
|
|
Vested or expected to vest at January 28, 2012
|
3,617,383
|
|
$
|
28.39
|
|
4.2
|
|
$
|
42,924
|
|
|
Exercisable at January 28, 2012
|
1,666,672
|
|
$
|
23.16
|
|
3.1
|
|
$
|
28,076
|
|
The number of stock options expected to vest was based on our annual forfeiture rate assumption.
56
A summary of the nonvested restricted stock activity for fiscal years
2009
,
2010
, and
2011
is as follows:
|
|
Number of Shares
|
Weighted Average Grant-Date Fair Value Per Share
|
|||
|
Outstanding nonvested restricted stock at January 31, 2009
|
716,275
|
|
$
|
24.81
|
|
|
Granted
|
471,688
|
|
17.91
|
|
|
|
Vested
|
(327,675
|
)
|
28.85
|
|
|
|
Forfeited
|
(10,800
|
)
|
20.50
|
|
|
|
Outstanding nonvested restricted stock at January 30, 2010
|
849,488
|
|
$
|
19.48
|
|
|
Granted
|
507,684
|
|
35.88
|
|
|
|
Vested
|
(847,688
|
)
|
19.46
|
|
|
|
Forfeited
|
(5,700
|
)
|
33.44
|
|
|
|
Outstanding nonvested restricted stock at January 29, 2011
|
503,784
|
|
$
|
35.88
|
|
|
Granted
|
564,589
|
|
40.76
|
|
|
|
Vested
|
(271,784
|
)
|
35.84
|
|
|
|
Forfeited
|
(55,300
|
)
|
38.72
|
|
|
|
Outstanding nonvested restricted stock at January 28, 2012
|
741,289
|
|
$
|
39.40
|
|
The nonvested restricted stock awards granted to employees in
2011
,
2010
, and
2009
(other than the awards granted to our Chairman, CEO and President, Steven S. Fishman in 2011 and 2010) vest if certain financial performance objectives are achieved. If we meet a threshold financial performance objective and the grantee remains employed by us, the restricted stock will vest on the opening of our first trading window
five
years after the grant date of the award. If we meet a higher financial performance objective and the grantee remains employed by us, the restricted stock will vest on the first trading day after we file our Annual Report on Form 10-K with the SEC for the fiscal year in which the higher objective is met.
On the grant date of the
2010
restricted stock awards (other than the award granted to Mr. Fishman), we estimated a
two
-year period for vesting based on the assumed achievement of the higher financial performance objective.
On the grant date of the
2011
restricted stock awards (other than the award granted to Mr. Fishman), we estimated a
three
-year period for vesting based on the assumed achievement of the higher financial performance objective.
The nonvested restricted stock awards granted to Mr. Fishman in
2011
and 2010 vest if we achieve a corporate financial goal for
2011
and
2010
, respectively, and he is employed by us on the anniversary of the grant date of the award. If either of the conditions is not achieved, the restricted stock awards are forfeited. Mr. Fishman's 2010 nonvested restricted stock award vested. Mr. Fishman's
2011
restricted stock is expected to vest after we file this Form 10-K with the SEC.
In
2011
and
2010
, we granted to each of the non-employee members of our Board of Directors restricted stock awards having a fair value on the grant date of approximately
$95,000
. In
2009
, we granted to each of the non-employee members of our Board of Directors restricted stock awards having a fair value on the grant date of approximately
$75,000
. These awards vest on the earlier of 1) the trading day immediately preceding the next annual meeting of our shareholders; or 2) the death or disability of the grantee. However, the restricted stock award will not vest if the non-employee director ceases to serve on our Board of Directors before either vesting event occurs.
57
During
2011
,
2010
, and
2009
, the following activity occurred under our share-based compensation plans:
|
(in thousands)
|
2011
|
2010
|
2009
|
||||||
|
Total intrinsic value of stock options exercised
|
$
|
8,747
|
|
$
|
32,537
|
|
$
|
5,079
|
|
|
Total fair value of restricted stock vested
|
$
|
11,618
|
|
$
|
31,150
|
|
$
|
6,954
|
|
The total unearned compensation cost related to all share-based awards outstanding at
January 28, 2012
was approximately
$26.3 million
. This compensation cost is expected to be recognized through January 2016 based on existing vesting terms with the weighted-average remaining expense recognition period being approximately
1.7
years from
January 28, 2012
.
Pension Benefits
We maintain the Pension Plan and Supplemental Pension Plan covering certain employees whose hire date was on or before April 1, 1994. Benefits under each plan are based on credited years of service and the employee's compensation during the last five years of employment. The Supplemental Pension Plan is maintained for certain highly compensated executives whose benefits were frozen in the Pension Plan in 1996. The Supplemental Pension Plan is designed to pay benefits in the same amount as if the participants continued to accrue benefits under the Pension Plan. We have no obligation to fund the Supplemental Pension Plan, and all assets and amounts payable under the Supplemental Pension Plan are subject to the claims of our general creditors.
The components of net periodic pension expense were comprised of the following:
|
|
2011
|
2010
|
2009
|
||||||
|
(in thousands)
|
|
|
|
||||||
|
Service cost - benefits earned in the period
|
$
|
2,211
|
|
$
|
2,433
|
|
$
|
2,261
|
|
|
Interest cost on projected benefit obligation
|
3,496
|
|
3,254
|
|
3,726
|
|
|||
|
Expected investment return on plan assets
|
(4,627
|
)
|
(4,249
|
)
|
(3,172
|
)
|
|||
|
Amortization of prior service cost
|
(34
|
)
|
(34
|
)
|
(34
|
)
|
|||
|
Amortization of transition obligation
|
13
|
|
13
|
|
13
|
|
|||
|
Amortization of actuarial loss
|
1,796
|
|
2,217
|
|
2,691
|
|
|||
|
Settlement loss
|
298
|
|
1,785
|
|
175
|
|
|||
|
Net periodic pension cost
|
$
|
3,153
|
|
$
|
5,419
|
|
$
|
5,660
|
|
In
2011
,
2010
, and
2009
, we incurred pretax non-cash settlement charges of
$0.3 million
,
$1.8 million
and
$0.2 million
, respectively. The settlement charges were caused by lump sum benefit payments made to plan participants in excess of combined annual service cost and interest cost for each year.
The weighted-average assumptions used to determine net periodic pension expense were:
|
|
2011
|
2010
|
2009
|
|||
|
Discount rate
|
5.7
|
%
|
5.7
|
%
|
7.3
|
%
|
|
Rate of increase in compensation levels
|
3.9
|
%
|
3.5
|
%
|
3.5
|
%
|
|
Expected long-term rate of return
|
8.0
|
%
|
8.0
|
%
|
8.0
|
%
|
58
The weighted-average assumptions used to determine benefit obligations were:
|
2011
|
2010
|
|||
|
Discount rate
|
5.0
|
%
|
5.7
|
%
|
|
Rate of increase in compensation levels
|
3.5
|
%
|
3.9
|
%
|
The following schedule provides a reconciliation of projected benefit obligations, plan assets, funded status, and amounts recognized for the Pension Plan and Supplemental Pension Plan at
January 28, 2012
and
January 29, 2011
:
|
January 28, 2012
|
January 29, 2011
|
|||||
|
(In thousands)
|
||||||
|
Change in projected benefit obligation:
|
||||||
|
Projected benefit obligation at beginning of year
|
$
|
62,554
|
|
$
|
59,526
|
|
|
Service cost
|
2,211
|
|
2,433
|
|
||
|
Interest cost
|
3,496
|
|
3,254
|
|
||
|
Benefits and settlements paid
|
(6,522
|
)
|
(7,135
|
)
|
||
|
Actuarial loss
|
8,203
|
|
4,476
|
|
||
|
Projected benefit obligation at end of year
|
$
|
69,942
|
|
$
|
62,554
|
|
|
Change in plan assets:
|
||||||
|
Fair market value at beginning of year
|
$
|
59,976
|
|
$
|
56,865
|
|
|
Actual return on plan assets
|
4,123
|
|
9,153
|
|
||
|
Employer contributions
|
1,085
|
|
1,093
|
|
||
|
Benefits and settlements paid
|
(6,522
|
)
|
(7,135
|
)
|
||
|
Fair market value at end of year
|
$
|
58,662
|
|
$
|
59,976
|
|
|
Under funded and net amount recognized
|
$
|
(11,280
|
)
|
$
|
(2,578
|
)
|
|
Amounts recognized in the consolidated balance sheets consist of:
|
||||||
|
Noncurrent assets
|
$
|
—
|
|
$
|
3,884
|
|
|
Current liabilities
|
(441
|
)
|
(623
|
)
|
||
|
Noncurrent liabilities
|
(10,839
|
)
|
(5,839
|
)
|
||
|
Net amount recognized
|
$
|
(11,280
|
)
|
$
|
(2,578
|
)
|
The following are components of accumulated other comprehensive income and, as such, are not yet reflected in net periodic pension expense:
|
2011
|
2010
|
|||||
|
(In thousands)
|
||||||
|
Unrecognized transition obligation
|
$
|
(25
|
)
|
$
|
(39
|
)
|
|
Unrecognized past service credit
|
125
|
|
159
|
|
||
|
Unrecognized actuarial loss
|
(24,089
|
)
|
(17,476
|
)
|
||
|
Accumulated other comprehensive loss, pretax
|
$
|
(23,989
|
)
|
$
|
(17,356
|
)
|
We expect to reclassify
$2.7 million
of the actuarial loss along with immaterial amounts of transition obligation and past service credit into net periodic pension expense during 2012.
59
The following table sets forth certain information for the Pension Plan and the Supplemental Pension Plan at
January 28, 2012
and
January 29, 2011
:
|
Pension Plan
|
Supplemental Pension Plan
|
||||||||||||
|
January 28, 2012
|
January 29, 2011
|
January 28, 2012
|
January 29, 2011
|
||||||||||
|
(In thousands)
|
|||||||||||||
|
Projected benefit obligation
|
$
|
62,992
|
|
$
|
56,092
|
|
$
|
6,950
|
|
$
|
6,462
|
|
|
|
Accumulated benefit obligation
|
55,708
|
|
49,127
|
|
5,581
|
|
4,750
|
|
|||||
|
Fair market value of plan assets
|
$
|
58,662
|
|
$
|
59,976
|
|
$
|
—
|
|
$
|
—
|
|
|
We elected not to make a discretionary contribution to the Pension Plan in
2011
or in
2010
. Our funding policy of the Pension Plan is to make annual contributions based on advice from our actuaries and the evaluation of our cash position, but not less than the minimum required by applicable regulations. Currently, we expect no required contributions to the Pension Plan during
2012
, however, discretionary contributions could be made depending upon further analysis.
Using the same assumptions as those used to measure our benefit obligations, the Pension Plan and the Supplemental Pension Plan benefits expected to be paid in each of the following fiscal years are as follows:
|
Fiscal Year
|
|||
|
(In thousands)
|
|||
|
2012
|
$
|
5,355
|
|
|
2013
|
5,330
|
|
|
|
2014
|
5,418
|
|
|
|
2015
|
5,553
|
|
|
|
2016
|
5,649
|
|
|
|
2017 - 2021
|
$
|
28,160
|
|
Our overall investment strategy is to earn a long-term rate of return sufficient to meet the liability needs of the Pension Plan, within prudent risk constraints. In order to develop the appropriate asset allocation and investment strategy, an actuarial review of the Pension Plan's expected future distributions was completed. The strategy provides a well-defined risk management approach designed to reduce risks based on the Pension Plan's funded status.
Assets can generally be considered as filling one of the following roles within the strategy: (1) Liability-hedging assets, which are designed to meet the cash payment needs of the plan's obligation and provide downside protection, primarily invested in intermediate and long maturity investment grade bonds; or (2) Return-seeking assets, which are designed to deliver returns in excess of the Pension Plan's obligation growth rates, with broadly diversified assets including U.S. and non-U.S. equities, real estate, and high yield bonds. The current target allocation is approximately
80%
liability-hedging assets and
20%
return-seeking assets. Target allocations may change over time due to changes in the plan's funded status, or in response to changes in plan or market conditions. All assets must have readily ascertainable market values and be easily marketable. The portfolio of assets maintains a high degree of liquidity in order to meet benefit payment requirements and to allow responsiveness to evolving Pension Plan and market conditions.
Previously, our pension investment policy allowed ownership of our common shares. At
January 28, 2012
and
January 29, 2011
, the Pension Plan owned
zero
and
1,081
of our common shares, respectively.
The investment managers have the discretion to invest within sub-classes of assets within the parameters of their investment guidelines. Fixed income managers can adjust duration exposure as deemed appropriate given current or expected market conditions. Additionally, the investment managers have the authority to invest in financial futures contracts and financial options contracts for the purposes of implementing hedging strategies. There were no futures contracts owned directly by the Pension Plan at
January 28, 2012
and
January 29, 2011
. The primary benchmark for assessing the effectiveness of the Pension Plan investments is that of the plan's liabilities themselves. Asset class returns are also judged relative to common benchmark indices such as the Russell 3000 and Barclay's Capital Long Credit Bond. Investment results and plan funded status are monitored daily, with a detailed performance review completed on a quarterly basis.
60
The fair value of our Pension Plan assets at
January 28, 2012
and
January 29, 2011
by asset category was comprised of the following:
|
January 28, 2012
|
January 29, 2011
|
||||||||||||||||||||||||
|
(In thousands)
|
Total
|
Level 1
|
Level 2
|
Level 3
|
Total
|
Level 1
|
Level 2
|
Level 3
|
|||||||||||||||||
|
Cash and Cash Equivalents
|
$
|
1,196
|
|
$
|
1,196
|
|
$
|
—
|
|
$
|
—
|
|
$
|
1,328
|
|
$
|
1,328
|
|
$
|
—
|
|
$
|
—
|
|
|
|
Equity Securities
|
|||||||||||||||||||||||||
|
Consumer Discretionary
|
—
|
|
—
|
|
—
|
|
—
|
|
645
|
|
645
|
|
—
|
|
—
|
|
|||||||||
|
Consumer Staples
|
—
|
|
—
|
|
—
|
|
—
|
|
156
|
|
156
|
|
—
|
|
—
|
|
|||||||||
|
Energy
|
—
|
|
—
|
|
—
|
|
—
|
|
249
|
|
249
|
|
—
|
|
—
|
|
|||||||||
|
Financial
|
—
|
|
—
|
|
—
|
|
—
|
|
399
|
|
399
|
|
—
|
|
—
|
|
|||||||||
|
Health Care
|
—
|
|
—
|
|
—
|
|
—
|
|
172
|
|
172
|
|
—
|
|
—
|
|
|||||||||
|
Industrials
|
—
|
|
—
|
|
—
|
|
—
|
|
550
|
|
550
|
|
—
|
|
—
|
|
|||||||||
|
Information Technology
|
—
|
|
—
|
|
—
|
|
—
|
|
565
|
|
565
|
|
—
|
|
—
|
|
|||||||||
|
Materials
|
—
|
|
—
|
|
—
|
|
—
|
|
235
|
|
235
|
|
—
|
|
—
|
|
|||||||||
|
Telecommunication Services
|
—
|
|
—
|
|
—
|
|
—
|
|
73
|
|
73
|
|
—
|
|
—
|
|
|||||||||
|
Utilities
|
—
|
|
—
|
|
—
|
|
—
|
|
305
|
|
305
|
|
—
|
|
—
|
|
|||||||||
|
Mutual Funds (a)
|
|||||||||||||||||||||||||
|
Diversified Emerging Markets
|
—
|
|
—
|
|
—
|
|
—
|
|
2,641
|
|
2,641
|
|
—
|
|
—
|
|
|||||||||
|
International Large Blend
|
—
|
|
—
|
|
—
|
|
—
|
|
2,824
|
|
2,824
|
|
—
|
|
—
|
|
|||||||||
|
Large Blend
|
—
|
|
—
|
|
—
|
|
—
|
|
7,797
|
|
7,797
|
|
—
|
|
—
|
|
|||||||||
|
Large Growth
|
—
|
|
—
|
|
—
|
|
—
|
|
5,857
|
|
5,857
|
|
—
|
|
—
|
|
|||||||||
|
Large Value
|
—
|
|
—
|
|
—
|
|
—
|
|
4,731
|
|
4,731
|
|
—
|
|
—
|
|
|||||||||
|
Mid-Cap Growth
|
—
|
|
—
|
|
—
|
|
—
|
|
2,920
|
|
2,920
|
|
—
|
|
—
|
|
|||||||||
|
Mid-Cap Value
|
—
|
|
—
|
|
—
|
|
—
|
|
1,942
|
|
1,942
|
|
—
|
|
—
|
|
|||||||||
|
Real Estate
|
—
|
|
—
|
|
—
|
|
—
|
|
3,410
|
|
3,410
|
|
—
|
|
—
|
|
|||||||||
|
Small Blend
|
—
|
|
—
|
|
—
|
|
—
|
|
5,466
|
|
5,466
|
|
—
|
|
—
|
|
|||||||||
|
Fixed Income Securities
|
|||||||||||||||||||||||||
|
U.S. Government
|
9,016
|
|
2,423
|
|
6,593
|
|
—
|
|
8,774
|
|
3,264
|
|
5,510
|
|
—
|
|
|||||||||
|
Corporate (b)
|
6,776
|
|
—
|
|
6,776
|
|
—
|
|
8,937
|
|
—
|
|
8,937
|
|
—
|
|
|||||||||
|
Mortgage Bonds
|
714
|
|
—
|
|
714
|
|
—
|
|
—
|
|
—
|
|
—
|
|
—
|
|
|||||||||
|
Common / Collective Trusts
|
|||||||||||||||||||||||||
|
Long Credit
|
17,728
|
|
—
|
|
17,728
|
|
—
|
|
—
|
|
—
|
|
—
|
|
—
|
|
|||||||||
|
Intermediate Credit
|
11,258
|
|
—
|
|
11,258
|
|
—
|
|
—
|
|
—
|
|
—
|
|
—
|
|
|||||||||
|
Global Real Estate
|
3,065
|
|
—
|
|
3,065
|
|
—
|
|
—
|
|
—
|
|
—
|
|
—
|
|
|||||||||
|
High Yield
|
2,923
|
|
—
|
|
2,923
|
|
—
|
|
—
|
|
—
|
|
—
|
|
—
|
|
|||||||||
|
International Equities
|
2,413
|
|
—
|
|
2,413
|
|
—
|
|
—
|
|
—
|
|
—
|
|
—
|
|
|||||||||
|
U.S. Equity Index
|
2,369
|
|
—
|
|
2,369
|
|
—
|
|
—
|
|
—
|
|
—
|
|
—
|
|
|||||||||
|
U.S. Small Cap
|
1,204
|
|
—
|
|
1,204
|
|
—
|
|
—
|
|
—
|
|
—
|
|
—
|
|
|||||||||
|
Total
|
$
|
58,662
|
|
$
|
3,619
|
|
$
|
55,043
|
|
—
|
|
$
|
59,976
|
|
$
|
45,529
|
|
$
|
14,447
|
|
—
|
|
|||
(a) Mutual funds are listed by their respective investment strategy as classified by Morningstar Inc.
(b) This category represents investment grade bonds of corporate issuers from diverse industries.
61
Savings Plans
We have a savings plan with a 401(k) deferral feature and a nonqualified deferred compensation plan with a similar deferral feature for eligible employees. We contribute a matching percentage of employee contributions. Our matching contributions are subject to Internal Revenue Service (“IRS”) regulations. For
2011
,
2010
, and
2009
, we expensed
$5.2 million
,
$5.6 million
, and
$5.6 million
, respectively, related to our matching contributions. In connection with our nonqualified deferred compensation plan, we had liabilities of
$20.4 million
and
$20.2 million
at
January 28, 2012
and
January 29, 2011
, respectively.
The provision for income taxes from continuing operations was comprised of the following:
|
2011
|
2010
|
2009
|
|||||||
|
(In thousands)
|
|||||||||
|
Current:
|
|||||||||
|
U.S. Federal
|
$
|
107,410
|
|
$
|
95,124
|
|
$
|
91,083
|
|
|
U.S. State and local
|
16,791
|
|
17,326
|
|
11,890
|
|
|||
|
Non-U.S.
|
—
|
|
—
|
|
—
|
|
|||
|
Total current tax expense
|
124,201
|
|
112,450
|
|
102,973
|
|
|||
|
Deferred:
|
|||||||||
|
U.S. Federal
|
9,203
|
|
20,876
|
|
15,176
|
|
|||
|
U.S. State and local
|
1,253
|
|
(489
|
)
|
3,826
|
|
|||
|
Non-U.S.
|
—
|
|
—
|
|
—
|
|
|||
|
Total deferred tax expense
|
10,456
|
|
20,387
|
|
19,002
|
|
|||
|
Income tax provision
|
$
|
134,657
|
|
$
|
132,837
|
|
$
|
121,975
|
|
Net deferred tax assets fluctuated by items that are not reflected in deferred expense above. The fluctuations in net deferred tax assets related to discontinued operations deferred income tax expense were
$0.1 million
decrease and
$0.5 million
increase for
2010
and
2009
, respectively. There were no fluctuations in deferred tax assets related to discontinued operations in
2011
. Fluctuations related principally to pension-related charges recorded in accumulated other comprehensive income were
$2.6 million
increase,
$1.7 million
decrease, and
$1.4 million
decrease for
2011
,
2010
, and
2009
, respectively. Additionally, net deferred tax assets increased by
$0.2 million
as a result of the establishment of goodwill associated with the acquisition of the U.S. subsidiaries of Liquidation World Inc.
Reconciliation between the statutory federal income tax rate and the effective income tax rate for continuing operations was as follows:
|
2011
|
2010
|
2009
|
||||
|
Statutory federal income tax rate
|
35.0
|
%
|
35.0
|
%
|
35.0
|
%
|
|
Effect of:
|
||||||
|
State and local income taxes, net of federal tax benefit
|
3.4
|
|
3.1
|
|
3.2
|
|
|
Non-U.S. income tax rate differential
|
0.4
|
|
—
|
|
—
|
|
|
Work opportunity tax and other employment tax credits
|
(0.4
|
)
|
(0.3
|
)
|
(0.5
|
)
|
|
Net benefit recognized for prior year tax uncertainties
|
—
|
|
(0.3
|
)
|
—
|
|
|
Valuation allowance
|
1.0
|
|
—
|
|
(0.4
|
)
|
|
Other, net
|
—
|
|
(0.1
|
)
|
0.4
|
|
|
Effective income tax rate
|
39.4
|
%
|
37.4
|
%
|
37.7
|
%
|
62
In 2011, the valuation allowance was associated with the non-U.S. deferred tax expense from our Canadian segment.
Income tax payments and refunds were as follows:
|
2011
|
2010
|
2009
|
|||||||
|
(In thousands)
|
|||||||||
|
Income taxes paid
|
$
|
114,406
|
|
$
|
100,973
|
|
$
|
105,961
|
|
|
Income taxes refunded
|
(983
|
)
|
(837
|
)
|
(694
|
)
|
|||
|
Net income taxes paid
|
$
|
113,423
|
|
$
|
100,136
|
|
$
|
105,267
|
|
Deferred taxes reflect the net tax effects of temporary differences between carrying amounts of assets and liabilities for financial reporting purposes and the amounts used for income tax, including income tax uncertainties. Significant components of our deferred tax assets and liabilities were as follows:
|
January 28, 2012
|
January 29, 2011
|
|||||
|
(In thousands)
|
||||||
|
Deferred tax assets:
|
||||||
|
Workers’ compensation and other insurance reserves
|
$
|
28,998
|
|
$
|
28,437
|
|
|
Compensation related
|
28,788
|
|
29,663
|
|
||
|
Accrued rent
|
26,516
|
|
17,755
|
|
||
|
Uniform inventory capitalization
|
20,289
|
|
21,702
|
|
||
|
Non-U.S. net operating losses
|
19,019
|
|
—
|
|
||
|
Depreciation and fixed asset basis differences
|
10,695
|
|
19,862
|
|
||
|
Accrued state taxes
|
7,779
|
|
8,327
|
|
||
|
Pension plans
|
4,467
|
|
1,049
|
|
||
|
State tax credits, net of federal tax benefit
|
3,390
|
|
2,830
|
|
||
|
Accrued operating liabilities
|
3,023
|
|
1,721
|
|
||
|
State tax net operating losses, net of federal tax benefit
|
710
|
|
1,171
|
|
||
|
KB store lease and other discontinued operations contingencies
|
1,474
|
|
1,409
|
|
||
|
Other
|
24,366
|
|
23,008
|
|
||
|
Valuation allowances - primarily related to Non-U.S. operations
|
(20,392
|
)
|
(1,382
|
)
|
||
|
Total deferred tax assets
|
159,122
|
|
155,552
|
|
||
|
Deferred tax liabilities:
|
||||||
|
Accelerated depreciation and fixed asset basis differences
|
70,569
|
|
58,693
|
|
||
|
Lease construction reimbursements
|
13,584
|
|
12,701
|
|
||
|
Compensation related
|
5,401
|
|
8,101
|
|
||
|
Prepaid expenses
|
5,695
|
|
5,699
|
|
||
|
Other
|
14,540
|
|
13,440
|
|
||
|
Total deferred tax liabilities
|
109,789
|
|
98,634
|
|
||
|
Net deferred tax assets
|
$
|
49,333
|
|
$
|
56,918
|
|
63
Net deferred tax assets are shown separately on our consolidated balance sheets as current and non-current deferred income taxes. The following table summarizes net deferred income tax assets from the consolidated balance sheets:
|
January 28, 2012
|
January 29, 2011
|
|||||
|
(In thousands)
|
||||||
|
Current deferred income taxes
|
$
|
42,784
|
|
$
|
50,252
|
|
|
Noncurrent deferred income taxes
|
6,549
|
|
6,666
|
|
||
|
Net deferred tax assets
|
$
|
49,333
|
|
$
|
56,918
|
|
Based on the weight of currently available evidence, we have fully reduced the provisional amount of net deferred income tax assets (including a net operating loss carryforward) of Big Lots Canada (see note 11), as well as the deferred tax benefit of the loss generated by our Canadian segment since the acquisition, by a valuation allowance.
We have the following income tax loss and credit carryforwards at
January 28, 2012
(amounts are shown net of tax excluding the federal income tax effect of the state and local items):
|
(In thousands)
|
||||||
|
Non-U.S.:
|
||||||
|
Net operating loss carryforwards
|
$
|
19,019
|
|
Expires fiscal years 2026 through 2031
|
||
|
U.S. State and local:
|
||||||
|
State net operating loss carryforwards
|
1,092
|
|
Expires fiscal years 2014 through 2025
|
|||
|
California enterprise zone credits
|
4,931
|
|
No expiration date
|
|||
|
Texas business loss credits
|
285
|
|
Expires fiscal years through 2025
|
|||
|
Total income tax loss and credit carryforwards
|
$
|
25,327
|
|
|||
Income taxes payable on our consolidated balance sheets have been reduced by the tax benefits primarily associated with share-based compensation. We receive an income tax deduction upon the exercise of non-qualified stock options and the vesting of restricted stock. Tax benefits of
$2.7 million
,
$13.8 million
, and
$0.6 million
in
2011
,
2010
, and
2009
, respectively, were credited directly to shareholders' equity related to share-based compensation deductions in excess of expense recognized for these awards.
The Company's Canadian subsidiary has an accumulated retained deficit, thus we have not provided for income taxes in the United States on undistributed earnings.
The following is a tabular reconciliation of the total amounts of unrecognized tax benefits for
2011
,
2010
, and
2009
:
|
2011
|
2010
|
2009
|
|||||||
|
(In thousands)
|
|||||||||
|
Unrecognized tax benefits - opening balance
|
$
|
27,250
|
|
$
|
35,824
|
|
$
|
34,729
|
|
|
Gross increases - tax positions in current year
|
2,179
|
|
1,127
|
|
11,757
|
|
|||
|
Gross increases - tax positions in prior period
|
616
|
|
1,237
|
|
5,556
|
|
|||
|
Gross decreases - tax positions in prior period
|
(9,513
|
)
|
(1,190
|
)
|
(4,101
|
)
|
|||
|
Settlements
|
(2,581
|
)
|
(9,121
|
)
|
(11,944
|
)
|
|||
|
Lapse of statute of limitations
|
(1,196
|
)
|
(627
|
)
|
(173
|
)
|
|||
|
Unrecognized tax benefits - end of year
|
$
|
16,755
|
|
$
|
27,250
|
|
$
|
35,824
|
|
64
At the end of
2011
and
2010
, the total amount of unrecognized tax benefits that, if recognized, would affect the effective income tax rate is
$11.0 million
and
$20.1 million
, respectively, after considering the federal tax benefit of state and local income taxes of
$4.9 million
and
$5.3 million
respectively. Unrecognized tax benefits of
$0.9 million
and
$1.9 million
, respectively, relate to tax positions for which the ultimate deductibility is highly certain but for which there is uncertainty about the timing of such deductibility. The uncertain timing items could result in the acceleration of the payment of cash to the taxing authority to an earlier period.
For
2011
, unrecognized tax benefits decreased by approximately
$9.1 million
related to our claims for welfare to work and work opportunity credits, which claims have either lapsed or are unlikely to be realized due to an unfavorable decision of U.S. Court of Appeals for the Federal Circuit against a similarly situated taxpayer. Our right to file a refund claim with respect to approximately
$4.2 million
of the credits has lapsed and our right to file a refund claim with respect to approximately
$0.7 million
of the credits will lapse by December 21, 2012. Our right to file a refund claim with respect to approximately
$4.2 million
of the credits may never lapse because the IRS has not issued a statutory notice of disallowance with respect to those claims; however, because our claims are unlikely to prevail in a different jurisdiction, we have decided not to pursue them. Therefore, we are reducing our unrecognized tax benefits by the entire amount of the claims. Because these benefits were unrecognized, the decrease will have no effect on income tax expense.
We recognized an expense (benefit) associated with interest and penalties on unrecognized tax benefits of approximately
$(0.5) million
,
$(1.9) million
, and
$(0.5) million
during
2011
,
2010
, and
2009
, respectively, as a component of income tax expense. The amount of accrued interest and penalties recorded in the accompanying consolidated balance sheets at the end of
2011
and
2010
was
$5.8 million
and
$6.4 million
, respectively.
We are subject to U.S. federal income tax, income tax of multiple state and local jurisdictions, and Canadian and provincial taxes. The statute of limitations for assessments on our federal income tax returns for periods prior to 2008 has lapsed. In addition, the state income tax returns filed by us are subject to examination generally for periods beginning with 2007, although state income tax carryforward attributes generated prior to 2007 may still be adjusted upon examination. We have various state returns in the process of examination or administrative appeal. Generally, the time limit for reassessing returns for Canadian and provincial income taxes for periods prior to the year ending October 3, 2004 have lapsed.
We have estimated the reasonably possible expected net change in unrecognized tax benefits through February 2, 2013, based on expected cash and noncash settlements or payments of uncertain tax positions and lapses of the applicable statutes of limitations for unrecognized tax benefits. The estimated net decrease in unrecognized tax benefits for the next 12 months is approximately
$4.0 million
. Actual results may differ materially from this estimate.
In September 2006, a class action complaint was filed against us in the Superior Court of California, Los Angeles County, alleging that we violated certain California wage and hour laws by misclassifying California store managers as exempt employees (“Seals matter”). The plaintiffs sought to recover, on their own behalf and on behalf of all other individuals who are similarly situated, damages for alleged unpaid overtime, unpaid minimum wages, wages not paid upon termination, improper wage statements, missed rest breaks, missed meal periods, reimbursement of expenses, loss of unused vacation time, and attorneys' fees and costs. In October 2009, the court denied, with prejudice, plaintiffs' class certification motion. In January 2010, the plaintiffs filed a notice of appeal. In April 2011, the California Court of Appeals affirmed the trial court's decision denying class certification. In December 2011, we entered into confidential settlement agreements with each of the plaintiffs, and the court dismissed the plaintiffs' claims in January 2012. The Seals matter was resolved without a material effect on our financial condition, results of operations, or liquidity.
In February 2008,
three
alleged class action complaints
were filed against us by a California resident (“Caron matter”). The first was filed in the Superior Court of California, Orange County. That action was similar in nature to the Seals matter, which enabled us to successfully coordinate that matter with the Seals matter in the Superior Court of California, Los Angeles County. The second and third matters, filed in the U.S. District Court, Central District of California, and the Superior Court of California, Riverside County, respectively, alleged that we violated certain California wage and hour laws for missed meal and rest periods and other wage and hour claims. The plaintiffs sought to recover, on their own behalf and on behalf of a California statewide class consisting of all other individuals who are similarly situated, damages resulting from improper wage statements, missed rest breaks, missed meal periods, non-payment of wages at termination, reimbursement of expenses, loss of unused vacation time, and attorneys' fees and costs. We believed these two matters overlapped and we successfully consolidated them before the U.S. District Court, Central District of California. We believe the remaining allegations also overlap some portion of the claims released through the class action settlement in the Espinosa matter, which was settled in 2008. In August 2009, the court denied, without prejudice, the plaintiffs' class certification motion. In April 2010, the court granted, with prejudice, our
65
motion to deny class certification. Accordingly, the claims of one plaintiff remained before the court. The Caron matter is similar in nature to the Sample matter described below.
In June 2010, a representative enforcement action was filed against us in the Superior Court of California, Alameda County, alleging that we violated certain California wage and hour laws for missed meal and rest periods and other wage and hour claims (“Sample matter”). The plaintiff seeks to recover, on her behalf and on behalf of a California statewide class consisting of all other individuals who are similarly situated, damages resulting from allegedly unpaid overtime, unpaid meal period premiums, unpaid rest period premiums, unpaid business expenses, non-payment of wages at termination, untimely payment of wages, noncompliant wage statements, failure to provide seating, and attorneys' fees and costs. In December 2011, we entered into a confidential settlement agreement with the plaintiffs in the Caron and Sample matters. The settlement remains subject to objection and requires court approval to become final. We currently believe that the Caron and Sample matters will collectively be resolved without a material effect on our financial condition, results of operations, or liquidity.
In February 2011, a class action complaint was filed against us in the Superior Court of California, Los Angeles County, alleging that we violated certain California wage and hour laws (“Martinez matter”). The plaintiffs seek to recover, on behalf of the named plaintiff and a California statewide class consisting of all other similarly situated current and former warehouse employees, damages for alleged missed meal periods, unpaid meal period premiums, unpaid overtime, unpaid vested vacation, unpaid wages at termination, untimely payment of wages, noncompliant wage statements, failure to keep accurate payroll records, and attorneys' fees and costs. We answered the plaintiff's complaint in March 2011. The parties engaged in limited discovery. In February 2012, we entered into a confidential settlement agreement with the plaintiffs and the court preliminarily approved the settlement in March 2012. The settlement remains subject to objection and requires further court approval to become final. We currently believe that the Martinez matter will be resolved without a material effect on our financial condition, results of operations, or liquidity.
We are involved in other legal actions and claims arising in the ordinary course of business. We currently believe that each such action and claim will be resolved without a material effect on our financial condition, results of operations, or liquidity. However, litigation involves an element of uncertainty. Future developments could cause these actions or claims to have a material effect on our financial condition, results of operations, and liquidity.
For a discussion of discontinued operations, including KB Toys matters, see note 13.
We are self-insured for certain losses relating to property, general liability, workers' compensation, and employee medical and dental benefit claims, a portion of which is paid by employees, and we have purchased stop-loss coverage in order to limit significant exposure in these areas. Accrued insurance liabilities are actuarially determined based on claims filed and estimates of claims incurred but not reported.
We have purchase obligations for outstanding purchase orders for merchandise issued in the ordinary course of our business that are valued at
$514.0 million
, the entirety of which represents obligations due within one year of
January 28, 2012
. In addition, we have a purchase commitment for future inventory purchases totaling
$80.8 million
at
January 28, 2012
. We paid
$28.0 million
,
$29.7 million
, and
$28.9 million
related to this commitment during
2011
,
2010
, and
2009
, respectively. We are not required to meet any periodic minimum purchase requirements under this commitment. The term of the commitment extends until the purchase requirement is satisfied. We have additional purchase obligations in the amount of
$221.2 million
primarily related to distribution and transportation, information technology, print advertising, energy procurement, and other store security, supply, and maintenance commitments.
On
July 18, 2011
, the Company completed its acquisition of Liquidation World Inc. Under the terms of our acquisition agreement, we invested approximately
$1.9 million
in cash to purchase all outstanding shares of Liquidation World Inc. As part of the acquisition, we assumed the liabilities and acquired all assets and leasehold rights of Liquidation World Inc.
On July 19, 2011, we changed the name of Liquidation World Inc. to Big Lots Canada, Inc. ("Big Lots Canada"). Based in Brantford, Ontario, Big Lots Canada offers a broad assortment of closeout merchandise. At
January 28, 2012
, Big Lots Canada operated
82
stores in Canada.
66
The results of Big Lots Canada since the acquisition date are included in our consolidated financial statements. The acquisition is immaterial to our operations as a whole and therefore no proforma disclosure of financial information has been presented. The following table summarizes the preliminary allocation of the purchase price to the fair value of the assets acquired and liabilities assumed based on the exchange rate in effect at the date of our acquisition of Big Lots Canada.
|
Preliminary Allocation
|
Revisions
|
Allocation As Revised
|
|||||||
|
(in thousands)
|
|||||||||
|
Financial assets
|
$
|
3,149
|
|
$
|
715
|
|
$
|
3,864
|
|
|
Inventory
|
7,299
|
|
1,568
|
|
8,867
|
|
|||
|
Other current assets
|
2,278
|
|
184
|
|
2,462
|
|
|||
|
Property and equipment
|
10,172
|
|
(344
|
)
|
9,828
|
|
|||
|
Goodwill
|
21,507
|
|
(8,780
|
)
|
12,727
|
|
|||
|
Other intangibles
|
1,285
|
|
1,308
|
|
2,593
|
|
|||
|
Debt
|
(16,664
|
)
|
—
|
|
(16,664
|
)
|
|||
|
Accounts payable and accrued liabilities
|
(27,157
|
)
|
5,349
|
|
(21,808
|
)
|
|||
|
$
|
1,869
|
|
$
|
1,869
|
|
||||
As discussed in note 9, and based on the weight of currently available evidence, we have fully reduced the provisional amount of the acquired net deferred income tax assets (including a net operating loss carryforward) of
$16.2 million
by a valuation allowance.
Other intangibles consist of tradename and lease assets and liabilities, which are amortized over periods up to
11.2
years.
The changes in the carrying amount of goodwill, which is generally not deductible for income tax purposes, for the year-to-date
2011
were as follows:
|
(in thousands)
|
|||
|
Balance at January 29, 2011
|
$
|
—
|
|
|
Goodwill from acquisition
|
21,507
|
|
|
|
Goodwill adjustments
|
(8,780
|
)
|
|
|
Foreign currency impact
|
(445
|
)
|
|
|
Balance at January 28, 2012
|
$
|
12,282
|
|
The goodwill from acquisition was the result of our acquisition of Liquidation World Inc. in the second quarter of
2011
.
Our discontinued operations for
2011
,
2010
, and
2009
, were comprised of the following:
|
2011
|
2010
|
2009
|
|||||||
|
(In thousands)
|
|||||||||
|
Closed stores
|
$
|
(19
|
)
|
$
|
81
|
|
$
|
(48
|
)
|
|
KB Toys matters
|
(264
|
)
|
(118
|
)
|
(1,609
|
)
|
|||
|
Total income (loss) from discontinued operations, pretax
|
$
|
(283
|
)
|
$
|
(37
|
)
|
$
|
(1,657
|
)
|
67
Closed Stores
In 2005, we determined that the results of 130 stores closed in 2005 should be reported as discontinued operations for all periods presented. For 2011, 2010, and 2009, the closed stores' operating income (loss) is comprised of exit-related costs, utilities, and security expenses on leased properties with remaining terms. Accretion on the lease termination obligations was less than
$0.1 million
and
$0.1 million
in 2010 and 2009, respectively. At fiscal year end 2011 and 2010, we had
no
accrued exit-related liabilities, as there were no remaining lease obligations related to the
130
stores. At fiscal year end 2009, we had accrued exit-related liabilities of
$0.5 million
as a result of the
130
store closures in 2005. The decrease in liabilities is due to payments of the exit-related amounts. Included in payments is sublease income of less than
$0.1 million
and
$0.2 million
in 2010 and 2009, respectively.
KB Toys Matters
We acquired the KB Toys business from Melville Corporation (now known as CVS New York, Inc., and together with its subsidiaries “CVS”) in May 1996. As part of that acquisition, we provided, among other things, an indemnity to CVS with respect to any losses resulting from KB Toys' failure to pay all monies due and owing under any KB Toys lease or mortgage obligation. While we controlled the KB Toys business, we provided guarantees with respect to a limited number of additional KB Toys store leases. We sold the KB Toys business to KB Acquisition Corp. (“KBAC”), an affiliate of Bain Capital, pursuant to a Stock Purchase Agreement. KBAC similarly agreed to indemnify us with respect to all lease and mortgage obligations. These guarantee and lease obligations are collectively referred to as the “KB Lease Obligations.”
On January 14, 2004, KBAC and certain affiliated entities (collectively referred to as “KB-I”) filed for bankruptcy protection pursuant to Chapter 11 of title 11 of the United States Code. In connection with the 2004 bankruptcy, KB-I rejected
226
store leases and
two
distribution center leases for which we believed we may have guarantee or indemnification obligations (collectively referred to as the “KB-I Bankruptcy Lease Obligations”). We recorded pretax charges for estimated KB-I Bankruptcy Lease Obligations in loss from discontinued operations of
$18.1 million
in years prior to 2007. We based this amount on the number of demand notices that we had received from landlords and used information received from KB-I, the bankruptcy trust, and our own lease records which date back to when we owned the KB Toys business.
In the second fiscal quarter of 2007, we recorded a gain of
$2.0 million
, pretax in income (loss) from discontinued operations to reflect favorable settlements related to the KB-I Bankruptcy Lease Obligations. In the fourth fiscal quarter of 2007, we recorded approximately
$8.8 million
in income of the KB-I Bankruptcy Lease Obligations to reduce the amount on our consolidated balance sheet to zero as of February 2, 2008. We based this reversal on the following factors: 1) we had not received any new demand letters from landlords during 2007, 2) all prior demands against us by landlords had been settled or paid or the landlords had stopped pursuing their demands, 3) the KB-I bankruptcy occurred more than four years prior to the end of 2007 and most of the lease rejections occurred more than three years prior to the end of 2007, and 4) we believed that the likelihood of new claims against us was remote, and, if incurred, the amount would be immaterial.
On August 30, 2005, in connection with the acquisition by an affiliate of Prentice Capital Management of majority ownership of KB-I, KB-I emerged from its 2004 bankruptcy (the KB Toys business that emerged from bankruptcy is hereinafter referred to as “KB-II”). In 2007, we entered into an agreement with KB-II and various Prentice Capital entities which we believe provides a cap on our liability under the existing KB Lease Obligations and an indemnity from the Prentice Capital entities with respect to any renewals, extensions, modifications or amendments of the KB Lease Obligations which otherwise could potentially expose us to additional incremental liability beyond the date of the agreement, September 24, 2007. Under the agreement, KB-II is required to update us periodically with respect to the status of any remaining leases for which they believe we have a guarantee or indemnification obligation. In addition, we have the right to request a statement of the net asset value of Prentice Capital Offshore in order to monitor the sufficiency of the indemnity.
On December 11, 2008, KB-II filed for bankruptcy protection pursuant to Chapter 11 of title 11 of the United States Code. Based on information provided to us by KB-II, we believe that we continue to have KB Lease Obligations with respect to
29
KB Toys stores (“KB-II Bankruptcy Lease Obligations”). In the fourth fiscal quarter of 2008, we recorded a charge in the amount of
$5.0 million
, pretax, in income (loss) from discontinued operations to reflect the estimated amount that we expect to pay for KB-II Bankruptcy Lease Obligations. We continue to believe that additional payments by us under the KB-I Bankruptcy Lease Obligations are remote and, therefore we have not recognized any charge or liability in 2008 related to these earlier lease rejections.
68
In the fourth fiscal quarter of 2009, we obtained an assignment of a lease for the former KB corporate office. We believe that our ability to find a subtenant for this location is remote. We recorded a charge of
$1.2 million
, pretax in income (loss) from discontinued operations primarily related to our remaining liability for the former KB corporate office. At fiscal year end 2011 and 2010, we had accrued in total for the KB-II Bankruptcy Lease Obligations and the KB corporate office lease obligation
$3.1 million
and
$3.6 million
, respectively.
In
September 2006
, to avoid litigation under the threat of eminent domain, we sold a company-owned and operated store in California for an approximate gain of
$12.8 million
. As part of the sale, we entered into a lease which permitted us to occupy and operate the store through January 2009 in exchange for $1 per year rent plus the cost of taxes, insurance, and common area maintenance. Subsequently, this lease was modified to allow us to occupy this space through September 2009 under substantially the same terms. Because of the favorable lease terms, we deferred recognition of the gain until we no longer held a continuing involvement in the property.
As a result, the gain on the sale was deferred until the end of the lease and the net sales proceeds of approximately
$13.3 million
were recorded as a long-term real estate liability included in other liabilities on our consolidated balance sheet in prior years. In the third fiscal quarter of
2009
, after attempts to further extend the lease term were unsuccessful, we closed the store, ending our continuing involvement with this property, and recognized a pretax gain on sale of real estate of
$13.0 million
.
We manage our business as two segments: U.S. and Canada. The following tables summarize net sales, results of operations, and total assets, by segment:
|
(in thousands)
|
2011
|
2010
|
2009
|
|||||||||||||||||||||||||||||||||
|
U.S.
|
Canada
|
Total
|
U.S.
|
Canada
|
Total
|
U.S.
|
Canada
|
Total
|
||||||||||||||||||||||||||||
|
Net sales
|
$
|
5,140,164
|
|
$
|
62,105
|
|
$
|
5,202,269
|
|
$
|
4,952,244
|
|
$
|
—
|
|
$
|
4,952,244
|
|
$
|
4,726,772
|
|
$
|
—
|
|
$
|
4,726,772
|
|
|||||||||
|
Depreciation expense
|
88,469
|
|
1,811
|
|
90,280
|
|
78,606
|
|
—
|
|
78,606
|
|
74,904
|
|
—
|
|
74,904
|
|
||||||||||||||||||
|
Operating profit (loss)
|
357,814
|
|
(12,219
|
)
|
345,595
|
|
357,345
|
|
—
|
|
357,345
|
|
325,010
|
|
—
|
|
325,010
|
|
||||||||||||||||||
|
Interest expense
|
(2,739
|
)
|
(791
|
)
|
(3,530
|
)
|
(2,573
|
)
|
—
|
|
(2,573
|
)
|
(1,840
|
)
|
—
|
|
(1,840
|
)
|
||||||||||||||||||
|
Other income (expense)
|
163
|
|
(336
|
)
|
(173
|
)
|
612
|
|
—
|
|
612
|
|
175
|
|
—
|
|
175
|
|
||||||||||||||||||
|
Income (loss) from continuing operations before income taxes
|
355,238
|
|
(13,346
|
)
|
341,892
|
|
355,384
|
|
—
|
|
355,384
|
|
323,345
|
|
—
|
|
323,345
|
|
||||||||||||||||||
|
Income tax expense
|
134,657
|
|
—
|
|
134,657
|
|
132,837
|
|
—
|
|
132,837
|
|
121,975
|
|
—
|
|
121,975
|
|
||||||||||||||||||
|
Income (loss) from continuing operations
|
$
|
220,581
|
|
$
|
(13,346
|
)
|
$
|
207,235
|
|
$
|
222,547
|
|
$
|
—
|
|
$
|
222,547
|
|
$
|
201,370
|
|
$
|
—
|
|
$
|
201,370
|
|
|||||||||
|
(in thousands)
|
January 28, 2012
|
January 29, 2011
|
||||||||||||||||||||||||||||||||||
|
U.S.
|
Canada
|
Total
|
U.S.
|
Canada
|
Total
|
|||||||||||||||||||||||||||||||
|
Total assets
|
$
|
1,586,035
|
|
$
|
55,275
|
|
$
|
1,641,310
|
|
$
|
1,619,599
|
|
$
|
—
|
|
$
|
1,619,599
|
|
|
|
|
|||||||||||||||
Our U.S. segment uses the following six merchandise categories, which match our internal management and reporting of merchandise net sales: Consumables, Furniture, Home, Seasonal, Play n' Wear, and Hardlines & Other. The Consumables category includes the food, health and beauty, plastics, paper, chemical, and pet departments. The Furniture category includes the upholstery, mattresses, ready-to-assemble, and case goods departments. Case goods consist of bedroom, dining room, fireplaces, and other occasional furniture. The Home category includes the domestics, stationery, and home decorative departments. The Seasonal category includes the lawn & garden, Christmas, summer, and other holiday departments. The Play n' Wear category includes the electronics, toy, jewelry, infant accessories, and apparel departments. The Hardlines & Other
69
category includes the appliances, tools, paint, and home maintenance departments, as well as the results of certain large closeout deals that are typically acquired through our alternate product sourcing operations. In the third quarter of 2011, we realigned the merchandise categories reported in our U.S. segment to be consistent with the realignment of our merchandising team. As discussed in the Reclassifications section of note 1 to the accompanying consolidated financial statements, the categories known as Hardlines and Other prior to the third quarter of 2011 are now known as Play n' Wear and Hardlines & Other, respectively.
The following table presents net sales data by segment and category:
|
(In thousands)
|
2011
|
2010
|
2009
|
||||||||
|
U.S.
|
|||||||||||
|
Consumables
|
$
|
1,571,771
|
|
$
|
1,452,783
|
|
$
|
1,456,370
|
|
||
|
Furniture
|
883,341
|
|
829,725
|
|
716,785
|
|
|||||
|
Home
|
799,494
|
|
783,860
|
|
717,744
|
|
|||||
|
Play n' Wear
|
776,445
|
|
811,750
|
|
806,247
|
|
|||||
|
Seasonal
|
683,498
|
|
642,220
|
|
591,321
|
|
|||||
|
Hardlines & Other
|
425,615
|
|
431,906
|
|
438,305
|
|
|||||
|
Total U.S.
|
5,140,164
|
|
4,952,244
|
|
4,726,772
|
|
|||||
|
Canada
|
62,105
|
|
—
|
|
—
|
|
|||||
|
Net sales
|
$
|
5,202,269
|
|
$
|
4,952,244
|
|
$
|
4,726,772
|
|
||
70
Summarized fiscal quarterly financial data for
2011
and
2010
is as follows:
|
Fiscal Year 2011
|
First
|
Second
|
Third
|
Fourth
|
Year
|
||||||||||
|
(In thousands, except per share amounts) (a)
|
|||||||||||||||
|
Net sales
|
$
|
1,227,274
|
|
$
|
1,167,135
|
|
$
|
1,138,286
|
|
$
|
1,669,574
|
|
$
|
5,202,269
|
|
|
Gross margin
|
494,129
|
|
460,536
|
|
444,360
|
|
671,382
|
|
2,070,407
|
|
|||||
|
Income from continuing operations
|
52,531
|
|
35,714
|
|
4,241
|
|
114,749
|
|
207,235
|
|
|||||
|
Income (loss) from discontinued operations
|
(60
|
)
|
(31
|
)
|
(51
|
)
|
(29
|
)
|
(171
|
)
|
|||||
|
Net income
|
52,471
|
|
35,683
|
|
4,190
|
|
114,720
|
|
207,064
|
|
|||||
|
Earnings per share - basic:
|
|||||||||||||||
|
Continuing operations
|
$
|
0.71
|
|
$
|
0.51
|
|
$
|
0.07
|
|
$
|
1.79
|
|
$
|
3.03
|
|
|
Discontinued operations
|
—
|
|
—
|
|
—
|
|
—
|
|
—
|
|
|||||
|
$
|
0.71
|
|
$
|
0.51
|
|
$
|
0.06
|
|
$
|
1.79
|
|
$
|
3.03
|
|
|
|
Earnings per share - diluted:
|
|||||||||||||||
|
Continuing operations
|
$
|
0.70
|
|
$
|
0.50
|
|
$
|
0.06
|
|
$
|
1.75
|
|
$
|
2.99
|
|
|
Discontinued operations
|
—
|
|
—
|
|
—
|
|
—
|
|
—
|
|
|||||
|
$
|
0.70
|
|
$
|
0.50
|
|
$
|
0.06
|
|
$
|
1.75
|
|
$
|
2.98
|
|
|
|
Fiscal Year 2010
|
First
|
Second
|
Third
|
Fourth
|
Year
|
||||||||||
|
(In thousands, except per share amounts) (a)
|
|||||||||||||||
|
Net sales
|
$
|
1,235,162
|
|
$
|
1,142,309
|
|
$
|
1,055,830
|
|
$
|
1,518,943
|
|
$
|
4,952,244
|
|
|
Gross margin
|
501,955
|
|
462,425
|
|
428,107
|
|
619,964
|
|
2,012,451
|
|
|||||
|
Income from continuing operations
|
55,998
|
|
38,779
|
|
17,745
|
|
110,025
|
|
222,547
|
|
|||||
|
Income (loss) from discontinued operations
|
(100
|
)
|
98
|
|
(51
|
)
|
30
|
|
(23
|
)
|
|||||
|
Net income
|
55,898
|
|
38,877
|
|
17,694
|
|
110,055
|
|
222,524
|
|
|||||
|
Earnings per share - basic:
|
|||||||||||||||
|
Continuing operations
|
$
|
0.69
|
|
$
|
0.49
|
|
$
|
0.24
|
|
$
|
1.48
|
|
$
|
2.87
|
|
|
Discontinued operations
|
—
|
|
—
|
|
—
|
|
—
|
|
—
|
|
|||||
|
$
|
0.69
|
|
$
|
0.49
|
|
$
|
0.23
|
|
$
|
1.48
|
|
$
|
2.87
|
|
|
|
Earnings per share - diluted:
|
|||||||||||||||
|
Continuing operations
|
$
|
0.68
|
|
$
|
0.48
|
|
$
|
0.23
|
|
$
|
1.46
|
|
$
|
2.83
|
|
|
Discontinued operations
|
—
|
|
—
|
|
—
|
|
—
|
|
—
|
|
|||||
|
$
|
0.68
|
|
$
|
0.48
|
|
$
|
0.23
|
|
$
|
1.46
|
|
$
|
2.83
|
|
|
|
(a)
|
Earnings per share calculations for each fiscal quarter are based on the applicable weighted-average shares outstanding for each period and the sum of the earnings per share for the four fiscal quarters may not necessarily be equal to the full year earnings per share amount.
|
71
Not applicable.
I
tem 9A. Controls and Procedures
Evaluation of Disclosure Controls and Procedures
Our management, with the participation of our Chief Executive Officer and Chief Financial Officer, has evaluated the effectiveness of our disclosure controls and procedures, as that term is defined in Rules 13a-15(e) and 15d-15(e) of the Securities Exchange Act of 1934, as amended (“Exchange Act”), as of the end of the period covered by this report. Based on that evaluation, our Chief Executive Officer and Chief Financial Officer have each concluded that such disclosure controls and procedures were effective as of the end of the period covered by this report.
Management's Report on Internal Control over Financial Reporting
Management is responsible for establishing and maintaining adequate internal control over financial reporting (as defined in Rules 13a-15(f) and 15d-15(f) under the Exchange Act) for us. Our internal control over financial reporting is designed to provide reasonable assurance regarding the reliability of financial reporting and the preparation of financial statements in accordance with accounting principles generally accepted in the United States of America.
Internal control systems, no matter how well designed and operated, have inherent limitations, including the possibility of the circumvention or overriding of controls. Due to these inherent limitations, our internal control over financial reporting may not prevent or detect misstatements. As a result, projections of effectiveness to future periods are subject to risk that controls may become inadequate because of changes in conditions, or that the degree of compliance with the policies or procedures may deteriorate.
Management assessed the effectiveness of our internal control over financial reporting as of
January 28, 2012
. In making its assessment, management used the criteria set forth by the Committee of Sponsoring Organizations of the Treadway Commission in
Interna
l Control - Integrated Framework
. Based on this assessment, management, including the Chief Executive Officer and Chief Financial Officer, concluded that we maintained effective internal control over financial reporting as of
January 28, 2012
.
Management’s assessment of and conclusion on the effectiveness of internal control over financial reporting did not include an assessment of certain elements of internal controls over financial reporting of Liquidation World Inc. acquired on July 18, 2011, which is included in our consolidated financial statements for the year ended
January 28, 2012
. Liquidation World Inc. accounts for 3% of total assets, 1% of revenues, and 6% of net income of the consolidated financial statement amounts as of and for the year ended
January 28, 2012
.
Our independent registered public accounting firm, Deloitte & Touche LLP, has issued an attestation report on our internal control over financial reporting. The report appears in the Financial Statements and Supplementary Data section of this Form 10-K.
Changes in Internal Control over Financial Reporting
There were no changes in our internal control over financial reporting that occurred during our most recent fiscal quarter that have materially affected, or are reasonably likely to materially affect, our internal control over financial reporting.
Not applicable.
72
The information contained under the captions “Proposal One: Election of Directors,” “Governance,” and “Stock Ownership” in the
2012
Proxy Statement, with respect to directors, shareholder nomination procedures, the code of ethics, the Audit Committee, our audit committee financial experts, and Section 16(a) beneficial ownership reporting compliance, is incorporated herein by reference in response to this item. The information contained in Part I under the caption “Supplemental Item. Executive Officers of the Registrant,” with respect to executive officers, is incorporated herein by reference in response to this item.
The information contained under the captions “Governance,” “Director Compensation,” and “Executive Compensation” in the 2012 Proxy Statement, with respect to corporate Compensation Committee interlocks and insider participation, director compensation, the Compensation Committee Report, and executive compensation, is incorporated herein by reference in response to this item.
Equity Compensation Plan Information
The following table summarizes information as of
January 28, 2012
, relating to our equity compensation plans pursuant to which our common shares may be issued.
|
Number of securities to be issued upon exercise of outstanding options, warrants, and rights (#)
|
Weighted-average exercise price of outstanding options, warrants, and rights ($)
|
Number of securities remaining available for future issuance under equity compensation plans (excluding securities reflected in column (a)) (#)
|
|||||||
|
Plan Category
|
(a)
|
(b)
|
(c)
|
||||||
|
Equity compensation plans approved by security holders
|
3,676,423
|
|
(1)(2)
|
28.36
|
|
2,809,146
|
|
(3)
|
|
|
Equity compensation plans not approved by security holders
|
—
|
|
—
|
|
—
|
|
|||
|
Total
|
3,676,423
|
|
28.36
|
|
2,809,146
|
|
|||
|
(1) Includes stock options granted under the 2005 LTIP, the Director Stock Option Plan and 1996 LTIP. In addition, we had 741,289 shares of unvested restricted stock outstanding under the 2005 LTIP.
|
|||||||||
|
(2) The common shares issuable upon exercise of outstanding stock options granted under each shareholder-approved plan are as follows:
|
|||||||||
|
2005 LTIP
|
3,287,823
|
|
|||||||
|
Director Stock Option Plan
|
158,000
|
|
|||||||
|
1996 LTIP
|
230,600
|
|
|||||||
|
(3) The common shares available for issuance under each shareholder-approved plan are as follows:
|
|||||||||
|
2005 LTIP
|
2,809,146
|
|
|||||||
|
Director Stock Option Plan
|
—
|
|
|||||||
|
1996 LTIP
|
—
|
|
|||||||
The 1996 LTIP terminated on December 31, 2005. The Director Stock Option Plan terminated on May 30, 2008. The number of common shares available for issuance under the 2005 LTIP is adjusted annually by adding 0.75% of the total number of issued common shares (including treasury shares) as of the start of each of our fiscal years that the 2005 LTIP is in effect. See note 7 to the accompanying consolidated financial statements.
73
The information contained under the caption “Stock Ownership” in the
2012
Proxy Statement, with respect to the security ownership of certain beneficial owners and management, is incorporated herein by reference in response to this item.
The information contained under the caption “Governance - Determination of Director Independence” and “Governance - Related Person Transactions” in the
2012
Proxy Statement, with respect to the review of director independence and transactions with related persons, is incorporated herein by reference in response to this item.
The information contained under the captions “Audit Committee Disclosure - Audit and Non-Audit Services Pre-Approval Policy” and “Audit Committee Disclosure - Fees Paid to Independent Registered Public Accounting Firm” in the
2012
Proxy Statement, with respect to the Audit Committee's pre-approval policies and procedures and the fees paid to Deloitte & Touche LLP, is incorporated herein by reference in response to this item.
Index to Consolidated Financial Statements, Financial Statement Schedules and Exhibits
(a) Documents filed as part of this report:
(1) Financial Statements
All other financial statements not listed in the preceding index are omitted because they are not required or are not applicable or because the information required to be set forth therein either was not material or is included in the consolidated financial statements or notes thereto.
(2) Financial Statement Schedules
All schedules are omitted because they are not required or are not applicable or because the information required to be set forth therein either was not material or is included in the consolidated financial statements or notes thereto.
74
(3)
Exhibits
. Exhibits marked with an asterisk (*) are filed herewith. The Exhibit marked with two asterisks (**) is furnished electronically with this Annual Report. Copies of exhibits will be furnished upon written request and payment of our reasonable expenses in furnishing the exhibits. Exhibits 10.1 through 10.34 are management contracts or compensatory plans or arrangements.
|
Exhibit No.
|
Document
|
|
2
|
Agreement of Merger (incorporated herein by reference to Exhibit 2 to our Form 10-Q for the quarter ended May 5, 2001).
|
|
3.1
|
Amended Articles of Incorporation (incorporated herein by reference to Exhibit 3(a) to our Form 10-Q for the quarter ended May 5, 2001).
|
|
3.2
|
Amendment to the Amended Articles of Incorporation of Big Lots, Inc. (incorporated herein by reference to Exhibit 3.1 to our Form 8-K dated May 27, 2010).
|
|
3.3
|
Code of Regulations (incorporated herein by reference to Exhibit 3(b) to our Form 10-Q for the quarter ended May 5, 2001).
|
|
4
|
Specimen Common Share Certificate (incorporated herein by reference to Exhibit 4(a) to our Form 10-K for the year ended February 2, 2002).
|
|
10.1
|
Big Lots, Inc. 1996 Performance Incentive Plan (incorporated herein by reference to Exhibit 10 to our Post-Effective Amendment No. 1 to Form S-8 dated June 29, 2001).
|
|
10.2
|
Amendment to the Big Lots, Inc. 1996 Performance Incentive Plan, effective May 18, 2005 (incorporated herein by reference to Exhibit 10.3 to our Form 8-K dated August 17, 2005).
|
|
10.3
|
Amendment to the Big Lots, Inc. 1996 Performance Incentive Plan, effective March 4, 2008 (incorporated herein by reference to Exhibit 10.4 to our Form 10-Q for the quarter ended May 3, 2008).
|
|
10.4
|
Form of Non-Qualified Stock Option Grant Agreement under the Big Lots, Inc. 1996 Performance Incentive Plan (incorporated herein by reference to Exhibit 10.2 to our Form 8-K dated September 9, 2004).
|
|
10.5
|
Big Lots 2005 Long-Term Incentive Plan, as amended and restated effective May 27, 2010 (incorporated herein by reference to Exhibit 4.4 to our Form S-8 dated March 3, 2011).
|
|
10.6
|
Form of Big Lots 2005 Long-Term Incentive Plan Non-Qualified Stock Option Award Agreement (incorporated herein by reference to Exhibit 10.4 to our Form 8-K dated February 21, 2006).
|
|
10.7
|
Form of Big Lots 2005 Long-Term Incentive Plan Non-Qualified Stock Option Award Agreement (incorporated herein by reference to Exhibit 10.3 to our Form 8-K dated March 4, 2009).
|
|
10.8
|
Form of Big Lots 2005 Long-Term Incentive Plan Restricted Stock Award Agreement (incorporated herein by reference to Exhibit 10.4 to our Form 8-K dated March 4, 2009).
|
|
10.9
|
Form of Big Lots 2005 Long-Term Incentive Plan Restricted Stock Award Agreement for CEO (incorporated herein by reference to Exhibit 10.5 to our Form 8-K dated March 3, 2010).
|
|
10.10
|
Form of Big Lots 2005 Long-Term Incentive Plan Restricted Stock Award Agreement for Outside Directors (incorporated herein by reference to Exhibit 10.2 to our Form 10-Q dated July 31, 2010).
|
|
10.11
|
Big Lots, Inc. Amended and Restated Director Stock Option Plan (incorporated herein by reference to Exhibit 10 to our Post-Effective Amendment No. 1 to Form S-8).
|
|
10.12
|
First Amendment to Big Lots, Inc. Amended and Restated Director Stock Option Plan, effective August 20, 2002 (incorporated herein by reference to Exhibit 10(d) to our Form 10-Q for the quarter ended August 3, 2002).
|
|
10.13
|
Amendment to Big Lots, Inc. Amended and Restated Director Stock Option Plan, effective March 5, 2008 (incorporated herein by reference to Exhibit 10.5 to our Form 10-Q for the quarter ended May 3, 2008).
|
|
10.14
|
Form of Option Award Agreement under the Big Lots, Inc. Amended and Restated Director Stock Option Plan (incorporated herein by reference to Exhibit 10.1 to our Form 8-K dated September 9, 2004).
|
|
10.15
|
Big Lots 2006 Bonus Plan, as amended and restated effective December 5, 2008 (incorporated herein by reference to Exhibit 10.10 to our Form 10-Q for the quarter ended November 1, 2008).
|
75
|
10.16
|
Big Lots Savings Plan (incorporated herein by reference to Exhibit 10.8 to our Form 10-K for the year ended January 29, 2005).
|
|
10.17
|
Big Lots Supplemental Savings Plan, as amended and restated effective January 1, 2008 (incorporated herein by reference to Exhibit 10.1 to our Form 8-K dated August 28, 2007).
|
|
10.18
|
Big Lots Defined Benefit Pension Plan (incorporated herein by reference to Exhibit 10.10 to our Form 10-K for the year ended January 29, 2005).
|
|
10.19
|
Big Lots Supplemental Defined Benefit Pension Plan, as amended and restated effective January 1, 2008 (incorporated herein by reference to Exhibit 10.2 to our Form 8-K dated August 28, 2007).
|
|
10.20
|
Big Lots Executive Benefit Plan (incorporated herein by reference to Exhibit 10(m) to our Form 10-K for the year ended January 31, 2004).
|
|
10.21
|
First Amendment to Big Lots Executive Benefit Plan (incorporated herein by reference to Exhibit 10.11 to our Form 10-Q for the quarter ended November 1, 2008).
|
|
10.22
|
Amended and Restated Employment Agreement with Lisa M. Bachmann (incorporated herein by reference to Exhibit 10.5 to our Form 10-Q for the quarter ended November 1, 2008).
|
|
10.23
|
Employment Agreement with Robert C. Claxton (incorporated herein by reference to Exhibit 10.6 to our Form 10-Q for the quarter ended November 1, 2008).
|
|
10.24
|
Amended and Restated Employment Agreement with Joe R. Cooper (incorporated herein by reference to Exhibit 10.2 to our Form 10-Q for the quarter ended November 1, 2008).
|
|
10.25
|
Amended and Restated Employment Agreement with Steven S. Fishman (incorporated herein by reference to Exhibit 10.1 to our Form 10-Q for the quarter ended November 1, 2008).
|
|
10.26
|
Amended and Restated Employment Agreement with Charles W. Haubiel II (incorporated herein by reference to Exhibit 10.7 to our Form 10-Q for the quarter ended November 1, 2008).
|
|
10.27
|
Amended and Restated Employment Agreement with John C. Martin (incorporated herein by reference to Exhibit 10.4 to our Form 10-Q for the quarter ended November 1, 2008).
|
|
10.28
|
Amended and Restated Employment Agreement with Norman J. Rankin (incorporated herein by reference to Exhibit 10.8 to our Form 10-Q for the quarter ended November 1, 2008).
|
|
10.29
|
Amended and Restated Employment Agreement with Robert S. Segal (incorporated herein by reference to Exhibit 10.9 to our Form 10-Q for the quarter ended November 1, 2008).
|
|
10.30
|
Amended and Restated Employment Agreement with Brad A. Waite (incorporated herein by reference to Exhibit 10.3 to our Form 10-Q for the quarter ended November 1, 2008).
|
|
10.31
|
Retention Agreement with Steven S. Fishman (incorporated herein by reference to Exhibit 10.1 to our Form 8-K dated March 3, 2010).
|
|
10.32
|
Form of Indemnification Agreement (incorporated herein by reference to Exhibit 10.12 to our Form 10-Q for the quarter ended November 1, 2008).
|
|
10.33
|
Form of Executive Severance Agreement (incorporated herein by reference to Exhibit 10.13 to our Form 10-Q for the quarter ended November 1, 2008).
|
|
10.34
|
Form of Senior Executive Severance Agreement (incorporated herein by reference to Exhibit 10.14 to our Form 10-Q for the quarter ended November 1, 2008).
|
|
10.35
|
Credit Agreement among Big Lots Stores, Inc., as borrower, the Guarantors named therein, and the Banks named therein (incorporated herein by reference to Exhibit 10.1 to our Form 8-K dated April 30, 2009).
|
|
10.36
|
Credit Agreement among Big Lots, Inc., Big Lots Stores, Inc. and Big Lots Canada, Inc., as borrowers, the Guarantors named therein, and the Banks named therein (incorporated herein by reference to Exhibit 10.1 to our Form 8-K dated July 22, 2011).
|
|
10.37
|
Security Agreement between Big Lots Stores, Inc. and Big Lots Capital, Inc. (incorporated herein by reference to Exhibit 10.2 to our Form 8-K dated October 29, 2004).
|
|
10.38
|
Stock Purchase Agreement between KB Acquisition Corporation and Consolidated Stores Corporation (incorporated herein by reference to Exhibit 2(a) to our Form 10-Q for the quarter ended October 28, 2000).
|
76
|
10.39
|
Acquisition Agreement between Big Lots, Inc. and Liquidation World Inc. (incorporated herein by reference to Exhibit 10.1 to our Form 8-K dated May 26, 2011).
|
|
10.40
|
Big Lots, Inc. Non-Employee Director Compensation Package and Share Ownership Requirements (incorporated by reference to Exhibit 10.1 to our Form 10-Q for the quarter ended July 31, 2010).
|
|
21*
|
Subsidiaries.
|
|
23*
|
Consent of Deloitte & Touche LLP.
|
|
24*
|
Power of Attorney for Jeffrey P. Berger, Peter J. Hayes, David T. Kollat, Brenda J. Lauderback, Philip E. Mallott, Russell Solt, James R. Tener, and Dennis B. Tishkoff.
|
|
31.1*
|
Certification of Chief Executive Officer pursuant to Section 302 of the Sarbanes-Oxley Act of 2002.
|
|
31.2*
|
Certification of Chief Financial Officer pursuant to Section 302 of the Sarbanes-Oxley Act of 2002.
|
|
32.1*
|
Certification of Chief Executive Officer pursuant to Section 906 of the Sarbanes-Oxley Act of 2002.
|
|
32.2*
|
Certification of Chief Financial Officer pursuant to Section 906 of the Sarbanes-Oxley Act of 2002.
|
|
101**
|
XBRL Instance Document.
|
77
Signatures
Pursuant to the requirements of Section 13 or 15(d) of the Securities Exchange Act of 1934, the Registrant has duly caused this report to be signed on its behalf by the undersigned, thereunto duly authorized
, on this 26
th
day of March 2012.
|
|
BIG LOTS, INC.
|
|
|
|
|
|
By: /s/ Steven S. Fishman
|
|
|
Steven S. Fishman
|
|
|
Chairman of the Board, Chief Executive Officer
|
|
|
and President
|
Pursuant to the requirements of the Securities Exchange Act of 193
4, this report has been signed below by the following persons on behalf of the Registrant and in the capacities indicated on the 26
th
da
y of March 2012.
|
/s/ Steven S. Fishman
|
/s/ Joe R. Cooper
|
|
|
Steven S. Fishman
|
Joe R. Cooper
|
|
|
Chairman of the Board, Chief Executive Officer
|
Executive Vice President and Chief Financial Officer
|
|
|
and President
(Principal Executive Officer)
|
(Principal Financial Officer, Principal Accounting Officer and Duly Authorized Officer)
|
|
|
/s/ Jeffrey P. Berger *
|
/s/ Philip E. Mallott *
|
|
|
Jeffrey P. Berger
|
Philip E. Mallott
|
|
|
Director
|
Director
|
|
|
/s/ Peter J. Hayes *
|
/s/ Russell Solt *
|
|
|
Peter J. Hayes
|
Russell Solt
|
|
|
Director
|
Director
|
|
|
/s/ David T. Kollat *
|
/s/ James R. Tener *
|
|
|
David T. Kollat
|
James R. Tener
|
|
|
Director
|
Director
|
|
|
/s/ Brenda J. Lauderback *
|
/s/ Dennis B. Tishkoff *
|
|
|
Brenda J. Lauderback
|
Dennis B. Tishkoff
|
|
|
Director
|
Director
|
|
|
*
|
The above named Directors of the Registrant execute this report by Charles W. Haubiel II, their attorney-in-fact, pursuant to the power of attorney executed by the above-named Directors all in the capacities indicated and on the 1
st
day of March 2012, and filed herewith.
|
|
By: /s/ Charles W. Haubiel II
|
|
|
Charles W. Haubiel II
|
|
|
Attorney-in-Fact
|
|
78
TABLE OF CONTENTS
Part IItem 1. BusinessItem 1A. Risk FactorsItem 1B. Unresolved Staff CommentsItem 2. PropertiesItem 3. Legal ProceedingsItem 4. Mine Safety DisclosuresPart II. Other InformationItem 5. Market For Registrant's Common Equity, Related Stockholder Matters and Issuer Purchases Of Equity SecuritiesItem 6. Selected Financial DataItem 7. Management S Discussion and Analysis Of Financial Condition and Results Of OperationsNote 3 To The Accompanying Consolidated Financial StatementsItem 7A. Quantitative and Qualitative Disclosures About Market RiskItem 8. Financial Statements and Supplementary DataNote 1 Basis Of Presentation and Summary Of Significant Accounting PoliciesNote 2 Property and Equipment - NetNote 3 Bank Credit FacilityNote 4 Fair Value MeasurementsNote 5 LeasesNote 6 Shareholders EquityNote 7 Share-based PlansNote 8 Employee Benefit PlansNote 9 Income TaxesNote 10 Commitments, Contingencies and Legal ProceedingsNote 11 AcquisitionNote 12 GoodwillNote 13 Discontinued OperationsNote 14 Sales Of Real EstateNote 15 Business Segment DataNote 16 Selected Quarterly Financial Data (unaudited)Item 9. Changes in and Disagreements with Accountants on Accounting and Financial DisclosureItem 9B. Other InformationPart IIIItem 10. Directors, Executive Officers and Corporate GovernanceItem 11. Executive CompensationItem 12. Security Ownership Of Certain Beneficial Owners and Management and Related Stockholder MattersItem 13. Certain Relationships and Related Transactions, and Director IndependenceItem 14. Principal Accounting Fees and ServicesPart IVItem 15. Exhibits, Financial Statement Schedules