BIOGEN INC.
10-Ks and 10-Qs
|
|
|
|
|
|
|
|
|
|
|
|
|
|
|
|
|
|
|
|
|
|
|
|
|
|
|
|
|
|
|
|
|
|
|
|
|
|
|
|
|
|
|
|
|
|
|
|
|
|
|
|
|
|
|
|
|
|
|
UNITED STATES SECURITIES AND EXCHANGE COMMISSION
Washington, D.C. 20549
Form 10-K
|
þ
|
ANNUAL REPORT PURSUANT TO SECTION 13 OR 15(d) OF THE SECURITIES EXCHANGE ACT OF 1934
|
|
For the fiscal year ended December 31, 2013
|
|
or
|
¨
|
TRANSITION REPORT PURSUANT TO SECTION 13 OR 15(d) OF THE SECURITIES EXCHANGE ACT OF 1934
|
Commission file number: 0-19311
BIOGEN IDEC INC.
(Exact name of registrant as specified in its charter)
|
Delaware
|
33-0112644
|
|
|
(State or other jurisdiction of
incorporation or organization)
|
(I.R.S. Employer
Identification No.)
|
|
225 Binney Street, Cambridge, Massachusetts 02142
(617) 679-2000
(Address, including zip code, and telephone number, including area code, of Registrant’s principal executive offices)
Securities registered pursuant to Section 12(b) of the Act:
|
Title of Each Class
|
Name of Each Exchange on Which Registered
|
|
|
Common Stock, $0.0005 par value
|
The Nasdaq Global Select Market
|
|
Securities registered pursuant to Section 12(g) of the Act:
None
Indicate by check mark if the registrant is a well-known seasoned issuer, as defined in Rule 405 of the Securities Act. Yes
þ
No
¨
Indicate by check mark if the registrant is not required to file reports pursuant to Section 13 or 15(d) of the Act. Yes
¨
No
þ
Indicate by check mark whether the registrant (1) has filed all reports required to be filed by Section 13 or 15(d) of the Securities Exchange Act of 1934 during the preceding 12 months (or for such shorter period that the registrant was required to file such reports), and (2) has been subject to such filing requirements for the past 90 days. Yes
þ
No
¨
Indicate by check mark whether the registrant has submitted electronically and posted on its corporate Web site, if any, every Interactive Data File required to be submitted and posted pursuant to Rule 405 of Regulation S-T during the preceding 12 months (or for such shorter period that the registrant was required to submit and post such files): Yes
þ
No
¨
Indicate by check mark if disclosure of delinquent filers pursuant to Item 405 of Regulation S-K is not contained herein, and will not be contained, to the best of the registrant’s knowledge, in definitive proxy or information statements incorporated by reference in Part III of this Form 10-K or any amendment to this Form 10-K.
þ
Indicate by check mark whether the registrant is a large accelerated filer, an accelerated filer, a non-accelerated filer, or a smaller reporting company. See the definitions of “large accelerated filer,” “accelerated filer” and “smaller reporting company” in Rule 12b-2 of the Exchange Act.
|
Large accelerated filer
þ
|
|
Accelerated filer
¨
|
|
Non-accelerated filer
¨
|
|
Smaller reporting company
¨
|
|
|
|
(Do not check if a smaller reporting company)
|
|
|||
Indicate by check mark whether the registrant is a shell company (as defined in Rule 12b-2 of the Act). Yes
¨
No
þ
The aggregate market value of the registrant’s common stock held by non-affiliates of the registrant (without admitting that any person whose shares are not included in such calculation is an affiliate) computed by reference to the price at which the common stock was last sold as of the last business day of the registrant’s most recently completed second fiscal quarter was
$51,089,367,313
.
As of
January 31, 2014
, the registrant had
236,393,930
shares of common stock, $0.0005 par value, outstanding.
DOCUMENTS INCORPORATED BY REFERENCE
Portions of the definitive proxy statement for our
2014
Annual Meeting of Stockholders are incorporated by reference into Part III of this report.
BIOGEN IDEC INC.
ANNUAL REPORT ON FORM 10-K
For the Year Ended December 31, 2013
TABLE OF CONTENTS
|
|
|
Page
|
NOTE REGARDING FORWARD-LOOKING STATEMENTS
This report contains forward-looking statements that are based on our current beliefs and expectations. The following cautionary statements are being made pursuant to the provisions of the Private Securities Litigation Reform Act of 1995 (the “Act”) with the intention of obtaining the benefits of the “Safe Harbor” provisions of the Act. These forward-looking statements may be accompanied by such words as “anticipate,” “believe,” “could,” “estimate,” “expect,” “forecast,” “intend,” “may,” “plan,” “potential,” “project,” “target,” “will” and other words and terms of similar meaning. Reference is made in particular to forward-looking statements regarding:
|
•
|
the anticipated amount, timing and accounting of revenues, contingent payments, milestone, royalty and other payments under licensing, collaboration or acquisition agreements, tax positions and contingencies, doubtful accounts, pre-approval inventory, cost of sales, research and development costs, compensation and other expenses, amortization of intangible assets, and foreign currency forward contracts;
|
|
•
|
the anticipated timing of commercial launches of TECFIDERA in European countries;
|
|
•
|
anticipated regulatory filings and regulatory actions relating to, and commercial launch of, ELOCTATE and ALPROLIX;
|
|
•
|
additional anticipated commercial launches of FAMPYRA and the timing thereof;
|
|
•
|
patent terms, patent term extensions, patent office actions, and expected availability and period of data protection and market exclusivity rights;
|
|
•
|
the potential impact of increased product competition in the multiple sclerosis (MS) market, including competition from and growth of our own products and the possibility of future competition from biosimilars, generic versions or related prodrug derivatives;
|
|
•
|
the potential for increased competition between RITUXAN and GAZYVA in the oncology market;
|
|
•
|
our plans to develop further risk stratification protocols and therapies for TYSABRI and the impact of such protocols;
|
|
•
|
the timing, outcome and impact of administrative, regulatory, litigation and other proceedings related to patents and other proprietary and intellectual property rights, tax audits, assessments and settlements, product liability and other matters;
|
|
•
|
the impact of the commercial launch of TECFIDERA on sales and market share of our products;
|
|
•
|
the expected timing and financial impact of the final approval of the settlement of our dispute with the Italian National Medicines Agency relating to sales of TYSABRI;
|
|
•
|
the anticipated lifetime revenues of AVONEX and TYSABRI and amortization recorded in relation to their technology;
|
|
•
|
the costs, timing, potential approval and therapeutic scope of the development and commercialization of our pipeline products;
|
|
•
|
lease commitments and purchase obligations;
|
|
•
|
the potential impact of budget cuts and other measures in the U.S. and worldwide designed to reduce healthcare costs to constrain the overall level of government expenditures, including the impact of pricing actions in Europe and elsewhere;
|
|
•
|
the impact of the continued uncertainty and deterioration of the credit and economic conditions in certain countries in Europe and our collection of accounts receivable in such countries;
|
|
•
|
our ability to finance our operations and business initiatives and obtain funding for such activities;
|
|
•
|
the impact of new laws and accounting standards;
|
|
•
|
the expected timing of completion of our manufacturing obligation for Zevalin;
|
|
•
|
manufacturing capacity and our intent to utilize third party contract manufacturing organizations to provide manufacturing services for our small molecule products; and
|
|
•
|
the drivers for growing our business, including our plans to pursue business development and research opportunities, and competitive conditions.
|
These forward-looking statements involve risks and uncertainties, including those that are described in the “
Risk Factors
” section of this report and elsewhere within this report that could cause actual results to differ materially from those reflected in such statements. You should not place undue reliance on these statements. Forward-looking statements speak only as of the date of this report. We do not undertake any obligation to publicly update any forward-looking statements.
NOTE REGARDING COMPANY AND PRODUCT REFERENCES
Throughout this report, “Biogen Idec,” the “Company,” “we,” “us” and “our” refer to Biogen Idec Inc. and its consolidated subsidiaries. References to “RITUXAN” refer to both RITUXAN (the trade name for rituximab in the U.S., Canada and Japan) and MabThera (the trade name for rituximab outside the U.S., Canada and Japan), and “ANGIOMAX” refers to both ANGIOMAX (the trade name for bivalirudin in the U.S., Canada and Latin America) and ANGIOX (the trade name for bivalirudin in Europe).
NOTE REGARDING TRADEMARKS
AVONEX
®
, AVONEX PEN
®
, AVOSTARTGRIP
®
, RITUXAN
®
, TECFIDERA
®
, TYSABRI
®
and TOUCH
®
are registered trademarks of Biogen Idec. ALPROLIX
TM
, ELOCTATE
TM
, FUMADERM
TM
and PLEGRIDY
TM
are trademarks of Biogen Idec. The following are trademarks of the respective companies listed: ACTEMRA
®
— Chugai Seiyaku Kabushiki Kaisha; AUBAGIO
®
— Sanofi Societe Anonyme France; ANGIOMAX
®
and ANGIOX
TM
— The Medicines Company; ARZERRA
®
— Glaxo Group Limited; BENLYSTA
®
— GlaxoSmithKline Intellectual Property Limited; BETASERON
®
and BETAFERON
®
— Bayer Schering Pharma AG; LEMTRADA
®
— Genzyme Corporation; CIMZIA
®
— UCB Pharma, S.A.; COPAXONE
®
— Teva Pharmaceutical Industries Limited; ENBREL
®
— Immunex Corporation; EXTAVIA
®
and GILENYA
®
— Novartis AG; FAMPYRA
®
— Acorda Therapeutics, Inc.; GAZYVA
TM
— Genentech, Inc.; HUMIRA
®
— AbbVie Biotechnology Ltd.; ORENCIA
®
— Bristol-Myers Squibb Company; REBIF
®
— Ares Trading S.A.; REMICADE
®
— Janssen Biotech, Inc.; SIMPONI
®
and SIMPONI ARIA
TM
— Johnson & Johnson; TREANDA
®
— Cephalon, Inc.; and XELJANZ
®
— Pfizer Inc.
|
Item 1.
|
Business
|
Overview
Biogen Idec is a global biotechnology company focused on discovering, developing, manufacturing and marketing therapies for the treatment of multiple sclerosis (MS) and other autoimmune disorders, neurodegenerative diseases and hemophilia. We also collaborate on the development and commercialization of RITUXAN for the treatment of non-Hodgkin's lymphoma, chronic lymphocytic leukemia and other conditions and share profits and losses for GAZYVA for the treatment of chronic lymphocytic leukemia. Summary information about our marketed products is set forth in the table below.
|
|
|
|
Product Revenues
to Biogen Idec (in millions)
|
|||||||||||||
|
Product
|
Indications
|
Development or
Marketing Collaborator
|
2013
|
2012
|
2011
|
|||||||||||
|
AVONEX (1)
|
Multiple sclerosis
|
None
|
$
|
3,005.5
|
|
$
|
2,913.1
|
|
$
|
2,686.6
|
|
|||||
|
TYSABRI (2)
|
Multiple sclerosis
Crohn’s disease
|
None
|
$
|
1,526.5
|
|
$
|
1,135.9
|
|
$
|
1,079.5
|
|
|||||
|
TECFIDERA (3)
|
Multiple sclerosis
|
None
|
$
|
876.1
|
|
$
|
—
|
|
$
|
—
|
|
|||||
|
FAMPYRA (4)
|
Multiple sclerosis
(walking ability)
|
Acorda Therapeutics
|
$
|
74.0
|
|
$
|
57.4
|
|
$
|
13.6
|
|
|||||
|
FUMADERM (5)
|
Psoriasis
|
None
|
$
|
60.2
|
|
$
|
59.7
|
|
$
|
54.7
|
|
|||||
|
|
|
|
Unconsolidated Joint Business
Revenues to Biogen Idec (in millions)
|
|||||||||||||
|
2013
|
2012
|
2011
|
||||||||||||||
|
RITUXAN (6)
|
Non-Hodgkin’s lymphoma
Rheumatoid arthritis
Chronic lymphocytic leukemia
ANCA-associated vasculitis
|
Genentech
(Roche Group)
|
$
|
1,126.0
|
|
$
|
1,137.9
|
|
$
|
996.6
|
|
|||||
|
(1)
|
AVONEX (interferon beta-1a), injection for intramuscular use, is indicated for the treatment of patients with relapsing forms of MS to slow the accumulation of physical disability and decrease the frequency of clinical exacerbations.
|
|
(2)
|
TYSABRI (natalizumab), injection for intravenous infusion, is indicated (1) as a monotherapy for the treatment of patients with relapsing forms of MS to delay the accumulation of physical disability and reduce the frequency of clinical exacerbations and (2) in the U.S. for inducing and maintaining clinical response and remission in adult patients with moderately to severely active Crohn's disease with evidence of inflammation who have had an inadequate response to, or are unable to tolerate, conventional Crohn's disease therapies and TNF inhibitors.
|
We previously collaborated with Elan Pharma International, Ltd (Elan), an affiliate of Elan Corporation, plc. on the development, manufacture and commercialization of TYSABRI. On April 2, 2013, we acquired full ownership of, and strategic, commercial and decision-making rights to, TYSABRI. Upon the closing of the transaction, our collaboration agreement with Elan was terminated.
|
(3)
|
TECFIDERA (dimethyl fumarate), delayed release capsules for oral use, is indicated for the treatment of patients with relapsing forms of MS. TECFIDERA was approved by the U.S. Food and Drug Administration (FDA) in March 2013. In February 2014, the European Commission (EC) approved the use of TECFIDERA in the European Union (E.U.) as a first-line oral treatment for people with relapsing-remitting MS.
|
|
(4)
|
FAMPYRA (prolonged-release fampridine tablets) is indicated for the improvement of walking ability in adult patients with MS who have walking disability.
|
|
(5)
|
FUMADERM (fumaric acid esters), prolonged release tablets
,
is only approved in Germany and is indicated for the treatment of adult patients with moderate to severe plaque psoriasis for whom topical therapy is ineffective.
|
|
(6)
|
RITUXAN (rituximab), injection for intravenous infusion, is indicated for the treatment of (1)(a) relapsed or refractory, low-grade or follicular, CD20-positive, B-cell Non-Hodgkin's lymphoma (NHL) as a single agent, (b) previously untreated follicular, CD20-positive, B-cell NHL in combination with first line chemotherapy and, in patients achieving a complete or partial response to RITUXAN in combination with chemotherapy, as a single-agent maintenance therapy, (c) non-progressing (including stable disease), low-grade, CD20-positive, B-cell NHL, as a single agent, after first-line CVP chemotherapy, and (d) previously untreated diffuse large B-cell, CD20-positive NHL in combination with CHOP or
|
1
other anthracycline-based chemotherapy regimens, (2) patients with CD20-positive chronic lymphocytic leukemia in combination with fludarabine and cyclophosphamide, (3) moderately- to severely-active rheumatoid arthritis, in combination with methotrexate, in adult patients who have had an inadequate response to one or more TNF antagonist therapies, and (4) Wegener's Granulomatosis and Microscopic Polyangiitis, in combination with glucocorticoids, in adult patients.
Additional financial information about our product revenues, other revenues, significant customers and geographic areas in which we operate is set forth in our consolidated financial statements, in Note 25,
Segment Information
to our consolidated financial statements, and in Item 6.
Selected Financial Data
and in Item 7.
Management's Discussion and Analysis of Financial Condition and Results of Operations
included in this report. A discussion of the risks attendant to our operations is set forth in the “
Risk Factors
” section of this report.
We devote significant resources to research and development programs and external business development opportunities, as summarized in the table below:
|
(In millions)
|
2013
|
2012
|
2011
|
||||||||||
|
Research and development
|
$
|
1,444.1
|
|
$
|
1,334.9
|
|
$
|
1,219.6
|
|
||||
|
Amortization of acquired intangible assets
|
$
|
342.9
|
|
$
|
202.2
|
|
$
|
208.6
|
|
||||
|
(Gain) loss on fair value remeasurement of contingent consideration
|
$
|
(0.5
|
)
|
$
|
27.2
|
|
$
|
36.1
|
|
||||
Additional information about our research and development programs and business development activity during 2013 is set forth below under the subsections entitled “
Research and Development Programs
” and “
Business Development.
”
We were formed as a California corporation in 1985 and became a Delaware corporation in 1997. In 2003, we acquired Biogen, Inc. and changed our corporate name from IDEC Pharmaceuticals Corporation to Biogen Idec Inc. Our principal executive offices are located at 225 Binney Street, Cambridge, MA 02142 and our telephone number is (617) 679-2000. Our website address is www.biogenidec.com. We make available free of charge through the Investors section of our website our Annual Reports on Form 10-K, Quarterly Reports on Form 10-Q, Current Reports on Form 8-K and all amendments to those reports as soon as reasonably practicable after such material is electronically filed with or furnished to the Securities and Exchange Commission (SEC). We include our website address in this report only as an inactive textual reference and do not intend it to be an active link to our website. The contents of our website are not incorporated into this report.
Marketed Products
MS Products
We develop, manufacture and market a number of products designed to treat patients with MS. MS is a progressive neurological disease in which the body loses the ability to transmit messages along nerve cells, leading to a loss of muscle control, paralysis and, in some cases, death. Patients with active relapsing MS experience an uneven pattern of disease progression characterized by periods of stability that are interrupted by flare-ups of the disease after which the patient returns to a new baseline of functioning.
AVONEX
AVONEX is one of the most prescribed treatments for relapsing forms of MS worldwide. AVONEX is a recombinant form of the interferon beta protein produced in the body in response to viral infection. In February 2012, the FDA approved two separate dosing innovations designed to improve the treatment experience for patients receiving once-a-week AVONEX for relapsing forms of MS: AVONEX PEN and a new dose titration regimen. AVONEX PEN is the first intramuscular autoinjector approved for MS and is designed to enhance the self-injection process for patients receiving AVONEX therapy. The dose titration regimen, facilitated by the AVOSTARTGRIP titration devices, provides patients with the option to gradually increase the dose of AVONEX at treatment initiation to reduce the incidence and severity of flu-like symptoms that patients may experience with therapy. These AVONEX dosing innovations are commercially available in the E.U., U.S. and other countries, and were recently approved for marketing in Japan.
TYSABRI
TYSABRI has advanced the treatment of relapsing MS with its established efficacy. TYSABRI is a monoclonal antibody approved in numerous countries as a monotherapy for relapsing MS and is also approved in the U.S. to treat Crohn's disease, an inflammatory disease of the intestines.
2
TYSABRI increases the risk of progressive multifocal leukoencephalopathy (PML), an opportunistic infection of the brain by the JC virus (JCV) that usually leads to death or severe disability. Infection by the JC virus is required for the development of PML and patients who are anti-JCV antibody positive have a higher risk of developing PML. Factors that increase the risk of PML are presence of anti-JCV antibodies, prior immunosuppressant use, and longer TYSABRI treatment duration. Patients who have all three risk factors have the highest risk of developing PML. Reports of cases of PML in patients treated with TYSABRI in clinical studies led us to voluntarily suspend the marketing and commercial distribution of TYSABRI in February 2005 until its reintroduction to the market in July 2006. Because of the risk of PML, TYSABRI has a boxed warning and is marketed under risk management or minimization plans approved by regulatory authorities. In the U.S., for example, TYSABRI is marketed under the TOUCH Prescribing Program, a restricted distribution program designed to assess and minimize the risk of PML, minimize death and disability due to PML, and promote informed benefit-risk decisions regarding TYSABRI use.
U.S. and E.U. regulators continue to monitor and assess on an ongoing basis the criteria for confirming PML diagnosis, the number of PML cases, the incidence of PML in TYSABRI patients, the risk factors for PML, and TYSABRI's benefit-risk profile, which could result in modifications to the approved labels or other restrictions on TYSABRI treatment. We continue to research and develop protocols and therapies that may reduce risk and improve outcomes of PML in patients.
In 2012, the FDA approved the inclusion in the U.S. product label for TYSABRI of anti-JCV antibody status as an additional factor in stratifying patients for developing PML and a table summarizing the estimated incidence of PML according to the duration of TYSABRI treatment, prior immunosuppressant use and anti-JCV antibody status. In addition, the FDA granted Quest Diagnostics a de novo classification petition for the STRATIFY JCV Antibody ELISA testing service, which allows neurologists to determine their MS patients' anti-JCV antibody status. A second generation assay capable of detecting JCV antibodies at lower concentrations than the original assay, known as STRATIFY DX SELECT JCV Antibody ELISA, has also been developed.
2013
Developments
|
•
|
We previously collaborated with Elan on the development, manufacture and commercialization of TYSABRI. On April 2, 2013, we acquired full ownership of, and strategic, commercial and decision-making rights to, TYSABRI from Elan, for an upfront payment of
$3.25 billion
together with an agreement to make contingent payments to Elan. Upon the closing of the transaction, our collaboration agreement with Elan was terminated. For additional information related to this relationship, please read Note 2,
Acquisitions
and Note 20,
Collaborative and Other Relationships
to our consolidated financial statements included within this report.
|
|
•
|
In 2013, the FDA and the European Medicines Agency (EMA) approved updates to the TYSABRI product labels. In July 2013, the EMA approved an expanded indication statement for TYSABRI to include glatiramer acetate (GA) treatment failures in the definition of non-responders eligible for TYSABRI, and in December 2013, the FDA approved a modification to the indication statement in the U.S. product label for TYSABRI clarifying the intended use of TYSABRI for people living with relapsing forms of MS, as well as updates to certain safety information. In May 2013, we withdrew the variation in our application we submitted to the EMA requesting to expand the indication statement to allow first-line use of TYSABRI for people living with certain relapsing forms of MS who have tested negative for antibodies to the JC virus.
|
|
•
|
In 2013, we submitted an application for approval of TYSABRI in Japan.
|
TECFIDERA
TECFIDERA is our first-line oral treatment for people with relapsing forms of MS. TECFIDERA was approved by the FDA in March 2013 and by regulatory authorities in Canada and Australia in April 2013 and July 2013, respectively. In February 2014, the EC approved the use of TECFIDERA in the E.U. as a first-line oral treatment for people with relapsing-remitting MS. TECFIDERA is also currently under review by regulatory authorities in additional markets.
We acquired TECFIDERA as part of our acquisition of Fumapharm AG in 2006. For more information about this acquisition and associated milestone obligations, please read the subsection entitled “
Contractual Obligations and Off-Balance Sheet Arrangements - Contingent Consideration related to Business Combinations
” of our “
Management’s Discussion and Analysis of Financial Condition and Results of Operations
.”
FAMPYRA
FAMPYRA is the first treatment that addresses the unmet medical need of walking improvement in adult patients with MS who have walking disability. FAMPYRA is a prolonged-release tablet formulation of the drug fampridine. FAMPYRA has been approved in over 50 countries across Europe, Asia and the Americas, and we anticipate making FAMPYRA commercially available in additional markets in 2014.
3
We have a license from Acorda Therapeutics, Inc. to develop and commercialize FAMPYRA in all markets outside the U.S. For information about this relationship, please read Note 20,
Collaborative and Other Relationships
to our consolidated financial statements included in this report.
2013
Developments
|
•
|
The EC granted a conditional marketing authorization for FAMPYRA in the E.U. in July 2011. A conditional marketing authorization is renewable annually and is granted to a medicinal product with a positive benefit-risk assessment that fulfills an unmet medical need when the benefit to public health of immediate availability outweighs the risk inherent in the fact that additional data are still required. This marketing authorization was renewed as of July 2013. To meet the conditions of this marketing authorization, we will continue to provide additional data from on-going clinical studies regarding FAMPYRA's benefits and safety.
|
Other Products
FUMADERM
FUMADERM is approved for the treatment of moderate to severe plaque psoriasis in Germany. Psoriasis is a skin disease in which cells build up on the skin surface and form scales and red patches.
RITUXAN
RITUXAN is a widely prescribed monoclonal antibody used to treat non-Hodgkin's lymphoma, rheumatoid arthritis, chronic lymphocytic leukemia and two forms of ANCA-associated vasculitis. Non-Hodgkin's lymphoma and chronic lymphocytic leukemia are cancers that affect lymphocytes, which are a type of white blood cell that help to fight infection. Rheumatoid arthritis is a chronic disease that occurs when the immune system mistakenly attacks the body's joints, resulting in inflammation, pain and joint damage. ANCA-associated vasculitis is a rare autoimmune disease that largely affects the small blood vessels of the kidneys, lungs, sinuses, and a variety of other organs.
In the U.S., we collaborate with Genentech, Inc. (Genentech), a wholly-owned member of the Roche Group, on the development and commercialization of RITUXAN. For information about this collaboration, please read Note 20,
Collaborative and Other Relationships
to our consolidated financial statements included in this report.
GAZYVA
GAZYVA (
obinutuzumab
), injection for intravenous infusion, in combination with chlorambucil, is indicated for the treatment of patients with previously untreated chronic lymphocytic leukemia. The FDA granted GAZYVA breakthrough therapy designation due to the significance of the positive progression-free survival results from the Phase 3 CLL11 clinical trial and the serious and life threatening nature of CLL. GAZYVA, formerly known as GA101, was approved by the FDA in November 2013.
In the U.S., we share operating profits and losses relating to GAZYVA with Genentech. The Roche Group and its sub-licensees maintain sole responsibility for the development, manufacturing and commercialization of GAZYVA in the U.S. For information about our agreement with Genentech, please read Note 20,
Collaborative and Other Relationships
to our consolidated financial statements included in this report.
Other Sources of Revenue
Our other sources of revenue consist of royalties we receive from net sales of products related to patents that we licensed (royalty revenues) and revenues from our contract manufacturing, product supply and biosimilar arrangements (corporate partner revenues). Summary information about our other sources of revenue is set forth in the table below:
|
(In millions)
|
2013
|
2012
|
2011
|
|||||||||
|
Royalty revenues
|
$
|
185.7
|
|
$
|
168.7
|
|
$
|
158.5
|
|
|||
|
Corporate partner revenues
|
$
|
78.2
|
|
$
|
43.8
|
|
$
|
57.4
|
|
|||
4
Our most significant source of royalty revenue is derived from net worldwide sales of ANGIOMAX, which is licensed to The Medicines Company (TMC). TMC markets ANGIOMAX primarily in the U.S. and Europe for use as an anticoagulant in patients undergoing percutaneous coronary intervention. Under the terms of our royalty arrangement for ANGIOMAX, TMC is obligated to pay us royalties earned, on a country-by-country basis, until the later of (1) twelve years from the date of the first commercial sale of ANGIOMAX in such country or (2) the date upon which the product is no longer covered by a licensed patent in such country. The annual royalty rate is reduced by a specified percentage in any country where the product is no longer covered by a licensed patent and where sales have been reduced to a certain volume-based market share. TMC began selling ANGIOMAX in the U.S. in January 2001. In March 2012, the U.S. Patent and Trademark Office granted the extension of the term of the principal U.S. patent that covers ANGIOMAX to December 15, 2014. We expect royalty revenue to decrease significantly when the term of the U.S. patent covering ANGIOMAX expires. For a further description of our royalty arrangement with TMC, please read the subsection entitled “
Other Revenues - Royalty Revenues
” in the “
Management's Discussion and Analysis of Financial Condition and Results of Operations
” section of this report.
Research and Development Programs
A commitment to research is fundamental to our mission at Biogen Idec. Our research and development strategy is to discover and develop first-in-class molecules or best-in-class molecules that improve safety or efficacy for unmet medical needs. By applying our expertise in biologics and our growing capabilities in small-molecule and anti-sense drug discovery and development, we target specific medical needs where new or better treatments are needed.
We intend to continue committing significant resources to research and development opportunities. As part of our ongoing research and development efforts, we have devoted significant resources to conducting clinical studies to advance the development of new pharmaceutical products and to explore the utility of our existing products in treating disorders beyond those currently approved in their labels. The table below highlights our current research and development programs that are in clinical trials. Drug development involves a high degree of risk and investment, and the status, timing and scope of our development programs are subject to change. Important factors that could adversely affect our drug development efforts are discussed in the “
Risk Factors
” section of this report.
|
Therapeutic Area
|
|
Product Candidate
|
|
Targeted Indications
|
Collaborator
|
|
Status
|
|
|
Neurology
|
PLEGRIDY (peginterferon beta-1a)
|
|
MS
|
None
|
|
U.S. BLA and EMA marketing authorisation application submitted and under regulatory review
|
||
|
Daclizumab High Yield Process (HYP)
|
|
MS
|
AbbVie Biotherapeutics
|
|
Phase 3
|
|||
|
|
TYSABRI
|
|
Secondary progressive MS
|
None
|
|
Phase 3
|
||
|
Stroke
|
None
|
Phase 2
|
||||||
|
|
Anti-LINGO
|
|
Optic Neuritis
|
None
|
|
Phase 2
|
||
|
|
MS
|
None
|
Phase 2
|
|||||
|
Neublastin
|
|
Neuropathic pain
|
None
|
|
Phase 2
|
|||
|
BIIB037
|
|
Alzheimer’s disease
|
None
|
|
Phase 1b
|
|||
|
|
ISIS - SMN
Rx
|
|
Spinal muscular atrophy
|
Isis Pharmaceuticals
|
|
Phase 1b/2a
|
||
|
BIIB061
|
MS
|
None
|
Phase 1
|
|||||
|
|
||||||||
|
Hemophilia
|
|
ALPROLIX [Coagulation Factor IX, Fc Fusion Protein (Recombinant)]
|
|
Hemophilia B
|
Swedish Orphan Biovitrum
|
|
U.S. BLA submitted and under regulatory review
|
|
|
|
ELOCTATE [(Antihemophilic Factor, Fc Fusion Protein (Recombinant)]
|
|
Hemophilia A
|
Swedish Orphan Biovitrum
|
|
U.S. BLA submitted and under regulatory review
|
||
|
|
||||||||
|
Immunology
|
|
STX-100
|
|
Idiopathic pulmonary fibrosis
|
None
|
|
Phase 2a
|
|
|
Anti-TWEAK
|
|
Lupus nephritis
|
None
|
|
Phase 2
|
|||
|
Anti-CD40 Ligand
|
General lupus
|
UCB, Inc.
|
Phase 1
|
|||||
|
|
||||||||
|
Other
|
|
GAZYVA (obinutuzumab)
|
|
Non-Hodgkin’s lymphoma
|
Genentech (Roche Group)
|
|
Phase 3
|
|
5
Late Stage Product Candidates
Additional information about our late stage product candidates is set forth below.
PLEGRIDY (peginterferon beta-1a)
PLEGRIDY (peginterferon beta-1a) is designed to prolong the effects and reduce the dosing frequency of interferon beta-1a.
In January 2013, we released the top-line efficacy analysis and safety data from the first year of the two-year global Phase 3 study, ADVANCE. Results support PLEGRIDY as a potential treatment dosed every two weeks or every four weeks for relapsing-remitting MS. The primary endpoint of ADVANCE, annualized relapse rate at one year, was met for both the two-week and four-week dosing regimens. Results showed that PLEGRIDY also met the secondary endpoints of risk of 12-week confirmed disability progression, proportion of patients who relapsed and magnetic resonance imaging assessments for both dose regimens.
During the second quarter of 2013, we submitted a Biologics License Application (BLA) to the FDA and a Marketing Authorisation Application to the EMA, in each case for marketing approval of PLEGRIDY in relapsing forms of MS. The regulatory submission was based on the results from the first year of the two-year global Phase 3 ADVANCE study. The FDA accepted our application in July 2013, and granted us a standard review timeline. The EMA validated our application in June
2013. We have also submitted a regulatory application for PLEGRIDY in Japan.
Daclizumab High Yield Process (HYP)
Daclizumab HYP is a monoclonal antibody that is being tested in relapsing-remitting MS. In April 2012, we completed patient enrollment in a Phase 3 study of daclizumab in relapsing-remitting MS, known as DECIDE, evaluating the efficacy and safety of daclizumab compared to interferon beta-1a (AVONEX). The DECIDE study is designed to have a two year endpoint and involves approximately 1,800 patients.
In August 2011, we announced positive results from SELECT, a global, registrational Phase 2b study designed to evaluate Daclizumab HYP in relapsing-remitting MS over one year. Results showed that Daclizumab HYP, administered subcutaneously once every four weeks, met primary and key secondary study endpoints, compared to placebo.
We collaborate with AbbVie Biotherapuetics, Inc., a subsidiary of AbbVie, Inc., on the development and commercialization of Daclizumab HYP. For information about this collaboration, please read Note 20,
Collaborative and Other Relationships
to our consolidated financial statements included in this report.
TYSABRI (SPMS)
In May 2013, we completed patient enrollment in a Phase 3b study of TYSABRI in secondary progressive MS, known as ASCEND. The study is designed to have an endpoint of approximately two years and involves approximately 875 patients. Secondary progressive MS is characterized by a steady progression of nerve damage, symptoms and disability.
Hemophilia Product Candidates
ELOCTATE [Antihemophilic Factor, Fc Fusion Protein (Recombinant)]
In October 2012, we announced positive top-line results from the Phase 3 study, known as A-LONG, investigating ELOCTATE in hemophilia A, a rare inherited disorder which inhibits blood coagulation. Top-line results from the A-LONG study showed that ELOCTATE was effective in the control and prevention of bleeding episodes, routine prophylaxis and perioperative management. Based on the results from the A-LONG clinical trial, we submitted a BLA to the FDA for marketing approval of ELOCTATE in the first quarter of 2013. In May 2013, the FDA accepted our application for ELOCTATE and granted us a standard review timeline. In October 2013, we announced that the FDA had requested additional information pertaining to the validation of certain steps in the manufacturing process for ELOCTATE. In December 2013, the FDA extended the initial Prescription Drug User Fee Act (PDUFA) date for the FDA’s review our application by three months, which is a standard extension period.
We have submitted additional regulatory applications for ELOCTATE in Australia, Canada and Japan.
Pediatric data will be required as part of the Marketing Authorisation Application for ELOCTATE that we plan to submit to the EMA, and we have initiated a global pediatric study of ELOCTATE.
6
ALPROLIX [Coagulation Factor IX, Fc fusion protein (Recombinant)]
In September 2012, we announced positive top-line results from the Phase 3 study, known as B-LONG, investigating ALPROLIX in hemophilia B, a rare inherited disorder which inhibits blood coagulation. Top-line results from the B-LONG study showed that ALPROLIX was effective in the control and prevention of bleeding episodes, routine prophylaxis, and perioperative management.
Based on this data, we submitted a BLA to the FDA for marketing approval of ALPROLIX in the fourth quarter of 2012. In March 2013, the FDA accepted our application for ALPROLIX and granted us a standard review timeline. In November 2013, in response to a request from FDA, we submitted additional information to the FDA related to the validation of a manufacturing step for ALPROLIX. Due to the timing of this submission, the FDA extended the initial PDUFA date for its review of our application by three months, which is a standard extension period.
We have submitted additional regulatory applications for ALPROLIX in Australia, Canada and Japan.
Pediatric data will be required as part of the Marketing Authorisation Application for ALPROLIX that we plan to submit to the EMA, and we have initiated a global pediatric study of ALPROLIX.
We collaborate with Swedish Orphan Biovitrum AB on the development and commercialization of ELOCATE and ALPROLIX. For information about this collaboration, please read Note 20,
Collaborative and Other Relationships
to our consolidated financial statements included in this report.
GAZYVA
The Roche Group is managing the following Phase 3 studies of GAZYVA:
|
•
|
GOYA
: investigating the efficacy and safety of GAZYVA in combination with CHOP chemotherapy compared to RITUXAN with CHOP chemotherapy in previously untreated patients with CD20-positive diffuse large B-cell lymphoma.
|
|
•
|
GALLIUM
: investigating the efficacy and safety of GAZYVA in combination with chemotherapy followed by maintenance with GAZYVA compared to RITUXAN in combination with chemotherapy followed by maintenance with RITUXAN in previously untreated patients with indolent non-Hodgkin's lymphoma.
|
|
•
|
GADOLIN
: investigating the efficacy and safety of GAZYVA plus bendamustine compared with bendamustine alone in patients with RITUXAN-refractory, indolent non-Hodgkin's lymphoma.
|
For information about our agreement with Genentech, please read Note 20,
Collaborative and Other Relationships
to our consolidated financial statements included in this report.
Business Development
In January 2014, we entered into an exclusive worldwide collaboration and license agreement with Sangamo BioSciences, Inc. (Sangamo) focused on the development of therapeutics for hemoglobinopathies, inherited conditions that result from the abnormal structure or underproduction of hemoglobin. Under the terms of the agreement, Sangamo is responsible for all research and development activities through the first clinical proof of concept trial in beta-thalassemia, and both companies will perform activities to enable submission of an Investigational New Drug application for sickle cell disease. We will be responsible for subsequent worldwide clinical development, manufacturing and commercialization of products arising from the alliance. Sangamo retains an option to co-promote any licensed product to treat sickle cell disease and beta-thalassemia in the U.S. Completion of the transaction is subject to customary closing conditions, including antitrust clearance in the U.S. under the Hart-Scott-Rodino Antitrust Improvements Act of 1976. For additional information about this transaction, please read Note 27,
Subsequent Events
to our consolidated financial statements included in this report.
In December 2013, pursuant to our joint venture agreement with Samsung Biologics, we exercised our right to enter into an agreement with Samsung Bioepis to commercialize anti-TNF biosimilar product candidates in Europe. Under the agreement, we will be responsible for commercialization of these product candidates across Europe. For additional information about this transaction and our joint venture agreement with Samsung Biologics, please read Note 20,
Collaborative and Other Relationships
to our consolidated financial statements included in this report.
In December 2013, we entered into a collaborative research, development, commercialization and license agreement with Proteostasis Therapeutics, Inc. (Proteostasis) under which both companies will develop and commercialize small molecule therapeutics for the treatment of neurological diseases. For additional information about this transaction, please read Note 20,
Collaborative and Other Relationships
to our consolidated financial statements included in this report.
7
In September 2013, we entered into a six-year research collaboration with Isis Pharmaceuticals, Inc. (Isis) under which both companies will perform discovery level research and develop and commercialize antisense and other therapeutics for the treatment of neurological disorders. Under the collaboration, Isis will perform research on a set of neurological targets identified within the agreement. Once the research has reached a specific stage of development we will make the determination whether antisense is the preferred approach to develop a therapeutic candidate or whether another modality is preferred. If antisense is selected, Isis will continue development and identify a product candidate. If another modality is used, we will assume the responsibility for identifying a product candidate and developing it. For additional information about this transaction, please read Note 20,
Collaborative and Other Relationships
to our consolidated financial statements included in this report.
In July 2013, we entered into a Platform Agreement with Adimab LLC (Adimab). Pursuant to the agreement, Adimab granted us a non-exclusive license to its proprietary antibody discovery platform that enables our researchers to utilize the Adimab technology for the discovery and optimization of all antibody formats, including bispecific antibodies.
In April 2013, we acquired full ownership of, and strategic, commercial and decision-making rights to, TYSABRI from Elan. Upon the closing of the transaction, our collaboration agreement with Elan was terminated. For additional information about this transaction, please read Note 2,
Acquisitions
to our consolidated financial statements included in this report.
Patents and Other Proprietary Rights
Patents are important to developing and protecting exclusive rights in our drugs and drug candidates. We regularly seek patent protection in the U.S. and in selected countries outside the U.S. for inventions originating from our research and development efforts. In addition, we license rights to various patents and patent applications. U.S. patents, as well as most foreign patents, are generally effective for 20 years from the date the earliest application was filed; however, U.S. patents that issue on applications filed before June 8, 1995 may be effective until 17 years from the issue date, if that is later than the 20 year date. In some cases, the patent term may be extended to recapture a portion of the term lost during FDA regulatory review or because of U.S. Patent and Trademark Office (USPTO) delays in prosecuting the application. The duration of foreign patents varies similarly, in accordance with local law.
Regulatory exclusivity, which may consist of regulatory data protection and market protection, also can provide meaningful protection for our products. Regulatory data protection provides to the holder of a drug or biologic marketing authorization, for a set period of time, the exclusive use of the proprietary pre-clinical and clinical data that it created at significant cost and submitted to the applicable regulatory authority to obtain approval of its product. Our products also may qualify for market protection from regulatory authorities, pursuant to which a regulatory authority may not permit for a set period of time, the approval or commercialization of another product containing the same active ingredient(s) as our product. After that set period of time, third parties are then permitted to rely upon our data to obtain approval of their abbreviated applications to market generic drugs and biosimilars. Although the World Trade Organization's agreement on trade-related aspects of intellectual property rights (TRIPS) requires signatory countries to provide regulatory exclusivity to innovative pharmaceutical products, implementation and enforcement varies widely from country to country.
We also rely upon other forms of unpatented confidential information to remain competitive. We protect such information principally through confidentiality agreements with our employees, consultants, outside scientific collaborators, scientists whose research we sponsor and other advisers. In the case of our employees, these agreements also provide, in compliance with relevant law, that inventions and other intellectual property conceived by such employees during their employment shall be our exclusive property.
Our trademarks, including AVONEX, RITUXAN, TECFIDERA and TYSABRI, are important to us and are generally covered by trademark applications or registrations in the USPTO and the patent or trademark offices of other countries. We also use trademarks licensed from third parties, such as the trademark FAMPYRA which we license from Acorda Therapeutics. Trademark protection varies in accordance with local law, and continues in some countries as long as the trademark is used and in other countries as long as the trademark is registered. Trademark registrations generally are for fixed but renewable terms.
A discussion of certain risks and uncertainties that may affect our patent position and proprietary rights is set forth in the “
Risk Factors
” section of this report.
Additional information about the patents and other proprietary rights covering our marketed products and several of our late-stage product candidates is set forth below.
8
AVONEX and PLEGRIDY (peginterferon beta-1a)
Our U.S. patent no. 7,588,755, granted in September 2009, claims the use of recombinant beta interferon for immunomodulation or treating a viral condition, viral disease, cancers or tumors. This patent, which expires in September 2026, covers the treatment of MS with our product AVONEX, as well as the treatment of MS with our product candidate PLEGRIDY. A discussion of legal proceedings related to this patent is set forth in Note 21,
Litigation
to our consolidated financial statements included in this report.
Additionally, we and another party each own a pending U.S. patent application related to recombinant interferon-beta protein. These applications, which fall outside of the GATT amendments to the U.S. patent statute, are not published by the USPTO and, if they mature into granted patents, may be entitled to a term of seventeen years from the grant date. There is a pending interference proceeding in the USPTO involving these applications. We do not know whether either of these applications will mature into patents with claims relevant to AVONEX or to PLEGRIDY.
Additional protection for PLEGRIDY is provided by patents and patent applications with expiration dates in 2021 in the U.S. and 2019 in the E.U., with the potential for patent term extension. We also expect that PLEGRIDY, if approved, will be granted regulatory exclusivity for 12 years from approval in the U.S. and 10 years from approval in the E.U.
TYSABRI
We have patents and patent applications covering TYSABRI in the U.S. and other countries. These patents and patent applications cover TYSABRI and related manufacturing methods, as well as various methods of treatment using the product. The principal patents covering the product and use of the product to treat MS are U.S. patent nos. 5,840,299 and 6,602,503 and European patent no. (EP) 0804237, which expire between 2015 and 2020. Additional U.S. patents and applications covering methods of treatment using the product and methods of manufacturing the product generally expire between 2014 and 2023. In other countries, additional patents and patent applications covering methods of treatment using the product and methods of manufacturing the product expire between 2014 and 2023, subject to any supplemental protection (i.e., patent term extension) certificates that may be obtained.
TECFIDERA
We have several U.S. patents and patent applications, and a number of corresponding foreign counterparts, related to TECFIDERA.
Our principal U.S. patents and expiration dates, subject to any available patent term extension following product approval, are:
|
•
|
U.S. patent no. 6,509,376, having claims to formulations of dimethyl fumarate for use in the treatment of autoimmune diseases including MS, expiring in 2019;
|
|
•
|
U.S. patent no. 7,320,999, having claims to a method of treating MS using dimethyl fumarate, expiring in 2020;
|
|
•
|
U.S. patent no. 7,619,001, having claims to a method of treating MS using dimethyl fumarate, monomethyl fumarate, or a combination thereof, expiring in 2018;
|
|
•
|
U.S. patent no. 7,803,840, having claims to a method of treating an autoimmune disease selected from autoimmune polyarthritis and MS using dimethyl fumarate, expiring in 2018;
|
|
•
|
U.S. patent no. 8,399,514, covering the dosing regimen of 240 mg of TECFIDERA administered twice a day, expiring in 2028; and
|
|
•
|
U.S. patent no. 8,524,773, having claims to a method of treating MS using monomethyl fumarate, expiring in 2018.
|
Our principal European patents expiration dates, subject to any potential supplemental patent certificates that may be available, are:
|
•
|
EP 1131065, directed to formulations of dimethyl fumarate and to uses thereof for treating autoimmune diseases, including MS, expiring in 2019; and
|
|
•
|
EP 2137537, the counterpart patent to our U.S. patent covering the dosing regimen of 240 mg of TECFIDERA administered twice a day, expiring in 2028.
|
9
In addition to patent protection, in the U.S. TECFIDERA is entitled to regulatory exclusivity afforded to new chemical entities until 2018. In the E.U., the EMA has determined that dimethyl fumurate in TECFIDERA qualifies as a new active substance (NAS). TECFIDERA is entitled to regulatory exclusivity in the E.U., which is expected to provide 8 years of data protection plus two years of market exclusivity from the date of notification of approval of our marketing application by the EC in February 2014.
RITUXAN and Anti-CD20 Antibodies
We have several U.S. patents and patent applications, and numerous corresponding foreign counterparts, directed to anti-CD20 antibody technology, including RITUXAN. The principal patents with claims to RITUXAN or its uses expire in the U.S. between 2015 and 2018 and expired in the rest of the world in 2013, subject to any available patent term extensions. In addition, we and our collaborator, Genentech, have filed numerous patent applications directed to anti-CD20 antibodies and their uses to treat various diseases. These pending patent applications have the potential of issuing as patents in the U.S. and in the rest of world with claims to anti-CD20 antibody molecules for periods beyond those stated above for RITUXAN. In 2008, a European patent of ours claiming the treatment with anti-CD20 antibodies of certain auto-immune indications, including
rheumatoid arthritis
, was revoked by the European Patent Office.
Genentech, our collaborator on RITUXAN, has secured an exclusive license to five U.S. patents and counterpart U.S. and foreign patent applications assigned to Xoma Corporation that relate to chimeric antibodies against the CD20 antigen. These patents have expired or will expire between 2007 and 2014. We, along with Genentech, share the cost of any royalties due to Xoma in our co-promotion territory on sales of RITUXAN.
FAMPYRA
We have an exclusive license under two European granted patents, several pending European patent applications and numerous corresponding non-U.S. counterpart applications related to FAMPYRA. European patent EP 0484186B1 claims pharmaceutical formulations containing aminopyridines including fampridine. This patent expired in November 2011 but is subject to pending and granted supplemental protection (i.e., patent term extension) certificates which, if granted, will extend the patent term to 2016 on a country-by-country basis. European patent EP 1732548B1, which claims sustained-release aminopyridine compositions for increasing walking speed in patients with MS, and EP 2377536B1, which claims sustained-release aminopyridine compositions for treating multiple sclerosis both expire in 2025 but are subject to pending and granted supplemental protection certificates which, if granted, will extend one of the patents’ term to 2026 on a country-by-country basis. In addition to these patent rights, FAMPYRA is covered by regulatory exclusivity in Europe expected until 2021.
ELOCTATE [Antihemophilic Factor, Fc Fusion Protein (Recombinant)] and ALPROLIX [Coagulation Factor IX, Fc fusion protein (Recombinant)]
We have several U.S. patents and patent applications, and a number of corresponding foreign counterparts, related to ELOCTATE and ALPROLIX, our long-lasting recombinant Factor VIII and Factor IX product candidates and their use, including U.S. patents nos. 7,404,956, 8,329,182, 7,348,004 and 7,862,820. These patents will expire between 2024 and 2025, and some may be entitled to additional patent term pursuant to the patent term adjustment or patent term extension provisions of the U.S. patent laws. Related European patents EP 1624891 and EP 1625208 expire in 2024 and may be entitled to additional patent term in at least some countries. Additionally, pending patent applications, if granted, would provide additional patent protection through 2033.
Sales, Marketing and Distribution
We focus our sales and marketing efforts on specialist physicians in private practice or at major medical centers. We use customary pharmaceutical company practices to market our products and to educate physicians, such as sales representatives calling on individual physicians, advertisements, professional symposia, direct mail, public relations and other methods. We provide customer service and other related programs for our products, such as disease and product-specific websites, insurance research services and order, delivery and fulfillment services. We have also established programs in the U.S. which provide qualified uninsured or underinsured patients with marketed products at no or reduced charge, based on specific eligibility criteria. Additional information about our sales, marketing and distribution efforts for our marketed products is set forth below.
10
AVONEX
We continue to focus our marketing and sales activities on maximizing the potential of AVONEX in the U.S. and the rest of world in the face of increased competition, including from our own products and products of our competitors. The principal markets for AVONEX are the U.S., Germany, France, Italy and the United Kingdom. In the U.S., Canada, Brazil, Argentina, Australia, Japan and most of the major countries of the E.U., we market and sell AVONEX through our own sales forces and marketing groups and distribute AVONEX principally through wholesale distributors of pharmaceutical products, mail order specialty distributors or shipping service providers. In other countries, we sell AVONEX to distribution partners who are then responsible for most marketing and distribution activities.
TYSABRI
The principal markets for TYSABRI are the U.S., the United Kingdom, France, Germany, Italy and Spain. Following the completion of our acquisition of 100% of the rights to TYSABRI from Elan in April 2013, we are solely responsible for the marketing and sale of TYSABRI for MS in the U.S. and the rest of world. We use a combination of our own sales force and marketing group and third party service providers for our marketing and distribution of TYSABRI.
TECFIDERA
The principal market for TECFIDERA is the U.S. and the E.U. In the U.S., E.U., Canada and Australia, we market and sell TECFIDERA through our own sales forces and marketing groups and distribute TECFIDERA principally through wholesale distributors of pharmaceutical products, mail order specialty distributors or shipping service providers.
RITUXAN and GAZYVA
The Roche Group and its sub-licensees market and sell RITUXAN worldwide. In the U.S., we collaborate with Genentech on the development and commercialization of RITUXAN, but Genentech maintains sole responsibility for the U.S. sales and marketing efforts related to RITUXAN. RITUXAN is generally sold to wholesalers, specialty distributors and directly to hospital pharmacies.
Pursuant to our agreement with Genentech, the Roche Group and its sub-licensees will maintain sole responsibility for the development, manufacturing and commercialization of GAZYVA in the U.S.
FAMPYRA
We market and sell FAMPYRA in major markets outside the U.S., such as France, Germany, Spain and Canada, through our own sales forces and marketing groups and distribute FAMPYRA in those markets principally through wholesale distributors of pharmaceutical products. In other countries outside the U.S., we sell FAMPYRA to distribution partners who are then responsible for most marketing and distribution activities. Our commercialization rights do not include the U.S. market.
FUMADERM
FUMADERM is marketed only in Germany, through our own sales force and marketing group.
Competition
Competition in the biotechnology and pharmaceutical industries is intense and comes from many and varied sources, including specialized biotechnology firms and large pharmaceutical companies. Many of our competitors are working to develop products similar to those we are developing or already market and have considerable experience in undertaking clinical trials and in obtaining regulatory approval to market pharmaceutical products. Certain of these companies have substantially greater financial, marketing and research and development resources than we do.
We believe that competition and leadership in the industry is based on managerial and technological excellence and innovation as well as establishing patent and other proprietary positions through research and development. The achievement of a leadership position also depends largely upon our ability to identify and exploit commercially the products resulting from research and the availability of adequate financial resources to fund facilities, equipment, personnel, clinical testing, manufacturing and marketing. Another key aspect of remaining competitive within the industry is recruiting and retaining qualified scientists and technicians. We believe that we have been successful in attracting skilled and experienced scientific personnel.
Competition among products approved for sale may be based, among other things, on patent position, product efficacy, safety, convenience, reliability, availability and price. In addition, early entry of a new pharmaceutical product into the market may have important advantages in gaining product acceptance and market share. Accordingly, the relative speed with which we can develop products, complete the testing and approval process and supply commercial quantities of products will have an important impact on our competitive position.
11
We may face increased competitive pressures as a result of the emergence of biosimilars. In the U.S., a number of our marketed products, including AVONEX, TYSABRI and RITUXAN, are licensed under the Public Health Service Act (PHSA) as biological products. In March 2010, U.S. healthcare reform legislation amended the PHSA to authorize the FDA to approve biological products, known as biosimilars or follow-on biologics, that are shown to be highly similar to previously approved biological products based upon potentially abbreviated data packages. The approval pathway for biosimilars does, however, grant a biologics manufacturer a 12 year period of exclusivity from the date of approval of its biological product before biosimilar competition can be introduced. Biosimilars legislation has also been in place in the E.U. since 2003. In December 2012, guidelines issued by the EMA for approving biosimilars of marketed monoclonal antibody products became effective. If a biosimilar version of one of our products were approved, it could reduce our sales of that product.
Additional information about the competition that our marketed products face is set forth below.
AVONEX, TYSABRI and TECFIDERA
Each of AVONEX, TYSABRI and TECFIDERA competes with the following products:
|
•
|
COPAXONE (glatiramer acetate), which is marketed by Teva Pharmaceutical Industries Ltd. COPAXONE generated worldwide revenues of approximately $4.0 billion in 2012.
|
|
•
|
REBIF (interferon-beta-1a), which is marketed by Merck (and co-promoted with Pfizer Inc. in the U.S.). REBIF generated worldwide revenues of approximately $2.5 billion in 2012.
|
|
•
|
BETASERON/BETAFERON (interferon-beta-1b), which is marketed by the Bayer Group. BETASERON/BETAFERON generated worldwide revenues of approximately $1.6 billion in 2012.
|
|
•
|
EXTAVIA (interferon-beta-1b), which is marketed by Novartis AG. EXTAVIA generated worldwide revenues of approximately $159.0 million in 2012.
|
|
•
|
GILENYA (fingolimod), which is marketed by Novartis AG. GILENYA generated worldwide revenues of approximately $1.2 billion in 2012.
|
|
•
|
AUBAGIO (teriflunomide), which is marketed by Sanofi. AUBAGIO generated worldwide revenues of approximately $9.2 million in 2012.
|
Along with us, a number of companies are working to develop additional treatments for MS that may in the future compete with AVONEX, TYSABRI, TECFIDERA or all of them. For example, a marketing application for LEMTRADA (alemtuzumab) (developed by Sanofi) has been approved in the E.U. as a treatment for MS in September 2013. In addition, the commercialization of our own products, such as TECFIDERA, may negatively impact future sales of AVONEX, TYSABRI or both. Further, following the expected expiration of Teva Pharmaceutical’s patent protection for COPAXONE (May 2014 for its U.S. patents and in May 2015 for its European patents), we anticipate that additional companies will introduce similar versions of COPAXONE that may also create further competition in the MS market.
FAMPYRA
FAMPYRA is indicated as a treatment to improve walking in adult patients with MS who have walking disability and is the first treatment that addresses this unmet medical need with demonstrated efficacy in people with all types of MS. FAMPYRA is currently the only therapy approved to improve walking in patients with MS, and benefits from exclusivity rights that prohibit generic versions from being marketed.
FUMADERM
FUMADERM competes with several different types of therapies in the psoriasis market within Germany, including oral systemics such as methotrexate and cyclosporine.
RITUXAN IN ONCOLOGY
RITUXAN competes with several different types of therapies in the oncology market, including:
|
•
|
TREANDA (bendamustine HCL) (marketed by Cephalon (Teva Pharmaceuticals)), which is indicated for CLL and for patients with indolent B-cell NHL that has progressed within 6 months of treatment with RITUXAN.
|
|
•
|
ARZERRA (ofatumumab) (marketed by GenMab in collaboration with GlaxoSmithKline), which is indicated for CLL patients refractory to both alemtuzumab and fludarabine.
|
12
We also expect that over time GAZYVA will compete with RITUXAN, TREANDA AND ARZERRA in the oncology market. In addition, we are aware of other anti-CD20 molecules, including biosimilars, in development that, if successfully developed and registered, may compete with RITUXAN and GAZYVA in the oncology market.
RITUXAN IN RHEUMATOID ARTHRITIS (RA)
RITUXAN competes with several different types of therapies in the RA market, including:
|
•
|
Traditional therapies for RA, including disease-modifying anti-rheumatic drugs such as steroids, methotrexate and cyclosporine, and pain relievers such as acetaminophen.
|
|
•
|
TNF inhibitors, such as REMICADE (infliximab) and SIMPONI and SIMPONI ARIA (golimumab) (marketed by Johnson & Johnson), HUMIRA (adalimumab) (marketed by AbbVie, Inc.), ENBREL (etanercept) (marketed by Amgen, Inc. and Pfizer) and CIMZIA (certolizumab pegol) (marketed by UCB, S.A.).
|
|
•
|
ORENCIA (abatacept) (marketed by Bristol-Myers Squibb Company).
|
|
•
|
ACTEMRA (tocilizumab) (marketed by the Roche Group).
|
|
•
|
XELJANZ (tofacitinib) (marketed by Pfizer).
|
We are also aware of other products, including biosimilars, in development that, if successfully developed and registered, may compete with RITUXAN in the RA market.
Regulatory
Our current and contemplated activities and the products and processes that will result from such activities are subject to substantial government regulation.
Regulation of Pharmaceuticals
Product Approval and Post-Approval Regulation in the United States
Before new pharmaceutical products may be sold in the U.S., preclinical studies and clinical trials of the products must be conducted and the results submitted to the FDA for approval. With limited exceptions, the FDA requires companies to register both pre-approval and post-approval clinical trials and disclose clinical trial results in public databases. Failure to register a trial or disclose study results within the required time periods could result in penalties, including civil monetary penalties. Clinical trial programs must establish efficacy, determine an appropriate dose and dosing regimen, and define the conditions for safe use. This is a high-risk process that requires stepwise clinical studies in which the candidate product must successfully meet predetermined endpoints. The results of the preclinical and clinical testing of a product are then submitted to the FDA in the form of a BLA or a New Drug Application (NDA). In response to a BLA or NDA, the FDA may grant marketing approval, request additional information or deny the application if it determines the application does not provide an adequate basis for approval.
Product development and receipt of regulatory approval takes a number of years, involves the expenditure of substantial resources and depends on a number of factors, including the severity of the disease in question, the availability of alternative treatments, potential safety signals observed in preclinical or clinical tests, and the risks and benefits of the product as demonstrated in clinical trials. The FDA has substantial discretion in the product approval process, and it is impossible to predict with any certainty whether and when the FDA will grant marketing approval. The agency may on occasion require the sponsor of a BLA or NDA to conduct additional clinical studies or to provide other scientific or technical information about the product, and these additional requirements may lead to unanticipated delay or expense. Furthermore, even if a product is approved, the approval may be subject to limitations based on the FDA's interpretation of the existing pre-clinical or clinical data.
The FDA has developed four distinct approaches intended to make therapeutically important drugs available as rapidly as possible, especially when the drugs are the first available treatment or have advantages over existing treatments: accelerated approval, fast track, breakthrough therapy, and priority review.
13
The FDA may grant “accelerated approval” status to products that treat serious or life-threatening illnesses and that provide meaningful therapeutic benefits to patients over existing treatments. Under this pathway, the FDA may approve a product based on surrogate endpoints, or clinical endpoints other than survival or irreversible morbidity. When approval is based on surrogate endpoints or clinical endpoints other than survival or morbidity, the sponsor will be required to conduct additional post-approval clinical studies to verify and describe clinical benefit. Under the agency's accelerated approval regulations, if the FDA concludes that a drug that has been shown to be effective can be safely used only if distribution or use is restricted, it may require certain post-marketing restrictions as necessary to assure safe use. In addition, for products approved under accelerated approval, sponsors may be required to submit all copies of their promotional materials, including advertisements, to the FDA at least thirty days prior to initial dissemination. The FDA may withdraw approval under accelerated approval after a hearing if, for instance, post-marketing studies fail to verify any clinical benefit, it becomes clear that restrictions on the distribution of the product are inadequate to ensure its safe use, or if a sponsor fails to comply with the conditions of the accelerated approval.
In addition, the FDA may grant “fast track” status to products that treat serious diseases or conditions and fill an unmet medical need. Fast track is a process designed to expedite the review of such products by providing, among other things, more frequent meetings with the FDA to discuss the product's development plan, more frequent written correspondence from the FDA about trial design, eligibility for accelerated approval, and rolling review, which allows submission of individually completed sections of a NDA or BLA for FDA review before the entire filing is completed. Fast track status does not ensure that a product will be developed more quickly or receive FDA approval.
The FDA may also grant “breakthrough therapy” status to drugs designed to treat, alone or in combination with another drug or drugs, a serious or life-threatening disease or condition and for which preliminary evidence suggests a substantial improvement over existing therapies. Such drugs need not address an unmet need, but are nevertheless eligible for expedited review if they offer the potential for an improvement. Breakthrough therapy status entitles the sponsor to earlier and more frequent meetings with the FDA regarding the development of nonclinical and clinical data and permits the FDA to offer product development or regulatory advice for the purpose of shortening the time to product approval. Breakthrough therapy status does not guarantee that a product will be developed or reviewed more quickly and does not ensure FDA approval.
Finally, the FDA may grant “priority review” status to products that offer major advances in treatment or provide a treatment where no adequate therapy exists. Priority review is intended to reduce the time it takes for the FDA to review a NDA or BLA.
Regardless of the approval pathway employed, the FDA may require a sponsor to conduct additional post-marketing studies as a condition of approval to provide data on safety and effectiveness. If a sponsor fails to conduct the required studies, the agency may withdraw its approval. In addition, if the FDA concludes that a drug that has been shown to be effective can be safely used only if distribution or use is restricted, it can mandate post-marketing restrictions as necessary to assure safe use. In such a case, the sponsor may be required to establish rigorous systems to assure use of the product under safe conditions. These systems are usually referred to as Risk Evaluation and Mitigation Strategies (REMS). The FDA can impose financial penalties for failing to comply with certain post-marketing commitments, including REMS. In addition, any changes to an approved REMS must be reviewed and approved by the FDA prior to implementation.
We monitor information on side effects and adverse events reported during clinical studies and after marketing approval and report such information and events to regulatory agencies. Non-compliance with the FDA's safety reporting requirements may result in civil or criminal penalties. Side effects or adverse events that are reported during clinical trials can delay, impede, or prevent marketing approval. Based on new safety information that emerges after approval, the FDA can mandate product labeling changes, impose a new REMS or the addition of elements to an existing REMS, require new post-marketing studies (including additional clinical trials), or suspend or withdraw approval of the product. These requirements may affect our ability to maintain marketing approval of our products or require us to make significant expenditures to obtain or maintain such approvals.
If we seek to make certain types of changes to an approved product, such as adding a new indication, making certain manufacturing changes, or changing manufacturers or suppliers of certain ingredients or components, the FDA will need to review and approve such changes in advance. In the case of a new indication, we are required to demonstrate with additional clinical data that the product is safe and effective for a use other than that initially approved. FDA regulatory review may result in denial or modification of the planned changes, or requirements to conduct additional tests or evaluations that can substantially delay or increase the cost of the planned changes.
14
In addition, the FDA regulates all advertising and promotion activities and communications for products under its jurisdiction both before and after approval. A company can make only those claims relating to safety and efficacy that are approved by the FDA. However, physicians may prescribe legally available drugs for uses that are not described in the drug's labeling. Such off-label uses are common across medical specialties, and often reflect a physician's belief that the off-label use is the best treatment for patients. The FDA does not regulate the behavior of physicians in their choice of treatments, but the FDA regulations do impose stringent restrictions on manufacturers' communications regarding off-label uses. Failure to comply with applicable FDA requirements may subject a company to adverse publicity, enforcement action by the FDA, corrective advertising, and the full range of civil and criminal penalties available to the FDA.
Product Approval and Post-Approval Regulation Outside the United States
We market our products in numerous jurisdictions outside the U.S. Most of these jurisdictions have product approval and post-approval regulatory processes that are similar in principle to those in the U.S. In Europe, where most of our ex-U.S. efforts are focused, there are several tracks for marketing approval, depending on the type of product for which approval is sought. Under the centralized procedure, a company submits a single application to the EMA. The marketing application is similar to the NDA or BLA in the U.S. and is evaluated by the Committee for Medicinal Products for Human Use (CHMP), the expert scientific committee of the EMA. If the CHMP determines that the marketing application fulfills the requirements for quality, safety, and efficacy, it will submit a favorable opinion to the EC. The CHMP opinion is not binding, but is typically adopted by the EC. A marketing application approved by the EC is valid in all member states. The centralized procedure is required for all biological products, orphan medicinal products, and new treatments for neurodegenerative disorders, and it is available for certain other products, including those which constitute a significant therapeutic, scientific or technical innovation.
In addition to the centralized procedure, Europe also has: (1) a nationalized procedure, which requires a separate application to and approval determination by each country; (2) a decentralized procedure, whereby applicants submit identical applications to several countries and receive simultaneous approval; and (3) a mutual recognition procedure, where applicants submit an application to one country for review and other countries may accept or reject the initial decision. Regardless of the approval process employed, various parties share responsibilities for the monitoring, detection, and evaluation of adverse events post-approval, including national authorities, the EMA, the EC, and the marketing authorization holder. In some regions, it is possible to receive an “accelerated” review whereby the national regulatory authority will commit to truncated review timelines for products that meet specific medical needs.
Good Manufacturing Practices
Regulatory agencies regulate and inspect equipment, facilities, and processes used in the manufacturing and testing of pharmaceutical and biologic products prior to approving a product. If, after receiving clearance from regulatory agencies, a company makes a material change in manufacturing equipment, location, or process, additional regulatory review and approval may be required. We also must adhere to current Good Manufacturing Practices (cGMP) and product-specific regulations enforced by regulatory agencies following product approval. The FDA, the EMA and other regulatory agencies also conduct periodic visits to re-inspect equipment, facilities, and processes following the initial approval of a product. If, as a result of these inspections, it is determined that our equipment, facilities, or processes do not comply with applicable regulations and conditions of product approval, regulatory agencies may seek civil, criminal, or administrative sanctions or remedies against us, including significant financial penalties and the suspension of our manufacturing operations.
Good Clinical Practices
The FDA, the EMA and other regulatory agencies promulgate regulations and standards for designing, conducting, monitoring, auditing and reporting the results of clinical trials to ensure that the data and results are accurate and that the rights and welfare of trial participants are adequately protected (commonly referred to as current Good Clinical Practices (cGCP)). Regulatory agencies enforce cGCP through periodic inspections of trial sponsors, principal investigators and trial sites, contract research organizations (CROs), and institutional review boards. If our studies fail to comply with applicable cGCP, the clinical data generated in our clinical trials may be deemed unreliable and relevant regulatory agencies may require us to perform additional clinical trials before approving our marketing applications. Noncompliance can also result in civil or criminal sanctions. We rely on third parties, including CROs, to carry out many of our clinical trial-related activities. Failure of such third parties to comply with cGCP can likewise result in rejection of our clinical trial data or other sanctions.
15
Orphan Drug Act
Under the U.S. Orphan Drug Act, the FDA may grant orphan drug designation to drugs or biologics intended to treat a “rare disease or condition,” which generally is a disease or condition that affects fewer than 200,000 individuals in the U.S. If a product which has an orphan drug designation subsequently receives the first FDA approval for the indication for which it has such designation, the product is entitled to orphan exclusivity, i.e., the FDA may not approve any other applications to market the same drug for the same indication for a period of seven years following marketing approval, except in certain very limited circumstances, such as if the later product is shown to be clinically superior to the orphan product. Legislation similar to the U.S. Orphan Drug Act has been enacted in other countries to encourage the research, development and marketing of medicines to treat, prevent or diagnose rare diseases. In the E.U., medicinal products intended for diagnosis, prevention or treatment of life-threatening or very serious diseases affecting less than five in 10,000 people receive 10-year market exclusivity, protocol assistance, and access to the centralized procedure for marketing authorization.
Regulation Pertaining to Pricing and Reimbursement
In both domestic and foreign markets, sales of our products depend, in part, on the availability and amount of reimbursement by third party payors, including governments and private health plans. Governments may regulate coverage, reimbursement and pricing of our products to control cost or affect utilization of our products. Private health plans may also seek to manage cost and utilization by implementing coverage and reimbursement limitations. Substantial uncertainty exists regarding the reimbursement by third party payors of newly approved health care products. The U.S. and foreign governments regularly consider reform measures that affect health care coverage and costs. Such reforms may include changes to the coverage and reimbursement of our products which may have a significant impact on our business.
Within the U.S.
Medicaid is a joint federal and state program that is administered by the states for low income and disabled beneficiaries. Under the Medicaid Drug Rebate Program, we are required to pay a rebate for each unit of product reimbursed by the state Medicaid programs. For most brand name drugs, the amount of the basic rebate for each product is set by law as the greater of 23.1% (17.1% for clotting factors and certain other products) of the average manufacturer price (AMP) or the difference between AMP and the best price available from us to any customer (with limited exceptions). The rebate amount must be adjusted upward if AMP increases more than inflation (measured by the Consumer Price Index - Urban). This adjustment can cause the total rebate amount to exceed the minimum 23.1% (or 17.1%) basic rebate amount. The rebate amount is calculated each quarter based on our report of current AMP and best price for each of our products to the Centers for Medicare & Medicaid Services. The requirements for calculating AMP and best price are complex. We are required to report any revisions to AMP or best price previously reported within a certain period, which revisions could affect our rebate liability for prior quarters. In addition, if we fail to provide information timely or we are found to have knowingly submitted false information to the government, the statute governing the Medicaid Drug Rebate Program provides for civil monetary penalties.
Medicare is a federal program that is administered by the federal government that covers individuals age 65 and over as well as those with certain disabilities. Medicare Part B generally covers drugs that must be administered by physicians or other health care practitioners; are provided in connection with certain durable medical equipment; or are certain oral anti-cancer drugs and certain oral immunosuppressive drugs. Medicare Part B pays for such drugs under a payment methodology based on the average sales price (ASP) of the drugs. Manufacturers, including us, are required to provide ASP information to the Centers for Medicare & Medicaid Services on a quarterly basis. The manufacturer-submitted information is used to calculate Medicare payment rates. The current payment rate for Medicare Part B drugs is ASP plus 6%. The payment rates for drugs in the hospital outpatient setting are subject to periodic adjustment. The Centers for Medicare & Medicaid Services also has the statutory authority to adjust payment rates for specific drugs outside the hospital outpatient setting based on a comparison of ASP payment rates to widely available market prices or to AMP, which could decrease Medicare payment rates, but the authority has not yet been implemented. If a manufacturer is found to have made a misrepresentation in the reporting of ASP, the governing statute provides for civil monetary penalties.
Medicare Part D provides coverage to enrolled Medicare patients for self-administered drugs (i.e., drugs that do not need to be injected or otherwise administered by a physician). Medicare Part D is administered by private prescription drug plans approved by the U.S. government and each drug plan establishes its own Medicare Part D formulary for prescription drug coverage and pricing, which the drug plan may modify from time-to-time. The prescription drug plans negotiate pricing with manufacturers and may condition formulary placement on the availability of manufacturer discounts. Manufacturers, including us, are required to provide a 50% discount on brand name prescription drugs utilized by Medicare Part D beneficiaries when those beneficiaries reach the coverage gap in their drug benefits.
16
Our products are subject to discounted pricing when purchased by federal agencies via the Federal Supply Schedule (FSS). FSS participation is required for our products to be covered and reimbursed by the Veterans Administration, Department of Defense, Coast Guard, and Public Health Service (PHS). Coverage under Medicaid, the Medicare Part B program and the PHS pharmaceutical pricing program is also conditioned upon FSS participation. FSS pricing is negotiated periodically with the Department of Veterans Affairs. FSS pricing is intended not to exceed the price that we charge our most-favored non-federal customer for a product. In addition, prices for drugs purchased by the Veterans Administration, Department of Defense (including drugs purchased by military personnel and dependents through the TriCare retail pharmacy program), Coast Guard, and PHS are subject to a cap on pricing equal to 76% of the non-federal average manufacturer price (non-FAMP). An additional discount applies if non-FAMP increases more than inflation (measured by the Consumer Price Index - Urban). In addition, if we fail to provide information timely or we are found to have knowingly submitted false information to the government, the governing statute provides for civil monetary penalties in addition to other penalties available to the government.
To maintain coverage of our products under the Medicaid Drug Rebate Program and Medicare Part B, we are required to extend discounts to certain covered entities that purchase products under the PHS pharmaceutical pricing program. Purchasers eligible for discounts include hospitals that serve a disproportionate share of financially needy patients, community health clinics, hemophilia treatment centers and other entities that receive health services grants from the PHS.
Outside the U.S.
Outside the U.S., the E.U. represents our major market. Within the E.U., our products are paid for by a variety of payors, with governments being the primary source of payment. Governments may determine or influence reimbursement of products. Governments may also set prices or otherwise regulate pricing. Negotiating prices with governmental authorities can delay commercialization of our products. Governments may use a variety of cost-containment measures to control the cost of products, including price cuts, mandatory rebates, value-based pricing, and reference pricing (i.e., referencing prices in other countries and using those reference prices to set a price). Budgetary pressures in many E.U. countries are continuing to cause governments to consider or implement various cost-containment measures, such as price freezes, increased price cuts and rebates, and expanded generic substitution and patient cost-sharing. If budget pressures continue, governments may implement additional cost-containment measures. For additional information related to our concentration of credit risk associated with certain international accounts receivable balances, please read the subsection below entitled “
Market Risk-Credit Risk
” in the “
Management's Discussion and Analysis of Financial Condition and Results of Operations
” section of this report.
Regulation Pertaining to Sales and Marketing
We are subject to various federal and state laws pertaining to health care “fraud and abuse,” including anti-kickback laws and false claims laws. Anti-kickback laws generally prohibit a prescription drug manufacturer from soliciting, offering, receiving, or paying any remuneration to generate business, including the purchase or prescription of a particular drug. Although the specific provisions of these laws vary, their scope is generally broad and there may be no regulations, guidance or court decisions that clarify how the laws apply to particular industry practices. There is therefore a possibility that our practices might be challenged under the anti-kickback or similar laws. False claims laws prohibit anyone from knowingly and willingly presenting, or causing to be presented for payment to third party payors (including Medicare and Medicaid) claims for reimbursed drugs or services that are false or fraudulent, claims for items or services not provided as claimed, or claims for medically unnecessary items or services. Our activities relating to the sale and marketing of our products may be subject to scrutiny under these laws. Violations of fraud and abuse laws may be punishable by criminal or civil sanctions, including fines and civil monetary penalties, and exclusion from federal health care programs (including Medicare and Medicaid). Federal and state authorities are paying increased attention to enforcement of these laws within the pharmaceutical industry and private individuals have been active in alleging violations of the laws and bringing suits on behalf of the government under the federal civil False Claims Act. If we were subject to allegations concerning, or were convicted of violating, these laws, our business could be harmed.
17
Laws and regulations have been enacted by the federal government and various states to regulate the sales and marketing practices of pharmaceutical manufacturers. The laws and regulations generally limit financial interactions between manufacturers and health care providers or require disclosure to the government and public of such interactions. The laws include federal “sunshine” provisions enacted in 2010 as part of the comprehensive federal health care reform legislation. The sunshine provisions apply to pharmaceutical manufacturers with products reimbursed under certain government programs and require those manufacturers to disclose annually to the federal government (for re-disclosure to the public) certain payments made to physicians and certain other healthcare practitioners or to teaching hospitals. State laws may also require disclosure of pharmaceutical pricing information and marketing expenditures. Many of these laws and regulations contain ambiguous requirements. Given the lack of clarity in laws and their implementation, our reporting actions could be subject to the penalty provisions of the pertinent federal and state laws and regulations. Outside the U.S., other countries have implemented requirements for disclosure of financial interactions with healthcare providers and additional countries may consider or implement such laws.
Other Regulations
Foreign Anti-Corruption
We are subject to various federal and foreign laws that govern our international business practices with respect to payments to government officials. Those laws include the U.S. Foreign Corrupt Practices Act (FCPA), which prohibits U.S. companies and their representatives from paying, offering to pay, promising, or authorizing the payment of anything of value to any foreign government official, government staff member, political party, or political candidate for the purpose of obtaining or retaining business or to otherwise obtain favorable treatment or influence a person working in an official capacity. In many countries, the health care professionals we regularly interact with may meet the FCPA's definition of a foreign government official. The FCPA also requires public companies to make and keep books and records that accurately and fairly reflect their transactions and to devise and maintain an adequate system of internal accounting controls.
The laws to which we are subject also include the U.K. Bribery Act 2010 (Bribery Act) which proscribes giving and receiving bribes in the public and private sectors, bribing a foreign public official, and failing to have adequate procedures to prevent employees and other agents from giving bribes. U.S. companies that conduct business in the United Kingdom generally will be subject to the Bribery Act. Penalties under the Bribery Act include potentially unlimited fines for companies and criminal sanctions for corporate officers under certain circumstances.
NIH Guidelines
We conduct research at our U.S. facilities in compliance with the current U.S. National Institutes of Health Guidelines for Research Involving Recombinant DNA Molecules (NIH Guidelines). By local ordinance, we are required to, among other things, comply with the NIH Guidelines in relation to our facilities in Cambridge, Massachusetts and Research Triangle Park (RTP), North Carolina and are required to operate pursuant to certain permits.
Other Laws
Our present and future business has been and will continue to be subject to various other laws and regulations. Various laws, regulations and recommendations relating to safe working conditions, laboratory practices, the experimental use of animals, and the purchase, storage, movement, import, export and use and disposal of hazardous or potentially hazardous substances, including radioactive compounds and infectious disease agents, used in connection with our research work are or may be applicable to our activities. Certain agreements entered into by us involving exclusive license rights may be subject to national or international antitrust regulatory control, the effect of which cannot be predicted. The extent of government regulation, which might result from future legislation or administrative action, cannot accurately be predicted.
Manufacturing and Raw Materials
We have three licensed biologics manufacturing facilities, which are located in RTP, North Carolina, Cambridge, Massachusetts, and Hillerød, Denmark. The RTP site includes a 105,000 square foot manufacturing plant, which contains 6,000 (3 x 2,000) liters of bioreactor capacity, as well as a 218,000 square foot Large-Scale Manufacturing (LSM) plant which contains 90,000 (6 x 15,000) liters of bioreactor capacity. The Cambridge site is a 67,000 square foot facility that contains 10,000 (5 x 2,000) liters of bioreactor capacity. The Hillerød site is an LSM plant that contains 90,000 (6 x 15,000) liters of bioreactor capacity. Our Hillerød facility was approved by the FDA and EMA for the manufacture of commercial TYSABRI in July 2013.
18
We currently manufacture AVONEX, PLEGRIDY and ELOCTATE drug substance at our RTP and Cambridge facilities, ALPROLIX drug substance at our RTP facility and TYSABRI drug substance at our RTP and Hillerød facilities. Genentech is responsible for all worldwide manufacturing activities for bulk RITUXAN and GAZYVA and has sourced the manufacture of certain bulk RITUXAN and GAZYVA requirements to a third party. Acorda Therapeutics supplies FAMPYRA to us pursuant to its supply agreement with Alkermes, Inc.
We use third parties to manufacture the active pharmaceutical ingredient (API) and the final product for TECFIDERA and FUMADERM. In December 2012, we entered into an arrangement with Eisai, Inc. (Eisai) to lease a portion of their facility in RTP to manufacture oral solid dose products supplementing our outsourced small molecule manufacturing capabilities. That facility also manufactures oral solid dose products for Eisai. As part of that arrangement, Eisai also provides us with vial-filling services for biologic therapies and packaging services for oral solid dose products. We intend to continue to utilize third party contract manufacturing organizations to manufacture the API and final product for our small molecule products, which we intend to supplement through our internal oral solid dose manufacturing capabilities.
We source all of our fill-finish and the majority of final product storage operations for our products, along with a substantial part of our packaging operations, to a concentrated group of third party contractors. We have internal label and pack capability for clinical and commercial products at our Cambridge and Hillerød facilities. Raw materials and supplies required for the production of our products and product candidates are procured from various suppliers in quantities adequate to meet our needs. Continuity of supply of raw materials is assured using a strategy of dual sourcing where possible or by a risk-based inventory strategy. Our third party service providers, suppliers and manufacturers may be subject to routine cGMP inspections by the FDA or comparable agencies in other jurisdictions and undergo assessment and certification by our quality management group.
We believe that our manufacturing facilities provide sufficient capacity for our products. In February 2012, we finalized an agreement with Samsung Biologics that established an entity based in South Korea to develop, manufacture and market biosimilars. Under the agreement, Samsung takes a leading role in the entity, which has contracted with us for technical development services and biologics manufacturing. In December 2013, pursuant to our joint venture agreement with Samsung Biologics, we exercised our right to enter into an agreement with Samsung Bioepis to commercialize anti-TNF biosimilar product candidates in Europe.
Important factors that could adversely affect our manufacturing operations are discussed in the “
Risk Factors
” section of this report.
Our Employees
As of
December 31, 2013
, we had approximately 6,850 employees worldwide.
Our Executive Officers (as of
February 6, 2014
)
George A. Scangos
,
Ph.D.
, 65, is our Chief Executive Officer and has served in this position since July 2010. From 1996 to July 2010, Dr. Scangos served as President and Chief Executive Officer of Exelixis, Inc., a drug discovery and development company, where he continues to serve on the board. From 1993 to 1996, Dr. Scangos served as President of Bayer Biotechnology, where he was responsible for research, business development, process development, manufacturing, engineering and quality assurance of Bayer’s biological products. Before joining Bayer in 1987, Dr. Scangos was a Professor of Biology at Johns Hopkins University for six years. Dr. Scangos served as non-executive Chairman of Anadys Pharmaceuticals, Inc., a biopharmaceutical company, from 2005 to July 2010 and was a director of the company from 2003 to July 2010. Dr. Scangos served as the Chair of the California Healthcare Institute in 2010 and was a member of the Board of the Global Alliance for TB Drug Developments until 2010. He is also a member of the Board of Trustees of the Boston Museum of Science and the Biomedical Sciences Career Program, and a member of the National Board of Visitors of the University of California, Davis School of Medicine. He is currently an Adjunct Professor of Biology at Johns Hopkins. Dr. Scangos received his B.A. in Biology from Cornell University and Ph.D. in Microbiology from the University of Massachusetts, and was a Jane Coffin Childs Post-Doctoral Fellow at Yale University.
Susan H. Alexander
, 57, is our Executive Vice President, Chief Legal Officer and Corporate Secretary and has served in these positions since December 2011. Prior to that, from 2006 to December 2011, Ms. Alexander served as our Executive Vice President, General Counsel and Corporate Secretary. From 2003 to January 2006, Ms. Alexander served as the Senior Vice President, General Counsel and Corporate Secretary of PAREXEL International Corporation, a biopharmaceutical services company. From 2001 to 2003, Ms. Alexander served as General Counsel of IONA Technologies, a software company. From 1995 to 2001, Ms. Alexander served as Counsel at Cabot Corporation, a specialty chemicals and performance materials company. Prior to that, Ms. Alexander was a partner at the law firms of Hinckley, Allen & Snyder and Fine & Ambrogne. Ms. Alexander received her B.A. from Wellesley College and her J.D. from Boston University School of Law.
19
Spyros Artavanis-Tsakonas, Ph.D.,
67
,
is our Senior Vice President, Chief Scientific Officer and has served in this position since May 2013. Prior to his appointment in May 2013, Dr. Artavanis-Tsakonas served as our interim Chief Scientific Officer while on sabbatical from Harvard Medical School from March 2012 to May 2013. Dr. Artavanis-Tsakonas has been a Professor of Cell Biology at the Harvard Medical School since 1999. Prior to that, from 1999 through 2012, he was Professor, Collège de France, serving as Chair of Biology and Genetics of Development, and from 1999 to 2007, he was also the K.J. Isselbacher- P. Schwartz Professor at the Massachusetts General Hospital Cancer Center and Director of Developmental Biology and Cancer at the Harvard Medical School. Dr. Artavanis-Tsakonas is the scientific co-founder of Exelixis Pharmaceuticals, Inc., a drug discovery and development company, Cellzome, a drug discovery and development company, and Anadys Pharmaceuticals, Inc., a biopharmaceutical company. Dr. Artavanis-Tsakonas obtained his M.Sc. in Chemistry from the Federal Institute of Technology, Zurich and a Ph.D. in Molecular Biology from the University of Cambridge, England. His postdoctoral research was completed at Biozentrum, University of Basel and Stanford University.
Paul J. Clancy
, 52, is our Executive Vice President, Finance and Chief Financial Officer and has served in these positions since August 2007. Mr. Clancy joined Biogen, Inc. in 2001 and has held several senior executive positions with us, including Vice President of Business Planning, Portfolio Management and U.S. Marketing, and Senior Vice President of Finance with responsibilities for leading the Treasury, Tax, Investor Relations and Business Planning groups. Prior to that, he spent 13 years at PepsiCo, a food and beverage company, serving in a range of financial and general management positions. Mr. Clancy serves on the board of directors of Agios Pharmaceuticals, Inc., a biopharmaceutical company. Mr. Clancy received his B.S. in Finance from Babson College and M.B.A. from Columbia University.
Gregory F. Covino,
48, is our Vice President, Finance and Chief Accounting Officer and has served in this position since April 2012. Prior to that, Mr. Covino served at Boston Scientific Corporation, a medical device company, as Vice President, Corporate Analysis and Control since March 2010, having responsibility for the company's internal audit function, and as Vice President, Finance, International from February 2008 to March 2010, having responsibility for the financial activities of the company's international division. Prior to that, Mr. Covino held several finance positions at Hubbell Incorporated, an electrical products company, including Vice President, Chief Accounting Officer and Controller from 2002 to January 2008, Interim Chief Financial Officer from 2004 to 2005, and Director, Corporate Accounting from 1999 to 2002. Mr. Covino received his B.S. in Business Administration from Bryant University.
John G. Cox
, 51, is our Executive Vice President, Pharmaceutical Operations and Technology and has served in this position since June 2010. Mr. Cox joined Biogen, Inc. in 2003 and has held several senior executive positions with us, including Senior Vice President of Technical Operations, Senior Vice President of Global Manufacturing, and Vice President of Manufacturing and General Manager of Biogen Idec’s operations in RTP. Prior to that, Mr. Cox held a number of senior operational roles at Diosynth Inc., a life sciences manufacturing and services company, where he worked in technology transfer, validation and purification. Prior to that, Mr. Cox focused on the same areas at Wyeth Corporation, a life sciences company, from 1993 to 2000. Mr. Cox serves on the board of directors of Repligen Corporation, a life sciences company. Mr. Cox received his B.S. in Biology from Arizona State University, M.B.A. from the University of Michigan and M.S. in Cell Biology from California State University.
Kenneth Di Pietro
, 55, is our Executive Vice President, Human Resources and has served in this position since January 2012. Mr. Di Pietro joined Biogen Idec from Lenovo Group, a technology company, where he served as Senior Vice President, Human Resources from 2005 to June 2011. From 2003 to 2005, he served as Corporate Vice President, Human Resources at Microsoft Corporation, a technology company. From 1999 to 2002, Mr. Di Pietro worked as Vice President, Human Resources at Dell Inc., a technology company. Prior to that, he spent 17 years at PepsiCo, a food and beverage company, serving in a range of human resource and general management positions. Mr. DiPietro serves on the board of directors of InVivo Therapeutics Corporation, a medical device company. Mr. Di Pietro received his B.S. in Industrial and Labor Relations from Cornell University.
Steven H. Holtzman
, 59, is our Executive Vice President, Corporate Development and has served in this position since January 2011. Prior to that, Mr. Holtzman was a founder of Infinity Pharmaceuticals, Inc., a drug discovery and development company, where he served as Chair of the Board of Directors from company inception in 2001 to November 2012, Executive Chair of the Board of Directors in 2010 and as Chief Executive Officer from 2001 to December 2009. From 1994 to 2001, Mr. Holtzman was Chief Business Officer at Millennium Pharmaceuticals Inc., a biopharmaceutical company. From 1986 to 1994, he was a founder, member of the Board of Directors and Executive Vice President of DNX Corporation, a biotechnology company. From 1996 to 2001, Mr. Holtzman served as presidential appointee to the national Bioethics Advisory Commission. Mr. Holtzman received his B.A. from Michigan State University and B.Phil. graduate degree from Oxford University which he attended as a Rhodes Scholar.
20
Tony Kingsley
, 50, is our Executive Vice President, Global Commercial Operations and has served in this position since November 2011. From January 2010 to November 2011, Mr. Kingsley served as our Senior Vice President, U.S. Commercial Operations. Prior to that, he served as Senior Vice President and General Manager of the Gynecological Surgical Products business at Hologic, Inc., a provider of diagnostic and surgical products, from October 2007 to November 2009, and as Division President, Diagnostic Products at Cytyc Corp., a provider of diagnostic and medical device products, from July 2006 to October 2007. In those roles, Mr. Kingsley ran commercial, manufacturing and research and development functions. From 1991 to 2006, he was a Partner at McKinsey & Company focusing on the biotechnology, pharmaceutical and medical device industries. Mr. Kingsley received his B.A. in Government from Dartmouth College and M.B.A. from Harvard Graduate School of Business Administration.
Alfred W. Sandrock, Jr., M.D., Ph.D.,
56
,
is our Group Senior Vice President, Chief Medical Officer and has served in this position since May 2013. From February 2012 to April 2013, Dr. Sandrock served as our Senior Vice President, Chief Medical Officer. Prior to that, Dr. Sandrock held several senior executive positions since joining us in 1998, including Senior Vice President of Development Sciences, Senior Vice President of Neurology Research and Development and Vice President of Clinical Development, Neurology. Dr. Sandrock received his B.A. in Human Biology from Stanford University, an M.D. from Harvard Medical School, and a Ph.D. in Neurobiology from Harvard University. He completed an internship in Medicine, a residency and chief residency in Neurology, and a Clinical Fellowship in Neuromuscular Disease and Clinical Neurophysiology (electromyography) at Massachusetts General Hospital.
Douglas E. Williams, Ph.D.
, 55, is our Executive Vice President, Research and Development and has served in this position since January 2011. Prior to that, Dr. Williams held several senior executive positions at ZymoGenetics Inc., a biopharmaceutical company, including Chief Executive Officer and a director from January 2009 to October 2010, President and Chief Scientific Officer from July 2007 to January 2009, and Executive Vice President, Research and Development and Chief Scientific Officer from 2004 to July 2007. Prior to that, he held leadership positions within the biotechnology industry, including Chief Scientific Officer and Executive Vice President of Research and Development at Seattle Genetics Inc., a biotechnology company, from 2003 to 2004, and Senior Vice President and Washington Site Leader at Amgen Inc., a biotechnology company, in 2002. Dr. Williams also served in a series of scientific and senior leadership positions over a decade at Immunex Corp., a biopharmaceutical company, including Executive Vice President and Chief Technology Officer, Senior Vice President of Discovery Research, Vice President of Research and Development and as a director. Prior to that, Dr. Williams served on the faculty of the Indiana University School of Medicine and the Department of Laboratory Medicine at the Roswell Park Memorial Institute in Buffalo, New York. Dr. Williams serves on the board of directors of Regulus Therapeutics Inc., a life sciences company. Dr. Williams received his B.S. in Biological Sciences from the University of Massachusetts, Lowell and Ph.D. in Physiology from the State University of New York at Buffalo, Roswell Park Memorial Institute Division.
21
|
Item 1A.
|
Risk Factors
|
We are substantially dependent on revenues from our four principal products.
Our current and future revenues depend upon continued sales of our four principal products, AVONEX, TYSABRI, TECFIDERA and RITUXAN. Although we have developed and continue to develop additional products for commercial introduction, we may be substantially dependent on sales from these products for many years. Any negative developments relating to any of these products, such as safety or efficacy issues, the introduction or greater acceptance of competing products, including biosimilars, generics or related prodrug derivatives, constraints on product pricing or price increases, changes in reimbursement policies of third parties or adverse regulatory or legislative developments, may reduce our revenues and adversely affect our results of operations. We and our competitors are introducing additional multiple sclerosis products in an increasingly crowded market and if those products have a similar or more attractive profile in terms of efficacy, convenience or safety, future sales of AVONEX, TYSABRI or TECFIDERA could be adversely affected. Sales of RITUXAN may be adversely affected by commercialized products such as GAZYVA, TREANDA and ARZERRA, and potentially other anti-CD20 and other molecules in development to treat the indications approved for RITUXAN.
If we fail to successfully execute on our commercialization efforts for TECFIDERA, our future revenue growth and results of operations may be adversely affected, and our stock price may decline.
We remain in the early stages of our commercial launch of TECFIDERA. If we are unable to successfully execute on our commercialization plans for TECFIDERA, our future revenue growth and results of operations may be adversely affected, and could cause a decline in our stock price. Factors that may prevent us from successfully commercializing TECFIDERA include:
|
•
|
intense competition in the increasingly crowded MS market, including the possibility of future competition from generic versions of TECFIDERA or related prodrug derivatives or from off-label use by physicians of therapies indicated for other conditions to treat MS patients;
|
|
•
|
our significant reliance on third parties to manufacture TECFIDERA, including the risks these third parties may not be able to supply TECFIDERA in a timely and cost-effective manner or in compliance with applicable regulations or otherwise fail to have sufficient aggregate manufacturing capacity to satisfy demand;
|
|
•
|
our sales and marketing efforts may not result in product revenues that meet the investment community's expectations for TECFIDERA;
|
|
•
|
additional risks associated with our anticipated launches of TECFIDERA in the E.U., including the impact of delays and the effects of a slower rollout of TECFIDERA across European countries over an extended number of months, the impact of competitive oral MS therapies approved in the E.U. prior to TECFIDERA, and our ability to obtain appropriate pricing and reimbursement for TECFIDERA in countries throughout the E.U.;
|
|
•
|
damage to our sales and reputation, and physician and patient confidence in TECFIDERA relating to any adverse experiences or events that may occur with patients treated with TECFIDERA, including any PML cases that may develop in patients previously treated with TYSABRI that switch to therapy with TECFIDERA; and
|
|
•
|
the other risks related to commercialization of new products described throughout these “Risk Factors”.
|
We remain in the early stages of our commercial launch of TECFIDERA and there is a limited amount of prescription, patient compliance and retention and other data available to date. These limited results may not be indicative of future performance or trends or the impact of TECFIDERA on our other products or the products of our competitors.
If we are unable to adequately protect and enforce our data, intellectual property and other proprietary rights, our competitors may take advantage of our development efforts or our acquired technology.
We have filed numerous patent applications in the U.S. and various other countries seeking protection of the processes, products and other inventions originating from our research and development. Patents have been issued on many of these applications. We have also obtained rights to various patents and patent applications under licenses with third parties, which provide for the payment of royalties by us. The ultimate degree of patent protection that will be afforded to drug and biotechnology products and processes, including ours, in the U.S. and in other important markets remains uncertain and is dependent upon the scope of protection decided upon by the patent offices, courts and lawmakers in these countries. Our patents may not afford us substantial protection or commercial benefit. Similarly, our pending patent applications or patent applications licensed from third parties may not ultimately be granted as patents and we may not prevail if patents that have been issued or licensed to us are challenged in court. In addition, court decisions or patent office regulations that place additional restrictions on patent claim scope or that facilitate patent challenges could also reduce our ability to protect our
22
intellectual property rights. If we cannot prevent others from exploiting our inventions, we will not derive the benefit from them that we currently expect.
Our products may qualify for regulatory exclusivity, which may consist of regulatory data protection and market protection. Although the World Trade Organization's agreement on trade-related aspects of intellectual property rights (TRIPS) requires signatory countries to provide regulatory exclusivity to innovative pharmaceutical products, implementation and enforcement varies widely from country to country. Failure to qualify for regulatory data or market protection, or failure to obtain or maintain the extent or duration of such protections that we expect in each of the markets for our products, could affect our revenue for our products or our decision on whether to market our products in a particular country or countries or could otherwise have an adverse impact on our results of operations.
Our drugs and biologics are susceptible to competition from generics and biosimilars in many markets. The legal and regulatory pathways leading to approval of generics and biosimilars vary widely from country to country and in some cases are not well defined. Manufacturers of generics and biosimilars may choose to launch or attempt to launch their products before the expiration of patent or regulatory data or market protection and to concurrently challenge the patent and regulatory protections covering our products. In the U.S., a high proportion of all approved innovative drugs are met with generic challenge as early as four years following approval. In the E.U., drugs that do not have regulatory exclusivity may face immediate generic competition. Generic versions of drugs and biosimilars are likely to be sold at substantially lower prices than branded products because the generic or biosimilar manufacturer would not have to recoup the research and development and marketing costs associated with the branded product. Accordingly, the introduction of generic or biosimilar versions of our marketed products likely would significantly reduce both the price that we receive for such marketed products and the volume of products that we sell, which may have an adverse impact on our results of operations.
We also rely upon unpatented proprietary and confidential information and technology in the research, development and manufacture of our products. We cannot ensure that others will not independently develop substantially equivalent information and technology or otherwise gain access to our trade secrets or disclose such technology, or that we can meaningfully protect such rights. We protect such information principally through confidentiality agreements with our employees, consultants, outside scientific collaborators, scientists whose research we sponsor and other advisers. These agreements may not provide meaningful protection or adequate remedies for our unpatented confidential information in the event of use or disclosure of such information.
Sales of TYSABRI are uncertain due to restrictions on use and safety warnings.
Sales of TYSABRI are uncertain given the significant restrictions on use and the significant safety warnings in the label, including the risk of developing progressive multifocal leukoencephalopathy (PML), a serious brain infection. The risk of developing PML increases with prior immunosuppressant use, which may cause patients who have previously received immunosuppressants or their physicians to refrain from using or prescribing TYSABRI. The risk of developing PML also increases with longer treatment duration, which may cause prescribing physicians or patients to suspend treatment with TYSABRI. The risk of developing PML also increases with exposure to JC virus, which may be indicated by the presence of anti-JCV antibodies. Patients testing positive for anti-JCV antibodies or their physicians may refrain from using or prescribing TYSABRI. Increased incidences of PML could limit sales growth, prompt regulatory review, require significant changes to the label or result in market withdrawal. Additional regulatory restrictions on the use of TYSABRI or safety-related label changes, including enhanced risk management programs, whether as a result of additional cases of PML, changes to the criteria for confirming PML diagnosis or otherwise, may significantly reduce expected revenues and require significant expense and management time to address the associated legal and regulatory issues. Increased competition, including competition from our own products, could also negatively impact future sales.
As we continue to research and develop protocols and therapies intended to reduce risk and improve outcomes of PML in patients, regulatory authorities may not agree with our perspective on such protocols and therapies. Our efforts at stratifying patients into groups with lower or higher risk for developing PML may not result in corresponding changes to the TYSABRI label. Furthermore, our risk stratification efforts may have an adverse impact on prescribing behavior and reduce sales of TYSABRI. The potential utility of the JC virus antibody assay as a risk stratification tool may be diminished as a result of both the assay's false negative rate as well as the possibility that a patient who initially tests negative for the JC virus antibody may acquire the JC virus after testing. An increase in the recommended frequency of retesting with the assay or in the assay's sensitivity may exacerbate these risks or otherwise adversely impact prescribing behavior. In addition, new data may challenge the assumptions or estimates underlying our risk stratification tools, including estimates of the prevalence of JC virus in the general population.
23
We may be unable to successfully commercialize new product candidates.
We have filed or are preparing to file applications for marketing approval for multiple product candidates for the treatment of MS and the treatment of hemophilia. These late-stage product candidates will impact our prospects for additional revenue growth and will require significant pre-launch investments that may not be recovered if they do not receive marketing approval.
Our ability to successfully commercialize a product candidate that receives marketing approval depends on a number of factors, including:
|
•
|
the medical community's acceptance of the product and the confidence of patients in the product;
|
|
•
|
the effectiveness of our sales force and marketing efforts;
|
|
•
|
the size of the patient population and our ability to identify new patients;
|
|
•
|
pricing and the extent of reimbursement from third party payors;
|
|
•
|
the ability to obtain and maintain data or market exclusivity for our products in the relevant indication(s);
|
|
•
|
our ability to offer products that have convenient dosing and delivery methods;
|
|
•
|
the availability or introduction of competing treatments that are deemed more effective, safer, more convenient, or less expensive;
|
|
•
|
manufacturing the product in a timely and cost-effective manner; and
|
|
•
|
compliance with complex regulatory requirements.
|
Our ability to successfully commercialize ELOCTATE and ALPROLIX, our long-lasting blood clotting factor candidates, may also be impacted by additional factors such as:
|
•
|
the hemophilia treatment market is highly competitive, with current treatments marketed by companies that have substantially greater financial resources and marketing expertise, and we may have difficulty penetrating this highly competitive market unless our long-lasting blood clotting factor candidates are regarded as offering substantial benefits over current treatments;
|
|
•
|
we do not have marketing experience within the hemophilia treatment market or well-established relationships with the associated medical and scientific community;
|
|
•
|
filing of our planned marketing authorization applications with the EMA requires the submission of positive pediatric data from our ongoing global pediatric studies with our applications, and there can be no assurance that we will receive such positive data; and
|
|
•
|
several companies are working to develop additional treatments for hemophilia and may obtain marketing approval of their treatments before we do, which has the potential to bar our application with the EMA under operation of the EMA’s Orphan Medicines Regulation; and
|
|
•
|
other companies may introduce longer-lasting or more efficacious, safer, cheaper or more convenient treatments than our long-lasting blood clotting factor candidates.
|
We depend, to a significant extent, on reimbursement from third party payors and a reduction in the extent of reimbursement could reduce our product sales and revenue.
Sales of our products are dependent, in large part, on the availability and extent of reimbursement from government health administration authorities, private health insurers and other organizations. Changes in government regulations or private third-party payors' reimbursement policies, as well as pressure by employers on private health insurance plans to reduce costs, may reduce reimbursement for our products and adversely affect our future results. In addition, when a new medical product is approved, the availability of government and private reimbursement for that product is uncertain, as is the amount for which that product will be reimbursed. We cannot predict the availability or amount of reimbursement for our product candidates.
24
In the U.S., federal and state legislatures, health agencies and third-party payors continue to focus on containing the cost of health care. Legislative and regulatory proposals and enactments to reform health care insurance programs could significantly influence the manner in which our products are prescribed and purchased. For example, provisions of the 2010 Patient Protection and Affordable Care Act (PPACA) have resulted in changes in the way health care is paid for by both governmental and private insurers, which has had and is expected to continue to have a significant impact on our business. These changes include, among other things, increased Medicare rebates owed by manufacturers under the Medicaid Drug Rebate Program, annual fees and taxes on manufacturers of certain branded prescription drugs, the requirement that manufacturers participate in a discount program for certain outpatient drugs under Medicare Part D and the expansion of the number of hospitals eligible for discounts. The U.S. federal government has also implemented spending cuts under the Budget Control Act of 2011, known as “sequestration”, which included a 2% reduction in Medicare reimbursements rates to providers such as physicians, hospitals and drug plans. These cuts, which reduce payments to health care providers for Medicare Part B drugs, could affect decisions regarding prescribing patterns or site of care, which could adversely impact sales of our products such as TYSABRI and RITUXAN, which are administered by infusion. In addition, Medicare Part D plans managing outpatient prescription drugs that are receiving less reimbursement from the government could seek further discounts from manufacturers, which could adversely affect our sales of our Part D drugs, such as AVONEX and TECFIDERA. It is possible that additional federal health care reform measures will be adopted in the future, including as a result of ongoing discussions to reduce the U.S. federal budget deficit to address government finances, any of which could result in increased pricing pressure and reduced reimbursement for our products and otherwise have an adverse impact on our financial position or results of operations.
There is also significant economic pressure on state budgets that may result in states increasingly seeking to achieve budget savings through mechanisms that limit coverage or payment for our drugs. In recent years, some states have considered legislation that would control the prices of drugs, including laws to allow importation of pharmaceutical products from lower cost jurisdictions outside the U.S. State Medicaid programs are increasingly requesting manufacturers to pay supplemental rebates and requiring prior authorization by the state program for use of any drug for which supplemental rebates are not being paid. Managed care organizations continue to seek price discounts and, in some cases, to impose restrictions on the coverage of particular drugs. Government efforts to reduce Medicaid expenses may lead to increased use of managed care organizations by Medicaid programs. This may result in managed care organizations influencing prescription decisions for a larger segment of the population and a corresponding constraint on prices and reimbursement for our products. In addition, under the PPACA, as states implement their health care marketplaces or operate under the federal exchange, the impact on drug manufacturers, including us, will depend in part on the formulary and benefit design decisions made by insurance sponsors or plans participating in these programs. It is possible that we may need to provide discounts or rebates to such plans in order to maintain favorable formulary access for our products for this patient population, which could have an adverse impact on our sales and results of operations.
In the European Union and some other international markets, the government provides health care at low cost to consumers and regulates pharmaceutical prices, patient eligibility or reimbursement levels to control costs for the government-sponsored health care system. Many countries have announced or implemented measures to reduce health care costs to constrain their overall level of government expenditures. These measures vary by country and may include, among other things, patient access restrictions, suspensions on price increases, prospective and possibly retroactive price reductions and other recoupments and increased mandatory discounts or rebates, recoveries of past price increases, and greater importation of drugs from lower-cost countries to higher-cost countries. These measures have negatively impacted our revenues, and may continue to adversely affect our revenues and results of operations in the future. In addition, certain countries set prices by reference to the prices in other countries where our products are marketed. Thus, our inability to secure adequate prices in a particular country may not only limit the marketing of our products within that country, but may also adversely affect our ability to obtain acceptable prices in other markets. This may create the opportunity for third party cross border trade or influence our decision to sell or not to sell a product, thus adversely affecting our geographic expansion plans and revenues.
Adverse safety events can negatively affect our business and stock price.
Adverse safety events involving our marketed products may have a negative impact on our commercialization efforts. Discovery of safety issues with our products could cause product liability events, additional regulatory scrutiny and requirements for additional labeling, withdrawal of products from the market and the imposition of fines or criminal penalties. Any of these actions could result in material write-offs of inventory, material impairments of intangible assets, goodwill and fixed assets, material restructuring charges and other adverse impacts on our results of operations. Regulatory authorities have been moving towards more active and transparent pharmacovigilance and are making greater amounts of stand-alone safety information directly available to the public through periodic safety update reports, patient registries and other reporting requirements. The reporting of adverse safety events involving our products or products similar to ours and public rumors about such events could cause our product sales or stock price to decline or experience periods of volatility.
25
Our long-term success depends upon the successful development of product candidates.
Our long-term viability and growth will depend upon the successful development of new products from our research and development activities, including products licensed from third parties. Product development is very expensive and involves a high degree of risk. Only a small number of research and development programs result in the commercialization of a product. Success in preclinical work or early stage clinical trials does not ensure that later stage or larger scale clinical trials will be successful.
Conducting clinical trials is a complex, time-consuming and expensive process. Our ability to complete our clinical trials in a timely fashion depends in large part on a number of key factors including protocol design, regulatory and institutional review board approval, patient enrollment rates, and compliance with extensive current Good Clinical Practices. We have opened clinical sites and are enrolling patients in a number of countries where our experience is more limited, and we are in most cases using the services of third party clinical trial providers which may impact our ability to control the timing, conduct, expense and quality of our clinical trials. If we fail to adequately manage the design, execution and regulatory aspects of our large, complex and diverse clinical trials, our studies and any potential regulatory approvals may be delayed, or we may fail to gain approvals for our product candidates. Clinical trials may indicate that our product candidates lack efficacy, have harmful side effects or raise safety or other concerns that may significantly reduce the likelihood of regulatory approval, result in significant restrictions on use and safety warnings in the approved label, adversely affect placement within the treatment paradigm, or otherwise significantly diminish the commercial potential of the product candidate. Also, positive results in a registrational trial may not be replicated in any subsequent confirmatory trials. Even if later stage clinical trials are successful, regulatory authorities may disagree with our view of the data or require additional studies, may disagree with the endpoints employed in the trials, may fail to approve the facilities or the processes used to manufacture a product candidate, and may fail to approve or delay approval of our product candidates, dosing or delivery methods, or may otherwise grant marketing approval that is more restricted than anticipated, including indications covering narrow patient populations and the imposition of safety monitoring or educational requirements or risk evaluation and mitigation strategies. The occurrence of any such events could result in the incurrence of significant costs and expenses and could otherwise have an adverse effect on our business, including our financial condition and results of operations.
Even if we are able to successfully develop new products, we may make a strategic decision to discontinue development of a product candidate if, for example, we believe commercialization will be difficult relative to other opportunities in our pipeline. Similarly, if we successfully develop a new product, but another company is the first to file for marketing approval of a competing orphan drug candidate, that company may ultimately receive marketing exclusivity for its drug candidate, preventing us from commercializing our orphan drug candidate in the applicable market for several years.
If we fail to compete effectively, our business and market position would suffer.
The biotechnology and pharmaceutical industry is intensely competitive. We compete in the marketing and sale of our products, the development of new products and processes, the acquisition of rights to new products with commercial potential and the hiring and retention of personnel. We compete with biotechnology and pharmaceutical companies that have a greater number of products on the market and in the product pipeline, greater financial and other resources and other technological or competitive advantages.
One or more of our competitors may benefit from significantly greater sales and marketing capabilities, may develop products that are accepted more widely than ours and may receive patent protection that dominates, blocks or adversely affects our product development or business. We also expect increased competition in the MS market through the introduction of generic versions of COPAXONE following the expected expiration of Teva Pharmaceutical’s patent protection for COPAXONE.
In addition, health care reform legislation enacted in the U.S. in 2010 has created a pathway for the FDA to approve biosimilars or follow-on products, which could compete on price and differentiation with a number of our existing products, including AVONEX, TYSABRI and RITUXAN, or products we may market in the future. Biosimilars legislation has also been in place in the E.U. since 2003. In December 2012, guidelines issued by the EMA for approving biosimilars of marketed monoclonal antibody products became effective. If a biosimilar version of one of our products were approved, it could reduce our sales of that product. The introduction by our competitors of more efficacious, safer, cheaper, or more convenient alternatives to our products could also reduce our revenues and the value of our product development efforts.
26
Adverse market and economic conditions may exacerbate certain risks affecting our business.
Sales of our products are dependent on reimbursement from government health administration authorities, private health insurers, distribution partners and other organizations. These organizations may reduce the extent of reimbursements, increase their scrutiny of claims, delay payment or be unable to satisfy their reimbursement obligations due to deteriorating global economic conditions, uncertainty about the direction and relative strength of the U.S. economy and resolution of the U.S. budget deficit, the continuing European financial crisis, volatility in the credit and financial markets, and other disruptions due to natural disasters, political instability or otherwise.
The European market represents a major part of our business and most of our marketing efforts outside the U.S. are focused on Europe. Thus, the continued uncertainty of the credit and economic conditions in Italy, Spain and Portugal, among other members of the European Union, subjects us to credit risk from accounts receivable related to our product sales in these countries, which may have a significant adverse impact on our results of operations. Our accounts receivable in certain European countries, such as Spain, Italy and Portugal, are subject to significant payment delays due to government funding and reimbursement practices. Continued adverse market and economic conditions in the European market could result in further reimbursement delays, reduce our product sales and revenues, result in additional allowances or significant bad debts, or cause us to recognize revenue in certain countries on a cash basis.
We depend on collaborators and other third-parties for both product and royalty revenue, the clinical development of future products and commercialization, marketing and manufacturing of certain products, which are outside of our full control.
We have a number of collaborators and partners, and have both in-licensed and out-licensed several products and programs. In addition to the factors described throughout these
“Risk Factors,”
these collaborations are subject to several other risks, including:
|
•
|
Our RITUXAN revenues, as well as any future revenues related to GAZYVA, are dependent on the efforts of Genentech and the Roche Group. Their interests may not always be aligned with our interests and they may not market RITUXAN or GAZYVA in the same manner or to the same extent that we would, which could adversely affect our RITUXAN or GAZYVA revenues.
|
|
•
|
Under our collaboration agreement with Genentech, the successful development and commercialization of GAZYVA and certain other anti-CD20 products will decrease our percentage of the collaboration's co-promotion profits.
|
|
•
|
Any failure on the part of our collaborators to comply with applicable laws and regulatory requirements in the sale, marketing and maintenance of the market authorization of our products or to fulfill any responsibilities they may have to protect and enforce any intellectual property rights underlying our products could have an adverse effect on our revenues as well as involve us in possible legal proceedings.
|
|
•
|
Collaborations often require the parties to cooperate, and failure to do so effectively could have an adverse impact on product sales by our collaborators, and could adversely affect the clinical development or regulatory approvals of products under joint control.
|
In addition, we rely on third parties for several other aspects of our business. As a sponsor of clinical trials of our products, we rely on third party contract research organizations to carry out most of our clinical trial related activities and accurately report their results. These activities include initiating and monitoring the conduct of studies at clinical trial sites, identifying any noncompliance with the study protocol or current Good Clinical Practices and interfacing with regulators throughout the process. The failure of a contract research organization to conduct these activities with proper vigilance and competence and in accordance with current Good Clinical Practices can result in regulatory authorities rejecting our clinical trial data or, in some circumstances, the imposition of civil or criminal sanctions against us.
Manufacturing issues could substantially increase our costs and limit supply of our products.
The process of manufacturing our products is complex, highly regulated and subject to several risks:
|
•
|
The process of manufacturing biologics is extremely susceptible to product loss due to contamination, oxidation, equipment failure or improper installation or operation of equipment, or vendor or operator error. Even minor deviations from normal manufacturing processes could result in reduced production yields, product defects and other supply disruptions. If microbial, viral or other contaminations are discovered in our products or manufacturing facilities, we may need to close our manufacturing facilities for an extended period of time to investigate and remediate the contaminant.
|
27
|
•
|
We rely on third party suppliers and manufacturers for, among other things, manufacturing of RITUXAN and GAZYVA, the majority of our clinical and commercial requirements for TECFIDERA and other small molecule products and product candidates, raw materials and supplies for production of products we manufacture, our fill-finish operations, the majority of our final product storage, and a substantial portion of our packaging operations. In addition, due to the unique manner in which our products are manufactured, we rely on single source providers of several raw materials and manufacturing supplies. These third parties are independent entities subject to their own unique operational and financial risks that are outside of our control. These third parties may not perform their obligations in a timely and cost-effective manner or in compliance with applicable regulations, and they may be unable or unwilling to increase production capacity commensurate with demand for our existing or future products. Finding alternative providers could take a significant amount of time and involve significant expense due to the specialized nature of the services and the need to obtain regulatory approval of any significant changes to our suppliers or manufacturing methods. We cannot be certain that we could reach agreement with alternative providers or that the FDA or other regulatory authorities would approve our use of such alternatives.
|
|
•
|
We rely on our manufacturing facilities in Research Triangle Park, North Carolina (RTP) and Hillerød, Denmark for the production of TYSABRI and our manufacturing facilities in RTP and Cambridge, Massachusetts for the production of AVONEX. Our global bulk supply of TYSABRI and AVONEX depends on the uninterrupted and efficient operation of these facilities, which could be adversely affected by equipment failures, labor shortages, natural disasters, power failures and numerous other factors. If we are unable to meet demand for TYSABRI or AVONEX for any reason, we would need to rely on a limited number of qualified third party contract manufacturers.
|
|
•
|
We and our third party providers are generally required to maintain compliance with current Good Manufacturing Practices and other stringent requirements and are subject to inspections by the FDA and comparable agencies in other jurisdictions to confirm such compliance. Any delay, interruption or other issues that arise in the manufacture, fill-finish, packaging, or storage of our products as a result of a failure of our facilities or the facilities or operations of third parties to pass any regulatory agency inspection could significantly impair our ability to develop and commercialize our products. Significant noncompliance could also result in the imposition of monetary penalties or other civil or criminal sanctions and damage our reputation.
|
Any adverse developments affecting our manufacturing operations or the operations of our third-party suppliers and manufacturers may result in shipment delays, inventory shortages, lot failures, product withdrawals or recalls, or other interruptions in the commercial supply of our products. We may also have to take inventory write-offs and incur other charges and expenses for products that fail to meet specifications, undertake costly remediation efforts or seek more costly manufacturing alternatives. Such developments could increase our manufacturing costs, cause us to lose revenue or market share as patients and physicians turn to competing therapeutics, diminish our profitability or damage our reputation.
Uncertainty over intellectual property in the biotechnology industry has been the source of litigation and other disputes, which is inherently costly and unpredictable.
We are aware that others, including various universities and companies working in the biotechnology field, have filed patent applications and have been granted patents in the U.S. and in other countries claiming subject matter potentially useful to our business. Some of those patents and patent applications claim only specific products or methods of making such products, while others claim more general processes or techniques useful or now used in the biotechnology industry. There is considerable uncertainty within our industry about the validity, scope and enforceability of many issued patents in the U.S. and elsewhere in the world, and, to date, the law and practice remains in substantial flux both in the agencies that grant patents and in the courts. We cannot currently determine the ultimate scope and validity of patents which may be granted to third parties in the future or which patents might be asserted to be infringed by the manufacture, use and sale of our products, services or technologies.
28
There has been, and we expect that there may continue to be, significant litigation in the industry regarding patents and other intellectual property rights. Litigation, arbitrations, administrative proceedings and other legal actions with private parties and governmental authorities concerning patents and other intellectual property rights may be protracted, expensive and distracting to management. Competitors may sue us as a way of delaying the introduction of our products. Any litigation, including any interference proceedings to determine priority of inventions, oppositions to patents in foreign countries or litigation against our partners, may be costly and time consuming and could harm our business. We expect that litigation may be necessary in some instances to determine the validity and scope of certain of our proprietary rights. Litigation may be necessary in other instances to determine the validity, scope or non-infringement of certain patent rights claimed by third parties to be pertinent to the manufacture, use or sale of our products. Ultimately, the outcome of such litigation could adversely affect the validity and scope of our patent or other proprietary rights, hinder our ability to manufacture and market our products, or result in the assessment of significant monetary damages against us that may exceed amounts, if any, accrued in our financial statements.
To the extent that valid present or future third party patent or other intellectual property rights cover our products, services or technologies, we or our strategic collaborators may seek licenses or other agreements from the holders of such rights in order to avoid or settle legal claims. Such licenses may not be available on acceptable terms, which may hinder our ability to manufacture and market our products and services. Payments under any licenses that we are able to obtain would reduce our profits derived from the covered products and services.
If we fail to comply with the extensive legal and regulatory requirements affecting the health care industry, we could face increased costs, penalties and a loss of business.
Our activities, and the activities of our collaborators, distributors and other third party providers, are subject to extensive government regulation and oversight both in the U.S. and in foreign jurisdictions. The FDA and comparable agencies in other jurisdictions directly regulate many of our most critical business activities, including the conduct of preclinical and clinical studies, product manufacturing, advertising and promotion, product distribution, adverse event reporting and product risk management. Our interactions in the U.S. or abroad with physicians and other health care providers that prescribe or purchase our products are also subject to government regulation designed to prevent fraud and abuse in the sale and use of the products and place greater restrictions on the marketing practices of health care companies. Health care companies are facing heightened scrutiny of their relationships with health care providers from anti-corruption enforcement officials. In addition, pharmaceutical and biotechnology companies have been the target of lawsuits and investigations alleging violations of government regulation, including claims asserting submission of incorrect pricing information, impermissible off-label promotion of pharmaceutical products, payments intended to influence the referral of health care business, submission of false claims for government reimbursement, antitrust violations, or violations related to environmental matters. These risks may be heightened as we continue to expand our global operations and introduce additional products to the market.
Regulations governing the health care industry are subject to change, with possibly retroactive effect, including:
|
•
|
new laws, regulations or judicial decisions, or new interpretations of existing laws, regulations or decisions, related to health care availability, pricing or marketing practices, compliance with wage and hour laws and other employment practices, method of delivery, payment for health care products and services, compliance with health information and data privacy and security laws and regulations, tracking and reporting payments and other transfers of value made to physicians and teaching hospitals, and extensive anti-bribery and anti-corruption prohibitions;
|
|
•
|
changes in the FDA and foreign regulatory approval processes that may delay or prevent the approval of new products and result in lost market opportunity; and
|
|
•
|
changes in FDA and foreign regulations that may require additional safety monitoring, labeling changes, restrictions on product distribution or use, or other measures after the introduction of our products to market, which could increase our costs of doing business, adversely affect the future permitted uses of approved products, or otherwise adversely affect the market for our products.
|
Examples of previously enacted and possible future changes in laws that could adversely affect our business include the enactment in the U.S. of health care reform, potential regulations easing the entry of competing biosimilars in the marketplace, new legislation or implementation of existing statutory provisions on importation of lower-cost competing drugs from other jurisdictions, enhanced penalties for and investigations into non-compliance with U.S. fraud and abuse laws, and compliance with the Physician Payment Sunshine Act in the U.S. and similar foreign rules and regulations that require collection and reporting of payments or other transfers of value made to physicians and teaching hospitals.
29
Violations of governmental regulation may be punishable by criminal and civil sanctions against us, including fines and civil monetary penalties and exclusion from participation in government programs, including Medicare and Medicaid, as well as against executives overseeing our business. In addition to penalties for violation of laws and regulations, we could be required to repay amounts we received from government payors, or pay additional rebates and interest if we are found to have miscalculated the pricing information we have submitted to the government. Whether or not we have complied with the law, an investigation into alleged unlawful conduct could increase our expenses, damage our reputation, divert management time and attention and adversely affect our business.
Our sales and operations are subject to the risks of doing business internationally.
We are increasing our presence in international markets, which subjects us to many risks that could adversely affect our business, such as:
|
•
|
the inability to obtain necessary foreign regulatory or pricing approvals of products in a timely manner;
|
|
•
|
collectability of accounts receivable;
|
|
•
|
fluctuations in currency exchange rates;
|
|
•
|
difficulties in staffing and managing international operations;
|
|
•
|
the imposition of governmental controls;
|
|
•
|
less favorable intellectual property or other applicable laws;
|
|
•
|
increasingly complex standards for complying with foreign laws and regulations that may differ substantially from country to country and may conflict with corresponding U.S. laws and regulations;
|
|
•
|
the emergence of far-reaching anti-bribery and anti-corruption legislation in the U.K., including passage of the U.K. Bribery Act 2010, and elsewhere and escalation of investigations and prosecutions pursuant to such laws;
|
|
•
|
compliance with complex import and export control laws;
|
|
•
|
restrictions on direct investments by foreign entities and trade restrictions;
|
|
•
|
greater political or economic instability; and
|
|
•
|
changes in tax laws and tariffs.
|
In addition, our international operations are subject to regulation under U.S. law. For example, the Foreign Corrupt Practices Act prohibits U.S. companies and their representatives from offering, promising, authorizing or making payments to foreign officials for the purpose of obtaining or retaining business abroad. In many countries, the health care professionals we regularly interact with may meet the definition of a foreign government official for purposes of the Foreign Corrupt Practices Act. Failure to comply with domestic or foreign laws could result in various adverse consequences, including possible delay in approval or refusal to approve a product, recalls, seizures or withdrawal of an approved product from the market, the imposition of civil or criminal sanctions and the prosecution of executives overseeing our international operations.
Our business may be adversely affected if we do not manage our current growth and do not successfully execute our growth initiatives.
We have experienced growth in our headcount and operations, which has placed, and will continue to place, significant demands on our management and our operational and financial infrastructure. We anticipate further growing through both internal development projects as well as external opportunities, which include the acquisition, partnering and in-licensing of products, technologies and companies or the entry into strategic alliances and collaborations. The availability of high quality development opportunities is limited and we are not certain that we will be able to identify candidates that we and our shareholders consider suitable or complete transactions on terms that are acceptable to us and our shareholders. In order to pursue such opportunities, we may require significant additional financing, which may not be available to us on favorable terms, if at all. Even if we are able to successfully identify and complete acquisitions and other strategic alliances and collaborations, we may not be able to integrate them or take full advantage of them and therefore may not realize the benefits that we expect.
30
To effectively manage our current and future potential growth, we will need to continue to enhance our operational, financial and management processes and to effectively expand, train and manage our employee base. Supporting our growth initiatives will require significant capital expenditures and management resources, including investments in research and development, sales and marketing, manufacturing and other areas of our business. If we do not successfully manage our current growth and do not successfully execute our growth initiatives, then our business and financial results may be adversely affected and we may incur asset impairment or restructuring charges.
Our investments in properties, including our manufacturing facilities, may not be fully realizable.
We own or lease real estate primarily consisting of buildings that contain research laboratories, office space, and biologic manufacturing operations. For strategic or other operational reasons, we may decide to further consolidate or co-locate certain aspects of our business operations or dispose of one or more of our properties, some of which may be located in markets that are experiencing high vacancy rates and decreasing property values. If we determine that the fair value of any of our owned properties is lower than their book value we may not realize the full investment in these properties and incur significant impairment charges. If we decide to fully or partially vacate a leased property, such as we did in connection with our recent relocation of our corporate headquarters from Weston, Massachusetts to Cambridge, Massachusetts, we may incur significant cost, including lease termination fees, rent expense in excess of sublease income and impairment of leasehold improvements. In addition, we may not fully utilize our manufacturing facilities, resulting in idle time at facilities or substantial excess manufacturing capacity, due to reduced expectations of product demand, improved yields on production and other factors. Any of these events may have an adverse impact on our results of operations.
Our effective tax rate may fluctuate and we may incur obligations in tax jurisdictions in excess of accrued amounts.
As a global biotechnology company, we are subject to taxation in numerous countries, states and other jurisdictions. As a result, our effective tax rate is derived from a combination of applicable tax rates in the various places that we operate. In preparing our financial statements, we estimate the amount of tax that will become payable in each of such places. Our effective tax rate, however, may be different than experienced in the past due to numerous factors, including changes in the mix of our profitability from country to country, the results of examinations and audits of our tax filings, adjustments to the value of our uncertain tax positions, including those relating to our manufacturing deduction, changes in accounting for income taxes and changes in tax laws. Any of these factors could cause us to experience an effective tax rate significantly different from previous periods or our current expectations.
In addition, our inability to secure or sustain acceptable arrangements with tax authorities and previously enacted or future changes in the tax laws, among other things, may result in tax obligations in excess of amounts accrued in our financial statements.
In the U.S., there are several proposals under consideration to reform tax law, including proposals that may reduce or eliminate the deferral of U.S. income tax on our unrepatriated earnings, penalize certain transfer pricing structures, and reduce or eliminate certain foreign or domestic tax credits or deductions. Our future reported financial results may be adversely affected by tax law changes which restrict or eliminate certain foreign tax credits or our ability to deduct expenses attributable to foreign earnings, or otherwise affect the treatment of our unrepatriated earnings.
The growth of our business depends on our ability to attract and retain qualified personnel and to develop and maintain key relationships.
The achievement of our commercial, research and development and external growth objectives depends upon our ability to attract and retain qualified scientific, manufacturing, sales and marketing and executive personnel and to develop and maintain relationships with qualified clinical researchers and key distributors. Competition for these people and relationships is intense and comes from a variety of sources, including pharmaceutical and biotechnology companies, universities and non-profit research organizations.
Pending and future product liability claims may adversely affect our business and our reputation.
The administration of drugs in humans, whether in clinical studies or commercially, carries the inherent risk of product liability claims whether or not the drugs are actually the cause of an injury. Our products or product candidates may cause, or may appear to have caused, injury or dangerous drug interactions, and we may not learn about or understand those effects until the product or product candidate has been administered to patients for a prolonged period of time.
31
We are subject from time to time to lawsuits based on product liability and related claims. We cannot predict with certainty the eventual outcome of any pending or future litigation. We may not be successful in defending ourselves in the litigation and, as a result, our business could be materially harmed. These lawsuits may result in large judgments or settlements against us, any of which could have a negative effect on our financial condition and business if in excess of our insurance coverage. Additionally, lawsuits can be expensive to defend, whether or not they have merit, and the defense of these actions may divert the attention of our management and other resources that would otherwise be engaged in managing our business.
Our operating results are subject to significant fluctuations.
Our quarterly revenues, expenses and net income (loss) have fluctuated in the past and are likely to fluctuate significantly in the future due to the risks described in these
“Risk Factors”
as well as the timing of charges and expenses that we may take. We have recorded, or may be required to record, charges that include:
|
•
|
the cost of restructurings;
|
|
•
|
impairments with respect to investments, fixed assets and long-lived assets, including in-process research and development and other intangible assets;
|
|
•
|
inventory write-downs for failed quality specifications, charges for excess or obsolete inventory and charges for inventory write downs relating to product suspensions, expirations or recalls;
|
|
•
|
bad debt expenses and increased bad debt reserves;
|
|
•
|
outcomes of litigation and other legal proceedings, regulatory matters and tax matters;
|
|
•
|
milestone payments under license and collaboration agreements; and
|
|
•
|
payments in connection with acquisitions and other business development activity.
|
Our revenues are also subject to foreign exchange rate fluctuations due to the global nature of our operations. We recognize foreign currency gains or losses arising from our operations in the period in which we incur those gains or losses. Although we have foreign currency forward contracts to hedge specific forecasted transactions denominated in foreign currencies, our efforts to reduce currency exchange losses may not be successful. As a result, currency fluctuations among our reporting currency, the U.S. dollar, and the currencies in which we do business will affect our operating results, often in unpredictable ways. Our net income may also fluctuate due to the impact of charges we may be required to take with respect to foreign currency hedge transactions. In particular, we may incur higher than expected charges from hedge ineffectiveness or from the termination of a hedge relationship.
In addition, our operating results during any one period do not necessarily suggest the anticipated results of future periods.
Our portfolio of marketable securities is subject to market, interest and credit risk that may reduce its value.
We maintain a portfolio of marketable securities for investment of our cash. Changes in the value of our portfolio of marketable securities could adversely affect our earnings. In particular, the value of our investments may decline due to increases in interest rates, downgrades of the bonds and other securities included in our portfolio, instability in the global financial markets that reduces the liquidity of securities included in our portfolio, declines in the value of collateral underlying the mortgage and asset-backed securities included in our portfolio, and other factors. Each of these events may cause us to record charges to reduce the carrying value of our investment portfolio or sell investments for less than our acquisition cost. Although we attempt to mitigate these risks by investing in high quality securities and continuously monitoring our portfolio's overall risk profile, the value of our investments may nevertheless decline.
Our business involves environmental risks, which include the cost of compliance and the risk of contamination or injury.
Our business and the business of several of our strategic partners involve the controlled use of hazardous materials, chemicals, biologics and radioactive compounds. Although we believe that our safety procedures for handling and disposing of such materials comply with state and federal standards, there will always be the risk of accidental contamination or injury. If we were to become liable for an accident, or if we were to suffer an extended facility shutdown, we could incur significant costs, damages and penalties that could harm our business. Biologics manufacturing also requires permits from government agencies for water supply and wastewater discharge. If we do not obtain appropriate permits, or permits for sufficient quantities of water and wastewater, we could incur significant costs and limits on our manufacturing volumes that could harm our business.
32
A breakdown or breach of our information technology systems could subject us to liability or interrupt the operation of our business.
Many of our key business processes are facilitated by information technology systems. Information technology systems are potentially vulnerable to breakdown, malicious intrusion and random attack. Likewise, individuals authorized to access our information technology systems may pose a risk by exposing private or confidential data to unauthorized persons or to the public. While we believe that we have taken appropriate security measures to minimize these risks to our data and information technology systems, there can be no assurance that our efforts will prevent breakdowns or breaches in our systems that could adversely affect our business.
Provisions in our Genentech collaboration agreement may discourage a third party from attempting to acquire us.
Provisions in our collaboration agreement with Genentech might discourage a takeover attempt that could be viewed as beneficial to shareholders who wish to receive a premium for their shares from a potential bidder. Our collaboration agreement with Genentech allows Genentech to purchase our rights to RITUXAN and certain anti-CD20 products developed under the agreement if we undergo a change of control and certain other conditions are met, which may limit our attractiveness to potential acquirers.
|
Item 1B.
|
Unresolved Staff Comments
|
None.
|
Item 2.
|
Properties
|
Below is a summary of our owned and leased properties as of
December 31, 2013
.
Massachusetts
In Cambridge, Massachusetts, we own approximately 508,000 square feet of real estate space, consisting of a building that houses a research laboratory, office space and a cogeneration plant totaling approximately 263,000 square feet and a building that contains research, development and quality laboratories which total approximately 245,000 square feet.
In addition, we lease a total of approximately 1,132,000 square feet in Massachusetts, which is summarized as follows:
|
•
|
729,000 square feet in Cambridge, Massachusetts, which is comprised of a 67,000 square foot biologics manufacturing facility and 662,000 square feet for our corporate headquarters, laboratory and additional office space;
|
|
•
|
357,000 square feet of office space in Weston, Massachusetts, of which 175,000 square feet has been subleased for a term which started in January 2014 and will continue through the remaining term of our lease agreement; and
|
|
•
|
46,000 square feet of warehouse space in Somerville, Massachusetts.
|
Our Massachusetts lease agreements expire at various dates through the year 2028.
North Carolina
We manufacture bulk AVONEX and TYSABRI and other products in our pipeline at our facilities located in RTP, North Carolina, where we own approximately 740,000 square feet of real estate space, which is summarized as follows:
|
•
|
357,000 square feet of laboratory and office space;
|
|
•
|
175,000 square feet related to a large-scale biologics manufacturing facility;
|
|
•
|
105,000 square feet related to a biologics manufacturing facility;
|
|
•
|
60,000 square feet of warehouse space; and
|
|
•
|
43,000 square feet related to a large-scale purification facility.
|
In addition, we lease 48,000 square feet of a facility in RTP, North Carolina from Eisai to manufacture our and Eisai's oral solid dose products.
33
Denmark
We have a large-scale biologics manufacturing facility totaling approximately 225,000 square feet located in Hillerød, Denmark. In July 2013, the facility was approved by the FDA and EMA for the manufacture of commercial TYSABRI.
We also own approximately 310,000 square feet of additional space which is currently in use at this location and is summarized as follows:
|
•
|
140,000 square feet of warehouse, utilities and support space;
|
|
•
|
70,000 square feet related to a label and packaging facility;
|
|
•
|
50,000 square feet of administrative space; and
|
|
•
|
50,000 square feet related to a laboratory facility.
|
Other International
We lease office space in Zug, Switzerland, our international headquarters, the United Kingdom, Germany, France, Denmark, and numerous other countries. Our international lease agreements expire at various dates through the year 2023.
|
Item 3.
|
Legal Proceedings
|
For a discussion of legal matters as of
December 31, 2013
, please read Note 21,
Litigation
to our consolidated financial statements included in this report, which is incorporated into this item by reference.
|
Item 4.
|
Mine Safety Disclosures
|
Not applicable.
34
|
Item 5.
|
Market for Registrant’s Common Equity, Related Stockholder Matters and Issuer Purchases of Equity Securities
|
Market and Stockholder Information
Our common stock trades on The NASDAQ Global Select Market under the symbol “BIIB.” The following table shows the high and low sales price for our common stock as reported by The NASDAQ Global Select Market for each quarter in the years ended
December 31, 2013
and
2012
:
|
|
Common Stock Price
|
||||||||||||||
|
|
2013
|
2012
|
|||||||||||||
|
|
High
|
Low
|
High
|
Low
|
|||||||||||
|
First Quarter
|
$
|
192.92
|
|
$
|
139.72
|
|
$
|
127.85
|
|
$
|
111.44
|
|
|||
|
Second Quarter
|
$
|
242.64
|
|
$
|
191.80
|
|
$
|
144.38
|
|
$
|
124.23
|
|
|||
|
Third Quarter
|
$
|
248.95
|
|
$
|
203.55
|
|
$
|
157.18
|
|
$
|
137.88
|
|
|||
|
Fourth Quarter
|
$
|
298.82
|
|
$
|
221.07
|
|
$
|
155.30
|
|
$
|
134.00
|
|
|||
As of
January 31, 2014
, there were approximately 867 stockholders of record of our common stock.
In addition, as of
January 31, 2014
, 47 stockholders of record of Biogen, Inc. common stock have yet to exchange their shares of Biogen, Inc. common stock for our common stock as contemplated by the merger of Biogen, Inc. and IDEC Pharmaceuticals Corporation in November 2003.
Dividends
We have not paid cash dividends since our inception. We do not anticipate paying any cash dividends in the near term.
Issuer Purchases of Equity Securities
The following table summarizes our common stock repurchase activity during the
fourth
quarter of
2013
:
|
Period
|
Total
Number of
Shares
Purchased
(#)
|
Average Price
Paid per
Share
($)
|
Total Number of
Shares Purchased
as Part of Publicly
Announced Programs
(#)
|
Maximum Number
of Shares That May
Yet Be Purchased
Under Our Programs
($ in millions)
|
|||||||
|
Oct-13
|
—
|
|
—
|
|
—
|
|
4,185,526
|
|
|||
|
Nov-13
|
—
|
|
—
|
|
—
|
|
4,185,526
|
|
|||
|
Dec-13
|
—
|
|
—
|
|
—
|
|
4,185,526
|
|
|||
|
Total
|
—
|
|
—
|
|
|||||||
On February 11, 2011, we announced that our Board of Directors authorized the repurchase of up to
20.0 million
shares of common stock. This authorization does not have an expiration date. As of
December 31, 2013
, approximately 15.8 million shares of our common stock at a cost of $1,883.0 million have been repurchased under this authorization. In
2013
, approximately
2.0 million
shares were repurchased at a cost of
$400.3 million
.
Approximately
4.2 million
shares of our common stock remain available for repurchase under the 2011 authorization.
35
Stock Performance Graph
The graph below compares the five-year cumulative total stockholder return on our common stock, the S&P 500 Index, the Nasdaq Pharmaceutical Index and the Nasdaq Biotechnology Index assuming the investment of $100.00 on December 31, 2008 with dividends being reinvested. The stock price performance in the graph below is not necessarily indicative of future price performance.
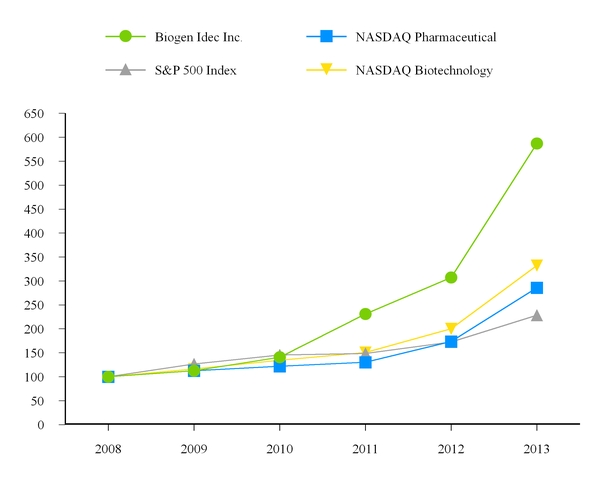
|
2008
|
2009
|
2010
|
2011
|
2012
|
2013
|
|||||||
|
Biogen Idec Inc.
|
100.00
|
|
112.32
|
|
140.77
|
|
231.05
|
|
307.31
|
|
586.96
|
|
|
NASDAQ Pharmaceutical
|
100.00
|
|
112.36
|
|
121.80
|
|
130.37
|
|
173.45
|
|
285.96
|
|
|
S&P 500 Index
|
100.00
|
|
126.46
|
|
145.51
|
|
148.59
|
|
172.37
|
|
228.19
|
|
|
NASDAQ Biotechnology
|
100.00
|
|
115.96
|
|
134.58
|
|
150.85
|
|
200.25
|
|
332.45
|
|
36
|
Item 6.
|
Selected Financial Data
|
BIOGEN IDEC INC. AND SUBSIDIARIES
SELECTED FINANCIAL DATA
|
|
For the Years Ended December 31,
|
||||||||||||||||||
|
|
2013
|
2012
|
2011
|
2010
|
2009
|
||||||||||||||
|
(In millions, except per share amounts)
|
(5) (7) (9) (10)
|
(7) (8)
|
(5) (6)
|
(3) (4)
|
(1) (2)
|
||||||||||||||
|
Results of Operations
|
|||||||||||||||||||
|
Product revenues
|
$
|
5,542.3
|
|
$
|
4,166.1
|
|
$
|
3,836.1
|
|
$
|
3,470.1
|
|
$
|
3,152.9
|
|
||||
|
Revenues from unconsolidated joint business
|
1,126.0
|
|
1,137.9
|
|
996.6
|
|
1,077.2
|
|
1,094.9
|
|
|||||||||
|
Other revenues
|
263.9
|
|
212.5
|
|
215.9
|
|
169.1
|
|
129.5
|
|
|||||||||
|
Total revenues
|
6,932.2
|
|
5,516.5
|
|
5,048.6
|
|
4,716.4
|
|
4,377.3
|
|
|||||||||
|
Cost and expenses:
|
|||||||||||||||||||
|
Cost of sales, excluding amortization of acquired intangible assets
|
857.7
|
|
545.5
|
|
466.8
|
|
400.3
|
|
382.1
|
|
|||||||||
|
Research and development
|
1,444.1
|
|
1,334.9
|
|
1,219.6
|
|
1,248.6
|
|
1,283.1
|
|
|||||||||
|
Selling, general and administrative
|
1,712.1
|
|
1,277.5
|
|
1,056.1
|
|
1,031.5
|
|
911.0
|
|
|||||||||
|
Amortization of acquired intangible assets
|
342.9
|
|
202.2
|
|
208.6
|
|
208.9
|
|
289.8
|
|
|||||||||
|
Collaboration profit sharing
|
85.4
|
|
317.9
|
|
317.8
|
|
258.1
|
|
215.9
|
|
|||||||||
|
(Gain) loss on fair value remeasurement of contingent consideration
|
(0.5
|
)
|
27.2
|
|
36.1
|
|
—
|
|
—
|
|
|||||||||
|
Restructuring charges
|
—
|
|
2.2
|
|
19.0
|
|
75.2
|
|
—
|
|
|||||||||
|
Acquired in-process research and development
|
—
|
|
—
|
|
—
|
|
245.0
|
|
—
|
|
|||||||||
|
Total cost and expenses
|
4,441.6
|
|
3,707.4
|
|
3,323.9
|
|
3,467.5
|
|
3,081.9
|
|
|||||||||
|
Gain on sale of rights
|
24.9
|
|
46.8
|
|
—
|
|
—
|
|
—
|
|
|||||||||
|
Income from operations
|
2,515.5
|
|
1,855.9
|
|
1,724.7
|
|
1,248.9
|
|
1,295.4
|
|
|||||||||
|
Other income (expense), net
|
(34.9
|
)
|
(0.7
|
)
|
(13.5
|
)
|
(19.0
|
)
|
37.3
|
|
|||||||||
|
Income before income tax expense and equity in loss of investee, net of tax
|
2,480.6
|
|
1,855.1
|
|
1,711.2
|
|
1,229.9
|
|
1,332.7
|
|
|||||||||
|
Income tax expense
|
601.0
|
|
470.6
|
|
444.5
|
|
331.3
|
|
355.6
|
|
|||||||||
|
Equity in loss of investee, net of tax
|
17.2
|
|
4.5
|
|
—
|
|
—
|
|
—
|
|
|||||||||
|
Net income
|
1,862.3
|
|
1,380.0
|
|
1,266.7
|
|
898.6
|
|
977.1
|
|
|||||||||
|
Net income (loss) attributable to noncontrolling interests, net of tax
|
—
|
|
—
|
|
32.3
|
|
(106.7
|
)
|
6.9
|
|
|||||||||
|
Net income attributable to Biogen Idec Inc.
|
$
|
1,862.3
|
|
$
|
1,380.0
|
|
$
|
1,234.4
|
|
$
|
1,005.2
|
|
$
|
970.1
|
|
||||
|
Diluted Earnings Per Share
|
|||||||||||||||||||
|
Diluted earnings per share attributable to Biogen Idec Inc.
|
$
|
7.81
|
|
$
|
5.76
|
|
$
|
5.04
|
|
$
|
3.94
|
|
$
|
3.35
|
|
||||
|
Weighted-average shares used in calculating diluted earnings per share attributable to Biogen Idec Inc.
|
238.3
|
|
239.7
|
|
245.0
|
|
254.9
|
|
289.5
|
|
|||||||||
|
Financial Condition
|
|||||||||||||||||||
|
Cash, cash equivalents and marketable securities
|
$
|
1,848.5
|
|
$
|
3,742.4
|
|
$
|
3,107.4
|
|
$
|
1,950.8
|
|
$
|
2,457.8
|
|
||||
|
Total assets
|
$
|
11,863.3
|
|
$
|
10,130.1
|
|
$
|
9,049.6
|
|
$
|
8,092.5
|
|
$
|
8,551.9
|
|
||||
|
Notes payable, line of credit and other financing arrangements, less current portion
|
$
|
592.4
|
|
$
|
687.4
|
|
$
|
1,060.8
|
|
$
|
1,066.4
|
|
$
|
1,080.2
|
|
||||
|
Total Biogen Idec Inc. shareholders’ equity
|
$
|
8,620.2
|
|
$
|
6,961.5
|
|
$
|
6,425.5
|
|
$
|
5,396.5
|
|
$
|
6,221.5
|
|
||||
37
In addition to the following notes, the financial data included within the tables above should be read in conjunction with our consolidated financial statements and related notes and the
“Management’s Discussion and Analysis of Financial Condition and Results of Operations”
sections of this report and our previously filed Form 10-Ks.
|
(1)
|
Total cost and expenses includes the $110.0 million upfront payment made to Acorda Therapeutics, Inc. pursuant to our June 30, 2009 collaboration and license agreement to develop and commercialize products containing fampridine in markets outside the U.S.
|
|
(2)
|
Changes in tax law in certain state jurisdictions in which we operate and the resolution of multiple federal, state and foreign tax audits, including the effective settlement of several uncertain tax positions resulted in a $58.3 million reduction to our income tax expense.
|
|
(3)
|
Included in total cost and expenses is a charge to acquired in-process research and development of
$40.0 million
related to the achievement of a milestone by Biogen Idec Hemophilia, Inc. (formerly Syntonix Pharmaceuticals, Inc.).
|
|
(4)
|
Included in total cost and expenses is a charge to acquired in-process research and development of $205.0 million incurred in connection with the license agreement entered into with Knopp Neurosciences Inc. (Knopp), which we consolidated as we determined that we were the primary beneficiary of the entity. The $205.0 million charge was partially offset by an attribution of $145.0 million to the noncontrolling interest.
|
|
(5)
|
Our share of revenues from unconsolidated joint business reflects charges of
$50.0 million
in 2011 and
$49.7 million
in 2013 for damages and interest awarded to Hoechst in Genentech's arbitration with Hoechst for RITUXAN.
|
|
(6)
|
Biogen Idec Inc.’s shareholders’ equity reflects a reduction in additional paid in capital and noncontrolling interests totaling $187.3 million resulting from our purchase of the noncontrolling interest in our joint venture investments in Biogen Dompé SRL and Biogen Dompé Switzerland GmbH.
|
|
(7)
|
Gain on sale of rights relates to the sale of all of our rights, including rights to royalties, related to BENLYSTA.
|
|
(8)
|
Equity in loss of investee, net of tax relates to our ownership interest in Samsung Bioepis to develop, manufacture and market biosimilar pharmaceuticals.
|
|
(9)
|
Commencing in the second quarter of 2013, product revenues and total revenues includes 100% of net revenues related to sales of TYSABRI as a result of our acquisition of TYSABRI rights from Elan and net revenues related to sales of TECFIDERA, our new oral first-line treatment for people with relapsing forms of multiple sclerosis (MS), which was approved by the FDA and commenced commercial sales. In addition, upon the closing of our acquisition of TYSABRI rights, our collaboration agreement was terminated, and we no longer record collaboration profit sharing.
|
|
(10)
|
Included in net income is a $38.5 million benefit, net of ancillary federal and state income and non-income tax effects, related to years 2005 through 2012 as a result of receiving updated technical guidance from the IRS concerning our current and prior year filings and calculation of our U.S. federal manufacturing deduction and overall tax classification of our unconsolidated joint business.
|
38
|
Item 7.
|
Management’s Discussion and Analysis of Financial Condition and Results of Operations
|
The following discussion should be read in conjunction with our consolidated financial statements and related notes beginning on page F-1 of this report. Certain totals may not sum due to rounding.
Executive Summary
Introduction
Biogen Idec is a global biotechnology company focused on discovering, developing, manufacturing and marketing therapies for the treatment of multiple sclerosis (MS) and other autoimmune disorders, neurodegenerative diseases and hemophilia. We also collaborate on the development and commercialization of RITUXAN for the treatment of non-Hodgkin's lymphoma, chronic lymphocytic leukemia and other conditions and share profits and losses for GAZYVA for the treatment of chronic lymphocytic leukemia.
In the near term, our revenues are dependent upon continued sales of our four principal products, AVONEX, TYSABRI, TECFIDERA and RITUXAN. In the longer term, our revenue growth will be dependent upon the successful clinical development, regulatory approval and launch of new commercial products, our ability to obtain and maintain patents and other rights related to our marketed products and assets originating from our research and development efforts, and successful execution of external business development opportunities. As part of our ongoing research and development efforts, we have devoted significant resources to conducting clinical studies to advance the development of new pharmaceutical products and to explore the utility of our existing products in treating disorders beyond those currently approved in their labels.
Financial Highlights
The following table is a summary of financial results achieved:
|
|
For the Years Ended
December 31,
|
% Change
|
||||||||
|
|
2013 compared to 2012
|
|||||||||
|
(In millions, except per share amounts and percentages)
|
2013
(1) (2)
|
2012
|
||||||||
|
Total revenues
|
$
|
6,932.2
|
|
$
|
5,516.5
|
|
25.7
|
%
|
||
|
Income from operations
|
$
|
2,515.5
|
|
$
|
1,855.8
|
|
35.5
|
%
|
||
|
Net income attributable to Biogen Idec Inc.
|
$
|
1,862.3
|
|
$
|
1,380.0
|
|
34.9
|
%
|
||
|
Diluted earnings per share attributable to Biogen Idec Inc.
|
$
|
7.81
|
|
$
|
5.76
|
|
35.8
|
%
|
||
|
(1)
|
Commencing in the second quarter of 2013, product revenues and total revenues includes 100% of net revenues related to sales of TYSABRI as a result of our acquisition of TYSABRI rights from Elan and net revenues related to sales of TECFIDERA, our new oral first-line treatment for people with relapsing forms of MS, which was approved by the FDA and commenced commercial sales.
|
|
(2)
|
Our share of revenues from unconsolidated joint business reflects a charge of
$49.7 million
for damages and interest awarded to Hoechst in Genentech's arbitration with Hoechst for RITUXAN.
|
As described below under
“Results of Operations
,” our operating results for the year ended
December 31, 2013
, reflect the following:
|
•
|
Worldwide AVONEX revenues totaled
$3,005.5 million
for
2013
, representing an increase of
3.2%
over
2012
.
|
|
•
|
Worldwide TYSABRI revenues totaled
$1,526.5 million
for
2013
, representing an increase of
34.4%
over
2012
. The increase in revenue is primarily due to 100% of net U.S. revenue being recognized starting in April 2013 as a result of our acquisition of TYSABRI rights.
|
|
•
|
Worldwide TECFIDERA revenues totaled
$876.1 million
for
2013
. Approximately $134.0 million of U.S. TECFIDERA revenues in 2013 represent inventory in the channel.
|
|
•
|
Our share of revenues from unconsolidated joint business totaled
$1,126.0 million
for
2013
, representing a decrease of
1.0%
from
2012
.
|
|
•
|
Total cost and expenses increased
19.8%
for
2013
compared to
2012
. This increase resulted from a
69.6%
increase in the amortization of acquired intangible assets, a
57.2%
increase in cost of sales, a
34.0%
increase in selling, general and administrative expense and an
8.2%
increase in research and development expense, partially offset by a
73.1%
decrease in collaboration profit sharing compared with the same period in
2012
.
|
39
The increases in cost of sales and the amortization of acquired intangibles are a result of both our 2013 acquisition of the TYSABRI rights and higher amortization recorded on our AVONEX intangible asset. Our increase in research and development expense was primarily attributable to the upfront payment we made to Isis Pharmaceuticals, Inc. (Isis) upon entering into a six year research collaboration and the upfront and milestone payments made to Samsung Bioepis upon entering into a development and commercialization agreement. Higher selling, general and administrative expense resulted from increased costs incurred in connection with our product launch of TECFIDERA in the U.S. and our development of commercial capabilities for potential product launches of ELOCTATE and ALPROLIX, respectively.
We generated
$2,345.1 million
of net cash flows from operations for
2013
, which were primarily driven by earnings. In addition, we used
$3.25 billion
of our cash, cash equivalents and marketable securities for our acquisition of TYSABRI rights from Elan. Cash, cash equivalents and marketable securities totaled approximately
$1,848.5 million
as of
December 31, 2013
.
Acquisitions
On April 2, 2013, we acquired full ownership of, and strategic, commercial and decision-making rights to TYSABRI from Elan. Upon the closing of the transaction, our collaboration agreement with Elan was terminated. For additional information related to this transaction, please read Note 2,
Acquisitions
to our consolidated financial statements included within this report.
Business Environment
We conduct our business within the biotechnology and pharmaceutical industries, which are highly competitive. Many of our competitors are working to develop or have commercialized products similar to those we market or are developing, including oral and other alternative formulations that may compete with AVONEX, TYSABRI, TECFIDERA or other products we are developing. In addition, the commercialization of certain of our own approved products and pipeline product candidates may negatively impact future sales of AVONEX, TYSABRI, TECFIDERA or all three. We may also face increased competitive pressures from the emergence of biosimilars, generic versions of TECFIDERA or related prodrug derivatives. In the U.S., AVONEX, TYSABRI, and RITUXAN are licensed under the Public Health Service Act (PHSA) as biological products. In March 2010, U.S. healthcare reform legislation amended the PHSA to authorize the FDA to approve biological products, known as biosimilars, that are similar to or interchangeable with previously approved biological products based upon potentially abbreviated data packages.
Global economic conditions continue to present challenges for our industry. Governments in many international markets where we operate have implemented austerity measures to constrain the overall level of government expenditures. These measures, which include efforts aimed at reforming health care coverage and reducing health care costs, particularly in certain countries in Europe, continue to exert pressure on product pricing, have delayed reimbursement for our products, and have negatively impacted our revenues and results of operations. It is possible that additional U.S. federal health care reform measures will be adopted in the future, including as a result of ongoing discussions to reduce the U.S. federal budget deficit to address government finances, any of which could result in increased pricing pressure and reduced reimbursement for our products and otherwise have an adverse impact on our financial position or results of operations. For additional information about certain risks that could negatively impact our financial position or future results of operations, please read the
“Risk Factors”
section of this report.
The Patient Protection and Affordable Care Act
The Patient Protection and Affordable Care Act (PPACA) included a significant expansion of the Medicaid program, as well as the creation of new state-based health benefit exchanges, or marketplaces, through which individuals and small businesses may purchase health insurance. Premium and cost-sharing credits and subsidies are available to those who qualify based on income. Marketplace plans began to enroll new members in October 2013, and coverage began on January 1, 2014. Although the effects of the legislation are still unclear, PPACA could result in a greater number of individuals with health insurance under Medicaid and the marketplace health plans. The impact on manufacturers, including us, will depend in part on the formulary and benefit design decisions made by insurance sponsors or plans participating in the programs. It is possible that individuals who were previously unable to access insurance may now become insured, thus increasing coverage for our products. This potential increase in coverage, however, may be offset by the added discounts that could be required in these channels as well as the number of patients who over time move from commercial insurance to the health insurance marketplaces. It is also possible that we may need to provide discounts or rebates to such plans in order to maintain favorable formulary access for our products for this patient population, which could have an adverse impact on our sales and results of operations.
40
Key Pipeline Developments
TECFIDERA
In March 2013, the FDA approved TECFIDERA, our first-line oral treatment for people with relapsing forms of MS. The FDA approval was based on TECFIDERA's comprehensive development program, in which TECFIDERA demonstrated significant reductions in MS disease activity coupled with favorable safety and tolerability in the Phase 3 DEFINE and CONFIRM studies. We commenced our commercial launch of TECFIDERA in the U.S. in April 2013.
In February 2014, the European Commission (EC) approved the use of TECFIDERA in the European Union (E.U.) as a first-line oral treatment for people with relapsing-remitting MS.
TECFIDERA was approved in Canada in April 2013 and Australia in July 2013.
We acquired TECFIDERA as part of our acquisition of Fumapharm AG in 2006. For more information about this acquisition and associated milestone obligations, please read the subsection entitled
“Contractual Obligations and Off-Balance Sheet Arrangements – Contingent Consideration related to Business Combinations”
of this
“Management’s Discussion and Analysis of Financial Condition and Results of Operations.”
ELOCTATE and ALPROLIX
In October 2012, we announced positive top-line results from the Phase 3 study, known as A-LONG, investigating ELOCTATE in hemophilia A, a rare inherited disorder which inhibits blood coagulation. Top-line results from the A-LONG study showed that ELOCTATE was effective in the control and prevention of bleeding episodes, routine prophylaxis and perioperative management. Based on the results from the A-LONG clinical trial, we submitted a Biologics License Application (BLA) to the FDA for marketing approval of ELOCTATE in the first quarter of 2013. In May 2013, the FDA accepted our application for ELOCTATE and granted us a standard review timeline. In October 2013, we announced that the FDA had requested additional information pertaining to the validation of certain steps in the manufacturing process for ELOCTATE. In December 2013, the FDA extended the initial Prescription Drug User Fee Act (PDUFA) date for the FDA’s review our application by three months, which is a standard extension period.
In September 2012, we announced positive top-line results from the Phase 3 study, known as B-LONG, investigating ALPROLIX in hemophilia B, a rare inherited disorder which inhibits blood coagulation. Top-line results from the B-LONG study showed that ALPROLIX was effective in the control and prevention of bleeding episodes, routine prophylaxis, and perioperative management.
Based on this data, we submitted a BLA to the FDA for marketing approval of ALPROLIX in the fourth quarter of 2012. In March 2013, the FDA accepted our application for ALPROLIX and granted us a standard review timeline. In November 2013, in response to a request from FDA, we submitted additional information to the FDA related to the validation of a manufacturing step for ALPROLIX. Due to the timing of this submission, the FDA extended the initial PDUFA date for its review of our application by three months, which is a standard extension period.
We have submitted additional regulatory applications for ELOCTATE and ALPROLIX in Australia, Canada and Japan.
Pediatric data will be required as part of the Marketing Authorisation Applications for ELOCTATE and ALPROLIX that we plan to submit to the EMA, and we have initiated global pediatric studies of ELOCTATE and ALPROLIX.
We collaborate with Swedish Orphan Biovitrum AB on the development and commercialization of ELOCTATE and ALPROLIX. For information about this collaboration, please read Note 20,
Collaborative and Other Relationships
to our consolidated financial statements included within this report.
PLEGRIDY (Peginterferon beta-1a)
During the second quarter of 2013, we submitted a BLA to the FDA and a Marketing Authorisation Application to the EMA, in each case for marketing approval of PLEGRIDY in relapsing forms of MS. The regulatory submission was based on the results from the first year of the two-year global Phase 3 ADVANCE study. The FDA accepted our application in July 2013, and granted us a standard review timeline. The EMA validated our application in June 2013.
GAZYVA
GAZYVA, in combination with chlorambucil, is indicated for the treatment of patients with previously untreated chronic lymphocytic leukemia. The FDA granted GAZYVA breakthrough therapy designation due to the significance of the positive progression-free survival results from the Phase 3 CLL11 clinical trial and the serious and life threatening nature of CLL. GAZYVA, formerly known as GA101, was approved by the FDA and commenced commercial sales in November 2013.
41
In the U.S., we share operating profits and losses relating to GAZYVA with Genentech. The Roche Group and its sub-licensees maintain sole responsibility for the development, manufacturing and commercialization of GAZYVA in the U.S. For information about our agreement with Genentech, please read Note 20,
Collaborative and Other Relationships
to our consolidated financial statements included in this report.
Results of Operations
Revenues
Revenues are summarized as follows:
|
|
For the Years Ended
December 31,
|
% Change
|
|||||||||||||||
|
|
2013 compared to 2012
|
2012 compared to 2011
|
|||||||||||||||
|
(In millions, except percentages)
|
2013
|
2012
|
2011
|
||||||||||||||
|
Product Revenues:
|
|||||||||||||||||
|
United States
|
$
|
3,581.0
|
|
$
|
2,176.8
|
|
$
|
1,954.8
|
|
64.5
|
%
|
11.4
|
%
|
||||
|
Rest of world
|
1,961.3
|
|
1,989.3
|
|
1,881.3
|
|
(1.4
|
)%
|
5.7
|
%
|
|||||||
|
Total product revenues
|
5,542.3
|
|
4,166.1
|
|
3,836.1
|
|
33.0
|
%
|
8.6
|
%
|
|||||||
|
Unconsolidated joint business revenues
|
1,126.0
|
|
1,137.9
|
|
996.6
|
|
(1.0
|
)%
|
14.2
|
%
|
|||||||
|
Other revenues
|
263.9
|
|
212.5
|
|
215.9
|
|
24.2
|
%
|
(1.6
|
)%
|
|||||||
|
Total revenues
|
$
|
6,932.2
|
|
$
|
5,516.5
|
|
$
|
5,048.6
|
|
25.7
|
%
|
9.3
|
%
|
||||
Product Revenues
Product revenues are summarized as follows:
|
|
For the Years Ended
December 31,
|
% Change
|
|||||||||||||||
|
|
2013 compared to 2012
|
2012 compared to 2011
|
|||||||||||||||
|
(In millions, except percentages)
|
2013
|
2012
|
2011
|
||||||||||||||
|
AVONEX
|
$
|
3,005.5
|
|
$
|
2,913.1
|
|
$
|
2,686.6
|
|
3.2
|
%
|
8.4
|
%
|
||||
|
TYSABRI
|
1,526.5
|
|
1,135.9
|
|
1,079.5
|
|
34.4
|
%
|
5.2
|
%
|
|||||||
|
TECFIDERA
|
876.1
|
|
—
|
|
—
|
|
**
|
|
**
|
|
|||||||
|
Other product revenues
|
134.2
|
|
117.1
|
|
70.0
|
|
14.6
|
%
|
67.3
|
%
|
|||||||
|
Total product revenues
|
$
|
5,542.3
|
|
$
|
4,166.1
|
|
$
|
3,836.1
|
|
33.0
|
%
|
8.6
|
%
|
||||
AVONEX
Revenues from AVONEX are summarized as follows:
|
|
For the Years Ended
December 31,
|
% Change
|
|||||||||||||||
|
|
2013 compared to 2012
|
2012 compared to 2011
|
|||||||||||||||
|
(In millions, except percentages)
|
2013
|
2012
|
2011
|
||||||||||||||
|
United States
|
$
|
1,902.4
|
|
$
|
1,793.7
|
|
$
|
1,628.3
|
|
6.1
|
%
|
10.2
|
%
|
||||
|
Rest of world
|
1,103.1
|
|
1,119.4
|
|
1,058.3
|
|
(1.5
|
)%
|
5.8
|
%
|
|||||||
|
Total AVONEX revenues
|
$
|
3,005.5
|
|
$
|
2,913.1
|
|
$
|
2,686.6
|
|
3.2
|
%
|
8.4
|
%
|
||||
For
2013
compared to
2012
, the increase in U.S. AVONEX revenues was primarily due to price increases partially offset by an 8% decrease in unit sales volume, which was attributable in part to patients transitioning to TECFIDERA. For
2012
compared to
2011
, the increase in U.S. AVONEX revenues was due to price increases partially offset by a 2% decrease in unit sales volume.
42
For
2013
compared to
2012
, the decrease in rest of world AVONEX revenues was primarily due to pricing reductions resulting from austerity measures enacted in some countries, partially offset by increased unit demand primarily in Europe. For
2012
compared to
2011
, the increase in rest of world AVONEX revenues was due to increased demand primarily in Europe driven by customer penetration attributable to the AVONEX PEN launch, partially offset by pricing reductions resulting from austerity measures enacted in some countries. Rest of world AVONEX unit volume primarily in Europe increased 2% and 8% for
2013
and
2012
, respectively, over the prior year comparative periods. Rest of world AVONEX revenue for
2013
compared to
2012
also reflects the positive impact of foreign currency exchange rates, partially offset by losses recognized in relation to the settlement of certain cash flow hedge instruments under our foreign currency hedging program. Rest of world AVONEX revenues for
2012
compared to
2011
also reflects the negative impact of foreign currency exchange rates, partially offset by gains recognized in relation to the settlement of certain cash flow hedge instruments under our foreign currency hedging program.
Losses recognized in relation to the settlement of certain cash flow hedge instruments under our foreign currency hedging program for AVONEX totaled $9.3 million in
2013
, compared to gains recognized of $25.4 million for
2012
and losses recognized of $30.6 million in
2011
.
We expect AVONEX to continue facing increased competition in the MS marketplace in both the U.S. and rest of world. We and a number of other companies have commercialized or are working to develop additional treatments for MS, including oral and other alternative formulations that may compete with AVONEX. The launch and growth of TECFIDERA and the commercialization of certain of our own potential products, such as PLEGRIDY, may also negatively impact future sales of AVONEX. Increased competition also may lead to reduced unit sales of AVONEX, as well as increasing price pressures particularly in geographic markets outside the U.S.
TYSABRI
Revenues from TYSABRI are summarized as follows:
|
|
For the Years Ended
December 31,
|
% Change
|
|||||||||||||||
|
|
2013 compared to 2012
|
2012 compared to 2011
|
|||||||||||||||
|
(In millions, except percentages)
|
2013
|
2012
|
2011
|
||||||||||||||
|
United States
|
$
|
814.2
|
|
$
|
383.1
|
|
$
|
326.5
|
|
112.5
|
%
|
17.3
|
%
|
||||
|
Rest of world
|
712.3
|
|
752.8
|
|
753.0
|
|
(5.4
|
)%
|
—
|
%
|
|||||||
|
Total TYSABRI revenues
|
$
|
1,526.5
|
|
$
|
1,135.9
|
|
$
|
1,079.5
|
|
34.4
|
%
|
5.2
|
%
|
||||
For
2013
compared to
2012
, the increase in U.S. TYSABRI revenues was primarily due to our recognition, starting in April 2013, of 100% of net revenues on TYSABRI in-market sales due to our acquisition of the remaining TYSABRI rights from Elan, price increases and a 1% increase in unit sales volume, which includes the impact of patients transitioning to TECFIDERA. For
2012
compared to
2011
, the increase in U.S. TYSABRI revenues was due to an 11% increase in unit sales volume and price increases
.
Based on data reported by Elan and our sales to third party customers, total U.S. TYSABRI in-market sales were $958.3 million, $886.0 million and $746.5 million for
2013
,
2012
, and
2011
, respectively. For
2013
compared to
2012
, the increase in in-market sales was due to price increases. For
2012
compared to
2011
, the increase in in-market sales was due to increased unit sales volume and price increases
.
For
2013
compared to
2012
, the decrease in rest of world TYSABRI revenues was primarily due to pricing reductions from austerity measures enacted in some countries, a decrease in unit demand primarily in Europe and the net impact of a EUR
15.4 million
($20.0 million) reduction in revenues recorded for a probable settlement of outstanding claims with the Italian National Medicines Agency (Agenzia Italiana del Farmaco or AIFA) relating to sales of TYSABRI in Italy in excess of a reimbursement limit for the periods between February 2009 and February 2011. For
2012
compared to
2011
, the change in rest of world TYSABRI revenues reflects the deferral of a portion of our revenues recognized on sales of TYSABRI in Italy and pricing reductions from austerity measures enacted in some countries offset by an increase in demand. The change in demand resulted in a decrease of approximately 1% in rest of world TYSABRI unit sales volume for
2013
compared with
2012
versus an increase of 14% in rest of world TYSABRI unit sales volume for
2012
compared with
2011
. Rest of world TYSABRI revenue for
2013
compared to
2012
also reflects the positive impact of foreign currency exchange rates, partially offset by losses recognized in relation to the settlement of certain cash flow hedge instruments under our foreign currency hedging program. Rest of world TYSABRI revenues for
2012
compared to
2011
also reflects the negative impact of foreign currency exchange rates, partially offset by gains recognized in relation to the settlement of certain cash flow hedge instruments under our foreign currency hedging program.
43
Losses recognized in relation to the settlement of certain cash flow hedge instruments under our foreign currency hedging program for TYSABRI totaled $3.8 million in
2013
, compared to gains recognized of $9.7 million for
2012
and losses recognized of $6.3 million in
2011
.
For information relating to our agreement in principle with AIFA relating to sales of TYSABRI in Italy, please read Note 4,
Accounts Receivable
to our consolidated financial statements included in this report. As described in Note 4, the settlement with AIFA is pending approval by Italian regulatory authorities. Upon approval of the settlement, any deferred revenue related to the periods subsequent to February 2011 that is in excess of the settlement will be recognized as revenue. Currently, we expect to record approximately $105.0 million of incremental revenue based on amounts deferred through
December 31, 2013
.
We expect TYSABRI to continue facing increased competition in the MS marketplace in both the U.S. and rest of world. We and a number of other companies have commercialized or are working to develop additional treatments for MS, including oral and other alternative formulations that may compete with TYSABRI. In addition, the launch and growth of TECFIDERA and the commercialization of certain of our own products may negatively impact future sales of TYSABRI. Increased competition may also lead to reduced unit sales of TYSABRI, as well as increasing price pressure. In addition, safety warnings included in the TYSABRI label, such as the risk of progressive multifocal leukoencephalopathy (PML), and any future safety-related label changes, may limit the growth of TYSABRI unit sales. We continue to research and develop protocols and therapies that may reduce risk and improve outcomes of PML in patients. Our efforts to stratify patients into lower or higher risk for developing PML, including through the JCV antibody assay, and other on-going or future clinical trials involving TYSABRI may have a negative impact on prescribing behavior, which may result in decreased product revenues from sales of TYSABRI.
TECFIDERA
Revenues from TECFIDERA are summarized as follows:
|
|
For the Years Ended
December 31,
|
% Change
|
|||||||||||||
|
|
2013 compared to 2012
|
2012 compared to 2011
|
|||||||||||||
|
(In millions, except percentages)
|
2013
|
2012
|
2011
|
||||||||||||
|
United States
|
$
|
864.4
|
|
$
|
—
|
|
$
|
—
|
|
**
|
**
|
||||
|
Rest of world
|
11.7
|
|
—
|
|
—
|
|
**
|
**
|
|||||||
|
Total TECFIDERA revenues
|
$
|
876.1
|
|
$
|
—
|
|
$
|
—
|
|
**
|
**
|
||||
During
2013
, we received marketing approval for TECFIDERA in the U.S., Canada and Australia. U.S. sales began in April 2013. Approximately $134.0 million of U.S. TECFIDERA revenues in 2013 represent inventory in the channel at
December 31, 2013
.
In the first three quarters subsequent to its commercial launch in the United States, approximately 70% of new patients taking TECFIDERA have switched from a different MS therapy, including our products AVONEX and TYSABRI. We believe that the previous therapies from which these patients switched to TECFIDERA is roughly proportionate to the current market share distribution of all products currently approved to treat relapsing remitting MS. As TECFIDERA has only been approved for nine months, we have limited product history and it is difficult to estimate trends of future product sales of TECFIDERA and the resulting impact on sales and market share of our other therapies and other competing MS therapies.
Other Product Revenues
Other product revenues are summarized as follows:
|
|
For the Years Ended
December 31,
|
% Change
|
|||||||||||||||
|
|
2013 compared to 2012
|
2012 compared to 2011
|
|||||||||||||||
|
(In millions, except percentages)
|
2013
|
2012
|
2011
|
||||||||||||||
|
FAMPYRA
|
$
|
74.0
|
|
$
|
57.4
|
|
$
|
13.6
|
|
28.9
|
%
|
322.1
|
%
|
||||
|
FUMADERM
|
60.2
|
|
59.7
|
|
54.7
|
|
0.8
|
%
|
9.1
|
%
|
|||||||
|
Other
|
—
|
|
—
|
|
1.7
|
|
**
|
|
(100.0
|
)%
|
|||||||
|
Total other product revenues
|
$
|
134.2
|
|
$
|
117.1
|
|
$
|
70.0
|
|
14.6
|
%
|
67.3
|
%
|
||||
We have a license from Acorda Therapeutics, Inc. (Acorda) to develop and commercialize FAMPYRA in all markets outside the U.S. For information about our relationship with Acorda, please read Note 20,
Collaborative and Other Relationships
to our consolidated financial statements included within this report.
44
For
2013
compared to
2012
, the increase in FAMPYRA revenue was due to the recognition of previously deferred revenue and increased demand in Germany and France. FAMPYRA revenue for
2013
includes the recognition of revenues previously deferred in Germany as a result of finalizing the contract that included the final negotiated fixed price, which was favorable to the initial range cited by the German pricing authority.
Unconsolidated Joint Business Revenues
We collaborate with Genentech, Inc., a wholly-owned member of the Roche Group, on the development and commercialization of RITUXAN. In addition, in the U.S. we share operating profits and losses relating to GAZYVA with Genentech. The Roche Group and its sub-licensees maintain sole responsibility for the development, manufacturing and commercialization of GAZYVA in the U.S. For additional information related to this collaboration, including information regarding the pre-tax profit sharing formula and its impact on future unconsolidated joint business revenues, please read Note 20,
Collaborative and Other Relationships
to our consolidated financial statements included within this report.
Revenues from unconsolidated joint business are summarized as follows:
|
|
For the Years Ended
December 31,
|
% Change
|
|||||||||||||||
|
|
2013 compared to 2012
|
2012 compared to 2011
|
|||||||||||||||
|
(In millions, except percentages)
|
2013
|
2012
|
2011
|
||||||||||||||
|
Biogen Idec's share of profits in the U.S. for RITUXAN and GAZYVA (1)
|
$
|
1,085.2
|
|
$
|
1,031.7
|
|
$
|
872.7
|
|
5.2
|
%
|
18.2
|
%
|
||||
|
Reimbursement of selling and development expenses in the U.S. for RITUXAN
|
2.1
|
|
1.6
|
|
6.1
|
|
31.3
|
%
|
(73.8
|
)%
|
|||||||
|
Revenue on sales in the rest of world for RITUXAN
|
38.7
|
|
104.6
|
|
117.8
|
|
(63.0
|
)%
|
(11.2
|
)%
|
|||||||
|
Total unconsolidated joint business revenues
|
$
|
1,126.0
|
|
$
|
1,137.9
|
|
$
|
996.6
|
|
(1.0
|
)%
|
14.2
|
%
|
||||
(1) GAZYVA was approved by the FDA in November 2013.
For
2013
compared to
2012
, our share of revenues from unconsolidated joint business reflects a charge for damages and interest awarded to Hoechst in Genentech's arbitration with Hoechst. As disclosed in Note 21,
Litigation
to our consolidated financial statements included within this report, Genentech and Hoechst have completed the arbitration relating to Hoechst's claims under a license agreement between Hoechst's predecessor and Genentech that was terminated in October 2008. The license agreement provided for royalty payments of 0.5% on net sales of certain products defined by the agreement.
Although we were not a party to the arbitration, we reduced our share of RITUXAN revenues from unconsolidated joint business by
$49.7 million
during
2013
to reflect our share of the royalties and interest awarded to Hoechst, of which revenue on sales in the rest of world for RITUXAN was reduced by
$41.2 million
and pre-tax profits in the U.S. were reduced by
$8.5 million
. In 2011, we reduced our share of RITUXAN revenues from unconsolidated joint business by
$50.0 million
for our share of the estimate of the loss that we expected to be incurred upon completion of the arbitration award unfavorable to Genentech.
Biogen Idec’s Share of Pre-tax Profits in the U.S. for RITUXAN and GAZYVA
The following table provides a summary of amounts comprising our share of pre-tax profits on RITUXAN and GAZYVA in the U.S.:
|
|
For the Years Ended
December 31,
|
% Change
|
|||||||||||||||
|
|
2013 compared to 2012
|
2012 compared to 2011
|
|||||||||||||||
|
(In millions, except percentages)
|
2013
|
2012
|
2011
|
||||||||||||||
|
Product revenues, net
|
$
|
3,425.8
|
|
$
|
3,131.8
|
|
$
|
2,924.5
|
|
9.4
|
%
|
7.1
|
%
|
||||
|
Cost and expenses
|
615.9
|
|
543.7
|
|
730.8
|
|
13.3
|
%
|
(25.6
|
)%
|
|||||||
|
Pre-tax profits in the U.S. for RITUXAN and GAZYVA
|
$
|
2,809.9
|
|
$
|
2,588.1
|
|
$
|
2,193.7
|
|
8.6
|
%
|
18.0
|
%
|
||||
|
Biogen Idec's share of pre-tax profits in the U.S. for RITUXAN and GAZYVA
|
$
|
1,085.2
|
|
$
|
1,031.7
|
|
$
|
872.7
|
|
5.2
|
%
|
18.2
|
%
|
||||
45
For
2013
compared to
2012
, the increase in U.S. product revenues was due to price increases, an increase in commercial demand and the recognition of $94.9 million in net revenues resulting from the July 2013 issuance by the Department of Health and Human Services of its final rule on the Exclusion of Orphan Drugs for Certain Covered Entities Under 340B Program. The issuance of the final rule by the Department of Health and Human Services did not have an impact on the amount we recorded as revenues from unconsolidated joint business in our consolidated statements of income because, through June 30, 2013, we had been increasing our share of profits in the U.S. to reflect our interpretation of the proposed 340B rule. The final rule was consistent with our prior interpretation.
For
2012
compared to
2011
, the increase in U.S. product revenues was primarily due to price increases and an increase in commercial demand. Increased commercial demand was approximately 4% and 3% in U.S. unit sales volume for
2013
and
2012
, respectively, over the prior year comparative periods.
Collaboration costs and expenses for
2013
compared to
2012
increased primarily due to a higher cost of goods sold resulting from an increased volume in RITUXAN sales and higher associated third party royalties. In addition, upon the first marketing approval of GAZYVA by the FDA, we began recognizing all activity, including sales and marketing and research and development expenses, related to the GAZYVA program in unconsolidated joint business within our consolidated statements of income. Prior to its first regulatory approval, we recognized our share of GAZYVA development and commercialization expenses as research and development expense and selling, general and administrative expense, respectively, within our consolidated statements of income.
Collaboration costs and expenses for
2012
compared to
2011
decreased primarily due to lower sales and marketing expenses incurred by the collaboration and a decline in expenditures for the development of RITUXAN for use in other indications. The efficiencies and lower costs realized from the consolidation of the sales force in 2011 were offset by a 2011 charge of approximately
$125.0 million
recorded to the collaboration, representing Genentech's estimate of the compensatory damages and interest that may be awarded to Hoechst GmbH (Hoechst) resulting from an intermediate adverse decision by the arbitrator in Genentech’s ongoing arbitration with Hoechst. As a result of this charge to the collaboration, our share of revenues from unconsolidated joint business was reduced by
$50.0 million
in the second quarter of 2011. This
$50.0 million
amount reflected our share of the estimate of the loss that we expect to incur upon completion of the arbitration award unfavorable to Genentech.
Revenue on Sales in the Rest of World for RITUXAN
Revenue on sales in the rest of world for RITUXAN consists of our share of pre-tax co-promotion profits on RITUXAN in Canada and royalty revenue on sales outside the U.S. and Canada. For
2013
compared to
2012
, revenue on sales in the rest of world for RITUXAN decreased as a result of a
$41.2 million
charge for damages and interest awarded to Hoechst, as discussed above, as well as the expirations of royalties on a country-by-country basis. For
2012
compared to
2011
, revenue on sales in the rest of world for RITUXAN decreased due to the expirations of royalties on a country-by-country basis offset by a portion of the 2011 Hoechst charge, noted above, which was recorded as of June 30, 2011.
The royalty period for sales in the rest of world with respect to all products is 11 years from the first commercial sale of such product on a country-by-country basis. The royalty periods for a substantial portion of the remaining royalty-bearing sales in the rest of world markets expired during 2012 and 2013. We expect future revenue on sales of RITUXAN in the rest of world will be limited to our share of pre-tax co-promotion profits in Canada.
46
Other Revenues
Other revenues are summarized as follows:
|
|
For the Years Ended
December 31,
|
% Change
|
|||||||||||||||
|
|
2013 compared to 2012
|
2012 compared to 2011
|
|||||||||||||||
|
(In millions, except percentages)
|
2013
|
2012
|
2011
|
||||||||||||||
|
Royalty revenues
|
$
|
185.7
|
|
$
|
168.7
|
|
$
|
158.5
|
|
10.1
|
%
|
6.4
|
%
|
||||
|
Corporate partner revenues
|
78.2
|
|
43.8
|
|
57.4
|
|
78.5
|
%
|
(23.7
|
)%
|
|||||||
|
Total other revenues
|
$
|
263.9
|
|
$
|
212.5
|
|
$
|
215.9
|
|
24.2
|
%
|
(1.6
|
)%
|
||||
Royalty Revenues
We receive royalties from net sales on products related to patents that we licensed. Our most significant source of royalty revenue is derived from net worldwide sales of ANGIOMAX, which is licensed to The Medicines Company (TMC). Royalty revenues from the net worldwide sales of ANGIOMAX are recognized in an amount equal to the level of net sales achieved during a calendar year multiplied by the royalty rate in effect for that tier under our agreement with TMC. The royalty rate increases based upon which tier of total net sales are earned in any calendar year. During
2012
, we amended our agreement with TMC for the period from January 1, 2013 to December 15, 2014 to modestly increase the royalty rate in effect for all tiers. For
2013
compared to
2012
, the increase in royalty revenues is primarily related to the increase in the royalty rate as well as an increase in the net worldwide sales of ANGIOMAX. For
2012
compared to
2011
, the increase in royalty revenues reflects an increase in the net worldwide sales of ANGIOMAX.
In March 2012, the U.S. Patent and Trademark Office granted the extension of the term of the principal U.S. patent that covers ANGIOMAX to December 15, 2014. Under the terms of our royalty arrangement for ANGIOMAX, TMC is obligated to pay us royalties earned, on a country-by-country basis, until the later of (1) twelve years from the date of the first commercial sale of ANGIOMAX in such country or (2) the date upon which the product is no longer covered by a licensed patent in such country. The annual royalty rate is reduced by a specified percentage in any country where the product is no longer covered by a licensed patent and where sales have been reduced to a certain volume-based market share. TMC began selling ANGIOMAX in the U.S. in January 2001. We expect royalty revenue to decrease significantly when the term of the U.S. patent covering ANGIOMAX expires.
Corporate Partner Revenues
Our corporate partner revenues include amounts earned upon delivery of product under contract manufacturing agreements, revenues related to our arrangements with Samsung Bioepis and Eisai, Inc., and supply agreement revenues covering products previously included within our product line that we have sold or exclusively licensed to third parties.
For
2013
compared to
2012
the increase in corporate partner revenues was primarily due to increased revenue from our biosimilar arrangements and an amendment to our Zevalin supply agreement, which resulted in the delivery of our remaining Zevalin inventory and the recognition of a previously deferred amount. Zevalin is a program we sold in 2007 but have continued to manufacture. As part of the amendment, we have committed to one additional Zevalin manufacturing campaign, which we expect to complete in 2014. For
2012
compared to
2011
, the decrease in corporate partner revenues was primarily related to a one-time cash payment of approximately $11.0 million received in exchange for entering into an asset transfer agreement in March 2011.
For additional information on our relationship with Samsung Bioepis, please read Note 20,
Collaborative and Other Relationships
to our consolidated financial statements included within this report. For additional information on our relationship with Eisai, please read Note 11,
Property, Plant and Equipment
to our consolidated financial statements included within this report.
47
Reserves for Discounts and Allowances
Revenues from product sales are recorded net of applicable allowances for trade term discounts, wholesaler incentives, Medicaid rebates, Veterans Administration (VA) and Public Health Service (PHS) discounts, managed care rebates, product returns, and other governmental rebates or applicable allowances including those associated with the implementation of pricing actions in certain international markets where we operate.
Reserves established for these discounts and allowances are classified as reductions of accounts receivable (if the amount is payable to our direct customer) or a liability (if the amount is payable to a party other than our customer). These reserves are based on estimates of the amounts earned or to be claimed on the related sales. Our estimates take into consideration our historical experience, current contractual and statutory requirements, specific known market events and trends, and forecasted customer buying and payment patterns. Actual amounts may ultimately differ from our estimates. If actual results vary, we adjust these estimates, which will have an effect on earnings in the period of adjustment. To date, such adjustments have not been significant.
Reserves for discounts, contractual adjustments and returns that reduced gross product revenues are summarized as follows:
|
|
For the Years Ended
December 31,
|
% Change
|
|||||||||||||||
|
|
2013 compared to 2012
|
2012 compared to 2011
|
|||||||||||||||
|
(In millions, except percentages)
|
2013
|
2012
|
2011
|
||||||||||||||
|
Discounts
|
$
|
235.6
|
|
$
|
96.2
|
|
$
|
84.3
|
|
144.9
|
%
|
14.1
|
%
|
||||
|
Contractual adjustments
|
835.0
|
|
529.5
|
|
358.1
|
|
57.7
|
%
|
47.9
|
%
|
|||||||
|
Returns
|
24.0
|
|
21.9
|
|
14.8
|
|
9.6
|
%
|
48.0
|
%
|
|||||||
|
Total allowances
|
$
|
1,094.6
|
|
$
|
647.6
|
|
$
|
457.2
|
|
69.0
|
%
|
41.6
|
%
|
||||
|
Gross product revenues
|
$
|
6,636.9
|
|
$
|
4,813.7
|
|
$
|
4,293.3
|
|
37.9
|
%
|
12.1
|
%
|
||||
|
Percent of gross product revenues
|
16.5
|
%
|
13.5
|
%
|
10.6
|
%
|
|||||||||||
During
2013
, we reclassified prior year amounts related to our AVONEX co-pay programs from discounts to contractual adjustments. For the years ended
December 31, 2012
and
2011
, we reclassified $17.3 million and $11.7 million, respectively. For additional information related to our reserves, please read Note 5,
Reserves for Discounts and Allowances
to our consolidated financial statements included in this report.
As a result of our acquisition of TYSABRI rights from Elan, we began recognizing reserves for discounts and allowances for U.S. TYSABRI revenue in the second quarter of 2013. Prior periods included reserves for discounts and allowances for rest of world TYSABRI revenue and worldwide AVONEX revenue. In addition, following our commercial launch of TECFIDERA in the second quarter of 2013, we began recognizing reserves for discounts and allowances related to TECFIDERA revenue. Gross product revenues for
2012
and
2011
include sales of TYSABRI to Elan under our collaboration agreement, which did not have any corresponding reserves for discounts and allowances.
Discounts include trade term discounts and wholesaler incentives. For
2013
compared to
2012
, the increase in discounts was primarily driven by the above noted additions of TECFIDERA and U.S. TYSABRI amounts. For
2012
compared to
2011
, the increase in discounts was primarily driven by wholesaler incentives as a result of price increases.
Contractual adjustments relate to Medicaid and managed care rebates, VA, PHS discounts and other government rebates or applicable allowances. In addition to the above noted additions of TECFIDERA and U.S. TYSABRI amounts, for
2013
compared to
2012
, the increase in contractual adjustments was primarily due to an increase in U.S. governmental rebates and allowances as a result of price increases. For
2012
compared to
2011
, the increase in contractual adjustments was due to higher reserves for managed care and Medicaid and VA programs principally associated with higher rebates resulting from price increases as well as an increase in governmental rebates and allowances in certain of the international markets in which we operate.
Product return reserves are established for returns made by wholesalers. In accordance with contractual terms, wholesalers are permitted to return product for reasons such as damaged or expired product. The majority of wholesaler returns are due to product expiration. Reserves for product returns are recorded in the period the related revenue is recognized, resulting in a reduction to product sales. For
2013
compared to
2012
, return reserves increased primarily due to our acquisition of TYSABRI rights and the FDA approval and start of commercial sales of TECFIDERA, as discussed above. For
2012
compared to
2011
, return reserves increased primarily due to returns associated with a voluntary withdrawal of a limited amount of AVONEX product as well as price increases.
48
Cost and Expenses
A summary of total cost and expenses is as follows:
|
|
For the Years Ended
December 31,
|
% Change
|
|||||||||||||||
|
|
2013 compared to 2012
|
2012 compared to 2011
|
|||||||||||||||
|
(In millions, except percentages)
|
2013
|
2012
|
2011
|
||||||||||||||
|
Cost of sales, excluding amortization of acquired intangible assets
|
$
|
857.7
|
|
$
|
545.5
|
|
$
|
466.8
|
|
57.2
|
%
|
16.9
|
%
|
||||
|
Research and development
|
1,444.1
|
|
1,334.9
|
|
1,219.6
|
|
8.2
|
%
|
9.5
|
%
|
|||||||
|
Selling, general and administrative
|
1,712.1
|
|
1,277.5
|
|
1,056.1
|
|
34.0
|
%
|
21.0
|
%
|
|||||||
|
Amortization of acquired intangible assets
|
342.9
|
|
202.2
|
|
208.6
|
|
69.6
|
%
|
(3.1
|
)%
|
|||||||
|
Collaboration profit sharing
|
85.4
|
|
317.9
|
|
317.8
|
|
(73.1
|
)%
|
—
|
%
|
|||||||
|
(Gain) loss on fair value remeasurement of contingent consideration
|
(0.5
|
)
|
27.2
|
|
36.1
|
|
(102.0
|
)%
|
(24.6
|
)%
|
|||||||
|
Restructuring charges
|
—
|
|
2.2
|
|
19.0
|
|
(100.0
|
)%
|
(88.3
|
)%
|
|||||||
|
Total cost and expenses
|
$
|
4,441.6
|
|
$
|
3,707.4
|
|
$
|
3,323.9
|
|
19.8
|
%
|
11.5
|
%
|
||||
Cost of Sales, Excluding Amortization of Acquired Intangible Assets (Cost of Sales)
|
|
For the Years Ended
December 31,
|
% Change
|
|||||||||||||||
|
|
2013 compared to 2012
|
2012 compared to 2011
|
|||||||||||||||
|
(In millions, except percentages)
|
2013
|
2012
|
2011
|
||||||||||||||
|
Product cost of sales
|
$
|
427.6
|
|
$
|
365.9
|
|
$
|
307.3
|
|
16.9
|
%
|
19.1
|
%
|
||||
|
Royalty cost of sales
|
430.1
|
|
179.6
|
|
159.5
|
|
139.5
|
%
|
12.6
|
%
|
|||||||
|
Total cost of sales
|
$
|
857.7
|
|
$
|
545.5
|
|
$
|
466.8
|
|
57.2
|
%
|
16.9
|
%
|
||||
For
2013
compared to
2012
, the increase in royalty cost of sales was primarily driven by our acquisition of TYSABRI rights, partially offset by the expiration of a third party royalty related to AVONEX. Commencing in the second quarter of 2013, we began recording 100% of cost of sales and third party royalties of TYSABRI, which previously were shared with Elan. Our contingent payments due to Elan are also recorded as a component of royalty cost of sales. For additional information on the contingent payments due to Elan, please read Note 2,
Acquisitions
to our consolidated financial statements included within this report.
For
2013
compared to
2012
, the increase in product cost of sales was driven by higher unit sales volume, our product launch of TECFIDERA in the U.S. and our biosimilars manufacturing arrangement with Samsung Bioepis. In addition, for
2013
compared to
2012
, the increase in product cost of sales was driven by an increase in charges related to excess, obsolete, unmarketable or other inventory due in part to the implementation of our plans to supply rest of world markets with TYSABRI manufactured at our Hillerød, Denmark facility, which was approved by the FDA and EMA in July 2013.
For
2012
compared to
2011
, the increase in cost of sales was primarily driven by higher revenue from our core products, higher costs of the AVONEX PEN and increased funding related to the JCV antibody assay, nurse training fees, and our arrangement with Samsung Biologics.
Our products are subject to strict quality control and monitoring which we perform throughout the manufacturing process. Periodically, certain batches or units of product may no longer meet quality specifications or may expire. The expiry associated with our inventory is generally between 6 months and 5 years, depending on the product.
Inventory amounts written down related to excess, obsolete, unmarketable, or other inventory totaled
$47.3 million
,
$24.8 million
, and
$25.4 million
for the years ended
December 31, 2013
,
2012
, and
2011
, respectively.
49
Research and Development
|
|
For the Years Ended
December 31,
|
% Change
|
|||||||||||||||
|
|
2013 compared to 2012
|
2012 compared to 2011
|
|||||||||||||||
|
(In millions, except percentages)
|
2013
|
2012
|
2011
|
||||||||||||||
|
Marketed products
|
$
|
252.1
|
|
$
|
128.2
|
|
$
|
111.0
|
|
96.6
|
%
|
15.5
|
%
|
||||
|
Late stage programs
|
272.8
|
|
467.0
|
|
428.1
|
|
(41.6
|
)%
|
9.1
|
%
|
|||||||
|
Early stage programs
|
130.8
|
|
90.7
|
|
72.5
|
|
44.2
|
%
|
25.1
|
%
|
|||||||
|
Research and discovery
|
97.6
|
|
94.6
|
|
97.3
|
|
3.2
|
%
|
(2.8
|
)%
|
|||||||
|
Other research and development costs
|
552.7
|
|
479.0
|
|
465.6
|
|
15.4
|
%
|
2.9
|
%
|
|||||||
|
Milestone and upfront payments
|
138.1
|
|
75.4
|
|
45.1
|
|
83.2
|
%
|
67.2
|
%
|
|||||||
|
Total research and development
|
$
|
1,444.1
|
|
$
|
1,334.9
|
|
$
|
1,219.6
|
|
8.2
|
%
|
9.5
|
%
|
||||
Research and development expense incurred in support of our marketed products includes costs associated with product lifecycle management activities including, if applicable, costs associated with the development of new indications for existing products. Late stage programs are programs in Phase 3 development or in registration stage. Early stage programs are programs in Phase 1 or Phase 2 development. Research and discovery represents costs incurred to support our discovery research and translational science efforts. Other research and development costs consist of indirect costs incurred in support of overall research and development activities and non-specific programs, including activities that benefit multiple programs, such as management costs as well as depreciation and other facility-based expenses.
For
2013
compared to
2012
, the increase in research and development expense was primarily related to an increase in costs incurred in connection with our marketed products, early stage programs and upfront and milestone payments partially offset by a decrease in costs incurred in connection with our late stage programs. The increase in spending associated with marketed products is related to TECFIDERA, which is now recorded in this caption, and costs associated with TYSABRI, which previously were shared with Elan. Research and development expense related to our early stage programs increased over the prior year primarily due to costs incurred in the advancement of our Anti-LINGO program in multiple sclerosis, our BIIB037 program for Alzheimer’s disease, our anti-TWEAK program for lupus nephritis, and an increase in spending incurred in connection with our development of STX-100 for the treatment of idiopathic pulmonary fibrosis.
The decrease in spending associated with our late stage product candidates was driven by the discontinuation of dexpramipexole (as described below), decreased clinical trial activity associated with our ELOCTATE and ALPROLIX product candidates, as these clinical trials concluded in
2012
, and the FDA approval of TECFIDERA in the U.S. during the first quarter of 2013.
For
2012
compared to
2011
, the increase in research and development expense includes costs incurred in connection with our late and early stage programs, additional investments in our marketed products, an increase in upfront and milestone payments, and costs related to reorganizing a group in our research and development function. The increase in spending associated with our late stage product candidates was driven by increased clinical trial activity associated with our ELOCTATE, dexpramipexole, and Daclizumab HYP product candidates as well as costs incurred in support of commercial preparatory capabilities related to ELOCTATE.
At the end of December 2012, we learned that a Phase 3 trial investigating dexpramipexole in people with amyotrophic lateral sclerosis (ALS) did not meet its primary endpoint and failed to show efficacy in its key secondary endpoints. Based on these results, we discontinued development of dexpramipexole in ALS. Prior to our decision to discontinue dexpramipexole, we had started the R&D extension program, ENVISION, and had entered into arrangements with certain suppliers for the purchase of raw materials and the supply of drug product. These arrangements were canceled. We accrued approximately
$12.3 million
of research and development expense, as of December 31, 2012, related to these firm commitments to purchase R&D services and inventory or to pay cancellation charges.
Research and development expense related to our early stage programs in
2012
increased over
2011
compared to
2012
primarily due to costs incurred in the advancement of our Anti-TWEAK program in lupus nephritis, our BIIB037 program for Alzheimer’s disease, our Neublastin program for neuropathic pain, an increase in spending incurred in connection with our collaboration and license agreement with Portola Pharmaceuticals, Inc. for the development of the Syk inhibitor molecule and development of STX-100 for the treatment of idiopathic pulmonary fibrosis.
50
We intend to continue committing significant resources to targeted research and development opportunities where there is a significant unmet need and where the drug candidate has the potential to be highly differentiated. Specifically, we intend to continue to invest in bringing forward our MS pipeline and in pursuing additional therapies for autoimmune disorders, neurodegenerative diseases and hemophilia.
Milestone and Upfront Payments included in Research and Development Expense
Included in total research and development expense in
2013
were charges of
$75.0 million
related to an upfront payment made to Isis in September 2013 upon entering into a six year research collaboration with Isis under which both companies will perform research and then seek to develop and commercialize antisense or other therapeutics for the treatment of neurological disorders, $36.0 million related to upfront and milestone payments made to Samsung Bioepis in December 2013 upon entering into a development and commercialization agreement and a
$10.0 million
milestone payment made to Isis related to the selection and advancement of ISIS-DMPK
Rx
to treat DM1. These payments are classified as research and development expense as the programs they relate to have not achieved regulatory approval. Research and development expense in
2012
included charges totaling
$71.0 million
related to upfront payments made to Isis in January, June and December 2012 upon entering into three separate agreements for the development of Isis’ antisense investigational drug ISIS-SMN
Rx
for the treatment of spinal muscular atrophy (SMA), product candidates related to the treatment of mytonic dystrophy (DM1), and antisense therapeutics for up to three gene targets, respectively. Research and development expense in
2011
included a charge of
$36.8 million
related to an upfront payment made in connection with our collaboration and license agreement entered into with Portola Pharmaceuticals, Inc.
Selling, General and Administrative
|
|
For the Years Ended
December 31,
|
% Change
|
|||||||||||||||
|
|
2013 compared to 2012
|
2012 compared to 2011
|
|||||||||||||||
|
(In millions, except percentages)
|
2013
|
2012
|
2011
|
||||||||||||||
|
Selling, general and administrative
|
$
|
1,712.1
|
|
$
|
1,277.5
|
|
$
|
1,056.1
|
|
34.0
|
%
|
21.0
|
%
|
||||
For
2013
compared to
2012
, the increase in selling, general and administrative expense was primarily driven by costs associated with developing commercial capabilities for the product launch of TECFIDERA and the potential product launches of ELOCTATE and ALPROLIX, an increase in sales and marketing activities in support of AVONEX and TYSABRI and the
$27.2 million
charge recognized in relation to our exiting the Weston facility. For additional information related to this charge, please read Note 11,
Property, Plant and Equipment
to our consolidated financial statements included in this report. The increase in sales and marketing activities in support of TYSABRI were primarily driven by assuming 100% responsibility of activities as a result of the acquisition of TYSABRI rights. The successful commercialization of potential new products requires significant investments, such as sales force build and development, training, and other related activities. In addition, the increase in selling, general, and administrative expense was driven by an increase in share-based compensation expense, partially offset by a reduction in grant and sponsorship activity.
For
2012
compared to
2011
, the increase in selling, general and administrative expense was primarily driven by costs associated with developing commercial capabilities in preparation for the potential product launches of TECFIDERA, ELOCTATE and ALPROLIX, an increase in costs associated with the development of our sales force and promotional spending in support of FAMPYRA, an increase in sales and marketing activities in support of AVONEX and TYSABRI, and an increase in grant and sponsorship activity. The increase in selling, general and administrative expense was offset by the positive impact of foreign currency exchange rates.
We remain focused on preparing for multiple potential product launches in the coming years. As discussed above, we continue to invest in the development of commercial capabilities in support of our TECFIDERA program, which was recently approved by the FDA and the EC and is in the early stages of commercial launch. We also have continued to make investments in the development of commercial capabilities for our hemophilia franchise.
51
Amortization of Acquired Intangible Assets
|
|
For the Years Ended
December 31,
|
% Change
|
|||||||||||||||
|
|
2013 compared to 2012
|
2012 compared to 2011
|
|||||||||||||||
|
(In millions, except percentages)
|
2013
|
2012
|
2011
|
||||||||||||||
|
Amortization of acquired intangible assets
|
$
|
342.9
|
|
$
|
202.2
|
|
$
|
208.6
|
|
69.6
|
%
|
(3.1
|
)%
|
||||
For
2013
compared to
2012
, the change in amortization of acquired intangible assets was primarily driven by our acquisition of the TYSABRI rights from Elan and an increase in the amount of amortization recorded in relation to our AVONEX intangible asset. For
2012
compared to
2011
, the change in amortization of acquired intangible assets was primarily driven by the decrease in the amount of amortization recorded in relation to our AVONEX intangible asset.
We amortize the intangible assets related to TYSABRI and AVONEX using the economic consumption method based on revenue generated from the products underlying the related intangible assets. An analysis of the anticipated lifetime revenues of TYSABRI and AVONEX is performed annually during our long range planning cycle, which is generally updated in the third quarter of each year, and whenever events or changes in circumstances would significantly affect the
anticipated lifetime revenues of TYSABRI or AVONEX
. This analysis serves as the basis for the calculation of our economic consumption models used for these products. This analysis is based upon certain assumptions that we evaluate on a periodic basis, such as the anticipated product sales of AVONEX and TYSABRI, the expected impact of competitor products and our own commercial and pipeline product candidates, including TECFIDERA and PLEGRIDY, and the issuance of new patents or the extension of existing patents.
Our most recent long range planning cycle was updated in the third quarter of 2013, and included the impact of our acquisition of TYSABRI rights from Elan and a decrease in the expected future product revenues of AVONEX, resulting in an increase in amortization expense as compared to prior quarters. The results of our analysis were impacted by changes in the estimated impact of TECFIDERA, as well as other existing and potential oral and alternative MS formulations, including PLEGRIDY, that may compete with AVONEX and TYSABRI. Based upon this more recent analysis, the estimated future amortization for acquired intangible assets is expected to be as follows:
|
(In millions)
|
As of December 31, 2013
|
||
|
2014
|
$
|
426.3
|
|
|
2015
|
336.4
|
|
|
|
2016
|
322.7
|
|
|
|
2017
|
327.5
|
|
|
|
2018
|
330.2
|
|
|
|
Total
|
$
|
1,743.1
|
|
We monitor events and expectations regarding product performance. If there are any indications that the assumptions underlying our most recent analysis would be different than those utilized within our current estimates, our analysis would be updated and may result in a significant change in the anticipated lifetime revenues of AVONEX and TYSABRI. The occurrence of an adverse event could substantially increase the amount of amortization expense associated with our acquired intangible assets as compared to previous periods or our current expectations, which may result in a significant negative impact on our future results of operations.
Collaboration Profit Sharing
|
|
For the Years Ended
December 31,
|
% Change
|
|||||||||||||||
|
|
2013 compared to 2012
|
2012 compared to 2011
|
|||||||||||||||
|
(In millions, except percentages)
|
2013
|
2012
|
2011
|
||||||||||||||
|
Collaboration profit sharing
|
$
|
85.4
|
|
$
|
317.9
|
|
$
|
317.8
|
|
(73.1
|
)%
|
—
|
%
|
||||
Upon the closing of our acquisition of TYSABRI rights, our collaboration agreement was terminated, and we no longer record collaboration profit sharing. Collaboration profit sharing previously included the portion of rest of world net operating profits to be shared with Elan under the terms of our collaboration agreement for the development, manufacture and commercialization of TYSABRI. The amount also included the reimbursement for our portion of third-party royalties paid by Elan on behalf of the collaboration relating to rest of world sales. For
2012
compared to
2011
, collaboration profit sharing expense was consistent as a portion of our revenues recognized on sales of TYSABRI in Italy were deferred, as discussed under
52
the heading
Product Revenues - TYSABRI
, resulting in rest of world net operating profits being lower, offset by unit volume revenue growth. For
2012
and
2011
, our collaboration profit sharing expense included $53.2 million and $55.5 million, respectively, related to the reimbursement of third-party royalty payments made by Elan, which started to expire in 2013. For additional information about this collaboration, please read Note 20,
Collaborative and Other Relationships
to our consolidated financial statements included in this report.
(Gain) Loss on Fair Value Remeasurement of Contingent Consideration
|
|
For the Years Ended
December 31,
|
% Change
|
|||||||||||||||
|
|
2013 compared to 2012
|
2012 compared to 2011
|
|||||||||||||||
|
(In millions, except percentages)
|
2013
|
2012
|
2011
|
||||||||||||||
|
(Gain) loss on fair value remeasurement of contingent consideration
|
$
|
(0.5
|
)
|
$
|
27.2
|
|
$
|
36.1
|
|
(102.0
|
)%
|
(24.6
|
)%
|
||||
The consideration for certain of our business combinations includes future payments that are contingent upon the occurrence of a particular factor or factors. For business combinations completed after January 1, 2009, we record an obligation for such contingent consideration payments at its fair value on the acquisition date. We revalue our contingent consideration obligations each reporting period. Changes in the fair value of our contingent consideration obligations, other than changes due to payments, are recognized as a (gain) loss on fair value remeasurement of contingent consideration within our consolidated statements of income.
In connection with our acquisition of Stromedix, Inc. in March 2012, we recorded a contingent consideration obligation of
$122.2 million
. The fair value of this contingent consideration obligation as of
December 31, 2013
and
2012
was
$140.7 million
and
$135.3 million
, respectively. For
2013
compared to
2012
, the net increase in the fair value of this obligation was primarily due to changes in the discount rate and in the probability and expected timing related to the achievement of certain developmental milestones.
Upon completion of our purchase of the noncontrolling interest in our joint venture investments in Biogen Dompé SRL and Biogen Dompé Switzerland GmbH in September 2011, we recorded a contingent consideration obligation of
$38.8 million
. The fair value of this contingent consideration obligation as of
December 31, 2013
and
2012
was
$31.6 million
and
$29.8 million
, respectively. For
2013
compared to
2012
, the net increase in the fair value of this obligation was primarily due to changes in the probability and expected timing related to the achievement of certain cumulative sales-based and developmental milestones and in the discount rate. For
2012
compared to
2011
, the net decrease in the fair value of this obligation was primarily due to changes in the probability and expected timing related to the achievement of certain cumulative sales-based and developmental milestones and in the discount rate as well as the payment of a
$4.0 million
regulatory approval milestone.
In connection with our acquisition of Biogen Idec International Neuroscience GmbH (BIN), formerly Panima Pharmaceuticals AG (Panima), in December 2010, we recorded a contingent consideration obligation of
$81.2 million
. The fair value of this contingent consideration obligation as of
December 31, 2013
and
2012
was
$108.6 million
and
$128.8 million
, respectively. For
2013
compared to
2012
, the net decrease in the fair value of this obligation was primarily due to changes in the probability and expected timing related to the achievement of certain remaining developmental milestones and in the discount rate as well as payments of
$12.5 million
in developmental milestones. For
2012
compared to
2011
, the net increase in the fair value of this obligation was primarily due to changes in the discount rate and in the probability and expected timing related to the achievement of certain remaining developmental milestones, offset by a payment of a
$2.5 million
developmental milestone.
Restructuring Charges
|
|
For the Years Ended
December 31,
|
% Change
|
|||||||||||||||
|
|
2013 compared to 2012
|
2012 compared to 2011
|
|||||||||||||||
|
(In millions, except percentages)
|
2013
|
2012
|
2011
|
||||||||||||||
|
Restructuring charges
|
$
|
—
|
|
$
|
2.2
|
|
$
|
19.0
|
|
(100.0
|
)%
|
(88.3
|
)%
|
||||
For
2012
and
2011
, restructuring charges were related to our 2010 restructuring initiative. In 2010 we announced a number of strategic, operational, and organizational initiatives designed to provide a framework for the future growth of our business and realign our overall structure to become a more efficient and cost effective organization. As part of this initiative:
|
•
|
We out-licensed or terminated certain research and development programs, including those in oncology and cardiovascular medicine, that were no longer a strategic fit for us.
|
53
|
•
|
We completed a 13% reduction in workforce spanning our sales, research and development, and administrative functions.
|
|
•
|
We vacated and recognized the sale of the San Diego, California facility as well as consolidated certain of our Massachusetts facilities.
|
As of
December 31, 2012
, all restructuring charges related to our 2010 initiative had been incurred and paid.
Gain on Sale of Rights
|
|
For the Years Ended
December 31,
|
% Change
|
||||||||||||||
|
|
2013 compared to 2012
|
2012 compared to 2011
|
||||||||||||||
|
(In millions, except percentages)
|
2013
|
2012
|
2011
|
|||||||||||||
|
Gain on sale of rights
|
$
|
24.9
|
|
$
|
46.8
|
|
$
|
—
|
|
(46.8
|
)%
|
**
|
||||
During the third quarter of 2012, we sold all of our rights, including rights to royalties, related to BENLYSTA (belimumab). We were entitled to these rights pursuant to a license agreement with Human Genome Sciences, Inc. and GlaxoSmithKline plc (collectively the Licensees). Under the terms of the BENLYSTA sale agreement, we will receive payments equal to a multiple of royalties payable by the Licensees for the period covering October 2011 to September 2014 and a one-time contingency payment that could be paid to us if the cumulative royalties over the full royalty term exceed an agreed amount.
For
2013
compared to
2012
, we recognized lower payments from the sale of our rights to BENLYSTA resulting from a lower multiple of sales being applied in 2013 as compared to 2012. The payments received during
2013
and
2012
covered the royalty period from October 1 to September 30. The remaining payments, which are contingent upon BENLYSTA sales over the period ending September 2014, will be recognized as the payments become due. For additional information related to this transaction, please read Note 3,
Gain on Sale of Rights
to our consolidated financial statements included in this report.
Other Income (Expense), Net
|
|
For the Years Ended
December 31,
|
% Change
|
||||||||||||||
|
|
2013 compared to 2012
|
2012 compared to 2011
|
||||||||||||||
|
(In millions, except percentages)
|
2013
|
2012
|
2011
|
|||||||||||||
|
Other income (expense), net
|
$
|
(34.9
|
)
|
$
|
(0.7
|
)
|
$
|
(13.5
|
)
|
**
|
(94.5
|
)%
|
||||
For
2013
compared to
2012
, the change in other income (expense), net was due to a decrease in interest income due to lower average cash, cash equivalent and marketable securities balances primarily related to the use of cash in connection with our acquisition of TYSABRI rights from Elan and the repayment of our
6.0%
Senior Notes, a decrease in other, net primarily related to higher non-income based state taxes and higher foreign exchange losses. For
2012
compared to
2011
, the change in other income (expense), net was primarily due to an increase in interest income from the acceleration of interest imputed on originally discounted accounts receivables during the second quarter of 2012, which were collected in Spain in advance of original estimates, offset by an increase in interest expense due to a decrease in the amount of capitalized interest. Other income (expense), net in
2012
includes a gain of
$9.0 million
recognized upon our acquisition of Stromedix in March 2012, which was based on the value derived from the purchase price of our equity interest held in Stromedix prior to the acquisition. The amount in
2011
includes a gain of $13.8 million on the sale of stock from our strategic investments portfolio that was deemed no longer strategic.
For additional information related to our strategic investments, please read Note 9,
Financial Instruments
to our consolidated financial statements included in this report.
Income Tax Provision
|
|
For the Years Ended
December 31,
|
% Change
|
|||||||||||||||
|
|
2013 compared to 2012
|
2012 compared to 2011
|
|||||||||||||||
|
(In millions, except percentages)
|
2013
|
2012
|
2011
|
||||||||||||||
|
Effective tax rate on pre-tax income
|
24.2
|
%
|
25.4
|
%
|
26.0
|
%
|
(4.7
|
)%
|
(2.3
|
)%
|
|||||||
|
Income tax expense
|
$
|
601.0
|
|
$
|
470.6
|
|
$
|
444.5
|
|
27.7
|
%
|
5.9
|
%
|
||||
54
Our effective tax rate fluctuates from year to year due to the global nature of our operations. The factors that most significantly impact our effective tax rate include variability in the allocation of our taxable earnings among multiple jurisdictions, changes in tax laws, the amount and characterization of our research and development expenses, the levels of certain deductions and credits, acquisitions, and licensing transactions.
Our effective tax rate for
2013
compared to
2012
decreased primarily as a result of a change in our uncertain tax position related to our U.S. federal manufacturing deduction and our unconsolidated joint business, described below under
"Accounting for Uncertainty in Income Taxes"
, lower intercompany royalties owed by a foreign wholly owned subsidiary to a U.S. wholly owned subsidiary on the international sales of one of our products, the reinstatement of the federal research and development tax credit and the 2012 correction of an error in our deferred tax accounting, which increased our rate in the prior year. These favorable items were partially offset by higher relative earnings in the U.S. from the commercial launch of TECFIDERA, lower orphan drug credits due to reduced expenditures in eligible clinical trials and higher state taxes.
During
2013
, we recorded a deferred charge of
$203.7 million
in connection with an intercompany transfer of the intellectual property for Daclizumab HYP. The deferred charge will be amortized to income tax expense over the economic life of the Daclizumab HYP program. If the Daclizumab HYP program were to be discontinued, we will accelerate the amortization of this deferred charge and record an expense equal to its remaining net book value.
Our effective tax rate for
2012
compared to
2011
decreased primarily as a result of higher orphan drug credits for our ELOCTATE, STX-100, dexpramipexole and other orphan credit eligible clinical trials, lower intercompany royalties owed by a foreign wholly owned subsidiary to a U.S. wholly owned subsidiary on the international sales of one of our products and higher deductions related to our manufacturing activities. These decreases were partially offset by the correction of an error which had accumulated over several years in our deferred tax accounting for capitalized interest which resulted in an expense of
$29.0 million
.
Accounting for Uncertainty in Income Taxes
During 2013, we received updated technical guidance from the IRS concerning our current and prior year filings and calculation of our U.S. federal manufacturing deduction and overall tax classification of our unconsolidated joint business. Based on this guidance we reevaluated the level of our unrecognized benefits related to uncertain tax positions, and recorded a
$49.8 million
income tax benefit. This benefit is for a previously unrecognized position and relates to years 2005 through 2012. We recorded an offsetting expense of
$11.3 million
for non-income based state taxes, which is recorded in other income (expense) within our consolidated statements of income.
For information on our state tax matter and additional information related to income taxes for
2013
,
2012
and
2011
, please read Note 17,
Income Taxes
to our consolidated financial statements included in this report.
Equity in Loss of Investee, Net of Tax
|
|
For the Years Ended
December 31,
|
% Change
|
||||||||||||||
|
|
2013 compared to 2012
|
2012 compared to 2011
|
||||||||||||||
|
(In millions, except percentages)
|
2013
|
2012
|
2011
|
|||||||||||||
|
Equity in loss of investee, net of tax
|
$
|
17.2
|
|
$
|
4.5
|
|
$
|
—
|
|
281.2
|
%
|
**
|
||||
In February 2012, we finalized an agreement with Samsung BioLogics Co. Ltd. that established an entity, Samsung Bioepis, to develop, manufacture and market biosimilar pharmaceuticals. We account for this investment under the equity method of accounting. We recognize our share of the results of operations related to our investment in Samsung Bioepis one quarter in arrears. For
2013
compared to
2012
, the increase in equity in loss of investee, net of tax was due to increased clinical trial activity. For additional information related to this transaction, please read Note 20,
Collaborative and Other Relationships
to our consolidated financial statements included in this report.
On December 17, 2013, pursuant to our joint venture agreement with Samsung Biologics, we exercised our right to enter into an agreement with Samsung Bioepis to commercialize anti-TNF biosimilar product candidates in Europe. Under the terms of this agreement, we paid
$21.0 million
and accrued
$15.0 million
, which was recorded as research and development expense within our consolidated statements of income.
55
Noncontrolling Interest
|
|
For the Years Ended
December 31,
|
% Change
|
||||||||||||||
|
|
2013 compared to 2012
|
2012 compared to 2011
|
||||||||||||||
|
(In millions, except percentages)
|
2013
|
2012
|
2011
|
|||||||||||||
|
Net income attributable to noncontrolling interests, net of tax
|
$
|
—
|
|
$
|
—
|
|
$
|
32.3
|
|
**
|
(100.0
|
)%
|
||||
For
2012
compared to
2011
, the change in net income attributable to noncontrolling interests, net of tax, reflects a reduction in earnings from our foreign joint ventures due to our purchase of the noncontrolling interest in our joint venture investments described below. Amounts recognized during
2011
also reflect the attribution of a $10.0 million milestone payment to Knopp upon dosing the first patient in a registrational study for dexpramipexole as well as the attribution of a
$15.0 million
milestone payment to Neurimmune upon our submission of an IND application for BIIB037.
On September 6, 2011, we completed the purchase of the noncontrolling interest in our joint venture investments in Biogen Dompé SRL and Biogen Dompé Switzerland GmbH, our respective sales affiliates in Italy and Switzerland. Prior to this transaction, our consolidated financial statements reflected 100% of the operations of these joint venture investments and we recorded net income (loss) attributable to noncontrolling interests in our consolidated statements of income based on the percentage of ownership interest retained by our joint venture partners. We have continued to consolidate the operations of these entities following our purchase of the noncontrolling interest; however, as of September 6, 2011, we no longer allocate 50% of the earnings of these ventures to net income (loss) attributable to noncontrolling interests as Biogen Dompé SRL and Biogen Dompé Switzerland GmbH became wholly-owned subsidiaries of ours.
Market Risk
We conduct business globally. As a result, our international operations are subject to certain risks which may affect our results of operations, including volatility in foreign currency exchange rates or weak economic conditions in the foreign markets in which we operate.
Foreign Currency Exchange Risk
Our results of operations are subject to foreign currency exchange rate fluctuations due to the global nature of our operations. While the financial results of our global activities are reported in U.S. dollars, the functional currency for most of our foreign subsidiaries is their respective local currency. Fluctuations in the foreign currency exchange rates of the countries in which we do business will affect our operating results, often in ways that are difficult to predict.
Our net income may also fluctuate due to the impact of our foreign currency hedging program, which is designed to mitigate, over time, a portion of the impact resulting from volatility in exchange rate changes on revenues. We use foreign currency forward contracts to manage foreign currency risk with the majority of our forward contracts used to hedge certain forecasted revenue transactions denominated in foreign currencies in the next
18 months
. For a more detailed disclosure of our hedges outstanding, please read Note 10,
Derivative Instruments
to our consolidated financial statements included in this report. Our ability to mitigate the impact of exchange rate changes on revenues and net income diminishes as significant exchange rate fluctuations are sustained over extended periods of time. Other foreign currency gains or losses arising from our operations are recognized in the period in which we incur those gains or losses.
Pricing Pressure
Governments in a number of international markets in which we operate, including Germany, France, Italy, the United Kingdom, Portugal and Spain, have implemented measures aimed at reducing healthcare costs to constrain the overall level of government expenditures. These implemented measures vary by country and include, among other things, mandatory rebates and discounts, prospective and possible retroactive price reductions and suspensions on pricing increases on pharmaceuticals. Certain implemented measures negatively impacted our revenues in
2012
and
2013
. We expect to see continued efforts to achieve additional reductions in public expenditures and consequently our revenues and results of operations may be further negatively impacted if these, similar or more extensive measures are, or continue to be, implemented in these and other countries in which we operate.
In addition, certain countries set prices by reference to the prices in other countries where our products are marketed. Thus, our inability to secure adequate prices in a particular country may impair our ability to obtain acceptable prices in existing and potential new markets and limit market growth. The continued implementation of pricing actions throughout Europe may also lead to higher levels of parallel trade.
56
In the U.S., federal and state legislatures, health agencies and third-party payors continue to focus on containing the cost of health care. Legislative and regulatory proposals and enactments to reform health care insurance programs could significantly influence the manner in which our products are prescribed and purchased. For example, provisions of the 2010 Patient Protection and Affordable Care Act (PPACA) have resulted in changes in the way health care is paid for by both governmental and private insurers, which has had and is expected to continue to have a significant impact on our business. These changes include, among other things, increased Medicare rebates owed by manufacturers under the Medicaid Drug Rebate Program, annual fees and taxes on manufacturers of certain branded prescription drugs, the requirement that manufacturers participate in a discount program for certain outpatient drugs under Medicare Part D and the expansion of the number of hospitals eligible for discounts. The U.S. federal government has also implemented spending cuts under the Budget Control Act of 2011, known as “sequestration”, which included a 2% reduction in Medicare reimbursement rates to providers such as physicians, hospitals and drug plans. These cuts, which reduce payments to health care providers for Medicare Part B drugs, could affect decisions regarding prescribing patterns or site of care, which could adversely impact sales of our products such as TYSABRI and RITUXAN, which are administered by infusion. In addition, Medicare Part D plans managing outpatient prescription drugs that are receiving less reimbursement from the government could seek further discounts from manufacturers, which could adversely affect our sales of our Part D drugs, such as AVONEX and TECFIDERA. It is possible that additional federal health care reform measures will be adopted in the future, including as a result of ongoing discussions to reduce the U.S. federal budget deficit to address government finances, any of which could result in increased pricing pressure and reduced reimbursement for our products and otherwise have an adverse impact on our financial position or results of operations.
There is also significant economic pressure on state budgets that may result in states increasingly seeking to achieve budget savings through mechanisms that limit coverage or payment for our drugs. In recent years, some states have considered legislation that would control the prices of drugs. State Medicaid programs are increasingly requesting manufacturers to pay supplemental rebates and requiring prior authorization by the state program for use of any drug for which supplemental rebates are not being paid. Managed care organizations continue to seek price discounts and, in some cases, to impose restrictions on the coverage of particular drugs. Government efforts to reduce Medicaid expenses may lead to increased use of managed care organizations by Medicaid programs. This may result in managed care organizations influencing prescription decisions for a larger segment of the population and a corresponding constraint on prices and reimbursement for our products. In addition, under the PPACA, as states implement their health care marketplaces or operate under the federal exchange, the impact on drug manufacturers, including us, will depend in part on the formulary and benefit design decisions made by insurance sponsors or plans participating in these programs. It is possible that we may need to provide discounts or rebates to such plans in order to maintain favorable formulary access for our products for this patient population, which could have an adverse impact on our sales and results of operations.
Credit Risk
We are subject to credit risk from our accounts receivable related to our product sales. The majority of our accounts receivable arise from product sales in the U.S. and Europe with concentrations of credit risk limited due to the wide variety of customers and markets using our products, as well as their dispersion across many different geographic areas. Our accounts receivable are primarily due from wholesale distributors, public hospitals and other government entities. We monitor the financial performance and credit worthiness of our large customers so that we can properly assess and respond to changes in their credit profile. We operate in certain countries where weakness in economic conditions has resulted in extended collection periods. We continue to monitor these conditions, including the volatility associated with international economies and the relevant financial markets, and assess their possible impact on our business. Our historical write-offs of accounts receivable have not been significant.
Although our contractual payment terms have not changed, we noted greater volatility in the amount and timing of collections of accounts receivable balances in certain countries. In countries where we have experienced a pattern of payments extending beyond our contractual payment term and we expect to collect receivables greater than one year from the time of sale, we have discounted our receivables and reduced related revenues over the period of time that we estimate those amounts will be paid using the country’s market-based borrowing rate for such period. The related receivables are classified at the time of sale as non-current assets.
57
Within the European Union, our accounts receivable in Spain, Italy and Portugal continue to be subject to significant payment delays due to government funding and reimbursement practices. Uncertain credit and economic conditions have generally led to a lengthening of time to collect our accounts receivable in these countries, although these countries have introduced programs to pay down significantly overdue payables. Specifically during the fourth quarter of 2013, Portugal remitted approximately $10.0 million of funds against receivables aged greater than 2 years. Our net accounts receivable balances from product sales in Italy, Portugal and Spain totaled $217.2 million and $207.5 million as of
December 31, 2013
and
2012
, respectively, of which $17.4 million and $17.6 million were classified as non-current and included within investments and other assets within our consolidated balance sheets as of those dates. Approximately
$45.9 million
and
$11.8 million
of the aggregated balances for these three countries were overdue more than one year as of
December 31, 2013
and
2012
, respectively.
We believe that our allowance for doubtful accounts was adequate as of
December 31, 2013
and
2012
, respectively. However, if significant changes occur in the availability of government funding or the reimbursement practices of these or other governments, we may not be able to collect on amounts due to us from customers in such countries and our results of operations could be adversely affected.
Financial Condition and Liquidity
Our financial condition is summarized as follows:
|
|
As of December 31,
|
% Change
|
||||||||
|
(In millions, except percentages)
|
2013
|
2012
|
2013 compared to 2012
|
|||||||
|
Financial assets:
|
||||||||||
|
Cash and cash equivalents
|
$
|
602.6
|
|
$
|
570.7
|
|
5.6
|
%
|
||
|
Marketable securities — current
|
620.2
|
|
1,135.0
|
|
(45.4
|
)%
|
||||
|
Marketable securities — non-current
|
625.8
|
|
2,036.7
|
|
(69.3
|
)%
|
||||
|
Total cash, cash equivalents and marketable securities
|
$
|
1,848.5
|
|
$
|
3,742.4
|
|
(50.6
|
)%
|
||
|
Borrowings:
|
||||||||||
|
Current portion of notes payable and line of credit
|
$
|
3.5
|
|
$
|
453.4
|
|
(99.2
|
)%
|
||
|
Notes payable and other financing arrangements
|
592.4
|
|
687.4
|
|
(13.8
|
)%
|
||||
|
Total borrowings
|
$
|
595.9
|
|
$
|
1,140.8
|
|
(47.8
|
)%
|
||
|
Working Capital:
|
||||||||||
|
Current assets
|
$
|
3,184.9
|
|
$
|
3,244.3
|
|
(1.8
|
)%
|
||
|
Current liabilities
|
(1,758.3
|
)
|
(1,657.4
|
)
|
6.1
|
%
|
||||
|
Total working capital
|
$
|
1,426.6
|
|
$
|
1,586.9
|
|
(10.1
|
)%
|
||
For the year ended
December 31, 2013
, certain significant cash flows were as follows:
|
•
|
$3.25 billion
used for our acquisition of TYSABRI rights from Elan;
|
|
•
|
$643.2 million
in total payments for income taxes;
|
|
•
|
$450.0 million
used for the repayment of principal of our
6.0%
Senior Notes;
|
|
•
|
$400.3 million
used for share repurchases;
|
|
•
|
$246.3 million
used for purchases of property, plant and equipment; and
|
|
•
|
$100.0 million
upfront payment made to Isis pursuant to our collaboration agreement dated September 2013.
|
For the year ended
December 31, 2012
, certain significant cash flows were as follows:
|
•
|
$133.2 million in cash collections on accounts receivable balances in Spain and Portugal as part of new programs to resolve outstanding amounts long overdue;
|
|
•
|
$67.5 million
in proceeds from the issuance of stock for share-based compensation arrangements;
|
|
•
|
$46.8 million
in proceeds from the sale of our royalty and other rights to BENLYSTA;
|
58
|
•
|
$984.7 million
used for share repurchases;
|
|
•
|
$526.6 million
in total payments for income taxes;
|
|
•
|
$254.5 million
used for purchases of property, plant and equipment;
|
|
•
|
$72.4 million
of net cash paid for the acquisition of Stromedix, Inc.;
|
|
•
|
$71.0 million
in upfront payments made to Isis, recognized as research and development expense, pursuant to our collaboration agreements dated January, June, and December 2012; and
|
|
•
|
$32.1 million
in contributions made to Samsung Bioepis.
|
We have historically financed our operating and capital expenditures primarily through cash flows earned through our operations. We expect to continue funding our current and planned operating requirements principally through our cash flows from operations, as well as our existing cash resources. We believe that our existing funds, when combined with cash generated from operations and our access to additional financing resources, if needed, are sufficient to satisfy our operating, working capital, strategic alliance, milestone payment, capital expenditure and debt service requirements for the foreseeable future. In addition, we may choose to opportunistically return cash to shareholders and pursue other business initiatives, including acquisition and licensing activities. We may, from time to time, also seek additional funding through a combination of new collaborative agreements, strategic alliances and additional equity and debt financings or from other sources should we identify a significant new opportunity.
The undistributed cumulative foreign earnings of certain of our foreign subsidiaries, exclusive of earnings that would result in little or no net income tax expense under current U.S. tax law or which has already been subject to tax under U.S. tax law, are invested indefinitely outside the U.S. During 2013, we completed our acquisition of TYSABRI rights using cash primarily located outside the U.S. Of the total cash, cash equivalents and marketable securities at
December 31, 2013
, approximately $300 million was generated from operations in foreign jurisdictions and is intended for use in our foreign operations or in connection with business development transactions outside of the U.S. In managing our day-to-day liquidity in the U.S., we do not rely on the unrepatriated earnings as a source of funds and we have not provided for U.S. federal or state income taxes on these undistributed foreign earnings. The residual U.S. tax liability, if cumulative amounts were repatriated, would be between
$900 million
to
$1 billion
as of
December 31, 2013
.
For additional information related to certain risks that could negatively impact our financial position or future results of operations, please read the “
Risk Factors
” and “
Quantitative and Qualitative Disclosures About Market Risk
” sections of this report.
Share Repurchase Programs
In February 2011, our Board of Directors authorized the repurchase of up to
20.0 million
shares of common stock. This authorization does not have an expiration date. In
2013
, approximately
2.0 million
shares were repurchased at a cost of
$400.3 million
.
We repurchased approximately
7.8 million
shares at a cost of approximately
$984.7 million
under the 2011 authorization in
2012
.
Approximately
4.2 million
shares of our common stock remain available for repurchase under the 2011 authorization.
Cash, Cash Equivalents and Marketable Securities
Until required for another use in our business, we typically invest our cash reserves in bank deposits, certificates of deposit, commercial paper, corporate notes, U.S. and foreign government instruments and other interest bearing marketable debt instruments in accordance with our investment policy. It is our policy to mitigate credit risk in our cash reserves and marketable securities by maintaining a well-diversified portfolio that limits the amount of exposure as to institution, maturity, and investment type. We also limit our exposure to European sovereign debt securities and maintain no holdings with respect to certain euro-zone states, such as Portugal, Italy and Spain. The value of our investments, however, may be adversely affected by increases in interest rates, downgrades in the credit rating of the corporate bonds included in our portfolio, instability in the global financial markets that reduces the liquidity of securities included in our portfolio, and by other factors which may result in declines in the value of the investments. Each of these events may cause us to record charges to reduce the carrying value of our investment portfolio if the declines are other-than-temporary or sell investments for less than our acquisition cost which could adversely impact our financial position and our overall liquidity.
59
The decrease in cash, cash equivalents and marketable securities from
December 31, 2012
is primarily due to our acquisition of TYSABRI rights from Elan and the repayment of principal of our
6.0%
Senior Notes, partially offset by net proceeds from sales and maturities of marketable securities and net cash flows provided by operating activities.
Borrowings
In March 2013, we entered into a
$750.0 million
senior unsecured revolving credit facility, which we may choose to use for working capital and general corporate purposes. The terms of this revolving credit facility include a financial covenant that requires us to not exceed a maximum debt to EBITDA ratio. This facility terminates in March 2014. As of
December 31, 2013
, we had
no
outstanding borrowings and were in compliance with all covenants under this facility.
On March 1, 2013, we repaid the
$450.0 million
principal amount of our
6.0%
Senior Notes.
We have
$550.0 million
aggregate principal amount of
6.875%
Senior Notes due March 1, 2018 that were originally priced at
99.184%
of par. The discount is amortized as additional interest expense over the period from issuance through maturity.
In connection with our 2006 distribution agreement with Fumedica, we issued notes totaling
61.4 million
Swiss Francs which were payable to Fumedica in varying amounts from June 2008 through June 2018. Our remaining note payable to Fumedica had a present value of
14.0 million
Swiss Francs (
$15.8 million
) and
16.4 million
Swiss Franc (
$17.9 million
) as of
December 31, 2013
and
2012
, respectively.
For a summary of the fair and carrying values of our outstanding borrowings as of
December 31, 2013
and
2012
, please read Note 8,
Fair Value Measurements
to our consolidated financial statements included in this report.
Working Capital
We define working capital as current assets less current liabilities. The decrease in working capital from
December 31, 2012
reflects a decrease in total current assets of $59.4 million and an increase in total current liabilities of $100.9 million. The decrease in total current assets was primarily driven by our acquisition of TYSABRI rights from Elan, partially offset by an increase in inventory related to our AVONEX, TYSABRI and ELOCTATE programs and accounts receivable resulting from increased product revenue. The increase in total current liabilities primarily resulted from an increase in taxes payable and accrued expenses and other partially offset by the repayment of our
6.0%
Senior Notes on March 1, 2013.
Cash Flows
The following table summarizes our cash flow activity:
|
|
For the Years Ended
December 31,
|
% Change
|
|||||||||||||||
|
|
2013 compared to 2012
|
2012 compared to 2011
|
|||||||||||||||
|
(In millions, except percentages)
|
2013
|
2012
|
2011
|
||||||||||||||
|
Net cash flows provided by operating activities
|
$
|
2,345.1
|
|
$
|
1,879.9
|
|
$
|
1,727.7
|
|
24.7
|
%
|
8.8
|
%
|
||||
|
Net cash flows used in by investing activities
|
$
|
(1,604.7
|
)
|
$
|
(950.3
|
)
|
$
|
(1,650.3
|
)
|
68.9
|
%
|
(42.4
|
)%
|
||||
|
Net cash flows used in financing activities
|
$
|
(716.5
|
)
|
$
|
(877.5
|
)
|
$
|
(319.9
|
)
|
(18.3
|
)%
|
174.3
|
%
|
||||
Operating Activities
Cash flows from operating activities represent the cash receipts and disbursements related to all of our activities other than investing and financing activities. We expect cash provided from operating activities will continue to be our primary source of funds to finance operating needs and capital expenditures for the foreseeable future.
Operating cash flow is derived by adjusting our net income for:
|
•
|
Non-cash operating items such as depreciation and amortization, impairment charges and share-based compensation charges;
|
|
•
|
Changes in operating assets and liabilities which reflect timing differences between the receipt and payment of cash associated with transactions and when they are recognized in results of operations; and
|
|
•
|
Changes associated with the fair value of contingent milestones associated with our acquisitions of businesses and payments related to collaborations.
|
60
For
2013
compared to
2012
, the increase in cash provided by operating activities is primarily driven by an increase in net income and taxes payable, partially offset by an increase in inventory related to our AVONEX, TYSABRI and ELOCTATE programs and accounts receivable resulting from increased product revenue.
For
2012
compared to
2011
, the increase in cash provided by operating activities was driven by an increase in net income, primarily resulting from increased product revenue, and higher accrued balances offset by an increase in deferred income taxes and inventory balances.
Investing Activities
For
2013
compared to
2012
, the increase in net cash flows used in investing activities is primarily due to
$3,262.7 million
used for our acquisition of TYSABRI rights from Elan, partially offset by net proceeds from sales and maturities of marketable securities.
For
2012
compared to
2011
, the decrease in net cash flows used in investing activities is primarily due to a decrease in the net purchases of marketable securities offset by the net cash paid for the acquisition of Stromedix. Net purchases of marketable securities totaled
$584.8 million
in
2012
, compared to
$1,420.3 million
in
2011
.
Financing Activities
For
2013
compared to
2012
, the decrease in net cash flows used in financing activities is primarily due to a decrease in the amount of our common stock we repurchased partially offset by the repayment of principal of our
6.0%
Senior Notes.
For
2012
compared to
2011
, the increase in net cash flows used in financing activities is due primarily to an increase in the amounts of our common stock we repurchased as well as a decrease in proceeds from the issuance of stock for share-based compensation arrangements. We received
$67.5 million
in
2012
, compared to
$314.7 million
in
2011
, related to stock option exercises and stock issuances under our employee stock purchase plan.
Contractual Obligations and Off-Balance Sheet Arrangements
Contractual Obligations
The following table summarizes our contractual obligations as of
December 31, 2013
, excluding amounts related to uncertain tax positions, amounts payable to tax authorities, funding commitments, contingent milestone payments, contingent payments, contingent consideration and our financing arrangements, as described below.
|
|
Payments Due by Period
|
||||||||||||||||||
|
(In millions)
|
Total
|
Less than
1 Year
|
1 to 3
Years
|
3 to 5
Years
|
After
5 Years
|
||||||||||||||
|
Non-cancellable operating leases (1), (2)
|
$
|
611.7
|
|
$
|
66.8
|
|
$
|
109.6
|
|
$
|
92.4
|
|
$
|
342.9
|
|
||||
|
Notes payable (3)
|
723.4
|
|
41.3
|
|
82.0
|
|
81.6
|
|
518.5
|
|
|||||||||
|
Purchase and other obligations (4)
|
188.7
|
|
165.2
|
|
22.1
|
|
1.4
|
|
—
|
|
|||||||||
|
Defined benefit obligation
|
42.6
|
|
—
|
|
—
|
|
—
|
|
42.6
|
|
|||||||||
|
Total contractual obligations
|
$
|
1,566.4
|
|
$
|
273.3
|
|
$
|
213.7
|
|
$
|
175.4
|
|
$
|
904.0
|
|
||||
|
(1)
|
We lease properties and equipment for use in our operations. In addition to rent, the leases may require us to pay additional amounts for taxes, insurance, maintenance and other operating expenses. Amounts reflected within the table, detail future minimum rental commitments under non-cancelable operating leases as of December 31 for each of the periods presented.
|
|
(2)
|
Includes future minimum rental commitments related to leases executed for two office buildings in Cambridge, Massachusetts, which completed construction in July and November 2013, net of sublease income expected to be received for the vacated portion of our Weston, MA facility. For additional information related to our leases, please read Note 11,
Property, Plant and Equipment
to our consolidated financial statements included in this report.
|
|
(3)
|
Notes payable includes principal and interest payments.
|
|
(4)
|
Purchase and other obligations include our obligations of approximately
$23.5 million
related to the fair value of net liabilities on derivative contracts, approximately $5.0 million related to fixed obligations for the purchase of natural gas and approximately $24.7 million related to obligations for communication services.
|
61
Tax Related Obligations
We exclude liabilities pertaining to uncertain tax positions from our summary of contractual obligations as we cannot make a reliable estimate of the period of cash settlement with the respective taxing authorities. As of
December 31, 2013
, we have approximately
$99.4 million
of liabilities associated with uncertain tax positions.
Other Funding Commitments
During the year ended
December 31, 2013
, we contributed the remaining
13.5 billion
South Korean won (approximately
$12.4 million
) to Samsung Bioepis to complete our obligation to contribute an aggregate of approximately
49.5 billion
South Korean won (approximately
$45.0 million
) for our
15 percent
ownership interest of Samsung Bioepis. For additional information related to our relationship with Samsung Bioepis, please read Note 20,
Collaborative and Other Relationships
to our consolidated financial statements included in this report.
As of
December 31, 2013
, we have funding commitments of up to approximately
$14.0 million
as part of our investment in biotechnology oriented companies and venture capital funds.
As of
December 31, 2013
, we have several on-going clinical studies in various clinical trial stages. Our most significant clinical trial expenditures are to clinical research organizations (CROs). The contracts with CROs are generally cancellable, with notice, at our option. We have recorded accrued expenses of approximately
$28.2 million
on our consolidated balance sheet for expenditures incurred by CROs as of
December 31, 2013
. We have approximately
$424.1 million
in cancellable future commitments based on existing CRO contracts as of
December 31, 2013
.
Contingent Development and Commercial Milestone Payments
Based on our development plans as of
December 31, 2013
, we have committed to make potential future milestone payments to third parties of up to approximately
$2.0 billion
as part of our various collaborations, including licensing and development programs. Payments under these agreements generally become due and payable only upon achievement of certain development, regulatory or commercial milestones. Because the achievement of these milestones had not occurred as of
December 31, 2013
, such contingencies have not been recorded in our financial statements.
We anticipate that we may pay approximately $169.6 million of milestone payments in
2014
, provided various development, regulatory or commercial milestones are achieved. Amounts related to contingent milestone payments are not considered contractual obligations as they are contingent on the successful achievement of certain development, regulatory approval and commercial milestones. These milestones may not be achieved.
TYSABRI Contingent Payments
On April 2, 2013, we acquired full ownership of, and strategic, commercial and decision-making rights to, TYSABRI from Elan. Under the terms of the acquisition agreement, we continued to share TYSABRI profits with Elan on an equal basis until April 30, 2013. We recorded the profit split for the month ended April 30, 2013, as cost of sales within our consolidated statements of income as we controlled TYSABRI effective April 2, 2013. Commencing May 1, 2013 and for the first twelve months thereafter, we will make contingent payments to Elan of
12%
on worldwide net sales of TYSABRI and, thereafter,
18%
on annual worldwide net sales up to
$2.0 billion
and
25%
on annual worldwide net sales that exceed
$2.0 billion
. In 2014, the
$2.0 billion
threshold will be pro-rated for the portion of 2014 remaining after the first 12 months expires. Royalty payments to Elan and other third parties are recognized as cost of sales within our consolidated statements of income.
Contingent Consideration related to Business Combinations
In connection with our purchase of the noncontrolling interests in our joint venture investments in Biogen Dompé SRL and Biogen Dompé Switzerland GmbH and our acquisitions of Stromedix, Biogen Idec International Neuroscience GmbH and Biogen Idec Hemophilia Inc., we agreed to make additional payments of up to approximately $1.0 billion based upon the achievement of certain milestone events. These milestones may not be achieved.
As the acquisitions of the noncontrolling interests in our joint venture investments and our acquisitions of Stromedix and Biogen Idec International Neuroscience GmbH, formerly Panima Pharmaceuticals AG, occurred after January 1, 2009, we record contingent consideration liabilities at their fair value on the acquisition date and revalue these obligations each reporting period. For additional information related to the acquisitions of the noncontrolling interests in our joint venture investments and our acquisition of Stromedix please read Note 2,
Acquisitions
, to our consolidated financial statements included in this report.
62
In connection with our acquisition of Biogen Idec Hemophilia Inc. (BIH), formerly Syntonix, in January 2007, we agreed to pay up to an additional
$80.0 million
if certain milestone events associated with the development of BIH’s lead product, ALPROLIX are achieved. The first
$40.0 million
contingent payment was achieved in the first quarter of 2010. An additional
$20.0 million
contingent payment will occur if prior to the tenth anniversary of the closing date, the FDA grants approval of a Biologic License Application for ALPROLIX. A second
$20.0 million
contingent payment will occur if prior to the tenth anniversary of the closing date, a marketing authorization is granted by the EMA for ALPROLIX. For additional information related to our acquisition of BIH, please read Note 2,
Acquisitions
to our consolidated financial statements included in this report.
In 2006, we acquired Fumapharm AG. As part of this acquisition we acquired FUMADERM and TECFIDERA (together, Fumapharm Products). We paid
$220.0 million
upon closing of the transaction and agreed to pay an additional
$15.0 million
if a Fumapharm Product is approved for MS in the U.S. or E.U. In the second quarter of 2013, we paid this
$15.0 million
contingent payment as TECFIDERA was approved in the U.S. for MS by the FDA. We are also required to make the following additional contingent payments to former shareholders of Fumapharm AG based on the attainment of certain cumulative sales levels of Fumapharm Products and the level of total net sales of Fumapharm Products in the prior twelve month period, as defined in the acquisition agreement:
|
Cumulative Sales Level
|
||||||||||||||||||||
|
Prior 12 Month Sales
|
$500M
|
$1.0B
|
$2.0B
|
$3.0B
|
Each additional $1.0B up to $20.0B
|
|||||||||||||||
|
Payment Amount (In millions)
|
||||||||||||||||||||
|
< $500 million
|
$
|
—
|
|
$
|
—
|
|
$
|
—
|
|
$
|
—
|
|
$
|
—
|
|
|||||
|
$500 million - $1.0 billion
|
22.0
|
|
25.0
|
|
50.0
|
|
50.0
|
|
50.0
|
|
||||||||||
|
$1.0 billion - $1.5 billion
|
—
|
|
50.0
|
|
100.0
|
|
100.0
|
|
100.0
|
|
||||||||||
|
$1.5 billion - $2.0 billion
|
—
|
|
—
|
|
150.0
|
|
150.0
|
|
150.0
|
|
||||||||||
|
$2.0 billion - $2.5 billion
|
—
|
|
—
|
|
200.0
|
|
200.0
|
|
200.0
|
|
||||||||||
|
$2.5 billion - $3.0 billion
|
—
|
|
—
|
|
—
|
|
250.0
|
|
250.0
|
|
||||||||||
|
> $3.0 billion
|
—
|
|
—
|
|
—
|
|
—
|
|
300.0
|
|
||||||||||
For example, if we reach the $2.0 billion cumulative sales level related to the Fumapharm Products and our prior twelve month sales of the related products were between $1.0 million and $1.5 billion, then we will owe a $100.0 million contingent payment, and no further contingent payments will be required to be paid until such time as cumulative sales reach the next applicable cumulative sales level, or $3.0 billion in this example. These payments will be accounted for as an increase to goodwill as incurred, in accordance with the accounting standard applicable to business combinations when we acquired Fumapharm. Any portion of the payment which is tax deductible will be recorded as a reduction to goodwill. Payments are due within 60 days following the end of the quarter in which the applicable cumulative sales level has been reached. During 2013, we accrued the
$25.0 million
contingent payment as we reached the $1.0 billion cumulative sales level related to the Fumapharm Products.
Financing Arrangement
In July 2011, we executed leases for two office buildings to be constructed in Cambridge, Massachusetts. Construction of these facilities began in late 2011. In accordance with accounting guidance applicable to entities involved with the construction of an asset that will be leased when the construction is completed, we were considered the owner of these properties during the construction period. Accordingly, we recorded an asset and a corresponding financing obligation on our consolidated balance sheet for the amount of costs incurred related to the construction for these buildings.
In July and November 2013, the construction of the two office buildings was completed and we started leasing the facilities. Upon completion of the construction of the buildings, we determined that we are no longer considered the owner of the buildings because we do not have any unusual or significant continuing involvement. Consequently, we derecognized the buildings and their associated financing obligation of approximately
$161.5 million
from our consolidated balance sheet. As of
December 31, 2012
, the amount recorded within our consolidated balance sheet as property, plant and equipment and financing obligation totaled approximately
$86.5 million
.
63
Other Off-Balance Sheet Arrangements
We do not have any relationships with entities often referred to as structured finance or special purpose entities that were established for the purpose of facilitating off-balance sheet arrangements. As such, we are not exposed to any financing, liquidity, market or credit risk that could arise if we had engaged in such relationships. We consolidate variable interest entities if we are the primary beneficiary.
Legal Matters
For a discussion of legal matters as of
December 31, 2013
, please read Note 21,
Litigation
to our consolidated financial statements included in this report.
Critical Accounting Estimates
The preparation of our consolidated financial statements, which have been prepared in accordance with accounting principles generally accepted in the U.S. (U.S. GAAP), requires us to make estimates, judgments and assumptions that may affect the reported amounts of assets, liabilities, equity, revenues and expenses, and related disclosure of contingent assets and liabilities. We base our estimates on historical experience and on various other assumptions that we believe are reasonable, the results of which form the basis for making judgments about the carrying values of assets and liabilities. We evaluate our estimates, judgments and assumptions on an ongoing basis. Actual results may differ from these estimates under different assumptions or conditions.
Revenue Recognition and Related Allowances
We recognize revenue when all of the following criteria are met: persuasive evidence of an arrangement exists; delivery has occurred or services have been rendered; our price to the customer is fixed or determinable; and collectability is reasonably assured.
Product Revenues
Revenues from product sales are recognized when title and risk of loss have passed to the customer, which is typically upon delivery. Sales of TYSABRI in the U.S. were previously recognized on the “sell-through” model, upon shipment of the product by Elan to its third party distributor rather than upon shipment to Elan. As a result of our acquisition of TYSABRI rights from Elan on April 2, 2013, we began recognizing sales of TYSABRI in the U.S. when title and risk of loss passed to the same third party distributor. The timing of distributor orders and shipments can cause variability in earnings.
Revenues from Unconsolidated Joint Business
We collaborate with Genentech on the development and commercialization of RITUXAN. In addition, in the U.S. we share operating profits and losses relating to GAZYVA with Genentech. The Roche Group and its sub-licensees maintain sole responsibility for the development, manufacturing and commercialization of GAZYVA in the U.S. Revenues from unconsolidated joint business consists of (1) our share of pre-tax profits in the U.S. for RITUXAN and GAZYVA; (2) reimbursement of our selling and development expenses in the U.S. for RITUXAN; and (3) revenue on sales in the rest of world for RITUXAN, which consist of our share of pre-tax co-promotion profits in Canada and royalty revenue on sales outside the U.S. and Canada by F. Hoffmann-La Roche Ltd. (Roche) and its sublicensees. Pre-tax co-promotion profits on RITUXAN are calculated and paid to us by Genentech in the U.S. and by Roche in Canada. Pre-tax co-promotion profits consist of U.S. and Canadian net sales to third-party customers less the cost to manufacture, third-party royalty expenses, distribution, selling, and marketing expenses, and joint development expenses incurred by Genentech, Roche and us. We record our share of the pretax co-promotion profits on RITUXAN in Canada and royalty revenues on sales outside the U.S. on a cash basis as we do not have access to the information or ability to estimate these profits or royalty revenue in the period incurred. Additionally, our share of the pre-tax profits on RITUXAN and GAZYVA in the U.S. includes estimates made by Genentech and those estimates are subject to change. Actual results may ultimately differ from our estimates.
Reserves for Discounts and Allowances
We establish reserves for trade term discounts, wholesaler incentives, Medicaid and managed care rebates, VA and PHS discounts, product returns and other governmental discounts or applicable allowances associated with the implementation of pricing actions in certain of international markets in which we operate. These reserves are based on estimates of the amounts earned or to be claimed on the related sales. Our estimates take into consideration our historical experience, current contractual and statutory requirements, specific known market events and trends, industry data and forecasted customer buying patterns. If actual results vary, we may need to adjust these estimates, which could have an effect on earnings in the period of the adjustment.
64
In addition to the discounts and rebates described above and classified as a reduction of revenue, we also maintain certain customer service contracts with distributors and other customers in the distribution channel that provide us with inventory management, data and distribution services. To the extent we can demonstrate a separable benefit and fair value for these services, we classify these payments within selling, general and administrative expenses.
Bad Debt Reserves
Bad debt reserves are based on our estimated uncollectible accounts receivable. Given our historical experience with bad debts, combined with our credit management policies and practices, we do not presently maintain significant bad debt reserves. However certain of our customers are based in countries where the economic conditions continue to present challenges. We continue to monitor these conditions and associated impacts on the financial performance and credit worthiness of our large customers so that we can properly assess and respond to changes in their credit profile.
Concentrations of Credit Risk
The majority of our receivables arise from product sales in the United States and Europe and are primarily due from wholesale distributors, public hospitals and other government entities. We monitor the financial performance and credit worthiness of our large customers so that we can properly assess and respond to changes in their credit profile. We continue to monitor these conditions, including the volatility associated with international economies and the relevant financial markets, and assess their possible impact on our business. The credit and economic conditions within many of the international markets in which we operate, particularly in certain countries throughout Europe, such as Italy, Spain and Portugal, remain uncertain. These conditions have resulted in, and may continue to result in, an increase in the average length of time that it takes to collect on our accounts receivable outstanding in these countries.
In Portugal and select regions in Spain and Italy where our collections have slowed and a significant portion of these receivables are routinely being collected beyond our contractual payment terms and over periods in excess of one year, we have discounted our receivables and reduced related revenues based on the period of time that we estimate those amounts will be paid, to the extent such period exceeds one year, using the country’s market-based borrowing rate for such period. The related receivables are classified at the time of sale as non-current assets.
To date, we have not experienced any significant losses with respect to the collection of our accounts receivable. If economic conditions worsen and/or the financial condition of our customers were to further deteriorate, our risk of collectability may increase, which may result in additional allowances and/or significant bad debts.
For additional information related to our concentration of credit risk associated with our accounts receivable balances, please read the subsection above entitled
“Credit Risk”
in this
“Management’s Discussion and Analysis of Financial Condition and Results of Operations.”
Royalty Revenues
We receive royalty revenues under license agreements with a number of third parties that sell products based on technology we have developed or to which we own rights. The license agreements provide for the payment of royalties to us based on sales of these licensed products. There are no future performance obligations on our part under these license agreements. We record these revenues based on estimates of the sales that occurred during the relevant period. The relevant period estimates of sales are based on interim data provided by licensees and analysis of historical royalties that have been paid to us, adjusted for any changes in facts and circumstances, as appropriate. We maintain regular communication with our licensees in order to assess the reasonableness of our estimates. Differences between actual royalty revenues and estimated royalty revenues are adjusted for in the period in which they become known, typically the following quarter. Historically, adjustments have not been material when compared to actual amounts paid by licensees. To the extent we do not have sufficient ability to accurately estimate revenues, we record such revenues on a cash basis.
Clinical Trial Expenses
Clinical trial expenses include expenses associated with CROs. The invoicing from CROs for services rendered can lag several months. We accrue the cost of services rendered in connection with CRO activities based on our estimate of site management, monitoring costs, and project management costs. We maintain regular communication with our CROs to gauge the reasonableness of our estimates. Differences between actual clinical trial expenses and estimated clinical trial expenses recorded have not been material and are adjusted for in the period in which they become known. We also accrue the costs of ongoing clinical trials associated with programs that have been terminated or discontinued for which there is no future economic benefit at the time the decision is made to terminate or discontinue the program.
65
Consolidation of Variable Interest Entities
We consolidate variable interest entities in which we are the primary beneficiary. For such consolidated entities where we own or are exposed to less than 100% of the economics, we record noncontrolling interest in our statement of income for the current results allocated to the third party equity interests.
In determining whether we are the primary beneficiary of a variable interest entity, we consider a number of factors, including our ability to direct the activities that most significantly affect the entity’s economic success, our contractual rights and responsibilities under the arrangement and the significance of the arrangement to each party. These considerations impact the way we account for our existing collaborative and joint venture relationships and may result in the future consolidation of companies or entities with which we have collaborative or other arrangements.
Inventory
Inventories are stated at the lower of cost or market with cost determined in a manner that approximates the first-in, first-out (FIFO) method. Inventory that can be used in either the production of clinical or commercial products is expensed as research and development costs when selected for use in a clinical manufacturing campaign.
Capitalization of Inventory Costs
Our policy is to capitalize inventory costs associated with our products prior to regulatory approval, when, based on management’s judgment, future commercialization is considered probable and the future economic benefit is expected to be realized. We consider numerous attributes in evaluating whether the costs to manufacture a particular product should be capitalized as an asset. We assess the regulatory approval process and where the particular product stands in relation to that approval process, including any known safety or efficacy concerns, potential labeling restrictions and other impediments to approval. We evaluate our anticipated research and development initiatives and constraints relating to the product and the indication in which it will be used. We consider our manufacturing environment including our supply chain in determining logistical constraints that could hamper approval or commercialization. We consider the shelf life of the product in relation to the expected timeline for approval and we consider patent related or contract issues that may prevent or delay commercialization. We also base our judgment on the viability of commercialization, trends in the marketplace and market acceptance criteria. Finally, we consider the reimbursement strategies that may prevail with respect to the product and assess the economic benefit that we are likely to realize.
We expense previously capitalized costs related to pre-approval inventory upon a change in such judgment, due to, among other potential factors, a denial or significant delay of approval by necessary regulatory bodies. There is a risk inherent in these judgments and any changes we make in these judgments may have a material impact on our results in future periods.
Obsolescence and Unmarketable Inventory
We periodically review our inventories for excess or obsolescence and write-down obsolete or otherwise unmarketable inventory to its estimated net realizable value. If the actual net realizable value is less than that estimated by us, or if it is determined that inventory utilization will further diminish based on estimates of demand, additional inventory write-downs may be required. Additionally, our products are subject to strict quality control and monitoring which we perform throughout the manufacturing process. In the event that certain batches or units of product no longer meet quality specifications, we will record a charge to cost of sales to write-down any unmarketable inventory to its estimated net realizable value. In all cases, product inventory is carried at the lower of cost or its estimated net realizable value.
Acquired Intangible Assets, including In-process Research and Development (IPR&D)
Effective January 1, 2009, when we purchase a business, the acquired IPR&D is measured at fair value, capitalized as an intangible asset and tested for impairment at least annually until commercialization, after which time the IPR&D is amortized over its estimated useful life. If we acquire an asset or group of assets that do not meet the definition of a business under applicable accounting standards, the acquired IPR&D is expensed on its acquisition date. Future costs to develop these assets are recorded to research and development expense as they are incurred.
We have acquired, and expect to continue to acquire, intangible assets through the acquisition of biotechnology companies or through the consolidation of variable interest entities. These intangible assets primarily consist of technology associated with human therapeutic products and in-process research and development product candidates. When significant identifiable intangible assets are acquired, we generally engage an independent third-party valuation firm to assist in determining the fair values of these assets as of the acquisition date. Management will determine the fair value of less significant identifiable intangible assets acquired. Discounted cash flow models are typically used in these valuations, and these models require the use of significant estimates and assumptions including but not limited to:
|
•
|
estimating the timing of and expected costs to complete the in-process projects;
|
66
|
•
|
projecting regulatory approvals;
|
|
•
|
estimating future cash flows from product sales resulting from completed products and in process projects; and
|
|
•
|
developing appropriate discount rates and probability rates by project.
|
We believe the fair values assigned to the intangible assets acquired are based upon reasonable estimates and assumptions given available facts and circumstances as of the acquisition dates.
If these projects are not successfully developed, the sales and profitability of the company may be adversely affected in future periods. Additionally, the value of the acquired intangible assets may become impaired. We believe that the foregoing assumptions used in the IPR&D analysis were reasonable at the time of the respective acquisition. No assurance can be given, however, that the underlying assumptions used to estimate expected project sales, development costs or profitability, or the events associated with such projects, will transpire as estimated.
Impairment and Amortization of Long-lived Assets and Accounting for Goodwill
Long-lived Assets Other than Goodwill
Long-lived assets to be held and used, including property, plant and equipment as well as intangible assets, including IPR&D and trademarks, totaled approximately $6,225.4 million as of
December 31, 2013
. Property, plant and equipment are reviewed for impairment whenever events or changes in circumstances indicate that the carrying amount of the assets may not be recoverable. We review our intangible assets with indefinite lives for impairment annually, as of October 31, and whenever events or changes in circumstances indicate that the carrying value of an asset may not be recoverable.
When performing our impairment assessment, we have the option to first assess qualitative factors to determine whether it is necessary to recalculate the fair value of our intangible assets with indefinite lives. If we elect this option and believe, as a result of the qualitative assessment, that it is more-likely-than-not that the fair value of our intangible assets with indefinite lives is less than its carrying amount, we calculate the fair value using the same methodology as described above. If the carrying value of our intangible assets with indefinite lives exceeds its fair value, then the intangible asset is written-down to its fair values. Alternatively, we may elect to not first assess qualitative factors and immediately recalculate the fair value of our intangible assets with indefinite lives.
Our most significant intangible assets are our acquired and in-licensed rights and patents and developed technology. Acquired and in-licensed rights and patents primarily relates to our acquisition of TYSABRI rights from Elan. Developed technology primarily relates to our AVONEX product, which was recorded in connection with the merger of Biogen, Inc. and IDEC Pharmaceuticals Corporation in 2003. We amortize the intangible assets related to TYSABRI and AVONEX using the economic consumption method based on revenue generated from the products underlying the related intangible assets. An analysis of the anticipated lifetime revenues of TYSABRI and AVONEX is performed annually during our long range planning cycle, which is generally updated in the third quarter of each year, and whenever events or changes in circumstances would significantly affect the
anticipated lifetime revenues of TYSABRI or AVONEX
. This analysis serves as the basis for the calculation of our economic consumption models used for these products. This analysis is based upon certain assumptions that we evaluate on a periodic basis, such as the anticipated product sales of AVONEX and TYSABRI, the expected impact of competitor products and our own commercial and pipeline product candidates, including TECFIDERA and PLEGRIDY, and the issuance of new patents or the extension of existing patents.
We monitor events and expectations regarding product performance. If there are any indications that the assumptions underlying our most recent analysis would be different than those utilized within our current estimates, our analysis would be updated and may result in a significant change in the anticipated lifetime revenues of AVONEX and TYSABRI. The occurrence of an adverse event could substantially increase the amount of amortization expense associated with our acquired intangible assets as compared to previous periods or our current expectations, which may result in a significant negative impact on our future results of operations.
Impairment charges related to our long-lived assets during
2013
,
2012
and
2011
were immaterial.
Goodwill
Goodwill totaled approximately
$1,232.9 million
as of
December 31, 2013
, and relates largely to amounts that arose in connection with the merger of Biogen, Inc. and IDEC Pharmaceuticals Corporation. Our goodwill balances represent the difference between the purchase price and the fair value of the identifiable tangible and intangible net assets when accounted for using the purchase method of accounting.
67
We assess our goodwill balance within our single reporting unit annually, as of October 31, and whenever events or changes in circumstances indicate the carrying value of goodwill may not be recoverable to determine whether any impairment in this asset may exist and, if so, the extent of such impairment. We have the option to first assess qualitative factors to determine whether it is necessary to perform the two-step impairment test. If we elect this option and believe, as a result of the qualitative assessment, that it is more-likely-than-not that the fair value of our reporting unit is less than its carrying amount, the quantitative two-step impairment test is required; otherwise, no further testing is required. Alternatively, we may elect to not first assess qualitative factors and immediately perform the quantitative two-step impairment test. In the first step, we compare the fair value of our reporting unit to its carrying value. If the carrying value of the net assets assigned to the reporting unit exceeds the fair value of our reporting unit, then the second step of the impairment test is performed in order to determine the implied fair value of our reporting unit’s goodwill. If the carrying value of our reporting unit’s goodwill exceeds its implied fair value, then we would record an impairment loss equal to the difference.
We completed our required annual impairment test in the fourth quarter of
2013
,
2012
and
2011
and determined in each of those periods that the carrying value of goodwill was not impaired. In each year, the fair value of our reporting unit, which includes goodwill, was significantly in excess of the carry value of our reporting unit.
Investments, including Fair Value Measures and Impairments
We invest in various types of securities, including short-term and long-term marketable securities, principally corporate notes, government securities including government sponsored enterprise mortgage-backed securities and credit card and auto loan asset-backed securities, in which our excess cash balances are invested.
In accordance with the accounting standard for fair value measurements we have classified our financial assets as Level 1, 2 or 3 within the fair value hierarchy. Fair values determined by Level 1 inputs utilize quoted prices (unadjusted) in active markets for identical assets that we have the ability to access. Fair values determined by Level 2 inputs utilize data points that are observable such as quoted prices, interest rates and yield curves. Fair values determined by Level 3 inputs utilize unobservable data points for the asset.
As noted in Note 8,
Fair Value Measurements
to our consolidated financial statements, a majority of our financial assets have been classified as Level 2. These assets have been initially valued at the transaction price and subsequently valued utilizing third party pricing services. The pricing services use many observable market inputs to determine value, including reportable trades, benchmark yields, credit spreads, broker/dealer quotes, bids, offers, current spot rates and other industry and economic events. We validate the prices provided by our third party pricing services by understanding the models used, obtaining market values from other pricing sources and analyzing pricing data in certain instances.
We also have some investments classified as Level 3 whose fair value is initially measured at transaction prices and subsequently valued using the pricing of recent financing or by reviewing the underlying economic fundamentals and liquidation value of the companies. We apply judgments and estimates when we validate the prices provided by third parties. While we believe the valuation methodologies are appropriate, the use of valuation methodologies is highly judgmental and changes in methodologies can have a material impact on our results of operations.
Impairment
We conduct periodic reviews to identify and evaluate each investment that has an unrealized loss, in accordance with the meaning of other-than-temporary impairment and its application to certain investments. An unrealized loss exists when the current fair value of an individual security is less than its amortized cost basis. Unrealized losses on available-for-sale debt securities that are determined to be temporary, and not related to credit loss, are recorded, net of tax, in accumulated other comprehensive income.
For available-for-sale debt securities with unrealized losses, management performs an analysis to assess whether we intend to sell or whether we would more likely than not be required to sell the security before the expected recovery of the amortized cost basis. Where we intend to sell a security, or may be required to do so, the security’s decline in fair value is deemed to be other-than-temporary and the full amount of the unrealized loss is reflected within earnings as an impairment loss.
Regardless of our intent to sell a security, we perform additional analysis on all securities with unrealized losses to evaluate losses associated with the creditworthiness of the security. Credit losses are identified where we do not expect to receive cash flows sufficient to recover the amortized cost basis of a security and are reflected within earnings as an impairment loss.
68
Royalty Cost of Sales
We make royalty payments to a number of third parties under license or purchase agreements associated with our acquisition of intellectual property. These royalty payments are typically calculated as a percentage (royalty rate) of the sales of our products within a particular year. That royalty rate may remain constant, increase or decrease within each year based on the total amount of sales during the annual period. Each quarterly period we estimate our total royalty obligation for the full year and recognize the proportional amount as cost of sales based on actual quarterly sales as a percentage of full year estimated sales. For example, if the level of net sales in any calendar year increases the royalty rate within the year, we will record our cost of sales at an even rate over the year, based on the estimated blended royalty rate.
Share-Based Compensation
We make certain assumptions in order to value and record expense associated with awards made under our share-based compensation arrangements. Changes in these assumptions may lead to variability with respect to the amount of expense we recognize in connection with share-based payments.
Determining the appropriate valuation model and related assumptions requires judgment, and includes estimating the expected market price of our stock on vesting date and stock price volatility as well as the term of the expected awards. Determining the appropriate amount to expense based on the anticipated achievement of performance targets requires judgment, including forecasting the achievement of future financial targets. The estimate of expense is revised periodically based on the probability of achieving the required performance targets and adjustments are made throughout the performance as appropriate. The cumulative impact of any revision is reflected in the period of change.
We also estimate forfeitures over the requisite service period when recognizing share-based compensation expense based on historical rates and forward-looking factors; these estimates are adjusted to the extent that actual forfeitures differ, or are expected to materially differ, from our estimates.
Contingent Consideration
For acquisitions completed after January 1, 2009, we record contingent consideration resulting from a business combination at its fair value on the acquisition date. Each reporting period thereafter, we revalue these obligations and record increases or decreases in their fair value as an adjustment to contingent consideration expense within the consolidated statement of income. Changes in the fair value of the contingent consideration obligations can result from adjustments to the discount rates and achievement and timing of any cumulative sales-based and development milestones, or changes in the probability of certain clinical events and changes in the assumed probability associated with regulatory approval. These fair value measurements represent Level 3 measurements as they are based on significant inputs not observable in the market.
Significant judgment is employed in determining the appropriateness of these assumptions as of the acquisition date and for each subsequent period. Accordingly, changes in assumptions described above, could have a material impact on the amount of contingent consideration expense we record in any given period.
Income Taxes
We prepare and file income tax returns based on our interpretation of each jurisdiction’s tax laws and regulations. In preparing our consolidated financial statements, we estimate our income tax liability in each of the jurisdictions in which we operate by estimating our actual current tax expense together with assessing temporary differences resulting from differing treatment of items for tax and financial reporting purposes. These differences result in deferred tax assets and liabilities, which are included in our consolidated balance sheets. Significant management judgment is required in assessing the realizability of our deferred tax assets. In performing this assessment, we consider whether it is more likely than not that some portion or all of the deferred tax assets will not be realized. The ultimate realization of deferred tax assets is dependent upon the generation of future taxable income during the periods in which those temporary differences become deductible. In making this determination, under the applicable financial accounting standards, we are allowed to consider the scheduled reversal of deferred tax liabilities, projected future taxable income, and the effects of tax planning strategies. Our estimates of future taxable income include, among other items, our estimates of future income tax deductions related to the exercise of stock options. In the event that actual results differ from our estimates, we adjust our estimates in future periods and we may need to establish a valuation allowance, which could materially impact our financial position and results of operations.
All tax effects associated with intercompany transfers of assets within our consolidated group, both current and deferred, are recorded as a prepaid tax or deferred charge and recognized through the consolidated statement of income when the asset transferred is sold to a third party or otherwise recovered through amortization of the asset's remaining economic life. If the asset transferred becomes impaired, for example through the discontinuation of a research program, we will expense any remaining deferred charge or prepaid tax.
69
We account for uncertain tax positions using a “more-likely-than-not” threshold for recognizing and resolving uncertain tax positions. We evaluate uncertain tax positions on a quarterly basis and consider various factors, that include, but are not limited to, changes in tax law, the measurement of tax positions taken or expected to be taken in tax returns, the effective settlement of matters subject to audit, information obtained during in process audit activities and changes in facts or circumstances related to a tax position. We adjust the level of the liability to reflect any subsequent changes in the relevant facts surrounding the uncertain positions. Our liabilities for uncertain tax positions can be relieved only if the contingency becomes legally extinguished through either payment to the taxing authority or the expiration of the statute of limitations, the recognition of the benefits associated with the position meet the “more-likely-than-not” threshold or the liability becomes effectively settled through the examination process. We consider matters to be effectively settled once the taxing authority has completed all of its required or expected examination procedures, including all appeals and administrative reviews; we have no plans to appeal or litigate any aspect of the tax position; and we believe that it is highly unlikely that the taxing authority would examine or re-examine the related tax position. We also accrue for potential interest and penalties related to unrecognized tax benefits in income tax expense.
We earn a significant amount of our operating income outside the U.S. As a result, a portion of our cash, cash equivalents, and marketable securities are held by foreign subsidiaries. We currently do not intend or foresee a need to repatriate these funds. We expect existing domestic cash, cash equivalents, marketable securities and cash flows from operations to continue to be sufficient to fund our domestic operating activities and cash commitments for investing and financing activities for the foreseeable future.
As of
December 31, 2013
, our non-U.S. subsidiaries’ undistributed foreign earnings included in consolidated retained earnings and other basis differences aggregated approximately
$3.8 billion
. All undistributed foreign earnings of non-U.S. subsidiaries, exclusive of earnings that would result in little or no net income tax expense or which were previously taxed under current U.S. tax law, are reinvested indefinitely in operations outside the U.S. This determination is made on a jurisdiction by jurisdiction basis and takes into the account the liquidity requirements in both the U.S. and within our foreign subsidiaries.
If we decide to repatriate funds in the future to execute our growth initiatives or to fund any other liquidity needs, the resulting tax consequences would negatively impact our results of operations through a higher effective tax rate and dilution of our earnings. The residual U.S. tax liability, if cumulative amounts were repatriated, would be between
$900 million
to
$1 billion
as of
December 31, 2013
.
Contingencies
We are currently involved in various claims and legal proceedings. On a quarterly basis, we review the status of each significant matter and assess its potential financial exposure. If the potential loss from any claim, asserted or unasserted, or legal proceeding is considered probable and the amount can be reasonably estimated, we accrue a liability for the estimated loss. Significant judgment is required in both the determination of probability and the determination as to whether an exposure is reasonably estimable. Because of uncertainties related to these matters, accruals are based only on the best information available at the time. As additional information becomes available, we reassess the potential liability related to pending claims and litigation and may revise our estimates. These revisions in the estimates of the potential liabilities could have a material impact on our consolidated results of operations and financial position.
New Accounting Standards
For a discussion of new accounting standards please read Note 1,
Summary of Significant Accounting Principles
to our consolidated financial statements included in this report.
|
Item 7A.
|
Quantitative and Qualitative Disclosures About Market Risk
|
We have operations or maintain distribution relationships in the U.S., Europe, Middle East, Canada, Central and South America, Australia, New Zealand, Japan, China, India and elsewhere in Asia in connection with the sale of AVONEX and TYSABRI and in Germany in connection with the sale of FUMADERM. TECFIDERA is commercially available in the U.S., Canada and Australia. FAMPYRA is commercially available throughout the European Union and in Canada, Australia, New Zealand, Israel and South Korea. In addition, we receive royalty revenues based on worldwide product sales by our licensees and through Genentech on sales of RITUXAN in the rest of world. As a result, our financial position, results of operations and cash flows can be affected by market fluctuations in foreign exchange rates, primarily with respect to the Euro, Canadian dollar, Swiss franc, Danish krone, Swedish krona, British pound, and Japanese yen.
70
We use foreign currency forward contracts to manage foreign currency risk but do not engage in currency speculation. The majority of our forward contracts are used to hedge certain forecasted revenue transactions denominated in foreign currencies. We also use forward contracts to mitigate the foreign currency exposure related to certain balance sheet items. We have not elected hedge accounting for the balance sheet related items.
The following quantitative information includes the impact of currency movements on forward contracts used in both programs. As of
December 31, 2013
and
2012
, a hypothetical adverse 10% movement in foreign exchange rates compared to the U.S. dollar across all maturities (for example, a strengthening of the Euro) would result in a hypothetical decrease in the fair value of forward contracts of approximately $101.6 million and $76.7 million, respectively. Our use of this methodology to quantify the market risk of such instruments should not be construed as an endorsement of its accuracy or the accuracy of the related assumptions. The quantitative information about market risk is limited because it does not take into account all foreign currency operating transactions.
In addition, the fair value of our marketable securities is subject to change as a result of potential changes in market interest rates. The potential change in fair value for interest rate sensitive instruments has been assessed on a hypothetical 100 basis point adverse movement across all maturities. As of
December 31, 2013
and
2012
, we estimate that such hypothetical adverse 100 basis point movement would result in a hypothetical loss in fair value of approximately $5.7 million and $23.8 million, respectively, to our interest rate sensitive instruments.
The returns from cash, cash equivalents and marketable securities will vary as short-term interest rates change. A 100 basis-point adverse movement (decrease) in short-term interest rates would decrease interest income by approximately $10.3 million and $17.5 million as of
December 31, 2013
and
2012
, respectively.
|
Item 8.
|
Financial Statements and Supplementary Data
|
The information required by this Item 8 is contained on pages F-1 through F-69 of this report and is incorporated herein by reference.
|
Item 9.
|
Changes in and Disagreements with Accountants on Accounting and Financial Disclosure
|
None.
|
Item 9A.
|
Controls and Procedures
|
Disclosure Controls and Procedures and Internal Control over Financial Reporting
Controls and Procedures
We have carried out an evaluation, under the supervision and with the participation of our management, including our principal executive officer and principal financial officer, of the effectiveness of the design and operation of our disclosure controls and procedures (as defined in Rules 13a-15(e) and 15d-15(e) under the Securities Exchange Act of 1934, as amended), as of
December 31, 2013
. Based upon that evaluation, our principal executive officer and principal financial officer concluded that, as of the end of the period covered by this report, our disclosure controls and procedures are effective in ensuring that (a) the information required to be disclosed by us in the reports that we file or submit under the Securities Exchange Act is recorded, processed, summarized and reported within the time periods specified in the SEC’s rules and forms, and (b) such information is accumulated and communicated to our management, including our principal executive officer and principal financial officer, as appropriate to allow timely decisions regarding required disclosure. In designing and evaluating our disclosure controls and procedures, our management recognized that any controls and procedures, no matter how well designed and operated, can provide only reasonable assurance of achieving the desired control objectives, and our management necessarily was required to apply its judgment in evaluating the cost-benefit relationship of possible controls and procedures.
Changes in Internal Control over Financial Reporting
There were no changes in our internal control over financial reporting during the quarter ended
December 31, 2013
that have materially affected, or are reasonably likely to materially affect, our internal control over financial reporting.
71
Management’s Annual Report on Internal Control over Financial Reporting
Our management is responsible for establishing and maintaining adequate internal control over our financial reporting. Internal control over financial reporting is defined in Rules 13a-15(f) and 15d-15(f) under the Securities Exchange Act as a process designed by, or under the supervision of, a company’s principal executive and principal financial officers and effected by a company’s board of directors, management and other personnel to provide reasonable assurance regarding the reliability of financial reporting and the preparation of financial statements for external purposes in accordance with U.S. GAAP. Our internal control over financial reporting includes those policies and procedures that:
|
•
|
pertain to the maintenance of records that, in reasonable detail, accurately and fairly reflect our transactions and dispositions of our assets;
|
|
•
|
provide reasonable assurance that transactions are recorded as necessary to permit preparation of financial statements in accordance with U.S. GAAP, and that our receipts and expenditures are being made only in accordance with authorizations of our management and directors; and
|
|
•
|
provide reasonable assurance regarding prevention or timely detection of unauthorized acquisition, use or disposition of our assets that could have a material effect on our financial statements.
|
Because of its inherent limitations, internal control over financial reporting may not prevent or detect misstatements. Projections of any evaluation of effectiveness to future periods are subject to the risk that controls may become inadequate because of changes in conditions, or that the degree of compliance with the policies or procedures may deteriorate.
Our management assessed the effectiveness of our internal control over financial reporting as of
December 31, 2013
. In making this assessment, management used the criteria set forth by the Committee of Sponsoring Organizations of the Treadway Commission (COSO) in its 1992 Internal Control — Integrated Framework.
Based on our assessment, our management has concluded that, as of
December 31, 2013
, our internal control over financial reporting is effective based on those criteria.
The effectiveness of our internal control over financial reporting as of
December 31, 2013
has been audited by PricewaterhouseCoopers LLP, an independent registered public accounting firm, as stated in their report, which is included herein.
|
Item 9B.
|
Other Information
|
None.
72
|
Item 10.
|
Directors, Executive Officers and Corporate Governance
|
The information concerning our executive officers is set forth under the heading
“Our Executive Officers”
in Part I of this report. The text of our code of business conduct, which includes the code of ethics that applies to our principal executive officer, principal financial officer, principal accounting officer or controller, and persons performing similar functions, is posted on our website, www.biogenidec.com, under the “Corporate Governance” subsection of the “About Us” section of the site. We intend to make all required disclosures regarding any amendments to, or waivers from, provisions of our code of business conduct at the same location of our website. We include our website address in this report only as an inactive textual reference and do not intend it to be an active link to our website.
The response to the
remainder
of this item is incorporated by reference from the discussion responsive thereto in the sections entitled “
Proposal 1 - Election of Directors,” “Corporate Governance,” “Stock Ownership - Section 16(a) Beneficial Ownership Reporting Compliance
” and “
Miscellaneous - Stockholder Proposals
” contained in the proxy statement for our
2014
annual meeting of stockholders.
|
Item 11.
|
Executive Compensation
|
The response to this item is incorporated by reference from the discussion responsive thereto in the sections entitled “
Executive Compensation and Related Information
” and
“Corporate Governance”
contained in the proxy statement for our
2014
annual meeting of stockholders.
|
Item 12.
|
Security Ownership of Certain Beneficial Owners and Management and Related Stockholder Matters
|
The response to this item is incorporated by reference from the discussion responsive thereto in the sections entitled
“Stock Ownership”
and
“Equity Compensation Plan Information”
contained in the proxy statement for our
2014
annual meeting of stockholders.
|
Item 13.
|
Certain Relationships and Related Transactions, and Director Independence
|
The response to this item is incorporated by reference from the discussion responsive thereto in the sections entitled “
Certain Relationships and Related Person Transactions
” and
“Corporate Governance
” contained in the proxy statement for our
2014
annual meeting of stockholders.
|
Item 14.
|
Principal Accountant Fees and Services
|
The response to this item is incorporated by reference from the discussion responsive thereto in the section entitled “
Proposal 2 — Ratification of the Selection of our Independent Registered Public Accounting Firm
” contained in the proxy statement for our
2014
annual meeting of stockholders.
73
|
Item 15.
|
Exhibits and Financial Statement Schedules
|
|
a.
|
(1)
Consolidated Financial Statements:
|
The following financial statements are filed as part of this report:
|
Financial Statements
|
|
Page Number
|
|
Consolidated Statements of Income
|
|
F-2
|
|
Consolidated Statements of Comprehensive Income
|
F-3
|
|
|
Consolidated Balance Sheets
|
|
F-4
|
|
Consolidated Statements of Cash Flows
|
|
F-5
|
|
Consolidated Statements of Equity
|
|
F-6
|
|
Notes to Consolidated Financial Statements
|
|
F-9
|
|
Report of Independent Registered Public Accounting Firm
|
|
F-69
|
(2)
Financial Statement Schedules
Schedules are omitted because they are not applicable, or are not required, or because the information is included in the consolidated financial statements and notes thereto.
(3)
Exhibits
The exhibits listed on the Exhibit Index beginning on page A-1, which is incorporated herein by reference, are filed or furnished as part of this report or are incorporated into this report by reference.
74
SIGNATURES
Pursuant to the requirements of Section 13 or 15(d) of the Securities Exchange Act of 1934, the registrant has duly caused this report to be signed on its behalf by the undersigned, thereunto duly authorized.
|
BIOGEN IDEC INC.
|
|
|
By:
|
/
S
/ G
EORGE
A. S
CANGOS
|
|
George A. Scangos
|
|
|
Chief Executive Officer
|
|
Date:
February 6, 2014
75
Pursuant to the requirements the Securities Exchange Act of 1934, this report has been signed below by the following persons on behalf of the registrant and in the capacities and on the dates indicated.
|
Name
|
|
Capacity
|
|
Date
|
|
/
S
/ G
EORGE
A. S
CANGOS
|
|
Director and Chief Executive Officer (principal executive officer)
|
|
February 6, 2014
|
|
George A. Scangos
|
||||
|
/
S
/ P
AUL
J. C
LANCY
|
|
Executive Vice President, Finance and Chief Financial Officer (principal financial officer)
|
|
February 6, 2014
|
|
Paul J. Clancy
|
||||
|
/
S
/ G
REGORY
F. C
OVINO
|
Vice President, Finance, Chief Accounting Officer (principal accounting officer)
|
February 6, 2014
|
||
|
Gregory F. Covino
|
||||
|
/
S
/ W
ILLIAM
D. Y
OUNG
|
|
Director and Chairman of the Board of Directors
|
|
February 6, 2014
|
|
William D. Young
|
||||
|
/
S
/
A
LEXANDER
J
.
D
ENNER
|
|
Director
|
|
February 6, 2014
|
|
Alexander J. Denner
|
||||
|
/
S
/ C
AROLINE
D. D
ORSA
|
|
Director
|
|
February 6, 2014
|
|
Caroline D. Dorsa
|
||||
|
/
S
/ N
ANCY
L. L
EAMING
|
|
Director
|
|
February 6, 2014
|
|
Nancy L. Leaming
|
||||
|
/
S
/ R
ICHARD
C
.
M
ULLIGAN
|
|
Director
|
|
February 6, 2014
|
|
Richard C. Mulligan
|
||||
|
/
S
/ R
OBERT
W. P
ANGIA
|
|
Director
|
|
February 6, 2014
|
|
Robert W. Pangia
|
||||
|
/
S
/ S
TELIOS
P
APADOPOULOS
|
|
Director
|
|
February 6, 2014
|
|
Stelios Papadopoulos
|
||||
|
/
S
/ B
RIAN
S. P
OSNER
|
Director
|
February 6, 2014
|
||
|
Brian S. Posner
|
||||
|
/
S
/ E
RIC
K. R
OWINSKY
|
Director
|
February 6, 2014
|
||
|
Eric K. Rowinsky
|
||||
|
/
S
/ L
YNN
S
CHENK
|
Director
|
February 6, 2014
|
||
|
Lynn Schenk
|
||||
|
/
S
/ S
TEPHEN
A. S
HERWIN
|
Director
|
February 6, 2014
|
||
|
Stephen A. Sherwin
|
||||
76
BIOGEN IDEC INC. AND SUBSIDIARIES
CONSOLIDATED FINANCIAL STATEMENTS
|
|
|
Page Number
|
|
Consolidated Statements of Income
|
|
F-2
|
|
Consolidated Statements of Comprehensive Income
|
F-3
|
|
|
Consolidated Balance Sheets
|
|
F-4
|
|
Consolidated Statements of Cash Flows
|
|
F-5
|
|
Consolidated Statements of Equity
|
|
F-6
|
|
Notes to Consolidated Financial Statements
|
|
F-9
|
|
Report of Independent Registered Public Accounting Firm
|
|
F-69
|
F- 1
BIOGEN IDEC INC. AND SUBSIDIARIES
(In thousands, except per share amounts)
|
|
For the Years Ended December 31,
|
||||||||||
|
|
2013
|
2012
|
2011
|
||||||||
|
Revenues:
|
|||||||||||
|
Product, net
|
$
|
5,542,331
|
|
$
|
4,166,074
|
|
$
|
3,836,117
|
|
||
|
Unconsolidated joint business
|
1,126,017
|
|
1,137,923
|
|
996,597
|
|
|||||
|
Other
|
263,851
|
|
212,464
|
|
215,920
|
|
|||||
|
Total revenues
|
6,932,199
|
|
5,516,461
|
|
5,048,634
|
|
|||||
|
Cost and expenses:
|
|||||||||||
|
Cost of sales, excluding amortization of acquired intangible assets
|
857,726
|
|
545,494
|
|
466,780
|
|
|||||
|
Research and development
|
1,444,053
|
|
1,334,919
|
|
1,219,602
|
|
|||||
|
Selling, general and administrative
|
1,712,051
|
|
1,277,465
|
|
1,056,133
|
|
|||||
|
Amortization of acquired intangible assets
|
342,948
|
|
202,204
|
|
208,566
|
|
|||||
|
Collaboration profit sharing
|
85,357
|
|
317,895
|
|
317,771
|
|
|||||
|
(Gain) loss on fair value remeasurement of contingent consideration
|
(547
|
)
|
27,202
|
|
36,065
|
|
|||||
|
Restructuring charges
|
—
|
|
2,225
|
|
19,026
|
|
|||||
|
Total cost and expenses
|
4,441,588
|
|
3,707,404
|
|
3,323,943
|
|
|||||
|
Gain on sale of rights
|
24,898
|
|
46,792
|
|
—
|
|
|||||
|
Income from operations
|
2,515,509
|
|
1,855,849
|
|
1,724,691
|
|
|||||
|
Other income (expense), net
|
(34,930
|
)
|
(744
|
)
|
(13,477
|
)
|
|||||
|
Income before income tax expense and equity in loss of investee, net of tax
|
2,480,579
|
|
1,855,105
|
|
1,711,214
|
|
|||||
|
Income tax expense
|
601,014
|
|
470,554
|
|
444,528
|
|
|||||
|
Equity in loss of investee, net of tax
|
17,224
|
|
4,518
|
|
—
|
|
|||||
|
Net income
|
1,862,341
|
|
1,380,033
|
|
1,266,686
|
|
|||||
|
Net income attributable to noncontrolling interests, net of tax
|
—
|
|
—
|
|
32,258
|
|
|||||
|
Net income attributable to Biogen Idec Inc.
|
$
|
1,862,341
|
|
$
|
1,380,033
|
|
$
|
1,234,428
|
|
||
|
Net income per share:
|
|||||||||||
|
Basic earnings per share attributable to Biogen Idec Inc.
|
$
|
7.86
|
|
$
|
5.80
|
|
$
|
5.09
|
|
||
|
Diluted earnings per share attributable to Biogen Idec Inc.
|
$
|
7.81
|
|
$
|
5.76
|
|
$
|
5.04
|
|
||
|
Weighted-average shares used in calculating:
|
|||||||||||
|
Basic earnings per share attributable to Biogen Idec Inc.
|
236,919
|
|
237,938
|
|
242,395
|
|
|||||
|
Diluted earnings per share attributable to Biogen Idec Inc.
|
238,308
|
|
239,740
|
|
245,033
|
|
|||||
See accompanying notes to these consolidated financial statements.
F- 2
BIOGEN IDEC INC. AND SUBSIDIARIES
CONSOLIDATED STATEMENTS OF COMPREHENSIVE INCOME
(In thousands)
|
|
For the Years Ended December 31,
|
||||||||||
|
|
2013
|
2012
|
2011
|
||||||||
|
Net income attributable to Biogen Idec Inc.
|
$
|
1,862,341
|
|
$
|
1,380,033
|
|
$
|
1,234,428
|
|
||
|
Other comprehensive income:
|
|||||||||||
|
Unrealized gains (losses) on securities available for sale:
|
|||||||||||
|
Unrealized gains (losses) recognized during the period, net of tax of $6,394, $2,940 and $133
|
11,770
|
|
5,080
|
|
(224
|
)
|
|||||
|
Less: reclassification adjustment for (gains) losses included in net income, net of tax of $5,576, $486 and $7,155
|
(10,355
|
)
|
(903
|
)
|
(12,184
|
)
|
|||||
|
Unrealized gains (losses) on securities available for sale, net of tax of $818, $2,454 and $7,288
|
1,415
|
|
4,177
|
|
(12,408
|
)
|
|||||
|
Unrealized gains (losses) on foreign currency forward contracts:
|
|||||||||||
|
Unrealized gains (losses) recognized during the period, net of tax of $1,721, $1,396 and $3,647
|
(26,679
|
)
|
(11,808
|
)
|
32,830
|
|
|||||
|
Less: reclassification adjustment for (gains) losses included in net income, net of tax of $533, $3,360 and $1,268
|
13,716
|
|
(31,713
|
)
|
9,767
|
|
|||||
|
Unrealized gains (losses) on foreign currency forward contracts, net of tax of $1,187, $4,756 and $4,915
|
(12,963
|
)
|
(43,521
|
)
|
42,597
|
|
|||||
|
Unrealized gains (losses) on pension benefit obligation
|
2,096
|
|
(12,656
|
)
|
(9,280
|
)
|
|||||
|
Currency translation adjustment
|
37,012
|
|
23,230
|
|
(25,834
|
)
|
|||||
|
Total other comprehensive income (loss), net of tax
|
27,560
|
|
(28,770
|
)
|
(4,925
|
)
|
|||||
|
Comprehensive income attributable to Biogen Idec Inc.
|
1,889,901
|
|
1,351,263
|
|
1,229,503
|
|
|||||
|
Comprehensive income attributable to noncontrolling interests, net of tax
|
—
|
|
65
|
|
37,161
|
|
|||||
|
Comprehensive income
|
$
|
1,889,901
|
|
$
|
1,351,328
|
|
$
|
1,266,664
|
|
||
See accompanying notes to these consolidated financial statements.
F- 3
BIOGEN IDEC INC. AND SUBSIDIARIES
(In thousands, except per share amounts)
|
|
As of December 31,
|
||||||
|
|
2013
|
2012
|
|||||
|
ASSETS
|
|||||||
|
Current assets:
|
|||||||
|
Cash and cash equivalents
|
$
|
602,562
|
|
$
|
570,721
|
|
|
|
Marketable securities
|
620,167
|
|
1,134,989
|
|
|||
|
Accounts receivable, net
|
824,406
|
|
686,848
|
|
|||
|
Due from unconsolidated joint business, net
|
252,662
|
|
268,395
|
|
|||
|
Inventory
|
659,003
|
|
447,373
|
|
|||
|
Other current assets
|
226,134
|
|
136,011
|
|
|||
|
Total current assets
|
3,184,934
|
|
3,244,337
|
|
|||
|
Marketable securities
|
625,772
|
|
2,036,658
|
|
|||
|
Property, plant and equipment, net
|
1,750,710
|
|
1,742,226
|
|
|||
|
Intangible assets, net
|
4,474,653
|
|
1,631,547
|
|
|||
|
Goodwill
|
1,232,916
|
|
1,201,296
|
|
|||
|
Investments and other assets
|
594,350
|
|
274,054
|
|
|||
|
Total assets
|
$
|
11,863,335
|
|
$
|
10,130,118
|
|
|
|
LIABILITIES AND EQUITY
|
|||||||
|
Current liabilities:
|
|||||||
|
Current portion of notes payable and line of credit
|
$
|
3,494
|
|
$
|
453,379
|
|
|
|
Taxes payable
|
179,685
|
|
20,066
|
|
|||
|
Accounts payable
|
219,913
|
|
203,999
|
|
|||
|
Accrued expenses and other
|
1,355,187
|
|
979,945
|
|
|||
|
Total current liabilities
|
1,758,279
|
|
1,657,389
|
|
|||
|
Notes payable and other financing arrangements
|
592,433
|
|
687,396
|
|
|||
|
Long-term deferred tax liability
|
232,554
|
|
217,272
|
|
|||
|
Other long-term liabilities
|
659,231
|
|
604,266
|
|
|||
|
Total liabilities
|
3,242,497
|
|
3,166,323
|
|
|||
|
Commitments and contingencies
|
|
|
|
|
|||
|
Equity:
|
|||||||
|
Biogen Idec Inc. shareholders’ equity
|
|||||||
|
Preferred stock, par value $0.001 per share
|
—
|
|
—
|
|
|||
|
Common stock, par value $0.0005 per share
|
128
|
|
127
|
|
|||
|
Additional paid-in capital
|
4,023,651
|
|
3,854,525
|
|
|||
|
Accumulated other comprehensive loss
|
(27,745
|
)
|
(55,305
|
)
|
|||
|
Retained earnings
|
6,349,135
|
|
4,486,794
|
|
|||
|
Treasury stock, at cost; 19,641 shares and 17,655 shares, respectively
|
(1,724,927
|
)
|
(1,324,618
|
)
|
|||
|
Total Biogen Idec Inc. shareholders’ equity
|
8,620,242
|
|
6,961,523
|
|
|||
|
Noncontrolling interests
|
596
|
|
2,272
|
|
|||
|
Total equity
|
8,620,838
|
|
6,963,795
|
|
|||
|
Total liabilities and equity
|
$
|
11,863,335
|
|
$
|
10,130,118
|
|
|
See accompanying notes to these consolidated financial statements.
F- 4
BIOGEN IDEC INC. AND SUBSIDIARIES
(In thousands)
|
|
For the Years Ended December 31,
|
||||||||||
|
|
2013
|
2012
|
2011
|
||||||||
|
Cash flows from operating activities:
|
|||||||||||
|
Net income
|
$
|
1,862,341
|
|
$
|
1,380,033
|
|
$
|
1,266,686
|
|
||
|
Adjustments to reconcile net income to net cash flows from operating activities:
|
|||||||||||
|
Depreciation and amortization of property, plant and equipment, and intangible assets
|
531,740
|
|
365,648
|
|
358,933
|
|
|||||
|
Share-based compensation
|
136,293
|
|
118,566
|
|
113,005
|
|
|||||
|
Deferred income taxes
|
(245,077
|
)
|
(116,900
|
)
|
153,576
|
|
|||||
|
Other
|
(27,612
|
)
|
28,822
|
|
20,153
|
|
|||||
|
Changes in operating assets and liabilities, net:
|
|||||||||||
|
Accounts receivable
|
(126,753
|
)
|
3,571
|
|
(73,374
|
)
|
|||||
|
Inventory
|
(243,960
|
)
|
(140,309
|
)
|
(59,219
|
)
|
|||||
|
Other assets
|
(160,188
|
)
|
(27,347
|
)
|
(43,241
|
)
|
|||||
|
Accrued expenses and other current liabilities
|
284,049
|
|
273,372
|
|
33,722
|
|
|||||
|
Other liabilities and taxes payable
|
318,512
|
|
34,112
|
|
(36,235
|
)
|
|||||
|
Other
|
15,733
|
|
(39,671
|
)
|
(6,265
|
)
|
|||||
|
Net cash flows provided by operating activities
|
2,345,078
|
|
1,879,897
|
|
1,727,741
|
|
|||||
|
Cash flows from investing activities:
|
|||||||||||
|
Proceeds from sales and maturities of marketable securities
|
5,190,052
|
|
2,749,558
|
|
2,276,720
|
|
|||||
|
Purchases of marketable securities
|
(3,278,091
|
)
|
(3,334,434
|
)
|
(3,696,995
|
)
|
|||||
|
Acquisition of TYSABRI rights
|
(3,262,719
|
)
|
—
|
|
—
|
|
|||||
|
Acquisitions of businesses and variable interest entities, net of cash acquired
|
(15,000
|
)
|
(72,401
|
)
|
(5,000
|
)
|
|||||
|
Purchases of property, plant and equipment
|
(246,281
|
)
|
(254,548
|
)
|
(208,020
|
)
|
|||||
|
Other
|
7,371
|
|
(38,517
|
)
|
(16,999
|
)
|
|||||
|
Net cash flows used in investing activities
|
(1,604,668
|
)
|
(950,342
|
)
|
(1,650,294
|
)
|
|||||
|
Cash flows from financing activities:
|
|||||||||||
|
Purchase of treasury stock
|
(400,309
|
)
|
(984,715
|
)
|
(497,975
|
)
|
|||||
|
Proceeds from issuance of stock for share-based compensation arrangements
|
66,770
|
|
67,493
|
|
314,650
|
|
|||||
|
Excess tax benefit from share-based compensation
|
73,467
|
|
54,738
|
|
50,586
|
|
|||||
|
Acquisition of noncontrolling interests
|
—
|
|
—
|
|
(148,264
|
)
|
|||||
|
Repayments of borrowings
|
(452,340
|
)
|
(2,428
|
)
|
(11,459
|
)
|
|||||
|
Other
|
(4,116
|
)
|
(12,566
|
)
|
(27,400
|
)
|
|||||
|
Net cash flows used in financing activities
|
(716,528
|
)
|
(877,478
|
)
|
(319,862
|
)
|
|||||
|
Net increase (decrease) in cash and cash equivalents
|
23,882
|
|
52,077
|
|
(242,415
|
)
|
|||||
|
Effect of exchange rate changes on cash and cash equivalents
|
7,959
|
|
4,102
|
|
(2,641
|
)
|
|||||
|
Cash and cash equivalents, beginning of the year
|
570,721
|
|
514,542
|
|
759,598
|
|
|||||
|
Cash and cash equivalents, end of the year
|
$
|
602,562
|
|
$
|
570,721
|
|
$
|
514,542
|
|
||
See accompanying notes to these consolidated financial statements.
F- 5
BIOGEN IDEC INC. AND SUBSIDIARIES
CONSOLIDATED STATEMENTS OF EQUITY
(In thousands)
|
|
Preferred stock
|
Common stock
|
Additional
paid-in
capital
|
Accumulated
other
comprehensive
loss
|
Retained
earnings
|
Treasury stock
|
Total
Biogen Idec Inc.
shareholders’
equity
|
Noncontrolling
interests
|
Total
equity
|
|||||||||||||||||||||||||||||||||||
|
|
Shares
|
Amount
|
Shares
|
Amount
|
Shares
|
Amount
|
||||||||||||||||||||||||||||||||||||||
|
Balance, December 31, 2012
|
—
|
|
$
|
—
|
|
254,237
|
|
$
|
127
|
|
$
|
3,854,525
|
|
$
|
(55,305
|
)
|
$
|
4,486,794
|
|
(17,655
|
)
|
$
|
(1,324,618
|
)
|
$
|
6,961,523
|
|
$
|
2,272
|
|
$
|
6,963,795
|
|
|||||||||||
|
Net income
|
1,862,341
|
|
1,862,341
|
|
—
|
|
1,862,341
|
|
||||||||||||||||||||||||||||||||||||
|
Other comprehensive income, net of tax
|
27,560
|
|
27,560
|
|
—
|
|
27,560
|
|
||||||||||||||||||||||||||||||||||||
|
Deconsolidation of noncontrolling interests
|
—
|
|
(1,676
|
)
|
(1,676
|
)
|
||||||||||||||||||||||||||||||||||||||
|
Repurchase of common stock for Treasury pursuant to the 2011 share repurchase plan, at cost
|
(1,986
|
)
|
(400,309
|
)
|
(400,309
|
)
|
(400,309
|
)
|
||||||||||||||||||||||||||||||||||||
|
Issuance of common stock under stock option and stock purchase plans
|
767
|
|
—
|
|
66,770
|
|
66,770
|
|
66,770
|
|
||||||||||||||||||||||||||||||||||
|
Issuance of common stock under stock award plan
|
969
|
|
1
|
|
(89,747
|
)
|
(89,746
|
)
|
(89,746
|
)
|
||||||||||||||||||||||||||||||||||
|
Compensation expense related to share-based payments
|
146,210
|
|
146,210
|
|
146,210
|
|
||||||||||||||||||||||||||||||||||||||
|
Tax benefit from share-based payments
|
45,893
|
|
45,893
|
|
45,893
|
|
||||||||||||||||||||||||||||||||||||||
|
Balance, December 31, 2013
|
—
|
|
$
|
—
|
|
255,973
|
|
$
|
128
|
|
$
|
4,023,651
|
|
$
|
(27,745
|
)
|
$
|
6,349,135
|
|
(19,641
|
)
|
$
|
(1,724,927
|
)
|
$
|
8,620,242
|
|
$
|
596
|
|
$
|
8,620,838
|
|
|||||||||||
See accompanying notes to these consolidated financial statements.
F- 6
BIOGEN IDEC INC. AND SUBSIDIARIES
CONSOLIDATED STATEMENTS OF EQUITY - (Continued)
(In thousands)
|
|
Preferred stock
|
Common stock
|
Additional
paid-in
capital
|
Accumulated
other
comprehensive
loss
|
Retained
earnings
|
Treasury stock
|
Total
Biogen Idec Inc.
shareholders’
equity
|
Noncontrolling
interests
|
Total
equity
|
|||||||||||||||||||||||||||||||||||
|
Shares
|
Amount
|
Shares
|
Amount
|
Shares
|
Amount
|
|||||||||||||||||||||||||||||||||||||||
|
Balance, December 31, 2011
|
—
|
|
$
|
—
|
|
255,633
|
|
$
|
128
|
|
$
|
4,185,048
|
|
$
|
(26,535
|
)
|
$
|
3,106,761
|
|
(13,518
|
)
|
$
|
(839,903
|
)
|
$
|
6,425,499
|
|
$
|
1,488
|
|
$
|
6,426,987
|
|
|||||||||||
|
Net income
|
1,380,033
|
|
1,380,033
|
|
—
|
|
1,380,033
|
|
||||||||||||||||||||||||||||||||||||
|
Other comprehensive income, net of tax
|
(28,770
|
)
|
(28,770
|
)
|
65
|
|
(28,705
|
)
|
||||||||||||||||||||||||||||||||||||
|
Distributions to noncontrolling interests
|
—
|
|
1,199
|
|
1,199
|
|
||||||||||||||||||||||||||||||||||||||
|
Capital contributions from noncontrolling interests
|
—
|
|
73
|
|
73
|
|
||||||||||||||||||||||||||||||||||||||
|
Deconsolidation of noncontrolling interests
|
(3
|
)
|
(3
|
)
|
(553
|
)
|
(556
|
)
|
||||||||||||||||||||||||||||||||||||
|
Repurchase of common stock for Treasury pursuant to the 2011 share repurchase plan, at cost
|
(7,811
|
)
|
(984,715
|
)
|
(984,715
|
)
|
(984,715
|
)
|
||||||||||||||||||||||||||||||||||||
|
Retirement of common stock pursuant to the 2011 share repurchase plan, at cost
|
(3,674
|
)
|
(2
|
)
|
(499,998
|
)
|
3,674
|
|
500,000
|
|
—
|
|
—
|
|
||||||||||||||||||||||||||||||
|
Issuance of common stock under stock option and stock purchase plans
|
1,039
|
|
—
|
|
67,493
|
|
67,493
|
|
67,493
|
|
||||||||||||||||||||||||||||||||||
|
Issuance of common stock under stock award plan
|
1,239
|
|
1
|
|
(71,358
|
)
|
(71,357
|
)
|
(71,357
|
)
|
||||||||||||||||||||||||||||||||||
|
Compensation expense related to share-based payments
|
123,956
|
|
123,956
|
|
123,956
|
|
||||||||||||||||||||||||||||||||||||||
|
Tax benefit from share-based payments
|
49,387
|
|
49,387
|
|
49,387
|
|
||||||||||||||||||||||||||||||||||||||
|
Balance, December 31, 2012
|
—
|
|
$
|
—
|
|
254,237
|
|
$
|
127
|
|
$
|
3,854,525
|
|
$
|
(55,305
|
)
|
$
|
4,486,794
|
|
(17,655
|
)
|
$
|
(1,324,618
|
)
|
$
|
6,961,523
|
|
$
|
2,272
|
|
$
|
6,963,795
|
|
|||||||||||
See accompanying notes to these consolidated financial statements.
F- 7
BIOGEN IDEC INC. AND SUBSIDIARIES
CONSOLIDATED STATEMENTS OF EQUITY - (Continued)
(In thousands)
|
Preferred stock
|
Common stock
|
Additional
paid-in
capital
|
Accumulated
other
comprehensive
loss
|
Retained
earnings
|
Treasury stock
|
Total
Biogen Idec Inc.
shareholders’
equity
|
Noncontrolling
interests
|
Total
equity
|
||||||||||||||||||||||||||||||||||||
|
Shares
|
Amount
|
Shares
|
Amount
|
Shares
|
Amount
|
|||||||||||||||||||||||||||||||||||||||
|
Balance, December 31, 2010
|
8
|
|
$
|
—
|
|
248,200
|
|
$
|
124
|
|
$
|
3,895,103
|
|
$
|
(21,610
|
)
|
$
|
1,872,481
|
|
(7,662
|
)
|
$
|
(349,592
|
)
|
$
|
5,396,506
|
|
$
|
52,937
|
|
$
|
5,449,443
|
|
|||||||||||
|
Net income
|
1,234,428
|
|
1,234,428
|
|
32,258
|
|
1,266,686
|
|
||||||||||||||||||||||||||||||||||||
|
Other comprehensive income, net of tax
|
(4,925
|
)
|
(4,925
|
)
|
4,903
|
|
(22
|
)
|
||||||||||||||||||||||||||||||||||||
|
Distributions to noncontrolling interests
|
(148
|
)
|
(148
|
)
|
(26,914
|
)
|
(27,062
|
)
|
||||||||||||||||||||||||||||||||||||
|
Acquisitions of noncontrolling interests
|
(125,641
|
)
|
(125,641
|
)
|
(61,696
|
)
|
(187,337
|
)
|
||||||||||||||||||||||||||||||||||||
|
Repurchase of common stock for Treasury pursuant to the 2011 share repurchase plan, at cost
|
(6,018
|
)
|
(497,975
|
)
|
(497,975
|
)
|
(497,975
|
)
|
||||||||||||||||||||||||||||||||||||
|
Issuance of common stock under stock option and stock purchase plans
|
5,458
|
|
3
|
|
306,982
|
|
162
|
|
7,664
|
|
314,649
|
|
314,649
|
|
||||||||||||||||||||||||||||||
|
Issuance of common stock under stock award plan
|
1,482
|
|
1
|
|
(50,954
|
)
|
(50,953
|
)
|
(50,953
|
)
|
||||||||||||||||||||||||||||||||||
|
Conversion of preferred stock
|
(8
|
)
|
493
|
|
—
|
|
—
|
|
—
|
|
—
|
|
||||||||||||||||||||||||||||||||
|
Compensation expense related to share-based payments
|
117,347
|
|
117,347
|
|
117,347
|
|
||||||||||||||||||||||||||||||||||||||
|
Recharacterization of share-based awards from equity to cash-settled due to restructuring
|
(8,172
|
)
|
(8,172
|
)
|
(8,172
|
)
|
||||||||||||||||||||||||||||||||||||||
|
Tax benefit from share-based payments
|
50,383
|
|
50,383
|
|
50,383
|
|
||||||||||||||||||||||||||||||||||||||
|
Balance, December 31, 2011
|
—
|
|
$
|
—
|
|
255,633
|
|
$
|
128
|
|
$
|
4,185,048
|
|
$
|
(26,535
|
)
|
$
|
3,106,761
|
|
(13,518
|
)
|
$
|
(839,903
|
)
|
$
|
6,425,499
|
|
$
|
1,488
|
|
$
|
6,426,987
|
|
|||||||||||
See accompanying notes to these consolidated financial statements.
F- 8
|
1.
|
Summary of Significant Accounting Policies
|
Business Overview
Biogen Idec is a global biotechnology company focused on discovering, developing, manufacturing and marketing therapies for the treatment of multiple sclerosis (MS) and other autoimmune disorders, neurodegenerative diseases and hemophilia. We also collaborate on the development and commercialization of RITUXAN for the treatment of non-Hodgkin's lymphoma, chronic lymphocytic leukemia and other conditions and share profits and losses for GAZYVA for the treatment of chronic lymphocytic leukemia.
Consolidation
Our consolidated financial statements reflect our financial statements, those of our wholly-owned subsidiaries and those of certain variable interest entities where we are the primary beneficiary. For consolidated entities where we own or are exposed to less than
100%
of the economics, we record net income (loss) attributable to noncontrolling interests in our consolidated statements of income equal to the percentage of the economic or ownership interest retained in such entities by the respective noncontrolling parties. Intercompany balances and transactions are eliminated in consolidation.
In determining whether we are the primary beneficiary of an entity and therefore required to consolidate, we apply a qualitative approach that determines whether we have both (1) the power to direct the economically significant activities of the entity and (2) the obligation to absorb losses of, or the right to receive benefits from, the entity that could potentially be significant to that entity. These considerations impact the way we account for our existing collaborative relationships and other arrangements. We continuously assess whether we are the primary beneficiary of a variable interest entity as changes to existing relationships or future transactions may result in us consolidating or deconsolidating our partner(s) to collaborations and other arrangements.
Use of Estimates
The preparation of our consolidated financial statements requires us to make estimates, judgments, and assumptions that may affect the reported amounts of assets, liabilities, equity, revenues and expenses, and related disclosure of contingent assets and liabilities. On an on-going basis, we evaluate our estimates and judgments and methodologies. We base our estimates on historical experience and on various other assumptions that are believed to be reasonable, the results of which form the basis for making judgments about the carrying values of assets and liabilities. Actual results may differ from these estimates under different assumptions or conditions.
Revenue Recognition
We recognize revenue when all of the following criteria are met: persuasive evidence of an arrangement exists; delivery has occurred or services have been rendered; our price to the customer is fixed or determinable; and collectability is reasonably assured.
Product Revenues
Revenues from product sales are recognized when title and risk of loss have passed to the customer, which is typically upon delivery. Sales of TYSABRI in the U.S. were previously recognized on the “sell-through” model, upon shipment of the product by Elan to its third party distributor rather than upon shipment to Elan. As a result of our acquisition of TYSABRI rights from Elan on April 2, 2013, we began recognizing sales of TYSABRI in the U.S. when title and risk of loss passed to the same third party distributor. Product revenues are recorded net of applicable reserves for discounts and allowances.
Reserves for Discounts and Allowances
We establish reserves for trade term discounts, wholesaler incentives, Medicaid rebates, Veterans Administration (VA) and Public Health Service (PHS) discounts, managed care rebates, product returns and other governmental rebates or applicable allowances, including those associated with the implementation of pricing actions in certain of the international markets in which we operate. Reserves established for these discounts and allowances are classified as reductions of accounts receivable (if the amount is payable to our direct customer) or a liability (if the amount is payable to a party other than our customer). These reserves are based on estimates of the amounts earned or to be claimed on the related sales. Our estimates take into consideration our historical experience, current contractual and statutory requirements, specific known market events and trends, industry date and forecasted customer buying and payment patterns. Actual amounts may ultimately differ from our estimates. If actual results vary, we adjust these estimates, which could have an effect on earnings in the period of adjustment.
Product revenue reserves are categorized as follows: discounts, contractual adjustments and returns.
F- 9
BIOGEN IDEC INC. AND SUBSIDIARIES
NOTES TO CONSOLIDATED FINANCIAL STATEMENTS — (Continued)
Discounts include trade term discounts and wholesaler incentives. Trade term discounts and wholesaler incentives primarily relate to estimated obligations for credits to be granted to wholesalers for remitting payment on their purchases within established incentive periods and credits to be granted to wholesalers for compliance with various contractually-defined inventory management practices, respectively. We determine these reserves based on our experience, including the timing of customer payments.
Contractual adjustments primarily relate to Medicaid and managed care rebates, VA and PHS discounts and other governmental rebates or applicable allowances.
|
•
|
Medicaid rebates relate to our estimated obligations to states under established reimbursement arrangements. Rebate accruals are recorded in the same period the related revenue is recognized resulting in a reduction of product revenue and the establishment of a liability which is included in other current liabilities. Our liability for Medicaid rebates consists of estimates for claims that a state will make for the current quarter, claims for prior quarters that have been estimated for which an invoice has not been received, invoices received for claims from the prior quarters that have not been paid, and an estimate of potential claims that will be made for inventory that exists in the distribution channel at period end.
|
|
•
|
Governmental rebates or chargebacks, including VA and PHS discounts, represent our estimated obligations resulting from contractual commitments to sell products to qualified healthcare providers at prices lower than the list prices we charge to wholesalers which provide those products. The wholesaler charges us for the difference between what the wholesaler pays for the products and the ultimate selling price to the qualified healthcare providers. Rebate and chargeback reserves are established in the same period as the related revenue is recognized resulting in a reduction in product revenue and accounts receivable. Chargeback amounts are generally determined at the time of resale to the qualified healthcare provider from the wholesaler, and we generally issue credits for such amounts within a few weeks of the wholesaler notifying us about the resale. Our reserves for VA, PHS and chargebacks consists of amounts that we expect to issue for inventory that exists at the wholesalers that we expect will be sold to qualified healthcare providers and chargebacks that wholesalers have claimed for which we have not issued a credit.
|
|
•
|
Managed care rebates represent our estimated obligations to third parties, primarily pharmacy benefit managers. Rebate accruals are recorded in the same period the related revenue is recognized resulting in a reduction of product revenue and the establishment of a liability which is included in accrued expenses and other current liabilities. These rebates result from performance-based goals that are primarily based on attaining contractually specified sales volumes and growth and price increase limit allowances (price protection). The calculation of the accrual for these rebates is based on an estimate of the customer’s buying patterns and the resulting applicable contractual rebate rate(s) to be earned over a contractual period.
|
|
•
|
Other governmental rebates or applicable allowances primarily relate to mandatory rebates and discounts in markets where government-sponsored healthcare systems are the primary payors for healthcare.
|
Product returns are established for returns expected to be made by wholesalers and are recorded in the period the related revenue is recognized, resulting in a reduction to product sales. In accordance with contractual terms, wholesalers are permitted to return product for reasons such as damaged or expired product. The majority of wholesaler returns are due to product expiration. Expired product return reserves are estimated through a comparison of historical return data to their related sales on a production lot basis. Historical rates of return are determined for each product and are adjusted for known or expected changes in the marketplace specific to each product.
In addition to the discounts, rebates and product returns described above and classified as a reduction of revenue, we also maintain certain customer service contracts with distributors and other customers in the distribution channel that provide us with inventory management, data and distribution services. To the extent we can demonstrate a separable benefit and fair value for these services, we classify these payments within selling, general and administrative expenses.
In countries where we have experienced a pattern of payments extending beyond our contractual payment term and we expect to collect receivables greater than one year from the time of sale, we have discounted our receivables and reduced related revenues over the period of time that we estimate those amounts will be paid using the country’s market-based borrowing rate for such period. The related receivables are classified at the time of sale as non-current assets. We accrete interest income on these receivables, which is recognized as a component of other income (expense), net within our consolidated statement of income.
F- 10
BIOGEN IDEC INC. AND SUBSIDIARIES
NOTES TO CONSOLIDATED FINANCIAL STATEMENTS — (Continued)
We also distribute no-charge product to qualifying patients under our patient assistance and patient replacement goods program. This program is administered through one of our distribution partners, which ships product for qualifying patients from its own inventory received from us. Gross revenue and the related reserves are not recorded on product shipped under this program and cost of sales is recorded when the product is shipped.
Revenues from Unconsolidated Joint Business
We collaborate with Genentech on the development and commercialization of RITUXAN. In addition, in the U.S. we share operating profits and losses relating to GAZYVA with Genentech. The Roche Group and its sub-licensees maintain sole responsibility for the development, manufacturing and commercialization of GAZYVA in the U.S. For additional information related to our collaboration with Genentech, please read Note 20,
Collaborative and Other Relationships
, to these consolidated financial statements. Revenues from unconsolidated joint business consists of (1) our share of pre-tax profits in the U.S. for RITUXAN and GAZYVA; (2) reimbursement of our selling and development expenses in the U.S. for RITUXAN; and (3) revenue on sales in the rest of world for RITUXAN, which consist of our share of pre-tax co-promotion profits in Canada and royalty revenue on sales outside the U.S. and Canada by F. Hoffmann-La Roche Ltd. (Roche) and its sublicensees. Pre-tax co-promotion profits on RITUXAN are calculated and paid to us by Genentech in the U.S. and by Roche in Canada. Pre-tax co-promotion profits consist of U.S. and Canadian net sales to third-party customers less the cost to manufacture, third-party royalty expenses, distribution, selling, and marketing expenses, and joint development expenses incurred by Genentech, Roche and us. We record our share of the pretax co-promotion profits on RITUXAN in Canada and royalty revenues on sales outside the U.S. on a cash basis as we do not have access to the information or ability to estimate these profits or royalty revenue in the period incurred. Additionally, our share of the pre-tax profits on RITUXAN and GAZYVA in the U.S. includes estimates made by Genentech and those estimates are subject to change. Actual results may ultimately differ from our estimates.
Royalty Revenues
We receive royalty revenues on sales by our licensees of other products covered under patents that we own. We do not have future performance obligations under these license arrangements. We record these revenues based on estimates of the sales that occurred during the relevant period. The relevant period estimates of sales are based on interim data provided by licensees and analysis of historical royalties that have been paid to us, adjusted for any changes in facts and circumstances, as appropriate. Differences between actual and estimated royalty revenues are adjusted for in the period in which they become known, typically the following quarter. Historically, adjustments have not been material when compared to actual amounts paid by licensees. If we are unable to reasonably estimate royalty revenue or do not have access to the information, then we record royalty revenues on a cash basis.
Multiple-Element Revenue Arrangements
We may enter into transactions that involve the sale of products and related services under multiple element arrangements. In accounting for these transactions, we allocate revenue to the various elements based on their selling price. The selling price of a revenue generating element can be based on current selling prices offered by us or another party for current products or management’s best estimate of a selling price. Revenue allocated to an individual element is recognized when all other revenue recognition criteria are met for that element.
Fair Value Measurements
We have certain financial assets and liabilities recorded at fair value which have been classified as Level 1, 2 or 3 within the fair value hierarchy as described in the accounting standards for fair value measurements.
|
•
|
Level 1
— Fair values are determined utilizing quoted prices (unadjusted) in active markets for identical assets or liabilities that we have the ability to access;
|
|
•
|
Level 2
— Fair values are determined by utilizing quoted prices for identical or similar assets and liabilities in active markets or other market observable inputs such as interest rates, yield curves and foreign currency spot rates; and
|
|
•
|
Level 3
— Prices or valuations that require inputs that are both significant to the fair value measurement and unobservable.
|
F- 11
BIOGEN IDEC INC. AND SUBSIDIARIES
NOTES TO CONSOLIDATED FINANCIAL STATEMENTS — (Continued)
The majority of our financial assets have been classified as Level 2. Our financial assets (which include our cash equivalents, derivative contracts, marketable debt securities, and plan assets for deferred compensation) have been initially valued at the transaction price and subsequently valued, at the end of each reporting period, utilizing third party pricing services or other market observable data. The pricing services utilize industry standard valuation models, including both income and market based approaches and observable market inputs to determine value. These observable market inputs include reportable trades, benchmark yields, credit spreads, broker/dealer quotes, bids, offers, current spot rates and other industry and economic events.
We validate the prices provided by our third party pricing services by reviewing their pricing methods and matrices, obtaining market values from other pricing sources and analyzing pricing data in certain instances. After completing our validation procedures, we did not adjust or override any fair value measurements provided by our pricing services as of
December 31, 2013
and
2012
, respectively.
We also maintain venture capital investments classified as Level 3 whose fair value is initially measured at transaction prices and subsequently valued using the pricing of recent financing or by reviewing the underlying economic fundamentals and liquidation value of the companies. These investments include investments in certain biotechnology oriented venture capital funds which primarily invest in small privately-owned, venture-backed biotechnology companies. The fair value of our investments in these venture capital funds has been estimated using the net asset value of the fund. Gains and losses (realized and unrealized) included in earnings for the period are reported in other income (expense), net. The investments cannot be redeemed within the funds. Distributions from each fund will be received as the underlying investments of the fund are liquidated. We expect to liquidate a portion of these funds over the next three to five years. We apply judgments and estimates when we validate the prices provided by third parties. While we believe the valuation methodologies are appropriate, the use of valuation methodologies is highly judgmental and changes in methodologies can have a material impact on our results of operations.
Other
The carrying amounts reflected in the consolidated balance sheets for cash equivalents, current accounts receivable, due from unconsolidated joint business, other current assets, accounts payable, and accrued expenses and other, approximate fair value due to their short-term maturities.
Cash and Cash Equivalents
We consider only those investments which are highly liquid, readily convertible to cash and that mature within three months from date of purchase to be cash equivalents. As of
December 31, 2013
and
2012
, cash equivalents were comprised of money market funds and commercial paper, overnight reverse repurchase agreements, and other debt securities with maturities less than 90 days from the date of purchase.
Accounts Receivable
The majority of our accounts receivable arise from product sales and primarily represent amounts due from our wholesale distributors, public hospitals and other government entities. We monitor the financial performance and credit worthiness of our large customers so that we can properly assess and respond to changes in their credit profile. We provide reserves against trade receivables for estimated losses that may result from a customer’s inability to pay. Amounts determined to be uncollectible are charged or written-off against the reserve.
In countries where we have experienced a pattern of payments extending beyond our contractual payment term and we expect to collect receivables greater than one year from the time of sale, we have discounted our receivables and reduced related revenues over the period of time that we estimate those amounts will be paid using the country’s market-based borrowing rate for such period. The related receivables are classified at the time of sale as non-current assets. We accrete interest income on these receivables, which is recognized as a component of other income (expense), net within our consolidated statement of income.
F- 12
BIOGEN IDEC INC. AND SUBSIDIARIES
NOTES TO CONSOLIDATED FINANCIAL STATEMENTS — (Continued)
Concentration of Credit Risk
Financial instruments that potentially subject us to concentrations of credit risk include cash and cash equivalents, investments, derivatives, and accounts receivable. We attempt to minimize the risks related to cash and cash equivalents and investments by investing in a broad and diverse range of financial instruments as previously defined by us. We have established guidelines related to credit ratings and maturities intended to safeguard principal balances and maintain liquidity. Our investment portfolio is maintained in accordance with our investment policy, which defines allowable investments, specifies credit quality standards and limits the credit exposure of any single issuer. We minimize credit risk resulting from derivative instruments by choosing only highly rated financial institutions as counterparties.
Concentrations of credit risk with respect to receivables, which are typically unsecured, are limited due to the wide variety of customers and markets using our products, as well as their dispersion across many different geographic areas. The majority of our accounts receivable arise from product sales in the United States and Europe and have standard payment terms which generally require payment within
30 to 90 days
. We monitor the financial performance and credit worthiness of our large customers so that we can properly assess and respond to changes in their credit profile. We continue to monitor these conditions and assess their possible impact on our business. For additional information related to this concentration of credit risk, please read Note 4,
Accounts Receivable
to these consolidated financial statements.
As of
December 31, 2013
, two wholesale distributors individually accounted for approximately
34.5%
and
15.7%
of consolidated receivables, respectively, and as of
December 31, 2012
, one wholesale distributor accounted for approximately
14.5%
of consolidated receivables. The increase in our concentration of consolidated receivables balances during 2013 was due in part to our acquisition of TYSABRI rights from Elan, and our resulting assumption of the relationship with the one global distributor of that product.
Marketable Securities and Other Investments
Marketable Debt Securities
Available-for-sale debt securities are recorded at fair market value and unrealized gains and losses are included in accumulated other comprehensive income (loss) in equity, net of related tax effects, unless the security has experienced a credit loss, we have determined that we have the intent to sell the security or we have determined that it is more likely than not that we will have to sell the security before its expected recovery. Realized gains and losses are reported in other income (expense), net, on a specific identification basis.
Marketable Equity Securities
Our marketable equity securities represent investments in publicly traded equity securities and are included in investments and other assets within our consolidated balance sheet. When assessing whether a decline in the fair value of a marketable equity security is other-than-temporary, we consider the fair market value of the security, the duration of the security’s decline, and prospects for the underlying business, including favorable or adverse clinical trial results, new product initiatives and new collaborative agreements with the companies in which we have invested.
Non-Marketable Equity Securities
We also invest in equity securities of companies whose securities are not publicly traded and where fair value is not readily available. These investments are recorded using either the cost method or the equity method of accounting, depending on our ownership percentage and other factors that suggest we have significant influence. We monitor these investments to evaluate whether any decline in their value has occurred that would be other-than-temporary, based on the implied value of recent company financings, public market prices of comparable companies, and general market conditions and are included in investments and other assets within our consolidated balance sheet.
Evaluating Investments for Other-than-Temporary Impairments
We conduct periodic reviews to identify and evaluate each investment that has an unrealized loss, in accordance with the meaning of other-than-temporary impairment and its application to certain investments. An unrealized loss exists when the current fair value of an individual security is less than its amortized cost basis. Unrealized losses on available-for-sale securities that are determined to be temporary, and not related to credit loss, are recorded, net of tax, in accumulated other comprehensive income.
F- 13
BIOGEN IDEC INC. AND SUBSIDIARIES
NOTES TO CONSOLIDATED FINANCIAL STATEMENTS — (Continued)
For available-for-sale debt securities with unrealized losses, management performs an analysis to assess whether we intend to sell or whether we would more likely than not be required to sell the security before the expected recovery of the amortized cost basis. Where we intend to sell a security, or may be required to do so, the security’s decline in fair value is deemed to be other-than-temporary and the full amount of the unrealized loss is reflected within earnings as an impairment loss.
Regardless of our intent to sell a security, we perform additional analysis on all securities with unrealized losses to evaluate losses associated with the creditworthiness of the security. Credit losses are identified where we do not expect to receive cash flows sufficient to recover the amortized cost basis of a security.
For equity securities, when assessing whether a decline in value is other-than-temporary, we consider the fair market value of the security, the duration of the security’s decline, and the financial condition of the issuer. We then consider our intent and ability to hold the equity security for a period of time sufficient to recover our carrying value. Where we have determined that we lack the intent and ability to hold an equity security to its expected recovery, the security’s decline in fair value is deemed to be other-than-temporary and is reflected within earnings as an impairment loss.
Equity Method of Accounting
In circumstances where we have the ability to exercise significant influence over the operating and financial policies of a company in which we have an investment, we utilize the equity method of accounting for recording investment activity. In assessing whether we exercise significant influence, we consider the nature and magnitude of our investment, the voting and protective rights we hold, any participation in the governance of the other company, and other relevant factors such as the presence of a collaboration or other business relationship. Under the equity method of accounting, we will record within our results of operations our share of income or loss of the other company.
Inventory
Inventories are stated at the lower of cost or market with cost determined in a manner that approximates the first-in, first-out (FIFO) method. Inventory that can be used in either the production of clinical or commercial products is expensed as research and development costs when selected for use in a clinical manufacturing campaign.
Capitalization of Inventory Costs
We capitalize inventory costs associated with our products prior to regulatory approval, when, based on management’s judgment, future commercialization is considered probable and the future economic benefit is expected to be realized. We consider numerous attributes in evaluating whether the costs to manufacture a particular product should be capitalized as an asset. We assess the regulatory approval process and where the particular product stands in relation to that approval process, including any known safety or efficacy concerns, potential labeling restrictions and other impediments to approval. We evaluate our anticipated research and development initiatives and constraints relating to the product and the indication in which it will be used. We consider our manufacturing environment including our supply chain in determining logistical constraints that could hamper approval or commercialization. We consider the shelf life of the product in relation to the expected timeline for approval and we consider patent related or contract issues that may prevent or delay commercialization. We also base our judgment on the viability of commercialization, trends in the marketplace and market acceptance criteria. Finally, we consider the reimbursement strategies that may prevail with respect to the product and assess the economic benefit that we are likely to realize. We expense previously capitalized costs related to pre-approval inventory upon a change in such judgment, due to, among other potential factors, a denial or significant delay of approval by necessary regulatory bodies.
Obsolescence and Unmarketable Inventory
We periodically review our inventories for excess or obsolescence and write-down obsolete or otherwise unmarketable inventory to its estimated net realizable value. If the actual net realizable value is less than that estimated by us, or if it is determined that inventory utilization will further diminish based on estimates of demand, additional inventory write-downs may be required. Additionally, our products are subject to strict quality control and monitoring which we perform throughout the manufacturing process. In the event that certain batches or units of product no longer meet quality specifications, we will record a charge to cost of sales to write-down any unmarketable inventory to its estimated net realizable value. In all cases, product inventory is carried at the lower of cost or its estimated net realizable value. Amounts written-down due to unmarketable inventory are charged to cost of sales, excluding amortization of acquired intangible assets.
F- 14
BIOGEN IDEC INC. AND SUBSIDIARIES
NOTES TO CONSOLIDATED FINANCIAL STATEMENTS — (Continued)
Property, Plant and Equipment
Property, plant and equipment are carried at cost, subject to review for impairment whenever events or changes in circumstances indicate that the carrying amount of the asset may not be recoverable. The cost of normal, recurring, or periodic repairs and maintenance activities related to property, plant and equipment are expensed as incurred. The cost for planned major maintenance activities, including the related acquisition or construction of assets, is capitalized if the repair will result in future economic benefits.
Interest costs incurred during the construction of major capital projects are capitalized until the underlying asset is ready for its intended use, at which point the interest costs are amortized as depreciation expense over the life of the underlying asset. We also capitalize certain direct and incremental costs associated with the validation effort required for licensing by regulatory agencies of new manufacturing equipment for the production of a commercially approved drug. These costs primarily include direct labor and material and are incurred in preparing the equipment for its intended use. The validation costs are either amortized over the life of the related equipment or expensed as cost of sales when the product produced in the validation process is sold.
In addition, we capitalize certain internal use computer software development costs. If the software is an integral part of production assets, these costs are included in machinery and equipment and are amortized on a straight-line basis over the estimated useful lives of the related software, which generally range from
three to five years
.
We generally depreciate or amortize the cost of our property, plant and equipment using the straight-line method over the estimated useful lives of the respective assets, which are summarized as follows:
|
Asset Category
|
Useful Lives
|
|
Land
|
Not depreciated
|
|
Buildings
|
15 to 40 years
|
|
Leasehold Improvements
|
Lesser of the useful life or the term of the respective lease
|
|
Furniture and Fixtures
|
5 to 7 years
|
|
Machinery and Equipment
|
5 to 20 years
|
|
Computer Software and Hardware
|
3 to 5 years
|
When we dispose of property, plant and equipment, we remove the associated cost and accumulated depreciation from the related accounts on our consolidated balance sheet and include any resulting gain or loss in our consolidated statement of income.
Intangible Assets
Our intangible assets consist of acquired and in-licensed rights and patents, developed technology, out-licensed patents, in-process research and development acquired after January 1, 2009, trademarks and trade names. Our intangible assets are recorded at fair value at the time of their acquisition and are stated within our consolidated balance sheets net of accumulated amortization and impairments, if applicable.
Intangible assets related to acquired and in-licensed rights and patents, developed technology and out-licensed patents are amortized over their estimated useful lives using the economic consumption method if anticipated future revenues can be reasonably estimated; the straight-line method is used when revenues cannot be reasonably estimated. Amortization is recorded as amortization of acquired intangible assets within our consolidated statements of income.
Acquired and in-licensed rights and patents primarily relates to our acquisition of TYSABRI rights from Elan Pharma International, Ltd (Elan), an affiliate of Elan Corporation, plc. Developed technology primarily relates to our AVONEX product, which was recorded in connection with the merger of Biogen, Inc. and IDEC Pharmaceuticals Corporation in 2003. We amortize the intangible assets related to TYSABRI and AVONEX using the economic consumption method based on revenue generated from the products underlying the related intangible assets. An analysis of the anticipated lifetime revenues of TYSABRI and AVONEX is performed annually during our long range planning cycle, which is generally updated in the third quarter of each year, and whenever events or changes in circumstances would significantly affect the
anticipated lifetime revenues of TYSABRI or AVONEX
. This analysis serves as the basis for the calculation of our economic consumption models used for these products. This analysis is based upon certain assumptions that we evaluate on a periodic basis, such as the anticipated product sales of AVONEX and TYSABRI, the expected impact of competitor products and our own commercial and pipeline product candidates, including TECFIDERA and PLEGRIDY, and the issuance of new patents or the extension of existing patents.
F- 15
BIOGEN IDEC INC. AND SUBSIDIARIES
NOTES TO CONSOLIDATED FINANCIAL STATEMENTS — (Continued)
Intangible assets related to trademarks, trade names and in-process research and development prior to commercialization are not amortized because they have indefinite lives, however, they are subject to review for impairment. We review our intangible assets with indefinite lives for impairment annually, as of October 31, and whenever events or changes in circumstances indicate that the carrying value of an asset may not be recoverable.
Acquired In-process Research and Development (IPR&D)
Acquired IPR&D represents the fair value assigned to research and development assets
that have not reached technological feasibility
. The value assigned to acquired IPR&D is determined by estimating the costs to develop the acquired technology into commercially viable products, estimating the resulting revenue from the projects, and discounting the net cash flows to present value. The revenue and costs projections used to value acquired IPR&D are, as applicable, reduced based on the probability of success of developing a new drug. Additionally, the projections consider the relevant market sizes and growth factors, expected trends in technology, and the nature and expected timing of new product introductions by us and our competitors. The rates utilized to discount the net cash flows to their present value are commensurate with the stage of development of the projects and uncertainties in the economic estimates used in the projections. Upon the acquisition of IPR&D, we complete an assessment of whether our acquisition constitutes the purchase of a single asset or a group of assets. We consider multiple factors in this assessment, including the nature of the technology acquired, the presence or absence of separate cash flows, the development process and stage of completion, quantitative significance and our rationale for entering into the transaction.
If we acquire an asset or group of assets that do not meet the definition of a business under applicable accounting standards, then the acquired IPR&D is expensed on its acquisition date. Future costs to develop these assets are recorded to research and development expense as they are incurred.
We review amounts capitalized as acquired IPR&D for impairment at least annually, as of October 31, and whenever events or changes in circumstances indicate that the carrying value of the assets might not be recoverable.
When performing our impairment assessment, we have the option to first assess qualitative factors to determine whether it is necessary to recalculate the fair value of our acquired IPR&D. If we elect this option and believe, as a result of the qualitative assessment, that it is more-likely-than-not that the fair value of our acquired IPR&D is less than its carrying amount, we calculate the fair value using the same methodology as described above. If the carrying value of our acquired IPR&D exceeds its fair value, then the intangible asset is written-down to its fair value. Alternatively, we may elect to not first assess qualitative factors and immediately recalculate the fair value of our acquired IPR&D.
Goodwill
Goodwill represents the difference between the purchase price and the fair value of the identifiable tangible and intangible net assets when accounted for using the purchase method of accounting. Goodwill is not amortized, but reviewed for impairment. Goodwill is reviewed annually, as of October 31, and whenever events or changes in circumstances indicate that the carrying value of the goodwill might not be recoverable.
We have the option to first assess qualitative factors to determine whether it is necessary to perform the two-step impairment test. If we elect this option and believe, as a result of the qualitative assessment, that it is more-likely-than-not that the fair value of our reporting unit is less than its carrying amount, the quantitative two-step impairment test is required; otherwise, no further testing is required. Alternatively, we may elect to not first assess qualitative factors and immediately perform the quantitative two-step impairment test. In the first step, we compare the fair value of our reporting unit to its carrying value. If the carrying value of the net assets assigned to the reporting unit exceeds the fair value of our reporting unit, then the second step of the impairment test is performed in order to determine the implied fair value of our reporting unit’s goodwill. If the carrying value of our reporting unit’s goodwill exceeds its implied fair value, then we would record an impairment loss equal to the difference. As described in Note 25,
Segment Information
to these consolidated financial statements, we operate in one operating segment which we consider our only reporting unit.
Impairment of Long-Lived Assets
Long-lived assets to be held and used, including property, plant and equipment are reviewed for impairment whenever events or changes in circumstances indicate that the carrying amount of the assets or asset group may not be recoverable.
Determination of recoverability is based on an estimate of undiscounted future cash flows resulting from the use of the asset and its eventual disposition. In the event that such cash flows are not expected to be sufficient to recover the carrying amount of the assets, the assets are written-down to their fair values. Long-lived assets to be disposed of are carried at fair value less costs to sell.
F- 16
BIOGEN IDEC INC. AND SUBSIDIARIES
NOTES TO CONSOLIDATED FINANCIAL STATEMENTS — (Continued)
Contingent Consideration
The consideration for our acquisitions often includes future payments that are contingent upon the occurrence of a particular event. For acquisitions that qualify as business combinations completed after January 1, 2009, we record an obligation for such contingent payments at fair value on the acquisition date. We estimate the fair value of contingent consideration obligations through valuation models that incorporate probability adjusted assumptions related to the achievement of the milestones and thus likelihood of making related payments. We revalue these contingent consideration obligations each reporting period. Changes in the fair value of our contingent consideration obligations are recognized within our consolidated statements of income. Changes in the fair value of the contingent consideration obligations can result from changes to one or multiple inputs, including adjustments to the discount rates, changes in the amount or timing of expected expenditures associated with product development, changes in the amount or timing of cash flows and reserves associated with products upon commercialization, changes in the assumed achievement or timing of any cumulative sales-based and development milestones, changes in the probability of certain clinical events and changes in the assumed probability associated with regulatory approval.
Discount rates in our valuation models represent a measure of the credit risk associated with settling the liability. The period over which we discount our contingent obligations is based on the current development stage of the product candidates, our specific development plan for that product candidate adjusted for the probability of completing the development step, and when the contingent payments would be triggered. In determining the probability of success, we utilize data regarding similar milestone events from several sources, including industry studies and our own experience. These fair value measurements are based on significant inputs not observable in the market. Significant judgment is employed in determining the appropriateness of these assumptions as of the acquisition date and for each subsequent period. Accordingly, changes in assumptions could have a material impact on the amount of contingent consideration expense we record in any given period.
Derivative Instruments and Hedging Activities
We recognize all derivative instruments as either assets or liabilities at fair value in our consolidated balance sheets. Changes in the fair value of derivatives are recorded each period in current earnings or accumulated other comprehensive income (loss), depending on whether a derivative is designated as part of a hedge transaction and, if so, the type of hedge transaction. We classify the cash flows from these instruments in the same category as the cash flows from the hedged items. We do not hold or issue derivative instruments for trading or speculative purposes.
We assess, both at inception and on an ongoing basis, whether the derivatives that are used in hedging transactions are highly effective in offsetting the changes in cash flows or fair values of the hedged items. We also assess hedge ineffectiveness on a quarterly basis and record the gain or loss related to the ineffective portion to current earnings. If we determine that a forecasted transaction is no longer probable of occurring, we discontinue hedge accounting for the affected portion of the hedge instrument, and any related unrealized gain or loss on the contract is recognized in current earnings.
Translation of Foreign Currencies
The functional currency for most of our foreign subsidiaries is their local currency. For our non-U.S. subsidiaries that transact in a functional currency other than the U.S. dollar, assets and liabilities are translated at current rates of exchange at the balance sheet date. Income and expense items are translated at the average foreign exchange rates for the period. Adjustments resulting from the translation of the financial statements of our foreign operations into U.S. dollars are excluded from the determination of net income and are recorded in accumulated other comprehensive income, a separate component of equity. For subsidiaries where the functional currency differs from the local currency, non-monetary assets and liabilities are translated at the rate of exchange in effect on the date assets were acquired while monetary assets and liabilities are translated at current rates of exchange as of the balance sheet date. Income and expense items are translated at the average foreign currency rates for the period. Translation adjustments of these subsidiaries are included in net income.
Royalty Cost of Sales
We make royalty payments to a number of third parties under license or purchase agreements associated with our acquisition of intellectual property. These royalty payments are typically calculated as a percentage (royalty rate) of the sales of our products within a particular year. That royalty rate may remain constant, increase or decrease within each year based on the total amount of sales during the annual period. Each quarterly period we estimate our total royalty obligation for the full year and recognize the proportional amount as cost of sales based on actual quarterly sales as a percentage of full year estimated sales. For example, if the level of net sales in any calendar year increases the royalty rate within the year, we will record our cost of sales at an even rate over the year, based on the estimated blended royalty rate.
F- 17
BIOGEN IDEC INC. AND SUBSIDIARIES
NOTES TO CONSOLIDATED FINANCIAL STATEMENTS — (Continued)
Accounting for Share-Based Compensation
Our share-based compensation programs grant awards which have included stock options, restricted stock units which vest based on stock performance known as market stock units (MSUs), performance-vested restricted stock units which settle in cash (CSPSs), performance-vested restricted stock units which settle in shares (PVRSUs), time-vested restricted stock units (RSUs) and shares issued under our employee stock purchase plan (ESPP). We charge the estimated fair value of awards against income over the requisite service period, which is generally the vesting period. Where awards are made with non-substantive vesting periods (for instance, where a portion of the award vests upon retirement eligibility), we estimate and recognize expense based on the period from the grant date to the date on which the employee is retirement eligible.
The fair values of our stock option grants are estimated as of the date of grant using a Black-Scholes option valuation model. The estimated fair values of the stock options are then expensed over the options’ vesting periods.
The fair values of our MSUs are estimated using a lattice model with a Monte Carlo simulation. Compensation expense for MSUs is recognized over the applicable service period.
The fair values of our RSUs are based on the market value of our stock on the date of grant. Compensation expense for RSUs is recognized over the applicable vesting period.
We apply an accelerated attribution method to recognize stock based compensation expense, net of estimated forfeitures, when accounting for our MSUs. The probability of actual shares expected to be earned is considered in the grant date valuation, therefore the expense will not be adjusted to reflect the actual units earned.
We apply an accelerated attribution method to recognize stock based compensation expense when accounting for our CSPSs and the fair value of the liability is remeasured at the end of each reporting period through expected cash settlement. Compensation expense associated with CSPSs is based upon the stock price and the number of units expected to be earned after assessing the probability that certain performance criteria will be met and the associated targeted payout level that is forecasted will be achieved, net of estimated forfeitures. Cumulative adjustments are recorded each quarter to reflect changes in the stock price and estimated outcome of the performance-related conditions until the date results are determined and settled.
We apply an accelerated attribution method to recognize stock based compensation expense when accounting for our PVRSUs. The number of units reflected as granted represents the target number of shares that are eligible to vest in full or in part and are earned subject to the attainment of certain performance criteria established at the beginning of the performance period. Compensation expense associated with these units is initially based upon the number of shares expected to vest after assessing the probability that certain performance criteria will be met and the associated targeted payout level that is forecasted will be achieved, net of estimated forfeitures. Cumulative adjustments are recorded quarterly to reflect subsequent changes in the estimated outcome of performance-related conditions until the date results are determined.
The purchase price of common stock under our ESPP is equal to
85%
of the lower of (i) the market value per share of the common stock on the participant’s entry date into an offering period or (ii) the market value per share of the common stock on the purchase date. The fair value of the discounted purchases made under our ESPP is calculated using the Black-Scholes model. The fair value of the look-back provision plus the
15%
discount is recognized as compensation expense over the 90 day purchase period.
Research and Development Expenses
Research and development expenses consist of upfront fees and milestones paid to collaborators and expenses incurred in performing research and development activities, including compensation and benefits, facilities expenses, overhead expenses, clinical trial and related clinical manufacturing expenses, write-offs of pre-approved inventory that was previously capitalized that are determined to be no longer realizable, fees paid to clinical research organizations (CROs) and other outside expenses. Research and development expenses are expensed as incurred. Payments we make for research and development services prior to the services being rendered are recorded as prepaid assets on our consolidated balance sheets and are expensed as the services are provided. We also accrue the costs of ongoing clinical trials associated with programs that have been terminated or discontinued for which there is no future economic benefit at the time the decision is made to terminate or discontinue the program.
F- 18
BIOGEN IDEC INC. AND SUBSIDIARIES
NOTES TO CONSOLIDATED FINANCIAL STATEMENTS — (Continued)
From time to time, we enter into development agreements in which we share expenses with a collaborative partner. We record payments received from our collaborative partners for their share of the development costs as a reduction of research and development expense, except as discussed within Note 20,
Collaborative and Other Relationships
to these consolidated financial statements.
Because an initial indication has been approved for both RITUXAN and GAZYVA,
expenses incurred by Genentech in the ongoing development of RITUXAN and GAZYVA are not recorded as research and development expense, but rather reduce our share of profits recorded as a component of unconsolidated joint business revenues.
For collaborations with commercialized products, if we are the principal, we record revenue and the corresponding operating costs in their respective line items within our consolidated statements of income. If we are not the principal, we record operating costs as a reduction of revenue.
Selling, General and Administrative Expenses
Selling, general and administrative expenses are primarily comprised of compensation and benefits associated with sales and marketing, finance, human resources, legal and other administrative personnel, outside marketing, advertising and legal expenses and other general and administrative costs.
Advertising costs are expensed as incurred. For the years ended
December 31, 2013
,
2012
and
2011
, advertising costs totaled
$72.7 million
,
$54.3 million
and
$45.3 million
, respectively.
Income Taxes
The provision for income taxes includes federal, state, local and foreign taxes. Income taxes are accounted for under the liability method. Deferred tax assets and liabilities are recognized for the estimated future tax consequences of temporary differences between the financial statement carrying amounts and their respective tax bases. Deferred tax assets and liabilities are measured using enacted tax rates expected to apply to taxable income in the year in which the temporary differences are expected to be recovered or settled. We evaluate the realizability of our deferred tax assets and establish a valuation allowance when it is more likely than not that all or a portion of deferred tax assets will not be realized.
All tax effects associated with intercompany transfers of assets within our consolidated group, both current and deferred, are recorded as a prepaid tax or deferred charge and recognized through the consolidated statement of income when the asset transferred is sold to a third party or otherwise recovered through amortization of the asset's remaining economic life. If the asset transferred becomes impaired, for example through the discontinuation of a research program, we will expense any remaining deferred charge or prepaid tax.
We account for uncertain tax positions using a “more-likely-than-not” threshold for recognizing and resolving uncertain tax positions. We evaluate uncertain tax positions on a quarterly basis and consider various factors, including, but not limited to, changes in tax law, the measurement of tax positions taken or expected to be taken in tax returns, the effective settlement of matters subject to audit, information obtained during in process audit activities and changes in facts or circumstances related to a tax position. We also accrue for potential interest and penalties related to unrecognized tax benefits in income tax expense.
Contingencies
We are currently involved in various claims and legal proceedings. Loss contingency provisions are recorded if the potential loss from any claim, asserted or unasserted, or legal proceeding is considered probable and the amount can be reasonably estimated or a range of loss can be determined. These accruals represent management’s best estimate of probable loss. Disclosure also is provided when it is reasonably possible that a loss will be incurred or when it is reasonably possible that the amount of a loss will exceed the recorded provision. On a quarterly basis, we review the status of each significant matter and assess its potential financial exposure. Significant judgment is required in both the determination of probability and the determination as to whether an exposure is reasonably estimable. Because of uncertainties related to these matters, accruals are based only on the best information available at the time. As additional information becomes available, we reassess the potential liability related to pending claims and litigation and may revise our estimates. These revisions in the estimates of the potential liabilities could have a material impact on our consolidated results of operations and financial position.
F- 19
BIOGEN IDEC INC. AND SUBSIDIARIES
NOTES TO CONSOLIDATED FINANCIAL STATEMENTS — (Continued)
Restructuring Charges
We have made estimates and judgments regarding the amount and timing of our restructuring expense and liability, including current and future period termination benefits, lease termination costs, and other exit costs to be incurred when related actions take place. We have also assessed the recoverability of certain long-lived assets employed in the business and, in certain instances shortened the expected useful life of the assets based on changes in their expected use. When we determine that the useful lives of assets are shorter than we had originally estimated, we record additional depreciation to reflect the assets’ new shorter useful lives. Severance and other related costs and asset-related charges are reflected within our consolidated statement of income as a component of total restructuring charges incurred. Actual results may differ from these estimates.
Earnings per Share
Basic earnings per share is computed using the two-class method. Under the two-class method, undistributed net income is allocated to common stock and participating securities based on their respective rights to share in dividends. We have determined that our preferred shares meet the definition of participating securities and, to the extent any are outstanding during a period, have allocated a portion of net income to our preferred shares on a pro rata basis. Net income allocated to preferred shares is excluded from the calculation of basic earnings per share.
New Accounting Pronouncements
From time to time, new accounting pronouncements are issued by the Financial Accounting Standards Board (FASB) or other standard setting bodies that are adopted by the Company as of the specified effective date. Unless otherwise discussed, we believe that the impact of recently issued standards that are not yet effective will not have a material impact on our financial position or results of operations upon adoption.
ASU No. 2013-01,
Balance Sheet (Topic 210): Clarifying the Scoping of Disclosures about Offsetting Assets and Liabilities
(ASU 2013-01) clarifies the scope of ASU No. 2011-11 to apply to derivatives accounted for in accordance with Topic 815,
Derivatives and Hedging
, including bifurcated embedded derivatives, repurchase agreements and reverse repurchase agreements, and securities borrowing and securities lending transactions that are either offset in accordance with ASC 210-20-45 or ASC 815-10-45 or subject to an enforceable master netting arrangement or similar agreement. This ASU was effective for fiscal years beginning on or after January 1, 2013 and interim periods within those annual periods. We adopted this standard in the first quarter of 2013 and presented this information in Note 10,
Derivative Instruments
to these consolidated financial statements. The adoption of this standard did not have an impact on our financial position or results of operations.
ASU No. 2013-02,
Comprehensive Income (Topic 220): Reporting of Amounts Reclassified Out of Accumulated Other Comprehensive Income
(ASU 2013-02) requires an entity to provide information about the amounts reclassified out of accumulated other comprehensive income by component. In addition, an entity is required to present, either on the face of the statement where net income is presented or in the notes, significant amounts reclassified out of accumulated other comprehensive income by the respective line items of net income but only if the amount reclassified is required under U.S. GAAP to be reclassified to net income in its entirety in the same reporting period. For other amounts that are not required under U.S. GAAP to be reclassified in their entirety to net income, an entity is required to cross-reference to other disclosures required under U.S. GAAP that provide additional detail about those amounts. This ASU was effective for reporting periods beginning after December 15, 2012. We adopted this standard in the first quarter of 2013 and presented this information in Note 14,
Accumulated Other Comprehensive Income (Loss)
to these consolidated financial statements. The adoption of this standard did not have an impact on our financial position or results of operations.
|
2.
|
Acquisitions
|
TYSABRI
On April 2, 2013, we acquired full ownership of, and strategic, commercial and decision-making rights to, TYSABRI from Elan. Upon the closing of the transaction, we made an upfront payment of
$3.25 billion
to Elan, which was funded from our existing cash, and our collaboration agreement with Elan was terminated.
We are accounting for this transaction as the acquisition of an asset as we did not acquire any employees from Elan nor did we acquire any significant processes that we did not previously perform or manage under the collaboration agreement. Under the collaboration agreement, we manufactured TYSABRI and collaborated with Elan on the product's marketing, commercial, regulatory, distribution and ongoing development activities. The collaboration agreement was designed to effect an equal sharing of worldwide profits and losses generated by the activities of the collaboration. For additional information related to this collaboration, please read Note 20,
Collaborative and Other Relationships
to these consolidated financial statements.
F- 20
BIOGEN IDEC INC. AND SUBSIDIARIES
NOTES TO CONSOLIDATED FINANCIAL STATEMENTS — (Continued)
The
$3.25 billion
upfront payment was capitalized in the second quarter of 2013 as an intangible asset within our consolidated balance sheet as TYSABRI has reached technological feasibility. We adjusted the value of this intangible asset by
$84.4 million
related to deferred revenue from two sales-based milestones previously paid by Elan as well as transaction costs. The net intangible asset capitalized was
$3,178.3 million
. Commencing in the second quarter of 2013, we began amortizing this intangible asset over the estimated useful life using an economic consumption method based on actual and expected revenue generated from the sales of our TYSABRI product, which is currently
17 years
.
Following the April 2, 2013 closing of the transaction, we began recording 100% of U.S. revenues, cost of sales and operating expenses related to TYSABRI within our consolidated statements of income. Under the terms of the acquisition agreement, we continued to share TYSABRI profits with Elan on an equal basis until April 30, 2013. We recorded the profit split for the month ended April 30, 2013, as cost of sales within our consolidated statements of income as we controlled TYSABRI effective April 2, 2013. Commencing May 1, 2013 and for the first twelve months thereafter, we will make contingent payments to Elan of
12%
on worldwide net sales of TYSABRI and, thereafter,
18%
on annual worldwide net sales up to
$2.0 billion
and
25%
on annual worldwide net sales that exceed
$2.0 billion
. In 2014, the
$2.0 billion
threshold will be pro-rated for the portion of 2014 remaining after the first 12 months expires. Royalty payments to Elan and other third parties are recognized as cost of sales within our consolidated statements of income.
Stromedix, Inc.
In March 2012, we completed our acquisition of all the outstanding stock of Stromedix, Inc. (Stromedix), a privately held company located in Cambridge, Massachusetts. Stromedix was a business involved in the discovery of antibodies designed to treat fibrosis disorders. Stromedix’ lead candidate, STX-100, was in Phase 2a of development in patients with idiopathic pulmonary fibrosis (IPF). The purchase price included a
$75.0 million
cash payment and up to a maximum of
$487.5 million
in contingent consideration in the form of development and approval milestones, of which
$275.0 million
related directly to the development and approval of STX-100 for the treatment of IPF. The acquisition was funded from our existing cash on hand and has been accounted for as the acquisition of a business. In addition to acquiring the outstanding stock of the entity and obtaining the rights to STX-100, we obtained the services of key employees and the rights to a second antibody and an antibody conjugate, which are both in preclinical development.
Upon acquisition, we recorded a contingent consideration obligation of
$122.2 million
representing the fair value of the contingent consideration. This amount was estimated through a valuation model that incorporated industry based probability adjusted assumptions relating to the achievement of these milestones and the likelihood of us making payments. Subsequent changes in the fair value of this obligation are recognized as adjustments to contingent consideration and reflected within our consolidated statements of income. We allocated
$219.2 million
and
$48.2 million
of the total purchase price to acquired IPR&D and goodwill, respectively. The amount allocated to acquired IPR&D represented the fair value of the IPR&D programs acquired through a probability adjusted cash flow analysis utilizing a discount rate of
20.0%
. The goodwill recognized was primarily attributable to establishing a deferred tax liability for the IPR&D intangible assets which have no tax basis and, therefore, are not tax deductible. During
2013
, we adjusted the goodwill by
$4.1 million
to establish a deferred tax asset related to our Stromedix transaction. For additional information related to our fair value of this obligation, please read Note 8,
Fair Value Measurements
to these consolidated financial statements.
Pro forma information is not presented as it is immaterial to our consolidated financial statements.
Prior to the acquisition of Stromedix, we had an equity interest equal to approximately
5.0%
of the company’s total capital stock (on an “as converted” basis) pursuant to a license agreement we entered into with Stromedix in 2007 for the development of the STX-100 product candidate. Based on the fair market value of this equity interest derived from the purchase price, we recognized a gain of approximately
$9.0 million
in 2012, which was recorded as a component of other income (expense), net within our consolidated statement of income.
Noncontrolling Interest in Joint Ventures
In September 2011, we completed the purchase of the noncontrolling interest in our joint venture investments in Biogen Dompé SRL and Biogen Dompé Switzerland GmbH, our respective sales affiliates in Italy and Switzerland, from our joint venture partners, Dompé Farmaceutici SpA and Dompé International SA, respectively. This transaction was funded from our existing cash on hand and has been accounted for as the acquisition of a noncontrolling interest. The purchase price of these shares was comprised of cash payments totaling
$152.9 million
plus up to
$42.5 million
in contingent consideration payable upon the achievement of commercial and regulatory milestones using exchange rates at the time of the transaction. As these amounts reflect payments to acquire a noncontrolling interest, these payments and the accrual of a liability related to the contingent consideration were recorded as a reduction in the noncontrolling interest for these entities with the remainder to additional paid in capital.
F- 21
BIOGEN IDEC INC. AND SUBSIDIARIES
NOTES TO CONSOLIDATED FINANCIAL STATEMENTS — (Continued)
Upon acquisition, we recorded a contingent consideration obligation of
$38.8 million
representing the acquisition date fair value of the contingent consideration. This amount was estimated through a valuation model that incorporates probability weighted assumptions relating to the achievement of these milestones and thus the likelihood of us making payments. Subsequent changes in the fair value of this obligation are recognized as adjustments to contingent consideration within our consolidated statements of income. For additional information related to our valuation of this obligation, please read Note 8,
Fair Value Measurements
to these consolidated financial statements.
Biogen Idec Hemophilia Inc.
In connection with our acquisition of Biogen Idec Hemophilia Inc. (BIH), formerly Syntonix Pharmaceuticals, Inc. (Syntonix), in January 2007, we agreed to pay up to an additional
$80.0 million
if certain milestone events associated with the development of BIH’s lead product, ALPROLIX (recombinant factor IX Fc fusion protein), a product for the treatment of hemophilia B, are achieved. The first
$40.0 million
contingent payment was achieved in 2010 upon initiation of patient enrollment in a registrational trial of ALPROLIX. We recorded this payment as a charge to acquired IPR&D within our consolidated statement of income in 2010, in accordance with the accounting standards applicable to business combinations when we acquired BIH.
An additional
$20.0 million
contingent payment will occur if prior to the tenth anniversary of the closing date, the FDA grants approval of a Biologic License Application for ALPROLIX. A second
$20.0 million
contingent payment will occur if prior to the tenth anniversary of the closing date, a marketing authorization is granted by the EMA for ALPROLIX. If earned, these payments will be capitalized as an intangible assets when the related milestones are achieved.
|
3.
|
Gain on Sale of Rights
|
During the third quarter of 2012, we sold all of our rights, including rights to royalties, related to BENLYSTA (belimumab) to a DRI Capital managed fund (DRI). We were entitled to these rights pursuant to a license agreement with Human Genome Sciences, Inc. and GlaxoSmithKline plc (collectively the "Licensees"). Under the terms of the BENLYSTA sale agreement, we will receive payments from DRI equal to a multiple of royalties payable by the Licensees for the period covering October 2011 to September 2014 and a one-time contingency payment that could be paid to us if the cumulative royalties over the full royalty term exceed an agreed amount. DRI will retain all the royalty payments from sales of BENLYSTA after September 2014. We have accounted for this as the sale of a long-lived asset with zero cost basis as we have transferred all of our substantive rights related to this asset.
Under the terms of this noncancelable sale, DRI will have no recourse to us for the Licensees' performance with respect to sales of BENLYSTA, even in the event of Licensees' insolvency, nonperformance or inability to comply with terms of the license agreement. We do not have any continuing involvement with DRI or the Licensees with respect to sales of BENLYSTA, and have concluded that the sale of the rights represents the culmination of an earnings process.
The payments received during 2013 and 2012 totaled
$24.9 million
and
$46.8 million
, respectively. These payments were recorded as a gain on sale of rights within our consolidated statements of income. The remaining payments, which are contingent upon BENLYSTA sales over the period ending September 2014, will be recognized as the payments become due as we cannot reliably estimate the amount and timing of contingent payments.
|
4.
|
Accounts Receivable
|
Our accounts receivable primarily arise from product sales in the U.S. and Europe and mainly represent amounts due from our wholesale distributors, public hospitals and other government entities. Concentrations of credit risk with respect to our accounts receivable, which are typically unsecured, are limited due to the wide variety of customers and markets using our products, as well as their dispersion across many different geographic areas. The majority of our accounts receivable have standard payment terms which generally require payment within
30 to 90 days
. We monitor the financial performance and credit worthiness of our large customers so that we can properly assess and respond to changes in their credit profile. We provide reserves against trade receivables for estimated losses that may result from a customer’s inability to pay. Amounts determined to be uncollectible are charged or written-off against the reserve. To date, our historical reserves and write-offs of accounts receivable have not been significant.
F- 22
BIOGEN IDEC INC. AND SUBSIDIARIES
NOTES TO CONSOLIDATED FINANCIAL STATEMENTS — (Continued)
The credit and economic conditions within Italy, Spain and Portugal, among other members of the European Union, continue to remain uncertain. Uncertain credit and economic conditions have generally led to a lengthening of time to collect our accounts receivable in some of these countries. In Portugal and select regions in Spain and Italy where our collections have slowed and a significant portion of these receivables are routinely being collected beyond our contractual payment terms and over periods in excess of one year, we have discounted our receivables and reduced related revenues based on the period of time that we estimate those amounts will be paid, to the extent such period exceeds one year, using the country’s market-based borrowing rate for such period. The related receivables are classified at the time of sale as non-current assets. We accrete interest income on these receivables, which is recognized as a component of other income (expense), net within our consolidated statements of income.
Our net accounts receivable balances from product sales in selected European countries are summarized as follows:
|
|
As of December 31, 2013
|
||||||||||
|
(In millions)
|
Current
Balance Included
within Accounts
Receivable, net
|
Non-Current
Balance Included
within Investments
and Other Assets
|
Total
|
||||||||
|
Spain
|
$
|
113.3
|
|
$
|
6.8
|
|
$
|
120.1
|
|
||
|
Italy
|
$
|
76.1
|
|
$
|
2.4
|
|
$
|
78.5
|
|
||
|
Portugal
|
$
|
10.4
|
|
$
|
8.2
|
|
$
|
18.6
|
|
||
|
|
As of December 31, 2012
|
||||||||||
|
(In millions)
|
Current
Balance Included
within Accounts
Receivable, net
|
Non-Current
Balance Included
within Investments
and Other Assets
|
Total
|
||||||||
|
Spain
|
$
|
78.9
|
|
$
|
—
|
|
$
|
78.9
|
|
||
|
Italy
|
$
|
94.4
|
|
$
|
10.2
|
|
$
|
104.6
|
|
||
|
Portugal
|
$
|
16.6
|
|
$
|
7.4
|
|
$
|
24.0
|
|
||
Approximately
$45.9 million
and
$11.8 million
of the total net accounts receivable balances for these countries were overdue more than one year as of
December 31, 2013
and
2012
, respectively.
Pricing of TYSABRI in Italy - AIFA
In the fourth quarter of 2011, Biogen Idec SRL, our Italian subsidiary, received a notice from the Italian National Medicines Agency (Agenzia Italiana del Farmaco or AIFA) stating that sales of TYSABRI for the period from February 2009 through February 2011 exceeded by EUR
30.7 million
a reimbursement limit established pursuant to a Price Determination Resolution (Price Resolution) granted by AIFA in December 2006. In December 2011, based on our interpretation that the Price Resolution by its terms only applied to the first
24 months
of TYSABRI sales (which began in February 2007), we filed an appeal against AIFA in administrative court seeking a ruling that the reimbursement limit does not apply and that the position of AIFA is unenforceable. That appeal is pending.
In June 2013, Biogen Idec SRL received an additional notice from AIFA, stating that sales of TYSABRI from February 2011 through February 2013 also exceeded the same reimbursement limit in the Price Resolution. We dispute that the reimbursement limit applies to this period for the same reason that we dispute its application to the February 2009 through February 2011 period.
In July 2013, we reached an agreement in principle with the Price and Reimbursement Committee of AIFA to settle all of AIFA's existing claims relating to sales of TYSABRI in excess of the reimbursement limit for the periods between February 2009 through February 2013 for an aggregate repayment of EUR
33.3 million
. As part of this settlement, we also agreed that the reimbursement limit in the Pricing Resolution will no longer be in effect as of February 2013. The settlement is pending approval by Italian regulatory authorities. Upon this approval and the execution of the settlement, we will dismiss our appeal.
As a result of this agreement, we recorded a liability and reduction to revenue of EUR
15.4 million
(
$20.0 million
). That adjustment approximates 50% of the claim related to the period from February 2009 through February 2011 for which we had not previously recorded any amounts. We recorded the adjustment as of June 30, 2013 as the likelihood of making a payment to settle AIFA's claims for this period was then probable and the amount could be estimated.
F- 23
BIOGEN IDEC INC. AND SUBSIDIARIES
NOTES TO CONSOLIDATED FINANCIAL STATEMENTS — (Continued)
Since being notified in the fourth quarter of 2011 that AIFA believed a reimbursement limit was in effect, we have deferred revenue on sales of TYSABRI as if the reimbursement limit were in effect for each biannual period. As of
December 31, 2013
, we have deferred an aggregate amount of
$129.3 million
, of which
$45.9 million
,
$62.7 million
and
$13.8 million
were deferred for the years ended
December 31, 2013
,
2012
and
2011
, respectively. We will continue to defer revenue until the settlement is approved. Upon approval of the settlement, any deferred revenue related to the periods subsequent to February 2011 that is in excess of the settlement will be recognized as revenue. At the time of sale, our net accounts receivable balances from product sales in Italy include the amount of deferred revenue discussed above as our customers pay the invoice price of the product. For additional information, please read Note 21,
Litigation
to these consolidated financial statements.
5. Reserves for Discounts and Allowances
As a result of our acquisition of TYSABRI rights from Elan, we began recognizing reserves for discounts and allowances for U.S. TYSABRI revenue in the second quarter of 2013. Prior periods included reserves for discounts and allowances for rest of world TYSABRI revenue and worldwide AVONEX revenue. In addition, following our commercial launch of TECFIDERA in the second quarter of 2013, we began recognizing reserves for discounts and allowances related to TECFIDERA revenue.
An analysis of the change in reserves is summarized as follows:
|
(In millions)
|
Discounts
|
Contractual
Adjustments
|
Returns
|
Total
|
|||||||||||
|
2013
|
|||||||||||||||
|
Beginning balance
|
$
|
14.3
|
|
$
|
196.0
|
|
$
|
26.8
|
|
$
|
237.1
|
|
|||
|
Current provisions relating to sales in current year
|
236.3
|
|
851.4
|
|
22.9
|
|
1,110.6
|
|
|||||||
|
Adjustments relating to prior years
|
(0.7
|
)
|
(16.4
|
)
|
1.1
|
|
(16.0
|
)
|
|||||||
|
Payments/returns relating to sales in current year
|
(189.7
|
)
|
(560.4
|
)
|
—
|
|
(750.1
|
)
|
|||||||
|
Payments/returns relating to sales in prior years
|
(13.2
|
)
|
(135.0
|
)
|
(17.1
|
)
|
(165.3
|
)
|
|||||||
|
Ending balance
|
$
|
47.0
|
|
$
|
335.6
|
|
$
|
33.7
|
|
$
|
416.3
|
|
|||
|
(In millions)
|
Discounts
|
Contractual
Adjustments
|
Returns
|
Total
|
|||||||||||
|
2012
|
|||||||||||||||
|
Beginning balance
|
$
|
11.9
|
|
$
|
120.0
|
|
$
|
23.7
|
|
$
|
155.6
|
|
|||
|
Current provisions relating to sales in current year
|
96.5
|
|
534.2
|
|
22.0
|
|
652.7
|
|
|||||||
|
Adjustments relating to prior years
|
(0.3
|
)
|
(4.7
|
)
|
(0.1
|
)
|
(5.1
|
)
|
|||||||
|
Payments/returns relating to sales in current year
|
(83.6
|
)
|
(363.2
|
)
|
(4.3
|
)
|
(451.1
|
)
|
|||||||
|
Payments/returns relating to sales in prior years
|
(10.2
|
)
|
(90.3
|
)
|
(14.5
|
)
|
(115.0
|
)
|
|||||||
|
Ending balance
|
$
|
14.3
|
|
$
|
196.0
|
|
$
|
26.8
|
|
$
|
237.1
|
|
|||
|
(In millions)
|
Discounts
|
Contractual
Adjustments
|
Returns
|
Total
|
|||||||||||
|
2011
|
|||||||||||||||
|
Beginning balance
|
$
|
13.9
|
|
$
|
107.0
|
|
$
|
21.1
|
|
$
|
142.0
|
|
|||
|
Current provisions relating to sales in current year
|
84.3
|
|
372.1
|
|
15.7
|
|
472.1
|
|
|||||||
|
Adjustments relating to prior years
|
—
|
|
(14.0
|
)
|
(0.9
|
)
|
(14.9
|
)
|
|||||||
|
Payments/returns relating to sales in current year
|
(73.3
|
)
|
(277.0
|
)
|
(0.4
|
)
|
(350.7
|
)
|
|||||||
|
Payments/returns relating to sales in prior years
|
(13.0
|
)
|
(68.1
|
)
|
(11.8
|
)
|
(92.9
|
)
|
|||||||
|
Ending balance
|
$
|
11.9
|
|
$
|
120.0
|
|
$
|
23.7
|
|
$
|
155.6
|
|
|||
F- 24
BIOGEN IDEC INC. AND SUBSIDIARIES
NOTES TO CONSOLIDATED FINANCIAL STATEMENTS — (Continued)
During
2013
, we reclassified prior year amounts related to our AVONEX co-pay programs from discounts to contractual adjustments. For the years ended
December 31, 2012
and
2011
, we reclassified
$17.3 million
and
$11.7 million
, respectively.
The total reserves above, included in our consolidated balance sheets, are summarized as follows:
|
|
As of December 31,
|
||||||
|
(In millions)
|
2013
|
2012
|
|||||
|
Reduction of accounts receivable
|
$
|
151.4
|
|
$
|
46.1
|
|
|
|
Component of accrued expenses and other
|
264.9
|
|
191.0
|
|
|||
|
Total reserves
|
$
|
416.3
|
|
$
|
237.1
|
|
|
|
6.
|
Inventory
|
The components of inventory are summarized as follows:
|
|
As of December 31,
|
||||||
|
(In millions)
|
2013
|
2012
|
|||||
|
Raw materials
|
$
|
115.0
|
|
$
|
101.8
|
|
|
|
Work in process
|
435.4
|
|
244.9
|
|
|||
|
Finished goods
|
108.6
|
|
100.7
|
|
|||
|
Total inventory
|
$
|
659.0
|
|
$
|
447.4
|
|
|
In prior years AVONEX PEN units, which have been assembled but not yet packaged, were classified as finished goods. For the year ended
December 31, 2013
, they are classified as work in process. We reclassified
$14.4 million
as of
December 31, 2012
to be consistent with this new presentation.
The components of inventory by product are summarized as follows:
|
|
As of December 31,
|
||||||
|
(In millions)
|
2013
|
2012
|
|||||
|
AVONEX
|
$
|
176.9
|
|
$
|
144.0
|
|
|
|
TYSABRI
|
170.9
|
|
114.8
|
|
|||
|
TECFIDERA
|
33.6
|
|
—
|
|
|||
|
Other
|
162.6
|
|
86.8
|
|
|||
|
Total finished goods and work in process
|
544.0
|
|
345.6
|
|
|||
|
Raw materials
|
115.0
|
|
101.8
|
|
|||
|
Total inventory
|
$
|
659.0
|
|
$
|
447.4
|
|
|
As of
December 31, 2013
and
2012
,
$93.7 million
and
$38.3 million
, respectively, of our inventory, including costs associated with our ELOCTATE, ALPROLIX and PLEGRIDY programs, have been capitalized in advance of regulatory approval and included in Other in the table above. For information on our pre-approval policy, please read Note 1,
Summary of Significant Accounting Policies
to these consolidated financial statements
Amounts written down related to excess, obsolete, unmarketable or other inventory are charged to cost of sales, and totaled
$47.3 million
,
$24.8 million
, and
$25.4 million
for the years ended
December 31, 2013
,
2012
, and
2011
, respectively.
F- 25
BIOGEN IDEC INC. AND SUBSIDIARIES
NOTES TO CONSOLIDATED FINANCIAL STATEMENTS — (Continued)
|
7.
|
Intangible Assets and Goodwill
|
Intangible Assets
Intangible assets, net of accumulated amortization, impairment charges and adjustments, are summarized as follows:
|
|
|
As of December 31, 2013
|
As of December 31, 2012
|
||||||||||||||||||||||
|
(In millions)
|
Estimated Life
|
Cost
|
Accumulated
Amortization
|
Net
|
Cost
|
Accumulated
Amortization
|
Net
|
||||||||||||||||||
|
Out-licensed patents
|
13-23 years
|
$
|
578.0
|
|
$
|
(450.8
|
)
|
$
|
127.2
|
|
$
|
578.0
|
|
$
|
(421.0
|
)
|
$
|
157.0
|
|
||||||
|
Developed technology
|
15-23 years
|
3,005.3
|
|
(2,165.4
|
)
|
839.9
|
|
3,005.3
|
|
(1,965.7
|
)
|
1,039.6
|
|
||||||||||||
|
In-process research and development
|
Indefinite until commercialization
|
327.4
|
|
—
|
|
327.4
|
|
330.1
|
|
—
|
|
330.1
|
|
||||||||||||
|
Trademarks and tradenames
|
Indefinite
|
64.0
|
|
—
|
|
64.0
|
|
64.0
|
|
—
|
|
64.0
|
|
||||||||||||
|
Acquired and in-licensed rights and patents
|
6-17 years
|
3,240.0
|
|
(123.8
|
)
|
3,116.2
|
|
53.7
|
|
(12.9
|
)
|
40.8
|
|
||||||||||||
|
Total intangible assets
|
$
|
7,214.7
|
|
$
|
(2,740.0
|
)
|
$
|
4,474.7
|
|
$
|
4,031.1
|
|
$
|
(2,399.6
|
)
|
$
|
1,631.5
|
|
|||||||
Amortization of acquired intangible assets totaled
$342.9 million
,
$202.2 million
, and
$208.6 million
for the years ended
December 31, 2013
,
2012
and
2011
, respectively. The increase in amortization for the year ended
December 31, 2013
was primarily driven by amortization recorded in relation to the intangible asset recorded upon our acquisition of the TYSABRI rights and an increase in the amount of amortization recorded in relation to our AVONEX intangible asset. Amortization of acquired intangible assets for the year ended
December 31, 2013
, includes a charge of
$2.6 million
related to a write down in carrying value of one of our in-process research and development assets to reflect a change in its estimated fair value.
Developed Technology
Developed technology primarily relates to our AVONEX product, which was recorded in connection with the merger of Biogen, Inc. and IDEC Pharmaceuticals Corporation in 2003. The net book value of this asset as of
December 31, 2013
, was
$829.7 million
. We amortize this intangible asset using the economic consumption method based on revenue generated from our AVONEX product. An analysis of the anticipated lifetime revenues of AVONEX is performed annually during our long range planning cycle, which is generally updated in the third quarter of each year, and whenever events or changes in circumstances would significantly affect the anticipated lifetime revenues of AVONEX. This analysis serves as the basis for the calculation of our economic consumption models used for the AVONEX product.
In-process Research and Development (IPR&D)
In-process research and development represents the fair value assigned to research and development assets that we acquire that have not reached technological feasibility at the date of acquisition. Upon commercialization, we determine the estimated useful life. In connection with our acquisition of Stromedix in March 2012, we acquired IPR&D programs with an estimated fair value of
$219.2 million
. For a more detailed description of this transaction, please read Note 2,
Acquisitions
to these consolidated financial statements.
Acquired and In-licensed Rights and Patents
Acquired and in-licensed rights and patents primarily relates to our acquisition of the TYSABRI rights from Elan. The net intangible asset capitalized related to this acquisition was
$3,178.3 million
. In the second quarter of 2013, we began amortizing this intangible asset over the estimated useful life using an economic consumption method based on actual and expected revenues generated from the sales of our TYSABRI product. For a more detailed description of this transaction, please read Note 2,
Acquisitions
to these consolidated financial statements.
F- 26
BIOGEN IDEC INC. AND SUBSIDIARIES
NOTES TO CONSOLIDATED FINANCIAL STATEMENTS — (Continued)
Estimated Future Amortization of Intangible Assets
Our most recent long range planning cycle was updated in the third quarter of 2013, and included the impact of our acquisition of TYSABRI rights from Elan and a decrease in the expected future product revenues of AVONEX, resulting in an increase in amortization expense as compared to prior quarters. The results of our analysis were impacted by changes in the estimated impact of TECFIDERA, as well as other existing and potential oral and alternative MS formulations, including PLEGRIDY, that may compete with AVONEX and TYSABRI. Based upon this more recent analysis, the estimated future amortization for acquired intangible assets is expected to be as follows:
|
(In millions)
|
As of December 31, 2013
|
||
|
2014
|
$
|
426.3
|
|
|
2015
|
336.4
|
|
|
|
2016
|
322.7
|
|
|
|
2017
|
327.5
|
|
|
|
2018
|
330.2
|
|
|
|
Total
|
$
|
1,743.1
|
|
Goodwill
The following table provides a roll forward of the changes in our goodwill balance:
|
|
As of December 31,
|
||||||
|
(In millions)
|
2013
|
2012
|
|||||
|
Goodwill, beginning of year
|
$
|
1,201.3
|
|
$
|
1,146.3
|
|
|
|
Increase to goodwill
|
35.7
|
|
48.2
|
|
|||
|
Other
|
(4.1
|
)
|
6.8
|
|
|||
|
Goodwill, end of year
|
$
|
1,232.9
|
|
$
|
1,201.3
|
|
|
The increase in goodwill during the year ended
December 31, 2013
, was primarily related to the
$15.0 million
contingent payment (exclusive of a
$1.5 million
tax benefit), which became payable upon the approval of TECFIDERA in the U.S. and the
$25.0 million
contingent payment (exclusive of a
$2.8 million
tax benefit), which became payable as we reached the
$1.0 billion
cumulative sales level related to the Fumapharm Products, both made to former shareholders of Fumapharm AG and holders of their rights. For additional information related to future contingent payments, please read Note 22,
Commitments and Contingencies
to these consolidated financial statements.
For the year ended
December 31, 2013
, we also adjusted goodwill to establish a deferred tax asset related to our Stromedix transaction. For additional information related to our transaction with Stromedix, please read Note 2,
Acquisitions
to these consolidated financial statements.
As of
December 31, 2013
, we had
no
accumulated impairment losses related to goodwill.
F- 27
BIOGEN IDEC INC. AND SUBSIDIARIES
NOTES TO CONSOLIDATED FINANCIAL STATEMENTS — (Continued)
|
8.
|
Fair Value Measurements
|
The tables below present information about our assets and liabilities that are regularly measured and carried at fair value and indicate the level within the fair value hierarchy of the valuation techniques we utilized to determine such fair value:
|
(In millions)
|
As of
December 31, 2013 |
Quoted
Prices in
Active
Markets
(Level 1)
|
Significant
Other
Observable
Inputs
(Level 2)
|
Significant
Unobservable
Inputs
(Level 3)
|
|||||||||||
|
Assets:
|
|||||||||||||||
|
Cash equivalents
|
$
|
424.7
|
|
$
|
—
|
|
$
|
424.7
|
|
$
|
—
|
|
|||
|
Marketable debt securities:
|
|||||||||||||||
|
Corporate debt securities
|
439.8
|
|
—
|
|
439.8
|
|
—
|
|
|||||||
|
Government securities
|
674.7
|
|
—
|
|
674.7
|
|
—
|
|
|||||||
|
Mortgage and other asset backed securities
|
131.4
|
|
—
|
|
131.4
|
|
—
|
|
|||||||
|
Marketable equity securities
|
11.2
|
|
11.2
|
|
—
|
|
—
|
|
|||||||
|
Venture capital investments
|
21.9
|
|
—
|
|
—
|
|
21.9
|
|
|||||||
|
Derivative contracts
|
3.8
|
|
—
|
|
3.8
|
|
—
|
|
|||||||
|
Plan assets for deferred compensation
|
22.7
|
|
—
|
|
22.7
|
|
—
|
|
|||||||
|
Total
|
$
|
1,730.2
|
|
$
|
11.2
|
|
$
|
1,697.1
|
|
$
|
21.9
|
|
|||
|
Liabilities:
|
|||||||||||||||
|
Derivative contracts
|
$
|
23.5
|
|
$
|
—
|
|
$
|
23.5
|
|
$
|
—
|
|
|||
|
Contingent consideration obligations
|
280.9
|
|
—
|
|
—
|
|
280.9
|
|
|||||||
|
Total
|
$
|
304.4
|
|
$
|
—
|
|
$
|
23.5
|
|
$
|
280.9
|
|
|||
|
(In millions)
|
As of
December 31, 2012 |
Quoted
Prices
in Active
Markets
(Level 1)
|
Significant
Other
Observable
Inputs
(Level 2)
|
Significant
Unobservable
Inputs
(Level 3)
|
|||||||||||
|
Assets:
|
|||||||||||||||
|
Cash equivalents
|
$
|
439.4
|
|
$
|
—
|
|
$
|
439.4
|
|
$
|
—
|
|
|||
|
Marketable debt securities:
|
|||||||||||||||
|
Corporate debt securities
|
1,001.0
|
|
—
|
|
1,001.0
|
|
—
|
|
|||||||
|
Government securities
|
1,657.8
|
|
—
|
|
1,657.8
|
|
—
|
|
|||||||
|
Mortgage and other asset backed securities
|
512.9
|
|
—
|
|
512.9
|
|
—
|
|
|||||||
|
Marketable equity securities
|
9.0
|
|
9.0
|
|
—
|
|
—
|
|
|||||||
|
Venture capital investments
|
20.3
|
|
—
|
|
—
|
|
20.3
|
|
|||||||
|
Derivative contracts
|
1.8
|
|
—
|
|
1.8
|
|
—
|
|
|||||||
|
Plan assets for deferred compensation
|
14.3
|
|
—
|
|
14.3
|
|
—
|
|
|||||||
|
Total
|
$
|
3,656.5
|
|
$
|
9.0
|
|
$
|
3,627.2
|
|
$
|
20.3
|
|
|||
|
Liabilities:
|
|||||||||||||||
|
Derivative contracts
|
$
|
14.4
|
|
$
|
—
|
|
$
|
14.4
|
|
$
|
—
|
|
|||
|
Contingent consideration obligations
|
293.9
|
|
—
|
|
—
|
|
293.9
|
|
|||||||
|
Total
|
$
|
308.3
|
|
$
|
—
|
|
$
|
14.4
|
|
$
|
293.9
|
|
|||
The fair value of Level 2 instruments classified as cash equivalents and marketable debt securities were determined through third party pricing services. For a description of our validation procedures related to prices provided by third party pricing services, refer to Note 1,
Summary of Significant Accounting Policies: Fair Value Measurements
, to these consolidated financial statements.
F- 28
BIOGEN IDEC INC. AND SUBSIDIARIES
NOTES TO CONSOLIDATED FINANCIAL STATEMENTS — (Continued)
Marketable Equity Securities and Venture Capital Investments
Our marketable equity securities represent investments in publicly traded equity securities. Our venture capital investments, which are all Level 3 measurements, include investments in certain venture capital funds, accounted for at fair value, that primarily invest in small privately-owned, venture-backed biotechnology companies. These venture capital investments represented approximately
0.2%
of total assets of
December 31, 2013
and
2012
, respectively.
The following table provides a roll forward of the fair value of our venture capital investments, which includes Level 3 measurements:
|
|
As of December 31,
|
||||||
|
(In millions)
|
2013
|
2012
|
|||||
|
Fair value, beginning of year
|
$
|
20.3
|
|
$
|
23.5
|
|
|
|
Unrealized gains included in earnings
|
10.5
|
|
5.4
|
|
|||
|
Unrealized losses included in earnings
|
(6.3
|
)
|
(9.2
|
)
|
|||
|
Purchases
|
0.7
|
|
0.6
|
|
|||
|
Settlements
|
(3.3
|
)
|
—
|
|
|||
|
Fair value, end of year
|
$
|
21.9
|
|
$
|
20.3
|
|
|
The fair values of our debt instruments, which are Level 2 liabilities, are summarized as follows:
|
|
As of December 31,
|
||||||
|
(In millions)
|
2013
|
2012
|
|||||
|
Notes payable to Fumedica
|
$
|
17.5
|
|
$
|
20.0
|
|
|
|
Credit Facility
|
—
|
|
—
|
|
|||
|
6.0% Senior Notes due March 1, 2013
|
—
|
|
453.7
|
|
|||
|
6.875% Senior Notes due March 1, 2018
|
647.9
|
|
681.6
|
|
|||
|
Total
|
$
|
665.4
|
|
$
|
1,155.3
|
|
|
The fair value of our notes payable to Fumedica was estimated using market observable inputs, including current interest and foreign currency exchange rates. The fair value of our
6.875%
Senior Notes was determined through market, observable, and corroborated sources. For additional information related to our debt instruments, please read Note 12,
Indebtedness
to these consolidated financial statements.
Contingent Consideration Obligations
The following table provides a roll forward of the fair values of our contingent consideration obligations which includes Level 3 measurements:
|
|
As of December 31,
|
||||||
|
(In millions)
|
2013
|
2012
|
|||||
|
Fair value, beginning of year
|
$
|
293.9
|
|
$
|
151.0
|
|
|
|
Additions
|
—
|
|
122.2
|
|
|||
|
Changes in fair value
|
(0.5
|
)
|
27.2
|
|
|||
|
Payments
|
(12.5
|
)
|
(6.5
|
)
|
|||
|
Fair value, end of year
|
$
|
280.9
|
|
$
|
293.9
|
|
|
As of
December 31, 2013
and
2012
, approximately
$251.9 million
and
$271.5 million
, respectively, of the fair value of our total contingent consideration obligations were reflected as components of other long-term liabilities within our consolidated balance sheets with the remaining balances reflected as a component of accrued expenses and other.
F- 29
BIOGEN IDEC INC. AND SUBSIDIARIES
NOTES TO CONSOLIDATED FINANCIAL STATEMENTS — (Continued)
In connection with our acquisition of Stromedix in March 2012, we recorded a contingent consideration obligation of
$122.2 million
. This valuation was based on probability weighted net cash outflow projections of
$487.5 million
, discounted using a rate of
4.4%
, which is a measure of the credit risk associated with settling the liability. As of
December 31, 2013
and
2012
, the fair value of this contingent consideration obligation was
$140.7 million
and
$135.3 million
, respectively. Our most recent valuation was determined based upon probability weighted net cash outflow projections discounted using a rate of
3.8%
. For
2013
compared to
2012
, the net increase in the fair value of this obligation was primarily due to changes in the discount rate and in the probability and expected timing related to the achievement of certain developmental milestones.
Upon completion of our purchase of the noncontrolling interest in our joint venture investments in Biogen Dompé SRL and Biogen Dompé Switzerland GmbH in September 2011, we recorded a contingent consideration obligation of
$38.8 million
. As of
December 31, 2013
and
2012
, the fair value of this contingent consideration obligation was
$31.6 million
and
$29.8 million
, respectively. Our most recent valuation was determined based upon probability weighted net cash outflow projections of
$38.5 million
, discounted using a rate of
1.5%
, which is a measure of the credit risk associated with settling the liability. For
2013
compared to
2012
, the net increase in the fair value of this obligation was primarily due to changes in the probability and expected timing related to the achievement of certain cumulative sales-based and developmental milestones and in the discount rate. For
2012
compared to
2011
, the net decrease in the fair value of this obligation was primarily due to changes in the probability and expected timing related to the achievement of certain cumulative sales-based and developmental milestones and in the discount rate as well as the payment of a
$4.0 million
regulatory approval milestone.
In connection with our acquisition of Biogen Idec International Neuroscience GmbH (BIN), formerly Panima Pharmaceuticals AG (Panima), in December 2010, we recorded a contingent consideration obligation of
$81.2 million
. As of
December 31, 2013
and
2012
, the fair value of this contingent consideration obligation was
$108.6 million
and
$128.8 million
, respectively. Our most recent valuation was determined based upon probability weighted net cash outflow projections of
$375.0 million
, discounted using a rate of
3.8%
, which is a measure of the credit risk associated with settling the liability. For
2013
compared to
2012
, the net decrease in the fair value of this obligation was primarily due to changes in the probability and expected timing related to the achievement of certain remaining developmental milestones and in the discount rate as well as payments of
$12.5 million
developmental milestones. For
2012
compared to
2011
, the net increase in the fair value of this obligation was primarily due to changes in the discount rate and in the probability and expected timing related to the achievement of certain remaining developmental milestones, offset by a payment of a
$2.5 million
developmental milestone.
Acquired IPR&D
In connection with our acquisition of Stromedix, we allocated
$219.2 million
of the total purchase price to acquired IPR&D, which was capitalized as an intangible asset. The amount allocated to acquired IPR&D was based on significant inputs not observable in the market and thus represented a Level 3 fair value measurement. These assets are tested for impairment annually, and whenever events or changes in circumstances indicate that the carrying value of the assets might not be recoverable, until commercialization, after which time the IPR&D is amortized over its estimated economic life. For a more detailed description of this transaction, please read Note 2,
Acquisitions
to these consolidated financial statements.
There were
no
changes in valuation techniques or inputs utilized or transfers between fair value measurement levels during the years ended
December 31, 2013
and
2012
. For additional information related to the valuation techniques and inputs utilized in valuation of our financial assets and liabilities, please read Note 1,
Summary of Significant Accounting Policies
to these consolidated financial statements.
F- 30
BIOGEN IDEC INC. AND SUBSIDIARIES
NOTES TO CONSOLIDATED FINANCIAL STATEMENTS — (Continued)
9. Financial Instruments
On April 2, 2013, we used
$3.25 billion
to fund the upfront payment in connection with our acquisition of the TYSABRI rights.
Marketable Securities
The following tables summarize our marketable debt and equity securities:
|
As of December 31, 2013 (In millions)
|
Fair
Value
|
Gross
Unrealized
Gains
|
Gross
Unrealized
Losses
|
Amortized
Cost
|
|||||||||||
|
Available-for-sale:
|
|||||||||||||||
|
Corporate debt securities
|
|||||||||||||||
|
Current
|
$
|
100.7
|
|
$
|
—
|
|
$
|
—
|
|
$
|
100.7
|
|
|||
|
Non-current
|
339.1
|
|
0.4
|
|
(0.1
|
)
|
338.8
|
|
|||||||
|
Government securities
|
|||||||||||||||
|
Current
|
519.5
|
|
—
|
|
—
|
|
519.5
|
|
|||||||
|
Non-current
|
155.2
|
|
—
|
|
(0.1
|
)
|
155.3
|
|
|||||||
|
Mortgage and other asset backed securities
|
|||||||||||||||
|
Current
|
—
|
|
—
|
|
—
|
|
—
|
|
|||||||
|
Non-current
|
131.4
|
|
—
|
|
(0.1
|
)
|
131.5
|
|
|||||||
|
Total marketable debt securities
|
$
|
1,245.9
|
|
$
|
0.4
|
|
$
|
(0.3
|
)
|
$
|
1,245.8
|
|
|||
|
Marketable equity securities, non-current
|
$
|
11.2
|
|
$
|
8.7
|
|
$
|
—
|
|
$
|
2.5
|
|
|||
|
As of December 31, 2012 (In millions)
|
Fair
Value
|
Gross
Unrealized
Gains
|
Gross
Unrealized
Losses
|
Amortized
Cost
|
|||||||||||
|
Available-for-sale:
|
|||||||||||||||
|
Corporate debt securities
|
|||||||||||||||
|
Current
|
$
|
346.9
|
|
$
|
0.3
|
|
$
|
—
|
|
$
|
346.6
|
|
|||
|
Non-current
|
654.1
|
|
2.8
|
|
(0.6
|
)
|
651.9
|
|
|||||||
|
Government securities
|
|||||||||||||||
|
Current
|
783.4
|
|
0.3
|
|
—
|
|
783.1
|
|
|||||||
|
Non-current
|
874.4
|
|
0.8
|
|
—
|
|
873.6
|
|
|||||||
|
Mortgage and other asset backed securities
|
|||||||||||||||
|
Current
|
4.8
|
|
—
|
|
—
|
|
4.8
|
|
|||||||
|
Non-current
|
508.1
|
|
1.4
|
|
(1.3
|
)
|
508.0
|
|
|||||||
|
Total marketable debt securities
|
$
|
3,171.7
|
|
$
|
5.6
|
|
$
|
(1.9
|
)
|
$
|
3,168.0
|
|
|||
|
Marketable equity securities, non-current
|
$
|
9.0
|
|
$
|
3.0
|
|
$
|
—
|
|
$
|
6.0
|
|
|||
The following table summarizes our financial assets with maturities of
less than 90 days
from the date of purchase included within cash and cash equivalents on the accompanying consolidated balance sheet:
|
|
As of December 31,
|
||||||
|
(In millions)
|
2013
|
2012
|
|||||
|
Commercial paper
|
$
|
1.2
|
|
$
|
40.7
|
|
|
|
Overnight reverse repurchase agreements
|
22.4
|
|
67.4
|
|
|||
|
Short-term debt securities
|
401.1
|
|
331.3
|
|
|||
|
Total
|
$
|
424.7
|
|
$
|
439.4
|
|
|
The carrying values of our commercial paper, including accrued interest, overnight reverse repurchase agreements, and our short-term debt securities approximate fair value due to their short term maturities.
F- 31
BIOGEN IDEC INC. AND SUBSIDIARIES
NOTES TO CONSOLIDATED FINANCIAL STATEMENTS — (Continued)
Summary of Contractual Maturities: Available-for-Sale Securities
The estimated fair value and amortized cost of our marketable debt securities available-for-sale by contractual maturity are summarized as follows:
|
|
As of December 31, 2013
|
As of December 31, 2012
|
|||||||||||||
|
(In millions)
|
Estimated
Fair Value
|
Amortized
Cost
|
Estimated
Fair Value
|
Amortized
Cost
|
|||||||||||
|
Due in one year or less
|
$
|
620.2
|
|
$
|
620.2
|
|
$
|
1,135.0
|
|
$
|
1,134.5
|
|
|||
|
Due after one year through five years
|
573.1
|
|
572.9
|
|
1,744.3
|
|
1,741.2
|
|
|||||||
|
Due after five years
|
52.6
|
|
52.7
|
|
292.4
|
|
292.3
|
|
|||||||
|
Total available-for-sale securities
|
$
|
1,245.9
|
|
$
|
1,245.8
|
|
$
|
3,171.7
|
|
$
|
3,168.0
|
|
|||
The average maturity of our marketable debt securities available-for-sale as of
December 31, 2013
and
2012
, was
13
months and
14
months, respectively.
Proceeds from Marketable Debt Securities
The proceeds from maturities and sales of marketable debt securities and resulting realized gains and losses are summarized as follows:
|
|
For the Years Ended December 31,
|
||||||||||
|
(In millions)
|
2013
|
2012
|
2011
|
||||||||
|
Proceeds from maturities and sales
|
$
|
5,190.1
|
|
$
|
2,749.6
|
|
$
|
2,276.7
|
|
||
|
Realized gains
|
$
|
6.6
|
|
$
|
2.1
|
|
$
|
3.9
|
|
||
|
Realized losses
|
$
|
2.1
|
|
$
|
3.5
|
|
$
|
2.3
|
|
||
Realized losses for the year ended
December 31, 2013
, primarily relate to sales of agency mortgage-backed securities and corporate securities. Realized losses for the year ended
December 31, 2012
, primarily relate to sales of agency mortgage-backed securities. Realized losses for the year ended
December 31, 2011
, primarily relate to the sale of government and corporate securities.
Strategic Investments
As of
December 31, 2013
and
2012
, our strategic investment portfolio was comprised of investments totaling
$56.9 million
and
$64.2 million
, respectively, which are included in investments and other assets in our accompanying consolidated balance sheets.
Our strategic investment portfolio includes investments in marketable equity securities of certain biotechnology companies and our investments in venture capital funds accounted for at fair value which totaled
$33.1 million
and
$29.3 million
as of
December 31, 2013
and
2012
, respectively. Our strategic investment portfolio also includes other equity investments in privately-held companies and additional investments in venture capital funds accounted for under the cost method. The carrying value of these investments totaled
$23.8 million
and
$34.9 million
, as of
December 31, 2013
and
2012
, respectively.
Changes in Fair Value
During the years ended
December 31, 2013
,
2012
, and
2011
, we realized changes in fair value recorded through income of
$14.4 million
,
$6.5 million
and
$7.3 million
, respectively, on our strategic investment portfolio. In 2013, we sold our stock in Portola for a gain of
$7.1 million
. Included within changes in fair value recognized during the year ended
December 31, 2012
, was a gain of
$9.0 million
recognized upon our acquisition of Stromedix as we previously held an equity interest. For a more detailed description of this transaction, please read Note 2,
Acquisitions
to these consolidated financial statements. In
2011
we sold
four
strategic investments for
$40.6 million
, which resulted in a net gain of
$13.5 million
.
Impairments
During the years ended
December 31, 2013
,
2012
, and
2011
, we recognized impairment charges on our marketable equity securities of certain biotechnology companies, investments in venture capital funds accounted for under the cost method and investments in privately-held companies totaling
$2.8 million
,
$5.5 million
, and
$9.9 million
, respectively.
F- 32
BIOGEN IDEC INC. AND SUBSIDIARIES
NOTES TO CONSOLIDATED FINANCIAL STATEMENTS — (Continued)
|
10.
|
Derivative Instruments
|
Foreign Currency Forward Contracts - Hedging Instruments
Due to the global nature of our operations, portions of our revenues are earned in currencies other than the U.S. dollar. The value of revenues measured in U.S. dollars is therefore subject to changes in foreign currency exchange rates. In order to mitigate these changes we use foreign currency forward contracts to lock in exchange rates associated with a portion of our forecasted international revenues.
Foreign currency forward contracts in effect as of
December 31, 2013
and
2012
, had durations of
1
to
18 months
and
1
to
12 months
, respectively. These contracts have been designated as cash flow hedges and accordingly, to the extent effective, any unrealized gains or losses on these foreign currency forward contracts are reported in accumulated other comprehensive income (loss) (referred to as AOCI in the tables below). Realized gains and losses for the effective portion of such contracts are recognized in revenue when the sale of product in the currency being hedged is recognized. To the extent ineffective, hedge transaction gains and losses are reported in other income (expense), net.
The notional value of foreign currency forward contracts that were entered into to hedge forecasted revenues is summarized as follows:
|
|
Notional Amount
As of December 31,
|
||||||
|
Foreign Currency: (In millions)
|
2013
|
2012
|
|||||
|
Euro
|
$
|
636.3
|
|
$
|
492.2
|
|
|
|
Canadian dollar
|
34.0
|
|
31.8
|
|
|||
|
British pound sterling
|
72.3
|
|
—
|
|
|||
|
Total foreign currency forward contracts
|
$
|
742.6
|
|
$
|
524.0
|
|
|
The portion of the fair value of these foreign currency forward contracts that was included in accumulated other comprehensive income (loss) within total equity reflected losses of
$23.6 million
and
$11.8 million
and gains of
$36.5 million
for the years ended
December 31, 2013
,
2012
and
2011
, respectively. We expect all contracts to be settled over the next
18 months
and any amounts in accumulated other comprehensive income (loss) to be reported as an adjustment to revenue. We consider the impact of our and our counterparties’ credit risk on the fair value of the contracts as well as the ability of each party to execute its contractual obligations. As of
December 31, 2013
and
2012
, respectively, credit risk did not change the fair value of our foreign currency forward contracts.
The following table summarizes the effect of derivatives designated as hedging instruments on our consolidated statements of income:
|
For the Years Ended December 31,
|
||||||||||||||||||||||||||
|
Net Gains/(Losses)
Reclassified from AOCI into Net Income
(Effective Portion)
|
Net Gains/(Losses)
Recognized into Net Income
(Ineffective Portion)
|
|||||||||||||||||||||||||
|
Location
|
2013
|
2012
|
2011
|
Location
|
2013
|
2012
|
2011
|
|||||||||||||||||||
|
Revenue
|
$
|
(13.2
|
)
|
$
|
35.1
|
|
$
|
(36.9
|
)
|
Other income (expense)
|
$
|
(0.2
|
)
|
$
|
4.8
|
|
$
|
(3.9
|
)
|
|||||||
Foreign Currency Forward Contracts - Other Derivatives
We also enter into other foreign currency forward contracts, usually with one month durations, to mitigate the foreign currency risk related to certain balance sheet positions. We have not elected hedge accounting for these transactions.
The aggregate notional amount of these outstanding foreign currency contracts was
$273.3 million
and
$243.2 million
as of
December 31, 2013
and
2012
, respectively. Net gains of
$5.2 million
,
$4.2 million
and
$12.1 million
related to these contracts were recognized as a component of other income (expense), net, for years ended
December 31, 2013
,
2012
and
2011
, respectively.
F- 33
BIOGEN IDEC INC. AND SUBSIDIARIES
NOTES TO CONSOLIDATED FINANCIAL STATEMENTS — (Continued)
Summary of Derivatives
While certain of our derivatives are subject to netting arrangements with our counterparties, we do not offset derivative assets and liabilities within our consolidated balance sheets.
The following table summarizes the fair value and presentation in our consolidated balance sheets for our outstanding derivatives including those designated as hedging instruments:
|
(In millions)
|
Balance Sheet Location
|
Fair Value
As of December 31, 2013 |
||
|
Hedging Instruments:
|
||||
|
Asset derivatives
|
Other current assets
|
$
|
0.6
|
|
|
Liability derivatives
|
Accrued expenses and other
|
$
|
23.4
|
|
|
Other Derivatives:
|
||||
|
Asset derivatives
|
Other current assets
|
$
|
3.2
|
|
|
Liability derivatives
|
Accrued expenses and other
|
$
|
0.1
|
|
|
(In millions)
|
Balance Sheet Location
|
Fair Value
As of December 31, 2012 |
||
|
Hedging Instruments:
|
||||
|
Asset derivatives
|
Other current assets
|
$
|
0.6
|
|
|
Liability derivatives
|
Accrued expenses and other
|
$
|
11.5
|
|
|
Other Derivatives:
|
||||
|
Asset derivatives
|
Other current assets
|
$
|
1.2
|
|
|
Liability derivatives
|
Accrued expenses and other
|
$
|
2.9
|
|
|
11.
|
Property, Plant and Equipment
|
Property, plant and equipment are recorded at historical cost, net of accumulated depreciation. Components of property, plant and equipment, net are summarized as follows:
|
|
As of December 31,
|
||||||
|
(In millions)
|
2013
|
2012
|
|||||
|
Land
|
$
|
59.7
|
|
$
|
55.7
|
|
|
|
Buildings
|
961.5
|
|
902.5
|
|
|||
|
Leasehold improvements
|
139.6
|
|
107.3
|
|
|||
|
Machinery and equipment
|
944.5
|
|
882.0
|
|
|||
|
Computer software and hardware
|
559.2
|
|
476.6
|
|
|||
|
Furniture and fixtures
|
60.3
|
|
46.9
|
|
|||
|
Construction in progress
|
144.2
|
|
212.3
|
|
|||
|
Total cost
|
2,869.0
|
|
2,683.3
|
|
|||
|
Less: accumulated depreciation
|
(1,118.3
|
)
|
(941.1
|
)
|
|||
|
Total property, plant and equipment, net
|
$
|
1,750.7
|
|
$
|
1,742.2
|
|
|
Depreciation expense totaled
$187.8 million
,
$164.3 million
and
$143.9 million
for
2013
,
2012
and
2011
, respectively.
For
2013
,
2012
and
2011
, we capitalized interest costs related to construction in progress totaling approximately
$7.8 million
,
$25.4 million
and
$32.6 million
, respectively.
Cambridge Leases
In July 2011, we executed leases for two office buildings to be constructed in Cambridge, Massachusetts. Construction of these facilities began in late 2011. In accordance with accounting guidance applicable to entities involved with the construction of an asset that will be leased when the construction is completed, we were considered the owner of these properties during the construction period. Accordingly, we recorded an asset and a corresponding financing obligation on our consolidated balance sheet for the amount of costs incurred related to the construction for these buildings.
F- 34
BIOGEN IDEC INC. AND SUBSIDIARIES
NOTES TO CONSOLIDATED FINANCIAL STATEMENTS — (Continued)
In July and November 2013, the construction of the two office buildings was completed and we started leasing the facilities. Upon completion of the construction of the buildings, we determined that we are no longer considered the owner of the buildings because we do not have any unusual or significant continuing involvement. Consequently, we derecognized the buildings and their associated financing obligation of approximately
$161.5 million
from our consolidated balance sheet. As of
December 31, 2012
, the amount recorded within our consolidated balance sheet as property, plant and equipment and financing obligation totaled approximately
$86.5 million
.
As a result of our decision to relocate our corporate headquarters to Cambridge, Massachusetts, we vacated part of our Weston, Massachusetts facility in the fourth quarter of 2013. We incurred a charge of
$27.2 million
in connection with this move. This charge represents our remaining lease obligation for the vacated portion of our Weston facility, net of sublease income expected to be received. The term of our sublease to the vacated portion of our Weston facility started in January 2014 and will continue through the remaining term of our lease agreement.
In addition, this decision has shortened the expected useful lives of certain leasehold improvements and other assets at our Weston facility. During the years ended
December 31, 2013
,
2012
and
2011
, approximately
$6.2 million
,
$11.4 million
and
$4.7 million
of additional depreciation was recognized.
Hillerød, Denmark Facility
As of September 2012, our large-scale biologics manufacturing facility in Hillerød, Denmark was ready for its intended use as we began the process of manufacturing clinical products for sale to third parties. As a result, we transferred
$465.9 million
from construction in progress to various fixed asset accounts. We ceased capitalizing a majority of the interest expense and began recording depreciation on the various assets during the third quarter of 2012. The average estimated useful life for the facility and its assets is
20 years
. In July 2013, the facility was approved by the FDA and EMA for the manufacture of commercial TYSABRI.
Research Triangle Park (RTP) Lease
In December 2012, we entered into an arrangement with Eisai, Inc. (Eisai) to lease a portion of their facility in RTP to manufacture our and Eisai's oral solid dose products and for Eisai to provide us with vial-filling services for biologic therapies and packaging services for oral solid dose products. The
10
year operating lease agreement, which is cancellable after
5
years, became effective in February 2013 and gives us the option to purchase the facility.
|
12.
|
Indebtedness
|
Our indebtedness is summarized as follows:
|
|
As of December 31,
|
||||||
|
(In millions)
|
2013
|
2012
|
|||||
|
Current portion:
|
|||||||
|
6.0% Senior notes due March 1, 2013
|
$
|
—
|
|
$
|
450.0
|
|
|
|
Note payable to Fumedica
|
3.5
|
|
3.4
|
|
|||
|
Credit facility
|
—
|
|
—
|
|
|||
|
Current portion of notes payable and line of credit
|
$
|
3.5
|
|
$
|
453.4
|
|
|
|
Non-current portion:
|
|||||||
|
6.875% Senior notes due March 1, 2018
|
580.1
|
|
586.4
|
|
|||
|
Note payable to Fumedica
|
12.3
|
|
14.5
|
|
|||
|
Financing arrangement for the construction of the Cambridge facilities
|
—
|
|
86.5
|
|
|||
|
Non-current portion of notes payable and other financing arrangements
|
$
|
592.4
|
|
$
|
687.4
|
|
|
F- 35
BIOGEN IDEC INC. AND SUBSIDIARIES
NOTES TO CONSOLIDATED FINANCIAL STATEMENTS — (Continued)
The following is a summary description of our principal indebtedness as of
December 31, 2013
:
Senior Notes
On March 4, 2008, we issued
$450.0 million
aggregate principal amount of
6.0%
Senior Notes due March 1, 2013 and
$550.0 million
aggregate principal amount of
6.875%
Senior Notes due March 1, 2018 that were originally priced at
99.886%
and
99.184%
of par, respectively. The discount is amortized as additional interest expense over the period from issuance through maturity. These notes are senior unsecured obligations. Interest on the notes is payable March 1 and September 1 of each year. The notes may be redeemed at our option at any time at
100%
of the principal amount plus accrued interest and a specified make-whole amount. The notes contain a change of control provision that may require us to purchase the notes under certain circumstances. There is also an interest rate adjustment feature that requires us to pay interest at an increased rate on the notes if the credit rating on the notes declines below investment grade.
Upon the issuance of the
6.875%
Senior Notes due in 2018, we entered into interest rate swap contracts where we received a fixed rate and paid a variable rate. These contracts were terminated in December 2008. Upon termination of these swaps, the carrying amount of the
6.875%
Senior Notes due in 2018 was increased by
$62.8 million
and is being amortized using the effective interest rate method over the remaining life of the Senior Notes and is being recognized as a reduction of interest expense. As of
December 31, 2013
,
$32.4 million
remains to be amortized.
On March 1, 2013, we repaid the
$450.0 million
principal amount of our
6.0%
Senior Notes.
Notes Payable to Fumedica
In connection with our 2006 distribution agreement with Fumedica, we issued notes totaling
61.4 million
Swiss Francs which were payable to Fumedica in varying amounts from June 2008 through June 2018. Our remaining note payable to Fumedica had a present value of
14.0 million
Swiss Francs (
$15.8 million
) and
16.4 million
Swiss Francs (
$17.9 million
) as of
December 31, 2013
and
2012
, respectively.
Credit Facility
In March 2013, we entered into a
$750.0 million
senior unsecured revolving credit facility, which we may choose to use for working capital and general corporate purposes. The terms of this revolving credit facility include a financial covenant that requires us to not exceed a maximum debt to EBITDA ratio. This facility terminates in March 2014. As of
December 31, 2013
, we had
no
outstanding borrowings and were in compliance with all covenants under this facility.
Financing Arrangements
During 2011 we recorded a financing obligation in relation to the construction of the two office buildings in Cambridge, Massachusetts. In July and November 2013, the construction of the two office buildings was completed and we derecognized the buildings and associated financing obligation. As of
December 31, 2012
, the amount recorded within our consolidated balance sheet as a financing obligation totaled approximately
$86.5 million
. For additional information related to these transactions, please read Note 11,
Property, Plant & Equipment
to these consolidated financial statements.
Debt Maturity
The total gross payments due under our debt arrangements are as follows:
|
(In millions)
|
As of December 31, 2013
|
||
|
2014
|
$
|
3.5
|
|
|
2015
|
3.6
|
|
|
|
2016
|
3.6
|
|
|
|
2017
|
3.6
|
|
|
|
2018
|
553.6
|
|
|
|
2019 and thereafter
|
—
|
|
|
|
Total
|
$
|
567.9
|
|
The fair value of our debt is disclosed in Note 8,
Fair Value Measurements
to these consolidated financial statements.
F- 36
BIOGEN IDEC INC. AND SUBSIDIARIES
NOTES TO CONSOLIDATED FINANCIAL STATEMENTS — (Continued)
|
13.
|
Equity
|
Preferred Stock
The following table describes the number of shares authorized, issued and outstanding of our preferred stock as of
December 31, 2013
and
2012
:
|
|
As of December 31, 2013
|
As of December 31, 2012
|
|||||||||||||||
|
(In thousands)
|
Authorized
|
Issued
|
Outstanding
|
Authorized
|
Issued
|
Outstanding
|
|||||||||||
|
Series A
|
1,750
|
|
—
|
|
—
|
|
1,750
|
|
—
|
|
—
|
|
|||||
|
Series X junior participating
|
1,000
|
|
—
|
|
—
|
|
1,000
|
|
—
|
|
—
|
|
|||||
|
Undesignated
|
5,250
|
|
—
|
|
—
|
|
5,250
|
|
—
|
|
—
|
|
|||||
|
Total preferred stock
|
8,000
|
|
—
|
|
—
|
|
8,000
|
|
—
|
|
—
|
|
|||||
We have
8,000,000
shares of Preferred Stock authorized. Shares may be issued without a vote or action of stockholders from time to time in classes or series with the designations, powers, preferences, and the relative, participating, optional or other special rights of the shares of each such class or series and any qualifications, limitations or restrictions thereon as set forth in the instruments governing such shares. Any such Preferred Stock may rank prior to common stock as to dividend rights, liquidation preference or both, and may have full or limited voting rights and may be convertible into shares of common stock.
Common Stock
The following table describes the number of shares authorized, issued and outstanding of our common stock as of
December 31, 2013
and
2012
:
|
|
As of December 31, 2013
|
As of December 31, 2012
|
|||||||||||||||
|
(In thousands)
|
Authorized
|
Issued
|
Outstanding
|
Authorized
|
Issued
|
Outstanding
|
|||||||||||
|
Common stock
|
1,000,000
|
|
255,973
|
|
236,332
|
|
1,000,000
|
|
254,237
|
|
236,582
|
|
|||||
Share Repurchases
In February 2011, our Board of Directors authorized the repurchase of up to
20.0 million
shares of common stock. This authorization does not have an expiration date. In
2013
, approximately
2.0 million
shares were repurchased at a cost of
$400.3 million
.
We repurchased approximately
7.8 million
shares at a cost of approximately
$984.7 million
under the 2011 authorization in
2012
.
Approximately
4.2 million
shares of our common stock remain available for repurchase under the 2011 authorization.
|
14.
|
Accumulated Other Comprehensive Income (Loss)
|
The following table summarizes the changes in accumulated other comprehensive income (loss), net of tax by component:
|
(In millions)
|
Unrealized Gains (Losses) on Securities Available for Sale
|
Unrealized Gains (Losses) on Foreign Currency Forward Contracts
|
Unfunded Status of Postretirement Benefit Plans
|
Translation Adjustments
|
Total
|
||||||||||||||
|
Balance, December 31, 2012
|
$
|
4.2
|
|
$
|
(10.7
|
)
|
$
|
(21.7
|
)
|
$
|
(27.1
|
)
|
$
|
(55.3
|
)
|
||||
|
Other comprehensive income (loss) before reclassifications
|
11.8
|
|
(26.7
|
)
|
2.1
|
|
37.1
|
|
24.3
|
|
|||||||||
|
Amounts reclassified from accumulated other comprehensive income (loss)
|
(10.4
|
)
|
13.7
|
|
—
|
|
—
|
|
3.3
|
|
|||||||||
|
Net current period other comprehensive income (loss)
|
1.4
|
|
(13.0
|
)
|
2.1
|
|
37.1
|
|
27.6
|
|
|||||||||
|
Balance, December 31, 2013
|
$
|
5.6
|
|
$
|
(23.7
|
)
|
$
|
(19.6
|
)
|
$
|
10.0
|
|
$
|
(27.7
|
)
|
||||
F- 37
BIOGEN IDEC INC. AND SUBSIDIARIES
NOTES TO CONSOLIDATED FINANCIAL STATEMENTS — (Continued)
|
(In millions)
|
Unrealized Gains (Losses) on Securities Available for Sale
|
Unrealized Gains (Losses) on Foreign Currency Forward Contracts
|
Unfunded Status of Postretirement Benefit Plans
|
Translation Adjustments
|
Total
|
||||||||||||||
|
Balance, December 31, 2011
|
$
|
—
|
|
$
|
32.8
|
|
$
|
(9.0
|
)
|
$
|
(50.3
|
)
|
$
|
(26.5
|
)
|
||||
|
Other comprehensive income (loss) before reclassifications
|
5.1
|
|
(11.8
|
)
|
(12.7
|
)
|
23.2
|
|
3.8
|
|
|||||||||
|
Amounts reclassified from accumulated other comprehensive income (loss)
|
(0.9
|
)
|
(31.7
|
)
|
—
|
|
—
|
|
(32.6
|
)
|
|||||||||
|
Net current period other comprehensive income (loss)
|
4.2
|
|
(43.5
|
)
|
(12.7
|
)
|
23.2
|
|
(28.8
|
)
|
|||||||||
|
Balance, December 31, 2012
|
$
|
4.2
|
|
$
|
(10.7
|
)
|
$
|
(21.7
|
)
|
$
|
(27.1
|
)
|
$
|
(55.3
|
)
|
||||
|
(In millions)
|
Unrealized Gains (Losses) on Securities Available for Sale
|
Unrealized Gains (Losses) on Foreign Currency Forward Contracts
|
Unfunded Status of Postretirement Benefit Plans
|
Translation Adjustments
|
Total
|
||||||||||||||
|
Balance, December 31, 2010
|
$
|
12.4
|
|
$
|
(9.8
|
)
|
$
|
0.2
|
|
$
|
(24.4
|
)
|
$
|
(21.6
|
)
|
||||
|
Other comprehensive income (loss) before reclassifications
|
(0.2
|
)
|
32.8
|
|
(9.2
|
)
|
(25.9
|
)
|
(2.5
|
)
|
|||||||||
|
Amounts reclassified from accumulated other comprehensive income (loss)
|
(12.2
|
)
|
9.8
|
|
—
|
|
—
|
|
(2.4
|
)
|
|||||||||
|
Net current period other comprehensive income (loss)
|
(12.4
|
)
|
42.6
|
|
(9.2
|
)
|
(25.9
|
)
|
(4.9
|
)
|
|||||||||
|
Balance, December 31, 2011
|
$
|
—
|
|
$
|
32.8
|
|
$
|
(9.0
|
)
|
$
|
(50.3
|
)
|
$
|
(26.5
|
)
|
||||
The following table summarizes the amounts reclassified from accumulated other comprehensive income:
|
(In millions)
|
Income Statement Location
|
Amounts Reclassified from
Accumulated Other Comprehensive Income
|
||||||||||
|
For the Years Ended December 31,
|
||||||||||||
|
2013
|
2012
|
2011
|
||||||||||
|
Gains (losses) on securities available for sale
|
Other income (expense)
|
$
|
15.9
|
|
$
|
1.4
|
|
$
|
19.4
|
|
||
|
Income tax benefit (expense)
|
(5.5
|
)
|
(0.5
|
)
|
(7.2
|
)
|
||||||
|
Gains (losses) on foreign currency forward contracts
|
Revenues
|
(13.2
|
)
|
35.1
|
|
(11.1
|
)
|
|||||
|
Income tax benefit (expense)
|
(0.5
|
)
|
(3.4
|
)
|
1.3
|
|
||||||
|
Total reclassifications, net of tax
|
$
|
(3.3
|
)
|
$
|
32.6
|
|
$
|
2.4
|
|
|||
Securities Available for Sale
Balances included within accumulated other comprehensive income (loss) related to unrealized gains (losses) on securities available for sale are shown net of tax of
$3.3 million
and
$2.5 million
as of
December 31, 2013
and
2012
, respectively. Other comprehensive income (loss) before reclassifications recognized during the years ended
December 31, 2013
,
2012
and
2011
are shown net of tax of
$6.4 million
,
$2.9 million
and
$0.1 million
, respectively.
Foreign Currency Forward Contracts
Balances included within accumulated other comprehensive income (loss) related to unrealized gains (losses) on foreign currency forward contracts are shown net of tax of
$0.1 million
and
$1.1 million
as of
December 31, 2013
and
2012
, respectively. Other comprehensive income (loss) before reclassifications recognized during the years ended
December 31, 2013
,
2012
and
2011
are shown net of tax of
$1.7 million
,
$1.4 million
and
$3.6 million
, respectively.
F- 38
BIOGEN IDEC INC. AND SUBSIDIARIES
NOTES TO CONSOLIDATED FINANCIAL STATEMENTS — (Continued)
Postretirement Benefit Plans
Tax amounts related to the unfunded status of pension and retirement benefit plans were immaterial for all amounts presented. For discussion of the unfunded status of pension and retirement benefit plans, please read Note 24,
Employee Benefit Plans
to these consolidated financial statements.
|
15.
|
Earnings per Share
|
Basic and diluted earnings per share are calculated as follows:
|
|
For the Years Ended December 31,
|
||||||||||
|
(In millions)
|
2013
|
2012
|
2011
|
||||||||
|
Numerator:
|
|||||||||||
|
Net income attributable to Biogen Idec Inc.
|
$
|
1,862.3
|
|
$
|
1,380.0
|
|
$
|
1,234.4
|
|
||
|
Adjustment for net income allocable to preferred stock
|
—
|
|
—
|
|
(0.5
|
)
|
|||||
|
Net income used in calculating basic and diluted earnings per share
|
$
|
1,862.3
|
|
$
|
1,380.0
|
|
$
|
1,233.9
|
|
||
|
Denominator:
|
|||||||||||
|
Weighted average number of common shares outstanding
|
236.9
|
|
237.9
|
|
242.4
|
|
|||||
|
Effect of dilutive securities:
|
|||||||||||
|
Stock options and employee stock purchase plan
|
0.3
|
|
0.5
|
|
1.0
|
|
|||||
|
Time-vested restricted stock units
|
0.8
|
|
1.0
|
|
1.3
|
|
|||||
|
Market stock units
|
0.3
|
|
0.3
|
|
0.3
|
|
|||||
|
Dilutive potential common shares
|
1.4
|
|
1.8
|
|
2.6
|
|
|||||
|
Shares used in calculating diluted earnings per share
|
238.3
|
|
239.7
|
|
245.0
|
|
|||||
Amounts excluded from the calculation of net income per diluted share because their effects were anti-dilutive were insignificant.
Earnings per share for the years ended
December 31, 2013
,
2012
and
2011
, reflects, on a weighted average basis, the repurchase of
0.9 million
shares,
5.8 million
shares and
6.0 million
shares, respectively, of our common stock under our share repurchase authorizations.
|
16.
|
Share-based Payments
|
Share-based Compensation Expense
The following table summarizes share-based compensation expense included within our consolidated statements of income:
|
|
For the Years Ended December 31,
|
||||||||||
|
(In millions)
|
2013
|
2012
|
2011
|
||||||||
|
Research and development
|
$
|
95.6
|
|
$
|
74.7
|
|
$
|
62.0
|
|
||
|
Selling, general and administrative
|
160.3
|
|
109.6
|
|
88.7
|
|
|||||
|
Restructuring charges
|
—
|
|
—
|
|
(0.6
|
)
|
|||||
|
Subtotal
|
255.9
|
|
184.3
|
|
150.1
|
|
|||||
|
Capitalized share-based compensation costs
|
(9.8
|
)
|
(5.4
|
)
|
(4.5
|
)
|
|||||
|
Share-based compensation expense included in total cost and expenses
|
246.1
|
|
178.9
|
|
145.6
|
|
|||||
|
Income tax effect
|
(73.3
|
)
|
(53.4
|
)
|
(44.6
|
)
|
|||||
|
Share-based compensation expense included in net income attributable to Biogen Idec Inc.
|
$
|
172.8
|
|
$
|
125.5
|
|
$
|
101.0
|
|
||
F- 39
BIOGEN IDEC INC. AND SUBSIDIARIES
NOTES TO CONSOLIDATED FINANCIAL STATEMENTS — (Continued)
The following table summarizes share-based compensation expense associated with each of our share-based compensation programs:
|
|
For the Years Ended December 31,
|
||||||||||
|
(In millions)
|
2013
|
2012
|
2011
|
||||||||
|
Stock options
|
$
|
0.6
|
|
$
|
2.3
|
|
$
|
5.9
|
|
||
|
Market stock units
|
32.8
|
|
23.3
|
|
14.6
|
|
|||||
|
Time-vested restricted stock units
|
103.5
|
|
93.0
|
|
89.6
|
|
|||||
|
Performance-vested restricted stock units settled in shares
|
—
|
|
0.1
|
|
1.0
|
|
|||||
|
Cash settled performance shares
|
109.8
|
|
60.4
|
|
32.7
|
|
|||||
|
Employee stock purchase plan
|
9.2
|
|
5.2
|
|
6.3
|
|
|||||
|
Subtotal
|
255.9
|
|
184.3
|
|
150.1
|
|
|||||
|
Capitalized share-based compensation costs
|
(9.8
|
)
|
(5.4
|
)
|
(4.5
|
)
|
|||||
|
Share-based compensation expense included in total cost and expenses
|
$
|
246.1
|
|
$
|
178.9
|
|
$
|
145.6
|
|
||
Windfall tax benefits from vesting of stock awards, exercises of stock options and ESPP participation were
$73.5 million
,
$54.7 million
and
$50.6 million
in
2013
,
2012
and
2011
, respectively. These amounts have been calculated under the alternative transition method.
As of
December 31, 2013
, unrecognized compensation cost related to unvested share-based compensation was approximately
$193.6 million
, net of estimated forfeitures. We expect to recognize the cost of these unvested awards over a weighted-average period of
1.4
years.
Share-Based Compensation Plans
We have
three
share-based compensation plans pursuant to which awards are currently being made: (1) the Biogen Idec Inc. 2006 Non-Employee Directors Equity Plan (2006 Directors Plan); (2) the Biogen Idec Inc. 2008 Omnibus Equity Plan (2008 Omnibus Plan); and (3) the Biogen Idec Inc. 1995 Employee Stock Purchase Plan (ESPP). We have
five
share-based compensation plans under which there are outstanding awards, but from which no further awards can or will be made: (i) the IDEC Pharmaceuticals Corporation 1993 Non-Employee Directors Stock Option Plan; (ii) the IDEC Pharmaceuticals Corporation 1988 Stock Option Plan; (iii) the Biogen, Inc. 1985 Non-Qualified Stock Option Plan; (iv) the Biogen Idec Inc. 2003 Omnibus Equity Plan; and (v) the Biogen Idec Inc. 2005 Omnibus Equity Plan (2005 Omnibus Plan). We have not made any awards pursuant to the 2005 Omnibus Plan since our stockholders approved the 2008 Omnibus Plan and do not intend to make any awards pursuant to the 2005 Omnibus Plan in the future, except that unused shares under the 2005 Omnibus Plan have been carried over for use under the 2008 Omnibus Plan.
Directors Plan
In May 2006, our stockholders approved the 2006 Directors Plan for share-based awards to our directors. Awards granted from the 2006 Directors Plan may include stock options, shares of restricted stock, restricted stock units, stock appreciation rights and other awards in such amounts and with such terms and conditions as may be determined by a committee of our Board of Directors, subject to the provisions of the plan. We have reserved a total of
1.6 million
shares of common stock for issuance under the 2006 Directors Plan. The 2006 Directors Plan provides that awards other than stock options and stock appreciation rights will be counted against the total number of shares reserved under the plan in a
1.5-to-1
ratio.
Omnibus Plans
In June 2008, our stockholders approved the 2008 Omnibus Plan for share-based awards to our employees. Awards granted from the 2008 Omnibus Plan may include stock options, shares of restricted stock, restricted stock units, performance shares, shares of phantom stock, stock appreciation rights and other awards in such amounts and with such terms and conditions as may be determined by a committee of our Board of Directors, subject to the provisions of the plan. Shares of common stock available for issuance under the 2008 Omnibus Plan consist of
15.0 million
shares reserved for this purpose, plus shares of common stock that remained available for issuance under the 2005 Omnibus Plan on the date that our stockholders approved the 2008 Omnibus Plan, plus shares that are subject to awards under the 2005 Omnibus Plan which remain unissued upon the cancellation, surrender, exchange or termination of such awards. The 2008 Omnibus Equity Plan provides that awards other than stock options and stock appreciation rights will be counted against the total number of shares available under the plan in a
1.5-to-1
ratio.
F- 40
BIOGEN IDEC INC. AND SUBSIDIARIES
NOTES TO CONSOLIDATED FINANCIAL STATEMENTS — (Continued)
Stock Options
We no longer grant stock options to our employees or directors. Outstanding stock options previously granted to our employees and directors generally have a ten-year term and vest over a period of between one and four years, provided the individual continues to serve at Biogen Idec through the vesting dates. Options granted under all plans are exercisable at a price per share not less than the fair market value of the underlying common stock on the date of grant. The estimated fair value of options, including the effect of estimated forfeitures, is recognized over the options’ vesting periods. The fair value of the stock options granted in 2010 was estimated as of the date of grant using a Black-Scholes option valuation model. There were
no
grants of stock options made in
2013
,
2012
and
2011
.
The expected life of options granted is derived using assumed exercise rates based on historical exercise patterns and represents the period of time that options granted are expected to be outstanding. Expected stock price volatility is based upon implied volatility for our exchange-traded options and other factors, including historical volatility. After assessing all available information on either historical volatility, implied volatility, or both, we have concluded that a combination of both historical and implied volatility provides the best estimate of expected volatility. The risk-free interest rate used is determined by the market yield curve based upon risk-free interest rates established by the Federal Reserve, or non-coupon bonds that have maturities equal to the expected term. The dividend yield of zero is based upon the fact that we have not historically granted cash dividends, and do not expect to issue dividends in the foreseeable future. Stock options granted prior to January 1, 2006 were valued based on the grant date fair value of those awards, using the Black-Scholes option pricing model, as previously calculated for pro-forma disclosures.
The following table summarizes our stock option activity:
|
Shares
|
Weighted
Average
Exercise
Price
|
|||||
|
Outstanding at December 31, 2012
|
907,000
|
|
$
|
54.48
|
|
|
|
Granted
|
—
|
|
$
|
—
|
|
|
|
Exercised
|
(523,000
|
)
|
$
|
53.73
|
|
|
|
Cancelled
|
—
|
|
$
|
—
|
|
|
|
Outstanding at December 31, 2013
|
384,000
|
|
$
|
55.49
|
|
|
The total intrinsic values of options exercised in
2013
,
2012
and
2011
totaled
$86.2 million
,
$63.0 million
, and
$149.0 million
, respectively. The aggregate intrinsic values of options outstanding as of
December 31, 2013
totaled
$86.1 million
. The weighted average remaining contractual term for options outstanding as of
December 31, 2013
was
3.1
years.
Of the options outstanding,
0.4 million
were exercisable as of
December 31, 2013
. The exercisable options had a weighted-average exercise price of
$55.49
. The aggregate intrinsic value of options exercisable as of
December 31, 2013
was
$85.5 million
. The weighted average remaining contractual term for options exercisable as of
December 31, 2013
was
3.1
years.
A total of
0.4 million
vested and expected to vest options were outstanding as of
December 31, 2013
. These vested and expected to vest options had a weighted average exercise price of
$55.49
and an aggregated intrinsic value of
$86.1 million
. The weighted average remaining contractual term of vested and expected to vest options as of
December 31, 2013
was
3.1
years.
The following table summarizes the amount of tax benefit realized for stock options and cash received from the exercise of stock options:
|
|
For the Years Ended December 31,
|
||||||||||
|
(In millions)
|
2013
|
2012
|
2011
|
||||||||
|
Tax benefit realized for stock options
|
$
|
29.4
|
|
$
|
20.9
|
|
$
|
47.5
|
|
||
|
Cash received from the exercise of stock options
|
$
|
28.1
|
|
$
|
38.8
|
|
$
|
291.9
|
|
||
F- 41
BIOGEN IDEC INC. AND SUBSIDIARIES
NOTES TO CONSOLIDATED FINANCIAL STATEMENTS — (Continued)
Market Stock Units (MSUs)
MSUs awarded to employees vest in
four
equal annual increments beginning on the anniversary of the grant date. The vesting of these awards is subject to the respective employee’s continued employment. The number of MSUs granted represents the target number of units that are eligible to be earned based on the attainment of certain market-based criteria involving our stock price. The number of MSUs earned is calculated at each annual anniversary from the date of grant over the respective vesting periods, resulting in multiple performance periods. Participants may ultimately earn between
0%
and
150%
of the target number of units granted based on actual stock performance. Accordingly, additional MSUs may be issued or currently outstanding MSUs may be cancelled upon final determination of the number of awards earned. Compensation expense, including the effect of forfeitures, is recognized over the applicable service period.
The following table summarizes our MSU activity:
|
Shares
|
Weighted
Average
Grant Date
Fair Value
|
|||||
|
Unvested at December 31, 2012
|
606,000
|
|
$
|
94.73
|
|
|
|
Granted (a)
|
271,000
|
|
$
|
193.45
|
|
|
|
Vested
|
(296,000
|
)
|
$
|
85.12
|
|
|
|
Forfeited
|
(31,000
|
)
|
$
|
128.39
|
|
|
|
Unvested at December 31, 2013
|
550,000
|
|
$
|
128.04
|
|
|
|
(a)
|
MSUs granted in 2013 include approximately
18,000
and
39,000
MSUs issued in 2013 based upon the attainment of performance criteria set for 2012 and 2011, respectively, in relation to shares granted in those years. The remainder of MSUs granted during 2013 include awards granted in conjunction with our annual awards made in February 2013 and MSUs granted in conjunction with the hiring of employees. These grants reflect the target number of shares eligible to be earned at the time of grant.
|
We value grants of MSUs using a lattice model with a Monte Carlo simulation. This valuation methodology utilizes several key assumptions, including the
60
calendar day average closing stock price on grant date, expected volatility of our stock price, risk-free rates of return and expected dividend yield. The assumptions used in our valuation are summarized as follows:
|
|
For the Years Ended December 31,
|
||
|
|
2013
|
2012
|
|
|
Expected dividend yield
|
—%
|
—%
|
|
|
Range of expected stock price volatility
|
21.7% - 25.7%
|
29.6% - 34.0%
|
|
|
Range of risk-free interest rates
|
0.1% - 0.7%
|
0.2% - 0.6%
|
|
|
60 calendar day average stock price on grant date
|
$150.33 - $240.14
|
$113.83 - $149.79
|
|
|
Weighted-average per share grant date fair value
|
$193.45
|
$134.95
|
|
Cash Settled Performance Shares (CSPSs)
CSPSs awarded to employees vest in
three
equal annual increments beginning on the anniversary of the grant date. The vesting of these awards is subject to the respective employee’s continued employment with such awards settled in cash. The number of CSPSs granted represents the target number of units that are eligible to be earned based on the attainment of certain performance measures established at the beginning of the performance period, which ends on December 31
st
of each year. Participants may ultimately earn between
0%
and
200%
of the target number of units granted based on the degree of actual performance metric achievement. Accordingly, additional CSPSs may be issued or currently outstanding CSPSs may be cancelled upon final determination of the number of units earned. CSPSs are settled in cash based on the
60
calendar day average closing stock price through each vesting date once the actual vested and earned number of units is known. Since no shares are issued, these awards will not dilute equity. Compensation expense, including the effect of forfeitures, is recognized over the applicable service period.
F- 42
BIOGEN IDEC INC. AND SUBSIDIARIES
NOTES TO CONSOLIDATED FINANCIAL STATEMENTS — (Continued)
The following table summarizes our CSPS activity:
|
Shares
|
||
|
Unvested at December 31, 2012
|
592,000
|
|
|
Granted (a)
|
273,000
|
|
|
Vested
|
(317,000
|
)
|
|
Forfeited
|
(34,000
|
)
|
|
Unvested at December 31, 2013
|
514,000
|
|
|
(a)
|
CSPSs granted in 2013 include approximately
76,000
CSPSs issued in 2013 based upon the attainment of performance criteria set for 2012 in relation to shares granted in 2012. The remainder of the CSPSs granted in 2013 include awards granted in conjunction with our annual awards made in February 2013 and CSPSs granted in conjunction with the hiring of employees. These grants reflect the target number of shares eligible to be earned at the time of grant.
|
During
2013
, we paid
$48.3 million
of cash in settlement of CSPS awards upon vesting.
Time-Vested Restricted Stock Units (RSUs)
RSUs awarded to employees generally vest no sooner than
one-third per year over three years
on the anniversary of the date of grant, or upon the third anniversary of the date of the grant, provided the employee remains continuously employed with us, except as otherwise provided in the plan. Shares of our common stock will be delivered to the employee upon vesting, subject to payment of applicable withholding taxes. RSUs awarded to directors for service on our Board of Directors vest on the first anniversary of the date of grant, provided in each case that the director continues to serve on our Board of Directors through the vesting date. Shares of our common stock will be delivered to the director upon vesting and are not subject to any withholding taxes. The fair value of all RSUs is based on the market value of our stock on the date of grant. Compensation expense, including the effect of forfeitures, is recognized over the applicable service period.
The following table summarizes our RSU activity:
|
Shares
|
Weighted
Average
Grant Date
Fair Value
|
|||||
|
Unvested at December 31, 2012
|
2,187,000
|
|
$
|
90.37
|
|
|
|
Granted (a)
|
758,000
|
|
$
|
176.53
|
|
|
|
Vested
|
(1,181,000
|
)
|
$
|
79.17
|
|
|
|
Forfeited
|
(104,000
|
)
|
$
|
119.42
|
|
|
|
Unvested at December 31, 2013
|
1,660,000
|
|
$
|
135.95
|
|
|
|
(a)
|
RSUs granted in 2013 primarily represent RSUs granted in conjunction with our annual awards made in February 2013 and awards made in conjunction with the hiring of new employees. RSUs granted in 2013 also include approximately
16,000
RSUs granted to our Board of Directors.
|
RSUs granted in
2012
and
2011
had weighted average grant date fair values of
$124.54
and
$70.01
, respectively.
Performance-Vested Restricted Stock Units (PVRSUs)
The following table summarizes our PVRSU activity:
|
Shares
|
Weighted
Average
Grant Date
Fair Value
|
|||||
|
Unvested at December 31, 2012
|
930
|
|
$
|
53.64
|
|
|
|
Granted
|
—
|
|
$
|
—
|
|
|
|
Vested
|
(930
|
)
|
$
|
53.64
|
|
|
|
Forfeited
|
—
|
|
$
|
—
|
|
|
|
Unvested at December 31, 2013
|
—
|
|
$
|
—
|
|
|
F- 43
BIOGEN IDEC INC. AND SUBSIDIARIES
NOTES TO CONSOLIDATED FINANCIAL STATEMENTS — (Continued)
Grant Activity
In 2011, approximately
1,000
PVRSUs were granted with weighted average grant date fair values of
$53.64
per share. The number of PVRSUs reflected as granted represents the target number of shares that are eligible to vest in full or in part and are earned subject to the attainment of certain performance criteria established at the beginning of the performance period, which ended December 31, 2009. Participants may ultimately earn up to
200%
of the target number of shares granted in the event that the maximum performance thresholds are attained. Accordingly, additional PVRSUs may be issued upon final determination of the number of awards earned.
Once the earned number of performance-vested awards has been determined, the earned PVRSUs will then vest in
three
equal increments on (1) the later of the first anniversary of the grant date or the date of results determination; (2) the second anniversary of the grant date; and (3) the third anniversary of the grant date. The vesting of these awards is also subject to the respective employees’ continued employment. Compensation expense associated with these PVRSUs is initially based upon the number of shares expected to vest after assessing the probability that certain performance criteria will be met and the associated targeted payout level that is forecasted will be achieved, net of estimated forfeitures. Cumulative adjustments are recorded quarterly to reflect subsequent changes in the estimated outcome of performance-related conditions until the date results are determined.
Employee Stock Purchase Plan (ESPP)
The following table summarizes our ESPP activity:
|
|
For the Years Ended December 31,
|
||||||||||
|
(In millions, except share amounts)
|
2013
|
2012
|
2011
|
||||||||
|
Shares issued under ESPP
|
245,000
|
|
274,000
|
|
434,000
|
|
|||||
|
Cash received under ESPP
|
$
|
38.7
|
|
$
|
28.7
|
|
$
|
22.8
|
|
||
|
17.
|
Income Taxes
|
Income Tax Expense
Income before income tax provision and the income tax expense consist of the following:
|
|
For the Years Ended December 31,
|
||||||||||
|
(In millions)
|
2013
|
2012
|
2011
|
||||||||
|
Income before income taxes (benefit):
|
|||||||||||
|
Domestic
|
$
|
1,953.0
|
|
$
|
1,398.0
|
|
$
|
1,408.9
|
|
||
|
Foreign
|
527.6
|
|
457.1
|
|
302.3
|
|
|||||
|
Total
|
$
|
2,480.6
|
|
$
|
1,855.1
|
|
$
|
1,711.2
|
|
||
|
Income tax expense (benefit):
|
|||||||||||
|
Current:
|
|||||||||||
|
Federal
|
$
|
700.9
|
|
$
|
507.9
|
|
$
|
231.7
|
|
||
|
State
|
98.4
|
|
35.6
|
|
15.1
|
|
|||||
|
Foreign
|
46.8
|
|
44.0
|
|
44.1
|
|
|||||
|
Total
|
846.1
|
|
587.5
|
|
290.9
|
|
|||||
|
Deferred:
|
|||||||||||
|
Federal
|
$
|
(200.6
|
)
|
$
|
(133.0
|
)
|
$
|
160.9
|
|
||
|
State
|
(35.9
|
)
|
(13.0
|
)
|
(8.1
|
)
|
|||||
|
Foreign
|
(8.6
|
)
|
29.1
|
|
0.8
|
|
|||||
|
Total
|
(245.1
|
)
|
(116.9
|
)
|
153.6
|
|
|||||
|
Total income tax expense
|
$
|
601.0
|
|
$
|
470.6
|
|
$
|
444.5
|
|
||
The 2012 deferred tax expense on foreign earnings includes an expense of
$33.1 million
related to capitalized interest at our Denmark manufacturing facility. Of this amount,
$29.0 million
represents the correction of an error in our accounting that had accumulated over several prior years. We do not consider this correction to be material.
F- 44
BIOGEN IDEC INC. AND SUBSIDIARIES
NOTES TO CONSOLIDATED FINANCIAL STATEMENTS — (Continued)
Deferred Tax Assets and Liabilities
Significant components of our deferred tax assets and liabilities are summarized as follows:
|
|
As of December 31,
|
||||||
|
(In millions)
|
2013
|
2012
|
|||||
|
Deferred tax assets:
|
|||||||
|
Tax credits
|
$
|
64.1
|
|
$
|
69.3
|
|
|
|
Inventory, other reserves, and accruals
|
169.6
|
|
118.3
|
|
|||
|
Capitalized costs
|
7.9
|
|
7.6
|
|
|||
|
Intangibles, net
|
124.2
|
|
84.5
|
|
|||
|
Net operating loss
|
14.7
|
|
37.5
|
|
|||
|
Share-based compensation
|
85.0
|
|
58.6
|
|
|||
|
Other
|
76.9
|
|
57.8
|
|
|||
|
Valuation allowance
|
(1.5
|
)
|
(12.3
|
)
|
|||
|
Total deferred tax assets
|
$
|
540.9
|
|
$
|
421.3
|
|
|
|
Deferred tax liabilities:
|
|||||||
|
Purchased intangible assets
|
$
|
(550.8
|
)
|
$
|
(411.3
|
)
|
|
|
Unrealized gain on investments and cumulative translation adjustment
|
(3.2
|
)
|
(1.2
|
)
|
|||
|
Inventory
|
(24.9
|
)
|
(50.8
|
)
|
|||
|
Depreciation, amortization and other
|
(112.6
|
)
|
(146.4
|
)
|
|||
|
Total deferred tax liabilities
|
$
|
(691.5
|
)
|
$
|
(609.7
|
)
|
|
In addition to deferred tax assets and liabilities, we have recorded prepaid tax and deferred charges related to intercompany transactions. As of
December 31, 2013
and
2012
, the total deferred charges and prepaid taxes were
$248.9 million
and
$33.4 million
, respectively.
During 2013, we recorded a deferred charge of
$203.7 million
in connection with an intercompany transfer of the intellectual property for Daclizumab HYP. The deferred charge will be amortized to income tax expense over the economic life of the Daclizumab HYP program. If the Daclizumab HYP program were to be discontinued, we will accelerate the amortization of this deferred charge and record an expense equal to its remaining net book value.
Tax Rate
A reconciliation between the U.S. federal statutory tax rate and our effective tax rate is summarized as follows:
|
|
For the Years Ended December 31,
|
|||||||
|
|
2013
|
2012
|
2011
|
|||||
|
Statutory rate
|
35.0
|
%
|
35.0
|
%
|
35.0
|
%
|
||
|
State taxes
|
3.1
|
|
0.9
|
|
1.7
|
|
||
|
Taxes on foreign earnings
|
(6.7
|
)
|
(6.2
|
)
|
(5.9
|
)
|
||
|
Credits and net operating loss utilization
|
(2.6
|
)
|
(3.5
|
)
|
(4.4
|
)
|
||
|
Purchased intangible assets
|
1.5
|
|
1.2
|
|
1.3
|
|
||
|
Manufacturing deduction
|
(6.6
|
)
|
(2.1
|
)
|
(1.5
|
)
|
||
|
Other permanent items
|
0.8
|
|
(0.4
|
)
|
0.3
|
|
||
|
Contingent consideration
|
—
|
|
0.5
|
|
0.7
|
|
||
|
Other
|
(0.3
|
)
|
—
|
|
(1.2
|
)
|
||
|
Effective tax rate
|
24.2
|
%
|
25.4
|
%
|
26.0
|
%
|
||
F- 45
BIOGEN IDEC INC. AND SUBSIDIARIES
NOTES TO CONSOLIDATED FINANCIAL STATEMENTS — (Continued)
Our effective tax rate for
2013
compared to
2012
decreased primarily as a result of a change in our uncertain tax position related to our U.S. federal manufacturing deduction and our unconsolidated joint business, described below under
"Accounting for Uncertainty in Income Taxes"
, lower intercompany royalties owed by a foreign wholly owned subsidiary to a U.S. wholly owned subsidiary on the international sales of one of our products, the reinstatement of the federal research and development tax credit and the 2012 correction of an error in our deferred tax accounting, which increased our rate in the prior year. These favorable items were partially offset by higher relative earnings in the U.S. from the commercial launch of TECFIDERA, lower orphan drug credits due to reduced expenditures in eligible clinical trials and higher state taxes.
Our effective tax rate for
2012
compared to
2011
decreased primarily as a result of higher orphan drug credits for our ELOCTATE, STX-100, dexpramipexole and other orphan credit eligible clinical trials, lower intercompany royalties owed by a foreign wholly owned subsidiary to a U.S. wholly owned subsidiary on the international sales of one of our products and higher deductions related to our manufacturing activities. These decreases were partially offset by the correction of an error which had accumulated over several years in our deferred tax accounting for capitalized interest which resulted in an expense of
$29.0 million
.
As of
December 31, 2013
, we had net operating losses and general business credit carry forwards for federal income tax purposes of approximately
$36.8 million
and
$4.2 million
, respectively, which begin to expire in 2020. Additionally, for state income tax purposes, we had net operating loss carry forwards of approximately
$108.1 million
, which begin to expire in 2014. For state income tax purposes, we also had research and investment credit carry forwards of approximately
$113.0 million
, which begin to expire in 2014. For foreign income tax purposes, we had
$5.9 million
of net operating loss carryforwards, which do not expire.
In assessing the realizability of our deferred tax assets, we have considered whether it is more likely than not that some portion or all of the deferred tax assets will not be realized. The ultimate realization of deferred tax assets is dependent upon the generation of future taxable income during the periods in which those temporary differences become deductible. In making this determination, under the applicable financial reporting standards, we are allowed to consider the scheduled reversal of deferred tax liabilities, projected future taxable income, and tax planning strategies. Our estimates of future taxable income take into consideration, among other items, our estimates of future income tax deductions related to the exercise of stock options. Based upon the level of historical taxable income and income tax liability and projections for future taxable income over the periods in which the deferred tax assets are utilizable, we believe it is more likely than not that we will realize the benefits of the deferred tax assets of our wholly owned subsidiaries. In the event that actual results differ from our estimates or we adjust our estimates in future periods, we may need to establish a valuation allowance, which could materially impact our financial position and results of operations.
As of
December 31, 2013
, undistributed foreign earnings of non-U.S. subsidiaries included in consolidated retained earnings and other basis differences aggregated approximately
$3.8 billion
. We intend to reinvest these earnings indefinitely in operations outside the U.S. The residual U.S. tax liability, if cumulative amounts were repatriated, would be between
$900 million
to
$1 billion
as of
December 31, 2013
.
Accounting for Uncertainty in Income Taxes
A reconciliation of the beginning and ending amount of our unrecognized tax benefits is summarized as follows:
|
(In millions)
|
2013
|
2012
|
2011
|
||||||||
|
Balance at January 1,
|
$
|
125.9
|
|
$
|
64.4
|
|
$
|
121.5
|
|
||
|
Additions based on tax positions related to the current period
|
11.9
|
|
13.0
|
|
2.2
|
|
|||||
|
Additions for tax positions of prior periods
|
71.7
|
|
69.8
|
|
48.6
|
|
|||||
|
Reductions for tax positions of prior periods
|
(92.1
|
)
|
(18.6
|
)
|
(75.8
|
)
|
|||||
|
Statute expirations
|
(1.9
|
)
|
(1.9
|
)
|
(2.3
|
)
|
|||||
|
Settlements
|
(5.4
|
)
|
(0.8
|
)
|
(29.8
|
)
|
|||||
|
Balance at December 31,
|
$
|
110.1
|
|
$
|
125.9
|
|
$
|
64.4
|
|
||
We and our subsidiaries are routinely examined by various taxing authorities. We file income tax returns in the U.S. federal jurisdiction, various U.S. states, and foreign jurisdictions. With few exceptions, including the proposed disallowance we discuss below, we are no longer subject to U.S. federal tax examination for years before 2010 or state, local, or non-U.S. income tax examinations for years before 2004.
F- 46
BIOGEN IDEC INC. AND SUBSIDIARIES
NOTES TO CONSOLIDATED FINANCIAL STATEMENTS — (Continued)
Included in the balance of unrecognized tax benefits as of
December 31, 2013
,
2012
, and
2011
are
$32.5 million
,
$109.5 million
, and
$31.3 million
(net of the federal benefit on state issues), respectively, of unrecognized tax benefits that, if recognized, would affect the effective income tax rate in future periods.
We recognize potential interest and penalties accrued related to unrecognized tax benefits in income tax expense. In
2013
, we recognized a net interest expense of
$4.5 million
. During
2012
, we recognized net interest expense of
$0.1 million
. In
2011
, we recognized a net interest benefit of approximately
$12.9 million
. We have accrued approximately
$11.3 million
and
$2.5 million
for the payment of interest as of
December 31, 2013
and
2012
, respectively.
Federal Uncertain Tax Positions
During 2013, we received updated technical guidance from the IRS concerning our current and prior year filings and calculation of our U.S. federal manufacturing deduction and overall tax classification of our unconsolidated joint business. Based on this guidance we reevaluated the level of our unrecognized benefits related to uncertain tax positions, and recorded a
$49.8 million
income tax benefit. This benefit is for a previously unrecognized position and relates to years 2005 through 2012. We recorded an offsetting expense of
$11.3 million
for non-income based state taxes, which is recorded in other income (expense) within our consolidated statements of income.
In October 2011, in conjunction with our examination, the IRS proposed a disallowance of approximately
$130 million
in deductions for tax years 2007, 2008 and 2009 related to payments for services provided by our wholly owned Danish subsidiary located in Hillerød, Denmark. We believe that these items represent valid deductible business expenses and are vigorously defending our position. We have initiated a mutual agreement procedure between the IRS and SKAT (the Danish tax authorities) for the years 2001 through 2009, in an attempt to reach agreement on the issue. In addition, we have applied for a bilateral advanced pricing agreement for the years 2010 through 2014 to resolve similar issues for the subsequent years.
It is reasonably possible that we will adjust the value of our uncertain tax positions related to our unconsolidated joint business and certain transfer pricing issues as we receive additional information from various taxing authorities. In addition, the IRS routinely examines our intercompany transfer pricing with respect to intellectual property related transactions and it is possible that the IRS may disagree with one or more positions we have taken with respect to such valuations. We do not anticipate any other significant changes in our positions in the next twelve months other than expected settlements which have been classified as current liabilities within the accompanying balance sheet.
State Uncertain Tax Positions
In 2006, the Massachusetts Department of Revenue (DOR) issued a Notice of Assessment against Biogen Idec MA Inc. (BIMA), one of our wholly-owned subsidiaries, for
$38.9 million
of corporate excise tax for 2002, which includes associated interest and penalties. The assessment asserted that the portion of sales attributable to Massachusetts (sales factor), the computation of BIMA’s research and development credits and certain deductions claimed by BIMA were not appropriate, resulting in unpaid taxes for 2002. On August 18, 2011, we reached a settlement with the DOR under which we agreed to pay
$7.0 million
in taxes, plus
$5.0 million
of interest, and agreed on the nature and amount of tax credits carried forward into 2004.
On June 8, 2010, we received Notices of Assessment from the DOR against BIMA for
$103.5 million
of corporate excise tax, including associated interest and penalties, related to our 2004, 2005 and 2006 tax filings. On October 15, 2013, we reached a settlement with the Massachusetts DOR related to our 2004, 2005 and 2006 state tax filings under which we agreed to pay
$5.0 million
in taxes and interest and agreed on the nature and amount of tax credits carried forward into 2007. This resolution did not have a significant impact on our results of operations.
The audit fieldwork associated with our Massachusetts state tax filings for 2007 and 2008 has been completed without a significant proposed adjustment.
F- 47
BIOGEN IDEC INC. AND SUBSIDIARIES
NOTES TO CONSOLIDATED FINANCIAL STATEMENTS — (Continued)
|
18.
|
Other Consolidated Financial Statement Detail
|
Supplemental Cash Flow Information
Supplemental disclosure of cash flow information for the years ended
December 31, 2013
,
2012
and
2011
, is as follows:
|
|
For the Years Ended December 31,
|
||||||||||
|
(In millions)
|
2013
|
2012
|
2011
|
||||||||
|
Cash paid during the year for:
|
|||||||||||
|
Interest
|
$
|
53.6
|
|
$
|
65.4
|
|
$
|
66.7
|
|
||
|
Income taxes
|
$
|
643.2
|
|
$
|
526.6
|
|
$
|
332.7
|
|
||
Non-cash Investing and Financing Activity
In July and November 2013, the construction of the two office buildings was completed and we started leasing the facilities. Upon completion of the construction of the buildings, we determined that we were no longer considered the owner of the buildings because we do not have any unusual or significant continuing involvement. Consequently, we derecognized the buildings and their associated financing obligation of approximately
$161.5 million
from our consolidated balance sheet. For additional information related to these transactions, please read Note 11,
Property, Plant & Equipment
to these consolidated financial statements.
In March 2012, upon completion of our acquisition of Stromedix, we recorded
$219.2 million
of in-process research and development and
$48.2 million
of goodwill. In addition, we also recorded a contingent consideration obligation of
$122.2 million
.
In September 2011, upon completion of our acquisition of the noncontrolling interest in our joint venture investments in Biogen Dompé SRL and Biogen Dompé Switzerland GmbH, we recorded a contingent consideration obligation of
$38.8 million
.
Other Income (Expense), Net
Components of other income (expense), net, are summarized as follows:
|
|
For the Years Ended December 31,
|
||||||||||
|
(In millions)
|
2013
|
2012
|
2011
|
||||||||
|
Interest income
|
$
|
8.2
|
|
$
|
29.5
|
|
$
|
19.2
|
|
||
|
Interest expense
|
(31.9
|
)
|
(36.5
|
)
|
(33.0
|
)
|
|||||
|
Impairments on investments
|
(2.8
|
)
|
(5.5
|
)
|
(9.9
|
)
|
|||||
|
Gain (loss) on investments, net
|
21.7
|
|
10.6
|
|
18.8
|
|
|||||
|
Foreign exchange gains (losses), net
|
(15.2
|
)
|
(2.5
|
)
|
(6.3
|
)
|
|||||
|
Other, net
|
(14.9
|
)
|
3.7
|
|
(2.3
|
)
|
|||||
|
Total other income (expense), net
|
$
|
(34.9
|
)
|
$
|
(0.7
|
)
|
$
|
(13.5
|
)
|
||
For
2013
compared to
2012
, the change in other income (expense), net was due to a decrease in interest income due to lower average cash, cash equivalent and marketable securities balances primarily related to the use of cash in connection with our acquisition of TYSABRI rights from Elan and the repayment of our
6.0%
Senior Notes, a decrease in other, net primarily related to higher non-income based state taxes and higher foreign exchange losses.
F- 48
BIOGEN IDEC INC. AND SUBSIDIARIES
NOTES TO CONSOLIDATED FINANCIAL STATEMENTS — (Continued)
Accrued Expenses and Other
Accrued expenses and other consists of the following:
|
|
As of December 31,
|
||||||
|
(In millions)
|
2013
|
2012
|
|||||
|
Employee compensation and benefits
|
$
|
343.4
|
|
$
|
248.5
|
|
|
|
Revenue-related rebates
|
264.9
|
|
191.0
|
|
|||
|
Deferred revenue
|
172.7
|
|
148.0
|
|
|||
|
Royalties and licensing fees
|
160.7
|
|
45.2
|
|
|||
|
Clinical development expenses
|
55.2
|
|
51.6
|
|
|||
|
Current portion of contingent consideration obligations
|
29.0
|
|
22.4
|
|
|||
|
Construction in progress accrual
|
25.0
|
|
12.3
|
|
|||
|
Collaboration expenses
|
18.7
|
|
37.4
|
|
|||
|
Other
|
285.6
|
|
223.5
|
|
|||
|
Total accrued expenses and other
|
$
|
1,355.2
|
|
$
|
979.9
|
|
|
|
19.
|
Investments in Variable Interest Entities
|
Consolidated Variable Interest Entities
Our consolidated financial statements include the financial results of variable interest entities in which we are the primary beneficiary.
Investments in Joint Ventures
On September 6, 2011, we completed the purchase of the noncontrolling interest in our joint venture investments in Biogen Dompé SRL and Biogen Dompé Switzerland GmbH, our respective sales affiliates in Italy and Switzerland, from our joint venture partners, Dompé Farmaceutici SpA and Dompé International SA, respectively. Prior to this transaction, our consolidated financial statements reflected
100%
of the operations of these joint venture investments and we recorded net income (loss) attributable to noncontrolling interests in our consolidated statements of income based on the percentage of ownership interest retained by our joint venture partners as we retained the power to direct the activities which most significantly and directly impacted their economic performance. We have continued to consolidate the operations of these entities following our purchase of the noncontrolling interest; however, as of September 6, 2011, we no longer allocate
50%
of the earnings of these affiliates to net income (loss) attributable to noncontrolling interests as Biogen Dompé SRL and Biogen Dompé Switzerland GmbH became wholly-owned subsidiaries of the Company.
Until we completed our purchase of the noncontrolling interests, the assets of these joint ventures were restricted, from the standpoint of Biogen Idec, in that they were not available for our general business use outside the context of each joint venture. The joint ventures’ most significant assets were accounts receivable from the ordinary course of business. The holders of the liabilities of each joint venture, including the credit line from Dompé Farmaceutici SpA to Biogen Dompé SRL, had no recourse to Biogen Idec. Balances outstanding under Biogen Dompé SRL’s credit line were repaid in connection with this transaction. In addition, Dompé Farmaceutici SpA purchased all of Biogen Dompé SRL’s outstanding receivables as of June 30, 2011, adjusted for cash received through September 5, 2011. For additional information related to this transaction, please read Note 2,
Acquisitions
to these consolidated financial statements.
Knopp
In August 2010, we entered into a license agreement with Knopp Neurosciences, Inc. (Knopp), a subsidiary of Knopp Holdings, LLC, for the development, manufacture and commercialization of dexpramipexole. Under the terms of the license agreement we made a
$26.4 million
upfront payment and agreed to pay Knopp development and sales-based milestone payments as well as royalties on future commercial sales. In addition, we also purchased
30.0%
of the Class B common shares of Knopp for
$60.0 million
.
F- 49
BIOGEN IDEC INC. AND SUBSIDIARIES
NOTES TO CONSOLIDATED FINANCIAL STATEMENTS — (Continued)
At the end of December 2012, we learned that a Phase 3 trial investigating dexpramipexole in people with amyotrophic lateral sclerosis (ALS) did not meet its primary endpoint and failed to show efficacy in its key secondary endpoints. Based on these results, we discontinued development of dexpramipexole in ALS. Prior to our decision to discontinue dexpramipexole, we had started the R&D extension program, ENVISION, and had entered into arrangements with certain suppliers for the purchase of raw materials and the supply of drug product. These arrangements were canceled. We accrued approximately
$12.3 million
of research and development expense in 2012 related to these firm commitments to purchase R&D services and inventory or to pay cancellation charges.
In addition, in the first quarter of 2013, we terminated the license agreement with Knopp and, in the fourth quarter of 2013, we exercised our put option on the
30.0%
of the Class B common shares to Knopp.
We had previously determined that we were the primary beneficiary of Knopp because we had the power through the license agreement to direct the activities that most significantly impacted Knopp’s economic performance and were required to fund
100%
of the research and development costs incurred in support of the collaboration agreement. As such, we consolidated the results of Knopp. In March 2013, we deconsolidated the results of Knopp upon termination of the license agreement.
A summary of activity related to this collaboration is as follows:
|
|
For the Years Ended December 31,
|
||||||||||
|
(In millions)
|
2013
|
2012
|
2011
|
||||||||
|
Milestone payments made to Knopp
|
$
|
—
|
|
$
|
—
|
|
$
|
10.0
|
|
||
|
Biogen Idec’s share of expense reflected within our consolidated statements of income
|
$
|
—
|
|
$
|
113.0
|
|
$
|
54.8
|
|
||
|
Collaboration expense attributed to noncontrolling interests, net of tax
|
$
|
—
|
|
$
|
—
|
|
$
|
8.6
|
|
||
The assets and liabilities of Knopp were not significant to our financial position or results of operations. We had provided no financing to Knopp other than previously contractually required amounts disclosed above.
Neurimmune SubOne AG
In 2007, we entered into a collaboration agreement with Neurimmune SubOne AG (Neurimmune), a subsidiary of Neurimmune AG, for the development and commercialization of antibodies for the treatment of Alzheimer’s disease. Neurimmune conducts research to identify potential therapeutic antibodies and we are responsible for the development, manufacturing and commercialization of all products. Based upon our current development plans, we may pay Neurimmune up to
$345.0 million
in remaining milestone payments, as well as royalties on sales of any resulting commercial products.
We determined that we are the primary beneficiary of Neurimmune because we have the power through the collaboration to direct the activities that most significantly impact the entity’s economic performance and are required to fund
100%
of the research and development costs incurred in support of the collaboration agreement. Accordingly, we consolidate the results of Neurimmune.
Amounts that are incurred by Neurimmune for research and development expenses in support of the collaboration that we reimburse are reflected in research and development expense in our consolidated statements of income. In April 2011, we submitted an Investigational New Drug application for BIIB037 (human anti-Amyloid ß mAb), a beta-amyloid removal therapy, which triggered a
$15.0 million
milestone payment due to Neurimmune. As we consolidate Neurimmune, we recognized this payment as a charge to noncontrolling interests in the second quarter of 2011. Future milestone payments will be reflected within our consolidated statements of income as a charge to the noncontrolling interest, net of tax, when such milestones are achieved.
A summary of activity related to this collaboration is as follows:
|
|
For the Years Ended December 31,
|
||||||||||
|
(In millions)
|
2013
|
2012
|
2011
|
||||||||
|
Milestone payments made to Neurimmune
|
$
|
—
|
|
$
|
—
|
|
$
|
15.0
|
|
||
|
Biogen Idec’s share of expense reflected within our consolidated statements of income
|
$
|
27.2
|
|
$
|
13.3
|
|
$
|
24.2
|
|
||
|
Collaboration expense attributed to noncontrolling interests, net of tax
|
$
|
—
|
|
$
|
—
|
|
$
|
14.7
|
|
||
F- 50
BIOGEN IDEC INC. AND SUBSIDIARIES
NOTES TO CONSOLIDATED FINANCIAL STATEMENTS — (Continued)
A summary of activity related to this collaboration since inception, along with an estimate of additional future development expenses expected to be incurred by us, is as follows:
|
(In millions)
|
As of December 31, 2013
|
||
|
Total expense incurred by Biogen Idec
|
$
|
115.7
|
|
|
Estimate of additional amounts to be incurred by us in development of the lead compound
|
$
|
800.9
|
|
The assets and liabilities of Neurimmune are not significant to our financial position or results of operations as it is a research and development organization. We have provided no financing to Neurimmune other than previously contractually required amounts.
Unconsolidated Variable Interest Entities
We have relationships with other variable interest entities that we do not consolidate as we lack the power to direct the activities that significantly impact the economic success of these entities. These relationships include investments in certain biotechnology companies and research collaboration agreements. For additional information related to our significant collaboration arrangements with unconsolidated variable interest entities, please read Note 20,
Collaborative and Other Relationships
to these consolidated financial statements.
As of
December 31, 2013
and
2012
, the total carrying value of our investments in biotechnology companies that we have determined to be variable interest entities, but do not consolidate as we do not have the power to direct their activities, totaled
$5.5 million
and
$9.4 million
, respectively. Our maximum exposure to loss related to these variable interest entities is limited to the carrying value of our investments.
We have entered into research collaborations with certain variable interest entities where we are required to fund certain development activities. These development activities are included in research and development expense within our consolidated statements of income, as they are incurred.
We have provided no financing to these variable interest entities other than previously contractually required amounts.
|
20.
|
Collaborative and Other Relationships
|
In connection with our business strategy, we have entered into various collaboration agreements which provide us with rights to develop, produce and market products using certain know-how, technology and patent rights maintained by our collaborative partners. Terms of the various collaboration agreements may require us to make milestone payments upon the achievement of certain product research and development objectives and pay royalties on future sales, if any, of commercial products resulting from the collaboration.
Depending on the collaborative arrangement, we may record funding receivables or payable balances with our partners, based on the nature of the cost-sharing mechanism and activity within the collaboration. Our significant collaboration arrangements are discussed below.
Genentech (Roche Group)
We collaborate with Genentech on the development and commercialization of RITUXAN. In addition, in the U.S. we share operating profits and losses relating to GAZYVA with Genentech. The Roche Group and its sub-licensees maintain sole responsibility for the development, manufacturing and commercialization of GAZYVA in the U.S.
Our collaboration agreement will continue in effect until we mutually agree to terminate the collaboration, except that if we undergo a change in control, as defined in the collaboration agreement, Genentech has the right to present an offer to buy the rights to RITUXAN and we must either accept Genentech’s offer or purchase Genentech’s rights on the same terms as its offer. Genentech will also be deemed concurrently to have purchased our rights to any other anti-CD20 products in development in exchange for a royalty and our rights to GAZYVA in exchange for the compensation described in the table below. Our collaboration with Genentech was created through a contractual arrangement and not through a joint venture or other legal entity.
F- 51
BIOGEN IDEC INC. AND SUBSIDIARIES
NOTES TO CONSOLIDATED FINANCIAL STATEMENTS — (Continued)
RITUXAN
Genentech is responsible for the worldwide manufacturing of RITUXAN. Development and commercialization rights and responsibilities under this collaboration are divided as follows:
U.S.
We share with Genentech co-exclusive rights to develop, commercialize and market RITUXAN in the U.S.
Canada
We and Genentech have assigned our rights under our collaboration agreement with respect to Canada to Roche.
Outside the U.S. and Canada
We have granted Genentech exclusive rights to develop, commercialize and market RITUXAN outside the U.S. and Canada. Under the terms of separate sublicense agreements between Genentech and Roche, development and commercialization of RITUXAN outside the U.S. and Canada is the responsibility of Roche and its sublicensees. We do not have any direct contractual arrangements with Roche or it sublicensees.
Under the terms of the collaboration agreement, Roche pays us royalties between
10%
and
12%
on sales of RITUXAN outside the U.S. and Canada, with the royalty period lasting
11 years
from the first commercial sale of RITUXAN on a country-by-country basis. The royalty periods for a substantial portion of the remaining royalty-bearing sales of RITUXAN in the rest of world markets expired in 2012 and 2013. We expect future revenue on sales of RITUXAN in the rest of world will be limited to our share of pre-tax co-promotion profits in Canada.
GAZYVA
Prior to approval, we recognized
35%
of the development and commercialization expenses as research and development expense and selling, general and administrative expense, respectively, in our consolidated statements of income. After GAZYVA was approved in the fourth quarter of 2013, we began to recognize our share of the development and commercialization expenses as a reduction of our share of pre-tax profits in revenues from unconsolidated joint business.
Commercialization of GAZYVA will impact our percentage of the co-promotion profits for RITUXAN, as summarized in the table below.
Ocrelizumab
Genentech is solely responsible for further development and commercialization of ocrelizumab and funding future costs. Genentech cannot develop ocrelizumab in CLL, NHL or RA without our consent. We will receive tiered royalties between
13.5%
and
24%
on U.S. sales of ocrelizumab if approved for commercial sale by the FDA. Commercialization of ocrelizumab does not impact the percentage of the co-promotion profits we receive for RITUXAN.
Profit-sharing Formula
RITUXAN
Our current pretax co-promotion profit-sharing formula provides for a
30%
share on the first
$50.0 million
of co-promotion operating profits earned each calendar year. Under the amended agreement, our share of annual co-promotion profits in excess of
$50.0 million
varies, as summarized in the table below, upon the following events:
|
Until GAZYVA First Non-CLL FDA Approval
|
40.0
|
%
|
|
After GAZYVA First Non-CLL FDA Approval until First GAZYVA Threshold Date
|
39.0
|
%
|
|
After First GAZYVA Threshold Date until Second GAZYVA Threshold Date
|
37.5
|
%
|
|
After Second GAZYVA Threshold Date
|
35.0
|
%
|
First Non-CLL GAZYVA FDA Approval
means the FDA’s first approval of GAZYVA in an indication other than CLL.
First GAZYVA Threshold Date
means the earlier of (1) the date of the First Non-CLL GAZYVA FDA Approval if U.S. gross sales of GAZYVA for the preceding consecutive 12 month period were at least
$150.0 million
or (2) the first day of the calendar quarter after the date of the First Non-CLL GAZYVA FDA Approval that U.S. gross sales of GAZYVA within any consecutive 12 month period have reached
$150.0 million
.
F- 52
BIOGEN IDEC INC. AND SUBSIDIARIES
NOTES TO CONSOLIDATED FINANCIAL STATEMENTS — (Continued)
Second GAZYVA Threshold Date
means the first day of the calendar quarter after U.S. gross sales of GAZYVA within any consecutive 12 month period have reached
$500.0 million
. The Second GAZYVA Threshold Date can be achieved regardless of whether GAZYVA has been approved in a non-CLL indication.
In addition, should the FDA approve an anti-CD20 product other than ocrelizumab or GAZYVA that is acquired or developed by Genentech and subject to the collaboration agreement, our share of the co-promotion operating profits would be between
30%
and
38%
based on certain events.
GAZYVA
Our current pretax profit-sharing formula provides for a
35%
share on the first
$50.0 million
of operating profits earned each calendar year. Under the amended agreement, our share of annual profits in excess of
$50.0 million
varies, as summarized in the table below, upon the following events:
|
Until First GAZYVA Threshold Date
|
39.0
|
%
|
|
After First GAZYVA Threshold Date until Second GAZYVA Threshold Date
|
37.5
|
%
|
|
After Second GAZYVA Threshold Date
|
35.0
|
%
|
Our share of operating losses on GAZYVA is
35%
.
Unconsolidated Joint Business Revenues
Revenues from unconsolidated joint business consists of (1) our share of pre-tax profits in the U.S. for RITUXAN and GAZYVA; (2) reimbursement of our selling and development expenses in the U.S. for RITUXAN; and (3) revenue on sales in the rest of world for RITUXAN, which consist of our share of pre-tax co-promotion profits in Canada and royalty revenue on sales outside the U.S. and Canada by Roche, and its sublicensees. Pre-tax co-promotion profits on RITUXAN are calculated and paid to us by Genentech in the U.S. and by Roche in Canada. Pre-tax co-promotion profits consist of U.S. and Canadian sales to third-party customers net of discounts and allowances less the cost to manufacture, third-party royalty expenses, distribution, selling, and marketing expenses, and joint development expenses incurred by Genentech, Roche and us. We record our share of the pretax co-promotion profits on RITUXAN in Canada and royalty revenues on sales outside the U.S. on a cash basis as we do not have access to the information or ability to estimate these profits or royalty revenue in the period incurred. Additionally, our share of the pre-tax profits on RITUXAN and GAZYVA in the U.S. includes estimates made by Genentech and those estimates are subject to change. Actual results may ultimately differ from our estimates.
In June 2011, the collaboration recognized a charge of approximately
$125.0 million
, representing an estimate of compensatory damages and interest that might be awarded to Hoechst GmbH (Hoechst), in relation to an intermediate decision by the arbitrator in Genentech’s ongoing arbitration with Hoechst. Although we were not a party to the arbitration, we charged the amounts paid by Genentech and not ultimately recovered from Hoechst as a cost charged to our collaboration with Genentech. Accordingly, we reduced our share of RITUXAN revenues from unconsolidated joint business by approximately
$50.0 million
in the second quarter of 2011, a portion of which was recorded as a reduction in revenue on sales in the rest of the world for RITUXAN. In February 2013, the arbitrator awarded Hoechst royalties of EUR
108 million
together with interest (estimated by Hoechst to be approximately EUR
54 million
as of the date of the award). Accordingly, we reduced our share of RITUXAN revenues from unconsolidated joint business by approximately
$49.7 million
during 2013, of which revenue on sales in the rest of world for RITUXAN was reduced by
$41.2 million
and pre-tax profits in the U.S. were reduced by
$8.5 million
, to reflect our share of the royalties awarded to Hoechst and the interest Hoechst claims. For additional information related to this matter, please read Note 21,
Litigation
to these consolidated financial statements.
Revenues from unconsolidated joint business are summarized as follows:
|
|
For the Years Ended December 31,
|
||||||||||
|
(In millions)
|
2013
|
2012
|
2011
|
||||||||
|
Biogen Idec’s share of pre-tax profits in the U.S. for RITUXAN and GAZYVA (1)
|
$
|
1,085.2
|
|
$
|
1,031.7
|
|
$
|
872.7
|
|
||
|
Reimbursement of selling and development expenses in the U.S. for RITUXAN
|
2.1
|
|
1.6
|
|
6.1
|
|
|||||
|
Revenue on sales in the rest of world for RITUXAN
|
38.7
|
|
104.6
|
|
117.8
|
|
|||||
|
Total unconsolidated joint business revenues
|
$
|
1,126.0
|
|
$
|
1,137.9
|
|
$
|
996.6
|
|
||
(1) GAZYVA was approved by the FDA in November 2013.
F- 53
BIOGEN IDEC INC. AND SUBSIDIARIES
NOTES TO CONSOLIDATED FINANCIAL STATEMENTS — (Continued)
In
2013
,
2012
, and
2011
, the
40%
profit-sharing threshold was met during the first quarter.
Prior to approval, we record our share of the expenses incurred by the collaboration for the development of anti-CD20 products in research and development expense in our consolidated statements of income. We incurred
$25.7 million
,
$35.4 million
, and
$26.9 million
in development expense for the years ended
December 31, 2013
,
2012
, and
2011
, respectively. After an anti-CD20 product is approved, we record our share of the development expenses related to that product as a reduction of our share of pre-tax profits in revenues from unconsolidated joint business.
Elan
On April 2, 2013, we acquired full ownership of, and strategic, commercial and decision-making rights to, TYSABRI from Elan. Upon the closing of the transaction, our collaboration agreement with Elan was terminated. For additional information related to this transaction, please read Note 2,
Acquisitions
to these consolidated financial statements.
We previously collaborated with Elan on the development, manufacture and commercialization of TYSABRI. Under the terms of our collaboration agreement, we manufactured TYSABRI and collaborated with Elan on the product’s marketing, commercial distribution and ongoing development activities. The agreement was designed to effect an equal sharing of profits and losses generated by the activities of our collaboration. Under the agreement, however, once sales of TYSABRI exceeded specific thresholds, Elan was required to make milestone payments to us in order to continue sharing equally in the collaboration’s results.
In the U.S., we previously sold TYSABRI to Elan who sold the product to third party distributors. Our sales price to Elan in the U.S. was set prior to the beginning of each quarterly period to effect an approximate equal sharing of the gross profit between Elan and us. We recognized revenue for sales in the U.S. of TYSABRI upon Elan’s shipment of the product to the third party distributors, at which time all revenue recognition criteria had been met. We incurred manufacturing and distribution costs, research and development expenses, commercial expenses, and general and administrative expenses related to TYSABRI. We recorded these expenses to their respective line items within our consolidated statements of income when they were incurred. Research and development and sales and marketing expenses were shared equally with Elan and the reimbursement of these expenses was recorded as reductions of the respective expense categories. During the years ended
December 31, 2013
,
2012
, and
2011
, we recorded
$11.7 million
,
$43.7 million
and
$47.5 million
, respectively, as reductions of research and development expense for reimbursements from Elan. In addition, for the years ended
December 31, 2013
,
2012
, and
2011
, we recorded
$20.6 million
,
$99.9 million
and
$77.3 million
, respectively, as reductions of selling, general and administrative expense for reimbursements from Elan.
In the rest of world, we previously were responsible for distributing TYSABRI to customers and were primarily responsible for all operating activities. Generally, we recognized revenue for sales of TYSABRI in the rest of world at the time of product delivery to our customers. Payments were made to Elan for their share of the rest of world net operating profits to effect an equal sharing of collaboration operating profit. These payments also included the reimbursement for our portion of third-party royalties that Elan paid on behalf of the collaboration relating to rest of world sales. These amounts were reflected in the collaboration profit sharing line in our consolidated statements of income. For the years ended
December 31, 2013
,
2012
and
2011
,
$85.4 million
,
$317.9 million
and
$317.8 million
, respectively, was reflected in the collaboration profit sharing line for our collaboration with Elan.
Acorda
In 2009, we entered into a collaboration and license agreement with Acorda Therapeutics, Inc. (Acorda) to develop and commercialize products containing fampridine in markets outside the U.S. We also have responsibility for regulatory activities and the future clinical development of related products in those markets.
In July 2011, the EC granted a conditional marketing authorization for fampridine in the E.U., under the trade name FAMPYRA, which triggered a
$25.0 million
milestone payment. This payment was made to Acorda in 2011 and was capitalized as an intangible asset. A conditional marketing authorization is renewable annually and is granted to a medicinal product with a positive benefit-risk assessment that fulfills an unmet medical need when the benefit to public health of immediate availability outweighs the risk inherent in the fact that additional data are still required. This marketing authorization was renewed as of July 2013. To meet the conditions of this marketing authorization, we will provide additional data from on-going clinical studies regarding FAMPYRA's benefits and safety in the long term. FAMPYRA has been approved in over 50 countries across Europe, Asia and the Americas.
F- 54
BIOGEN IDEC INC. AND SUBSIDIARIES
NOTES TO CONSOLIDATED FINANCIAL STATEMENTS — (Continued)
Under the terms of the collaboration and license agreement, we pay Acorda tiered royalties based on the level of ex-U.S. net sales. We may pay up to
$375.0 million
of additional milestone payments to Acorda, based on the successful achievement of certain regulatory and commercial milestones. The next expected milestone would be
$15.0 million
, due if ex-U.S. net sales reach
$100.0 million
over a period of four consecutive quarters. We will capitalize these additional milestones as intangible assets upon achievement of the milestone which will then be amortized utilizing an economic consumption model and recognized as amortization of acquired intangible assets. Royalty payments are recognized as a cost of goods sold.
In connection with the collaboration and license agreement, we have also entered into a supply agreement with Acorda for the commercial supply of FAMPYRA. This agreement is a sublicense arrangement of an existing agreement between Acorda and Alkermes, who acquired Elan Drug Technologies, the original party to the license with Acorda.
A summary of activity related to this collaboration is as follows:
|
|
For the Years Ended December 31,
|
||||||||||
|
(In millions)
|
2013
|
2012
|
2011
|
||||||||
|
Upfront and milestones payments made to Acorda (1)
|
$
|
—
|
|
$
|
—
|
|
$
|
25.0
|
|
||
|
Total cost of sales related to royalties and commercial supply of FAMPYRA reflected within our statements of income
|
$
|
24.3
|
|
$
|
20.2
|
|
$
|
6.5
|
|
||
(1) Milestone payment was capitalized as an intangible asset.
Swedish Orphan Biovitrum AB
In January 2007, we acquired
100%
of the stock of Syntonix. Syntonix had previously entered into a collaboration agreement with Swedish Orphan Biovitrum AB (Sobi) to jointly develop and commercialize Factor VIII and Factor IX hemophilia products, including ELOCTATE and ALPROLIX. In February 2010, we restructured the collaboration agreement and assumed full development responsibilities and costs, as well as manufacturing rights. In addition, the cross-royalty rates were reduced and commercial rights for certain territories were changed. As a result, we now have commercial rights for North America (the Biogen Idec North America Territory) and for rest of the world markets outside of Europe, Russia, Turkey and certain countries in the Middle East (the Biogen Idec Direct Territory). Subject to the exercise of an option right that Sobi controls, Sobi will have commercial rights in Europe, Russia, Turkey and certain countries in the Middle East (the Sobi Territory).
Under the terms of the option right, Sobi may, following our submission of a marketing authorization application to the EMA for each product developed under the collaboration, opt to take over final regulatory approval, pre-launch and commercialization activities in the Sobi Territory by making a payment into escrow of
$10.0 million
per product. Upon EMA regulatory approval of each such product, Sobi will be liable to reimburse us
50%
of the sum of all shared manufacturing and development expenses incurred by us from October 1, 2009 through the date on which Sobi is registered as the marketing authorization holder for the applicable product, as well as
100%
of certain development expenses incurred exclusively for the benefit of the Sobi Territory (the Opt-In Consideration). Through
December 31, 2013
, we have incurred between
$120 million
and
$130 million
in expenditures for each product that may be reimbursable by SOBI should it exercise its right to commercialize one or both products. To effect Sobi’s reimbursement to us for the Opt-In Consideration exceeding the escrow payment for each product, the cross-royalty structure for direct sales in each company’s respective territories will be adjusted until the Opt-In Consideration is paid in full (the Reimbursement Period). The mechanism for reimbursement is outlined in the table below.
F- 55
BIOGEN IDEC INC. AND SUBSIDIARIES
NOTES TO CONSOLIDATED FINANCIAL STATEMENTS — (Continued)
Under the restructured agreement, amounts are payable as follows:
|
|
|
|
Rates should Sobi exercise
its option right
(3)
|
||||
|
Royalty and Net Revenue Share Rates:
|
Method
|
Rate prior to 1st
commercial sale in
the Sobi Territory:
|
Base Rate following
1st commercial sale in
the Sobi Territory:
|
Rate during the
Reimbursement
Period:
|
|||
|
Sobi rate to Biogen Idec on net sales in the Sobi Territory
|
Royalty
|
N/A
|
10 to 12%
|
Base Rate
plus 5%
|
|||
|
Biogen Idec rate to Sobi on net sales in the Biogen Idec North America Territory
|
Royalty
|
2%
|
10 to 12%
|
Base Rate
less 5%
|
|||
|
Biogen Idec rate to Sobi on net sales in the Biogen Idec Direct Territory
|
Royalty
|
2%
|
15 to 17%
|
Base Rate
less 5%
|
|||
|
Biogen Idec rate to Sobi on net revenue
(1)
from the Biogen Idec Distributor Territory
(2)
|
Net
Revenue
Share
|
10%
|
50%
|
Base Rate
less 15%
|
|||
|
(1)
|
Net revenue represents Biogen Idec’s pre-tax receipts from third-party distributors, less expenses incurred by Biogen Idec in the conduct of commercialization activities supporting the distributor activities.
|
|
(2)
|
The Biogen Idec Distributor Territory represents Biogen Idec territories where sales are derived utilizing a third-party distributor.
|
|
(3)
|
A credit will be issued to Sobi against its reimbursement of the Opt-in Consideration in an amount equal to the difference in the rate paid by Biogen Idec to Sobi on sales in the Biogen Idec territories for certain periods prior to the first commercial sale in the Sobi Territory versus the rate that otherwise would have been payable on such sales.
|
If the reimbursement of the Opt-in Consideration has not been achieved within
six years
of the first commercial sale of such product, we maintain the right to require Sobi to pay any remaining balances due to us within
90 days
of the six year anniversary date of the first commercial sale.
Should Sobi not exercise its option right with respect to one or both products or should Sobi terminate the agreement with respect to one or both products we will obtain full worldwide development and commercialization rights for such affected products and we will be obligated to pay royalties to Sobi subject to separate terms, as defined under the restructured collaboration agreement. In addition, if EMA approval for any product is not granted within
18 months
of the applicable EMA filing date, Sobi shall have the right to require that the escrow payment be refunded and revoke its option right for such product.
AbbVie Biotherapeutics, Inc.
We have a collaboration agreement with AbbVie Biotherapeutics, Inc., a subsidiary of AbbVie, Inc. (AbbVie) aimed at advancing the development and commercialization of Daclizumab HYP in MS. Under the agreement, development and commercialization costs and profits in North America and the E.U. are shared equally. In January 2010, we agreed with our collaborator, AbbVie, to assume the manufacture of Daclizumab HYP.
Based upon our current development plans, we may incur up to an additional
$60.0 million
of payments upon achievement of development and commercial milestones related to the development of Daclizumab HYP.
A summary of activity related to this collaboration is as follows:
|
|
For the Years Ended
December 31,
|
||||||||||
|
(In millions)
|
2013
|
2012
|
2011
|
||||||||
|
Total development expense incurred by the collaboration
|
$
|
133.4
|
|
$
|
128.0
|
|
$
|
105.2
|
|
||
|
Biogen Idec’s share of development expense reflected within our consolidated statements of income
|
$
|
71.0
|
|
$
|
65.6
|
|
$
|
54.2
|
|
||
F- 56
BIOGEN IDEC INC. AND SUBSIDIARIES
NOTES TO CONSOLIDATED FINANCIAL STATEMENTS — (Continued)
Portola Pharmaceuticals, Inc.
On October 26, 2011, we entered into an exclusive, worldwide collaboration and license agreement with Portola Pharmaceuticals, Inc. (Portola) under which both companies will develop and commercialize highly selective, novel oral Syk inhibitors for the treatment of various autoimmune and inflammatory diseases, including asthma, rheumatoid arthritis and systemic lupus erythematosus.
Under the terms of the agreement, we provided Portola with an upfront payment of
$36.8 million
in cash and purchased
$8.2 million
in Portola equity, with potential additional payments of up to
$406.8 million
based on the achievement of certain development and regulatory milestones. During the third quarter of 2012, we decided to stop development of the Syk inhibitor for the treatment of rheumatoid arthritis. We are researching the Syk inhibitor for the treatment of asthma and other indications. In the fourth quarter of 2013, we sold our stock in Portola for a gain of
$7.1 million
.
A summary of collective activity related to these programs is as follows:
|
|
For the Years Ended December 31,
|
||||||||||
|
(In millions)
|
2013
|
2012
|
2011
|
||||||||
|
Total expense incurred by the collaboration
|
$
|
1.6
|
|
$
|
18.8
|
|
$
|
1.1
|
|
||
|
Total expense reflected within our consolidated statements of income, excluding upfront and milestone payments
|
$
|
1.6
|
|
$
|
14.2
|
|
$
|
0.9
|
|
||
Isis Pharmaceuticals, Inc.
Long-Term Strategic Research Collaboration
In September 2013, we entered into a
six
year research collaboration with Isis Pharmaceuticals Inc. (Isis) under which both companies will perform discovery level research and then develop and commercialize antisense or other therapeutics for the treatment of neurological disorders. Under the collaboration, Isis will perform research on a set of neurological targets identified within the agreement. Once the research has reached a specific stage of development, we will make the determination whether antisense is the preferred approach to develop a therapeutic candidate or whether another modality is preferred. If antisense is selected, Isis will continue development and identify a product candidate. If another modality is used, we will assume the responsibility for identifying a product candidate and developing it.
Under the terms of this agreement, we paid Isis an upfront amount of
$100.0 million
. Of this payment, we recorded prepaid research and discovery services of approximately
$25.0 million
, representing the value of the Isis full time equivalent employee resources which are required by the collaboration to provide research and discovery services to us over the next six years. The remaining
$75.0 million
of the upfront payment was recorded as research and development expense in the third quarter of 2013, the period in which we entered into the collaboration, as it represents the purchase of intellectual property that has not reached technological feasibility.
Isis is also eligible to receive milestone payments, license fees and royalty payments for all product candidates developed through this collaboration, with the specific amount dependent upon the modality of the product candidate advanced by us.
For antisense product candidates, Isis will be responsible for global development through the completion of a Phase 2 trial and we will provide advice on the clinical trial design and regulatory strategy. We have an option to license the product candidate until completion of the Phase 2 trial. If we exercise our option, we will pay Isis up to a
$70.0 million
license fee and assume global development, regulatory and commercialization responsibilities. Isis could receive additional milestone payments upon the achievement of certain regulatory milestones of up to
$130.0 million
, plus additional amounts related to the cost of clinical trials conducted by Isis under the collaboration, and royalties on future sales if we successfully develop the product candidate after option exercise.
For product candidates using a different modality, we will be responsible for global development through all stages and will owe Isis up to
$90.0 million
upon the achievement of certain regulatory milestones.
Product Collaborations
In December, June and January 2012, we entered into three separate exclusive, worldwide option and collaboration agreements with Isis Pharmaceuticals, Inc. (Isis) under which both companies will develop and commercialize antisense therapeutics for up to three gene targets, Isis’ product candidates for the treatment of myotonic dystrophy type 1 (DM1), and the treatment of spinal muscular atrophy (SMA), respectively.
F- 57
BIOGEN IDEC INC. AND SUBSIDIARIES
NOTES TO CONSOLIDATED FINANCIAL STATEMENTS — (Continued)
Under the terms of the December 2012 agreement, we provided Isis with an upfront payment of
$30.0 million
and will make potential additional payments, prior to licensing, of up to
$10.0 million
based on the development of the selected product candidate as well as a mark-up of the cost estimate of the Phase 1 and Phase 2 trials. Isis will be responsible for global development of any product candidate
through the completion of a Phase 2 trial and we will provide advice on the clinical trial design and regulatory strategy. We have an option to license the product candidate
until completion of the Phase 2 trial. If we exercise our option, we will pay Isis up to a
$70.0 million
license fee and assume global development, regulatory and commercialization responsibilities. Isis could receive up to another
$130.0 million
in milestone payments upon the achievement of certain regulatory milestones as well as royalties on future sales
if we successfully develop the product candidate after option exercise.
Under the terms of the June 2012 agreement for the DM1 candidate, we provided Isis with an upfront payment of
$12.0 million
and will make potential additional payments, prior to licensing, of up to
$59.0 million
based on the development of the selected product candidate. In 2013, we made a
$10.0 million
milestone payment to Isis related to the selection and advancement of ISIS-DMPK
Rx
to treat DM1. Isis will be responsible for global development of any product candidate through the completion of a Phase 2 trial and we will provide advice on the clinical trial design and regulatory strategy. We also have an option to license the product candidate until completion of the Phase 2 trial. If we exercise our option, we will pay Isis up to a
$70.0 million
license fee and assume global development, regulatory and commercialization responsibilities. Isis could receive up to another
$130.0 million
in milestone payments upon the achievement of certain regulatory milestones as well as royalties on future sales if we successfully develop the product candidate after option exercise.
Under the terms of the January 2012 agreement for the antisense investigation drug, ISIS-SMN
Rx
, we paid Isis
$29.0 million
as an upfront payment. In January 2014, we amended the agreement and agreed to pay the clinical trial costs of up to
$40.0 million
related to the development of ISIS-SMN
Rx
through two studies which Isis will be responsible for performing. We are providing input on the clinical trial design and regulatory strategy and have an option to license ISIS-SMN
Rx
until completion of the first successful Phase 2/3 trial. If we exercise our option, we will pay Isis a
$75.0 million
license fee and assume global development, regulatory and commercialization responsibilities. Isis could receive up to another
$150.0 million
in milestone payments upon the achievement of certain regulatory milestones as well as royalties on future sales of ISIS-SMN
Rx
if we successfully develop ISIS-SMN
Rx
after option exercise.
Proteostasis Therapeutics, Inc.
In December 2013, we entered into a collaborative research, development, commercialization and license agreement with Proteostasis Therapeutics, Inc. (Proteostasis) under which both companies will develop and commercialize small molecule therapeutics for the treatment of neurological diseases.
Under the terms of the agreement, we paid Proteostasis an upfront payment of
$2.5 million
with potential additional payments of up to
$197.5 million
based on the achievement of certain development, regulatory and commercial milestones plus royalties on commercial sales. In addition, we will fund certain research and development expenses. Proteostasis has the option to co-commercialize any potential products. In January 2014 we purchased
$5.0 million
of the preferred stock of Proteostasis.
Other Research and Discovery Arrangements
During the year ended
December 31, 2013
, we entered into research and discovery arrangements that resulted in
$35.0 million
recorded as investments and other assets within our consolidated balance sheet and
$4.0 million
recorded as research and development expense within our consolidated statements of income. These additional arrangements include the potential for future milestone payments based on clinical and commercial development over a period of several years.
Samsung Bioepis
In February 2012, we finalized an agreement with Samsung Biologics that established an entity, Samsung Bioepis, to develop, manufacture and market biosimilar pharmaceuticals. Under the terms of the agreement, Samsung Biologics agreed to contribute
280.5 billion
South Korean won (approximately
$250.0 million
) for an
85 percent
stake in Samsung Bioepis and we agreed to contribute approximately
49.5 billion
South Korean won (approximately
$45.0 million
) for the remaining
15 percent
ownership interest. Our investment is limited to this contribution as we have no obligation to provide any additional funding; however, we maintain an option to purchase additional stock based in Samsung Bioepis that would allow us to increase our ownership percentage up to
49.9 percent
. The exercise of this option is within our control and is based on paying for
49.9 percent
of the total investment made to Samsung Bioepis in excess of what we have already contributed during the agreement plus interest.
F- 58
BIOGEN IDEC INC. AND SUBSIDIARIES
NOTES TO CONSOLIDATED FINANCIAL STATEMENTS — (Continued)
Samsung Biologics has the power to direct the activities of Samsung Bioepis which will most significantly and directly impact its economic performance. We account for this investment under the equity method of accounting as we maintain the ability to exercise significant influence over Samsung Bioepis through a presence on the entity’s Board of Directors and our contractual relationship. Under the equity method, we record our original investment at cost and subsequently adjust the carrying value of our investments for our share of equity in the entity’s income or losses according to our percentage of ownership. If losses accumulate, we will record our share of losses until our investment has been fully depleted. Once our investment has been fully depleted, we will recognize additional losses only if we provide or are required to provide additional funding. During the year ended
December 31, 2013
, we contributed the remaining
13.5 billion
South Korean won (approximately
$12.4 million
) to Samsung Bioepis to complete our obligation to contribute an aggregate of approximately
49.5 billion
South Korean won (approximately
$45.0 million
) for our
15 percent
ownership interest of Samsung Bioepis. As of
December 31, 2013
and
2012
, the carrying value of our investment in Samsung Bioepis totaled
25.2 billion
and
29.7 billion
South Korean won (approximately
$23.9 million
and
$27.8 million
), respectively, which is classified as a component of investments and other assets within our consolidated balance sheets. We recognize our share of the results of operations related to our investment in Samsung Bioepis one quarter in arrears when the results of the entity become available, which is reflected as equity in loss of investee, net of tax within our consolidated statements of income. During the years ended
December 31, 2013
and
2012
, we recognized a loss on our investment of
$17.2 million
and
$4.5 million
, respectively.
Simultaneous with the formation of Samsung Bioepis, we entered into a license agreement, a technical development services agreement and a manufacturing agreement with Samsung Bioepis. Under the terms of the license agreement, we granted Samsung Bioepis an exclusive license to use, develop, manufacture, and commercialize biosimilar products created by Samsung Bioepis using Biogen Idec product-specific technology. In exchange, we will receive single digit royalties on all biosimilar products developed and commercialized by Samsung Bioepis. Under the terms of the technical development services agreement, we provide Samsung Bioepis technical development and technology transfer services, which include, but are not limited to, cell culture development, purification process development, formulation development, and analytical development. Under the terms of our manufacturing agreement, we will manufacture clinical and commercial quantities of bulk drug substance of biosimilar products for Samsung Bioepis pursuant to contractual terms. Under limited circumstances, we may also supply Samsung Bioepis with quantities of drug product of biosimilar products for use in clinical trials through arrangements with third party contract manufacturers. For the years ended
December 31, 2013
and
2012
, we recognized
$43.1 million
and
$13.3 million
, respectively, in other revenues in relation to these services, which is reflected as a component of other revenues within our consolidated statement of income.
On December 17, 2013, pursuant to our joint venture agreement with Samsung Biologics, we exercised our right to enter into an agreement with Samsung Bioepis to commercialize anti-TNF biosimilar product candidates in Europe. Under the terms of this agreement, we paid
$21.0 million
and accrued
$15.0 million
, which was recorded as a research and development expense within our consolidated statements of income. These payments are classified as research and development expense as the programs they relate to have not achieved regulatory approval. Samsung Bioepis is eligible to receive an additional
$85.0 million
in additional milestones related to clinical development and regulatory approval of the product candidates. Upon commercialization, there will be a 50 percent profit share with Samsung Bioepis.
|
21.
|
Litigation
|
Massachusetts Department of Revenue
On June 8, 2010, we received Notices of Assessment from the Massachusetts DOR against BIMA for the payment of additional corporate excise tax, including associated interest and penalties, related to our 2004, 2005 and 2006 state tax filings and our subsequent application for abatement of the assessment was denied. On October 15, 2013 we reached a settlement resolving this matter.
Hoechst — Genentech Arbitration
On October 24, 2008, Hoechst GmbH (Hoechst), an affiliate of Sanofi-Aventis Deutschland GmbH (Sanofi), filed a request for arbitration with the ICC International Court of Arbitration (Paris) claiming that Genentech breached a license agreement, now terminated, under which Hoechst claims rights (the Hoechst License). The Hoechst License granted Genentech certain rights with respect to U.S. Patents 5,849,522 (’522 patent) and 6,218,140 (’140 patent). In 2012, the arbitrator ruled that Genentech was liable to Hoechst for license royalties with respect to sales of RITUXAN, and in February 2013 he awarded Hoechst royalties of EUR
108 million
, together with interest (estimated by Hoechst to be approximately EUR
54 million
as of the date of the award). Genentech has filed Declarations of Appeal in the Paris Court of Appeal to vacate the arbitral awards in their entirety, which are pending. In the fourth quarter, Genentech paid Hoechst the amounts that Hoechst claims that it is owed, while reserving all legal rights, including the right to challenge the awards and the right to claim reimbursement.
F- 59
BIOGEN IDEC INC. AND SUBSIDIARIES
NOTES TO CONSOLIDATED FINANCIAL STATEMENTS — (Continued)
Although we are not a party to the arbitration, the amounts paid by Genentech and not ultimately recovered from Hoechst are a cost charged to our collaboration with Genentech. Our revenues from unconsolidated joint business were reduced by approximately
$50.0 million
in the second quarter of 2011 and by approximately
$49.7 million
in 2013 to reflect our share of the royalties awarded to Hoechst and the interest Hoechst claims. Our share may vary from these amounts if Genentech is successful in challenging the awards.
Sanofi ’522 and ’140 Patent Litigation
On October 27, 2008, Sanofi filed suit against Genentech and Biogen Idec in the United States District Court for the Eastern District of Texas claiming that RITUXAN infringes the ’522 patent and the ’140 patent. That action was transferred and consolidated with an action filed on the same day by Genentech and Biogen Idec against Sanofi in the United States District for the Northern District of California seeking declaratory judgments that RITUXAN does not infringe the patents and that the asserted patent claims are invalid and unenforceable. On April 21, 2011, the federal court in California entered a separate and final judgment of non-infringement, and the United States Court of Appeals for the Federal Circuit affirmed on March 22, 2012. The federal court in California has stayed further proceedings relating to Biogen Idec's and Genentech's claims for a declaration that the asserted patent claims are invalid and unenforceable, and no trial date has been set on those claims.
’755 Patent Litigation
On September 15, 2009, we were issued U.S. Patent No. 7,588,755 (’755 Patent), which claims the use of interferon beta for immunomodulation or treating a viral condition, viral disease, cancers or tumors. This patent, which expires in September 2026, covers, among other things, the treatment of MS with our product AVONEX. On May 27, 2010, Bayer Healthcare Pharmaceuticals Inc. (Bayer) filed a lawsuit against us in the U.S. District Court for the District of New Jersey seeking a declaratory judgment of patent invalidity and non-infringement and seeking monetary relief in the form of attorneys' fees, costs and expenses. On May 28, 2010, BIMA filed a lawsuit in the U.S. District Court for the District of New Jersey alleging infringement of the ’755 Patent by EMD Serono, Inc. (manufacturer, marketer and seller of REBIF), Pfizer, Inc. (co-marketer of REBIF), Bayer (manufacturer, marketer and seller of BETASERON and manufacturer of EXTAVIA), and Novartis Pharmaceuticals Corp. (marketer and seller of EXTAVIA) and seeking monetary damages, including lost profits and royalties. The court has consolidated the two lawsuits, and we refer to the two actions as the “Consolidated ’755 Patent Actions”.
Bayer, Pfizer, Novartis and EMD Serono have all filed counterclaims in the Consolidated ’755 Patent Actions seeking declaratory judgments of patent invalidity and non-infringement, and seeking monetary relief in the form of costs and attorneys' fees, and EMD Serono and Bayer have each filed a counterclaim seeking a declaratory judgment that the ’755 Patent is unenforceable based on alleged inequitable conduct. Bayer has also amended its complaint to seek such a declaration. No trial date has been set.
Novartis V&D ’688 Patent Litigation
On January 26, 2011, Novartis Vaccines and Diagnostics, Inc. (Novartis V&D) filed suit against us in the United States District Court for the District of Delaware, alleging that TYSABRI infringes U.S. Patent No. 5,688,688 “Vector for Expression of a Polypeptide in a Mammalian Cell” (’688 Patent). In December 2013 the parties reached a settlement resolving the dispute. The settlement was not significant to our financial statements or results of operations.
Italian National Medicines Agency
In the fourth quarter of 2011, Biogen Idec SRL received a notice from the Italian National Medicines Agency (Agenzia Italiana del Farmaco or AIFA) stating that sales of TYSABRI for the period from February 2009 through February 2011 exceeded by EUR
30.7 million
a reimbursement limit established pursuant to a Price Determination Resolution (Price Resolution) granted by AIFA in December 2006. The Price Resolution set the initial price for the sale of TYSABRI in Italy and limited the amount of government reimbursement “for the first
24 months
” of TYSABRI sales. As the basis for the claim, the AIFA notice referred to a 2001 Decree that provides for an automatic
24
-month renewal of the terms of all Price Resolutions that are not renegotiated prior to the expiration of their term.
On November 17, 2011, Biogen Idec SRL responded to AIFA that the reimbursement limit in the Price Resolution by its terms applied only to the first
24 months
of TYSABRI sales, which began in February 2007. On December 23, 2011, we filed an appeal in the Regional Administrative Tribunal of Lazio (Il Tribunale Amministrativo Regionale per il Lazio) in Rome against AIFA, seeking a ruling that our interpretation of the Price Resolution is valid and that the position of AIFA is unenforceable, and the appeal is pending. On November 21, 2012, the tribunal ruled that the reimbursement limit would not automatically renew for another 24-month term pending resolution of the dispute.
F- 60
BIOGEN IDEC INC. AND SUBSIDIARIES
NOTES TO CONSOLIDATED FINANCIAL STATEMENTS — (Continued)
In June 2013, the Price and Reimbursement Committee of AIFA informed Biogen Idec SRL that sales of TYSABRI for February 2011 through February 2013 exceeded the reimbursement limit in the Price Resolution. We dispute that the reimbursement limit applies to this period for the same reason that we dispute its application to the February 2009 through February 2011 period.
In July 2013, we reached an agreement in principle with the Price and Reimbursement Committee of AIFA to settle all of AIFA's claims relating to sales of TYSABRI in excess of the reimbursement limit for the periods between February 2009 through February 2013 for an aggregate repayment of EUR
33.3 million
. As part of this settlement, we also agreed that the reimbursement limit will no longer be in effect as of February 2013. The settlement is pending approval by Italian regulatory authorities. Upon this approval and the execution of the settlement, we will dismiss our appeal.
Average Manufacturer Price Litigation
On September 6, 2011, we and several other pharmaceutical companies were served with a complaint originally filed under seal on October 28, 2008 in the United States District Court for the Eastern District of Pennsylvania by Ronald Streck (the relator) on behalf of himself and the United States, and the states of New Jersey, California, Rhode Island, Michigan, Montana, Wisconsin, Massachusetts, Tennessee, Oklahoma, Texas, Indiana, New Hampshire, North Carolina, Florida, Georgia, New Mexico, Illinois, New York, Virginia, Delaware, Hawaii, Louisiana, Connecticut, and Nevada (collectively, the States), and the District of Columbia, alleging violations of the False Claims Act, 31 U.S.C. § 3729 et seq. and state and District of Columbia statutory counterparts. The United States and the States have declined to intervene, and the District of Columbia has not intervened. The complaint as amended alleges that Biogen Idec and other defendants underreport Average Manufacturer Price (AMP) information to the Centers for Medicare and Medicaid Services, thereby causing Biogen Idec and the other defendants to underpay rebates under the Medicaid Drug Rebate Program. The relator alleges that the underreporting has occurred because Biogen Idec and other defendants improperly consider various payments that they make to drug wholesalers to be discounts under applicable federal law. On July 3, 2012, the court dismissed all state and federal claims as to AMP submissions before January 1, 2007, and dismissed the remaining state-law claims in whole as to claims under New Mexico law and in part as to claims under the laws of Delaware, New Hampshire, Texas, Connecticut, Georgia, Indiana, Montana, New York, Oklahoma, and Rhode Island. The court denied our motion to dismiss federal law claims as to AMP submissions after January 1, 2007. A trial has been set for December 2014. We have not formed an opinion that an unfavorable outcome under the remaining claims is either “probable” or “remote,” and are unable at this stage of the litigation to form an opinion as to the magnitude or range of any potential loss. We believe that we have good and valid defenses and intend to vigorously defend against the allegations.
Government Review of Sales and Promotional Practices
We have learned that state and federal governmental authorities are investigating our sales and promotional practices. We are cooperating with the government.
Qui Tam Litigation
In August, 2012, we learned that a relator, on behalf of the United States and certain states, filed a suit under seal on February 17, 2011 against us, Elan Corporation, plc, and Elan Pharmaceuticals, Inc. in the United States District Court for the Western District of Virginia. We have neither seen nor been served with the complaint, but understand that it was filed under the Federal False Claims Act.
Canada Lease Dispute
On April 18, 2008, First Real Properties Limited filed suit against Biogen Idec Canada Inc. (BI Canada) in the Superior Court of Justice in London, Ontario alleging breach of an offer for lease of property signed by BI Canada in 2007 and an unsigned proposed lease for the same property. In October 2013, the trial court ruled in our favor and dismissed the case. The plaintiff has filed an appeal, which is pending. In its decision, the trial court held that in the event of reversal on appeal, damages to the plaintiff should not exceed
$2.6 million
. We have not formed an opinion as to whether an unfavorable outcome in the plaintiff's appeal is either “probable” or “remote.”
F- 61
BIOGEN IDEC INC. AND SUBSIDIARIES
NOTES TO CONSOLIDATED FINANCIAL STATEMENTS — (Continued)
Knopp Neurosciences Dispute
On February 25, 2013, Knopp filed suit against Biogen Idec International Holding Ltd. in the United States District Court for the District of Massachusetts, alleging that Biogen Idec wrongfully terminated its license agreement with Knopp for the development of a product for ALS. Knopp seeks damages and injunctive relief. Knopp had also sought the transfer of certain biosamples, but the court dismissed that claim with prejudice in June 2013. No trial date has been set for Knopp's remaining claims. We have not formed an opinion that an unfavorable outcome is either “probable” or “remote,” and are unable at this stage of the litigation to form an opinion as to the magnitude or range of any potential loss. We believe that we have good and valid defenses and are vigorously defending against the claims.
Product Liability and Other Legal Proceedings
We are also involved in product liability claims and other legal proceedings generally incidental to our normal business activities. While the outcome of any of these proceedings cannot be accurately predicted, we do not believe the ultimate resolution of any of these existing matters would have a material adverse effect on our business or financial condition.
|
22.
|
Commitments and Contingencies
|
Leases
We rent laboratory and office space and certain equipment under non-cancelable operating leases. These lease agreements contain various clauses for renewal at our option and, in certain cases, escalation clauses typically linked to rates of inflation. Rental expense under these leases, net of amounts recognized in relation to our exiting the Weston facility, which terminate at various dates through 2028, amounted to
$56.1 million
in
2013
. Rent expense was
$49.0 million
in
2012
and
$46.2 million
in
2011
. In addition to rent, the leases may require us to pay additional amounts for taxes, insurance, maintenance and other operating expenses.
As of
December 31, 2013
, minimum rental commitments under non-cancelable leases, net of income from subleases, for each of the next five years and total thereafter were as follows:
|
(In millions)
|
2014
|
2015
|
2016
|
2017
|
2018
|
Thereafter
|
Total
|
||||||||||||||||||||
|
Minimum lease payments (1)
|
$
|
66.8
|
|
$
|
64.2
|
|
$
|
57.0
|
|
$
|
54.9
|
|
$
|
49.8
|
|
$
|
384.4
|
|
$
|
677.1
|
|
||||||
|
Less: income from subleases
|
—
|
|
(5.6
|
)
|
(6.0
|
)
|
(6.0
|
)
|
(6.3
|
)
|
(41.5
|
)
|
(65.4
|
)
|
|||||||||||||
|
Net minimum lease payments
|
$
|
66.8
|
|
$
|
58.6
|
|
$
|
51.0
|
|
$
|
48.9
|
|
$
|
43.5
|
|
$
|
342.9
|
|
$
|
611.7
|
|
||||||
|
(1)
|
Includes future minimum rental commitments related to leases executed for two office buildings in Cambridge, Massachusetts, which completed construction in July and November 2013. The leases both have
15
year terms and we have options to extend the term of each lease for two additional five-year terms. Future minimum rental commitments under these leases will total approximately
$340.0 million
over the initial 15 year lease terms.
|
As a result of our decision to relocate our corporate headquarters to Cambridge, Massachusetts, we vacated part of our Weston, Massachusetts facility in the fourth quarter of 2013. We incurred a charge of
$27.2 million
in connection with this move. This charge represents our remaining lease obligation for the vacated portion of our Weston facility, net of sublease income expected to be received. The term of our sublease to the vacated portion of our Weston facility started in January 2014 and will continue through the remaining term of our lease agreement.
For additional information related to these transactions, please read Note 11,
Property, Plant and Equipment
to these consolidated financial statements.
Under certain of our lease agreements, we are contractually obligated to return leased space to its original condition upon termination of the lease agreement. At the inception of a lease with such conditions, we record an asset retirement obligation liability and a corresponding capital asset in an amount equal to the estimated fair value of the obligation. In subsequent periods, for each such lease, we record interest expense to accrete the asset retirement obligation liability to full value and depreciate each capitalized asset retirement obligation asset, both over the term of the associated lease agreement. Our asset retirement obligations were not significant as of
December 31, 2013
or
2012
.
Tax Related Obligations
As of
December 31, 2013
, we have approximately
$99.4 million
of liabilities associated with uncertain tax positions.
F- 62
BIOGEN IDEC INC. AND SUBSIDIARIES
NOTES TO CONSOLIDATED FINANCIAL STATEMENTS — (Continued)
Other Funding Commitments
During the year ended
December 31, 2013
, we contributed the remaining
13.5 billion
South Korean won (approximately
$12.4 million
) to Samsung Bioepis to complete our obligation to contribute an aggregate of approximately
49.5 billion
South Korean won (approximately
$45.0 million
) for our
15 percent
ownership interest of Samsung Bioepis. For additional information related to our relationship with Samsung Bioepis, please read Note 20,
Collaborative and Other Relationships
to these consolidated financial statements.
As of
December 31, 2013
, we have funding commitments of up to approximately
$14.0 million
as part of our investment in biotechnology oriented companies and venture capital funds.
As of
December 31, 2013
, we have several on-going clinical studies in various clinical trial stages. Our most significant clinical trial expenditures are to clinical research organizations (CROs). The contracts with CROs are generally cancellable, with notice, at our option. We have recorded accrued expenses of approximately
$28.2 million
on our consolidated balance sheet for expenditures incurred by CROs as of
December 31, 2013
. We have approximately
$424.1 million
in cancellable future commitments based on existing CRO contracts as of
December 31, 2013
.
Contingent Development and Commercial Milestone Payments
Based on our development plans as of
December 31, 2013
, we have committed to make potential future milestone payments to third parties of up to approximately
$2.0 billion
as part of our various collaborations, including licensing and development programs. Payments under these agreements generally become due and payable only upon achievement of certain development, regulatory or commercial milestones. Because the achievement of these milestones had not occurred as of
December 31, 2013
, such contingencies have not been recorded in our financial statements.
TYSABRI Contingent Payments
On April 2, 2013, we acquired full ownership of, and strategic, commercial and decision-making rights to, TYSABRI from Elan. Under the terms of the acquisition agreement, we continued to share TYSABRI profits with Elan on an equal basis until April 30, 2013. We recorded the profit split for the month ended April 30, 2013, as cost of sales within our consolidated statements of income as we controlled TYSABRI effective April 2, 2013. Commencing May 1, 2013 and for the first twelve months thereafter, we will make contingent payments to Elan of
12%
on worldwide net sales of TYSABRI and, thereafter,
18%
on annual worldwide net sales up to
$2.0 billion
and
25%
on annual worldwide net sales that exceed
$2.0 billion
. In 2014, the
$2.0 billion
threshold will be pro-rated for the portion of 2014 remaining after the first 12 months expires. Royalty payments to Elan and other third parties are recognized as cost of sales within our consolidated statements of income.
Contingent Consideration related to Business Combinations
In connection with our purchase of the noncontrolling interests in our joint venture investments in Biogen Dompé SRL and Biogen Dompé Switzerland GmbH and our acquisitions of Stromedix, Biogen Idec International Neuroscience GmbH (BIN), Biogen Idec Hemophilia Inc. (BIH), and Fumapharm AG, we agreed to make additional payments based upon the achievement of certain milestone events. These milestones may not be achieved.
As the acquisitions of the noncontrolling interests in our joint venture investments and our acquisitions of Stromedix and BIN, formerly Panima Pharmaceuticals AG, occurred after January 1, 2009, we record contingent consideration liabilities at their fair value on the acquisition date and revalue these obligations each reporting period. For additional information related to the acquisitions of the noncontrolling interests in our joint venture investments and our acquisition of Stromedix please read Note 2,
Acquisitions
, to these consolidated financial statements.
In connection with our acquisition of BIH, formerly Syntonix, in January 2007, we agreed to pay up to an additional
$80.0 million
if certain milestone events associated with the development of BIH’s lead product, ALPROLIX are achieved. The first
$40.0 million
contingent payment was achieved in the first quarter of 2010. An additional
$20.0 million
contingent payment will occur if prior to the tenth anniversary of the closing date, the FDA grants approval of a Biologic License Application for ALPROLIX. A second
$20.0 million
contingent payment will occur if prior to the tenth anniversary of the closing date, a marketing authorization is granted by the EMA for ALPROLIX. For additional information related to our acquisition of BIH transactions please read Note 2,
Acquisitions
to these consolidated financial statements.
F- 63
BIOGEN IDEC INC. AND SUBSIDIARIES
NOTES TO CONSOLIDATED FINANCIAL STATEMENTS — (Continued)
In 2006, we acquired Fumapharm AG. As part of this acquisition we acquired FUMADERM and TECFIDERA (together, Fumapharm Products). We paid
$220.0 million
upon closing of the transaction and agreed to pay an additional
$15.0 million
if a Fumapharm Product is approved for MS in the U.S. or E.U. In the second quarter of 2013, we paid this
$15.0 million
contingent payment as TECFIDERA was approved in the U.S. for MS by the FDA. We are also required to make the following additional contingent payments to former shareholders of Fumapharm AG based on the attainment of certain cumulative sales levels of Fumapharm Products and the level of total net sales of Fumapharm Products in the prior twelve month period, as defined in the acquisition agreement:
|
Cumulative Sales Level
|
||||||||||||||||||||
|
Prior 12 Month Sales
|
$500M
|
$1.0B
|
$2.0B
|
$3.0B
|
Each additional $1.0B up to $20.0B
|
|||||||||||||||
|
Payment Amount (In millions)
|
||||||||||||||||||||
|
< $500 million
|
$
|
—
|
|
$
|
—
|
|
$
|
—
|
|
$
|
—
|
|
$
|
—
|
|
|||||
|
$500 million - $1.0 billion
|
22.0
|
|
25.0
|
|
50.0
|
|
50.0
|
|
50.0
|
|
||||||||||
|
$1.0 billion - $1.5 billion
|
—
|
|
50.0
|
|
100.0
|
|
100.0
|
|
100.0
|
|
||||||||||
|
$1.5 billion - $2.0 billion
|
—
|
|
—
|
|
150.0
|
|
150.0
|
|
150.0
|
|
||||||||||
|
$2.0 billion - $2.5 billion
|
—
|
|
—
|
|
200.0
|
|
200.0
|
|
200.0
|
|
||||||||||
|
$2.5 billion - $3.0 billion
|
—
|
|
—
|
|
—
|
|
250.0
|
|
250.0
|
|
||||||||||
|
> $3.0 billion
|
—
|
|
—
|
|
—
|
|
—
|
|
300.0
|
|
||||||||||
These payments will be accounted for as an increase to goodwill as incurred, in accordance with the accounting standard applicable to business combinations when we acquired Fumapharm. Any portion of the payment which is tax deductible will be recorded as a reduction to goodwill. Payments are due within 60 days following the end of the quarter in which the applicable cumulative sales level has been reached. During 2013, we accrued the
$25.0 million
contingent payment as we reached the
$1.0 billion
cumulative sales level related to the Fumapharm Products.
|
23.
|
Guarantees
|
As of
December 31, 2013
and
2012
, we did not have significant liabilities recorded for guarantees.
We enter into indemnification provisions under our agreements with other companies in the ordinary course of business, typically with business partners, contractors, clinical sites and customers. Under these provisions, we generally indemnify and hold harmless the indemnified party for losses suffered or incurred by the indemnified party as a result of our activities. These indemnification provisions generally survive termination of the underlying agreement. The maximum potential amount of future payments we could be required to make under these indemnification provisions is unlimited. However, to date we have not incurred material costs to defend lawsuits or settle claims related to these indemnification provisions. As a result, the estimated fair value of these agreements is minimal. Accordingly, we have no liabilities recorded for these agreements as of
December 31, 2013
and
2012
.
|
24.
|
Employee Benefit Plans
|
We sponsor various retirement and pension plans. Our estimates of liabilities and expenses for these plans incorporate a number of assumptions, including expected rates of return on plan assets and interest rates used to discount future benefits.
401(k) Savings Plan
We maintain a 401(k) Savings Plan which is available to substantially all regular employees in the U.S. over the age of
21
. Participants may make voluntary contributions. We make matching contributions according to the 401(k) Savings Plan’s matching formula. All matching contributions and participant contributions vest immediately. The 401(k) Savings Plan also holds certain transition contributions on behalf of participants who previously participated in the Biogen, Inc. Retirement Plan. The expense related to our 401(k) Savings Plan primarily consists of our matching contributions.
Expense related to our 401(k) Savings Plan totaled
$39.3 million
,
$32.8 million
and
$24.8 million
for the years ended
December 31, 2013
,
2012
and
2011
, respectively.
F- 64
BIOGEN IDEC INC. AND SUBSIDIARIES
NOTES TO CONSOLIDATED FINANCIAL STATEMENTS — (Continued)
Deferred Compensation Plan
We maintain a non-qualified deferred compensation plan, known as the Supplemental Savings Plan (SSP), which allows a select group of management employees in the U.S. to defer a portion of their compensation. The SSP also provides certain credits to highly compensated U.S. employees, which are paid by the company. These credits are known as the Restoration Match. The deferred compensation amounts are accrued when earned. Such deferred compensation is distributable in cash in accordance with the rules of the SSP. Deferred compensation amounts under such plan as of
December 31, 2013
and
2012
totaled approximately
$84.7 million
and
$66.9 million
, respectively, and are included in other long-term liabilities within the accompanying consolidated balance sheets. The SSP also holds certain transition contributions on behalf of participants who previously participated in the Biogen, Inc. Retirement Plan.The Restoration Match and participant contributions vest immediately. Distributions to participants can be either in one lump sum payment or annual installments as elected by the participants.
Pension Plan
Our retiree benefit plans include defined benefit plans for employees in our affiliates in Switzerland and Germany as well as other insignificant defined benefit plans in certain other countries in which we maintain an operating presence.
Our Swiss plan is a government-mandated retirement fund that provides employees with a minimum investment return. The minimum investment return is determined annually by Swiss government and was
1.5%
in
2013
,
1.5%
in
2012
and
2.0%
in
2011
, respectively. Under this plan, both we and certain of our employees with annual earnings in excess of government determined amounts are required to make contributions into a fund managed by an independent investment fiduciary. Employer contributions must be in an amount at least equal to the employee’s contribution. Minimum employee contributions are based on the respective employee’s age, salary, and gender. As of
December 31, 2013
and
2012
, the Plan had an unfunded net pension obligation of approximately
$22.6 million
and
$20.5 million
, respectively, and plan assets which totaled approximately
$38.1 million
and
$28.1 million
, respectively. In
2013
,
2012
and
2011
, we recognized expense totaling
$10.9 million
,
$3.8 million
and
$3.6 million
, respectively, related to our Swiss plan.
The obligations under the German plan are unfunded and totaled
$20.0 million
and
$15.9 million
as of
December 31, 2013
and
2012
, respectively. Net periodic pension cost related to the German plan totaled
$3.3 million
,
$1.9 million
and
$1.8 million
for the years ended
December 31, 2013
,
2012
and
2011
, respectively.
|
25.
|
Segment Information
|
We operate as
one
operating segment, which is the business of discovering, developing, manufacturing and marketing therapies for the treatment of multiple sclerosis and other autoimmune disorders, neurodegenerative diseases and hemophilia and, therefore, our chief operating decision-maker manages the operations of our company as a single operating segment. Enterprise-wide disclosures about product revenues, other revenues and long-lived assets by geographic area and information relating to major customers are presented below. Revenues are primarily attributed to individual countries based on location of the customer or licensee.
Revenue by product is summarized as follows:
|
|
For the Years Ended December 31,
|
||||||||||||||||||||||||||||||||||
|
|
2013
|
2012
|
2011
|
||||||||||||||||||||||||||||||||
|
(In millions)
|
United
States
|
Rest of
World
|
Total
|
United
States
|
Rest of
World
|
Total
|
United
States
|
Rest of
World
|
Total
|
||||||||||||||||||||||||||
|
AVONEX
|
$
|
1,902.4
|
|
$
|
1,103.1
|
|
$
|
3,005.5
|
|
$
|
1,793.7
|
|
$
|
1,119.4
|
|
$
|
2,913.1
|
|
$
|
1,628.3
|
|
$
|
1,058.3
|
|
$
|
2,686.6
|
|
||||||||
|
TYSABRI
|
814.2
|
|
712.3
|
|
1,526.5
|
|
383.1
|
|
752.8
|
|
1,135.9
|
|
326.5
|
|
753.0
|
|
1,079.5
|
|
|||||||||||||||||
|
TECFIDERA
|
864.4
|
|
11.7
|
|
876.1
|
|
—
|
|
—
|
|
—
|
|
—
|
|
—
|
|
—
|
|
|||||||||||||||||
|
Other
|
—
|
|
134.2
|
|
134.2
|
|
—
|
|
117.1
|
|
117.1
|
|
—
|
|
70.0
|
|
70.0
|
|
|||||||||||||||||
|
Total product revenues
|
$
|
3,581.0
|
|
$
|
1,961.3
|
|
$
|
5,542.3
|
|
$
|
2,176.8
|
|
$
|
1,989.3
|
|
$
|
4,166.1
|
|
$
|
1,954.8
|
|
$
|
1,881.3
|
|
$
|
3,836.1
|
|
||||||||
F- 65
BIOGEN IDEC INC. AND SUBSIDIARIES
NOTES TO CONSOLIDATED FINANCIAL STATEMENTS — (Continued)
Geographic Information
The following tables contain certain financial information by geographic area:
|
December 31, 2013 (In millions)
|
U.S.
|
Europe
(1)
|
Germany
|
Asia
|
Other
|
Total
|
|||||||||||||||||
|
Product revenues from external customers
|
$
|
3,581.0
|
|
$
|
1,170.2
|
|
$
|
417.7
|
|
$
|
93.2
|
|
$
|
280.2
|
|
$
|
5,542.3
|
|
|||||
|
Revenues from unconsolidated joint business
|
$
|
1,087.3
|
|
$
|
1.6
|
|
$
|
—
|
|
$
|
3.2
|
|
$
|
33.9
|
|
$
|
1,126.0
|
|
|||||
|
Other revenues from external customers
|
$
|
193.5
|
|
$
|
26.1
|
|
$
|
1.2
|
|
$
|
43.1
|
|
$
|
—
|
|
$
|
263.9
|
|
|||||
|
Long-lived assets
|
$
|
984.4
|
|
$
|
758.3
|
|
$
|
2.5
|
|
$
|
2.1
|
|
$
|
3.3
|
|
$
|
1,750.7
|
|
|||||
|
December 31, 2012 (In millions)
|
U.S.
|
Europe
(1)
|
Germany
|
Asia
|
Other
|
Total
|
|||||||||||||||||
|
Product revenues from external customers
|
$
|
2,176.8
|
|
$
|
1,216.2
|
|
$
|
409.2
|
|
$
|
93.2
|
|
$
|
270.7
|
|
$
|
4,166.1
|
|
|||||
|
Revenues from unconsolidated joint business
|
$
|
1,033.3
|
|
$
|
14.3
|
|
$
|
—
|
|
$
|
27.5
|
|
$
|
62.8
|
|
$
|
1,137.9
|
|
|||||
|
Other revenues from external customers
|
$
|
170.2
|
|
$
|
27.9
|
|
$
|
1.1
|
|
$
|
13.3
|
|
$
|
—
|
|
$
|
212.5
|
|
|||||
|
Long-lived assets
|
$
|
996.6
|
|
$
|
738.6
|
|
$
|
1.9
|
|
$
|
2.9
|
|
$
|
2.2
|
|
$
|
1,742.2
|
|
|||||
|
December 31, 2011 (In millions)
|
U.S.
|
Europe
(1)
|
Germany
|
Asia
|
Other
|
Total
|
|||||||||||||||||
|
Product revenues from external customers
|
$
|
1,954.8
|
|
$
|
1,163.3
|
|
$
|
377.5
|
|
$
|
88.7
|
|
$
|
251.8
|
|
$
|
3,836.1
|
|
|||||
|
Revenues from unconsolidated joint business
|
$
|
878.8
|
|
$
|
29.9
|
|
$
|
—
|
|
$
|
30.7
|
|
$
|
57.2
|
|
$
|
996.6
|
|
|||||
|
Other revenues from external customers
|
$
|
187.0
|
|
$
|
28.3
|
|
$
|
0.6
|
|
$
|
—
|
|
$
|
—
|
|
$
|
215.9
|
|
|||||
|
Long-lived assets
|
$
|
1,012.5
|
|
$
|
816.6
|
|
$
|
1.6
|
|
$
|
5.3
|
|
$
|
2.4
|
|
$
|
1,838.4
|
|
|||||
|
(1)
|
Represents amounts related to Europe less those attributable to Germany.
|
Revenues from Unconsolidated Joint Business
Approximately
16%
,
21%
and
20%
of our total revenues in
2013
,
2012
and
2011
, respectively, are derived from our joint business arrangement with Genentech. For additional information related to our collaboration with Genentech, please read Note 20,
Collaborative and Other Relationships
to these consolidated financial statements.
Significant Customers
We recorded revenue from two wholesale distributors accounting for
32%
and
24%
of gross product revenues in
2013
,
20%
and
10%
of gross product revenue in
2012
, and
18%
and
10%
of gross product revenues in
2011
.
Other
As of
December 31, 2013
,
2012
and
2011
, approximately
$731.1 million
,
$713.4 million
and
$668.5 million
, respectively, of our long-lived assets were related to our manufacturing facilities in Denmark.
F- 66
BIOGEN IDEC INC. AND SUBSIDIARIES
NOTES TO CONSOLIDATED FINANCIAL STATEMENTS — (Continued)
|
26.
|
Quarterly Financial Data (Unaudited)
|
|
(In millions, except per share amounts)
|
First
Quarter
|
Second
Quarter
|
Third
Quarter
|
Fourth
Quarter
|
Total
Year
|
||||||||||||||
|
2013
|
(a)
|
(b)
|
(b) (c)
|
(b)
|
|||||||||||||||
|
Product revenues
|
$
|
1,095.8
|
|
$
|
1,385.9
|
|
$
|
1,453.6
|
|
$
|
1,607.1
|
|
$
|
5,542.3
|
|
||||
|
Unconsolidated joint business revenues
|
$
|
264.6
|
|
$
|
288.8
|
|
$
|
303.2
|
|
$
|
269.4
|
|
$
|
1,126.0
|
|
||||
|
Other revenues
|
$
|
54.7
|
|
$
|
48.8
|
|
$
|
71.0
|
|
$
|
89.4
|
|
$
|
263.9
|
|
||||
|
Total revenues
|
$
|
1,415.1
|
|
$
|
1,723.5
|
|
$
|
1,827.8
|
|
$
|
1,965.9
|
|
$
|
6,932.2
|
|
||||
|
Gross profit
|
$
|
1,281.4
|
|
$
|
1,492.8
|
|
$
|
1,593.1
|
|
$
|
1,707.3
|
|
$
|
6,074.5
|
|
||||
|
Net income
|
$
|
426.7
|
|
$
|
490.7
|
|
$
|
487.6
|
|
$
|
457.3
|
|
$
|
1,862.3
|
|
||||
|
Net income attributable to Biogen Idec Inc.
|
$
|
426.7
|
|
$
|
490.7
|
|
$
|
487.6
|
|
$
|
457.3
|
|
$
|
1,862.3
|
|
||||
|
Basic earnings per share attributable to Biogen Idec Inc.
|
$
|
1.80
|
|
$
|
2.07
|
|
$
|
2.06
|
|
$
|
1.94
|
|
$
|
7.86
|
|
||||
|
Diluted earnings per share attributable to Biogen Idec Inc.
|
$
|
1.79
|
|
$
|
2.06
|
|
$
|
2.05
|
|
$
|
1.92
|
|
$
|
7.81
|
|
||||
|
(In millions, except per share amounts)
|
First
Quarter
|
Second
Quarter
|
Third
Quarter
|
Fourth
Quarter
|
Total
Year
|
||||||||||||||
|
2012
|
(d)
|
|
(e) (f)
|
|
|||||||||||||||
|
Product revenues
|
$
|
975.4
|
|
$
|
1,076.8
|
|
$
|
1,039.1
|
|
$
|
1,074.7
|
|
$
|
4,166.1
|
|
||||
|
Unconsolidated joint business revenues
|
$
|
284.6
|
|
$
|
284.6
|
|
$
|
287.8
|
|
$
|
280.9
|
|
$
|
1,137.9
|
|
||||
|
Other revenues
|
$
|
32.0
|
|
$
|
59.6
|
|
$
|
58.6
|
|
$
|
62.3
|
|
$
|
212.5
|
|
||||
|
Total revenues
|
$
|
1,292.0
|
|
$
|
1,421.0
|
|
$
|
1,385.5
|
|
$
|
1,417.9
|
|
$
|
5,516.5
|
|
||||
|
Gross profit
|
$
|
1,158.8
|
|
$
|
1,281.8
|
|
$
|
1,246.2
|
|
$
|
1,284.1
|
|
$
|
4,971.0
|
|
||||
|
Net income
|
$
|
302.4
|
|
$
|
387.1
|
|
$
|
398.4
|
|
$
|
292.1
|
|
$
|
1,380.0
|
|
||||
|
Net income attributable to Biogen Idec Inc.
|
$
|
302.7
|
|
$
|
386.8
|
|
$
|
398.4
|
|
$
|
292.1
|
|
$
|
1,380.0
|
|
||||
|
Basic earnings per share attributable to Biogen Idec Inc.
|
$
|
1.26
|
|
$
|
1.62
|
|
$
|
1.68
|
|
$
|
1.24
|
|
$
|
5.80
|
|
||||
|
Diluted earnings per share attributable to Biogen Idec Inc.
|
$
|
1.25
|
|
$
|
1.61
|
|
$
|
1.67
|
|
$
|
1.23
|
|
$
|
5.76
|
|
||||
Full year amounts may not sum due to rounding.
|
(a)
|
Our share of revenues from unconsolidated joint business reflects a charge of
$41.5 million
for damages and interest awarded to Hoechst in Genentech's arbitration with Hoechst for RITUXAN.
|
|
(b)
|
Product revenues and total revenues for the second, third and fourth quarters of 2013 includes 100% of net revenues related to sales of TYSABRI as a result of our acquisition of TYSABRI rights from Elan on April 2, 2013 and net revenues related to sales of TECFIDERA, our new oral first-line treatment for people with relapsing forms of multiple sclerosis (MS), which was approved by the FDA in March 2013 and commenced commercial sales in April 2013.
|
|
(c)
|
Net income and net income attributable to Biogen Idec Inc., for the third quarter of 2013, includes a charge to research and development expense of
$75.0 million
related to an upfront payment made in connection with our collaboration agreement entered into with Isis.
|
|
(d)
|
Net income and net income attributable to Biogen Idec Inc. for the first quarter of 2012 includes a charge to research and development expense of
$29.0 million
related to an upfront payment made in connection with our development agreement entered into with Isis.
|
|
(e)
|
Net income and net income attributable to Biogen Idec Inc. for the fourth quarter of 2012 includes the correction of an error that had accumulated over several prior years in our deferred tax accounting for capitalized interest which resulted in an expense of
$29.0 million
.
|
|
(f)
|
Net income and net income attributable to Biogen Idec Inc. for the fourth quarter of 2012 includes a charge to research and development expense of
$30.0 million
related to an upfront payment made in connection with our development agreement entered into with Isis.
|
F- 67
BIOGEN IDEC INC. AND SUBSIDIARIES
NOTES TO CONSOLIDATED FINANCIAL STATEMENTS — (Continued)
27. Subsequent Events
Sangamo BioSciences, Inc.
On January 9, 2014, we entered into an exclusive worldwide collaboration and license agreement with Sangamo BioSciences, Inc. (Sangamo) under which both companies will develop and commercialize product candidates for the treatment of two inherited blood disorders, sickle cell disease and beta-thalassemia. The collaboration is currently in the research stage of development.
Under the terms of the agreement, we will provide Sangamo with an upfront payment of
$20.0 million
in cash, with additional payments of up to
$300.0 million
based on the achievement of certain development and regulatory milestones, plus royalties based on sales. Under this arrangement, Sangamo will be responsible for identifying a product candidate for the treatment of beta-thalassemia and advancing that candidate through a completed Phase 1 human clinical trial, at which point we will assume responsibility for development. We will jointly develop a sickle cell disease candidate through the potential filing on an investigative new drug application, after which we will assume clinical responsibilities. We will lead the global development and commercialization efforts and Sangamo will have the option to assume co-promotion responsibilities in the U.S.
Completion of the transaction is subject to customary closing conditions, including antitrust clearance in the U.S. under the Hart-Scott-Rodino Antitrust Improvements Act of 1976.
F- 68
REPORT OF INDEPENDENT REGISTERED PUBLIC ACCOUNTING FIRM
To the Board of Directors and Shareholders of Biogen Idec Inc.
In our opinion, the accompanying consolidated balance sheets and the related consolidated statements of income, comprehensive income, equity and cash flows present fairly, in all material respects, the financial position of Biogen Idec Inc. and its subsidiaries at
December 31, 2013
and
2012
, and the results of their operations and their cash flows for each of the three years in the period ended
December 31, 2013
in conformity with accounting principles generally accepted in the United States of America. Also in our opinion, the Company maintained, in all material respects, effective internal control over financial reporting as of
December 31, 2013
, based on criteria established in
Internal Control — Integrated Framework (1992)
issued by the Committee of Sponsoring Organizations of the Treadway Commission (COSO). The Company’s management is responsible for these financial statements, for maintaining effective internal control over financial reporting and for its assessment of the effectiveness of internal control over financial reporting, included in Management’s Annual Report on Internal Control over Financial Reporting appearing under 9A. Our responsibility is to express opinions on these financial statements and on the Company’s internal control over financial reporting based on our integrated audits. We conducted our audits in accordance with the standards of the Public Company Accounting Oversight Board (United States). Those standards require that we plan and perform the audits to obtain reasonable assurance about whether the financial statements are free of material misstatement and whether effective internal control over financial reporting was maintained in all material respects. Our audits of the financial statements included examining, on a test basis, evidence supporting the amounts and disclosures in the financial statements, assessing the accounting principles used and significant estimates made by management, and evaluating the overall financial statement presentation. Our audit of internal control over financial reporting included obtaining an understanding of internal control over financial reporting, assessing the risk that a material weakness exists, and testing and evaluating the design and operating effectiveness of internal control based on the assessed risk. Our audits also included performing such other procedures as we considered necessary in the circumstances. We believe that our audits provide a reasonable basis for our opinions.
A company’s internal control over financial reporting is a process designed to provide reasonable assurance regarding the reliability of financial reporting and the preparation of financial statements for external purposes in accordance with generally accepted accounting principles. A company’s internal control over financial reporting includes those policies and procedures that (i) pertain to the maintenance of records that, in reasonable detail, accurately and fairly reflect the transactions and dispositions of the assets of the company; (ii) provide reasonable assurance that transactions are recorded as necessary to permit preparation of financial statements in accordance with generally accepted accounting principles, and that receipts and expenditures of the company are being made only in accordance with authorizations of management and directors of the company; and (iii) provide reasonable assurance regarding prevention or timely detection of unauthorized acquisition, use, or disposition of the company’s assets that could have a material effect on the financial statements.
Because of its inherent limitations, internal control over financial reporting may not prevent or detect misstatements. Also, projections of any evaluation of effectiveness to future periods are subject to the risk that controls may become inadequate because of changes in conditions, or that the degree of compliance with the policies or procedures may deteriorate.
/s/ PricewaterhouseCoopers LLP
Boston, Massachusetts
February 6, 2014
F- 69
EXHIBIT INDEX
|
Exhibit No.
|
|
Description
|
|
2.1†
|
Asset Purchase Agreement among Biogen Idec International Holding Ltd., Elan Pharma International Limited and Elan Pharmaceuticals, Inc., dated as of February 5, 2013. Filed as Exhibit 2.1 to our Current Report on Form 8-K/A filed on February 12, 2013.
|
|
|
3.1
|
|
Amended and Restated Certificate of Incorporation, as amended. Filed as Exhibit 3.1 to our Quarterly Report on Form 10-Q for the quarter ended June 30, 2012.
|
|
3.2
|
|
Second Amended and Restated Bylaws, as amended. Filed as Exhibit 3.1 to our Quarterly Report on Form 10-Q for the quarter ended September 30, 2012.
|
|
4.1
|
|
Reference is made to Exhibit 3.1 for a description of the rights, preferences and privileges of our Series A Preferred Stock and Series X Junior Participating Preferred Stock.
|
|
4.2
|
|
Indenture between Biogen Idec and The Bank of New York Trust Company, N.A. dated as of February 26, 2008. Filed as Exhibit 4.1 to our Registration Statement on Form S-3 (File No. 333-149379).
|
|
4.3
|
|
First Supplemental Indenture between Biogen Idec and The Bank of New York Trust Company, N.A. dated as of March 4, 2008. Filed as Exhibit 4.1 to our Current Report on Form 8-K filed on March 4, 2008.
|
|
10.1
|
|
Credit Agreement among Biogen Idec, Bank of America, N.A. as administrative agent, swing line lender and L/C issuer and the other lenders party thereto. Filed as Exhibit 10.1 to our Quarterly Report on Form 10-Q for the quarter ended March 31, 2013.
|
|
10.2†
|
|
Expression Technology Agreement between Biogen Idec and Genentech. Inc. dated March 16, 1995. Filed as an exhibit to Biogen Idec’s Quarterly Report on Form 10-Q for the quarter ended March 31, 1995.
|
|
10.3
|
|
Letter Agreement between Biogen Idec and Genentech, Inc. dated May 21, 1996. Filed as Exhibit 10.1 to our Current Report on Form 8-K filed on June 6, 1996.
|
|
10.4†
|
|
Second Amended and Restated Collaboration Agreement between Biogen Idec and Genentech, Inc. dated as of October 18, 2010. Filed as Exhibit 10.5 to our Annual Report on Form 10-K for the year ended December 31, 2010.
|
|
10.5†
|
|
Letter agreement regarding GA101 financial terms between Biogen Idec and Genentech, Inc. dated October 18, 2010. Filed as Exhibit 10.6 to our Annual Report on Form 10-K for the year ended December 31, 2010.
|
|
10.6†
|
|
ANTEGREN (now TYSABRI) Development and Marketing Collaboration Agreement between Biogen Idec and Elan Pharma International Limited dated August 15, 2000. Filed as Exhibit 10.48 to Biogen, Inc.’s Annual Report on Form 10-K for the year ended December 31, 2002 (File No. 0-12042) and incorporated herein by reference.
|
|
10.7*
|
|
Biogen Idec Inc. 2008 Omnibus Equity Plan. Filed as Appendix A to our Definitive Proxy Statement on Schedule 14A filed on May 8, 2008.
|
|
10.8*
|
|
Amendment to Biogen Idec Inc. 2008 Omnibus Equity Plan dated October 13, 2008. Filed as Exhibit 10.19 to our Annual Report on Form 10-K for the year ended December 31, 2008.
|
|
10.9*
|
|
Form of restricted stock unit award agreement under the Biogen Idec Inc. 2008 Omnibus Equity Plan. Filed as Exhibit 10.1 to our Current Report on Form 8-K filed on August 1, 2008.
|
|
10.10*
|
|
Form of nonqualified stock option award agreement under the Biogen Idec Inc. 2008 Omnibus Equity Plan. Filed as Exhibit 10.2 to our Current Report on Form 8-K filed on August 1, 2008.
|
|
10.11*
|
|
Form of cash-settled performance shares award agreement under the Biogen Idec Inc. 2008 Omnibus Equity Plan. Filed as Exhibit 10.1 to our Quarterly Report on Form 10-Q for the quarter ended March 31, 2010.
|
|
10.12+
|
Form of performance shares award agreement under the Biogen Idec Inc. 2008 Omnibus Equity Plan.
|
|
|
10.13*
|
|
Form of market stock unit award agreement under the Biogen Idec Inc. 2008 Omnibus Equity Plan. Filed as Exhibit 10.2 to our Quarterly Report on Form 10-Q for the quarter ended March 31, 2010.
|
|
10.14*
|
|
Biogen Idec Inc. 2006 Non-Employee Directors Equity Plan, as amended. Filed as Appendix A to our Definitive Proxy Statement on Schedule 14A filed on April 28, 2010.
|
|
10.15*
|
|
Amendment to Biogen Idec Inc. 2006 Non-Employee Directors Equity Plan dated June 1, 2011. Filed as Exhibit 10.4 to our Quarterly Report on Form 10-Q for the quarter ended June 30, 2011.
|
|
10.16*
|
|
Biogen Idec Inc. 2005 Omnibus Equity Plan. Filed as Appendix A to our Definitive Proxy Statement on Schedule 14A filed on April 15, 2005.
|
A- 1
|
Exhibit No.
|
|
Description
|
|
10.17*
|
|
Amendment No. 1 to the Biogen Idec Inc. 2005 Omnibus Equity Plan dated April 4, 2006. Filed as Exhibit 10.1 to our Quarterly Report on Form 10-Q for the quarter ended March 31, 2007.
|
|
10.18*
|
|
Amendment No. 2 to the Biogen Idec Inc. 2005 Omnibus Equity Plan dated February 12, 2007. Filed as Exhibit 10.2 to our Quarterly Report on Form 10-Q for the quarter ended March 31, 2007.
|
|
10.19*
|
|
Amendment to the Biogen Idec Inc. 2005 Omnibus Equity Plan dated April 18, 2008. Filed as Exhibit 10.7 to our Quarterly Report on Form 10-Q for the quarter ended June 30, 2008.
|
|
10.20*
|
|
Amendment to Biogen Idec Inc. 2005 Omnibus Equity Plan dated October 13, 2008. Filed as Exhibit 10.30 to our Annual Report on Form 10-K for the year ended December 31, 2008.
|
|
10.21*
|
|
Biogen Idec Inc. 2003 Omnibus Equity Plan. Filed as Exhibit 10.73 to our Current Report on Form 8-K filed on November 12, 2003.
|
|
10.22*
|
|
Amendment to Biogen Idec Inc. 2003 Omnibus Equity Plan. Filed as Exhibit 10.1 to our Quarterly Report on Form 10-Q for the quarter ended March 31, 2005.
|
|
10.23*
|
|
Amendment to Biogen Idec Inc. 2003 Omnibus Equity Plan dated April 18, 2008. Filed as Exhibit 10.6 to our Quarterly Report on Form 10-Q for the quarter ended June 30, 2008.
|
|
10.24*
|
|
Amendment to Biogen Idec Inc. 2003 Omnibus Equity Plan dated October 13, 2008. Filed as Exhibit 10.34 to our Annual Report on Form 10-K for the year ended December 31, 2008.
|
|
10.25*
|
|
Biogen Idec Inc. 1995 Employee Stock Purchase Plan as amended and restated effective April 6, 2005. Filed as Appendix B to our Definitive Proxy Statement on Schedule 14A filed on April 15, 2005.
|
|
10.26*
|
|
IDEC Pharmaceuticals Corporation 1993 Non-Employee Directors Stock Option Plan, as amended and restated through February 19, 2003. Filed as Appendix B to our Definitive Proxy Statement on Schedule 14A filed on April 11, 2003.
|
|
10.27*
|
|
Amendment to IDEC Pharmaceuticals Corporation 1993 Non-Employee Directors Stock Option Plan dated April 18, 2008. Filed as Exhibit 10.5 to our Quarterly Report on Form 10-Q for the quarter ended June 30, 2008.
|
|
10.28*
|
|
Amendment to IDEC Pharmaceuticals Corporation 1993 Non-Employee Directors Stock Option Plan dated June 1, 2011. Filed as Exhibit 10.3 to our Quarterly Report on Form 10-Q for the quarter ended June 30, 2011.
|
|
10.29*
|
|
IDEC Pharmaceuticals Corporation 1988 Stock Option Plan, as amended and restated through February 19, 2003. Filed as Appendix A to our Definitive Proxy Statement on Schedule 14A filed on April 11, 2003.
|
|
10.30*
|
|
Amendment to the IDEC Pharmaceuticals Corporation 1988 Stock Option Plan dated April 16, 2004. Filed as Exhibit 10.1 to our Quarterly Report on Form 10-Q for the quarter ended June 30, 2004.
|
|
10.31*
|
|
Amendment to IDEC Pharmaceuticals Corporation 1988 Stock Option Plan dated April 18, 2008. Filed as Exhibit 10.4 to our Quarterly Report on Form 10-Q for the quarter ended June 30, 2008.
|
|
10.32*
|
|
Biogen, Inc. 1985 Non-Qualified Stock Option Plan, as amended and restated through April 11, 2003. Filed as Exhibit 10.22 to our Annual Report on Form 10-K for the year ended December 31, 2007.
|
|
10.33*
|
|
Amendment to Biogen, Inc. 1985 Non-Qualified Stock Option Plan dated April 18, 2008. Filed as Exhibit 10.2 to our Quarterly Report on Form 10-Q for the quarter ended June 30, 2008.
|
|
10.34*
|
|
Amendment to Biogen, Inc. 1985 Non-Qualified Stock Option Plan dated October 13, 2008. Filed as Exhibit 10.45 to our Annual Report on Form 10-K for the year ended December 31, 2008.
|
|
10.35*
|
|
Biogen Idec Inc. 2008 Performance-Based Management Incentive Plan. Filed as Appendix B to Biogen Idec’s Definitive Proxy Statement on Schedule 14A filed on May 8, 2008.
|
|
10.36*
|
|
Voluntary Executive Supplemental Savings Plan, as amended and restated effective January 1, 2004. Filed as Exhibit 10.13 to our Annual Report on Form 10-K for the year ended December 31, 2003.
|
|
10.37*
|
|
Supplemental Savings Plan, as amended and restated effective January 1, 2012. Filed as Exhibit 10.39 to our Annual Report on Form 10-K for the year ended December 31, 2011.
|
|
10.38*
|
|
Voluntary Board of Directors Savings Plan, as amended and restated effective January 1, 2012. Filed as Exhibit 10.40 to our Annual Report on Form 10-K for the year ended December 31, 2011.
|
|
10.39*+
|
|
Biogen Idec Inc. Executive Severance Policy — U.S. Executive Vice President, as amended effective January 1, 2014.
|
|
10.40*+
|
|
Biogen Idec Inc. Executive Severance Policy — International Executive Vice President, as amended effective January 1, 2014.
|
A- 2
|
Exhibit No.
|
|
Description
|
|
10.41*
|
|
Biogen Idec Inc. Executive Severance Policy — U.S. Senior Vice President, as amended effective October 13, 2008. Filed as Exhibit 10.53 to our Annual Report on Form 10-K for the year ended December 31, 2008.
|
|
10.42*
|
|
Biogen Idec Inc. Executive Severance Policy — International Senior Vice President, as amended effective October 13, 2008. Filed as Exhibit 10.54 to our Annual Report on Form 10-K for the year ended December 31, 2008.
|
|
10.43*
|
|
Annual Retainer Summary for Board of Directors. Filed as Exhibit 10.2 to our Quarterly Report on Form 10-Q for the quarter ended June 30, 2011.
|
|
10.44*
|
|
Form of indemnification agreement for directors and executive officers. Filed as Exhibit 10.1 to our Current Report on Form 8-K filed on June 7, 2011.
|
|
10.45*
|
|
Employment Agreement between Biogen Idec and George A. Scangos amended as of August 23, 2013. Filed as Exhibit 10.1 to our Current Report on Form 8-K filed on August 26, 2013.
|
|
10.46*
|
|
Letter regarding employment arrangement of Paul J. Clancy dated August 17, 2007. Filed as Exhibit 10.49 to our Annual Report on Form 10-K for the year ended December 31, 2007.
|
|
10.47*
|
|
Letter regarding employment arrangement of Douglas E. Williams dated December 7, 2010. Filed as Exhibit 10.57 to our Annual Report on Form 10-K for the year ended December 31, 2011.
|
|
10.48*
|
Letter regarding employment arrangement of Steven H. Holtzman dated November 19, 2010. Filed as Exhibit 10.58 to our Annual Report on Form 10-K for the year ended December 31, 2011.
|
|
|
10.49*
|
|
Letter regarding employment arrangement of Kenneth DiPietro dated December 12, 2011. Filed as Exhibit 10.49 to our Annual Report on Form 10-K for the year ended December 31, 2012.
|
|
10.50*
|
Letter regarding employment arrangement of Alfred Sandrock. Filed as Exhibit 10.1 to our Quarterly Report on Form 10-Q for the quarter ended June 30, 2013.
|
|
|
10.51*+
|
Letter agreement regarding separation arrangement of Raymond Pawlicki dated November 5, 2013.
|
|
|
21
|
|
Subsidiaries. Filed as Exhibit 21 to our annual report on Form 10-K for the year ended December 31, 2012.
|
|
23+
|
|
Consent of PricewaterhouseCoopers LLP, an Independent Registered Public Accounting Firm.
|
|
31.1+
|
|
Certification of the Chief Executive Officer pursuant to Section 302 of the Sarbanes-Oxley Act of 2002.
|
|
31.2+
|
|
Certification of the Chief Financial Officer pursuant to Section 302 of the Sarbanes-Oxley Act of 2002.
|
|
32.1++
|
|
Certification of the Chief Executive Officer and the Chief Financial Officer pursuant to Section 906 of the Sarbanes-Oxley Act of 2002.
|
|
101++
|
|
The following materials from Biogen Idec Inc.’s Annual Report on Form 10-K for the year ended December 31, 2013, formatted in XBRL (Extensible Business Reporting Language): (i) the Consolidated Statements of Income, (ii) the Consolidated Statements of Comprehensive Income, (iii) the Consolidated Balance Sheets, (iv) the Consolidated Statements of Cash Flows, (v) the Consolidated Statements of Equity and (vi) Notes to Consolidated Financial Statements.
|
|
^
|
References to “our” filings mean filings made by Biogen Idec Inc. and filings made by IDEC Pharmaceuticals Corporation prior to the merger with Biogen, Inc. Unless otherwise indicated, exhibits were previously filed with the Securities and Exchange Commission under Commission File Number 0-19311 and are incorporated herein by reference.
|
|
*
|
Management contract or compensatory plan or arrangement.
|
|
†
|
Confidential treatment has been granted or requested with respect to portions of this exhibit.
|
|
+
|
Filed herewith.
|
|
+
|
+
|
Furnished herewith.
|
A- 3
TABLE OF CONTENTS
Part IItem 1. BusinessItem 1A. Risk FactorsItem 1B. Unresolved Staff CommentsItem 2. PropertiesItem 3. Legal ProceedingsItem 4. Mine Safety DisclosuresPart IIItem 5. Market For Registrant S Common Equity, Related Stockholder Matters and Issuer Purchases Of Equity SecuritiesItem 6. Selected Financial DataItem 7. Management S Discussion and Analysis Of Financial Condition and Results Of OperationsItem 7A. Quantitative and Qualitative Disclosures About Market RiskItem 8. Financial Statements and Supplementary DataItem 9. Changes in and Disagreements with Accountants on Accounting and Financial DisclosureItem 9A. Controls and ProceduresItem 9B. Other InformationPart IIIItem 10. Directors, Executive Officers and Corporate GovernanceItem 11. Executive CompensationItem 12. Security Ownership Of Certain Beneficial Owners and Management and Related Stockholder MattersItem 13. Certain Relationships and Related Transactions, and Director IndependenceItem 14. Principal Accountant Fees and ServicesPart IVItem 15. Exhibits and Financial Statement Schedules